Attached files
| file | filename |
|---|---|
| EX-23.1 - EXHIBIT 23.1 CONSENT OF INDEPENDENT REGISTERED PUBLIC ACCOUNTING FIRM - BLYTH INC | exhibit23_1.htm |
| EX-31.1 - EXHIBIT 31.1 CERTIFICATION - BLYTH INC | exhibit31_1.htm |
| EX-31.2 - EXHIBIT 31.2 CERTIFICATION - BLYTH INC | exhibit31_2.htm |
| EX-21.1 - LIST OF SUBSIDIARIES - BLYTH INC | exhibit21_1.htm |
| EX-32.2 - EXHIBIT 32.2 SECTION 906 CERTIFICATION - BLYTH INC | exhibit32_2.htm |
| EX-23.2 - EXHIBIT 23.2 CONSENT OF INDEPENDENT REGISTERED PUBLIC ACCOUNTING FIRM - BLYTH INC | exhibit23_2.htm |
| EX-32.1 - EXHIBIT 32.1 SECTION 906 CERTIFICATION - BLYTH INC | exhibit32_1.htm |
UNITED STATES
SECURITIES AND EXCHANGE COMMISSION
Washington, D.C. 20549
FORM 10-K
(Mark One)
x ANNUAL REPORT PURSUANT TO SECTION 13 OR 15(d) OF THE SECURITIES EXCHANGE ACT OF 1934
For the fiscal year ended January 31, 2010
or
|
|
o
|
TRANSITION REPORT PURSUANT TO SECTION 13 OR 15(d) OF THE SECURITIES EXCHANGE ACT OF 1934
|
For the transition period from ______________ to ______________
Commission File number 1-13026
BLYTH, INC.
(Exact Name of Registrant as Specified in Its Charter)
|
Delaware
|
36-2984916
|
|
(State or Other Jurisdiction of
Incorporation or Organization)
|
(I.R.S. Employer
Identification No.)
|
|
One East Weaver Street
Greenwich, Connecticut
|
06831
|
|
(Address of Principal Executive Offices)
|
(Zip Code)
|
Registrant’s telephone number, including area code: (203) 661-1926
Securities registered pursuant to Section 12(b) of the Act:
|
Title of each class
|
Name of each exchange
on which registered
|
|
Common Stock, par value $0.02 per share
|
New York Stock Exchange
|
Securities registered pursuant to Section 12(g) of the Act: None
Indicate by check mark if the registrant is a well-known seasoned issuer, as defined in Rule 405 of the Securities Act. Yes o No x
Indicate by check mark if the registrant is not required to file reports pursuant to Section 13 or Section 15(d) of the Act. Yes o No x
Indicate by check mark whether the registrant (1) has filed all reports required to be filed by Section 13 or 15(d) of the Securities Exchange Act of 1934 during the preceding 12 months (or for such shorter period that the registrant was required to file such reports), and (2) has been subject to such filing requirements for the past 90 days. Yes x No o
Indicate by check mark whether the registrant has submitted electronically and posted on its corporate Web site, if any, every Interactive Data File required to be submitted and posted pursuant to Rule 405 of Regulation S-T during the preceding 12 months (or for such shorter period that the registrant was required to submit and post such files) Yes o No o
Indicate by check mark if disclosure of delinquent filers pursuant to Item 405 of Regulation S-K is not contained herein, and will not be contained, to the best of registrant’s knowledge, in definitive proxy or information statements incorporated by reference in Part III of this Form 10-K or any amendment to this Form 10-K. x
Indicate by check mark whether the registrant is a large accelerated filer, an accelerated filer, a non-accelerated filer, or a smaller reporting company. See the definitions of “large accelerated filer,” “accelerated filer” and “smaller reporting company” in Rule 12b-2 of the Exchange Act. (Check one):
|
Large accelerated filer o
Non-accelerated filer o
|
Accelerated filer x
Smaller reporting company o
|
Indicate by check mark whether the registrant is a shell company (as defined in Rule 12b-2 of the Act). Yes o No x
The aggregate market value of the voting common equity held by non-affiliates of the registrant was approximately $259.7 million based on the closing price of the registrant’s Common Stock on the New York Stock Exchange on July 31, 2009 and based on the assumption, for purposes of this computation only, that all of the registrant’s directors and executive officers are affiliates.
As of March 31, 2010, there were 8,795,148 outstanding shares of Common Stock.
DOCUMENTS INCORPORATED BY REFERENCE
Portions of the 2010 Proxy Statement for the Annual Meeting of Shareholders to be held on June 10, 2010 (Incorporated into Part III).
TABLE OF CONTENTS
|
PART I
|
||||
|
Item 1.
|
|
4
|
||
|
Item 1A.
|
9
|
|||
|
Item 1B.
|
15
|
|||
|
Item 2.
|
15
|
|||
|
Item 3.
|
15
|
|||
|
Item 4.
|
15
|
|||
|
PART II
|
||||
|
Item 5.
|
|
16
|
||
|
Item 6.
|
20
|
|||
|
Item 7.
|
21
|
|||
|
Item 7A.
|
40
|
|||
|
Item 8.
|
42
|
|||
|
Item 9.
|
86
|
|||
|
Item 9A.
|
86
|
|||
|
Item 9B.
|
89
|
|||
|
PART III
|
||||
|
Item 10.
|
|
90
|
||
|
Item 11.
|
90
|
|||
|
Item 12.
|
90
|
|||
|
Item 13.
|
90
|
|||
|
Item 14.
|
90
|
|||
|
PART IV
|
||||
|
Item 15.
|
|
91
|
||
|
|
PART I
|
Item 1. Business
(a) General Development of Business
Blyth, Inc. (together with its subsidiaries, the “Company,” which may be referred to as “we,” “us” or “our”) is a multi-channel company competing primarily in the home fragrance and decorative accessories industry. We design, market and distribute an extensive array of decorative and functional household products including candles, accessories, seasonal decorations, household convenience items and personalized gifts. We also market chafing fuel and other products for the foodservice trade, coffee and tea, nutritional supplements and weight management products. Our distribution channels include direct sales, catalog, Internet and wholesale. Sales and operations take place primarily in the United States, Canada and Europe, with additional activity in Mexico, Australia and the Far East.
Additional Information
Additional information is available on our website, www.blyth.com. Our annual reports on Form 10-K, quarterly reports on Form 10-Q, current reports on Form 8-K and any amendments thereto filed or furnished pursuant to the Securities Exchange Act of 1934 are available on our website free of charge as soon as reasonably practicable following submission to the SEC. Also available on our website are our corporate governance guidelines, code of conduct, and the charters for the audit committee, compensation committee, and nominating and corporate governance committee, each of which is available in print to any shareholder who makes a request to Blyth, Inc., One East Weaver Street, Greenwich, CT 06831, Attention: Secretary. The information posted to www.blyth.com, however, is not incorporated herein by reference and is not a part of this report.
(b) Financial Information about Segments
We report our financial results in three business segments: the Direct Selling segment, the Catalog & Internet segment and the Wholesale segment. These segments accounted for approximately 66%, 18% and 16% of consolidated net sales, respectively, for fiscal 2010. Financial information relating to these business segments for fiscal 2008, 2009 and 2010 appears in Note 18 to the Consolidated Financial Statements and is incorporated herein by reference.
(c) Narrative Description of Business
Direct Selling Segment
In fiscal 2010, the Direct Selling segment represented approximately 66% of total sales. Our principal Direct Selling business is PartyLite, which sells premium candles and home fragrance products and related decorative accessories. PartyLiteâ brand products are marketed in North America, Europe and Australia through a network of independent sales consultants using the party plan method of direct selling. These products include fragranced and non-fragranced candles, bath products and a broad range of related accessories.
In fiscal 2006, we acquired a party plan company called Two Sisters Gourmet, which is focused on selling gourmet food. Effective March 31, 2009, we combined the Two Sisters Gourmet brand into our PartyLite business and continue to offer these products as part of the PartyLite party concept. In October 2008, we acquired our interest in ViSalus, a distributor-based business that sells nutritional supplements, energy drinks and weight management products. ViSalus represented approximately 2% of total sales of the Direct Selling segment during fiscal 2010.
United States Market
Within the United States market, PartyLiteâ brand products are sold directly to consumers through a network of independent sales consultants. These consultants are compensated on the basis of PartyLite product sales at parties organized by them and parties organized by consultants recruited by them. About 22,000 independent sales consultants located in the United States were selling PartyLite products at January 31, 2010. PartyLite products are designed, packaged and priced in accordance with their premium quality, exclusivity and the distribution channel through which they are sold. Independent distributors sell ViSalus brand products using a one-to-one direct sales model.
International Market
In fiscal 2010, PartyLite products were sold internationally by more than 44,000 independent sales consultants located outside the United States. These consultants were the exclusive distributors of PartyLite brand products internationally. PartyLite’s international markets at the end of fiscal 2010 were Australia, Austria, Canada, Denmark, Finland, France, Germany, Mexico, Norway, Poland, Sweden, Switzerland and the United Kingdom.
We support our independent sales consultants with inventory management and control, and satisfy delivery requirements through an Internet-based order entry system, which is available to all independent sales consultants in the United States, Canada and Europe.
Business Acquisition
During fiscal 2009 we signed a definitive agreement to purchase ViSalus Holdings, LLC (“ViSalus”), a direct seller of vitamins and other related nutritional supplements, through a series of investments. On October 21, 2008, we completed the initial investment and acquired a 43.6% equity interest in ViSalus for $13.0 million in cash. In addition, we may be required to make additional purchases of ViSalus’ equity interest to increase our equity ownership over time to 57.5%, 72.7% and 100.0%. These additional purchases were originally conditioned upon ViSalus meeting certain operating targets in calendar years 2009, 2010 and 2011. However, ViSalus did not meet the operating threshold in 2009 so we were not required to make an additional purchase. We have exercised our one-time, one-year extension and additional purchases will be made if ViSalus meets certain operating targets in calendar years 2010, 2011 and 2012. We have the option to acquire the remaining interest in ViSalus even if they do not meet the predefined operating targets.
Catalog & Internet Segment
In fiscal 2010, this segment represented approximately 18% of total sales. We design, market and distribute a wide range of household convenience items, personalized gifts and photo storage products, as well as coffee and tea, within this segment. These products are sold through the Catalog and Internet distribution channel under brand names that include As We Changeâ, Boca Javaâ, Easy Comfortsâ, Exposuresâ, Home Marketplaceâ, Miles Kimballâ and Walter Drakeâ.
Wholesale Segment
In fiscal 2010, this segment represented approximately 16% of total sales. Products within this segment include candles and related accessories, seasonal decorations and home décor products such as lamps, picture frames and decorative metal accessories. In addition, chafing fuel and tabletop lighting products and accessories for the “away from home” or foodservice trade are sold
in this segment. Our wholesale products are designed, packaged and priced to satisfy the varying demands of retailers and consumers within each distribution channel.
Products sold in the Wholesale segment in the United States are marketed through the premium consumer wholesale channels and sold to independent gift shops, specialty chains, department stores, food and drug outlets, mass retailers, hotels, restaurants and independent foodservice distributors through independent sales representatives, our key account managers and our sales managers. Our sales force supports our customers with product catalogs and samples, merchandising programs and selective fixtures. Our sales force also receives training on the marketing and proper use of our products.
Product Brand Names
The key brand names under which our Direct Selling segment products are sold are:
|
PartyLiteâ
Well Being by PartyLiteâ
|
Two Sisters Gourmetâ by PartyLiteâ
ViSalus Sciencesâ
|
The key brand names under which our Catalog & Internet segment products are sold are:
|
As We Changeâ
Boca Javaâ
Easy Comfortsâ
Exposuresâ
|
Home Marketplaceâ
Miles Kimballâ
Walter Drakeâ
|
The key brand names under which our Wholesale segment products are sold are:
|
Ambriaâ
CBKâ
Colonial Candleâ
Colonial Candle of Cape Codâ
|
Colonial at HOMEâ
HandyFuelâ
Seasons of Cannon Fallsâ
Sternoâ
|
New Product Development
Concepts for new products and product line extensions are directed to the marketing departments of our business units from within all areas of the Company, as well as from our independent sales representatives and worldwide product manufacturing partners. The new product development process may include technical research, consumer market research, fragrance studies, comparative analyses, the formulation of engineering specifications, feasibility studies, safety assessments, testing and evaluation.
Manufacturing, Sourcing and Distribution
In all of our business segments, management continuously works to increase value and lower costs through increased efficiency in worldwide production, sourcing and distribution practices, the application of new technologies and process control systems, and consolidation and rationalization of equipment and facilities. Net capital expenditures over the past five years have totaled $58.0 million and are targeted to technological advancements and normal maintenance and replacement projects at our manufacturing and distribution facilities. We have also closed several facilities and written down the values of certain machinery and equipment in recent years in response to changing market conditions.
We manufacture most of our candles using highly automated processes and technologies, as well as certain hand crafting and finishing, and source nearly all of our other products, primarily from independent manufacturers in the Pacific Rim, Europe and Mexico. Many of our products are manufactured by others based on our design specifications, making our global supply chain approach critically important to new product development, quality control and cost management. We have also built a network of stand-alone highly automated distribution facilities in our core markets.
Customers
Customers in the Direct Selling segment are individual consumers served by independent sales consultants. Sales within the Catalog & Internet segment are also made directly to consumers. Wholesale segment customers primarily include independent gift and department stores, specialty chains, foodservice distributors, hotels and restaurants. No single customer accounts for 10% or more of sales.
Competition
All of our business segments are highly competitive, both in terms of pricing and new product introductions. The worldwide market for home expressions products is highly fragmented with numerous suppliers serving one or more of the distribution channels served by us. In addition, we compete for direct selling consultants with other direct selling companies. Because there are relatively low barriers to entry in all of our business segments, we may face increased competition from other companies, some of which may have substantially greater financial or other resources than those available to us. Competition includes companies selling candles manufactured at lower costs outside of the United States. Moreover, certain competitors focus on a single geographic or product market and attempt to gain or maintain market share solely on the basis of price.
Employees
As of January 31, 2010, we had approximately 2,300 full-time employees, of whom approximately 30% were based outside of the United States. Approximately 60% of our employees are non-salaried. We do not have any unionized employees. We believe that relations with our employees are good. Since our formation in 1977, we have never experienced a work stoppage.
Raw Materials
All of the raw materials used for our candles, home fragrance products and chafing fuel, principally petroleum-based wax, fragrance, glass containers and corrugate, have historically been available in adequate supply from multiple sources. In fiscal 2010, costs were lower compared to the prior year for certain raw materials, such as paraffin and other wax products, dyethelene glycol (“DEG”), as well as paper, while staying stable for ethanol and increasing for steel. In general commodity prices have helped us maintain the profitability of the products in all three segments.
Seasonality
Our business is seasonal, with our net sales strongest in the third and fourth fiscal quarters due to increased shipments to meet year-end holiday season demand for our products. For additional information, see “Management’s Discussion and Analysis of Financial Condition and Results of Operations – Seasonality.”
Trademarks and Patents
We own and have pending several trademark and patent registrations and applications in the United States Patent and Trademark Office related to our products. We also register certain trademarks and patents in other countries. While we regard these trademarks and patents as valuable assets to our business, we are not dependent on any single trademark or patent or group thereof.
Environmental Law Compliance
Most of the manufacturing, distribution and research operations are affected by federal, state, local and international environmental laws relating to the discharge of materials or otherwise to the protection of the environment. We have made and intend to continue to make expenditures necessary to comply with applicable environmental laws, and do not believe that such expenditures will have a material effect on our capital expenditures, earnings or competitive position.
(d) Financial Information about Geographic Areas
For information on net sales from external customers attributed to the United States and international geographies and on long-lived assets located in and outside the United States, see Note 18 to the Consolidated Financial Statements.
Item 1A. Risk Factors
We may be unable to increase sales or identify suitable acquisition candidates.
Our ability to increase sales depends on numerous factors, including market acceptance of existing products, the successful introduction of new products, growth of consumer discretionary spending, our ability to recruit new independent sales consultants, sourcing of raw materials and demand-driven increases in production and distribution capacity. Business in all of our segments is driven by consumer preferences. Accordingly, there can be no assurances that our current or future products will maintain or achieve market acceptance. Our sales and earnings results can be negatively impacted by the worldwide economic environment, particularly the United States, Canadian and European economies. There can be no assurances that our financial results will not be materially adversely affected by these factors in the future.
Our historical growth has been due in part to acquisitions, and we continue to consider additional strategic acquisitions. There can be no assurances that we will continue to identify suitable acquisition candidates, consummate acquisitions on terms favorable to us, finance acquisitions, successfully integrate acquired operations or that companies we acquire will perform as anticipated.
We may be unable to respond to changes in consumer preferences.
Our ability to manage our inventories properly is an important factor in our operations. The nature of our products and the rapid changes in customer preferences leave us vulnerable to an increased risk of inventory obsolescence. Excess inventories can result in lower gross margins due to the excessive discounts and markdowns that might be necessary to reduce inventory levels. Our ability to meet future product demand in all of our business segments will depend upon our success in sourcing adequate supplies of our products; bringing new production and distribution capacity on line in a timely manner; improving our ability to forecast product demand and fulfill customer orders promptly; improving customer service-oriented management information systems; and training, motivating and managing new employees. The failure of any of the above could result in a material adverse effect on our financial results.
A downturn in the economy may affect consumer purchases of discretionary items such as our products which could have a material adverse effect on our business, financial condition and results of operations.
Our results of operations may be materially affected by conditions in the global capital markets and the economy generally, both in the United States and elsewhere around the world. Recently, concerns over inflation, energy costs, geopolitical issues, the availability and cost of credit, the U.S. mortgage market and a declining real estate market in the United States have contributed to increased volatility and diminished expectations for the economy. A continued or protracted downturn in the economy could adversely impact consumer purchases of discretionary items including demand for our products. Factors that could affect consumers’ willingness to make such discretionary purchases include general business conditions, levels of employment, energy costs, interest rates and tax rates, the availability of consumer credit and consumer confidence. A reduction in consumer spending could significantly reduce our sales and leave us with unsold inventory. The occurrence of these events could have a material adverse effect on our business, financial condition and results of operations.
The recent turmoil in the financial markets could increase our cost of borrowing and impede access to or increase the cost of financing our operations and investments and could result in additional impairments to our businesses.
United States and global credit and equity markets have recently undergone significant disruption, making it difficult for many businesses to obtain financing on acceptable terms. In addition, in recent years equity markets have experienced rapid and wide fluctuations in value. If these conditions continue or worsen, our cost of borrowing, if needed, may increase and it may be more difficult to obtain financing for our businesses. In addition, our borrowing costs can be affected by short and long-term debt ratings assigned by independent rating agencies. A decrease in these ratings would likely increase our cost of borrowing and/or make it more difficult for us to obtain financing. In the event current market conditions continue we will more than likely be subject to higher interest costs than we are currently incurring and may require our providing security to guarantee such borrowings. Alternatively, we may not be able to obtain unfunded borrowings in that amount, which may require us to seek other forms of financing, such as term debt, at higher interest rates and with additional expenses.
In addition, we may be subject to future impairments of our assets, including accounts receivable, investments, inventories, property, plant and equipment, goodwill and other intangibles, if the valuation of these assets or businesses declines.
We face diverse risks in our international business, which could adversely affect our operating results.
We are dependent on international sales for a substantial amount of our total revenue. For fiscal 2008, 2009 and 2010, revenue from outside the United States was 33%, 41% and 45% of our total revenue, respectively. We expect international sales to continue to represent a substantial portion of our revenue for the foreseeable future. Due to our reliance on sales to customers outside the United States, we are subject to the risks of conducting business internationally, including:
|
•
|
United States and foreign government trade restrictions, including those which may
impose restrictions on imports to or from the United States;
|
|
•
|
foreign government taxes and regulations, including foreign taxes that we may not be able
to offset against taxes imposed upon us in the United States, and foreign tax and other
laws limiting our ability to repatriate funds to the United States;
|
|
•
|
the laws and policies of the United States, Canada and certain European countries affecting the importation of goods (including duties, quotas and taxes);
|
||
|
•
|
foreign labor laws, regulations and restrictions;
|
|
•
|
difficulty in staffing and managing foreign operations and difficulty in maintaining quality control;
|
|
•
|
adverse fluctuations in foreign currency exchange rates and interest rates, including
risks related to any interest rate swap or other hedging activities we undertake;
|
||
|
•
|
political instability, natural disasters, health crises, war or events of terrorism;
|
||
|
•
|
transportation costs and delays; and
|
|
•
|
the strength of international economies.
|
We are dependent upon sales by independent consultants.
A significant portion of our products are marketed and sold through the direct selling method of distribution, where products are primarily marketed and sold by independent consultants to consumers without the use of retail establishments. This distribution system depends upon the successful recruitment, retention and motivation of a large number of independent consultants to offset frequent turnover. The recruitment and retention of independent consultants depends on the competitive environment among direct selling companies and on the general labor market, unemployment levels, economic conditions, and demographic and cultural changes in the workforce. The motivation of our consultants depends, in large part, upon the effectiveness of our compensation and promotional programs, its competitiveness compared with other direct selling companies, the successful introduction of new products, and the ability to advance through the consultant ranks.
Our sales are directly tied to the levels of activity of our consultants, which is a part-time working activity for many of them. Activity levels may be affected by the degree to which a market is penetrated by the presence of our consultants, the amount of average sales per party, the amount of sales per consultant, the mix of high-margin and low-margin products in our product line and the activities and actions of our competitors.
Earnings of PartyLite’s independent sales consultants are subject to taxation, and in some instances, legislation or governmental agencies impose obligations on us to collect or pay taxes, such as value added taxes, and to maintain appropriate records. In addition, we may be subject to the risk in some jurisdictions of new liabilities being imposed for social security and similar taxes with respect to PartyLite’s independent sales consultants. In the event that local laws and regulations or the interpretation of local laws and regulations change to require us to treat PartyLite’s independent sales consultants as employees, or that PartyLite’s independent sales consultants are deemed by local regulatory authorities in one or more of the jurisdictions in which we operate to be our employees rather than independent contractors or agents under existing laws and interpretations, we may be held responsible for social charges and related taxes in those jurisdictions, plus related assessments and penalties, which could harm our financial condition and operating results.
Our profitability may be affected by shortages or increases in the cost of raw materials.
Certain raw materials could be in short supply due to price changes, capacity, availability, a change in production requirements, weather or other factors, including supply disruptions due to production or transportation delays. While the price of crude oil is only one of several factors impacting the price of petroleum wax, it is possible that recent fluctuations in oil prices may have a material adverse effect on the cost of petroleum-based products used in the manufacture or transportation of our products, particularly in the Direct Selling and Wholesale segments. In recent years, substantial cost increases for certain raw materials, such as paraffin, diethylene glycol (DEG), ethanol and paper, negatively impacted profitability of certain products in all three segments. In addition, a number of governmental authorities in the U.S. and abroad have introduced or are contemplating enacting legal requirements, including emissions limitations, cap and trade systems and other measures to reduce production of greenhouse gases, in response to the potential impacts of climate change. These measures may have an indirect effect on us by affecting the prices of products made from fossil fuels, including paraffin and DEG, as well as ethanol, which is used as an additive to gasoline. Given the wide range of potential future climate change regulations and their effects on these raw materials, the potential indirect impact to our operations is uncertain.
In addition, the potential impact of climate change on the weather is highly uncertain. The impact of climate change may vary by geographic location and other circumstances, including weather patterns and any impact to natural resources such as water. Severe weather in the locations where fossil fuel based raw materials are produced, such as increased hurricane activity or virulence in the Gulf of Mexico, could disrupt the production, availability or pricing of these raw materials.
We expect not to be disproportionately affected by these measures compared with other companies engaged in the same businesses.
We are dependent upon our key corporate management personnel.
Our success depends in part on the contributions of our key corporate management, including our Chairman and Chief Executive Officer, Robert B. Goergen, as well as the members of the Office of the Chairman: Robert H. Barghaus, Vice President and Chief Financial Officer; Robert B. Goergen, Jr., Vice President and President, Multi-Channel Group; and Anne M. Butler, Vice President and President, PartyLite Worldwide. We do not have employment contracts with any of our key corporate management personnel except the Chairman and Chief Executive Officer, nor do we maintain any key person life insurance policies. The loss of any of the key corporate management personnel could have a material adverse effect on our operating results.
Our businesses are subject to the risks from increased competition.
Our business is highly competitive both in terms of pricing and new product introductions. The worldwide market for decorative and functional products for the home is highly fragmented with numerous suppliers serving one or more of the distribution channels served by us. In addition, we compete for independent sales consultants with other direct selling companies. Because there are relatively low barriers to entry in all of our business segments, we may face increased competition from other companies, some of which may have substantially greater financial or other resources than those available to us. Competition includes companies selling candles manufactured at lower costs outside of the United States. Moreover, certain competitors focus on a single geographic or product market and attempt to gain or maintain market share solely on the basis of price.
We depend upon our information technology systems.
We are increasingly dependent on information technology systems to operate our websites, process transactions, manage inventory, purchase, sell and ship goods on a timely basis and maintain cost-efficient operations. Previously, we have experienced interruptions resulting from upgrades to certain of our information technology systems which temporarily reduced the effectiveness of our operations. Our information technology systems depend on global communications providers, telephone systems, hardware, software and other aspects of Internet infrastructure that have experienced significant system failures and outages in the past. Our systems are susceptible to outages due to fire, floods, power loss, telecommunications failures, break-ins and similar events. Despite the implementation of network security measures, our systems are vulnerable to computer viruses, break-ins and similar disruptions from unauthorized tampering with our systems. The occurrence of these or other events could disrupt or damage our information technology systems and inhibit internal operations, the ability to provide customer service or the ability of customers or sales personnel to access our information systems.
The Internet plays a major role in our interaction with customers and independent consultants and distributors. Risks such as changes in required technology interfaces, website downtime and other technical failures, security breaches, and consumer privacy are key concerns related to the
Internet. Our failure to successfully respond to these risks and uncertainties could reduce sales, increase costs and damage our relationships.
Management uses information systems to support decision making and to monitor business performance. We may fail to generate accurate financial and operational reports essential for making decisions at various levels of management. Failure to adopt systematic procedures to quality Information Technology General Controls could disrupt our business and reduce sales. In addition, if we do not maintain adequate controls such as reconciliations, segregation of duties and verification to prevent errors or incomplete information, our ability to operate our business could be limited.
Our effective tax rate and the amount of our provision for income taxes may be adversely affected by a number of factors, including:
|
•
|
the jurisdictions in which profits are determined to be earned and taxed;
|
|
•
|
adjustments to estimated taxes upon finalization of various tax returns;
|
|
•
|
changes in available tax credits;
|
|
•
|
changes in the valuation of our deferred tax assets and liabilities;
|
|
•
|
changes in accounting standards or tax laws and regulations, or interpretations thereof;
|
|
•
|
the resolution of issues arising from uncertain positions and tax audits with various tax authorities; and
|
|
•
|
penalties and/or interest expense that we may be required to recognize on liabilities associated with uncertain tax positions.
|
ViSalus’ business is affected by extensive laws, governmental regulations and similar constraints, and their failure to comply with those constraints may have a material adverse effect on ViSalus’ financial condition and operating results.
ViSalus is affected by extensive laws, governmental regulations, administrative determinations, court decisions and similar constraints. Such laws, regulations and other constraints exist at the federal, state or local levels in the United States, including regulations pertaining to: (1) the formulation, manufacturing, packaging, labeling, distribution, importation, sale and storage of ViSalus’ products; (2) product claims and advertising, including direct claims and advertising by ViSalus, as well as claims and advertising by distributors, for which ViSalus may be held responsible; (3) ViSalus’ network marketing program; and (4) taxation of ViSalus’ independent distributors (which in some instances may impose an obligation on ViSalus to collect the taxes and maintain appropriate records). There can be no assurance that ViSalus or its distributors are in compliance with all of these regulations, and the failure by ViSalus or its distributors’ failure to comply with these regulations or new regulations could lead to the imposition of significant penalties or claims and could negatively impact ViSalus’ business. In addition, the adoption of new regulations or changes in the interpretations of existing regulations may result in significant
compliance costs or discontinuation of product sales and may negatively impact the marketing of ViSalus’ products, resulting in significant loss of sales revenues.
In addition, ViSalus’ network marketing program is subject to a number of federal and state regulations administered by the FTC and various state agencies in the United States. ViSalus is subject to the risk that, in one or more markets, its network marketing program could be found not to be in compliance with applicable law or regulations. Regulations applicable to network marketing organizations generally are directed at preventing fraudulent or deceptive schemes, often referred to as “pyramid” or “chain sales” schemes, by ensuring that product sales ultimately are made to consumers and that advancement within an organization is based on sales of the organization’s products rather than investments in the organization or other non-retail sales-related criteria. The regulatory requirements concerning network marketing programs do not include “bright line” rules and are inherently fact-based, and thus, even in jurisdictions where ViSalus believes that its network marketing program is in full compliance with applicable laws or regulations governing network marketing systems, it is subject to the risk that these laws or regulations or the enforcement or interpretation of these laws and regulations by governmental agencies or courts can change. The failure of ViSalus’ network marketing program to comply with current or newly adopted regulations could negatively impact its business in a particular market or in general.
Increased cost of our catalog and promotional mailings can reduce our profitability.
Postal rate increases and paper and printing costs affect the cost of our catalog and promotional mailings. Future additional increases in postal rates or in paper or printing costs would reduce our profitability to the extent that we are unable to pass those increases directly to customers or offset those increases by raising selling prices or by reducing the number and size of certain catalog circulations.
Climate change may pose physical risks that could harm our results of operations or affect the way we conduct our business.
Several of our facilities are located in areas exposed to the risk of hurricanes or tornadoes. The effect of global warming on such storms is highly uncertain. Based on an assessment of the locations of the facilities, the nature and extent of the operations conducted at such facilities, the prior history of such storms in these locations, and the likely future effect of such storms on those operations and on the Company as a whole, we do not currently expect any material adverse effect on the results of operation from such storms in the foreseeable future.
Failure to comply with Section 404 of the Sarbanes-Oxley Act of 2002 might have an impact on market confidence in our reported financial information.
We must continue to document, test, monitor and enhance our internal control over financial reporting in order to satisfy the requirements of Section 404 of the Sarbanes-Oxley Act of 2002. The material weakness in our internal control over financial reporting relating to accounting for income taxes reported during fiscal 2009 has been remediated, and the control was determined to be effective at January 31, 2010. We will continue to perform the documentation and evaluations needed to comply with Section 404. If during this process our management identifies one or more material weaknesses in our internal control over financial reporting, we will be unable to assert our internal control as effective.
Item 1B. Unresolved Staff Comments
None.
Item 2. Properties
The following table sets forth the location and approximate square footage of our major manufacturing and distribution facilities:
|
Location
|
Use
|
Business Segment
|
Approximate Square Feet
|
|||||||
|
Owned
|
Leased
|
|||||||||
|
Arndell Park, Australia
|
Distribution
|
Direct Selling
|
— | 38,000 | ||||||
|
Batavia, Illinois
|
Manufacturing and
Research &
Development
|
Direct Selling and Wholesale
|
486,000 | — | ||||||
|
Carol Stream, Illinois
|
Distribution
|
Direct Selling
|
— | 515,000 | ||||||
|
Cumbria, England
|
Manufacturing and
related distribution
|
Direct Selling
|
90,000 | — | ||||||
|
Deerfield Beach, Florida
|
Roasting, packaging
and distribution
|
Catalog & Internet
|
— | 22,000 | ||||||
|
Elkin, North Carolina
|
Manufacturing and
related distribution
|
Wholesale
|
280,000 | — | ||||||
|
Heidelberg, Germany
|
Distribution
|
Direct Selling
|
— | 6,000 | ||||||
|
Monterrey, Mexico
|
Distribution
|
Direct Selling
|
— | 45,000 | ||||||
|
Oshkosh, Wisconsin
|
Distribution
|
Catalog & Internet
|
— | 386,000 | ||||||
|
Texarkana, Texas
|
Manufacturing and
related distribution
|
Wholesale
|
154,000 | 65,000 | ||||||
|
Tilburg, Netherlands
|
Distribution
|
Direct Selling
|
442,500 | — | ||||||
|
Union City, Tennessee
|
Warehouse and
distribution
|
Wholesale
|
360,000 | 16,000 | ||||||
Our executive and administrative offices are generally located in leased space (except for certain offices located in owned space).
Item 3. Legal Proceedings
We are involved in litigation arising in the ordinary course of business. In our opinion, existing litigation will not have a material adverse effect on our financial position, results of operations or cash flows.
Item 4. Reserved
PART II
|
Item 5.
|
Market for Registrant’s Common Equity, Related Stockholder Matters and Issuer Purchases of Equity Securities
|
Our Common Stock is traded on the New York Stock Exchange under the symbol BTH. Effective as of 6:01 p.m., Eastern Time, on January 30, 2009 we implemented a 1-for-4 reverse stock split of our Common Stock. The following table provides the closing price range for the Common Stock on the New York Stock Exchange. The fiscal 2009 prices have been retroactively adjusted to give effect to the reverse stock split (such adjustment has been calculated by multiplying the historic stock price by four, the reverse stock split multiple; none of the information for fiscal 2009 represents actual closing prices of the Common Stock):
|
High
|
Low
|
|||||||
|
Fiscal 2009
|
||||||||
|
First Quarter
|
$ | 89.44 | $ | 67.36 | ||||
|
Second Quarter
|
78.88 | 47.72 | ||||||
|
Third Quarter
|
64.56 | 25.60 | ||||||
|
Fourth Quarter
|
35.40 | 13.64 | ||||||
|
Fiscal 2010
|
||||||||
|
First Quarter
|
$ | 44.49 | $ | 16.12 | ||||
|
Second Quarter
|
45.98 | 29.90 | ||||||
|
Third Quarter
|
47.90 | 33.81 | ||||||
|
Fourth Quarter
|
38.75 | 28.09 | ||||||
Many of our shares are held in “street name” by brokers and other institutions on behalf of stockholders, and we had more than 3,000 beneficial holders of Common Stock as of March 31, 2010.
During fiscal 2010 and 2009, the Board of Directors declared dividends as follows (fiscal 2009 amounts have been adjusted to give effect to the reverse stock split by multiplying the actual amount of the dividend by four, the reverse stock split multiple): $1.00 per share declared in the fourth quarter of fiscal 2010 and payable in the first quarter of fiscal 2011, $0.10 per share payable in the second and fourth quarters of fiscal 2010 and $1.08 per share payable in the second and fourth quarters of fiscal 2009. Our ability to pay cash dividends in the future depends upon, among other things, our ability to operate profitably and to generate significant cash flows from operations in excess of investment and financing requirements that may increase in the future to, for example, fund new acquisitions or retire debt.
The following table sets forth, for the equity compensation plan categories listed below, information as of January 31, 2010:
Equity Compensation Plan Information
|
Plan Category
|
(a)
Number of securities to be issued upon exercise of outstanding options, warrants and rights1
|
(b)
Weighted-average
exercise price of outstanding options, warrants and rights1
|
(c)
Number of securities remaining available for future issuance under equity compensation plans (excluding securities reflected in column (a))
|
|||||||||
|
Equity compensation plans approved by security holders
|
62,125 | $ | 107.68 | 843,926 | ||||||||
|
Equity compensation plans not approved by security holders
|
- | - | - | |||||||||
|
Total
|
62,125 | $ | 107.68 | 843,926 | ||||||||
1 The information in this column excludes 132,987 restricted stock units outstanding as of January 31, 2010.
The following table sets forth certain information concerning the repurchases of Common Stock made by us during the fourth quarter of fiscal 2010.
|
Issuer Purchases of Equity Securities (1)
|
|
Period
|
Total Number of Shares Purchased (2)
|
Average Price Paid per Share
|
Total Number of Shares Purchased as Part of Publicly Announced Plans or Programs
|
Maximum Number of Shares that May Yet Be Purchased Under the Plans or Programs
|
||||||||||||
|
November 1, 2009 -November 30, 2009
|
- | - | - | 1,869,162 | ||||||||||||
|
December 1, 2009 -December 31, 2009
|
34,693 | $ | 32.89 | 34,693 | 1,834,469 | |||||||||||
|
January 1, 2010 -January 31, 2010
|
70,039 | 32.83 | 70,039 | 1,764,430 | ||||||||||||
|
Total
|
104,732 | $ | 32.85 | 104,732 | 1,764,430 | |||||||||||
_____________________________
(1) On September 10, 1998, our Board of Directors approved a share repurchase program pursuant to which we were originally authorized to repurchase up to 250,000 shares of Common Stock in open market transactions. From June 1999 to June 2006, the Board of Directors increased the authorization under this repurchase program five times (on June 8, 1999 to increase the authorization by 250,000 shares to 500,000 shares; on March 30, 2000 to increase the authorization by 250,000 shares to 750,000 shares; on December 14, 2000 to increase the authorization by 250,000 shares to 1.0 million shares; on April 4, 2002 to increase the authorization by 500,000 shares to 1.5 million shares; and on June 7, 2006 to increase the authorization by 1.5 million shares to 3.0 million shares). On December 13, 2007, the Board of Directors authorized a new repurchase program, for 1.5 million shares, which will become effective after we
exhaust the authorized amount under the old repurchase program. As of January 31, 2010, we have purchased a total of 2,735,570 shares of Common Stock under the old repurchase program. The repurchase programs do not have expiration dates. We intend to make further purchases under the repurchase programs from time to time. The amounts set forth in this paragraph have been adjusted to give effect to the reverse stock split executed in fiscal 2009.
(2) This does not include the 300 shares that we withheld in order to satisfy employee withholding taxes upon the distribution of vested restricted stock units.
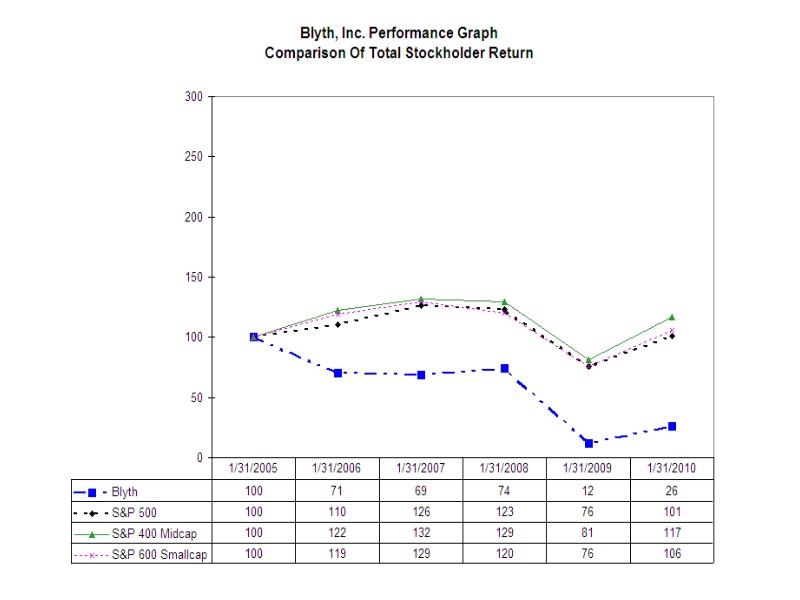
Performance Graph
The performance graph set forth below reflects the yearly change in the cumulative total stockholder return (price appreciation and reinvestment of dividends) on our Common Stock compared to the Standard and Poor’s (“S&P”) 500 Index, the S&P MidCap 400 Index and the S&P SmallCap 600 Index for the five fiscal years ended January 31, 2010. The graph assumes the investment of $100 in Common Stock and the reinvestment of all dividends paid on such Common Stock into additional shares of Common Stock and such indexes over the five-year period. We believe that we are unique and do not have comparable industry peers. Since our competitors are typically not public companies or are themselves subsidiaries or divisions of public companies engaged in multiple lines of business, we believe that it is not possible to compare our performance against that of our competition. In the absence of a satisfactory peer group, we believe that it is appropriate to compare us to companies comprising the S&P MidCap 400 Index and S&P SmallCap 600 Index, the former being the index we were in until December 2009 and the latter the index we are currently tracked in by S&P.
Item 6. Selected Financial Data
Set forth below are selected summary consolidated financial and operating data for fiscal years 2006 through 2010, which have been derived from our audited financial statements for those years. The information presented below should be read in conjunction with “Management’s Discussion and Analysis of Financial Condition and Results of Operations” and our consolidated financial statements, including the notes thereto, appearing elsewhere in this Report. The per share amounts and number of shares outstanding have been adjusted to give effect to the 1-for-4 reverse stock split of our common stock that we implemented on January 30, 2009.
| Year ended January 31, | ||||||||||||||||||||
|
(In thousands, except per share and percent data)
|
2006
|
2007
|
2008
|
2009
|
2010
|
|||||||||||||||
|
Statement of Earnings Data: (1)
|
||||||||||||||||||||
|
Net sales
|
$ | 1,254,261 | $ | 1,220,611 | $ | 1,164,950 | $ | 1,050,793 | $ | 958,077 | ||||||||||
|
Gross profit
|
635,785 | 596,669 | 615,471 | 577,216 | 525,499 | |||||||||||||||
|
Goodwill and other intangibles impairment
|
53,261 | 48,812 | 49,178 | 48,751 | 16,498 | |||||||||||||||
|
Operating profit (2)
|
45,167 | 15,644 | 30,887 | 4,028 | 29,983 | |||||||||||||||
|
Interest expense
|
20,602 | 19,074 | 15,540 | 10,001 | 7,755 | |||||||||||||||
|
Earnings (loss) from continuing operations
|
||||||||||||||||||||
|
before income taxes and noncontrolling interest
|
26,444 | 5,369 | 21,725 | (11,525 | ) | 22,074 | ||||||||||||||
|
Earnings (loss) from continuing operations
|
||||||||||||||||||||
|
attributable to Blyth, Inc.
|
20,531 | 2,555 | 11,072 | (15,480 | ) | 17,694 | ||||||||||||||
|
Earnings (loss) from discontinued operations
|
||||||||||||||||||||
|
attributable to Blyth, Inc. (3)
|
4,326 | (105,728 | ) | - | - | - | ||||||||||||||
|
Net earnings (loss) attributable to Blyth, Inc.
|
24,857 | (103,173 | ) | 11,072 | (15,480 | ) | 17,694 | |||||||||||||
|
Basic net earnings (loss) from continuing operations
|
||||||||||||||||||||
|
attributable per Blyth, Inc. common share
|
$ | 2.01 | $ | 0.26 | $ | 1.15 | $ | (1.73 | ) | $ | 1.99 | |||||||||
|
Basic net earnings (loss) from discontinued operations
|
||||||||||||||||||||
|
attributable per Blyth, Inc. common share
|
$ | 0.42 | $ | (10.63 | ) | $ | - | $ | - | $ | - | |||||||||
|
Basic net earnings (loss) attributable per Blyth, Inc. common share
|
$ | 2.43 | $ | (10.37 | ) | $ | 1.15 | $ | (1.73 | ) | $ | 1.99 | ||||||||
|
Diluted net earnings (loss) from continuing operations
|
||||||||||||||||||||
|
attributable per Blyth, Inc. common share
|
$ | 1.99 | $ | 0.26 | $ | 1.14 | $ | (1.73 | ) | $ | 1.98 | |||||||||
|
Diluted net earnings (loss) from discontinued operations
|
||||||||||||||||||||
|
attributable per Blyth, Inc. common share
|
$ | 0.42 | $ | (10.56 | ) | $ | - | $ | - | $ | - | |||||||||
|
Diluted net earnings (loss) attributable per Blyth, Inc. common share
|
$ | 2.41 | $ | (10.30 | ) | $ | 1.14 | $ | (1.73 | ) | $ | 1.98 | ||||||||
|
Cash dividends declared, per share
|
$ | 1.76 | $ | 2.00 | $ | 2.16 | $ | 2.16 | $ | 1.20 | ||||||||||
|
Basic weighted average number
|
||||||||||||||||||||
|
of common shares outstanding
|
10,239 | 9,945 | 9,648 | 8,971 | 8,912 | |||||||||||||||
|
Diluted weighted average number
|
||||||||||||||||||||
|
of common shares outstanding
|
10,294 | 10,014 | 9,732 | 8,971 | 8,934 | |||||||||||||||
|
Operating Data:
|
||||||||||||||||||||
|
Gross profit margin
|
50.7 | % | 48.9 | % | 52.8 | % | 54.9 | % | 54.8 | % | ||||||||||
|
Operating profit margin
|
3.6 | % | 1.3 | % | 2.7 | % | 0.4 | % | 3.1 | % | ||||||||||
|
Net capital expenditures
|
$ | 17,272 | $ | 17,714 | $ | 9,421 | $ | 8,173 | $ | 5,384 | ||||||||||
|
Depreciation and amortization
|
35,875 | 34,630 | 31,974 | 18,628 | 16,592 | |||||||||||||||
|
Balance Sheet Data:
|
||||||||||||||||||||
|
Total assets
|
$ | 1,116,520 | $ | 774,638 | $ | 667,422 | $ | 574,103 | $ | 522,993 | ||||||||||
|
Total debt
|
371,742 | 215,779 | 158,815 | 145,731 | 110,544 | |||||||||||||||
|
Total stockholders' equity
|
493,824 | 363,693 | 299,068 | 248,498 | 256,274 | |||||||||||||||
|
(1)
|
Statement of Earnings Data includes the results of operations for periods subsequent to the respective purchase acquisitions of As We Change, acquired in August 2008, and ViSalus, acquired in October 2008, none of which individually or in the aggregate had a material effect on the Company’s results of operations.
|
|
(2)
|
Fiscal 2007 and 2008 earnings include restructuring charges recorded in the Wholesale and Direct Selling segments of $24.0 million and $2.3 million, respectively. Fiscal 2009 and 2010 earnings include restructuring charges recorded in the Direct Selling segment of $1.7 million and $0.1 million, respectively (See Note 5 to the Consolidated Financial Statements).
|
|
(3)
|
In fiscal 2007, the Kaemingk Edelman, Euro-Decor, Gies and Colony businesses were sold. The results of operations for these business units have been reclassified to discontinued operations for all periods presented.
|
|
Item 7. Management’s Discussion and Analysis of Financial Condition and Results of Operations
|
The financial and business analysis below provides information that we believe is relevant to an assessment and understanding of our consolidated financial condition, changes in financial condition and results of operations. This financial and business analysis should be read in conjunction with our consolidated financial statements and accompanying notes to the Consolidated Financial Statements set forth in Item 8.
Overview
Blyth is a designer and marketer of home fragrance products and accessories, home décor, seasonal decorations, household convenience items and personalized gifts. We also market chafing fuel and other products for the foodservice trade, nutritional supplements, and weight management products. We compete in the global home expressions industry, and our products can be found throughout North America, Europe and Australia. Our financial results are reported in three segments, the Direct Selling segment, the Catalog & Internet segment and the Wholesale segment. These reportable segments are based on similarities in distribution channels, customers and management oversight.
Fiscal 2010 Net sales are comprised of an approximately $635 million Direct Selling business, an approximately $166 million Catalog & Internet business and an approximately $157 million Wholesale business. Sales and earnings growth differ in each segment depending on geographic location, market penetration, our relative market share and product and marketing execution, among other business factors.
Our current focus is driving sales growth of our brands so we may leverage more fully our infrastructure. New product development continues to be critical to all three segments of our business. In the Direct Selling segment, monthly sales and productivity incentives are designed to attract, retain and increase the earnings opportunity of independent sales consultants. In the Catalog & Internet channel, product, merchandising and circulation strategy are designed to drive strong sales growth in newer brands and expand the sales and customer base of our flagship brands. In the Wholesale segment, sales initiatives are targeted to independent retailers and national accounts.
Reverse Stock Split
On January 30, 2009, we implemented a 1-for-4 reverse stock split of our outstanding common stock that reduced the number of outstanding shares of common stock from 35.6 million to 8.9 million. The historical per share amounts within this section have been adjusted to give effect to the reverse stock split.
Business Acquisition
On August 4, 2008, we signed an agreement to purchase ViSalus, a direct seller of vitamins and other related nutritional supplements, through a series of investments. On October 21, 2008, we completed the initial investment and acquired a 43.6% equity interest in ViSalus for $13.0 million in cash. In addition, we may be required to make additional purchases of ViSalus’ equity interest to increase our equity ownership over time to 57.5%, 72.7% and 100.0%. These additional purchases were originally conditioned upon ViSalus meeting certain operating targets in calendar years 2009, 2010 and 2011. However, ViSalus did not meet the operating threshold in 2009 so we were not required to make an additional purchase. We have exercised our one-time, one-year extension and additional purchases will be made if ViSalus meets certain operating targets in
calendar years 2010, 2011 and 2012. We have the option to acquire the remaining interest in ViSalus even if they do not meet the predefined operating targets.
Sale of Mass Channel Candle Business
On April 27, 2007, we sold certain assets and liabilities of our BHI NA mass channel candle business, which was part of the Wholesale segment. The net assets were sold for $25.3 million, including proceeds from the sale of overstock inventory of $1.3 million. Of this amount, $21.8 million was received at closing and a total of $3.5 million was received subsequently in fiscal 2008. The sale resulted in a pre-tax loss of $0.6 million, which was recorded in Administrative expenses in the Consolidated Statements of Earnings (Loss) in fiscal 2008.
Segments
Within the Direct Selling segment, the Company designs, manufactures or sources, markets and distributes an extensive line of products including scented candles, candle-related accessories and other fragranced products under the PartyLite® brand. The Company also has an interest in another direct selling business, ViSalus Sciences, which sells nutritional supplements and weight management products. All products in this segment are sold in North America through networks of independent sales consultants and distributors. PartyLite brand products are also sold in Europe and Australia.
Within the Catalog & Internet segment, we design, source and market a broad range of household convenience items, premium photo albums, frames, holiday cards, personalized gifts, kitchen accessories and gourmet coffee and tea. These products are sold directly to the consumer under the As We Change ®, Boca Java®, Easy Comforts®, Exposures®, Home Marketplace®, Miles Kimball® and Walter Drake® brands. These products are sold in North America.
Within the Wholesale segment, we design, manufacture or source, market and distribute an extensive line of home fragrance products, candle-related accessories, seasonal decorations such as ornaments and trim, and home décor products such as picture frames, lamps and textiles. Products in this segment are sold primarily in North America to retailers in the premium and specialty markets under the CBK®, Colonial Candle of Cape Cod®, Colonial at HOME® and Seasons of Cannon Falls® brands. In addition, chafing fuel and tabletop lighting products and accessories for the “away from home” or foodservice trade are sold through this segment under the Ambria®, HandyFuel® and Sterno® brands.
The following table sets forth, for the periods indicated, the percentage relationship to Net Sales and the percentage increase or decrease of certain items included in our Consolidated Statements of Earnings (Loss):
|
Percentage Increase (Decrease) from Prior Period
|
||||||||||||||||||||
|
Percentage of Net Sales
|
Fiscal 2009 Compared to Fiscal 2008
|
Fiscal 2010 Compared to Fiscal 2009
|
||||||||||||||||||
|
Years Ended January 31
|
||||||||||||||||||||
|
2008
|
2009
|
2010
|
||||||||||||||||||
|
Net sales
|
100.0 | 100.0 | 100.0 | (9.8 | ) | (8.8 | ) | |||||||||||||
|
Cost of goods sold
|
47.2 | 45.1 | 45.2 | (13.8 | ) | (8.7 | ) | |||||||||||||
|
Gross profit
|
52.8 | 54.9 | 54.8 | (6.2 | ) | (9.0 | ) | |||||||||||||
|
Selling
|
34.8 | 38.1 | 38.4 | (1.1 | ) | (8.3 | ) | |||||||||||||
|
Administrative
|
11.2 | 11.8 | 11.6 | (4.9 | ) | (9.9 | ) | |||||||||||||
|
Operating profit
|
2.7 | 0.4 | 3.1 | N/M | N/M | |||||||||||||||
|
Earnings from continuing operations
|
1.0 | (1.5 | ) | 1.8 | N/M | N/M | ||||||||||||||
N/M - Percent change from the prior year is not meaningful in concluding on our performance due to nonrecurring goodwill and other intangible impairments.
Fiscal 2010 Compared to Fiscal 2009
Consolidated Net Sales
Net sales decreased $92.7 million, or approximately 9%, from $1,050.8 million in fiscal 2009 to $958.1 million in fiscal 2010. The decrease is a result of a decline in sales in PartyLite’s North American businesses and overall declines in sales in our Wholesale and Catalog & Internet segments. This decrease was partially offset by an increase in sales within PartyLite’s European markets.
Net Sales – Direct Selling Segment
Net sales in the Direct Selling segment decreased $29.3 million, or 4%, from $664.5 million in fiscal 2009 to $635.2 million in fiscal 2010.
PartyLite’s U.S. sales decreased approximately 14% compared to the prior year, due to the U.S. economic recession, which led to lower consumer discretionary spending, a decline in PartyLite shows as well as a decrease in shows per consultant, all resulting in less opportunity to promote our products and recruit new consultants. We increased promotional activities to attract and retain consultants, hostesses and guests to attend shows. As a result, PartyLite’s active independent US sales consultants remained approximately even on a year-over-year basis.
PartyLite Canada reported a 17% decrease compared to the prior year in U.S. dollars, or 15% on a local currency basis. The sales decrease in Canada is primarily due to the weak Canadian economy which contributed to the decline in consultant base of 8% and a decrease in PartyLite shows year-over-year.
In PartyLite’s European markets, sales increased 3% in U.S. dollars, driven by strong sales in Germany, France and Austria. On a local currency basis, PartyLite Europe sales increased approximately 5%, driven by an increase of approximately 2,000 consultants. PartyLite Europe represented approximately 50% of PartyLite’s worldwide net sales in fiscal 2009 compared to 54% in fiscal 2010, reflecting the continued sales growth within the European markets.
Net sales in the Direct Selling segment represented approximately 63% of total Blyth net sales in fiscal 2009 compared to 66% in fiscal 2010.
Net Sales – Catalog & Internet Segment
Net sales in the Catalog & Internet segment decreased $24.1 million, or 13%, from $190.1 million in fiscal 2009 to $166.0 million in fiscal 2010. Sales decreased across all catalogs due to lower consumer discretionary spending, as well as a planned reduction in catalog circulation in an effort to reduce selling costs through more targeted catalog delivery.
Net sales in the Catalog & Internet segment accounted for approximately 18% of total Blyth net sales in fiscal 2009 and fiscal 2010.
Net Sales – Wholesale Segment
Net sales in the Wholesale segment decreased $39.4 million, or 20%, from $196.2 million in fiscal 2009 to $156.8 million in fiscal 2010. The decrease is primarily a result of reduced sales within our home décor, seasonal décor and food service product lines, which have been adversely impacted by the weak housing market and overall economy.
Net sales in the Wholesale segment represented approximately 19% of total Blyth net sales in fiscal 2009 compared to 16% in fiscal 2010.
Consolidated Gross Profit and Operating Expenses
Blyth’s consolidated gross profit decreased $51.7 million, or 9%, from $577.2 million in fiscal 2009 to $525.5 million in fiscal 2010. The decrease in gross profit is primarily attributable to the 9% decrease in sales, partially offset by rigorous cost controls. These efforts included consolidating some operations and workforce reductions, specifically related to distribution operations. The gross profit margin decreased slightly from 54.9% in fiscal 2009 to 54.8% in fiscal 2010, primarily due to the impact of sales declining at a greater rate than promotional expenses, partially offset by cost reduction measures and a general decrease in most commodity costs, specifically wax products and dyethelene glycol (“DEG”).
Blyth’s consolidated selling expense decreased $33.2 million, or approximately 8%, from $400.7 million in fiscal 2009 to $367.5 million in fiscal 2010. The decrease in selling expense is primarily the result of the reduced sales within the Wholesale segment, PartyLite U.S. and the Catalog & Internet segment. Selling expense as a percentage of net sales increased from 38.1% in fiscal 2009 to 38.4% in fiscal 2010 which is primarily a result of promotional initiatives in the Direct Selling segment to drive sales, partially offset by the consolidation of the sales and marketing operations of our seasonal and home décor Wholesale operations.
Blyth consolidated administrative expenses decreased $12.3 million, or 10%, from $123.8 million in fiscal 2009 to $111.5 million in fiscal 2010. This decline is principally due to improved expense management on a year over year basis. The consolidation of some of our operations has allowed us to reduce administrative costs. The merger of the Midwest and CBK operations within the Wholesale segment resulted in an approximately 23% reduction in that business unit’s administrative expenses when compared to fiscal 2009. Also contributing to the improvement is a $1.9 million gain on a pension plan settlement. Administrative expenses as a percentage of sales declined slightly from approximately 11.8% for fiscal 2009 to 11.6% for fiscal 2010.
Impairment charges of $48.8 million for goodwill and other intangibles were recognized in the Catalog & Internet segment in fiscal 2009, compared to a $16.5 million impairment recorded in the Direct Selling segment in fiscal 2010. In fiscal 2009 and 2010 we reviewed the performance of the Miles Kimball and ViSalus businesses, respectively, and their projected outlooks. Both businesses experienced lower revenue growth and reduced operating margins than anticipated. This shortfall in revenues and profit was primarily attributable to decreased consumer spending due to changes in the business environment and an overall weak economy. As a result, the goodwill and intangibles in the Catalog & Internet segment were determined to be impaired in fiscal 2009 and in the Direct Selling segment during fiscal 2010.
Blyth’s consolidated operating profit increased $26.0 million from $4.0 million in fiscal 2009 to $30.0 million in fiscal 2010. The increase is primarily due to the decrease in goodwill and other intangibles impairments, partially offset by the impact of the 9% decrease in sales.
Operating Profit - Direct Selling Segment
Operating profit in the Direct Selling segment decreased $30.6 million, from $74.4 million in fiscal 2009 to $43.8 million in fiscal 2010. More than half of the decrease is attributable to the $16.5 million goodwill and other intangible impairments related to ViSalus recorded in fiscal 2010. The remaining decline in operating income is attributable to a decline in operating income for PartyLite’s U.S. operations, primarily a result of the 14% decrease in sales. Partially offsetting this decline is sales growth within PartyLite Europe.
Operating Loss – Catalog & Internet Segment
Operating loss in the Catalog & Internet segment decreased from $59.1 million in fiscal 2009, to $4.8 million in fiscal 2010. The lower operating loss is primarily due to the nonrecurring goodwill and other intangibles impairments charges of $48.8 million recorded during fiscal 2009 and a $1.9 million gain as the result of the pension plan settlement realized during fiscal 2010. Excluding the effect of these items, the operating loss would have been $10.3 million last year as compared to $6.7 million this year. This improvement is principally due to the nonrecurring impact of ERP implementation issues experienced in fiscal 2009 that increased shipping and customer service costs and cost reductions at the Miles Kimball Company and Boca Java.
Operating Loss – Wholesale Segment
Operating loss in the Wholesale segment decreased $2.2 million from $11.2 million in fiscal 2009 to $9.0 million in fiscal 2010. This reduction is primarily the result of a 28% improvement in Selling and Administrative expenses across the segment, primarily due to the merger of the Midwest and CBK operations. This was offset by a 20% decrease in sales across the segment due to a soft housing market and a continuing weak economy.
Consolidated Other Expense (Income)
Interest expense decreased $2.2 million, from $10.0 million in fiscal 2009 to $7.8 million in fiscal 2010, primarily due to the payoff of the matured 7.90% Senior Notes during fiscal 2010.
Interest income decreased $2.9 million, from $4.3 million in fiscal 2009 to $1.4 million in fiscal 2010, due to sharply lower interest rates earned on invested cash during fiscal 2010.
Foreign exchange and other losses were $9.8 million in fiscal 2009 compared to $1.6 million in fiscal 2010. The loss recorded in fiscal 2009 includes $5.2 million for the permanent impairment of our investment in RedEnvelope and a write-down of $2.1 million related to our preferred stock portfolio that was previously classified as a trading investment. The loss in fiscal 2010 included a $0.9 million loss on the sale of an auction rate security investment.
Income tax expense increased $1.8 million from $3.8 million in fiscal 2009 to $5.6 million in fiscal 2010. The increase in income tax expense was due primarily to a reduction in pretax losses in the United States and a $9.1 million reduction in our unrecognized tax benefit reserve, partially offset by the tax impact of the non-deductible portion of goodwill and other intangible impairments and impairments of investments for which a partial tax benefit was recorded. The effective tax rate was a negative 33.3% in fiscal 2009 as a result of our net loss compared to an expense of 25.6% for the current year.
The Net loss attributable to Blyth, Inc. was $15.5 million in fiscal 2009 compared to earnings of $17.7 million in fiscal 2010. The improvement is primarily attributable to the $48.8 million goodwill and intangibles impairments recorded during the third quarter of fiscal 2009, partially offset by the $16.5 million goodwill and intangibles impairment recorded in the second quarter of fiscal 2010 and lower sales in relation to the comparable prior year.
As a result of the foregoing, earnings from operations increased $33.2 million, from a loss of $15.5 million in fiscal 2009 to earnings of $17.7 million in fiscal 2010. Basic and diluted earnings (loss) per share from operations were ($1.73) for fiscal 2009 compared to income of $1.99 and $1.98 per share, respectively, for fiscal 2010.
Fiscal 2009 Compared to Fiscal 2008
Consolidated Net Sales
Net sales decreased $114.2 million, or approximately 10%, from $1,165.0 million in fiscal 2008 to $1,050.8 million in fiscal 2009. The decrease is a result of a decline in sales in PartyLite’s North American businesses and overall declines in sales in our Wholesale and Catalog & Internet segments. This decrease was partially offset by an increase in sales within PartyLite’s International markets.
Net Sales – Direct Selling Segment
Net sales in the Direct Selling segment decreased $22.3 million, or 3%, from $686.8 million in fiscal 2008 to $664.5 million in fiscal 2009. PartyLite’s U.S. sales decreased approximately 23% compared to fiscal 2008. This decrease was driven by a decline in the number of sales consultants, which declined from over 27,000 as of January 31, 2008 to over 21,000 as of January 31, 2009, as well as fewer shows. The reduction in sales consultants is partially the result of an increase in competition to attract and retain consultants due to more companies entering the direct selling channel. Additionally, the downturn in the U.S. economy led to lower consumer discretionary spending, which resulted in fewer shows and opportunities to promote our products and recruit new consultants. We initiated new and expanded means to maintain our consultant count such as increased training and promotional initiatives.
PartyLite Canada reported an approximately 10% decrease for fiscal 2009 compared to fiscal 2008 in U.S. dollars, or 6% on a local currency basis. The sales decrease in Canada is primarily due to the decrease in its consultant base.
In PartyLite’s European markets, sales increased approximately 14% in U.S. dollars in fiscal 2009 compared to fiscal 2008, driven by strong sales in the newer markets, an increase of about 5,000 consultants and favorable foreign currency translation. On a local currency basis, PartyLite Europe sales increased approximately 10%. PartyLite Europe represented approximately 42% of PartyLite’s worldwide net sales in fiscal 2008 compared to 50% in fiscal 2009, reflecting the continued sales growth.
Net sales in the Direct Selling segment represented approximately 59% of total Blyth net sales in fiscal 2008 compared to 63% in fiscal 2009.
Net Sales – Catalog & Internet Segment
Net sales in the Catalog & Internet segment decreased $16.7 million, or 8%, from $206.8 million in fiscal 2008 to $190.1 million in fiscal 2009. This decrease is due to lower consumer discretionary spending, as well as order processing difficulties associated with the implementation of a new Enterprise Resource Planning (“ERP “) system.
Net sales in the Catalog & Internet segment accounted for approximately 18% of total Blyth net sales in fiscal 2008 and 2009.
Net Sales – Wholesale Segment
Net sales in the Wholesale segment decreased $75.2 million, or 28%, from $271.4 million in fiscal 2008 to $196.2 million in fiscal 2009. The decrease is a result of reduced sales within our home décor and seasonal decor product lines, which were adversely impacted by the weak housing market. In addition, sales were negatively impacted by $31.8 million, as a result of the
sale of our mass channel candle business, which occurred at the end of the first quarter of fiscal 2008.
Net sales in the Wholesale segment represented approximately 23% of total Blyth net sales in fiscal 2008 compared to 19% in fiscal 2009.
Consolidated Gross Profit and Operating Expenses
Blyth’s consolidated gross profit decreased $38.3 million, or 6%, from $615.5 million in fiscal 2008 to $577.2 million in fiscal 2009. The decrease in gross profit is primarily attributable to the 10% decrease in sales, partially offset by efforts to control costs including reductions in workforce within the manufacturing and distribution operations and renegotiations of certain vendor and supplier contracts. The gross profit margin increased from 52.8% in fiscal 2008 to 54.9% in fiscal 2009. This increase from fiscal 2008 is due in part to nonrecurring charges of $8.9 million, or 0.8%, relating to severance, inventory write-downs and asset impairments in connection with the sale of BHI NA during fiscal 2008. The balance of this increase was primarily due to the absence of BHI NA sales in fiscal 2009 since BHI NA operated at lower margins than Blyth’s other businesses in the prior year.
Blyth’s consolidated selling expense decreased $4.6 million, or approximately 1%, from $405.3 million in fiscal 2008 to $400.7 million in fiscal 2009. The decrease in selling expense relates to the reduced sales in PartyLite U.S. (from $303.8 million is fiscal 2008 to $234.9 million in fiscal 2009) and the Wholesale and Catalog & Internet segments. Offsetting the impact in reduced sales were strategic initiatives undertaken by PartyLite to increase sales. These initiatives include various independent consultant promotional programs aimed at increasing sales and recruiting new consultants. Selling expense as a percentage of net sales increased from 34.8% in fiscal 2008 to 38.1% in fiscal 2009. Overall, the increase in selling expense as a percent of sales is primarily a result of sales decreasing at a greater rate than selling expenses.
Blyth consolidated administrative expenses decreased $6.3 million, or 5%, from $130.1 million in fiscal 2008 to $123.8 million in fiscal 2009. This decline was principally due to severance related charges ($3.2 million) and the termination of an office lease ($2.4 million) taken during fiscal 2008 associated with the sale of BHI NA, as well as improved expense management on a year over year basis. Administrative expenses as a percentage of sales were approximately 11.2% for fiscal 2008 and 11.8% for fiscal 2009.
Impairment charges of $49.2 million for goodwill and other intangibles were recognized in the Catalog & Internet segment in fiscal 2008, compared to $48.8 million in fiscal 2009. In both years we reviewed the performance of the Miles Kimball business and its projected outlook. The Miles Kimball business experienced lower revenue growth and reduced operating margins than anticipated during both fiscal 2008 and 2009. This shortfall in revenues and profit was primarily attributable to decreased consumer spending due to changes in the business environment, an overall weak economic climate and higher postage, paper and printing costs. As a result, the goodwill and intangibles in the Catalog & Internet segment were determined to be impaired in fiscal 2008 and further impaired in fiscal 2009.
Blyth’s consolidated operating profit decreased $26.9 million from $30.9 million in fiscal 2008 to $4.0 million in fiscal 2009. The decrease is primarily due to the decrease in sales partially offset by a corresponding decrease in selling, general and administrative expenses as a result of initiatives to maintain sales, as well as severance incurred due to reductions in personnel.
Operating Profit - Direct Selling Segment
Operating profit in the Direct Selling segment decreased $24.3 million, or 25%, from $98.7 million in fiscal 2008 to $74.4 million in fiscal 2009. The decrease was primarily due to a 20% reduction in sales for PartyLite’s North American operations and increased promotional costs of $5.0 million. Partially offsetting this decline was an improvement in sales within PartyLite Europe, including the positive effects of stronger foreign currencies.
Operating Loss – Catalog & Internet Segment
Operating loss in the Catalog & Internet segment increased by $10.2 million, from $48.9 million in fiscal 2008, to $59.1 million in fiscal 2009. This increased loss was primarily due to the issues associated with the implementation of the new ERP at the Miles Kimball Company and continued lower consumer spending resulting from the weakening economy. Operating losses for fiscal 2008 and 2009 included goodwill and other intangibles impairments charges of $49.2 million and $48.8 million, respectively. Partially offsetting these charges were a reduction in losses at the Boca Java Company of $2.7 million, excluding the $1.9 million goodwill impairment.
Operating Loss – Wholesale Segment
Operating loss in the Wholesale segment decreased from $19.0 million in fiscal 2008 to $11.2 million in fiscal 2009. This reduction is primarily the result of the sale of the BHI NA business in fiscal 2008, which had contributed $18.0 million in operating losses in the prior year, improving operating income this year by $16.3 million. This was partially offset by lower sales and profit across the segment due to a soft housing market and weakening economy.
Consolidated Other Expense (Income)
Interest expense decreased $5.5 million, or 35%, from $15.5 million in fiscal 2008 to $10.0 million in fiscal 2009, primarily due to a decrease in outstanding debt.
Interest income decreased $3.3 million, from $7.6 million in fiscal 2008 to $4.3 million in fiscal 2009, mainly due to lower amounts of cash and short-term investments and lower interest rates during fiscal 2009.
Foreign exchange and other losses were $1.3 million in fiscal 2008 compared to $9.8 million in fiscal 2009. The loss in fiscal 2008 includes a $1.2 million impairment charge related to an available-for-sale equity investment in RedEnvelope, Inc. and a $0.9 million impairment charge on an Australian joint venture investment accounted for under the equity method. The loss recorded in fiscal 2009 includes $5.2 million for the permanent impairment of our investment in RedEnvelope and an unrealized loss of $2.1 million related to our preferred stock portfolio that were classified as trading investments.
Income tax expense decreased $6.7 million from $10.5 million in fiscal 2008 to $3.8 million in fiscal 2009. The decrease in income tax expense was primarily due to a pretax loss in the United States. This decrease was offset by continued strong foreign sourced earnings as well as the tax impact of the non-deductible portion of goodwill and other intangible impairments and impairments of investments for which no tax benefit was recorded. The effective tax rate was 48.6% in fiscal 2008 compared to a negative 33.3% for fiscal 2009 as result of our net loss. The fiscal 2009 rate reflects the strong foreign sourced earnings offset in part by the pretax loss in the United States and the partial benefit taken on the Goodwill and intangible impairments in the Catalog and Internet segment.
As a result of the foregoing, earnings from continuing operations decreased $26.6 million, from $11.1 million in fiscal 2008 to a loss of $15.5 million in fiscal 2009. Basic earnings per share from continuing operations were $1.15 for fiscal 2008 compared to a loss of $1.73 for fiscal 2009. Diluted earnings per share from continuing operations were $1.14 for fiscal 2008 compared to a loss of $1.73 for fiscal 2009.
Seasonality
Historically, our operating cash flow for the first nine months of the fiscal year shows little if any positive cash flow, due to requirements for meeting working capital needs for inventory purchases and the extension of credit through the holiday season. Our fourth quarter, however, historically generated a surplus of cash resulting from a large concentration of our business occurring during the winter holiday season. Over one third of our total revenue was recorded in the fourth quarter of fiscal 2010.
Liquidity and Capital Resources
In fiscal 2009, the cash provided by operations of $37.8 million was significantly lower than previously experienced. During both fiscal 2010 and fiscal 2009, management took a number of actions to address this decline. First, we began and continue to execute an aggressive working capital management program designed to conserve cash. Second, we have focused on cost cutting measures throughout the Company with the goal to save cash. Third, we have altered the timing and level of dividends and treasury share buybacks and may continue to do so in the future. These initiatives have supported our expectation that we will be able to fund our working capital requirements in the foreseeable future from cash flow from operations, as seen by the $93.4 million in cash provided by operations in fiscal 2010.
Cash and cash equivalents increased $61.0 million from $146.4 million at January 31, 2009 to $207.4 million at January 31, 2010, as a result of the aforementioned measures put in effect by management.
We typically generate positive cash flow from operations due to favorable gross margins and the variable nature of selling expenses, which constitute a significant percentage of operating expenses. We generated $37.8 million in cash from operations in fiscal 2009 compared to $93.4 million in fiscal 2010. Included in earnings in fiscal 2010 were non-cash charges for depreciation and amortization, goodwill and other intangible impairments and amortization of unearned stock-based compensation of $16.6 million, $16.5 million and $2.7 million, respectively.
Net changes in operating assets and liabilities provided cash of $35.9 million in fiscal 2010, primarily driven by a $36.2 million reduction in inventories. Due to the seasonal nature of our businesses we generally do not have significant positive cash flow from operations until our fourth quarter. Our working capital needs are the highest in late summer prior to the start of the holiday season. If demand for our products falls short of expectations, we could be required to maintain higher inventory balances than forecasted and could negatively impact our liquidity.
Net cash used by investing activities was $4.8 million in fiscal 2009, compared to a source of $6.1 million in fiscal 2010. Our investments decreased slightly from $25.0 million as of January 31, 2009 to $24.1 million at January 31, 2010, primarily through liquidations offset by the acquisition of short-term certificates of deposit. Other sources of cash in fiscal 2010 were $6.6 million received on the cash settlement of a net investment hedge and $3.9 million received from the sale of assets. Net capital expenditures for property, plant and equipment were $5.4 million in fiscal 2010, down from $8.2 million in fiscal 2009. We used cash of $15.8 million during fiscal
2009 to obtain our 43.6% interest in ViSalus and the acquisition of certain assets of the As We Change catalog.
Net cash used in financing activities in fiscal 2009 was $43.7 million compared to $41.3 million in fiscal 2010. The current year included the reduction of our long-term debt and capital lease obligations by $38.0 million, compared to long-term debt and capital lease payments of $13.2 million in the prior year. During fiscal 2010, we purchased treasury stock of $4.0 million and paid dividends of $1.8 million compared to $11.1 million and $19.4 million, respectively, in fiscal 2009. We will continue to carefully monitor our cash position, and will only make additional repurchases of outstanding debt or treasury shares and will only pay dividends when we have sufficient cash surpluses available to do so.
In addition to the United States, a significant portion of our operations are in Western European nations, Canada, Australia and Mexico. A significant downturn in our business in these markets would adversely impact our ability to generate operating cash flows. Operating cash flows would also be negatively impacted if we experienced difficulties in the recruitment, retention and our ability to maintain the productivity of our independent consultants.
Although there was a significant improvement in operating cash flow during fiscal 2010, sales decreased in the PartyLite U.S. market from the prior year by $33.9 million, or 14%, which was driven by lower activity by existing consultants and a lower number of PartyLite shows held resulting from difficult economic conditions. Management’s key areas of focus have included stabilizing the consultant base through training and promotional incentives. Following several years of declines in consultant count in the United States fiscal 2010 represented a period of stability as the number of active independent sales consultants has increased slightly as a result of management efforts. While we are making efforts to stabilize and increase the number of active independent sales consultants, it may be difficult to do so in the current economic climate due to reduced consumer discretionary spending. If our U.S. consultant count declines it will have a negative impact on our liquidity and financial results.
We anticipate total capital spending of approximately $10 million for fiscal 2011. A major influence on the forecasted expenditures is our investment in the growth of the PartyLite European operations as well as investments in information technology systems. We have grown in part through acquisitions and, as part of our growth strategy, we expect to continue from time to time in the ordinary course of business to evaluate and pursue acquisition opportunities as appropriate. We believe our financing needs in the short and long term can be met from cash generated internally. Information on debt maturities is presented in Note 13 to the Consolidated Financial Statements.
On October 21, 2008, we acquired a 43.6% interest in ViSalus for $13.0 million and incurred acquisition costs of $1.0 million for a total cash acquisition cost of $14.0 million. We intend to and may be required to purchase additional interests in ViSalus that will require additional capital resources, increasing our ownership to 100%. These additional purchases were originally conditioned upon ViSalus meeting certain operating targets in calendar years 2009, 2010 and 2011. However, ViSalus did not meet the operating threshold in 2009 so we were not required to make an additional purchase. We have exercised our one-time, one-year extension and additional purchases will be made if ViSalus meets certain operating targets in calendar years 2010, 2011 and 2012. We have the option, but are not required, to acquire the remaining interest in ViSalus if they do not meet these operating targets. If ViSalus meets its current projected operating targets, the total expected redemption value of the noncontrolling interest will be approximately $4.5 million over calendar years 2011, 2012 and 2013. The purchase prices of the additional investments are equal to a multiple of ViSalus’ earnings before interest, taxes, depreciation and
amortization, exclusive of certain extraordinary items. The payment, if any, will be out of existing cash balances and from expected future cash flows from operations.
United States and global credit and equity markets have undergone significant disruption in the past few years, making it difficult for many businesses to obtain financing on acceptable terms. In addition, equity markets are continuing to experience rapid and wide fluctuations in value. If these conditions continue or worsen, our cost of borrowing may increase and it may be more difficult to obtain financing for our businesses. In addition, our borrowing costs can be affected by short and long-term debt ratings assigned by independent rating agencies. A decrease in these ratings would likely increase our cost of borrowing and/or make it more difficult for us to obtain financing. Obtaining a new credit facility will more than likely require higher interest costs and may require our providing security to guarantee such borrowings. Alternatively, we may not be able to obtain unfunded borrowings, which may require us to seek other forms of financing, such as term debt, at higher interest rates and additional expense.
In addition, if the economic conditions continue to worsen, we may be subject to future impairments of our assets, including accounts receivable, inventories, property, plant and equipment, investments, goodwill and other intangibles, if the valuation of these assets or businesses continues to decline.
As of January 31, 2010, we had a total of $2.0 million available under an uncommitted facility with Bank of America to be used for letters of credit through January 31, 2011. As of January 31, 2010, no letters of credit were outstanding under this facility.
In May 1999, we filed a shelf registration statement for issuance of up to $250.0 million in debt securities with the Securities and Exchange Commission. On September 24, 1999, we issued $150.0 million of 7.90% Senior Notes due October 1, 2009 at a discount of approximately $1.4 million, which was amortized over the life of the notes. During the first nine months of fiscal 2010 we repurchased $12.6 million of these notes prior to their maturity date. The final principal payments of $24.7 million were made upon maturity.
On October 20, 2003, we issued $100.0 million 5.50% Senior Notes due on November 1, 2013 at a discount of approximately $0.2 million, which is being amortized over the life of the notes. Such notes contain among other provisions, restrictions on liens on principal property or stock issued to collateralize debt. As of January 31, 2010, we were in compliance with such provisions. Interest is payable semi-annually in arrears on May 1 and November 1. The notes may be redeemed in whole or in part at any time at a specified redemption price. The proceeds of the debt issuances were used for general corporate purposes.
As of January 31, 2009 and 2010, Miles Kimball had approximately $8.2 million and $7.7 million, respectively, of long-term debt (including current portion) outstanding under a real estate mortgage note payable, which matures on June 1, 2020. Under the terms of the note, payments of principal and interest are required monthly at a fixed interest rate of 7.89%.
As of January 31, 2009 and 2010, Midwest-CBK had $0.1 million, of long-term debt outstanding under an Industrial Revenue Bond (“IRB”), which matures on January 1, 2025. The bond is backed by an irrevocable letter of credit. The loan is collateralized by certain of Midwest-CBK’s assets. The amount outstanding under the IRB bears interest at short-term floating rates, which on a weighted average was 0.3% as of January 31, 2010. Interest payments are required monthly and the principal is due upon maturity.
As of January 31, 2010 ViSalus had $2.7 million of long-term debt outstanding related to notes payable to RAM and ViSalus’ three founders. Under the terms of the notes, interest is accrued at a fixed interest rate of 10.0%.
The estimated fair value of our $145.7 million and $110.5 million total long-term debt (including current portion) at January 31, 2009 and 2010 was approximately $120.6 million and $95.6 million, respectively. The fair value of the liability is determined using the fair value of its notes when traded as an asset in an inactive market and is based on current interest rates, relative credit risk and time to maturity.
The following table summarizes the maturity dates of our contractual obligations as of January 31, 2010:
|
Less than
|
More than
|
|||||||||||||||||||
|
Contractual Obligations (In thousands)
|
Total
|
1 year
|
1 - 3 Years
|
3 - 5 Years
|
5 Years
|
|||||||||||||||
|
Long-Term Debt(1)
|
$ | 110,404 | $ | 498 | $ | 3,782 | $ | 101,232 | $ | 4,892 | ||||||||||
|
Capital Leases(2)
|
140 | 84 | 56 | - | - | |||||||||||||||
|
Interest(3)
|
24,800 | 6,375 | 12,333 | 4,977 | 1,115 | |||||||||||||||
|
Purchase Obligations(4)
|
38,719 | 36,872 | 1,698 | 149 | - | |||||||||||||||
|
Operating Leases
|
43,075 | 13,731 | 19,312 | 7,131 | 2,901 | |||||||||||||||
|
Unrecognized Tax Benefits(5)
|
12,271 | 218 | - | - | - | |||||||||||||||
|
Total Contractual Obligations
|
$ | 229,409 | $ | 57,778 | $ | 37,181 | $ | 113,489 | $ | 8,908 | ||||||||||
|
(1) Long-term debt includes 5.5% Senior Notes due November 1, 2013, a mortgage note payable-maturity June 1, 2020, and an Industrial Revenue Bond ("IRB") with a maturity date of January 1, 2025 (See Note 13 to the Consolidated Financial Statements).
|
||||||||||||||||||||
|
(2) Amounts represent future lease payments, excluding interest, due on five capital leases, which end between fiscal 2011 and fiscal 2013 (See Note 13 to the Consolidated Financial Statements).
|
||||||||||||||||||||
|
(3) Interest expense on long-term debt is comprised of $20.6 million relating to Senior Notes, $3.6 million in mortgage interest, $5 thousand of interest due on the CBK Industrial Revenue Bond, $532 thousand relating to the Visalus founder loans and approximately $25 thousand of interest relating to future capital lease obligations.
|
||||||||||||||||||||
|
(4) Purchase obligations consist primarily of open purchase orders for inventory.
|
||||||||||||||||||||
|
(5) Unrecognized tax benefits consist of $0.2 million which is expected to be realized within the next 12 months, and $12.1 million for
|
||||||||||||||||||||
|
which we are not able to reasonably estimate the timing of the potential future payments (See Note 16 to the Consolidated Financial Statements).
|
||||||||||||||||||||
Since January 31, 2009, we have purchased 120,000 shares on the open market, for a cost of $4.0 million, bringing the cumulative total purchased shares to 2,735,570 as of January 31, 2010, for a total cost of approximately $228.8 million. Additionally in fiscal 2005, 1,226,654 shares were repurchased through a Dutch auction cash tender offer for an aggregate purchase price of $172.6 million, including fees and expenses. The acquired shares are held as common stock in treasury at cost.
On January 19, 2010, the Company announced that it had declared a special cash dividend of $1.00 per share of common stock, committing us to an $8.8 million payment in February 2010. The dividend was payable to shareholders of record as of February 2, 2010, and was paid on February 16, 2010.
During fiscal 2010 we paid a total of $1.8 million in dividends, compared to $19.4 million in fiscal 2009. The total dividends declared during fiscal 2010 were approximately $10.6 million, which includes the $8.8 million special dividend declared in January 2010 and paid in February 2010. Our ability to pay cash dividends in the future is dependent upon, among other things, our ability to operate profitably and to generate significant cash flows from operations in excess of investment and financing requirements that may increase in the future to, for example, fund new acquisitions or retire debt. As we normally do, we will review our dividend policy prior to our next dividend payment (historically we have paid dividends in May and November), and may adjust the rate of our semi-annual dividend if necessary. We may also consider paying a special dividend around the end of fiscal 2011 as we determine the operating results of our seasonal businesses.
We do not maintain any off-balance sheet arrangements, transactions, obligations or other relationships with unconsolidated entities that would be expected to a have a material current or future effect upon our financial statements. We utilize derivatives for operational purposes.
Critical Accounting Policies
Our discussion and analysis of our financial condition and results of operations are based upon our consolidated financial statements, which have been prepared in accordance with accounting principles generally accepted in the United States. The preparation of these financial statements requires us to make estimates and judgments that affect the reported amounts of assets, liabilities, revenues and expenses, and related disclosure of contingent assets and liabilities. On an ongoing basis, we evaluate our estimates, including those related to bad debts, sales adjustments, inventories, income taxes, restructuring and impairments, contingencies and litigation. We base our estimates on historical experience and on various other assumptions that we believe to be reasonable under the circumstances, the results of which form the basis for making judgments about the carrying values of assets and liabilities that are not readily apparent from other sources. Actual results may differ from these estimates under different assumptions or conditions.
Note 1 to the Consolidated Financial Statements includes a summary of the significant accounting policies and methods used in the preparation of our consolidated financial statements. The following are our critical accounting policies and methods.
Revenue Recognition
Revenues consist of sales to customers, net of returns and allowances. We recognize revenue upon delivery, when both title and risk of loss are transferred to the customer. We present revenues net of any taxes collected from customers and remitted to government authorities.
Generally, our sales are based on fixed prices from published price lists. We record estimated reductions to revenue for customer programs, which may include special pricing agreements for specific customers, volume incentives and other promotions. Should market conditions decline, we may increase customer incentives with respect to future sales. We also record reductions to revenue based primarily on historical experience, for estimated customer returns and chargebacks that may arise as a result of shipping errors, product damage in transit or for other reasons that can only become known subsequent to recognizing the revenue. If the amount of actual customer returns and chargebacks were to increase significantly from the estimated amount, revisions to the estimated allowance would be required. In some instances, we receive payment in advance of product delivery. Such advance payments occur primarily in our direct selling and direct marketing channels and are recorded as deferred revenue in Accrued expenses in the Consolidated Balance Sheets. Upon delivery of product for which advance payment has been made, the related deferred revenue is reversed and recorded as revenue.
We establish an allowance for doubtful accounts for trade and note receivables. The allowance is determined based on our evaluation of specific customers’ ability to pay, aging of receivables, historical experience and the current economic environment. While we believe we have appropriately considered known or expected outcomes, our customers’ ability to pay their obligations, including those to us, could be adversely affected by declining retail sales resulting from such factors as contraction in the economy or a general decline in consumer spending. Some of our wholesale business units offer seasonal dating programs pursuant to which customers that qualify for such programs are offered extended payment terms for seasonal product shipments, which is a common practice in some of our channels. The sales price for our products sold pursuant to such seasonal dating programs is fixed prior to the time of shipment to the customer. Customers do not have the right to return product, except for rights to return that
we believe are typical of our industry for such reasons as damaged goods, shipping errors or similar occurrences. We are not required to repurchase products from our customers, nor do we have any regular practice of doing so. We believe that we are reasonably assured of payment for products sold pursuant to such seasonal dating programs based on our historical experience with the established list of customers eligible for such programs. If, however, product sales by our Wholesale segment’s customers during the seasonal selling period should fall significantly below expectations, such customers’ financial condition could be adversely affected, increasing the risk of not collecting these seasonal dating receivables and, possibly, resulting in additional bad debt charges. We do not make any sales under consignment or similar arrangements.
Inventory valuation
Inventories are valued at the lower of cost or market. Cost is determined by the first-in, first-out method. We write down our inventory for estimated obsolete, excess and unmarketable inventory by an amount equal to the difference between the cost of inventory and the estimated market value based upon assumptions about future demand, market conditions, customer planograms and sales forecasts. If market acceptance of our existing products or the successful introduction of new products should significantly decrease, additional inventory write-downs could be required. Potential additional inventory write-downs could result from unanticipated additional quantities of obsolete finished goods and raw materials, and/or from lower disposition values offered by the parties who normally purchase surplus inventories.
Restructuring and impairment charges on long-lived assets
In response to changing market conditions and competition, our management regularly updates our business model and market strategies, including the evaluation of facilities, personnel and products. Future adverse changes in economic and market conditions could result in additional organizational changes and possibly additional restructuring and impairment charges. Historically, we have reviewed long-lived assets, including property, plant and equipment and other intangibles with definite lives for impairment annually and whenever events or changes in circumstances indicated that the carrying amount of such an asset might not be recoverable. Management determines whether there has been a permanent impairment on long-lived assets held for use in the business by comparing anticipated undiscounted future cash flow from the use and eventual disposition of the asset or asset group to the carrying value of the asset. The amount of any resulting impairment is calculated by comparing the carrying value to the fair value, which may be estimated using the present value of the same cash flows. Long-lived assets that meet the definition of held for sale are valued at the lower of carrying amount or net realizable value.
Goodwill and other indefinite lived intangibles
We had approximately $14.0 million and $2.3 million of goodwill as of January 31, 2009 and 2010, respectively. Goodwill is subject to an assessment for impairment using a two-step fair value-based test and as such other intangibles are also subject to impairment reviews, which must be performed at least annually or more frequently if events or circumstances indicate that goodwill or other indefinite lived intangibles might be impaired.
We perform our annual assessment of impairment as of January 31, which is our fiscal year-end date, or as deemed necessary. For goodwill, the first step is to identify whether a potential impairment exists. This first step compares the fair value of a reporting unit to its carrying amount, including goodwill. Fair value for each of our reporting units is estimated utilizing a combination of valuation techniques, namely the discounted cash flow methodology and the market multiple methodology. The fair value of the reporting units is derived using a combination of the outcome of the two valuation techniques described above and depends in part on whether
the market multiple methodology has sufficient similar transactions occurring in a recent timeframe. The discounted cash flow methodology assumes the fair value of an asset can be estimated by the economic benefit or net cash flows the asset will generate over the life of the asset, discounted to its present value. The discounting process uses a rate of return that accounts for both the time value of money and the investment risk factors. The market multiple methodology estimates fair value based on what other participants in the market have recently paid for reasonably similar assets. Adjustments are made to compensate for differences between the reasonably similar assets and the assets being valued. If the fair value of the reporting unit exceeds the carrying value, no further analysis is necessary. If the carrying amount of the reporting unit exceeds its fair value, the second step is performed. The second step compares the carrying amount of the goodwill to the estimated fair value of the goodwill. If fair value is less than the carrying amount, an impairment loss is reported as a reduction to goodwill and a charge to operating expense.
Our assumptions in the discounted cash flow methodology used to support recoverability include the reporting unit’s five year business outlook. The business outlook is a five year projection of the business unit’s financial performance. The business outlook includes the cash expected to be generated from the reporting unit based on certain assumptions for revenue growth, capital spending and profit margins. This serves as the basis for the discounted cash flow model in determining fair value. Additionally, the discount rate utilized in the cash flow model values the reporting unit to its net present value taking into consideration the time value of money, other investment risk factors and the terminal value of the business. For the terminal value, we used a multiple of earnings before income taxes, depreciation and amortization (“EBITDA”) multiplied by a certain factor for which an independent third party would pay for a similar business in an arms length transaction. In determining this factor we used information that was available for similar transactions executed in the marketplace. The multiple of EBITDA used contemplates, among other things, the expected revenue growth of the business, which in turn would require the use of a higher EBITDA multiple if revenue were expected to grow at a higher rate than normal. The following circumstances could impact our cash flow and cause further impairments to reported goodwill:
|
· unexpected increase in competition resulting in lower prices or lower volumes,
|
|
· entry of new products into the marketplace from competitors,
|
|
· lack of acceptance of our new products into the marketplace,
|
|
· loss of a key employee or customer,
|
|
· significantly higher raw material costs, and
|
|
· a prolonged economic downturn
|
|
· other micro/macroeconomic factors.
|
Goodwill
Miles Kimball
As a result of our third quarter of fiscal 2009 impairment assessment, we determined that the goodwill related to the Miles Kimball reporting unit, in the Catalog & Internet segment, was impaired. The Miles Kimball Company continued to experience substantial declines in operating performance when compared to prior years’ results and its strategic outlook. We believe this shortfall in performance was primarily attributable to decreased consumer spending due to changes in the business environment and adverse economic conditions. As a result of the impairment analysis performed, the goodwill was determined to be fully impaired, as the fair value of the reporting unit was less than its carrying value, including goodwill. Accordingly, we
recorded a non-cash pre-tax goodwill impairment charge of $29.0 million, which included the $1.3 million related to As We Change, during the third quarter of fiscal 2009.
Direct Selling Segment
In the second quarter of fiscal 2010, ViSalus, revised downward its revenues forecast for the current fiscal year as a result of lower demand for its product reflecting lower consumer spending attributed to the domestic economic recession and a higher than anticipated attrition rate in its distributor base. These factors together have required management to focus its efforts on stabilizing its distributor base and curtailing its international expansion plans. Accordingly management has reduced its current year and long-term forecasts in response to the weakening demand for its products. The impairment analysis performed indicated that the goodwill in ViSalus was fully impaired, as its fair value was less than its carrying value, including goodwill. Accordingly, we recorded a non-cash pre-tax goodwill impairment charge of $13.2 million, during the second quarter of fiscal 2010. The January 31, 2010 impairment assessment of remaining $2.3 million of goodwill within this segment indicates that it is fully recoverable.
Other
In August 2005, we acquired a 100% interest in Boca Java, a small gourmet coffee and tea company. Boca Java sells its products primarily through the internet and is included in the Catalog & Internet segment. Boca Java represents a separate reporting unit and is reviewed for impairment on an annual basis. We completed an impairment assessment during fiscal 2009 which indicated that the goodwill of $1.9 million was fully impaired and recorded a charge to write off the goodwill.
Significant assumptions
If actual revenue growth, profit margins, costs and capital spending should differ significantly from the assumptions included in our business outlook used in the cash flow models, the reporting unit’s fair value could fall significantly below expectations and additional impairment charges could be required to write down goodwill to its fair value and, if necessary, other long lived assets could be subject to a similar fair value test and possible impairment. Long lived assets represent primarily fixed assets and other long term assets excluding goodwill and other intangibles.
There are two main assumptions that are used for the discounted cash flow analysis: first, the discount rate and second the terminal multiple. This discount rate is used to value the gross cash flows expected to be derived from the business to its net present value. The discount rate uses a rate of return to account for the time value of money and an investment risk factor. For the terminal multiple, we used EBITDA multiplied by a factor for which an independent third party would pay for a similar business in an arms length transaction. In determining this factor we used information that was available for similar transactions executed in the marketplace. The multiple of EBITDA used contemplates, among other things, the expected revenue growth of the business which in turn would require the use of a higher EBITDA multiple if revenue were expected to grow at a higher rate than normal. A change in the discount rate is often used by management to alter or temper the discounted cash flow model if there is a higher degree of risk that the business outlook objectives might not be achieved. These risks are often based upon the business units past performance, competition, confidence in the business unit management, position in the marketplace, acceptance of new products in the marketplace and other macro and microeconomic factors surrounding the business.
If management believes there is additional risk associated with the business outlook it will adjust the discount rate and terminal value accordingly. The terminal value is generally a multiple of EBITDA and is discounted to its net present value using the discount rate. Capital expenditures are included and are consistent with the historical business trend plus any known significant expenditures.
Trade Names and Trademarks
Our trade name and trademark intangible assets related to our acquisitions of Miles Kimball and Walter Drake (reported in the Catalog & Internet segment) and our acquisition of a controlling interest in ViSalus in October 2008 (reported in the Direct Selling segment). We had approximately $12.1 million and $9.0 million in trade names and trademarks as of January 31, 2009 and 2010, respectively.
We perform our annual assessment of impairment for indefinite-lived intangible assets as of January 31, which is our fiscal year-end, or upon the occurrence of a triggering event. We use the relief from royalty method to estimate the fair value for indefinite-lived intangible assets. The underlying concept of the relief from royalty method is that the inherent economic value of intangibles is directly related to the timing of future cash flows associated with the intangible asset. Similar to the income approach or discounted cash flow methodology used to determine the fair value of goodwill, the fair value of indefinite-lived intangible assets is equal to the present value of after-tax cash flows associated with the intangible asset based on an applicable royalty rate. The royalty rate is determined by using existing market comparables for royalty agreements using an intellectual property data base. The arms-length agreements generally support a rate that is a percentage of direct sales. This approach is based on the premise that the free cash flow is a more valid criterion for measuring value than “book” or accounting profits.
As a result of our fiscal 2009 impairment assessments, we determined that the recorded values of trade names and trademarks in the Miles Kimball reporting unit, in the Catalog & Internet segment, were impaired. In the third and fourth quarters of fiscal 2009 we performed additional impairment assessments due to changes in the business environment and adverse economic conditions currently experienced due to the continued decrease in consumer spending. As a result of these impairment analyses performed, the trade names and trademarks in this reporting unit were determined to be impaired, as their fair value was less than their carrying value. Accordingly, we recorded non-cash pre-tax impairment charges of $15.0 million and $2.9 million in the third and fourth quarters, respectively of fiscal 2009.
During the second quarter of fiscal 2010 we performed impairment assessments due to adverse economic conditions currently experienced due to the continued decrease in consumer spending and a higher then expected distributor attrition rate. We determined that the recorded values of trade names, trademarks and customer relationships within ViSalus, in the Direct Selling segment, were impaired. As a result of these impairment analyses performed, the intangible assets were determined to be impaired, as their fair value was less than their carrying value. Accordingly, we recorded a non-cash pre-tax impairment charge of $3.1 million related to the trade names and trademarks and $0.2 million related to customer relationships.
As of January 31, 2010 we performed our annual impairment analysis on the trade names and trademarks of the Catalog & Internet and ViSalus assets. The three primary assumptions used in the relief from royalty method are the discount rate, the perpetuity growth rate and the royalty rate. This discount rate is used to value the expected net cash flows to be derived from the royalty to its net present value. The discount rate uses a rate of return to account for the time value of money and an investment risk factor. The perpetuity growth rate estimates the businesses sustainable long-term growth rate. The royalty rate is based upon past royalty performance as
well as the expected royalty growth rate using both macro and microeconomic factors surrounding the business. A change in the discount rate is often used by management to risk adjust the discounted cash flow analysis if there is a higher degree of risk that the estimated cash flows from the indefinite-lived intangible asset may not be fully achieved. These risks are often based upon the business units’ past performance, competition, position in the marketplace, acceptance of new products in the marketplace and other macro and microeconomic factors surrounding the business. If, however, actual cash flows should fall significantly below expectations, this could result in an impairment of our indefinite-lived intangible assets.
If the discount rate would have increased by 1% and royalty rate would have decreased by 0.5%, the estimated fair value of the trade names and trademarks within the Catalog & Internet segment would have decreased the $7.8 million recorded value by $3.0 million to $4.8 million.
If the discount rate would have increased by 1% and the royalty rate would have decreased by 0.5%, the estimated fair value of ViSalus’ trade names and trademarks within the Direct Selling segment would have decreased the $1.1 million recorded value by $0.3 million to $0.8 million.
Accounting for income taxes
As part of the process of preparing our Consolidated Financial Statements, we are required to estimate our actual current tax exposure (state, federal and foreign), together with assessing permanent and temporary differences resulting from differing bases and treatment of items for tax and accounting purposes, such as the carrying value of intangibles, deductibility of expenses, depreciation of property and equipment, and valuation of inventories. Temporary differences result in deferred tax assets and liabilities, which are included within our Consolidated Balance Sheets. We must then assess the likelihood that our deferred tax assets will be recovered from future taxable income. Actual results could differ from this assessment if sufficient taxable income is not generated in future periods. To the extent we determine the need to establish a valuation allowance or change the allowance in a period, we would include this as an expense within the tax provision in the accompanying Consolidated Statements of Earnings (Loss). Management periodically estimates our probable tax obligations using historical experience in tax jurisdictions and informed judgments. There are inherent uncertainties related to the interpretation of tax regulations in the jurisdictions in which we transact business. The judgments and estimates made at a point in time may change based on the outcome of tax audits, as well as changes to or further interpretations of regulations. If such changes take place, there is a risk that the tax rate may increase or decrease in any period. Amounts accrued for the tax uncertainties, primarily recorded in long-term liabilities, total $24.5 million and $12.3 million at January 31, 2009 and 2010, respectively. Accruals relate to tax issues for U.S. federal, domestic state, and taxation of foreign earnings.
Blyth’s historical policy has been to consider its unremitted foreign earnings as not indefinitely invested except for amounts deemed required for working capital and expansion needs and as such provide deferred income tax expense on these undistributed earnings. The Company periodically reassesses whether the non-US subsidiaries will invest their undistributed earnings indefinitely.
As of January 31, 2010, we determined that $193.0 million of cumulative undistributed foreign earnings were not reinvested indefinitely by our non-U.S. subsidiaries. During fiscal 2010, additional deferred income taxes of $6.8 million were recorded as a reduction to our Net earnings on these unremitted earnings.
In August 2008, a state department of revenue proposed to assess additional corporate income taxes on us for fiscal years 2002, 2003 and 2004 in the net amount of $34.9 million, which
includes interest. We filed a protest to the assessment and intend to contest it vigorously. During fiscal 2008, we established a reserve for this matter which we believe is adequate based on existing facts and circumstances. The ultimate resolution of this matter could exceed our recorded reserve in the event of an unfavorable outcome of this matter. It is reasonably possible that losses in excess of our recorded reserve could be incurred; however, we cannot estimate such a loss at this time.
Impact of Adoption of Recently Issued Accounting Standards
We have reviewed all guidance issued but not implemented as of the filing date and have determined that only the following could or do have a significant affect on our financial statements.
In January 2010, the Financial Accounting Standards Board (“FASB”) issued Accounting Standards Update (“ASU”) 2010-06, "Fair Value Measurements and Disclosures (Topic 820) - Improving Disclosures about Fair Value Measurements" (“ASU 2010-06”). ASU 2010-06 requires new disclosures regarding transfers in and out of the Level 1 and 2 and activity within Level 3 fair value measurements and clarifies existing disclosures of inputs and valuation techniques for Level 2 and 3 fair value measurements. The new disclosures and clarifications of existing disclosures are effective for interim and annual reporting periods beginning after December 15, 2009, except for the disclosure of activity within Level 3 fair value measurements, which is effective for fiscal years beginning after December 15, 2010, and for interim periods within those years. This update will only have an impact on our disclosures beginning February 1, 2010 and will not have a material impact on our financial statements.
Forward-looking and Cautionary Statements
Certain statements contained in this report may constitute forward-looking statements within the meaning of the Private Securities Litigation Reform Act of 1995. These statements involve a number of risks, uncertainties and other factors that could cause actual results to differ materially, as discussed more fully elsewhere in this report and in our previous filings with the Securities and Exchange Commission.
Item 7A. Quantitative and Qualitative Disclosures About Market Risk
Market Risk
We have operations outside of the United States and sell our products worldwide. Our activities expose us to a variety of market risks, including the effects of changes in interest rates, foreign currency exchange rates and commodity prices. These financial exposures are actively monitored and, where considered appropriate, managed by us. We enter into contracts, with the intention of limiting these risks, with only those counterparties that we deem to be creditworthy, in order to also mitigate our non-performance risk.
Interest Rate Risk
We are subject to interest rate risk on both variable rate debt and our investments in auction rate securities. As of January 31, 2010, we are subject to interest rate risk on approximately $0.1 million of variable rate debt. A 1-percentage point increase in the interest rate would not have a significant impact on pre-tax earnings. As of January 31, 2010, we held $10.0 million of auction rate securities, at par value. As the effective rate is below 1 % as of January 31, 2010 any decrease in the rate of return would not significantly impact pre-tax earnings.
Investment Risk
We are subject to investment risks on our marketable securities due to market volatility. As of January 31, 2010 we held $15.7 million in equity instruments which have been adjusted to fair value based on current market data.
Foreign Currency Risk
We use foreign exchange forward contracts to hedge the impact of foreign currency fluctuations on foreign denominated inventory purchases, intercompany payables and certain foreign denominated loans. We do not hold or issue derivative financial instruments for trading purposes. We have, in the past, hedged the net assets of certain of our foreign operations through foreign currency forward contracts. The net after-tax gain related to the derivative net investment hedges recorded in Accumulated other comprehensive income (loss) (“AOCI”) during fiscal 2010 was $0.4 million. The after-tax gain in AOCI related to net investment hedges as of January 31, 2010 was $5.2 million.
We have designated our forward exchange contracts on forecasted intercompany purchases and future purchase commitments as cash flow hedges and as such, as long as the hedge remains effective and the underlying transaction remains probable, the effective portion of the changes in the fair value of these contracts will be recorded in AOCI until earnings are affected by the variability of the cash flows being hedged. With regard to commitments for inventory purchases, upon payment of each commitment, the underlying forward contract is closed and the corresponding gain or loss is transferred from AOCI and is included in the measurement of the cost of the acquired asset. If a hedging instrument is sold or terminated prior to maturity, gains and losses are deferred in AOCI until the hedged item is settled. However, if the hedged item is probable of no longer occurring, the resulting gain or loss on the terminated hedge is recognized into earnings immediately. During fiscal 2010 the amount transferred to earnings was a loss of $1.4 million. The net after-tax gain included in AOCI at January 31, 2010 is $0.1 million and is expected to be transferred into earnings within the next twelve months upon payment of the underlying commitment.
We have designated our foreign currency forward contracts related to certain foreign denominated loans and intercompany payables as fair value hedges. The gains or losses on the fair value hedges are recognized into earnings and generally offset the transaction gains or losses in the foreign denominated loans that they are intended to hedge.
For consolidated financial statement presentation, net cash flows from such forward contracts are classified in the categories of the Consolidated Statements of Cash Flows with the items being hedged.
Forward contracts held with each bank are presented in a net asset or liability position based netting agreements with each bank.
The following table provides information about our foreign exchange forward contracts accounted for as cash flow hedges at January 31, 2010:
|
US Dollar
|
Average
|
Unrealized
|
||||||||||
|
(In thousands, except average contract rate)
|
Notional Amount
|
Contract Rate
|
Gain (Loss)
|
|||||||||
|
Euro
|
$ | 5,975 | $ | 1.47 | $ | 144 | ||||||
The foreign exchange contracts outstanding have maturity dates through October 2010.
Item 8. Financial Statements and Supplementary Data
Report of Independent Registered Public Accounting Firm
The Board of Directors and Stockholders of Blyth, Inc.
We have audited the accompanying consolidated balance sheet of Blyth, Inc. and Subsidiaries (the “Company”) as of January 31, 2010, and the related consolidated statements of earnings (loss), stockholders' equity, and cash flows for the year then ended. Our audit also included the financial statement schedule listed at Item 15(a)(2). These financial statements and schedule are the responsibility of the Company's management. Our responsibility is to express an opinion on these financial statements and schedule based on our audit.
We conducted our audit in accordance with the standards of the Public Company Accounting Oversight Board (United States). Those standards require that we plan and perform the audit to obtain reasonable assurance about whether the financial statements are free of material misstatement. An audit includes examining, on a test basis, evidence supporting the amounts and disclosures in the financial statements. An audit also includes assessing the accounting principles used and significant estimates made by management, as well as evaluating the overall financial statement presentation. We believe that our audit provides a reasonable basis for our opinion.
In our opinion, the financial statements referred to above present fairly, in all material respects, the consolidated financial position of the Company at January 31, 2010, and the consolidated results of their operations and their cash flows for the year then ended, in conformity with U.S. generally accepted accounting principles. Also, in our opinion, the related financial statement schedule, when considered in relation to the basic financial statements taken as a whole, presents fairly in all material respects the information set forth therein.
As discussed in Note 2 to the consolidated financial statements, the Company adopted the guidance originally issued in Financial Accounting Standards Board’s Statement No. 160 “Noncontrolling Interests in Consolidated Financial Statements, an amendment of ARB No. 51” (codified in FASB ASC Topic 810) effective February 1, 2009.
We also have audited, in accordance with the standards of the Public Company Accounting Oversight Board (United States), the Company’s internal control over financial reporting as of January 31, 2010, based on criteria established in Internal Control-Integrated Framework issued by the Committee of Sponsoring Organizations of the Treadway Commission and our report dated April 9, 2010 expressed an unqualified opinion thereon.
/S/ ERNST & YOUNG LLP
Stamford, Connecticut
April 9, 2010
REPORT OF INDEPENDENT REGISTERED PUBLIC ACCOUNTING FIRM
To the Board of Directors and Stockholders of Blyth, Inc.
Greenwich, Connecticut
We have audited the accompanying consolidated balance sheets of Blyth, Inc. and subsidiaries (the "Company") as of January 31, 2009, and the related consolidated statements of earnings (loss), stockholders' equity, and cash flows for each of the two years in the period ended January 31, 2009. Our audits also included information for fiscal years ended 2008 and 2009 in the financial statement schedule listed in the Index at Item 15. These financial statements and financial statement schedule are the responsibility of the Company's management. Our responsibility is to express an opinion on the financial statements and financial statement schedule based on our audits.
We conducted our audits in accordance with the standards of the Public Company Accounting Oversight Board (United States). Those standards require that we plan and perform the audit to obtain reasonable assurance about whether the financial statements are free of material misstatement. An audit includes examining, on a test basis, evidence supporting the amounts and disclosures in the financial statements. An audit also includes assessing the accounting principles used and significant estimates made by management, as well as evaluating the overall financial statement presentation. We believe that our audits provide a reasonable basis for our opinion.
In our opinion, such consolidated financial statements present fairly, in all material respects, the financial position of Blyth, Inc. and subsidiaries as of January 31, 2009, and the results of their operations and their cash flows for each of the two years in the period ended January 31, 2009, in conformity with accounting principles generally accepted in the United States of America. Also, in our opinion, the 2008 and 2009 information in such financial statement schedule, when considered in relation to the basic consolidated financial statements taken as a whole, presents fairly, in all material respects, the information set forth therein.
As discussed in Note 2 to the consolidated financial statements, the accompanying consolidated financial statements have been retrospectively adjusted for the adoption of new accounting guidance for the presentation and disclosure of noncontrolling interests.
/S/ DELOITTE & TOUCHE LLP
Stamford, Connecticut
April 13, 2009 (April 9, 2010 as to the effects of the immaterial restatement discussed in Note 1, and the effects of the adoption of new accounting guidance for the presentation and disclosure of noncontrolling interests as discussed in Note 2)
|
BLYTH, INC. AND SUBSIDIARIES
|
||||||||
|
Consolidated Balance Sheets
|
||||||||
|
As of January 31, (In thousands, except share and per share data)
|
2009
|
2010
|
||||||
|
ASSETS
|
||||||||
|
Current assets:
|
||||||||
|
Cash and cash equivalents
|
$ | 146,424 | $ | 207,394 | ||||
|
Short-term investments
|
- | 5,000 | ||||||
|
Accounts receivable, less allowance for doubtful receivables of $3,438 in 2009 and $2,243 in 2010
|
29,525 | 18,694 | ||||||
|
Inventories
|
137,087 | 102,203 | ||||||
|
Prepaid and other
|
30,669 | 23,997 | ||||||
|
Deferred income taxes
|
40,574 | 6,769 | ||||||
|
Total current assets
|
384,279 | 364,057 | ||||||
|
Property, plant and equipment, at cost:
|
||||||||
|
Land and buildings
|
108,803 | 103,997 | ||||||
|
Leasehold improvements
|
10,010 | 7,944 | ||||||
|
Machinery and equipment
|
133,032 | 129,299 | ||||||
|
Office furniture, data processing equipment and software
|
66,888 | 68,641 | ||||||
|
Construction in progress
|
1,145 | 914 | ||||||
| 319,878 | 310,795 | |||||||
|
Less accumulated depreciation
|
199,524 | 202,808 | ||||||
| 120,354 | 107,987 | |||||||
|
Other assets:
|
||||||||
|
Investments
|
24,975 | 19,072 | ||||||
|
Goodwill
|
13,988 | 2,298 | ||||||
|
Other intangible assets, net of accumulated amortization of $10,897 in 2009 and $12,254 in 2010
|
16,840 | 12,176 | ||||||
|
Other assets
|
13,667 | 17,403 | ||||||
|
Total other assets
|
69,470 | 50,949 | ||||||
|
Total assets
|
$ | 574,103 | $ | 522,993 | ||||
|
LIABILITIES AND STOCKHOLDERS' EQUITY
|
||||||||
|
Current liabilities:
|
||||||||
|
Current maturities of long-term debt
|
$ | 37,936 | $ | 582 | ||||
|
Accounts payable
|
47,014 | 57,338 | ||||||
|
Accrued expenses
|
64,893 | 60,895 | ||||||
|
Dividend payable
|
- | 8,826 | ||||||
|
Income taxes payable
|
17,291 | 4,913 | ||||||
|
Total current liabilities
|
167,134 | 132,554 | ||||||
|
Deferred income taxes
|
21,778 | 686 | ||||||
|
Long-term debt, less current maturities
|
107,795 | 109,962 | ||||||
|
Other liabilities
|
28,005 | 24,984 | ||||||
|
Commitments and contingencies
|
- | - | ||||||
|
Redeemable noncontrolling interest
|
893 | (1,470 | ) | |||||
|
Stockholders' equity:
|
||||||||
|
Preferred stock - authorized 10,000,000 shares of $0.01 par value; no shares issued
|
- | - | ||||||
|
Common stock - authorized 50,000,000 shares of $0.02 par value; issued 12,733,209 shares in 2009 and 12,765,919 shares in 2010
|
255 | 255 | ||||||
|
Additional contributed capital
|
141,307 | 144,233 | ||||||
|
Retained earnings
|
486,548 | 494,524 | ||||||
|
Accumulated other comprehensive income
|
19,366 | 20,591 | ||||||
|
Treasury stock, at cost, 3,842,224 shares in 2009 and 3,972,112 shares in 2010
|
(398,978 | ) | (403,329 | ) | ||||
|
Total stockholders' equity
|
248,498 | 256,274 | ||||||
|
Noncontrolling interest
|
- | 3 | ||||||
|
Total equity
|
248,498 | 256,277 | ||||||
|
Total liabilities and equity
|
$ | 574,103 | $ | 522,993 | ||||
|
The accompanying notes are an integral part of these consolidated financial statements.
|
||||||||
|
BLYTH, INC. AND SUBSIDIARIES
|
||||||||||||
|
Consolidated Statements of Earnings (Loss)
|
||||||||||||
|
For the year ended January 31, (In thousands, except per share data)
|
2008
|
2009
|
2010
|
|||||||||
|
Net sales
|
$ | 1,164,950 | $ | 1,050,793 | $ | 958,077 | ||||||
|
Cost of goods sold
|
549,479 | 473,577 | 432,578 | |||||||||
|
Gross profit
|
615,471 | 577,216 | 525,499 | |||||||||
|
Selling
|
405,316 | 400,658 | 367,487 | |||||||||
|
Administrative
|
130,090 | 123,779 | 111,531 | |||||||||
|
Goodwill and other intangibles impairment
|
49,178 | 48,751 | 16,498 | |||||||||
|
Total operating expense
|
584,584 | 573,188 | 495,516 | |||||||||
|
Operating profit
|
30,887 | 4,028 | 29,983 | |||||||||
|
Other expense (income):
|
||||||||||||
|
Interest expense
|
15,540 | 10,001 | 7,755 | |||||||||
|
Interest income
|
(7,635 | ) | (4,261 | ) | (1,410 | ) | ||||||
|
Foreign exchange and other, net
|
1,257 | 9,813 | 1,564 | |||||||||
|
Total other expense
|
9,162 | 15,553 | 7,909 | |||||||||
|
Earnings (loss) before income taxes
|
21,725 | (11,525 | ) | 22,074 | ||||||||
|
Income tax expense
|
10,547 | 3,840 | 5,649 | |||||||||
|
Net earnings (loss)
|
11,178 | (15,365 | ) | 16,425 | ||||||||
|
Less: Net earnings (loss) attributable to the noncontrolling interests
|
106 | 115 | (1,269 | ) | ||||||||
|
Net earnings (loss) attributable to Blyth, Inc.
|
11,072 | (15,480 | ) | 17,694 | ||||||||
|
Basic:
|
||||||||||||
|
Net earnings (loss) attributable per Blyth, Inc. common share
|
$ | 1.15 | $ | (1.73 | ) | $ | 1.99 | |||||
|
Weighted average number of shares outstanding
|
9,648 | 8,971 | 8,912 | |||||||||
|
Diluted:
|
||||||||||||
|
Net earnings (loss) attributable per Blyth, Inc. common share
|
$ | 1.14 | $ | (1.73 | ) | $ | 1.98 | |||||
|
Weighted average number of shares outstanding
|
9,732 | 8,971 | 8,934 | |||||||||
|
Cash dividend declared per share
|
$ | 2.16 | $ | 2.16 | $ | 1.20 | ||||||
|
The accompanying notes are an integral part of these consolidated financial statements.
|
||||||||||||
|
BLYTH, INC. AND SUBSIDIARIES
|
||||||||||||||||||||||||||||||||||||
|
Consolidated Statements of Stockholders' Equity
|
||||||||||||||||||||||||||||||||||||
|
Blyth, Inc.'s Stockholders
|
||||||||||||||||||||||||||||||||||||
|
Accumulated
|
Redeemable
|
|||||||||||||||||||||||||||||||||||
|
Additional
|
Other
|
Noncontrolling
|
||||||||||||||||||||||||||||||||||
|
Common
|
Contributed
|
Retained
|
Comprehensive
|
Treasury
|
Noncontrolling
|
Total
|
Interest
|
Comprehensive
|
||||||||||||||||||||||||||||
|
(In thousands)
|
Stock
|
Capital
|
Earnings
|
Income (Loss)
|
Stock
|
Interest
|
Equity
|
(Temporary Equity)
|
Income (Loss)
|
|||||||||||||||||||||||||||
|
Balance at January 31, 2007
|
$ | 253 | $ | 130,127 | $ | 534,897 | $ | 22,130 | $ | (323,714 | ) | $ | - | $ | 363,693 | |||||||||||||||||||||
|
ASC 740 adjustment
|
$ | (2,769 | ) | $ | (2,769 | ) | ||||||||||||||||||||||||||||||
|
Adjusted Balance, February 1, 2007:
|
$ | 253 | $ | 130,127 | $ | 532,128 | $ | 22,130 | $ | (323,714 | ) | $ | - | $ | 360,924 | $ | - | $ | - | |||||||||||||||||
|
Net earnings for the year
|
11,072 | 106 | 11,178 | 11,178 | ||||||||||||||||||||||||||||||||
|
Distribution to noncontrolling interest
|
(106 | ) | (106 | ) | ||||||||||||||||||||||||||||||||
|
Foreign currency translation adjustments
|
3,693 | 3,693 | 3,693 | |||||||||||||||||||||||||||||||||
|
Pension adjustment (net of tax $167)
|
253 | 253 | 253 | |||||||||||||||||||||||||||||||||
|
Unrealized gain on certain investments (net of tax of $10)
|
16 | 16 | 16 | |||||||||||||||||||||||||||||||||
|
Net loss on cash flow hedging instruments (net of a tax benefit of $392)
|
(648 | ) | (648 | ) | (648 | ) | ||||||||||||||||||||||||||||||
|
Comprehensive income
|
14,492 | |||||||||||||||||||||||||||||||||||
|
Comprehensive income attributable to the noncontrolling interests
|
(106 | ) | ||||||||||||||||||||||||||||||||||
|
Comprehensive income attributable to Blyth, Inc.
|
$ | 14,386 | ||||||||||||||||||||||||||||||||||
|
Common stock issued in connection with long-term incentive plan
|
1 | 7,077 | 7,078 | |||||||||||||||||||||||||||||||||
|
Tax benefit from stock options
|
303 | 303 | ||||||||||||||||||||||||||||||||||
|
Amortization of unearned compensation
|
1,420 | 1,420 | ||||||||||||||||||||||||||||||||||
|
Dividends paid ($2.16 per share)
|
(20,872 | ) | (20,872 | ) | ||||||||||||||||||||||||||||||||
|
Treasury stock purchases
|
(64,171 | ) | (64,171 | ) | ||||||||||||||||||||||||||||||||
|
Balance at January 31, 2008
|
$ | 254 | $ | 138,927 | $ | 522,328 | $ | 25,444 | $ | (387,885 | ) | $ | - | $ | 299,068 | $ | - | $ | - | |||||||||||||||||
|
Net loss for the year
|
(15,480 | ) | 115 | (15,365 | ) | (15,365 | ) | |||||||||||||||||||||||||||||
|
Distribution to noncontrolling interest
|
(115 | ) | (115 | ) | ||||||||||||||||||||||||||||||||
|
Foreign currency translation adjustments
|
(4,318 | ) | (4,318 | ) | (4,318 | ) | ||||||||||||||||||||||||||||||
|
Net unrealized loss on certain investments (net of tax benefit of $546)
|
(2,375 | ) | (2,375 | ) | (2,375 | ) | ||||||||||||||||||||||||||||||
|
Net gain on cash flow hedging instruments (net of a tax liability of $377)
|
615 | 615 | 615 | |||||||||||||||||||||||||||||||||
|
Comprehensive loss
|
(21,443 | ) | ||||||||||||||||||||||||||||||||||
|
Comprehensive income attributable to the noncontrolling interests
|
(115 | ) | ||||||||||||||||||||||||||||||||||
|
Comprehensive loss attributable to Blyth, Inc.
|
$ | (21,558 | ) | |||||||||||||||||||||||||||||||||
|
Common stock issued in connection with long-term incentive plan
|
1 | 1 | ||||||||||||||||||||||||||||||||||
|
Amortization of unearned compensation
|
2,380 | 2,380 | ||||||||||||||||||||||||||||||||||
|
Dividends paid ($2.16 per share)
|
(19,406 | ) | (19,406 | ) | ||||||||||||||||||||||||||||||||
|
Treasury stock purchases
|
(11,093 | ) | (11,093 | ) | ||||||||||||||||||||||||||||||||
|
Accretion of redeemable noncontrolling interest
|
(893 | ) | (893 | ) | 893 | |||||||||||||||||||||||||||||||
|
Balance at January 31, 2009
|
$ | 255 | $ | 141,307 | $ | 486,549 | $ | 19,366 | $ | (398,978 | ) | $ | - | $ | 248,499 | $ | 893 | $ | - | |||||||||||||||||
|
Net earnings (loss) for the year
|
17,694 | 201 | 17,895 | (1,470 | ) | 16,425 | ||||||||||||||||||||||||||||||
|
Distribution to noncontrolling interest
|
(198 | ) | (198 | ) | ||||||||||||||||||||||||||||||||
|
Foreign currency translation adjustments (net of tax liability of $261)
|
1,558 | 1,558 | 1,558 | |||||||||||||||||||||||||||||||||
|
Net unrealized gain on certain investments (net of tax liability of $315)
|
438 | 438 | 438 | |||||||||||||||||||||||||||||||||
|
Realized loss on sale of available for sale investment (net of tax benefit of $197)
|
322 | 322 | 322 | |||||||||||||||||||||||||||||||||
|
Realized gain on pension plan termination (net of tax liability of $749)
|
(1,153 | ) | (1,153 | ) | (1,153 | ) | ||||||||||||||||||||||||||||||
|
Net unrealized gain on cash flow hedging instruments (net of tax liability of $30)
|
60 | 60 | 60 | |||||||||||||||||||||||||||||||||
|
Comprehensive income
|
17,650 | |||||||||||||||||||||||||||||||||||
|
Comprehensive loss attributable to the noncontrolling interests
|
1,269 | |||||||||||||||||||||||||||||||||||
|
Comprehensive income attributable to Blyth, Inc.
|
$ | 18,919 | ||||||||||||||||||||||||||||||||||
|
Stock-based compensation
|
2,926 | 2,926 | ||||||||||||||||||||||||||||||||||
|
Dividends declared ($1.20 per share)
|
(10,612 | ) | (10,612 | ) | ||||||||||||||||||||||||||||||||
|
Reversal of accretion of redeemable noncontrolling interest
|
893 | 893 | (893 | ) | ||||||||||||||||||||||||||||||||
|
Treasury stock purchases
|
(4,351 | ) | (4,351 | ) | ||||||||||||||||||||||||||||||||
|
Balance at January 31, 2010
|
$ | 255 | $ | 144,233 | $ | 494,524 | $ | 20,591 | $ | (403,329 | ) | $ | 3 | $ | 256,277 | $ | (1,470 | ) | ||||||||||||||||||
|
The accompanying notes are an integral part of these consolidated financial statements.
|
||||||||||||||||||||||||||||||||||||
|
BLYTH, INC. AND SUBSIDIARIES
|
||||||||||||
|
Year ended January 31, (In thousands)
|
2008
|
2009
|
2010
|
|||||||||
|
Cash flows from operating activities:
|
||||||||||||
|
Net earnings (loss)
|
$ | 11,178 | $ | (15,365 | ) | $ | 16,425 | |||||
|
Adjustments to reconcile net earnings (loss) to net cash provided by operating activities:
|
||||||||||||
|
Depreciation and amortization
|
31,974 | 18,628 | 16,592 | |||||||||
|
Goodwill and other intangibles impairment charges
|
49,178 | 48,751 | 16,498 | |||||||||
|
Impairment of assets
|
1,224 | 8,034 | 376 | |||||||||
|
Loss on sale of assets
|
112 | 13 | 30 | |||||||||
|
Stock-based compensation expense
|
2,184 | 1,836 | 2,695 | |||||||||
|
Loss on sale of business
|
611 | - | - | |||||||||
|
Unrealized loss (gain) on trading investments
|
(29 | ) | 2,096 | - | ||||||||
|
Deferred income taxes
|
(7,192 | ) | (13,376 | ) | 6,630 | |||||||
|
Equity in (earnings) losses of investee
|
1,295 | (116 | ) | 120 | ||||||||
|
Gain on pension termination
|
- | - | (1,902 | ) | ||||||||
|
Changes in operating assets and liabilities, net of effect of business acquisitions and divestitures:
|
||||||||||||
|
Accounts receivable
|
(6,877 | ) | 5,062 | 10,977 | ||||||||
|
Inventories
|
173 | (5,972 | ) | 36,160 | ||||||||
|
Prepaid and other
|
1,772 | 7,566 | 252 | |||||||||
|
Other long-term assets
|
4,917 | 2,510 | 1,268 | |||||||||
|
Accounts payable
|
(2,452 | ) | (7,800 | ) | 9,666 | |||||||
|
Accrued expenses
|
(891 | ) | (15,068 | ) | (5,753 | ) | ||||||
|
Other liabilities
|
(842 | ) | (5,679 | ) | (4,090 | ) | ||||||
|
Income taxes
|
5,506 | 6,722 | (12,574 | ) | ||||||||
|
Net cash provided by operating activities
|
91,841 | 37,842 | 93,370 | |||||||||
|
Cash flows from investing activities:
|
||||||||||||
|
Purchases of property, plant and equipment, net of disposal proceeds
|
(9,421 | ) | (8,173 | ) | (5,384 | ) | ||||||
|
Purchases of short-term investments
|
(1,787,248 | ) | (69,716 | ) | (5,000 | ) | ||||||
|
Proceeds from sales of short-term investments
|
1,865,403 | 84,777 | - | |||||||||
|
Note receivable issued under revolving credit facility
|
- | (4,416 | ) | - | ||||||||
|
Proceeds from the repayment of note receivable
|
- | 4,416 | - | |||||||||
|
Proceeds from sales of assets, net of costs
|
25,646 | 36 | 3,939 | |||||||||
|
Purchases of long-term investments
|
- | (3,070 | ) | (521 | ) | |||||||
|
Proceeds from sale of long-term investments
|
- | 7,204 | 6,494 | |||||||||
|
Proceeds from sales of businesses, net of cash disposed
|
514 | - | - | |||||||||
|
Purchase of businesses, net of cash acquired
|
- | (15,814 | ) | - | ||||||||
|
Cash settlement of net investment hedges
|
- | - | 6,563 | |||||||||
|
Net cash provided by (used in) investing activities
|
94,894 | (4,756 | ) | 6,091 | ||||||||
|
Cash flows from financing activities:
|
||||||||||||
|
Proceeds from issuance of common stock
|
7,079 | - | - | |||||||||
|
Tax benefit from stock options
|
303 | - | - | |||||||||
|
Purchases of treasury stock
|
(64,171 | ) | (11,093 | ) | (3,981 | ) | ||||||
|
Borrowings from bank line of credit
|
- | 560,800 | - | |||||||||
|
Repayments on bank line of credit
|
- | (560,800 | ) | - | ||||||||
|
Borrowings on long-term debt
|
- | - | 2,660 | |||||||||
|
Repayments on long-term debt
|
(56,676 | ) | (12,682 | ) | (37,774 | ) | ||||||
|
Payments on capital lease obligations
|
(445 | ) | (507 | ) | (187 | ) | ||||||
|
Dividends paid
|
(20,872 | ) | (19,406 | ) | (1,785 | ) | ||||||
|
Distributions to noncontrolling interest
|
- | - | (198 | ) | ||||||||
|
Net cash used in financing activities
|
(134,782 | ) | (43,688 | ) | (41,265 | ) | ||||||
|
Effect of exchange rate changes on cash
|
7,260 | (5,995 | ) | 2,774 | ||||||||
|
Net increase (decrease) in cash and cash equivalents
|
59,213 | (16,597 | ) | 60,970 | ||||||||
|
Cash and cash equivalents at beginning of year
|
103,808 | 163,021 | 146,424 | |||||||||
|
Cash and cash equivalents at end of year
|
$ | 163,021 | $ | 146,424 | $ | 207,394 | ||||||
|
Supplemental disclosure of cash flow information:
|
||||||||||||
|
Cash paid during the year for:
|
||||||||||||
|
Interest
|
$ | 17,618 | $ | 9,547 | $ | 8,471 | ||||||
|
Income taxes, net of refunds
|
7,458 | 7,643 | 12,021 | |||||||||
|
Non-cash transactions:
|
||||||||||||
|
Capital leases for equipment
|
30 | 30 | 71 | |||||||||
|
The accompanying notes are an integral part of these consolidated financial statements.
|
||||||||||||
BLYTH, INC. AND SUBSIDIARIES
Notes to Consolidated Financial Statements
|
Note 1.
|
Summary of Significant Accounting Policies
|
Blyth, Inc. (the “Company”) is a multi-channel company competing primarily in the home fragrance and decorative accessories industry. The Company designs, markets and distributes an extensive array of decorative and functional household products including candles, accessories, seasonal decorations, household convenience items and personalized gifts, as well as products for the foodservice trade, nutritional supplements and weight management products. The Company competes in the global home expressions industry and the Company’s products can be found throughout North America, Europe and Australia.
A summary of the significant accounting policies applied in the preparation of the accompanying consolidated financial statements follows:
Principles of Consolidation
The consolidated financial statements include the accounts of Blyth, Inc. and its subsidiaries. The Company consolidates entities in which it owns or controls more than 50% of the voting shares and/or investments where the Company has been determined to have control. The portion of the entity not owned by the Company is reflected as the noncontrolling interest within the Equity section of the Consolidated Balance Sheets and in the case of the redeemable noncontrolling interest their interest is within a mezzanine section of the Consolidated Balance Sheets between Long-term liabilities and Equity. Investments in companies that are not consolidated but where we have significant influence are reported using the equity method and are recorded in Other assets in the Consolidated Balance Sheets. All inter-company balances and transactions have been eliminated in consolidation.
Certain of the Company’s subsidiaries operate on a 52 or 53-week fiscal year ending on the Saturday nearest to January 31. European, Mexican and Australian operations and one domestic direct selling entity maintain a calendar year accounting period, which is consolidated with the Company’s fiscal period. The application of this consolidation policy has been consistently applied and has not had a significant impact on the Company’s financials.
Estimates
The preparation of financial statements in conformity with generally accepted accounting principles requires management to make estimates and assumptions that affect the reported amounts of assets and liabilities and disclosure of contingent assets and liabilities as of the date of the financial statements and the reported amounts of revenues and expenses during the reporting period. Actual results could differ from those estimates.
Credit Concentration
The Company’s credit sales are principally to department and gift stores, mass merchandisers and distributors, which purchase the Company’s products for resale. The Company performs ongoing credit evaluations of its customers and generally does not require collateral. The Company makes provisions for estimated credit losses. No single customer accounts for 10% or more of Net sales.
BLYTH, INC. AND SUBSIDIARIES
Notes to Consolidated Financial Statements
|
Note 1.
|
Summary of Significant Accounting Policies (continued)
|
Foreign Currency Translation
The Company’s international subsidiaries generally use their local currency as their functional currency. Therefore, all Balance Sheet accounts of international subsidiaries are translated into U.S. dollars at the year-end rates of exchange and Statement of Earnings (Loss) items are translated using the weighted average exchange rates for the period. Resulting translation adjustments are included in Accumulated other comprehensive income (loss) (“AOCI”) within the Consolidated Balance Sheets. Transactional gains and losses arising from the impact of currency exchange rate fluctuations on transactions in a currency other than the local functional currency are included in Foreign exchange and other, net within the Consolidated Statements of Earnings (Loss).
Investments
The Company makes investments from time to time in the ordinary course of its business that may include common and preferred equity securities, debt instruments, and long-term investments and/or joint ventures. The Company’s investments are accounted for in accordance with the Financial Accounting Standards Board (“FASB”) Accounting Standards Codification (“ASC”) Topics 320 to 325, “Investments”. The Company reviews investments for impairment using both quantitative and qualitative factors. Unrealized gains and losses on available-for-sale investment securities that are considered temporary and are not the result of a credit loss are included in AOCI, net of applicable taxes, while realized gains and losses are reported in earnings. For investments held as trading, all realized and unrealized gains and losses are reported in earnings. The equity method of accounting is used to account for investments in common stock in which the Company owns less than the majority of voting stock and has the ability to exercise significant influence over the operating and financial policies of the investee but lacks control.
Derivatives and Other Financial Instruments
The Company uses foreign exchange forward contracts to hedge the impact of foreign currency fluctuations on foreign denominated inventory purchases, intercompany payables and certain loans. It does not hold or issue derivative financial instruments for trading purposes. The Company has also hedged the net assets of certain of its foreign operations through foreign currency forward contracts.
The Company has designated forward exchange contracts on forecasted intercompany purchases and future purchase commitments as cash flow hedges and as long as the hedge remains effective and the underlying transaction remains probable, the effective portion of the changes in the fair value of these contracts will be recorded in AOCI until earnings are affected by the variability of the cash flows being hedged. With regard to commitments for inventory purchases, upon payment of each commitment, the underlying forward contract is closed and the corresponding gain or loss is transferred from AOCI and is realized in the Consolidated Statements of Earnings (Loss). If a hedging instrument is sold or terminated prior to maturity, gains and losses are deferred in AOCI until the hedged item is settled. However, if the hedged item is probable of no longer occurring, the resultant gain or loss on the terminated hedge is recognized into earnings immediately.
BLYTH, INC. AND SUBSIDIARIES
Notes to Consolidated Financial Statements
Note 1. Summary of Significant Accounting Policies (continued)
The Company has designated its foreign currency forward contracts related to certain foreign denominated loans and intercompany payables as fair value hedges. The gains or losses on the fair value hedges are recognized into earnings and generally offset the transaction gains or losses in the foreign denominated loans that they are intended to hedge.
For consolidated financial statement presentation, net cash flows from such hedges are classified in the categories of the Consolidated Statement of Cash Flows with the items being hedged. Forward contracts held with each bank are presented within the Consolidated Balance Sheets as a net asset or liability, based on netting agreements with each bank and whether the forward contracts are in a net gain or loss position. Refer to Note 9 for further details on our accounting for derivative instruments.
Cash and Cash Equivalents
The Company considers all highly liquid debt instruments purchased with an original maturity of three months or less to be cash equivalents. Insignificant amounts due from credit card companies for the settlement of credit card transactions are included in cash equivalents because they are both short-term and highly liquid instruments and typically take one to three business days to be received by the Company. The major credit card companies making these payments are highly accredited businesses and the Company does not deem them as having material counterparty credit risk.
The Company holds its cash investments with high credit quality financial institutions. Cash balances in the Company’s U.S. concentration accounts are insured by the Federal Deposit Insurance Corporation up to $250,000 per bank. The Company has $2.4 million of restricted cash in a certificate of deposit that is used as collateral to standby letters of credit, which is reported in Investments. This cash will be restricted until the standby letters of credit are relieved by the beneficiaries.
Inventories
Inventories are valued at the lower of cost or market. Cost is determined by the first-in, first-out method. The Company records provisions for obsolete, excess and unmarketable inventory in Cost of goods sold.
Shipping and Handling
The Company classifies shipping and handling fees billed to customers as Revenue, and shipping and handling costs are classified as Cost of goods sold.
Property, Plant and Equipment
Property, plant and equipment are stated at cost, less accumulated depreciation. Depreciation expense for fiscal 2008, 2009 and 2010 was $30.5 million, $17.0 million and $15.2 million, respectively. The amortization of assets obtained through capital leases is also recorded as a component of depreciation expense. Depreciation is provided for principally by use of the straight-line method for financial reporting purposes. Leasehold improvements are amortized
BLYTH, INC. AND SUBSIDIARIES
Notes to Consolidated Financial Statements
Note 1. Summary of Significant Accounting Policies (continued)
over the lives of the respective leases or the service lives of the improvements, whichever is shorter. The Company records gains and losses from the sale of property, plant and equipment in operating profit.
During fiscal 2009, $6.7 million relating to a distribution center within the Wholesale segment was reclassified to a long-term asset available for sale within Other assets in the Consolidated Balance Sheets. This asset is still being held for sale as of January 31, 2010 and as such is not being depreciated but rather accounted for at fair value. We evaluate the asset for impairment and in fiscal 2010 this asset was impaired by an additional $0.4 million and has been more aggressively marketed.
The principal estimated lives used in determining depreciation are as follows:
|
27 to 40 years
|
|
|
Leasehold improvements
|
5 to 10 years
|
|
Machinery and equipment
|
5 to 12 years
|
|
Office furniture, data processing equipment and software
|
3 to 7 years
|
Goodwill and Other Indefinite Lived Intangibles
Goodwill is subject to an assessment for impairment using a two-step fair value-based test and as such other intangibles are also subject to impairment reviews, which must be performed at least annually or more frequently if events or circumstances indicate that goodwill or other indefinite lived intangibles might be impaired.
The Company performs its annual assessment of impairment as of January 31. For goodwill, the first step is to identify whether a potential impairment exists. This is done by comparing the fair value of a reporting unit to its carrying amount, including goodwill. Fair value for each of the Company’s reporting units is estimated utilizing a combination of valuation techniques, namely the discounted cash flow methodology and the market multiple methodology. The discounted cash flow methodology assumes the fair value of an asset can be estimated by the economic benefit or net cash flows the asset will generate over the life of the asset, discounted to its present value. The discounting process uses a rate of return that accounts for both the time value of money and the investment risk factors. The market multiple methodology estimates fair value based on what other participants in the market have recently paid for reasonably similar assets. Adjustments are made to compensate for differences between the reasonably similar assets and the assets being valued. If the
fair value of the reporting unit exceeds the carrying value, no further analysis is necessary. The fair value of the reporting units is derived by using a combination of the two valuation techniques described above. If the carrying amount of the reporting unit exceeds its fair value, the second step is performed. The second step compares the carrying amount of the goodwill to the estimated fair value of the goodwill. If fair value is less than the carrying amount, an impairment loss is reported as a reduction to the goodwill and a charge to operating expense.
BLYTH, INC. AND SUBSIDIARIES
Notes to Consolidated Financial Statements
Note 1. Summary of Significant Accounting Policies (continued)
Impairment of Long-Lived Assets
The Company reviews long-lived assets, including property, plant and equipment, and finite- lived intangible assets for impairment whenever events or changes in circumstances indicate that the carrying amount of such an asset may not be recoverable. An impairment is measured as the excess of the carrying value over the fair value of the long-lived asset. Management will determine whether there has been an impairment on such assets held for use in the business by comparing anticipated undiscounted future cash flows from the use and eventual disposition of the asset or asset group to the carrying value of the asset.
Accumulated Other Comprehensive Income (Loss)
Accumulated other comprehensive income (loss) includes net earnings (loss), as reported in the Consolidated Statements of Earnings (Loss) and Other Comprehensive Income (Loss). AOCI is comprised of foreign currency cumulative translation adjustments, unrealized gains and losses on certain investments in debt and equity securities, the net gains and losses on cash flow hedging instruments and net investment hedges and pension adjustments. The Company reports, by major components and as a single total, the change in comprehensive income (loss) during the period as part of the Consolidated Statements of Stockholders’ Equity.
The following table presents the components of the Company’s AOCI, net of deferred tax liabilities of $9.0 million for the fiscal years ended January 31, 2010:
|
(In thousands)
|
Foreign currency translation adjustments
|
Unrealized gain (loss) on certain investments
|
Net gain (loss) on cash flow hedges
|
Net gain on net investment hedges
|
Pension adjustment
|
Accumulated other comprehensive income (loss)
|
||||||||||||||||||
|
Balance at January 31, 2009
|
$ | 14,244 | $ | (1,497 | ) | $ | 12 | $ | 5,435 | $ | 1,172 | $ | 19,366 | |||||||||||
|
Balance at January 31, 2010
|
$ | 16,059 | $ | (737 | ) | $ | 72 | $ | 5,197 | $ | - | $ | 20,591 | |||||||||||
Income Taxes
Income tax expense is based on taxable income, statutory tax rates and the impact of non-deductible items. Deferred tax assets and liabilities are recognized for the expected tax consequences of temporary differences between the tax basis of assets and liabilities and their reported amounts. The Company periodically estimates whether its tax benefits are more likely than not sustainable on audit, based on the technical merits of the position. There are inherent uncertainties related to the interpretation of tax regulations in the jurisdictions in which the Company transacts business. The judgments and estimates made at a point in time may change based on the outcome of tax audits, as well as changes to or further interpretations of regulations. If such changes take place, there is a risk that the Company’s tax rate may increase or decrease in any period.
Deferred tax assets and liabilities reflect the Company’s best estimate of the tax benefits and costs expected to realize in the future. The Company establishes valuation allowances to reduce its deferred tax assets to an amount that will more likely than not be realized.
BLYTH, INC. AND SUBSIDIARIES
Notes to Consolidated Financial Statements
Note 1. Summary of Significant Accounting Policies (continued)
In accordance with ASC 740, “Income Taxes” (“ASC 740”), the Company recognizes the tax benefit from an uncertain tax position only if it is more likely than not that the tax position will be capable of withstanding examination by the taxing authorities based on the technical merits of the position. A number of years may elapse before an uncertain tax position for which we have established a tax reserve is audited and finally resolved, and the number of years for which we have audits that are open varies depending on the tax jurisdiction (a current summary is provided in Note 16 to the Consolidated Financial Statements). When facts and circumstances change, we reassess these probabilities and record any necessary adjustments to the provision.
During fiscal 2009 and 2010, the Company determined that a portion of its undistributed foreign earnings are not reinvested indefinitely by its non-U.S. subsidiaries, and accordingly, recorded a deferred income tax expense related to these undistributed earnings. The Company periodically reassesses whether the non-U.S. subsidiaries will invest their undistributed earnings indefinitely.
Revenue Recognition
Revenues consist of sales to customers, net of returns and allowances. The Company recognizes revenue upon delivery, when both title and risk of loss are transferred to the customer. The Company presents revenues net of any taxes collected from customers and remitted to governmental authorities.
The Company records estimated reductions to revenue for customer programs, which may include special pricing agreements for specific customers, volume incentives and other promotions. The Company also records reductions to revenue, based primarily on historical experience, for estimated customer returns and chargebacks that may arise as a result of shipping errors, product damage in transit or for other reasons that can only become known subsequent to recognizing the revenue. In some instances, the Company receives payment in advance of product delivery. Such advance payments occur primarily in the direct selling and direct marketing channels and are recorded as deferred revenue. Upon delivery of product for which advance payment has been made, the related deferred revenue is reversed and recorded to revenue. Also included in deferred revenue are gift card sales. Upon expiration or redemption, the related deferred revenue is reclassified to revenue. The Company considers escheat laws and historical redemption data when realizing gift card revenue.
The Company has established an allowance for doubtful accounts for its trade and note receivables. The allowance is determined based on the Company’s evaluation of specific customers’ ability to pay, aging of receivables, historical experience and the current economic environment.
Some of the Company’s business units offer seasonal dating programs pursuant to which qualifying customers are offered extended payment terms for seasonal product shipments, which is a common practice in some of its industries. The sales price for the Company’s products sold pursuant to such seasonal dating programs is fixed prior to the time of shipment to the customer. Customers do not have the right to return product, except for rights to return that the Company believes are typical of the industry for such reasons as damaged goods, shipping errors or similar occurrences. The Company is not required to repurchase products from its customers and does not have regular practice of doing so. The Company does not make any sales under consignment or similar arrangements.
BLYTH, INC. AND SUBSIDIARIES
Notes to Consolidated Financial Statements
Note 1. Summary of Significant Accounting Policies (continued)
Earnings per Common and Common Equivalent Share
Earnings per common and common equivalent share-basic are computed based upon the weighted average number of shares outstanding during the period. These outstanding shares include both outstanding common shares and vested restricted stock units (“RSUs”) as common stock equivalents. Earnings per common and common equivalent share-diluted reflects the potential dilution that could occur if options and fixed awards to be issued under stock-based compensation arrangements were converted into common stock.
Employee Stock Option Plans
The Company has share-based compensation plans as described in Note 17 to the Consolidated Financial Statements. In accordance with U.S. Generally Accepted Accounting Principals (“GAAP”) the Company measures and records compensation expense, based on estimated fair values, for all share-based awards made to employees and directors, including stock options, restricted stock and restricted stock units. The Company recognizes compensation expense for share-based awards expected to vest on a straight-line basis over the requisite service period of the award based on their grant date fair value.
Operating Expenses
Cost of goods sold includes the cost of raw materials and their procurement costs, inbound and outbound freight, and the direct and indirect costs associated with the personnel, resources and property plant and equipment related to the manufacturing, warehousing, inventory management and order fulfillment functions. Selling expenses include customer service costs, the costs associated with trade shows and showrooms, catalog costs including printing and shipping, commissions paid to consultants, the salaries and benefits related to personnel within the marketing and selling functions, costs associated with promotional offers to independent consultants, and other selling and marketing expenses. Administrative and other expenses includes salaries and related benefits associated with various administrative departments, including human resources, legal, information technology, finance and executive, as well as professional fees and administrative facility costs associated with leased buildings, rents, office equipment and supplies.
Promotional Offers to Independent Consultants, Hostesses and Guests
PartyLite’s sales are generated by its independent consultants, who strive to maximize three interrelated objectives, namely selling product, scheduling (or booking) parties and recruiting new consultants. In order to encourage its consultants to accomplish these goals, PartyLite makes monthly promotional offers including free or discounted product to hostesses and guests holding and attending shows and annual incentive trips and the payment of bonuses to consultants.
Promotions including free or discounted product are designed to increase revenues by providing incentives for guests attending the parties and hostesses holding the shows. These include (1) discounted product offers to hostesses who hold shows or meet certain sales objectives at the shows, (2) offering free or discounted products to guests whose purchases exceed a certain level,
BLYTH, INC. AND SUBSIDIARIES
Notes to Consolidated Financial Statements
Note 1. Summary of Significant Accounting Policies (continued)
and (3) offering special “party only” products that can only be purchased by guests attending a show. Promotional offers for free product are recorded as a charge to Cost of goods sold when incurred, and promotional offers for discounted product are recorded as a reduction of revenue when incurred with the full cost of the product being charged to Cost of goods sold.
Annual incentive trips (paid for by PartyLite for consultants) and bonuses (usually in the form of cash or an allowance against the cost of an incentive trip) are awarded to consultants who recruit new consultants during promotional periods or achieve certain sales levels. Estimated costs related to these promotional offers are recorded as compensation within Selling expense as they are earned. During fiscal 2008, 2009 and 2010, related promotional expenses were recorded of $7.1 million, $9.8 million and $8.2 million, respectively.
Advertising and Catalog Costs
The Company expenses the costs of advertising as incurred, except the costs for direct-response advertising, which are capitalized and amortized over the expected period of future benefit.
Direct-response advertising relates to the Miles Kimball business and consists primarily of the costs to produce direct-mail order catalogs. The capitalized production costs are amortized for each specific catalog mailing over the period following catalog distribution in proportion to revenues (orders) received, compared to total estimated revenues for that particular catalog mailing. The amortization period is generally from three to six months and does not exceed twelve months.
In certain of the Company’s Wholesale and Direct Selling businesses, catalog production costs are capitalized and expensed as the catalogs are distributed, generally over less than a twelve month period.
Other
On January 30, 2009, the Company executed a 1-for-4 reverse stock split. Concurrent with this split the Company reduced its authorized common shares from 100,000,000 to 50,000,000 but did not adjust the par value of each common share, which was and remains at $0.02 per share. The fiscal 2009 Common stock and Additional contributed capital balances should have reflected this adjustment. The Company has corrected the classification between these two equity accounts. The following table displays the impact to the individual line items of the Consolidated Balance Sheets and Consolidated Statements of Stockholders' Equity as of January 31, 2009:
|
As Previously Reported
|
As Restated
|
Adjustment
|
||||||||||
|
Common stock
|
$ | 1,019 | $ | 255 | $ | (764 | ) | |||||
|
Additional contributed capital
|
140,543 | 141,307 | 764 | |||||||||
This immaterial restatement had no impact on the Company’s consolidated financial position, results of operations or cash flows.
BLYTH, INC. AND SUBSIDIARIES
Notes to Consolidated Financial Statements
Note 2. New Accounting Pronouncements
The following is a list of accounting pronouncements either adopted by the Company for fiscal 2010 or pronouncements that could have a significant impact on future financial statements or disclosures upon adoption:
In June 2009, the FASB issued Statement of Financial Accounting Standards (“SFAS”) No. 168, now referred to as ASC 105, “Generally Accepted Accounting Principals” (“ASC 105”). ASC 105 established the Codification as the single source of authoritative U.S. GAAP superseding all prior guidance and eliminating the GAAP hierarchy and establishing one level of authoritative GAAP. All other literature is considered non-authoritative. ASC 105 is effective for reporting periods beginning after September 15, 2009 and as such has been adopted for the third quarter of fiscal 2010. The adoption of this standard has significantly changed the Company’s U.S. GAAP references, however it did not have an impact on the Company’s financial statements.
Effective February 1, 2009, the Company has adopted the requirements of ASC 810, “Consolidation” (“ASC 810”), which establishes accounting and reporting standards for noncontrolling interests, including changes in a parent’s ownership interest in a subsidiary, and requires, among other things, that noncontrolling interests in subsidiaries be classified within equity. As a result of the adoption, the Company has reported noncontrolling interests, other than Redeemable noncontrolling interests, as a component of equity in the Consolidated Balance Sheets and the Net earnings (loss) attributable to the noncontrolling interests has been separately disclosed in the Consolidated Statements of Earnings (Loss). The prior periods presented have also been retrospectively restated to conform to the current classification required by ASC 810.
The Company has adopted the disclosure requirements of ASC 815, “Derivatives and Hedging”, effective February 1, 2009. ASC 815 amends and expands the disclosure related to accounting for derivative instruments and hedging activities.
Effective February 1, 2009, the Company adopted the accounting requirements of ASC 805, “Business Combinations”, which significantly changed the accounting for business combinations and also began applying the provisions of ASC 820, “Fair Value Measurements and Disclosures”, to non-financial assets and liabilities, as permitted by FASB Staff Position (“FSP”) FAS 157-2, “Effective Date of FASB Statement No. 157”. Neither of these adopted pronouncements had an impact on the Company’s financial condition or results of operations for fiscal 2010.
ASC 320-10-65, “Investments-Debt and Equity Securities - Transition and Open Effective Date Information” (“ASC 320-10-65”), requires entities to separate an other-than-temporary impairment of a debt security into two components when there are credit related losses associated with the impaired debt security for which management asserts that it does not have the intent to sell the security, and it is more likely than not that it will not be required to sell the security before recovery of its cost basis. The amount of the other-than-temporary impairment related to a credit loss is recognized in earnings, and the amount of the other-than-temporary impairment related to other factors is recorded in AOCI. The recognition and presentation requirements of ASC 320-10-65 are effective for periods ending after June 15, 2009, with early adoption permitted for periods ending after March 15, 2009. The Company elected to adopt the requirements of ASC 320-10-65, effective April 30, 2009. The application of this guidance did not have any effect on the Company’s consolidated financial condition or results of operations.
BLYTH, INC. AND SUBSIDIARIES
Notes to Consolidated Financial Statements
Note 2. New Accounting Pronouncements (continued)
ASC 825-10-65, “Financial Instruments- Transition and Open Effective Date Information” (“ASC 825-10-65”) requires disclosures about fair value of financial instruments in interim and annual financial statements. The disclosure requirements of ASC 825-10-65 are effective for periods ending after June 15, 2009, with early adoption permitted for periods ending after March 15, 2009. The Company has adopted the requirements of ASC 825-10-65, and has included required disclosures in the Company’s Notes to the Consolidated Financial Statements.
ASC 855, “Subsequent Events”, establishes principles and requirements for reviewing and reporting subsequent events. This requires disclosure of the date through which subsequent events are evaluated and whether the date corresponds with the time at which the financial statements are available for issuance or were issued. This accounting guidance was adopted for our second quarter of fiscal 2010. However, in February 2010, the FASB issued ASU 2010-09, "Subsequent Events (Topic 855) - Amendments to Certain Recognition and Disclosure Requirements" (“ASU 2010-09”). ASU 2010-09 requires a Securities and Exchange Commission (“SEC”) filer to evaluate subsequent events through the date that the financial statements are issued. SEC filers are no longer required to disclose the date through which subsequent events have been evaluated. This amendment is effective as of the date of issuance of ASU 2010-09, and as such the Company has changed its disclosure accordingly.
ASC 820-10-65, “Fair Value Measurements and Disclosures”(ASC 820-10-65”) clarifies the approach to and provides additional factors to consider in, measuring fair value when there has been a significant decrease in market activity for an asset or liability and quoted prices associated with transactions are not orderly. The requirements of ASC 820-10-65 are effective for periods ending after June 15, 2009, with early adoption permitted for periods ending after March 15, 2009. The Company elected to adopt the guidance of ASC 820-10-65, effective April 30, 2009. This adoption did not have an effect on the Company’s consolidated financial condition or results of operations.
In June 2009, the FASB issued SFAS No. 167 “Amendments to FASB Interpretation No. 46(R))” (“SFAS No. 167”). SFAS No. 167 amends the guidance of ASC 810, “Consolidation”, to eliminate the quantitative approach previously required for determining the primary beneficiary of a variable interest entity (“VIE”) and requires that the entity identify the primary beneficiary of the VIE as the enterprise that has both (a) the power to direct activities of the VIE that most significantly impact the VIE’s economic performance and (b) the obligation to absorb losses of the VIE or the right to receive benefits from the VIE. This amendment also requires an ongoing qualitative reassessments of whether an enterprise is the primary beneficiary of a VIE and additional disclosures about an enterprise’s involvement in VIE. The amendment is effective for reporting periods beginning after November 15, 2009 and as such will be adopted for the Company’s fiscal year beginning February 1, 2010. The adoption of this standard is not expected to have a significant impact on the Company’s consolidated financial condition or results of operations.
BLYTH, INC. AND SUBSIDIARIES
Notes to Consolidated Financial Statements
Note 2. New Accounting Pronouncements (continued)
In August 2009, the FASB issued Accounting Standards Update 2009-05, “Fair Value Measurements and Disclosures (Topic 820) – Measuring Liabilities at Fair Value” (“ASU 2009-05”). ASU 2009-05 amends Topic 820-10, “Fair Value Measurements and Disclosures – Overall”. This update clarifies techniques that may be used to determine the fair value of a liability if an active market for an identical liability does not exist. This new guidance was effective for the third quarter of fiscal 2010 for the Company. The adoption of this update did not have an impact on the Company’s consolidated financial condition or results of operations.
In January 2010, the FASB issued ASU 2010-02, "Consolidation (Topic 810) - Accounting and Reporting for Decreases in Ownership of a Subsidiary - a Scope Clarification" (“ASU 2010-02”). ASU 2010-02 clarifies that the scope of the decrease in ownership provisions of Topic 810 and how it applies to a subsidiary or group of assets that is a business, a subsidiary that is a business that is transferred to an equity method investee or a joint venture or an exchange of a group of assets that constitutes a business for a noncontrolling interest in an entity and does not apply to sales in substance of real estate. ASU 2010-02 should be applied on the first interim or annual period ending on or after December 15, 2009, and applied retrospectively to the first period that the entity adopted SFAS No. 160. The adoption of ASU 2010-02 did not have an impact on the Company’s consolidated financial condition or results of operations.
In January 2010, the FASB issued ASU 2010-06, "Fair Value Measurements and Disclosures (Topic 820) - Improving Disclosures about Fair Value Measurements" (“ASU 2010-06”). ASU 2010-06 requires new disclosures regarding transfers in and out of the Level 1 and 2 and activity within Level 3 fair value measurements and clarifies existing disclosures of inputs and valuation techniques for Level 2 and 3 fair value measurements. The new disclosures and clarifications of existing disclosures are effective for interim and annual reporting periods beginning after December 15, 2009, except for the disclosure of activity within Level 3 fair value measurements, which is effective for fiscal years beginning after December 15, 2010, and for interim periods within those years. This update will only have an impact on the Company’s disclosures beginning February 1, 2010 and will not have a material impact on the Company’s consolidated financial condition or results of operations.
Note 3. Business Acquisitions
In August 2008, the Company signed a definitive agreement to purchase ViSalus Holdings, LLC (“ViSalus”), a direct seller of vitamins, weight management products and other related nutritional supplements, through a series of investments.
On October 21, 2008, the Company completed its initial investment and acquired a 43.6% equity interest in ViSalus for $13.0 million in cash. Additionally, as provided in the acquisition agreement, and amended in September 2009, the Company has provided ViSalus with a $3.0 million revolving credit facility, of which $3.0 million was outstanding as of January 31, 2010. In addition, the Company is required, subject to the conditions in the acquisition agreement, to make additional purchases of ViSalus’ equity interest to increase its equity ownership over time to 57.5%, 72.7% and 100.0%. These additional purchases were originally conditioned upon ViSalus meeting certain operating targets in calendar years 2009, 2010 and 2011. However, ViSalus did not meet the operating threshold in 2009 so the Company was not
BLYTH, INC. AND SUBSIDIARIES
Notes to Consolidated Financial Statements
Note 3. Business Acquisitions (continued)
required to make an additional purchase. The Company exercised its one-time, one-year extension and additional purchases will be made if ViSalus meets certain operating targets in calendar years 2010, 2011 and 2012. The purchase prices of the additional investments are based on ViSalus’ future operating results as defined in the agreement. The Company has the option to acquire the remaining interest in ViSalus even if ViSalus does not meet the predefined operating targets.
The Company has accounted for the acquisition of ViSalus as a business combination under SFAS No. 141 “Business Combinations”, since the Company obtained control of ViSalus prior to the effective date of ASC 805. The Company analyzed the criteria for consolidation in accordance with ASC 810, and has determined it has control of ViSalus based on the following factors. ViSalus is currently majority owned collectively by Blyth and Ropart Asset Management Fund, LLC and Ropart Asset Management Fund II, LLC (collectively, “RAM”), a related party (see Note 22 to the Consolidated Financial Statements for additional information). Moreover, the Company has taken into account the composition of ViSalus’ three-member board of managers, one of whom is an executive officer of the Company, one of whom is a principal of RAM and one of whom is a founder and executive officer of ViSalus. Additionally, the Company and RAM together control ViSalus’ compensation committee and control the compensation of the ViSalus executive officer who serves on ViSalus’ board of managers. Consequently, all of the members of ViSalus’ board of managers may be deemed to operate under the Company’s influence.
The Company has also taken into account ViSalus’ governing documents, which afford the Company significant rights with respect to major corporate actions and the right to force the other owners of ViSalus’ equity instruments to sell them in some corporate transactions. Finally, the Company considered the mechanisms that are in place to permit it to purchase the remaining noncontrolling interest in ViSalus over the next several years.
As discussed above, the Company is required to purchase the remaining noncontrolling interests in ViSalus if ViSalus meets certain operating targets. As a result, these noncontrolling interests were determined to be redeemable and are accounted for in accordance with the guidance of ASC 480-10-S99-3A, and the non-codified portions of Emerging Issues Task Force Topic D-98, “Classification and Measurement of Redeemable Securities.” Accordingly, the Company had recognized these noncontrolling interests outside of permanent equity and accreted changes in their redemption value through the date of redemption during the time at which it was probable that the noncontrolling interests would be redeemed. The accretion of the redemption value had been recognized as a charge to retained earnings, and to the extent that the resulting redemption value exceeds the fair value of the noncontrolling interests, the differential was reflected in the Company’s EPS. During the second quarter of fiscal 2010 ViSalus’ revenues forecast for the current fiscal year was revised downward as a result of lower demand for its product, reflecting lower consumer spending attributed to the domestic economic recession and a higher than anticipated attrition rate in its distributor base. These factors together have required management to focus its efforts on stabilizing its distributor base and curtailing its international expansion plans. Accordingly, management has reduced its current year and long-term forecasts in response to the weakening demand for its products. The Company has taken a number of actions in response to its lower forecasts including the review of ViSalus assets for impairment (see Note 6 for further detail) and assessing whether it was probable that the noncontrolling interest would be redeemed based on revised forecasts. The current revisions in ViSalus’ near-term and long-term
BLYTH, INC. AND SUBSIDIARIES
Notes to Consolidated Financial Statements
Note 3. Business Acquisitions (continued)
projections have resulted in management concluding that it is no longer probable that Blyth would be obligated to purchase the remaining ownership interest in ViSalus. As of January 31, 2010, the redeemable noncontrolling interest reflects only the allocation of losses equivalent to the noncontrolling interest’s share of ViSalus, as a result of this redemption feature no longer being probable of exercise. Accordingly, during the second quarter of fiscal 2010, the Company reversed its accretion of its redeemable noncontrolling interest to zero on its Consolidated Balance Sheet and reversed previous EPS accretion adjustments for the portion in excess of fair value. If ViSalus meets its current projected operating targets, the total expected redemption value of noncontrolling interest will be approximately $4.5 million paid through 2014. However at these levels Blyth would not be obligated to purchase the remaining interest in ViSalus but could do so at its discretion. The total expected redemption value could increase or decrease depending upon whether ViSalus exceeds or falls short of its operating projections. Upon expiration of the redemption feature the entire amount of noncontrolling interest will be reclassified into the Equity section of the Consolidated Balance Sheets.
The acquisition of ViSalus by Blyth involved related parties, as discussed in Note 22 to the Consolidated Financial Statements. In addition to Blyth, the other owners of ViSalus consist of: its three founders, each of whom currently own approximately 11.7% of ViSalus for a total of 35.3% (the “founders”), RAM which owns 15.2%, and a small group of employees who own approximately 5.9%. Blyth’s initial investment in ViSalus of $13.0 million was paid to ViSalus ($2.5 million), RAM ($3.0 million) and the three founders ($2.5 million each). Mr. Goergen, Blyth’s chairman and chief executive officer, beneficially owns approximately 31% of Blyth’s outstanding common stock, and together with members of his family, owns substantially all of RAM. ViSalus expensed management fees from RAM in the amount of $0.2 million and $0.1 million in fiscal 2009 and 2010, respectively. As of the end of fiscal 2010, ViSalus had outstanding notes payable to RAM and the founders of $2.7 million, in addition to its $3.0 million revolving credit facility owed to Blyth.
On February 1, 2010, ViSalus received a financing commitment from the founders and RAM for up to $1.2 million to fund its operations for calendar year 2010, $0.9 million of which has been borrowed as of March 31, 2010. The loan is due February 28, 2011 and interest accrues at 10% per annum payable quarterly in arrears. In addition to the 10% interest, the loan requires ViSalus to pay a further lump-sum interest payment at loan maturity at an interest cost ranging from $0.6 million to $2.4 million. The amount of actual lump-sum interest payments depends on whether and when the Company lends $0.3 million to ViSalus, which ViSalus will use to repay a similar amount to the founders and RAM. The Company has no obligation to do so. If the Company lends $0.3 million to ViSalus prior to April 30, 2010, ViSalus’ interest cost to the founders and RAM would be 10% per annum plus $0.6 million. If the Company lends $0.3 million to ViSalus thereafter, and assuming that the founders and RAM do not make additional loans to ViSalus, ViSalus’ interest cost to the founders and RAM would be 10% per annum plus an amount ranging from $0.9 million to $1.2 million. If the Company chooses not to lend $0.3 million to ViSalus, ViSalus’ interest cost to the founders and RAM would be 10% per annum plus up to an additional $2.4 million. The additional lump-sum interest payments beyond the fixed interest rate of 10% per annum also depend upon ViSalus meeting certain operating conditions. The loan is secured by ViSalus’ assets and has preference over existing loans from the founders, RAM and the Company.
BLYTH, INC. AND SUBSIDIARIES
Notes to Consolidated Financial Statements
Note 3. Business Acquisitions (continued)
During fiscal 2009, the Company acquired certain assets of As We Change, a catalog and internet retailer, for $2.3 million in cash. The results of operations for As We Change, which were not material, are included in the Consolidated Statements of Earnings (Loss) of the Company since August 3, 2008, the date of acquisition. As We Change is included in the Catalog & Internet reporting segment.
Note 4. Business Divestitures and Discontinued Operations
In April 2007, the Company sold certain assets and liabilities of the Blyth HomeScents International North American mass channel candle business (“BHI NA”), which was part of the Wholesale segment. The net assets were sold for $25.3 million, including proceeds from the sale of overstock inventory of $1.3 million. Of this amount, $21.8 million was received at closing and a total of $3.5 million was received subsequently in fiscal 2008.
Note 5. Restructuring and Impairment Charges
During fiscal 2007, the Company recorded charges related to the restructuring of the North American operations of the Direct Selling segment in recognition of the decline in sales in this channel. Restructuring charges associated with the termination of 91 employees included severance costs of $1.5 million, $0.4 million of which was recorded in cost of goods sold, $0.4 million was recorded in selling expense and $0.7 million in administrative expense. During fiscal 2008 an additional $0.1 million of severance costs were recorded to administrative expense. Lease termination costs of $0.5 million, $1.5 million and $1.7 million were recorded to Costs of goods sold, in fiscal 2007, 2008 and 2009, respectively. As a result of a change in estimate relating to future sublease income and payments made during fiscal 2010, the Company recorded additional charges of $0.1 million to Costs of goods sold. The Company anticipates the lease termination costs to be paid through fiscal 2013.
The following is a tabular rollforward of the restructuring charges described above that were recorded on the Consolidated Balance Sheets of the Company:
|
Wholesale Segment
|
Direct Selling
Segment
|
|||||||||||||||
|
(In thousands)
|
Severance Costs
|
Lease Obligation
|
Severance Cost
|
Total
|
||||||||||||
|
Balance at January 31, 2007
|
$ | 469 | $ | 450 | $ | 1,541 | $ | 2,460 | ||||||||
|
Changes in estimate during fiscal 2008
|
726 | 1,486 | 130 | 2,342 | ||||||||||||
|
Payments made against 2008 charges
|
(1,057 | ) | (785 | ) | (1,571 | ) | (3,413 | ) | ||||||||
|
Balance at January 31, 2008
|
$ | 138 | $ | 1,151 | $ | 100 | $ | 1,389 | ||||||||
|
Changes in estimate during fiscal 2009
|
- | 1,701 | 1,701 | |||||||||||||
|
Payments made in fiscal 2009
|
(138 | ) | (865 | ) | (100 | ) | (1,103 | ) | ||||||||
|
Balance at January 31, 2009
|
$ | - | $ | 1,987 | $ | - | $ | 1,987 | ||||||||
|
Changes in estimate during fiscal 2010
|
- | 129 | - | 129 | ||||||||||||
|
Payments made in fiscal 2010
|
- | (789 | ) | - | (789 | ) | ||||||||||
|
Balance at January 31, 2010
|
$ | - | $ | 1,327 | $ | - | $ | 1,327 | ||||||||
BLYTH, INC. AND SUBSIDIARIES
Notes to Consolidated Financial Statements
Note 6. Investments
The Company considers all money market funds and debt instruments, including certificates of deposit and commercial paper, purchased with an original maturity of three months or less to be cash equivalents, unless the assets are restricted. The carrying value of cash and cash equivalents approximates their fair value.
The Company’s investments as of January 31, 2010 consisted of a number of financial securities including debt instruments, preferred stocks, mutual funds, short-term and long-term certificates of deposit, an investment in a limited liability company and restricted cash. The Company accounts for its investments in debt and equity instruments in accordance with ASC 320, “Investments – Debt & Equity Securities”.
The following table summarizes, by major security type, the fair value of the Company’s investments:
|
January 31, 2009
|
January 31, 2010
|
|||||||
|
Debt securities
|
$ | 4,481 | $ | - | ||||
|
Equity securities
|
16,243 | 15,680 | ||||||
|
Certificates of deposit
|
3,070 | 7,413 | ||||||
|
Investment in LLC
|
1,100 | 979 | ||||||
|
Other
|
81 | - | ||||||
|
Total investments
|
$ | 24,975 | $ | 24,072 | ||||
Short-term investments held as of January 31, 2010 consist of $5 million of certificates of deposit that have maturities greater than three months but less than twelve months. These are recorded at cost and interest earned on these is realized in Interest income in the Consolidated Statements of Earnings (Loss).
The Company’s investments in preferred stocks were originally bought and sold on a short-term basis with the sole purpose of generating a profit on price differences. Accordingly, these investments were classified as short-term trading investments. Realized and unrealized gains and losses on these securities were recorded in the Consolidated Statements of Earnings (Loss) in Foreign exchange and other through January 31, 2009.
The Company changed its investment strategy and, in connection with that change, changed the classification of the preferred stock investments to long-term available for sale securities. With the change in designation to available for sale, the unrealized losses on these investments that are considered temporary are now recorded in AOCI. These securities are valued based on quoted prices in inactive markets. As of January 31, 2010, the Company has recorded a net of tax unrealized gain of $0.1 million in AOCI.
BLYTH, INC. AND SUBSIDIARIES
Notes to Consolidated Financial Statements
Note 6. Investments (continued)
The Company holds other debt and equity auction rate securities (“ARS”) which are classified as long-term available for sale investments. Realized gains and losses on these securities are determined using the specific identification method and are recorded in Foreign exchange and other. Unrealized losses on these securities that are considered temporary and that are not the result of a credit loss are recorded in AOCI. Unrealized losses that are considered other than temporary are recorded in the Consolidated Statements of Earnings (Loss) in Foreign exchange and other.
As of January 31, 2009 and 2010, the Company held $13.5 million and $9.4 million, respectively, of ARS classified as available-for-sale securities. ARS are generally long-term debt instruments that provide liquidity through a Dutch auction process that resets the applicable interest rate at predetermined intervals in days. This mechanism generally allows investors to rollover their holdings and continue to own their respective securities or liquidate their holdings by selling their securities at par value. The Company generally invested in these securities for short periods of time as part of its cash management program. The Company’s auction rate security held as of January 31, 2010 is an AAA/Aaa rated investments in a closed-end fund consisting of preferred stock of various utilities that maintains assets equal to or greater than 200% of the liquidation preference of its preferred stock. The valuation of this security considered the financial conditions of the issuer, as well as the value of the collateral. The Company assessed the credit risk associated with the ARS to be minimal. If the credit ratings of the issuer or the collateral deteriorate, the Company may adjust the carrying value of these investments.
The weakness within the credit markets has prevented the Company and other investors from liquidating all of their holdings by selling their securities at par value. Historically, the par value of these securities approximated fair value as a result of the resetting of the interest rate. In the first quarter of fiscal 2009 market auctions, including auctions for substantially all the Company’s ARS, began to fail due to insufficient buyers. As a result of these failed auctions and the uncertainty of when these securities could successfully be liquidated at par (liquidity risk), the Company recorded a pre-tax unrealized loss of $1.5 million to AOCI as of January 31, 2009 and classified these securities as non-current investments. In November 2009 management made the decision to liquidate the debt ARS, at a price below par value and recorded a realized loss of $0.9 million to Foreign exchange and other within the Consolidated Statements of Earnings (Loss) during the third quarter. As of January 31, 2010, the Company has assessed the pre-tax unrealized loss to be $0.6 million. This instrument has been in a continuous loss position for greater than 12 months, however the Company deems the investment to be temporarily impaired as management has made the decision not to sell the investment until it can be redeemed at par value and the underlying liquidity of the issuer does not indicate that a condition of a permanent impairment exists.
BLYTH, INC. AND SUBSIDIARIES
Notes to Consolidated Financial Statements
Note 6. Investments (continued)
The following table summarizes the proceeds and gross realized gains and losses on the sale of available for sale investments recorded in Foreign exchange and other within the Consolidated Statements of Earnings (Loss). Gains and losses are calculated using the specific identification method.
|
(In thousands)
|
Year Ended January 31, 2010
|
|||
|
Net proceeds
|
$ | 5,238 | ||
|
Realized gains (losses)
|
(870 | ) | ||
The Company holds an investment in a limited liability company (“LLC”) obtained through its ViSalus acquisition. The LLC is accounted for under the equity method as the Company holds a minority interest in this company. The Company records its share of the LLC’s earnings or loss to its investment balance. All earnings and losses are recorded in the Consolidated Statements of Earnings (Loss) in Foreign exchange and other. Through January 31, 2010 the Company has recorded losses of $0.1 million related to this investment. The investment in this LLC involves related parties as discussed in Note 22.
Also included in long-term investments are certificates of deposit that are held as collateral for the Company’s outstanding standby letters of credit. These are recorded at cost and interest earned on these is realized in Interest income in the Consolidated Statements of Earnings (Loss).
In addition to the investments noted above, the Company holds mutual funds as part of a deferred compensation plan which are classified as available for sale. As of January 31, 2009 and 2010 the fair value of these securities was $1.3 million and $1.0 million, respectively. These securities are valued based on quoted prices in an active market. Unrealized gains and losses on these securities are recorded in AOCI. These mutual funds are included in Other assets in the Consolidated Balance Sheets.
Note 7. Inventories
The major components of Inventories are as follows:
|
January 31, (In thousands)
|
2009
|
2010
|
||||||
|
Raw materials
|
$ | 9,643 | $ | 8,482 | ||||
|
Finished goods
|
127,444 | 93,721 | ||||||
|
Total
|
$ | 137,087 | $ | 102,203 | ||||
As of January 31, 2009 and 2010, the inventory valuation reserves totaled $15.8 million and $14.4 million, respectively. The Company recorded provisions for obsolete, excess and unmarketable inventory to Cost of goods sold in the Consolidated Statements of Earnings (Loss) for fiscal 2008, 2009 and 2010 of $4.8 million, $6.1 million and $3.9 million, respectively.
BLYTH, INC. AND SUBSIDIARIES
Notes to Consolidated Financial Statements
Note 8. Prepaid and Other
Prepaid and other consists of the following:
|
2009
|
2010
|
|||||||
|
Income and other taxes
|
$ | 2,192 | $ | 2,269 | ||||
|
Catalogs
|
6,649 | 6,319 | ||||||
|
Promotions
|
2,844 | 3,952 | ||||||
|
Foreign exchange forward contracts
|
6,127 | 144 | ||||||
|
Other
|
12,857 | 11,313 | ||||||
|
Total
|
$ | 30,669 | $ | 23,997 | ||||
Note 9. Derivatives and Other Financial Instruments
The Company uses foreign exchange forward contracts to hedge the impact of foreign currency fluctuations on foreign denominated inventory purchases, intercompany payables and certain loans. It does not hold or issue derivative financial instruments for trading purposes. The Company has also hedged the net assets of certain of its foreign operations through foreign currency forward contracts. The net after-tax gain related to the net investment hedges recorded in AOCI during fiscal 2010 was $0.4 million. The gain in AOCI related to net investment hedges as of January 31, 2010 was $5.2 million.
The Company has designated forward exchange contracts on forecasted intercompany purchases and future purchase commitments as cash flow hedges and, as such, as long as the hedge remains effective and the underlying transaction remains probable, the effective portion of the changes in the fair value of these contracts will be recorded in AOCI until earnings are affected by the variability of the cash flows being hedged. With regard to commitments for inventory purchases, upon payment of each commitment, the underlying forward contract is closed and the corresponding gain or loss is transferred from AOCI and is realized in the Consolidated Statements of Earnings (Loss). If a hedging instrument is sold or terminated prior to maturity, gains and losses are deferred in AOCI until the hedged item is settled. However, if the hedged item is probable of no longer occurring, the resultant gain or loss on the terminated hedge is recognized into earnings immediately. The net after-tax gain included in AOCI at January 31, 2010 is $0.1 million and is expected to be transferred into earnings within the next twelve months upon payment of the underlying commitment.
The Company has designated its foreign currency forward contracts related to certain foreign denominated loans and intercompany payables as fair value hedges. The gains or losses on the fair value hedges are recognized into earnings and generally offset the transaction gains or losses in the foreign denominated loans that they are intended to hedge.
For consolidated financial statement presentation, net cash flows from such hedges are classified in the categories of the Consolidated Statement of Cash Flows with the items being hedged. Forward contracts held with each bank are presented within the Consolidated Balance Sheets as a net asset or liability, based on netting agreements with each bank and whether the forward contracts are in a net gain or loss position. The foreign exchange contracts outstanding have maturity dates through October 2010.
BLYTH, INC. AND SUBSIDIARIES
Notes to Consolidated Financial Statements
Note 9. Derivatives and Other Financial Instruments (continued)
The table below details the fair value and location of the Company’s hedges in the Consolidated Balance Sheets:
|
Fair Values of Derivative Instruments
|
||||||||
|
As of January 31, 2010 (In thousands)
|
Other Current Asset
|
Accrued Expenses
|
||||||
|
Derivatives designated as hedging instruments under Subtopic 815-20
|
||||||||
|
Foreign exchange forward contract in an asset position
|
$ | 144 | $ | 56 | ||||
|
Foreign exchange forward contract in a liability position
|
(56 | ) | (125 | ) | ||||
|
Net derivatives at fair value
|
$ | 88 | $ | (69 | ) | |||
Gain and loss activity related to the Company’s Cash Flow hedges for the year ended January 31, 2010 are as follows:
|
Derivatives in Subtopic 815-20 Cash Flow Hedging Relationships
|
Amount of Gain Recognized in AOCI on Derivative (Effective Portion)
|
Location of Loss Reclassified from AOCI into Income (Effective Portion)
|
Amount of Loss Reclassified from AOCI into Income (Effective Portion)
|
||||||
|
(In thousands)
|
|||||||||
|
Foreign exchange forward contract
|
$ | 90 |
Cost of goods sold
|
$ | (1,410 | ) | |||
For the year ended January 31, 2010, the Company recorded a gain of $0.7 million to AOCI related to foreign exchange forward contracts accounted for as Net Investment hedges.
Losses of $1.2 million were recorded to Foreign exchange and other related to foreign exchange forward contracts accounted for as Fair Value hedges for the fiscal year ended January 31, 2010.
Note 10. Goodwill and Other Intangibles
Goodwill is subject to an assessment for impairment using a two-step fair value-based test and as such other intangibles are also subject to impairment reviews, which must be performed at least annually or more frequently if events or circumstances indicate that goodwill or other indefinite lived intangibles might be impaired.
The Company performs its annual assessment of impairment as of January 31. For goodwill, the first step is to identify whether a potential impairment exists. This is done by comparing the fair value of a reporting unit to its carrying amount, including goodwill. Fair value for each of the Company’s reporting units is estimated utilizing a combination of valuation techniques, namely the discounted cash flow methodology and the market multiple methodology. The discounted cash flow methodology assumes the fair value of an asset can be estimated by the economic benefit or net cash flows the asset will generate over the life of the asset, discounted to its present value. The discounting process uses a rate of return that accounts for both the time value of money and the investment risk factors. The market multiple methodology estimates fair value based on what other participants in the market have recently paid for reasonably similar assets. Adjustments are made to compensate for differences between the reasonably similar assets and the assets being valued. If the
BLYTH, INC. AND SUBSIDIARIES
Notes to Consolidated Financial Statements
Note 10. Goodwill and Other Intangibles (continued)
fair value of the reporting unit exceeds the carrying value, no further analysis is necessary. The fair value of the reporting units is derived using a combination of the outcome of the two valuation techniques described above. If the carrying amount of the reporting unit exceeds its fair value, the second step is performed. The second step compares the carrying amount of the goodwill to the estimated fair value of the goodwill. If fair value is less than the carrying amount, an impairment loss is reported as a reduction to the goodwill and a charge to operating expense.
During the first three quarters of fiscal 2009, the Miles Kimball Company and the Boca Java reporting units, both part of the Catalog & Internet segment, experienced substantial declines in operating performance when compared to prior years’ results and their strategic outlook. The Company believes this shortfall in performance was primarily attributable to decreased consumer spending due to changes in the business environment and adverse economic conditions. As a result the Company performed an impairment analysis, and determined that the goodwill in these reporting units was determined to be fully impaired. Accordingly, the Company recorded a non-cash pre-tax goodwill impairment charge of $30.9 million.
In the second quarter of fiscal 2010, the ViSalus business, within the Direct Selling segment, revised downward its revenues forecast for the current fiscal year as a result of lower demand for its product reflecting lower consumer spending attributed to the domestic economic recession and a higher than anticipated attrition rate in its distributor base. These factors together have required management to focus its efforts on stabilizing its distributor base and curtailing its international expansion plans. Accordingly management has reduced its current year and long-term forecasts in response to the weakening demand for its products. The impairment analysis performed indicated that the goodwill in ViSalus was fully impaired, as its fair value was less than its carrying value, including goodwill. Accordingly, the Company recorded a non-cash pre-tax goodwill impairment charge of $13.2 million, during the second quarter of fiscal 2010.
The gross value of all goodwill, by operating segment, was $98.0 million in the Wholesale segment, $77.7 million in the Catalog & Internet segment and $15.5 million in the Direct Selling segment.
The following table shows changes in goodwill for the fiscal years ended January 31, 2009 and 2010, by operating segment:
|
(In thousands)
|
Direct Selling
|
Catalog & Internet
|
Wholesale
|
Total
|
||||||||||||
|
Balance as of February 1, 2009
|
2,298 | 29,556 | - | 31,854 | ||||||||||||
|
ViSalus acquisition
|
11,690 | - | - | 11,690 | ||||||||||||
|
As We Change acquisition
|
- | 1,295 | - | 1,295 | ||||||||||||
|
Impairment charges
|
- | (30,851 | ) | - | (30,851 | ) | ||||||||||
|
Balance as of January 31, 2009
|
13,988 | - | - | 13,988 | ||||||||||||
|
ViSalus acquisition
|
1,501 | - | - | 1,501 | ||||||||||||
|
Impairment charges
|
(13,191 | ) | - | - | (13,191 | ) | ||||||||||
|
Balance as of January 31, 2010
|
2,298 | - | - | 2,298 | ||||||||||||
Other intangible assets include indefinite-lived trade names and trademarks and customer relationships related to the Company’s acquisition of Miles Kimball and Walter Drake in fiscal 2004 and As We Change during fiscal 2009, which are reported in the Catalog and Internet segment; and ViSalus, acquired during fiscal 2009, which is reported in the Direct Selling segment. The indefinite-lived trade names and trademarks were valued at $12.1 million and $9.0
BLYTH, INC. AND SUBSIDIARIES
Notes to Consolidated Financial Statements
Note 10. Goodwill and Other Intangibles (continued)
million as of the fiscal years ended January 31, 2009 and 2010, respectively. The Company does not amortize the indefinite-lived trade names and trademarks, but rather tests for impairment annually as of January 31, and upon the occurrence of a triggering event. As part of the impairment analysis’ performed in the third and fourth quarters of fiscal 2009, the Company recorded impairment charges totaling $17.9 million, related to certain of the Company’s trade names, which were determined to be impaired due to changes in the business environment, adverse economic conditions currently experienced and decreased consumer spending. As part of the previously mentioned impairment analysis performed for the second quarter of fiscal 2010 quarter for ViSalus, the Company recorded impairment charges totaling $3.1 million, related to certain of the Company’s trade names, which were determined to be impaired.
The gross value of all indefinite trade names and trade marks by segment was $28.1 million in the Catalog & Internet segment and $4.2 million in the Direct Selling segment. The gross value of all customer relationships by segment was $15.4 million in the Catalog & Internet segment and $0.3 million in the Direct Selling segment.
|
Direct Selling Segment
|
Catalog & Internet Segment
|
Total
|
||||||||||||||||||||||
|
(In thousands)
|
Indefinite-lived trade names and trademarks
|
Customer relationships
|
Indefinite-lived trade names and trademarks
|
Customer relationships
|
Indefinite-lived trade names and trademarks
|
Customer relationships
|
||||||||||||||||||
|
Other intangibles at January 31, 2008
|
$ | - | $ | - | $ | 25,750 | $ | 5,750 | $ | 25,750 | $ | 5,750 | ||||||||||||
|
ViSalus acquisition
|
4,200 | 300 | - | - | 4,200 | 300 | ||||||||||||||||||
|
As We Change acquisition
|
- | - | - | 387 | - | 387 | ||||||||||||||||||
|
Amortization
|
- | (29 | ) | - | (1,618 | ) | - | (1,647 | ) | |||||||||||||||
|
Impairments
|
- | - | (17,900 | ) | - | (17,900 | ) | - | ||||||||||||||||
|
Other intangibles at January 31, 2009
|
$ | 4,200 | $ | 271 | $ | 7,850 | $ | 4,519 | $ | 12,050 | $ | 4,790 | ||||||||||||
|
Amortization
|
- | (64 | ) | - | (1,293 | ) | - | (1,357 | ) | |||||||||||||||
|
Impairments
|
(3,100 | ) | (207 | ) | - | - | (3,100 | ) | (207 | ) | ||||||||||||||
|
Other intangibles at January 31, 2010
|
$ | 1,100 | $ | - | $ | 7,850 | $ | 3,226 | $ | 8,950 | $ | 3,226 | ||||||||||||
Amortization expense is recorded on an accelerated basis over the estimated lives of the customer lists ranging from 5 to 12 years. Amortization expense was $1.6 million in fiscal 2009 and $1.4 million in fiscal 2010. Estimated amortization expense for the next five fiscal years, beginning with fiscal 2011 is as follows: $1.1 million, $0.7 million, $0.6 million, $0.6 million and $0.1 million. The weighted average remaining life of the Company’s customer lists was 4.6 years at January 31, 2010.
Note 11. Fair Value Measurements
The fair-value hierarchy established in ASC 820 prioritizes the inputs used in valuation techniques into three levels as follows:
|
Level-1 – Observable inputs – quoted prices in active markets for identical assets and liabilities
|
|
|
Level-2 – Observable inputs other than the quoted prices in active markets for identical assets and liabilities – such as quoted prices for similar instruments, quoted prices for identical or similar instruments in inactive markets, or other inputs that are observable or can be corroborated by observable market data;
|
|
|
Level-3 – Unobservable inputs – includes amounts derived from valuation models where one or more significant inputs are unobservable and require the Company to develop relevant assumptions.
|
BLYTH, INC. AND SUBSIDIARIES
Notes to Consolidated Financial Statements
Note 11. Fair Value Measurements (continued)
For fiscal 2010, the Company is no longer subject to previously existing deferral provisions and is applying the framework for measuring fair value to all nonfinancial assets and liabilities, including those that are not recognized or disclosed at fair value in the financial statements on a recurring basis, and has expanded disclosures to meet these requirements.
Assets and Liabilities Measured at Fair Value on a Recurring Basis
The following table summarizes the financial assets and liabilities measured at fair value on a recurring basis as of the measurement date, January 31, 2010, and the basis for that measurement, by level within the fair value hierarchy:
|
(In thousands)
|
Balance as of January 31, 2010
|
Quoted prices in active markets for identical assets (Level 1)
|
Significant other observable inputs (Level 2)
|
Significant unobservable inputs (Level 3)
|
||||||||||||
|
Financial assets
|
||||||||||||||||
|
Certificates of deposit
|
$ | 7,413 | $ | - | $ | 7,413 | $ | - | ||||||||
|
Equity securities
|
15,680 | - | 6,256 | 9,424 | ||||||||||||
|
Deferred compensation plan assets 1
|
958 | 958 | - | - | ||||||||||||
|
Foreign exchange forward contracts
|
88 | - | 88 | - | ||||||||||||
|
Total
|
$ | 24,139 | $ | 958 | $ | 13,757 | $ | 9,424 | ||||||||
|
Financial liabilities
|
||||||||||||||||
|
Foreign exchange forward contracts
|
$ | (69 | ) | $ | - | $ | (69 | ) | $ | - | ||||||
|
1) There is an offsetting liability for the obligation to its employees in Other liabilities
|
||||||||||||||||
The table below summarizes the changes in the fair value of Level-3 financial assets, consisting of debt and equity ARS, for the twelve month period ended January 31, 2010:
|
(In thousands)
|
Significant unobservable inputs (Level 3)
|
|||
|
Fair value February 1, 2009
|
$ | 13,515 | ||
|
Unrealized gain 1
|
522 | |||
|
Reversal of unrealized loss(1)
|
387 | |||
|
Sale of ARS
|
(4,150 | ) | ||
|
Other than temporary impairment
|
(850 | ) | ||
|
Fair value January 31, 2010
|
$ | 9,424 | ||
|
(1) These unrealized gains/losses on our available for sale investments are recorded as a component of other comprehensive income.
|
||||
The Company values its investments in equity securities within the deferred compensation plan using level 1 inputs, by obtaining quoted prices in active markets. The deferred compensation plan assets consist of shares of mutual funds, for which there are quoted prices in an active market. The Company also enters into both cash flow and fair value hedges by purchasing forward contracts. These contracts are valued using level 2 inputs, primarily observable forward foreign exchange rates. The Company values certain preferred stock investments using information classified as level 2. This data consists of quoted prices of identical instruments in an inactive market and third party bid offers. The certificates of deposit have been valued using information classified as level 2, as these are not traded on the open market and are held
BLYTH, INC. AND SUBSIDIARIES
Notes to Consolidated Financial Statements
Note 11. Fair Value Measurements (continued)
unsecured by a single counterparty. The equity securities consist of ARS that take into consideration many factors including the credit quality of both the issuer and its guarantor and value of the collateral, all of which aids in the determination of the default risk, credit risk and downgrade risk. Additionally, the Company utilizes input from valuation specialists in performing discounted cash flow and market analyses. Since there is not an active observable market currently for these securities, they have been classified as a level 3 input.
The carrying values of cash and cash equivalents, trade and other receivables and trade payables are considered to be representative of their respective fair values.
Assets and Liabilities Measured at Fair Value on a Nonrecurring Basis
The Company is required, on a non-recurring basis, to adjust the carrying value or provide valuation allowances for certain assets using fair value measurements in accordance with ASC 820. The Company’s assets and liabilities measured at fair value on a nonrecurring basis include property, plant and equipment, goodwill, intangibles and other assets. These assets are not measured at fair value on an ongoing basis; however, they are subject to fair value adjustments in certain circumstances, such as when there is evidence that an impairment may exist.
The following table summarizes the assets measured at fair value on a nonrecurring basis as of the measurement date, January 31, 2010, by level within the fair value hierarchy and identifies the losses recorded during the fiscal year:
|
(In thousands)
|
Balance as of January 31, 2010
|
Quoted prices in active markets for identical assets (Level 1)
|
Significant other observable inputs (Level 2)
|
Significant unobservable inputs (Level 3)
|
Total impairment losses
|
|||||||||||||||
|
Goodwill
|
$ | 2,298 | $ | - | $ | - | $ | 2,298 | $ | (13,191 | ) | |||||||||
|
Indefinite-lived trade names and trademarks
|
8,950 | - | - | 8,950 | (3,100 | ) | ||||||||||||||
|
Customer Relationships
|
3,226 | - | - | 3,226 | (207 | ) | ||||||||||||||
|
Assets held for sale
|
6,492 | - | - | 6,492 | (376 | ) | ||||||||||||||
| $ | (16,874 | ) | ||||||||||||||||||
Goodwill and intangibles are subject to impairment testing on an annual basis, or sooner if circumstances indicate a condition of impairment may exist. The valuation uses assumptions such as interest and discount rates, growth projections and other assumptions of future business conditions. These valuation methods require a significant degree of management judgment concerning the use of internal and external data. In the event these methods indicate that fair value is less than the carrying value, the asset is recorded at fair value as determined by the valuation models. As such, the Company classifies goodwill and other intangibles subjected to nonrecurring fair value adjustments as level 3. See Note 10 for further details on the asset impairment review performed during the second quarter of fiscal 2010.
The fair value of the Company’s assets held for sale is reviewed periodically, as the market for these assets change. For fiscal 2010 these assets consisted of both a building and land within the Wholesale segment and land within the Direct Selling segment, which are classified as assets held for sale. They are reported as non-current assets in Other assets within the Consolidated Balance Sheets. The valuation of these assets uses a significant amount of management’s judgment and relies heavily on the information provided by third parties. The current local real estate market,
BLYTH, INC. AND SUBSIDIARIES
Notes to Consolidated Financial Statements
Note 11. Fair Value Measurements (continued)
regional comparatives, estimated concessions and transaction costs are all considered when determining the fair value of these assets. The impaired building and land are within the Wholesale segment. Due to the nature of this information and the assumptions made by management the Company has classified the inputs used in valuing these assets as level 3.
The estimated fair value of the Company’s $110.5 million in debt, including the $100 million Senior Notes, recorded at an amortized cost, as of January 31, 2010 was approximately $95.6 million. The fair value of the liability is determined using the fair value of its notes when traded as an asset in an inactive market and is based on current interest rates, relative credit risk and time to maturity. Due to nature of the information used the Company considers these inputs to be level 2.
Note 12. Accrued Expenses
Accrued expenses consist of the following:
|
2009
|
2010
|
|||||||
|
Compensation and benefits
|
$ | 21,121 | $ | 20,269 | ||||
|
Deferred revenue
|
12,759 | 13,645 | ||||||
|
Promotional
|
7,674 | 8,235 | ||||||
|
Interest payable
|
2,779 | 1,618 | ||||||
|
Taxes, other than income
|
3,248 | 2,882 | ||||||
|
Self-insurance reserves
|
1,838 | 2,081 | ||||||
|
Postage and freight
|
1,538 | 2,446 | ||||||
|
Other
|
13,936 | 9,719 | ||||||
|
Total
|
$ | 64,893 | $ | 60,895 | ||||
Note 13. Long-Term Debt
Long-term debt consists of the following:
|
January 31, (In thousands)
|
2009
|
2010
|
||||||
|
7.90% Senior Notes
|
$ | 37,292 | $ | - | ||||
|
5.50% Senior Notes
|
99,897 | 99,918 | ||||||
|
Other
|
8,542 | 10,626 | ||||||
| 145,731 | 110,544 | |||||||
|
Less current maturities
|
(37,936 | ) | (582 | ) | ||||
| $ | 107,795 | $ | 109,962 | |||||
In May 1999, the Company filed a shelf registration statement for issuance of up to $250.0 million in debt securities with the Securities and Exchange Commission. On September 24, 1999, the Company issued $150.0 million of 7.90% Senior Notes due October 1, 2009 at a discount of approximately $1.4 million, which was amortized over the life of the notes. The Company repurchased $12.3 million of its 7.90% Senior Notes in fiscal 2009 and $12.6 million in the first eight months of fiscal 2010, settling the debt early. Principal payments of $24.7 million were made upon maturity.
BLYTH, INC. AND SUBSIDIARIES
Notes to Consolidated Financial Statements
Note 13. Long-Term Debt (continued)
On October 20, 2003, the Company issued $100.0 million 5.50% Senior Notes due on November 1, 2013 at a discount of approximately $0.2 million, which is being amortized over the life of the notes. Such notes contain among other provisions, restrictions on liens on principal property or stock issued to collateralize debt. At January 31, 2010, the Company was in compliance with such provisions. Interest is payable semi-annually in arrears on May 1 and November 1. The notes may be redeemed in whole or in part at any time at a specified redemption price. The proceeds of the debt issuances were used for general corporate purposes.
As of January 31, 2009 and 2010, Miles Kimball had approximately $8.2 million and $7.7 million, respectively, of long-term debt outstanding under a real estate mortgage note payable which matures June 1, 2020. Under the terms of the note, payments of principal and interest are required monthly at a fixed interest rate of 7.89%.
As of January 31, 2009 and 2010, Midwest-CBK had $0.1 million of long-term debt outstanding under an Industrial Revenue Bond (“IRB”), which matures on January 1, 2025. The bond is backed by an irrevocable letter of credit issued by a bank and is collateralized by certain of Midwest-CBK’s assets. The amount outstanding under the IRB bears interest at short-term floating rates, which on a weighted average was 0.3% at January 31, 2010. Interest payments are required monthly under the terms of the bond.
As of January 31, 2010 ViSalus had $2.7 million of long-term debt outstanding related to outstanding notes payable to RAM and its three founders. Under the terms of the notes, interest is accrued at a fixed interest rate of 10%.
|
2011
|
$ | 582 | ||
|
2012
|
3,237 | |||
|
2013
|
601 | |||
|
2014
|
100,549 | |||
|
2015
|
682 | |||
|
Thereafter
|
4,893 | |||
| $ | 110,544 | |||
The estimated fair value of the Company’s $145.7 million and $110.5 million total long-term debt (including current portion) at January 31, 2009 and 2010 was approximately $120.6 million and $95.6 million, respectively. The fair value of the liability is determined using the fair value of its notes when traded as an asset in an inactive market and is based on current interest rates, relative credit risk and time to maturity.
As of January 31, 2010, the Company had a total of $2.0 million available under an uncommitted bank facility to be used for letters of credit. The issuance of letters of credit under this facility will be available until January 31, 2011. As of January 31, 2010, no letters of credit were outstanding.
As of January 31, 2010, the Company had $2.4 million in standby letters of credit outstanding that are collateralized with a certificate of deposit.
BLYTH, INC. AND SUBSIDIARIES
Notes to Consolidated Financial Statements
Note 14. Employee Benefit Plans
In accordance with ASC 715, “Compensation-Retirement Benefits”, the Company recorded an adjustment to its Consolidated Balance Sheet as of January 31, 2007 reducing its projected benefit obligation by $1.5 million with a corresponding credit to AOCI, net of taxes of $0.9 million. In fiscal 2008 the Company recorded an additional credit to AOCI, net of deferred taxes, of $0.3 million in order to reflect the changes in the funded status of the Miles Kimball Company Retirement Plan (“Plan”).
The Plan was terminated effective October 31, 2007. During fiscal 2009, the Company filed for approval of the plan termination with the Pension Benefit Guaranty Corporation (“PBGC”) and the Internal Revenue Service (“IRS”). Pursuant to the termination, the Company purchased an annuity with a life insurance company, covering all participants in the Plan. Upon approval of the termination, this annuity became irrevocable. The Company was relieved from primary responsibility of the pension obligation and the gross $1.9 million unrealized gain was recognized in the Consolidated Statement of Earnings (Loss) upon this settlement.
Certain of the Company’s non-U.S. subsidiaries provide pension benefits to employees or participate in government sponsored programs. The cost of these plans or government sponsored programs was $1.7 million and $2.0 million in fiscal 2009 and 2010, respectively. Most employees outside the United States are covered by government sponsored and administered programs. Other contributions to government-mandated programs are not expected to be significant.
The Company has defined contribution employee benefit plans in both the United States and certain of its foreign locations, covering substantially all eligible non-union employees. Contributions to all such plans are principally at the Company’s discretion. Total expense related to all defined contribution plans for the fiscal years ended January 31, 2008, 2009 and 2010 was $5.7 million, $4.5 million and $3.4 million, respectively. The continued decrease in expense compared to prior periods is primarily due to the reductions in personnel and profit sharing contributions made during the year.
The Company has entered into an employment agreement with its Chairman and Chief Executive Officer, Robert B. Goergen, dated as of August 1, 2000. This contract has been amended and restated from time to time to extend his term of employment and provide other benefits. Benefits pursuant to the agreement have been funded by a purchased annuity contract.
Note 15. Commitments and Contingencies
In August 2008, a state department of revenue proposed to assess additional corporate income taxes on the Company for fiscal years 2002, 2003 and 2004 in the net amount of $34.9 million, which includes interest. In August 2008, the Company filed a protest of the assessment, which it intends to contest vigorously. During fiscal 2008, the Company established a reserve for this matter that it believes is adequate based on existing facts and circumstances. The ultimate resolution of this matter could exceed the Company’s recorded reserve in the event of an unfavorable outcome of this matter. It is reasonably possible that losses in excess of the Company’s recorded reserve could be incurred; however, the Company cannot estimate such a loss at this time.
BLYTH, INC. AND SUBSIDIARIES
Notes to Consolidated Financial Statements
Note 15. Commitments and Contingencies (continued)
The Company utilizes operating and capital leases for a portion of its facilities and equipment. Generally, the leases provide that the Company pay real estate taxes, maintenance, insurance and other occupancy expenses applicable to leased premises. Certain leases provide for renewal for various periods at stipulated rates.
|
The minimum future rental commitments under operating and capital leases are as follows (In thousands):
|
||||
|
For the years ending January 31,
|
||||
|
2011
|
$ | 13,832 | ||
|
2012
|
11,276 | |||
|
2013
|
8,099 | |||
|
2014
|
4,054 | |||
|
2015
|
3,077 | |||
|
2016 and thereafter
|
2,900 | |||
|
Total minimum payments required
|
$ | 43,238 | ||
Rent expense for the years ended January 31, 2008, 2009 and 2010 was $18.5 million, $17.2 million and $16.3 million, respectively.
Pursuant to the employment agreement identified above, upon the death of both Mr. Goergen and his spouse, the Company will, upon the demand of the estate of either Mr. Goergen or his spouse, buy back from such estate up to 1,875,000 shares of Company Common Stock within 90 days of such demand at the fair market value thereof (as defined in the employment agreement) or register the public offer and sale by such estate of up to 1,875,000 shares of Common Stock. In connection with the employment agreement, the Company and Mr. Goergen entered into a registration rights agreement relating to the registration of up to 1,875,000 shares of Common Stock as described above in the event that the Company chooses not to purchase such shares upon the death of both Mr. Goergen and his spouse. There is no specified effective date or stock price requirement in the agreements and the Company’s only obligation is to use its best efforts to have the registration become effective. The Company will not be obligated to purchase or register such shares, notwithstanding the death of both Mr. Goergen and his spouse, if the survivor’s estate, or his or her beneficiaries, as the case may be, can then sell all of the shares of the common stock owned by them without registration. At January 31, 2010 the Company has recorded a liability of approximately $0.2 million related to the estimated future costs to register the securities.
The Company has contingent liabilities that have arisen in the ordinary course of its business, including pending litigation. The Company believes the outcome of these matters will not have a material adverse effect on its consolidated financial position, results of operations, or cash flows.
Note 16. Income Taxes
Earnings (loss) from operations before income taxes and minority interest:
|
2008
|
2009
|
2010
|
||||||||||
|
United States
|
$ | (40,159 | ) | $ | (81,843 | ) | $ | (43,387 | ) | |||
|
Foreign
|
61,884 | 70,318 | 65,461 | |||||||||
| $ | 21,725 | $ | (11,525 | ) | $ | 22,074 | ||||||
BLYTH, INC. AND SUBSIDIARIES
Notes to Consolidated Financial Statements
Note 16. Income Taxes (continued)
Income tax expense attributable to continuing operations consists of the following:
|
2008
|
2009
|
2010
|
||||||||||
|
Current income tax expense:
|
||||||||||||
|
Federal
|
$ | 211 | $ | (40 | ) | $ | (10,550 | ) | ||||
|
State
|
8,936 | 2,418 | 436 | |||||||||
|
Foreign
|
8,592 | 12,698 | 9,044 | |||||||||
| 17,739 | 15,076 | (1,070 | ) | |||||||||
|
Deferred income tax expense (benefit):
|
||||||||||||
|
Federal
|
(6,516 | ) | (10,277 | ) | 7,253 | |||||||
|
State
|
(673 | ) | (757 | ) | 64 | |||||||
|
Foreign
|
(3 | ) | (202 | ) | (598 | ) | ||||||
| (7,192 | ) | (11,236 | ) | 6,719 | ||||||||
| $ | 10,547 | $ | 3,840 | $ | 5,649 | |||||||
Significant components of the Company’s deferred tax assets and liabilities are as follows:
|
2009
|
2010
|
|||||||
|
Deferred tax assets:
|
||||||||
|
Amortization
|
$ | 20,865 | $ | 17,200 | ||||
|
Accrued expenses and other
|
1,520 | 7,983 | ||||||
|
Allowance for doubtful receivables
|
1,755 | 1,233 | ||||||
|
Employee benefit plans
|
3,564 | 3,093 | ||||||
|
Inventory reserves
|
4,911 | 3,788 | ||||||
|
Net operating loss and other tax credit carryforwards
|
25,461 | 25,071 | ||||||
|
Capital loss carryforward
|
12,345 | 11,104 | ||||||
|
Contingency reserves
|
7,592 | 4,063 | ||||||
|
Other reserves
|
2,998 | 2,122 | ||||||
|
Valuation allowance
|
(21,533 | ) | (21,036 | ) | ||||
| 59,478 | 54,621 | |||||||
|
Deferred tax liabilities:
|
||||||||
|
Prepaids
|
(8,310 | ) | (6,341 | ) | ||||
|
Undistributed foreign earnings
|
(19,689 | ) | (28,347 | ) | ||||
|
Depreciation and amortization
|
(12,497 | ) | (10,733 | ) | ||||
| (40,496 | ) | (45,421 | ) | |||||
|
Net deferred tax asset
|
$ | 18,982 | $ | 9,200 | ||||
BLYTH, INC. AND SUBSIDIARIES
Notes to Consolidated Financial Statements
Note 16. Income Taxes (continued)
The Company’s valuation allowance relates to certain U.S. and non-U.S. tax loss carryforwards, state deferred tax assets, and a U.S. capital loss carryforward, for which the Company believes, due to various limitations in these foreign jurisdictions related to the tax loss carryforwards and due to limitations imposed by U.S. federal and state tax regulations, it is more likely than not that such benefits will not be realized. As of January 31, 2010, the Company had net operating loss carryforwards, which consisted of approximately $6.4 million of U.S. federal net operating losses that will expire on January 31, 2023 and 2026, $59.8 million of U.S. state net operating losses that will begin to expire in 2013, and foreign net operating losses of $16.7 million, which will begin to expire in 2012. Also, as of January 31, 2010, the Company had a $29.8 million U.S. capital loss carryforward of which the majority will expire on January 31, 2012. Finally, the Company has state deferred tax assets of $1.1 million, that due to the fact that the businesses that these assets relate to have a history of net operating losses, it is more likely than not that a benefit for these assets will not be recognized.
As of January 31, 2010, the Company determined that $193.0 million of undistributed foreign earnings were not reinvested indefinitely by its non-U.S. subsidiaries. An accumulated deferred tax liability has been recorded against these undistributed earnings of $28.3 million, an increase of $8.6 million over the prior year. Of this amount, $6.8 million was recorded an expense to the Company’s Net earnings in the current period.
An $8.3 million charge was recorded for the increase in current period unremitted earnings of foreign subsidiaries not permanently reinvested, offset by a benefit of $1.5 million related to foreign exchange gains previously deferred in AOCI associated with a reduction of deferred tax liabilities in the current period for prior unremitted earnings not permanently reinvested, resulting in a net $6.8 million charge recorded to the Company’s Net earnings. The deferred tax liability was also increased by $0.3 million related to the foreign exchange losses recorded in AOCI for deferred tax liabilities for remaining prior unremitted earnings not permanently reinvested.
As of January 31, 2010, undistributed earnings of foreign subsidiaries considered permanently reinvested for which deferred income taxes have not been provided were approximately $89.4 million.
BLYTH, INC. AND SUBSIDIARIES
Notes to Consolidated Financial Statements
Note 16. Income Taxes (continued)
A reconciliation of the provision for income taxes to the amount computed at the federal statutory rate is as follows:
|
2008
|
2009
|
2010
|
||||||||||
|
Tax at statutory rate
|
$ | 7,387 | $ | (3,918 | ) | $ | 7,726 | |||||
|
Tax effect of:
|
||||||||||||
|
U.S. state income taxes, net of federal benefit
|
(1,567 | ) | (1,383 | ) | 348 | |||||||
|
Tax exempt interest
|
(1,677 | ) | (200 | ) | (23 | ) | ||||||
|
Permanent differences
|
17 | 283 | (217 | ) | ||||||||
|
Disallowed tax benefit on non-consolidated losses
|
- | - | 907 | |||||||||
|
Valuation allowance on deferred tax assets
|
1,935 | 801 | - | |||||||||
|
Release of valuation allowance on capital loss carryforward
|
(2,742 | ) | (931 | ) | (263 | ) | ||||||
|
Change in reserve for tax contingencies
|
5,781 | 3,384 | (8,745 | ) | ||||||||
|
Non-deductible goodwill impairment
|
10,625 | 6,448 | 4,617 | |||||||||
|
Foreign dividend and subpart F income
|
983 | 6,832 | 8,870 | |||||||||
|
Tax on undistributed foreign earnings
|
275 | 4,079 | 6,819 | |||||||||
|
Foreign tax rate differential
|
(11,932 | ) | (12,156 | ) | (14,470 | ) | ||||||
|
Other
|
1,462 | 601 | 83 | |||||||||
| $ | 10,547 | $ | 3,840 | $ | 5,652 | |||||||
The Company adopted the provisions for recognizing and measuring uncertain tax positions taken or expected to be taken in a tax return that affect amounts reported in the financial statements as required by ASC 740 on February 1, 2007. As a result of the implementation of this guidance, the Company recognized a $6.1 million increase in the liability for unrecognized tax benefits that may not be realized and an asset of $3.3 million. These amounts accounted for a net $2.8 million reduction to the Company’s February 1, 2007 Retained earnings balance. The following is a reconciliation of the total amounts of unrecognized tax benefits excluding interest and penalties during the year ended January 31, 2009:
|
(In thousands)
|
||||
|
Balance as of February 1, 2009
|
$ | 24,526 | ||
|
Gross increases – tax positions prior periods
|
556 | |||
|
Gross decreases – tax positions prior periods
|
(9,700 | ) | ||
|
Decreases – settlements with taxing authorities
|
(3,100 | ) | ||
|
Reductions - lapse of statute of limitations
|
(11 | ) | ||
|
Balance as of January 31, 2010
|
$ | 12,271 | ||
As of January 31, 2010, the Company had $12.3 million of gross unrecognized tax benefits, excluding interest and penalties. This amount represents the portion that, if recognized, would impact the effective tax rate. The Company recognizes interest and penalties related to unrecognized tax benefits in income tax expense. As of January 31, 2010, the Company had $6.6 million accrued for the payment of interest and penalties, which also impacted the tax rate.
BLYTH, INC. AND SUBSIDIARIES
Notes to Consolidated Financial Statements
Note 16. Income Taxes (continued)
The Company believes that it is reasonably possible that the total amount of unrecognized tax benefits as of January 31, 2010 that may be resolved within fiscal 2011 is approximately $0.2 million, as a result of filing amended tax returns, the lapse of statutes of limitations and audit settlements. Due to the various jurisdictions in which the Company files tax returns and the uncertainty regarding the timing of the settlement of tax audits, it is possible that there could be other significant changes in the amount of unrecognized tax benefits in fiscal 2011, but the amount cannot be estimated.
The Company files income tax returns in the U.S. federal jurisdiction, various state and local jurisdictions, and many foreign jurisdictions. The number of years with open tax audits varies depending on the tax jurisdiction. The Company’s major taxing jurisdictions include the United States (including the state jurisdictions of Connecticut, Illinois and Massachusetts), Canada, Germany and Switzerland. In the United States, the Company is currently open to examination by the Internal Revenue Service for fiscal 2009. The Company is currently under audit in a number of states for fiscal years 2002 through 2005 and is open to examination for fiscal years 2005 through 2009. The Company is currently under audit in Germany for fiscal years 2007 through 2009. Additionally, in Canada and Germany the Company is open to examination for fiscal years 2007 through 2009. In Switzerland, the Company is open to examination for fiscal 2009.
In August 2008, a state department of revenue proposed to assess additional corporate income taxes on the Company in the net amount of $34.9 million, which includes interest. In August 2008, the Company filed a protest of the assessment, which it intends to contest vigorously. During fiscal 2008, the Company established a reserve for this matter that it believes is adequate based on existing facts and circumstances. The ultimate resolution of this matter could exceed our recorded reserve in the event of an unfavorable outcome of this matter. It is reasonably possible that losses in excess of the Company’s recorded reserve could be incurred; however, the Company cannot estimate such a loss at this time.
BLYTH, INC. AND SUBSIDIARIES
Notes to Consolidated Financial Statements
Note 17. Stock-Based Compensation
Effective January 30, 2009, the Company’s common stock and related equity based instruments were subject to a 1-for-4 reverse stock split. All historical stock-based compensation disclosures have been adjusted accordingly.
Summary of Plans
As of January 31, 2010, the Company had one active stock-based compensation plan, the Amended and Restated 2003 Omnibus Incentive Plan (“2003 Plan”), available to grant future awards. In addition, the Company maintains two inactive stock-based compensation plans (the Amended and Restated 1994 Employee Stock Option Plan and the Amended and Restated 1994 Stock Option Plan for Non-Employee Directors), under which vested and unexercised options remain outstanding. There were 1,020,449 shares authorized for grant under these plans as of January 31, 2010, and there were approximately 840,000 shares available for grant under these plans. The Company’s policy is to issue new shares of common stock for all stock options exercised and restricted stock grants.
The Board of Directors and the stockholders of the Company have approved the adoption of and subsequent amendments to the 2003 Plan. The 2003 Plan provides for grants of incentive and nonqualified stock options, stock appreciation rights, restricted stock, restricted stock units, performance shares, performance units, dividend equivalents and other stock unit awards to officers and employees. The 2003 Plan also provides for grants of nonqualified stock options to directors of the Company who are not, and who have not been during the immediately preceding 12-month period, officers or employees of the Company or any of its subsidiaries. Restricted stock and restricted stock units (“RSUs”) are granted to certain employees to incent performance and retention. RSUs issued under the plans provide that shares awarded may not be sold or otherwise transferred until restrictions have lapsed. The release of RSUs on each of the vesting dates is contingent upon continued active employment by the employee until the vesting dates. A total of 83,089 RSUs have been granted during fiscal 2010.
In accordance with U.S. GAAP the Company measures and recognizes compensation expense for all share-based payment awards made to employees and directors, including employee stock options, restricted stock and RSUs based on estimated fair values.
Stock-based compensation expense recognized during the period is based on the value of the portion of stock-based payment awards that is ultimately expected to vest during the period. Stock-based compensation expense recognized in the Company’s Consolidated Statements of Earnings (Loss) for the fiscal years ended January 31, 2008, 2009 and 2010 includes compensation expense for restricted stock, RSUs and stock-based awards granted subsequent to January 31, 2006 based on the grant date fair value estimated in accordance with the provisions of ASC 718, “Compensation—Stock Compensation” (“ASC 718”). The Company recognizes these compensation costs for those awards expected to vest net of estimated forfeitures, on a straight-line basis over the requisite service period of the award, which is over periods of 2 to 5 years for employee restricted stock and RSUs; and 1 to 2 years for non-employee restricted stock and RSUs. Forfeitures are estimated at the time of grant and revised, if necessary, in subsequent periods if actual forfeitures differ from those estimates.
BLYTH, INC. AND SUBSIDIARIES
Notes to Consolidated Financial Statements
Note 17. Stock-Based Compensation (continued)
Transactions related to restricted stock and RSUs are summarized as follows:
|
Shares
|
Weighted Average Grant Date Fair Value
|
Aggregate Intrinsic Value (In thousands)
|
||||||||||
|
Nonvested restricted stock and RSUs at January 31, 2009
|
75,119 | $ | 89.51 | |||||||||
|
Granted
|
83,089 | 32.64 | ||||||||||
|
Vested
|
(48,653 | ) | 88.14 | |||||||||
|
Forfeited
|
(8,317 | ) | 67.47 | |||||||||
|
Nonvested restricted stock and RSUs at January 31, 2010
|
101,238 | $ | 45.31 | $ | 2,844 | |||||||
|
Total restricted stock and RSUs at January 31, 2010
|
132,987 | $ | 57.01 | $ | 3,736 | |||||||
Compensation expense related to restricted stock and RSUs for fiscal 2008, 2009 and 2010 was approximately $1.4 million, $1.8 million and $2.7 million, respectively. The total intrinsic value of restricted stock and RSUs vested during fiscal 2009 and 2010 was $0.2 million and $0.9 million, respectively. The weighted average grant date fair value of restricted stock and RSUs granted during fiscal 2008, 2009 and 2010 was approximately $105, $80 and $33 per share, respectively. The average grant date fair value of restricted stock and RSUs vested during fiscal 2008, 2009 and 2010 was approximately $104, $105 and $88 per share, respectively.
As of January 31, 2010, there was $1.6 million of unearned compensation expense related to non-vested RSU awards. The total unrecognized stock-based compensation cost to be recognized in future periods as of January 31, 2010 does not consider the effect of stock-based awards that may be issued in subsequent periods. This cost is expected to be recognized over a weighted average period of 1.5 years.
Transactions involving stock options are summarized as follows:
|
Option Shares
|
Weighted Average Exercise Price
|
Weighted Average Remaining Contractual Life
|
Aggregate Intrinsic Value
|
|||||||||||||
|
Outstanding at January 31, 2009
|
79,425 | $ | 107.10 | 3.30 | ||||||||||||
|
Options expired
|
(17,300 | ) | 104.99 | |||||||||||||
|
Outstanding and exercisable at January 31, 2010
|
62,125 | $ | 107.68 | 2.42 | $ | - | ||||||||||
At January 31, 2009 and 2010, options to purchase 79,425 and 62,125 shares, respectively, were vested and exercisable.
The aggregate intrinsic value in the table above represents the difference between the Company’s closing stock price on the last trading day of fiscal 2010 and the exercise price, multiplied by the number of in-the-money options that would have been received by the option holders had all option holders exercised their options on January 31, 2010. Intrinsic value will change in future periods based on the fair market value of the Company’s stock and the number of shares outstanding. The total intrinsic value of stock options exercised during fiscal 2008 was approximately $0.6 million. There were no exercises during fiscal 2009 and 2010.
BLYTH, INC. AND SUBSIDIARIES
Notes to Consolidated Financial Statements
Note 17. Stock-Based Compensation (continued)
The Company used the Black-Scholes option-pricing model to determine fair value for stock option grants. The Company’s determination of fair value of stock-based payment awards on the date of grant using an option-pricing model is affected by the Company’s stock price as well as assumptions regarding a number of highly complex and subjective variables. These variables include, but are not limited to, the Company’s expected stock price volatility over the term of the awards, and actual and projected employee stock option exercise behaviors.
Note 18. Segment Information
The Company’s financial results are reported in three segments - the Direct Selling segment, the Catalog & Internet segment and the Wholesale segment. These reportable segments are based on similarities in distribution channels, customers and management oversight.
Within the Direct Selling segment, the Company designs, manufactures or sources, markets and distributes an extensive line of products including scented candles, candle-related accessories and other fragranced products under the PartyLite® brand. PartyLite also offers gourmet foods under the Two Sisters Gourmetâ by PartyLiteâ brand name. The Company also operates ViSalus Sciences®, a Direct Selling business, which is focused on selling nutritional supplements and weight management products. Products in this segment are sold in North America through networks of independent sales consultants. PartyLite brand products are also sold in Europe and Australia.
Within the Catalog & Internet segment, the Company designs, sources and markets a broad range of household convenience items, premium photo albums, frames, holiday cards, personalized gifts, kitchen accessories and gourmet coffee and tea. These products are sold directly to the consumer under the As We Change ®, Boca Java®, Easy Comforts®, Exposures®, Home Marketplace®, Miles Kimball® and Walter Drake® brands. These products are sold in North America.
Within the Wholesale segment, the Company designs, manufactures or sources, markets and distributes an extensive line of home fragrance products, candle-related accessories, seasonal decorations such as ornaments and trim, and home décor products such as picture frames, lamps and textiles. Products in this segment are sold primarily in North America to retailers in the premium, specialty and mass channels under the CBK®, Colonial Candle of Cape Cod®, Colonial at HOME® and Seasons of Cannon Falls® brands. In addition, chafing fuel and tabletop lighting products and accessories for the “away from home” or foodservice trade are sold through this segment under the Ambria®, HandyFuel® and Sterno® brands.
Operating profit in all segments represent net sales less operating expenses directly related to the business segments and corporate expenses allocated to the business segments. Other income (expense) includes interest expense, interest income and equity in earnings of investees, which are not allocated to the business segments. Identifiable assets for each segment consist of assets used directly in its operations and intangible assets, if any, resulting from the purchase of businesses. Unallocated Corporate within the identifiable assets include corporate cash and cash equivalents, short-term investments, prepaid income tax, corporate fixed assets, deferred bond costs, deferred income taxes and other long-term investments and assets, which are not allocated to the business segments.
BLYTH, INC. AND SUBSIDIARIES
Notes to Consolidated Financial Statements
Note 18. Segment Information (continued)
The geographic area data includes net trade sales based on product shipment destination and long-lived assets (which consist of fixed assets and other long-term assets) based on physical location.
Operating Segment Information
|
Financial Information
|
2008
|
2009
|
2010
|
|||||||||
|
Net Sales
|
||||||||||||
|
Direct Selling
|
$ | 686,800 | $ | 664,489 | $ | 635,194 | ||||||
|
Multi-channel Group:
|
||||||||||||
|
Catalog & Internet
|
206,767 | 190,059 | 166,044 | |||||||||
|
Wholesale
|
271,383 | 196,245 | 156,839 | |||||||||
|
Subtotal Multi-channel Group
|
478,150 | 386,304 | 322,883 | |||||||||
|
Total
|
$ | 1,164,950 | $ | 1,050,793 | $ | 958,077 | ||||||
|
Earnings (1)
|
||||||||||||
|
Direct Selling
|
$ | 98,749 | $ | 74,381 | $ | 43,778 | ||||||
|
Multi-channel Group:
|
||||||||||||
|
Catalog & Internet
|
(48,904 | ) | (59,118 | ) | (4,781 | ) | ||||||
|
Wholesale
|
(18,958 | ) | (11,235 | ) | (9,014 | ) | ||||||
|
Subtotal Multi-channel Group
|
(67,862 | ) | (70,353 | ) | (13,795 | ) | ||||||
|
Operating profit
|
30,887 | 4,028 | 29,983 | |||||||||
|
Other income (expense)
|
(9,162 | ) | (15,553 | ) | (7,909 | ) | ||||||
|
Earnings before income taxes and minority interest
|
$ | 21,725 | $ | (11,525 | ) | $ | 22,074 | |||||
|
Identifiable Assets
|
||||||||||||
|
Direct Selling
|
$ | 306,484 | $ | 317,868 | $ | 205,615 | ||||||
|
Multi-channel Group:
|
||||||||||||
|
Catalog & Internet
|
103,677 | 66,341 | 58,040 | |||||||||
|
Wholesale
|
146,612 | 103,163 | 81,928 | |||||||||
|
Subtotal Multi-channel Group
|
250,289 | 169,504 | 139,968 | |||||||||
|
Unallocated Corporate
|
110,649 | 86,731 | 177,410 | |||||||||
|
Total
|
$ | 667,422 | $ | 574,103 | $ | 522,993 | ||||||
|
Capital Expenditures (2)
|
||||||||||||
|
Direct Selling
|
$ | 4,491 | $ | 3,287 | $ | 3,999 | ||||||
|
Multi-channel Group:
|
||||||||||||
|
Catalog & Internet
|
3,842 | 1,624 | 305 | |||||||||
|
Wholesale
|
2,092 | 2,876 | 1,062 | |||||||||
|
Subtotal Multi-channel Group
|
5,934 | 4,500 | 1,367 | |||||||||
|
Unallocated Corporate
|
(1,004 | ) | 386 | 18 | ||||||||
|
Total
|
$ | 9,421 | $ | 8,173 | $ | 5,384 | ||||||
|
Depreciation and Amortization
|
||||||||||||
|
Direct Selling
|
$ | 11,270 | $ | 9,961 | $ | 9,263 | ||||||
|
Multi-channel Group:
|
||||||||||||
|
Catalog & Internet
|
3,911 | 4,232 | 4,019 | |||||||||
|
Wholesale
|
16,001 | 3,875 | 2,921 | |||||||||
|
Subtotal Multi-channel Group
|
19,912 | 8,107 | 6,940 | |||||||||
|
Unallocated Corporate
|
792 | 560 | 389 | |||||||||
|
Total
|
$ | 31,974 | $ | 18,628 | $ | 16,592 | ||||||
|
GEOGRAPHIC INFORMATION
|
||||||||||||
|
Net Sales
|
||||||||||||
|
United States
|
$ | 775,789 | $ | 624,956 | $ | 528,474 | ||||||
|
International
|
389,161 | 425,837 | 429,603 | |||||||||
|
Total
|
$ | 1,164,950 | $ | 1,050,793 | $ | 958,077 | ||||||
|
Long Lived Assets (3)
|
||||||||||||
|
United States
|
$ | 162,319 | $ | 84,328 | $ | 72,852 | ||||||
|
International
|
43,370 | 36,026 | 35,135 | |||||||||
|
Total
|
$ | 205,689 | $ | 120,354 | $ | 107,987 | ||||||
|
(1)
|
Fiscal 2008 and 2009 earnings within the Catalog & Internet segment include non-cash pre-tax goodwill and other intangibles impairment charges of $49.2 million and $48.8 million, respectively. Fiscal 2010 earnings include non-cash pre-tax goodwill and other intangibles impairment charges of $16.5 million within the Direct Selling segment (See Note 10 to the Consolidated Financial Statements).
|
|
(2)
|
Capital Expenditures are presented net of disposals and transfers. The unallocated corporate balance is net of transfers to other divisions.
|
|
(3)
|
$25.9 million of the International Long lived assets as of January 31, 2010 were in the Netherlands.
|
BLYTH, INC. AND SUBSIDIARIES
Notes to Consolidated Financial Statements
Note 19. Earnings Per Share
Effective January 30, 2009, the Company’s common stock and related equity-based instruments were adjusted in a 1-for-4 reverse stock split. In accordance with ASC 260, “Earnings per Share” (“ASC 260”) all historical earnings per share amounts have been adjusted accordingly.
Vested restricted stock units issued under the Company’s stock-based compensation plans participate in a cash equivalent of the dividends paid to common shareholders and are not considered contingently issuable shares. Accordingly these RSUs are included in the calculation of basic and diluted earnings per share as common stock equivalents. RSUs that have not vested and are subject to a risk of forfeiture are included in the calculation of diluted earnings per share.
The components of basic and diluted earnings per share are as follows:
|
Year ended January 31, (In thousands)
|
2008
|
2009
|
2010
|
|||||||||
|
Net earnings (loss) attributable to Blyth, Inc.
|
$ | 11,072 | $ | (15,480 | ) | $ | 17,694 | |||||
|
Weighted average number outstanding:
|
||||||||||||
|
Common shares
|
9,648 | 8,961 | 8,889 | |||||||||
|
Vested restricted stock units
|
- | 10 | 23 | |||||||||
|
Weighted average number of common shares outstanding:
|
||||||||||||
|
Basic
|
9,648 | 8,971 | 8,912 | |||||||||
|
Dilutive effect of stock options and non-vested restricted shares units
|
84 | - | 22 | |||||||||
|
Weighted average number of common shares outstanding:
|
||||||||||||
|
Diluted
|
9,732 | 8,971 | 8,934 | |||||||||
|
Basic net earnings (loss) attributable per common share
|
$ | 1.15 | $ | (1.73 | ) | $ | 1.99 | |||||
|
Diluted net earnings (loss) attributable per common share
|
$ | 1.14 | $ | (1.73 | ) | $ | 1.98 | |||||
As of January 31, 2008, 2009 and 2010, options to purchase 108,100, 79,425 and 62,125 shares of common stock, respectively, are not included in the computation of diluted earnings per share because the effect would be antidilutive.
In accordance with ASC 260, diluted earnings per share for the year ended January 31, 2009 have been computed in the same manner as basic earnings per share due to the net loss from operations.
Note 20. Treasury and Common Stock
|
Treasury Stock
|
||||||||
|
(In thousands, except shares)
|
Shares
|
Amount
|
||||||
|
Balance at January 31, 2007
|
2,833,950 | $ | (323,714 | ) | ||||
|
Treasury stock purchases
|
805,388 | (64,171 | ) | |||||
|
Balance at January 31, 2008
|
3,639,338 | (387,885 | ) | |||||
|
Treasury stock purchases
|
202,886 | (11,093 | ) | |||||
|
Balance at January 31, 2009
|
3,842,224 | $ | (398,978 | ) | ||||
|
Treasury stock purchases
|
120,000 | (3,981 | ) | |||||
|
Treasury stock withheld in connection with long-term incentive plan
|
9,888 | $ | (370 | ) | ||||
|
Balance at January 31, 2010
|
3,972,112 | $ | (403,329 | ) | ||||
BLYTH, INC. AND SUBSIDIARIES
Notes to Consolidated Financial Statements
Note 20. Treasury and Common Stock (continued)
|
Common Stock
|
||||||||
|
(In thousands, except shares)
|
Shares
|
Amount
|
||||||
|
Changes in Common Stock were:
|
|
|
||||||
|
Balance at January 31, 2007
|
12,659,265 | $ | 253 | |||||
|
Common stock issued in connection with long-term incentive plan
|
72,350 | 1 | ||||||
|
Common stock cancelled in connection with long-term incentive plan
|
(1,000 | ) | - | |||||
|
Balance at January 31, 2008
|
12,730,615 | $ | 254 | |||||
|
Common stock issued in connection with long-term incentive plan
|
2,594 | 1 | ||||||
|
Balance at January 31, 2009
|
12,733,209 | $ | 255 | |||||
|
Common stock issued in connection with long-term incentive plan
|
32,710 | - | ||||||
|
Balance at January 31, 2010
|
12,765,919 | $ | 255 | |||||
Stock Repurchase Plan
During the year ended January 31, 2010, the Company has purchased 120,000 shares on the open market, for a cost of $4.0 million, bringing the cumulative total purchased shares to 2,735,570 and a total cost of approximately $228.8 million. A total of 1,764,430 shares remain authorized for purchase under the existing plan. Additionally in fiscal 2005, 1,226,654 shares were repurchased through a Dutch auction cash tender offer for an aggregate purchase price of $172.6 million, including fees and expenses. The acquired shares are held as common stock in treasury at cost.
Note 21. Selected Quarterly Financial Data (Unaudited)
A summary of selected quarterly information for the years ended January 31 is as follows:
|
2009 Quarter Ended
|
||||||||||||||||||
|
(In thousands, except per share data)
|
||||||||||||||||||
|
April 30
|
July 31
|
October 31
|
January 31
|
|||||||||||||||
|
Net sales
|
$ | 249,848 | $ | 236,786 | $ | 250,805 | $ | 313,354 | ||||||||||
|
Gross profit
|
139,431 | 128,007 | 132,250 | 177,528 | ||||||||||||||
|
Operating profit (loss)
|
9,961 | 8,063 | (39,410 | ) | 25,414 | |||||||||||||
|
Net earnings (loss)
|
1,189 | 3,034 | (32,882 | ) | (2 | ) | 13,294 | (2 | ) | |||||||||
|
Net earnings (loss) attributable to Blyth, Inc.
|
1,160 | 3,005 | (32,912 | ) | 13,267 | |||||||||||||
|
Basic
|
||||||||||||||||||
|
Net earnings (loss) per common share (1)
|
$ | 0.13 | $ | 0.33 | $ | (3.70 | ) | $ | 1.49 | |||||||||
|
Diluted
|
||||||||||||||||||
|
Net earnings (loss) per common share (1)
|
$ | 0.13 | $ | 0.33 | $ | (3.70 | ) | $ | 1.49 | |||||||||
|
2010 Quarter Ended
|
|||||||||||||||||
|
(In thousands, except per share data)
|
|||||||||||||||||
|
April 30
|
July 31
|
October 31
|
January 31
|
||||||||||||||
|
Net sales
|
$ | 214,724 | $ | 199,354 | $ | 221,578 | $ | 322,421 | |||||||||
|
Gross profit
|
117,802 | 105,919 | 115,033 | 186,745 | |||||||||||||
|
Operating profit (loss)
|
5,786 | (14,647 | ) | 2,985 | 35,859 | ||||||||||||
|
Net earnings (loss)
|
2,424 | (15,830 | ) | (3 | ) | (1,439 | ) | 31,270 | |||||||||
|
Net earnings (loss) attributable to Blyth, Inc.
|
2,435 | (15,562 | ) | (970 | ) | 31,791 | |||||||||||
|
Basic
|
|||||||||||||||||
|
Net earnings (loss) per common share (1)
|
$ | 0.27 | $ | (1.74 | ) | $ | (0.11 | ) | $ | 3.58 | |||||||
|
Diluted
|
|||||||||||||||||
|
Net earnings (loss) per common share (1)
|
$ | 0.27 | $ | (1.74 | ) | $ | (0.11 | ) | $ | 3.57 | |||||||
|
(1) The sum of per share amounts for the quarters does not necessarily equal that reported for the year because the computations are made independently.
|
|||||||||||||||||
|
(2) Third quarter, fiscal 2009 net loss, includes a goodwill and other intangible asset impairment charge of $45.9 million and the fourth quarter, fiscal 2009 net earnings,
|
|||||||||||||||||
|
includes an other intangible asset impairment charge of $2.9 million with in the Catalog & Internet segment (See Note 10 to the Consolidated Financial Statements).
|
|||||||||||||||||
|
Fourth quarter fiscal 2009 Net earnings reflect a benefit of $2.7 million resulting from a deferred tax adjustment related to the third quarter of fiscal 2009.
|
|||||||||||||||||
|
(3) Second quarter, fiscal 2010 net loss, includes a goodwill and other intangible asset impairment charge of $16.5 million.
|
|||||||||||||||||
BLYTH, INC. AND SUBSIDIARIES
Notes to Consolidated Financial Statements
Note 22. Related Party Transactions
As discussed in Note 3 to the Consolidated Financial Statements, the acquisition of ViSalus by Blyth in October 2008 involved related parties. ViSalus is currently owned in part by RAM, which owns a significant noncontrolling interest in ViSalus. Robert B. Goergen, Chairman of the Board and Chief Executive Officer of the Company; Robert B. Goergen, Jr., Vice President of the Company and President of the Multi-Channel Group; and Todd A. Goergen, son of Robert B. Goergen and Pamela Goergen (who is also a director of the Company), and brother of Robert B. Goergen, Jr., own, directly or indirectly, substantially all of the interests in RAM.. Todd A. Goergen was a member of the Board of Managers of ViSalus at the time of acquisition. Mr. Goergen, the Company’s chairman and chief executive officer, beneficially owns approximately 31% of the Company’s outstanding common stock, and together with members of his family, owns substantially all of RAM. As of the end of fiscal 2010 ViSalus had a $ 0.7 million notes payable due to RAM and $2.0 million, to the founders.
On February 1, 2010, ViSalus received a financing commitment from the founders and RAM for up to $1.2 million to fund its operations for calendar year 2010, $0.9 million of which has been borrowed as of March 31, 2010. The loan is due February 28, 2011 and interest accrues at 10% per annum payable quarterly in arrears. In addition to the 10% interest, the loan requires ViSalus to pay a further lump-sum interest payment at loan maturity at an interest cost ranging from $0.6 million to $2.4 million. The amount of actual lump-sum interest payments depends on whether and when the Company lends $0.3 million to ViSalus, which ViSalus will use to repay a similar amount to the founders and RAM. The Company has no obligation to do so. If the Company lends $0.3 million to ViSalus prior to April 30, 2010, ViSalus’ interest cost to the founders and RAM would be 10% per annum plus $0.6 million. If the Company lends $0.3 million to ViSalus thereafter, and assuming that the founders and RAM do not make additional loans to ViSalus, ViSalus’ interest cost to the founders and RAM would be 10% per annum plus an amount ranging from $0.9 million to $1.2 million. If the Company chooses not to lend $0.3 million to ViSalus, ViSalus’ interest cost to the founders and RAM would be 10% per annum plus up to an additional $2.4 million. The additional lump-sum interest payments beyond the fixed interest rate of 10% per annum also depend upon ViSalus meeting certain operating conditions. The loan is secured by ViSalus’ assets and has preference over existing loans from the founders, RAM and the Company.
As discussed in Note 6 to the Consolidated Financial Statements, the investment in the LLC, involves related parties. RAM holds an approximately 16% interest in the LLC. In addition to this interest they also have significant influence on the management of the LLC and representation on its board of managers.
|
Changes in and Disagreements with Accountants on Accounting and Financial Disclosure
|
None.
Item 9A. Controls and Procedures
(a) Evaluation of Disclosure Controls and Procedures
We conducted an evaluation, under the supervision and with the participation of management, including the Chief Executive Officer and Chief Financial Officer, of the effectiveness of the design and operation of our disclosure controls and procedures (as such term is defined in Rules 13a−15(e) and 15d−15(e) under the Securities Exchange Act of 1934, as amended (the “Exchange Act”)) as of January 31, 2010. Based on that evaluation, the Chief Executive Officer and Chief Financial Officer concluded that the Company’s disclosure controls and procedures were effective as of January 31, 2010.
(b) Management’s Assessment of Internal Control over Financial Reporting
Management is responsible for establishing and maintaining adequate internal control over financial reporting as defined in Rules 13a−15(f) and 15d−15(f) under the Exchange Act. Our internal control system over financial reporting is designed to provide reasonable assurance regarding the reliability of financial reporting and the preparation of financial statements for external purposes in accordance with generally accepted accounting principles. Because of inherent limitations, internal control over financial reporting may not prevent or detect misstatements. Also, projections of any evaluation of effectiveness to future periods are subject to the risk that controls may become inadequate because of changes in conditions, or that the degree of compliance with the policies or procedures may deteriorate.
Management has assessed the effectiveness of our internal control over financial reporting as of January 31, 2010. In making this assessment, management used the criteria established in Internal Control - Integrated Framework issued by the Committee of Sponsoring Organizations of the Treadway Commission (COSO). The objective of this assessment is to determine whether our internal control over financial reporting was effective, including the remediation of a material weakness identified during the prior year, as of January 31, 2010 A material weakness is a deficiency, or a combination of deficiencies, in internal control over financial reporting, such that there is a reasonable possibility that a material misstatement of the Company’s annual or interim financial statements will not be prevented or detected on a timely basis. Based on our assessment utilizing the criteria issued by COSO, management has concluded that our internal control over financial reporting was effective as of January 31, 2010.
Our independent registered public accounting firm has issued an attestation report on our internal control over financial reporting. The report appears herein below.
(c) Changes in Internal Control Over Financial Reporting
Other than the actions taken to remediate the material weakness noted below, there was no change in our internal control over financial reporting during our last fiscal year that has materially affected, or is reasonably likely to materially affect, our internal control over financial reporting.
During fiscal 2010, we implemented the following plan to remediate the material weakness related to financial reporting of income taxes identified as of January 31, 2009:
|
·
|
Allocated sufficient resources, including hiring a number of new personnel to assist in the preparation and review of the tax provision, which includes review of the deferred tax accounts;
|
|
·
|
Improved documentation and analysis and established a formalized review of the tax provision and deferred tax balances with senior management, financial reporting personnel and external advisors to ensure an appropriate level of review, analysis and accounting treatment of all tax balances;
|
|
·
|
When necessary supplemented our internal resources with external advisors; and
|
|
·
|
Implemented tax accounting software to enable the accounting related to the tax provision process to be more efficient and thereby allow more time for review and analysis.
|
Report of Independent Registered Public Accounting Firm
The Board of Directors and Stockholders of Blyth, Inc.
We have audited Blyth, Inc., and Subsidiaries’ (the “Company”) internal control over financial reporting as of January 31, 2010, based on criteria established in Internal Control—Integrated Framework issued by the Committee of Sponsoring Organizations of the Treadway Commission (the COSO criteria). The Company’s management is responsible for maintaining effective internal control over financial reporting, and for its assessment of the effectiveness of internal control over financial reporting included in the accompanying Management’s Assessment of Internal Control over Financial Reporting. Our responsibility is to express an opinion on the Company’s internal control over financial reporting based on our audit.
We conducted our audit in accordance with the standards of the Public Company Accounting Oversight Board (United States). Those standards require that we plan and perform the audit to obtain reasonable assurance about whether effective internal control over financial reporting was maintained in all material respects. Our audit included obtaining an understanding of internal control over financial reporting, assessing the risk that a material weakness exists, testing and evaluating the design and operating effectiveness of internal control based on the assessed risk, and performing such other procedures as we considered necessary in the circumstances. We believe that our audit provides a reasonable basis for our opinion.
A company’s internal control over financial reporting is a process designed to provide reasonable assurance regarding the reliability of financial reporting and the preparation of financial statements for external purposes in accordance with generally accepted accounting principles. A company’s internal control over financial reporting includes those policies and procedures that (1) pertain to the maintenance of records that, in reasonable detail, accurately and fairly reflect the transactions and dispositions of the assets of the company; (2) provide reasonable assurance that transactions are recorded as necessary to permit preparation of financial statements in accordance with generally accepted accounting principles, and that receipts and expenditures of the company are being made only in accordance with authorizations of management and directors of the company; and (3) provide reasonable assurance regarding prevention or timely detection of unauthorized acquisition, use, or disposition of the company’s assets that could have a material effect on the financial statements.
Because of its inherent limitations, internal control over financial reporting may not prevent or detect misstatements. Also, projections of any evaluation of effectiveness to future periods are subject to the risk that controls may become inadequate because of changes in conditions, or that the degree of compliance with the policies or procedures may deteriorate.
In our opinion, the Company maintained, in all material respects, effective internal control over financial reporting as of January 31, 2010, based on the COSO criteria.
We also have audited, in accordance with the standards of the Public Company Accounting Oversight Board (United States), the consolidated balance sheet of the Company as of January 31, 2010, and the related consolidated statements of earnings (loss), stockholders' equity, and cash flows for the year then ended and our report dated April 9, 2010 expressed an unqualified opinion thereon.
/S/ ERNST & YOUNG LLP
Stamford, Connecticut
April 9, 2010
Item 9B. Other Information
None.
Item 10. Directors, Executive Officers and Corporate Governance
The information required by this Item will be set forth in our Proxy Statement for our annual meeting of stockholders scheduled to be held on June 10, 2010 (the “Proxy Statement”) under the captions “Nominees for Election at the 2010 Annual Meeting for Terms Expiring in 2013,” “Continuing Directors with Terms Expiring in 2011,” “Continuing Directors with Terms Expiring in 2012,” “Executive Officers,” “Section 16(a) Beneficial Ownership Reporting Compliance,” “Code of Conduct” and “Board of Director and Committee Meetings” and is incorporated herein by reference.
Item 11. Executive Compensation
The information required by this Item will be set forth in our Proxy Statement under the captions “Executive Compensation,” “Employment Contracts and Severance Arrangements,” “Compensation Committee Report” and “Compensation Committee Interlocks and Insider Participation” and is incorporated herein by reference.
|
Item 12. Security Ownership of Certain Beneficial Owners and Management and Related Stockholder Matters
|
The information required by this Item is set forth in Item 5 above and will also be forth in our Proxy Statement under the caption “Security Ownership of Management and Certain Beneficial Owners” and is incorporated herein by reference.
|
Item 13. Certain Relationships and Related Transactions, and Director Independence
|
The information required by this Item will be set forth in our Proxy Statement under the captions “Director Independence” and “Certain Relationships and Related Transactions” and is incorporated herein by reference.
Item 14. Principal Accountant Fees and Services
The information required by this Item will be set forth in our Proxy Statement under the caption “Independent Auditor Fees” and is incorporated herein by reference.
Item 15. Exhibits, Financial Statement Schedules
(a)(1). Financial Statements
The following consolidated financial statements are contained on the indicated pages of this report:
|
Page No.
|
||||
|
Reports of Independent Registered Public Accounting Firm
|
42 | |||
|
Statements:
|
||||
|
Consolidated Balance Sheets
|
44 | |||
|
Consolidated Statements of Earnings (Loss)
|
45 | |||
|
Consolidated Statements of Stockholders’ Equity
|
46 | |||
|
Consolidated Statements of Cash Flows
|
47 | |||
|
Notes to Consolidated Financial Statements
|
48 | |||
(a)(2). Financial Statement Schedules
The following financial statement schedule is contained on the indicated page of this report:
Page No.
Valuation and Qualifying Accounts S-2
All other schedules are omitted because they are inapplicable or the requested information is shown in the consolidated financial statements or related notes.
(a)(3). Exhibits
|
Exhibit No.
|
Description of Exhibit
|
|
2.1
|
Membership Interest Purchase Agreement, dated as of August 4, 2008, among Blyth, Inc., Blyth VSH Acquisition Corporation, ViSalus Holdings, LLC and the members of ViSalus Holdings, LLC (incorporated by reference to Exhibit 2.1 to the Registrant’s Current Report on Form 8-K filed on August 5, 2008)
|
|
3.1
|
Restated Certificate of Incorporation (incorporated by reference to the Registrant’s Registration Statement on Form S-1 (No. 33-77458))
|
|
3.2
|
Restated By-laws (incorporated by reference to the Registrant’s Registration Statement on Form S-1 (No. 33-77458))
|
| 3.3 | Certificate of Amendment to the Restated Certificate of Incorporation (incorporated by reference to Exhibit 3.3 the Registrant’s Current Report on Form 8-K filed on January 30, 2009) |
|
4.1(a)
|
Form of Indenture, dated as of May 20, 1999, between the Registrant and First
|
|
|
Union National Bank, as Trustee (incorporated by reference to the Registrant’s Registration Statement on Form S-3 (Reg. No. 333-77721) filed on May 4, 1999)
|
|
|
|
|
4.1(b)
|
Form of Second Supplemental Indenture dated as of October 23, 2003 between the Registrant and Wachovia Bank, National Association, Trustee (incorporated by reference to Exhibit 4.1 to the Registrant’s Current Report on Form 8-K filed on October 22, 2003)
|
|
10.1
|
Standard Form Industrial Lease dated April 22, 1993, between Carol Point Builders I General Partnership and PartyLite Gifts, Inc. (incorporated by reference to the Registrant’s Registration Statement on Form S-1 (No. 33-77458))
|
|
10.1(a)
|
First Amendment, dated August 21, 1995, between ERI-CP, Inc., a Delaware corporation, as successor to Carol Point Builders I General Partnership, and PartyLite Gifts, Inc., to Standard Form Industrial Lease dated April 22, 1993, between Carol Point Builders I General Partnership and PartyLite Gifts, Inc. (incorporated by reference to Exhibit 10.4(a) to the Registrant’s Annual Report on Form 10-K for the fiscal year ended January 31, 1996)
|
|
10.1(b)
|
Second Amendment, dated August 4, 2000, between Carol Point LLC, a Massachusetts limited liability company, as successor landlord to ERI-CP Inc., and PartyLite Gifts, Inc., to Standard Form Industrial Lease dated April 22, 1993, between Carol Point Builders I General Partnership and PartyLite Gifts, Inc. (incorporated by reference to Exhibit 10.4(a) to the Registrant’s Annual Report on Form 10-K for the fiscal year ended January 31, 1996) (incorporated by reference to Exhibit 10.3(b) to the Registrant’s Annual Report on Form 10-K for the fiscal year ended January 31, 2002)
|
|
10.1(c)
|
Third Amendment, dated February 28, 2001, between Carol Point LLC, a Massachusetts limited liability company, as successor landlord to ERI-CP Inc., and PartyLite Worldwide, Inc., as tenant, pursuant to Assignment and Assumption Agreement, dated January 31, 2001, between PartyLite Gifts, Inc. (assignor) and PartyLite Worldwide, Inc. (assignee), to Standard Form Industrial Lease dated April 22, 1993, between Carol Point Builders I General Partnership and PartyLite Gifts, Inc. (incorporated by reference to Exhibit 10.4(a) to the Registrant’s Annual Report on Form 10-K for the fiscal year ended January 31, 1996) (incorporated by reference to Exhibit 10.3(c) to the Registrant’s Annual Report on Form 10-K for the fiscal year ended January 31, 2002)
|
| 10.2 | Lease Agreement, dated June 25, 1997, between Carol Stream I Development Company, as landlord, PartyLite Gifts, Inc., as tenant, and the Registrant, as guarantor (incorporated by reference to Exhibit 10.5 to the Registrant’s Annual Report on Form 10-K for the fiscal year ended January 31, 1998) |
|
10.2(a)
|
First Amendment to Lease, dated February 1, 2001, between MP 437 Tower CS, Inc. by RREEF Management Company, as landlord, as successor to Carol Stream I Development Company, and PartyLite Worldwide, Inc., as tenant, pursuant to Assignment and Assumption Agreement, dated January 31, 2001, between PartyLite Gifts, Inc. (assignor) and PartyLite Worldwide, Inc. (assignee) (incorporated by reference to Exhibit 10.4(a) to the Registrant’s Annual Report on Form 10-K for the fiscal year ended January 31, 2002)
|
|
10.3+
|
Form of Indemnity Agreement between the Registrant and each of its directors (incorporated by reference to the Registrant’s Registration Statement on Form S-1 (No. 33-77458))
|
|
10.4+
|
Blyth Industries, Inc. Non-Qualified Deferred Compensation Plan (incorporated by reference to Exhibit 4.1 to the Registrant’s Current Report on Form 8-K as filed on December 21, 1999)
|
|
10.5+
|
Amended and Restated Employment Agreement dated as of December 11, 2008 by and between the Registrant and Robert B. Goergen (incorporated by reference to Exhibit 10.1 to the Registrant’s Current Report on Form 8-K as filed on December 12, 2008)
|
|
10.6+
|
Registration Rights Agreement dated as of August 1, 2000 by and between the Registrant and Robert B. Goergen (incorporated by reference to Exhibit 10.10 to the Registrant’s Quarterly Report on Form 10-Q for the fiscal quarter ended October 31, 2000)
|
|
10.6(a)+
|
Amendment No. 1 dated as of March 12, 2004 to the Registration Rights Agreement dated as of August 1, 2000 by and between the Registrant and Robert B. Goergen (incorporated by reference to Exhibit 10.7(a) to the Registrant’s Annual Report on Form 10-K for the fiscal year ended January 31, 2004)
|
|
10.7+
|
Amended and Restated 1994 Employee Stock Option Plan of the Registrant (incorporated by reference to Exhibit 4.1 to the Registrant’s Current Report on Form 8-K filed April 17, 2000)
|
|
10.7(a)+
|
Amendment No. 1 to the Amended and Restated 1994 Employee Stock Option Plan of the Registrant (incorporated by reference to Exhibit 10.9(a) to the Registrant’s Annual Report on Form 10-K for the fiscal year ended January 31, 2004)
|
|
10.8+
|
Form of Non-transferable Incentive Stock Option Agreement under the Amended and Restated 1994 Employee Stock Option Plan of the Registrant (incorporated by reference to Exhibit 4.2 to the Registrant’s Quarterly Report on Form 10-Q for the fiscal quarter ended July 31, 1996)
|
|
10.9+
|
Form of Non-transferable Non-Qualified Stock Option Agreement under the Amended and Restated 1994 Employee Stock Option Plan of the Registrant (incorporated by reference to Exhibit 4.3 to the Registrant’s Quarterly Report on Form 10-Q for the fiscal quarter ended July 31, 1996)
|
| 10.10+ | Amended and Restated 1994 Stock Option Plan for Non-Employee Directors of the Registrant (incorporated by reference to Exhibit 4.1 to the Registrant’s Current Report on Form 8-K filed April 19, 2002) |
| 10.10(a)+ | Amendment No. 1 to the Amended and Restated 1994 Stock Option Plan for Non-Employee Directors of the Registrant (incorporated by reference to Exhibit 10.12(a) to the Registrant’s Annual Report on Form 10-K for the fiscal year ended January 31, 2004) |
|
10.11+
|
Form of Stock Option Agreement under the 1994 Stock Option Plan for Non-Employee Directors of the Registrant (incorporated by reference to the
|
|
|
Registrant’s Registration Statement on Form S-1 (No. 33-77458))
|
|
10.12+
|
Amended and Restated 2003 Omnibus Incentive Plan (incorporated by reference to Exhibit 10.1 to the Registrant’s Current Report on Form 8-K filed June 6, 2008)
|
|
10.13+
|
Amendment No. 1 to Amended and Restated Employment Agreement dated as of December 10, 2009 by and between the Registrant and Robert B. Goergen (incorporated by reference to Exhibit 10.1 to the Registrant’s Current Report on Form 8-K as filed on December 10, 2009)
|
|
16.1+
|
Letter Regarding Change in Certifying Accountant (incorporated by reference to Exhibit 16.1 to the Registrant’s Current Report on Form 8-K as filed on May 14, 2009)
|
|
21.1*
|
List of Subsidiaries
|
|
23.1*
|
Consent of Independent Registered Public Accounting Firm
|
|
23.2*
|
Consent of Independent Registered Public Accounting Firm
|
|
31.1*
|
Section 302 Certification of Chairman and Chief Executive Officer
|
|
31.2*
|
Section 302 Certification of Vice President and Chief Financial Officer
|
|
32.1*
|
Certification of Chairman and Chief Executive Officer pursuant to Section 906 of the Sarbanes-Oxley Act of 2002
|
|
32.2*
|
Certification of Vice President and Chief Financial Officer pursuant to Section 906 of the Sarbanes-Oxley Act of 2002
|
|
*
|
Filed herewith.
|
|
+
|
Management contract or compensatory plan required to be filed by Item 15(a)(3) of this report.
|
SIGNATURES
Pursuant to the requirements of Section 13 or 15(d) of the Securities Exchange Act of 1934, the registrant has duly caused this report to be signed on its behalf by the undersigned, thereunto duly authorized.
BLYTH, INC.
By: /s/ Robert B. Goergen
Name: Robert B. Goergen
Title: Chairman and Chief Executive Officer
Date: April 9, 2010
Pursuant to the requirements of the Securities Exchange Act of 1934, this report has been signed below by the following persons on behalf of the registrant and in the capacities and on the dates indicated.
|
Signature
|
Title
|
Date
|
|||
|
/s/ Robert B. Goergen
|
Chairman and Chief Executive Officer;
|
April 9, 2010
|
|||
|
Robert B. Goergen
|
Director (Principal Executive Officer)
|
||||
|
/s/ Robert H. Barghaus
|
Vice President and Chief Financial Officer
|
April 9, 2010
|
|||
|
Robert H. Barghaus
|
(Principal Financial and Accounting Officer)
|
||||
|
/s/ Anne M. Busquet
|
Director
|
April 9, 2010
|
|||
|
Anne M. Busquet
|
|||||
|
/s/ Pamela M. Goergen
|
Director
|
April 9, 2010
|
|||
|
Pamela M. Goergen
|
|||||
|
/s/ Neal I. Goldman
|
Director
|
April 9, 2010
|
|||
|
Neal I. Goldman
|
|||||
|
/s/ Carol J. Hochman
|
Director
|
April 9, 2010
|
|||
|
Carol J. Hochman
|
|||||
|
/s/ Wilma H. Jordan
|
Director
|
April 9, 2010
|
|||
|
Wilma H. Jordan
|
|||||
|
/s/ James M. McTaggart
|
Director
|
April 9, 2010
|
|||
|
James M. McTaggart
|
|||||
|
/s/ Howard E. Rose
|
Director
|
April 9, 2010
|
|||
|
Howard E. Rose
|
|||||
SCHEDULE II- VALUATION AND QUALIFYING ACCOUNTS
For the years ended January 31, 2008, 2009 and 2010
(In thousands)
|
Balance at
|
Charged to
|
Balance at
|
||||||||||||||||
|
Beginning
|
Costs and
|
End of
|
||||||||||||||||
|
Description
|
of Period
|
Expenses
|
Deductions
|
(1 | ) |
Period
|
||||||||||||
|
2008
|
||||||||||||||||||
|
Allowance for doubtful accounts
|
$ | 1,533 | $ | 2,044 | $ | (1,571 | ) | $ | 2,006 | |||||||||
|
Income tax valuation allowance
|
18,610 | 2,583 | (3,700 | ) | 17,493 | |||||||||||||
|
Inventory reserve
|
24,284 | 4,754 | (16,647 | ) | 12,391 | |||||||||||||
|
2009
|
||||||||||||||||||
|
Allowance for doubtful accounts
|
$ | 2,006 | $ | 5,648 | $ | (4,216 | ) | $ | 3,438 | |||||||||
|
Income tax valuation allowance
|
17,493 | 7,467 | (3,427 | ) | 21,533 | |||||||||||||
|
Inventory reserve
|
12,391 | 5,795 | (2,369 | ) | 15,817 | |||||||||||||
|
2010
|
||||||||||||||||||
|
Allowance for doubtful accounts
|
$ | 3,438 | $ | 3,534 | $ | (4,729 | ) | $ | 2,243 | |||||||||
|
Income tax valuation allowance
|
21,533 | 1,165 | (1,662 | ) | 21,036 | |||||||||||||
|
Inventory reserve
|
15,817 | 3,806 | (5,240 | ) | 14,383 | |||||||||||||
|
(1) Deductions in 2008 include the sale of Wholesale Europe and BHI NA.
|
||||||||||||||||||