Attached files
| file | filename |
|---|---|
| EX-23 - EXHIBIT 23 - BLYTH INC | bth-12312014xex23.htm |
| EX-31.1 - EXHIBIT 31.1 - BLYTH INC | bth-12312014xex311.htm |
| EX-31.2 - EXHIBIT 31.2 - BLYTH INC | bth-12312014xex312.htm |
| EX-32.1 - EXHIBIT 32.1 - BLYTH INC | bth-12312014xex321.htm |
| EX-32.2 - EXHIBIT 32.2 - BLYTH INC | bth-12312014xex322.htm |
| EX-99.1 - EXHIBIT 99.1 - BLYTH INC | bth-12312014xex991.htm |
| EXCEL - IDEA: XBRL DOCUMENT - BLYTH INC | Financial_Report.xls |
| EX-21.1 - EXHIBIT 21.1 - BLYTH INC | bth-12312014xex211.htm |
UNITED STATES
SECURITIES AND EXCHANGE COMMISSION
Washington, D.C. 20549
FORM 10-K
(Mark One)
x ANNUAL REPORT PURSUANT TO SECTION 13 OR 15(d) OF THE SECURITIES EXCHANGE ACT OF 1934
For the year ended December 31, 2014
or
o TRANSITION REPORT PURSUANT TO SECTION 13 OR 15(d) OF THE SECURITIES EXCHANGE ACT OF 1934
For the transition period from _______ to _______
Commission File number 1-13026
BLYTH, INC.
(Exact Name of Registrant as Specified in Its Charter)
Delaware | 36-2984916 |
(State or Other Jurisdiction of Incorporation or Organization) | (I.R.S. Employer Identification No.) |
One East Weaver Street Greenwich, Connecticut | 06831 |
(Address of Principal Executive Offices) | (Zip Code) |
Registrant’s telephone number, including area code: (203) 661-1926
Securities registered pursuant to Section 12(b) of the Act:
Title of each class | Name of each exchange on which registered |
Common Stock, par value $0.02 per share | New York Stock Exchange |
Securities registered pursuant to Section 12(g) of the Act: None
Indicate by check mark if the registrant is a well-known seasoned issuer, as defined in Rule 405 of the Securities Act. Yes o No x
Indicate by check mark if the registrant is not required to file reports pursuant to Section 13 or Section 15(d) of the Act. Yes o No x
Indicate by check mark whether the registrant (1) has filed all reports required to be filed by Section 13 or 15(d) of the Securities Exchange Act of 1934 during the preceding 12 months (or for such shorter period that the registrant was required to file such reports), and (2) has been subject to such filing requirements for the past 90 days. Yes x No o
Indicate by check mark whether the registrant has submitted electronically and posted on its corporate Web site, if any, every Interactive Data File required to be submitted and posted pursuant to Rule 405 of Regulation S-T during the preceding 12 months (or for such shorter period that the registrant was required to submit and post such files). Yes x No o
Indicate by check mark if disclosure of delinquent filers pursuant to Item 405 of Regulation S-K is not contained herein, and will not be contained, to the best of registrant’s knowledge, in definitive proxy or information statements incorporated by reference in Part III of this Form 10-K or any amendment to this Form 10-K. o
Indicate by check mark whether the registrant is a large accelerated filer, an accelerated filer, a non-accelerated filer, or a smaller reporting company. See the definitions of “large accelerated filer,” “accelerated filer” and “smaller reporting company” in Rule 12b-2 of the Exchange Act. (Check one):
Large accelerated filer o Non-accelerated filer o | Accelerated filer x Smaller reporting company o |
Indicate by check mark whether the registrant is a shell company (as defined in Rule 12b-2 of the Act). Yes o No x
The aggregate market value of the voting common equity held by non-affiliates of the registrant was approximately $70.4 million based on the closing price of the registrant’s Common Stock on the New York Stock Exchange on June 30, 2014 and based on the assumption, for purposes of this computation only, that all of the registrant’s directors and executive officers are affiliates.
As of February 28, 2015, there were 16,082,230 outstanding shares of Common Stock.
DOCUMENTS INCORPORATED BY REFERENCE
Portions of the 2015 Proxy Statement for the Annual Meeting of Shareholders to be held on May 8, 2015 (Incorporated into Part III).
TABLE OF CONTENTS
PART I | |||
Item 1. | |||
Item 1A. | |||
Item 1B. | |||
Item 2. | |||
Item 3. | |||
Item 4. | |||
PART II | |||
Item 5. | |||
Item 6. | |||
Item 7. | |||
Item 7A. | |||
Item 8. | |||
Item 9. | |||
Item 9A. | |||
Item 9B. | |||
PART III | |||
Item 10. | |||
Item 11. | |||
Item 12. | |||
Item 13. | |||
Item 14. | |||
PART IV | |||
Item 15. | |||
2
CAUTIONARY NOTE ABOUT FORWARD-LOOKING STATEMENTS
This annual report on Form 10-K contains “forward-looking statements” within the meaning of the safe harbor provisions of the Private Securities Litigation Reform Act of 1995. All of our statements in this annual report other than statements of historical fact are “forward-looking statements” for purposes of federal and state securities laws, including, by way of example, any projections of future earnings, revenue, capital expenditures, cash flow from operations or other financial items; any statements regarding our, PartyLite's or Silver Star Brands' plans, strategies or objectives for future operations; any statements as to our belief; and any assumptions underlying any forward-looking statements. Forward-looking statements can be identified by the fact that they do not relate strictly to historical or current facts and often include words such as “may,” “will,” “estimate,” “intend,” “believe,” “expect” or “anticipate” and any other similar words.
Although we believe that the expectations reflected in our forward-looking statements are reasonable, our actual results could differ materially from those projected, estimated or assumed in any of our forward-looking statements. Our future financial condition and results of operations, as well as any forward-looking statements, are subject to change and to inherent risks and uncertainties, such as those disclosed or incorporated by reference in our filings with the Securities and Exchange Commission. Important factors that could cause our actual results, performance and achievements to differ materially from those indicated in
our forward-looking statements include, among others, the following:
• | our ability to improve our financial and operational performance; |
• | our ability to respond appropriately to changing consumer preferences and demand for our current and new products |
or product enhancements;
• our dependence on sales by independent consultants and our ability to recruit, retain and motivate them;
• the loss by PartyLite of a significant number of its consultants;
• the attractiveness of PartyLite's compensation plans to current and prospective independent consultants;
• our ability to influence or control our consultants;
• federal, state and foreign regulations applicable to our products (including advertising and labeling), promotional
programs and compensation plans;
• susceptibility to excess and obsolete inventory due to changing consumer preferences;
• adverse publicity directed at our products or business models, or those of similar companies;
• product liability claims;
• competition;
• an economic downturn;
• our ability to grow our business in existing and new markets, including risks associated with international operations;
• legal actions by or against current or former independent consultants;
• our reliance on third-party manufacturers for the supply of some of our products;
• our ability to manufacture candles at required quantity and quality levels;
• disruptions to transportation channels;
• shortages or increases in the cost of raw materials;
• our dependence on key employees;
• | certain taxes or assessments relating to the activities of our independent consultants for which we may be held responsible; |
• our ability to identify, consummate and integrate suitable acquisition candidates on favorable terms and conditions;
• the covenants in our revolving loan agreement and term loan limit our operating and financial flexibility, including, among other things, our ability to pay dividends and repurchase our common stock;
• increased borrowing costs and reduced access to capital;
• our ability to protect our intellectual property;
• interruptions in our information-technology systems;
• our storage of user and employee data;
• information security or data breaches;
• credit card and debit card fraud;
• changes in our effective tax rate;
• fluctuations in our periodic results of operations;
3
• increased paper, mailing and shipping costs;
• increased risk and write-offs associated with Silver Star Brands' credit program;
• speculative trading and volatility in our stock price;
• the failure of securities or industry analysts to publish research reports about our business, or the publication of
negative reports about our business; and
• our compliance with the Sarbanes-Oxley Act of 2002.
We operate in a very competitive and rapidly changing environment, where new risks emerge from time to time. It is not possible for us to predict all risks, nor can we assess the impact of all factors on our business or the extent to which any factor, or combination of factors, may cause our actual results to differ materially from those contained in any of our forward-looking statements. In light of these risks, uncertainties and assumptions, the future events and trends discussed in this annual report may not occur, and our actual results could differ materially and adversely from those anticipated, estimated or implied in any forward-looking statements. Forward-looking statements are neither historical facts nor assurances of future performance. Additional factors that could cause our actual results to differ materially from our forward-looking statements are set forth in this annual report, especially under the heading “Risk Factors,” “Management's Discussion and Analysis of Financial Condition and Results of Operations” and in our Consolidated Financial Statements and the related Notes.
You should not rely upon forward-looking statements as predictions of future events. The events and circumstances reflected in the forward-looking statements may not be achieved or occur. Although we believe that the expectations reflected in the forward-looking statements are reasonable, we cannot guarantee future results, levels of activity, performance or achievements. Forward-looking statements in this annual report speak only as of the date of this report, and forward-looking statements in documents attached or to be filed with the Securities and Exchange Commission that are incorporated by reference speak only as of the date of those documents. We do not undertake any obligation to update or release any revisions to any forward-looking statement, whether as a result of new information, future developments or otherwise.
4
PART I
Item 1. Business.
(a) General Development of Business
Blyth, Inc. (together with its subsidiaries, the “Company,” which may be referred to as “we,” “us” or “our”) is a multi-channel company primarily focused on the direct-to-consumer market. Our products include an extensive array of decorative and functional household products such as candles, accessories, seasonal decorations, household convenience items and personalized gifts, as well as health, wellness and beauty related products. Our products can be found primarily throughout the United States, Canada, Mexico, Europe and Australia.
During the past five years we have disposed of some of our businesses. In February 2011 we assigned all the assets and liabilities of the Boca Java business through a court approved assignment for the benefit of its creditors. In May 2011, we sold substantially all of the net assets of our Midwest-CBK seasonal, home décor and home fragrance business. In October 2012, we sold our Sterno business, which completed our strategic transformation from a multi-channel marketing company to a direct-to-consumer marketing company focused on the direct selling and direct marketing channels of distribution. In September 2014, we entered into a recapitalization agreement with ViSalus that reduced our ownership interest in ViSalus from approximately 80.9% to 10.0%. As a result of our strategic transformation, we report our financial results in two business segments: Candles & Home Décor (which currently is our PartyLite business) and Catalog & Internet (which currently is our Silver Star Brands business).
Additional Information
Additional information is available on our website, www.blyth.com. Our annual reports on Form 10-K, quarterly reports on Form 10-Q, current reports on Form 8-K and any amendments thereto filed or furnished pursuant to the Securities Exchange Act of 1934 are available on our website free of charge as soon as reasonably practicable following submission to the SEC. Also available on our website are our corporate governance guidelines, code of conduct, and the charters for the audit committee, compensation committee, and nominating and corporate governance committee, each of which is available in print to any shareholder who makes a request to Blyth, Inc., One East Weaver Street, Greenwich, CT 06831, Attention: Secretary. The information posted to www.blyth.com is not incorporated herein by reference and is not a part of this report.
(b) Financial Information about Segments
We report our financial results in two business segments: Candles & Home Décor and Catalog & Internet. These segments accounted for approximately 71% and 29% of consolidated net sales, respectively, for the year ended December 31, 2014. Financial information relating to these business segments for the years ended December 31, 2014, 2013 and 2012 appears in Note 19 to the Consolidated Financial Statements and is incorporated herein by reference.
(c) Narrative Description of Business
Candles & Home Décor Segment
We operate in the Candles & Home Décor segment through PartyLite. PartyLite sells premium candles, flameless and other home fragrance products and related decorative accessories under the PartyLite® name primarily in the United States, Canada, Mexico, Europe and Australia. Since late 2014, PartyLite’s products have also been available through third parties in South Korea and Turkey.
Independent Consultants
Within the United States and Canada, which PartyLite defines as its North American market, PartyLite® brand products are sold through independent consultants who are compensated on the basis of PartyLite product sales at in-person and on-line parties organized by them and parties organized by consultants recruited by them. Approximately 14,800 active independent North American sales consultants were selling PartyLite products at December 31, 2014 compared to approximately 16,800 at December 31, 2013. PartyLite products are designed, packaged and priced in accordance with their premium quality, exclusivity and the distribution channel through which they are sold. Products may also be purchased on individual consultants’ websites and, in certain markets, on the corporate shopping website.
5
Approximately 27,600 active independent European sales consultants were selling PartyLite products at December 31, 2014 compared to approximately 30,200 at December 31, 2013. PartyLite's international markets include: Australia, Austria, Belgium, Czech Republic, Denmark, Finland, France, Germany, Ireland, Italy, Luxembourg, Mexico, Netherlands, Norway, Poland, Slovakia, South Korea, Sweden, Switzerland, Turkey and the United Kingdom.
Sourcing, Manufacturing and Logistics
PartyLite supports its independent sales consultants with inventory management and control, and satisfies delivery requirements through on-line order entry systems, which are available to most of its independent sales consultants.
PartyLite manufactures most of its candles using highly automated processes and technologies, as well as certain hand crafting and finishing, and sources nearly all of its home décor products, primarily from independent manufacturers in the Pacific Rim and Europe. PartyLite sources its food products from third party manufacturers in the United States based on its formulas. PartyLite has highly automated distribution facilities in the United States and Europe supporting its business.
Raw Materials
All of the raw materials used for our candles and home fragrance products have historically been available in adequate supply from multiple sources. Some of our ingredients are proprietary to the supplier and may not be easily re-sourced or replaced.
Catalog & Internet Segment
Silver Star Brands is a direct-to-consumer business that develops and markets an extensive array of decorative and functional household products, personalized products, gifts, unique food products and health, wellness and beauty products. Silver Star Brands reaches consumers through its websites, catalogs and direct mail campaigns through its brands:
• | As We Change® - focuses exclusively on the needs and preferences of women age 40+, providing a private and convenient place to turn for beauty, anti-aging, personal care, health and wellness, and slimming active wear items. |
• | Easy Comforts® - offers health and personal care merchandise to the 50+ aging consumer, to support an independent lifestyle, including a wide array of mobility, daily living aids, personal safety and incontinence products. |
• | Exposures® - sells photo albums, storage products, holiday décor and personalized gifts. |
• | Miles Kimball® - offers unique and hard-to-find gadgets, personalized gifts, outdoor, gardening and household items, stationery, apparel and candy. |
• | Native Remedies® - a direct-to-consumer eCommerce marketer of natural herbal dietary supplements and homeopathic products (acquired in February 2015). |
• | Walter Drake® - a leading direct marketer of value-priced kitchenware, household products, organizers, health care items, gardening and outdoor décor, personalized gifts, calendars and stationery. |
Sourcing, Manufacturing and Logistics
Silver Star Brands sources all of its As We Change, Easy Comforts, Exposures, Miles Kimball and Walter Drake products, primarily from independent manufacturers in the Pacific Rim, and sources its Native Remedies products from third party manufacturers in the United States. Silver Star Brands has a highly automated distribution facility in the United States supporting its business.
Product Brand Names
The major brand names under which our Candles & Home Décor segment products are sold are PartyLite® and GloLite by PartyLite®. For the primary brand names under which our Catalog & Internet segment products are sold, see above under “Catalog & Internet Segment.”
Trade names, trademarks and service marks of other companies appearing in this annual report are the property of their respective holders.
6
Manufacturing, Sourcing and Distribution
In all of our business segments, management continuously works to increase value and lower costs through increased efficiency in worldwide production, sourcing, distribution and customer service practices, the application of new technologies and process control systems, and consolidation and rationalization of equipment and facilities. Net capital expenditures over the past five years have totaled $28.7 million and are targeted at technological advancements, significant maintenance and replacement projects at our manufacturing and distribution facilities and customer service capacity increases. We have also closed several facilities and written down the values of certain machinery and equipment in recent years in response to changing market conditions. In January 2015, PartyLite began to shut down its manufacturing facility in Cumbria, U.K. and will manufacture all of its candles in its Batavia, IL manufacturing facility.
Customers
Our customers are individuals served by our independent sales consultants or who purchase products from our catalogs or websites. No single customer accounted for 10% or more of our net sales for the year ended December 31, 2014 or our accounts receivable balance as of December 31, 2014.
Competition
Both of our business segments are highly competitive, both in terms of pricing and new product introductions. The worldwide markets for these products are highly fragmented, with numerous suppliers serving one or more of the distribution channels served by us. Some of our competitors have longer operating histories, significantly greater financial, technical, product-development, marketing and sales resources, greater name recognition, larger established customer bases, and better-developed distribution channels than we do. Because there are relatively low barriers to entry in both of our business segments, it is relatively easy for new competitors to emerge to compete with both of our businesses. Some of our competitors focus on a single geographic or product market and attempt to gain or maintain market share solely on the basis of price.
Competition in the Candles & Home Decor segment includes companies selling candles manufactured at lower costs through direct selling and retail channels. The Catalog & Internet segment is also highly competitive, with longer and better established brands as well as new start-ups in the catalog, internet and brick-and-mortar retail markets.
In the Candles & Home Décor segment we compete for consultants with other direct selling companies, both those that sell similar products and those that sell other types of products, and we compete with other direct selling companies for hosts who allow consultants to conduct parties in their homes.
Employees
As of December 31, 2014, we had approximately 1,600 full-time employees, of whom approximately 34% were based outside of the United States. Approximately 60% of our employees are non-salaried. We do not have any unionized employees in North America. We believe that relations with our employees are good. Since our formation in 1977, we have never experienced a work stoppage.
Seasonality
Our businesses are seasonal in nature and, as a result, the net sales and working capital requirements of our businesses fluctuate from quarter to quarter. Our Candles & Home Décor and Catalog & Internet businesses tend to achieve their strongest sales in the third and fourth quarters due to increased shipments to meet year-end holiday season demand for our products. We expect the seasonality of our businesses to continue in the future, which may cause period-to-period fluctuations in certain of our operating results and limit our ability to predict our future results accurately.
Government Regulation
eCommerce and Data Collection
Our involvement in eCommerce and collection of information regarding employees, independent consultants and consumers subject our businesses to a number of laws, regulations, administrative determinations, court decisions and similar constraints at the U.S. federal, state and local level and at all levels of government in foreign jurisdictions, governing companies that maintain information regarding their employees, consultants and consumers or their conduct of business on the Internet. These may involve user privacy, data protection, electronic contracts, consumer protection, taxation and online payment services. For
7
example, the FTC regulates the appropriate collection and protection of personal identifiable information and has issued a number of enforcement actions against companies for using mobile applications or collecting information regarding consumers in a manner that the FTC considers to violate the Federal Trade Commission Act, as amended (the "FTC Act"). United States federal, state and foreign jurisdiction laws and regulations regarding data privacy and protection and eCommerce are constantly evolving and can be subject to significant change. In addition, the application and interpretation of these laws and regulations are often uncertain, particularly given the new and rapidly-evolving use of technology in the marketplace. The adoption of new laws and regulations or changes in the interpretations of existing laws and regulations may result in significant compliance costs or otherwise negatively impact our business.
Direct Selling and Network Marketing Programs
Our direct selling programs are subject to federal and state regulations administered by the FTC and various state agencies as well as regulations in foreign markets administered by foreign agencies. These regulations generally seek to ensure that product sales are made to consumers and that advancement within an organization is based on sales of products rather than investments in the organization or other non-retail sales related criteria. For instance, in some markets, there are limits on the extent to which consultants may earn royalty overrides on sales generated by consultants that were not directly sponsored by them. While we believe we are in compliance with these regulations, we remain subject to the risk that in one or more markets our marketing systems could be found not to be in compliance with applicable regulations. Failure to comply with these regulations could have a material adverse effect on our business in a particular market or in general.
Environmental Regulations
Most of our manufacturing and distribution operations are affected by federal, state, local and international environmental laws relating to the discharge of materials or otherwise to the protection of the environment. We have made and intend to continue to make expenditures necessary to comply with applicable environmental laws, and do not believe that such expenditures will have a material effect on our capital expenditures, earnings or competitive position.
Regulation of Foods, Dietary Supplements, Vitamins, Minerals, Herbal and Homeopathic Products and Cosmetics.
The sale, advertisement and promotion of foods, dietary supplements, vitamins, minerals, herbal and homeopathic products and cosmetics that we sell are subject to regulation by the Food and Drug Administration (“FDA”), the Federal Trade Commission ("FTC"), the U.S. Postal Service ("USPS"), the U.S. Department of Agriculture and state regulatory authorities. In particular, the FDA regulates the formulation, manufacturing, packaging, labeling, distribution and sale of foods, dietary supplements, vitamins, minerals, herbal and homeopathic products and cosmetics. The FTC regulates the advertising of these products, and the USPS regulates advertising claims with respect to such products sold by mail order. The National Advertising Division (“NAD”) of the Council of Better Business Bureaus oversees an industry-sponsored self-regulatory system that permits competitors to resolve disputes over advertising claims. The NAD may refer matters to the FTC and/or other agencies for further action, if the advertiser does not participate in the NAD system or implement the NAD's recommendations.
(d) Financial Information about Geographic Areas
For information on net sales from external customers attributed to the United States and international geographies and on long-lived assets located in and outside the United States, see Note 19 to the Consolidated Financial Statements.
8
Item 1A. Risk Factors.
We encounter substantial risks in our business, any one of which may adversely affect our business, results of operations or financial condition. The fact that some of these risk factors may be the same or similar to those that we have filed with the Securities and Exchange Commission in prior reports means only that the risks are present in multiple periods. We believe that many of the risks that are described here are part of doing business in the industries in which we operate and will likely be present in all periods. The fact that certain risks are endemic to these industries does not lessen their significance. These risk factors should be read together with the other items in this report, including “Item 7 - Management's Discussion and Analysis of Financial Condition and Results of Operations.” We use the terms “we”, “us” or “our” to refer to Blyth, Inc. and its subsidiaries, unless suggested otherwise by the context.
Our success depends on our ability to improve our financial and operational performance.
Our ability to improve our financial and operational performance depends upon a number of factors, including our ability to recruit, retain and motivate consultants; reverse declines in our net sales; implement our cost savings programs and other initiatives and achieve anticipated savings and benefits; reinvest certain of those savings effectively in our business, while effectively managing our cost base; improve working capital, effectively manage inventory and implement initiatives to reduce inventory levels, including the potential impact on cash flows and obsolescence; and appropriately address the other factors described below in “Risk Factors.”
The failure by our businesses to respond appropriately to changing consumer preferences and demand for new products or product enhancements could harm our business, financial condition and results of operations.
Our ability to increase our sales and earnings depends on numerous factors, including market acceptance of our existing
products and the successful introduction of new products. Sales of PartyLite's candles and accessories and Silver Star Brands' consumer products fluctuate according to changes in consumer preferences. If our businesses are unable to anticipate, identify or react to changing preferences, our sales may decline. PartyLite's candles represented a substantial portion of our sales in 2012, 2013 and 2014. If consumer demand for these products decreases significantly, then our business, financial condition and results of operations would be harmed. In addition, if our businesses miscalculate consumer tastes and are no longer able to offer products that appeal to their customers, their brand images may suffer and sales and earnings would decline.
PartyLite depends upon sales by its independent sales force to drive its business, and its failure to continue to recruit, retain and motivate consultants would harm its business and our financial condition and results of operations.
PartyLite markets its products through its independent consultants primarily using a party plan direct selling model. This marketing system depends upon the successful recruitment, retention and motivation of a large number of consultants to offset frequent turnover, which is a common characteristic found in the direct selling industry. Our consultants may terminate their services at any time. Many of them market and sell our products on a part-time basis, join us for a short-period of time and likely engage in other business activities, some of which may compete with us. If PartyLite is unable to grow its consultant sales forces and reverse declines in their total number of consultants, our business would be materially harmed. The rate of turnover of PartyLite's consultants can be very high and volatile from time to time, which may materially hinder its ability to increase its total consultant count.
Our ability to recruit, retain and motivate consultants depends on a number of factors, including, but not limited to, our prominence among direct selling companies and the general labor market, the attractiveness of our products and compensation and promotional programs, the number of people interested in direct selling, unemployment levels, economic conditions, and demographic and cultural changes in the workforce. PartyLite relies primarily upon the efforts of its consultants to attract, train and motivate new consultants, so our sales directly depend upon their efforts. The failure by PartyLite to recruit, retain and motivate consultants and to reverse declines in its total number of consultants could negatively impact sales of its products, which could harm our business, financial condition and results of operations.
The loss by PartyLite of a significant number of its consultants could harm our business, financial condition and results of operations.
The loss by PartyLite of a significant number of its consultants for any reason could negatively impact the sales of its products, impair its ability to recruit new consultants and harm our business, financial condition and results of operations. During 2014, the total number of PartyLite’s consultants declined to approximately 48,000 from approximately 52,100 at December 31, 2013.
9
In general, PartyLite does not have non-competition arrangements with its consultants that would prohibit them from promoting competing products if they terminate their relationship. Pursuant to agreements that all of PartyLite's top consultants are requested to sign, the consultant is not permitted to solicit or recruit PartyLite's consultants to participate in any other direct selling company for a period of time following the termination of their agreement. We cannot ensure that PartyLite's consultants will abide by any non-solicitation obligations or that we will be able to enforce them. Some of PartyLite’s consultants have not abided by these non-solicitation agreements following their departure and while we have, in some cases, taken legal action and other steps to seek to enforce these non-solicitation agreements, we have not always been able to do so. If PartyLite's consultants do not abide by these non-solicitation obligations or if we are unable to enforce them, our competitive position may be compromised, which could harm our business, financial condition and results of operations.
PartyLite's compensation plan, or changes that are made to its plan, may be viewed negatively by some of its consultants, could fail to achieve our desired objectives and could have a negative impact on our business.
Direct selling is highly competitive and sensitive to the introduction of new competitors, new products and/or new compensation plans. Companies commonly attempt to attract new consultants by offering generous compensation plans. From time to time, PartyLite modifies components of its compensation plan in an effort to:
• | keep it competitive and attractive to existing and potential consultants, |
• | cause or address a change in the behavior of its consultants, |
• | motivate consultants to grow our business, |
• | conform to legal and regulatory requirements, and |
• | address other business needs. |
In light of the size and diversity of our consultant sales force and the complexity of our compensation plan, it is difficult to predict how any changes to the plan would be viewed by PartyLite's consultants and whether such changes will achieve their desired results. There can be no assurance that PartyLite's compensation plan will allow us to successfully attract or retain consultants, nor can we assure that any changes we make to our compensation plan will achieve our desired results.
Since we cannot exert the same level of influence or control over our consultants as we could if they were our employees, we may be unable to enforce compliance with our policies and procedures, which could result in claims against us.
PartyLite's consultants are independent contractors and, accordingly, PartyLite is not in a position to provide the same direction, motivation and oversight as it could if they were its employees. As a result, there can be no assurance that PartyLite's consultants will participate in its marketing strategies or plans, accept the introduction of new products or comply with policies and procedures. Extensive federal, state, local and foreign jurisdiction laws regulate our businesses, products and programs. While we have implemented policies and procedures that are designed to govern consultant conduct so that they comply with this regulatory regime, it can be difficult to enforce these policies and procedures because of the large number of consultants and their independent status. Violations by our consultants of applicable laws or of our policies and procedures could reflect negatively on our products and operations, harm our business reputation or lead to the imposition of penalties or claims.
The failure of our product advertising, promotional programs and recruitment techniques to comply with current or newly adopted regulations could negatively impact our business in a particular market or in general.
There are federal, state, provincial and foreign laws of general application, such as the FTC Act and state, provincial or foreign unfair and deceptive trade practices laws that could potentially be invoked to challenge our advertising, compensation practices or recruitment techniques. In particular, our recruiting efforts include promotional materials for recruits that describe the potential opportunity available to them if they become consultants. These materials, as well as our other recruiting efforts and those of consultants, are subject to scrutiny by the FTC, other enforcement agencies, our competitors, and current or former consultants with respect to misleading statements, including misleading earnings claims made to convince potential new recruits to become consultants. If claims or recruiting techniques used by PartyLite or by its consultants are deemed to be misleading, it could result in violations of the FTC Act or comparable state, provincial or foreign statutes prohibiting unfair or deceptive trade practices, result in reputational harm, or be subject to court challenge under the Lanham Act and state law by our competitors and current and former consultants, any of which could materially harm our business, financial condition and results of operations.
We are subject to the risk that, in one or more markets, our party plan programs could be found not to be in compliance with applicable law or regulations since regulatory requirements concerning direct selling programs do not include “bright
10
line” rules. The failure of our compensation programs to comply with current or newly adopted regulations over “pyramid” or “chain sales” schemes would negatively impact our business in a particular market or in general.
PartyLite's promotional and compensation programs are subject to a number of federal and state regulations administered by the FTC and various state agencies in the United States and the equivalent provincial and federal government agencies in Canada and in the other countries in which our businesses operate. We are subject to the risk that, in one or more markets, our party plan programs could be found not to be in compliance with applicable law or regulations. Regulations applicable to direct selling organizations generally are directed at preventing fraudulent or deceptive schemes, often referred to as “pyramid” or “chain sales” schemes, by ensuring that product sales ultimately are made to consumers and that advancement within an organization is based on sales of the organization's products rather than investments in the organization or other non-retail, non-product sales related criteria. The regulatory requirements concerning party plan programs do not include “bright line” rules, and therefore, even in jurisdictions where we believe that our compensation programs are in compliance with applicable laws or regulations, we are subject to the risk that these laws or regulations or the enforcement or interpretation of these laws and regulations by governmental agencies or courts can change. The failure of our compensation programs to comply with current or newly adopted regulations could negatively impact our business in a particular market or in general.
Our products are subject to government regulation, both in the United States and abroad, which could increase our costs significantly and limit or prevent the sale of our products.
The sale, advertisement and promotion of foods, dietary supplements, vitamins, minerals, herbal and homeopathic products and cosmetics that we sell are subject to regulation by the FDA, FTC, USPS, the U.S. Department of Agriculture and state regulatory authorities. Any of these government agencies, as well as legislative bodies, can change existing regulations, or impose new ones, or could take aggressive measures, causing or contributing to a variety of negative consequences, including:
• | requirements for the reformulation of products to meet new standards, |
• | the recall or discontinuance of products, |
• | additional record keeping, |
• | expanded documentation of the properties of products, |
• | expanded or different labeling, |
• | adverse event tracking and reporting and |
• | additional scientific substantiation. |
Any or all of these requirements could have a material adverse effect on us. There can be no assurance that the regulatory environment in which we operate will not change or that such regulatory environment, or any specific action taken against us, will not result in a material adverse effect on us.
If we do not respond appropriately to changing consumer preferences, we could be vulnerable to increased exposure to
excess and obsolete inventory.
The ability of our businesses to respond to changing consumer preferences and demand for new products or product
enhancements and to manage their inventories properly is an important factor in their operations. The nature of their products
and the rapid changes in consumer preferences leave them vulnerable to an increased risk of inventory obsolescence. Excess or
obsolete inventories can result in lower gross margins due to the excessive discounts and markdowns that might be necessary to
reduce inventory levels. Our success depends in part on the ability of our businesses to anticipate and respond to these changes, and they may not respond in a timely or commercially appropriate manner to such changes. We have in the past written down and written off excess or obsolete inventories. The ability of our businesses to meet future product demand will depend, among other things, upon their success in improving their ability to forecast product demand and fulfill customer orders promptly.
We may incur material product liability claims, which could increase our costs and harm our business.
PartyLite and Silver Star Brands primarily market products for consumer use, although some of their products are also intended for human consumption. As such, we may be subject to product liability claims if the use of our products is alleged to have resulted in injury to consumers, whether from consumption or otherwise. We also may be subjected to product liability claims that relate to the use of candles and claims that our candles and accessories include inadequate instructions as to their uses or inadequate warnings concerning side effects. We cannot ensure that any of our products will never be associated with consumer injury. In addition, many of our products are manufactured by third-party manufacturers that also provide raw materials, which prevent us from having full control over the ingredients contained in many of our products.
11
Any product liability claim brought against any of our businesses, with or without merit, could result in an increase of our product liability insurance rates. Insurance coverage varies in cost and can be difficult to obtain, and we cannot guarantee that we will be able to obtain insurance coverage in the future on terms acceptable to us or at all. In addition, such liability claims could cause our consumers to lose confidence in our products and stop purchasing our products, which would harm our business, financial condition and results of operations.
All of our businesses are subject to risks from increased competition, and our failure to maintain our competitive position
would harm us.
PartyLite's business of selling candles and accessories and Silver Star Brands' business of selling a wide variety of consumer products through catalogs and the Internet are highly competitive both in terms of pricing and new product introductions. The worldwide markets for these products are highly fragmented, with numerous suppliers serving one or more of the distribution channels served by us. In addition, we anticipate that we will be subject to increasing competition in the future from sellers that utilize eCommerce. Some of these competitors have longer operating histories, significantly greater financial, technical, product development, marketing and sales resources, greater name recognition, larger established customer bases, and better-developed distribution channels than our businesses. Our current or future competitors may be able to develop products that are comparable or superior to those that we offer, offer competitive products at more attractive prices, adapt more quickly than we do to new technologies, evolving industry trends and standards or consumer requirements, or devote greater resources to the development, promotion and sale of their products than our businesses. Competitors in PartyLite's target market include Yankee Candle and numerous retail establishments, including big-box retailers, that sell a wide variety of candles and accessories. Silver Star Brands competes with numerous general merchandise catalogs, online retailers and retail establishments. In addition, because the industries in which our businesses operate are not particularly capital intensive or otherwise subject to high barriers to entry, it is relatively easy for new competitors to emerge to compete with us for consultants and customers.
PartyLite is subject to significant competition for the recruitment of consultants from other direct selling organizations, including those that market candles and home accessories, as well as other types of products. Furthermore, the fact that our consultants may easily enter and exit our programs contributes to the level of competition that we face. Our ability to remain competitive depends, in significant part, on our success in recruiting and retaining consultants through attractive compensation plans, the maintenance of attractive product portfolios and other incentives. If our businesses are unable to compete effectively in their markets, if competition in their markets intensifies or if we are unable to recruit and retain consultants, our business, financial condition and results of operations would be harmed.
A downturn in the economy may affect consumer purchases of discretionary items such as our products.
Recently, concerns over the global economy, including the recent financial crisis in Europe (including concerns that certain
European countries may default on payments due on their national debt) and the resulting economic uncertainty, as well as
concerns over unemployment in the United States and Europe, inflation, energy costs, geopolitical issues, and the availability
and cost of credit have contributed to increased volatility and diminished expectations for the United States and global
economies. A continued or protracted downturn in the economy could adversely impact consumer purchases of discretionary
items, including all of our products. Factors that could affect consumers' willingness to make such discretionary purchases
include general business conditions, levels of unemployment, political uncertainty, energy costs, interest rates and tax rates, the
availability of consumer credit and consumer confidence. A reduction in consumer spending could significantly reduce our
sales and leave us with unsold inventory.
Our results of operations are significantly affected by our success in increasing sales in our existing markets, as well as
opening new markets. As we continue to expand into international markets, our business becomes increasingly subject to
political, economic, legal and other risks. Changes in these markets could adversely affect our business.
PartyLite has a history of expanding into new international markets. We believe that our ability to achieve future growth is dependent in part on our ability to continue our international expansion efforts. There can be no assurance, however, that we will be able to grow in our existing international markets, enter new international markets on a timely basis or that new markets will be profitable. We must overcome significant regulatory and legal barriers before we can begin marketing in any international market. Also, before marketing commences in a new country or market, it is difficult to assess the extent to which our products and sales techniques will be accepted or successful in any given country. In addition to significant regulatory barriers, we may also encounter problems conducting operations in new markets with different cultures, languages, legal systems and payment methods from those encountered elsewhere. Once we have entered a market, we must adhere to the regulatory and legal requirements of that market. There can be no assurance that we will be able to obtain and retain necessary permits and approvals in new markets, or that we will have sufficient capital to finance our expansion efforts in a timely manner.
12
In many markets, other network marketing companies already have significant market penetration which may have the
effect of desensitizing the local population to a new opportunity from PartyLite, or to make it more difficult for us to attract qualified consultants. Even if PartyLite is able to commence operations in new markets, there may not be a sufficient population of individuals who are interested in direct selling in general or our business model in particular. We believe our future success will depend in part on our ability to seamlessly integrate PartyLite's compensation plans across all markets where legally permissible. There can be no assurance, however, that we will be able to utilize our compensation plans seamlessly in all existing or future markets.
We face diverse risks in our international business.
We depend on international sales for a substantial amount of our total revenue. For the years ended December 31, 2014 and 2013, revenue from outside the United States represented 58% of our total revenue. We expect international sales to continue to represent a substantial portion of our revenue for the foreseeable future and we plan to expand further into international markets. During 2014 and into 2015, our results of operations were negatively impacted by the significant increase in the value of the U.S. dollar against the euro. Due to our reliance on sales to customers outside the United States, we are subject to the risks of conducting business internationally, including:
• the acceptability of our products and sales models to international consumers;
• the interest in PartyLite's business, products and compensation programs to prospective overseas consultants;
• United States and foreign government trade restrictions, including those which may impose restrictions on imports to
or from the United States;
• foreign government taxes and regulations, including foreign taxes that we may not be able to offset against taxes
imposed upon us in the United States, and foreign tax and other laws limiting our ability to repatriate funds to the
United States;
• laws and policies affecting the importation of goods (including duties, quotas and taxes);
• foreign employment and labor laws, regulations and restrictions;
• difficulty in staffing and managing international operations and difficulty in maintaining quality control;
• adverse fluctuations in world currency exchange rates and interest rates, including risks related to any interest rate
swap or other hedging activities we undertake;
• political instability, natural disasters, health crises, war or events of terrorism;
• transportation costs and delays; and
• the strength of international economies.
Legal actions by PartyLite's former consultants or third parties against us could harm our business.
PartyLite monitors and reviews the compliance of its consultants with their respective policies and procedures as well the laws and regulations applicable to their businesses. From time to time, some consultants fail to adhere to these policies and procedures. In such cases, PartyLite may take disciplinary action against that consultant based on the facts and circumstances of the particular case, which may include, for example, warnings for minor violations to termination of the relationship for more serious violations. From time to time, we become involved in litigation with a former consultant who voluntarily terminated their relationship or whose relationship has been terminated. Sometimes those former consultants have become associated with one of our competitors and that competitor may join in the action. We consider this type of litigation to be routine and incidental to our business. While neither the existence nor the outcome of this type of litigation is typically material to our business, we may become involved in litigation of this nature that results in a large cash award against us. Our competitors have also been involved in this type of litigation and, in some cases, class actions, where the result has been a large cash award against the competitor. These types of challenges, awards or settlements could provide incentives for similar actions by former consultants against us in the future. Any such challenge involving us or others in our industry could harm our business by resulting in fines or damages against us, creating adverse publicity about us or our industry, or hurting our ability to attract and retain consultants. We believe that compliance by consultants with our policies and procedures is critical to the integrity of our business, and, therefore, we will continue to be aggressive in enforcing them. As such, there can be no assurance that this type of litigation will not occur again in the future or result in an award or settlement that has an adverse effect on our business.
Since our businesses rely on independent third parties to manufacture and supply many of their products, if these third
parties fail to reliably supply products at required levels of quantity and quality, then our business, financial condition and
results of operations would be harmed.
13
PartyLite manufactures substantially all of its candles, but all of its accessories are manufactured by third parties, primarily based overseas. All of Silver Star Brands' products are manufactured and supplied by third party manufacturers, primarily based overseas. If any of the third party manufacturers were to become unable or unwilling to continue to provide products in required volumes and at suitable quality levels, we would be required to identify and obtain acceptable replacement manufacturing sources. There is no assurance that we would be able to obtain alternative manufacturing sources on a timely basis. An extended interruption in the supply of products would result in loss of sales, which could negatively impact our business, financial condition and results of operations. In addition, any actual or perceived degradation of product quality as a result of reliance on third party manufacturers may have an adverse effect on sales or result in increased product returns.
If PartyLite is unable to manufacture its candles at required levels of quantity and quality, then our business, financial
condition and results of operations could be harmed.
PartyLite will manufacture substantially all of its candles at its manufacturing facility in Batavia, IL. As a result, PartyLite will depend upon the uninterrupted and efficient operation of one manufacturing facility. Those operations are subject to power failures, the breakdown, failure or substandard performance of equipment, the improper installation, maintenance and operation of equipment, natural or other disasters, and the need to comply with the requirements or directives of government agencies. If PartyLite's manufacturing facility was to experience a catastrophic loss, it would disrupt our operations and could result in personal injury or property damage, damage relationships with PartyLite's consultants and customers or result in large expenses to repair or replace the facility, as well as result in other liabilities and adverse impacts. If PartyLite were to become unable to provide candles in required volumes and at suitable quality levels we would be required to identify and obtain acceptable replacement third party manufacturing sources. There is no assurance that we would be able to obtain alternative manufacturing sources on a timely basis. An extended interruption in the supply of candles would result in loss of sales by PartyLite, which could negatively impact our business, financial condition and results of operations. In addition, any actual or perceived degradation of product quality as a result of reliance on third party manufacturers instead of PartyLite for the manufacture of its candles could have an adverse effect on sales or result in increased product returns.
PartyLite's manufacturing facility is subject to a variety of environmental laws relating to the storage, discharge, handling,
emission, generation, manufacture, use and disposal of chemicals, solid and hazardous waste, and other toxic and hazardous
materials. PartyLite's manufacturing operations presently do not result in the generation of material amounts of hazardous or
toxic substances. Nevertheless, complying with new or more stringent laws or regulations, or more vigorous enforcement of
current or future policies of regulatory agencies, could require substantial expenditures by us that could have a material adverse
effect on our business, financial condition or results of operations. Environmental laws and regulations require us to maintain
and comply with a number of permits, authorizations and approvals and to maintain and update training programs and safety
data regarding materials used in our processes. Violations of those requirements could result in financial penalties and other
enforcement actions and could require us to halt one or more portions of our operations until a violation is cured. The
combined costs of curing incidents of non-compliance, resolving enforcement actions that might be initiated by government
authorities or of satisfying new legal requirements could have a material adverse effect on our business, financial condition or
results of operations.
Disruptions to transportation channels that we use to distribute our products may adversely affect us.
We may experience disruptions to the transportation channels used to distribute our products, including increased airport and
shipping port congestion, lack of transportation capacity, increased fuel expenses and a shortage of manpower. Disruptions in
our container shipments may result in increased costs, including the additional use of air freight to meet demand. Although we
have not recently experienced significant shipping disruptions, we continue to watch for signs of upcoming congestion.
Congestion in ports can affect previously negotiated contracts with shipping companies, resulting in unexpected increases in
shipping costs.
Our profitability may be affected by shortages or increases in the cost of raw materials.
Certain raw materials could be in short supply due to price changes, capacity, availability, a change in production requirements,
weather or other factors, including supply disruptions due to production or transportation delays. PartyLite sources petroleum-based paraffin wax (which is used to manufacture candles) from several suppliers. While the price of crude oil is only one of several factors impacting the price of paraffin, it is possible that fluctuations in oil prices may have a material adverse effect on the cost and availability of petroleum-based products used in the manufacture or transportation of PartyLite's products. In recent years, substantial cost increases for certain raw materials, such as paraffin and paper, negatively impacted our profitability, and the global supply of paraffin has declined. There can be no assurance that PartyLite will have continued access to an adequate supply of paraffin or that it will able to identify and procure an adequate supply of a suitable replacement if required to do so. In addition, a number of governmental authorities in the United States and abroad have introduced or are
14
contemplating enacting legal requirements, including emissions limitations, cap and trade systems and other measures to reduce production of greenhouse gases, in response to the potential impacts of climate change. These measures may have an indirect effect on us by affecting the prices of products made from fossil fuels, including paraffin. Given the wide range of potential future climate change regulations and their effects on these raw materials, the potential indirect impact to our operations is uncertain. In addition, climate change might contribute to severe weather in the locations where fossil fuel-based raw materials are produced, such as increased hurricane activity in the Gulf of Mexico, which could disrupt the production, availability or pricing of these raw materials. Volatility in the prices of raw materials could increase our cost of sales and reduce our profitability. Moreover, we may not be able to implement price increases for products to cover any increased costs, and any price increases we implement may result in lower sales volumes. If our businesses are not successful in managing ingredient costs, if they are unable to increase their prices to cover increased costs or if such price increases reduce their sales volume, then such increases could harm our business, financial condition and results of operations.
If we lose the services of key employees, then our business, financial condition and results of operations would be harmed.
We depend on the continued services of Robert B. Goergen, our executive Chairman of the Board; Robert B. Goergen, Jr., our President and Chief Executive Officer and President PartyLite Worldwide; and Jane F. Casey, our Vice President and Chief Financial Officer. In addition, PartyLite depends upon the continued services of the other members of its current senior management teams, including the relationships that they have developed with PartyLite's senior independent consultants. The loss or departure of these key employees could negatively impact PartyLite's relationship with its senior independent consultants and harm our business, financial condition and results of operations. If any of these key employees does not remain with us, our business could suffer. The loss of any key employees could negatively impact our ability to implement our business strategy. Our continued success will also depend upon our ability to retain existing, and attract additional, qualified personnel to meet our needs. Replacing key employees may be difficult and may require an extended period of time because of the limited number of individuals in our industry with the necessary breadth of skills and experience.
We may be held responsible for certain taxes or assessments relating to the activities of our consultants.
The earnings of consultants are subject to taxation, and, in some instances, legislation or governmental regulations impose obligations on PartyLite to collect or pay taxes, such as value-added taxes, and to maintain appropriate records. In addition, we may be subject to the risk in some jurisdictions of new liabilities being imposed for social security and similar taxes with respect to consultants. If local laws and regulations or the interpretation of local laws and regulations change to require PartyLite to treat consultants as employees, or if consultants are deemed by local regulatory authorities in one or more of the jurisdictions in which we operate to be our employees rather than independent contractors or agents under existing laws and interpretations, we may be held responsible for social charges and related taxes in those jurisdictions, plus related assessments and penalties.
There can be no assurances that we will identify suitable acquisition candidates, complete acquisitions on terms favorable to
us, successfully integrate acquired operations or that companies we acquire will perform as anticipated.
We seek to grow through strategic acquisitions in addition to internal growth. There can be no assurances that we will identify suitable acquisition candidates, complete acquisitions on terms favorable to us or be able to finance acquisitions. We also may
encounter difficulties in integrating acquisitions with our operations, applying our internal controls processes to these
acquisitions or in managing strategic investments. Additionally, we may not realize the degree or timing of benefits we
anticipate when we first enter into a transaction. We will not be required to submit acquisitions for stockholder approval,
except in certain situations that have not applied to any of our acquisitions and that we do not expect to apply to any future
acquisitions. In addition, accounting requirements relating to business combinations, including the requirement to expense
certain acquisition costs as incurred, may cause us to incur greater earnings volatility and generally lower earnings during
periods in which we acquire new businesses. Furthermore, covenants in our revolving loan agreement and term loan limit or restrict our and our subsidiaries' ability to engage in acquisitions.
The covenants in our revolving loan agreement and term loan limit our operating and financial flexibility.
The asset-based revolving loan agreement and term loan contain covenants that restrict, subject to certain exceptions, our and our domestic subsidiaries’ ability to, among other things: (i) incur indebtedness; (ii) create liens on assets; (iii) engage in mergers or consolidations; (iv) engage in certain dispositions or acquisitions of assets; (v) make investments, loans, guarantees or advances; (vi) pay dividends and distributions or repurchase our common stock; (vii) repay certain indebtedness; (viii) enter into sale and leaseback transactions; (ix) engage in certain transactions with affiliates; and (x) change the nature of our or our domestic subsidiaries’ business. In addition, the revolving loan agreement and term loan (a) require us to maintain a fixed charge coverage ratio (“FCCR”) of 1.0 to 1.0 upon the occurrence of certain events or conditions, (b) with certain exceptions,
15
prohibit us from making acquisitions if the FCCR is less than 1.0 to 1.0, and (c) among other conditions, prohibit us from paying dividends or repurchasing our common stock under certain circumstances. We estimate that our FCCR was less than 1.0 to 1.0 at February 28, 2015. The term loan also requires us to make certain prepayments out of "excess cash flow" starting in 2017. The revolving loan agreement and term loan also contains certain additional affirmative, negative and financial covenants and events of default.
If our businesses fail to protect their intellectual property, then our ability to compete could be negatively affected.
All of our businesses attempt to protect their intellectual property rights, both in the United States and elsewhere, through a
combination of patent, trademark, copyright and trade secret laws, as well as licensing agreements and third-party nondisclosure and assignment agreements. The failure by our businesses to obtain or maintain adequate protection of their intellectual property rights for any reason could have a material adverse effect on our business, financial condition and results of operations.
We also possess trade secret rights in our consultant lists and related contact information. To protect our trade secrets and other proprietary information, we currently require most of our employees, consultants, advisors and collaborators to enter into confidentiality agreements. We cannot ensure that these agreements will provide meaningful protection for any of our trade secrets, knowhow or other proprietary information in the event of any unauthorized use, misappropriation or disclosure. If we are unable to maintain the proprietary and/or secret nature of our products and consultant lists, we could be materially adversely affected. Further, loss of protection for our consultant lists could harm our ability to recruit and retain consultants, which could harm our financial condition and results of operations.
The market for our products depends to a significant extent upon the goodwill associated with our trademarks and trade names.
We own most of the material trademarks and trade-name rights used in connection with the packaging, marketing and
distribution of our products in the markets where those products are sold. We rely on these trademarks, trade names, trade
dress and brand names to distinguish our products from the products of our competitors, and have registered or applied to
register many of these trademarks. We may not be successful in asserting trademark or trade-name protection against third
parties or otherwise successfully defending against a challenge to our trademarks or trade names. In addition, the laws of
other countries may not protect our intellectual property rights to the same extent as the laws of the United States. In the event that our trademarks or trade names are successfully challenged, we could be forced to rebrand our products, remove products from the market or pay a settlement, which could result in loss of brand recognition, and could require us to devote resources to advertising and marketing new brands and building goodwill in these new brands, trademarks and trade names. Further, we cannot ensure that competitors will not infringe our trademarks, pass off themselves or their goods and services as being ours or associated with ours or otherwise deprecate the value of the goodwill associated with our trademarks and trade names or that we will have adequate resources to enforce our trademarks. Infringement of our trademarks or trade names, passing off by a competitor or deprecating the goodwill associated with our trademarks could impair the goodwill associated with our brands and harm our reputation, which could materially harm our financial condition and results of operations.
We face the risk of claims that we have infringed third parties' intellectual property rights. Any claims of intellectual property
infringement, even those without merit, could be expensive and time consuming to defend; cause us to cease making, licensing,
selling or using products that incorporate the challenged intellectual property; require us to redesign, reengineer, or rebrand our
products or packaging, if feasible; divert management's attention and resources; or require us to enter into royalty or licensing
agreements in order to obtain the right to use a third party's intellectual property. Any royalty or licensing agreements, if
required, may not be available to us on acceptable terms or at all.
We depend upon our information-technology systems, and if we experience interruptions in these systems, our business,
financial condition and results of operations could be negatively impacted.
Our businesses are increasingly dependent on information-technology systems to operate their websites, communicate with
their independent consultants, calculate compensation due to their consultants, process transactions, manage inventory, purchase, sell and ship goods on a timely basis and maintain cost-efficient operations, including information technology that they license from third parties. There is no guarantee that our businesses will continue to have access to these third-party information-technology systems after the current license agreements expire, and if they do not obtain licenses to use effective replacement information-technology systems, our business, financial condition and results of operations could be adversely affected.
Previously, our businesses have experienced interruptions resulting from upgrades to some of their information-technology
systems that temporarily reduced the effectiveness of their operations. Our information-technology systems depend on global
communication providers, telephone systems, hardware, software and other aspects of Internet infrastructure that have
16
experienced system failures in the past. Our systems are susceptible to outages due to fire, floods, power loss,
telecommunication failures and similar events. Despite the implementation of network security measures, our systems are
vulnerable to computer viruses, break-ins and similar disruptions from unauthorized tampering with our systems. The
occurrence of these or other events could disrupt or damage our information-technology systems and inhibit internal operations,
the ability to provide service to our consultants and customers or their ability to access our information systems. If we are unable to effectively upgrade our systems and network infrastructure and take other steps to improve the efficiency of our systems, it could cause system interruptions or delays and adversely affect our operating results.
The Internet plays a major role in our interaction with customers and consultants. The disruptions described above may make our websites and online services unavailable or slow to respond and prevent us from efficiently fulfilling orders, which may reduce our sales and the attractiveness of our products and services. Risks such as changes in required technology interfaces, website downtime and other technical failures, security breaches and consumer privacy regulations are key concerns related to the Internet. Our failure to respond successfully to these risks and uncertainties could reduce sales, increase costs and damage our relationships.
Management uses information systems to support decision-making and to monitor business performance. We may fail to
generate accurate financial and operational reports essential for making decisions at various levels of management. Failure to
adopt systematic procedures to maintain quality information-technology general controls could impact management's decision making and performance monitoring, which could disrupt our business. In addition, if we do not maintain adequate controls
such as reconciliations, segregation of duties and verification to prevent errors or incomplete information, our ability to operate
our business could be limited.
As a result of our online sales, we process, store and transmit large amounts of data, including personal information. If we fail to prevent or mitigate data loss, security breaches or the circumvention of our security measures, our systems could allow data loss or misappropriation of confidential, proprietary and/or personal information - including that of third parties such as consultants and customers collected in our online businesses - or could interrupt our operations, damage our computers or otherwise harm our reputation and business. Although we have developed systems and processes that are designed to protect this information and prevent data loss and security breaches, such measures cannot provide absolute security. In addition, we rely on third party technology, systems and services in certain aspects of our business, including storage encryption and authentication technology to securely transmit confidential information. These third party systems also cannot provide absolute security.
Our storage of user and employee data subjects us to a number of federal, state and foreign laws and regulations governing the collection, storage, handling or sharing of personal data.
We collect, handle, store and disclose personal data collected from users of our websites and mobile applications, as well as our
employees, consultants, and potential and actual purchasers of our products. In this regard, we are subject to a number of U.S. federal, state and foreign laws and regulations. The FTC, state attorneys general and foreign data protection and consumer protection authorities actively investigate and enforce compliance with laws and regulations governing fair information practices, as they are evolving in practice and being tested in courts. These laws, including the FTC Act, could be interpreted in ways that could harm our business, particularly if we are deemed to engage in unfair or deceptive trade practices with regard to our collection, storage, handling or sharing of personal data. Risks attendant upon our conduct of business on the Internet and data collection practices may involve user or employee privacy, data protection, electronic contracts, consumer protection, taxation and online payment services. The adoption of new laws and regulations or changes in the interpretations of existing laws and regulations regarding the storage, handling, collection and sharing of personal data may result in significant compliance costs or otherwise negatively impact our business. Our consultants also collect, store, handle and process personal data. A violation of law or fair information practices by a consultant could cause us financial or reputational harm.
A breach of information security, including a cybersecurity breach or failure of one or more key information technology systems, networks, hardware, processes, associated sites or service providers could have a material adverse impact on our business or reputation.
Numerous and evolving cybersecurity threats pose a potential risk to the security of our information technology systems, networks and services, as well as the confidentiality, availability and integrity of our data. Since the techniques used in these cyber-attacks change frequently and may be difficult to detect for periods of time, we may face difficulties in anticipating and implementing adequate preventative measures. Our information technology systems have been, and will likely continue to be, subject to computer viruses or other malicious codes, unauthorized access attempts, phishing and other cyber-attacks. To date, we have seen no material impact on our business or operations from these attacks; however, we cannot guarantee that our security efforts will prevent breaches or breakdowns to our or our third party providers’ databases or systems. If the information
17
technology systems, networks or service providers we rely upon fail to function properly, or if we or one of our third-party providers suffer a loss, significant unavailability or disclosure of our business, customer, consultant or other information, due to any number of causes, ranging from catastrophic events or power outages to improper data handling or security breaches, and our business continuity plans do not effectively address these failures on a timely basis, we may be exposed to reputational, competitive and business harm as well as litigation and regulatory action. The costs and operational consequences of responding to breaches and implementing remediation measures could be significant.
Our business is susceptible to fraud, including credit card and debit card fraud.
Our customers and consultants typically pay for their orders with debit cards or credit cards. Our reputation, business and results of operations could be negatively impacted if we experience credit card and debit card fraud. Failure to adequately detect and avoid fraudulent credit card and debit card transactions could cause our businesses to lose their ability to accept credit cards or debit cards as forms of payment and/or result in charge-backs of the fraudulently charged amounts and/or significantly decrease revenues. Furthermore, credit card and debit card fraud may lessen customers' and consultants' willingness to purchase our products.
Changes in our effective tax rate may have an adverse effect on our financial results.
Our effective tax rate and the amount of our provision for income taxes may be adversely affected by a number of factors,
including:
• the jurisdictions in which profits are determined to be earned and taxed;
• adjustments to estimated taxes upon finalization of various tax returns;
• changes in available tax credits;
• changes in the valuation of our deferred tax assets and liabilities;
• the resolution of issues arising from uncertain positions and tax audits with various tax authorities;
• the non-deductibility of certain expenditures for tax purposes;
• changes in accounting standards or tax laws and regulations, or interpretations thereof; and
• penalties and/or interest expense that we may be required to recognize on liabilities associated with uncertain tax
positions.
A substantial amount of our deferred tax assets include foreign tax credits. We reduce deferred tax assets by a valuation allowance if, based on the weight of available evidence, some portion or all of the deferred tax assets are unlikely to be realized. Recording of valuation allowances includes estimates and therefore involves inherent uncertainty. In the fourth quarter of 2014, we recorded a $19.6 million valuation allowance on foreign tax credits. We may also be required to record valuation allowances in the future, and our future results and financial condition may be adversely affected if we are required to do so. We may also be affected by future tax regulatory changes since the recordation of deferred tax assets and valuation allowances have been made based on the currently effective tax regulations.
We do not collect sales or consumption taxes in some states.
Some jurisdictions have implemented, or may implement, laws that require out-of-state sellers of tangible personal property to collect and remit taxes. In particular, the Streamlined Sales Tax Project (an ongoing, multi-year effort by U.S. state and local governments to pursue federal legislation that would require collection and remittance of remote sales tax by out-of-state sellers) could allow states that meet certain simplification and other standards to require out-of-state sellers to collect and remit sales taxes on goods purchased by in-state residents. The adoption of remote sales tax collection legislation would result in the imposition of sales taxes and additional costs associated with complex sales tax collection, remittance and audit compliance requirements on us. A successful assertion by one or more states or foreign countries requiring us to collect taxes where we do not do so could result in substantial tax liabilities, including for past sales, as well as penalties and interest.
Since our periodic results of operations may fluctuate, we may fail to meet or exceed the expectations of investors or
securities analysts, which could cause our stock price to decline.
Our periodic results of operations have fluctuated in the past and are likely to fluctuate significantly in the future. Our periodic
results of operations may fluctuate as a result of many factors, including those listed below, many of which are outside of our
control:
• demand for and market acceptance of our products;
• our ability to recruit, retain and motivate consultants;
18
• the timing and success of introductions of new products by us or our competitors;
• the strength of the economy;
• changes in our pricing policies or those of our competitors;
• competition, including entry into the industry by new competitors and new offerings by existing competitors;
• the impact of seasonality on our business; and
• the international expansion of our operations.
These factors, among others, make business forecasting difficult, may cause quarter to quarter fluctuations in our results of
operations and may impair our ability to predict financial results accurately, which could reduce the market price of our
common stock. Therefore, you should not rely on the results of any one quarter or year as an indication of future performance.
Furthermore, period to period comparisons of our results of operations may not be as meaningful for our company as they may
be for other public companies.
Our profitability could be adversely affected by increased mailing, printing and shipping costs.
Postal rate increases and paper and printing costs affect the cost of our catalog and promotional mailings. Future additional
increases in postal rates or in paper or printing costs would reduce Silver Star Brands' profitability to the extent that it is unable
to pass those increases directly to customers or offset those increases by raising selling prices or by reducing the number and
size of certain catalog circulations. The sales volume and profitability of both of our businesses could be affected by increased costs to ship our products.
The turmoil in the financial markets in recent years could increase our cost of borrowing and impede access to or increase
the cost of financing our operations and investments and could result in additional impairments to our businesses.
United States and global credit and equity markets have undergone significant disruption in recent years, making it difficult for
many businesses to obtain financing on acceptable terms, if at all. In addition, in recent years equity markets have experienced
rapid and wide fluctuations in value. If these conditions continue or worsen, our cost of borrowing may increase and it may be
more difficult to obtain financing for our businesses. In addition, while our debt is not currently being rated, our future borrowing costs could be affected by short and long-term debt ratings assigned by independent rating agencies if we choose to raise capital with public debt. A decrease in these ratings by the agencies would likely increase our cost of future borrowings and/or make it more difficult for us to obtain financing. In the event current market conditions continue we will more than likely be subject to higher interest costs than we are currently incurring. In addition, we may be subject to future impairments of our assets, including accounts receivable, inventories, property, plant and equipment, goodwill and other intangibles, if the valuation of these assets or businesses declines.
We have agreed to lend ViSalus up to $6.0 million and to reimburse them for up to $4.0 million in legal fees.
In October 2014, we and ViSalus entered into a revolving loan agreement pursuant to which we agreed to lend ViSalus up to $6.0 million. The revolving loan agreement will terminate on the later of (i) October 17, 2019 or (ii) resolution of the putative class action that is pending against ViSalus and others in the United States District Court in the Eastern District of Michigan, Southern Division (the “ViSalus Lawsuit”). Loans made under the revolving loan agreement will be unsecured and there are no financial performance covenants under the loan agreement and limited negative covenants. ViSalus will be permitted to obtain financing from other parties, whether that financing is secured or unsecured. In addition, in connection with the ViSalus recapitalization in September 2014, we agreed to reimburse and pay on behalf of ViSalus 80% of the legal fees and disbursements reasonably charged by ViSalus’s legal counsel and reasonable out-of-pocket expenses incurred by ViSalus in defending ViSalus and certain others against the claims asserted by the plaintiffs in the ViSalus Lawsuit, up to a maximum amount of $4.0 million.
The operation of Silver Star Brands' credit program, including higher than expected rates of customer defaults, could
adversely affect Silver Star Brands' sales and earnings and impact its cash flow from operations.
Silver Star Brands allows some of its customers to purchase products and pay for them with monthly payments over time,
which impacts Silver Star Brands' working capital requirements and cash flow from operations. Although customers are
selected and dollar limits on their purchases under the program are set using parameters that seek to ensure that most customers
will be able to make the monthly payments under the program, some customers default on their obligations under the program
and there is a risk that defaults may occur in larger than anticipated amounts. In addition the program may become subject to
regulatory regimes including, but not limited to, regulations that might be issued by the Consumer Financial Protection Bureau.
The operation of the credit program and the application of such regulatory regimes or changes to them, if either occurs, may
affect Silver Star Brands' sales and/or financial performance.
19
Our stock price has been volatile, has a small public float and is subject to market conditions.
The trading price of our common stock has been subject to wide fluctuations. Due to the large ownership of our common stock
by Robert B. Goergen and his affiliates, we have a relatively small public float compared to the number of our shares
outstanding. Accordingly, we cannot predict the extent to which investors' interest in our common stock will provide an active
and liquid trading market.
If securities or industry analysts do not publish research reports about our business, or publish negative reports about
our business, our share price and trading volume could decline.
The trading market for our common stock depends, to some extent, on the research reports that securities or industry
analysts may publish about us. We are not currently followed by securities or industry analysts, and there can be no assurance
that any analysts will begin to follow us. In the event that securities or industry analysts begin to cover us, we will not have
any control over them or the reports that they may issue. If our financial performance fails to meet analyst estimates in the
future or one or more of the analysts who cover us at such time downgrade our shares or change their opinion of our shares, our
share price would likely decline. Since we are not currently followed by analysts, we do not have significant visibility in the
financial markets, which could cause our share price or trading volume to decline. Moreover, since we do not currently have any analyst coverage, the price of our stock may be influenced by articles and opinions expressed in newsletters or on Internet message boards, any of which may contain inaccuracies or misstatements. If analysts begin to cover us and one or
more of such analysts cease coverage of our company or fail to regularly publish reports on us, our share price or trading
volume may decline. Our operating results in future quarters may be below the expectations of securities analysts and
investors. If that were to occur, the price of our common stock would likely decline, perhaps substantially.
If we fail to comply with Section 404 of the Sarbanes-Oxley Act of 2002, the market may have reduced confidence in our
reported financial information.
We must continue to document, test, monitor and enhance our internal control over financial reporting in order to satisfy the
requirements of Section 404 of the Sarbanes-Oxley Act of 2002. We will continue to perform the documentation and
evaluations needed to comply with Section 404. If during this process our management identifies one or more material
weaknesses in our internal control over financial reporting, we will be unable to assert that our internal controls are effective,
which may cause market participants to have reduced confidence in our reported financial condition.
20
Item 1B. Unresolved Staff Comments.
None.
Item 2. Properties.
The following table sets forth the location and approximate square footage of our major manufacturing, distribution, research and development, and office facilities for each of our business segments:
Location | Use | Business Segment | Approximate Square Feet | |
Owned | Leased | |||
Arndell Park, Australia | Distribution | Candles & Home Décor | — | 38,000 |
Batavia, IL | Manufacturing, Distribution and Research & Development | Candles & Home Décor | 420,000 | — |
Cumbria, England (1) | Manufacturing and related distribution | Candles & Home Décor | 90,000 | |
Oshkosh, WI | Distribution | Catalog & Internet | — | 386,000 |
Oshkosh, WI | Office | Catalog & Internet | — | 99,625 |
Plymouth, MA | Office | Candles & Home Décor | 100,000 | — |
Tilburg, Netherlands | Distribution | Candles & Home Décor | 442,500 | — |
(1) In January 2015, we announced our intention to shut down the Cumbria, England manufacturing facility, which we expect to complete in the first half of 2015. | ||||
Our executive and administrative offices are generally located in leased space (except for certain offices located in owned space).
Item 3. Legal Proceedings.
We are involved in litigation arising in the ordinary course of business, which, in our opinion, will not have a material adverse effect on our financial position, results of operations or cash flows.
Item 4. Mine Safety Disclosures.
Not applicable.
21
PART II
Item 5. Market for Registrant’s Common Equity, Related Stockholder Matters and Issuer Purchases of Equity Securities
Our Common Stock is traded on the New York Stock Exchange under the symbol BTH. The following table provides the closing price range for the Common Stock on the New York Stock Exchange:
High | Low | ||||||
Year Ended December 31, 2014 | |||||||
First Quarter | $ | 10.94 | $ | 8.90 | |||
Second Quarter | 10.72 | 7.42 | |||||
Third Quarter | 9.88 | 5.85 | |||||
Fourth Quarter | 10.27 | 7.68 | |||||
Year Ended December 31, 2013 | |||||||
First Quarter | $ | 17.36 | $ | 13.45 | |||
Second Quarter | 19.68 | 13.34 | |||||
Third Quarter | 15.23 | 8.70 | |||||
Fourth Quarter | 15.50 | 10.50 | |||||
Many of our shares are held in “street name” by brokers and other institutions on behalf of stockholders, and we had approximately 2,625 beneficial holders of Common Stock as of February 28, 2015.
During the year ended December 31, 2014 and December 31, 2013, the Board of Directors declared cash dividends as follows:
Regular Dividend | December 31, 2014 | December 31, 2013 | |||||
Second Quarter | $ | 0.05 | $ | 0.10 | |||
Fourth Quarter | $ | — | $ | 0.10 | |||
Our revolving loan agreement and term loan prohibit us from paying dividends or repurchasing common stock:
• for amounts in excess of $2.5 million in any twelve-month period;
• at times when there are no loans outstanding under the revolving loan agreement, if availability (on a pro forma basis) is less than $3.0 million; and
• at times when there are loans outstanding under the revolving loan agreement, if (a) availability (on a pro forma basis) is less than the greater of 30.0% of the revolving loan commitment or $2.25 million, (b) immediately after such dividend or repurchase, availability (on a pro forma basis) would be less than the greater of 30.0% of the revolving loan commitment or $2.25 million or (c) the FCCR is less than 1.1 to 1.0.
We estimate that our FCCR was less than 1.0 to 1.0 at February 28, 2015.
The following table sets forth, for the equity compensation plan categories listed below, information as of December 31, 2014:
Equity Compensation Plan Information
Plan Category | (a) Number of securities to be issued upon exercise of outstanding options, warrants and rights1 | (b) Weighted-average exercise price of outstanding options, warrants and rights1 | (c) Number of securities remaining available for future issuance under equity compensation plans (excluding securities reflected in column (a)) | ||||||
Equity compensation plans approved by security holders | — | $ | — | 1,570,776 | |||||
Equity compensation plans not approved by security holders | — | — | — | ||||||
Total | — | $ | — | 1,570,776 | |||||
1 The information in this column excludes 227,257 restricted stock units outstanding as of December 31, 2014.
22
The following table sets forth certain information concerning repurchases of our common stock during the quarter ended December 31, 2014.
Issuer Purchases of Equity Securities (1) | ||||||||||||
Period | Total Number of Shares Purchased | Price Paid per Share | Total Number of Shares Purchased as Part of Publicly Announced Plans or Programs | Maximum Number of Shares that May Yet Be Purchased Under the Plans or Programs | ||||||||
October 1, 2014 - October 31, 2014 | — | $ | — | — | 1,005,578 | |||||||
November 1, 2014 -November 30, 2014 | — | — | — | 1,005,578 | ||||||||
December 1, 2014 -December 31, 2014 | — | — | — | 1,005,578 | ||||||||
Total | — | $ | — | — | 1,005,578 | |||||||
(1) On September 10, 1998, our Board of Directors approved a share repurchase program pursuant to which we were originally authorized to repurchase up to 500,000 shares of common stock in open market transactions. From June 1999 to June 2006 the Board of Directors increased the authorization under this repurchase program five times (on June 8, 1999 to increase the authorization by 500,000 shares to 1.0 million shares; on March 30, 2000 to increase the authorization by 500,000 shares to 1.5 million shares; on December 14, 2000 to increase the authorization by 500,000 shares to 2.0 million shares; on April 4, 2002 to increase the authorization by 1.0 million shares to 3.0 million shares; and on June 7, 2006 to increase the authorization by 3.0 million shares to 6.0 million shares). On December 13, 2007, the Board of Directors authorized a new repurchase program, for 3.0 million shares, which became effective after we exhausted the authorized amount under the old repurchase program. As of December 31, 2014, we have purchased a total of 7,994,422 shares of common stock under the old and new repurchase programs. The new repurchase program does not have an expiration date. We intend to make further purchases under our repurchase program from time to time. Our revolving loan agreement and term loan limit and restrict our ability to repurchase our common stock. The amounts set forth in this paragraph have been adjusted to give effect to the 1-for-4 reverse stock split implemented in January 2009 and the 2-for-1 stock split implemented in June 2012.
23
Performance Graph
The performance graph set forth below reflects the yearly change in the cumulative total stockholder return (price appreciation and reinvestment of dividends) on our common stock compared to the Standard and Poor’s (“S&P”) 500 Index and the S&P SmallCap 600 Index. The graph assumes the investment of $100 in common stock and the reinvestment of all dividends paid on such common stock into additional shares of common stock and such indexes. We believe that it is appropriate to compare us to companies comprising the S&P SmallCap 600 Index, the index we are currently tracked in by S&P.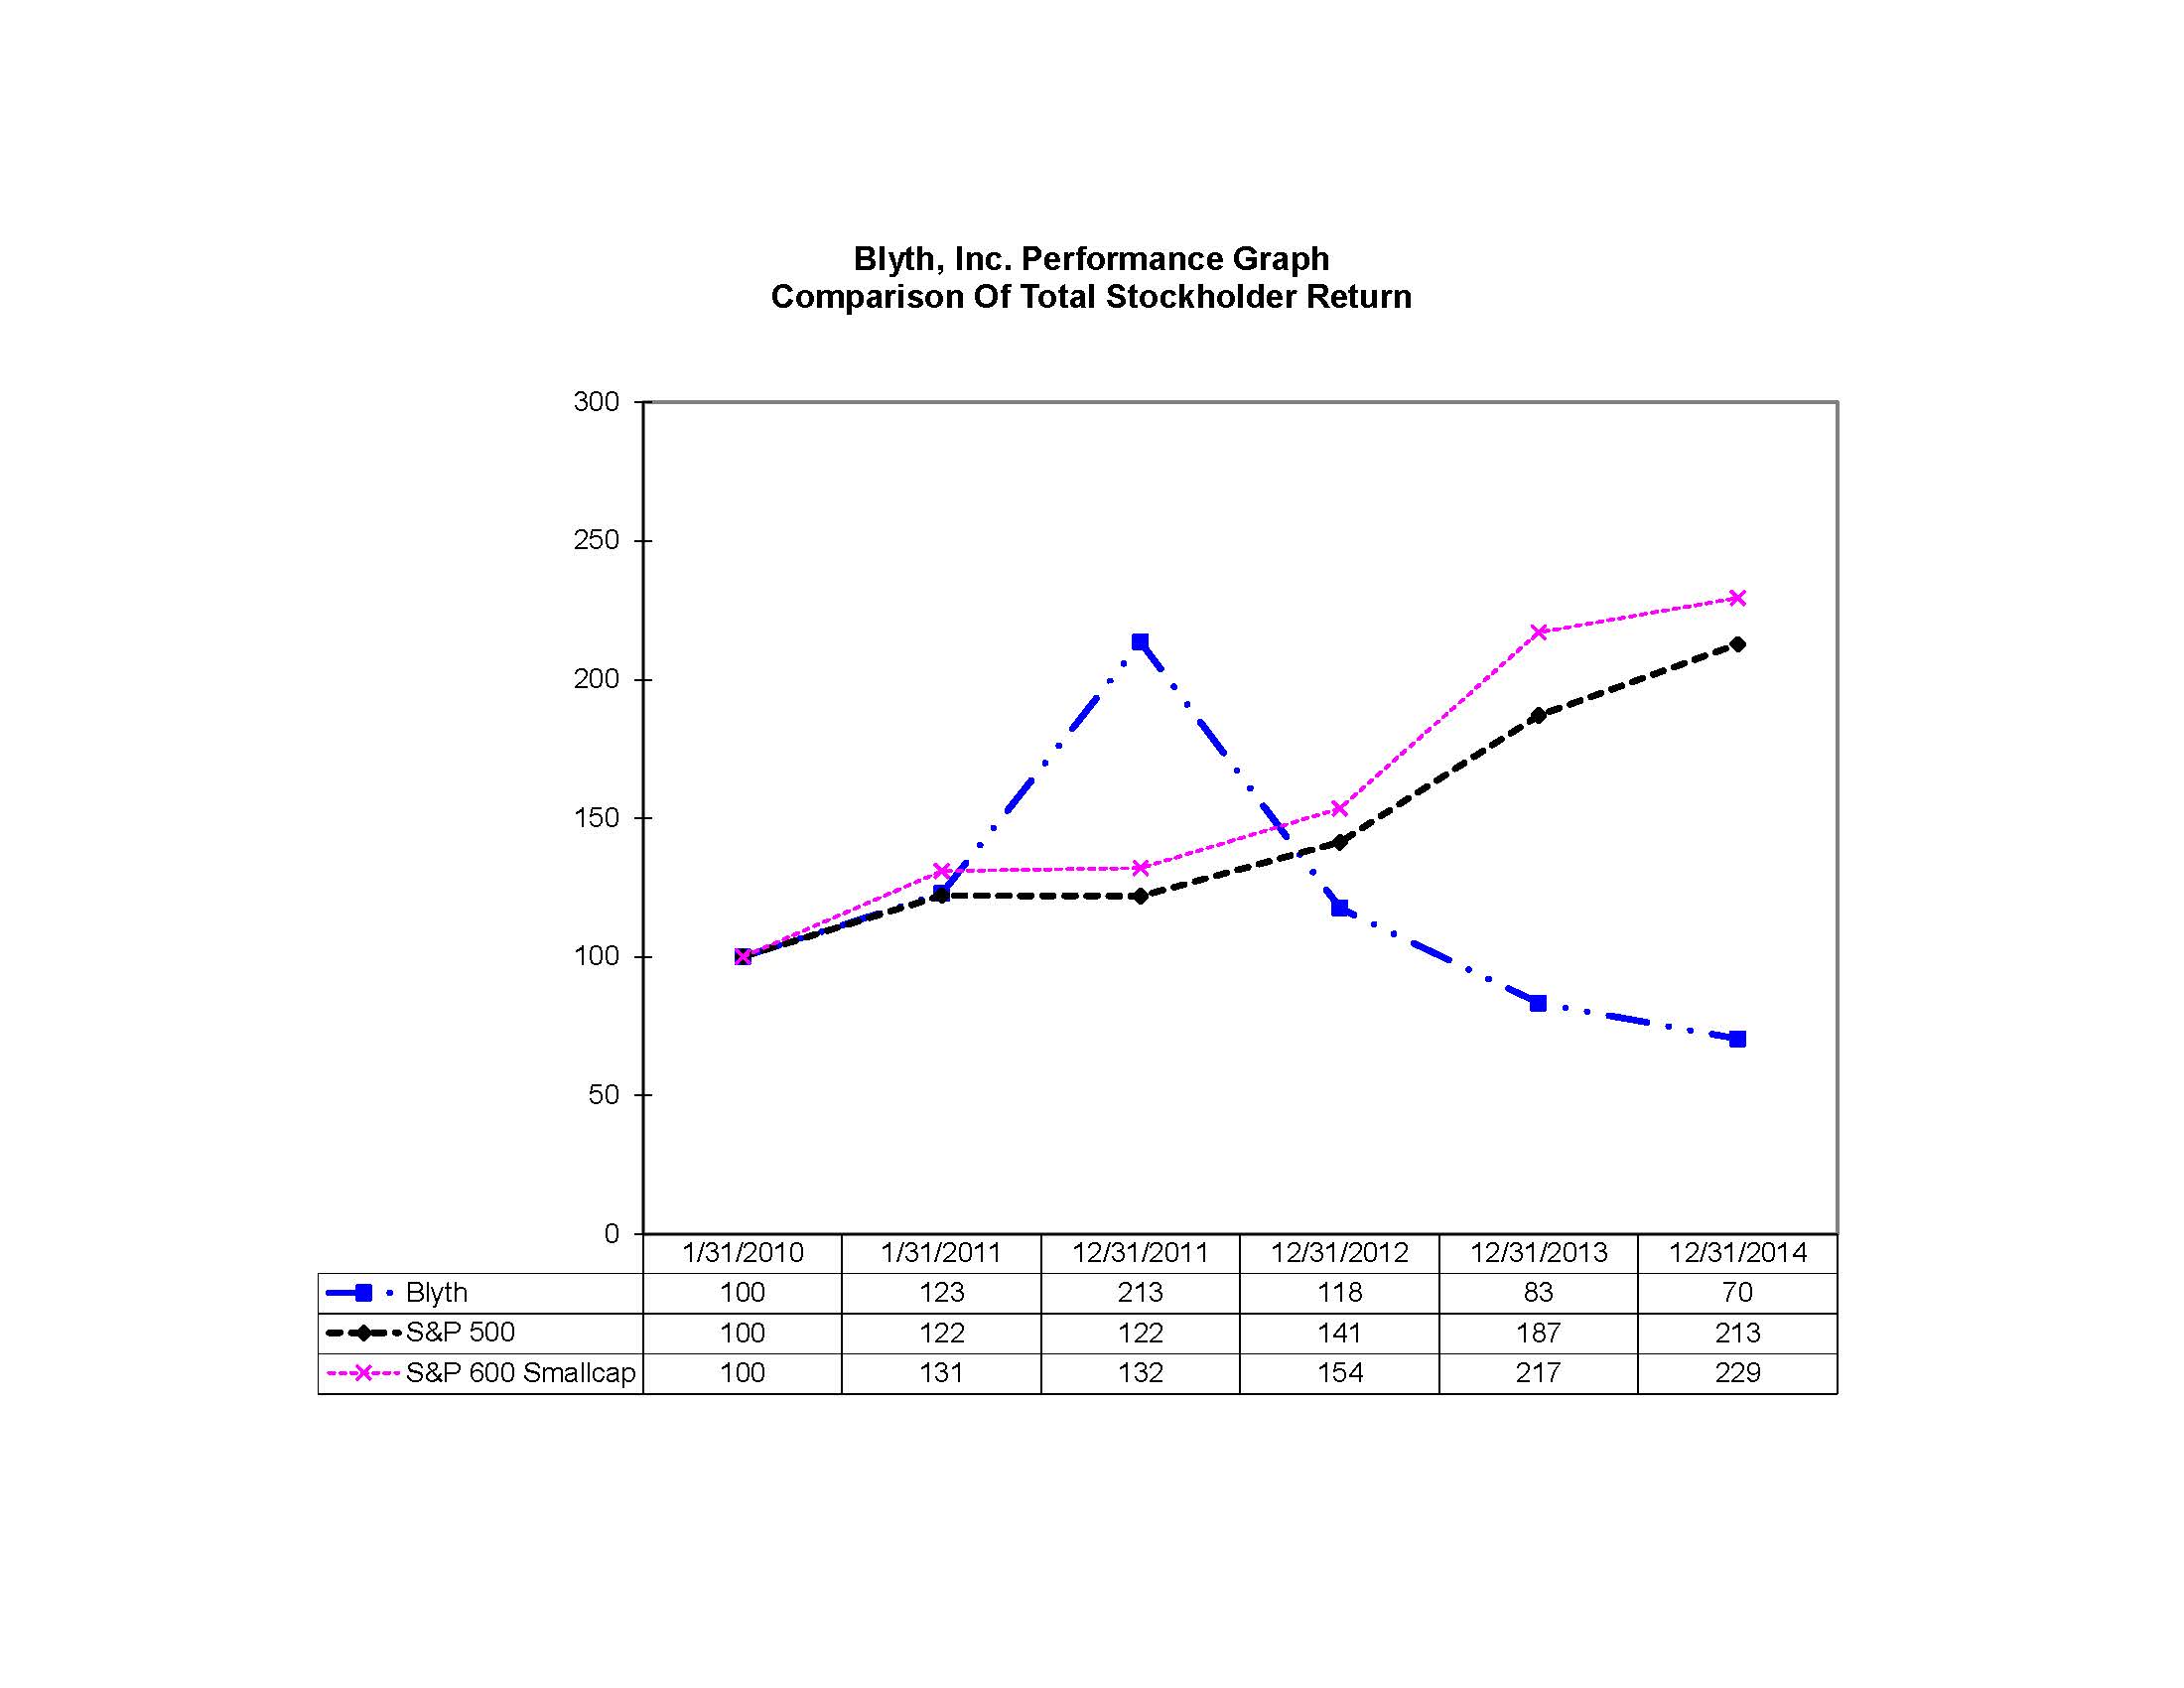
24
Item 6. Selected Financial Data
Set forth below are selected summary consolidated financial and operating data which have been derived from our audited financial statements. The information presented below should be read in conjunction with “Management’s Discussion and Analysis of Financial Condition and Results of Operations” and our Consolidated Financial Statements, including the notes thereto, appearing elsewhere in this Report. The per share amounts and number of shares outstanding have been retroactively adjusted to give effect to the 2-for-1 stock split implemented June 15, 2012.
In December 2011, we changed our fiscal year-end from January 31 to December 31. In addition, we have eliminated the lag differences in the reporting year-ends of certain of our subsidiaries to align them with our other subsidiaries fiscal year-end.
Years ended December 31, | Eleven Months ended December 31, | Year ended January 31, | |||||||||||||||||||||
(In thousands, except per share and percent data) | 2014 | 2013 | 2012 | 2011 | 2011 | 2011 | |||||||||||||||||
Statement of Earnings Data: | (2) | (2) | (Unaudited) | (2) | (2) | ||||||||||||||||||
Net sales | $ | 490,020 | $ | 534,262 | $ | 555,980 | $ | 648,498 | $ | 601,781 | $ | 701,450 | |||||||||||
Gross profit | 307,240 | 334,676 | 343,303 | 402,269 | 375,091 | 438,102 | |||||||||||||||||
Operating profit (1) | 7,097 | 11,890 | 4,015 | 24,660 | 29,744 | 50,060 | |||||||||||||||||
Earnings (loss) from continuing operations before income taxes and noncontrolling interest (3) | (3,512 | ) | 6,536 | 351 | 18,398 | 20,449 | 43,438 | ||||||||||||||||
Earnings (loss) from continuing operations | (24,583 | ) | (200 | ) | 3,001 | 21,455 | 22,695 | 28,780 | |||||||||||||||
Less: Net earnings attributable to noncontrolling interests | 343 | 313 | 281 | 280 | 257 | 225 | |||||||||||||||||
Earnings (loss) from discontinued operations | 111,687 | 2,946 | 41,282 | (7,425 | ) | (6,212 | ) | (1,964 | ) | ||||||||||||||
Net earnings attributable to Blyth, Inc. | 86,761 | 2,433 | 44,002 | 13,750 | 16,226 | 26,591 | |||||||||||||||||
Per share data: | |||||||||||||||||||||||
Diluted net earnings (loss) from continuing operations | $ | (1.54 | ) | $ | (0.03 | ) | $ | 0.16 | $ | 1.27 | $ | 1.34 | $ | 1.68 | |||||||||
Diluted net earnings (loss) from discontinued operations | 6.91 | 0.18 | 2.39 | (0.45 | ) | (0.37 | ) | (0.12 | ) | ||||||||||||||
Diluted net earnings attributable per share of Blyth, Inc. | $ | 5.37 | $ | 0.15 | $ | 2.55 | $ | 0.83 | $ | 0.97 | $ | 1.56 | |||||||||||
Cash dividends declared, per share | 0.05 | 0.20 | 0.18 | 0.85 | 0.85 | 0.60 | |||||||||||||||||
Diluted weighted average number of common shares outstanding | 16,165 | 16,228 | 17,247 | 16,656 | 16,656 | 17,017 | |||||||||||||||||
Operating Data: | |||||||||||||||||||||||
Gross profit margin | 62.7 | % | 62.6 | % | 61.7 | % | 62.0 | % | 62.3 | % | 62.5 | % | |||||||||||
Operating profit margin | 1.4 | % | 2.2 | % | 0.7 | % | 3.8 | % | 4.9 | % | 7.1 | % | |||||||||||
Net capital expenditures | $ | 2,867 | $ | 3,061 | $ | 9,098 | $ | 6,294 | $ | 5,786 | $ | 7,913 | |||||||||||
Depreciation and amortization | 8,322 | 9,889 | 10,132 | 10,785 | 9,774 | 10,976 | |||||||||||||||||
Balance Sheet Data: | |||||||||||||||||||||||
Total assets | $ | 287,353 | $ | 366,841 | $ | 436,114 | $ | 515,294 | $ | 515,294 | $ | 508,835 | |||||||||||
Total debt | 55,463 | 56,278 | 78,190 | 99,883 | 99,883 | 107,618 | |||||||||||||||||
Total stockholders' equity | $ | 133,571 | $ | 45,622 | $ | 58,536 | $ | 153,798 | $ | 153,798 | $ | 252,868 | |||||||||||
(1) Calendar year 2012 and 2011 and fiscal 2011 earnings include restructuring charges recorded in the Candles & Home Décor segment of $3.2 million, $3.0 million and $0.8 million, respectively.
(2) In September 2014, we entered into a recapitalization agreement with ViSalus that reduced our ownership in ViSalus from approximately 80.9% to 10.0%. In 2012, we sold our Sterno business and in 2011 we sold substantially all of the net assets of Midwest-CBK and disposed of the assets and liabilities of the Boca Java business as more fully detailed in Note 3 to the Consolidated
Financial Statements. The results of operations for these businesses have been reclassified to discontinued operations for all periods presented.
(3) In 2013, we paid make-whole interest expense of $1.2 million for the early retirement of our 5.50% Senior Notes recorded in Interest Expense. In addition, in 2012, we recorded a $1.9 million impairment on a promissory note in addition to other adjustments of $0.3 million, for a net write-down of $1.6 million recorded in Foreign exchange and other.
25
Item 7. Management’s Discussion and Analysis of Financial Condition and Results of Operations
The financial and business analysis below provides information that we believe is relevant to an assessment and understanding of our consolidated financial condition, changes in financial condition and results of operations. This financial and business analysis should be read in conjunction with our Consolidated Financial Statements and accompanying notes set forth in Item 8 “Financial Statements and Supplementary Data.”
Overview
We are a multi-channel company primarily focused on the direct-to-consumer market. Our products include an extensive array of decorative and functional household products such as candles, accessories, seasonal decorations, household convenience items and personalized gifts, as well as health, wellness and beauty related products. Our products can be found primarily throughout the United States, Canada, Mexico, Europe and Australia. Our financial results are reported in two segments: the Candles & Home Décor segment (PartyLite) and the Catalog & Internet segment (Silver Star Brands).
On September 4, 2014, we entered into a recapitalization agreement with the ViSalus founders and certain other preferred stockholders to exchange the ViSalus redeemable preferred stock for ViSalus common stock, which reduced our ownership in ViSalus from approximately 80.9% to 10.0%. In 2012, we divested our Sterno business. These transactions are more fully detailed in Note 3 to the Consolidated Financial Statements. The results of operations for these businesses have been presented as discontinued operations for all periods presented.
Our current focus is driving sales growth and profitability of our brands so we may leverage more fully our infrastructure, as
well as supporting new infrastructure requirements of some of our businesses. New product development continues to be
critical to both segments of our business. In the Candles & Home Décor segment, monthly sales and productivity incentives are designed to attract, retain and increase the earnings opportunity of independent sales consultants. In the Catalog & Internet segment, product, merchandising and circulation strategy are designed to drive strong sales growth in smaller brands and expand the sales and customer base of our flagship brands.
Segments
Within the Candles & Home Décor segment, we design, manufacture or source, market and distribute an
extensive line of products including scented candles, candle-related accessories and other fragranced products under the
PartyLite® brand. Products in this segment are sold predominately through networks of independent sales consultants. PartyLite brand products are primarily sold in the United States, Canada, Mexico, Europe and Australia.
Within the Catalog & Internet segment, under the Silver Star Brands name, we design, source and market a broad
range of household convenience items, health, wellness and beauty products, holiday cards, personalized gifts, kitchen accessories, premium photo albums and frames. These products are sold directly to the consumer under the Miles Kimball®, Walter Drake®, Easy Comforts®, As We Change®, Exposures® and Native Remedies® brands. These products are sold in the United States and Canada.
The following table sets forth, for the periods indicated, the percentage relationship to net sales and the percentage increase or decrease of certain items included in our Consolidated Statements of Earnings:
Percentage of Net Sales (1) | Percentage Increase (Decrease) from Prior Period | |||||||||||||
Years ended | ||||||||||||||
12/31/2014 | 12/31/2013 | 12/31/2012 | 12/31/14 compared to 12/31/13 | 12/31/13 compared to 12/31/12 | ||||||||||
Net sales | 100.0 | 100.0 | 100.0 | (8.3 | ) | (3.9 | ) | |||||||
Cost of goods sold | 37.3 | 37.4 | 38.3 | (8.4 | ) | (6.2 | ) | |||||||
Gross profit | 62.7 | 62.6 | 61.7 | (8.2 | ) | (2.5 | ) | |||||||
Selling | 45.7 | 45.1 | 44.8 | (7.1 | ) | (3.3 | ) | |||||||
Administrative | 15.6 | 15.3 | 16.2 | (6.6 | ) | (9.1 | ) | |||||||
Operating profit | 1.4 | 2.2 | 0.7 | (40.3 | ) | 196.1 | ||||||||
Earnings (loss) from continuing operations | (5.1 | ) | (0.1 | ) | 0.5 | 4,758.9 | (118.9 | ) | ||||||
26
(1) In 2014 we entered into a recapitalization agreement with ViSalus and in 2012, we sold our Sterno business as more fully detailed in Note 3 to the Consolidated Financial Statements. The results of operations for these businesses have been reclassified to discontinued operations for all periods presented.
For the year ended December 31, 2014 compared to the year ended December 31, 2013
Net Sales
Net sales decreased 8%, or approximately $44.3 million, to $490.0 million for the year ended December 31, 2014 from $534.3 million for the year ended December 31, 2013 primarily due to a decrease in the Candles & Home Décor segment and to a much lesser extent a decrease in the Catalog & Internet segment.
Net Sales – Candles & Home Décor Segment
Net sales for PartyLite decreased $43.2 million, or 11%, to $347.6 million for the year ended December 31, 2014 from $390.8 million in the prior year. This decline was principally due to a decrease at PartyLite North America of 20% and a decrease at PartyLite Europe of 8%, or down 6% in local currency. These declines were principally due to a reduction in consultant counts which resulted in a lower number of shows. Net sales at PartyLite Australia were down 2% compared to last year in U.S. dollars, however sales increased 4% in local currency.
PartyLite's European active independent sales consultants decreased to approximately 27,600 at December 31, 2014 from approximately 30,200 at December 31, 2013. North American active independent sales consultants decreased to approximately 14,800 at December 31, 2014 from approximately 16,800 at December 31, 2013.
Net sales in the Candles & Home Décor segment accounted for approximately 71% of total Blyth net sales for the year ended December 31, 2014 compared to 73% in the prior year.
Net Sales – Catalog & Internet Segment
Net sales for Silver Star Brands decreased $1.1 million, or 1%, to $142.4 million for the year ended December 31, 2014 from $143.5 million in the prior year reflecting a higher number of sales orders deferred this year versus the prior year partly offset by increases associated with health, wellness and beauty products and increased sales on preferred credit. Net sales in the Catalog & Internet segment accounted for approximately 29% of total Blyth net sales for the year ended December 31, 2014 compared to 27% in the prior year.
Gross Profit and Operating Expenses
Blyth’s consolidated gross profit decreased $27.5 million, or 8%, to $307.2 million for the year ended December 31, 2014 from $334.7 million for the year ended December 31, 2013. This decrease was principally due to the impact of lower sales, as well as a one-time fixed asset impairment charge of $0.6 million on certain machinery and equipment located at the Cumbria, United Kingdom facility. Gross margin increased to 62.7% for the year ended December 31, 2014 from 62.6% for the prior year primarily due to the implementation of various cost saving programs.
Blyth’s consolidated selling expenses decreased $17.2 million, or approximately 7%, to $223.7 million for the year ended December 31, 2014 from $240.9 million for the year ended December 31, 2013. This decrease was primarily due to lower commission expenses at PartyLite associated with their sales decline. Selling expenses as a percentage of net sales increased to 45.7% from 45.1% when compared to the prior year. This increase was mainly due to the impact of a lower sales base.
Blyth’s consolidated administrative and other expenses decreased $5.4 million, or 7%, to $76.4 million for the year ended December 31, 2014 from $81.8 million for the year ended December 31, 2013. This decline was principally due to lower administrative overhead and other cost saving initiatives throughout the company. Administrative expenses as a percentage of net sales increased to 15.6% for the year ended December 31, 2014 from 15.3% for the prior year. This increase was mainly due to the impact of a lower sales base.
Blyth’s consolidated operating profit decreased $4.8 million to $7.1 million for the year ended December 31, 2014 from $11.9 million for the year ended December 31, 2013. This decrease was principally due to lower sales and operating profit at PartyLite partly offset by a decrease in operating losses at Silver Star Brands.
Operating Profit – Candles & Home Décor Segment
27
Operating profit for PartyLite was $7.5 million for the year ended December 31, 2014 versus $14.8 million for the prior year, a decline of $7.3 million. This decrease was principally due to the impact of sales declines at PartyLite Europe and PartyLite North America. In addition to the impact of lower sales, PartyLite Europe was affected by the stronger U.S. dollar, which negatively impacted full year 2014 profits by approximately $1.8 million. These decreases were partly offset by cost reduction programs. Included in this year's operating profit is a one-time fixed asset impairment of $0.6 million on certain machinery and equipment located at the Cumbria, United Kingdom facility. Corporate expenses charged to PartyLite were $10.1 million this year and $12.2 million last year.
Operating Loss – Catalog & Internet Segment
Operating loss for Silver Star Brands was $0.4 million for the year ended December 31, 2014 versus a $2.9 million loss for the prior year. This improvement was due to reduced promotional expenses, lower catalog costs due to shifts to eCommerce, an increase in proprietary sales of health, wellness and beauty products that carry higher gross margins than general merchandise products, and higher credit sales. Corporate expense charged to Silver Star Brands were $3.9 million this year and $4.5 million last year.
Other Expense (Income)
Interest expense increased $1.0 million to $7.0 million for the year ended December 31, 2014 from $6.0 million in the prior year. This increase was principally due to charges associated with the debt modification of our 6.00% Senior Notes, which were originally due in 2017. Additional charges this year relate to accelerated amortization of previously deferred costs of $1.2 million, as well as an accrual of a prepayment of $2.0 million premium paid to the Senior Notes holder in March 2015. Partly offsetting these fee increases was the charge of last year's make-whole interest payment on the early retirement of the 5.50% Senior Notes of $1.2 million, as well as the impact of lower outstanding debt this year as compared to last year.
Interest income decreased $0.1 million to $0.5 million for the year ended December 31, 2014 from $0.6 million in the prior year, mainly due to lower invested average cash balances.
Foreign exchange and other expense was $4.0 million for the year ended December 31, 2014 compared to income of $0.1 million in the prior year. This increased expense was due to a $2.9 million impairment charge this year on our ViSalus investment as well as this year's foreign exchange losses mainly resulting from the U.S. dollar strengthening. Last year's income included losses on the sale of investments of $0.3 million.
Income tax expense increased $14.4 million to $21.1 million for the year ended December 31, 2014 from $6.7 million in the prior year. The effective tax rate was 600.0% in 2014 compared to 103.1% for 2013. The increase in the effective tax rate was due primarily to a valuation allowance which was recorded in the fourth quarter of 2014 on foreign tax credits of $19.6 million.
The net earnings from discontinued operations for the year ended December 31, 2014 were $111.7 million compared to $2.9 million in the prior year. The net earnings for the year ended December 31, 2014 from discontinued operations includes $118.9 million related to the gain on the ViSalus recapitalization during the period through its recapitalization date partly offset by operating losses from ViSalus of $7.2 million. The ViSalus recapitalization was non-cash and was treated as a tax free exchange as the preferred stockholders received ViSalus common stock in exchange for their preferred stock.
The net earnings attributable to noncontrolling interests remained constant at $0.3 million for the year ended December 31, 2014 and 2013.
Net earnings attributable to Blyth, Inc. increased $84.4 million to $86.8 million for the year ended December 31, 2014 from $2.4 million in the prior year. This increase is primarily attributable to the gain from the ViSalus recapitalization of $118.9 million partly offset by discontinued operations net loss of $7.2 million, higher tax expense of $14.4 million, higher other expenses of $5.3 million and lower operating profit of $4.8 million.
For the year ended December 31, 2013 compared to the year ended December 31, 2012
Net Sales
Net sales decreased 4%, or approximately $21.7 million, to $534.3 million for the year ended December 31, 2013 from $556.0 million for the year ended December 31, 2012 due to a 6% decrease in the Candles & Home Décor segment. Net sales in our Catalog & Internet segment increased 3% over the prior year.
28
Net Sales – Candles & Home Décor Segment
Net sales for PartyLite decreased $26.5 million, or 6%, to $390.8 million for the year ended December 31, 2013 from $417.3 million for the year ended December 31, 2012. This decline was mainly due to a 17% decline in North American sales due to a decline in active independent sales consultants to approximately 17,000 at December 31, 2013 from approximately 19,000 at December 31, 2012, as well as fewer shows, which results in fewer opportunities to promote our products and recruit new consultants.
In PartyLite’s European markets sales declined 6% in local currency or 2% in U.S. dollars mainly due to lower sales within the larger, more mature markets partly offset by higher sales in Austria and Finland. In addition, PartyLite Australia sales increased 27% in local currency or 17% in U.S. dollars mainly due to growing consultant counts. PartyLite's European independent consultant count was over 30,000 at December 31, 2013 and at December 31, 2012.
Net sales in the Candles & Home Décor segment accounted for approximately 73% of total Blyth net sales for the year ended December 31, 2013 compared to 75% for the year ended December 31, 2012.
Net Sales – Catalog & Internet Segment
Net sales for Silver Star Brands increased $4.8 million, or 3%, to $143.5 million for the year ended December 31, 2013 from $138.7 million for the year ended December 31, 2012. This increase was primarily due to the improved performance of our health, wellness and beauty products as well as higher sales associated with the credit program. These increases were partly offset by lower general merchandise sales. Net sales in the Catalog & Internet segment accounted for approximately 27% of total Blyth net sales for the year ended December 31, 2013 compared to 25% for the year ended December 31, 2012.
Gross Profit and Operating Expenses
Blyth’s consolidated gross profit decreased $8.6 million, or 3%, to $334.7 million for the year ended December 31, 2013 from $343.3 million for the year ended December 31, 2012. This decrease was principally due to the impact of lower sales. In addition, gross margin increased to 62.6% for the year ended December 31, 2013 from 61.7% for the year ended December 31, 2012 due to improvements at PartyLite and Silver Star Brands.
Blyth’s consolidated selling expenses decreased $8.3 million, or approximately 3%, to $240.9 million for the year ended December 31, 2013 from $249.2 million for the year ended December 31, 2012. This decrease was primarily due to lower commission expenses at PartyLite associated with its sales declines. Selling expenses as a percentage of net sales increased to 45.1% from 44.8% for the year ended December 31, 2012 principally due to lower sales.
Blyth’s consolidated administrative and other expenses decreased $8.3 million, or 9%, to $81.8 million for the year ended December 31, 2013 from $90.1 million for the year ended December 31, 2012. This decline was due to prior year charges at PartyLite associated with the realignment of the North American distribution center. In addition, corporate expenses declined from the prior year due to cost saving initiatives as well as the elimination of executive and employee bonuses. Administrative expenses as a percentage of net sales decreased to 15.3% for the year ended December 31, 2013 from 16.2% for the year ended December 31, 2012 principally due to cost saving initiatives.
Blyth’s consolidated operating profit increased $7.9 million to $11.9 million for the year ended December 31, 2013 from $4.0 million for the year ended December 31, 2012. This increase was principally due to an increase in operating profit at PartyLite and a decrease in operating loss at Silver Star Brands. In addition, prior year's operating profit includes PartyLite's restructuring charges of $3.2 million associated with the realignment of the North American distribution center and Silver Star Brands' intangible impairment charge of $0.8 million.
Operating Profit – Candles & Home Décor Segment
Operating profit for PartyLite increased to $14.8 million for the year ended December 31, 2013 from $12.3 million for the year ended December 31, 2012. Prior year profit includes restructuring charges of $3.2 million associated with the realignment of the North American distribution center. Corporate expenses charged to PartyLite were $12.2 million for the year ended December 31, 2013 and $15.7 million for the year ended December 31, 2012.
Operating Loss – Catalog & Internet Segment
29
Operating loss for Silver Star Brands decreased to $2.9 million for the year ended December 31, 2013 from $8.3 million for year ended December 31, 2012. This improvement was principally due to the impact of increased sales. In addition, last year's loss includes an intangible impairment charge of $0.8 million. Corporate expense charged to Silver Star Brands were $4.5 million for the year ended December 31, 2013 and $5.8 million for the year ended December 31, 2012.
Other Expense (Income)
Interest expense decreased $0.1 million to $6.0 million for the year ended December 31, 2013 from $6.1 million for year ended December 31, 2012. This decline was due to lower average outstanding debt this year versus last year offset by a make-whole interest charge of $1.2 million incurred in 2013 associated with the early retirement of the 5.50% senior notes settled in July 2013.
Interest income decreased $1.1 million to $0.6 million for the year ended December 31, 2013 from $1.7 million for year ended December 31, 2012, mainly due to lower invested average cash balances as well as prior year's interest income of $0.7 million received on a promissory note.
Foreign exchange and other income was $0.1 million for the year ended December 31, 2013 compared to $0.7 million for year ended December 31, 2012. This decline was due to this year's losses on the sale of investments of $0.3 million compared to last year's gain on the sale of investments of $1.0 million.
Income tax expense increased $9.4 million to $6.7 million for the year ended December 31, 2013 from a benefit of $2.7 million for the year ended December 31, 2012. The effective tax rate was 103.1% in 2013 compared to negative 755.0% for 2012. This increase was due primarily to increased nondeductible foreign losses as well as the tax impact of a dividend received from ViSalus, a non-consolidated subsidiary for income tax purposes.
The net earnings from discontinued operations was $2.9 million for the year ended December 31, 2013 compared to $41.3 million for the year ended December 31, 2012. The net earnings for the year ended December 31, 2012 include $5.5 million related to the gain on sale of Sterno.
The net earnings attributable to noncontrolling interests remained constant at $0.3 million for the years ended December 31, 2013 and 2012.
Net earnings attributable to Blyth, Inc. decreased $41.6 million to $2.4 million for the year ended December 31, 2013 from $44.0 million for the year ended December 31, 2012. This decrease was primarily attributable to ViSalus's decreased operating performance within discontinued operations partly offset by improved operating results at PartyLite and Silver Star Brands.
Seasonality
Our businesses are seasonal in nature and, as a result, the net sales and working capital requirements of our businesses fluctuate from quarter to quarter. Our Candles & Home Décor and Catalog & Internet businesses tend to achieve their strongest sales in the third and fourth quarters due to increased shipments to meet year-end holiday season demand for our products.We expect the seasonality of our businesses to continue in the future, which may cause period-to-period fluctuations in certain of our operating results and limit our ability to predict our future results accurately.
Liquidity and Capital Resources
Cash and cash equivalents decreased $12.6 million to $94.3 million at December 31, 2014 from $106.9 million at December 31, 2013. This decrease in cash was primarily attributed to net purchases of short-term investments, foreign exchange losses and capital expenditures. These payments were partly offset by positive cash flow from operations. Cash held in foreign locations was approximately $47 million and $53 million as of December 31, 2014 and 2013, respectively.
We typically generate positive cash flow from operations due to favorable gross margins and the variable nature of selling expenses, which constitute a significant percentage of operating expenses. We generated $14.7 million in cash from continuing operations for the year ended December 31, 2014 compared to $12.2 million for the year ended December 31, 2013. Cash from continuing operations reflects an increase mainly due to lower working capital requirements primarily in inventories. Included in earnings for the year ended December 31, 2014 were non-cash charges for depreciation and amortization of $8.3 million and stock-based compensation of $1.2 million.
30
Net cash used by investing activities from continuing operations was $14.0 million for the year ended December 31, 2014, compared to cash provided by investing activities of $29.5 million for the year ended December 31, 2013. Cash used in investing activities mainly reflects net purchases of investments of $11.1 million and capital expenditures of $2.9 million. Prior year's cash provided by investing activities included the collection of a note receivable of $10.0 million and net proceeds from the sales and purchases of investments of $23.8 million offset by capital expenditures of $3.1 million.
Net cash used in financing activities from continuing operations for the year ended December 31, 2014 was $1.8 million compared to $36.0 million for the year ended December 31, 2013. This year's activity includes dividend payments of $0.8 million as well as repayments on long-term debt and lease obligations of $0.8 million. Prior year's cash primarily reflected repayments on long-term debt and lease obligations of $72.7 million mainly due to the early retirement of our 5.50% senior notes, treasury stock repurchases of $10.0 million and dividend payments of $3.2 million partly offset by borrowing on long term debt of $50.0 million.
We will continue to monitor carefully our cash position, and will only make additional repurchases of treasury shares and pay dividends when we have sufficient cash surpluses available and are permitted to do so under the terms of our revolving loan agreement and term loan. Our revolving loan agreement and term loan prohibit us from paying dividends and repurchasing our common stock under certain circumstances.
A significant portion of our business is outside of the United States. A significant downturn in our business in our international markets would adversely impact our ability to generate operating cash flows. Operating cash flows would also be negatively impacted if we experienced difficulties in the recruitment, retention and our ability to maintain the productivity of our independent consultants. Management's key areas of focus have included stabilizing and increasing the consultant base within PartyLite through training and promotional incentives. PartyLite has had several continuous years of decline in the United States and Canada. While we are making efforts to stabilize and increase the number of active independent sales consultants within PartyLite, it may be difficult to do so. If PartyLite's consultant count continues to decline it will have a negative impact on our liquidity and financial results.
In connection with the ViSalus recapitalization, we agreed to make available to ViSalus a revolving credit facility. On October 17, 2014, we and ViSalus entered into a revolving loan agreement (the “Blyth Revolving Loan Agreement”) pursuant to which we agreed to lend ViSalus up to $6.0 million. Loans under the Blyth Revolving Loan Agreement bear interest at a rate of 10% per annum. Interest will be paid monthly, in arrears, and there is no higher default rate of interest. The Blyth Revolving Loan Agreement will terminate on the later of (i) October 17, 2019 or (ii) resolution of the putative class action that is pending against ViSalus and others in the United States District Court in the Eastern District of Michigan, Southern Division (the “ViSalus Lawsuit”). Loans made under the Blyth Revolving Loan Agreement may be voluntarily repaid and the Blyth Revolving Loan Agreement may be terminated by ViSalus, subject to certain conditions. Loans made under the Blyth Revolving Loan Agreement will be unsecured. On October 17, 2014, the founders of ViSalus and Robert B. Goergen (the “Founder Lenders”) entered into a substantially similar loan agreement with ViSalus (the “Founder Revolving Loan Agreement”) pursuant to which they made a revolving credit facility available to ViSalus in an amount up to $6.0 million on terms that are substantially identical to the terms of the Blyth Revolving Loan Agreement. Loans made under the Blyth Revolving Loan Agreement and loans made under the Founder Revolving Loan Agreement will be made at the same time in equal amounts and will rank equally with each other. There are no financial performance covenants under the Blyth Revolving Loan Agreement and limited negative covenants. ViSalus is permitted to obtain financing from other parties, whether that financing is secured or unsecured. In addition, we agreed to reimburse and pay on behalf of ViSalus 80% of the legal fees and disbursements reasonably charged by ViSalus’s legal counsel and reasonable out-of-pocket expenses incurred by ViSalus in defending ViSalus and certain others against the claims asserted by the plaintiffs in the ViSalus Lawsuit, up to a maximum amount of $4.0 million.
On May 10, 2013, we issued $50.0 million principal amount of 6.00% Senior Notes. The Senior Notes bore interest payable semi-annually in arrears on May 15 and November 15. In connection with the ViSalus recapitalization, we amended the indenture governing the Senior Notes to provide for notice of the mandatory redemption of the Senior Notes on the earlier of March 4, 2015 or the date, if any, that we consummated a new financing in the amount of at least $50.0 million. In early March 2015, we provided the notice of the mandatory redemption of the Senior Notes, which became due and were repaid on March 10, 2015. As a result, we were also required to pay a $3.0 million redemption premium in addition to accrued interest. In addition, to secure the obligations under the indenture, we granted a security interest to the lender in substantially all of our personal property and certain of our real property.
On March 9, 2015, we, together with all of our domestic subsidiaries, except the subsidiary through which we hold our interest in ViSalus, entered into a term loan and security agreement, which we refer to as the term loan, with GFIE, LLC, as term lender. The agreement provides for a five-year term loan in an original principal amount equal to $35.0 million. The obligations under
31
the term loan are secured by, among other assets, (i) a first priority lien on and security interest in PartyLite’s manufacturing facility in Batavia, IL, intellectual property and various stock and other equity interests and (ii) a second priority lien on and security interest in all accounts receivable, inventory, chattel paper, and deposit and securities accounts and PartyLite’s office building in Plymouth, MA. The term loan bears interest at a rate of the greater of 1.00% or LIBOR, in each case plus 5%. The principal amount of the term loan will be paid in installments as follows: beginning on March 31, 2016, and continuing on the last day of each calendar quarter thereafter, up to and including December 31, 2019, we will pay equal quarterly installments of $437,500. The entire remaining balance of principal and accrued interest on the term loan, and all other charges and/or amounts then due in connection with the term loan, will be due and payable in full on March 9, 2020. The term loan may be prepaid, in whole or in part, from time to time, without penalty or premium. In addition, commencing in 2017 (based on our 2016 results), we are required to prepay the term loan annually in an amount up to 25% of “excess cash flow,” if any. For these purposes, excess cash flow is our consolidated EBITDA for the most recently completed fiscal year, determined as set forth in the term loan, less certain capital expenditures, certain repayments of debt, certain interest expenses, and certain cash and other expenditures.
The term loan contains covenants that restrict, subject to certain exceptions, our and the domestic subsidiaries’ ability to, among other things: (i) incur indebtedness; (ii) create liens on assets; (iii) engage in mergers or consolidations; (iv) engage in certain dispositions or acquisitions of assets; (v) make investments, loans, guarantees or advances; (vi) pay dividends and distributions or repurchase our common stock; (vii) repay certain indebtedness; (viii) enter into sale and leaseback transactions; (ix) engage in certain transactions with affiliates; and (x) change the nature of our or the domestic subsidiaries’ business. In addition, the term loan (a) requires us to maintain a fixed charge coverage ratio (“FCCR”) upon the occurrence of certain events or conditions, (b) with certain exceptions, prohibits us from making acquisitions if the FCCR is less than 1.0 to 1.0, and (c) among other conditions, generally prohibits us from paying dividends or repurchasing our common stock:
• for amounts in excess of $2.5 million in any twelve-month period;
• at times when there are no loans outstanding under the revolving loan agreement, if availability (on a pro forma basis) is less than $3.0 million; and
• at times when there are loans outstanding under the revolving loan agreement, if (a) availability (on a pro forma basis) is less than the greater of 30.0% of the revolving loan commitment or $2.25 million, (b) immediately after such dividend or repurchase, availability (on a pro forma basis) would be less than the greater of 30.0% of the revolving loan commitment or $2.25 million or (c) the FCCR is less than 1.1 to 1.0.
We estimate that our FCCR was less than 1.0 to 1.0 at February 28, 2015. The term loan also contains certain additional affirmative, negative and financial covenants and events of default.
On March 9, 2015, we and the domestic subsidiaries also entered into a loan and security agreement, which we refer to as the revolving loan agreement, with Bank of America, N.A., as revolver lender. The revolving loan agreement provides for an asset-based five-year revolving line of credit facility in an aggregate principal amount up to the lesser of $15.0 million or an amount determined by reference to a “borrowing base,” which deducts such reserves as the revolver lender may require in its reasonable discretion. Our borrowing base under the revolving loan agreement will be comprised principally of specified percentages of eligible inventory, accounts receivables and (once a required appraisal is received) PartyLite’s office building in Plymouth, MA. The obligations under the revolving loan agreement are secured by, among other assets, (i) a first priority lien on and security interest in accounts receivable, inventory, chattel paper and deposit and securities accounts, as well as PartyLite’s office building in Plymouth, MA, and (ii) a second priority lien on and security interest in various other assets, including PartyLite’s manufacturing facility in Batavia, IL, and our intellectual property and various stock and other equity interests.
We estimate that, based on the value of eligible inventory, accounts receivable and PartyLite’s office building in Plymouth, MA, as of January 31, 2015, subject to the receipt of the appraisal of that facility, our borrowing base would have been approximately $13.0 million. As of the date hereof, we have not made any borrowings under the revolving loan agreement and have outstanding thereunder only an existing letter of credit for approximately $1.1 million.
Advances under the revolving loan agreement will bear interest at a rate equal to either (i) LIBOR plus an applicable margin ranging from 1.75% to 2.25% or (ii) a base rate equal, at the time of determination, to the greater of (a) the revolver lender’s prime rate; (b) the Federal Funds Rate (as defined) plus 0.50%; or (c) LIBOR for a 30 day interest period plus 1.00%, in each case plus an applicable margin ranging from 0.75% to 1.25%. All loans under the revolving loan agreement will be due and payable in full on March 9, 2020, and may be prepaid, in whole or in part, from time to time, without penalty or premium (except as may be necessary to cover certain funding losses in connection with LIBOR loans). If an overadvance, as determined pursuant to the revolving loan agreement, exists at any time, or accounts receivable are disposed of, we will be
32
required to repay a portion of the loans under the revolving loan agreement determined as set forth in the revolving loan agreement.
The revolving loan agreement contains affirmative and negative covenants that are substantially similar to those contained in the term loan and that restrict our and the domestic subsidiaries, and impose obligations on us and them, in the same manner. The revolving loan agreement also contains certain customary events of default that are substantially similar to those contained in the term loan. Loans under the revolving loan agreement will be used primarily for working capital and other general corporate purposes.
A portion of our cash and cash equivalents is held by our international subsidiaries in foreign banks and, as such, may be subject to foreign and domestic taxes, unfavorable exchange rate fluctuations and other factors, including foreign working capital requirements, limiting our ability to repatriate funds to the United States.
In addition, if economic conditions decline, we may be subject to future impairments of our assets, including accounts receivable, inventories, property, plant and equipment, investments, goodwill and other intangibles, if the valuations of these assets or businesses decline.
As of December 31, 2014, we had $2.4 million available under an uncommitted facility issued by a bank, to be used for letters of credit through January 31, 2015. As of December 31, 2014, no amount was outstanding under this facility.
As of December 31, 2014, we had $1.1 million in standby letters of credit outstanding that are fully collateralized through a certificate of deposit funded by us.
As of December 31, 2014 and 2013, Silver Star Brands had approximately $4.9 million and $5.5 million, respectively, of long-term debt outstanding under a real estate mortgage note payable which matures June 1, 2020. Under the terms of the note, payments of principal and interest are required monthly at a fixed interest rate of 7.89%.
The following table summarizes the maturity dates of our contractual obligations as of December 31, 2014:
Payments Due by Period | |||||||||||||||||||
Contractual Obligations (In thousands) | Total | Less than 1 year | 1 - 3 Years | 4 - 5 Years | More than 5 Years | ||||||||||||||
Long-Term Debt(1) | $ | 54,852 | $ | 50,734 | $ | 1,652 | $ | 1,933 | $ | 533 | |||||||||
Capital Leases(2) | 611 | 173 | 294 | 144 | — | ||||||||||||||
Interest(3) | 4,716 | 3,887 | 564 | 253 | 12 | ||||||||||||||
Purchase Obligations(4) | 18,313 | 18,142 | 171 | — | — | ||||||||||||||
Operating Leases | 18,423 | 5,068 | 6,592 | 4,575 | 2,188 | ||||||||||||||
Unrecognized Tax Benefits(5) | 2,791 | — | — | — | — | ||||||||||||||
Total Contractual Obligations | $ | 99,706 | $ | 78,004 | $ | 9,273 | $ | 6,905 | $ | 2,733 | |||||||||
(1) Long-term debt includes 6.00% Senior Notes due 2015 and a mortgage note payable maturing June 1, 2020 (See Note 11 to the Consolidated Financial Statements).
(2) Amounts represent future lease payments, excluding interest, due on nine capital leases, which end between 2015 and 2019 (See Note 13 to the Consolidated Financial Statements).
(3) Interest expense on long-term debt is comprised of $3.5 million relating to Senior Notes, $1.1 million in mortgage interest, and approximately $71,000 of interest relating to future capital lease obligations.
(4) Purchase obligations consist primarily of open purchase orders for inventory.
(5) There are no unrecognized tax benefits expected to be realized within the next 12 months and $2.8 million for which we are not able to reasonably estimate the timing of the potential future payments (See Note 14 to the Consolidated Financial Statements).
On December 13, 2007, our Board of Directors authorized a new stock repurchase program for 3,000,000 shares in addition to 6,000,000 shares authorized under the previous plan. The new stock repurchase program became effective after we exhausted the authorized amount under the old repurchase program. As of December 31, 2014, the cumulative total shares purchased under the new and old program was 7,994,422, at a total cost of approximately $275.0 million. The acquired shares are held as common stock in treasury at cost.
During the year ended December 31, 2014 we paid $0.8 million in dividends compared to $3.2 million in 2013.
33
We do not maintain any off-balance sheet arrangements, transactions, obligations or other relationships with unconsolidated entities that would be expected to a have a material current or future effect upon our financial statements. We utilize foreign exchange forward contracts for operational purposes.
Critical Accounting Policies
Our discussion and analysis of our financial condition and results of operations are based upon our Consolidated Financial Statements which have been prepared in accordance with accounting principles generally accepted in the United States. The preparation of these financial statements requires us to make estimates and judgments that affect the reported amounts of assets, liabilities, revenues and expenses, and related disclosure of contingent assets and liabilities. On an ongoing basis, we evaluate our estimates, including those related to bad debts, sales adjustments, inventories, income taxes, restructuring and impairments, contingencies and litigation. We base our estimates on historical experience and on various other assumptions that we believe to be reasonable under the circumstances, the results of which form the basis for making judgments about the carrying values of assets and liabilities that are not readily apparent from other sources. Actual results may differ from these estimates under different assumptions or conditions.
34
Note 1 to the Consolidated Financial Statements includes a summary of the significant accounting policies and methods used in the preparation of our Consolidated Financial Statements. The following are our critical accounting policies and methods.
Revenue Recognition
Revenues consist of sales to customers, net of returns and allowances. We recognize revenue upon delivery, when both title and risk of loss are transferred to the customer. We present revenues net of any taxes collected from customers and remitted to government authorities. We also record revenue on financing fees from past due balances from financing receivables within our Catalog & Internet segment.
Generally, our sales are based on fixed prices from published price lists. We record estimated reductions to revenue for customer promotions, volume incentives and other promotions. Should market conditions decline, we may increase customer incentives with respect to future sales. We also record reductions to revenue based primarily on historical experience, for estimated customer returns and chargebacks that may arise as a result of shipping errors, product damage in transit or for other reasons that can only become known subsequent to recognizing the revenue. If the amount of actual customer returns and chargebacks were to increase significantly from the estimated amount, revisions to the estimated allowance would be required. In some instances, we receive payment in advance of product delivery. Such advance payments occur in both our direct selling and direct marketing channels and are recorded as deferred revenue in Accrued expenses in the Consolidated Balance Sheets. Upon delivery of product for which advance payment has been made, the related deferred revenue is reversed and recorded as revenue.
We establish an allowance for doubtful accounts for customer receivables. The allowance is determined based on our evaluation of specific customers’ ability to pay, aging of receivables, historical experience and the current economic environment. We believe we are adequately reserved for expected credit losses and will continue to take actions to reduce our exposure to credit losses. While we believe we have appropriately considered known or expected outcomes, our customers’ ability to pay their obligations, including those to us, could be adversely affected by contraction in the economy or a general decline in consumer spending.
The sales price for our products sold is fixed prior to the time of shipment to the customer. Customers do not have the right to return product, except for rights to return that we believe are typical of our industry for such reasons as damaged goods, shipping errors or similar occurrences.
Financing Receivables
During 2012, Silver Star Brands entered into an agreement with a financial services company to offer financing services, including originating, collecting, and servicing customer receivables related to the purchase of Silver Star Brands products through a private credit financing program. New financing originations, which represent the amounts of financing provided by the service provider to customers, were approximately $20.9 million and $14.8 million for the years ended December 31, 2014 and 2013, respectively. As of December 31, 2014 and 2013, our net financing receivables balances were $7.2 million and $5.6 million, respectively. This balance is recorded in accounts receivable in the Consolidated Balance Sheets and includes income from financing fees which represents income from interest earned on outstanding balances and late fees.
We maintain an allowance to cover expected financing receivable credit losses and evaluate credit loss expectations based on our total portfolio. The allowance for credit losses is determined based on various factors, including historical and anticipated experience, past due receivables, receivable type, and customer risk profile. Accounts become past due and accrue interest 30 days after the first initial billing cycle when a payment due date is missed or only a partial payment is received. As of December 31, 2014 and 2013, the allowance for credit losses was $4.8 million and $3.0 million, respectively. Provisions for the allowance of credit losses are recorded to selling expenses for product sales. Interest income from financing or late fees is charged directly against net sales within the Consolidated Statements of Earnings. We continue to monitor broader economic indicators and their potential impact on future loss performance. We have an extensive process to manage exposure to customer credit risk, including active management of credit lines and collection activities. Based on our assessment of the customer financing receivables, we believe we are adequately reserved. Write-offs were 11.5% and 23.7% of 2014 and 2013 sales, respectively. Our policy is to write-off financing receivables greater than 180 days past due with no collection activity and no receivable is placed on non-accrual status until it is written off. All write-offs are submitted to a third party collection agency.
See Note 4 of the Notes to the Consolidated Financial Statements included in “Part II — Item 8 — Financial Statements and Supplementary Data” for additional information about our financing receivables and the associated allowance.
35
Inventory valuation
Inventories are valued at the lower of cost or market. Cost is determined by the first-in, first-out method. We write down our inventory for estimated obsolete, excess and unmarketable inventory by an amount equal to the difference between the cost of inventory and the estimated market value based upon assumptions about future demand, market conditions, customer programs and sales forecasts. If market acceptance of our existing products or the successful introduction of new products should significantly decrease, additional inventory write-downs could be required. Potential additional inventory write-downs could result from unanticipated additional quantities of obsolete finished goods and raw materials, and/or from lower disposition values offered by the parties who normally purchase surplus inventories.
Restructuring and impairment charges on long-lived assets
In response to changing market conditions and competition, our management regularly updates our business model and market strategies, including the evaluation of facilities, personnel and products. Future adverse changes in economic and market conditions could result in additional organizational changes and possibly additional restructuring and impairment charges. Historically, we have reviewed long-lived assets, including property, plant and equipment and other intangibles with definite lives for impairment whenever events or changes in circumstances indicated that the carrying amount of such an asset might not be recoverable. Management determines whether there has been an impairment on long-lived assets held for use in the business by comparing anticipated undiscounted future cash flow from the use and eventual disposition of the asset or asset group to the carrying value of the asset. For assets whose aggregate undiscounted cash flows are less than its carrying value, the assets are considered potentially impaired and actual impairments, if any, would be determined to the extent the assets carrying value exceeds its aggregate fair value. Long-lived assets that meet the definition of held for sale are valued at the lower of carrying amount or net realizable value. Assets or asset groups are determined at the lowest level possible for which identifiable cash flows are largely independent of the cash flows of other assets and liabilities. Recoverability of long-lived assets to be held and used is measured by a comparison of the carrying amount of an asset to the estimated undiscounted future cash flows expected to be generated by the asset. If the carrying amount of an asset exceeds its estimated undiscounted future cash flows, an impairment charge is recognized by the amount by which the carrying amount of the asset exceeds the fair value of the asset.
Goodwill
We had approximately $2.3 million of goodwill as of December 31, 2014 and 2013. Goodwill is subject to an assessment for impairment using a two-step fair value-based test, which is performed at least annually or more frequently if events or circumstances indicate that goodwill might be impaired.
The following circumstances could impact our cash flow and cause further impairments to reported goodwill:
• | unexpected increase in competition resulting in lower prices or lower volumes, |
• | entry of new products into the marketplace from competitors, |
• | lack of acceptance of our new products into the marketplace, |
• | loss of a key employee or customer, |
• | significantly higher raw material costs, |
• | economic downturn, and |
• | other micro/macroeconomic factors. |
The December 31, 2014 impairment assessment of our $2.3 million of the goodwill within the Candles & Home Décor segment unit indicates that it is fully recoverable.
If actual revenue growth, profit margins, costs and capital spending should differ significantly from the assumptions included in our business outlook used in the cash flow models, the reporting unit’s fair value could fall significantly below expectations and additional impairment charges could be required to write down goodwill to its fair value and, if necessary, other long lived-assets could be subject to a similar fair value test and possible impairment. Long-lived assets represent primarily fixed assets and other long-term assets excluding goodwill and other intangibles.
Trade Names and Trademarks
Our trade name and trademark intangible assets relate to our acquisitions of Miles Kimball and Walter Drake (reported in the Catalog & Internet segment). We had approximately $6.6 million in trade names and trademarks as of December 31, 2014 and 2013.
36
On an annual basis we perform our assessment of impairment for indefinite-lived intangible assets, or upon the occurrence of a triggering event. We use the relief from royalty method to estimate the fair value for indefinite-lived intangible assets. The underlying concept of the relief from royalty method is that the inherent economic value of intangibles is directly related to the timing of future cash flows associated with the intangible asset. Similar to the discounted cash flow methodology used to determine the fair value of goodwill, the fair value of indefinite-lived intangible assets is equal to the present value of after-tax cash flows associated with the intangible asset based on an applicable royalty rate. The royalty rate is determined by using existing market comparables for royalty agreements using an intellectual property data base. The arms-length agreements generally support a rate that is a percentage of direct sales. This approach is based on the premise that the free cash flow is a more valid criterion for measuring value than “book” or accounting profits.
As of December 31, 2014, we performed our annual impairment analysis on the trade names and trademarks of the Catalog & Internet assets. The three primary assumptions used in the relief from royalty method are the discount rate, the perpetuity growth rate and the royalty rate. This discount rate is used to value the expected net cash flows to be derived from the royalty to its net present value. The discount rate uses a rate of return to account for the time value of money and an investment risk factor. The perpetuity growth rate estimates the businesses' sustainable long-term growth rate. The royalty rate is based upon past royalty performance as well as the expected royalty growth rate using both macro and microeconomic factors surrounding the business. A change in the discount rate is often used by management to risk adjust the discounted cash flow analysis if there is a higher degree of risk that the estimated cash flows from the indefinite-lived intangible asset may not be fully achieved. These risks are often based upon the business units’ past performance, competition, position in the marketplace, acceptance of new products in the marketplace and other macro and microeconomic factors surrounding the business. If, however, actual cash flows should fall significantly below expectations, this could result in an impairment of our indefinite-lived intangible assets.
If the discount rate had increased by 0.5% and royalty rate had decreased by 0.25%, the estimated fair value of the trade names and trademarks within the Catalog & Internet segment would have decreased by $2.8 million to $7.2 million. This decrease would have required us to take an impairment charge of $0.5 million to write-down our indefinite lived intangibles to its estimated fair value. Conversely, if the discount rate had decreased by 0.5% and the royalty rate had increased by 0.25%, the estimated fair value of the trade names and trademarks within the Catalog & Internet segment would have increased by $3.1 million to $13.0 million, requiring us to take an impairment charge of $0.1 million to write-down our indefinite lived intangibles to its estimated fair value.
Accounting for income taxes
As part of the process of preparing our Consolidated Financial Statements, we are required to estimate our actual current tax exposure (state, federal and foreign), together with assessing permanent and temporary differences resulting from differing bases and treatment of items for tax and accounting purposes, such as the carrying value of intangibles, investments, deductibility of expenses, depreciation of property and equipment, and valuation of inventories. Temporary differences result in deferred tax assets and liabilities, which are included within our Consolidated Balance Sheets. We must then assess the likelihood that our deferred tax assets will be recovered from future taxable income. Actual results could differ from this assessment if sufficient taxable income is not generated in future periods. To the extent we determine the need to establish a valuation allowance or change the allowance in a period, we would include this as an expense within the tax provision in the accompanying Consolidated Statements of Earnings. Management periodically estimates our probable tax obligations using historical experience in tax jurisdictions and informed judgments. There are inherent uncertainties related to the interpretation of tax regulations in the jurisdictions in which we transact business. The judgments and estimates made at a point in time may change based on the outcome of tax audits, as well as changes to or further interpretations of regulations. If such changes take place, there is a risk that the tax rate may increase or decrease in any period. Amounts accrued for tax uncertainties, primarily recorded in long-term liabilities, total $2.8 million and $4.0 million at December 31, 2014 and 2013, respectively. Accruals relate to tax issues for U.S. federal, domestic state, and taxation of foreign earnings.
Our policy is to record deferred taxes on our unremitted foreign earnings in excess of amounts deemed required for working capital and expansion needs as these earnings are not considered indefinitely reinvested. We periodically reassess the working capital needs of our foreign subsidiaries and update our indefinite reinvestment assertion accordingly.
As of December 31, 2014, we determined that $176.5 million of cumulative undistributed foreign earnings were not reinvested indefinitely by our non-U.S. subsidiaries. An accumulated deferred tax liability has been recorded against these undistributed earnings of $1.1 million, which includes the impact of utilization of foreign tax credits.
Due to the various jurisdictions in which we file tax returns and the uncertainty regarding the timing of the settlement of tax audits, it is possible that there could be other significant changes in the amount of unrecognized tax benefits in the year ended December 31, 2014 but the amount cannot be estimated.
37
Item 7A. Quantitative and Qualitative Disclosures About Market Risk
Market Risk
We have operations outside of the United States and sell our products worldwide. Our activities expose us to a variety of market risks, including the effects of changes in interest rates, foreign currency exchange rates and commodity prices. These financial exposures are actively monitored and, where considered appropriate, managed by us. We enter into contracts, with the intention of limiting these risks, with only those counterparties that we deem to be creditworthy, and also in order to mitigate our non-performance risk. International sales represented 58% of total sales for the year ended December 31, 2014.
Investment Risk
We are subject to investment risks on our investments due to market volatility. As of December 31, 2014, we held $19.0 million of short-term bond mutual funds, which have been adjusted to fair value based on current market data. We also have a long-term cost basis investment in ViSalus of approximately $6.9 million which may be subject to future impairments based upon ViSalus' performance.
Foreign Currency Risk
We use foreign exchange forward contracts to hedge the impact of foreign currency fluctuations on foreign denominated inventory purchases, net assets of our foreign operations, intercompany payables and certain foreign denominated loans. We do not hold or issue derivative financial instruments for trading purposes.
We have hedged the net assets of certain of our foreign operations through foreign currency forward contracts. The realized and unrealized gains/losses on these hedges are recorded within AOCI until the investment is sold or disposed of. The cumulative net after-tax gain related to net investment hedges in AOCI as of December 31, 2014 and 2013 was $4.1 million and $2.3 million, respectively.
We have designated our foreign currency forward contracts related to certain foreign denominated loans and intercompany payables as fair value hedges. The gains or losses on the fair value hedges are recognized into earnings and generally offset the transaction gains or losses in the foreign denominated loans that they are intended to hedge.
We have designated forward exchange contracts on forecasted intercompany inventory purchases and future purchase commitments as cash flow hedges and as long as the hedge remains effective and the underlying transaction remains probable, the effective portion of the changes in the fair value of these contracts will be recorded in AOCI until earnings are affected by the variability of the cash flows being hedged. Upon settlement of each commitment, the underlying forward contract is closed and the corresponding gain or loss is transferred from AOCI and is included in the measurement of the cost of the acquired asset upon sale. If a hedging instrument is sold or terminated prior to maturity, gains and losses are deferred in AOCI until the hedged item is settled. However, if the hedged item is no longer probable of occurring, the resultant gain or loss on the terminated hedge is recognized into earnings immediately. The net after-tax unrealized gain included in AOCI at December 31, 2014 for cash flow hedges is $0.2 million and is expected to be transferred into earnings within the next twelve months upon settlement of the underlying commitment. The net after-tax loss included in AOCI at December 31, 2013 for cash flow hedges was $0.1 million.
For consolidated financial statement presentation, net cash flows from such hedges are classified in the categories of the Consolidated Statement of Cash Flows with the items being hedged.
The following table provides information about our foreign exchange forward contracts accounted for as cash flow hedges as of December 31, 2014:
(In thousands, except average contract rate) | U.S. Dollar Notional Amount | Average Contract Rate | Unrealized Gain | ||||||||
Euro | $ | 4,650 | $ | 1.32 | $ | 376 | |||||
The foreign exchange contracts outstanding have maturity dates through October 2015.
38
Item 8. Financial Statements and Supplementary Data
Report of Independent Registered Public Accounting Firm
The Board of Directors and Stockholders of Blyth, Inc. and subsidiaries
We have audited the accompanying consolidated balance sheets of Blyth, Inc. and subsidiaries (“the Company”) as of December 31, 2014 and 2013, and the related consolidated statements of earnings, comprehensive income, stockholders' equity, and cash flows for each of the three years in the period ended December 31, 2014. Our audits also included the financial statement schedule listed at Item 15(a)(2). These financial statements and schedules are the responsibility of the Company's management. Our responsibility is to express an opinion on these financial statements based on our audits.
We conducted our audits in accordance with the standards of the Public Company Accounting Oversight Board (United States). Those standards require that we plan and perform the audit to obtain reasonable assurance about whether the financial statements are free of material misstatement. An audit includes examining, on a test basis, evidence supporting the amounts and disclosures in the financial statements. An audit also includes assessing the accounting principles used and significant estimates made by management, as well as evaluating the overall financial statement presentation. We believe that our audits provide a reasonable basis for our opinion.
In our opinion, the financial statements referred to above present fairly, in all material respects, the consolidated financial position of the Company at December 31, 2014 and 2013, and the consolidated results of its operations and its cash flows for each of the three years in the period ended December 31, 2014, in conformity with U.S. generally accepted accounting principles. Also, in our opinion, the related financial statement schedule, when considered in relation to the basic financial statements taken as a whole, presents fairly in all material respects the information set forth therein.
We also have audited, in accordance with the standards of the Public Company Accounting Oversight Board (United States), the Company's internal control over financial reporting as of December 31, 2014, based on criteria established in Internal Control-Integrated Framework issued by the Committee of Sponsoring Organizations of the Treadway Commission (2013 framework) and our report dated March 16, 2015 expressed an unqualified opinion thereon.
/s/ Ernst & Young LLP
Stamford, Connecticut
March 16, 2015
39
BLYTH, INC. AND SUBSIDIARIES Consolidated Balance Sheets | |||||||
(In thousands, except share and per share data) | December 31, 2014 | December 31, 2013 | |||||
ASSETS | |||||||
Current assets: | |||||||
Cash and cash equivalents | $ | 94,329 | $ | 106,933 | |||
Short-term investments | 18,961 | 7,985 | |||||
Accounts receivable, less allowance for doubtful receivables of $5,481 and $3,932, respectively | 11,133 | 12,556 | |||||
Inventories | 45,784 | 54,682 | |||||
Prepaid assets | 15,168 | 17,281 | |||||
Other current assets | 7,515 | 6,483 | |||||
Discontinued operations | — | 34,208 | |||||
Total current assets | 192,890 | 240,128 | |||||
Property, plant and equipment, at cost: | |||||||
Land and buildings | 85,788 | 89,575 | |||||
Leasehold improvements | 6,371 | 6,460 | |||||
Machinery and equipment | 76,147 | 79,479 | |||||
Office furniture, data processing equipment and software | 51,063 | 51,988 | |||||
Construction in progress | 1,184 | 838 | |||||
220,553 | 228,340 | ||||||
Less accumulated depreciation | 152,287 | 151,514 | |||||
68,266 | 76,826 | ||||||
Other assets: | |||||||
Investments | 7,951 | 1,070 | |||||
Goodwill | 2,298 | 2,298 | |||||
Other intangible assets, net of accumulated amortization of $15,372 and $15,186, respectively | 6,593 | 6,780 | |||||
Deferred income taxes | 624 | 4,369 | |||||
Other assets | 8,731 | 7,763 | |||||
Discontinued operations | — | 27,607 | |||||
Total other assets | 26,197 | 49,887 | |||||
Total assets | $ | 287,353 | $ | 366,841 | |||
LIABILITIES AND STOCKHOLDERS' EQUITY | |||||||
Current liabilities: | |||||||
Current maturities of long-term debt | $ | 50,907 | $ | 952 | |||
Accounts payable | 23,358 | 27,327 | |||||
Accrued expenses | 41,327 | 40,931 | |||||
Income taxes payable | 1,193 | 669 | |||||
Deferred income taxes | 4,086 | 648 | |||||
Other current liabilities | 8,387 | 9,604 | |||||
Discontinued operations | — | 23,966 | |||||
Total current liabilities | 129,258 | 104,097 | |||||
Long-term debt, less current maturities | 4,556 | 55,326 | |||||
Deferred income taxes | 7,309 | — | |||||
Other liabilities | 12,087 | 13,922 | |||||
Discontinued operations | — | 147,468 | |||||
Stockholders' equity: | |||||||
Common stock - authorized 50,000,000 shares of $0.02 par value; issued 26,642,250 shares and 26,574,031 shares, respectively | 533 | 532 | |||||
Additional contributed capital | 169,897 | 168,732 | |||||
Retained earnings | 403,463 | 312,036 | |||||
Accumulated other comprehensive income | 11,849 | 16,362 | |||||
Treasury stock, at cost, 10,572,020 shares and 10,557,342 shares, respectively | (452,171 | ) | (452,040 | ) | |||
Total stockholders' equity | 133,571 | 45,622 | |||||
Noncontrolling interest | 572 | 406 | |||||
Total equity | 134,143 | 46,028 | |||||
Total liabilities and equity | $ | 287,353 | $ | 366,841 | |||
The accompanying notes are an integral part of these Consolidated Financial Statements.
40
BLYTH, INC. AND SUBSIDIARIES Consolidated Statements of Earnings | |||||||||||
For the year ended | |||||||||||
(In thousands, except per share data) | December 31, 2014 | December 31, 2013 | December 31, 2012 | ||||||||
Net sales | $ | 490,020 | $ | 534,262 | $ | 555,980 | |||||
Cost of goods sold | 182,780 | 199,586 | 212,677 | ||||||||
Gross profit | 307,240 | 334,676 | 343,303 | ||||||||
Selling | 223,742 | 240,943 | 249,231 | ||||||||
Administrative and other expense | 76,401 | 81,843 | 90,057 | ||||||||
Total operating expense | 300,143 | 322,786 | 339,288 | ||||||||
Operating profit | 7,097 | 11,890 | 4,015 | ||||||||
Other expense (income): | |||||||||||
Interest expense | 7,042 | 6,042 | 6,062 | ||||||||
Interest income | (453 | ) | (616 | ) | (1,707 | ) | |||||
Foreign exchange and other, net | 4,020 | (72 | ) | (691 | ) | ||||||
Total other expense | 10,609 | 5,354 | 3,664 | ||||||||
Earnings (loss) from continuing operations before income taxes and noncontrolling interest | (3,512 | ) | 6,536 | 351 | |||||||
Income tax expense (benefit) | 21,071 | 6,736 | (2,650 | ) | |||||||
Earnings (loss) from continuing operations | (24,583 | ) | (200 | ) | 3,001 | ||||||
Earnings (loss) from discontinued operations, net of income tax expense | (7,231 | ) | 2,946 | 35,742 | |||||||
Gain on sale of discontinued operations | 118,918 | — | 5,540 | ||||||||
Net earnings from discontinued operations | 111,687 | 2,946 | 41,282 | ||||||||
Net earnings | 87,104 | 2,746 | 44,283 | ||||||||
Less: Net earnings attributable to noncontrolling interests | 343 | 313 | 281 | ||||||||
Net earnings attributable to Blyth, Inc. | $ | 86,761 | $ | 2,433 | $ | 44,002 | |||||
Basic earnings per share: | |||||||||||
Net earnings (loss) from continuing operations | $ | (1.55 | ) | $ | (0.03 | ) | $ | 0.16 | |||
Net earnings from discontinued operations | 6.93 | 0.18 | 2.40 | ||||||||
Net earnings attributable per share of Blyth, Inc. | $ | 5.38 | $ | 0.15 | $ | 2.56 | |||||
Weighted average number of shares outstanding | 16,112 | 16,196 | 17,180 | ||||||||
Diluted earnings per share: | |||||||||||
Net earnings (loss) from continuing operations | $ | (1.54 | ) | $ | (0.03 | ) | $ | 0.16 | |||
Net earnings from discontinued operations | 6.91 | 0.18 | 2.39 | ||||||||
Net earnings attributable per share of Blyth, Inc. | $ | 5.37 | $ | 0.15 | $ | 2.55 | |||||
Weighted average number of shares outstanding | 16,165 | 16,228 | 17,247 | ||||||||
Cash dividend declared per share | $ | 0.05 | $ | 0.20 | $ | 0.18 | |||||
The accompanying notes are an integral part of these Consolidated Financial Statements.
41
BLYTH, INC. AND SUBSIDIARIES Consolidated Statements of Comprehensive Income | |||||||||||
For the year ended | |||||||||||
(In thousands) | December 31, 2014 | December 31, 2013 | December 31, 2012 | ||||||||
Net earnings | $ | 87,104 | $ | 2,746 | $ | 44,283 | |||||
Other comprehensive income (loss), net of tax: | |||||||||||
Foreign currency translation adjustments | (4,798 | ) | 1,914 | 3,451 | |||||||
Net unrealized gain (loss) on certain investments | (109 | ) | (169 | ) | 202 | ||||||
Net unrealized gain (loss) on cash flow hedging instruments | 439 | (154 | ) | (490 | ) | ||||||
Less: Reclassification adjustments for (gain) loss included in net income | (45 | ) | 370 | (624 | ) | ||||||
Other comprehensive income (loss) | (4,513 | ) | 1,961 | 2,539 | |||||||
Total comprehensive income, net of tax | 82,591 | 4,707 | 46,822 | ||||||||
Less: net earnings attributable to noncontrolling interests | 343 | 313 | 281 | ||||||||
Comprehensive income attributable to Blyth, Inc. | $ | 82,248 | $ | 4,394 | $ | 46,541 | |||||
The accompanying notes are an integral part of these Consolidated Financial Statements.
42
BLYTH, INC. AND SUBSIDIARIES Consolidated Statements of Stockholders' Equity | |||||||||||||||||||||||||||
Blyth, Inc.'s Stockholders | |||||||||||||||||||||||||||
(In thousands) | Common Stock | Additional Contributed Capital | Retained Earnings | Accumulated Other Comprehensive Income (Loss) | Treasury Stock | Noncontrolling Interest | Total Equity | ||||||||||||||||||||
Balance, December 31, 2011 | $ | 514 | $ | 147,790 | $ | 420,349 | $ | 11,862 | $ | (426,717 | ) | $ | 168 | $ | 153,966 | ||||||||||||
Net earnings for the year | 44,002 | 281 | 44,283 | ||||||||||||||||||||||||
Distribution to noncontrolling interest | (181 | ) | (181 | ) | |||||||||||||||||||||||
Other comprehensive income | 2,539 | 2,539 | |||||||||||||||||||||||||
Stock-based compensation | 2 | 4,676 | 4,678 | ||||||||||||||||||||||||
Purchase of additional ViSalus interest | 14 | 14,614 | 14,628 | ||||||||||||||||||||||||
Reversal of accretion of redeemable noncontrolling interest, net | (2,396 | ) | (2,396 | ) | |||||||||||||||||||||||
Issuance of redeemable preferred stock, net (2) | (140,644 | ) | (140,644 | ) | |||||||||||||||||||||||
Dividends declared ($0.18 per share) | (3,012 | ) | (3,012 | ) | |||||||||||||||||||||||
Treasury stock purchases (1) | (15,057 | ) | (15,057 | ) | |||||||||||||||||||||||
Balance, December 31, 2012 | $ | 530 | $ | 167,080 | $ | 318,299 | $ | 14,401 | $ | (441,774 | ) | $ | 268 | $ | 58,804 | ||||||||||||
Net earnings for the year | 2,433 | 313 | 313 | ||||||||||||||||||||||||
Distribution to noncontrolling interest | (175 | ) | (175 | ) | |||||||||||||||||||||||
Accretion to redemption value for ViSalus redeemable preferred stock | (5,471 | ) | (5,471 | ) | |||||||||||||||||||||||
Other comprehensive income | 1,961 | 1,961 | |||||||||||||||||||||||||
Stock-based compensation | 2 | 1,652 | 1,654 | ||||||||||||||||||||||||
Dividends paid ($0.20 per share) | (3,225 | ) | (3,225 | ) | |||||||||||||||||||||||
Treasury stock purchases (1) | (10,266 | ) | (10,266 | ) | |||||||||||||||||||||||
Balance, December 31, 2013 | $ | 532 | $ | 168,732 | $ | 312,036 | $ | 16,362 | $ | (452,040 | ) | $ | 406 | $ | 46,028 | ||||||||||||
Net earnings for the year | 86,761 | 343 | 87,104 | ||||||||||||||||||||||||
Distribution to noncontrolling interest | (177 | ) | (177 | ) | |||||||||||||||||||||||
Reversal of accretion to redemption value for ViSalus redeemable preferred stock and dividends paid in excess of income earned | 5,471 | 5,471 | |||||||||||||||||||||||||
Other comprehensive loss | (4,513 | ) | (4,513 | ) | |||||||||||||||||||||||
Stock-based compensation | 1 | 1,165 | 1,166 | ||||||||||||||||||||||||
Dividends paid ($0.05 per share) | (805 | ) | (805 | ) | |||||||||||||||||||||||
Treasury stock purchases (1) | (131 | ) | (131 | ) | |||||||||||||||||||||||
Balance, December 31, 2014 | $ | 533 | $ | 169,897 | $ | 403,463 | $ | 11,849 | $ | (452,171 | ) | $ | 572 | $ | 134,143 | ||||||||||||
(1) This includes shares withheld in order to satisfy employee withholding taxes upon the distribution of vested restricted stock units.
(2) Net amount includes $5.8 million reclassed from accrued expenses to equity as a result of a stock award settlement previously accounted for as a liability and satisfied with the redeemable preferred stock.
The accompanying notes are an integral part of these Consolidated Financial Statements.
43
BLYTH, INC. AND SUBSIDIARIES Consolidated Statements of Cash Flows | |||||||||||
For the year ended | |||||||||||
(In thousands) | December 31, 2014 | December 31, 2013 | December 31, 2012 | ||||||||
Cash flows from operating activities: | |||||||||||
Earnings (loss) from continuing operations | $ | (24,583 | ) | $ | (200 | ) | $ | 3,001 | |||
Adjustments to reconcile earnings to net cash provided by (used in) operating activities: | |||||||||||
Depreciation and amortization | 8,322 | 9,889 | 10,132 | ||||||||
Loss (gain) on sale of assets | 75 | 429 | (582 | ) | |||||||
Stock-based compensation expense of Blyth, Inc. | 1,166 | 1,654 | 2,704 | ||||||||
Deferred income taxes | 14,472 | 1,793 | (1,797 | ) | |||||||
Loss on impairment of assets | 3,475 | — | 834 | ||||||||
Changes in operating assets and liabilities: | |||||||||||
Accounts receivable | 896 | (3,525 | ) | (4,838 | ) | ||||||
Inventories | 6,627 | (717 | ) | 16,442 | |||||||
Prepaid and other | 1,450 | (443 | ) | 2,423 | |||||||
Other long-term assets | 1,986 | (1,225 | ) | (648 | ) | ||||||
Accounts payable | (2,731 | ) | (2,309 | ) | (1,412 | ) | |||||
Accrued expenses | 642 | (4,622 | ) | (5,861 | ) | ||||||
Income taxes payable | 186 | 169 | (572 | ) | |||||||
Other liabilities and other | 2,764 | 11,351 | (4,706 | ) | |||||||
Net cash provided by operating activities of continuing operations | 14,747 | 12,244 | 15,120 | ||||||||
Net cash provided by (used in) operating activities of discontinued operations | (8,992 | ) | 35,259 | 28,570 | |||||||
Net cash provided by operating activities | 5,755 | 47,503 | 43,690 | ||||||||
Cash flows from investing activities: | |||||||||||
Purchases of property, plant and equipment, net of disposals | (2,867 | ) | (3,061 | ) | (9,098 | ) | |||||
Proceeds from collection of note receivable | — | 10,000 | — | ||||||||
Purchases of short-term investments | (20,032 | ) | (20,810 | ) | (63,233 | ) | |||||
Proceeds from sale of short-term investments | 8,900 | 44,550 | 66,090 | ||||||||
Proceeds from sale of discontinued operations | — | — | 23,500 | ||||||||
Cash settlement of net investment hedges | — | (1,356 | ) | (1,874 | ) | ||||||
Proceeds from sales of assets | 10 | 29 | 539 | ||||||||
Proceeds from sale of long-term investments | — | 105 | 3,611 | ||||||||
Net cash provided by (used in) investing activities of continuing operations | (13,989 | ) | 29,457 | 19,535 | |||||||
Net cash provided by (used in) investing activities of discontinued operations | 3,135 | (9,569 | ) | (10,569 | ) | ||||||
Net cash provided by (used in) investing activities | (10,854 | ) | 19,888 | 8,966 | |||||||
Cash flows from financing activities: | |||||||||||
Purchases of treasury stock | — | (9,961 | ) | (13,434 | ) | ||||||
Borrowings on long-term debt | — | 50,000 | — | ||||||||
Repayments on long-term debt | (678 | ) | (72,402 | ) | (21,722 | ) | |||||
Payments on capital lease obligations | (107 | ) | (248 | ) | (127 | ) | |||||
Dividends paid | (805 | ) | (3,225 | ) | (3,012 | ) | |||||
Distributions to noncontrolling interest | (177 | ) | (175 | ) | (181 | ) | |||||
Net cash used in financing activities of continuing operations | (1,767 | ) | (36,011 | ) | (38,476 | ) | |||||
Net cash used in financing activities of discontinued operations | — | (31,447 | ) | (95,195 | ) | ||||||
Net cash used in financing activities | (1,767 | ) | (67,458 | ) | (133,671 | ) | |||||
Effect of exchange rate changes on cash | (5,738 | ) | 1,063 | 1,333 | |||||||
Net increase (decrease) in cash and cash equivalents | (12,604 | ) | 996 | (79,682 | ) | ||||||
Cash and cash equivalents at beginning of period | 106,933 | 105,937 | 185,619 | ||||||||
Cash and cash equivalents at end of period | $ | 94,329 | $ | 106,933 | $ | 105,937 | |||||
Supplemental disclosure of cash flow information: | |||||||||||
Cash paid during the year for: | |||||||||||
Interest | $ | 7,206 | $ | 6,042 | $ | 6,140 | |||||
Income taxes | 7,173 | 7,107 | 46,511 | ||||||||
Non-cash transactions: | |||||||||||
Capital leases for equipment | $ | 463 | $ | 655 | $ | 137 | |||||
The accompanying notes are an integral part of these Consolidated Financial Statements.
44
BLYTH, INC. AND SUBSIDIARIES
Notes to Consolidated Financial Statements
Note 1. Summary of Significant Accounting Policies
Blyth, Inc. (the “Company”) is a multi-channel company primarily focused on the direct-to-consumer market. The Company's products include an extensive array of decorative and functional household products such as candles, accessories, seasonal decorations, household convenience items and personalized gifts, as well as health, wellness and beauty related products. The Company’s products can primarily be found throughout the United States, Canada, Mexico, Europe and Australia. Our financial results are reported in two segments: the Candles & Home Décor segment (PartyLite) and the Catalog & Internet segment (Silver Star Brands).
A summary of the significant accounting policies applied in the preparation of the accompanying Consolidated Financial Statements follows:
Principles of Consolidation
The Consolidated Financial Statements include the accounts of Blyth, Inc. and its subsidiaries. The Company’s Catalog & Internet subsidiaries operate on a 52 or 53-week fiscal year ending on the Saturday closest to December 31. The Company consolidates entities in which it owns or controls more than 50% of the voting shares and/or investments where the Company has been determined to have control. The portion of the entity not owned by the Company is reflected as the noncontrolling interest within the Equity section of the Consolidated Balance Sheets. All inter-company balances and transactions have been eliminated in consolidation.
Discontinued Operations
In September 2014, the Company entered into a recapitalization agreement with ViSalus that reduced its ownership in ViSalus from approximately 80.9% to 10.0%. In October 2012, the Company sold its Sterno business. See Note 3 to the Consolidated Financial Statements for further information. The results of operations for these businesses have been reclassified to discontinued operations for all periods presented.
Two-for-one stock split
On May 16, 2012, the Company's Board of Directors announced a two-for-one stock split of its common stock effective in the form of a stock dividend of one share for each outstanding share. The record date for the stock split was June 1, 2012, and the additional shares were distributed on June 15, 2012. Accordingly, all per share amounts, weighted average shares outstanding, shares outstanding and shares repurchased presented in the Consolidated Financial Statements and notes have been adjusted retroactively to reflect the stock split. Shareholders' equity has been retroactively adjusted to give effect to the stock split for all periods presented by reclassifying the par value of the additional shares issued in connection with the stock split from Retained Earnings to Common Stock.
Estimates
The preparation of financial statements in conformity with generally accepted accounting principles requires management to make estimates and assumptions that affect the reported amounts of assets and liabilities and disclosure of contingent assets and liabilities as of the date of the financial statements and the reported amounts of revenues and expenses during the reporting period. Actual results could differ from those estimates.
Credit Concentration
The Company performs ongoing credit evaluations of its customers and generally does not require collateral. The Company makes provisions for estimated credit losses. No single customer accounts for 10% or more of Net Sales or Accounts Receivable.
Foreign Currency Translation
The Company’s international subsidiaries use their local currency as their functional currency. Therefore, all Balance Sheet accounts of international subsidiaries are translated into U.S. dollars at the year-end rates of exchange and Statement of Earnings items are translated using the weighted average exchange rates for the period. Resulting translation adjustments are
45
included in Accumulated other comprehensive income (loss) (“AOCI”) within the Consolidated Balance Sheets. Transactional gains and losses arising from the impact of currency exchange rate fluctuations on transactions in a currency other than the local functional currency are included in Foreign exchange and other, net within the Consolidated Statements of Earnings.
Investments
The Company makes investments from time to time in the ordinary course of its business that may include equity securities, debt instruments (all maturing within one year), mutual funds, cost investments and long-term investments and/or joint ventures. The Company’s investments are accounted for in accordance with the Financial Accounting Standards Board (“FASB”) Accounting Standards Codification (“ASC”) Topics 320 Investments – debt and equity securities and 325 Investments - other. The Company reviews investments for impairment using both quantitative and qualitative factors. Unrealized gains and losses on available-for-sale investment securities that are considered temporary and are not the result of a credit loss are included in AOCI, net of applicable taxes, while realized gains and losses are reported in earnings.
Derivatives and Other Financial Instruments
The Company uses foreign exchange forward contracts to hedge the impact of foreign currency fluctuations on foreign denominated inventory purchases, intercompany payables and certain loans. It does not hold or issue derivative financial instruments for trading purposes. The Company has also hedged the net assets of certain of its foreign operations through foreign currency forward contracts.
The Company has designated forward exchange contracts on forecasted intercompany purchases and purchase commitments as cash flow hedges and as long as the hedge remains effective and the underlying transaction remains probable, the effective portion of the changes in the fair value of these contracts are recorded in AOCI until earnings are affected by the variability of the cash flows being hedged. With regard to commitments for inventory purchases, upon payment of each commitment, the underlying forward contract is closed and the corresponding gain or loss is transferred from AOCI upon sale of the asset assigned and is realized in the Consolidated Statements of Earnings. If a hedging instrument is sold or terminated prior to maturity, gains and losses are deferred in AOCI until the hedged item is settled. However, if the hedged item is no longer probable of occurring, the resultant gain or loss on the hedge is recognized into earnings immediately.
The Company has designated its foreign currency forward contracts related to certain foreign denominated loans and intercompany payables as fair value hedges. The gains or losses on the fair value hedges are recognized into earnings and generally offset the transaction gains or losses in the foreign denominated loans that they are intended to hedge.
For consolidated financial statement presentation, net cash flows from such hedges are classified in the categories of the Consolidated Statement of Cash Flows with the items being hedged. Forward contracts held with each bank are presented within the Consolidated Balance Sheets as a net asset or liability, based on netting agreements with each bank and whether the forward contracts are in a net gain or loss position. Refer to Note 7 to the Consolidated Financial Statements for further details on our accounting for derivative instruments.
Cash and Cash Equivalents
The Company considers all highly liquid debt instruments purchased with an original maturity of three months or less to be cash equivalents. Amounts due from credit card companies of $1.7 million for the settlement of credit card transactions are included in cash equivalents because they are both short-term and highly liquid instruments and typically take one to three business days to be received by the Company. The major credit card companies making these payments are highly accredited businesses and the Company does not deem them to have material counterparty credit risk.
The Company holds its cash investments with high credit quality financial institutions. Cash balances in the Company’s U.S. concentration accounts are fully insured by the Federal Deposit Insurance Corporation with no limit per bank. The Company has $1.1 million of restricted cash, reported in Investments used as collateral for standby letters of credit as of December 31, 2014. This cash will be restricted until the standby letters of credit are relieved by the beneficiaries.
Inventories
Inventories are valued at the lower of cost or market. Cost is determined by the first-in, first-out method. The Company records provisions for obsolete, excess and unmarketable inventory in Cost of goods sold.
Shipping and Handling
46
The Company classifies shipping and handling fees billed to customers as Revenue, and shipping and handling costs as Cost of goods sold.
Property, Plant and Equipment
Property, plant and equipment are stated at cost, less accumulated depreciation. Depreciation expense for the years ended December 31, 2014, 2013 and 2012 was $8.1 million, $9.3 million and $9.5 million, respectively. The amortization of assets obtained through capital leases is also recorded as a component of depreciation expense. Depreciation is provided for principally by use of the straight-line method for financial reporting purposes. Leasehold improvements are amortized over the lives of the respective leases or the service lives of the improvements, whichever is shorter. The Company records gains and losses from the sale of property, plant and equipment in operating profit.
The principal estimated lives used in determining depreciation are as follows:
Buildings | 27 to 40 years |
Leasehold improvements | 5 to 10 years |
Machinery and equipment | 5 to 12 years |
Office furniture, data processing equipment and software | 3 to 7 years |
Goodwill and Other Indefinite Lived Intangibles
Goodwill and Other indefinite-lived intangibles are subject to an assessment for impairment at least annually or more frequently if events or circumstances indicate that goodwill or other indefinite lived intangibles might be impaired. The Company performs its annual assessment of impairment for goodwill in the first quarter.
For goodwill, the first step is to identify whether a potential impairment exists. This is done by comparing the fair value of a reporting unit to its carrying amount, including goodwill. Fair value for each of the Company’s reporting units is estimated utilizing a combination of valuation techniques, namely the discounted cash flow and market multiple methodologies. The discounted cash flow analysis assumes the fair value of an asset can be estimated by the economic benefit or net cash flows the asset will generate over the life of the asset, discounted to its present value. The discounting process uses a rate of return that accounts for both the time value of money and the investment risk factors. The market multiple analysis estimates fair value based on what other participants in the market have recently paid for reasonably similar assets. Adjustments are made to compensate for differences between the reasonably similar assets and the assets being valued. The fair value of the reporting units is derived by using a combination of the two valuation techniques described above. If the fair value of the reporting unit exceeds the carrying value, no further analysis is necessary. If the carrying amount of the reporting unit exceeds its fair value, the second step is performed. The second step compares the carrying amount of the goodwill to the estimated fair value of the goodwill. If fair value is less than the carrying amount, an impairment loss is reported as a reduction to the goodwill and a charge to operating expense.
For indefinite-lived intangible assets, the Company uses the relief from royalty method to estimate the fair value for indefinite-lived intangible assets and compares this value to book value. The underlying concept of the relief from royalty method is that the inherent economic value of intangibles is directly related to the timing of future cash flows associated with the intangible asset. Similar to the discounted cash flow methodology used to determine the fair value of goodwill, the fair value of indefinite-lived intangible assets is equal to the present value of after-tax cash flows associated with the intangible asset based on an applicable royalty rate. The royalty rate is determined by using existing market comparables for royalty agreements. The arms-length agreements generally support a rate that is a percentage of direct sales. This approach is based on the premise that the free cash flow is a more valid criterion for measuring value than “book” or accounting profits.
Impairment of Long-Lived Assets
The Company reviews long-lived assets, including property, plant and equipment and other intangibles with definite lives for impairment annually or whenever events or changes in circumstances indicated that the carrying amount of such an asset might not be recoverable. When indicators are present, management determines whether there has been an impairment on long-lived assets held for use in the business by comparing anticipated undiscounted future cash flow from the use and eventual disposition of the asset or asset group to the carrying value of the asset or asset group. The amount of any resulting impairment is calculated by comparing the carrying value to the fair value of the individual assets.
47
Long-lived assets that meet the definition of held for sale are valued at the lower of carrying amount or net realizable value. Assets or asset groups are determined at the lowest level possible for which identifiable cash flows are largely independent of the cash flows of other assets and liabilities. For assets whose aggregate undiscounted cash flows are less than its carrying value, the assets are considered potentially impaired and actual impairments, if any, would be determined to the extent the assets carrying value exceeds its aggregate fair value.
Recoverability of long-lived assets to be held and used is measured by a comparison of the carrying amount of an asset to the estimated undiscounted future cash flows expected to be generated by the asset. If the carrying amount of an asset exceeds its estimated undiscounted future cash flows, an impairment charge is recognized by the amount by which the carrying amount of the asset exceeds the fair value of the asset. For the year ended December 31, 2014, earnings within the Candles & Home Décor segment include a one-time fixed asset impairment charge of $0.6 million on certain machinery and equipment held and used at the Cumbria, United Kingdom facility (see Note 21 to the Consolidated Financial Statements).
Accumulated Other Comprehensive Income (Loss)
AOCI is comprised of foreign currency cumulative translation adjustments, unrealized gains and losses on certain investments in debt and equity securities, the net gains and losses on cash flow hedging instruments and net investment hedges. The Company reports, by major components and as a single total, the change in comprehensive income (loss) during the period as part of the Consolidated Statements of Stockholders’ Equity.
The following table discloses the tax effects allocated to each component of AOCI in the financial statements:
(In thousands) | December 31, 2014 | December 31, 2013 | December 31, 2012 | |||||||||||||||||||||||||||
Before-Tax Amount | Tax (Expense) or Benefit | Net-of-tax Amount | Before-Tax Amount | Tax (Expense) or Benefit | Net-of-tax Amount | Before-Tax Amount | Tax (Expense) or Benefit | Net-of-tax Amount | ||||||||||||||||||||||
Foreign currency translation adjustments | $ | 2,560 | $ | (7,358 | ) | $ | (4,798 | ) | $ | (949 | ) | $ | 2,863 | $ | 1,914 | $ | 2,347 | $ | 1,104 | $ | 3,451 | |||||||||
Net unrealized gain (loss) on certain investments | (168 | ) | 59 | (109 | ) | (260 | ) | 91 | (169 | ) | 264 | (62 | ) | 202 | ||||||||||||||||
Net unrealized gain (loss) on cash flow hedging instruments | 675 | (236 | ) | 439 | (237 | ) | 83 | (154 | ) | (741 | ) | 251 | (490 | ) | ||||||||||||||||
Less: Reclassification adjustments for (gain) loss included in net income | (69 | ) | 24 | (45 | ) | 569 | (199 | ) | 370 | (960 | ) | 336 | (624 | ) | ||||||||||||||||
Other comprehensive income (loss) | $ | 2,998 | $ | (7,511 | ) | $ | (4,513 | ) | $ | (877 | ) | $ | 2,838 | $ | 1,961 | $ | 910 | $ | 1,629 | $ | 2,539 | |||||||||
The components of AOCI, net of tax, for the year ended December 31, 2014 are as follows:
(In thousands) | Foreign Currency Translation Adjustment | Net unrealized gain (loss) on certain investments | Net unrealized gain (loss) on cash flow hedging instruments | Net Investment Hedge gain | Total | ||||||||||
Beginning balance at January 1, 2014 | $ | 13,905 | $ | 263 | $ | (110 | ) | $ | 2,304 | $ | 16,362 | ||||
Other comprehensive income (loss) before reclassifications | (7,340 | ) | (109 | ) | 439 | 2,542 | (4,468 | ) | |||||||
Less: amounts reclassified from accumulated other comprehensive income (loss) (1) (2) | — | (40 | ) | 85 | — | 45 | |||||||||
Net current period other comprehensive income (loss) | (7,340 | ) | (69 | ) | 354 | 2,542 | (4,513 | ) | |||||||
Ending balance at December 31, 2014 | $ | 6,565 | $ | 194 | $ | 244 | $ | 4,846 | $ | 11,849 | |||||
(1) All amounts net of a 35% tax rate.
(2) Reclassified from AOCI into Foreign exchange and other, net and Cost of goods sold.
Income Taxes
48
Income tax expense is based on taxable income, statutory tax rates and the impact of non-deductible items. Deferred tax assets and liabilities are recognized for the expected tax consequences of temporary differences between the tax basis of assets and liabilities and their reported amounts. The Company periodically estimates whether its tax benefits are more likely than not sustainable on audit, based on the technical merits of the position. There are inherent uncertainties related to the interpretation of tax regulations in the jurisdictions in which the Company transacts business. The judgments and estimates made at a point in time may change based on the outcome of tax audits, as well as changes to or further interpretations of regulations. If such changes take place, there is a risk that the Company's tax rate may increase or decrease in any period.
Deferred tax assets and liabilities reflect the Company's best estimate of the tax benefits and costs expected to be realized in the future. The Company establishes valuation allowances to reduce its deferred tax assets to an amount that will more likely than not be realized.
In accordance with ASC 740, “Income Taxes” (“ASC 740”), the Company recognizes the tax benefit from an uncertain tax position only if it is more likely than not that the tax position will be capable of withstanding examination by the taxing authorities based on the technical merits of the position. A number of years may elapse before an uncertain tax position for which the Company has established a tax reserve is audited and finally resolved, and the number of years for which the Company has audits that are open varies depending on the tax jurisdiction (a current summary is provided in Note 14 to the Consolidated Financial Statements). When facts and circumstances change, the Company reassesses these probabilities and records any necessary adjustments to the provision.
The Company determined that a portion of its undistributed foreign earnings are not reinvested indefinitely by its non-U.S. subsidiaries, and accordingly, recorded a deferred income tax liability related to these undistributed earnings. The Company periodically reassesses whether the non-U.S. subsidiaries will invest their undistributed earnings indefinitely.
Revenue Recognition
Revenues consist of sales to customers, net of returns and allowances. The Company recognizes revenue upon delivery, when both title and risk of loss are transferred to the customer. The Company presents revenues net of any taxes collected from customers and remitted to governmental authorities. The Company also records revenue on financing fees from past due balances from financing receivables within its Catalog & Internet segment.
The Company records estimated reductions to revenue for customer promotions, volume incentives and other promotions. The Company also records reductions to revenue, based primarily on historical experience, for estimated customer returns and chargebacks that may arise as a result of shipping errors, product damaged in transit or for other reasons that can only become known subsequent to recognizing the revenue. In some instances, the Company receives payment in advance of product delivery and records it as deferred revenue. Upon delivery of product for which advance payment has been made, the related deferred revenue is reversed and recorded to revenue. Gift card sales are also included in deferred revenue. Upon redemption or when redemption is remote, the related deferred revenue is recorded to revenue. The Company considers applicable escheat laws and historical redemption data when realizing gift card revenue.
The Company has established an allowance for doubtful accounts for its trade and financing receivables. The allowance is determined based on the Company’s evaluation of specific customers’ ability to pay, aging of receivables, historical experience and the current economic environment. The sales price for the Company’s products is fixed prior to the time of shipment to the customer. Customers have the right to return product in circumstances for which the Company believes are typical of the industry for such reasons as damaged goods, shipping errors or similar occurrences. Independent consultants within the Candles & Home Decor segment are allowed to return unused product purchased within the past twelve months for a refund of 90% of its original purchase price.
Earnings per Common and Common Equivalent Share
Basic earnings per common share and common share equivalents are computed based upon the weighted average number of shares outstanding during the period. These outstanding shares include both outstanding common shares and vested restricted stock units (“RSUs”) as common stock equivalents. Diluted earnings per common share and common share equivalents reflect the potential dilution that could occur if options and fixed awards to be issued under stock-based compensation arrangements were converted into common stock.
Employee Stock Compensation
49
The Company has share-based compensation plans as described in Note 16 to the Consolidated Financial Statements. In accordance with U.S. Generally Accepted Accounting Principles (“GAAP”), the Company measures and records compensation expense, based on estimated fair values, for all share-based awards made to employees and directors, including stock options, restricted stock and restricted stock units. The Company recognizes compensation expense for share-based awards expected to vest on a straight line basis with graded vesting over the requisite service period of the award based on their grant date fair value.
Cost of Goods Sold and Operating Expenses
Cost of goods sold includes the cost of raw materials and their procurement costs, inbound and outbound freight, and the direct and indirect costs associated with the personnel, resources and property, plant and equipment related to the manufacturing, warehousing, inventory management and order fulfillment functions. Selling expenses include commissions paid to consultants, customer service costs, catalog costs including printing and shipping, the salaries and benefits related to personnel within the marketing and selling functions, costs associated with promotional offers to independent consultants, allowances for doubtful accounts and other selling and marketing expenses. Administrative and other expenses includes salaries and related benefits associated with various administrative departments, including human resources, legal, information technology, finance and executive, as well as professional fees and administrative facility costs associated with leased buildings, office equipment and supplies.
Promotional Offers to Independent Consultants
The Company’s direct selling sales are generated by its independent consultants, who strive to maximize the interrelated objectives of selling product, scheduling (or booking) parties or events and recruiting new consultants. In order to encourage its consultants to accomplish these goals, the Company makes monthly promotional offers including free or discounted products to consultants and customers, as well as annual incentive trips and the payment of bonuses to consultants.
Promotions, including free or discounted products, are designed to increase revenues by providing incentives for customers and guests attending shows whose purchases exceed a certain level. Promotional offers for free products are recorded as a charge to Cost of goods sold when incurred, and promotional offers for discounted products are recorded as a reduction of revenue when incurred with the full cost of the product being charged to Cost of goods sold. Sales bonuses are awarded based on achieving certain ranks within the compensation plan. These bonuses are paid monthly and are charged to selling expenses when earned.
Annual incentive trips and bonuses are awarded to consultants who recruit new consultants or achieve certain sales levels. Estimated costs related to these promotional offers are recorded as compensation within Selling expense as they are earned. For the years ended December 31, 2014, 2013 and 2012, expenses related to promotional activities were $6.1 million, $6.6 million and $6.5 million, respectively.
Advertising and Catalog Costs
The Company expenses the costs of advertising as incurred, except the costs for direct-response advertising, which are capitalized and amortized over the expected period of future benefit. For the years ended December 31, 2014, 2013 and 2012, advertising expenses were $47.0 million, $64.8 million and $66.5 million, respectively. As of December 31, 2014 and 2013, prepaid advertising expenses totaled $7.9 million and $8.5 million, respectively.
Direct-response advertising relates to the Silver Star Brands business and consists primarily of the costs to produce direct-mail order catalogs. The capitalized production costs are amortized for each specific catalog mailing over the period following catalog distribution in proportion to revenues (orders) received, compared to total estimated revenues for that particular catalog mailing. The amortization period is generally from three to six months and does not exceed twelve months.
In the Candles & Home Décor segment, catalog production costs are capitalized and expensed as the catalogs are distributed, generally over less than a twelve month period.
Note 2. New Accounting Pronouncements
The following is a list of accounting standards that could have an impact on future financial statements or disclosures upon adoption:
In January 2015, the FASB issued ASU 2015-01, Income Statement - Extraordinary and Unusual Items (Subtopic 225-20): Simplifying Income Statement Presentation by Eliminating the Concept of Extraordinary Items ("ASU 2015-01"). ASU
50
2015-01 eliminates the concept of an extraordinary item from GAAP. As a result, an entity is no longer required to separately classify, present, or disclose extraordinary events and transactions; however, the presentation and disclosure guidance for items that are unusual in nature or occur infrequently will be retained. The new standard is effective for annual reporting periods beginning after December 15, 2015. The standard permits the use of applying changes prospectively and retrospectively to all prior periods presented in the financial statements. Early adoption is permitted provided that the guidance is applied from the beginning of the fiscal year of adoption. The adoption of this standard is not expected to have a material impact on the Company’s consolidated financial position, results of operations and related disclosures.
In May 2014, the FASB issued ASU 2014-09, Revenue from Contracts with Customers (Topic 606) ("ASU 2014-09"), which requires an entity to recognize the amount of revenue which it expects to be entitled for the transfer of promised goods and services to customers. ASU 2014-09 will replace most existing revenue recognition guidance in GAAP when it becomes effective. The new standard is effective for annual reporting periods beginning after December 15, 2016. Early adoption is not permitted. The standard permits the use of either the retrospective or cumulative effect transition method. The Company is evaluating the impact of the adoption on its consolidated financial position, results of operations and related disclosures.
Note 3. Discontinued Operations
The Company has early adopted ASU 2014-08, Presentation of Financial Statements (Topic 205) and Property, Plant, and Equipment (Topic 360): "Reporting Discontinued Operations and Disclosures of Disposals of Components of an Entity" ("ASU 2014-08").
On September 4, 2014, the Company, ViSalus and certain of ViSalus’s preferred stockholders entered into a recapitalization agreement pursuant to which ViSalus was recapitalized by exchanging each share of ViSalus preferred stock for 38.2 shares of ViSalus common stock, thereby (i) reducing the Company’s ownership interest in ViSalus from approximately 80.9% to 10.0% and (ii) eliminating the obligation of ViSalus to redeem the preferred stock in 2017 (for approximately $143.2 million) and the related guaranty by the Company of ViSalus’s performance of such obligation. In addition, the Company agreed to make available to ViSalus a revolving credit facility.
On October 17, 2014, the Company and ViSalus entered into a revolving loan agreement (the "Blyth Revolving Loan Agreement") pursuant to which the Company agreed to lend ViSalus up to $6.0 million. Loans under the revolving credit agreement bear interest at a rate of 10% per annum. Interest will be paid monthly and there will be no higher default rate of interest. The revolving loan involves related parties. Robert B. Goergen, Robert B. Goergen, Jr. and Todd A. Goergen own 8.29%, 0.34% and 2.81%, respectively, of the outstanding capital stock of ViSalus. On October 17, 2014, the founders of ViSalus and Robert B. Goergen (the “Founder Lenders”) entered into a substantially similar loan agreement with ViSalus (the “Founder Revolving Loan Agreement”) pursuant to which they made a revolving credit facility available to ViSalus in an amount up to $6.0 million on terms that are substantially identical to the terms of the Blyth Revolving Loan Agreement. Loans made under the Blyth Revolving Loan Agreement and loans made under the Founder Revolving Loan Agreement will be made at the same time in equal amounts and will rank equally with each other. As of December 31, 2014, ViSalus owed the Company $3.0 million under the Blyth Revolving Loan Agreement. In February 2015, the Company lent an additional $0.8 million under the agreement, bringing the amount outstanding to $3.8 million.
As a result of its reduced ownership in ViSalus, the Company will no longer consolidate ViSalus's results in the Company's financial statements; rather, the ViSalus investment will be recorded on a cost basis subject to annual impairment reviews to ensure its investment is properly stated. The Company's investment in ViSalus was evaluated for impairment at December 31, 2014 and, as a result, a $2.9 million impairment charge was recorded to the ViSalus investment bringing the ending investment value to $6.9 million. This transaction is presented as discontinued operations in the Consolidated Financial Statements and results of operations for the years ended December 31, 2014, 2013 and 2012.
The Company recorded a gain on the recapitalization of ViSalus of $118.9 million, net of income tax benefit of $0.7 million, as a result of the exchange of the ViSalus preferred stock for ViSalus common stock, which eliminated the Company’s guaranty of ViSalus’s agreement to redeem the preferred stock. This transaction is non-cash and was treated as a tax free exchange, as the preferred stockholders received ViSalus common stock in exchange for their preferred stock.
On October 29, 2012, the Company completed the sale of its Sterno business for $23.5 million in cash and recorded a gain of $5.5 million, net of income tax expense of $3.1 million. This transaction is presented as discontinued operations in the Consolidated Financial Statements and results of operations for the year ended December 31, 2012.
The following table details net earnings (loss) of discontinued operations for the years ended December 31:
51
(In thousands) | 2014 | 2013 | 2012 | ||||||
Net sales | $ | 138,860 | $ | 351,187 | $ | 671,848 | |||
Cost of goods sold | 42,179 | 113,273 | 216,068 | ||||||
Selling, administrative and other expenses | 104,199 | 230,154 | 371,546 | ||||||
Other income and expenses | 1,657 | (333 | ) | (227 | ) | ||||
Earnings (loss) before income taxes and noncontrolling interest | (9,175 | ) | 8,093 | 84,461 | |||||
Income tax expense (benefit) | (176 | ) | 4,457 | 35,758 | |||||
Less: Net earnings (loss) attributable to noncontrolling interests | (1,768 | ) | 690 | 12,961 | |||||
Net earnings (loss) attributable to discontinued operations | $ | (7,231 | ) | $ | 2,946 | $ | 35,742 | ||
The following table details assets and liabilities of discontinued operations as of December 31, 2013:
Total assets of discontinued operations (In thousands) | |||
Cash | $ | 7,914 | |
Accounts receivable, net | 149 | ||
Inventories | 21,113 | ||
Prepaid and other | 1,349 | ||
Deferred tax current | 2,517 | ||
Other current assets | 1,166 | ||
Current assets of discontinued operations | 34,208 | ||
Net plant, property and equipment | 18,602 | ||
Investments | 1,177 | ||
Deferred tax non-current | 5,800 | ||
Intangible assets | 2,028 | ||
Non-current assets of discontinued operations | 27,607 | ||
Total | $ | 61,815 | |
Total liabilities of discontinued operations | |||
Accounts payable | $ | 5,870 | |
Accrued expenses | 17,986 | ||
Income taxes payable | 110 | ||
Current liabilities of discontinued operations | 23,966 | ||
Other liabilities | 865 | ||
Redeemable preferred stock | 146,603 | ||
Non-current liabilities of discontinued operations | 147,468 | ||
Total | $ | 171,434 | |
Note 4. Financing Receivables
During 2012, Silver Star Brands entered into an agreement with a financial services company to offer financing services, including originating, collecting, and servicing customer receivables related to the purchase of Silver Star Brands products through a private credit financing program. New financing originations, which represent the amounts of financing provided by the service provider to customers, were approximately $20.9 million and $14.8 million for the years ended December 31, 2014 and 2013, respectively. As of December 31, 2014 and 2013, the Company's net financing receivables balances were $7.2 million and $5.6 million, respectively. This balance is recorded in accounts receivable in the Consolidated Balance Sheets and includes income from financing fees which represents income from interest earned on outstanding balances and late fees.
Silver Star Brands maintains an allowance to cover expected financing receivable credit losses and evaluates credit loss expectations based on its total portfolio. The allowance for credit losses is determined based on various factors, including historical and anticipated experience, past due receivables, receivable type, and customer risk profile. Accounts become past
52
due and accrue interest 30 days after the first initial billing cycle when a payment due date is missed or only a partial payment is received. As of December 31, 2014 and 2013, the allowance for credit losses was $4.8 million and $3.0 million, respectively. Provisions for the allowance of credit losses are recorded to selling expenses for product sales. Provisions for the allowance of interest income from financing or late fees is charged directly against net sales within the Consolidated Statements of Earnings. In 2014, provisions recorded to selling expense for product sales were $5.7 million and provisions recorded directly against sales for interest income and late fees were $1.6 million. The Company continues to monitor broader economic indicators and their potential impact on future loss performance. The Company has an extensive process to manage its exposure to customer credit risk, including active management of credit lines and its collection activities. Based on its assessment of the customer financing receivables, the Company believes it is adequately reserved. Write-offs were 11.5% and 23.7% of 2014 and 2013 sales, respectively. The Company's policy is to write-off financing receivables greater than 180 days past due with no collection activity and no receivable is placed on non-accrual status until it is written off. All write-offs are submitted to a third party collection agency.
The majority of Silver Star Brands' financing receivables are considered sub-prime credit risk, which represent lower credit quality accounts that are comparable to FICO scores below 600. Credit decisions are based on propriety scorecards, which include the customer's credit history, payment history, credit usage and other credit agency-related elements. Credit scores are obtained prior to a customers initial mailing and then rescored each season and adjusted accordingly. At a minimum each customer is rescored at least every six months.
The following table summarizes the changes in the allowance for financing receivables credit losses for the respective periods:
(In thousands) | December 31, 2014 | December 31, 2013 | ||||
Allowance for financing receivable credit losses: | ||||||
Balance at the beginning of period | $ | 2,988 | $ | 712 | ||
Provision for credit losses | 7,279 | 4,540 | ||||
Write-offs | (5,639 | ) | (2,277 | ) | ||
Recoveries | 139 | 13 | ||||
Balance at the end of period | $ | 4,767 | $ | 2,988 | ||
The following table summarizes the age of Silver Star Brands' customer financing receivables, gross, including interest and other finance charges, as of December 31, 2014:
(In thousands) | Current | Past Due 1 - 90 Days | 91 - 180 Days | Total |
Financing Receivables | $7,132 | $3,237 | $1,645 | $12,014 |
Note 5. Investments
The Company considers all money market funds and debt instruments, including certificates of deposit and commercial paper, purchased with an original maturity of three months or less to be cash equivalents, unless the assets are restricted. The carrying value of cash and cash equivalents approximates its fair value.
The Company’s investments as of December 31, 2014 consisted of a number of financial securities including certificates of deposit, shares in mutual funds invested in short term bonds and a 10% ownership interest in a former subsidiary now treated as a cost investment. The Company accounts for its investments in debt and equity instruments in accordance with ASC 320, “Investments – Debt & Equity Securities.” The Company accounts for its cost investments in accordance with ASC 325, “Investments – Other.”
The following table summarizes, by major security type, the amortized costs and fair value of the Company’s investments:
December 31, 2014 | December 31, 2013 | ||||||||||||||||||||||
(In thousands) | Cost Basis(1) | Fair Value | Net unrealized loss in AOCI(2) | Cost Basis(1) | Fair Value | Net unrealized loss in AOCI | |||||||||||||||||
Short-term bond mutual funds | $ | 19,092 | $ | 18,961 | $ | (131 | ) | $ | 8,000 | $ | 7,985 | $ | (15 | ) | |||||||||
Certificates of deposit | 1,101 | 1,101 | — | 1,070 | 1,070 | — | |||||||||||||||||
Investment in ViSalus | 6,850 | 6,850 | — | — | — | — | |||||||||||||||||
Total investments | $ | 27,043 | $ | 26,912 | $ | (131 | ) | $ | 9,070 | $ | 9,055 | $ | (15 | ) | |||||||||
53
(1) The cost basis represents the actual amount paid less any permanent impairment of that asset.
(2) The Company believes these short-term losses are temporary in nature and that, therefore, no permanent impairment is required.
As of December 31, 2014 and 2013, the Company held $19.0 million and $8.0 million, respectively, of short-term bond mutual funds, which are classified as short-term available for sale investments. Unrealized losses on these investments that are considered temporary are recorded in AOCI. These securities are valued based on quoted prices in active markets. As of December 31, 2014 and 2013, the Company recorded $0.1 million and insignificant unrealized losses, net of tax, respectively.
Also included in long-term investments are certificates of deposit that are held as collateral for the Company’s outstanding standby letters of credit and for foreign operations of $1.1 million December 31, 2014 and 2013, respectively. These investments are recorded at fair value which approximates cost and interest earned on these is recorded in Interest income in the Consolidated Statements of Earnings.
The Company accounts for its noncontrolling interest in ViSalus on a cost basis under ASC 325. This investment was evaluated for impairment at December 31, 2014 and, as a result, a $2.9 million impairment charge was recorded to the ViSalus investment bringing the ending investment value to $6.9 million. These transactions involve related parties as discussed in Note 15 to the Consolidated Financial Statements.
In addition to the investments noted above, the Company holds mutual funds as part of a deferred compensation plan which are classified as available for sale. As of December 31, 2014 and 2013, the fair value of these securities was $1.0 million. These securities are valued based on quoted prices in an active market. Unrealized gains and losses on these securities are recorded in AOCI. These mutual funds are included in Other assets in the Consolidated Balance Sheets.
The following table summarizes the proceeds and realized gains and losses on the sale of available for sale investments recorded in Foreign exchange and other within the Consolidated Statements of Earnings for the years ended December 31, 2014 and 2013. Gains and losses reclassified from AOCI, net to foreign exchange, in the Consolidated Statement of Earnings are calculated using the specific identification method.
(In thousands) | December 31, 2014 | December 31, 2013 | |||||
Net proceeds | $ | 8,900 | $ | 44,655 | |||
Realized losses | $ | (8 | ) | $ | (304 | ) | |
Note 6. Inventories
The major components of Inventories are as follows:
(In thousands) | December 31, 2014 | December 31, 2013 | |||||
Raw materials | $ | 3,259 | $ | 3,642 | |||
Finished goods | 42,525 | 51,040 | |||||
Total | $ | 45,784 | $ | 54,682 | |||
As of December 31, 2014 and 2013, the inventory valuation reserves totaled $5.0 million and $5.5 million, respectively. The Company recorded provisions for obsolete, excess and unmarketable inventory to Cost of goods sold in the Consolidated Statements of Earnings for the years ended December 31, 2014, 2013 and 2012 of $3.1 million, $2.4 million and $0.3 million, respectively.
Note 7. Derivatives and Other Financial Instruments
The Company uses foreign exchange forward contracts to hedge the impact of foreign currency fluctuations on foreign denominated inventory purchases, net assets of its foreign operations, intercompany payables and loans. The Company does not hold or issue derivative financial instruments for trading purposes. The Company has hedged the net assets of certain of its foreign operations through foreign currency forward contracts. The realized and unrealized gains/losses on these hedges are recorded within AOCI until the investment is sold or disposed of. As of December 31, 2014, there were no outstanding net investment hedges. The cumulative net after-tax gain related to net investment hedges in AOCI as of December 31, 2014 and 2013 was $4.1 million and $2.3 million, respectively.
54
The Company has designated its foreign currency forward contracts related to certain foreign denominated loans and intercompany payables as fair value hedges. The gains or losses on the fair value hedges are recognized into earnings and generally offset the transaction gains or losses in the foreign denominated loans that they are intended to hedge.
The Company has designated forward exchange contracts on forecasted intercompany inventory purchases and future purchase commitments as cash flow hedges and as long as the hedge remains effective and the underlying transaction remains probable, the effective portion of the changes in the fair value of these contracts will be recorded in AOCI until earnings are affected by the variability of the cash flows being hedged. Upon settlement of each commitment, the underlying forward contract is closed and the corresponding gain or loss is transferred from AOCI and is included in the measurement of the cost of the acquired asset upon sale. If a hedging instrument is sold or terminated prior to maturity, gains and losses are deferred in AOCI until the hedged item is settled. However, if the hedged item is no longer probable of occurring, the resultant gain or loss on the terminated hedge is recognized into earnings immediately. The net after-tax unrealized gain included in AOCI at December 31, 2014 for cash flow hedges was $0.2 million and is expected to be transferred into earnings within the next twelve months upon settlement of the underlying commitment. The net after-tax unrealized loss included in AOCI at December 31, 2013 for cash flow hedges was $0.1 million.
For financial statement presentation, net cash flows from such hedges are classified in the categories of the Consolidated Statement of Cash Flows with the items being hedged. Forward contracts held with each bank are presented within the Consolidated Balance Sheets as a net asset or liability, based on netting agreements with each bank and whether the forward contracts are in a net gain or loss position. The foreign exchange contracts outstanding have maturity dates through October 2015.
The table below details the fair value and location of the Company’s hedges in the Consolidated Balance Sheets:
(In thousands) | December 31, 2014 | December 31, 2013 | |||||
Derivatives designated as hedging instruments | Prepaid Assets | Accrued Expenses | |||||
Foreign exchange forward contracts in an asset position | $ | 405 | $ | 44 | |||
Foreign exchange forward contracts in a liability position | (8 | ) | (225 | ) | |||
Net derivatives at fair value | $ | 397 | $ | (181 | ) | ||
For the years ended December 31, 2014 and 2013, the Company recorded gains of $0.4 million and losses of $0.3 million, respectively, related to foreign exchange forward contracts accounted for as Fair Value hedges to Foreign exchange and other.
Gain and loss activity recorded to Cost of goods sold and reclassified from AOCI to the Company’s cash flow hedges are as follows:
Cash Flow Hedging Relationships | Amount of Gain (Loss) Recognized in AOCI on Derivative (Effective Portion) | Amount of Gain (Loss) Reclassified from AOCI into Income (Effective Portion) | |||||||||||
(In thousands) | December 31, 2014 | December 31, 2013 | December 31, 2014 | December 31, 2013 | |||||||||
Foreign exchange forward contracts | $ | 720 | $ | (274 | ) | $ | 174 | $ | (235 | ) | |||
For the years ended December 31, 2014 and December 31, 2013, the Company recorded gains of $1.8 million and losses of $1.4 million, respectively, to AOCI related to foreign exchange forward contracts accounted for as Net Investment hedges.
Note 8. Goodwill and Other Intangibles
Goodwill is subject to an assessment for impairment using a two-step fair value-based test and, as such, other intangibles are also subject to impairment reviews, which must be performed at least annually or more frequently if events or circumstances indicate that goodwill or other indefinite-lived intangibles might be impaired.
As of December 31, 2014 and 2013, the carrying amount of the Company’s goodwill within the Candles & Home Décor segment was $2.3 million.
Other intangible assets include indefinite-lived trade names and trademarks and customer relationships related to the Company’s acquisition of Miles Kimball and Walter Drake, which are reported in the Catalog & Internet segment.
55
During the year ended December 31, 2012, the Exposures brand under the Silver Star Brands business experienced substantial declines in revenues when compared to its forecasts and prior years. The Company believes this shortfall in revenue was primarily attributable to decreased consumer spending, due to changes in the business environment and adverse economic conditions. As a result of the impairment analysis performed, the indefinite-lived trade name was determined to be partly impaired, as the fair value of this brand was less than its carrying value. Accordingly, the Company recorded a non-cash pre-tax impairment charge of $0.8 million to Administrative and other expenses in the Consolidated Statements of Earnings resulting in a carrying value of $0.6 million.
The indefinite-lived trade names and trademarks were valued at $6.6 million as of December 31, 2014 and 2013, respectively. The Company does not amortize the indefinite-lived trade names and trademarks, but rather tests for impairment annually and upon the occurrence of a triggering event. The initial gross value of all indefinite-lived trade names and trademarks and customer relationships was $28.1 million and $15.4 million, respectively, within the Catalog & Internet segment. The difference between the initial gross value and its current carrying value represents impairment charges previously recorded for indefinite-lived trade names and trademarks and prior period amortization for customer relationships.
Other intangible assets within the Catalog & Internet segment include the following:
(In thousands) | Indefinite-lived trade names and trademarks | Customer relationships | |||||
Other intangibles at December 31, 2012 | $ | 6,566 | $ | 827 | |||
Amortization | — | (613 | ) | ||||
Other intangibles at December 31, 2013 | $ | 6,566 | $ | 214 | |||
Amortization | — | (187 | ) | ||||
Other intangibles at December 31, 2014 | $ | 6,566 | $ | 27 | |||
Amortization expense is recorded on an accelerated basis over the estimated lives of the customer lists ranging from 5 to 12 years. For the years ended December 31, 2014 and 2013, amortization expense was $0.2 million and $0.6 million, respectively. Amortization expense in 2015 is an insignificant amount. The weighted average remaining life of the Company’s customer lists was 1.1 years at December 31, 2014.
Note 9. Fair Value Measurements
The fair-value hierarchy established in ASC 820 prioritizes the inputs used in valuation techniques into three levels as follows:
Level-1 – Observable inputs – quoted prices in active markets for identical assets and liabilities | |
Level-2 – Observable inputs other than the quoted prices in active markets for identical assets and liabilities – such as quoted prices for similar instruments, quoted prices for identical or similar instruments in inactive markets, or other inputs that are observable or can be corroborated by observable market data; | |
Level-3 – Unobservable inputs – includes amounts derived from valuation models where one or more significant inputs are unobservable and require the Company to develop relevant assumptions. | |
56
Assets and Liabilities Measured at Fair Value on a Recurring Basis
The following tables summarizes the financial assets and liabilities measured at fair value on a recurring basis as of December 31, 2014 and 2013, and the basis for that measurement, by level within the fair value hierarchy:
(In thousands) | Balance as of December 31, 2014 | Quoted prices in active markets for identical assets (Level 1) | Significant other observable inputs (Level 2) | Significant unobservable inputs (Level 3) | |||||||||||
Financial assets | |||||||||||||||
Short-term bond mutual funds | $ | 18,961 | $ | 18,961 | $ | — | $ | — | |||||||
Certificates of deposit | 1,101 | — | 1,101 | — | |||||||||||
Foreign exchange forward contracts | 405 | — | 405 | — | |||||||||||
Deferred compensation plan assets (1) | 962 | 962 | — | — | |||||||||||
Total | $ | 21,429 | $ | 19,923 | $ | 1,506 | $ | — | |||||||
Financial liabilities | |||||||||||||||
Foreign exchange forward contracts | $ | (8 | ) | $ | — | $ | (8 | ) | $ | — | |||||
(1) Recorded as an Other asset with an offsetting liability for the obligation to employees in Other liabilities.
(In thousands) | Balance as of December 31, 2013 | Quoted prices in active markets for identical assets (Level 1) | Significant other observable inputs (Level 2) | Significant unobservable inputs (Level 3) | |||||||||||
Financial assets | |||||||||||||||
Short-term bond mutual funds | $ | 7,985 | $ | 7,985 | $ | — | $ | — | |||||||
Certificates of deposit | 1,070 | — | 1,070 | — | |||||||||||
Foreign exchange forward contracts | 44 | 44 | |||||||||||||
Deferred compensation plan assets (1) | 1,007 | 1,007 | — | — | |||||||||||
Total | $ | 10,106 | $ | 8,992 | $ | 1,114 | $ | — | |||||||
Financial liabilities | |||||||||||||||
Foreign exchange forward contracts | $ | (225 | ) | $ | — | $ | (225 | ) | $ | — | |||||
(1) Recorded as an Other asset with an offsetting liability for the obligation to employees in Other liabilities.
The Company values its investments in equity securities within the deferred compensation plan and its investments in short term bond mutual funds using level 1 inputs, by obtaining quoted prices in active markets. The deferred compensation plan assets consist of shares of mutual funds. The Company also enters into both cash flow and fair value hedges by purchasing foreign currency exchange forward contracts. These contracts are valued using level 2 inputs, primarily observable forward foreign exchange rates. The certificates of deposit that are used to collateralize some of the Company’s letters of credit have been valued using information classified as level 2, as these are not traded on the open market and are held unsecured by one counterparty.
The carrying values of cash and cash equivalents, trade and other receivables and trade payables are considered to be representative of their respective fair values.
Assets and Liabilities Measured at Fair Value on a Nonrecurring Basis
The Company is required, on a non-recurring basis, to adjust the carrying value or provide valuation allowances for certain assets using fair value measurements in accordance with ASC 820. The Company’s assets and liabilities measured at fair value on a nonrecurring basis include property, plant and equipment, goodwill, intangibles, its ViSalus investment and other assets. These assets are not measured at fair value on a recurring basis; however, they are subject to fair value adjustments in certain circumstances, such as when there is evidence that impairment may exist. The Company's investment in ViSalus was evaluated for impairment at December 31, 2014 and, as a result, a $2.9 million impairment charge was recorded to the ViSalus investment bringing the ending investment value to $6.9 million. The Company used a discounted cash flow model to estimate the fair value of its ViSalus investment. This model incorporated the most recent long term strategic forecast of the business to determine the estimated cash flows, which were then discounted to arrive at its net present value. The discount rate used to determine its present value considers the time value of money, certain growth rate assumptions, other investment risk factors and the terminal value of the business.
57
Goodwill and indefinite-lived intangibles are subject to impairment testing on an annual basis, or sooner if circumstances indicate a condition of impairment may exist. The valuation uses assumptions such as interest and discount rates, growth projections and other assumptions of future business conditions. These valuation methods require a significant degree of management judgment concerning the use of internal and external data. In the event these methods indicate that fair value is less than the carrying value, the asset is recorded at fair value as determined by the valuation models. As such, the Company classifies goodwill and other intangibles subjected to nonrecurring fair value adjustments as level 3.
The fair value of the Company’s long-lived assets, primarily property, plant and equipment, is reviewed whenever events or changes in circumstances indicate that carrying amounts of a long-lived assets may not be recoverable. Management determines whether there has been an impairment of long-lived assets held for use in the business by comparing anticipated undiscounted future cash flows from the use and eventual disposition of the asset or asset group to the carrying value of the asset. The amount of any resulting impairment is calculated by comparing the carrying value to the fair value. For the year ended December 31, 2014, earnings within the Candles & Home Décor segment include a one-time fixed asset impairment charge of $0.6 million on certain machinery and equipment held and used at the Cumbria, United Kingdom facility (see Note 21 to the Consolidated Financial Statements). Long-lived assets that meet the definition of held for sale are valued at the lower of carrying amount or net realizable value. Assets or asset groups are determined at the lowest level possible for which identifiable cash flows are largely independent of the cash flows of other assets and liabilities. For assets whose aggregate undiscounted cash flows are less than carrying value, the assets are considered potentially impaired and actual impairments, if any, would be determined to the extent the assets' carrying values exceeds its aggregate fair values.
The valuation of these assets uses a significant amount of management’s judgment and uses information provided by third parties. The local real estate market, regional comparatives, estimated concessions and transaction costs are all considered when determining the fair value of these assets. Due to the nature of this information and the assumptions made by management, the Company has classified the inputs used in valuing these assets as level 3.
Note 10. Accrued Expenses
Accrued expenses consist of the following:
(In thousands) | December 31, 2014 | December 31, 2013 | |||||
Compensation and benefits | $ | 9,707 | $ | 11,715 | |||
Deferred revenue | 9,928 | 9,455 | |||||
Promotional | 6,109 | 6,874 | |||||
Interest payable | 2,341 | 384 | |||||
Postage & Freight | 2,476 | 1,763 | |||||
Professional fees | 2,734 | 1,433 | |||||
Taxes, other than income | 1,516 | 1,632 | |||||
Self insurance reserves | 717 | 789 | |||||
Inventory | 502 | 633 | |||||
Other | 5,297 | 6,253 | |||||
Total | $ | 41,327 | $ | 40,931 | |||
Note 11. Long-Term Debt
Long-term debt consists of the following:
(In thousands) | December 31, 2014 | December 31, 2013 | |||||
6.00% Senior Notes | $ | 50,000 | $ | 50,000 | |||
Other | 5,463 | 6,278 | |||||
55,463 | 56,278 | ||||||
Less current maturities | (50,907 | ) | (952 | ) | |||
$ | 4,556 | $ | 55,326 | ||||
58
On May 10, 2013, the Company issued $50.0 million principal amount of 6.00% Senior Notes. The Senior Notes bore interest payable semi-annually in arrears on May 15 and November 15. In connection with the ViSalus recapitalization, the Company amended the indenture governing the Senior Notes to provide for notice of the mandatory redemption of the Senior Notes on the earlier of March 4, 2015 or the date, if any, that the Company consummated a new financing in the amount of at least $50.0 million. In early March 2015, the Company provided the notice of the mandatory redemption of the Senior Notes, which became due and were repaid on March 10, 2015. This amendment was accounted for as a modification in accordance with ASC section 470-50 “Debt -Modifications and Extinguishments.” As a result, the Company was required to a pay a $3.0 million redemption premium in addition to accrued interest on the redemption date. The redemption premium will be expensed on a pro rata basis from September 4, 2014 through the redemption date. As of December 31, 2014, the Company recorded $0.7 million of additional interest expense associated with the redemption premium. The Company has classified the Senior Notes as current. In addition, to secure the obligations under the indenture, the Company granted a security interest to the lender in substantially all of its personal property and certain of its real property.
As of December 31, 2014 and 2013, Silver Star Brands had approximately $4.9 million and $5.5 million, respectively, of long-term debt outstanding under a real estate mortgage note payable which matures June 1, 2020. Under the terms of the note, payments of principal and interest are required monthly at a fixed interest rate of 7.89%.
Maturities under debt obligations for the years ending December 31 are as follows (In thousands): | |||
2015 | $ | 50,907 | |
2016 | 954 | ||
2017 | 993 | ||
2018 | 1,039 | ||
2019 | 1,037 | ||
Thereafter | 533 | ||
$ | 55,463 | ||
The Company’s debt is recorded at its amortized cost basis which approximates its fair value.
As of December 31, 2014, the Company had a total of $2.4 million available under an uncommitted bank facility to be used for letters of credit through January 31, 2015. As of December 31, 2014, no amount was outstanding under this facility.
As of December 31, 2014, the Company had $1.1 million in standby letters of credit outstanding that are collateralized with a certificate of deposit and have an expiration date of March 1, 2015.
Note 12. Employee Benefit Plans
The Company has defined contribution employee benefit plans in both the United States and certain of its foreign locations, covering substantially all eligible non-union employees. Contributions to all such plans are principally at the Company’s discretion. Total expense related to all defined contribution plans in the United States for the years ended December 31, 2014, 2013 and 2012 was $1.2 million, $1.5 million and $1.6 million, respectively.
Certain of the Company’s non-U.S. subsidiaries provide pension benefits to employees or participate in government sponsored programs. The cost of these plans or government sponsored programs was $1.7 million, $1.8 million and $1.7 million for the years ended December 31, 2014, 2013 and 2012, respectively. Most employees outside the United States are covered by government sponsored and administered programs. Other contributions to government-mandated programs are not expected to be significant.
Note 13. Commitments and Contingencies
The Company utilizes operating and capital leases for a portion of its facilities and equipment. Generally, the leases provide that the Company pay real estate taxes, maintenance, insurance and other occupancy expenses applicable to leased premises. Certain leases provide for renewal for various periods at stipulated rates.
59
The minimum future rental commitments under operating and capital leases are as follows (In thousands): | |||
For the years ending December 31, | |||
2015 | $ | 5,271 | |
2016 | 4,121 | ||
2017 | 2,800 | ||
2018 | 2,445 | ||
2019 | 2,280 | ||
and thereafter | 2,188 | ||
Total minimum payments required | $ | 19,105 | |
Rent expense for the years ended December 31, 2014, 2013 and 2012 was $5.4 million, $6.5 million and $9.5 million, respectively.
The Company is involved in litigation arising in the ordinary course of business, which, in its opinion, will not have a
material adverse effect on its financial position, results of operations or cash flows.
Note 14. Income Taxes
Earnings (loss) from operations before income taxes and noncontrolling interest for the years ended:
(In thousands) | December 31, 2014 | December 31, 2013 | December 31, 2012 | ||||||||
United States | $ | (39,400 | ) | $ | (35,049 | ) | $ | (45,352 | ) | ||
Foreign | 35,888 | 41,585 | 45,703 | ||||||||
$ | (3,512 | ) | $ | 6,536 | $ | 351 | |||||
Income tax expense (benefit) attributable to continuing operations consists of the following for the years ended:
(In thousands) | December 31, 2014 | December 31, 2013 | December 31, 2012 | ||||||||
Current income tax expense: | |||||||||||
Federal | $ | (340 | ) | $ | (1,857 | ) | $ | (5,989 | ) | ||
State | 137 | 295 | (554 | ) | |||||||
Foreign | 6,802 | 6,505 | 5,690 | ||||||||
$ | 6,599 | $ | 4,943 | $ | (853 | ) | |||||
Deferred income tax expense (benefit): | |||||||||||
Federal | $ | 14,677 | $ | 2,136 | $ | (1,640 | ) | ||||
State | (123 | ) | (7 | ) | (315 | ) | |||||
Foreign | (82 | ) | (336 | ) | 158 | ||||||
14,472 | 1,793 | (1,797 | ) | ||||||||
$ | 21,071 | $ | 6,736 | $ | (2,650 | ) | |||||
Significant components of the Company’s deferred tax assets and liabilities are as follows for the years ended:
60
(In thousands) | December 31, 2014 | December 31, 2013 | |||||
Deferred tax assets: | |||||||
Amortization of intangibles | $ | 2,018 | $ | 3,173 | |||
Accrued expenses and other | 1,401 | 5,994 | |||||
Allowance for doubtful receivables | 1,891 | 1,217 | |||||
Employee benefit plans | 2,356 | 2,832 | |||||
Inventory reserves | 353 | 815 | |||||
Foreign tax credits | 19,588 | 16,758 | |||||
Net operating loss | 17,575 | 15,739 | |||||
Capital loss carryforward | 1,442 | 1,995 | |||||
Basis difference on investment | 40,305 | — | |||||
Uncertain tax positions | 1,121 | 1,121 | |||||
Other reserves | 251 | 300 | |||||
Valuation allowance | (78,209 | ) | (17,067 | ) | |||
$ | 10,092 | $ | 32,877 | ||||
Deferred tax liabilities: | |||||||
Prepaid and other | $ | (13,591 | ) | $ | (8,640 | ) | |
Undistributed foreign earnings | (1,109 | ) | (13,451 | ) | |||
Depreciation and amortization | (6,163 | ) | (7,066 | ) | |||
(20,863 | ) | (29,157 | ) | ||||
Net deferred tax asset (liability) | $ | (10,771 | ) | $ | 3,720 | ||
A valuation allowance for deferred tax assets is recorded to the extent the Company cannot determine that the ultimate realization of a deferred tax asset is more likely than not. In determining the need for a valuation allowance, the Company assesses all available positive and negative evidence and considers available tax planning strategies. The Company’s valuation allowance relates to certain U.S. and non-U.S. tax loss carryforwards, state loss carryforwards, Foreign Tax Credit carryforwards, Basis Difference on Investments, and a U.S. capital loss carryforward, for which the Company believes, due to various reasons noted below, that it is more likely than not that such benefits will not be realized.
The change in the Company's valuation allowance of $61.1 million is primarily related to the establishment of a valuation for the Foreign Tax Credit carryforward and the Basis Difference on its Investment in ViSalus.
As of December 31, 2014, the Company had Valuation Allowances related to the following:
• | U.S. federal operating loss carryforwards of $5.7 million limited by Internal Revenue Code section 382 with a corresponding deferred tax asset of $2.2 million that will expire on December 31, 2022, offset by a valuation allowance of $1.7 million; |
• | U.S. state operating losses of $158.6 million that will begin to expire in 2017 with a corresponding deferred tax asset of $8.1 million, offset by a valuation allowance of $8.1 million; |
• | Foreign operating losses of $24.5 million that will begin to expire in 2017 with a corresponding deferred tax asset of $7.2 million, offset by a valuation allowance of $6.7 million; |
• | U.S. capital loss carryforward of $4.0 million which will begin to expire in 2017, offset by a valuation allowance of $1.4 million; |
• | Foreign Tax Credit carryforward of $19.6 million that is offset in its entirety by a valuation allowance of $19.6 million. During the fourth quarter of 2014, the Company established a full valuation allowance on this carryforward since it was determined that the Company, more likely than not, will not generate sufficient U.S. taxable income to realize its Foreign Tax Credit deferred tax asset within the carryforward period. This determination was primarily due to U.S. cumulative losses in recent years, and the strengthening of the U.S. dollar against the euro which will effect its ability to both repatriate earnings from its European subsidiaries and implement the tax planning strategies that were previously identified. |
• | Basis Difference in its Investment in ViSalus of $40.3 million that is offset in its entirety by a $40.3 million valuation allowance which was established as of December 31, 2014. The Company recorded a valuation allowance on this asset as the gain on a potential disposal of the Company’s investment in ViSalus would result in a capital loss and, as of December 31, 2014, the Company does not have capital gains available to utilize this loss; and |
• | Other deferred assets of $10.0 million with an offsetting state valuation allowance of $0.3 million. |
61
As of December 31, 2014, the Company determined that $176.5 million of undistributed foreign earnings were not reinvested indefinitely by its non-U.S. subsidiaries. An accumulated deferred tax liability has been recorded against these undistributed earnings of $1.1 million, which includes the impact of utilization of available foreign tax credits.
As of December 31, 2014, undistributed earnings of foreign subsidiaries considered permanently reinvested, for which deferred income taxes have not been provided, were approximately $96.1 million. Determining the tax liability that would arise if these earnings were remitted is not practicable.
A reconciliation of the provision for income taxes to the amount computed at the federal statutory rate is as follows for the years ended:
(In thousands) | December 31, 2014 | December 31, 2013 | December 31, 2012 | ||||||||
Tax at statutory rate | $ | (1,229 | ) | $ | 2,288 | $ | 123 | ||||
Tax effect of: | |||||||||||
U.S. state income taxes, net of federal benefit | (35 | ) | 148 | (1,508 | ) | ||||||
Tax exempt interest | — | (11 | ) | (22 | ) | ||||||
Other non-deductible expenses and return to provision adjustments | 3,566 | 135 | (2,133 | ) | |||||||
Dividend from non-consolidating domestic subsidiary | — | 852 | 1,120 | ||||||||
Valuation allowance on foreign tax credits | 19,588 | — | — | ||||||||
Valuation allowance movement on capital loss carryforward | (625 | ) | 121 | (347 | ) | ||||||
Change in reserve for tax contingencies | (525 | ) | 571 | (192 | ) | ||||||
Non-deductible impairment | 1,015 | — | — | ||||||||
Foreign dividend and subpart F income | 9,782 | 11,203 | 15,020 | ||||||||
Tax (benefit) on undistributed foreign earnings | (4,653 | ) | (185 | ) | (4,507 | ) | |||||
Foreign tax rate differential | (5,813 | ) | (8,386 | ) | (10,204 | ) | |||||
$ | 21,071 | $ | 6,736 | $ | (2,650 | ) | |||||
The following is a reconciliation of the total amounts of unrecognized tax benefits related to uncertain tax positions, excluding interest and penalties, during the year ended December 31, 2014:
(In thousands) | |||
Balance as of January 1, 2014 | $ | 4,035 | |
Gross increases – tax positions prior periods | 7 | ||
Gross decreases – tax positions prior periods | — | ||
Gross increases – tax positions current period | — | ||
Gross decreases – tax positions current period | — | ||
Decreases – settlements with taxing authorities | (707 | ) | |
Reductions - lapse of statute of limitations | (544 | ) | |
December 31, 2014 | $ | 2,791 | |
As of December 31, 2014, the Company had $2.8 million of gross unrecognized tax benefits, excluding interest and penalties. This amount represents the portion that, if recognized, would impact the effective tax rate. The Company recognizes interest and penalties related to unrecognized tax benefits in income tax expense. As of December 31, 2014 and 2013, the Company had $4.4 million accrued for the payment of interest and penalties. Interest in the amount of $0.1 million and $0.2 million adversely impacted the current year and the prior year tax rate, respectively.
Due to the various jurisdictions in which the Company files tax returns and the uncertainty regarding the timing of the settlement of tax audits, it is possible that there could be other significant changes in the amount of unrecognized tax benefits in 2014, but the amount cannot be estimated.
The Company files income tax returns in the U.S. federal jurisdiction, various state and local jurisdictions, and many foreign jurisdictions. The number of years with open tax audits varies depending on the tax jurisdiction. The Company’s major taxing jurisdictions include the United States (including the state jurisdictions of California, Connecticut, Illinois, Massachusetts and
62
Michigan), Canada, Germany and Switzerland. In the United States, the Company is currently open to examination by the Internal Revenue Service for the year ended December 31, 2013. Additionally, in Canada and Germany the Company is open to examination for fiscal years 2008 through 2013 and is currently under audit in Canada for fiscal years ended January 31, 2009 through 2011 and in Germany for the years ended 2010 to 2012. In Switzerland, the Company is open to examination for years ended 2009 through 2012.
Note 15. Related Party Transactions
The acquisition and recapitalization of ViSalus involves related parties. ViSalus was owned in part by Ropart Asset Management Fund, LLC and related entities (collectively, “RAM”), which owned a significant non-controlling interest in
ViSalus at the time of acquisition and through September 2012. In September 2012, RAM distributed its interest in ViSalus to
its members, including Robert B. Goergen (executive Chairman of the Board of Directors), Robert B. Goergen, Jr. (President and Chief Executive Officer) and Todd A. Goergen (son of Robert B. Goergen and brother of Robert B. Goergen, Jr.). Robert B. Goergen beneficially owns approximately 36.0% of the Company’s outstanding common stock, and together with members of his family, owns substantially all of RAM. Todd A. Goergen is currently a member of the Board of Directors of ViSalus and was a member of the board of ViSalus at the time of the acquisition and recapitalization.
Revolving Loan Agreement with ViSalus. In connection with the ViSalus recapitalization, the Company agreed to make
available to ViSalus a $6.0 million revolving credit facility. On October 17, 2014, the founders of ViSalus and Robert B.
Goergen (the “Founder Lenders”) entered into a substantially similar loan agreement with ViSalus (the “Founder Revolving
Loan Agreement”) pursuant to which they made a revolving credit facility available to ViSalus in an amount up to $6.0 million
on terms that are substantially identical to the terms of the Blyth Revolving Loan Agreement. Loans made under the Blyth
Revolving Loan Agreement and loans made under the Founder Revolving Loan Agreement will be made at the same time in
equal amounts and will rank equally with each other. The revolving loan involves related parties. Robert B. Goergen, Robert B.
Goergen, Jr. and Todd A. Goergen own 8.29%, 0.34% and 2.81%, respectively, of the outstanding capital stock of ViSalus as of December 31, 2014. As of December 31, 2014, ViSalus owed the Company $3.0 million under the Blyth Revolving Loan Agreement. In February 2015, the Company lent an additional $0.8 million to ViSalus, bringing the amount outstanding to $3.8 million.
Management and Transition Services with ViSalus. In July 2012, ViSalus and the Company entered into a management services
agreement under which the Company provided certain administrative support services to ViSalus for what was believed to be
an arm's length price for such services. The basis for determining the price for the services under the management services
agreement was on a cost recovery basis and required ViSalus to pay for such services within 30 days of receipt of the invoice.
In connection with the recapitalization of ViSalus in September 2014, the Company and ViSalus entered into a new transition services agreement pursuant to which the Company agreed to provide certain transition services to ViSalus, including, general administrative services, certain business support services, payroll services and maintenance of certain insurance policies and employee benefit programs. Transition services will be provided for terms that vary by service and are generally considered sufficient to allow ViSalus to arrange for such services on its own behalf following the recapitalization. The transition services will be provided at a fee that is 6% greater than the Company’s actual, out-of-pocket expenses in providing the applicable transition service. The total cost of services that were provided in 2014 under both the management and transition services agreements was $0.8 million. The estimated management fee for administrative services for 2015 is $0.2 million.
RAM Sublease. For the years ended December 31, 2014 and 2013, RAM paid the Company $0.2 million, respectively,
to sublet office space, which the Company believes approximates the fair market rental for the rental period.
Term Loan and the Intercreditor Agreement. The term loan and the intercreditor agreement involve related parties since the term lender is owned by Robert B. Goergen, the executive Chairman of the Board, and Pamela Goergen, Mr. Goergen’s wife and a former member of the Company’s board of directors. See Note 21 to the Consolidated Financial Statements.
Note 16. Stock-Based Compensation
As of December 31, 2014, the Company had one active stock-based compensation plan, the Second Amended and Restated Omnibus Incentive Plan (“2003 Plan”), available to grant future awards. There were 2,040,897 shares authorized for grant as of December 31, 2014, and approximately 1,570,776 shares available for grant under the 2003 Plan. The Company’s policy is to issue new shares of common stock for all stock options exercised and restricted stock grants.
The Board of Directors and the stockholders of the Company have approved the adoption and subsequent amendments of the 2003 Plan. The 2003 Plan provides for grants of incentive and nonqualified stock options, stock appreciation rights, restricted stock, restricted stock units, performance shares, performance units, dividend equivalents and other stock unit awards to
63
officers and employees. The 2003 Plan also provides for grants of nonqualified stock options to directors of the Company who are not, and who have not been during the immediately preceding 12-month period, officers or employees of the Company or any of its subsidiaries. Restricted stock and restricted stock units (“RSUs”) are granted to certain employees to incent performance and retention. RSUs issued under these plans provide that shares awarded may not be sold or otherwise transferred until restrictions have lapsed. The release of RSUs on each of the vesting dates is contingent upon continued active employment by the employee until the vesting dates.
Stock-based compensation expense recognized during the period is based on the value of the portion of stock-based payment awards that is ultimately expected to vest during the period. Stock-based compensation expense recognized in the Company’s Consolidated Statements of Earnings for the years ended December 31, 2014, 2013 and 2012 included compensation expense for restricted stock, RSUs and stock-based awards granted subsequent to January 31, 2006 based on the grant date fair value estimated in accordance with the provisions of ASC 718, “Compensation—Stock Compensation” (“ASC 718”). The Company recognizes these compensation costs net of a forfeiture rate for only those awards expected to vest, on a straight-line basis over the requisite service period of the award, which is over periods of 3 years for stock options; 2 to 5 years for employee restricted stock and RSUs; and 1 to 2 years for non-employee restricted stock and RSUs. Forfeitures are estimated at the time of grant and revised, if necessary, in subsequent periods if actual forfeitures differ from those estimates.
Transactions related to restricted stock and RSUs are summarized as follows:
Shares | Weighted Average Grant Date Fair Value | Aggregate Intrinsic Value (In thousands) | ||||||||
Nonvested restricted stock and RSUs at December 31, 2012 | 122,682 | $ | 31.06 | |||||||
Granted | 60,422 | 16.08 | ||||||||
Vested | (76,883 | ) | 28.75 | |||||||
Forfeited | (5,481 | ) | 23.65 | |||||||
Nonvested restricted stock and RSUs at December 31, 2013 | 100,740 | $ | 24.25 | $ | 1,096 | |||||
Granted | 136,949 | 9.49 | ||||||||
Vested | (71,701 | ) | 26.80 | |||||||
Forfeited | (103 | ) | 37.55 | |||||||
Nonvested restricted stock and RSUs at December 31, 2014 | 165,885 | $ | 10.95 | $ | 1,518 | |||||
Total restricted stock and RSUs at December 31, 2014 | 227,257 | $ | 17.08 | $ | 2,079 | |||||
Compensation expense related to restricted stock and RSUs for the years ended December 31, 2014, 2013 and 2012 was approximately $1.2 million, $1.7 million and $4.6 million, respectively. The total recognized tax benefit for the years ended December 31, 2014, 2013 and 2012 was approximately $0.4 million, $0.6 million and $1.7 million, respectively. The total intrinsic value of restricted stock and RSUs vested for the years ended December 31, 2014 and 2013 was $0.6 million. The weighted average grant date fair value of restricted stock and RSUs granted during the years ended December 31, 2014, 2013 and 2012 was approximately $9, $16 and $36 per share, respectively. The average grant date fair value of restricted stock and RSUs vested for the years ended December 31, 2014, 2013 and 2012 was approximately $27, $29 and $20 per share, respectively.
As of December 31, 2014, there was $0.5 million of unearned compensation expense related to non-vested restricted stock and RSU awards. This cost is expected to be recognized over a weighted average period of 1.7 years. The total unrecognized stock-based compensation cost to be recognized in future periods as of December 31, 2014 does not consider the effect of stock-based awards that may be issued in subsequent periods.
At December 31, 2013, options to purchase 2,500 shares were vested and exercisable at a weighted average exercise price of 63.37. As of December 31, 2014, all stock options have expired. There were no grants or exercises of stock options for the year ended December 31, 2014.
Note 17. Earnings Per Share
Vested restricted stock units issued under the Company’s stock-based compensation plans participate in a cash equivalent of the dividends paid to common shareholders and are not considered contingently issuable shares. Accordingly, these RSUs are
64
included in the calculation of basic and diluted earnings per share as common stock equivalents. RSUs that have not vested and are subject to a risk of forfeiture are included solely in the calculation of diluted earnings per share.
The components of basic and diluted earnings per share are as follows for the years ended:
(In thousands) | December 31, 2014 | December 31, 2013 | December 31, 2012 | ||||||||
Net earnings attributable to Blyth, Inc. | $ | 86,761 | $ | 2,433 | $ | 44,002 | |||||
Weighted average number outstanding: | |||||||||||
Common shares | 16,047 | 16,141 | 17,113 | ||||||||
Vested restricted stock units | 65 | 55 | 67 | ||||||||
Weighted average number of common shares outstanding: | |||||||||||
Basic | 16,112 | 16,196 | 17,180 | ||||||||
Dilutive effect of stock options and non-vested restricted shares units | 53 | 32 | 67 | ||||||||
Diluted | 16,165 | 16,228 | 17,247 | ||||||||
Basic earnings (loss) per share: | |||||||||||
Net earnings (loss) from continuing operations | $ | (1.55 | ) | $ | (0.03 | ) | $ | 0.16 | |||
Net earnings from discontinued operations | 6.93 | 0.18 | 2.40 | ||||||||
Net earnings attributable per share of Blyth, Inc. | $ | 5.38 | $ | 0.15 | $ | 2.56 | |||||
Diluted earnings (loss) per share: | |||||||||||
Net earnings (loss) from continuing operations | $ | (1.54 | ) | $ | (0.03 | ) | $ | 0.16 | |||
Net earnings from discontinued operations | 6.91 | 0.18 | 2.39 | ||||||||
Net earnings attributable per share of Blyth, Inc. | $ | 5.37 | $ | 0.15 | $ | 2.55 | |||||
All weighted average shares outstanding in the calculation of basic and diluted earnings per share have been adjusted retroactively to reflect the two-for-one stock split that took place on June 15, 2012.
Note 18. Treasury and Common Stock
Treasury Stock (In thousands, except shares) | Shares | Amount | ||||
Balance at December 31, 2011 | 9,204,340 | $ | (426,717 | ) | ||
Treasury stock purchases | 694,636 | (13,434 | ) | |||
Treasury stock withheld in connection with long-term incentive plan | 45,263 | (1,623 | ) | |||
December 31, 2012 | 9,944,239 | $ | (441,774 | ) | ||
Treasury stock purchases | 594,582 | (9,961 | ) | |||
Treasury stock withheld in connection with long-term incentive plan | 18,521 | (305 | ) | |||
December 31, 2013 | 10,557,342 | $ | (452,040 | ) | ||
Treasury stock withheld in connection with long-term incentive plan | 14,678 | (131 | ) | |||
Balance at December 31, 2014 | 10,572,020 | $ | (452,171 | ) | ||
Common Stock (In thousands, except shares) | Shares | Amount | ||||
Balance at December 31, 2011 | 25,641,484 | $ | 514 | |||
Common stock issued for the purchase of additional ViSalus interest | 681,324 | 14 | ||||
Common stock issued in connection with long-term incentive plan | 182,402 | 2 | ||||
December 31, 2012 | 26,505,210 | $ | 530 | |||
Common stock issued in connection with long-term incentive plan | 68,821 | 2 | ||||
December 31, 2013 | 26,574,031 | $ | 532 | |||
Common stock issued in connection with long-term incentive plan | 68,219 | 1 | ||||
Balance at December 31, 2014 | 26,642,250 | $ | 533 | |||
65
All share amounts, including shares outstanding and activity of Treasury stock and Common stock have been adjusted retroactively to reflect the two-for-one stock split that took place on June 15, 2012.
Note 19. Segment Information
The Company’s products include an extensive array of decorative and functional household products such as candles, accessories, seasonal decorations, household convenience items and personalized gifts, as well as health, wellness and beauty related products. The Company's products can be found primarily throughout the United States, Canada, Mexico, Europe and Australia. The Company's financial results are reported in two segments: the Candles & Home Décor segment and the Catalog & Internet segment.
Within the Candles & Home Décor segment, the Company designs, manufactures or sources, markets and distributes an extensive line of products including scented candles, candle-related accessories and other fragranced products under the PartyLite® brand. Products in this segment are primarily sold through networks of independent sales consultants. PartyLite brand products are sold primarily in the United States, Canada, Mexico, Europe and Australia.
Within the Catalog & Internet segment, under the Silver Star Brands name, the Company designs, sources and markets a broad range of household convenience items, health, wellness and beauty products, holiday cards, personalized gifts, kitchen accessories, premium photo albums and frames. These products are sold directly to the consumer under the Miles Kimball®, Walter Drake®, Easy Comforts®, As We Change®, Exposures® and Native Remedies® brands. These products are sold in the United States and Canada.
Operating profit in all segments represents net sales less operating expenses directly related to the business segments and corporate expenses allocated to the business segments. Other expense includes Interest expense, Interest income, and Foreign exchange and other which are not allocated to the business segments. Identifiable assets for each segment consist of assets used directly in its operations and intangible assets, if any, resulting from purchase business combinations. Unallocated Corporate within the identifiable assets include cash and cash equivalents, short-term investments, discontinued operations, prepaid income tax, corporate fixed assets, deferred debt costs and other long-term investments, which are not allocated to the business segments. Corporate expenses are allocated to each segment based on budgeted sales.
The geographic area data includes net sales based on product shipment destination and long-lived assets, which consist of fixed assets, based on physical location.
66
Operating Segment Information
(In thousands) | For the year ended | ||||||||||
Financial Information | December 31, 2014 | December 31, 2013 | December 31, 2012 | ||||||||
Net Sales | (3) | (3)(1) | |||||||||
Candles & Home Décor | $ | 347,640 | $ | 390,796 | $ | 417,266 | |||||
Catalog & Internet | 142,380 | 143,466 | 138,714 | ||||||||
Total | $ | 490,020 | $ | 534,262 | $ | 555,980 | |||||
Earnings (1) | |||||||||||
Candles & Home Décor | $ | 7,505 | $ | 14,808 | $ | 12,276 | |||||
Catalog & Internet | (408 | ) | (2,918 | ) | (8,261 | ) | |||||
Operating profit | 7,097 | 11,890 | 4,015 | ||||||||
Other Expense/(Income) (4) | (10,609 | ) | (5,354 | ) | (3,664 | ) | |||||
Earnings (loss) before income taxes and non-controlling interest | $ | (3,512 | ) | $ | 6,536 | $ | 351 | ||||
Identifiable Assets | |||||||||||
Candles & Home Décor | 148,658 | 175,900 | 188,731 | ||||||||
Catalog & Internet | 51,393 | 50,880 | 51,274 | ||||||||
Unallocated Corporate | 87,302 | 140,061 | 196,109 | ||||||||
Total | $ | 287,353 | $ | 366,841 | $ | 436,114 | |||||
Capital Expenditures (2) | |||||||||||
Candles & Home Décor | 1,908 | 2,819 | 7,792 | ||||||||
Catalog & Internet | 922 | 223 | 896 | ||||||||
Unallocated Corporate | 37 | 19 | 410 | ||||||||
Total | $ | 2,867 | $ | 3,061 | $ | 9,098 | |||||
Depreciation and Amortization | |||||||||||
Candles & Home Décor | 6,139 | 6,616 | 6,499 | ||||||||
Catalog & Internet | 1,974 | 3,022 | 3,377 | ||||||||
Unallocated Corporate | 209 | 251 | 256 | ||||||||
Total | $ | 8,322 | $ | 9,889 | $ | 10,132 | |||||
Geographic Information | |||||||||||
Net Sales | |||||||||||
United States | $ | 207,659 | $ | 222,092 | $ | 235,348 | |||||
International | 282,361 | 312,170 | 320,632 | ||||||||
Total | $ | 490,020 | $ | 534,262 | $ | 555,980 | |||||
Long Lived Assets | |||||||||||
United States | $ | 42,543 | $ | 45,537 | $ | 50,277 | |||||
International | 25,723 | 31,289 | 30,954 | ||||||||
Total | $ | 68,266 | $ | 76,826 | $ | 81,231 | |||||
(1) | For the year ended December 31, 2014, earnings within the Candles & Home Décor segment include a one-time fixed asset impairment charge of $0.6 million on certain machinery and equipment located at the Cumbria, United Kingdom facility (See Note 21 to the Consolidated Financial Statements). For the year ended December 31, 2012, earnings within the Catalog & Internet segment include non-cash pre-tax intangibles impairment charges of $0.8 million (See Note 8 to the Consolidated Financial Statements). |
(2) | Capital expenditures are presented net of disposals and transfers. The unallocated corporate balance is net of transfers to other divisions. |
(3) | As adjusted for discontinued operations (See Note 3 to the Consolidated Financial Statements). |
(4) | For the year ended December 31, 2014, the Company recorded a $2.9 million impairment charge on its ViSalus investment. On February 4, 2013, the Company received $10.0 million as a final settlement on a promissory note. As a result of this settlement, the Company recorded an impairment charge in Foreign Exchange and Other expense of $1.6 million, net of other adjustments, to write-down the promissory note to the settlement amount. |
Note 20. Selected Quarterly Financial Data (Unaudited)
67
A summary of selected quarterly information for the year ended December 31, 2014 and December 31, 2013 is as follows:
December 31, 2014 Quarter Ended (In thousands, except per share data)(2) | |||||||||||||||
March 31 | June 30 | September 30 | December 31 | ||||||||||||
Net sales | $ | 118,239 | $ | 104,233 | $ | 90,752 | $ | 176,796 | |||||||
Gross profit | 74,382 | 63,926 | 53,495 | 115,437 | |||||||||||
Operating profit (loss) | (132 | ) | (2,136 | ) | (11,422 | ) | 20,787 | ||||||||
Net loss from continuing operations | (724 | ) | (2,680 | ) | (9,571 | ) | (11,951 | ) | |||||||
Net earnings (loss) from discontinued operations | (2,038 | ) | (1,760 | ) | 115,744 | (259 | ) | ||||||||
Net earnings (loss) attributable to Blyth, Inc. | $ | (2,762 | ) | $ | (4,440 | ) | $ | 106,173 | $ | (12,210 | ) | ||||
Basic earnings per share | |||||||||||||||
Net loss from continuing operations | $ | (0.05 | ) | $ | (0.17 | ) | $ | (0.59 | ) | $ | (0.74 | ) | |||
Net earnings (loss) from discontinued operations | (0.12 | ) | (0.11 | ) | 7.17 | (0.01 | ) | ||||||||
Net earnings (loss) attributable to Blyth, Inc. (1) | $ | (0.17 | ) | $ | (0.28 | ) | $ | 6.58 | $ | (0.75 | ) | ||||
Diluted earnings per share | |||||||||||||||
Net loss from continuing operations | $ | (0.05 | ) | $ | (0.17 | ) | $ | (0.59 | ) | $ | (0.73 | ) | |||
Net earnings (loss) from discontinued operations | (0.12 | ) | (0.11 | ) | 7.16 | (0.02 | ) | ||||||||
Net earnings (loss) attributable to Blyth, Inc. (1) | $ | (0.17 | ) | $ | (0.28 | ) | $ | 6.57 | $ | (0.75 | ) | ||||
December 31, 2013 Quarter Ended (In thousands, except per share data)(2) | |||||||||||||||
March 31 | June 30 | September 30 | December 31 | ||||||||||||
Net sales | $ | 128,786 | $ | 110,209 | $ | 97,029 | $ | 198,238 | |||||||
Gross profit | 79,188 | 67,167 | 56,281 | 132,040 | |||||||||||
Operating profit (loss) | (421 | ) | (4,054 | ) | (11,548 | ) | 27,913 | ||||||||
Net earnings (loss) from continuing operations | (717 | ) | (4,000 | ) | (9,106 | ) | 13,310 | ||||||||
Net earnings (loss) from discontinued operations | 3,313 | 2,642 | 636 | (3,645 | ) | ||||||||||
Net earnings (loss) attributable to Blyth, Inc. | $ | 2,596 | $ | (1,358 | ) | $ | (8,470 | ) | $ | 9,665 | |||||
Basic earnings per share | |||||||||||||||
Net earnings (loss) from continuing operations | $ | (0.04 | ) | $ | (0.25 | ) | $ | (0.57 | ) | $ | 0.83 | ||||
Net earnings (loss) from discontinued operations | 0.20 | 0.17 | 0.04 | (0.23 | ) | ||||||||||
Net earnings (loss) attributable to Blyth, Inc. (1) | $ | 0.16 | $ | (0.08 | ) | $ | (0.53 | ) | $ | 0.60 | |||||
Diluted earnings per share | |||||||||||||||
Net earnings (loss) from continuing operations | $ | (0.04 | ) | $ | (0.25 | ) | $ | (0.57 | ) | $ | 0.83 | ||||
Net earnings (loss) from discontinued operations | 0.20 | 0.17 | 0.04 | (0.23 | ) | ||||||||||
Net earnings (loss) attributable to Blyth, Inc. (1) | $ | 0.16 | $ | (0.08 | ) | $ | (0.53 | ) | $ | 0.60 | |||||
(1) The sum of per share amounts for the quarters does not necessarily equal that reported for the year because the computations are made independently.
(2) As adjusted for change in discontinued operations (See Note 3 to the Consolidated Financial Statements).
Note 21. Subsequent Events
PartyLite has in recent years manufactured substantially all of its candles at its facilities in Batavia, Illinois and Cumbria, United Kingdom. On January 13, 2015, as part of the Company's efforts to centralize PartyLite’s manufacturing operations and reduce duplication of functions, the Company's Board of Directors approved PartyLite’s creation of a “Global Center of Excellence” in Batavia, Illinois and the closing of its manufacturing facility located in Cumbria, United Kingdom. The closure of this facility is scheduled to commence in the first quarter of 2015. As of December 31, 2014, the Company has recorded a one-time fixed asset impairment of $0.6 million on certain machinery and equipment located at the Cumbria, United Kingdom facility. All assets have been classified as held and used as of December 31, 2014 as the facility can not be sold in its present condition and there have been no plans to market it. The Company estimates that closing PartyLite’s Cumbria facility will result in total annualized savings of $8.0 million, or $40.0 million over the next five years. In addition, the Company estimates
68
that it will incur pre-tax one-time and transitional costs of $6.0 million in the first half of 2015, composed of $2.6 million to shut down the Cumbria facility (including severance costs and equipment removal), $1.2 million for continued overhead at Cumbria while manufacturing is transitioned to Batavia, $1.0 million of capital expenditures and $1.2 million of miscellaneous costs (e.g., equipment upgrades). The Company does not anticipate that there will be any further material future cash expenditures associated with the closure of the Cumbria manufacturing facility.
On February 9, 2015, the Company announced that its Silver Star Brands business unit acquired certain of the assets of Native Remedies® LLC at a purchase price of $5.0 million. Native Remedies is a direct-to-consumer eCommerce marketer of natural herbal dietary supplements and homeopathic products. The Native Remedies brand will become part of Silver Star Brands. Financial results from the date of the acquisition will be included in the Company's Catalog & Internet segment for reporting purposes.
On March 9, 2015, the Company, together with all of its domestic subsidiaries, except the subsidiary through which it holds its interest in ViSalus (collectively, the “domestic subsidiaries”), entered into a Term Loan and Security Agreement with GFIE, LLC, as term lender. The agreement provides for a five-year term loan in an original principal amount equal to $35.0 million. The obligations under the agreement are secured by, among other assets, (i) a first priority lien on and security interest in PartyLite’s manufacturing facility in Batavia, IL and the intellectual property and various stock and other equity interests owned by the Company and the domestic subsidiaries and (ii) a second priority lien on and security interest in the Company's and the domestic subsidiaries' accounts receivable, inventory, chattel paper, and deposit and securities accounts and PartyLite’s office building in Plymouth, MA. The term loan bears interest at a non-default rate of the greater of 1.00% or LIBOR, in each case plus 5%, payable quarterly in arrears. The principal amount of the term loan will be paid in installments as follows: beginning on March 31, 2016, and continuing on the last day of each calendar quarter thereafter, up to and including December 31, 2019, the Company will pay equal quarterly installments of $437.5 thousand. The entire remaining balance of principal and accrued interest on the term loan, and all other charges and/or amounts then due in connection with the term loan, will be due and payable in full on March 9, 2020. The term loan may be prepaid, in whole or in part, from time to time, without penalty or premium. In addition, commencing in 2017 (based on our 2016 results), the Company is required to prepay the term loan annually in an amount up to 25% of “excess cash flow,” if any. For these purposes, excess cash flow is the Company's consolidated EBITDA for the most recently completed fiscal year, determined as set forth in the term loan, less certain capital expenditures, certain repayments of debt, certain interest expenses, and certain cash and other expenditures.
The term loan contains covenants that restrict, subject to certain exceptions, the Company's and all of its subsidiaries' ability to, among other things: (i) incur indebtedness; (ii) create liens on assets; (iii) engage in mergers or consolidations; (iv) engage in certain dispositions or acquisitions of assets; (v) make investments, loans, guarantees or advances; (vi) pay dividends and distributions or repurchase its common stock; (vii) repay or prepay certain indebtedness; (viii) enter into sale and leaseback transactions; (ix) engage in certain transactions with affiliates; and (x) change the nature of its or any of its subsidiaries’ business. In addition, the term loan (a) requires the Company to maintain a fixed charge coverage ratio (“FCCR”) of 1.0 to 1.0 upon the occurrence of certain events or conditions, (b) with certain exceptions, prohibits the Company from making acquisitions if the FCCR is less than 1.0 to 1.0, and (c) among other conditions, generally prohibits the Company from paying dividends or repurchasing its common stock:
• for amounts in excess of $2.5 million in any twelve-month period;
• at times when there are no loans outstanding under the revolving loan agreement, if availability (on a pro forma basis) is less than $3.0 million; and
• at times when there are loans outstanding under the revolving loan agreement, if (a) availability (on a pro forma basis) is less than the greater of 30.0% of the revolving loan commitment or $2.25 million, (b) immediately after such dividend or repurchase, availability (on a pro forma basis) would be less than the greater of 30.0% of the revolving loan commitment or $2.25 million or (c) the FCCR is less than 1.1 to 1.0.
The Company estimates that its FCCR was less than 1.0 to 1.0 at February 28, 2015. The term loan agreement also contains additional affirmative, negative and financial covenants and events of default.
The proceeds of the term loan, together with available cash, were used to fund the mandatory redemption of the 6.00% Senior Notes.
On March 9, 2015, the Company and the domestic subsidiaries also entered into a Loan and Security Agreement, which it refers to as the revolving loan agreement, with Bank of America, N.A., as revolver lender. The revolving loan agreement provides for an asset-based five-year revolving line of credit facility in an aggregate principal amount up to the lesser of $15.0 million or an amount determined by reference to a “borrowing base,” which deducts such reserves as the revolver lender may require in its reasonable discretion. The Company's borrowing base under the revolving loan agreement will be comprised
69
principally of specified percentages of eligible inventory, accounts receivables and (once a required appraisal is received) PartyLite’s office building in Plymouth, MA. The obligations under the revolving loan agreement are secured by, among other assets, (i) a first priority lien on and security interest in the Company's and the domestic subsidiaries' accounts receivable, inventory, chattel paper and deposit and securities accounts, as well as PartyLite’s office building in Plymouth, MA, and (ii) a second priority lien on and security interest in various other assets of the Company and the domestic subsidiaries, including PartyLite’s manufacturing facility in Batavia, IL, and its and the domestic subsidiaries' intellectual property and various stock and other equity interests.
The Company estimates that, based on the value of eligible inventory, accounts receivable and PartyLite’s office building in Plymouth, MA, as of January 31, 2015, subject to the receipt of the appraisal of that facility, its borrowing base would have been approximately $13.0 million. As of the date hereof, the Company has not made any borrowings under the revolving loan agreement and has outstanding thereunder only an existing letter of credit for approximately $1.1 million.
Loans under the revolving loan agreement will bear non-default interest at a rate equal to either (i) LIBOR plus an applicable margin ranging from 1.75% to 2.25% or (ii) a base rate equal, at the time of determination, to the greater of (a) the revolver lender’s prime rate; (b) the Federal Funds Rate (as defined) plus 0.50%; or (c) LIBOR for a 30 day interest period plus 1.00%, in each case plus an applicable margin ranging from 0.75% to 1.25%. All loans under the revolving loan agreement will be due and payable in full on March 9, 2020, and may be prepaid, in whole or in part, from time to time, without penalty or premium (except as may be necessary to cover certain funding losses in connection with LIBOR loans). If an overadvance, as determined pursuant to the revolving loan agreement, exists at any time, or accounts receivable are disposed of, the Company will be required to repay a portion of the loans under the revolving loan agreement determined as set forth in the revolving loan agreement.
The revolving loan agreement contains affirmative, negative and financial covenants that are substantially similar to those contained in the term loan agreement and that restrict and impose obligations on the Company and the domestic subsidiaries in the same manner. The revolving loan agreement also contains events of default that are substantially similar to those contained in the term loan agreement.
Loans under the revolving loan agreement will be used primarily for working capital and other general corporate purposes.
The relative rights of the term lender and the revolver lender with respect to their respective liens and remedies are governed by an intercreditor agreement.
The term loan agreement and the intercreditor agreement involve related parties since the term lender is owned by Robert B. Goergen, our executive Chairman of the Board, and Pamela Goergen, Mr. Goergen’s wife and a former member of the Company's board of directors. The term loan was approved by a special committee of the Company's Board of Directors comprised solely of independent directors. The special committee received legal advice from Wachtell, Lipton, Rosen & Katz and a fairness opinion from Duff & Phelps.
Item 9. Changes in and Disagreements with Accountants on Accounting and Financial Disclosure
None.
Item 9A. Controls and Procedures
(a) Evaluation of Disclosure Controls and Procedures
We conducted an evaluation, under the supervision and with the participation of management, including the Chief Executive Officer and Chief Financial Officer, of the effectiveness of the design and operation of our disclosure controls and procedures (as such term is defined in Rules 13a-15(e) and 15d-15(e) under the Securities Exchange Act of 1934, as amended (the “Exchange Act”)) as of December 31, 2014. Based on that evaluation, the Chief Executive Officer and Chief Financial Officer concluded that the Company’s disclosure controls and procedures were effective as of December 31, 2014.
(b) Management’s Assessment of Internal Control over Financial Reporting
Management is responsible for establishing and maintaining adequate internal control over financial reporting as defined in Rules 13a-15(f) and 15d-15(f) under the Exchange Act. Our internal control system over financial reporting is designed to provide reasonable assurance regarding the reliability of financial reporting and the preparation of financial statements for external purposes in accordance with generally accepted accounting principles. Because of inherent limitations, internal control over financial reporting may not prevent or detect misstatements. Also, projections of any evaluation of effectiveness to future
70
periods are subject to the risk that controls may become inadequate because of changes in conditions, or that the degree of compliance with the policies or procedures may deteriorate.
Management has assessed the effectiveness of our internal control over financial reporting as of December 31, 2014. In making this assessment, management used the criteria established in Internal Control - Integrated Framework (2013) issued by the Committee of Sponsoring Organizations of the Treadway Commission (COSO). The objective of this assessment is to determine whether our internal control over financial reporting was effective as of December 31, 2014. Based on our assessment utilizing the criteria issued by COSO, management has concluded that our internal control over financial reporting was effective as of December 31, 2014.
Our independent registered public accounting firm has issued an attestation report on our internal control over financial reporting. The report appears herein below.
(c) Changes in Internal Control Over Financial Reporting
There have been no changes in our internal control over financial reporting identified in connection with the evaluation required by paragraph (d) of Exchange Act Rules 13a-15 or 15d-15 that occurred during the period ended December 31, 2014 that have materially affected, or are reasonably likely to materially affect, our internal control over financial reporting.
Item 9B. Other information
Several Current Report on Form 8-K triggering events occurred within four business days before the filing of this Annual Report on Form 10-K. We are satisfying the obligations under Form 8-K by including the disclosure required thereby in this Item 9B.
Item 2.02 Results of Operations and Financial Condition.
On March 16, 2015, we issued a press release reporting our financial results for the fourth quarter and fiscal year ended December 31, 2014. The information contained in this Item 2.02 shall not be deemed "filed" for purposes of Section 18 of the Securities Exchange Act of 1934, as amended (the "Exchange Act"), or incorporated by reference in any filing under the Securities Act of 1933, as amended, or the Exchange Act, except as shall be expressly set forth by specific reference in such a filing. A copy of the press release is attached hereto as Exhibit 99.1 and is incorporated herein by reference.
Item 2.06 Material Impairments.
Our investment in ViSalus was evaluated for impairment at December 31, 2014 and, as a result, a $2.9 million impairment charge was recorded to our ViSalus investment bringing the ending investment value to $6.9 million. See Note 5 to the Consolidated Financial Statements, which is incorporated by reference herein.
Item 5.02 Departure of Directors or Certain Officers; Election of Directors; Appointment of Certain Officers;
Compensatory Arrangements of Certain Officers.
(e) On March 10, 2015, our compensation committee approved the payment of bonuses to Robert B. Goergen, our Chairman of the Board, in the amount of $90,000; to Robert B. Goergen, Jr., our President and Chief Executive Officer, in the amount of $140,000; and to Jane F. Casey, our Vice President and Chief Financial Officer, in the amount of $35,000.
71
Report of Independent Registered Public Accounting Firm
The Board of Directors and Stockholders of Blyth, Inc. and subsidiaries
We have audited Blyth, Inc. and subsidiaries’ (the “Company”) internal control over financial reporting as of December 31, 2014, based on criteria established in Internal Control-Integrated Framework issued by the Committee of Sponsoring Organizations of the Treadway Commission (2013 framework) (the COSO criteria). The Company’s management is responsible for maintaining effective internal control over financial reporting, and for its assessment of the effectiveness of internal control over financial reporting included in the accompanying Management’s Assessment of Internal Control over Financial Reporting. Our responsibility is to express an opinion on the Company’s internal control over financial reporting based on our audit.
We conducted our audit in accordance with the standards of the Public Company Accounting Oversight Board (United States). Those standards require that we plan and perform the audit to obtain reasonable assurance about whether effective internal control over financial reporting was maintained in all material respects. Our audit included obtaining an understanding of internal control over financial reporting, assessing the risk that a material weakness exists, testing and evaluating the design and operating effectiveness of internal control based on the assessed risk, and performing such other procedures as we considered necessary in the circumstances. We believe that our audit provides a reasonable basis for our opinion.
A company’s internal control over financial reporting is a process designed to provide reasonable assurance regarding the reliability of financial reporting and the preparation of financial statements for external purposes in accordance with generally accepted accounting principles. A company’s internal control over financial reporting includes those policies and procedures that (1) pertain to the maintenance of records that, in reasonable detail, accurately and fairly reflect the transactions and dispositions of the assets of the company; (2) provide reasonable assurance that transactions are recorded as necessary to permit preparation of financial statements in accordance with generally accepted accounting principles, and that receipts and expenditures of the company are being made only in accordance with authorizations of management and directors of the company; and (3) provide reasonable assurance regarding prevention or timely detection of unauthorized acquisition, use, or disposition of the company’s assets that could have a material effect on the financial statements.
Because of its inherent limitations, internal control over financial reporting may not prevent or detect misstatements. Also, projections of any evaluation of effectiveness to future periods are subject to the risk that controls may become inadequate because of changes in conditions, or that the degree of compliance with the policies or procedures may deteriorate.
In our opinion, the Company maintained, in all material respects, effective internal control over financial reporting as of December 31, 2014, based on the COSO criteria.
We also have audited, in accordance with the standards of the Public Company Accounting Oversight Board (United States), the consolidated balance sheets of the Company as of December 31, 2014 and 2013 and the related consolidated statements of earnings, comprehensive income, stockholders' equity, and cash flows for each of the three years in the period ended December 31, 2014 of the Company, and our report dated March 16, 2015 expressed an unqualified opinion thereon.
/s/ Ernst & Young LLP
Stamford, Connecticut
March 16, 2015
72
PART III
Item 10. Directors, Executive Officers and Corporate Governance
The information required by this Item will be set forth in our Proxy Statement for our annual meeting of stockholders scheduled to be held on May 8, 2015 (the “Proxy Statement”) under the captions “Nominees for Election as Directors,” “Executive Officers,” “Section 16(a) Beneficial Ownership Reporting Compliance,” “Code of Conduct” and “Board of Director and Committee Meetings” and is incorporated herein by reference.
Item 11. Executive Compensation
The information required by this Item will be set forth in our Proxy Statement under the captions “Executive Compensation Information,” “Employment Contracts and Severance Arrangements,” “Compensation Committee Report” and “Compensation Committee Interlocks and Insider Participation” and is incorporated herein by reference.
Item 12. Security Ownership of Certain Beneficial Owners and Management and Related Stockholder Matters
The information required by this Item is set forth in Item 5 above and will be set forth in our Proxy Statement under the caption “Security Ownership of Management and Certain Beneficial Owners” and is incorporated herein by reference.
Item 13. Certain Relationships and Related Transactions, and Director Independence
The information required by this Item will be set forth in our Proxy Statement under the captions “Director Independence” and “Certain Relationships and Related Transactions” and is incorporated herein by reference.
Item 14. Principal Accounting Fees and Services
The information required by this Item will be set forth in our Proxy Statement under the caption “Independent Auditor Fees” and is incorporated herein by reference.
73
PART IV
Item 15. Exhibit and Financial Statement Schedules
(a)(1). Financial Statements
The following Consolidated Financial Statements are contained on the indicated pages of this report:
Page No. | |
Reports of Independent Registered Public Accounting Firm | |
Statements: | |
Consolidated Balance Sheets | |
Consolidated Statements of Earnings | |
Consolidated Statements of Comprehensive Income | |
Consolidated Statements of Stockholders’ Equity | |
Consolidated Statements of Cash Flows | |
Notes to Consolidated Financial Statements | |
(a)(2). Financial Statement Schedules
The following financial statement schedule is contained on the indicated page of this report:
Page No. | ||
Valuation and Qualifying Accounts | ||
All other schedules are omitted because they are inapplicable or the requested information is shown in the Consolidated Financial Statements or related notes.
74
(a)(3). Exhibits
Exhibit No. | Description of Exhibit |
3.1 | Amended and Restated Certificate of Incorporation (incorporated by reference to Exhibit 3.1 to the Registrant’s Current Report on Form 8-K filed June 10, 2010) |
3.2 | Amended and Restated Bylaws (incorporated by reference to Exhibit 3.2 to the Registrant’s Quarterly Report on Form 10-Q for the fiscal quarter ended October 31, 2011) |
4.1 | Form of Indenture dated as of May 10, 2013 between Registrant and U.S. Bank National Association governing $50,000,000 principal amount of 6.00% Senior Notes due 2017 (incorporated by reference to Exhibit 4.2 to the Registrant’s Quarterly Report on Form 10-Q for the fiscal quarter ended June 30, 2013) |
4.1(a) | First Supplemental Indenture by and among Blyth, Inc., as Issuer, the persons signatory thereto as Guarantors and US Bank National Association, as Trustee and Collateral Agent, dated as of September 4, 2014 (incorporated by reference to Exhibit 4.1 to the Registrant’s Current Report on Form 8-K filed September 8, 2014) |
4.2 | Loan and Security Agreement dated as of March 9, 2015, among Blyth, Inc., certain of Blyth, Inc.’s subsidiaries which are signatory thereto, and Bank of America, N.A. (incorporated by reference to Exhibit 4.2 to the Registrant’s Current Report on Form 8-K filed March 13, 2015) |
4.3 | Mortgage, Assignment of Leases and Rents, Security Agreement and Fixture Filing made as of the 9th day of March, 2015, by PartyLite Gifts, Inc. and PartyLite Worldwide, LLC, each as mortgagor, to Bank of America, N.A., as mortgagee (incorporated by reference to Exhibit 4.3 to the Registrant’s Current Report on Form 8-K filed March 13, 2015) |
4.4 | Mortgage, Assignment of Leases and Rents, Security Agreement and Fixture Filing made as of the 9th day of March, 2015, by PartyLite Worldwide, LLC, as mortgagor, to Bank of America, N.A., as mortgagee (incorporated by reference to Exhibit 4.4 to the Registrant’s Current Report on Form 8-K filed March 13, 2015) |
4.5 | Environmental Indemnity Agreement made as of March 9, 2015 by Blyth, Inc. and its subsidiaries signatory thereto, for the benefit of Bank of America, N.A. (incorporated by reference to Exhibit 4.5 to the Registrant’s Current Report on Form 8-K filed March 13, 2015) |
4.6 | Trademark Collateral Assignment and Security Agreement dated as of March 9, 2015 by Silver Star Brands, Inc., PartyLite Gifts, Inc., PartyLite Worldwide, LLC, Candle Corporation of America and Bank of America, N.A. (incorporated by reference to Exhibit 4.6 to the Registrant’s Current Report on Form 8-K filed March 13, 2015) |
4.7 | Patent Collateral Assignment and Security Agreement dated as of March 9, 2015 by PartyLite Worldwide, LLC, Candle Corporation of America and Bank of America, N.A. (incorporated by reference to Exhibit 4.7 to the Registrant’s Current Report on Form 8-K filed March 13, 2015) |
4.8 | Copyright Collateral Assignment and Security Agreement dated as of March 9, 2015 by Blyth, Inc., its subsidiaries signatory thereto and Bank of America, N.A. (incorporated by reference to Exhibit 4.8 to the Registrant’s Current Report on Form 8-K filed March 13, 2015) |
4.9 | Domain Name Collateral Assignment and Security Agreement dated as of March 9, 2015 by Blyth, Inc., its subsidiaries signatory thereto and Bank of America, N.A. (incorporated by reference to Exhibit 4.9 to the Registrant’s Current Report on Form 8-K filed March 13, 2015) |
4.10 | Stock Pledge Agreement dated as of the 9th day of March, 2015, by and between Blyth, Inc., its subsidiaries signatory thereto and Bank of America, N.A. (incorporated by reference to Exhibit 4.10 to the Registrant’s Current Report on Form 8-K filed March 13, 2015) |
75
4.11 | Term Loan and Security Agreement dated as of March 9, 2015, among Blyth, Inc., its subsidiaries signatory thereto and GFIE, LLC (incorporated by reference to Exhibit 4.11 to the Registrant’s Current Report on Form 8-K filed March 13, 2015) |
4.12 | Term Loan Note dated as of March 9, 2015, issued by Blyth, Inc. and its subsidiaries signatory thereto to GFIE, LLC (incorporated by reference to Exhibit 4.12 to the Registrant’s Current Report on Form 8-K filed March 13, 2015) |
4.13 | Mortgage, Assignment of Leases and Rents, Security Agreement and Fixture Filing made as of the 9th day of March, 2015, by PartyLite Gifts, Inc. and PartyLite Worldwide, LLC, each as mortgagor, to GFIE, LLC, as mortgagee (incorporated by reference to Exhibit 4.13 to the Registrant’s Current Report on Form 8-K filed March 13, 2015) |
4.14 | Mortgage, Assignment of Leases and Rents, Security Agreement and Fixture Filing made as of the 9th day of March, 2015, by PartyLite Worldwide, LLC, as mortgagor, to GFIE, LLC, as mortgagee (incorporated by reference to Exhibit 4.14 to the Registrant’s Current Report on Form 8-K filed March 13, 2015) |
4.15 | Environmental Indemnity Agreement made as of March 9, 2015 by Blyth, Inc. and its subsidiaries signatory thereto for the benefit of GFIE, LLC (incorporated by reference to Exhibit 4.15 to the Registrant’s Current Report on Form 8-K filed March 13, 2015) |
4.16 | Trademark Collateral Assignment and Security Agreement dated as of March 9, 2015 by Silver Star Brands, Inc., PartyLite Gifts, Inc., PartyLite Worldwide, LLC, Candle Corporation of America and GFIE, LLC (incorporated by reference to Exhibit 4.16 to the Registrant’s Current Report on Form 8-K filed March 13, 2015) |
4.17 | Patent Collateral Assignment and Security Agreement dated as of March 9, 2015 by PartyLite Worldwide, LLC, Candle Corporation of America and GFIE, LLC (incorporated by reference to Exhibit 4.17 to the Registrant’s Current Report on Form 8-K filed March 13, 2015) |
4.18 | Copyright Collateral Assignment and Security Agreement dated as of March 9, 2015 by Silver Star Brands, Inc., Candle Corporation of America and GFIE, LLC (incorporated by reference to Exhibit 4.18 to the Registrant’s Current Report on Form 8-K filed March 13, 2015) |
4.19 | Domain Name Collateral Assignment and Security Agreement dated as of March 9, 2015 by Blyth, Inc., its subsidiaries signatory thereto and GFIE, LLC (incorporated by reference to Exhibit 4.19 to the Registrant’s Current Report on Form 8-K filed March 13, 2015) |
4.20 | Stock Pledge Agreement dated as of the 9th day of March, 2015, by and between Blyth, Inc., its subsidiaries signatory thereto and GFIE, LLC (incorporated by reference to Exhibit 4.20 to the Registrant’s Current Report on Form 8-K filed March 13, 2015) |
4.21 | Intercreditor Agreement as of March 9, 2015 between Bank of America, N.A., as ABL Secured Party, and GFIE, LLC, as Term Loan Secured Party (incorporated by reference to Exhibit 4.21 to the Registrant’s Current Report on Form 8-K filed March 13, 2015) |
10.1+ | Amended and Restated Employment Agreement dated as of March 12, 2013 by and between the Registrant and Robert B. Goergen (incorporated by reference to Exhibit 10.1 to the Registrant’s Current Report on Form 8-K filed March 15, 2013) |
10.1(a)+ | Amendment No. 1, dated as of November 14, 2013, to the Amended and Restated Employment Agreement dated as of March 12, 2013, by and between Registrant and Robert B. Goergen (incorporated by reference to Exhibit 10.2 to the Registrant’s Current Report on Form 8-K filed November 18, 2013) |
10.1(b)+ | Amendment No. 2, dated as of November 12, 2014, to the Amended and Restated Employment Agreement, dated as of March 12, 2013, by and between Blyth, Inc. and Robert B. Goergen (incorporated by reference to Exhibit 10.1 to the Registrant’s Current Report on Form 8-K filed November 18, 2014) |
76
10.2+ | Blyth, Inc. Retention and Severance Agreement dated December 17, 2010 by and between Blyth, Inc. and Robert B. Goergen, Jr. (incorporated by reference to Exhibit 10.3 to the Registrant’s Current Report on Form 8-K filed December 17, 2010) |
10.2(a)+ | Amendment No. 1, dated as of November 14, 2013, to the Retention and Severance Agreement dated as of December 17, 2010, by and between Registrant and Robert B. Goergen, Jr. (incorporated by reference to Exhibit 10.1 to the Registrant’s Current Report on Form 8-K filed November 18, 2013) |
10.3+ | Blyth, Inc. Retention and Severance Agreement dated December 17, 2010 by and between Blyth, Inc. and Robert H. Barghaus (incorporated by reference to Exhibit 10.1 to the Registrant’s Current Report on Form 8-K filed December 17, 2010) |
10.3(a)+ | Letter Agreement and General Release dated August 8, 2014 by and between Blyth, Inc. and Robert H. Barghaus (incorporated by reference to Exhibit 10.2 to the Registrant’s Current Report on Form 8-K filed August 11, 2014) |
10.4+ | Retention and Severance Agreement dated as of August 11, 2014 by and between Blyth, Inc. and Jane F. Casey (incorporated by reference to Exhibit 10.1 to the Registrant’s Current Report on Form 8-K filed August 11, 2014) |
10.5+ | Blyth, Inc. Second Amended and Restated Omnibus Incentive Plan (incorporated by reference to Exhibit A to the Registrant's Schedule 14A, Proxy Statement pursuant to Section 14(a) of the Securities Exchange Act of 1934 filed April 3, 2013) |
10.6*+ | Form of Restricted Stock Unit Agreement under the Blyth, Inc. Second Amended and Restated Omnibus Incentive Plan |
10.7+ | Blyth Industries, Inc. Non-Qualified Deferred Compensation Plan (incorporated by reference to Exhibit 4.1 to the Registrant’s Current Report on Form 8-K as filed on December 21, 1999) |
10.8 | Recapitalization Agreement by and among Blyth, Inc., ViSalus, Inc. and certain holders of the Series B Redeemable Convertible Preferred Stock of ViSalus, Inc. dated as of September 4, 2014 (incorporated by reference to Exhibit 10.1 to the Registrant’s Current Report on Form 8-K filed September 8, 2014) |
10.9 | Transition Services Agreement by and between Blyth, Inc. and ViSalus, Inc. dated as of September 4, 2014 (incorporated by reference to Exhibit 10.2 to the Registrant’s Current Report on Form 8-K filed September 8, 2014) |
10.10 | Consent Agreement by and among Blyth, Inc. and the beneficial holders of Blyth’s 6.00% Senior Notes due 2017 in the aggregate principal amount outstanding of $50,000,000 dated as of September 4, 2014 (incorporated by reference to Exhibit 10.4 to the Registrant’s Current Report on Form 8-K filed September 8, 2014) |
10.11 | Collateral Agreement dated as of September 4, 2014 by and among the Grantors party thereto and U.S. Bank National Association, as Collateral Agent (incorporated by reference to Exhibit 10.5 to the Registrant’s Current Report on Form 8-K filed September 8, 2014) |
10.12 | Revolving Loan Agreement, dated as of October 16, 2014 by and between Blyth, Inc. and ViSalus, Inc. (incorporated by reference to Exhibit 10.1 to the Registrant’s Current Report on Form 8-K filed October 20, 2014) |
10.13 | Intercreditor Agreement, dated as of October 16, 2014, by and among Blyth, Inc., ViSalus, Inc., the founders of ViSalus and Robert Goergen (incorporated by reference to Exhibit 10.2 to the Registrant’s Current Report on Form 8-K filed October 20, 2014) |
21.1* | List of Subsidiaries. |
77
23* | Consent of Independent Registered Public Accounting Firm. |
31.1* | Certification of Chairman and Chief Executive Officer pursuant to Rule 13a-14(a) under the Securities Exchange Act of 1934. |
31.2* | Certification of Vice President and Chief Financial Officer pursuant to Rule 13a-14(a) under the Securities Exchange Act of 1934. |
32.1* | Certification of Chairman and Chief Executive Officer pursuant to Section 906 of the Sarbanes-Oxley Act of 2002. |
32.2* | Certification of Vice President and Chief Financial Officer pursuant to Section 906 of the Sarbanes-Oxley Act of 2002. |
99.1* | Press release reporting financial results for the fourth quarter and fiscal year ended December 31, 2014 |
101.INS | XBRL Instance Document |
101.SCH | XBRL Taxonomy Extension Schema Document |
101.CAL | XBRL Taxonomy Extension Calculation Linkbase Document |
101.LAB | XBRL Taxonomy Extension Label Linkbase Document |
101.PRE | XBRL Taxonomy Extension Presentation Linkbase Document |
101.DEF | XBRL Taxonomy Extension Definition Linkbase Document |
* | Filed herewith. |
+ | Management contract or compensatory plan required to be filed by Item 15(a)(3) of this report. |
78
SIGNATURES
Pursuant to the requirements of Section 13 or 15(d) of the Securities Exchange Act of 1934, the registrant has duly caused this report to be signed on its behalf by the undersigned, thereunto duly authorized.
BLYTH, INC.
By: /s/ Robert B. Goergen, Jr.
Name: Robert B. Goergen, Jr.
Title: President and Chief Executive Officer
Date: March 16, 2015
79
Pursuant to the requirements of the Securities Exchange Act of 1934, this report has been signed below by the following persons on behalf of the registrant and in the capacities and on the dates indicated.
Signature | Title | Date | ||
/s/ Robert B. Goergen, Jr. | President and Chief Executive Officer; | March 16, 2015 | ||
Robert B. Goergen, Jr. | Director (Principal Executive Officer) | |||
/s/ Jane F. Casey | Vice President and Chief Financial Officer | March 16, 2015 | ||
Jane F. Casey | (Principal Financial Officer) | |||
/s/ Joseph T. Cirillo | Vice President, Controller and Chief Accounting Officer | March 16, 2015 | ||
Joseph T. Cirillo | (Principal Accounting Officer) | |||
/s/ Robert B. Goergen | Chairman of the Board | March 16, 2015 | ||
Robert B. Goergen | ||||
/s/ Jane A. Dietze | Director | March 16, 2015 | ||
Jane A. Dietze | ||||
/s/ Andrew Graham | Director | March 16, 2015 | ||
Andrew Graham | ||||
/s/ Brett M. Johnson | Director | March 16, 2015 | ||
Brett M. Johnson | ||||
Director | ||||
Ilan Kaufthal | ||||
/s/ James M. McTaggart | Director | March 16, 2015 | ||
James M. McTaggart | ||||
/s/ Howard E. Rose | Director | March 16, 2015 | ||
Howard E. Rose | ||||
/s/ James Williams | Director | March 16, 2015 | ||
James Williams | ||||
80
SCHEDULE II- VALUATION AND QUALIFYING ACCOUNTS
Description | Balance at Beginning of Period | Charged to Costs and Expenses | Deductions | Balance at End of Period | |||||||||||
(In thousands) | |||||||||||||||
For the year ended 12/31/2012 | |||||||||||||||
Allowance for doubtful accounts | $ | 380 | $ | 1,354 | $ | (460 | ) | $ | 1,274 | ||||||
Income tax valuation allowance | 19,083 | 320 | — | 19,403 | |||||||||||
For the year ended 12/31/2013 | |||||||||||||||
Allowance for doubtful accounts | $ | 1,274 | $ | 5,546 | $ | (2,888 | ) | $ | 3,932 | ||||||
Income tax valuation allowance | 19,403 | 1,460 | (3,797 | ) | (a) | 17,066 | |||||||||
For the year ended 12/31/2014 | |||||||||||||||
Allowance for doubtful accounts | $ | 3,932 | $ | 6,790 | $ | (5,241 | ) | $ | 5,481 | ||||||
Income tax valuation allowance | 17,066 | 61,157 | (14 | ) | 78,209 | ||||||||||
(a) $3,201 of deductions relates to valuation allowance associated with expiring capital losses. | |||||||||||||||
81