Attached files
| file | filename |
|---|---|
| EX-32 - CERTIFICATION OF PEO/PFO PURSUANT TO SECTION 906 - INSIGNIA SYSTEMS INC/MN | insignia101501_ex32.htm |
| EX-31.1 - CERTIFICATION OF PEO PURSUANT TO SECTION 302 - INSIGNIA SYSTEMS INC/MN | insignia101501_ex31-1.htm |
| EX-23.1 - CONSENT OF INDEPENDENT REGISTERED PUBLIC ACCOUNTING FIRM - INSIGNIA SYSTEMS INC/MN | insignia101501_ex23-1.htm |
| EX-31.2 - CERTIFICATION OF PFO PURSUANT TO SECTION 302 - INSIGNIA SYSTEMS INC/MN | insignia101501_ex31-2.htm |
|
|
|
|
|
UNITED STATES SECURITIES AND EXCHANGE COMMISSION |
||
|
Washington, D.C. 20549 |
||
|
|
|
|
|
|
|
|
|
|
|
|
|
FORM 10-K |
||
|
|
|
|
|
|
|
|
|
|
|
|
|
ANNUAL REPORT PURSUANT TO SECTION 13 OR 15(d) |
||
|
OF THE SECURITIES EXCHANGE ACT OF 1934 |
||
|
|
|
|
|
For the year ended December 31, 2009 |
|
Commission File Number 1-13471 |
|
|
|
|
|
|
|
|
|
|
|
|
|
INSIGNIA SYSTEMS, INC. |
||
|
(Exact name of registrant as specified in its charter) |
||
|
|
|
|
|
Minnesota |
|
41-1656308 |
|
(State or other jurisdiction of incorporation or organization) |
|
(IRS Employer Identification No.) |
|
|
|
|
|
8799 Brooklyn Blvd. |
||
|
Minneapolis, MN 55445 |
||
|
(Address of principal executive offices) |
||
|
|
|
|
|
(763) 392-6200 |
||
|
(Registrant’s telephone number, including area code) |
||
|
|
|
|
|
Securities Registered Pursuant to Section 12(b) of the Act: |
||
|
|
|
|
|
Title of each class: |
|
Name of each exchange on which registered: |
|
Common Stock, $.01 par value |
|
The NASDAQ Stock Market |
|
Securities Registered Pursuant to Section 12(g) of the Act: None |
||
|
|
|
|
|
|
|
|
Indicate by check mark if the registrant is a well-known seasoned issuer, as defined in Rule 405 of the securities Act. Yeso No x
Indicate by check mark if the registrant is not required to file reports pursuant to Section 13 or Section 15(d) of the Act. Yes o No x
Indicate by check mark whether the registrant (1) has filed all reports required to be filed by Section 13 or 15(d) of the Securities Exchange Act of 1934 during the preceding 12 months (or for such shorter period that the registrant was required to file such report(s), and (2) has been subject to such filing requirements for the past 90 days. Yes x No o
Indicate by check mark whether the registrant has submitted electronically and posted on its corporate Web site, if any, every Interactive Data File required to be submitted and posted pursuant to Rule 405 of Regulation S-T (§232.405 of this chapter) during the preceding 12 months (or for such shorter period that the registrant was required to submit and post such files). Yes o No o
Indicate by check mark if disclosure of delinquent filers pursuant to Item 405 of Regulation S-K is not contained herein, and will not be contained, to the best of registrant’s knowledge, in definitive proxy or information statements incorporated by reference in Part III of this Form 10-K or any amendment to this Form 10-K. x
Indicate
by check mark whether the registrant is a large accelerated filer, an
accelerated filer, a non-accelerated filer, or a smaller reporting company. See
the definitions of “large accelerated filer,” “accelerated filer” and “smaller
reporting company” in Rule 12b-2 of the Exchange Act. (Check one):
Large
accelerated filer o Accelerated filer o Non-accelerated filer x Smaller reporting company o
Indicate
by check mark whether the registrant is a shell company (as defined in Rule
12b-2 of the Exchange Act).
Yes o No x
The aggregate market value of the voting and non-voting common equity held by non-affiliates of the registrant as of the last business day of the second quarter (June 30, 2009) was approximately $41,769,000 based upon the last sale price of the registrant’s Common Stock on such date.
Number of shares outstanding of Common Stock, $.01 par value, as of March 24, 2010, was 15,438,724.
|
|
|
DOCUMENTS INCORPORATED BY REFERENCE: |
|
Insignia Systems, Inc. Proxy Statement to be filed for the Annual Meeting of Shareholders to be |
|
held on May 26, 2010 (Part III – Items 10, 11, 12, 13 and 14) |
|
|
2
Forward-Looking Statements
Statements made in this Annual Report on Form 10-K, in the Company’s other SEC filings, in press releases and in oral statements to shareholders and securities analysts, which are not statements of historical or current facts, are “forward-looking statements.” Such forward-looking statements involve known and unknown risks, uncertainties and other factors which may cause the actual results or performance of the Company to be materially different from the results or performance expressed or implied by such forward-looking statements. The words “believes,” “expects,” “anticipates,” “seeks” and similar expressions identify forward-looking statements. Readers are cautioned not to place undue reliance on these forward-looking statements, which speak only as of the date the statement was made. These statements are subject to the risks and uncertainties that could cause actual results to differ materially and adversely from the forward-looking statements. These risks and uncertainties include, but are not limited to, the risks described in Part I, Item 1A.
General
Insignia Systems, Inc., (the “Company”) markets in-store advertising products, programs and services to consumer packaged goods manufacturers (customers) and retailers. The Company has been in business since 1990. Since 1998, the Company has been focusing on providing in-store services through the Insignia Point-Of-Purchase Services (POPS) in-store advertising program. Insignia POPS® includes the Insignia POPSign® program.
Insignia’s POPSign is a national, account-specific, in-store, shelf-edge advertising program that has been shown to deliver significant sales increases. Funded by consumer packaged goods manufacturers, the program allows manufacturers to deliver vital product information to consumers at the point-of-purchase. The brand information is combined with each retailer’s store-specific prices and is displayed on the retailer’s unique sign format. The combining of manufacturer and retailer information produces a complete “call to action” that gets consumers the information they want and need to make purchasing decisions, while building store and brand equity.
For retailers, Insignia’s POPSign program is a source of incremental revenue and is the first in-store advertising program that delivers a complete “call to action” on a product-specific and store-specific basis, with all participating retail stores updated weekly. For consumer packaged goods manufacturers, Insignia’s POPSign program provides access to the optimum retail advertising site for their products – the retail shelf-edge. In addition, manufacturers benefit from significant sales increases, short lead times, micro-marketing capabilities, such as store-specific and multiple language options, and a wide variety of program features and enhancements that provide unique advertising advantages.
The Company’s Internet address is www.insigniasystems.com. The Company has made available on its Web site all of the reports it files with the SEC. The Company’s Web site is not incorporated by reference into this Report on Form 10-K. Copies of reports can also be obtained free of charge by requesting them from Insignia Systems, Inc., 8799 Brooklyn Boulevard, Minneapolis, Minnesota 55445; Attention: CFO; telephone 763-392-6200.
3
Industry and Market Background
According to Point-Of-Purchase Advertising International (POPAI), an industry non-profit trade association, more than 70% of brand purchase decisions are being made in-store. As a result, product manufacturers are constantly seeking in-store vehicles to motivate consumers to buy their branded products. The Company’s market studies indicate that the shelf-edge sign represents the final and best opportunity for manufacturers to convince the consumer to buy. In fact, a 2005 industry study concluded that shelf signs are the most effective type of in-store advertising vehicle after end-aisle displays and in-store leaflets.
Many consumers seek product information beyond price in order to make educated buying decisions. The Company’s marketing studies indicate the most effective sign contains information supplied by the product manufacturer in combination with the retailer’s price and design look.
Company Products
Insignia’s POPSign Program
Insignia’s POPSign program is an in-store, shelf-edge, point-of-purchase advertising program that enables manufacturers to deliver product-specific messages quickly and accurately – in designs and formats that have been pre-approved and supported by participating retailers. Insignia POPSigns deliver vital product selling information from manufacturers, such as product uses and features, nutritional information, advertising tag lines and product images. The brand information is combined with the retailer’s store-specific prices and is displayed on the retailer’s unique sign format that includes its logo, headline and store colors. Each sign is displayed directly in front of the manufacturer’s product in the participating retailer’s stores. Insignia’s POPSign program offers special features and enhancements, such as Advantage and Custom Advantage headers that allow manufacturers to add visibility and highlight their brand message at-shelf. Insignia offers Color POPSigns with customizable, image-building full-color graphics. Insignia UltraColor® POPSigns offer 75% more area for the full-color creative than Color POPSigns.
Utilizing proprietary technology, the Company collects and organizes the data from both manufacturers and retailers, then formats, prints and delivers the signs to retailers for distribution and display. Store personnel place the signs at the shelf for two-week display cycles. The Company charges manufacturers for the signs placed in stores for each cycle. Retailers are paid a fee to display the signs and for product movement data provided to Insignia.
The Impulse Retail System and SIGNright Sign System
Prior to 1996, the Company’s primary product offering was the Impulse Retail System, a system developed by an independent product design and development firm. In 1996, the Company replaced the Impulse Retail System with the SIGNright Sign System. In 1998, the Company ceased the active domestic sales of the SIGNright Sign System.
Cardstock for the two systems is sold by the Company in a variety of sizes and colors that can be customized to include pre-printed custom artwork, such as a retailer’s logo. Approximately 2% of 2009 revenues came from the sale of cardstock. The Company expects this percentage to be comparable in the future.
Stylus Software
In late 1993, the Company introduced Stylus, a PC-based software application used by retailers to produce signs, labels, and posters. The Stylus software allows retailers to create signs, labels and posters by manually entering the information or by importing information from a database. Approximately 1% of 2009 revenues came from the sale of Stylus products and maintenance. The Company expects this percentage to be comparable in the future.
4
Laser Printer and Vinyl Label Supplies
The Company provides a comprehensive offering of laser printable cardstock and vinyl labels to retailers for their in-store signage and shelf-edge product information needs. Products include adhesive and non-adhesive supplies in a variety of colors, sizes and weights. Approximately 4% of 2009 revenues came from the sale of laser printer and vinyl label supplies. The Company expects this percentage to be comparable in the future.
Marketing and Sales
The Company directly markets the Insignia POPSign program to food and drug manufacturers and retailers. By utilizing the Insignia POPSign program, these manufacturers and retailers can easily accomplish what had previously been either impossible or extremely difficult: tailoring national in-store advertising programs to regional and local needs with minimal effort. In addition to the benefits provided to manufacturers and retailers, Insignia’s POPSign program provides consumers more information and clearer messages to aid in purchasing decisions. The Company believes its POPSign program is the most complete in-store advertising sign program available, benefiting consumer, retailer, and manufacturer.
On June 12, 2006, the Company entered into an Exclusive Reseller Agreement with Valassis Sales and Marketing Services, Inc. (“Valassis”). The agreement had an initial term of one year with the objective of increasing the Company’s sales of Insignia POPSigns. On December 6, 2006, the Company and Valassis executed Amendment No. 1 to the agreement which finalized certain appendices, made certain other modifications to the agreement and extended the initial term through December 31, 2007. On July 2, 2007 the Company and Valassis executed Amendment No. 2 to the agreement which extended the term of the agreement to December 31, 2017 and expanded the strategic alliance to increase the role of Valassis to include developing and expanding the Company’s participating retailer network. In conjunction with Amendment No. 2 Valassis received a five-year warrant to acquire 800,000 shares of Insignia’s common stock at a price of $4.04 and will be paid cash commissions by the Company on the revenue the Company realizes from POPS programs the consumer packaged goods manufacturers conduct in the new retail chains. The Company recorded $1,521,000 of expense during the year ended December 31, 2007 related to the fair value of the warrant.
Prior to April 1998, the Company marketed the Impulse Retail System and the SIGNright Sign System through telemarketing by in-house sales personnel and independent sales representatives. In May 1998, the Company discontinued the active marketing of the systems. The Company sells cardstock and supplies related to these systems to U.S. and international customers.
The Company markets its Stylus software in the United States and internationally primarily through resellers that integrate Stylus as an Open Database Connectivity design and publishing component into their retail data and information management software applications.
During 2009, 2008 and 2007, foreign sales accounted for less than 1% of total net sales each year. The Company expects sales to foreign distributors will be less than 1% of total net sales in 2010.
Competition
Insignia’s POPSign Program
The Insignia POPSign program is competing for the marketing expenditures of branded product manufacturers for at-shelf advertising-related signage. The Insignia POPSign program has one major competitor in its market, which is News America Marketing In-Store®, Inc. (News America), plus other smaller competitors.
News America offers a network for in-store advertising, promotion and sales merchandising services. News America has branded its in-store shelf signage products as SmartSource Shelftalksm, SmartSource Shelfvisionsm and SmartSource Price Pop®.
5
We believe the main strengths of the Insignia POPSign program in relation to its competitors are:
|
|
|
|
|
|
- |
the linking of manufacturers to retailers at a central coordination point |
|
|
|
|
|
|
- |
providing a complete “call to action” |
|
|
|
|
|
|
- |
supplying product-specific and store-specific messages at the retail shelf |
|
|
|
|
|
|
- |
delivering vital product information and store-specific prices |
|
|
|
|
|
|
- |
short lead times |
|
|
|
|
|
|
- |
significant sales increases |
Patents and Trademarks
The Company has developed and is using a number of trademarks, service marks, slogans, logos and other commercial symbols to advertise and sell its products. The Company owns U.S. registered trademarks for Insignia Systems, Inc.® (and Design), Insignia POPS®, POPS Select®, Insignia POPSign®, Insignia ShelfPOPS®, UltraColor®, Stylus®, Stylus Work Center®, SIGNright®, Impulse®, DuraSign®, I-Care®, and Check This Out.®
The Company is in the process of obtaining trademark registrations in the United States for the trademark “Insignia E-POPS” and “Color POPSign.”
The Company licenses the right to use a patented barcode on the sign cards for the Company’s Impulse and SIGNright Sign Systems. Neither revenues from this product line, nor royalties paid under the license agreement, are considered material.
Key employees are required to enter into nondisclosure and invention assignment agreements, and customers, vendors and other third parties also must agree to nondisclosure restrictions prior to disclosure of our trade secrets or other confidential or proprietary information.
Product Development
Product development for Insignia’s POPSign program has been conducted internally and includes the proprietary data management and operations system, as well as the current offering of point-of-purchase and other advertising products. Ongoing internal systems enhancements, as well as the development of point-of-purchase and other advertising or promotional products, will be conducted utilizing both internal and external resources as appropriate.
Product development on the SIGNright Sign System was primarily conducted by a developer on a contract basis.
The Stylus software product line remains a viable application for the Company’s retail customers. The Company performs development to keep Stylus current and updated to meet industry requirements.
Customers
Valassis and General Mills, Inc. each accounted for 20% of the Company’s total net sales for the year ended December 31, 2009. General Mills, Inc., Nestle Co., Kellogg Sales Company and Valassis accounted for 19%, 13%, 11% and 10%, respectively, of the Company’s total net sales for the year ended December 31, 2008. Nestle Co. and Kellogg Sales Company accounted for 15% and 11%, respectively, of the Company’s total net sales for the year ended December 31, 2007.
6
Backlog
Sales backlog on March 8, 2010 was approximately $7.5 million, all of which is for delivery during the remainder of 2010. The orders are believed to be firm but there is no assurance that all of the backlog will actually result in revenues. Sales backlog on March 9, 2009 was approximately $8.2 million.
Seasonality
The Company’s results of operations have fluctuated from quarter to quarter due to variations in net sales and operating expenses. There is no seasonal pattern to these fluctuations.
The results of operations fluctuate from quarter to quarter as a result of the following:
|
|
|
|
|
|
• |
The timing of seasonal events for customers; |
|
|
|
|
|
|
• |
Variations in the specific products which customers choose to advertise; |
|
|
|
|
|
|
• |
Fluctuations in advertising budgets of customers and the amounts they commit to in-store advertising; |
|
|
|
|
|
|
• |
Variations in the number of retailers in the Company’s network; |
|
|
|
|
|
|
• |
Sales incentives to sales staff and strategic partners; |
|
|
|
|
|
|
• |
Minimum program level commitments to retailers; and |
|
|
|
|
|
|
• |
Professional fees related to litigation. |
Employees
As of February 26, 2010, the Company had 116 employees, including all full-time and part-time employees.
Segment Reporting
The Company operates in a single reportable segment.
7
Our business faces significant risks, including the risks described below. If any of the events or circumstances described in the following risks occurs, our business, financial condition or results of operations could suffer, and the trading price of our common stock could decline.
Our Customers And Retailers May Be Susceptible To Changes In General Economic Conditions
Our revenues are affected by our customers’ marketing and advertising spending and our revenues and results of operations may be subject to fluctuations based upon general economic conditions. A continued economic downturn may reduce demand for our products and services or depress pricing of those products and services and have an adverse effect on our results of operations. Retailers may be impacted by changes in consumer spending as well, which may adversely impact our ability to renew contracts with our existing retailers as well as contract with new retailers on terms which are acceptable. In addition, if we are unable to successfully anticipate changing economic conditions, we may be unable to effectively plan for and respond to those changes, and our business could be negatively affected.
We Have Had Significant Losses In Prior Periods
Although we had net income of $3,716,000, $2,343,000 and $2,396,000 for the years ended December 31, 2009, 2007 and 2006, respectively, we had a net loss of $(2,257,000) for the year ended December 31, 2008, and significant net losses for a number of years prior to December 31, 2006. There can be no assurance that we will be profitable on a quarterly or annual basis. If we are unable to generate net income from operations our business will be adversely affected and our stock price will likely decline.
We Are Involved In Major Litigation
In August 2000, News America Marketing In-Store, Inc. (News America), brought suit against the Company in U.S. District Court in New York, New York. The case was settled in November 2002. The terms of the settlement agreement are confidential. The settlement did not impact the Company’s operating results.
In October 2003, News America brought suit against the Company in U.S. District Court in New York, New York, alleging that the Company has engaged in deceptive acts and practices, has interfered with existing business relationships with retailers and prospective economic advantage, and has engaged in unfair competition. The suit sought unspecified damages and injunctive relief. In February 2007 the U.S. District Court in New York transferred this action to Minnesota where the claims became part of the lawsuit the Company filed against News America and Albertson’s Inc. in 2004 (described below), and the New York action was subsequently dismissed.
On September 23, 2004, the Company brought suit against News America and Albertson’s Inc. (Albertson’s) in Federal District Court in Minneapolis, Minnesota, for violations of federal and state antitrust and false advertising laws, alleging that News America has acquired and maintained monopoly power through various wrongful acts designed to harm the Company in the in-store advertising and promotion products and services market. The suit seeks injunctive relief sufficient to prevent further antitrust injury and an award of treble damages to be determined at trial for the harm caused to the Company. On June 30, 2006 the Court denied the motions of News America and Albertson’s to dismiss the suit. On September 20, 2006, the State of Minnesota through its Attorney General intervened as a co-plaintiff in the business disparagement portion of the Minnesota case. In December 2006, News America filed counterclaims in the Minnesota case that included claims similar to those in its New York action against Insignia and one of its officers, plus claims for damages for two alleged incidents of libel and slander. On February 4, 2008, the Court approved a consent decree entered into by News America and the State of Minnesota under which News America agreed to not violate Minnesota’s statutes prohibiting commercial disparagement. On July 29, 2008, the Company and Albertson’s entered into a settlement agreement and mutual release, in which they each agreed to release all claims against the other, and the Company agreed to dismiss its lawsuit against Albertson’s. On September 30, 2009, the Court ruled on motions by both the Company and News America for Summary Judgment. The Court awarded Summary Judgment to the Company and one of its executive officers on all of News America’s counterclaims and third-party claims. The Court also denied News America’s Motion for Summary Judgment on the Company’s claims against News America other than granting News America’s uncontested motion on one claim in the Amended Complaint related to retailers. The Court’s rulings set the stage for a trial on the Company’s antitrust and unfair-competition claims against News America, and a settlement conference is currently scheduled for April 12, 2010. Assuming the case does not settle at that time, the Company will request that the Court set the case for trial as soon as possible after April 12th.
8
The Company filed claims in December 2006 and January 2007 with its director’s and officer’s liability and general liability insurers related to the defense costs and insurance coverage for claims asserted against the Company and one of its officers in News America’s counterclaims. On August 9, 2007, the Company filed a complaint against the insurers in Hennepin County District Court, State of Minnesota requesting a declaratory judgment that the insurers owed the Company and its officer such defense costs and insurance coverage. In December 2007, the Company settled its claim against one of the insurers. Also, in March 2009, the Company settled with the other insurer and received a payment of $1,387,000 as part of the settlement. The Company recorded the payment in general and administrative expenses for the quarter ended March 31, 2009, and the litigation with the insurers is now concluded.
Management currently expects the amount of legal fees and expenses that will be incurred in connection with the ongoing lawsuit against News America to be significant throughout 2010 and possibly future years. During the year ended December 31, 2009, the Company incurred legal fees of $1,753,000 related to the News America litigation which were offset by the $1,387,000 payment received from settlement of its claim against one of its insurers during the first quarter of 2009. Legal fees and expenses are expensed as incurred and are included in general and administrative expenses in the statements of operations.
The Company is subject to various other legal proceedings in the normal course of business. Management believes the outcome of these proceedings will not have a material adverse effect on the Company’s financial position or results of operations.
We Are Dependent On Our Contracts With Retailers And Our Ability To Renew Those Contracts When Their Terms Expire
On an ongoing basis, we negotiate renewals of various retailer contracts. Some of our retailer contracts require us to guarantee minimum payments to our retailers. If we are unable to offer guarantees at the required levels in the new contracts, and the contracts are not renewed because of that or because of other reasons, it will have a material adverse effect on our operations and financial condition.
Our POPS business and results of operations could be adversely affected if the number of retailer partners decreases significantly or if the retailer partners fail to continue to provide good service including performing their duties in placing and maintaining POPSigns at the shelf in their stores and providing product movement data to us.
9
Our Results Of Operations May Be Subject To Significant Fluctuations Which May Result In A Decrease In Our Stock Price
Our quarterly and annual operating results have fluctuated in the past and may vary in the future due to a wide variety of factors including:
|
|
|
|
• |
the loss of contracts with retailers; |
|
|
|
|
• |
the continued impact of significant litigation on our business; |
|
|
|
|
• |
the timing of seasonal events for customers or the loss of customers; |
|
|
|
|
• |
the timing of new retail stores being added; |
|
|
|
|
• |
the timing of additional selling, marketing and general and administrative expenses; and |
|
|
|
|
• |
competitive conditions in our industry. |
Due to these factors, our quarterly net sales, expenses and results of operations could vary significantly in the future and this could adversely affect the market price of our common stock.
We Have Significant Competition
We face significant competition from News America which provides at-shelf advertising and promotional signage. News America has significantly greater financial resources that can be used to market their products. Should our competitor succeed in obtaining more of the at-shelf advertising business from our current customers, our revenues and related operations would be adversely affected. We are involved in major litigation regarding News America’s alleged violations of anti-trust and other laws, as more fully described in this Item 1A under “We Are Involved In Major Litigation.”
Our Results Are Dependent On The Success Of Our Insignia POPS Program Which Represents A Significant Part Of Our Business
We are largely dependent on our POPS program, which represented approximately 93%, 92% and 88% of total net sales for fiscal 2009, 2008 and 2007, respectively. We expect the POPS program to represent a higher percentage in fiscal 2010 and future periods. Should brand manufacturers no longer perceive value in the POPS program, our business and results of operations would be adversely affected due to our heavy dependence on this program.
Our Results Are Dependent On The Level Of Spending By Branded Product Manufacturers For Advertising And Promotional Expenditures
We are largely dependent on the net sales from our POPSigns, which are purchased by branded product manufacturers. Changes in economic conditions could result in reductions in advertising and promotional expenditures by branded product manufacturers. Should these reductions occur, our revenues and related results of operations would be adversely affected.
Our Results Are Dependent On Our Manufacturer Partners Continuing To Achieve Sales Increases
Our product manufacturer customers use our POPS program to motivate consumers to buy their branded products. Use of our POPS program has historically resulted in sales increases for that particular product. If our POPS program does not continue to result in these product sales increases, our marketing success and sales levels could be adversely affected.
10
Our Stock Price Has Been And May Continue To Be Volatile
During 2009 our common stock has traded between $5.27 and $0.72 per share. The market price of our common stock may continue to be volatile and may be significantly affected by:
|
|
|
|
• |
the loss or addition of contracts with major consumer packaged goods manufacturers and retailers; |
|
|
|
|
• |
the continued impact of significant litigation on our business; |
|
|
|
|
• |
actual or anticipated fluctuations in our operating results; |
|
|
|
|
• |
announcements of new services by us or our competitors; |
|
|
|
|
• |
developments with respect to conditions and trends in our industry or in the industries we serve; |
|
|
|
|
• |
general market conditions; and |
|
|
|
|
• |
other factors, many of which are beyond our control. |
Item 1B. Unresolved Staff Comments
Not applicable.
The Company currently leases approximately 41,000 square feet of office and warehouse space in suburban Minneapolis, Minnesota, through February 29, 2016. The Company believes that the 41,000 square feet of space will meet the Company’s foreseeable needs.
In August 2000, News America Marketing In-Store, Inc. (News America), brought suit against the Company in U.S. District Court in New York, New York. The case was settled in November 2002. The terms of the settlement agreement are confidential. The settlement did not impact the Company’s operating results.
In October 2003, News America brought suit against the Company in U.S. District Court in New York, New York, alleging that the Company has engaged in deceptive acts and practices, has interfered with existing business relationships with retailers and prospective economic advantage, and has engaged in unfair competition. The suit sought unspecified damages and injunctive relief. In February 2007 the U.S. District Court in New York transferred this action to Minnesota where the claims became part of the lawsuit the Company filed against News America and Albertson’s Inc. in 2004 (described below), and the New York action was subsequently dismissed.
11
On September 23, 2004, the Company brought suit against News America and Albertson’s Inc. (Albertson’s) in Federal District Court in Minneapolis, Minnesota, for violations of federal and state antitrust and false advertising laws, alleging that News America has acquired and maintained monopoly power through various wrongful acts designed to harm the Company in the in-store advertising and promotion products and services market. The suit seeks injunctive relief sufficient to prevent further antitrust injury and an award of treble damages to be determined at trial for the harm caused to the Company. On June 30, 2006 the Court denied the motions of News America and Albertson’s to dismiss the suit. On September 20, 2006, the State of Minnesota through its Attorney General intervened as a co-plaintiff in the business disparagement portion of the Minnesota case. In December 2006, News America filed counterclaims in the Minnesota case that included claims similar to those in its New York action against Insignia and one of its officers, plus claims for damages for two alleged incidents of libel and slander. On February 4, 2008, the Court approved a consent decree entered into by News America and the State of Minnesota under which News America agreed to not violate Minnesota’s statutes prohibiting commercial disparagement. On July 29, 2008, the Company and Albertson’s entered into a settlement agreement and mutual release, in which they each agreed to release all claims against the other, and the Company agreed to dismiss its lawsuit against Albertson’s. On September 30, 2009, the Court ruled on motions by both the Company and News America for Summary Judgment. The Court awarded Summary Judgment to the Company and one of its executive officers on all of News America’s counterclaims and third-party claims. The Court also denied News America’s Motion for Summary Judgment on the Company’s claims against News America other than granting News America’s uncontested motion on one claim in the Amended Complaint related to retailers. The Court’s rulings set the stage for a trial on the Company’s antitrust and unfair-competition claims against News America, and a settlement conference is currently scheduled for April 12, 2010. Assuming the case does not settle at that time, the Company will request that the Court set the case for trial as soon as possible after April 12th.
The Company filed claims in December 2006 and January 2007 with its director’s and officer’s liability and general liability insurers related to the defense costs and insurance coverage for claims asserted against the Company and one of its officers in News America’s counterclaims. On August 9, 2007, the Company filed a complaint against the insurers in Hennepin County District Court, State of Minnesota requesting a declaratory judgment that the insurers owed the Company and its officer such defense costs and insurance coverage. In December 2007, the Company settled its claim against one of the insurers. Also, in March 2009, the Company settled with the other insurer and received a payment of $1,387,000 as part of the settlement. The Company recorded the payment in general and administrative expenses for the quarter ended March 31, 2009, and the litigation with the insurers is now concluded.
Management currently expects the amount of legal fees and expenses that will be incurred in connection with the ongoing lawsuit against News America to be significant throughout 2010 and possibly future years. During the year ended December 31, 2009, the Company incurred legal fees of $1,753,000 related to the News America litigation which were offset by the $1,387,000 payment received from settlement of its claim against one of its insurers during the first quarter of 2009. Legal fees and expenses are expensed as incurred and are included in general and administrative expenses in the statements of operations.
The Company is subject to various other legal proceedings in the normal course of business. Management believes the outcome of these proceedings will not have a material adverse effect on the Company’s financial position or results of operations.
12
Item 5. Market for Registrant’s Common Equity, Related Stockholder Matters and Issuer Purchases of Equity Securities
Market Information
The Company’s common stock trades on the NASDAQ Capital Market® under the symbol ISIG. The following table summarizes the high and low sale prices per share of our common stock for the periods indicated as reported on the Nasdaq System.
|
|
|
|
|
|
|
|
|
|
|
|
|
|
|
|
|
|
|
|
2009 |
|
High |
|
Low |
|
|
|
2008 |
|
High |
|
Low |
|
||||
|
First Quarter |
|
$ |
2.20 |
|
$ |
0.72 |
|
|
|
First Quarter |
|
$ |
2.95 |
|
$ |
1.71 |
|
|
Second Quarter |
|
|
3.01 |
|
|
1.79 |
|
|
|
Second Quarter |
|
|
2.50 |
|
|
1.64 |
|
|
Third Quarter |
|
|
3.98 |
|
|
2.44 |
|
|
|
Third Quarter |
|
|
2.24 |
|
|
1.50 |
|
|
Fourth Quarter |
|
|
5.27 |
|
|
3.75 |
|
|
|
Fourth Quarter |
|
|
1.94 |
|
|
0.75 |
|
Approximate Number of Holders of Common Stock
As of February 26, 2010, the Company had one class of Common Stock beneficially held by approximately 1,850 owners.
Dividends
The Company has never paid cash dividends on its common stock. The Board of Directors presently intends to retain all earnings for use in the Company’s business and does not anticipate paying cash dividends in the foreseeable future.
Stock Repurchase Plan
On February 23, 2010, the Board of Directors authorized the repurchase of up to $2,000,000 of the Company’s common stock on or before January 31, 2011. The plan does not obligate the Company to repurchase any particular number of shares, and may be suspended at any time at the Company’s discretion.
13
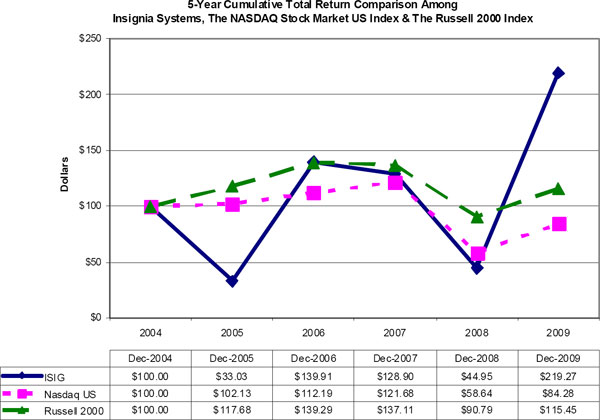
Stock Performance Graph
The following graph compares the cumulative total shareholder return on the Company’s Common Stock for the five fiscal years beginning December 31, 2004 and ending December 31, 2009, with the cumulative total return on the NASDAQ Stock Market — U.S. Index and the Russell 2000 Index over the same period (assuming the investment of $100 in the Company’s Stock, the NASDAQ Stock Market – U. S. Index and the Russell 2000 Index on December 31, 2004 and the reinvestment of all dividends).
14
Item 6. Selected Financial Data
The following table sets forth selected financial data for each of the five years ended December 31, 2009. The operations and balance sheet data for the years ended and as of December 31, 2009, 2008, 2007, 2006 and 2005 are derived from our audited financial statements. The following information should be read in conjunction with “Management’s Discussion and Analysis of Financial Condition and Results of Operations” and with our financial statements and the related notes thereto included elsewhere in this report.
(In thousands, except per share amounts.)
|
|
|
|
|
|
|
|
|
|
|
|
|
|
|
|
|
|
|
For the
Years Ended |
|
2009 |
|
2008 |
|
2007 |
|
2006 |
|
2005 |
|
|||||
|
Net sales |
|
$ |
28,770 |
|
$ |
31,406 |
|
$ |
24,431 |
|
$ |
21,894 |
|
$ |
19,598 |
|
|
Operating income (loss) |
|
|
3,745 |
(1) |
|
(299 |
) |
|
81 |
(3) |
|
2,314 |
|
|
(3,331 |
) |
|
Net income (loss) |
|
|
3,716 |
(1) |
|
(2,257 |
)(2) |
|
2,343 |
(3,4) |
|
2,396 |
|
|
(3,308 |
) |
|
|
|
|
|
|
|
|
|
|
|
|
|
|
|
|
|
|
|
Net income (loss) per share: |
|
|
|
|
|
|
|
|
|
|
|
|
|
|
|
|
|
Basic |
|
$ |
0.25 |
|
$ |
(0.15 |
) |
$ |
0.15 |
|
$ |
0.16 |
|
$ |
(0.22 |
) |
|
Diluted |
|
$ |
0.23 |
|
$ |
(0.15 |
) |
$ |
0.14 |
|
$ |
0.15 |
|
$ |
(0.22 |
) |
|
|
|
|
|
|
|
|
|
|
|
|
|
|
|
|
|
|
|
Shares used in calculation of net income (loss) per share: |
|
|
|
|
|
|
|
|
|
|
|
|
|
|
|
|
|
Basic |
|
|
15,139 |
|
|
15,484 |
|
|
15,411 |
|
|
15,093 |
|
|
15,002 |
|
|
Diluted |
|
|
15,846 |
|
|
15,484 |
|
|
16,186 |
|
|
15,556 |
|
|
15,002 |
|
|
|
|
|
|
|
|
|
|
|
|
|
|
|
|
|
|
|
|
Working capital |
|
$ |
10,716 |
|
$ |
6,396 |
|
$ |
7,751 |
|
$ |
5,017 |
|
$ |
2,592 |
|
|
Total assets |
|
|
17,839 |
|
|
15,593 |
|
|
13,340 |
|
|
8,583 |
|
|
6,673 |
|
|
Total shareholders’ equity |
|
|
11,685 |
|
|
7,271 |
|
|
9,677 |
|
|
4,862 |
|
|
2,072 |
|
|
|
|
|
(1) |
Includes one-time cash proceeds of $1,387 from the settlement of a claim against one of the Company’s insurers more fully described in Note 5 to the financial statements. |
|
(2) |
Includes tax expense of $2,131 related to the increase of the valuation allowance against deferred tax assets more fully described in Note 7 to the financial statements. |
|
(3) |
Includes a one-time non-cash charge of $1,521 for the warrant granted to Valassis more fully described in Note 6 to the financial statements. |
|
(4) |
Includes a tax benefit of $2,131 related to the reduction of the valuation allowance against deferred tax assets more fully described in Note 7 to the financial statements. |
Item 7. Management’s Discussion and Analysis of Financial Condition and Results of Operations
The following discussion should be read in conjunction with the financial statements and the related notes included in this Report. This Report contains forward-looking statements that involve risks and uncertainties. Our actual results could differ materially from those in such forward-looking statements as a result of many factors, including those discussed in “Forward-Looking Statements” and elsewhere in this Report.
15
Impact Of The Current Economic Environment
The Company does not believe that the recession which began in late 2007 had a significant effect on its results of operations for the year ended December 31, 2009. POPSign service revenues for the year ended December 31, 2009, decreased 7.8% over the year ended December 31, 2008; however, this decrease was primarily related to the loss of a significant retailer from the Company’s retail network at the end of 2008 when the contract with the retailer expired. Products sales for the year ended December 31, 2009, decreased 15.0% from the year ended December 31, 2008, which reflects a historical trend of decreases due to decreased demand for thermal sign card supplies and laser supplies. The Company may be adversely affected by the economic environment in the future if spending levels of its customers are reduced or it is unable to renew contracts with existing retailers or contract with new retailers on terms which are acceptable.
Results of Operations
The following table sets forth, for the periods indicated, certain items in the Company’s Statements of Operations as a percentage of total net sales.
|
|
|
|
|
|
|
|
|
|
|
|
|
Year ended December 31 |
|
2009 |
|
2008 |
|
2007 |
|
|||
|
Net sales |
|
|
100.0 |
% |
|
100.0 |
% |
|
100.0 |
% |
|
Cost of sales |
|
|
46.7 |
|
|
46.2 |
|
|
44.6 |
|
|
Gross profit |
|
|
53.3 |
|
|
53.8 |
|
|
55.4 |
|
|
Operating expenses: |
|
|
|
|
|
|
|
|
|
|
|
Selling |
|
|
23.0 |
|
|
27.1 |
|
|
23.2 |
|
|
Marketing |
|
|
5.4 |
|
|
5.1 |
|
|
5.8 |
|
|
Warrant expense |
|
|
— |
|
|
— |
|
|
6.2 |
|
|
General and administrative |
|
|
16.7 |
|
|
22.6 |
|
|
19.9 |
|
|
Insurance settlement proceeds |
|
|
(4.8 |
) |
|
— |
|
|
— |
|
|
Total operating expenses |
|
|
40.3 |
|
|
54.8 |
|
|
55.1 |
|
|
Operating income (loss) |
|
|
13.0 |
|
|
(1.0 |
) |
|
0.3 |
|
|
Other income |
|
|
0.3 |
|
|
0.6 |
|
|
0.6 |
|
|
Income (loss) before taxes |
|
|
13.3 |
|
|
(0.4 |
) |
|
0.9 |
|
|
Income tax (expense) benefit |
|
|
(0.4 |
) |
|
(6.8 |
) |
|
8.7 |
|
|
Net income (loss) |
|
|
12.9 |
% |
|
(7.2) |
% |
|
9.6 |
% |
Critical Accounting Policies
Our discussion of our financial condition and results of operations is based upon our financial statements, which have been prepared in accordance with accounting principles generally accepted in the United States. During the preparation of these financial statements, we are required to make estimates and assumptions that affect the reported amounts of assets, liabilities, net revenues, costs and expenses and related disclosures. On an ongoing basis, we evaluate our estimates and assumptions, including those related to revenue recognition, allowance for doubtful accounts, income taxes, and stock-based compensation expense. We base our estimates on historical experience and on various other assumptions that we believe are reasonable under the circumstances. The results of our analysis form the basis for making assumptions about the carrying values of assets and liabilities that are not readily apparent from other sources. Actual results may differ from these estimates under different assumptions or conditions, and the impact of such differences may be material to our consolidated financial statements.
We believe the following critical accounting policies affect our more significant judgments and estimates used in the preparation of our financial statements:
Revenue Recognition. The Company recognizes revenue from Insignia POPSigns ratably over the period of service, which is typically a two-week display cycle. We recognize revenue related to equipment, software and sign card sales at the time the products are shipped to customers. Revenue associated with maintenance agreements is recognized ratably over the life of the contract. Revenue that has been billed and not yet recognized is reflected as deferred revenue on our balance sheet.
16
Allowance for Doubtful Accounts. An allowance is established for estimated uncollectible accounts receivable. The Company determines its allowance by considering a number of factors, including the length of time trade accounts receivable are past due, the Company’s previous loss history, the customer’s current ability to pay its obligation to the Company, the condition of the general economy and the industry as a whole and other relevant facts and circumstances. Unexpected changes in the aforementioned factors could result in materially different amounts.
Income Taxes. Deferred income taxes are determined based on the estimated future tax effects of differences between the financial statement and tax bases of assets and liabilities given the provisions of enacted tax laws. Deferred income tax provisions and benefits are based on changes to the assets or liabilities from year to year. In providing for deferred taxes, we consider tax regulations of the jurisdictions in which we operate, estimates of future taxable income, and available tax planning strategies. If tax regulations, operating results or the ability to implement tax-planning strategies vary, adjustments to the carrying value of deferred tax assets and liabilities may be required. Valuation allowances are recorded related to deferred tax assets based on the “more likely than not” criteria.
We recognize the financial statement benefit of a tax position only after determining that the relevant tax authority would more likely than not sustain the position following an audit. For tax positions meeting the more-likely-than-not threshold, the amount recognized in the financial statements is the largest benefit that has a greater than 50 percent likelihood of being realized upon ultimate settlement with the relevant tax authority.
At December 31, 2009, all of the Company’s net deferred tax assets were offset with a valuation allowance, which amounted to approximately $7.9 million. The Company does not believe it is more likely than not that these deferred tax assets will be realized in future years.
Stock-Based Compensation. We measure and recognize compensation expense for all stock-based payments at fair value. We use the Black-Scholes option pricing model to determine the weighted average fair value of options and employee stock purchase plan rights. The determination of fair value of share-based payment awards on the date of grant using an option-pricing model is affected by our stock price as well as by assumptions regarding a number of highly complex and subjective variables. These variables include, but are not limited to, the expected stock price volatility over the term of the awards, and actual and projected employee stock option exercise behaviors.
The expected terms of the options and employee stock purchase plan rights are based on evaluations of historical and expected future employee exercise behavior. The risk-free interest rate is based on the U.S. Treasury rates at the date of grant with maturity dates approximately equal to the expected life at grant date. Volatility is based on historical and expected future volatility of the Company’s stock. The Company has not historically issued any dividends and does not expect to in the future. Forfeitures are estimated at the time of the grant and revised, if necessary, in subsequent periods if actual forfeitures differ from estimates.
If factors change and we employ different assumptions in the valuation of grants in future periods, the compensation expense that we record may differ significantly from what we have recorded in the current periods.
Fiscal 2009 Compared to Fiscal 2008
Net Sales. Net sales for the year ended December 31, 2009 decreased 8.4% to $28,770,000 compared to $31,406,000 for the year ended December 31, 2008.
17
Service revenues from our POPSign programs for the year ended December 31, 2009 decreased 7.8% to $26,666,000 compared to $28,931,000 for the year ended December 31, 2008. The decrease was primarily due to a decrease in the number of POPSign programs executed for customers (consumer packaged goods manufacturers) during the 2009 period as a result of the loss of Safeway, Inc. from our network of retailers at December 31, 2008 when the contract with Safeway, Inc. expired.
Product sales for the year ended December 31, 2009 decreased 15.0% to $2,104,000 compared to $2,475,000 for the year ended December 31, 2008. The decrease was primarily due to decreased sales of thermal sign card supplies, laser sign card and label supplies, and Stylus software based upon decreased demand for these products from our customers. The Company expects further declines in sales of thermal sign card supplies for the year ending December 31, 2010.
Gross Profit. Gross profit for the year ended December 31, 2009 decreased 9.1% to $15,341,000 compared to $16,884,000 for the year ended December 31, 2008. Gross profit as a percentage of total net sales decreased to 53.3% for 2009 compared to 53.8% for 2008.
Gross profit from our POPSign program revenues for the year ended December 31, 2009 decreased 8.4% to $14,652,000 compared to $16,002,000 for the year ended December 31, 2008. The decrease in gross profit of $1,350,000 was primarily due to decreased sales which was partially offset by decreased retailer expenses and printing expenses. Gross profit as a percentage of POPSign program revenues decreased to 55.0% for 2009 compared to 55.3% for 2008, due primarily to the effect of fixed costs and the effect of retailer expenses which did not decrease as significantly as sales.
Gross profit from our product sales for the year ended December 31, 2009 decreased 21.9% to $689,000 compared to $882,000 for the year ended December 31, 2008. Gross profit as a percentage of product sales decreased to 32.8% for 2009 compared to 35.6% for 2008. The decreases were primarily due to decreased sales and the effect of fixed costs.
Operating Expenses
Selling. Selling expenses for the year ended December 31, 2009 decreased 22.2% to $6,632,000 compared to $8,521,000 for the year ended December 31, 2008, primarily due to decreased sales commissions. The decreased sales commissions were due to decreased POPSign program sales and a sales incentive to our strategic partner (Valassis) present only in 2008 which was triggered by a year-over-year increase in sales to specific customers. Selling expenses as a percentage of total net sales decreased to 23.0% in 2009 compared to 27.1% in 2008, primarily due to the factors described above.
Marketing. Marketing expenses for the year ended December 31, 2009 decreased 3.9% to $1,540,000 compared to $1,602,000 for the year ended December 31, 2008, primarily due to decreased data acquisition expense and no staff recruitment costs in 2009. Marketing expenses as a percentage of total net sales increased to 5.4% in 2009 compared to 5.1% in 2008, primarily due to the factors described combined with the effect of decreased sales in 2009.
General and Administrative. General and administrative expenses for the year ended December 31, 2009 decreased 31.9% to $4,811,000 compared to $7,060,000 for the year ended December 31, 2008, primarily due to decreased legal costs related to the News America litigation and decreased facility related expenses which were partially offset by a lease termination payment which the Company received in 2008. The Company recorded lower legal expense in 2009 as there was more activity in 2008 related to trial preparation in the News America litigation. The decreased facility related expenses were the result of more favorable lease terms in the Company’s current facility which it has occupied since August 1, 2008. The Company received a payment of $400,000 for the early termination of its previous facility lease on July 31, 2008. The payment, net of $115,000 of moving expense, is recorded as part of general and administrative expenses in 2008. General and administrative expenses as a percentage of total net sales decreased to 16.7% in 2009 compared to 22.6% in 2008, primarily due to the factors described above in relation to decreased sales.
18
Legal fees were $1,838,000 for the year ended December 31, 2009 compared to $4,234,000 for the year ended December 31, 2008. The legal fees in each year were incurred primarily in connection with the News America litigation described elsewhere herein. We currently expect the amount of legal fees that will be incurred in connection with the ongoing lawsuit to be significant in 2010 as trial preparation continues and as the trial is conducted. A negative outcome of this litigation could affect long-term competitive aspects of the Company’s business.
Insurance Settlement Proceeds. The Company received a payment of $1,387,000 in the first quarter of 2009 from an insurer as part of a settlement of the Company’s claim that the insurer owed the Company defense costs for claims asserted against the Company and one of its officers in the News America litigation.
Other Income (Expense). Other income (net) for the year ended December 31, 2009 was $86,000 compared to other income (net) of $180,000 for the year ended December 31, 2008. Included in other income (net) was interest income of $127,000 for the year ended December 31, 2009 compared to interest income of $234,000 for the year ended December 31, 2008. Interest income for the 2009 year was lower due to lower interest rates which more than offset the effect of higher average cash balances in 2009. Lower interest expense of $40,000 for the year ended December 31, 2009 versus $57,000 for the year ended December 31, 2008 was due to scheduled principal payments made in 2009 to reduce amounts owed to a retailer.
Income Taxes. The Company recorded income tax expense for the year ended December 31, 2009 of $115,000 compared to $2,138,000 for the year ended December 31, 2008. The Company continues to carry a full valuation allowance against its net deferred tax asset at December 31, 2009, and has therefore recorded income tax expense of $115,000 for 2009 which is related to alternative minimum taxes. The Company recorded income tax expense for the year ended December 31, 2008, of $2,138,000 as a result of increasing the valuation allowance against the deferred tax assets by $1,930,000, recording expense of $201,000 from changes in the deferred tax assets and recognizing $7,000 of current income tax expense related to state tax liabilities.
Net Income (Loss). The net income for the year ended December 31, 2009 was $3,716,000 compared to a net loss of $(2,257,000) for the year ended December 31, 2008.
Fiscal 2008 Compared to Fiscal 2007
Net Sales. Net sales for the year ended December 31, 2008 increased 28.6% to $31,406,000 compared to $24,431,000 for the year ended December 31, 2007.
Service revenues from our POPSign programs for the year ended December 31, 2008 increased 34% to $28,931,000 compared to $21,589,000 for the year ended December 31, 2007. The increase was primarily due to an increase in the number of POPSign programs executed for customers (consumer packaged goods manufacturers) during the 2008 period which more than offset a reduction in the average sign price during the 2008 period.
Product sales for the year ended December 31, 2008 decreased 12.9% to $2,475,000 compared to $2,842,000 for the year ended December 31, 2007. The decrease was primarily due to decreased sales of both thermal sign card supplies and laser supplies based upon decreased demand for these products from our customers.
19
Gross Profit. Gross profit for the year ended December 31, 2008 increased 24.7% to $16,884,000 compared to $13,542,000 for the year ended December 31, 2007. Gross profit as a percentage of total net sales decreased to 53.8% for 2008 compared to 55.4% for 2007.
Gross profit from our POPSign program revenues for the year ended December 31, 2008 increased 28.9% to $16,002,000 compared to $12,419,000 for the year ended December 31, 2007. The increase in gross profit of $3,583,000 resulted from $7,342,000 of increased revenues offset by an increase in retailer expenses of $2,652,000 and an increase in all other costs of services (labor, overhead and material) of $1,107,000. Gross profit as a percentage of POPSign program revenues decreased to 55.3% for 2008 compared to 57.5% for 2007, due primarily to lower average revenue per sign combined with higher average cost per sign (primarily retailer expenses) in the 2008 period.
Gross profit from our product sales for the year ended December 31, 2008 decreased 21.5% to $882,000 compared to $1,123,000 for the year ended December 31, 2007. Gross profit as a percentage of product sales decreased to 35.6% for 2008 compared to 39.5% for 2007. The decreases were primarily due to decreased sales and the effect of fixed costs.
Operating Expenses
Selling. Selling expenses (exclusive of selling related warrant expense) for the year ended December 31, 2008 increased 50.4% to $8,521,000 compared to $5,664,000 for the year ended December 31, 2007, primarily due to increased sales commissions, staffing levels and meals/entertainment/travel costs. The increased sales commissions were due to increased POPSign program sales and the effect of increased incentives for our strategic partner (Valassis Sales & Marketing Services, Inc. (“Valassis”)) and our employed sales force. Selling expenses as a percentage of total net sales increased to 27.1% in 2008 compared to 23.2% in 2007, primarily due to the factors described above offset partially by the effect of increased sales in 2008.
Marketing. Marketing expenses (exclusive of marketing related warrant expense) for the year ended December 31, 2008 increased 13.5% to $1,602,000 compared to $1,412,000 for the year ended December 31, 2007, primarily due to increased labor and benefit costs (as a result of increased staffing levels) partially offset by decreased data acquisition and analysis costs. Marketing expenses as a percentage of total net sales decreased to 5.1% in 2008 compared to 5.8% in 2007, primarily due to the factors described which were more than offset by the effect of increased sales in 2008.
Warrant expense (selling and marketing). On July 2, 2007, the Company and Valassis entered into Amendment No. 2 (the “Amendment”) to the Exclusive Reseller Agreement between the parties. The Amendment extends the term of the strategic alliance between the parties to December 31, 2017. The Amendment also expands the strategic alliance to increase the role of Valassis in the selling and marketing efforts of developing and expanding the Company’s participating retailer network. Valassis received a five-year warrant to acquire 800,000 shares of the Company’s common stock at a price of $4.04 and will be paid a cash commission by the Company on the revenue the Company realizes from POPS programs the consumer packaged goods manufacturers conduct in the new retail chains. For the year ended December 31, 2007, the Company recorded $1,521,000 of expense related to the fair value of the warrant.
General and Administrative. General and administrative expenses for the year ended December 31, 2008 increased 45.1% to $7,060,000 compared to $4,864,000 for the year ended December 31, 2007, primarily due to increased legal costs related to the News America litigation and increased staffing levels which were partially offset by the receipt of a lease termination payment. The Company received a payment of $400,000 of early termination of its previous facility lease on July 31, 2008. The payment, net of $115,000 of moving expense, is recorded as part of general and administrative expenses. General and administrative expenses as a percentage of total net sales increased to 22.6% in 2008 compared to 19.9% in 2007, primarily due to the factors described above offset partially by the effect of increased sales in 2008. Legal fees were $4,234,000 for the year ended December 31, 2008 compared to $1,883,000 for the year ended December 31, 2007. The legal fees in each year were incurred primarily in connection with two News America lawsuits described elsewhere herein. Legal fees increased in 2008 primarily due to the increased in activity in the News America litigation as the parties prepared to be trial-ready.
20
Other Income (Expense). Other income (net) for the year ended December 31, 2008 was $180,000 compared to other income (net) of $153,000 for the year ended December 31, 2007. Included in other income (net) was interest income of $234,000 for the year ended December 31, 2008 versus interest income of $247,000 for the year ended December 31, 2007. Interest income for the 2008 year was lower due to lower interest rates which more than offset the effect of higher average cash balances in 2008. Lower interest expense of $57,000 for the year ended December 31, 2008 versus $95,000 for the year ended December 31, 2007 was primarily due to the expiration of the line of credit on April 30, 2007.
Income Taxes. The Company recorded income tax expense for the year ended December 31, 2008 of $2,138,000 as a result of increasing the valuation allowance against the deferred tax assets by $1,930,000, recording expense of $201,000 from changes in the deferred tax assets and recognizing $7,000 of current income tax expense related to state tax liabilities. The Company recorded an income tax benefit for the year ended December 31, 2007 of $2,109,000 as a result of the reversal of $2,337,000 of the valuation allowance against the deferred tax asset which offset expense from a change in deferred tax assets of $206,000 and $22,000 of current income tax expense related to Federal alternative minimum tax liability and other state tax liabilities.
Net Income (Loss). The net loss for the year ended December 31, 2008 was $(2,257,000) compared to net income of $2,343,000 for the year ended December 31, 2007.
Liquidity and Capital Resources
The Company has financed its operations with proceeds from public and private stock sales and sales of its services and products. At December 31, 2009, working capital was $10,716,000 compared to $6,396,000 at December 31, 2008. During the year ended December 31, 2009, cash and cash equivalents decreased by $2,255,000 from $11,052,000 at December 31, 2008 to $8,797,000 at December 31, 2009. The decrease in cash and cash equivalents was primarily the result of investments made during the first nine months in certificates of deposit with twenty-six week maturities which were classified as short-term investments. During the year ended December 31, 2009, cash, cash equivalents and short-term investments increased by $2,145,000 to $13,197,000 at December 31, 2009, as compared to $11,052,000 at December 31, 2008.
Net cash provided by operating activities during the year ended December 31, 2009, was $2,464,000. Net income of $3,716,000 plus non-cash expense of $1,066,000 totaling $4,782,000 for the year ended December 31, 2009, more than offset changes in operating assets and liabilities which used cash of $2,318,000. The non-cash expense of $1,066,000 consisted of stock-based compensation expense, depreciation, amortization, provision for income taxes and provision for bad debt expense. Accounts payable and accrued liabilities decreased $1,974,000 during the year ended December 31, 2009, primarily as a result of the payment in January 2009 of accrued commissions, retailer payments and legal fees which had accrued during 2008 and were payable after December 31, 2008. The Company expects accounts receivable, accounts payable, accrued liabilities and deferred revenue to fluctuate during future periods depending on the level of POPSign revenues and related business activity as well as billing arrangements with customers and payment terms with retailers.
Net cash of $4,678,000 was used in investing activities during the year ended December 31, 2009, due to short-term investment activity and the purchase of property and equipment. Purchases of short-term investments of $6,300,000 and proceeds of $1,900,000 during the year consisted entirely of purchases and redemptions of twenty-six week certificates of deposit. Purchases of property and equipment totaled $278,000 during the year ended December 31, 2009, and consisted of digital printing related equipment and related leasehold modifications as well as information technology equipment and software. The Company expects to make capital expenditures of approximately $200,000 in 2010 consisting of additional digital printing and information technology equipment.
21
Net cash of $41,000 was used in financing activities during the year ended December 31, 2009. Proceeds (net) of $161,000 resulting from the issuance of common stock from the employee stock purchase plan and the employee stock option plans were more than offset by the payment of $202,000 of principal on long-term liabilities.
The Company believes that based upon current business conditions, its existing cash balance and future cash from operations will be sufficient for its cash requirements in the foreseeable future. However, there can be no assurances that this will occur or that the Company will be able to secure additional financing from public or private stock sales or from other financing agreements if needed.
New Accounting Pronouncements
In June 2009, the Financial Accounting Standards Board (FASB) issued guidance that established the FASB Accounting Standards Codification™ (FASB ASC) as the source of authoritative accounting principles recognized by the FASB to be applied to nongovernmental entities in the preparation of financials statements in conformity with generally accepted accounting principles (GAAP). The Codification is a reorganization and compilation of all then-existing authoritative GAAP for nongovernmental entities, except for guidance issued by the Securities and Exchange Commission. Use of the new Codification is effective for interim and annual periods ending after September 15, 2009. Adoption of the Codification has not impacted the financial results of the Company.
In May 2009, FASB ASC 855, Subsequent Events was issued. This statement requires an entity to evaluate events that occur after the balance sheet date but before financial statements are issued or are available to be issued. The new guidance sets forth the period after the balance sheet date during which management of an entity should evaluate events or transactions that may occur for potential recognition or disclosure in the financial statements, the circumstances under which an entity should recognize events or transactions occurring after the balance sheet date in its financials statements, and the disclosures that an entity should make about events or transactions that occurred after the balance sheet date. The Company has adopted the new guidance that was effective for financial statements issued for interim and annual periods ending after June 15, 2009 and the adoption did not have a material impact on our financial statements.
In August 2009, the FASB issued Accounting Standards Update (ASU) No. 2009-05, Fair Value Measurements and Disclosures Topic 820 “Improving Disclosures about Fair Value Measurements”. The updated guidance affirms that the objective of fair value when the market for an asset is not active is the price that would be received to sell the asset in an orderly transaction and clarifies and includes additional factors for determining there has been a significant decrease in market activity for an asset when the market for that asset is not active. It also requires an entity to base its conclusion about whether a transaction was not orderly on the weight of the evidence. This guidance was effective September 1, 2009 and the adoption did not have a material impact on our financial statements.
In December 2009, the FASB issued ASU No. 2010-06, Fair Value Measurements and Disclosures Topic 820 “Improving Disclosures about Fair Value Measurements”. This ASU requires some new disclosures and clarifies some existing disclosure requirements about fair value measurement as set forth in Codification Subtopic 820-10. The FASB’s objective is to improve these disclosures and, thus, increase the transparency in financial reporting. Some of the new disclosures are effective for reporting periods beginning after December 15, 2009, with the remaining new disclosures effective for reporting periods beginning after December 15, 2010. The adoption of this ASU will not have a material impact on our financial statements.
22
Contractual Obligations
The following table summarizes the Company’s contractual obligations and commercial commitments as of December 31, 2009:
Payments due by Period
|
|
|
|
|
|
|
|
|
|
|
|
|
|
|
|
|
|
|
|
|
Total |
|
Less than |
|
2-3 |
|
4-5 |
|
After |
|
|||||
|
Contractual Obligations: |
|
|
|
|
|
|
|
|
|
|
|
|
|
|
|
|
|
Operating leases, excluding operating costs |
|
$ |
2,899,000 |
|
$ |
446,000 |
|
$ |
921,000 |
|
$ |
958,000 |
|
$ |
574,000 |
|
|
Payments to retailers* |
|
|
3,660,000 |
|
|
3,141,000 |
|
|
501,000 |
|
|
18,000 |
|
|
— |
|
|
Long-term liabilities |
|
|
219,000 |
|
|
219,000 |
|
|
— |
|
|
— |
|
|
— |
|
|
Purchase commitments |
|
|
398,000 |
|
|
322,000 |
|
|
76,000 |
|
|
— |
|
|
— |
|
|
|
||||||||||||||||
|
Total contractual obligations |
|
$ |
7,176,000 |
|
$ |
4,128,000 |
|
$ |
1,498,000 |
|
$ |
976,000 |
|
$ |
574,000 |
|
*On an ongoing basis, the Company negotiates renewals of various retailer agreements, some of which provide for fixed or store-based payments rather than sign placement-based payments. Upon the completion of renewals, the annual commitment amounts could be in excess of the amounts above.
Off-Balance Sheet Transactions
None.
Item 7A. Quantitative and Qualitative Disclosures About Market Risk
Not applicable.
Item 8. Financial Statements and Supplementary Data
INDEX TO FINANCIAL STATEMENTS
|
|
|
|
|
The following are included on the pages indicated: |
|
|
|
|
|
|
|
|
24 |
|
|
|
|
|
|
|
25 |
|
|
|
|
|
|
|
Statements of Operations for the years ended December 31, 2009, 2008 and 2007 |
26 |
|
|
|
|
|
|
Statements of Shareholders’ Equity for the years ended December 31, 2009, 2008 and 2007 |
27 |
|
|
|
|
|
|
Statements of Cash Flows for the years ended December 31, 2009, 2008 and 2007 |
28 |
|
|
|
|
|
|
29 |
|
23
REPORT OF INDEPENDENT REGISTERED PUBLIC ACCOUNTING FIRM
To the Board of Directors
and Shareholders
Insignia Systems, Inc.
We have audited the accompanying balance sheets of Insignia Systems, Inc. (a Minnesota corporation) (the “Company”) as of December 31, 2009 and 2008, and the related statements of operations, shareholders’ equity and cash flows for each of the three years in the period ended December 31, 2009. These financial statements are the responsibility of the Company’s management. Our responsibility is to express an opinion on these financial statements based on our audits.
We conducted our audits in accordance with the standards of the Public Company Accounting Oversight Board (United States). Those standards require that we plan and perform the audit to obtain reasonable assurance about whether the financial statements are free of material misstatement. The Company is not required to have, nor were we engaged to perform an audit of its internal control over financial reporting. Our audit included consideration of internal control over financial reporting as a basis for designing audit procedures that are appropriate in the circumstances, but not for the purpose of expressing an opinion on the effectiveness of the Company’s internal control over financial reporting. Accordingly, we express no such opinion. An audit also includes examining, on a test basis, evidence supporting the amounts and disclosures in the financial statements, assessing the accounting principles used and significant estimates made by management, as well as evaluating the overall financial statement presentation. We believe that our audits provide a reasonable basis for our opinion.
In our opinion, the financial statements referred to above present fairly, in all material respects, the financial position of Insignia Systems, Inc. as of December 31, 2009 and 2008, and the results of its operations and its cash flows for each of the three years in the period ended December 31, 2009, in conformity with accounting principles generally accepted in the United States of America.
|
|
|
|
|
/s/ Grant Thornton LLP |
Minneapolis, Minnesota
March 31, 2010
24
Insignia
Systems, Inc.
BALANCE
SHEETS
|
|
|
|
|
|
|
|
|
|
As of December 31 |
|
2009 |
|
2008 |
|
||
|
ASSETS |
|
|
|
|
|
|
|
|
Current Assets: |
|
|
|
|
|
|
|
|
Cash and cash equivalents |
|
$ |
8,797,000 |
|
$ |
11,052,000 |
|
|
Short-term investments |
|
|
4,400,000 |
|
|
- |
|
|
Accounts receivable, net |
|
|
2,890,000 |
|
|
2,767,000 |
|
|
Inventories |
|
|
389,000 |
|
|
442,000 |
|
|
Prepaid expenses and other |
|
|
394,000 |
|
|
238,000 |
|
|
Total Current Assets |
|
|
16,870,000 |
|
|
14,499,000 |
|
|
|
|
|
|
|
|
|
|
|
Other Assets: |
|
|
|
|
|
|
|
|
Property and equipment, net |
|
|
927,000 |
|
|
1,054,000 |
|
|
Other |
|
|
42,000 |
|
|
40,000 |
|
|
|
|
|
|
|
|
|
|
|
Total Assets |
|
$ |
17,839,000 |
|
$ |
15,593,000 |
|
|
|
|
|
|
|
|
|
|
|
|
|
|
|
|
|
|
|
|
|
|
|
|
|
|
|
|
|
LIABILITIES AND SHAREHOLDERS’ EQUITY |
|
|
|
|
|
|
|
|
Current Liabilities: |
|
|
|
|
|
|
|
|
Current maturities of long-term liabilities |
|
$ |
219,000 |
|
$ |
202,000 |
|
|
Accounts payable |
|
|
2,253,000 |
|
|
2,770,000 |
|
|
Accrued liabilities |
|
|
|
|
|
|
|
|
Retailer payments |
|
|
1,022,000 |
|
|
586,000 |
|
|
Compensation |
|
|
778,000 |
|
|
820,000 |
|
|
Legal |
|
|
257,000 |
|
|
365,000 |
|
|
Employee stock purchase plan |
|
|
131,000 |
|
|
65,000 |
|
|
Other commissions |
|
|
— |
|
|
1,742,000 |
|
|
Other |
|
|
389,000 |
|
|
395,000 |
|
|
Deferred revenue |
|
|
1,105,000 |
|
|
1,158,000 |
|
|
Total Current Liabilities |
|
|
6,154,000 |
|
|
8,103,000 |
|
|
|
|
|
|
|
|
|
|
|
Long-Term Liabilities, less current maturities |
|
|
— |
|
|
219,000 |
|
|
|
|
|
|
|
|
|
|
|
Commitments and Contingencies |
|
|
— |
|
|
— |
|
|
|
|
|
|
|
|
|
|
|
Shareholders’ Equity: |
|
|
|
|
|
|
|
|
Common stock, par value $.01: |
|
|
|
|
|
|
|
|
Authorized shares – 40,000,000 |
|
|
|
|
|
|
|
|
Issued and outstanding shares – 15,181,000 in 2009 and 15,069,000 in 2008 |
|
|
152,000 |
|
|
151,000 |
|
|
Additional paid-in capital |
|
|
32,578,000 |
|
|
31,881,000 |
|
|
Accumulated deficit |
|
|
(21,045,000 |
) |
|
(24,761,000 |
) |
|
Total Shareholders’ Equity |
|
|
11,685,000 |
|
|
7,271,000 |
|
|
|
|
|
|
|
|
|
|
|
Total Liabilities and Shareholders’ Equity |
|
$ |
17,839,000 |
|
$ |
15,593,000 |
|
See accompanying notes to financial statements.
25
Insignia Systems, Inc.
STATEMENTS OF OPERATIONS
|
|
|
|
|
|
|
|
|
|
|
|
|
Year Ended December 31 |
|
2009 |
|
2008 |
|
2007 |
|
|||
|
Services revenues |
|
$ |
26,666,000 |
|
$ |
28,931,000 |
|
$ |
21,589,000 |
|
|
Products revenues |
|
|
2,104,000 |
|
|
2,475,000 |
|
|
2,842,000 |
|
|
Total Net Sales |
|
|
28,770,000 |
|
|
31,406,000 |
|
|
24,431,000 |
|
|
|
|
|
|
|
|
|
|
|
|
|
|
Cost of services |
|
|
12,014,000 |
|
|
12,929,000 |
|
|
9,170,000 |
|
|
Cost of goods sold |
|
|
1,415,000 |
|
|
1,593,000 |
|
|
1,719,000 |
|
|
Total Cost of Sales |
|
|
13,429,000 |
|
|
14,522,000 |
|
|
10,889,000 |
|
|
Gross Profit |
|
|
15,341,000 |
|
|
16,884,000 |
|
|
13,542,000 |
|
|
|
|
|
|
|
|
|
|
|
|
|
|
Operating Expenses: |
|
|
|
|
|
|
|
|
|
|
|
Selling |
|
|
6,632,000 |
|
|
8,521,000 |
|
|
5,664,000 |
|
|
Marketing |
|
|
1,540,000 |
|
|
1,602,000 |
|
|
1,412,000 |
|
|
Warrant expense |
|
|
— |
|
|
— |
|
|
1,521,000 |
|
|
General and administrative |
|
|
4,811,000 |
|
|
7,060,000 |
|
|
4,864,000 |
|
|
Insurance settlement proceeds |
|
|
(1,387,000 |
) |
|
— |
|
|
— |
|
|
Total Operating Expenses |
|
|
11,596,000 |
|
|
17,183,000 |
|
|
13,461,000 |
|
|
Operating Income (Loss) |
|
|
3,745,000 |
|
|
(299,000 |
) |
|
81,000 |
|
|
|
|
|
|
|
|
|
|
|
|
|
|
Other Income (Expense): |
|
|
|
|
|
|
|
|
|
|
|
Interest income |
|
|
127,000 |
|
|
234,000 |
|
|
247,000 |
|
|
Interest expense |
|
|
(40,000 |
) |
|
(57,000 |
) |
|
(95,000 |
) |
|
Other income (expense), net |
|
|
(1,000 |
) |
|
3,000 |
|
|
1,000 |
|
|
Total Other Income |
|
|
86,000 |
|
|
180,000 |
|
|
153,000 |
|
|
Income (Loss) Before Taxes |
|
|
3,831,000 |
|
|
(119,000 |
) |
|
234,000 |
|
|
Income tax (expense) benefit |
|
|
(115,000 |
) |
|
(2,138,000 |
) |
|
2,109,000 |
|
|
Net Income (Loss) |
|
$ |
3,716,000 |
|
$ |
(2,257,000 |
) |
$ |
2,343,000 |
|
|
|
|
|
|
|
|
|
|
|
|
|
|
Net income (loss) per share: |
|
|
|
|
|
|
|
|
|
|
|
Basic |
|
$ |
0.25 |
|
$ |
(0.15 |
) |
$ |
0.15 |
|
|
Diluted |
|
$ |
0.23 |
|
$ |
(0.15 |
) |
$ |
0.14 |
|
|
|
|
|
|
|
|
|
|
|
|
|
|
Shares used in calculation of net income (loss) per share: |
|
|
|
|
|
|
|
|
|
|
|
Basic |
|
|
15,139,000 |
|
|
15,484,000 |
|
|
15,411,000 |
|
|
Diluted |
|
|
15,846,000 |
|
|
15,484,000 |
|
|
16,186,000 |
|
See accompanying notes to financial statements.
26
Insignia Systems, Inc.
STATEMENTS OF SHAREHOLDERS’ EQUITY
|
|
|
|
|
|
|
|
|
|
|
|
|
|
|
|
|
|
|
|
|
Common Stock |
|
Additional |
|
Accumulated |
|
|
|
|||||||
|
|
|
Shares |
|
Amount |
|
Capital |
|
Deficit |
|
Total |
|
|||||
|
|
|
|
|
|
|
|
|
|
|
|
|
|
|
|
|
|
|
Balance at January 1, 2007 |
|
|
15,152,000 |
|
$ |
152,000 |
|
$ |
29,557,000 |
|
$ |
(24,847,000 |
) |
$ |
4,862,000 |
|
|
Issuance of common stock, net |
|
|
398,000 |
|
|
4,000 |
|
|
471,000 |
|
|
— |
|
|
475,000 |
|
|
Value of stock-based compensation |
|
|
— |
|
|
— |
|
|
476,000 |
|
|
— |
|
|
476,000 |
|
|
Value of warrants issued for services |
|
|
— |
|
|
— |
|
|
1,521,000 |
|
|
— |
|
|
1,521,000 |
|
|
Net income |
|
|
— |
|
|
— |
|
|
— |
|
|
2,343,000 |
|
|
2,343,000 |
|
|
|
|
|
|
|
|
|
|
|
|
|
|
|
|
|
|
|
|
Balance at December 31, 2007 |
|
|
15,550,000 |
|
|
156,000 |
|
|
32,025,000 |
|
|
(22,504,000 |
) |
|
9,677,000 |
|
|
Issuance of common stock, net |
|
|
44,000 |
|
|
— |
|
|
98,000 |
|
|
— |
|
|
98,000 |
|
|
Repurchase of common stock, net |
|
|
(525,000 |
) |
|
(5,000 |
) |
|
(733,000 |
) |
|
— |
|
|
(738,000 |
) |
|
Value of stock-based compensation |
|
|
— |
|
|
— |
|
|
491,000 |
|
|
— |
|
|
491,000 |
|
|
Net loss |
|
|
— |
|
|
— |
|
|
— |
|
|
(2,257,000 |
) |
|
(2,257,000 |
) |
|
|
|
|
|
|
|
|
|
|
|
|||||||
|
Balance at December 31, 2008 |
|
|
15,069,000 |
|
|
151,000 |
|
|
31,881,000 |
|
|
(24,761,000 |
) |
|
7,271,000 |
|
|
Issuance of common stock, net |
|
|
112,000 |
|
|
1,000 |
|
|
160,000 |
|
|
— |
|
|
161,000 |
|
|
Value of stock-based compensation |
|
|
— |
|
|
— |
|
|
537,000 |
|
|
— |
|
|
537,000 |
|
|
Net income |
|
|
— |
|
|
— |
|
|
— |
|
|
3,716,000 |
|
|
3,716,000 |
|
|
|
|
|
|
|
|
|
|
|
||||||||
|
Balance at December 31, 2009 |
|
|
15,181,000 |
|
$ |
152,000 |
|
$ |
32,578,000 |
|
$ |
(21,045,000 |
) |
$ |
11,685,000 |
|
See accompanying notes to financial statements.
27
Insignia Systems, Inc.
STATEMENTS OF CASH FLOWS
|
|
|
|
|
|
|
|
|
|
|
|
|
Year Ended December 31 |
|
2009 |
|
2008 |
|
2007 |
|
|||
|
Operating Activities: |
|
|
|
|
|
|
|
|
|
|
|
Net income (loss) |
|
$ |
3,716,000 |
|
$ |
(2,257,000 |
) |
$ |
2,343,000 |
|
|
Adjustments to reconcile net income (loss) to net cash provided by operating activities: |
|
|
|
|
|
|
|
|
|
|
|
Depreciation and amortization |
|
|
405,000 |
|
|
370,000 |
|
|
266,000 |
|
|
Deferred income tax expense (benefit) |
|
|
— |
|
|
2,131,000 |
|
|
(2,131,000 |
) |
|
Stock-based compensation |
|
|
537,000 |
|
|
491,000 |
|
|
476,000 |
|
|
Warrant expense |
|
|
— |
|
|
— |
|
|
1,521,000 |
|
|
Changes in operating assets and liabilities: |
|
|
|
|
|
|
|
|
|
|
|
Accounts receivable |
|
|
(123,000 |
) |
|
(612,000 |
) |
|
770,000 |
|
|
Inventories |
|
|
53,000 |
|
|
(45,000 |
) |
|
55,000 |
|
|
Prepaid expenses and other |
|
|
(158,000 |
) |
|
611,000 |
|
|
55,000 |
|
|
Accounts payable |
|
|
(496,000 |
) |
|
1,401,000 |
|
|
24,000 |
|
|
Accrued liabilities |
|
|
(1,417,000 |
) |
|
2,672,000 |
|
|
476,000 |
|
|
Deferred revenue |
|
|
(53,000 |
) |
|
853,000 |
|
|
(131,000 |
) |
|
Net cash provided by operating activities |
|
|
2,464,000 |
|
|
5,615,000 |
|
|
3,724,000 |
|
|
|
|
|
|
|
|
|
|
|
|
|
|
Investing Activities: |
|
|
|
|
|
|
|
|
|
|
|
Purchases of property and equipment |
|
|
(278,000 |
) |
|
(1,049,000 |
) |
|
(164,000 |
) |
|
Purchases of investments |
|
|
(6,300,000 |
) |
|
— |
|
|
— |
|
|
Proceeds from sale of investments |
|
|
1,900,000 |
|
|
— |
|
|
— |
|
|
Net cash used in investing activities |
|
|
(4,678,000 |
) |
|
(1,049,000 |
) |
|
(164,000 |
) |
|
|
|
|
|
|
|
|
|
|
|
|
|
Financing Activities: |
|
|
|
|
|
|
|
|
|
|
|
Net change in line of credit |
|
|
— |
|
|
— |
|
|
(186,000 |
) |
|
Payment of long-term liabilities |
|
|
(202,000 |
) |
|
(267,000 |
) |
|
(241,000 |
) |
|
Proceeds from issuance of common stock, net |
|
|
161,000 |
|
|
98,000 |
|
|
475,000 |
|
|
Repurchase of common stock, net |
|
|
— |
|
|
(738,000 |
) |
|
— |
|
|
Net cash provided by (used in) financing activities |
|
|
(41,000 |
) |
|
(907,000 |
) |
|
48,000 |
|
|
Increase (decrease) in cash and cash equivalents |
|
|
(2,255,000 |
) |
|
3,659,000 |
|
|
3,608,000 |
|
|
Cash and cash equivalents at beginning of year |
|
|
11,052,000 |
|
|
7,393,000 |
|
|
3,785,000 |
|
|
Cash and cash equivalents at end of year |
|
$ |
8,797,000 |
|
$ |
11,052,000 |
|
$ |
7,393,000 |
|
|
|
|
|
|
|
|
|
|
|
|
|
|
Supplemental disclosures for cash flow information: |
|
|
|
|
|
|
|
|
|
|
|
Cash paid during the year for interest |
|
$ |
72,000 |
|
$ |
17,000 |
|
$ |
53,000 |
|
|
Cash paid during the year for income taxes |
|
$ |
67,000 |
|
$ |
8,000 |
|
$ |
60,000 |
|
See accompanying notes to financial statements.
28
Insignia
Systems, Inc.
NOTES TO FINANCIAL STATEMENTS
|
|
|
|
1. |
Summary of Significant Accounting Policies. |
|
|
Description of Business. Insignia Systems, Inc. (the “Company”) markets in-store advertising products, programs and services to retailers and consumer packaged goods manufacturers. The Company’s products include the Insignia Point-of-Purchase Services (POPS) in-store advertising program, thermal sign card supplies for the Company’s SIGNright and Impulse systems, Stylus software and laser printable cardstock and label supplies. |
|
|
|
|
|
Revenue Recognition. Revenues are recognized by the Company when persuasive evidence of an arrangement exists, shipment has occurred, the price is fixed, and collectability is reasonably assured. The Company recognizes revenue from Insignia POPSigns ratably over the period of service. The Company recognizes revenue related to equipment, software and sign card sales at the time the products are shipped to customers. Revenue associated with maintenance agreements is recognized ratably over the life of the contract. Revenue that has been billed and not yet earned is reflected as deferred revenue on the Balance Sheet. |
|
|
|
|
|
Cash and Cash Equivalents. The Company considers all highly liquid investments with an original maturity date of three months or less to be cash equivalents when purchased. Cash equivalents are stated at cost, which approximates fair value. At December 31, 2009, $2,733,000 was invested in an overnight repurchase account and $6,400,000 was invested in certificates of deposit. At December 31, 2008, $213,000 was invested in an overnight repurchase account, $7,000,000 was invested in certificates of deposit and $3,858,000 was invested in a short-term money market account. The balances in cash accounts, at times, may exceed federally insured limits. The Company has not experienced any losses in such accounts and believes it is not exposed to any significant credit risk on cash and cash equivalents. Bank certificates of deposit at December 31, 2009 and 2008, were held at various institutions with amounts at each institution at or below the $250,000 insured limit of the Federal Deposit Insurance Corporation. |
|
|
|
|
|
Short-Term Investments. Short-term investments consist of short-term bank certificates of deposit with original maturities of between three and twelve months. These short-term investments are classified as held to maturity and are valued at cost which approximates fair value. These investments are considered Level 2 investments in the fair value hierarchy. Bank certificates of deposit at December 31, 2009, were held at various institutions with amounts at each institution at or below the $250,000 insured limit of the Federal Deposit Insurance Corporation. |
|
|
|
|
|
Fair Value of Financial Instruments. The financial statements include the following financial instruments: cash and cash equivalents, short-term investments, accounts receivable, accounts payable and long-term liabilities. The fair value of the long-term liabilities is estimated based on the use of discounted cash flow analysis using interest rates for other debt offered to the Company. The Company estimates the carrying value of the long-term liabilities approximates fair value. All other financial instruments approximate fair value because of the short-term nature of these instruments. |
|
|
|
|
|
Accounts Receivable. The majority of the Company’s accounts receivable is due from companies in the consumer packaged goods industry. Credit is extended based on evaluation of a customer’s financial condition and, generally, collateral is not required. Accounts receivable are due within 30-60 days and are stated at amounts due from customers net of an allowance for doubtful accounts. Accounts receivable outstanding longer than the contractual payment terms are considered past due. The Company determines its allowance by considering a number of factors, including the length of time trade accounts receivable are past due, the Company’s previous loss history, the customer’s current ability to pay its obligation to the Company, and the condition of the general economy and the industry as a whole. The Company writes-off accounts receivable when they become uncollectible, and payments subsequently received on such receivables are credited to the allowance for doubtful accounts. |
29
Changes in the Company’s allowance for doubtful accounts are as follows:
|
|
|
|
|
|
|
|
|
|
December 31 |
|
2009 |
|
2008 |
|
||
|
Beginning balance |
|
$ |
7,000 |
|
$ |
10,000 |
|
|
Bad debt provision |
|
|
9,000 |
|
|
— |
|
|
Accounts written-off |
|
|
(8,000 |
) |
|
(3,000 |
) |
|
|
|||||||
|
Ending balance |
|
$ |
8,000 |
|
$ |
7,000 |
|
|
|
|
|
|
Inventories. Inventories are primarily comprised of parts and supplies for Impulse and SIGNright machines, sign cards, and rollstock. Inventory is valued at the lower of cost or market using the first-in, first-out (FIFO) method, and consists of the following: |
|
|
|
|
|
|
|
|
|
|
December 31 |
|
2009 |
|
2008 |
|
||
|
Raw materials |
|
$ |
57,000 |
|
$ |
107,000 |
|
|
Work-in-process |
|
|
52,000 |
|
|
64,000 |
|
|
Finished goods |
|
|
280,000 |
|
|
271,000 |
|
|
|
|
$ |
389,000 |
|
$ |
442,000 |
|
|
|
|
|
|
Property and Equipment. Property and equipment is recorded at cost. Significant additions or improvements extending asset lives are capitalized, while repairs and maintenance are charged to expense when incurred. Depreciation is provided in amounts sufficient to relate the cost of assets to operations over their estimated useful lives. The straight-line method of depreciation is used for financial reporting purposes and accelerated methods are used for tax purposes. Estimated useful lives of the assets are as follows: |
|
|
|
|
Production tooling |
1-3 years |
|
Machinery and equipment |
5 years |
|
Office furniture and fixtures |
3 years |
|
Computer equipment and software |
3 years |
|
|
|
|
|
Leasehold improvements are amortized over the shorter of the remaining term of the lease or estimated life of the asset. |
|
|
|
|
|
Impairment of Long-Lived Assets. The Company records impairment losses on long-lived assets used in operations when indicators of impairment are present and the undiscounted cash flows estimated to be generated by those assets are less than the assets’ carrying amount. Impaired assets are then recorded at their estimated fair market value. There were no impairments during the years ended December 31, 2009, 2008 and 2007. |
|
|
|
|
|
Income Taxes. Income taxes are accounted for under the liability method. Deferred income taxes are provided for temporary differences between the financial reporting and tax basis of assets and liabilities. Deferred taxes are reduced by a valuation allowance when, in the opinion of management, it is more likely than not that some portion or all of the deferred tax asset will not be realized. Deferred tax assets and liabilities are adjusted for the effects of changes in tax laws and rates on the date of the enactment. It is the Company’s policy to provide for uncertain tax positions and the related interest and penalties based upon management’s assessment of whether a tax benefit is more likely than not to be sustained upon examination by tax authorities. |
30
|
|
|
|
|
Stock-Based Compensation. The Company measures and recognizes compensation expense for all stock-based payments at fair value. We use the Black-Scholes option pricing model to determine the weighted average fair value of options and employee stock purchase plan rights. The determination of fair value of share-based payment awards on the date of grant using an option-pricing model is affected by our stock price as well as by assumptions regarding a number of complex and subjective variables. These variables include, but are not limited to, the expected stock price volatility over the term of the awards, and actual and projected employee stock option exercise behaviors. |
|
|
|
|
|
The expected terms of the options and employee stock purchase plan rights are based on evaluations of historical and expected future employee exercise behavior. The risk-free interest rate is based on the U.S. Treasury rates at the date of grant with maturity dates approximately equal to the expected life at grant date. Volatility is based on historical and expected future volatility of the Company’s stock. The Company has not historically issued any dividends and does not expect to in the future. Forfeitures are estimated at the time of the grant and revised, if necessary, in subsequent periods if actual forfeitures differ from estimates. |
|
|
|
|
|
If factors change and we employ different assumptions in the valuation of grants in future periods, the compensation expense that we record may differ significantly from what we have recorded in the current periods. |
|
|
|
|
|
Advertising Costs. Advertising costs are charged to operations as incurred. Advertising expenses were approximately $11,000, $11,000 and $9,000 during the years ended December 31, 2009, 2008 and 2007. |
|
|
|
|
|
Net Income (Loss) Per Share. Basic net income (loss) per share is computed by dividing net income (loss) by the weighted average shares outstanding and excludes any dilutive effects of options, warrants and convertible securities. Diluted net income per share gives effect to all diluted potential common shares outstanding during the year. Options and warrants to purchase approximately 1,852,000, 2,186,000 and 1,396,000 shares of common stock with weighted average exercise prices of $4.53, $4.89 and $5.81 were outstanding at December 31, 2009, 2008 and 2007 and were not included in the computation of common stock equivalents because their exercise prices were higher than the average fair market value of the common shares during the reporting periods. |
|
|
|
|
|
For the year ended December 31, 2008, the effect of options and warrants was anti-dilutive due to the net loss incurred during the period. Had net income been achieved, approximately 381,000 of common stock equivalents would have been included in the computation of diluted net income per share for the year ended December 31, 2008. |
|
|
|
|
|
Weighted average common share outstanding for the years ended December 31, 2009, 2008 and 2007 were as follows: |
|
|
|
|
|
|
|
|
|
|
|
|
|
Year ended December 31 |
|
|
2009 |
|
|
2008 |
|
|
2007 |
|
|
Denominator for basic net income (loss) per share – weighted average shares |
|
|
15,139,000 |
|
|
15,484,000 |
|
|
15,411,000 |
|
|
|
|
|
|
|
|
|
|
|
|
|
|
Effect of dilutive securities: |
|
|
|
|
|
|
|
|
|
|
|
Stock options and warrants |
|
|
707,000 |
|
|
— |
|
|
775,000 |
|
|
Denominator for diluted net income (loss) per share – adjusted weighted average shares |
|
|
15,846,000 |
|
|
15,484,000 |
|
|
16,186,000 |
|
|
|
|
|
|
Use of Estimates. The preparation of financial statements in conformity with accounting principles generally accepted in the United States requires management to make estimates and assumptions that affect the amounts reported in the financial statements and accompanying notes. Actual results could differ from these estimates. |
31
|
|
|
|
|
New Accounting Pronouncements. In June 2009, the Financial Accounting Standards Board (FASB) issued guidance that established the FASB Accounting Standards Codification™ (FASB ASC) as the source of authoritative accounting principles recognized by the FASB to be applied to nongovernmental entities in the preparation of financials statements in conformity with generally accepted accounting principles (GAAP). The Codification is a reorganization and compilation of all then-existing authoritative GAAP for nongovernmental entities, except for guidance issued by the Securities and Exchange Commission. Use of the new Codification is effective for interim and annual periods ending after September 15, 2009. Adoption of the Codification has not impacted the financial results of the Company. |
|
|
|
|
|
In May 2009, FASB ASC 855, Subsequent Events was issued. This statement requires an entity to evaluate events that occur after the balance sheet date but before financial statements are issued or are available to be issued. The new guidance sets forth the period after the balance sheet date during which management of an entity should evaluate events or transactions that may occur for potential recognition or disclosure in the financial statements, the circumstances under which an entity should recognize events or transactions occurring after the balance sheet date in its financials statements, and the disclosures that an entity should make about events or transactions that occurred after the balance sheet date. The Company has adopted the new guidance that was effective for financial statements issued for interim and annual periods ending after June 15, 2009 and the adoption did not have a material impact on our financial statements. In August 2009, the FASB issued Accounting Standards Update (ASU) No. 2009-05, Fair Value Measurements and Disclosures Topic 820 “Improving Disclosures about Fair Value Measurements”. The updated guidance affirms that the objective of fair value when the market for an asset is not active is the price that would be received to sell the asset in an orderly transaction and clarifies and includes additional factors for determining there has been a significant decrease in market activity for an asset when the market for that asset is not active. It also requires an entity to base its conclusion about whether a transaction was not orderly on the weight of the evidence. This guidance was effective September 1, 2009 and the adoption did not have a material impact on our financial statements. In December 2009, the FASB issued ASU No. 2010-06, Fair Value Measurements and Disclosures Topic 820 “Improving Disclosures about Fair Value Measurements”. This ASU requires some new disclosures and clarifies some existing disclosure requirements about fair value measurement as set forth in Codification Subtopic 820-10. The FASB’s objective is to improve these disclosures and, thus, increase the transparency in financial reporting. Some of the new disclosures are effective for reporting periods beginning after December 15, 2009, with the remaining new disclosures effective for reporting periods beginning after December 15, 2010. The adoption of this ASU will not have a material impact on our financial statements. |
|
|
|
|
2. |
Property and Equipment. Property and equipment consists of the following at December 31: |
|
|
|
|
|
|
|
|
|
|
|
|
2009 |
|
2008 |
|
||
|
Property and Equipment: |
|
|
|
|
|
|
|
|
Production tooling, machinery and equipment |
|
$ |
2,226,000 |
|
$ |
2,115,000 |
|
|
Office furniture and fixtures |
|
|
255,000 |
|
|
250,000 |
|
|
Computer equipment and software |
|
|
758,000 |
|
|
719,000 |
|
|
Web site |
|
|
38,000 |
|
|
38,000 |
|
|
Leasehold improvements |
|
|
322,000 |
|
|
255,000 |
|
|
|
|
|
3,599,000 |
|
|
3,377,000 |
|
|
Accumulated depreciation and amortization |
|
|
(2,672,000 |
) |
|
(2,323,000 |
) |
|
Net Property and Equipment |
|
$ |
927,000 |
|
$ |
1,054,000 |
|
|
|
|
|
3. |
Long-Term Liabilities. In prior periods, the Company reached an agreement with a retailer for the deferred payment of certain obligations on an interest-free basis. These obligations are recorded as long-term liabilities with an imputed annual interest rate of 10.0%. |
|
|
|
|
|
|
|
|
|
|
December 31 |
|
2009 |
|
2008 |
|
||
|
Uncollateralized three year liability, payable in monthly installments |
|
$ |
— |
|
$ |
23,000 |
|
|
Uncollateralized liability, due December 31, 2009 |
|
|
— |
|
|
179,000 |
|
|
Uncollateralized liability, due December 31, 2010 |
|
|
219,000 |
|
|
219,000 |
|
|
Total |
|
|
219,000 |
|
|
421,000 |
|
|
Less current maturities |
|
|
(219,000 |
) |
|
(202,000 |
) |
|
|
|
$ |
— |
|
$ |
219,000 |
|
32
|
|
|
|
4. |
Commitments and Contingencies. |
|
|
Operating Leases. The Company conducts its operations in a leased facility. In October 2007 the Company entered into agreements to terminate its previous facility lease and sublease effective July 31, 2008. On March 27, 2008, the Company entered into an operating lease for its current facility which is in effect from August 2008 through February 2016. The Company also leased equipment under operating lease agreements effective through September 2009. Rent expense under all of these leases, net of sub-lease rental income, was approximately $451,000, $546,000 and $527,000 for the years ended December 31, 2009, 2008 and 2007. |
|
|
|
|
|
Minimum future lease obligations under these leases, excluding operating costs, are approximately as follows for the years ending December 31: |
|
|
|
|
|
|
|
|
|
2010 |
|
$ |
446,000 |
|
|
|
2011 |
|
|
456,000 |
|
|
|
2012 |
|
|
465,000 |
|
|
|
2013 |
|
|
474,000 |
|
|
|
2014 |
|
|
484,000 |
|
|
|
Thereafter |
|
|
574,000 |
|
|
|
|
|
|
Legal. In August 2000, News America Marketing In-Store, Inc. (News America), brought suit against the Company in U.S. District Court in New York, New York. The case was settled in November 2002. The terms of the settlement agreement are confidential. The settlement did not impact the Company’s operating results. |
|
|
|
|
|
In October 2003, News America brought suit against the Company in U.S. District Court in New York, New York, alleging that the Company has engaged in deceptive acts and practices, has interfered with existing business relationships with retailers and prospective economic advantage, and has engaged in unfair competition. The suit sought unspecified damages and injunctive relief. In February 2007 the U.S. District Court in New York transferred this action to Minnesota where the claims became part of the lawsuit the Company filed against News America and Albertson’s Inc. in 2004 (described below), and the New York action was subsequently dismissed. |
|
|
|
|
|
On September 23, 2004, the Company brought suit against News America and Albertson’s Inc. (Albertson’s) in Federal District Court in Minneapolis, Minnesota, for violations of federal and state antitrust and false advertising laws, alleging that News America has acquired and maintained monopoly power through various wrongful acts designed to harm the Company in the in-store advertising and promotion products and services market. The suit seeks injunctive relief sufficient to prevent further antitrust injury and an award of treble damages to be determined at trial for the harm caused to the Company. On June 30, 2006 the Court denied the motions of News America and Albertson’s to dismiss the suit. On September 20, 2006, the State of Minnesota through its Attorney General intervened as a co- plaintiff in the business disparagement portion of the Minnesota case. In December 2006, News America filed counterclaims in the Minnesota case that included claims similar to those in its New York action against Insignia and one of its officers, plus claims for damages for two alleged incidents of libel and slander. On February 4, 2008, the Court approved a consent decree entered into by News America and the State of Minnesota under which News America agreed to not violate Minnesota’s statutes prohibiting commercial disparagement. On July 29, 2008, the Company and Albertson’s entered into a settlement agreement and mutual release, in which they each agreed to release all claims against the other, and the Company agreed to dismiss its lawsuit against Albertson’s. On September 30, 2009, the Court ruled on motions by both the Company and News America for Summary Judgment. The Court awarded Summary Judgment to the Company and one of its executive officers on all of News America’s counterclaims and third-party claims. The Court also denied News America’s Motion for Summary Judgment on the Company’s claims against News America other than granting News America’s uncontested motion on one claim in the Amended Complaint related to retailers. The Court’s rulings set the stage for a trial on the Company’s antitrust and unfair-competition claims against News America, and a settlement conference is currently scheduled for April 12, 2010. Assuming the case does not settle at that time, the Company will request that the Court set the case for trial as soon as possible after April 12th. |
33
|
|
|
|
|
The Company filed claims in December 2006 and January 2007 with its director’s and officer’s liability and general liability insurers related to the defense costs and insurance coverage for claims asserted against the Company and one of its officers in News America’s counterclaims. On August 9, 2007, the Company filed a complaint against the insurers in Hennepin County District Court, State of Minnesota requesting a declaratory judgment that the insurers owed the Company and its officer such defense costs and insurance coverage. In December 2007, the Company settled its claim against one of the insurers. Also, in March 2009, the Company settled with the other insurer and received a payment of $1,387,000 as part of the settlement. The Company recorded the payment in general and administrative expenses for the quarter ended March 31, 2009, and the litigation with the insurers is now concluded. |
|
|
|
|
|
Management currently expects the amount of legal fees and expenses that will be incurred in connection with the ongoing lawsuit against News America to be significant throughout 2010 and possibly future years. During the year ended December 31, 2009, the Company incurred legal fees of $1,753,000 related to the News America litigation which were offset by the $1,387,000 payment received from settlement of its claim against one of its insurers during the first quarter of 2009. Legal fees and expenses are expensed as incurred and are included in general and administrative expenses in the statements of operations. |
|
|
|
|
|
The Company is subject to various other legal proceedings in the normal course of business. Management believes the outcome of these proceedings will not have a material adverse effect on the Company’s financial position or results of operations. |
|
|
|
|
|
Retailer Agreements. The Company has contracts in the normal course of business with various retailers, some of which provide for fixed or store-based payments rather than sign placement-based payments. During the years ended December 31, 2009, 2008 and 2007, the Company incurred $3,017,000, $4,935,000 and $3,730,000 of costs related to fixed and store-based payments. The amounts were recorded in Cost of Services in the Statements of Operations. |
|
|
|
|
|
Aggregate commitment amounts under agreements with retailers are approximately as follows for the years ending December 31: |
|
|
|
|
|
|
|
|
|
|
|
|
2010 |
|
$ |
3,141,000 |
|
|
|
2011 |
|
|
350,000 |
|
|
|
2012 |
|
|
151,000 |
|
|
|
2013 |
|
|
18,000 |
|
|
|
|
|
|
|
|
|
|
|
|
|
On an ongoing basis the Company negotiates renewals of various retailer agreements. Upon the completion of future contract renewals, the annual commitment amounts for 2010 and thereafter could be in excess of the amounts above. |
|
|
|
|
5. |
Shareholders’ Equity. |
|
|
Private Placements and Warrants. On July 2, 2007, the Company issued a warrant to purchase 800,000 shares of the Company’s common stock to Valassis Sales and Marketing Services, Inc. (“Valassis”) at a price of $4.04 for a term of five years. The warrant was issued for services to develop and expand the Company’s participating retailer network in conjunction with Amendment No. 2 to the Exclusive Reseller Agreement which defines the terms of the strategic sales alliance between the Company and Valassis. The Company recorded $1,521,000 of expense related to the fair value of the warrant. The Black-Scholes option-pricing model was used to estimate the fair value of the warrant using an expected life of 5 years, volatility of 40%, a dividend yield of 0% and a risk-free interest rate of 4.9%. At December 31, 2009, the entire warrant was outstanding and exercisable. |
34
|
|
|
|
|
Stock-Based Compensation. The Company’s stock-based compensation plans are administered by the Compensation Committee of the Board of Directors, which selects persons to receive awards and determines the number of shares subject to each award and the terms, conditions, performance measures and other provisions of the award. |
|
|
|
|
|
The following table summarizes the stock-based compensation expense which was recognized in the Statements of Operations for the years ended December 31, 2009, 2008 and 2007: |
|
|
|
|
|
|
|
|
|
|
|
|
|
|
|
Year ended December 31 |
|
2009 |
|
2008 |
|
2007 |
|
|||
|
|
Cost of sales |
|
$ |
103,000 |
|
$ |
86,000 |
|
$ |
91,000 |
|
|
|
Selling |
|
|
120,000 |
|
|
95,000 |
|
|
80,000 |
|
|
|
Marketing |
|
|
63,000 |
|
|
65,000 |
|
|
58,000 |
|
|
|
General and administrative |
|
|
251,000 |
|
|
245,000 |
|
|
247,000 |
|
|
|
|
|
$ |
537,000 |
|
$ |
491,000 |
|
$ |
476,000 |
|
|
|
|
|
|
The Company uses the Black-Scholes option-pricing model to estimate fair value of stock-based awards with the following weighted average assumptions: |
|
|
|
|
|
|
|
|
|
|
|
|
2009 |
|
2008 |
|
2007 |
|
|
|
Stock Options: |
|
|
|
|
|
|
|
|
Expected life (years) |
3.57 |
|
3.38 |
|
3.92 |
|
|
|
Expected volatility |
77 |
% |
75 |
% |
40 |
% |
|
|
Dividend yield |
0 |
% |
0 |
% |
0 |
% |
|
|
Risk-free interest rate |
1.31 |
% |
2.67 |
% |
4.77 |
% |
|
|
|
|
|
The Company uses the straight-line attribution method to recognize expense for unvested options. The amount of share-based compensation recognized during a period is based on the value of the awards that are ultimately expected to vest. Forfeitures are estimated at the time of grant and revised, if necessary, in subsequent periods if actual forfeitures differ from those estimates. The Company will re-evaluate the forfeiture rate annually and adjust it as necessary. |
|
|
|
|
|
As of December 31, 2009, there was $331,000 of total unrecognized compensation costs related to the outstanding stock options which is expected to be recognized over a weighted average period of 1.0 years. |
|
|
|
|
|
Stock Options. Prior to 2003 the Company had a stock option plan (the “1990 Plan”) for its employees and directors under which substantially all of the shares reserved for issuance had been issued. During May 2003, the Company’s shareholders approved the 2003 Incentive Stock Option Plan (the “2003 Plan”) and an aggregate of 350,000 shares of common stock were reserved for issuance. The shareholders approved an additional 650,000 shares for issuance in May of 2004, an additional 625,000 shares for issuance in May of 2005, an additional 250,000 for issuance in May of 2007, an additional 500,000 for issuance in May of 2008 and an additional 250,000 for issuance in May of 2009. The 2003 Plan replaced the 1990 Plan. Options granted under the 1990 Plan will remain in effect until they are exercised or expire according to their terms. All current option grants are made under the 2003 Plan. |
|
|
|
|
|
Under the terms of the stock option plans, the Company grants incentive or non-qualified stock options to employees and directors generally at an exercise price at or above 100% of fair market value at the close of business on the date of grant. The stock options expire five or ten years after the date of grant and generally vest over three years. |
35
|
|
|
|
|
The following table summarizes activity under the option plans: |
|
|
|
|
|
|
|
|
|
|
|
|
|
|
|
|
|
|
|
|
Plan Shares |
|
Plan |
|
Weighted |
|
Aggregate |
|
||||
|
|
|
|
|
|
|
|
|
|
|
|
|
|
|
|
|
|
Balance at January 1, 2007 |
|
|
201,200 |
|
|
2,047,098 |
|
$ |
3.59 |
|
|
|
|
|
|
Reserved |
|
|
250,000 |
|
|
— |
|
|
— |
|
|
|
|
|
|
Granted |
|
|
(513,100 |
) |
|
513,100 |
|
|
3.74 |
|
|
|
|
|
|
Exercised |
|
|
— |
|
|
(142,616 |
) |
|
1.23 |
|
$ |
478,000 |
|
|
|
Cancelled – 2003 Plan |
|
|
96,968 |
|
|
(96,968 |
) |
|
1.60 |
|
|
|
|
|
|
Cancelled – 1990 Plan |
|
|
— |
|
|
(66,400 |
) |
|
8.17 |
|
|
|
|
|
|
|
|
|
|
|
|
|
|
|
|
|
|
|
|
|
|
Balance at December 31, 2007 |
|
|
35,068 |
|
|
2,254,214 |
|
|
3.73 |
|
|
|
|
|
|
Reserved |
|
|
500,000 |
|
|
— |
|
|
— |
|
|
|
|
|
|
Granted |
|
|
(321,000 |
) |
|
321,000 |
|
|
1.93 |
|
|
|
|
|
|
Exercised |
|
|
— |
|
|
(4,367 |
) |
|
1.24 |
|
|
3,000 |
|
|
|
Cancelled – 2003 Plan |
|
|
49,936 |
|
|
(49,936 |
) |
|
2.47 |
|
|
|
|
|
|
Cancelled – 1990 Plan |
|
|
— |
|
|
(23,200 |
) |
|
6.10 |
|
|
|
|
|
|
|
|
|
|
|
|
|
|
|
|
|
|
|
|
|
|
Balance at December 31, 2008 |
|
|
264,004 |
|
|
2,497,711 |
|
|
3.50 |
|
|
|
|
|
|
Reserved |
|
|
250,000 |
|
|
— |
|
|
— |
|
|
|
|
|
|
Granted |
|
|
(353,500 |
) |
|
353,500 |
|
|
2.88 |
|
|
|
|
|
|
Exercised |
|
|
— |
|
|
(51,866 |
) |
|
2.36 |
|
|
103,000 |
|
|
|
Cancelled – 2003 Plan |
|
|
1,101 |
|
|
(1,101 |
) |
|
3.88 |
|
|
|
|
|
|
Cancelled – 1990 Plan |
|
|
— |
|
|
(150,000 |
) |
|
8.35 |
|
|
|
|
|
|
|
|
|
|
|
|
|
|
|
|
|
|
|
|
|
|
Balance at December 31, 2009 |
|
|
161,605 |
|
|
2,648,244 |
|
|
3.17 |
|
|
|
|
|
|
|
|
|
|
|
|
The numbers of options exercisable under the option plans were: |
|||
|
|
|
December 31, 2007 |
|
1,372,417 |
|
|
|
December 31, 2008 |
|
1,751,837 |
|
|
|
December 31, 2009 |
|
1,988,202 |
|
|
|
|
|
The following table summarizes information about the stock options outstanding at December 31, 2009: |
|
|
|
|
|
|
|
|
|
|
|
|
|
|
|
|
|
|
|
|
|
|
|
Options Outstanding |
|
Options Exercisable |
||||||||||||
|
|
Ranges of |
|
Number |
|
Weighted |
|
Weighted |
|
Number |
|
Weighted |
||||||
|
|
|
|
|
|
|
|
|
|
|
|
|
|
|
|
|||
|
|
$0.58 – |
$0.84 |
|
56,867 |
|
5.86 years |
|
$ |
0.70 |
|
|
56,867 |
|
|
$ |
0.70 |
|
|
|
0.85 – |
1.20 |
|
647,267 |
|
6.01 years |
|
|
1.10 |
|
|
647,267 |
|
|
|
1.10 |
|
|
|
1.21 – |
1.92 |
|
541,834 |
|
6.62 years |
|
|
1.63 |
|
|
361,169 |
|
|
|
1.48 |
|
|
|
1.93 – |
2.80 |
|
373,047 |
|
8.81 years |
|
|
2.71 |
|
|
68,714 |
|
|
|
2.31 |
|
|
|
2.81 – |
3.79 |
|
525,400 |
|
7.47 years |
|
|
3.72 |
|
|
355,620 |
|
|
|
3.71 |
|
|
|
3.80 – |
4.97 |
|
71,230 |
|
1.10 years |
|
|
4.29 |
|
|
65,966 |
|
|
|
4.27 |
|
|
|
4.98 – |
7.44 |
|
112,899 |
|
2.92 years |
|
|
5.92 |
|
|
112,899 |
|
|
|
5.92 |
|
|
7.45 – |
11.36 |
|
319,700 |
|
2.05 years |
|
|
8.80 |
|
|
319,700 |
|
|
|
8.80 |
|
|
|
|
|
|
|
|
|
|
|
|
|
|
|
|
|
|
|
|
|
|
|
$0.58 – |
$11.36 |
|
2,648,244 |
|
6.07 years |
|
$ |
3.17 |
|
|
1,988,202 |
|
|
$ |
3.29 |
|
|
|
|
|
|
Options outstanding under the Option Plans expire at various dates during the period April 2010 through December 2019. Options outstanding at December 31, 2009 had a weighted average remaining life of 6.07 years and an aggregate intrinsic value of $5,683,000. Options exercisable at December 31, 2009 had a weighted average remaining life of 5.21 years and an aggregate intrinsic value of $4,387,000. The weighted average grant-date fair value of options granted during the years ended December 31, 2009, 2008 and 2007, were $1.55, $1.01 and $1.38. |
36
|
|
|
|
|
Employee Stock Purchase Plan. The Company has an Employee Stock Purchase Plan (the “Plan”) that enables employees to contribute up to 10% of their compensation toward the purchase of the Company’s common stock at 85% of market value. During the years ended December 31, 2009, 2008 and 2007, employees purchased 59,634, 39,914 and 164,040 shares under the Plan. At December 31, 2009, 346,029 shares are reserved for future employee purchases of common stock under the Plan. For the years ended December 31, 2009, 2008 and 2007, the Company recognized $77,000 $67,000 and $56,000 of stock- based compensation expense related to the Plan. |
|
|
|
|
|
Stock Repurchase Plan. On February 23, 2010, the Board of Directors authorized the repurchase of up to $2,000,000 of the Company’s common stock on or before January 31, 2011. The plan does not obligate the Company to repurchase any particular number of shares, and may be suspended at any time at the Company’s discretion. |
|
|
|
|
6. |
Income Taxes. The (provision) benefit for income taxes consists of the following: |
|
|
|
|
|
|
|
|
|
|
|
|
|
|
|
Year Ended December 31 |
|
2009 |
|
2008 |
|
2007 |
|
|||
|
|
Current taxes - Federal |
|
$ |
(86,000 |
) |
$ |
— |
|
$ |
(7,000 |
) |
|
|
Current taxes - State |
|
|
(29,000 |
) |
|
(7,000 |
) |
|
(15,000 |
) |
|
|
Deferred taxes - Federal |
|
|
(645,000 |
) |
|
(185,000 |
) |
|
(189,000 |
) |
|
|
Deferred taxes - State |
|
|
(56,000 |
) |
|
(16,000 |
) |
|
(17,000 |
) |
|
|
(Expense) benefit from adjustment of valuation allowance |
|
|
701,000 |
|
|
(1,930,000 |
) |
|
2,337,000 |
|
|
|
|
|
|
|
|
|
|
|
|
|
|
|
|
(Provision) benefit for income taxes |
|
$ |
(115,000 |
) |
$ |
(2,138,000 |
) |
$ |
2,109,000 |
|
|
|
|
|
|
Significant components of the deferred taxes are as follows: |
|
|
|
|
|
|
|
|
|
|
As of December 31 |
|
|
2009 |
|
|
2008 |
|
|
|
|||||||
|
Current Deferred Tax Assets: |
|
|
|
|
|
|
|
|
Accrued expenses |
|
$ |
189,000 |
|
$ |
99,000 |
|
|
Inventory reserve |
|
|
25,000 |
|
|
27,000 |
|
|
Other |
|
|
3,000 |
|
|
2,000 |
|
|
Current deferred tax assets before valuation allowance |
|
|
217,000 |
|
|
128,000 |
|
|
Less valuation allowance |
|
|
(217,000 |
) |
|
(128,000 |
) |
|
|
|||||||
|
Current deferred tax assets |
|
$ |
— |
|
$ |
— |
|
|
|
|
|
|
|
|
|
|
|
Long -Term Deferred Tax Assets: |
|
|
|
|
|
|
|
|
Net operating loss carryforwards |
|
$ |
6,848,000 |
|
$ |
7,632,000 |
|
|
Warrant expense |
|
|
563,000 |
|
|
563,000 |
|
|
Accrued expenses |
|
|
— |
|
|
147,000 |
|
|
Depreciation |
|
|
64,000 |
|
|
31,000 |
|
|
Stock options |
|
|
93,000 |
|
|
78,000 |
|
|
Alternative minimum tax credits |
|
|
125,000 |
|
|
34,000 |
|
|
Other |
|
|
3,000 |
|
|
1,000 |
|
|
Long-term deferred tax assets before valuation allowance |
|
|
7,696,000 |
|
|
8,486,000 |
|
|
Less valuation allowance |
|
|
(7,696,000 |
) |
|
(8,486,000 |
) |
|
|
|||||||
|
Long-term deferred tax assets |
|
$ |
— |
|
$ |
— |
|
37
|
|
|
|
|
At December 31, 2009, the Company had net operating loss carryforwards of approximately $17,211,000, which are available to offset future taxable income. The Company has determined that these carryforwards are not currently subject to the limitations of Internal Revenue Code Section 382 which provides limitations on the availability of net operating losses to offset current taxable income if an ownership change has occurred. These carryforwards will begin expiring in 2018. |
|
|
|
|
|
At December 31, 2009, the Company had indefinite-lived alternative minimum tax credit carryforwards of $125,000. |
|
|
|
|
|
The Company has established a valuation allowance due to uncertainties regarding the realization of deferred tax assets. During the year ended December 31, 2009, the Company recorded a $701,000 net release of the valuation allowance related to the utilization of loss carryforwards and determined that it is still more likely than not that none of the remaining deferred tax assets will be realized. During the year ended December 31, 2008, the Company recorded a $1,930,000 net increase to the valuation allowance due to changes in the Company’s expectations regarding its ability to realize certain deferred tax assets, which resulted from a determination that it was more likely than not that none of the deferred tax assets would be realized. During the year ended December 31, 2007, the Company recorded a $2,337,000 net release to the valuation allowance due to changes in the Company’s expectations regarding its ability to realize certain deferred tax assets, which resulted from a determination that it was more likely than not that a portion of the net deferred tax assets would be realized. The Company evaluates all significant available positive and negative evidence, including the existence of losses in recent years and its forecast of future taxable income, in assessing the need for a valuation allowance. The underlying assumptions the Company uses in forecasting future taxable income require significant judgment and take into account the Company’s recent performance. |
|
|
|
|
|
The Company will continue to assess the valuation allowance and to the extent it is determined that said allowance is no longer required, the tax benefit of the remaining deferred tax assets will be recognized in the future. Included as part of the Company’s net operating loss carryforwards are approximately $2,700,000 in tax deductions that resulted from the exercise of stock options. When these loss carryforwards are realized the corresponding changes in the valuation allowance will be recorded as additional paid-in capital. |
|
|
|
|
|
The actual tax expense attributable to income from continuing operations differs from the expected tax expense (benefit) computed by applying the U.S. federal corporate income tax rate of 34% to the net income (loss) as follows: |
|
|
|
|
|
|
|
|
|
|
|
|
|
Year Ended December 31 |
|
2009 |
|
2008 |
|
2007 |
|
|||
|
Federal statutory rate |
|
|
34.0 |
% |
|
(34.0 |
)% |
|
34.0 |
% |
|
|
|
|
|
|
|
|
|
|
|
|
|
Change in valuation allowance |
|
|
(35.3 |
) |
|
1,618.3 |
|
|
(961.0 |
) |
|
Stock options |
|
|
3.0 |
|
|
116.5 |
|
|
56.8 |
|
|
State taxes |
|
|
0.5 |
|
|
79.9 |
|
|
(41.9 |
) |
|
Meals & entertainment |
|
|
0.8 |
|
|
21.0 |
|
|
9.4 |
|
|
|
|
|
|
|
|
|
|
|
|
|
|
Effective federal income tax rate |
|
|
3.0 |
% |
|
1,801.7 |
% |
|
(902.7 |
)% |
|
|
|
|
|
The Company has determined that no liability is required to be recognized for uncertain tax positions taken in tax returns. The Company files income tax returns in the United States and numerous state and local tax jurisdictions. Tax years that are open for examination and assessment by the Internal Revenue Service are 2006 through 2009. With limited exceptions, tax years prior to 2005 are no longer open in major state and local tax jurisdictions. |
38
|
|
|
|
7. |
Employee Benefit Plans. The Company sponsors a Retirement Profit Sharing and Savings Plan under Section 401(k) of the Internal Revenue Code. The plan allows employees to defer up to 50% of their wages, subject to Federal limitations, on a pre-tax basis through contributions to the plan. During the years ended December 31, 2009, 2008 and 2007 the Company made a matching contribution of $77,000, $71,000 and $66,000, respectively. |
|
|
|
|
8. |
Concentrations. |
|
|
Major Customers. During the year ended December 31, 2009, two customers each accounted for 20% of the Company’s total net sales. At December 31, 2009, these two customers represented 25% and 15% of the Company’s total accounts receivable. During the year ended December 31, 2008, four customers accounted for 19%, 13%, 11% and 10% of the Company’s total net sales. At December 31, 2008, these four customers represented 12%, 2%, 7% and 24% of the Company’s total accounts receivable. |
|
|
|
|
|
Although there are a number of customers that the Company sells to, the loss of a major customer could adversely affect operating results. Additionally, the loss of a major retailer from the Company’s retail network could adversely affect operating results. |
|
|
|
|
|
Export Sales. Export sales accounted for less than 1% of total net sales during the years ended December 31, 2009, 2008 and 2007. |
|
|
|
|
9. |
Quarterly Financial Data. (Unaudited) |
|
|
Quarterly data for the years ended December 31, 2009 and 2008 was as follows: |
|
|
|
|
|
|
|
|
|
|
|
|
|
|
|
|
Year Ended December 31, 2009 |
|
1st Quarter |
|
2nd Quarter |
|
3rd Quarter |
|
4th Quarter |
|
||||
|
Net sales |
|
$ |
6,186,000 |
|
$ |
5,773,000 |
|
$ |
7,944,000 |
|
$ |
8,867,000 |
|
|
Gross profit |
|
|
3,223,000 |
|
|
3,025,000 |
|
|
4,132,000 |
|
|
4,961,000 |
|
|
Net income |
|
|
1,317,000 |
|
|
110,000 |
|
|
986,000 |
|
|
1,303,000 |
|
|
Net income per share: |
|
|
|
|
|
|
|
|
|
|
|
|
|
|
Basic |
|
$ |
0.09 |
|
$ |
0.01 |
|
$ |
0.07 |
|
$ |
0.09 |
|
|
Diluted |
|
$ |
0.09 |
|
$ |
0.01 |
|
$ |
0.06 |
|
$ |
0.08 |
|
|
|
|
|
|
|
|
|
|
|
|
|
|
|
|
|
Year Ended December 31, 2008 |
|
1st Quarter |
|
2nd Quarter |
|
3rd Quarter |
|
4th Quarter |
|
||||
|
Net sales |
|
$ |
6,563,000 |
|
$ |
7,578,000 |
|
$ |
8,597,000 |
|
$ |
8,668,000 |
|
|
Gross profit |
|
|
3,534,000 |
|
|
4,294,000 |
|
|
4,499,000 |
|
|
4,557,000 |
|
|
Net income (loss) |
|
|
(240,000 |
) |
|
410,000 |
|
|
(254,000 |
) |
|
(2,173,000 |
) |
|
Net income (loss) per share: |
|
|
|
|
|
|
|
|
|
|
|
|
|
|
Basic |
|
$ |
(0.02 |
) |
$ |
0.03 |
|
$ |
(0.02 |
) |
$ |
(0.14 |
) |
|
Diluted |
|
$ |
(0.02 |
) |
$ |
0.03 |
|
$ |
(0.02 |
) |
$ |
(0.14 |
) |
Item 9. Changes in and Disagreements With Accountants on Accounting and Financial Disclosures
Not applicable.
39
Item 9A. Controls and Procedures
Disclosure Controls and Procedures
The Company’s management carried out an evaluation, under the supervision and with the participation of the Company’s Chief Executive Officer (principal executive officer) and the Company’s Chief Financial Officer (principal financial officer), of the effectiveness of the design and operation of the Company’s disclosure controls and procedures (as such term is defined in Rules 13a-15(e) and 15d-15(e) under the Securities Exchange Act of 1934, as amended) as of December 31, 2009, pursuant to Exchange Act Rule 13a-15. Based upon that evaluation, the Company’s Chief Executive Officer and the Company’s Chief Financial Officer concluded that the Company’s disclosure controls and procedures as of December 31, 2009 were effective. Disclosure controls and procedures ensure that information required to be disclosed by us in the reports that we file or submit under the Exchange Act is recorded, processed, summarized and reported within the time periods specified in the rules and forms of the SEC, and are designed to ensure that information required to be disclosed by us in these reports is accumulated and communicated to our management, as appropriate to allow timely decisions regarding disclosures.
Management’s Annual Report on Internal Control Over Financial Reporting
Our management is responsible for establishing and maintaining adequate control over financial reporting, as such term is defined in Rule 13a-15(f) of the Exchange Act. Under the supervision and with the participation of our management, including our Chief Executive Officer and our Chief Financial Officer, we conducted an evaluation of the effectiveness of our internal control over financial reporting as of December 31, 2009. In conducting its evaluation, our management used the criteria set forth by the framework in Internal Control – Integrated Framework issued by the Committee of Sponsoring Organizations of the Treadway Commission. Based on that evaluation, management believes our internal control over financial reporting was effective as of December 31, 2009.
This annual report does not include an attestation report of the Company’s registered public accounting firm regarding internal control over financial reporting. Management’s report was not subject to attestation by the Company’s registered public accounting firm pursuant to temporary rules of the Securities and Exchange Commission that permit the Company to provide only management’s report in this annual report.
Changes in Internal Control Over Financial Reporting
No changes in the Company’s internal control over financial reporting have occurred during the fourth quarter of 2009 that have materially affected, or are reasonably likely to materially affect, the Company’s internal control over financial reporting.
None.
Item 10. Directors, Executive Officers and Corporate Governance
The information required by Item 10 concerning the directors and executive officers of the Company and corporate governance is incorporated herein by reference to the Company’s proxy statement for its 2010 Annual Meeting of Shareholders, which will be filed with the Securities and Exchange Commission pursuant to Regulation 14A within 120 days after the close of the fiscal year for which this report is filed.
40
Item 11. Executive Compensation
The information required by Item 11 is incorporated herein by reference to the Company’s proxy statement for its 2010 Annual Meeting of Shareholders which will be filed with the Securities and Exchange Commission pursuant to Regulation 14A within 120 days after the close of the fiscal year for which this report is filed.
Item 12. Security Ownership of Certain Beneficial Owners and Management and Related Stockholder Matters
The information required by Item 12 is incorporated herein by reference to the Company’s proxy statement for its 2010 Annual Meeting of Shareholders which will be filed with the Securities and Exchange Commission pursuant to Regulation 14A within 120 days after the close of the fiscal year for which this report is filed.
Item 13. Certain Relationships and Related Transactions and Director Independence
The information required by Item 13 is incorporated herein by reference to the Company’s proxy statement for its 2010 Annual Meeting of Shareholders which will be filed with the Securities and Exchange Commission pursuant to Regulation 14A within 120 days after the close of the fiscal year for which this report is filed.
Item 14. Principal Accountant Fees and Services
The information required by Item 14 is incorporated herein by reference to the Company’s proxy statement for its 2010 Annual Meeting of Shareholders which will be filed with the Securities and Exchange Commission pursuant to Regulation 14A within 120 days after the close of the fiscal year for which this report is filed.
41
Item 15. Exhibits and Financial Statement Schedules
|
|
|
|
The following financial statements of Insignia Systems, Inc. are included in Item 8: |
|
|
|
|
|
|
Report of Independent Registered Public Accounting Firm |
|
|
Balance Sheets as of December 31, 2009 and 2008 |
|
|
Statements of Operations for the years ended December 31, 2009, 2008 and 2007 |
|
|
Statements of Shareholders’ Equity for the years ended December 31, 2009, 2008 and 2007 |
|
|
Statements of Cash Flows for the years ended December 31, 2009, 2008 and 2007 |
|
|
Notes to Financial Statements |
|
|
|
|
(a) |
Exhibits |
|
|
|
|
|
|
|
Exhibit |
|
Description |
|
Incorporation By Reference To |
|
|
|
|
|
|
|
3.1 |
|
Articles of Incorporation of Registrant, as amended to date |
|
Exhibit 3.1 of the
Registrant’s Registration |
|
|
|
|
|
|
|
3.2 |
|
Bylaws, as amended to date |
|
Exhibit 3.1 of the
Registrant’s Form 8-K filed |
|
|
|
|
|
|
|
4.1 |
|
Specimen Common Stock Certificate of Registrant |
|
Exhibit 4.1 of the
Registrant’s Registration |
|
|
|
|
|
|
|
10.1 |
|
The Company’s 1990 Stock Plan, as amended |
|
Exhibit 10.3 of the
Registrant’s Annual Report on |
|
|
|
|
|
|
|
10.2 |
|
Employee Stock Purchase Plan, as amended |
|
Exhibit 4.2 of the Registrants Registration Statement on Form S-8, Reg. No. 333-161311 |
|
|
|
|
|
|
|
10.3 |
|
The Company’s 2003
Incentive Stock Option |
|
Exhibit 4.1 of the
Registrant’s Registration |
|
|
|
|
|
|
|
10.4 |
|
Amended Change in Control
Severance |
|
Exhibit 10.10 of the
Registrant’s Annual Report on |
|
|
|
|
|
|
|
10.5 |
|
Amended Change in Control
Severance |
|
Exhibit 10.11 of the
Registrant’s Annual Report on |
|
|
|
|
|
|
|
10.6 |
|
Consulting Agreement, effective February 1, 2006, between Gary L. Vars and the Company |
|
Exhibit 4.1 of the
Registrant’s Form 8-K filed |
|
|
|
|
|
|
|
10.7 |
|
Nonqualified Stock Option Agreement, effective February 1, 2006, between Gary L. Vars and the Company |
|
Exhibit 4.2 of the
Registrant’s Form 8-K filed |
|
|
|
|
|
|
|
10.8 |
|
Exclusive Reseller Agreement between Valassis Sales & Marketing Services, Inc. and the Company entered into as of June 12, 2006 |
|
Exhibit 10.1 of the Registrant’s Form 10-Q for the quarterly period ended June 30, 2006 (Confidential treatment has been requested for portions of the Agreement pursuant to Rule 24b-2.) |
42
|
|
|
|
|
|
|
Exhibit |
|
Description |
|
Incorporation By Reference To |
|
10.9 |
|
Amendment #1 dated December 6, 2006 to the Exclusive Reseller Agreement dated June 12, 2006 between Valassis Sales & Marketing Services, Inc. and the Company |
|
Exhibit 10.1 of the Registrant’s Form 10-K/A for the year ended December 31, 2008 (Confidential treatment has been requested for portions of the Amendment pursuant to Rule 24b-2.) |
|
|
|
|
|
|
|
10.10 |
|
Amended Change in Control Severance Agreement with Scott J. Simcox dated February 20, 2007 |
|
Exhibit 10.1 of the
Registrant’s Form 8-K filed |
|
|
|
|
|
|
|
10.11 |
|
Amended Change in Control Severance Agreement with Alan Jones dated May 23, 2007 |
|
Exhibit 10.1 of the
Registrant’s Form 8-K filed |
|
|
|
|
|
|
|
10.12 |
|
Amended Change in Control Severance Agreement with A. Thomas Lucas dated May 23, 2007 |
|
Exhibit 10.2 of the
Registrant’s Form 8-K filed |
|
|
|
|
|
|
|
10.13 |
|
Amendment #2 dated July 2, 2007 to Exclusive Reseller Agreement dated June 12, 2006 between Valassis Sales & Marketing Services, Inc. and the Company |
|
Exhibit 10.1 of the Registrant’s Form 10-Q for the quarterly period ended June 30, 2007 (Confidential treatment has been requested for portions of the Amendment pursuant to Rule 24b-2.) |
|
|
|
|
|
|
|
10.14 |
|
Form of Warrant dated July 2, 2007 to purchase shares of common stock issued to Valassis Sales & Marketing Services, Inc. by the Company per Amendment #2 to the Exclusive Reseller Agreement |
|
Exhibit 10.2 of the Registrant’s Form 10-Q for the quarterly period ended June 30, 2007 |
|
|
|
|
|
|
|
|
|
|
|
|
|
10.15 |
|
Lease Termination Agreement between the Company and the Landlord, dated October 12, 2007 |
|
Exhibit 10.20 of the
Registrant’s Annual Report on |
|
|
|
|
|
|
|
10.16 |
|
Sublease Termination Agreement between the Company and the Sublessee dated October 12, 2007 |
|
Exhibit 10.21 of the
Registrant’s Annual Report on |
|
|
|
|
|
|
|
10.17 |
|
Lease Agreement between the Company and the Landlord (Opus Northwest L.L.C.) dated March 27, 2008 (Exhibits Omitted) |
|
Exhibit 10.22 of the
Registrant’s Annual Report on |
|
|
|
|
|
|
|
10.18 |
|
2009 Executive Officer Incentive Bonus Plan |
|
Exhibit 99.1 of the
Registrant’s Form 8-K filed |
|
|
|
|
|
|
|
14 |
|
Code of Ethics |
|
Exhibit 14 of the
Registrant’s Annual Report on |
|
|
|
|
|
|
|
23.1 |
|
Consent of Independent
Registered Public |
|
Filed herewith |
|
|
|
|
|
|
|
31.1 |
|
Certification of Principal Executive Officer |
|
Filed herewith |
|
|
|
|
|
|
|
31.2 |
|
Certification of Principal Financial Officer |
|
Filed herewith |
|
|
|
|
|
|
|
32 |
|
Section 1350 Certification |
|
Filed herewith |
|
|
|
|
|
|
43
SIGNATURES
Pursuant to the requirements of Section 13 or 15(d) of the Securities Exchange Act of 1934, the registrant has duly caused this report to be signed on its behalf by the undersigned, thereunto duly authorized.
|
|
|
|
|
|
|
By: |
/s/ Scott F. Drill |
|
|
|
|
Scott F. Drill |
|
|
|
|
President and CEO |
|
|
Dated: March 31, 2010 |
|
|
|
Pursuant to the requirements of the Securities Exchange Act of 1934, this report has been signed by the following persons on behalf of the registrant in the capacities and on the dates indicated.
|
|
|
|
|
|
|
|
Signature |
|
Title |
|
Date |
|
|
|
|
|
|
|
|
|
/s/ Scott F. Drill |
|
President, Chief Executive Officer (principal executive officer) |
|
March 31, 2010 |
|
|
Scott F. Drill |
|
Secretary and Director |
|
|
|
|
|
|
|
|
|
|
|
/s/ Justin W. Shireman |
|
Vice President of Finance, Chief Financial Officer |
|
March 31, 2010 |
|
|
Justin W. Shireman |
|
(principal financial and accounting officer) and |
|
|
|
|
|
|
Treasurer |
|
|
|
|
|
|
|
|
|
|
|
/s/ Peter V. Derycz |
|
Director |
|
March 31, 2010 |
|
|
Peter V. Derycz |
|
|
|
|
|
|
|
|
|
|
|
|
|
/s/ Donald J. Kramer |
|
Director |
|
March 31, 2010 |
|
|
Donald J. Kramer |
|
|
|
|
|
|
|
|
|
|
|
|
/s/ Gordon F. Stofer |
|
Director |
|
March 31, 2010 |
|
|
Gordon F. Stofer |
|
|
|
|
|
The above persons are a majority of the directors.
44