Attached files
| file | filename |
|---|---|
| EX-32.2 - Ever-Glory International Group, Inc. | v179237_ex32-2.htm |
| EX-32.1 - Ever-Glory International Group, Inc. | v179237_ex32-1.htm |
| EX-31.1 - Ever-Glory International Group, Inc. | v179237_ex31-1.htm |
| EX-31.2 - Ever-Glory International Group, Inc. | v179237_ex31-2.htm |
| EX-21.1 - Ever-Glory International Group, Inc. | v179237_ex21-1.htm |
UNITED
STATES
SECURITIES
AND EXCHANGE COMMISSION
Washington,
D.C. 20549
FORM
10-K
(Mark
One)
|
x
|
ANNUAL
REPORT PURSUANT TO SECTION 13 OR 15(d) OF THE SECURITIES EXCHANGE ACT OF
1934
|
For the
fiscal year ended December 31, 2009
Or
|
¨
|
TRANSITION
REPORT PURSUANT TO SECTION 13 OR 15(d) OF THE SECURITIES EXCHANGE ACT OF
1934
|
For the
transition period from ____________ to ______________
Commission
file number: 0-28806
|
EVER-GLORY
INTERNATIONAL GROUP, INC.
|
||
|
(Exact
name of registrant as specified in its charter)
|
||
|
Florida
|
65-0420146
|
|
|
(State
or other jurisdiction of
incorporation
or organization)
|
|
(I.R.S.
Employer
Identification
No.)
|
100
N. Barranca Ave. #810
West
Covina, California 91791
(Address
of principal executive offices) (Zip Code)
(626)
839-9116
(Registrant’s
telephone number, including area code)
Securities
registered under Section 12(b) of the Act:
|
Title of each class registered:
|
Name of each exchange on which registered:
|
|
Common
Stock
|
NYSE
Amex LLC
|
Securities
registered under Section 12(g) of the Act: None.
Indicate
by check mark if the registrant is a well-known seasoned issuer, as defined in
Rule 405 of the Securities Act.
Yes ¨ No x
Indicate
by check mark if the registrant is not required to file reports pursuant to
Section 13 or Section 15(d) of the Act. Yes ¨ No x
Indicate
by check mark whether the registrant (1) has filed all reports required to be
filed by Section 13 or 15(d) of the Securities Exchange Act of 1934 during the
preceding 12 months (or for such shorter period that the registrant was required
to file such reports), and (2) has been subject to such filing requirements for
the past 90 days. Yes x No ¨
Indicate
by check mark if disclosure of delinquent filers pursuant to Item 405 of
Regulation S-K (§ 229.405 of this chapter) is not contained herein, and will not
be contained, to the best of registrant’s knowledge, in definitive proxy or
information statements incorporated by reference in Part III of this Form 10-K
or any amendment to this Form 10-K. ¨
Indicate
by check mark whether the registrant is a large accelerated filer, an
accelerated filer, a non-accelerated filer, or a smaller reporting company. See
the definitions of “large accelerated filer,” “accelerated filer” and “smaller
reporting company” in Rule 12b-2 of the Exchange Act.
|
Large
accelerated filer ¨
|
Accelerated
filer ¨
|
|
Non-accelerated
filer ¨ (Do
not check if smaller reporting company)
|
Smaller
Reporting company x
|
Indicate
by check mark whether the registrant is a shell company (as defined in Rule
12b-2 of the Act). Yes ¨ No x
As of
June 30, 2009, 13,548,498 shares of common stock were outstanding. The aggregate
market value of the common stock held by non-affiliates of the registrant, as of
June 30, 2009, the last business day of the 2nd fiscal quarter, was
approximately $6,842,665 based on the closing price of $ 1.85 for the
registrant’s common stock as reported on the NYSE Amex LLC (formerly, the
American Stock Exchange and the NYSE Alternext US LLC). Shares of common stock
held by each director, each officer and each person who owns 10% or more of the
outstanding common stock have been excluded from this calculation in that such
persons may be deemed to be affiliates. The determination of affiliate status is
not necessarily conclusive.
As
of March 30, 2010, there were 13,566,874 shares of our common stock
issued and outstanding.
DOCUMENTS
INCORPORATED BY REFERENCE
None.
EVER-GLORY
INTERNATIONAL GROUP, INC.
FORM
10-K
For
the Year Ended December 31, 2009
TABLE OF CONTENTS
|
Part
I
|
4
|
||
|
Item
1.
|
Business
|
4 | |
|
Item
1A.
|
Risk
Factors
|
12 | |
|
Item
1B.
|
Unresolved
Staff Comments
|
20 | |
|
Item
2.
|
Properties
|
20 | |
|
Item
3.
|
Legal
Proceedings
|
21 | |
|
Part
II
|
21
|
||
|
Item
5.
|
Market
for Registrant’s Common Equity, Related Stockholder Matters and Issuer
Purchases of Equity Securities
|
21 | |
|
Item
6.
|
Selected
Financial Data
|
22 | |
|
Item
7.
|
Management’s
Discussion and Analysis of Financial Condition and Results of
Operations
|
22 | |
|
Item
7A.
|
Quantitative
and Qualitative Disclosures about Market Risk
|
47 | |
|
Item
8.
|
Financial
Statements and Supplementary Data
|
48 | |
|
Item
9.
|
Changes
In and Disagreements with Accountants on Accounting and Financial
Disclosure
|
48 | |
|
Item
9A.
|
Controls
and Procedures
|
49 | |
|
Item
9B.
|
Other
Information
|
51
|
|
|
Part
III
|
52
|
||
|
Item
10.
|
Directors,
Executive Officers, and Corporate Governance
|
52 | |
|
Item
11.
|
Executive
Compensation
|
56 | |
|
Item
12.
|
Security
Ownership of Certain Beneficial Owners and Management and Related
Stockholder Matters
|
60 | |
|
Item
13.
|
Certain
Relationships and Related Transactions, and Director
Independence
|
61 | |
|
Item
14.
|
Principal
Accounting Fees and Services
|
64 | |
|
Part
IV
|
64
|
||
|
Item
15
|
Exhibits,
Financial Statement Schedules
|
64 | |
|
Signatures
|
67 |
2
Note
Regarding Forward-Looking Statements
Statements
contained in this Annual Report on Form 10-K, which are not historical facts,
are forward-looking statements, as the term is defined in the Private Securities
Litigation Reform Act of 1995. Such forward-looking statements, whether
expressed or implied, are subject to risks and uncertainties which can cause
actual results to differ materially from those currently anticipated, due to a
number of factors, which include, but are not limited to:
|
|
·
|
Competition
within our industry;
|
|
|
·
|
Seasonality
of our sales;
|
|
|
·
|
Success of
our investments in new product
development;
|
|
|
·
|
Our plans to
open new retail stores;
|
|
|
·
|
Success of
our acquired businesses;
|
|
|
·
|
Our
relationships with our major
customers;
|
|
|
·
|
The
popularity of our products;
|
|
|
·
|
Relationships
with suppliers and cost of
supplies;
|
|
|
·
|
Financial and
economic conditions in Asia, Japan, Europe and the
U.S.;
|
|
|
·
|
Anticipated
effective tax rates in future
years;
|
|
|
·
|
Regulatory
requirements affecting our
business;
|
|
|
·
|
Currency
exchange rate fluctuations;
|
|
|
·
|
Our future
financing needs; and
|
|
|
·
|
Our ability
to attract additional investment capital on attractive
terms.
|
Forward-looking
statements also include the assumptions underlying or relating to any of the
foregoing or other such statements. When used in this report, the words “may,”
“will,” “should,” “could,” “expect,” “plan,” “anticipate,” “believe,”
“estimate,” “predict,” “continue,” and similar expressions are generally
intended to identify forward-looking statements.
Readers
are cautioned not to place undue reliance on these forward-looking statements,
which reflect management’s opinions only as of the date hereof. We undertake no
obligation to revise or publicly release the results of any revision to these
forward-looking statements. Readers should carefully review the factors
described in the Section of this report entitled “Risk Factors” and other
documents we file from time to time with the Securities and Exchange Commission
(‘SEC’), including the Quarterly Reports on Form 10-Q to be filed by us in
2009.
3
PART
I
Item
1. BUSINESS
Corporate
History and Background
Ever-Glory
International Group, Inc., sometimes referred to in this report as “Ever-Glory”,
the “Company,” “we”, or “us”, is a holding company that oversees
the operations of its subsidiaries, and provides its subsidiaries with resources
and services in financial, legal, administrative and other areas. The Company
was incorporated in Florida on October 19, 1994. We changed our name from Andean
Development Corporation to “Ever-Glory International Group, Inc.” on November
17, 2005.
Perfect
Dream Limited (“Perfect Dream”) was incorporated in the British Virgin Islands
on July 1, 2004. Perfect Dream was originally formed as a holding company, and
it became our wholly-owned subsidiary as a result of a share exchange
transaction completed in November 2005.
In
January 2005, Perfect Dream acquired 100% of Goldenway Nanjing Garments Company
Limited (“Goldenway”). Goldenway, a People’s Republic of China (“PRC”) wholly
foreign-owned enterprise was incorporated on December 31, 1993. Goldenway is
principally engaged in the manufacturing and sale of garments. Until December
2004, Goldenway was a joint venture held by Jiangsu Ever-Glory International
Group Corporation (“Jiangsu Ever-Glory”). After it was acquired by Perfect
Dream, Goldenway changed its status to that of a wholly foreign owned enterprise
and increased its registered capital from US$2,512,106 to US$20,000,000. The
increased registered capital was required to be contributed in installments
within three years of the issuance of Goldenway's updated business license.
On July 6, 2009, the Company obtained the approval from the government
allowing the company to decrease the registered capital from $20,000,000 to
$15,047,788. As of June 30, 2009, the Company had fulfilled
its registered capital requirements.
On
November 9, 2006, Perfect Dream entered into a purchase agreement with
Ever-Glory Enterprises (HK) Limited (“Ever-Glory Hong Kong”) whereby we acquired
a 100% interest in Nanjing New-Tailun Garments Co, Ltd. (“New-Tailun”) from
Ever-Glory Hong Kong (the “New-Tailun transaction”). Pursuant to the terms of
the purchases agreement for this acquisition, we agreed to pay Ever-Glory Hong
Kong $2,000,000 in cash and issue 20,833,333 shares of our restricted common
stock having a value of $10,000,000. We valued the shares based on the preceding
30-day average of high bid and the low ask price for our common stock on the
date of the transfer within 90 days of the closing of the New-Tailun
transaction. The total consideration due to Ever-Glory Hong Kong in connection
with this transaction has been paid. The New-Tailun transaction closed on
December 30, 2006. New-Tailun is a 100% foreign-owned enterprise incorporated in
the PRC and is engaged in the manufacturing and sale of garments. New-Tailun has
a staff of approximately 560 employees with an annual production capacity of
about 1.8 million pieces.
On August
27, 2007, we acquired Nanjing Catch-Luck Garments Co, Ltd. (“Catch-Luck”), which
further expanded our production capacity. Catch-Luck is primarily engaged in the
manufacturing and sale of garments in China. Founded in 1995, Catch-Luck has
approximately 520 employees with an annual production capacity of 1.2 million
garments. It currently operates one factory spanning 6,635 square meters in the
Nanjing Jiangning Economic and Technological Development Zone.
Shanghai
La Go Go Fashion Company Limited (“LA GO GO”), a joint venture of Goldenway and
Shanghai La Chapelle Garment and Accessories Company Limited (“La Chapelle”),
was incorporated in the PRC on January 24, 2008. Goldenway invested
approximately US$826,200 (Renminbi (“RMB”) 6.0 million) in cash, and La Chapelle
invested approximately US$553,040 (RMB 4.0 million) in cash, for a 60% and 40%
ownership interest, respectively, in the joint venture. The business objective
of the joint venture is to develop, promote and market a line of middle to high
price range of women’s wear in China. On March 23, 2009, Goldenway transfered
all of its ownership interest in LA GO GO to Ever-Glory Apparel
4
Ever-Glory
International Group Apparel Inc.(“Ever-Glory Apparel”), a wholly owned
subsidiary of Goldenway, was incorporated in the PRC on January 6,
2009. Goldenway invested approximately US$733,500 (RMB 5.0 million)
in cash in Ever-Glory Apparel. As
of December 31, 2009, Goldenway has increased its investment to approximately
$6,595,000 (RMB45.0 million). Ever-Glory Apparel is principally
engaged in the import and export of apparel, fabric and accessories. Ever-Glory
Apparel is expected to be handling most import and export from
2010.
Ever-Glory
International Group (HK) Ltd. (“Ever-Glory HK”), a wholly-owned subsidiary of
Perfect-Dream, was incorporated in Samoa on September 15, 2009. Ever-Glory HK is
principally engaged in the import and export of apparel, fabric and
accessories.
Ever-Glory
Apparel and Ever-Glory HK will focus on the import and export
business. Goldenway focuses primarily on quality and production
control, and coordinating with outsourced contract manufacturers. New-Tailun
focuses on the Japanese market, and has strengths in the design, production,
sale and marketing of jeans and trousers. Catch-Luck is geared toward the
European market, and it designs and makes products that complement the product
lines of our other subsidiaries. LA GO GO focuses on establishing and creating a
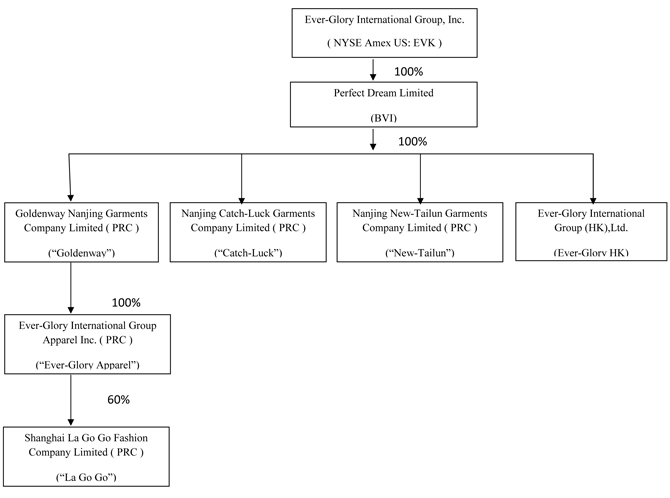
leading brand of ladies’ garments for the mainland Chinese market.
Our
corporate structure is illustrated below.
5
Business
Operations
Our
wholesale operations include manufacturing and worldwide sale of apparel to
well-known casual wear, sportswear and outerwear brands and retailers in major
markets. We manufacture our apparel products in our two factories, Catch-Luck
and New-Tailun, located in the Nanjing Jiangning Economic and
Technological Development Zone and Shang Fang Town respectively in Nanjing,
China. We conduct our original design manufacturing (“ODM”) operations
through three wholly-owned subsidiaries in China: Goldenway, New-Tailun, and
Catch-Luck. Our three facilities in Nanjing have approximately 1,500
employees. In 2009, we achieved total sales of $76,677,547.
Although
we have our own manufacturing capacity, we currently outsource most of the
manufacturing to our strategic alliances as part of our overall business
strategy. Outsourcing allows us to maximize our production capacity and remain
flexible while reducing capital expenditures and the costs of keeping skilled
workers on production lines during low season. We inspect products manufactured
by our long-term contractors to ensure that they meet our high quality control
standards. Total production capacity per year is more than 12 million
pieces. See Production
and Quality Control below.
Our
retail operation is conducted by our subsidiary, LA GO GO. The business
objective of the joint venture is to establish and create a leading brand of
women’s wear and to build a nationwide retail distribution channel in China. LA
GO GO had approximately 800 employees as of December 31, 2009. As of December 31
2009, we operated 185 retail stores in China and had total sales of
$13,193,444.
Wholesale
Segment
Products
We
manufacture a broad array of products in various categories for the women’s,
men’s and children’s markets. Within those categories, various product
classifications including high and middle grade casual-wear, sportswear and
outwear, including the following product lines:
|
Women’s
Clothing:
|
coats,
jackets, slacks, skirts, shirts, trousers, and jeans
|
|
|
Men’s
Clothing:
|
vests,
jackets, trousers, skiwear, shirts, coats and jeans
|
|
|
Children’s
Clothing:
|
coats,
vests, down jackets, trousers, knitwear and
jeans
|
Customers
We
manufacture garments for a number of well-known retail chains and famous
international brands. We also have our own in-house design capabilities and can
provide our customers with a selection of original designs that the customer may
have manufactured-to-order. We ordinarily supply our customers’ through purchase
orders, and we have no long-term supply contracts with any of them.
In the
fiscal year ended December 31, 2009, approximately 25% of our sales revenue came
from customers in Germany, 15% of our sales revenue came from customers in
United Kingdom, 11% of our sales revenue came from customers in other European
countries, 15% from customers in the United States, 15% from customers in Japan,
and 19% from customers in China. In 2009, only one customer represented more
than ten percent of our total sales (Approximately 29% of our total net sales).
Also, in 2009, sales to our five largest customers generated approximately 56%
of our total net sales.
Substantially
all of the Company’s long-lived assets were attributable to the PRC as of
December 31,2009 and 2008.
Suppliers
We
purchase the majority of our raw materials (including fabric, fasteners, thread,
buttons, labels and related materials) directly from numerous local fabric and
accessories suppliers. For our wholesale business, collectively, purchases from
our five largest suppliers represented approximately 19.4% and 18.6% of total
raw material purchases in 2009 and 2008, respectively. No single supplier
provided more than 10% of our total purchases.
6
We also
purchased finished goods from contract manufacturers. For our wholesale
business, collectively, purchases from our five largest contract manufacturers
represented approximately 42.6% and 40.7% of total finished goods purchases in
2009 and 2008, respectively. Two contract manufacturers provided approximately
17.9% and 10.7% of our total finished goods purchases in 2009. One contract
manufacturer provided approximately 21.5% of our total finished goods purchases
in 2008.
For our
wholesale business, we generally agree to pay our suppliers within 30-90 days
after our receipt of goods. We typically place orders for materials from
suppliers when we receive orders from our customers. On average, the materials
will generally be consumed by production in approximately 20 days.
Sales and
Marketing
We have
set up our own merchandising department to interface with our customers. We
believe we have developed good and stable business relationships with our main
customers in the Europe, U.S., Japan and China. Our sales staff typically work
directly with our customers and arrange the terms of the contracts with
them.
Our
management believes that we continue to benefit from our solid reputation for
providing high quality goods and professional service in the markets where we
have a presence, which provides us further opportunities to work with desirable
customers. Our marketing strategy aims to attract customers with the strongest
brands within the strongest markets. We market directly to branded retailers and
retail chains instead of selling through intermediary buyers and agents. We seek
to attract customers mainly from Europe, the U.S., Japan, and China. In
addition, we look for customers with strong brand appeal and product lines that
require high quality manufacturing and generate sufficient sales volume to
support our sizeable production capacity. Referrals from existing customers have
been and continue to be a fruitful source of new customers. In addition, we aim
to maintain an active presence in trade shows around the world, including those
in Europe, the U.S., Japan, and China.
Production
and Quality Control
In 2009,
we manufactured approximately 30% of the products we sell to wholesale customers
in our own manufacturing facilities. We typically outsource a large portion of
our products based upon factory capacity and customer demand. The number of
outside contract manufacturers to which we outsource is expected to increase in
order to meet the anticipated growth in demand from our customers.
As of
December, 31, 2009, our total production capacity including outsourcing reached
12 million pieces per year. At present, our production capacity is sufficient to
meet customer demand.
We are
committed to designing and manufacturing high quality garments. We place a
higher standard on quality control because we emphasize the high quality of our
products. We have implemented strict quality control and craft discipline
systems. Before we manufacture large quantities, we obtain the approval from our
customers either through in-person visits to the factories or by shipping
samples of our products to our customers for testing, inspection and feedback.
This ensures that our products perfectly meet specifications prior to
production. In addition, our trained professional quality control personnel
periodically inspect the manufacturing process and quality of our apparel
products. Our factory is ISO 9001:2000 certified. ISO 9000 is a family of
standards for quality management systems maintained by ISO,
International Organization for Standardization, and is administered by
accreditation and certification bodies. We have been independently audited and
certified to be in conformance with ISO 9001 which certifies that formalized
business processes are being applied.
Due to
our strict quality control and testing process, we have not undergone any
significant product or merchandise recalls, and we generally do not receive any
significant requests by our customers to return finished goods. Product returns
are not a material factor in our business.
7
We
anticipate to continue outsourcing a large portion of our production. Management
believes that outsourcing allows us to maximize our production flexibility
while reducing significant capital expenditure and the costs associated
with managing a large production workforce. We contract for the production of a
portion of our products through various outside independent manufacturers.
Quality control reviews are done by our employees during and after production
before the garments leave the outsourcing factories to ensure that
material and component qualities and the products “fits” are in accordance with
our specifications. We inspect prototypes of each product prior to cutting by
the contractors, and conduct a final inspection of finished products prior to
shipment to ensure that they meet our high standards.
Delivery
and Transportation
We do not
hold any significant inventory of finished goods, as we typically ship finished
goods to our customers upon completion.
We
deliver most of our products through Jiangsu Ever-Glory, our primary import and
export agent. Our products are generally shipped directly to customers. Jiangsu
Ever-Glory has access to a variety of ground , sea and air shipping
companies and can typically deliver a finished product to the client within the
timeframes we require. Merchandise is carried from our production facilities by
truck to a port where it is consolidated and loaded on containerized vessels for
ocean or air transport to the ultimate destination. Ever-Glory Apparel is
expected to be handle most of our import and export beginning in
2010.
Competition
The
garment manufacturing industry is highly competitive, particularly in China. Our
competitors include garment manufacturers of all sizes, both within China and
elsewhere in the world, many of which have greater financial and manufacturing
resources than us. We have been in the garment manufacturing business since 1993
and believe that we have earned a reputation for producing high quality products
efficiently and at competitive prices, with excellent customer service. We
believe we provide one-stop-service and more valuable products for our
customers.
Currently,
we have several competitors in China including small to large sized companies
including some state-owned trading groups and private garment companies. We
believe we differentiate ourselves from the competition and will be able to
effectively compete with our rivals due to our persistent pursuit of quality
control, a diversified casual wear product lineup, and in-house design talent.
In addition, we believe we derive advantages from the rapid feedback we receive
from our customers in the supply chain and using our advanced
Enterprise Resource Planning (“ERP”) system. Our ERP system integrates many of
our operational processes into one system including order processing,
statistical analysis, purchasing, manufacturing, logistics and financial control
systems, providing management with instantaneous feedback on important aspects
of our business operations.
Governmental
Regulations/Quotas
In 2009,
we were not subject to any export quota imposed by countries where our customers
are located. Nevertheless, we noticed many European counties tightened their
chemical inspection requirements after the removal of quotas. In
addition, there can be no assurance that additional trade restrictions will not
be imposed on the export of our products in the future. Such actions could
result in increases in the cost of our products generally and may adversely
affect our results of operations. On a longer term basis, we believe that our
customer mix and our ability to adjust the types of apparel we manufacture will
mitigate our exposure to such trade restrictions in the future.
We are
also required to comply with Chinese laws and regulations that apply to some of
the products we produce, in the countries we export to. In order to address
these Chinese compliance issues, we have established an advanced fabric testing
center to ensure that our products meet certain quality and safety standards in
the U.S. and EU. In addition, we work closely with our customers so that they
understand our testing and inspection process.
8
Seasonality
Our
business is affected by seasonal trends, with higher levels of wholesale sales
in our third and fourth quarters and higher retail sales in our first and fourth
quarters. These trends result primarily from the timing of seasonal wholesale
shipments and holiday periods in the retail segment.
Retail
Segment
As of
December 31, 2009, LA GO GO had 185 retail stores in China to sell its own brand
clothing. We believe our advantages in the retail segments are the acute and
prompt response to market trends, quick turn-around in design and production,
and appropriate pricing. In 2009, we achieved total net
sales of approximately US $13.2 million for our retail
business.
Supplier
We
purchase the majority of our raw materials (including fabric, fasteners, thread,
buttons, labels and related materials) directly from numerous local fabric and
accessories suppliers. For our retail business, collectively, purchases from our
five largest suppliers represented approximately 31.3% of total purchases in
2009. No single supplier provided more than 10% of our total purchases in 2009.
We have not experienced difficulty in obtaining raw materials essential to our
business.
We also
purchase finished goods from contract manufacturers. For our retail business,
collectively, our five largest contract manufacturers represented approximately
37.5% of total finished goods purchases in 2009. No single contract manufacturer
provided more than 10% of our total finished goods purchases in 2009. We have
not experienced difficulty in obtaining finished products from our contract
manufacturers.
For our
retail business, we generally agree to pay our suppliers within 30-180 days
after our receipt of goods. We typically place orders for materials from
suppliers when the style has been confirmed by our chief of design. On average,
the supplies we hold in stock will generally be consumed in production in
approximately 20 days.
Customers
LA GO GO
intends to appeal to fashionable urban females between the ages of 21 to
39. Our products are priced at a middle-to-high level in order to
appeal to the targeted customers.
Design
and Production
We have
our own design, production and quality control departments. LA GO GO
releases new designs twice a year during October for the spring/summer season
and May for the autumn/winter season. Our design team attends many
fashion shows each year to track the trend in Europe, Japan and Asia. The
designing team produces approximately 1000 designs each year. LA GO GO hosts its
own order-placing fair twice each year to determine the new products to be
released for the spring/summer and autumn/winter season based on the orders
placed by all the regional sales managers at such fair, the chief designer
decides the design to be manufactured. The production department will then
produce sample for the designer’s approval. Our quality control
department checks the quality of the final products by follow-up inspection. The
final products will be shipped to the logistics and distribution center for
sale.
Sales and
Marketing
Our LA GO
GO products are sold in flagship stores, and
stores-within-a-store. The sales department develops new sales
channels. According to the new store opening plan, the ratio of flagship
stores and stores-within-a-store are carefully balanced. The
store-within-a-store enters into contracts with department stores. The flagship
stores are carefully chosen at prominent locations and have lease agreements
with each property owner. Under our return and exchange policy,
products may be returned or exchanged for any reason within 15 days. During
2009, the return and exchange rate was very low and was not a material
factor in our operations.
9
Store
Operation
As of
December 31, 2009, we had 185 stores, including 31 flagship stores, with each
store generating average revenue of approximately $9,500 per month. The majority
of our retail stores are situated as stores-within-a-store in large, mid-tier
department stores located in over 20 provinces in China.
Trademark
We regard
our trademarks as an important part of our business due to the name recognition
of our customers. We currently have pending trademark registration applications
at the China Trademark Office (“CTO”) for the mark “LA GO GO” in class 25 and
class 18. La Chapelle applied for trademark registration in 2007 and later
assigned the application to LA GO GO in 2008 upon the latter’s incorporation. We
believe that the CTO will issue its decision on whether to
approve the applications for registration sometime in 2011. According
to the Trademark Law of the PRC, we are entitled to use the mark before
obtaining such approval. As of December 31, 2009, we are not aware of
any prior registration or valid claim or challenges to our right to use the
mark.
Information
Technology
We
recognize the importance of high-quality information management system in the
retail operation. As a result, we use “Parkson Retail Management
Sytem”, a comprehensive and mature retail management application in China, to
monitor and manage the merchandise planning, inventory and sales
information.
Employees
As of
December 31, 2009, we had over 2,100 employees. None of our employees belong to
a labor union. We have never experienced a labor strike or work stoppage.
We are in full compliance with the Chinese labor laws and regulations and are
committed to providing safe and comfortable working conditions and
accommodations for our employees.
Labor
Costs.
The
manufacture of garments is a labor-intensive business. Although much of our
production process is automated and mechanized, we rely on skilled labor to make
our products. During the year ended December 31, 2009, we benefited
from the abundance of affordable skilled workers as a result of the economic
downturn in China. To increase efficiency and productivity, we cut back total
number of employees while the average salary level increased.
Working
Conditions and Employee Benefits
We
consider our social responsibilities to our workers to be an important
objective, and we are committed to providing a safe, clean, comfortable working
environment and accommodations. Our employees are also entitled to paid holidays
and vacations. In addition, we frequently monitor our third party manufacturers’
working conditions to ensure their compliance with related labor laws and
regulations. We are in full compliance with our obligations to provide pension
benefits to our workers, as mandated by the PRC government. We strictly comply
with Chinese labor laws and regulations, and offer reasonable wages, life
insurance and medical insurance to our workers.
Compliance
with Environmental Laws
Based on
the present nature of our operations, we do not believe that environmental laws
and the cost of compliance with those laws have or will have a material impact
on our operations.
Description
of Property
In 2009,
we operated four facilities on certain land in the Nanjing Jiangning
Economic and Technological Development Zone and in Shangfang Town, which are
located in Nanjing, China. For further details concerning our
property, see Item 2 of this report regarding Properties.
10
Taxation
Our five
operating subsidiaries, all of which are incorporated in the PRC, are
governed by PRC income tax laws and are subject to the PRC enterprise income
tax. Each of our consolidated entities files its own separate tax return, and we
do not file a consolidated tax return. Goldenway was incorporated in the PRC and
is subject to PRC income tax laws and regulations. In 2009,
Goldenway’s income tax rate was 25%.
New-Tailun
and Catch-Luck were incorporated in the PRC and are subject to PRC income tax
laws and regulations. According to the relevant laws and regulations in the PRC,
enterprises with foreign investment in the PRC are entitled to full exemption
from income tax for two years beginning from the first year the enterprises
become profitable and have accumulated profits and a 50% income tax reduction
for the subsequent three years. New-Tailun and Catch-Luck were approved as
wholly foreign-owned enterprises in 2006 and are entitled to the income tax
exemptions in 2006 and 2007. In 2007, no income tax was recorded by New-Tailun
and Catch-Luck as these entities were entitled to full exemption from income
tax. Starting from 2008 and through 2010, New-Tailun and Catch-Luck are entitled
to a 50% reduction of the income tax rate of 25%. Therefore these two
subsidiaries will be taxed at 12.5% for 2008, 2009 and 2010.
LA GO GO
was established on January 24, 2008, its income tax rate is 25%.
Ever-Glory
Apparel was established on January 6, 2009, its income tax rate is
25%.
All of
our income tax expenses are related to our operations in China.
Recent
Developments
In
connection with the acquisition of Catch-Luck, in the second quarter of 2010 we
expect to issue 1,153,846 shares of the Company’s restricted common
stock to Ever-Glory Hong Kong as a result of Catch-Luck’s achievement of certain
2009 financial targets, pursuant to the Agreement for the Purchase and Sale of
Stock dated June 26, 2006, as amended on August 31, 2006 (the “Amendment”) by
and between us, Perfect Dream Ltd., Ever-Glory Hong Kong and
Catch-Luck.
In
connection with the Capital Contribution Agreement between Goldenway, La
Chapelle and Wuxi Xin Bao Lian Investment Company Limited (“Wuxi Xin Bao”) as
of January 9, 2008, La Chapelle agreed to meet certain audited net
income targets of at least RMB 20 million in 2008 and RMB 30 million in
2009. In the event La Chapelle’s actual audited net income falls
below 90% of either of these targets, the overall equity interest of Goldenway
and Wuxi Xin Bao shall, in each instance, be increased proportionally
in accordance with a formula set forth in the Capital Contribution Agreement. La
Chapelle’s net income in 2009 is approximately RMB30 million which is more than
90% of the agreed target of RMB 30 million. As a result, there will be no change
of the equity interest of Goldenway or Wuxi Xin Bao.
Our
Growth Strategy
Supply
chain management:
|
|
·
|
Expand the global sourcing
network
|
|
|
·
|
Invest in the overseas low-cost
manufacturing base
|
|
|
·
|
Focus on value and continue the
Average Selling Price
uptrend
|
|
|
·
|
Emphasis on product design and
technology application
|
|
|
·
|
Seek strategic acquisitions of
international distributors that could enhance global sales and
distribution network
|
Retailing
business development:
|
|
·
|
Multi-brand
operator
|
|
|
·
|
Firmly build up LA GO GO to
become a major Chinese mid-end mass market ladies' wear
brand
|
|
|
·
|
Seek opportunities for long-term
cooperation with reputable international
brands
|
|
|
·
|
Facilitate the entry of
international brands into the PRC
market
|
11
|
|
·
|
Retail network
expansion
|
|
|
·
|
Improve store efficiency and
increase same store sales
(“SSS”)
|
|
|
·
|
Strengthen brand
marketing
|
|
|
·
|
Launch flagship stores in Tier-1
Cities
|
|
|
·
|
Increase penetration and coverage
in Tier-2 and Tier-3 Cities
|
ITEM
1A.RISK FACTORS
You
should carefully consider the risks described below together with all of the
other information included in this Annual Report before making an investment
decision with regard to our securities. The statements contained in or
incorporated into this Annual Report that are not historic facts are
forward-looking statements that are subject to risks and uncertainties that
could cause actual results to differ materially from those set forth in or
implied by forward-looking statements. If any of the following events
described in these risk factors actually occurs, our business,
financial condition or results of operations could be harmed. In that case, the
trading price of our common stock could decline, and you may lose all or part of
your investment.
Risks
Relating to Our Industry
Our
sales are influenced by general economic cycles. A prolonged period of depressed
consumer spending would have a material adverse effect on our
profitability.
Apparel
is a cyclical industry that is dependent upon the overall level of consumer
spending. Purchase of apparel generally declines during recessionary periods
when disposable income is low. Our customers anticipate and respond to adverse
changes in economic conditions and uncertainty by reducing inventories and
canceling orders. As a result, any substantial deterioration in general economic
conditions, increases in energy costs or interest rates, acts of war, acts of
nature or terrorist or political events that diminish consumer spending and
confidence in any of the regions in which we compete, could reduce our sales and
adversely affect our business and financial condition. We currently sell to
customers in the U.S., the EU and Japan. Accordingly, economic conditions
and consumer spending patterns in these regions could affect our sales, and an
economic down turn in one or more of these regions could have an adverse
effect on our business. The economic downturn in the latter part of
2008 has resulted in the shortening of production cycles, i.e. from the
placement of orders by customers to the production of the finished
products. As a result, we had more pressure in
our production cycle and our gross margin decreased.
Intense
competition in the worldwide apparel industry could reduce our sales and
prices.
We face a
variety of competitive challenges from other apparel manufacturers both in China
and other countries. Some of these competitors have greater financial and
marketing resources than we do and may be able to adapt to changes in consumer
preferences or retail requirements more quickly, devote greater resources to the
marketing and sale of their products or adopt more aggressive pricing policies
than we can. As a result, we may not be able to compete successfully with them
if we cannot continue enhancing our marketing and management strategies, quality
and value or responding appropriately to consumers needs.
The
success of our business depends upon our ability to offer innovative and
upgraded products at attractive price points.
The
worldwide apparel industry is characterized by constant product innovation due
to changing consumer preferences and by the rapid replication of new products by
competitors. As a result, our success depends in large part on our ability to
continuously and rapidly respond to customer requirements for innovative and
stylish products at a competitive pace, intensity, and price. Failure on our
part to regularly and rapidly respond to customer requirements could adversely
affect our ability to retain our existing customers or to acquire new
customers which would limit our sales growth.
12
The
worldwide apparel industry is subject to ongoing pricing pressure.
The
apparel market is characterized by low barriers to entry for both suppliers and
marketers, global sourcing through suppliers located throughout the world, trade
liberalization, continuing movement of product sourcing to lower cost countries,
ongoing emergence of new competitors with widely varying strategies and
resources, and an increasing focus on apparel in the mass merchant channel of
distribution. These factors contribute to ongoing pricing pressure throughout
the supply chain. This pressure has and may continue to:
|
|
·
|
require us to reduce wholesale
prices on existing products;
|
|
|
·
|
result in reduced gross margins
across our product lines;
|
|
|
·
|
increase pressure on us to
further reduce our production costs and our operating
expenses.
|
Any of
these factors could adversely affect our business and financial
condition.
Fluctuation
in the price, availability and quality of raw materials could increase our cost
of goods and decrease our profitability.
We
purchase raw materials directly from local fabric and accessory suppliers. We
may also import specialty fabrics to meet specific customer requirements. We
also purchase finished goods from other contract manufacturers. The prices we
charge for our products are dependent in part on the market price for raw
materials used to produce them. The price, availability and quality of our raw
materials may fluctuate substantially, depending on a variety of factors,
including demand, crop yields, weather patterns, supply conditions,
transportation costs, government regulation, economic climates and other
unpredictable factors. Any raw material price increases could increase our cost
of goods and decrease our profitability unless we are able to pass higher prices
on to our customers.
As of
December 31, 2009 and 2008, we did not rely on any raw material supplier which
exceeds 10% of all of our total raw material purchases. For the wholesale
business, during 2009 the Company relied on two manufacturers for 18% and 11% of
purchased finished goods while in 2008 the Company relied on one manufacturer
for 21% of purchased finished goods . For the retail business, during 2009 the
Company did not rely on any single raw material supplier while in 2008 the
Company relied on two manufacturers for 29% of purchased finished goods. We do
not have any long-term written agreements with any of these suppliers and
do not anticipate entering into any such agreements in the near future. However,
we always execute a written agreement for each order placed with our suppliers.
We do not believe that loss on any of these suppliers would have a material
adverse effect on our ability to obtain finished goods or raw materials
essential to our business because we believe we can locate other suppliers in a
timely manner.
Risks
Relating to Our Business
Our
wholesale business depends on some key customers for a significant portion of
our sales. A significant adverse change in a customer relationship or in a
customer’s performance or financial position could harm our business and
financial condition.
For the
year ended December 31, 2009, our five largest customers represented
approximately 49% of our total net sales. For the year ended December 31, 2008,
our top five largest customers represented approximately 52% of our total net
sales. The garment manufacturing industry has experienced substantial
consolidation in recent years, which has resulted in increased customer leverage
over suppliers, greater exposure for suppliers to credit risk and an increased
emphasis by customers on inventory management and productivity.
A
decision by a major customer, whether motivated by competitive considerations,
strategic shifts, financial requirements or difficulties, economic conditions or
otherwise, to decrease its purchases from us or to change its manner of doing
business with us, could adversely affect our business and financial condition.
In addition, while we have long-standing customer relationships, we do not have
long-term contracts with any of our customers.
13
As a
result, purchases generally occur on an order-by-order basis, and the
relationship, as well as particular orders, can generally be terminated by
either party at any time. We do not believe that there is any material risk of
loss of any of these customers during the next 12 months. We also believe that
the unexpected loss of these customers could have material adverse effect on our
earnings or financial condition. While we believe that we could replace these
customers within 12 months, the loss of which will not have material adverse
effect on our financial condition in the long term. None of our affiliates are
officers, directors, or material shareholders of any of these
customers.
Our
business relies heavily on our ability to identify changes in fashion
trend.
Our
success depends in part on our ability to effectively predict and respond to
changing fashion tastes by offering appropriate products. Failure to
effectively follow the changing fashion trend will lead to higher seasonal
inventory levels. Our continuous ability to respond to the changing
customer demands constitutes a material risk to the success of our retail
success. For our wholesale business, if we could not swiftly respond
to the changing fashion trend, the sample we designed for the clients may not be
accepted or the products based on our design may be put into inventory and thus
have a negative impact on the amount of order the client may place with
us.
Our
ability to attract customers to the stores heavily depends on their
location.
Our
flagship stores and the store-within-a-stores are selectively located in what we
believe to be prominent locations or popular department stores to generate
customer traffic. The availability and/or cost of appropriate
locations for the existing or future stores may fluctuate for reasons beyond our
control. If we are unable to secure these locations or to renew
store leases on acceptable terms, we may not continue to attract the amount of
customers, which will have a material adverse effect on our sales and results of
operations.
We
may not be successful in expanding our LA GO GO retail business by opening
profitable new stores.
Our
future growth requires our continuous increase of new flagship stores and
stores-within-a-store in selected cities, improve our operating capabilities,
and retain and hire qualified sales personnel in these stores. There
can be no assurance that we will be able to achieve our store expansion goals,
nor any assurance that our newly opened stores will achieve revenue or
profitability levels comparable to those of our existing stores. If our stores
fail to achieve acceptable revenue, we may incur significant costs associated
with closing those stores.
We
depend on key personnel, and our ability to grow and compete will be harmed if
we do not retain the continued services of such personnel.
We depend
on the efforts and expertise of our management team. The loss of services of one
or more members of this team, each of whom have substantial experience in the
garment industry, could have an adverse effect on our business. If we are unable
to hire and retain qualified management or if any member of our management
leaves, such departure could have an adverse effect on our operations. In
particular, we believe we have benefited substantially from the leadership and
strategic guidance of our CEO and Chairman of the Board, Mr. Edward Yihua
Kang.
Our
ability to anticipate and effectively respond to changing fashion trends depends
in part on our ability to attract and retain key personnel in our design,
merchandising and marketing areas. In addition, if we experience material
growth, we will need to attract and retain additional qualified personnel. The
market for qualified and talented design and marketing personnel in the apparel
industry is intensely competitive, and we cannot be sure that we will be able to
attract and retain a sufficient number of qualified personnel in future periods.
If we are unable to attract or retain qualified personnel as needed, our growth
will be hampered and our operating results could be materially adversely
affected.
14
If
we fail to protect our trademark and maintain the value of our LA GO GO brand,
our retail sales are likely to decline.
We intend
to vigorously protect our trademark against infringement, but we may not be
successful in doing so. The unauthorized reproduction or other misappropriation
of our trademark would diminish the value of our brand, which could reduce
demand for our products or the prices at which we can sell our products. The
success of our retail operation significantly depends on the value and image of
the LAGOGO
brand. Our brand could be adversely affected if we fail to maintain and promote
the LA GO GO brand by successful marketing.
Failure
to maintain and/or upgrade our information technology systems may have an
adverse effect on our operation.
We rely
on various information technology systems to manage our operations, and we
regularly evaluate these systems against our current and expected requirements.
Although we have no current plans to implement modifications or upgrades to our
systems, we will eventually be required to make changes to legacy systems and
acquire new systems with new functionality. We are considering additional
investments in updating our ERP system to help us improve our internal control
system and to meet compliance requirements under Section 404. We are also
continuing to develop and update our internal information systems on a timely
basis to meet our business expansion needs. Any information technology system
disruptions, if not anticipated and appropriately mitigated, could have an
adverse effect on our business and operations.
We
may engage in future acquisitions and strategic investments that dilute the
ownership percentage of our shareholders and require the use of cash, incur debt
or assume contingent liabilities.
As part
of our business strategy, we expect to continue to review opportunities to buy
or invest in other businesses or technologies that we believe would enhance our
manufacturing capabilities, or that may otherwise offer growth opportunities. If
we buy or invest in other businesses in the future, this may require the use of
cash, or we may incur debt or assume contingent liabilities.
As part
of our business strategy, we expect to continue to review opportunities to buy
or invest in other businesses or technologies that we believe would complement
our current products, expand the breadth of our markets or enhance our technical
capabilities, or that may otherwise offer growth opportunities. If we buy or
invest in other businesses, products or technologies in the future, we
could:
|
|
·
|
incur significant unplanned
expenses and personnel
costs;
|
|
|
·
|
issue stock that would dilute our
current shareholders’ percentage
ownership;
|
|
|
·
|
use cash, which may result in a
reduction of our liquidity;
|
|
|
·
|
incur debt; assume liabilities;
and
|
|
|
·
|
spend resources on unconsummated
transactions.
|
We
may not realize the anticipated benefits of past or future acquisitions and
strategic investments, and integration of acquisitions may disrupt our business
and management.
We may in
the future acquire or make strategic investments in additional companies. We may
not realize the anticipated benefits of these or any other acquisitions or
strategic investments, which involve numerous risks, including:
|
|
·
|
unsuccessfully integrating the
purchased operations, technologies, personnel or products over
geographically disparate
locations;
|
|
|
·
|
unanticipated costs, litigation
and other contingent
liabilities;
|
|
|
·
|
diversion of management’s
attention from our core
business;
|
|
|
·
|
adverse effects on existing
business relationships with suppliers and
customers;
|
|
|
·
|
incurrence of acquisition-related
costs or amortization costs for acquired intangible assets that could
impact our operating
results;
|
15
|
|
·
|
inability to retain key
customers, distributors, vendors and other business partners of the
acquired business; and
|
|
|
·
|
potential loss of our key
employees or the key employees of an acquired
organization;
|
If we are
not be able to successfully integrate businesses, products, technologies or
personnel that we acquire, or to realize expected benefits of our acquisitions
or strategic investments, our business and financial results may be adversely
affected.
International
political instability and concerns about other international crises may increase
our cost of doing business and disrupt our business.
International
political instability may halt or hinder our ability to do business and may
increase our costs. Various events, including the occurrence or threat of
terrorist attacks, increased national security measures in the EU, the United
States and other countries, and military action and armed conflicts, can
suddenly increase international tensions. Increases in energy prices will also
impact our costs and could harm our operating results. In addition, concerns
about other international crises, such as the spread of severe acute respiratory
syndrome (“SARS”), avian influenza, or bird flu, and West Nile viruses, may have
an adverse effect on the world economy and could adversely affect our business
operations or the operations of our OEM partners, contract manufacturer and
suppliers. This political instability and concerns about other international
crises may, for example:
|
|
·
|
negatively affect the reliability
and cost of transportation;
|
|
|
·
|
negatively affect the desire and
ability of our employees and customers to
travel;
|
|
|
·
|
adversely affect our ability to
obtain adequate insurance at reasonable
rates;
|
|
|
·
|
require us to take extra security
precautions for our operations;
and
|
|
|
·
|
furthermore, to the extent that
air or sea transportation is delayed or disrupted, our operations may be
disrupted, particularly if shipments of our products are
delayed.
|
Business
interruptions could adversely affect our business.
Our
operations and the operations of our suppliers and customers are vulnerable to
interruption by fire, earthquake, hurricanes, power loss, telecommunications
failure and other events beyond our control. In the event of a major natural
disaster, we could experience business interruptions, destruction of facilities
and loss of life. In the event that a material business interruption occurs that
affects us or our suppliers or customers, shipments could be delayed and our
business and financial results could be harmed.
Risks
Related to Doing Business in China
Because
our assets are located overseas, shareholders may not receive distributions that
they would otherwise be entitled to if we were declared bankrupt or
insolvent.
Our
assets are, for the most part, located in the PRC. Because our assets are
located overseas, our assets may be outside of the jurisdiction of U.S. courts
if we are the subject of an insolvency or bankruptcy proceeding. As a result, if
we declared bankruptcy or insolvency, our shareholders may not receive the
distributions on liquidation that they would
otherwise be entitled to if our assets were to be located within the
U.S., under U.S. bankruptcy law.
16
Export
quotas imposed by the WTO could negatively affect our business and operations,
particularly if the Chinese government changes its allocation of such quotas to
us.
Pursuant
to a World Trade Organization (“WTO”) agreement, effective January 1, 2005, the
United States and other WTO member countries agreed to remove quotas applicable
to textiles. However, as the removal of quotas resulted in an import surge
from China, the U.S. took action in May 2005, and imposed safeguard quotas on
seven categories of goods, including certain classes of apparel products,
arousing strong objection from China.
On June
10, 2005, in response to the surge of Chinese imports into the EU, the EU
Commission signed a Memorandum of Understanding (“EU MOU”) with China in which
ten categories of textiles and apparel are subject to restraints.
Additionally, on November 8, 2005, the U.S. and China entered into a Memorandum
of Understanding (“US MOU”) in which 21 categories of textiles and
apparel are subject to restraints. Although certain of our apparel products
fall within the categories subject to the safeguards in the U.S. and the EU,
which could adversely affect our ability to export and sell these products, the
imposition of quotas in 2005 did not have a material effect on our net
sales, although it did impact our gross margin. There can be no assurance that
additional trade restrictions will not be imposed on the exportation of our
products in the future. Such actions could result in increases in the cost
of our products generally and may adversely affect our results of
operations.
Adverse
changes in economic and political policies of the PRC government could have a
material adverse effect on the overall economic growth of China, which could
adversely affect our business.
All of
our business operations are currently conducted in the PRC, under the
jurisdiction of the PRC government. Accordingly, our results of operations,
financial condition and prospects are subject to a significant degree to
economic, political and legal developments in China. China’s economy differs
from the economies of most developed countries in many respects, including with
respect to the amount of government involvement, level of development,
growth rate, control of foreign exchange and allocation of resources. While
the PRC economy has experienced significant growth in the past 20 years, growth
has been uneven across different regions and among various economic sectors of
China. The PRC government has implemented various measures to encourage economic
development and guide the allocation of resources. Some of these measures
benefit the overall PRC economy, but may also have a negative effect on us. For
example, our financial condition and results of operations may be adversely
affected by government control over capital investments or changes in tax
regulations that are applicable to us. Since early 2004, the PRC government has
implemented certain measures to control the pace of economic growth. Such
measures may cause a decrease in the level of economic activity in China, which
in turn could adversely affect our results of operations and financial
condition.
Unprecedented
rapid economic growth in China may increase our costs of doing business, and may
negatively impact our profit margins and/or profitability.
Our
business depends in part upon the availability of relatively low-cost labor and
materials. Rising wages in China may increase our overall costs of production.
In addition, rising raw material costs, due to strong demand and greater
scarcity, may increase our overall costs of production. If we are not able to
pass these costs on to our customers in the form of higher prices, our profit
margins and/or profitability could decline.
Fluctuation
in the value of Chinese RMB relative to other currencies may have a
material adverse effect on our business and/or an investment in our
shares.
The value
of RMB against the U.S. Dollar, the Euro and other currencies may fluctuate and
is affected by, among other things, changes in political and economic
conditions. In the last decade, the RMB has been pegged at RMB 8.2765 to one
U.S. Dollar. Following the removal of the peg to the U.S. Dollar and pressure
from the United States, the People’s Bank of China also announced that the RMB
would be pegged to a basket of foreign currencies, rather than being strictly
tied to the U.S. Dollar, and would be allowed to float trade within a narrow
0.3% daily band against this basket of currencies. The PRC government
has stated that the basket is dominated by the U.S. Dollar, the Euro,
Japanese Yen and South Korean Won, with a smaller proportion made up of the
British Pound, Thai Baht, Russian Ruble, Australian Dollar, Canadian Dollar and
Singapore Dollar. There can be no assurance that the relationship between the
RMB and these currencies will remain stable over time, especially in light of
the significant political pressure on the Chinese government to permit the free
flotation of the RMB, which could result in greater and more frequent
fluctuations in the exchange rate between the RMB, the U.S. Dollar, and the
Euro. If the RMB were to increase in value against the U.S. Dollar and other
currencies, for example, consumers in the U.S., Japan and Europe would
experience an increase in the relative prices of goods and services produced by
us, which might translate into a decrease in sales. In addition, if the RMB were
to decline in value against these other currencies, the financial value of your
investment in our shares would also decline.
17
You
may face difficulties in protecting your interests, and your ability to protect
your rights through the U.S. federal courts may be limited, because our
subsidiaries are incorporated in non-U.S. jurisdictions, we conduct
substantially all of our operations in China, and a majority of our officers
reside outside the United States.
Although
we are incorporated in Florida, we conduct substantially all of our operations
in China through our wholly owned subsidiaries in China. The majority of our
officers reside outside the United States and some or all of the assets of those
persons are located outside of the United States. As a result, it may be
difficult or impossible for you to bring an action against us or against these
individuals in China in the event that you believe that your rights have been
infringed under the securities laws or otherwise. Even if you are successful in
bringing an action of this kind, the laws of the PRC may render you unable to
enforce a judgment against our assets or the assets of our directors and
officers.
As a
result of all of the above, our public shareholders may have more difficulty in
protecting their interests through actions against our management, directors or
major shareholders than would shareholders of a corporation doing business
entirely within the United States.
Risks
Related to an Investment in Our Securities
Our
common stock has limited liquidity.
Our
common stock has been trading on the NYSE Amex (formerly, the American
Stock Exchange and NYSE Alternext US LLC) since July 16, 2008, but it is
thinly traded compared to larger more widely known companies in the same
industry. Thinly traded common stock can be more volatile than stock trading in
an active public market. We cannot predict the extent to which an active public
market for our common stock will develop or be sustained. The high and low bid
price of Ever-Glory’s common stock during the past 52 week period ended December
31, 2009 has been US$3.14 and US$0.65 per share respectively.
We cannot
predict the extent to which an active public market for our common stock will
develop or be sustained. Our common shares are currently traded, but
currently with low volume, based on quotations on the NYSE Amex, meaning that
the number of persons interested in purchasing our common shares at or near bid
prices at any given time may be relatively small or non-existent. This situation
is attributable to a number of factors, including the fact that we are a small
company which is still relatively unknown to stock analysts, stock brokers,
institutional investors and others in the investment community that generate or
influence trading volume. And even if we came to the attention of such persons,
they tend to be risk-averse and would be reluctant to follow an unproven company
such as ours or purchase or recommend the purchase of our shares until such time
as we became more seasoned and viable. As a consequence, there may be periods of
several days or more when trading activity in our shares is minimal or
non-existent, as compared to a seasoned issuer which has a large and steady
volume of trading activity that will generally support continuous trading
without an adverse effect on share price. We cannot give you any assurance that
a broader or more active public trading market for our common stock will develop
or be sustained, or that trading levels will be sustained.
FINRA sales
practice requirements may also limit a shareholder’s ability to buy and sell our
stock.
FINRA has
adopted rules that require that in recommending an investment to a customer, a
broker-dealer must have reasonable grounds for believing that the investment is
suitable for that customer. Prior to recommending speculative low priced
securities to their non-institutional customers, broker-dealers must make
reasonable efforts to obtain information about the customer’s financial status,
tax status, investment objectives and other information. Under interpretations
of these rules, FINRA believes that there is a high probability that speculative
low priced securities will not be suitable for at least some customers. The
FINRA requirements make it more difficult for broker-dealers to recommend that
their customers buy our common stock, which may limit your ability to buy and
sell our stock and have an adverse effect on the market for our
shares.
18
We
expect to experience volatility in our stock price, which could negatively
affect shareholders’ investments.
The
market price for shares of our common stock may be volatile and may fluctuate
based upon a number of factors, including, without limitation, business
performance, news announcements or changes in general market
conditions.
Other
factors, in addition to the risks included in this section, that may have a
significant impact on the market price of our common stock include, but are not
limited to:
|
|
·
|
receipt of substantial orders or
order cancellations of
products;
|
|
|
·
|
quality deficiencies in services
or products;
|
|
|
·
|
international developments, such
as technology mandates, political developments or changes in economic
policies;
|
|
|
·
|
changes in recommendations of
securities analysts;
|
|
|
·
|
shortfalls in our backlog, sales
or earnings in any given period relative to the levels expected by
securities analysts or projected by
us;
|
|
|
·
|
government regulations, including
stock option accounting and tax
regulations;
|
|
|
·
|
energy
blackouts;
|
|
|
·
|
acts of terrorism and
war;
|
|
|
·
|
widespread
illness;
|
|
|
·
|
proprietary rights or product or
patent litigation;
|
|
|
·
|
strategic transactions, such as
acquisitions and
divestitures;
|
|
|
·
|
rumors or allegations regarding
our financial disclosures or practices;
or
|
|
|
·
|
earthquakes or other natural
disasters in Nanjing or Shanghai, China where a significant portion of our
operations are based.
|
In the
past, securities class action litigation has often been brought against a
company following periods of volatility in the market price of its securities.
Due to changes in the volatility of our common stock price, we may be the target
of securities litigation in the future. Securities litigation could result in
substantial costs and divert management’s attention and resources.
To
date, we have not paid any cash dividends and no cash dividends will be paid in
the foreseeable future.
We do not
anticipate paying cash dividends on our common stock in the foreseeable future
and we may not have sufficient funds legally available to pay dividends. Even if
the funds are legally available for distribution, we may nevertheless decide not
to pay any dividends. We presently intend to retain all earnings for our
operations.
Our
corporate actions are substantially controlled by our principal shareholders and
affiliated entities.
Our
principal shareholders, which includes our officers and directors, and their
affiliated entities own approximately 73% of our outstanding shares of common
stock. These shareholders, acting individually or as a group, could exert
substantial influence over matters such as electing directors and approving
mergers or other business combination transactions. In addition, because of the
percentage of ownership and voting concentration in these principal shareholders
and their affiliated entities, elections of our Board of Directors will
generally be within the control of these shareholders and their affiliated
entities. While all of our shareholders are entitled to vote on matters
submitted to our shareholders for approval, the concentration of shares and
voting control presently lies with these principal shareholders and their
affiliated entities. As such, it would be difficult for shareholders to propose
and have approved proposals not supported by management. There can be no
assurances that matters voted upon by our officers and directors in their
capacity as shareholders will be viewed favorably by all of our
shareholders.
19
The
elimination of monetary liability against our directors, officers and employees
under Florida law and the existence of indemnification rights to our directors,
officers and employees may result in substantial expenditures by our company and
may discourage lawsuits against our directors, officers and
employees.
Our
amended and restated Articles of Incorporation contain a provision permitting us
to eliminate the liability of our directors for monetary damages to our company
and shareholders to the extent provided by Florida law. We may also have
contractual indemnification obligations under our employment agreements with our
officers. The foregoing indemnification obligations could result in our company
incurring substantial expenditures to cover the cost of settlement or damage
awards against directors and officers, which we may be unable to recoup. These
provisions and resultant costs may also discourage our company from bringing a
lawsuit against directors and officers for breaches of their fiduciary duties,
and may similarly discourage the filing of derivative litigation by our
shareholders against our directors and officers even though such actions, if
successful, might otherwise benefit our company and shareholders.
If
we fail to maintain an effective system of internal controls, we may not be able
to accurately report our financial results or prevent material
misstatements.
Under
Section 404 of the Sarbanes-Oxley Act of 2002, we are required to evaluate
and determine the effectiveness of our internal control over financial
reporting. In our Annual Report on Form 10-K for the year ended
December 31, 2009, we concluded that our internal control over financial
reporting was not effective as of December 31, 2009 based on our
assessment. For more information, please refer to Item 9. Controls and
Procedures. Our failure to achieve and maintain
effective internal control reporting could result in loss of our investor
confidence in the reliability of our financial statements, which in turn could
harm our business and negatively impact the trading price of our common
stock. Furthermore, we anticipate that we will incur considerable
costs and use significant management time and other resources in an effort to
comply with Section 404 and other requirements of the Sarbanes-Oxley
Act.
Item
1B. UNRESOLVED STAFF COMMENTS
None.
Item
2. PROPERTIES
Wholesale
segment
In 2009,
we operated three complexes as our operating and production facilities at 509
Chengxin Road, in the Nanjing Jiangning Economic and Technological Development
Zone, Shangfang Town, Nanjing, China. The following is a description of
these facilities:
(i) Goldenway. Our
Goldenway facilities include 112,442 square meters of floor
space. Our Goldenway facility hosts administrative, sales and
distribution functions in addition to manufacturing. On June 24, 2006 we
obtained the right to use the land on which these facilities are constructed for
50 years. There are no material encumbrances on these
facilities.
(ii) New-Tailun. Our
New-Tailun facilities include 25,000 square meters of floor space.
Approximately 560 employees work at this location. Our New-Tailun facility
mainly handles manufacturing. We lease the New-Tailun facility and the land
from Jiangsu Ever-Glory for US$50,452 per annum under a two year leasing
arrangement that expired on December 31,2009. In January 2010, we signed a new
two-year lease with Jiangsu Ever-Glory with annual rent
of approximately $46,000.
(iii)
Catch-Luck. Our
Catch-Luck facilities include 6,635 square meters of office and production
space. Approximately 520 employees work at those locations. Our Catch-Luck
facility mainly handles manufacturing. These facilities are located on
the piece of land for which we have the 50-year land use right.
In
addition, under certain lease arrangement between Goldenway and Jiangsu
Ever-Glory International Group Corporation, (“Jiangsu
Ever-Glory”), Goldenway currently holds the right to lease certain land and
use certain building and improvements on that land until 2016. In 2009
we leased part of this facility to a non- affiliated third party under a lease
with an annual rent of approximately $18,000.
20
We
believe that our current facilities will be sufficient to sustain our
wholesale operations for the foreseeable future.
Retail
Segment
For our
retail operations, we have a one year lease arrangement for our administrative
offices and a three-year lease for our warehouse. The current
flagship stores are generally leased under agreements with real estate
developers or department store or shopping mall operators for terms ranging from
2 to 5 years. The store-within-a-store are counters leased from
department stores for which we generally pay approximately 30%
of sales revenue as rent. We believe the administrative and warehouse
facilities are adequate to sustain our operations for the foreseeable future. We
also believe that the locations of the flagship stores and the
stores-within-a-store units are carefully selected and suitable for the LA GO GO
operation.
Item
3. LEGAL PROCEEDINGS
There is
no material pending legal proceeding to which the Company is a
party.
PART
II
Item 5. MARKET FOR REGISTRANT’S COMMON
EQUITY, RELATED STOCKHOLDER MATTERS AND ISSUER PURCHSES OF EQUITY
SECURITIES.
Market
for Common Equity
Our
common stock was quoted on the Over-The-Counter Bulletin Board (the “OTCBB”)
initially under the symbol “EGLY” and then it was changed to “EVGY” in
2007. On July 16, 2008 our common stock commenced trading on the NYSE
Amex LLC (“NYSE Amex”)(formerly named the American Stock Exchange and the NYSE
Alternext US LLC) under the symbol of “EVK”. As of December 31, 2009, there
were approximately 65 shareholders of record of our common stock. The number of
registered shareholders excludes any estimate by us of the number of beneficial
owners of common shares held in street name. The following table sets forth the
high and low bid information for the common stock for each quarter within the
last two fiscal years, as reported by the OTCBB on a quarterly basis for the
periods during which our common stock was quoted on the OTCBB and as reported by
the NYSE Amex from the third quarter of 2008 following our listing
thereon. These quotations reflect inter-dealer prices, without retail
mark-up, mark-down or commission and may not represent actual
transactions.
NYSE
AMEX
|
Bid Price
|
||||||||
|
PERIOD
|
HIGH
|
LOW
|
||||||
|
FISCAL
YEAR 2009
|
||||||||
|
Fourth
Quarter ended December 31, 2009
|
$ | 3.14 | $ | 2.05 | ||||
|
Third
Quarter ended September 30, 2009
|
$ | 2.15 | $ | 1.61 | ||||
|
Second
Quarter ended June 30, 2009
|
$ | 2.50 | $ | 1.53 | ||||
|
First
Quarter ended March 31, 2009
|
$ | 2.50 | $ | 0.65 | ||||
|
FISCAL
YEAR 2008:
|
||||||||
|
Fourth
Quarter ended December 31, 2008
|
$ | 2.49 | $ | 0.89 | ||||
|
Third
Quarter ended September 30, 2008
|
$ | 4.89 | $ | 1.90 | ||||
OTCBB
|
Bid Price
|
||||||||
|
PERIOD
|
HIGH
|
LOW
|
||||||
|
FISCAL
YEAR 2008:
|
||||||||
|
Second
Quarter ended June 30, 2008
|
$ | 4.80 | $ | 3.89 | ||||
|
First
Quarter ended March 31, 2008
|
$ | 3.60 | $ | 2.70 | ||||
21
On March
30, 2010, the closing sale price of our common stock on the NYSE Amex
was $2.95 per share. The stock prices shown in the table above are retroactively
adjusted, as applicable, to reflect our 10-to-1 reverse stock split effective on
November 20, 2007.
Dividend
Policy
We have
never declared or paid any cash dividends on our capital stock. We currently
intend to retain all of our net income for use in our business, and do not
anticipate paying any cash dividends in the foreseeable future. Any future
determination relating to dividend policy will be made at the discretion of
our Board of Directors and will depend on a number of factors, including future
earnings, capital requirements, financial condition and future prospects and
other factors the Board of Directors may deem relevant.
Item
6. SELECTED FINANCIAL DATA
Not
applicable
|
ITEM
7.
|
MANAGEMENT’S
DISCUSSION AND ANALYSIS OF FINANCIAL CONDITION AND RESULTS OF
OPERATIONS
|
The
following discussion and analysis of our financial condition and results of
operations for the year ended December 31, 2009 should be read in conjunction
with the Financial Statements and corresponding notes included in this annual
Report on Form 10-K. Our discussion includes forward-looking statements based
upon current expectations that involve risks and uncertainties, such as our
plans, objectives, expectations, and intentions. Actual results and the timing
of events could differ materially from those anticipated in these
forward-looking statements as a result of a number of factors, including those
set forth under the Risk Factors and Special Note Regarding Forward-Looking
Statements in this report. We use words such as “anticipate,” “estimate,”
“plan,” “project,” “continuing,” “ongoing,” “expect,” “believe,” “intend,”
“may,” “will,” “should,” “could,” “target”, “forecast” and similar expressions
to identify forward-looking statements.
Overview
Our
Business
We are a
leading apparel supply-chain manager and retailer in China, and are listed
on the NYSE Amex.
We
classify our businesses into two segments: wholesale and retail. Our wholesale
business consists of wholesale-channel sales made principally to famous brands,
department stores and specialty stores located throughout Europe, U.S., Japan
and the People’s Republic of China (the “PRC”). We have a focus on well-known,
middle-to-high grade casual wear, sportswear, and outerwear brands. Our retail
business which consists of retail-channel sales directly to consumers through
full-price retail stores located throughout the PRC.
Although
we have our own manufacturing facilities, we currently outsource most
manufacturing to our strategic alliances as part of our overall business
strategy. Outsourcing allows us to maximize our production capacity and
maintain flexibility while reducing capital expenditures and the costs of
keeping skilled workers on production lines during low season. Our management
oversees the long-term contractors and inspects products manufactured by them to
ensure that they meet our high quality control standards and timely delivery.
Our annual production capacity including outsourcing orders is in excess of 12
million pieces.
On
January 6, 2009, we established Ever-Glory International Group Apparel Inc.
(“Ever-Glory Apparel”) a wholly-owned subsidiary of Goldenway. On March 23,
2009, Goldenway transferred all of its ownership interest in LA GO GO to
Ever-Glory Apparel. On September 15, 2009, we established Ever-Glory
International Group (HK) Ltd. (“Ever-Glory HK”), a wholly-owned subsidiary of
Perfect Dream. Ever-Glory Apparel and Ever-Glory HK are principally engaged in
the import and export of apparel, fabric and accessories. In order to
reduce related transaction costs, we have been gradually shifting our import and
export business to Ever-glory Apparel and Ever-Glory HK. We previously utilized
Jiangsu Ever-Glory International Group Corporation (“Jiangsu Ever-Glory”),;
an entity controlled by Mr. Edward Yihua Kang, our Chairman of the Board and
Chief Executive Officer, to assist with our import and export
business.
22
Wholesale
Business
We
conduct our original design manufacturing (“ODM”) operations through four
wholly-owned subsidiaries which are located in the Nanjing Jiangning Economic
and Technological Development Zone and Shang Fang Town in the Jiangning
District in Nanjing, China: Ever-Glory Apparel, Goldenway Nanjing Garments
Company Limited (“Goldenway”), Nanjing New-Tailun Garments Company Limited (“New
Tailun”), and Nanjing Catch-Luck Garments Co., Ltd. (“Catch-Luck”).
Retail
Business
We
conduct our retail operations through Shanghai LA GO GO Fashion Company Limited
(“LA GO GO”), a joint venture of Ever-Glory Apparel and Shanghai La Chapelle
Garment and Accessories Company Limited, located in Shanghai, China. The
business objective of the joint venture is to establish a leading brand of
women’s wear and to build a retail and wholesale distribution channel for
the mainland Chinese market.
Business
Objectives
Wholesale
Business
We
believe the strength of our wholesale business is due to our consistent emphasis
on innovative and distinct product designs with exceptional styling and quality.
We maintain long-term relationships with a portfolio of well-known, middle to
higher class global brands, a strong and experienced management team and a
proven ability to design, market and distribute our own brand through
fast-growing retail channels in a highly populated country.
The
primary business objective for our wholesale segment is to expand our portfolio
into higher class brands, expand our customer base and improve margins.
Opportunities and continued investment initiatives include:
|
|
·
|
Expand
our global sourcing network;
|
|
|
·
|
Invest
in our overseas low-cost manufacturing base (outside of mainland
China);
|
|
|
·
|
Focus
on value and continue our average selling price
uptrend;
|
|
|
·
|
Emphasize
product design and new technology utilization;
and
|
|
|
·
|
Seek
strategic acquisitions of international distributors that could enhance
global sales and our distribution
network
|
Retail
Business
The
business objective for our retail segment is to further establish a leading
brand of women’s apparel and to build a nationwide retail distribution channel
in China. As of December 31, 2009 we operated 185 stores. During 2009 we opened
100 stores and closed 8 stores. We expect to open an additional 80-100 stores in
2010.
23
Opportunities
and continued investment initiatives include:
|
|
·
|
Become
a multi-brand operator;
|
|
|
·
|
Build
the LA GO GO brand to become a major Chinese mid-end mass market in
women's wear;
|
|
|
·
|
Seek
opportunities for long-term cooperation with reputable international
brands to expand our retail
business;
|
|
|
·
|
Facilitate
the entry of international brands into the PRC retail
market;
|
|
|
·
|
Expand
the LA GO GO retail network;
|
|
|
·
|
Improve
the LA GO GO retail store efficiency and increase same store
sales;
|
|
|
·
|
Strengthen
the LA GO GO brand promotion; and
|
|
|
·
|
Launch
LA GO GO flagship stores in Tier-1 Cities and increase penetration and
coverage in Tier-2 and Tier-3
Cities
|
Seasonality
of Business
Our
business is affected by seasonal trends, with higher levels of wholesale sales
in our third and fourth quarters and higher retail sales in our first and fourth
quarters. These trends result primarily from the timing of seasonal wholesale
shipments and holiday periods in the retail segment.
Collection
Policy
Wholesale
business
For our
new customers, we generally require orders to be backed by letters of credit.
For our long-term and established customers with a good payment track record, we
generally provide payment terms of between 30 and 120 days following delivery of
finished goods.
Retail
business
For
store-in-store shops, we generally receive payments from the stores between
60-90 days following the time of register receipt. For our own stores, we
receive payments at the point of sale.
Global
Economic Uncertainty
Our
business is dependent on consumer demand for our products. We believe that the
significant uncertainty in the global economy and a slowdown in the United
States. and the European economy have increased our clients’ sensitivity to the
cost of our products as reflected in our revenues for 2009 when compared to
2008. We have experienced continued pricing pressure this year. If the global
economic environment continues to be weak, these worsening economic conditions
could have a negative impact on the Company’s sales growth and operating
margins.
24
In
addition, economic conditions in the United States and in foreign markets in
which we operate could substantially affect our sales and profitability and our
cash position and collection of accounts receivable. Global credit
and capital markets have experienced unprecedented volatility and disruption.
Business credit and liquidity have tightened in much of the world. Some of our
suppliers and customers may face credit issues and could experience cash flow
problems and other financial hardships. These factors currently have not had an
impact on the timeliness of receivable collections from our customers. The
Company cannot predict at this point of time how this situation will develop and
whether accounts receivable may need to be allowed for or written off in the
coming quarters.
Despite
the various risks and uncertainties associated with the current global economy,
we believe our core strengths will continue to allow us to execute our strategy
for long-term sustainable growth in revenue, net income and operating cash
flow.
Summary
of Critical Accounting Policies
We have
identified critical accounting policies that, as a result of judgments,
uncertainties, uniqueness and complexities of the underlying accounting
standards and operation involved could result in material changes to our
financial position or results of operations under different conditions or using
different assumptions.
Revenue
Recognition
We
recognize wholesale revenue from product sales, net of value added taxes, upon
delivery for local sales and upon shipment of the products for export sales, at
which time title passes to the customer provided that there are no uncertainties
regarding customer acceptance, persuasive evidence of an arrangement exists, the
sales price is fixed and determinable and collectability is deemed probable. We
recognize wholesale revenue from manufacturing fees charged to buyers for the
assembly of garments from materials provided by the buyers upon completion of
the manufacturing process and upon delivery to the buyer for local sales and
upon shipment of the products for export sales, provided that there are no
uncertainties regarding customer acceptance, persuasive evidence of an
arrangement exists, the sales price is fixed and determinable and collectability
is deemed probable. Retail sales are recorded at the time of register
receipt.
Estimates
and Assumptions
In
preparing our consolidated financial statements, we use estimates and
assumptions that affect the reported amounts and disclosures. Our estimates are
often based on complex judgments, probabilities and assumptions that we believe
to be reasonable, but that are inherently uncertain and unpredictable. We are
also subject to other risks and uncertainties that may cause actual results to
differ from estimated amounts. Significant estimates in 2009 and 2008
include the assumptions used to value warrants and the estimates of the
valuation allowance for deferred tax assets.
25
Recent Accounting
Pronouncements
Embedded
Derivatives
(Included
in ASC 815 “Derivatives and Hedging”, previously SFAS 133)
In
June 2008, the FASB issued Emerging Issues Task Force Issue 07-5 “Determining
whether an Instrument (or Embedded Feature) is indexed to an Entity’s Own Stock”
(“EITF No. 07-5”). This Issue is effective for financial statements issued for
fiscal years beginning after December 15, 2008, and interim periods within those
fiscal years. Early application is not permitted. Paragraph 11(a) of Statement
of Financial Accounting Standard No 133 “Accounting for Derivatives and Hedging
Activities” (“SFAS 133”) specifies that a contract that would otherwise meet the
definition of a derivative but is both (a) indexed to the Company’s own
stock and (b) classified in stockholders’ equity in the statement of
financial position would not be considered a derivative financial instrument.
EITF No.07-5 provides a new two-step model to be applied in determining whether
a financial instrument or an embedded feature is indexed to an issuer’s own
stock and thus able to qualify for the SFAS 133 paragraph 11(a) scope exception.
Upon adoption of EITF No. 07-5, the Company reclassified certain warrants that
were previously classified as equity to liability (Note 8).
Business
Combinations
(Included
in ASC 805 “Business Combinations”, previously SFAS No. 141(R))
This ASC
guidance revised SFAS No. 141, “Business Combinations” and
addresses the accounting and disclosure for identifiable assets acquired,
liabilities assumed, and noncontrolling interests in a business combination.
Adoption of this standard on January 1, 2009 did not have a material impact on
the Company’s condensed consolidated financial statements, as the Company did
not enter into a business combination during 2009.
Noncontrolling
Interests
(Included
in ASC 810 “Consolidation”, previously SFAS No. 160 “Noncontrolling Interests in
Consolidated Financial Statements, an amendment of ARB No. 51)
SFAS 160
establishes accounting and reporting standards for the noncontrolling interest
in a subsidiary and for the deconsolidation of a subsidiary. It clarifies that a
noncontrolling interest in a subsidiary is an ownership interest in the
consolidated entity that should be reported as equity in the consolidated
financial statements. The Company adopted SFAS 160 on January 1, 2009. As a
result, the Company has reclassified financial statement line items within the
Company’s Consolidated Balance Sheets and Statements of Income and Comprehensive
Income for 2008 to conform to this standard.
Interim
Disclosures about Fair Value of Financial Instruments
(Included in ASC 825 “Financial Instruments”, previously FSP SFAS No.
107-1)
This
guidance requires that the fair value disclosures required for all financial
instruments within the scope of SFAS 107, “Disclosures about Fair Value of
Financial Instruments”, be included in interim financial statements. This
guidance also requires entities to disclose the method and significant
assumptions used to estimate the fair value of financial instruments on an
interim and annual basis and to highlight any changes from prior periods. FSP
SFAS No. 107-1 was effective for interim periods ending after September 15,
2009. The adoption of FSP SFAS No.107-1 did not have a material impact on the
Company’s Consolidated Financial Statements.
26
FASB
Accounting Standards Codification
(Accounting
Standards Update (“ASU”) 2009-1)
In June
2009, the FASB approved its Accounting Standards Codification (“Codification”)
as the single source of authoritative United States accounting and reporting
standards applicable for all non-governmental entities, with the exception of
the SEC and its staff. The Codification is effective for interim or annual
financial periods ending after September 15, 2009 and impacts the Company’s
financial statements as all future references to authoritative accounting
literature will be referenced in accordance with the Codification. There have
been no changes to the content of the Company’s financial statements or
disclosures as a result of implementing the Codification during the year of
2009.As a result of the Company’s implementation of the Codification during the
year of 2009, previous references to new accounting standards and literature are
no longer applicable. In the current quarter financial statements, the Company
will provide reference to both new and old guidance to assist in understanding
the impact of recently adopted accounting literature, particularly for guidance
adopted since the beginning of the current fiscal year but prior to the
Codification.
Collaborative
arrangements
(Included
in ASC808, formerly EITF07-1)
In
December 2007, the FASB issued new accounting guidance that defines
collaborative arrangements and establishes reporting requirements for
transactions between participants in a collaborative arrangement and between
participants in the arrangement and third parties. It also establishes the
appropriate income statement presentation and classification for joint operating
activities and payments between participants, as well as the sufficiency of the
disclosures related to those arrangements. This new accounting guidance was
effective for the Company on January 1, 2009, and its adoption did not have a
significant impact on its consolidated financial statements.
Transfers
of Financial Assets
(Included
in ASC860, formerly SFAS No. 166)
In June 2009, the FASB issued
new guidance on the Accounting for Transfers of Financial Assets that addresses
information a reporting entity provides in its financial statements about the
transfer of financial assets; the effects of a transfer on its financial
position, financial performance, and cash flows; and a transferor continuing
involvement in transferred financial assets. The guidance also removes the
concept of a qualifying special purpose entity, limits the circumstances in
which a transferor derecognizes a portion or component of a financial asset,
defines participating interest and enhances the information provided to
financial statement users to provide greater transparency. This guidance is
effective for the first annual reporting period beginning after November 15,
2009 and will be effective for the Company as of January 1, 2010. The Company is
currently evaluating the impact on our consolidated financial statements upon
adoption.
27
Results
of Operations
The
following table summarizes our results of operations for the years ended
December 31, 2009 and 2008. The table and the discussion below should be read in
conjunction with the consolidated financial statements and the notes thereto
appearing elsewhere in this report.
|
Year Ended December 31
|
||||||||||||||||
|
2009
|
2008
|
|||||||||||||||
|
(in
U.S. Dollars, except for percentages)
|
||||||||||||||||
|
Sales
|
$ | 89,870,991 | 100.0 | % | $ | 97,471,682 | 100.0 | % | ||||||||
|
Gross
Profit
|
18,305,224 | 20.4 | 15,902,166 | 16.3 | ||||||||||||
|
Operating
Expenses
|
12,192,514 | 13.6 | 8,658,382 | 8.9 | ||||||||||||
|
Income
From Operations
|
6,112,710 | 6.8 | 7,243,784 | 7.4 | ||||||||||||
|
Other
Expenses
|
915,944 | 1.0 | 2,597,050 | 2.7 | ||||||||||||
|
Income
Tax Expense
|
814,686 | 0.9 | 1,091,006 | 1.1 | ||||||||||||
|
Net
Income
|
$ | 4,382,080 | 4.9 | % | $ | 3,555,728 | 3.6 | % | ||||||||
Revenue
The
following table sets forth a breakdown of our total sales, by region, for the
years ended December 31, 2009 and 2008.
|
2009
|
% of
total
sales
|
2008
|
% of
total
sales
|
Growth in
2009
compared
with 2008
|
||||||||||||||||
|
Wholesales
business
|
||||||||||||||||||||
|
The
People’s republic of China
|
$ | 4,542,199 | 5.1 | % | $ | 7,625,288 | 7.8 | % | (40.4 | ) % | ||||||||||
|
Germany
|
22,164,414 | 24.7 | 26,967,753 | 27.7 | (17.8 | ) | ||||||||||||||
|
United
Kingdom
|
13,256,621 | 14.8 | 14,863,998 | 15.2 | (10.8 | ) | ||||||||||||||
|
Europe-Other
|
10,042,180 | 11.2 | 11,023,829 | 11.3 | (8.9 | ) | ||||||||||||||
|
Japan
|
13,282,230 | 14.8 | 16,579,037 | 17.0 | (19.9 | ) | ||||||||||||||
|
United
states
|
13,389,903 | 14.9 | 16,905,742 | 17.3 | (20.8 | ) | ||||||||||||||
|
Total
Wholesales business
|
76,677,547 | 85.3 | 93,965,647 | 96.4 | (18.4 | ) | ||||||||||||||
|
Retail
business
|
13,193,444 | 14.7 | 3,506,035 | 3.6 | 276.3 | |||||||||||||||
|
Total
|
$ | 89,870,991 | 100.0 | % | $ | 97,471,682 | 100.0 | % | (7.8 | ) % | ||||||||||
We
generate revenues primarily from our wholesale business from international
markets. We also generate revenues from our retail business from
the Chinese domestic market focusing on our own apparel brand: LA GO
GO.
Total
sales for the year ended December 31, 2009 were $89.9 million a decrease of
7.8% from the year ended December 31, 2008. Although sales in our retail
business increased significantly during 2009, sales in our wholesale business
decreased 18.4% due to the global economic slowdown.
28
Sales
generated from our wholesale business contributed 85.3%or $76.7 million of our
total sales for the year ended December 31, 2009, compared to 96.4% or $94.0
million for the year ended December 31, 2008. The decreases for each quarter are
as follows:
|
2009
|
2008
|
Decrease in 2009
compared with 2008
|
||||||||||
|
First
quarter
|
$ | 17,975,623 | $ | 19,627,010 | (8.4 | ) % | ||||||
|
Second
quarter
|
19,093,790 | 23,815,840 | (19.8 | ) | ||||||||
|
Third
quarter
|
22,312,104 | 30,847,432 | (27.7 | ) | ||||||||
|
Fourth
quarter
|
17,296,030 | 19,675,365 | (12.1 | ) | ||||||||
|
Total
|
$ | 76,677,547 | $ | 93,965,647 | (18.4 | ) % | ||||||
During
the second and third quarters of 2009, wholesale business decreased 19.8% and
27.7% compared with the same periods of 2008. This decrease was primarily due to
the worsening economic downturn. Ever-Glory suspended the orders of several
customers due to the pessimistic financial outlook and concern over timely
payment ability of those customers.
During
the first quarter of 2009, wholesale business decreased 8.4% compared with the
same period of 2008. This decrease was primarily attributable to the fact that
most orders processed in this quarter were placed in the third quarter 2008 when
the customers had not responded to the economic downturn yet.
During
the fourth quarter of 2009, the Company saw the wholesale business decrease
approximately 12.1% compared with the same period of 2008. The 12.1% rate of
decrease was an improvement compared to 19.8% and 27.7% in the second and third
quarters of 2009 reflective of the general economic conditions in the United
States and Europe.
Sales
generated from our retail business contributed 14.7% or $13.2 million of our
total sales for the year ended December 31, 2009, an increase of 276.3% compared
to $3.5 million for the year ended December 31, 2008. We had 185 LA GO GO stores
at December 31, 2009, compared to 93 LA GO GO stores at December 31, 2008. In
2009 we opened 100 new LA GO GO stores and closed 8 stores.
Costs and
Expenses
Cost
of Sales and Gross Margin
Cost of
goods sold includes the direct raw material cost, direct labor cost,
manufacturing overheads including depreciation of production equipment and rent,
consistent with the revenue earned. Cost of goods sold excludes warehousing
costs, which historically have not been significant.
29
The
following table sets forth the components of our cost of sales and gross profit
both in amounts and as a percentage of total sales for the years ended December
31, 2009 and 2008.
|
For the Year Ended December
31,
|
Growth(Decrease) in
2009 compared with
|
|||||||||||||||||||
|
2009
|
2008
|
2008
|
||||||||||||||||||
|
(in
U.S. dollars, except for percentages)
|
||||||||||||||||||||
|
Wholesale
Sales
|
$ | 76,677,547 | 100.0 | % | $ | 93,965,647 | 100.0 | % | (18.4 | ) % | ||||||||||
|
Raw
Materials
|
35,273,298 | 46.0 | 44,583,815 | 47.4 | (20.9 | ) | ||||||||||||||
|
Labor
|
2,992,231 | 3.9 | 3,079,043 | 3.3 | (2.8 | ) | ||||||||||||||
|
Outsourced
Production Costs
|
24,106,715 | 31.4 | 30,438,432 | 32.4 | (20.8 | ) | ||||||||||||||
|
Other
and Overhead
|
847,133 | 1.1 | 1,247,141 | 1.3 | (32.1 | ) | ||||||||||||||
|
Total
Cost of Sales for Wholesale
|
63,219,377 | 82.4 | 79,348,431 | 84.4 | (20.3 | ) | ||||||||||||||
|
Gross
Profit for Wholesale
|
13,458,170 | 17.6 | 14,617,216 | 15.6 | (7.9 | ) | ||||||||||||||
|
Net
Sales for Retail
|
13,193,444 | 100.0 | 3,506,035 | 100.0 | 276.3 | |||||||||||||||
|
Production
Costs
|
3,287,373 | 24.9 | 753,855 | 21.5 | 336.1 | |||||||||||||||
|
Rent
|
5,059,017 | 38.3 | 1,467,230 | 41.8 | 244.8 | |||||||||||||||
|
Total
Cost of Sales for Retail
|
8,346,390 | 63.3 | 2,221,085 | 63.4 | 275.8 | |||||||||||||||
|
Gross
Profit for Retail
|
4,847,054 | 36.7 | 1,284,950 | 36.6 | 277.2 | |||||||||||||||
|
Total
Cost of Sales
|
71,565,767 | 79.6 | 81,569,516 | 83.7 | (12.3 | ) | ||||||||||||||
|
Gross
Profit
|
$ | 18,305,224 | 20.4 | % | $ | 15,902,166 | 16.3 | % | 15.1 | % | ||||||||||
There are
two operational patterns in our apparel making and trading business CMT or
“Cutting, Making and Trim”, and FOB or “Freight on Board”. Under the CMT model,
our buyers supply us with the main raw materials, and we charge them for
production, whereby cash flows are reduced. FOB is a generally adopted business
model where the price is composed of both raw material and production
charges.
Total raw
materials costs decreased 20.9% to $35.3 million in 2009 from $44.6 million in
2008. As a percent of sales, raw materials cost for our wholesale business
accounted for 46.0% of our total sales in 2009, a decrease of 1.4% compared to
2008. This decrease was primarily due to our recently implemented centralized
purchasing function to increase our purchasing power and increased CMT
orders in the second quarter. For CMT orders the material supplied by the
buyers is not included in the pricing, and only production
charges account for the sales volume. As a result the sales volume appears low
while the gross profit is higher.
Total
labor costs decreased 2.8% to $3.0 million in 2009 versus $3.1 million in 2008.
As a percent of sales, labor costs for our wholesale business accounted for 3.9%
of our total sales in 2009, an increase of 60 basis points compared to
2008. This increase was primarily due to decreased outsourcing orders in
2009.
Total
outsourced production costs for our wholesale business decreased 20.8% to $24.1
million in 2009 from $30.4 million in 2008. As a percent of sales, outsource
production costs were 31.4% of our total sales in 2009, a 1.0% decrease compared
to 2008. This decrease in total cost was primarily due to the lower
sales volume in 2009.
30
Overhead
and other expenses for our wholesale business accounted for 1.1% of our total
sales in 2009, compared to 1.3% of total sales in 2008. This decrease was due to
lower sales volume in 2009..
Gross
profit in our wholesale business in 2009 was $13.5 million, a decrease of 7.9%
compared to 2008. Gross margin was 17.6% for our wholesale business in 2009 an
increase of 2.0% compared to 2008. The increase in our gross margin was
primarily because we decreased lower margin orders in a continued effort to
pursue higher added value operations.
Production
costs for our retail business were $3.3 million in 2009 as compared to $0.8
million in 2008. As a percent of sales, retail production costs accounted for
24.9% of our total sales in 2009, compared to 21.5% of total sales in 2008. The
increase was due to reduced selling prices in exchange for higher selling
volume.
Rent
costs for our retail business were $5.1 million in 2009 compared to $1.5
million in 2008. As a percent of sales, rent costs accounted for
38.3% of our total sales in 2009, compared to 41.8% of total sales
in 2008. The decrease in rent costs as a percentage of total retail sales
was due to an increase in same store sales in 2009.
Gross
profit in our retail business in 2009 was $4.8 million and gross margin was
36.7%. Gross profit in our retail business in 2008 was $1.3 million
and gross margin was 36.6%.
Total
cost of sales in 2009 was $71.6 million, compared to $81.6 million in 2008, a
decrease of 12.3%. As a percentage of total sales, cost of sales decreased to
79.6% of total sales in 2009, compared to 83.7% of total sales in
2008. Consequently, gross margin increased to 20.4% in 2009 from 16.3% in
2008.
We
purchase the majority of our raw materials directly from numerous local fabric
and accessories suppliers. Some of our customers also furnish us with raw
materials so that we can manufacture their products. For our wholesale business,
purchases from our five largest suppliers represented approximately 19.4% and
18.6% of raw materials purchases in 2009 and 2008, respectively. No one supplier
provided more than 10% of our raw materials purchases in 2009 and 2008. For our
retail business, purchases from our five largest suppliers represented
approximately 31.3% and 36.3% of raw materials purchases in 2009 and
2008. No supplier provided more than 10% of our total purchases in 2009 and
2008. We have not experienced difficulty in obtaining raw materials
essential to our business, and we believe we maintain good relationships with
our suppliers.
We also purchase finished
goods from contract manufacturers. For our wholesale business, purchases from
our five largest contract manufacturers represented approximately 42.6% and
40.7% of finished goods purchases in 2009 and 2008, respectively.
Two contract manufacturers provided approximately 17.9% and 10.7% of our
finished goods purchases in 2009. One contract manufacturer provided
approximately 21.5% of our finished goods purchases in 2008. For our retail
business, our five largest contract manufacturers represented approximately
37.5% and 50.1% of finished goods purchases in 2009 and 2008, respectively. No
contract manufacturer provided more than 10% of our finished goods purchases in
2009 and two contract manufacturers provided 19.0% and 10.3% of our finished
goods purchases in 2008. We have not experienced difficulty in obtaining
finished products from our contract manufacturers and we believe we
maintain good relationships with our contract manufacturers.
31
Selling,
General and Administrative (SG&A) Expenses
Our
selling expenses consist primarily of local transportation, unloading charges,
product inspection charges, salaries for retail staff and decoration and
marketing expenses associated with our retail business.
Our
general and administrative expenses include administrative salaries, office
expense, certain depreciation and amortization charges, repairs and maintenance,
legal and professional fees, warehousing costs and other expenses that are not
directly attributable to our revenues.
Costs of
our distribution network that are excluded from costs of sales consist of local
transportation and unloading charges, and product inspection charges.
Accordingly our gross profit amounts may not be comparable to those of other
entities who may included these amounts in costs of sales”
|
For the Year Ended December
31,
|
||||||||||||||||||||
|
2009
|
2008
|
Increase
(Decrease)
|
||||||||||||||||||
|
(in
U.S. Dollars, except for percentages)
|
||||||||||||||||||||
|
Gross
Profit
|
$ | 18,305,224 | 20.4 | % | $ | 15,902,166 | 16.3 | % | 15.1 | % | ||||||||||
|
Operating
Expenses:
|
||||||||||||||||||||
|
Selling
Expenses
|
4,659,103 | 5.2 | 1,966,926 | 2.0 | 136.9 | |||||||||||||||
|
General
and Administrative Expenses
|
7,533,411 | 8.4 | 6,691,456 | 6.9 | 12.6 | |||||||||||||||
|
Total
|
12,192,514 | 13.6 | 8,658,382 | 8.9 | 40.8 | |||||||||||||||
|
Income
from Operations
|
$ | 6,112,710 | 6.8 | % | $ | 7,243,784 | 7.4 | % | (15.6 | ) % | ||||||||||
Selling
expenses were $4.7 million in 2009 an increase of 136.9% or $2.7 million
compared to 2008. The increase was attributable to an increase of approximately
$1.2 million in salaries for retail staff, and approximately $1.3 million for
decoration and marketing expenses associated with the promotion of LA GO
GO.
General
and administrative expenses were $7.5 million in 2009, an increase of
12.6% or approximately $0.8 million compared to 2008. The increase was
attributable to an increase in payroll for additional management, design
and marketing staff as a result of our business expansion.
Income
from Operations
Income
from operations decreased 15.6% to $6.1 million in 2009 from $7.2 million in
2008 as the result of the increasing operating expenses.
32
Interest
Expense
|
2009
|
2008
|
Increase
|
% Increase
|
|||||||||||||
|
Bank
Loans
|
$ | 327,432 | $ | 327,834 | $ | -402 | (0.1 | ) % | ||||||||
|
Related
party
|
115,674 | 175,100 | -59,426 | (33.9 | ) | |||||||||||
|
Convertible
notes interest
|
58,659 | -58,659 | ||||||||||||||
|
Convertible
notes-non cash expenses
|
2,296,575 | -2,296,575 | ||||||||||||||
|
Total
|
$ | 443,106 | $ | 2,858,168 | $ | -2,415,062 | (84.5 | ) % | ||||||||
Interest
expense was $0.4 million in 2009, a decrease of 84.5% compared to 2008. This
decrease was mainly due to the conversion of convertible notes into common
stock in 2008.
Change
in fair value of derivative liability
Quarterly
changes in the fair value of derivative liability are as
follows:
|
Quarter
ended
|
3/31/2009
|
6/30/2009
|
9/30/2009
|
12/31/2009
|
Total 2009
|
|||||||||||||||
|
Change
in fair value of derivative liability:
|
||||||||||||||||||||
|
Warrants
issued August 2, 2007
|
$ | 1,066,494 | $ | (484,702 | ) | $ | 143,909 | $ | 420,358 | $ | 1,146,059 | |||||||||
|
Net
charges (credits) to income
|
$ | 1,066,494 | $ | (484,702 | ) | $ | 143,909 | $ | 420,358 | $ | 1,146,059 | |||||||||
Income
Tax Expenses
Income
tax expense was $0.8 million in 2009, a decrease of 25.3% compared
to 2008.
Our PRC
subsidiaries are governed by the Income Tax Law of the PRC concerning Foreign
Investment Enterprises and Foreign Enterprises and various local income tax laws
(“the Income Tax Laws”). Each of our consolidating entities files its own
separate tax return.
Below is
a summary of the income tax rate for each of our PRC subsidiaries in 2008 and
2009.
|
Goldenway
|
New-Tailun
|
Catch-Luck
|
LA GO GO
|
Ever-Glory Apparel
|
||||||||||||||||
|
2008
|
25.0 | % | 12.5 | % | 12.5 | % | 25.0 | % | * | |||||||||||
|
2009
|
25.0 | % | 12.5 | % | 12.5 | % | 25.0 | % | 25.0 | % | ||||||||||
*Ever-Glory
Apparel was established on Jan 6, 2009.
Perfect
Dream was incorporated in the British Virgin Islands on July 1, 2004, and has no
income tax.
Ever-Glory
HK was incorporated in Samoa on September 15, 2009, and has no income
tax.
33
Ever-Glory
International Group Inc. was incorporated in the United States and has incurred
net operating losses for income tax purposes through December 31, 2009. The net
operating loss carry forwards for United States income taxes may be available to
reduce future years’ taxable income. These carry forwards will expire, if not
utilized, through 2029. Management believes that the realization of the benefits
from these losses appears uncertain due to our limited operating history and
continuing losses for United States income tax purposes. Accordingly, we have
provided a 100% valuation allowance on the deferred tax asset benefit to reduce
the asset to zero.
Net
Income
Net
income in 2009 was $4.4 million, an increase of 23.2% compared to 2008.Our
diluted earnings per share were $0.29 and $0.26 for the years ended December 31,
2009 and 2008, respectively.
Noncontrolling
Interest
On
January 9, 2008, Goldenway entered into an Agreement with La Chapelle to form a
joint venture to develop, promote and market a new line of women’s wear in
China. Goldenway agreed to initially invest RMB 6 Million (approximately
$826,200) in cash, and La Chapelle agreed to invest RMB 4 Million (approximately
$553,040) in cash, for a 60%- and 40%- interest in the joint venture,
respectively. The joint venture is included in the Company’s consolidated
financial statements beginning in 2008, and the 40% interest held by La Chapelle
is classified as noncontrolling interest. As of December 31, 2009, the carrying
value of the noncontrolling interest was $665,546.
Summary
of Cash Flows
Net cash
provided by operating activities in 2009 was $3,070,658 compared with net cash
provided by operating activities of $2,832,441 in 2008. This increase was mainly
attributable to increases in accounts receivable and inventories, partially
offset by an increase in accounts payable in 2009.
Net cash
used in investing activities was $1,485,984 in 2009, compared with $2,324,798 in
2008. On January 9, 2008, Goldenway entered into a Capital Contribution
Agreement with La Chapelle, pursuant to which Goldenway invested $1,467,000 in
cash (RMB 10 million) in La Chapelle for a 10% ownership interest in La Chapelle
offset by an increase in purchase of property and equipment associated with the
promotion of LA GO GO resulting in the decrease used in net investing
activities in 2009.
Net cash
provided by financing activities was $562,320 in 2009, compared with $166,515 in
2008. In 2009 we repaid $16,038,040 of bank loans while receiving loan proceeds
of $16,800,360 from the bank. In 2009 and 2008 we repaid $200,000 and
$1,990,000 to Blue Power Holding Ltd, an entity controlled by Mr. Edward
Yihua Kang, offset in 2008 by $553,040 from La Chapelle’s investment in LA GO GO
and $219,635 received upon the exercise of warrants.
34
Liquidity
and Capital Resources
As of
December 31, 2009, we had cash and cash equivalents of $3,555,745, other current
assets of $40,301,982 and current liabilities of $26,805,882. We presently
finance our operations primarily from cash flows from our operations, and we
anticipate that this will continue to be our primary source of funds to finance
our short-term cash needs.
Bank
Loan
In 2006,
we acquired a fifty-year land use right for 112,442 square meters
(approximately 1,209,876 square feet) of land in the Nanjing Jiangning
Economic and Technological Development Zone, which houses our existing facility
of 26,629 square meters (approximately 286,528 square feet), including our
manufacturing facility and office space. In 2006, we completed the
construction of our new facilities and moved our headquarters into the new
office building and consolidated part of our operations into our new
manufacturing facility in January 2007. The new manufacturing facility occupies
an area of 10,000 square meters (approximately 107,600 square feet) and is
equipped with state-of-the-art equipment. The land and building
are being used as collateral for bank loans.
On
July 31, 2008, Goldenway entered into credit agreements with Nanjing Bank
which allow the Company to borrow up to $7.3 million (RMB50million) for a
24 month period. Bank loans are secured by our facilities and are used to fund
daily operations. As of December 31, 2009, we had borrowed approximately $5.9
million which matures in January, March and May 2010, at an interest rate of
5.35% per annum. In January and March 2010, the Company repaid and then borrowed
approximately $2.5 million under this agreement.The maturity of these borrowings
can be extended at our option.
On June
30, 2009, HSBC approved a revolving credit facility of $2.5 million to
Perfect-Dream. To date nothing has been drawn down on this line of
credit.
On July 3, 2009, Ever-Glory Apparel, entered into a
one-year revolving line of credit agreement (“Revolving Line of Credit
Agreement”) with Nanjing
Bank, a PRC Bank, which allows the Company
to borrow up to approximately USD 5.9 million
(RMB 40 million ) during the period from June 1, 2009 to June 1,
2010. Borrower is
required to apply for each loan when it needs to draw from this revolving line
of credit. The Revolving Line of Credit is guaranteed by Jiangsu
Ever-Glory, and Goldenway pursuant to certain guaranty agreements. We did
not pay any fee to Jiangsu Ever-Glory International Group Corporation or
Goldenway for such security. As of December 31, 2009 the company borrowed $0.4
million under this agreement.
Loan
from Related Party
During
2009 we repaid $200,000 to Blue Power Holdings Limited (“Blue Power”). As of
December 31, 2009, the amount owing to Blue Power was $2,575,759. Interest
accrued on the loan to Blue Power totaled $115,674 for 2009.
35
Capital
Commitments
We have a
continuing program for the purpose of improving our manufacturing facilities and
extending our LA GO GO stores. We anticipate that cash flows from operations and
borrowings from banks will be used to pay for these capital
commitments.
Uses
of Liquidity
Our cash
requirements through the end 2010 will be primarily to fund daily
operations and the growth of our business.
Sources
of Liquidity
Our
primary sources of liquidity for our short-term cash needs are expected to be
from cash flows generated from operations, and cash and cash equivalents
currently on hand. We believe that we will be able to borrow additional funds if
necessary.
We
believe our cash flow from operations together with our cash and cash
equivalents currently on hand will be sufficient to meet our needs for working
capital, capital expenditure and other commitments through the end of 2010. No
assurance can be made that additional financing will be available to us if
required, and adequate funds may not be available on terms acceptable to us. If
funding is insufficient at any time in the future, we will develop or enhance
our products or services and expand our business through our own cash flows from
operations.
As of
December 31, 2009, we had access to a $7.3 million line of credit. Of this line
of credit, $1.4 million was unused and available. This credit facility does
not include any covenants.
Foreign
Currency Translation Risk
Our
operations are, for the most part, located in the PRC, which may give rise to
significant foreign currency risks from fluctuations and the degree of
volatility of foreign exchange rates between the United States dollar and the
Chinese RMB. Most of our sales are in dollars. During 2003 and 2004 the exchange
rate of RMB to the dollar remained constant at 8.26 RMB to the dollar. On July
21, 2005, the Chinese government adjusted the exchange rate from 8.26 to 8.09
RMB to the dollar. From that time, the RMB continued to appreciate against the
U.S. dollar. As of December 31, 2009, the market foreign exchange rate had
increased to 6.82 RMB to one U.S. dollar. We are continuously negotiating price
adjustments with most of our customers based on the daily market foreign
exchange rates, which we believe will reduce our exposure to exchange rate
fluctuations in the future, and will pass some of the increased cost to our
customers.
In
addition, the financial statements of Goldenway, New-Tailun, Catch-Luck,
Ever-Glory Apparel and LA GO GO (whose functional currency is RMB) are
translated into US dollars using the closing rate method. The balance sheet
items are translated into US dollars using the exchange rates at the respective
balance sheet dates. The capital and various reserves are translated at
historical exchange rates prevailing at the time of the transactions while
income and expenses items are translated at the average exchange rate for the
period. All exchange differences are recorded within equity. The foreign
currency translation (loss) gain for the years ended December 31, 2009 and
2008 was ($35,838) and $1,880,500, respectively.
36
OFF-BALANCE
SHEET ARRANGEMENTS
We do not
have any off-balance sheet arrangements that have or are reasonably likely to
have a current or future effect on our financial condition, changes in financial
condition, revenues or expenses, results of operations, liquidity, capital
expenditures or capital resources that are material to our
investors.
RESTATEMENT
OF QUARTERLY FINANCIAL RESULTS
Subsequent
to the issuance of our September 30, 2009 consolidated interim financial
statements, we determined that we had incorrectly reported derivative warrant
liabilities related to the Company’s January 1, 2009 change in accounting
principle as a result of the adoption of ASC 815 (previously EITF No.
07-5). We have issued restated unaudited financial statements for the
nine months ended September 30, 2009, and we have restated our unaudited
financial statements for the first two quarters of 2009 in this Annual Report on
Form 10-K. There was no impact to the fourth quarter of 2009 as a
result of the restatement of the first three quarters of 2009.
The
adjustments identified in connection with the reclassification of the warrants
as derivavtive liabilities result in a decrease in paid in capital of
approximately $976,460, an increase in retained earnings of approximately
$494,680, and the recognition of a liability of approximately $481,780 as of
January 1, 2009. The liability was then adjusted to fair value as of
March 31, 2009 and June 30, 2009, resulting in an increase in the liability and
other expense of $1,066,494 as of and for the three months ended March 31, 2009,
and a decrease in the liability and other expense of $484,702 as of and for the
three months ended June 30, 2009.
The
following is management’s discussion and analysis of the financial results and
the unaudited restated financial statements for the quarters ended March
31, 2009 and June 30, 2009, reflecting the following changes:
|
●
|
Restated
financial statements;
|
|
|
●
|
Revisions
to the Results of Operations sections in Item 2, Management's Discussion
and Analysis of Financial Condition and Results of
Operations.
|
Quarter Ended March 31, 2009
– Results of Operations:
Results of
Operations
Results
of Operations for the three months ended March 31, 2009 as compared with the
three months ended March 31, 2008.
The
following table summarizes our results of operations for the three months ended
March 31, 2009 and 2008.
37
|
Three months ended March 31
|
||||||||||||||||
|
2009
|
2008
|
|||||||||||||||
|
(in
U.S. Dollars, except for percentages)
|
||||||||||||||||
|
Sales
|
$ | 20,507,822 | 100.0 | % | $ | 19,747,208 | 100.0 | % | ||||||||
|
Gross
Profit
|
4,714,155 | 23.0 | 3,721,036 | 18.8 | ||||||||||||
|
Operating
Expenses
|
2,796,596 | 13.6 | 1,690,182 | 8.6 | ||||||||||||
|
Income
From Operations
|
1,917,559 | 9.4 | 2,030,854 | 10.3 | ||||||||||||
|
Other
Expenses
|
(1,084,224 | ) | (5.3 | ) | (545,854 | ) | (2.8 | ) | ||||||||
|
Income
Tax Expense
|
289,071 | 1.4 | 283,838 | 1.4 | ||||||||||||
|
Net
Income
|
$ | 555,862 | 2.7 | % | $ | 1,197,293 | 6.1 | % | ||||||||
Change
in fair value of derivative liability
Change in
the fair value of derivative liability was $1.1 million for the three months
ended March 31, 2009 which reflects a reduction in the market value of
certain outstanding warrants.
Net
Income
Net
income was $0.6 million for the three months ended March 31, 2009
a decrease of 53.6% compared to the three months ended March 31, 2008. Our
diluted earnings per share were $0.04 and $0.10 for the three months ended March
31, 2009 and 2008, respectively.
The
following is the unaudited, restated statement of income for the three months
ended March 31, 2009:
|
Unaudited
|
||||||||||||||||
|
For the three months ended
|
||||||||||||||||
|
March 31,2009
|
adjustment
|
March 31,2009
|
March 31,2008
|
|||||||||||||
|
restated
|
as filed
|
|||||||||||||||
|
NET
SALES
|
||||||||||||||||
|
Related
parties
|
$ | - | $ | $ | - | $ | 425,102 | |||||||||
|
Third
parties
|
20,507,822 | 20,507,822 | 19,322,106 | |||||||||||||
|
Total
net sales
|
20,507,822 | 20,507,822 | 19,747,208 | |||||||||||||
|
COST
OF SALES
|
||||||||||||||||
|
Related
parties
|
- | - | 402,748 | |||||||||||||
|
Third
parties
|
15,793,667 | 15,793,667 | 15,623,424 | |||||||||||||
|
Total
cost of sales
|
15,793,667 | 15,793,667 | 16,026,172 | |||||||||||||
|
GROSS
PROFIT
|
4,714,155 | 4,714,155 | 3,721,036 | |||||||||||||
|
OPERATING
EXPENSES
|
||||||||||||||||
|
Selling
expenses
|
940,474 | 940,474 | 277,528 | |||||||||||||
|
General
and administrative expenses
|
1,856,122 | 1,856,122 | 1,412,654 | |||||||||||||
|
Total
Operating Expenses
|
2,796,596 | 2,796,596 | 1,690,182 | |||||||||||||
|
INCOME
FROM OPERATIONS
|
1,917,559 | 1,917,559 | 2,030,854 | |||||||||||||
|
OTHER
INCOME (EXPENSES)
|
||||||||||||||||
|
Interest
income
|
103,547 | 103,547 | 31,974 | |||||||||||||
|
Interest
expense
|
(123,650 | ) | (123,650 | ) | (577,828 | ) | ||||||||||
|
Change
of fair value of derivitive liability
|
(1,066,494 | ) | (1,066,494 | ) | ||||||||||||
|
Other
income
|
2,373 | 2,373 | - | |||||||||||||
|
Total
Other Income (Expenses)
|
(1,084,224 | ) | (1,066,494 | ) | (17,730 | ) | (545,854 | ) | ||||||||
|
INCOME
BEFORE INCOME TAX EXPENSE
|
833,335 | (1,066,494 | ) | 1,899,829 | 1,485,000 | |||||||||||
|
INCOME
TAX EXPENSE
|
(289,071 | ) | (289,071 | ) | (283,838 | ) | ||||||||||
|
NET
INCOME
|
544,264 | (1,066,494 | ) | 1,610,758 | 1,201,162 | |||||||||||
|
ADD(LESS):
NET LOSS(INCOME) ATTRIBUTABLE TO THE NONCONTROLING
INTEREST
|
11,598 | 11,598 | (3,869 | ) | ||||||||||||
|
NET
INCOME ATTRIBUTABLE TO THE COMPANY
|
$ | 555,862 | $ | (1,066,494 | ) | $ | 1,622,356 | $ | 1,197,293 | |||||||
|
NET
INCOME
|
$ | 544,264 | (1,066,494 | ) | 1,610,758 | 1,201,162 | ||||||||||
|
Foreign
currency translation (loss) gain
|
(44,208 | ) | (44,208 | ) | 1,099,884 | |||||||||||
|
COMPREHENSIVE
INCOME
|
500,056 | (1,066,494 | ) | 1,566,550 | 2,301,046 | |||||||||||
|
COMPREHENSIVE
INCOME ATTRIBUTABLE TO
|
||||||||||||||||
|
THE
NONCONTROLING INTEREST
|
(12,392 | ) | (12,392 | ) | 23,457 | |||||||||||
|
COMPREHENSIVE
INCOME ATTRIBUTABLE TO
|
||||||||||||||||
|
THE
COMPANY
|
$ | 512,448 | $ | (1,066,494 | ) | $ | 1,578,942 | $ | 2,277,589 | |||||||
|
NET
INCOME PER SHARE
|
||||||||||||||||
|
Attributable
to the Company's common stockholders
|
||||||||||||||||
|
Basic
|
$ | 0.04 | $ | $ | 0.12 | $ | 0.10 | |||||||||
|
Diluted
|
$ | 0.04 | $ | $ | 0.12 | $ | 0.10 | |||||||||
|
Weighted
average number of shares outstanding
|
||||||||||||||||
|
Basic
|
13,531,225 | 13,531,225 | 11,449,682 | |||||||||||||
|
Diluted
|
13,531,225 | 13,531,225 | 12,204,363 | |||||||||||||
38
The
following is the unaudited, restated balance sheet as of March 31,
2009:
|
March
31,
|
March
31,
|
|||||||
|
2009
|
2009
|
|||||||
|
restated
|
as
filed
|
|||||||
|
ASSETS
|
||||||||
|
CURRENT
ASSETS
|
||||||||
|
Cash
and cash equivalents
|
$ | 3,833,600 | $ | 3,833,600 | ||||
|
Accounts
receivable
|
12,970,781 | 12,970,781 | ||||||
|
Accounts
receivable - related parties
|
73,900 | 73,900 | ||||||
|
Inventories
|
2,856,073 | 2,856,073 | ||||||
|
Other
receivables and prepaid expenses
|
433,038 | 433,038 | ||||||
|
Advances
on inventory purchases
|
209,321 | 209,321 | ||||||
|
Amounts
due from related party
|
10,754,680 | 10,754,680 | ||||||
|
Total
Current Assets
|
31,131,393 | 31,131,393 | ||||||
|
LAND
USE RIGHT, NET
|
2,834,195 | 2,834,195 | ||||||
|
PROPERTY
AND EQUIPMENT, NET
|
12,799,944 | 12,799,944 | ||||||
|
INVESTMENT
AT COST
|
1,465,000 | 1,465,000 | ||||||
|
TOTAL
ASSETS
|
$ | 48,230,532 | $ | 48,230,532 | ||||
|
LIABILITIES
AND EQUITY
|
||||||||
|
CURRENT
LIABILITIES
|
||||||||
|
Bank
loans
|
$ | 6,592,500 | $ | 6,592,500 | ||||
|
Accounts
payable
|
5,290,568 | 5,290,568 | ||||||
|
Other
payables- related party
|
903,416 | 903,416 | ||||||
|
Other
payables and accrued liabilities
|
1,813,614 | 1,813,614 | ||||||
|
Value
added and other taxes payable
|
656,583 | 656,583 | ||||||
|
Income
tax payable
|
207,550 | 207,550 | ||||||
|
Deferred
tax liabilities
|
176,086 | 176,086 | ||||||
|
Total
Current Liabilities
|
15,640,317 | 15,640,317 | ||||||
|
LONG-TERM
LIABILITIES
|
||||||||
|
Loan
from related party
|
2,689,350 | 2,689,350 | ||||||
|
Derivative
liability
|
1,548,274 | |||||||
|
Total
Long-term Liabilities
|
4,237,624 | 2,689,350 | ||||||
|
TOTAL
LIABILITIES
|
19,877,941 | 18,329,667 | ||||||
|
COMMITMENTS
AND CONTINGENCIES
|
||||||||
|
EQUITY
|
||||||||
|
Stockholders'
equity of the Company
|
||||||||
|
Preferred
stock ($.001 par value, authorized 5,000,000 shares,
|
||||||||
|
no
shares issued and outstanding)
|
- | - | ||||||
|
Common
stock ($.001 par value, authorized 50,000,000 shares,
|
||||||||
|
12,394,652
and 12,373,567 shares issued and outstanding
|
||||||||
|
as
of March 31,2009 and December 31, 2008, respectively)
|
12,395 | 12,395 | ||||||
|
Additional
paid-in capital
|
3,594,704 | 4,571,164 | ||||||
|
Retained
earnings
|
16,858,081 | 17,429,895 | ||||||
|
Statutory
reserve
|
3,437,379 | 3,437,379 | ||||||
|
Accumulated
other comprehensive income
|
3,912,652 | 3,912,652 | ||||||
|
Total
Stockholders' Equity of the Company
|
27,815,211 | 29,363,485 | ||||||
|
Noncontrolling
interest
|
537,380 | 537,380 | ||||||
|
Total
Equity
|
28,352,591 | 29,900,865 | ||||||
|
TOTAL
LIABILITIES AND EQUITY
|
$ | 48,230,532 | $ | 48,230,532 | ||||
39
The
following is the unaudited, restated statement of cash flows for the three
months ended March 31, 2009:
|
|
March
31,
|
March
31,
|
||||||
|
|
2009
|
2009
|
||||||
|
|
restated
|
as
filed
|
||||||
|
CASH
FLOWS FROM OPERATING ACTIVITIES
|
||||||||
|
Net
income
|
$ | 544,264 | $ | 1,610,758 | ||||
|
Adjustments
to reconcile net income to cash provided
|
||||||||
|
by
operating activities:
|
||||||||
|
Depreciation
and amortization
|
484,005 | 484,005 | ||||||
|
Change
in fair value of derivative liability
|
1,066,494 | - | ||||||
|
Deferred income tax
|
96,194 | 96,194 | ||||||
|
Amortization
of discount on convertible notes
|
- | - | ||||||
|
Amortization
of deferred financing costs
|
- | - | ||||||
|
Stock
issued for interest
|
- | - | ||||||
|
Changes
in operating assets and liabilities
|
||||||||
|
Accounts
receivable
|
(3,488,612 | ) | (3,488,612 | ) | ||||
|
Accounts
receivable - related parties
|
(73,905 | ) | (73,905 | ) | ||||
|
Inventories
|
874,121 | 874,121 | ||||||
|
Other
receivables and prepaid expenses
|
(227,276 | ) | (227,276 | ) | ||||
|
Advances
on inventory purchases
|
78,547 | 78,547 | ||||||
|
Amounts
due from related party
|
795,181 | 795,181 | ||||||
|
Accounts
payable
|
1,675,077 | 1,675,077 | ||||||
|
Accounts
payable - related parties
|
148,837 | 148,837 | ||||||
|
Other
payables and accrued liabilities
|
151,499 | 151,499 | ||||||
|
Other
payables-related parties
|
2,327 | 2,327 | ||||||
|
Value
added and other taxes payable
|
288,298 | 288,298 | ||||||
|
Income
tax payable
|
(50,047 | ) | (50,047 | ) | ||||
|
Long
term deferred expense
|
||||||||
|
Net
cash provided by operating activities
|
2,365,004 | 2,365,004 | ||||||
|
|
||||||||
|
CASH
FLOWS FROM INVESTING ACTIVITIES
|
||||||||
|
Other
payables-related party
|
- | - | ||||||
|
Investment
in La Chapelle
|
- | - | ||||||
|
Purchase
of property and equipment
|
(65,719 | ) | (65,719 | ) | ||||
|
Proceeds
from sale of equipment
|
3,778 | 3,778 | ||||||
|
Net
cash used in investing activities
|
(61,941 | ) | (61,941 | ) | ||||
|
|
||||||||
|
CASH
FLOWS FROM FINANCING ACTIVITIES
|
||||||||
|
Contribution
from minority shareholders
|
- | - | ||||||
|
Proceeds
from bank loans
|
5,860,400 | 5,860,400 | ||||||
|
Repayment
of bank loans
|
(5,801,796 | ) | (5,801,796 | ) | ||||
|
Proceeds
from long term loan
|
29,265 | 29,265 | ||||||
|
Net
cash provided by financing activities
|
87,869 | 87,869 | ||||||
|
|
||||||||
|
EFFECT
OF EXCHANGE RATE CHANGES ON CASH
|
(2,695 | ) | (2,695 | ) | ||||
|
|
||||||||
|
NET
INCREASE IN CASH AND CASH EQUIVALENTS
|
2,388,237 | 2,388,237 | ||||||
|
|
||||||||
|
CASH
AND CASH EQUIVALENTS AT BEGINNING OF YEAR
|
1,445,363 | 1,445,363 | ||||||
|
|
||||||||
|
CASH
AND CASH EQUIVALENTS AT END OF YEAR
|
$ | 3,833,600 | $ | 3,833,600 | ||||
|
|
||||||||
|
SUPPLEMENTAL
DISCLOSURE OF CASH FLOW INFORMATION:
|
||||||||
|
|
||||||||
|
Cash
paid during the period for:
|
||||||||
|
Interest
expense
|
$ | 144,646 | $ | 144,646 | ||||
|
Income
taxes
|
$ | 242,924 | $ | 242,924 | ||||
40
Quarter Ended June 30, 2009
– Results of Operations:
Results of
Operations
Results
of Operations for the three months ended June 30, 2009 as compared with the
three months ended June 30, 2008.
The
following table summarizes our results of operations for the three months ended
June 30, 2009 and 2008.
|
Three months ended June 30
|
||||||||||||||||
|
2009
|
2008
|
|||||||||||||||
|
(in
U.S. Dollars, except for percentages)
|
||||||||||||||||
|
Sales
|
$ | 21,125,494 | 100.0 | % | $ | 24,068,397 | 100.0 | % | ||||||||
|
Gross
Profit
|
4,507,561 | 21.3 | 4,353,837 | 18.1 | ||||||||||||
|
Operating
Expenses
|
3,154,623 | 14.9 | 2,190,893 | 9.1 | ||||||||||||
|
Income
From Operations
|
1,352,938 | 6.4 | 2,162,944 | 9.0 | ||||||||||||
|
Other
Income(Expenses)
|
573,559 | 2.7 | (529,451 | ) | (2.2 | ) | ||||||||||
|
Income
Tax Expense
|
272,656 | 1.3 | 284,809 | 1.2 | ||||||||||||
|
Net
Income
|
$ | 1,653,841 | 7.8 | % | $ | 1,348,684 | 5.6 | % | ||||||||
Change
in fair value of derivative liability
Change in
the fair value of derivative liability was ($0.5) million for the three months
ended June 30, 2009 which reflects an increase in the estimated fair value
of certain outstanding warrants.
Net
Income
Net
income was $1.7 million for the three months ended June 30, 2009 an increase of
22.6% compared to the three months ended June 30, 2008. Our diluted earnings per
share were $0.12 and $0 for the three months ended June 30, 2009 and 2008,
respectively.
41
The
following is the unaudited, restated statement of income for the three months
ended June 30, 2009:
|
Unaudited
|
||||||||||||||||
|
For
the three months ended
|
||||||||||||||||
|
June 30,
2009
|
adjustment
|
June 30,
2009
|
June 30,
2008
|
|||||||||||||
|
restated
|
as
filed
|
|||||||||||||||
|
NET
SALES
|
||||||||||||||||
|
Related
parties
|
$ | 9,351 | $ | $ | 9,351 | $ | 67,461 | |||||||||
|
Third
parties
|
21,116,143 | 21,116,143 | 24,000,936 | |||||||||||||
|
Total
net sales
|
21,125,494 | 21,125,494 | 24,068,397 | |||||||||||||
|
COST
OF SALES
|
||||||||||||||||
|
Related
parties
|
9,013 | 9,013 | 58,636 | |||||||||||||
|
Third
parties
|
16,608,920 | 16,608,920 | 19,655,924 | |||||||||||||
|
Total
cost of sales
|
16,617,933 | 16,617,933 | 19,714,560 | |||||||||||||
|
GROSS
PROFIT
|
4,507,561 | 4,507,561 | 4,353,837 | |||||||||||||
|
OPERATING
EXPENSES
|
||||||||||||||||
|
Selling
expenses
|
865,341 | 865,341 | 368,564 | |||||||||||||
|
General
and administrative expenses
|
2,289,282 | 2,289,282 | 1,822,329 | |||||||||||||
|
Total
Operating Expenses
|
3,154,623 | 3,154,623 | 2,190,893 | |||||||||||||
|
INCOME
FROM OPERATIONS
|
1,352,938 | 1,352,938 | 2,162,944 | |||||||||||||
|
OTHER
INCOME (EXPENSES)
|
||||||||||||||||
|
Interest
income
|
161,481 | 161,481 | 48,590 | |||||||||||||
|
Interest
expense
|
(115,234 | ) | (115,234 | ) | (631,126 | ) | ||||||||||
|
Change
of fair value of derivitive liability
|
484,702 | 484,702 | ||||||||||||||
|
Other
income
|
42,610 | 42,610 | 53,085 | |||||||||||||
|
Total
Other Income (Expenses)
|
573,559 | 484,702 | 88,857 | (529,451 | ) | |||||||||||
|
INCOME
BEFORE INCOME TAX EXPENSE
|
1,926,497 | 484,702 | 1,441,795 | 1,633,493 | ||||||||||||
|
INCOME
TAX EXPENSE
|
(272,656 | ) | (272,656 | ) | (284,809 | ) | ||||||||||
|
NET
INCOME
|
1,653,841 | 484,702 | 1,169,139 | 1,348,684 | ||||||||||||
|
ADD(LESS):
NET LOSS(INCOME) ATTRIBUTABLE TO THE NONCONTROLING
INTEREST
|
5,861 | 5,861 | 620 | |||||||||||||
|
NET
INCOME ATTRIBUTABLE TO THE COMPANY
|
$ | 1,659,702 | $ | 484,702 | $ | 1,175,000 | $ | 1,349,304 | ||||||||
|
NET
INCOME
|
$ | 1,653,841 | $ | 484,702 | $ | 1,169,139 | $ | 1,348,684 | ||||||||
|
Foreign
currency translation (loss) gain
|
(39,103 | ) | (39,103 | ) | 611,354 | |||||||||||
|
COMPREHENSIVE
INCOME
|
1,614,738 | 484,702 | 1,130,036 | 1,960,038 | ||||||||||||
|
COMPREHENSIVE
LOSS (INCOME) ATTRIBUTABLE TO
|
||||||||||||||||
|
THE
NONCONTROLING INTEREST
|
3,109 | 3,109 | 435 | |||||||||||||
|
COMPREHENSIVE
INCOME ATTRIBUTABLE TO
|
||||||||||||||||
|
THE
COMPANY
|
$ | 1,617,847 | $ | 484,702 | $ | 1,133,145 | $ | 1,960,473 | ||||||||
|
NET
INCOME PER SHARE
|
||||||||||||||||
|
Attributable
to the Company's common stockholders
|
||||||||||||||||
|
Basic
|
$ | 0.12 | $ | $ | 0.09 | $ | 0.12 | |||||||||
|
Diluted
|
$ | 0.12 | $ | $ | 0.09 | $ | - | |||||||||
|
Weighted
average number of shares outstanding
|
||||||||||||||||
|
Basic
|
13,548,498 | 13,548,498 | 11,710,865 | |||||||||||||
|
Diluted
|
13,548,498 | 13,548,498 | 12,528,595 | |||||||||||||
42
Results
of Operations for the six months ended June 30, 2009 as compared with the six
months ended June 30, 2008.
The
following table summarizes our results of operations for the six months ended
June 30, 2009 and 2008.
|
Six months ended June 30
|
||||||||||||||||
|
2009
|
2008
|
|||||||||||||||
|
(in
U.S. Dollars, except for percentages)
|
||||||||||||||||
|
Sales
|
$ | 41,633,316 | 100.0 | % | $ | 43,815,605 | 100.0 | % | ||||||||
|
Gross
Profit
|
9,221,716 | 22.1 | 8,074,873 | 18.4 | ||||||||||||
|
Operating
Expenses
|
5,951,219 | 14.3 | 3,881,075 | 8.9 | ||||||||||||
|
Income
From Operations
|
3,270,497 | 7.9 | 4,193,798 | 9.6 | ||||||||||||
|
Other
Expenses
|
(510,665 | ) | (1.2 | ) | (1,075,305 | ) | (2.5 | ) | ||||||||
|
Income
Tax Expense
|
561,727 | 1.3 | 568,647 | 1.3 | ||||||||||||
|
Net
Income
|
$ | 2,198,105 | 5.3 | % | $ | 2,549,846 | 5.8 | % | ||||||||
Change
in fair value of derivative liability
Change in
the fair value of derivative liability was $0.6 million for the six months ended
June 30, 2009 which reflects a reduction in the estimated fair value of
certain outstanding warrants.
Net
Income
Net
income was $2.2 million for the six months ended June 30, 2009 a decrease of
13.8% compared to the six months ended June 30, 2008. Our diluted earnings per
share were $0.16 and $0.10 for the six months ended June 30, 2009 and 2008,
respectively.
43
The
following is the unaudited, restated statement of income for the six months
ended June 30, 2009:
|
Unaudited
|
||||||||||||||||
|
For
the six months ended
|
||||||||||||||||
|
June 30,
2009
|
adjustment
|
June 30,
2009
|
June 30,
2008
|
|||||||||||||
|
restated
|
as
filed
|
|||||||||||||||
|
NET
SALES
|
||||||||||||||||
|
Related
parties
|
$ | 9,351 | $ | $ | 9,351 | $ | 492,563 | |||||||||
|
Third
parties
|
41,623,965 | 41,623,965 | 43,323,042 | |||||||||||||
|
Total
net sales
|
41,633,316 | 41,633,316 | 43,815,605 | |||||||||||||
|
COST
OF SALES
|
||||||||||||||||
|
Related
parties
|
9,013 | 9,013 | 461,384 | |||||||||||||
|
Third
parties
|
32,402,587 | 32,402,587 | 35,279,348 | |||||||||||||
|
Total
cost of sales
|
32,411,600 | 32,411,600 | 35,740,732 | |||||||||||||
|
GROSS
PROFIT
|
9,221,716 | 9,221,716 | 8,074,873 | |||||||||||||
|
OPERATING
EXPENSES
|
||||||||||||||||
|
Selling
expenses
|
1,805,815 | 1,805,815 | 646,092 | |||||||||||||
|
General
and administrative expenses
|
4,145,404 | 4,145,404 | 3,234,983 | |||||||||||||
|
Total
Operating Expenses
|
5,951,219 | 5,951,219 | 3,881,075 | |||||||||||||
|
INCOME
FROM OPERATIONS
|
3,270,497 | 3,270,497 | 4,193,798 | |||||||||||||
|
OTHER
INCOME (EXPENSES)
|
||||||||||||||||
|
Interest
income
|
265,028 | 265,028 | 80,564 | |||||||||||||
|
Interest
expense
|
(238,884 | ) | (238,884 | ) | (1,208,954 | ) | ||||||||||
|
Change
of fair value of derivitive liability
|
(581,792 | ) | (581,792 | ) | ||||||||||||
|
Other
income
|
44,983 | 44,983 | 53,085 | |||||||||||||
|
Total
Other Income (Expenses)
|
(510,665 | ) | (581,792 | ) | 71,127 | (1,075,305 | ) | |||||||||
|
INCOME
BEFORE INCOME TAX EXPENSE
|
2,759,832 | (581,792 | ) | 3,341,624 | 3,118,493 | |||||||||||
|
INCOME
TAX EXPENSE
|
(561,727 | ) | (561,727 | ) | (568,647 | ) | ||||||||||
|
NET
INCOME
|
2,198,105 | (581,792 | ) | 2,779,897 | 2,549,846 | |||||||||||
|
ADD(LESS):
NET LOSS(INCOME) ATTRIBUTABLE TO THE NONCONTROLING
INTEREST
|
17,459 | 17,459 | (3,249 | ) | ||||||||||||
|
NET
INCOME ATTRIBUTABLE TO THE COMPANY
|
$ | 2,215,564 | $ | (581,792 | ) | $ | 2,797,356 | $ | 2,546,597 | |||||||
|
NET
INCOME
|
$ | 2,198,105 | $ | (581,792 | ) | $ | 2,779,897 | $ | 2,549,846 | |||||||
|
Foreign
currency translation (loss) gain
|
(83,311 | ) | (83,311 | ) | 1,711,238 | |||||||||||
|
COMPREHENSIVE
INCOME
|
2,114,794 | (581,792 | ) | 2,696,586 | 4,261,084 | |||||||||||
|
COMPREHENSIVE
LOSS (INCOME) ATTRIBUTABLE TO
|
||||||||||||||||
|
THE
NONCONTROLING INTEREST
|
15,501 | 15,501 | (23,022 | ) | ||||||||||||
|
|
||||||||||||||||
|
COMPREHENSIVE
INCOME ATTRIBUTABLE TO
|
||||||||||||||||
|
THE
COMPANY
|
$ | 2,130,295 | $ | (581,792 | ) | $ | 2,712,087 | $ | 4,238,062 | |||||||
|
NET
INCOME PER SHARE
|
||||||||||||||||
|
Attributable
to the Company's common stockholders
|
||||||||||||||||
|
Basic
|
$ | 0.16 | $ | $ | 0.21 | $ | 0.22 | |||||||||
|
Diluted
|
$ | 0.16 | $ | $ | 0.21 | $ | 0.10 | |||||||||
|
Weighted
average number of shares outstanding
|
||||||||||||||||
|
Basic
|
13,539,909 | 13,539,909 | 11,580,273 | |||||||||||||
|
Diluted
|
13,539,909 | 13,539,909 | 12,291,758 | |||||||||||||
44
The
following is the unaudited, restated balance sheet as of June 30,
2009:
|
June
30,
|
June
30,
|
|||||||
|
2009
|
2009
|
|||||||
|
restated
|
as
filed
|
|||||||
|
ASSETS
|
||||||||
|
CURRENT
ASSETS
|
||||||||
|
Cash
and cash equivalents
|
$ | 993,869 | $ | 993,869 | ||||
|
Accounts
receivable
|
15,188,450 | 15,188,450 | ||||||
|
Inventories
|
2,910,793 | 2,910,793 | ||||||
|
Value
added tax receivable
|
241,325 | 241,325 | ||||||
|
Other
receivables and prepaid expenses
|
398,730 | 398,730 | ||||||
|
Advances
on inventory purchases
|
321,710 | 321,710 | ||||||
|
Amounts
due from related party
|
10,153,169 | 10,153,169 | ||||||
|
Total
Current Assets
|
30,208,046 | 30,208,046 | ||||||
|
LAND
USE RIGHT, NET
|
2,817,773 | 2,817,773 | ||||||
|
PROPERTY
AND EQUIPMENT, NET
|
12,642,068 | 12,642,068 | ||||||
|
INVESTMENT
AT COST
|
1,465,000 | 1,465,000 | ||||||
|
TOTAL
ASSETS
|
$ | 47,132,887 | $ | 47,132,887 | ||||
|
LIABILITIES
AND EQUITY
|
||||||||
|
CURRENT
LIABILITIES
|
||||||||
|
Bank
loans
|
$ | 3,223,000 | $ | 3,223,000 | ||||
|
Accounts
payable
|
6,133,696 | 6,133,696 | ||||||
|
Accounts
payable and other payables- related parties
|
917,871 | 917,871 | ||||||
|
Other
payables and accrued liabilities
|
1,923,451 | 1,923,451 | ||||||
|
Value
added and other taxes payable
|
687,699 | 687,699 | ||||||
|
Income
tax payable
|
230,847 | 230,847 | ||||||
|
Deferred
tax liabilities
|
232,695 | 232,695 | ||||||
|
Total
Current Liabilities
|
13,349,259 | 13,349,259 | ||||||
|
LONG-TERM
LIABILITIES
|
||||||||
|
Loan
from related party
|
2,718,614 | 2,718,614 | ||||||
|
Derivative
liability
|
1,063,572 | |||||||
|
Total
Long-term Liabilities
|
3,782,186 | 2,718,614 | ||||||
|
TOTAL
LIABILITIES
|
17,131,445 | 16,067,873 | ||||||
|
COMMITMENTS
AND CONTINGENCIES
|
||||||||
|
EQUITY
|
||||||||
|
Stockholders'
equity of the Company
|
||||||||
|
Preferred
stock ($.001 par value, authorized 5,000,000 shares,
|
||||||||
|
no
shares issued and outstanding)
|
- | - | ||||||
|
Common
stock ($.001 par value, authorized 50,000,000 shares,
|
||||||||
|
13,548,498
and 12,373,567 shares issued and outstanding
|
||||||||
|
as
of June 30,2009 and December 31, 2008, respectively)
|
13,549 | 13,549 | ||||||
|
Additional
paid-in capital
|
3,594,704 | 4,571,164 | ||||||
|
Retained
earnings
|
18,517,783 | 18,604,895 | ||||||
|
Statutory
reserve
|
3,437,379 | 3,437,379 | ||||||
|
Accumulated
other comprehensive income
|
3,873,549 | 3,873,549 | ||||||
|
Total
Stockholders' Equity of the Company
|
29,436,964 | 30,500,536 | ||||||
|
Noncontrolling
interest
|
564,478 | 564,478 | ||||||
|
Total
Equity
|
30,001,442 | 31,065,014 | ||||||
|
TOTAL
LIABILITIES AND EQUITY
|
$ | 47,132,887 | $ | 47,132,887 | ||||
45
The
following is the unaudited, restated statement of cash flows for the six months
ended June 30, 2009:
|
June
30,
|
June
30,
|
|||||||
|
2009
|
2009
|
|||||||
|
restated
|
as
filed
|
|||||||
|
CASH
FLOWS FROM OPERATING ACTIVITIES
|
||||||||
|
Net
income
|
$ | 2,198,105 | $ | 2,779,897 | ||||
|
Adjustments
to reconcile net income to cash provided
|
||||||||
|
by
operating activities:
|
||||||||
|
Depreciation
and amortization
|
987,141 | 987,141 | ||||||
|
Change
in fair value of derivative liability
|
581,792 | - | ||||||
|
Accrued
interest on loan from related party
|
58,529 | 58,529 | ||||||
|
Deferred
income tax
|
152,868 | 152,868 | ||||||
|
Changes
in operating assets and liabilities
|
||||||||
|
Accounts
receivable
|
(5,718,775 | ) | (5,718,775 | ) | ||||
|
Inventories
|
819,734 | 819,734 | ||||||
|
Value
added tax receivable
|
(241,441 | ) | (241,441 | ) | ||||
|
Other
receivables and prepaid expenses
|
(467,251 | ) | (467,251 | ) | ||||
|
Advances
on inventory purchases
|
(33,835 | ) | (33,835 | ) | ||||
|
Amounts
due from related party
|
1,391,643 | 1,391,643 | ||||||
|
Accounts
payable
|
2,519,292 | 2,519,292 | ||||||
|
Accounts
payable and other payables - related parties
|
178,745 | 178,745 | ||||||
|
Other
payables and accrued liabilities
|
263,858 | 263,858 | ||||||
|
Value
added and other taxes payable
|
337,762 | 337,762 | ||||||
|
Income
tax payable
|
(44,974 | ) | (44,974 | ) | ||||
|
Net
cash provided by operating activities
|
2,983,193 | 2,983,193 | ||||||
|
CASH
FLOWS FROM INVESTING ACTIVITIES
|
||||||||
|
Investment
in La Chapelle
|
- | - | ||||||
|
Purchase
of property and equipment
|
(122,879 | ) | (122,879 | ) | ||||
|
Proceeds
from sale of equipment
|
6,810 | 6,810 | ||||||
|
Net
cash used in investing activities
|
(116,069 | ) | (116,069 | ) | ||||
|
CASH
FLOWS FROM FINANCING ACTIVITIES
|
||||||||
|
Proceeds
from bank loans
|
6,595,650 | 6,595,650 | ||||||
|
Repayment
of bank loans
|
(9,908,132 | ) | (9,908,132 | ) | ||||
|
Net
cash used in financing activities
|
(3,312,482 | ) | (3,312,482 | ) | ||||
|
EFFECT
OF EXCHANGE RATE CHANGES ON CASH
|
(6,136 | ) | (6,136 | ) | ||||
|
NET
(DECREASE) INCREASE IN CASH AND CASH EQUIVALENTS
|
(451,494 | ) | (451,494 | ) | ||||
|
CASH
AND CASH EQUIVALENTS AT BEGINNING OF PERIOD
|
1,445,363 | 1,445,363 | ||||||
|
CASH
AND CASH EQUIVALENTS AT END OF PERIOD
|
$ | 993,869 | $ | 993,869 | ||||
|
SUPPLEMENTAL
DISCLOSURE OF CASH FLOW INFORMATION:
|
||||||||
|
Cash
paid during the period for:
|
||||||||
|
Interest
expense
|
$ | 180,355 | $ | 180,355 | ||||
|
Income
taxes
|
$ | 436,106 | $ | 436,106 | ||||
46
Item
7A QUANTATITIVE AND QUALITATIVE DISCLSOURE ABOUT MARKET RISK
Not
applicable.
47
ITEM 8. FINANCIAL
STATEMENTS AND SUPPLEMENTARY DATA
CONSOLIDATED
FINANCIAL STATEMENTS
As of
December 31, 2009
CONTENTS
|
Report
of Registered Public Accounting Firm
|
F-1
|
|||
|
Consolidated
Balance Sheets
|
F-2
|
|
||
|
Consolidated
Statements of Income and Comprehensive Income
|
F-3
|
|||
|
Consolidated
Statements of Equity
|
F-4
|
|||
|
Consolidated
Statements of Cash Flows
|
F-5
|
|||
|
Notes
to Consolidated Financial Statements
|
F-6
|
48
REPORT OF INDEPENDENT
REGISTERED PUBLIC ACCOUNTING FIRM
The Board
of Directors and Shareholders
Ever-Glory
International Group, Inc.
We have
audited the accompanying consolidated balance sheets of Ever-Glory International
Group, Inc. and subsidiaries as of December 31, 2009 and 2008, and the related
consolidated statements of income and comprehensive income, equity and cash
flows for each of the two years in the period ended December 31,
2009. These financial statements are the responsibility of Ever-Glory
International Group, Inc.’s management. Our responsibility is to express an
opinion on these financial statements based on our audits.
We
conducted our audits in accordance with the standards of the Public Company
Accounting Oversight Board (United States). Those standards require that we plan
and perform the audit to obtain reasonable assurance about whether the financial
statements are free of material misstatement. An audit includes examining, on a
test basis, evidence supporting the amounts and disclosures in the financial
statements. An audit also includes assessing the accounting principles used and
significant estimates made by management, as well as evaluating the overall
financial statement presentation. We believe that our audits provide a
reasonable basis for our opinion.
In our
opinion, the consolidated financial statements referred to above present fairly,
in all material respects, the financial position of Ever-Glory International
Group, Inc. and subsidiaries as of December 31, 2009 and 2008, and the results
of their operations and their cash flows for each of the two years in the period
ended December 31, 2009 in conformity with accounting principles generally
accepted in the United States of America.
As
discussed in Note 2 to the consolidated financial statements, during 2009 the
provisions of new accounting standards relating to non-controlling interests and
contracts in an entity’s own equity were adopted.
/s/GHP
Horwath, P.C.
Denver,
Colorado
March 31,
2009
F-1
EVER-GLORY
INTERNATIONAL GROUP, INC. AND SUBSIDIARIES
CONSOLIDATED
BALANCE SHEETS
AS
OF DECEMBER 31, 2009 AND 2008
|
2009
|
2008
|
|||||||
|
ASSETS
|
||||||||
|
CURRENT
ASSETS
|
||||||||
|
Cash
and cash equivalents
|
$ | 3,555,745 | $ | 1,445,363 | ||||
|
Accounts
receivable
|
12,751,579 | 9,485,338 | ||||||
|
Inventories
|
12,419,622 | 3,735,227 | ||||||
|
Value
added tax receivable
|
730,724 | - | ||||||
|
Other
receivables and prepaid expenses
|
601,842 | 945,191 | ||||||
|
Advances
on inventory purchases
|
443,331 | 288,256 | ||||||
|
Amounts
due from related party
|
13,354,884 | 11,565,574 | ||||||
|
Total
Current Assets
|
43,857,727 | 27,464,949 | ||||||
|
LAND
USE RIGHT, NET
|
2,788,731 | 2,854,508 | ||||||
|
PROPERTY
AND EQUIPMENT, NET
|
12,540,856 | 12,494,452 | ||||||
|
INVESTMENT,
AT COST
|
1,467,000 | 1,467,000 | ||||||
|
TOTAL
ASSETS
|
$ | 60,654,314 | $ | 44,280,909 | ||||
|
LIABILITIES
AND EQUITY
|
||||||||
|
CURRENT
LIABILITIES
|
||||||||
|
Bank
loans
|
$ | 7,305,660 | $ | 6,542,820 | ||||
|
Current
portion of loan from related party
|
2,575,759 | - | ||||||
|
Accounts
payable
|
13,241,962 | 3,620,543 | ||||||
|
Accounts
payable and other payables - related parties
|
782,606 | 754,589 | ||||||
|
Other
payables and accrued liabilities
|
2,287,356 | 1,683,977 | ||||||
|
Value
added and other taxes payable
|
186,895 | 368,807 | ||||||
|
Income
tax payable
|
3,745 | 257,946 | ||||||
|
Deferred
tax liabilities
|
421,899 | 80,009 | ||||||
|
Total
Current Liabilities
|
26,805,882 | 13,308,691 | ||||||
|
LONG-TERM
LIABILITIES
|
||||||||
|
Loan
from related party, net of current portion
|
- | 2,660,085 | ||||||
|
Derivative
liability
|
1,627,839 | - | ||||||
|
Total
Long-term Liabilities
|
1,627,839 | 2,660,085 | ||||||
|
TOTAL
LIABILITIES
|
28,433,721 | 15,968,776 | ||||||
|
COMMITMENTS
AND CONTINGENCIES
|
||||||||
|
EQUITY
|
||||||||
|
Stockholders'
equity of the Company
|
||||||||
|
Preferred
stock ($.001 par value, authorized 5,000,000 shares,
|
||||||||
|
no
shares issued and outstanding)
|
- | - | ||||||
|
Common
stock ($.001 par value, authorized 50,000,000 shares,
|
||||||||
|
13,560,240
and 12,373,567shares issued and outstanding
|
||||||||
|
as
of December 31, 2009 and 2008, respectively)
|
13,560 | 12,374 | ||||||
|
Additional
paid-in capital
|
3,615,357 | 4,549,004 | ||||||
|
Retained
earnings
|
20,406,245 | 15,807,539 | ||||||
|
Statutory
reserve
|
3,585,448 | 3,437,379 | ||||||
|
Accumulated
other comprehensive income
|
3,934,437 | 3,956,860 | ||||||
|
Total
Stockholders' Equity of the Company
|
31,555,047 | 27,763,156 | ||||||
|
Noncontrolling
interest
|
665,546 | 548,977 | ||||||
|
Total
Equity
|
32,220,593 | 28,312,133 | ||||||
|
TOTAL
LIABILITIES AND EQUITY
|
$ | 60,654,314 | $ | 44,280,909 | ||||
F-2
EVER-GLORY
INTERNATIONAL GROUP, INC. AND SUBSDIARIES
CONSOLIDATED
STATEMENTS OF INCOME AND COMPREHENSIVE INCOME
FOR
THE YEARS ENDED DECEMBER 31, 2009 AND 2008
|
2009
|
2008
|
|||||||
|
NET
SALES
|
||||||||
|
Related
parties
|
$ | 73,207 | $ | 681,167 | ||||
|
Third
parties
|
89,797,784 | 96,790,515 | ||||||
|
Total
net sales
|
89,870,991 | 97,471,682 | ||||||
|
COST
OF SALES
|
||||||||
|
Related
parties
|
54,965 | 621,103 | ||||||
|
Third
parties
|
71,510,802 | 80,948,413 | ||||||
|
Total
cost of sales
|
71,565,767 | 81,569,516 | ||||||
|
GROSS
PROFIT
|
18,305,224 | 15,902,166 | ||||||
|
OPERATING
EXPENSES
|
||||||||
|
Selling
expenses
|
4,659,103 | 1,966,926 | ||||||
|
General
and administrative expenses
|
7,533,411 | 6,691,456 | ||||||
|
Total
operating expenses
|
12,192,514 | 8,658,382 | ||||||
|
INCOME
FROM OPERATIONS
|
6,112,710 | 7,243,784 | ||||||
|
OTHER
INCOME (EXPENSE)
|
||||||||
|
Interest
income
|
620,731 | 227,090 | ||||||
|
Interest
expense
|
(443,106 | ) | (2,858,168 | ) | ||||
|
Change
in fair value of derivative liability
|
(1,146,059 | ) | ||||||
|
Other
income
|
52,490 | 34,028 | ||||||
|
Total
other expense
|
(915,944 | ) | (2,597,050 | ) | ||||
|
INCOME
BEFORE INCOME TAX EXPENSE
|
5,196,766 | 4,646,734 | ||||||
|
INCOME
TAX EXPENSE
|
(814,686 | ) | (1,091,006 | ) | ||||
|
NET
INCOME
|
4,382,080 | 3,555,728 | ||||||
|
ADD(LESS):
NET (INCOME) LOSS ATTRIBUTABLE TO THE NONCONTROLLING
INTEREST
|
(129,984 | ) | 4,063 | |||||
|
NET
INCOME ATTRIBUTABLE TO THE COMPANY
|
$ | 4,252,096 | $ | 3,559,791 | ||||
|
NET
INCOME
|
$ | 4,382,080 | $ | 3,555,728 | ||||
|
Foreign
currency translation (loss) gain
|
(35,838 | ) | 1,880,500 | |||||
|
COMPREHENSIVE
INCOME
|
4,346,242 | 5,436,228 | ||||||
|
COMPREHENSIVE
INCOME ATTRIBUTABLE TO
|
||||||||
|
THE
NONCONTROLLING INTEREST
|
116,569 | 10,330 | ||||||
|
COMPREHENSIVE
INCOME ATTRIBUTABLE TO
|
||||||||
|
THE
COMPANY
|
$ | 4,229,673 | $ | 5,425,898 | ||||
|
NET
INCOME PER SHARE
|
||||||||
|
Attributable
to the Company's common stockholders
|
||||||||
|
Basic
|
$ | 0.31 | $ | 0.30 | ||||
|
Diluted
|
$ | 0.29 | $ | 0.26 | ||||
|
Weighted
average number of shares outstanding
|
||||||||
|
Basic
|
13,552,837 | 11,895,048 | ||||||
|
Diluted
|
14,703,522 | 13,489,769 | ||||||
F-3
EVER-GLORY
INTERNATIONAL GROUP, INC. AND SUBSIDIARIES
CONSOLIDATED
STATEMENTS OF EQUITY
FOR
THE YEARS ENDED DECEMBER 31, 2009 AND 2008
|
Additional
|
Retained Earnings
|
Accumulated other
|
||||||||||||||||||||||||||||||
|
Common Stock
|
paid-in
|
Statutory
|
comprehensive
|
Noncontrolling
|
||||||||||||||||||||||||||||
|
Shares
|
Amount
|
capital
|
Unrestricted
|
reserve
|
income
|
Interest
|
Total
|
|||||||||||||||||||||||||
|
Balance
at January 1,2008
|
11,379,309 | $ | 11,379 | $ | 2,154,368 | $ | 12,247,748 | $ | 3,437,379 | $ | 2,076,360 | $ | - | $ | 19,927,234 | |||||||||||||||||
|
Stock
issued for compensation
|
3,068 | 3 | 12,851 | 12,854 | ||||||||||||||||||||||||||||
|
Stock
issued for conversion of
|
- | |||||||||||||||||||||||||||||||
|
convertible
notes and interest
|
922,554 | 923 | 2,032,136 | 2,033,059 | ||||||||||||||||||||||||||||
|
Warrants
issued for services
|
130,082 | 130,082 | ||||||||||||||||||||||||||||||
|
Stock
issued upon exercise of warrants
|
68,636 | 69 | 219,567 | 219,636 | ||||||||||||||||||||||||||||
|
Contribution
from minority shareholders
|
553,040 | 553,040 | ||||||||||||||||||||||||||||||
|
Net
income
|
3,559,791 | 3,559,791 | ||||||||||||||||||||||||||||||
|
Foreign
currency translation gain
|
1,880,500 | (4,063 | ) | 1,876,437 | ||||||||||||||||||||||||||||
|
Balance
at December 31, 2008
|
12,373,567 | 12,374 | 4,549,004 | 15,807,539 | 3,437,379 | 3,956,860 | 548,977 | 28,312,133 | ||||||||||||||||||||||||
|
Cumulative
effect of change in accounting
|
(976,460 | ) | 494,679 | (481,781 | ) | |||||||||||||||||||||||||||
|
principle-January
1,2009-Reclassification of equity
|
||||||||||||||||||||||||||||||||
|
linked
financial instruments to derivative liability
|
||||||||||||||||||||||||||||||||
|
Stock
issued for compensation
|
32,827 | 32 | 43,967 | 43,999 | ||||||||||||||||||||||||||||
|
Stock
issued for merger of Catch-luck
|
1,153,846 | 1,154 | (1,154 | ) | - | |||||||||||||||||||||||||||
|
Net
income
|
4,252,096 | 129,984 | 4,382,080 | |||||||||||||||||||||||||||||
|
Transfer
to reserve
|
(148,069 | ) | 148,069 | |||||||||||||||||||||||||||||
|
Foreign
currency translation loss
|
(22,423 | ) | (13,415 | ) | (35,838 | ) | ||||||||||||||||||||||||||
|
Balance
at December 31, 2009
|
13,560,240 | $ | 13,560 | $ | 3,615,357 | $ | 20,406,245 | $ | 3,585,448 | $ | 3,934,437 | $ | 665,546 | $ | 32,220,593 | |||||||||||||||||
F-4
EVER-GLORY
INTERNATIONAL GROUP, INC. AND SUBSIDIARIES
CONSOLIDATED
STATEMENTS OF CASH FLOWS
FOR
THE YEARS ENDED DECEMBER 31, 2009 AND 2008
|
2009
|
2008
|
|||||||
|
CASH
FLOWS FROM OPERATING ACTIVITIES
|
||||||||
|
Net
income
|
$ | 4,382,080 | $ | 3,555,728 | ||||
|
Adjustments
to reconcile net income to cash provided
|
||||||||
|
by
operating activities:
|
||||||||
|
Depreciation
and amortization
|
1,892,654 | 1,010,379 | ||||||
|
Deferred
income tax
|
341,658 | 78,618 | ||||||
|
Amortization
of discount on convertible notes
|
- | 1,973,587 | ||||||
|
Amortization
of deferred financing costs
|
- | 191,995 | ||||||
|
Change
in fair value of derivative liability
|
1,146,059 | - | ||||||
|
Stock
issued for interest
|
- | 33,059 | ||||||
|
Stock
based compensation
|
43,999 | 12,854 | ||||||
|
Warrants
issued for services
|
- | 130,082 | ||||||
|
Changes
in operating assets and liabilities
|
||||||||
|
Accounts
receivable
|
(3,264,117 | ) | 4,385,144 | |||||
|
Accounts
receivable - related parties
|
- | 166,372 | ||||||
|
Inventories
|
(8,678,475 | ) | (1,675,726 | ) | ||||
|
Value
added tax receivable
|
(730,226 | ) | ||||||
|
Other
receivables and prepaid expenses
|
(244,188 | ) | (771,610 | ) | ||||
|
Advances
on inventory purchases
|
(154,970 | ) | (283,245 | ) | ||||
|
Amounts
due from related party
|
(3,395,972 | ) | (8,664,442 | ) | ||||
|
Accounts
payable
|
9,614,932 | 1,668,565 | ||||||
|
Accounts
payable - related parties
|
2,504,760 | (362,806 | ) | |||||
|
Other
payables and accrued liabilities
|
602,868 | 535,878 | ||||||
|
Other
payables-related parties
|
(554,589 | ) | 784,278 | |||||
|
Value
added and other taxes payable
|
(181,789 | ) | (39,201 | ) | ||||
|
Income
tax payable
|
(254,026 | ) | 102,932 | |||||
|
Net
cash provided by operating activities
|
3,070,658 | 2,832,441 | ||||||
|
CASH
FLOWS FROM INVESTING ACTIVITIES
|
||||||||
|
Other
payables-related party
|
(200,000 | ) | (400,000 | ) | ||||
|
Investment
in La Chapelle
|
- | (1,467,000 | ) | |||||
|
Purchase
of property and equipment
|
(1,314,524 | ) | (530,764 | ) | ||||
|
Proceeds
from sale of equipment
|
28,540 | 72,966 | ||||||
|
Net
cash used in investing activities
|
(1,485,984 | ) | (2,324,798 | ) | ||||
|
CASH
FLOWS FROM FINANCING ACTIVITIES
|
||||||||
|
Contribution
from non-controlling interest
|
- | 553,040 | ||||||
|
Proceeds
from bank loans
|
16,800,360 | 12,137,430 | ||||||
|
Repayment
of bank loans
|
(16,038,040 | ) | (10,753,590 | ) | ||||
|
Repayment
of long term loan from related party
|
(200,000 | ) | (1,990,000 | ) | ||||
|
Proceeds
from exercise of warrants
|
- | 219,635 | ||||||
|
Net
cash provided by financing activities
|
562,320 | 166,515 | ||||||
|
EFFECT
OF EXCHANGE RATE CHANGES ON CASH
|
(36,612 | ) | 129,466 | |||||
|
NET
INCREASE IN CASH AND CASH EQUIVALENTS
|
2,110,382 | 803,624 | ||||||
|
CASH
AND CASH EQUIVALENTS AT BEGINNING OF YEAR
|
1,445,363 | 641,739 | ||||||
|
CASH
AND CASH EQUIVALENTS AT END OF YEAR
|
$ | 3,555,745 | $ | 1,445,363 | ||||
|
SUPPLEMENTAL
DISCLOSURE OF CASH FLOW INFORMATION:
|
||||||||
|
Cash
paid during the year for:
|
||||||||
|
Interest
expense
|
$ | 327,432 | $ | 384,339 | ||||
|
Income
taxes
|
$ | 720,419 | $ | 909,444 | ||||
F-5
EVER-GLORY
INTERNATIONAL GROUP, INC AND SUBSIDIARIES
NOTES
TO THE CONSOLIDATED FINANCIAL STATEMENTS
DECEMBER
31, 2009 AND 2008
NOTE
1 - ORGANIZATION AND BASIS OF PRESENTATION
Ever-Glory
International Group, Inc. (“Ever-Glory”) was incorporated in Florida on October
19, 1994. All of its businesses are operated through its subsidiaries in the
People’s Republic of China (“PRC”).
Perfect
Dream Limited (“Perfect Dream”), a wholly-owned subsidiary of Ever-Glory, was
incorporated in the British Virgin Islands on July 1, 2004.
Ever-Glory
International Group (HK) Ltd. (“Ever-Glory HK”), a wholly-owned subsidiary of
Perfect-Dream, was incorporated in Samoa on September 15, 2009. Ever-Glory
HK is principally engaged in the import and export of
apparel, fabric and accessories.
Goldenway
Nanjing Garments Co. Ltd. (“Goldenway”), a wholly-owned subsidiary of Perfect
Dream, was incorporated in the PRC on December 31, 1993.
Nanjing
Catch-Luck Garments Co, Ltd. (“Catch-Luck”), a wholly owned subsidiary of
Perfect Dream, was incorporated in the PRC on December 21, 1995.
Nanjing
New-Tailun Garments Co. Ltd. (“New-Tailun’), a wholly-owned subsidiary of
Perfect Dream, was incorporated in the PRC on March 27, 2006.
These
three subsidiaries (Goldenway, Catch-Luck and New-Tailun) are principally
engaged in the manufacture and sale of garments.
Ever-Glory
International Group Apparel Inc.(“Ever-Glory Apparel”), a wholly owned
subsidiary of Goldenway, was incorporated in the PRC on January 6,
2009. Goldenway invested approximately $735,000 (RMB 5.0 million) in
cash. As of December 31, 2009, Goldenway has increased its investment to
approximately $6,595,000 (RMB45.0 million). Ever-Glory Apparel is
principally engaged in the import and export of
apparel, fabric and accessories.
Shanghai
LA GO GO Fashion Company Limited (“LA GO GO”), a joint venture of Goldenway and
Shanghai La Chapelle Garment and Accessories Company Limited (“La Chapelle”),
was incorporated in the PRC on January 24, 2008. Goldenway invested
approximately $826,200 (RMB 6.0 million) in cash, and La Chapelle invested
approximately $553,040 (RMB 4.0 million) in cash, for a 60% and 40% ownership
interest, respectively, in the joint venture. The joint venture was formed to
establish and create a leading brand of ladies’ apparel for the mainland Chinese
market. On March 23, 2009, Goldenway transfered all of its ownership interest in
LA GO GO to Ever-Glory Apparel. As of December 31, 2009, LA GO GO was operating
185 retail stores selling its LA GO GO Brand clothing.
F-6
EVER-GLORY
INTERNATIONAL GROUP, INC AND SUBSIDIARIES
NOTES
TO THE CONSOLIDATED FINANCIAL STATEMENTS
DECEMBER
31, 2009 AND 2008
Ever-Glory,
Perfect Dream, Ever-Glory HK ,Goldenway, New-Tailun, Catch-Luck, Ever-Glory
Apparel and LA GO GO are hereinafter referred to as (the “Company”)
RESTATED
2009 QUARTERLY FINANCIAL INFORMATION
Subsequent
to the issuance of the Company’s September 30, 2009 consolidated interim
financial statements, the Company determined that it had incorrectly reported
derivative warrant liabilities related to the Company’s January 1, 2009 change
in accounting principle as a result of the adoption of ASC 815 (previously EITF
No. 07-5). The Company has issued restated unaudited financial
statements for the nine months ended September 30, 2009, on a Form 10-Q/A and it
has restated its unaudited financial statements for the first two quarters of
2009 in this Annual Report on Form 10-K.There was no impact to the fourth
quarter of 2009 as a result of the restatement of the first three quarters of
2009.
NOTE
2 - SUMMARY OF SIGNIFICANT ACCOUNTING POLICIES
Principles of
Consolidation
The
consolidated financial statements include Ever-Glory and its subsidiaries, and
are prepared in accordance with accounting principles generally accepted in the
United States of America (“GAAP”). All significant intercompany accounts and
transactions have been eliminated in consolidation.
Business Combinations with
Entities under Common Control
On
November 9, 2006, the Company acquired 100% of New-Tailun from Ever-Glory
Enterprises (HK) Limited (Ever-Glory Hong Kong) . The Company paid $2,000,000 in
cash and, in September 2007, issued 20,833,333 shares of the Company’s
restricted common stock in connection with the transaction.
On June
26, 2006, the Company acquired 100% of Catch-Luck from Ever-Glory Hong Kong. The
Company paid Ever-Glory Hong Kong $600,000 in cash and issued 1,307,693 shares
of the Company’s restricted common stock in connection with the transaction. On
August 31, 2006, the Company amended the terms of the purchase consideration as
follows: An additional 1,153,846 shares of the Company’s restricted common stock
were to be issued to Ever-Glory Hong Kong if Catch-Luck generated gross revenues
of at least $19,000,000 and net income of $1,500,000 for the year ended December
31, 2008. These targets were met in 2008 and the shares were issued on April 28,
2009. An additional 1,153,846 shares of the Company’s restricted common stock
will be issued to Ever-Glory Hong Kong if Catch-Luck generates gross revenues of
at least $19,000,000 and net income of $1,500,000 for the year ending
December
31, 2009. These targets were met in 2009 and the shares are expected to be
issued in the second quarter of 2010.
F-7
EVER-GLORY
INTERNATIONAL GROUP, INC AND SUBSIDIARIES
NOTES
TO THE CONSOLIDATED FINANCIAL STATEMENTS
DECEMBER
31, 2009 AND 2008
Mr.
Edward Yihua Kang, is the Company’s Chairman and Chief Executive Officer, and is
also a significant shareholder of the Company Mr. Kang was also the controlling
shareholder of Ever-Glory Hong Kong at the time of these transactions.
Accordingly these transactions were accounted for as mergers of entities under
common control, and have been included in the consolidated financial statements
as of the beginning of the first post-merger period presented with each account
stated at historical cost.
Use of Estimates and
Assumptions
In
preparing the consolidated financial statements in conformity with GAAP,
management makes certain estimates and assumptions that affect the reported
amounts and disclosure of assets and liabilities at the date of the financial
statements and the reported amounts of revenues and expenses during the
reporting period. Management believes that the estimates utilized in
preparing the financial statements are reasonable and prudent based on the best
information available at the time the estimates are made. Actual results could
differ from these estimates.
Economic and Political
Risks
The
majority of the Company’s operations are conducted in the PRC. Accordingly, the
Company’s business, financial condition and results of operations may be
influenced by the political, economic and legal environment in the PRC, and by
the general state of the PRC economy. The Company's operations in the PRC are
subject to special considerations and significant risks not typically associated
with companies in North America and Western Europe. These include risks
associated with, among others, the political, economic and legal environment and
foreign currency exchange. The Company's results may be adversely affected by
changes in the political and social conditions in the PRC, and by changes in
governmental policies with respect to laws and regulations, anti-inflationary
measures, currency conversion, remittances abroad, and rates and methods of
taxation.
Cash and Cash
Equivalents
Cash and
cash equivalents include cash on hand and demand deposits with banks with
original maturities within three months.
F-8
EVER-GLORY
INTERNATIONAL GROUP, INC AND SUBSIDIARIES
NOTES
TO THE CONSOLIDATED FINANCIAL STATEMENTS
DECEMBER
31, 2009 AND 2008
Accounts
Receivable
The
Company extends unsecured credit to its customers in the ordinary course of
business but mitigates the associated risks by performing credit checks and
actively pursuing past due accounts. An allowance for doubtful
accounts is established and recorded based on management’s assessment of the
credit history of its customers and current relationships with them. The Company
writes off accounts receivable when amounts are deemed
uncollectible.
As of
December 31, 2009 and 2008, the Company considers all its accounts receivable to
be collectable and no provision for doubtful accounts has been made in the
consolidated financial statements.
Inventories
Manufactured
inventories are stated at lower of cost or market value, cost being determined
on a specific identification method. The Company manufactures products upon
receipt of orders from its customers. All products must pass the customers’
quality assurance procedures before delivery. Therefore, products are rarely
returned by customers after delivery.
Retail
merchandise inventories are stated at the lower of average cost or
market.
The
Company records an allowance for obsolete raw materials aged more than one year
and for obsolete finished goods aged more than eighteen months.
Property and
Equipment
Property
and equipment are stated at cost, less accumulated
depreciation. Expenditures for additions, major renewals and
betterments are capitalized and expenditures for maintenance and repairs are
charged to expense as incurred.
Depreciation
is provided on a straight-line basis, less estimated residual value, over the
assets’ estimated useful lives. The estimated useful lives are as
follows:
|
Property
and plant
|
15-20
Years
|
|
|
Leasehold
improvements
|
2-10
Years
|
|
|
Machinery
and equipment
|
10
Years
|
|
|
Office
equipment and furniture
|
5
Years
|
|
|
Motor
vehicles
|
5
Years
|
F-9
EVER-GLORY
INTERNATIONAL GROUP, INC AND SUBSIDIARIES
NOTES
TO THE CONSOLIDATED FINANCIAL STATEMENTS
DECEMBER
31, 2009 AND 2008
Land Use
Rights
All land
in the PRC is owned by the government and cannot be sold to any individual or
company. However, the government may grant a “land use right” to
occupy, develop and use land. The Company records land use rights obtained as
intangible assets at cost, which is amortized evenly over the grant period of 50
years.
Long-Lived
Assets
Long-lived
assets, property, equipment and land use rights held and used by the Company are
reviewed for impairment whenever events or changes in circumstances indicate
that the carrying amount of an asset may not be recoverable. For purposes of
evaluating the recoverability of long-lived assets, when undiscounted future
cash flows will not be sufficient to recover an asset’s carrying amount, the
asset is written down to its fair value. There were no impairments of long-lived
assets as of December 31, 2009.
Cost
Investment
Cost Investment consists of the
Company’s 10% equity investment in La Chapelle,
acquired on January 9, 2008 for approximately $1,467,000. If a decline in the
fair value of a cost method investment is determined to be other than temporary,
an impairment charge is recorded and the fair value becomes the new cost basis
of the investment. The fair value of the cost method
investment is not required
to be determined unless impairment indicators are present. When impairment
indicators exist, discounted cash flow analyses are generally used to estimate
the fair value. Management determined that there was no impairment of the cost
investment as of December 31, 2009.
Financial
Instruments
Management
has estimated that the carrying amounts of non-related party financial
instruments approximate their fair values due to their short-term maturities.
The fair value of amounts due from (to) related parties is not practicable to
estimate due to the related party nature of the underlying
transactions.
Fair Value
Accounting
Accounting
Standards Codification (“ASC”) 820 “Fair Value Measurements and
Disclosures”, previously FAS No.157, establishes a fair value
hierarchy that prioritizes the inputs to valuation techniques used to measure
fair value. The hierarchy gives the highest priority to unadjusted quoted prices
in active markets for identical assets or liabilities (Level 1
measurements) and the lowest priority to unobservable inputs (Level 3
measurements). The three levels of the fair value hierarchy under ASC 820 are
described below:
F-10
EVER-GLORY
INTERNATIONAL GROUP, INC AND SUBSIDIARIES
NOTES
TO THE CONSOLIDATED FINANCIAL STATEMENTS
DECEMBER
31, 2009 AND 2008
|
|
Level 1
|
Unadjusted
quoted prices in active markets that are accessible at the measurement
date for identical, unrestricted assets or
liabilities;
|
|
|
Level 2
|
Quoted
prices in markets that are not active, or inputs that are observable,
either directly or indirectly, for substantially the full term of the
asset or liability;
|
|
|
Level 3
|
Prices
or valuation techniques that require inputs that are both significant to
the fair value measurement and unobservable (supported by little or no
market activity).
|
At
December 31, 2009, the Company’s financial assets consist of cash placed with
financial institutions management considers to be of a high
quality.
Effective
January 1, 2008, the Company adopted ASC 825-10 “Financial Instruments”,
previously SFAS No. 159, “The
Fair Value Option for Financial Assets and Financial Liabilities—Including an Amendment of FASB
Statement No. 115”, which allows an entity
to choose to measure certain financial instruments and liabilities at fair value
on a contract-by-contract basis. Subsequent fair value measurement for the
financial instruments and liabilities an entity chooses to measure will be
recognized in earnings.
Revenue and Cost
Recognition
The
Company recognizes wholesale revenue from product sales, net of value added
taxes, upon delivery for local sales and upon shipment of the products for
export sales, at which time title passes to the customer provided that there are
no uncertainties regarding customer acceptance, persuasive evidence of an
arrangement exists, the sales price is fixed and determinable and collectability
is deemed probable. The Company recognize wholesale revenue from manufacturing
fees charged to buyers for the assembly of garments from materials provided by
the buyers upon completion of the manufacturing process and upon delivery to the
buyer for local sales and upon shipment of the products for export sales,
provided that there are no uncertainties regarding customer acceptance,
persuasive evidence of an arrangement exists, the sales price is fixed and
determinable and collectability is deemed probable.
Cost of
goods sold includes the direct raw material cost, direct labor cost,
manufacturing overheads including depreciation of production equipment and rent
consistent with the revenue earned.Cost of goods sold excludes warehousing
costs, which historically have not been significant.
F-11
EVER-GLORY
INTERNATIONAL GROUP, INC AND SUBSIDIARIES
NOTES
TO THE CONSOLIDATED FINANCIAL STATEMENTS
DECEMBER
31, 2009 AND 2008
Local
transportation and unloading charges, and product inspection charges, are
included in selling expenses and totaled $100,010 in 2009 and $114,473 in 2008,
respectively.
Income
Taxes
Deferred
tax assets and liabilities are recognized for the future tax consequences
attributable to differences between the financial statement carrying amounts of
existing assets and liabilities and their respective tax
bases. Deferred tax assets and liabilities are measured using enacted
tax rates expected to apply to taxable income in the years in which those
temporary differences are expected to be recovered or settled. The
effect on deferred tax assets and liabilities of a change in tax rates is
recognized in income in the period that included the enactment
date.
The
Company adopted ASC740 (formerly FASB Interpretation 48, “Accounting for
Uncertainty in Income Taxes” (“FIN 48”)) as of January 1, 2007. A tax position
is recognized as a benefit only if it is “more likely than not” that the tax
position would be sustained in a tax examination, with a tax examination being
presumed to occur. The amount recognized is the largest amount of tax benefit
that is greater than 50% likely of being realized on examination. For tax
positions not meeting the “more likely than not” test, no tax benefit is
recorded. The adoption had no effect on the Company’s consolidated financial
statements.
Non-controlling
Interest
In
December 2007, the FASB issued new accounting and disclosure guidance related to
non-controlling interests in subsidiaries (previously referred to as minority
interests), which resulted in a change in accounting policy effective January 1,
2009. Among other things, the new guidance requires that a non-controlling
interest in a subsidiary be accounted for as a component of equity separate from
the parent's equity. The new guidance is being applied prospectively, except for
the presentation and disclosure requirements, which have been applied
retrospectively.
Accordingly,
after adoption, non-controlling interests, consisting of La Chapelle’s 40%
interest in LA GO GO of $665,546 and $548,977 at December 31, 2009 and December
31, 2008, respectively, are classified as equity, a change from its previous
classification between liabilities and stockholders' equity. Earnings (loss)
attributable to non-controlling interest ($129,984 and ($4,063) for the years
2009 and 2008, respectively) are included in net income, although such earnings
continue to be deducted to measure earnings per share. Purchases and sales of
non-controlling interest are reported in equity similar to treasury stock
transactions.
F-12
EVER-GLORY
INTERNATIONAL GROUP, INC AND SUBSIDIARIES
NOTES
TO THE CONSOLIDATED FINANCIAL STATEMENTS
DECEMBER
31, 2009 AND 2008
Foreign Currency Translation
and Other Comprehensive Income
The
reporting currency of the Company is the U.S. dollar. The functional currency of
Ever-Glory, Perfect Dream and Ever-Glory HK is the U.S. dollar. The functional
currency of Goldenway, New Tailun, Catch-luck, Ever-Glory Apparel and LA GO
GO is the Chinese RMB.
For the
subsidiaries whose functional currencies are the RMB, all assets and liabilities
are translated at the exchange rate on the balance sheet date; equity is
translated at historical rates and items in the statement of income are
translated at the average rate for the period. Translation adjustments resulting
from this process are included in accumulated other comprehensive income in the
statement of equity. The resulting net translation losses that arise from
exchange rate fluctuations on transactions denominated in a currency other than
the functional currency are included in the results of operations as incurred
and amounted to $6,380 and $295,053 for the years ended December 31, 2009 and
2008, respectively. Items in the cash flow statement are translated at the
average exchange rate for the period.
Translation
adjustments resulting from this process included in accumulated other
comprehensive income in the consolidated statements of equity amounted to
$3,934,437 and $3,956,860 as of December 31, 2009 and 2008, respectively. Assets
and liabilities at December 31, 2009 and 2008 were translated at RMB6.82 to
$1.00. The average translation rates applied to income statement accounts and
statement of cash flows for the years ended December 31, 2009 and 2008 were
RMB6.82 and RMB6.94 to $1.00, respectively. As a result, amounts related to
assets and liabilities reported on the statement of cash flows will not
necessarily agree with changes in the corresponding balances on the balance
sheets.
Earnings Per
Share
The
Company reports earnings per share in accordance ASC 260, which requires
presentation of basic and diluted earnings per share in conjunction with the
disclosure of the methodology used in computing such earnings per share. Basic
earnings per share excludes dilution and is computed by dividing income
available to common stockholders by the weighted average common shares
outstanding during the period. Diluted earnings per share takes into account the
potential dilution that could occur if securities or other contracts to issue
common stock were exercised and converted into common stock. Further, if the
number of common shares outstanding increases as a result of a stock dividend or
stock split or decreases as a result of a reverse stock split, the computations
of a basic and diluted EPS shall be adjusted retroactively for all periods
presented to reflect that change in capital structure.
F-13
EVER-GLORY
INTERNATIONAL GROUP, INC AND SUBSIDIARIES
NOTES
TO THE CONSOLIDATED FINANCIAL STATEMENTS
DECEMBER
31, 2009 AND 2008
Included
in the calculation of basic EPS are shares of restricted common stock that have
been issued by the Company, all of which are fully vested. Shares of restricted
common stock whose issuance is contingent upon the attainment of specified
earnings targets are considered outstanding and included in the computation of
basic EPS as of the date that all necessary conditions have been satisfied,
which is the date upon which the specified amount of earnings has been
attained. These shares are to be considered outstanding and included
in the computation of diluted EPS as of the beginning of the period in which the
conditions are satisfied. If the specified amount of earnings has not
been attained as of the end of the reporting period, the contingently issuable
shares are excluded from the calculation of basic and diluted EPS.
Segments
The
Company applies ASC280 which establishes standards for operating information
regarding operating segments in annual financial statements and requires
selected information for those segments to be presented in financial reports
issued to stockholders. ASC280 also establishes standards for related
disclosures about products and services and geographic areas. Operating segments
are identified as components of an enterprise about which separate discrete
financial information is available for evaluation by the chief operating
decision maker, or decision making group, in making decisions how to allocate
resources and assess performance. The Company reports financial and operating
information in two segments:
|
(1)
|
Wholesale
apparel manufacture and sales
|
|
(2)
|
Retail
sales of own-brand clothing
|
Reclassification
Certain
amounts reported in the 2008 financial statements have been reclassified to
conform to the 2009 presentation.
Recent Accounting
Pronouncements
Embedded
Derivatives
(Included
in ASC 815 “Derivatives and Hedging”, previously SFAS 133)
In
June 2008, the FASB issued Emerging Issues Task Force Issue 07-5 “Determining
whether an Instrument (or Embedded Feature) is indexed to an Entity’s Own Stock”
(“EITF No. 07-5”). This Issue is effective for financial statements issued for
fiscal years beginning after December 15, 2008, and interim periods within those
fiscal years. Early application is not permitted. Paragraph 11(a) of Statement
of Financial Accounting Standard No 133 “Accounting for Derivatives and Hedging
Activities” (“SFAS 133”) specifies that a contract that would otherwise meet the
definition of a derivative but is both (a) indexed to the Company’s own
stock and (b) classified in stockholders’ equity in the statement of
financial position would not be considered a derivative financial instrument.
EITF No.07-5 provides a new two-step model to be applied in determining whether
a financial instrument or an embedded feature is indexed to an issuer’s own
stock and thus able to qualify for the SFAS 133 paragraph 11(a) scope exception.
Upon adoption of EITF No. 07-5, the Company reclassified certain warrants that
were previously classified as equity to liability
(Note 8).
F-14
EVER-GLORY
INTERNATIONAL GROUP, INC AND SUBSIDIARIES
NOTES
TO THE CONSOLIDATED FINANCIAL STATEMENTS
DECEMBER
31, 2009 AND 2008
Business
Combinations
(Included
in ASC 805 “Business Combinations”, previously SFAS No. 141(R))
This ASC
guidance revised SFAS No. 141, “Business Combinations” and
addresses the accounting and disclosure for identifiable assets acquired,
liabilities assumed, and noncontrolling interests in a business combination.
Adoption of this standard on January 1, 2009 did not have a material impact on
the Company’s condensed consolidated financial statements, as the Company did
not enter into a business combination during 2009.
Noncontrolling
Interests
(Included
in ASC 810 “Consolidation”, previously SFAS No. 160 “Noncontrolling Interests in
Consolidated Financial Statements, an amendment of ARB No. 51)
SFAS 160
establishes accounting and reporting standards for the noncontrolling interest
in a subsidiary and for the deconsolidation of a subsidiary. It clarifies that a
noncontrolling interest in a subsidiary is an ownership interest in the
consolidated entity that should be reported as equity in the consolidated
financial statements. The Company adopted SFAS 160 on January 1, 2009. As a
result, the Company has reclassified financial statement line items within the
Company’s Consolidated Balance Sheets and Statements of Income and Comprehensive
Income for 2008 to conform to this standard.
Interim
Disclosures about Fair Value of Financial Instruments
(Included in ASC 825 “Financial Instruments”, previously FSP SFAS No.
107-1)
This
guidance requires that the fair value disclosures required for all financial
instruments within the scope of SFAS 107, “Disclosures about Fair Value of Financial
Instruments”, be included in interim financial statements. This guidance
also requires entities to disclose the method and significant assumptions used
to estimate the fair value of financial instruments on an interim and annual
basis and to highlight any changes from prior periods. FSP SFAS No. 107-1 was
effective for interim periods ending after September 15, 2009. The adoption of
FSP SFAS No.107-1 did not have a material impact on the Company’s Consolidated
Financial Statements.
F-15
EVER-GLORY
INTERNATIONAL GROUP, INC AND SUBSIDIARIES
NOTES
TO THE CONSOLIDATED FINANCIAL STATEMENTS
DECEMBER
31, 2009 AND 2008
FASB
Accounting Standards Codification
(Accounting
Standards Update (“ASU”) 2009-1)
In June
2009, the FASB approved its Accounting Standards Codification (“Codification”)
as the single source of authoritative United States accounting and reporting
standards applicable for all non-governmental entities, with the exception of
the SEC and its staff. The Codification is effective for interim or annual
financial periods ending after September 15, 2009 and impacts the Company’s
financial statements as all future references to authoritative accounting
literature will be referenced in accordance with the Codification. There have
been no changes to the content of the Company’s financial statements or
disclosures as a result of implementing the Codification during the year of
2009.As a result of the Company’s implementation of the Codification during the
year of 2009, previous references to new accounting standards and literature are
no longer applicable. In the current financial statements, the Company has
provided reference to both new and old guidance to assist in understanding the
impact of recently adopted accounting literature, particularly for guidance
adopted since the beginning of the current fiscal year but prior to the
Codification.
Collaborative
arrangements
(Included
in ASC808, formerly EITF07-1)
In
December 2007, the FASB issued new accounting guidance that defines
collaborative arrangements and establishes reporting requirements for
transactions between participants in a collaborative arrangement and between
participants in the arrangement and third parties. It also establishes the
appropriate income statement presentation and classification for joint operating
activities and payments between participants, as well as the sufficiency of the
disclosures related to those arrangements. This new accounting guidance was
effective for the Company on January 1, 2009, and its adoption did not have a
significant impact on its consolidated financial statements.
Transfers
of Financial Assets
(Included
in ASC860, formerly SFAS No. 166)
In June 2009, the FASB issued
new guidance on the Accounting for Transfers of Financial Assets that addresses
information a reporting entity provides in its financial statements about the
transfer of financial assets; the effects of a transfer on its financial
position, financial performance, and cash flows; and a transferor continuing
involvement in transferred financial assets. The guidance also removes the
concept of a qualifying special purpose entity, limits the circumstances in
which a transferor derecognizes a portion or component of a financial asset,
defines participating interest and enhances the information provided to
financial statement users to provide greater transparency. This guidance is
effective for the first annual reporting period beginning after November 15,
2009 and will be effective for the Company as of January 1, 2010. The Company is
currently evaluating the impact on our consolidated financial statements upon
adoption.
F-16
EVER-GLORY
INTERNATIONAL GROUP, INC AND SUBSIDIARIES
NOTES
TO THE CONSOLIDATED FINANCIAL STATEMENTS
DECEMBER
31, 2009 AND 2008
NOTE
3 - INVENTORIES
Inventories
at December 31, 2009 and 2008 consisted of the following:
|
2009
|
2008
|
|||||||
|
Raw
materials
|
$ | 735,891 | $ | 328,607 | ||||
|
Work-in-progress
|
6,212,767 | 342,303 | ||||||
|
Finished
goods
|
5,529,726 | 3,064,317 | ||||||
| 12,478,384 | 3,735,227 | |||||||
|
Less:
allowance for obsolete inventories
|
(58,762 | ) | - | |||||
|
Total
inventories
|
$ | 12,419,622 | $ | 3,735,227 | ||||
NOTE
4 - LAND USE RIGHTS
In 2006,
the Company obtained a fifty-year land use right on 112,442 square meters of
land in the Nanjing Jiangning Economic and Technological Development
Zone.
Land use
rights at December 31, 2009 and 2008 consisted of the following:
|
2009
|
2008
|
|||||||
|
Land
use rights
|
$ | 3,068,813 | $ | 3,068,813 | ||||
|
Less:
accumulated amortization
|
(280,082 | ) | (214,305 | ) | ||||
|
Land
use rights, net
|
$ | 2,788,731 | $ | 2,854,508 | ||||
Amortization
expense was $65,777 and $64,634 for the years ended December 31, 2009 and 2008,
respectively. Future expected amortization expense for land use rights is
approximately $65,000 for each of the next five years.
NOTE
5 - PROPERTY AND EQUIPMENT
The
following is a summary of property and equipment at December 31 2009 and
2008:
|
2009
|
2008
|
|||||||
|
Property
and plant
|
$ | 14,172,467 | $ | 12,065,223 | ||||
|
Equipment
and machinery
|
3,600,516 | 3,588,705 | ||||||
|
Office
equipment and furniture
|
437,116 | 410,710 | ||||||
|
Motor
vehicles
|
297,811 | 234,971 | ||||||
| 18,507,910 | 16,299,609 | |||||||
|
Less:
accumulated depreciation
|
5,967,054 | 3,805,157 | ||||||
|
Property
and equipment, net
|
$ | 12,540,856 | $ | 12,494,452 | ||||
F-17
EVER-GLORY
INTERNATIONAL GROUP, INC AND SUBSIDIARIES
NOTES
TO THE CONSOLIDATED FINANCIAL STATEMENTS
DECEMBER
31, 2009 AND 2008
Depreciation
expense was $1,826,922 and $945,745 for the years ended December 31, 2009 and
2008, respectively.
NOTE
6 - OTHER PAYABLES AND ACCRUED LIABILITIES
Other
payables and accrued liabilities at December 31, 2009 and 2008 consisted of the
following:
|
2009
|
2008
|
|||||||
|
Building
construction costs payable
|
$ | 612,606 | $ | 633,725 | ||||
|
Accrued
professional fees
|
182,608 | 224,985 | ||||||
|
Accrued
wages and welfare
|
1,205,874 | 553,690 | ||||||
|
Other
payables
|
286,268 | 271,577 | ||||||
|
Total
other payables and accrued liabilities
|
$ | 2,287,356 | $ | 1,683,977 | ||||
NOTE
7 - BANK LOANS
Bank
loans represent amounts due to various banks and are generally due on demand or
within one year. These loans can be renewed with the banks. Short term bank
loans consisted of the following at December 31, 2009 and 2008:
|
2009
|
2008
|
|||||||
|
Bank
loan, interest rate at 0.44583% per month,
|
||||||||
|
paid
in full, January 2010
|
$ | 1,467,000 | $ | |||||
|
Bank
loan, interest rate at 0.44583% per month,
|
||||||||
|
paid
in full, March 2010
|
1,026,900 | |||||||
|
Bank
loan, interest rate at 0.4455% per month,
|
||||||||
|
paid
in full, March 2010
|
440,100 | |||||||
|
Bank
loan, interest rate at 0.405% per month,
|
||||||||
|
paid
in full, March 2010
|
264,060 | |||||||
|
Bank
loan, interest rate at 0.44583% per month,
|
||||||||
|
due
May 2010
|
3,374,100 | |||||||
|
Bank
loan, interest rate at 0.4425% per month,
|
||||||||
|
due
December 2010
|
733,500 | |||||||
|
Bank
loan, interest rate at 0.60225% per month,
|
||||||||
|
paid
in full, February 2009
|
5,809,320 | |||||||
|
Bank
loan, interest rate at 0.48825% per month,
|
||||||||
|
paid
in full, April 2009
|
733,500 | |||||||
|
Total
bank loans
|
$ | 7,305,660 | $ | 6,542,820 | ||||
F-18
EVER-GLORY
INTERNATIONAL GROUP, INC AND SUBSIDIARIES
NOTES
TO THE CONSOLIDATED FINANCIAL STATEMENTS
DECEMBER
31, 2009 AND 2008
On
July 31, 2008, Goldenway entered into a two-year revolving line of credit
agreement with a PRC Bank, which allows the Company to borrow up to
approximately $7.3 million (RMB50million). These borrowings are guaranteed by
Jiangsu Ever-Glory, an entity controlled by Mr. Kang. These borrowings are also
collateralized by the Company’s property and plant. As of December
31, 2009, $5.9 million of bank loans were under this agreement
and approximately $1.4 million was unused and available. Other bank loans
are not collateralized. In January and March 2010, the Company repaid and
then borrowed approximately $2.5 million under this agreement.
On June
30, 2009, HSBC approved a revolving credit facility of $2.5 million to
Perfect-Dream. To date nothing has been drawn down on this line of
credit.
On July
3, 2009, Ever-Glory Apparel entered into a one-year line of credit agreement for
approximately $5.9 million (RMB40 million) with Nanjing Bank. As of December 31,
2009, $440,100 of bank loans were drawn down under this agreement
and approximately $5.4 million was unused and available. In March 2010 the
$440,100 was repaid and the line of credit agreement expired. On March 11,
2010, Ever-Glory Apparel entered into a new one-year line of credit agreement
for approximately $7.3 million (RMB50 million) with Nanjing Bank. The loan is guaranteed by Jiangsu
Ever-Glory and Goldenway.
Total
interest expense on bank loans was $327,374 and $327,834 for the years ended
December 31, 2009 and 2008, respectively.
Note
8 DERIVATIVE WARRANT LIABILITY
(Included
in ASC 815 “Derivatives and Hedging”, previously SFAS 133)
In June 2008, the
FASB ratified EITF No. 07-5, Determining Whether an Instrument
(or Embedded Feature) is Indexed to an Entity’s Own Stock. Paragraph
11(a) of SFAS No. 133 specifies that a contract that would otherwise meet the
definition of a derivative but is both (a) indexed to the Company’s own stock
and (b) classified in stockholders’ equity in the statement of financial
position would not be considered a derivative financial instrument. EITF 07-5
provides a new two-step model to be applied in determining whether a financial
instrument or an embedded feature is indexed to an issuer’s own stock and thus
able to qualify for the SFAS No. 133 paragraph 11(a) scope exception. The
Company’s adoption of EITF 07-5 effective January 1, 2009, resulted in the
identification of certain warrants that were determined to require liability
classification because of certain provisions that may result in an adjustment to
their exercise price. Accordingly, these warrants were retroactively
reclassified as liabilities upon the effective date of EITF No. 07-5 as required
by the EITF. The resulting cumulative effect
of the change in accounting
principle was a decrease in paid in capital of approximately $976,500, an
increase in retained earnings of approximately $494,700, and the
recognition of a liability of approximately $481,800 as of January
1, 2009. The liability was then adjusted to fair value as of December 31, 2009, resulting
in an increase in the liability and an increase in
other expense
of $1,146,059.
F-19
EVER-GLORY
INTERNATIONAL GROUP, INC AND SUBSIDIARIES
NOTES
TO THE CONSOLIDATED FINANCIAL STATEMENTS
DECEMBER
31, 2009 AND 2008
The
Company uses the Black-Scholes pricing model to calculate fair value of its
warrant liabilities. Key assumptions used to apply these models are as
follows:
|
December 31,
2009
|
January 1,
2009
|
|||||||
|
Expected
term
|
3.43
years
|
4.43
years
|
||||||
|
Volatility
|
107 | % | 100 | % | ||||
|
Risk-free
interest rate
|
1.125 | % | 1.5 | % | ||||
|
Dividend
yield
|
0 | % | 0 | % | ||||
NOTE
9 - INCOME TAX
Pre-tax
income (loss) for the year ended December 31 2009 and 2008 was taxable in
the following jurisdictions:
|
2009
|
2008
|
|||||||
|
PRC
|
$ | 4,684,365 | $ | 7,408,479 | ||||
|
Others
|
512,401 | (2,761,745 | ) | |||||
| $ | 5,196,766 | $ | 4,646,734 | |||||
The
Company’s operating subsidiaries are governed by the Income Tax Law of the PRC
concerning Foreign Investment Enterprises and Foreign Enterprises and various
local income tax laws (“the Income Tax Laws”).
Beginning
January 1, 2008, the new Enterprise Income Tax (“EIT”) law replaced the old laws
for Domestic Enterprises (“DES”) and Foreign Invested Enterprises
(“FIEs”).
The key
changes are:
|
|
a.
|
The
new standard EIT rate of 25% replaces the 33% rate applicable to both DES
and FIEs, except for High-Tech companies that pay a reduced rate of
15%;
|
|
|
b.
|
Companies
established before March 16, 2007 continue to enjoy tax holiday treatment
approved by local governments for a grace period of either the next 5
years, or until the tax holiday term is completed, whichever is
sooner.
|
F-20
EVER-GLORY
INTERNATIONAL GROUP, INC AND SUBSIDIARIES
NOTES
TO THE CONSOLIDATED FINANCIAL STATEMENTS
DECEMBER
31, 2009 AND 2008
Below is
a summary of the income tax rates for each of our PRC subsidiaries in 2008 and
2009.
|
Goldenway
|
New-
Tailun
|
Catch-Luck
|
LA GO GO
|
Ever-Glory
Apparel
|
||||||||||||||||
|
2008
|
25.0 | % | 12.5 | % | 12.5 | % | 25.0 | % | * | |||||||||||
|
2009
|
25.0 | % | 12.5 | % | 12.5 | % | 25.0 | % | 25.0 | % | ||||||||||
*Ever-Glory
Apparel was established on January 6, 2009.
Perfect
Dream was incorporated in the British Virgin Islands on July 1, 2004, and has
no liabilities to income tax.
Ever-Glory
HK was incorporated in Samoa on September 15, 2009, and has no liabilities
to income tax.
Ever-Glory
was incorporated in the United States and has incurred net operating losses for
income tax purposes for 2009 and 2008. As of December 31, 2009, the net
operating loss carry forwards for United States income taxes was approximately
$1,186,000 which may be available to reduce future years’ taxable income. These
carry forwards will expire, if not utilized, through 2029. Management believes
that the realization of the benefits from these losses is uncertain due to the
Company’ limited operating history and continuing losses for United States
income tax purposes. Accordingly, the Company has provided a 100% valuation
allowance on the deferred tax asset to reduce the asset to zero. The valuation
allowance at December 31, 2009 was approximately $403,000.
The
following table reconciles the PRC statutory rates to the Company’s effective
tax rate for the years ended December 31, 2009 and 2008:
|
2009
|
2008
|
|||||||
|
PRC
Statutory Rate
|
25.0 | 25.0 | ||||||
|
Income
tax exemption
|
(9.2 | ) | (12.8 | ) | ||||
|
Other
|
1.6 | 2.5 | ||||||
|
Effective
income tax rate
|
17.4 | % | 14.7 | % | ||||
F-21
EVER-GLORY
INTERNATIONAL GROUP, INC AND SUBSIDIARIES
NOTES
TO THE CONSOLIDATED FINANCIAL STATEMENTS
DECEMBER
31, 2009 AND 2008
Income
tax expense for the years ended December 31, 2009 and 2008 is as
follows:
|
2009
|
2008
|
|||||||
|
Current
|
$ | 473,028 | $ | 1,012,388 | ||||
|
Deferred
|
341,658 | 78,618 | ||||||
|
Income
tax expense
|
$ | 814,686 | $ | 1,091,006 | ||||
The tax
effects of temporary differences that give rise to deferred tax assets and
liabilities at December 31, 2009 and 2008 are presented below:
Deferred
tax assets:
|
2009
|
2008
|
|||||||
|
U.S.
net operating losses
|
$ | 403,000 | $ | 254,000 | ||||
|
PRC
purchase invoices not yet received
|
1,366,398 | 407,879 | ||||||
| $ | 1,769,398 | $ | 661,879 | |||||
|
Valuation
allowance
|
(403,000 | ) | (254,000 | ) | ||||
| $ | 1,366,398 | $ | 407,879 | |||||
|
Deferred
Tax liabilities:
|
||||||||
|
PRC
sales invoices not yet issued
|
$ | 1,788,297 | $ | 487,888 | ||||
|
Net
deferred tax liabilities
|
$ | 421,899 | $ | 80,009 | ||||
At
December 31, 2009 and 2008, deferred tax liabilities arise from temporary
differences relating to sales and purchase invoices, which, for PRC tax
purposes are recorded
upon issuance of invoices, and which are recorded upon delivery or
shipment for book purposes.
NOTE
10 - EARNINGS PER SHARE
Basic and
diluted earnings per share for 2009 and 2008 were calculated as
follows:
|
2009
|
2008
|
|||||||
|
Weighted
average number of common shares- Basic
|
13,552,837 | 11,895,048 | ||||||
|
Contingently
issuable shares for Catch-Luck acquisition
|
1,150,685 | 1,594,721 | ||||||
|
Weighted
average number of common shares- Diluted
|
14,703,522 | 13,489,769 | ||||||
|
Earnings
per share - basic
|
$ | 0.31 | $ | 0.30 | ||||
|
Earnings
per share –diluted
|
$ | 0.29 | $ | 0.26 | ||||
F-22
EVER-GLORY
INTERNATIONAL GROUP, INC AND SUBSIDIARIES
NOTES
TO THE CONSOLIDATED FINANCIAL STATEMENTS
DECEMBER
31, 2009 AND 2008
In 2009
and 2008, the Company excluded 913,182 warrants outstanding from diluted
earnings per share because the exercise price of $3.20 exceeded the average
trading price of $2.16 and $3.17 for the years ended December 31, 2009 and 2008,
respectively making these warrants anti-dilutive.
NOTE
11 - STOCKHOLDERS’ EQUITY
Stock Issued for
Acquisitions under Common Control
In April
2009, the Company issued 1,153,846 shares of restricted common stock to a
related company as part of the consideration for the acquisition of
Catch-Luck.
Conversion of Convertible
Notes to Common Stock
During
2008, convertible notes and accrued interest expense totally $2,033,059 have
been converted into 922,554 shares of common stock.
Stock Issued to Independent
Directors
During
March 2009, the Company issued 21,085 shares of common stock to the
Company’s three independent directors as compensation for their services in the
third and fourth quarters of 2008. The shares were valued at $1.05 per share,
being the average market price of the common stock for the five trading days
before December 31,2008.
On July
16, 2009, the Company issued 11,742 shares of common stock to the Company’s
three independent directors as compensation for their services in the first and
second quarters of 2009. The shares were valued at $1.86 per share, being the
average market price of the common stock for the five trading days before June
30,2009.
On
September 2, 2008, the Company issued 3,068 shares of common stock to the
Company’s three independent directors as compensation for their services in the
second quarter of 2008. The shares were valued at $4.19 per share, being the
average market price of the common stock for the five days before June
30,2008.
F-23
EVER-GLORY
INTERNATIONAL GROUP, INC AND SUBSIDIARIES
NOTES
TO THE CONSOLIDATED FINANCIAL STATEMENTS
DECEMBER
31, 2009 AND 2008
Statutory
Reserve
Subsidiaries
incorporated in China are required to make appropriations to reserve funds,
comprising the statutory surplus reserve, statutory public welfare fund and
discretionary surplus reserve, based on after-tax net income determined in
accordance with generally accepted accounting principles of the People’s
Republic of China ( “PRC GAAP”). Appropriations to the statutory surplus reserve
are to be at least 10% of the after tax net income determined in accordance with
PRC GAAP until the reserve is equal to 50% of the entities’ registered
capital. Appropriations to the statutory public welfare fund are 10%
of the after tax net income determined in accordance with PRC GAAP. The
statutory public welfare fund is established for the purpose of providing
employee facilities and other collective benefits to the employees and is
non-distributable other than in liquidation. Appropriations to the surplus
reserve are made at the discretion of the Board of Directors. Effective January
1, 2006, the Company is only required to contribute to one statutory reserve
fund at 10% of net income after tax per annum, and any contributions are not to
exceed 50% of the respective companies’ registered capital.
As of
December 31, 2009, New-Tailun and Catch-Luck had fulfilled the 50% statutory
reserve contribution requirement; therefore no further transfers are required
for those entities. In 2009 Goldenway appropriated $89,048, Ever-Glory Apparel
appropriated $20,000 and LA GO GO appropriated $39,022 to the statutory
reserve.
Warrants
Following
is a summary of the status of warrants outstanding and exercisable at December
31, 2009 and 2008:
|
2009
|
2008
|
|||||||||||||||||||
|
Exercise Price
|
Number of
Shares
|
Average
Remaining
Contractual Life
|
Average
Exercise Price
|
Number of
Shares
|
Average
Remaining
Contractual Life
|
|||||||||||||||
|
$3.20
|
840,455 | 3.43 | $ | 3.20 | 840,455 | 4.43 | ||||||||||||||
|
$3.20
|
72,728 | 1.01 | $ | 3.20 | 72,728 | 2.01 | ||||||||||||||
|
Total
|
913,183 | 913,183 | ||||||||||||||||||
NOTE
12 - RELATED PARTY TRANSACTIONS
Mr. Kang
is the Company’s Chairman and Chief Executive Officer. Ever-Glory Hong Kong is
the Company’s major shareholder. Mr. David Yan is Ever-Glory Hong Kong’s
shareholder. All transactions associated with the following companies
controlled by Mr. Kang or Mr. Yan are considered to be related party
transactions. All related party outstanding balances are short-tem in
nature and are expected to be settled in cash.
F-24
EVER-GLORY
INTERNATIONAL GROUP, INC AND SUBSIDIARIES
NOTES
TO THE CONSOLIDATED FINANCIAL STATEMENTS
DECEMBER
31, 2009 AND 2008
Sales and Cost of Sales to
Related Parties
Sales and
cost of sales for the year ended December 31, 2009 were from transactions with
Nanjing Knitting, Jiangsu Ever-Glory and Shanghai La
Chapelle.
|
2009
|
2008
|
|||||||||||||||
|
Sales
|
Cost of Sales
|
Sales
|
Cost of Sales
|
|||||||||||||
|
Shanghai
La Chapelle
|
$ | 63,466 | $ | 45,563 | ||||||||||||
|
Nanjing
Knitting
|
$ | 9,353 | $ | 9,015 | $ | 681,167 | $ | 621,103 | ||||||||
|
Jiangsu
Ever-Glory
|
$ | 389 | $ | 387 | ||||||||||||
|
Total
|
$ | 73,208 | $ | 54,965 | $ | 681,167 | $ | 621,103 | ||||||||
Purchases from, and
Sub-contracts with Related Parties
The
Company purchased raw materials from related companies totaling $2,728,896 and
$1,828,661 during the years ended December 31, 2009 and 2008,
respectively.
|
2009
|
2008
|
|||||||
|
Nanjing
Knitting
|
$ | 2,686,863 | $ | 1,828,661 | ||||
|
Jiangsu
Ever-Glory
|
$ | 42,033 | ||||||
|
Total
|
$ | 2,728,896 | $ | 1,828,661 | ||||
In
addition, the Company sub-contracted certain manufacturing work to related
companies totaling $1,814,846 and $1,327,965 for the years ended December 31,
2009 and 2008, respectively. The Company provided raw materials to the
sub-contractors and was charged a fixed fee for labor provided by the
sub-contractors.
Sub-contracts
with related parties included in cost of sales for the years ended December 31,
2009 and 2008 are as follows:
|
2009
|
2008
|
|||||||
|
Nanjing
Knitting
|
$ | 591,470 | $ | 706,201 | ||||
|
Nanjing
Ever-Kyowa,
|
955,792 | 621,764 | ||||||
|
Ever-Glory
Vietnam
|
246,936 | |||||||
|
Ever-Glory
Cambodia
|
20,648 | |||||||
|
Total
|
$ | 1,814,846 | $ | 1,327,965 | ||||
F-25
EVER-GLORY
INTERNATIONAL GROUP, INC AND SUBSIDIARIES
NOTES
TO THE CONSOLIDATED FINANCIAL STATEMENTS
DECEMBER
31, 2009 AND 2008
Accounts Payable – Related
Parties
The
Company purchases raw materials from and subcontracts some of its production to
related parties. Accounts payable to related parties are as
follows:
|
2009
|
2008
|
|||||||
|
Nanjing
Knitting
|
$ | 153,660 | $ | 0 | ||||
|
Nanjing
Ever-Kyowa
|
335,546 | 0 | ||||||
|
Total
|
$ | 489,206 | $ | 0 | ||||
Amounts Due From Related Party
Jiangsu
Ever-Glory International Group Corp., (“Jiangsu Ever-Glory”) is an entity
engaged in importing/exporting, apparel-manufacture, real-estate development,
car sales and other activities. Jiangsu Ever-Glory is controlled by the
Company’s Chief Executive Officer. Because of restrictions on its ability to
directly import and export products, the Company utilizes Jiangsu Ever-Glory as
its agent, to assist the Company with its import and export transactions and its
international transportation projects. Import transactions primarily consist of
purchases of raw materials and accessories designated by the Company’s customers
for use in garment manufacture. Export transactions consist of the Company’s
sales to foreign markets such as Japan, Europe and the United States. As the
Company’s agent, Jiangsu Ever-Glory’s responsibilities include managing customs,
inspection, transportation, insurance and collections on behalf of the Company.
Jiangsu Ever-Glory also manages transactions denominated in currencies other
than the Chinese RMB at rates of exchange agreed between the Company and Jiangsu
Ever-Glory and based upon rates of exchange quoted by the People’s Bank of
China. In return for these services, Jiangsu Ever-Glory charges the Company a
fee of approximately 3% of export sales. For import transactions, the
Company may make advance payments, through Jiangsu Ever-Glory, for the raw
material purchases, or Jiangsu Ever-Glory may make advance payments on the
Company’s behalf. For export transactions, accounts receivable for export sales
are remitted by the Company’s customers through Jiangsu Ever-Glory, who forwards
the payments to the Company. The Company and Jiangsu Ever-Glory have agreed that
balances from import and export transactions may be offset. Amounts
due to (from) Jiangsu Ever-Glory are typically settled within 60-90 days.
Interest of 0.5% is charged on net amounts due at each month end. Interest
income for the years ended December 31, 2009 and 2008 was $614,842 and $217,181
respectively. Following is a summary of import and export transactions for the
years ended December 31, 2009 and 2008:
F-26
EVER-GLORY
INTERNATIONAL GROUP, INC AND SUBSIDIARIES
NOTES
TO THE CONSOLIDATED FINANCIAL STATEMENTS
DECEMBER
31, 2009 AND 2008
|
Accounts Receivable
|
Accounts Payable
|
Net
|
||||||||||
|
As
of January 1,2009
|
$ | 17,938,281 | $ | 6,372,707 | $ | 11,565,574 | ||||||
|
Sales/Purchases
|
$ | 68,275,235 | $ | 31,836,171 | ||||||||
|
Payments
Received/Made
|
$ | 70,467,973 | $ | 35,818,220 | ||||||||
|
As
of December 31,2009
|
$ | 15,745,543 | $ | 2,390,658 | $ | 13,354,885 | ||||||
Approximately
69% of the receivable balance at December 31, 2009 was settled by March 30,
2010.
Other Payables – Related Parties
As of
December 31, 2009 and 2008, other payables due to related parties
were as follows:.
|
2009
|
2008
|
|||||||
|
Shanghai
La Chapelle Garment and
|
$ | 293,400 | ||||||
|
Accessories
Company Limited
|
||||||||
|
Ever-Glory
Enterprise HK Limited
|
$ | 754,589 | ||||||
| $ | 293,400 | $ | 754,589 | |||||
The
balance as of December 31, 2008 included $200,000 for the purchase of
Catch-Luck and $554,589 was due for legal and professional fees paid by
Ever-Glory Enterprise HK Limited on behalf of the Company. In 2009 the
Company repaid $754,589 to Ever-Glory Hong Kong.
In February,
July and August 2009, LA GO GO borrowed $293,400 (RMB 2 million) from
Shanghai La Chapelle for operations. This loan is interest free and due on
demand. Management expects to repay this loan in cash from operations in 2010.
.
Loan from Related
Party
As of
December 31, 2009 and 2008 the Company owed $2,575,759 and $2,660,085,
respectively to Blue Power Holdings Limited., a company controlled by the
Company’s Chief Executive Officer. Interest is charged at 6% per annum on the
amounts due. The loans are due between July 2010 and April 2011. For years ended
December 31,2009 and 2008, the Company incurred interest expense of $115,674 and
$175,100, respectively. The accrued interest is included in the carrying amount
of the loan in the accompanying balance sheets. On November 18, 2009, the
Company repaid $200,000 to Blue Power Holdings Limited.
F-27
EVER-GLORY
INTERNATIONAL GROUP, INC AND SUBSIDIARIES
NOTES
TO THE CONSOLIDATED FINANCIAL STATEMENTS
DECEMBER
31, 2009 AND 2008
NOTE
13 – COMMITMENTS AND CONTINGENCIES
Capital
Commitment
The
Articles of Association of Goldenway required that the registered capital of
approximately $17.5 million was to be paid by Perfect
Dream before December 31, 2009. On July 6, 2009, the Company
obtained approval from the government allowing the Company to decrease the
registered capital from $17.5 million to $12.5 million. The Company has
fulfilled its $12.5 million registered capital requirements.
Operating Lease
Commitment
The
Company leases factory and office space from Jiangsu Ever-Glory International
Group Corp. under an operating lease which expired on December 31, 2009 at an
annual rental of RMB350,000. For the years ended December 31, 2009 and 2008, the
Company recognized rental expense in the amounts of $51,310 and $50,452,
respectively. On January 1, 2010, the Company signed a new operating lease with
Jiangsu Ever-Glory International Group Corp which will expire on December 31,
2011. The new lease provides for annual rent of RMB314,000.
The
Company leases retail space, warehouse and office facilities under operating
leases expiring on various dates through 2014.The majority of the Company’s
retail leases are for twelve-month periods and provide for contingent rents,
which are determined as a percentage of gross sales in excess of specified
levels. The Company records a rent liability in the consolidated balance sheets
and the corresponding rent expense when management determines that achieving the
specified levels during the fiscal year is probable. Future minimum
lease payments for leases with initial or remaining noncancelable lease terms in
excess of one year are as follows:
Year
ending December 31,
|
2010
|
$ | 728,000 | ||
|
2011
|
474,000 | |||
|
2012
|
220,000 | |||
|
2013
|
138,000 | |||
|
2014
|
116,000 | |||
| $ | 1,676,000 |
Rent
expense for the years ended December 31, 2009 and 2008 was approximately
$5,195,600
and $1,500,400
respectively.
F-28
EVER-GLORY
INTERNATIONAL GROUP, INC AND SUBSIDIARIES
NOTES
TO THE CONSOLIDATED FINANCIAL STATEMENTS
DECEMBER
31, 2009 AND 2008
Legal
Proceedings
There is
no material pending legal proceeding to which the Company is a
party.
NOTE14
- CONCENTRATIONS AND RISKS
Cash includes cash on hand and demand
deposits in accounts maintained with state owned banks within the People’s
Republic of China and Hong Kong. Total cash deposited with these banks at
December 31, 2009 and December 31, 2008 amounted to $3,555,745 and $1,445,363,
respectively, of which no deposits are covered by insurance. The Company has not
experienced any losses in such accounts and believes it is not exposed to any
risks on its cash in bank accounts.
Only one
customer, in our wholesale segment, represented more than ten percent of
our total sales in 2009 and 2008, accounting for approximately 29% or $22
million and 29% or $27 million of total sales, respectively, and
represented approximately 28% and 2% of accounts receivable as of
December 31, 2009 and 2008, respectively.
The
Company did not rely on any single raw material supplier during 2009 and
2008.
For the
wholesale business, during 2009 the Company relied on two manufacturers for 18%
and 11% of purchased finished goods while in 2008 the Company relied on one
manufacturer for 21% of purchased finished goods. For the retail business,
during 2009 the Company did not rely on any single raw material supplier while
in 2008 the Company relied on two manufacturers for 29% of purchased finished
goods.
NOTE15-
SEGMENTS
The
Company set up a new retail segment and realigned its management and segment
reporting structure effective January 1, 2008. The new retail segment and
operating activity arose in 2008 and did not change the composition of the
wholesale segment or previously reported amounts. The segment data presented
reflects this new segment structure. The Company reports financial and operating
information in the following two segments for 2009 and 2008:
(a) Wholesale
segment
(b) Retail
segment
The
Company also provides general corporate services to its segments and
these
costs are reported as "Corporate and others."
F-29
EVER-GLORY
INTERNATIONAL GROUP, INC AND SUBSIDIARIES
NOTES
TO THE CONSOLIDATED FINANCIAL STATEMENTS
DECEMBER
31, 2009 AND 2008
|
Wholesale
segment
|
Retail segment
|
Corporate and
others
|
Total
|
|||||||||||||
|
December
31, 2009
|
||||||||||||||||
|
Segment
profit or loss:
|
||||||||||||||||
|
Net
revenue from external customers
|
$ | 76,604,340 | $ | 13,193,444 | $ | - | $ | 89,797,784 | ||||||||
|
Net
revenue from related parties
|
$ | 73,207 | $ | 73,207 | ||||||||||||
|
Income
from operations
|
$ | 5,732,278 | $ | 421,078 | $ | (40,646 | ) | $ | 6,112,710 | |||||||
|
Interest
income
|
$ | 620,347 | $ | 384 | $ | - | $ | 620,731 | ||||||||
|
Interest
expense
|
$ | 324,025 | $ | 3,349 | $ | 115,732 | $ | 443,106 | ||||||||
|
Depreciation
and amortization
|
$ | 1,002,604 | $ | 890,050 | $ | 1,892,654 | ||||||||||
|
Income
tax expense
|
$ | 709,808 | $ | 104,878 | $ | 814,686 | ||||||||||
|
Segment
assets:
|
||||||||||||||||
|
Additions
to property, plant and equipment
|
$ | 77,604 | $ | 1,236,920 | $ | 1,314,524 | ||||||||||
|
Total
assets
|
$ | 67,208,697 | $ | 8,595,962 | $ | 48,162,586 | $ | 123,967,245 | ||||||||
|
December
31, 2008
|
||||||||||||||||
|
Segment
profit or loss:
|
||||||||||||||||
|
Net
revenue from external customers
|
$ | 93,284,480 | $ | 3,506,035 | $ | - | $ | 96,790,515 | ||||||||
|
Net
revenue from related parties
|
$ | 681,167 | $ | 681,167 | ||||||||||||
|
Income
from operations
|
$ | 7,488,366 | $ | (14,705 | ) | $ | (229,877 | ) | $ | 7,243,784 | ||||||
|
Interest
income
|
$ | 222,368 | $ | 4,608 | $ | 114 | $ | 227,090 | ||||||||
|
Interest
expense
|
$ | 327,834 | $ | 2,530,334 | $ | 2,858,168 | ||||||||||
|
Depreciation
and amortization
|
$ | 783,621 | $ | 4,077 | $ | 787,698 | ||||||||||
|
Income
tax expense
|
$ | 1,091,006 | $ | 1,091,006 | ||||||||||||
|
Segment
assets:
|
||||||||||||||||
|
Additions
to property, plant and equipment
|
$ | 462,691 | $ | 68,073 | $ | 530,764 | ||||||||||
|
Total
assets
|
$ | 41,340,062 | $ | 4,240,453 | $ | 40,199,256 | $ | 85,779,771 | ||||||||
The
reconciliations of segment information to the Company’s consolidated totals were
as follows:
|
December 31, 2009
|
December 31, 2008
|
|||||||
|
Revenues:
|
||||||||
|
Total
reportable segments
|
$ | 89,870,991 | $ | 97,471,682 | ||||
|
Elimination
of intersegment revenues
|
- | - | ||||||
|
Total
consolidated
|
$ | 89,870,991 | $ | 97,471,682 | ||||
|
Income
(loss) from operations:
|
||||||||
|
Total
segments
|
$ | 6,112,710 | $ | 7,243,784 | ||||
|
Elimination
of intersegment profits
|
- | - | ||||||
|
Total
consolidated
|
$ | 6,112,710 | $ | 7,243,784 | ||||
|
Total
assets:
|
||||||||
|
Total
segments
|
$ | 123,967,245 | $ | 85,779,771 | ||||
|
Elimination
of intersegment receivables
|
(63,312,931 | ) | (41,498,862 | ) | ||||
|
Total
consolidated
|
$ | 60,654,314 | $ | 44,280,909 | ||||
F-30
EVER-GLORY
INTERNATIONAL GROUP, INC AND SUBSIDIARIES
NOTES
TO THE CONSOLIDATED FINANCIAL STATEMENTS
DECEMBER
31, 2009 AND 2008
Revenue
is attributable to countries and locations based on the location of the
customer. For the years ended December 31, 2009 and 2008 revenues
were generated in the following jurisdictions:
|
2009
|
2008
|
|||||||
|
The
People’s Republic of China
|
$ | 17,735,643 | $ | 11,131,323 | ||||
|
Germany
|
22,164,414 | 26,967,753 | ||||||
|
United
Kingdom
|
13,256,621 | 14,863,998 | ||||||
|
Europe-Other
|
10,042,180 | 11,023,829 | ||||||
|
Japan
|
13,282,230 | 16,579,037 | ||||||
|
United
States
|
13,389,903 | 16,905,742 | ||||||
|
Total
|
$ | 89,870,991 | $ | 97,471,682 | ||||
Substantially
all of the company’s long-lived assets were attributable to the PRC as of
December 31, 2009 and 2008.
F-31
ITEM
9. CHANGES IN AND DISAGREEMENTS WITH ACCOUNTANTS ON ACCOUNTING AND FINANCIAL
DISCLOSURE
None
ITEM
9A(T). CONTROLS AND PROCEDURES
Evaluation
of Disclosure Controls and Procedures
We
maintain disclosure controls and procedures that are designed to ensure that
information required to be disclosed in our reports under the Securities
Exchange Act of 1934, as amended ( the “Exchange Act”) is recorded,
processed, summarized and reported within the time periods specified in the
SEC’s rules and forms, and that such information is accumulated and communicated
to our management, including its chief executive officer and chief financial
officer, as appropriate, to allow timely decisions regarding required
disclosure. In designing and evaluating the disclosure controls and procedures,
management recognizes that any controls and procedures, no matter how well
designed and operated, can provide only reasonable assurance of achieving the
desired control objectives, and management necessarily is required to apply its
judgment in evaluating the cost-benefit relationship of possible controls and
procedures.
49
As of
December 31, 2009, the end of the fiscal year covered by this report, we
carried out an evaluation, under the supervision and with the participation of
our management, including our chief executive officer and our chief financial
officer, of the effectiveness of the design and operation of our disclosure
controls and procedures. Based on the foregoing, our chief executive officer and
chief financial officer concluded that our disclosure controls and procedures
(as defined in Rules 13a-15(e) and 15d-15(e) under the Exchange Act) were not
operating effectively as of December 31, 2009. Our disclosure controls and
procedures were not effective because of the “material weaknesses” described
below under “Management’s annual report on internal control over financial
reporting,” which are in the process of being remediated as described below
under “Management Plan to Remediate Material Weaknesses.”
Management’s
Annual Report on Internal Control over Financial Reporting
Our
management is also responsible for establishing and maintaining adequate
internal control over financial reporting. Internal control over financial
reporting is defined in Rule 13a-15(f) and 15d-15(f) promulgated
under the Exchange Act as a process designed by, or under the supervision of,
our principal executive and principal financial officers and effected by our
Board of Directors, management and other personnel, to provide reasonable
assurance regarding the reliability of financial reporting and the preparation
of financial statements for external purposes in accordance with generally
accepted accounting principles and includes those policies and procedures
that:
|
|
l
|
Pertain
to the maintenance of records that in reasonable detail accurately and
fairly reflect the transactions and dispositions of the assets of the
Company;
|
|
|
l
|
Provide
reasonable assurance that transactions are recorded as necessary to permit
preparation of financial statements in accordance with generally accepted
accounting principles, and that receipts and expenditures of the Company
are being made only in accordance with authorizations of management and
directors of the Company; and
|
|
|
l
|
Provide
reasonable assurance regarding prevention or timely detection of
unauthorized acquisition, use or disposition of the Company’s assets that
could have a material effect on the financial
statements.
|
Because
of its inherent limitations, our internal control over financial reporting may
not prevent or detect all misstatements. Therefore, even those systems
determined to be effective can provide only reasonable assurance with respect to
financial statement preparation and presentation. Projections of any evaluation
of effectiveness to future periods are subject to the risk that controls may
become inadequate because of changes in conditions, or that the degree of
compliance with the policies or procedures may deteriorate.
Our
management including our Chief Executive Officer and our Chief Financial Officer
has assessed the effectiveness of our internal control over financial reporting
as of December 31, 2009. In making this assessment, management used the
criteria set forth by the Committee of Sponsoring Organizations of the Tread way
Commission (COSO) in Internal Control—Integrated Framework.
As a
result of such assessment, management concluded that our internal control over
financial reporting was not effective as of December 31, 2009,.
A
“material weakness” is defined under SEC rules as a deficiency, or a combination
of deficiencies, in internal control over financial reporting such that there is
a reasonable possibility that a material misstatement of a company’s annual or
interim financial statements will not be prevented or detected on a timely basis
by the company’s internal controls. As a result of its review, management
concluded that we had material weaknesses in our internal control over financial
reporting process consisting of the following:
50
|
|
l
|
Lack
of internal expertise and resources to analyze and properly apply
generally accepted accounting principles to complex and non-routine
transactions related to the appropriate classifications and treatments of
derivatives.
|
|
|
l
|
Deficiency
in the monitoring and supervision of financial reports preparation and
review process.
|
Management believes the
material weaknesses identified above were due to the complex and non-routine
nature of the Company’s derivatives and the
Company’s lack of
an Audit Committee Chairman during a
part of this period.
Management
Plan to Remediate Material Weaknesses
We have
taken the following measures and plan to continuously take measures to remediate
the above material weaknesses as soon as practical:
Management
is pursuing the implementation of the following corrective measures to address
the material weaknesses described above.
|
|
l
|
We
engaged an outside consultant to assist in the application of USGAAP to
complex transactions, including the accounting for
derivatives;
|
|
|
l
|
We
will procure periodic training to key officers and staff to enhance our
understanding of USGAAP and internal control over financial
reporting;
|
|
|
l
|
We
expect to appoint a new independent director as the Audit Committee
Chairman in the second quarter of
2010;
|
|
|
l
|
We
will have a dedicated internal control department headed by a full-time
internal control manager who directly reports to the Audit
Committee. The internal control department will focus on our
ongoing remediation initiatives and compliance
efforts.
|
These
measures are intended both to address the identified material weaknesses and to
enhance our overall internal control environment.
This
Annual Report does not include an attestation report of our registered public
accounting firm regarding internal control over financial reporting.
Management’s report was not subject to attestation by our registered public
accounting firm pursuant to temporary rules of the SEC that permit us to provide
only management’s report in this Annual Report.
Changes
in Internal Control over Financial Reporting
There
were no changes in the Company’s internal control over financial reporting
during the fourth quarter of 2009 that have materially affected or are
reasonably likely to materially affect our internal control over financial
reporting, except as desclosed above.
ITEM
9B OTHER INFORMATION
None.
51
PART
III
ITEM 10. DIRECTORS AND EXECUTIVE OFFICERS AND
CORPORATE GOVERNANCE
Board of Directors
and Management
The Board
of Directors oversees our management and our business affairs in order to ensure
that our stockholder’s interests are best served. Our Board does not involve
itself in our day-to-day operations. It establishes with management the
objectives and strategies to be implemented and monitors management’s general
performance and conduct.
The
following table includes the names, positions held, and ages of our current
executive officers and directors as of December 31, 2009:
|
Name
|
Age
|
Position
|
Held Position
Since
|
|||
|
Edward
Yihua Kang
|
46
|
Chief
Executive Officer, President, and Director
|
2005
|
|||
|
Jiajun
Sun
|
36
|
Chief
Operating Officer and Director
|
2005
|
|||
|
Yan Guo
|
32
|
Chief
Financial Officer and Secretary
|
2005
|
|||
|
Changyu
Qi (1)(2)
|
64
|
Director
|
2008
|
|||
|
Zhixue
Zhang (1)(2)
|
42
|
Director
|
2008
|
(1)
Member of the Audit Committee
(2)
Member of the Compensation Committee
Each
director will hold office until the next annual meeting of shareholders and
until his or her successor has been elected and qualified. Mr. Bennet
P. Tchaikovsky was a member of our Board of Directors, and served as chairman of
our Audit Committee and a member of the Compensation Committee until November
25, 2009. We have identified qualified independent director candidate to
fill the vacancy created by Mr.Tchaikovsky's resignation.
Edward Yihua
Kang has served as our President and Chief Executive Officer and as the
Chairman of our Board of Directors, since 2005. From December 1993 to January
2008, Mr. Kang served as the President and Chairman of the Board of Directors of
Goldenway. Mr. Kang has extensive worldwide managerial and operational
experience focusing upon business development and strategic planning. Mr. Kang
formerly was the Senior lecturer of the Management College, Nanjing Aeronautics
and Astronautics University, and the Vice General Manager of the Import and
Export Department of Nanjing Shenda Company. Mr. Kang earned a MS degree from
Peking University, a Bachelor’s degree in Management from Beijing Aeronautics
and Astronautics University and a Bachelor’s degree in Engineering from Nanjing
Aeronautics and Astronautics University. Mr. Kang’s extensive experience in the
garment industry, his acute vision and outstanding leadership capability, as
well as his commitment to the Company since its inception make him
well-qualified in the Board’s opinion to serve as our Chairman of the
Board.
52
Jiajun Sun has
served as our Chief Operating Officer and a member of our Board of Directors
since 2005. Mr. Sun also has served as a member of the Board of Directors of
Goldenway since 2000 and as a member of the Board of Directors of New-Tailun
since 2006. From July 1996 to November 2002, Mr. Sun was the General Manager of
International Trade Department at Goldenway. Mr. Sun has more than 8 years
experience in import and export in the textile industry. Mr. Sun earned his
bachelor’s degree from the Wuhan Textile Industry Institute. Mr. Sun has
accumulated substantial institutional knowledge of our business and
operations. His managing experiences and analytical skills make him
well positioned for his role as one of our Directors.
Changyu Qi
is a member of the Board of Directors, and serves as a member of the
Audit Committee and Compensation Committees. Mr. Qi has over 30 years of
experience in international trade, and since February 2005, has served as
inspector and deputy secretary of the Party Leadership Group of the Jiangsu
Provincial Government’s Department of Foreign Trade and Economic Cooperation. In
addition, since 2007, Mr. Qi has also served as a director on the Board of
Directors of Jiangsu Skyrun International Group, which is a state-owned
enterprises focusing on import and export. He is currently the
President of both the Jiangsu Chamber of Commerce for Import & Export Firms
and the Jiangsu International Freight Forwarders Association. Mr. Qi received a
B.S. in Foreign Trade and Economy from Beijing Foreign Trade
University. Mr. Qi’s extensive experience and deep understanding of
the issues facing import and export companies and foreign trade bring a valuable
perspective to our Board of Directors. Mr. Qi brings a wealth of knowledge to
our Board of Directors and has proven to possess keen insight to our
business.
Zhixue
Zhang was appointed to the Board of Directors in March 2008, and serves
on the Audit Committee and as chairman of the Compensation
Committee. Mr. Zhang is a professor of Organizational Management at
Peking University, and has held this position since August 2008. Mr. Zhang has
over fifteen years of experience in the fields of organizational psychology,
management and organizational culture as it relates to conducting business
within China and with Chinese businesses. From August 2001 to July 2008, he was
the Associate professor at Peking University. From August 2006 to June
2007, he was a Freeman Fellow at the University of Illinois at Urbana-Champaign.
From September 2001 to March 2002, he was a visiting scholar at the Kellogg
School of Management at Northwestern University. Mr. Zhang holds a Ph.D. from
the University of Hong Kong, and a M.Sc. from Beijing Normal University, and a
B.Sc. from Henan University. Mr. Zhang’s life-long background of
management education, as well as his business aptitude and strong analytical
skills, qualify him for his position as one of our Directors.
Yan Guo has
served as our Chief Financial Officer since 2005, and was appointed as Corporate
Secretary on May 26, 2008. From August 1, 2007 to March 26, 2008 Ms. Guo
was a member of the Board of Director. From July 1999 to 2004, Ms. Guo was the
Section Chief of the Financial and Accounting Department of Goldenway. Ms. Guo
earned her bachelor’s degree in Accounting from the Nanjing Audit
Institute.
Director
Qualifications
We seek
directors with established strong professional reputations and experience in
areas relevant to the strategy and operations of our businesses. We
also seek directors who possess the qualities of integrity and candor, who have
strong analytical skills and who are willing to engage management and each other
in a constructive and collaborative fashion. We also seek directors
who have the ability and commitment to devote significant time and energy to
service on the Board and its committees. We believe that all of our
directors meet the foregoing qualifications.
Our
directors have backgrounds in a variety of different areas including industry,
operation, marketing, strategic business management, and finance. We
believe that the backgrounds and skills of our directors bring a diverse range
of perspectives to the Board.
53
Board
Practices
Our
business and affairs are managed under the direction of our Board of Directors.
The primary responsibilities of our board of directors are to provide oversight,
strategic guidance, counseling and direction to our management. It is our
expectation that the Board of Directors will meet regularly on a quarterly basis
and additionally as required.
Board
Leadership Structure
The Board
of Directors believes that Mr. Kang’s service as both Chairman of the Board and
Chief Executive Officer is in the best interest of the Company and its
shareholders. Mr. Kang possesses detailed and in-depth knowledge of the issues,
opportunities and challenges facing the Company and its business and is thus
best positioned to develop agendas that ensure that the Board’s time and
attention are focused on the most critical matters. His combined role enables
decisive leadership, ensures clear accountability, and enhances the Company’s
ability to communicate its message and strategy clearly and consistently to the
Company’s shareholders, employees and customers. We have two
independent directors. We do not have a lead independent director.
Board’s
Role in Risk Oversight
Our Board
of Directors has overall responsibility for risk oversight. To
effectively achieve the goal of efficient risk management, the Board has
delegated responsibility for the oversight of specific risks to Board committees
as follows:
|
|
l
|
The
Audit Committee oversees the Company’s risk policies and processes
relating to the financial statements and financial reporting processes, as
well as key credit risks, liquidity risks, market risks and compliance,
and the guidelines, policies and processes for monitoring and mitigating
those risks.
|
|
|
l
|
The
Compensation Committee oversees risks related to the company’s director
compensation.
|
Our Board
of Directors is responsible to approve all related party transactions according
to our Code of Ethics.
Family
relationship
There are
no family relationships, or other arrangements or understandings between or
among any of the directors, executive officers or other person pursuant to which
such person was selected to serve as a director or officer.
Involvement in Certain Legal
Proceedings
No
director, person nominated to become a director, executive officer, promoter or
control person of the Company has, during the last ten years: (i) been convicted
in or is currently subject to a pending criminal proceeding (excluding traffic
violations and other minor offenses); (ii) been a party to a civil proceeding of
a judicial or administrative body of competent jurisdiction and as a result of
such proceeding was or is subject to a judgment, decree or final order enjoining
future violations of, or prohibiting or mandating activities subject to any
Federal or state securities or banking or commodities laws including, without
limitation, in any way limiting involvement in any business activity, or finding
any violation with respect to such law; (iii) has any bankruptcy petition been
filed by or against the business of which such person was an executive officer
or a general partner, whether at the time of the bankruptcy or for the two years
prior thereto; (iv) been the subject of, or a party to, any Federal or State
judicial or administrative order, judgment, decree, or finding, not subsequently
reversed, suspended or vacated, relating to an alleged violation
of: (a) Any Federal or State securities or commodities law or
regulation; or (b) Any law or regulation respecting financial institutions or
insurance companies including, but not limited to, a temporary or permanent
injunction, order of disgorgement or restitution, civil money penalty or
temporary or permanent cease-and-desist order, or removal or prohibition order;
or (c) Any law or regulation prohibiting mail or wire fraud or fraud in
connection with any business entity; nor (v) been the subject of, or a party to,
any sanction or order, not subsequently reversed, suspended or vacated, of any
self-regulatory organization (as defined in Section 3(a)(26) of the Exchange Act
(15 U.S.C. 78c(a)(26))), any registered entity (as defined in Section 1(a)(29)
of the Commodity Exchange Act (7 U.S.C. 1(a)(29))), or any equivalent exchange,
association, entity or organization that has disciplinary authority over its
members or persons associated with a member. (covering stock, commodities or
derivatives exchanges, or other SROs).
54
Board
Committees
In March
2008, the Board created the Audit Committee and the Compensation Committee and
has adopted charters for these committees. The Board has determined that
in its judgment, Mr. Qi and Mr. Zhang are independent directors within the
meaning of Section 803 of NYSE Amex Company Guide. Accordingly, both the members
of the Audit Committee are independent within the meaning of Section 803 of NYSE
Amex Company Guide.
Audit
Committee
The Board
of Directors adopted and approved a charter for the Audit Committee on March 13,
2008, and the charter was amended on May 26, 2008 and further amended on June
20, 2008. Currently, two directors comprise the Audit Committee: Mr. Qi and Mr.
Zhang. The members of the Audit Committee are currently “independent directors”
as that term is defined in Section 803 of NYSE Amex Company Guide.
.
Our Audit
Committee is responsible, in accordance with the Audit Committee charter,
recommending our independent auditors, and overseeing our audit activities and
certain financial matters to protect against improper and unsound practices and
to furnish adequate protection to all assets and records.
Our Audit
Committee pre-approves all audit and non-audit services provided by our
independent auditors. These services may include audit services, audit-related
services, tax services and other services. Pre-approval is generally provided
for up to one year and any pre-approval is detailed as to particular
service or category of services and is generally subject to a specific budget.
The Audit Committee has delegated pre-approval authority to its Chairman when
expedition of services is necessary. The independent auditors and management are
required to periodically report to the full Audit Committee regarding the extent
of services provided by the independent auditor in accordance with this
pre-approval, and the fees for the services performed to date.
Compensation
Committee
The
Compensation Committee currently consists of Mr. Qi and Mr. Zhang. Mr.
Zhang serves as Chairman of the Compensation Committee. The members
of the Compensation Committee are currently “independent directors” as that term
is defined in Section 803 of NYSE Amex Company Guide.
In
accordance with the Compensation Committee’s Charter, the Compensation Committee
is responsible for overseeing and, and as appropriate, making recommendations to
the Board regarding the annual salaries and other compensation of the Company’s
executive officers and general employees and other polices, providing assistance
and recommendations with respect to the compensation policies and practices of
the Company.
55
Section
16(a) of the Exchange Act
Section
16(a) of the Exchange Act, as amended, requires our directors and certain of our
officers, as well as persons who own more than 10% of a registered class of our
equity securities (“Reporting Persons”), to file reports with the SEC. To our
knowledge, based solely on review of the copies of such reports furnished to us
and written representations that no other reports were required, during the
fiscal year ended December 31, 2009, and all Section 16(a) filing requirements
applicable to officers, directors and greater than ten percent shareholders were
complied with.
Code
of Business Conduct and Ethics
We
have adopted a code of business conduct and ethics that applies to our officers,
directors and employees, including our Chief Executive Officer, senior executive
officers, principal accounting officer, controller and other senior financial
officers. Our code of business conduct and ethics is available on our website at
www.everglorygroup.com. A copy of our code of business conduct will be provided
to any person without charge, upon written request sent to us at our
offices located at 100 N. Barranca Ave. #810 West Covina, California 91791,
Attention “Shareholder Relations.”
The
Board of Directors and management are currently reviewing our code of business
conduct in connection with an overall review of our corporate governance and
other policies in light of Section 406 of the Sarbanes-Oxley Act. We will timely
disclose any amendments to or waivers of certain provisions of our code of
business conduct and ethics as required by the Exchange Act and the rules and
regulations of the SEC.
ITEM
11. EXECUTIVE COMPENSATION
Compensation
Discussion and Analysis
This
compensation discussion and analysis describes the material elements of the
compensation awarded to our current executive officers. This compensation
discussion focuses on the information contained in the following tables and
related footnotes and narrative for the last completed fiscal year. In 2009, our
Board of Directors and the Compensation Committee, since its chartering, has
overseen and administered our executive compensation program.
Our
current executive compensation program presently includes a base salary. Our
compensation program does not include (i) discretionary annual cash
performance-based incentives, (ii) termination/severance and change of control
payments, or (iii) perquisites and benefits.
Our
Compensation Philosophy and Objectives
Our
philosophy regarding compensation of our executive officers includes the
following principles:
|
|
·
|
our compensation program should
align the interests of our management team with those of our
shareholders;
|
|
|
·
|
our compensation program should
reward the achievement of our strategic initiatives and short- and
long-term operating and financial
goals;
|
|
|
·
|
compensation should appropriately
reflect differences in position and responsibility; compensation
should be reasonable and bear some relationship with the compensation
standards in the market in which our management team operates;
and
|
|
|
·
|
the compensation program should
be understandable and
transparent.
|
In order
to implement such compensation principles, we have developed the following
objectives for our executive compensation program:
|
|
·
|
overall compensation levels must
be sufficiently competitive to attract and retain talented leaders and
motivate those leaders to achieve superior
results;
|
56
|
|
·
|
a portion of total compensation
should be contingent on, and variable with, achievement of objective
corporate performance goals, and that portion should increase as an
executive’s position and responsibility
increases;
|
|
|
·
|
total compensation should be
higher for individuals with greater responsibility and greater ability to
influence our achievement of operating goals and strategic
initiatives;
|
|
|
·
|
the number of elements of our
compensation program should be kept to a minimum, and those elements
should be readily understandable by and easily communicated to executives,
shareholders, and others;
and
|
|
|
·
|
executive compensation should be
set at responsible levels to promote a sense of fairness and equity among
all employees and appropriate stewardship of corporate resources among
shareholders.
|
Determination
of Compensation Awards
Our Board
of Directors is provided with the primary authority to determine the
compensation awards available to our executive officers. To aid the Board of
Directors in making its determination for the last fiscal year, our current
senior management provided recommendations to the Compensation Committee
regarding the compensation of all executive officers.
Compensation
Benchmarking and Peer Group
Our Board
of Directors did not rely on any consultants or utilize any peer company
comparisons or benchmarking in 2009 in setting executive compensation. However,
our management has considered competitive market practices by reviewing publicly
available information relating to compensation of executive officers at other
comparable companies in the apparel industry in China in making its
recommendations to our Board of Directors regarding our executives’ compensation
for fiscal year 2009. As our company evolves, we expect to take steps, including
the utilization of peer company comparisons and/or hiring of compensation
consultants, to ensure that the Board has a comprehensive picture of the
compensation paid to our executives and with a goal toward total direct
compensation for our executives that are on a par with the median total direct
compensation paid to executives in peer companies if annually established target
levels of performance at the company and business segment level are
achieved.
Elements of
Compensation
Presently,
we compensate our executives with only a base salary. We do not pay any
compensation to our executive officers in the form of discretionary annual cash
performance-based incentives, long-term incentive plan awards or perquisites and
other compensation, although our Board of Directors may recommend and institute
such forms of compensation in the future.
Base
Salaries
Base
salary is used to recognize the experience, skills, knowledge and
responsibilities required of our employees, including our named executive
officers. All of our named executive officers, including our Chief Executive
Officer, are subject to employment agreements, and accordingly each of their
compensation has been determined as set forth in their respective agreement.
When establishing base salaries for 2009, subject to the provisions of each
person's employment agreement, our Board and management considered a number of
factors, including the seniority of the individual, the functional role of the
position, the level of the individual's responsibility, the ability to replace
the individual, the base salary of the individual at their prior employment and
the number of well qualified candidates to assume the individual's
role.
Discretionary
Annual Cash Performance-Based Incentives
In 2009,
we did not pay any compensation in the form of discretionary annual cash
performance-based incentives or other forms of bonuses to our Chief Executive
Officer and each other named executive officer. Our Compensation Committee may,
however, recommend such bonuses in the future.
57
Long-Term
Incentive Plan Awards
We
currently do not have an equity incentive plan, and no separate stock awards or
stock option grants were made to any of the named executive officers during the
fiscal year ended December 31, 2009. No stock options were held by the named
executive officers as of December 31, 2009.
Perquisites
and Other Compensation
We do not
have any retirement or pension plans in place for any of our named executives.
Our named executive officers are eligible for group medical benefits that are
generally available to and on the same terms as our other
employees.
Management’s
Role in the Compensation-Setting Process
Our
management plays a role in our compensation-setting process. We believe this
input from management to the Compensation Committee is needed in order for the
committee to evaluate the performance of our officers, recommend business
performance targets and objectives, and recommend compensation levels. Our
management may from time to time, make recommendations to our Board of Directors
regarding executive compensation. During this process, management may be asked
to provide the board with their evaluation of the executive officers’
performances, the background information regarding our strategic financial and
operational objectives, and compensation recommendations as to the executive
officers.
Summary Compensation
Table for Fiscal Year 2009, 2008 and
2007
The
following table sets forth information for the fiscal year ended December 31,
2009, 2008 and 2007 concerning the compensation paid and awarded to all
individuals serving as (a) our Chief Executive Officer and Chief Financial
Officer (b) the three most highly compensated Executive Officers (other than our
Chief Executive Officer and Chief Financial Officer) of ours and our
subsidiaries at the end of our fiscal year ended December 31, 2009, 2008
and 2007 whose total compensation exceeded $100,000 for these periods, and (c)
two additional individuals for whom disclosure would have been provided pursuant
to (b) except that they were not serving as executive officers at the end of our
fiscal year ended December 31, 2009. These individuals may be collectively
referred to in this report as our “Named Executive Officers.”
|
Name and
Principal Position
|
Fiscal
Year
|
Salary
($)
|
Bonus
($)
|
Stock
Awards
($)
|
Option
Awards
($)
|
Non-
Equity
Incentive
Plan
Compen-
sation
($)
|
Non-
qualified
Deferred
Compen-
sation
Earnings
($)
|
All Other
Compen-
sation
($)
|
Total
($)
|
|||||||||||||||||||||||||
|
Kang
Yihua
|
||||||||||||||||||||||||||||||||||
|
Chairman
of the
|
||||||||||||||||||||||||||||||||||
|
Board,
Chief
|
2009
|
16,394
|
43988
|
—
|
—
|
—
|
—
|
—
|
60,382
|
|||||||||||||||||||||||||
|
Executive
Officer
|
2008
|
25,824
|
—
|
—
|
—
|
—
|
—
|
—
|
25,824
|
|||||||||||||||||||||||||
|
and
President
|
2007
|
19,830
|
—
|
—
|
—
|
—
|
—
|
—
|
19,830
|
|||||||||||||||||||||||||
|
Guo
Yan
|
||||||||||||||||||||||||||||||||||
|
Chief
Financial
|
2009
|
3167
|
14,663
|
—
|
—
|
—
|
—
|
—
|
17,830
|
|||||||||||||||||||||||||
|
Officer
and
|
2008
|
3161
|
11,527
|
—
|
—
|
—
|
—
|
—
|
14,688
|
|||||||||||||||||||||||||
|
Director
|
2007
|
2,805
|
—
|
—
|
—
|
—
|
—
|
—
|
2,805
|
|||||||||||||||||||||||||
|
|
(1)
|
All compensation is paid in
Chinese RMB. For reporting purposes, the amounts in the table above have
been converted to U.S. Dollars at the conversion rate of 7.60
RMB, 6.94 RMB and 6.82 RMB to one for year 2007,
2008 and 2009 respectively. The officers listed in this table received no
other form of compensation in the years shown, other than the salary set
forth in this table.
|
58
Other
Compensation
Other
than as described above, there were no post-employment compensation, pension or
nonqualified deferred compensation benefits earned by the executive officers
during the year ended December 31, 2009. We do not have any retirement, pension,
or profit-sharing programs for the benefit of our directors, officers or other
employees. The Board of Directors may recommend adoption of one or more such
programs in the future.
Employment
Contracts and Termination of Employment and Change-In-Control
Arrangements
The
Company entered into an employment agreement with Edward Yihua Kang on November
1, 2005 pursuant to which Mr. Kang was appointed as the Chief Executive Officer
and President of the Company. In determining the compensation to be paid to Mr.
Kang, the Board of Directors and the Compensation Committee reviewed the overall
performance of the Company and the relative contribution of Mr. Kang in order to
arrive at an appropriate compensation level.
The
Company entered into an employment agreement with Jiajun Sun on November 1, 2005
pursuant to which Mr. Sun was appointed as the Chief Operating Officer of the
Company. In determining the compensation to be paid to Mr. Sun, the Board of
Directors and the Compensation Committee reviewed the overall performance of the
Company and the relative contribution of Mr. Sun in order to arrive at an
appropriate compensation level.
The
Company entered into an employment agreement with Ms. Yan Guo on November 1,
2005 pursuant to which Mr. Guo was appointed as the Chief Finance Officer of the
Company. In determining the compensation to be paid to Ms. Guo, the Board of
Directors and the Compensation Committee reviewed the overall performance of the
Company and the relative contribution of Ms. Guo in order to arrive at an
appropriate compensation level.
There are
no compensatory plans or arrangements, including payments to be received
from us, with respect to any director or executive officer of us which would in
any way result in payments to any such person because of his resignation,
retirement, or other termination of employment with us, any change in control of
the Company, or a change in the person’s responsibilities following a change in
control of the Company.
Director
Compensation for Fiscal 2009
The
following table reflects all compensation awarded to, earned by or paid to the
Company’s directors for the fiscal year ended December 31, 2009. Directors who
are also officers do not receive any additional compensation for their services
as directors.
|
Name
|
Fees
Earned or
Paid in
Cash
($)
|
Stock
Awards
($)(1)
|
Options
Awards
($)
|
Non-
Equity
Incentive
Plan
Compensat
ion
($)
|
Non-Qualif
ied
Deferred
Compensat
ion
Earnings
($)
|
All Other
Compensat
ion
($)
|
Total
($)
|
|||||||||||||||||||||
|
Kang
Yihua
|
60,382
|
—
|
—
|
—
|
—
|
—
|
60,382
|
|||||||||||||||||||||
|
Sun
Jia Jun
|
56,757
|
—
|
—
|
—
|
—
|
—
|
56,757
|
|||||||||||||||||||||
|
Guo
Yan
|
17,830
|
—
|
—
|
—
|
—
|
—
|
17,830
|
|||||||||||||||||||||
|
Bennet
P. Tchaikovsky
|
—
|
30,647
|
—
|
—
|
—
|
—
|
30,647
|
|||||||||||||||||||||
|
Changyu
Qi
|
—
|
5,000
|
—
|
—
|
—
|
—
|
5,000
|
|||||||||||||||||||||
|
Zhixue
Zhang
|
—
|
5,000
|
—
|
—
|
—
|
—
|
5,000
|
|||||||||||||||||||||
59
|
|
(1)
|
All compensation was paid in RMB.
The amounts in the foregoing table have been converted into U.S. Dollar at
the conversion rate of 6.82 RMB to the
dollar.
|
|
|
(2)
|
Mr. Kang received salary during
2009 of $ and total compensation of $ in consideration of his
services as our Chief Executive
Officer.
|
|
|
(3)
|
Mr. Sun received salary during
2009 of $ and total compensation of $ in consideration of his
services as our Chief Operating
Officer.
|
|
|
(4)
|
Mr.
Tchaikovsky resigned from the Board on November 25, 2009. He received
stock compensation according the following annual compensation arrangement
for the period of services he
provided.
|
|
|
(4)
|
On March 14, 2008, the Board
approved the following annual compensation for its independent
(non-employee) directors, which shall apply for
2009:
|
|
Service Description
|
Amount (in U.S. dollars)
|
|||
|
Base
Compensation
|
$ | 3,000 | ||
|
Audit
Committee Member
|
$ | 1,000 | ||
|
Compensation
Committee Member
|
$ | 1,000 | ||
|
Audit
Committee Chairman
|
$ | 3,000 | ||
|
Audit
Committee Financial Expert
|
$ | 26,000 | ||
Each
director may be appointed to perform multiple functions or serve on multiple
committees, and accordingly, may be eligible to receive more than one category
of compensation described above. Annual compensation will be paid in the form of
a number of shares of the Company’s restricted common stock having an aggregate
value equal to the annual compensation, as determined by the average per share
closing prices of the Company’s common stock as quoted on the OTCBB or NYSE
Amex, as applicable, for the five trading days leading up to and including the
last trading date of the quarter following which the shares are to be issued
(i.e. when the shares are issued within 30 days following the end of the second
quarter, and the fourth quarter when the shares are issued within 30 days
following the end of the fourth quarter) of the year for which compensation
is being paid. Compensation, in the form of shares, shall be issued
and paid semi-annually, within 30 days following the end of the second quarter
(beginning with the second quarter of 2008), and within 30 days after the end of
the fourth quarter, of each calendar year. In addition, the Annual
Compensation will be pro rated daily (based on a 360 day year) for any portion
of the year during which a director serves. Independent directors are
also eligible for reimbursement of all travel and other reasonable expenses
relating to the directors’ attendance of board meetings. In addition, the
Company has agreed to reimburse independent directors for reasonable expenses
incurred in connection with the performance of duties as a director of the
Company.
Outstanding
Equity Awards at Fiscal Year-End
None of
our executive officers were granted or otherwise received any option, stock or
equity incentive plan awards during 2009 and there were no outstanding
unexercised options previously awarded to our officers and directors, at the
fiscal year end, December 31, 2009.
ITEM
12. SECURITY OWNERSHIP OF CERTAIN BENEFICIAL OWNERS AND
MANAGEMENT AND RELATED STOCKHOLDER MATTERS
The
following table sets forth information regarding the beneficial ownership of our
common stock as of March 30, 2010, for each of the following
persons:
|
|
o
|
each of our directors and each of
the named executive officers in the “Management” section of this Annual
Report;
|
|
|
o
|
all directors and named executive
officers as a group; and
|
60
|
|
o
|
each person who is known by us to
own beneficially five percent or more of our common
stock.
|
Beneficial
ownership is determined in accordance with the rules of the SEC. Unless
otherwise indicated in the table, the persons and entities named in the table
have sole voting and sole investment power with respect to the shares set forth
opposite the shareholder’s name. Unless otherwise indicated, the address of each
beneficial owner listed below is c/o Ever-Glory International Group, Inc. 100 N.
Barranca Ave. #810, West Covina, California 91791. The percentage of class
beneficially owned set forth below is based on 13,566,874 shares of
our common stock outstanding on March 30, 2010,
|
Name of Beneficial Owner
|
Amount and
Nature
of Beneficial
Ownership of
Common Stock (1)
|
Percent of
Class
|
||||||
|
Executive
Officers and Directors
|
||||||||
|
Yi
Hua Kang
|
4,802,315 | 35.40 | % | |||||
|
Jia
Jun Sun
|
174,800 | 1.29 | % | |||||
|
Yan
Guo
|
- | - | ||||||
|
Changyu
Qi
|
4,971 | 0.04 | % | |||||
|
Zhixue
Zhang
|
4,932 | 0.04 | % | |||||
|
All
Executive Officers and Directors as a Group (six persons)
|
||||||||
|
5%
Holders
|
||||||||
|
Ever-Glory
Enterprises (H.K.) Ltd. (2)
|
4,469,252 | 32.94 | % | |||||
|
Xiao
Dong Yan (2)
|
379,240 | 2.80 | % | |||||
|
(1)
|
The percentage of shares
beneficially owned is based on 13,566,874 shares of common stock
outstanding as of March 29, 2010. Except as otherwise noted, shares are
owned beneficially and of record, and such record shareholder has sole
voting, investment and dispositive power of the
shares.
|
|
(2)
|
Xiao Dong Yan is the director of
Ever-Glory Enterprises (H.K.) Ltd. and, as such, may be deemed to be the
beneficial owner of the 4,469,252 shares held by Ever-Glory Enterprises
(H.K.) Ltd.
|
Equity
Compensation Plan Information
We have
not adopted any equity compensation plan as of December 31,
2009.
ITEM 13. CERTAIN RELATIONSHIPS AND RELATED
TRANSACTIONS AND DIRECTOR INDEPENDENCE
Related
Party Transactions
Mr. Kang
is the Company’s Chairman and Chief Executive Officer. Ever-Glory Hong Kong is
the Company’s major shareholder. Mr. Xiaodong Yan is Ever-Glory Hong Kong’s
shareholder. All transactions associated with the following companies controlled
by Mr. Kang or Mr. Yan are considered to be related party transactions. All
related party outstanding balances are short-tem in nature and are expected to
be settled in cash.
Sales and Cost of Sales to
Related Parties
Sales and
cost of sales for the year ended December 31, 2009 were from transactions with
Nanjing Knitting, Jiangsu Ever-Glory and Shanghai La Chapelle.
61
|
2009
|
2008
|
|||||||||||||||
|
Sales
|
Cost of Sales
|
Sales
|
Cost of Sales
|
|||||||||||||
|
Shanghai
La Chapelle
|
$ | 63,466 | $ | 45,563 | ||||||||||||
|
Nanjing
Knitting
|
$ | 9,353 | $ | 9,015 | $ | 681,167 | $ | 621,103 | ||||||||
|
Jiangsu
Ever-Glory
|
$ | 389 | $ | 387 | ||||||||||||
|
Total
|
$ | 73,208 | $ | 54,965 | $ | 681,167 | $ | 621,103 | ||||||||
Purchases from, and
Sub-contracts with Related Parties
The
Company purchased raw materials from related companies totaling $2,728,896 and
$1,828,661 during the years ended December 31, 2009 and 2008,
respectively.
|
2009
|
2008
|
|||||||
|
Nanjing
Knitting
|
$ | 2,686,863 | $ | 1,828,661 | ||||
|
Jiangsu
Ever-Glory
|
$ | 42,033 | ||||||
|
Total
|
$ | 2,728,896 | $ | 1,828,661 | ||||
In
addition, the Company sub-contracted certain manufacturing work to related
companies totaling $1,814,846 and $1,327,965 for the years ended December 31,
2009 and 2008, respectively. The Company provided raw materials to the
sub-contractors and was charged a fixed fee for labor provided by the
sub-contractors.
Sub-contracts
with related parties included in cost of sales for the years ended December 31,
2009 and 2008 are as follows:
|
2009
|
2008
|
|||||||
|
Nanjing
Knitting
|
$ | 591,470 | $ | 706,201 | ||||
|
Nanjing
Ever-Kyowa,
|
955,792 | 621,764 | ||||||
|
Ever-Glory
Vietnam
|
246,936 | |||||||
|
Ever-Glory
Cambodia
|
20,648 | |||||||
|
Total
|
$ | 1,814,846 | $ | 1,327,965 | ||||
Accounts Payable – Related
Parties
The
Company purchases raw materials from and subcontracts some of its production to
related parties. Accounts payable to related parties are as
follows:
|
2009
|
2008
|
|||||||
|
Nanjing
Knitting
|
$ | 153,660 | $ | 0 | ||||
|
Nanjing
Ever-Kyowa
|
335,546 | 0 | ||||||
|
Total
|
$ | 489,206 | $ | 0 | ||||
62
Amounts Due From Related
Party
Jiangsu
Ever-Glory International Group Corp., (“Jiangsu Ever-Glory”) is an entity
engaged in importing/exporting, apparel-manufacture, real-estate development,
car sales and other activities. Jiangsu Ever-Glory is controlled by the
Company’s Chief Executive Officer. Because of restrictions on its ability to
directly import and export products, the Company utilizes Jiangsu Ever-Glory as
its agent, to assist the Company with its import and export transactions and its
international transportation projects. Import transactions primarily consist of
purchases of raw materials and accessories designated by the Company’s customers
for use in garment manufacture. Export transactions consist of the Company’s
sales to foreign markets such as Japan, Europe and the United States. As the
Company’s agent, Jiangsu Ever-Glory’s responsibilities include managing customs,
inspection, transportation, insurance and collections on behalf of the Company.
Jiangsu Ever-Glory also manages transactions denominated in currencies other
than the Chinese RMB at rates of exchange agreed between the Company and Jiangsu
Ever-Glory and based upon rates of exchange quoted by the People’s Bank of
China. In return for these services, Jiangsu Ever-Glory charges the Company a
fee of approximately 3% of export sales. For import transactions, the
Company may make advance payments, through Jiangsu Ever-Glory, for the raw
material purchases, or Jiangsu Ever-Glory may make advance payments on the
Company’s behalf. For export transactions, accounts receivable for export sales
are remitted by the Company’s customers through Jiangsu Ever-Glory, who forwards
the payments to the Company. The Company and Jiangsu Ever-Glory have agreed that
balances from import and export transactions may be offset. Amounts
due to (from) Jiangsu Ever-Glory are typically settled within 60-90 days.
Interest of 0.5% is charged on net amounts due at each month end. Interest
income for the years ended December 31, 2009 and 2008 was $614,842 and $217,181
respectively. Following is a summary of import and export transactions for the
years ended December 31, 2009 and 2008:
|
Accounts Receivable
|
Accounts Payable
|
Net
|
||||||||||
|
As
of January 1,2009
|
$ | 17,938,281 | $ | 6,372,707 | $ | 11,565,574 | ||||||
|
Sales/Purchases
|
$ | 68,275,235 | $ | 31,836,171 | ||||||||
|
Payments
Received/Made
|
$ | 70,467,973 | $ | 35,818,220 | ||||||||
|
As
of December 31,2009
|
$ | 15,745,543 | $ | 2,390,658 | $ | 13,354,885 | ||||||
Approximately
69% of the receivable balance at December 31, 2009 was settled by March 30,
2010.
Other Payables – Related
Parties
As of
December 31, 2009 and 2008, other payables due to related parties
were as follows:.
|
2009
|
2008
|
|||||||
|
Shanghai La Chapelle Garment and Accessories Company Limited
|
$ | 293,400 | ||||||
|
Ever-Glory Enterprise HK Limited
|
$ | 754,589 | ||||||
| $ | 293,400 | $ | 754,589 | |||||
63
The
balance as of December 31, 2008 included $200,000 for the purchase of Catch-Luck
and $554,589 was due for legal and professional fees paid by
Ever-Glory Enterprise HK Limited on behalf of the Company. In 2009 the
Company repaid $754,589 to Ever-Glory Hong Kong.
In February,
July and August 2009, LA GO GO borrowed $293,400 (RMB 2 million) from
Shanghai La Chapelle for operations. This loan is interest free and due on
demand. Management expects to repay this loan in cash from operations in 2010.
.
Loan from Related
Party
As of
December 31, 2009 and 2008 the Company owed $2,575,759 and $2,660,085,
respectively to Blue Power Holdings Limited., a company controlled by the
Company’s Chief Executive Officer. Interest is charged at 6% per annum on the
amounts due. The loans are due between July 2010 and April 2011. For years ended
December 31,2009 and 2008, the Company incurred interest expense of $115,674 and
$175,100, respectively. The accrued interest is included in the carrying amount
of the loan in the accompanying balance sheets. On November 18, 2009, the
Company repaid $200,000 to Blue Power Holdings Limited.
ITEM 14. PRINCIPAL ACCOUNTANT FEES AND
SERVICES
On
December 22, 2009, the Audit Committee, with the approval of the Board of
Directors, engaged GHP Horwath P.C. as the Company’s independent
auditor.
Fees for
audit services include fees associated with the annual audit and the review of
documents filed with the SEC including quarterly reports on Form 10-Q and the
Annual Report on Form 10-K. Audit-related fees principally included accounting
consultation and information system control reviews. Tax fees
included tax compliance, tax advice and tax planning work.
|
2009
|
2008
|
|||||||
|
Audit
fees
|
$
|
216,000
|
$
|
248,000
|
||||
|
Audit-
related fees
|
-
|
-
|
||||||
|
Tax
fees
|
|
-
|
||||||
|
All
other fees
|
-
|
|||||||
PART
IV
|
ITEM 15.
|
EXHIBITS, FINANCIAL STATEMENTS
SCHEDULE
|
|
|
a.
|
(1) Financial
Statements
|
The
following consolidated financial statements of Ever-Glory International Group,
Inc. are included in Part II, Item 8 of this Report:
Report of
GHP Horwath P.C Independent Auditors
Consolidated
Balance Sheets at December 31, 2009 and 2008
Consolidated
Statements of Operations and Comprehensive Income for the Years Ended December
31, 2009 and 2008
Consolidated
Statements of Stockholders’ Equity for the Years Ended December 31, 2009 and
2008
Consolidated
Statements of Cash Flows for the Years Ended December 31, 2009 and
2008
Notes to
Consolidated Financial Statements
64
(2)
Financial Statement Schedules
Schedules
are omitted because the required information is not present or is not present in
amounts sufficient to require submission of the schedule or because the
information required is given in the consolidated financial statements or the
notes thereto.
(3)
Exhibits
EXHIBIT
INDEX
|
Number
|
Description
|
|
|
2.1
|
Agreement
and Plan of Reorganization as amended, dated as of July 29, 2005, by and
among Andean, Perfect Dream and Perfect Dream Shareholders (incorporated
by reference to Exhibit 2.1 of our Current Report on Form 8-K, filed
August 24, 2005).
|
|
|
2.2
|
Agreement
for the Purchase and Sale of Stock of Nanjing Catch-Luck Garments Co. Ltd.
dated (incorporated by reference to Exhibit 2.1 of our Current Report on
Form 8-K, filed June 29, 2006).
|
|
|
2.3
|
Amendment
No. 1 To Agreement for the Purchase and Sale of Stock of Nanjing
Catch-Luck Garments Co. Ltd. dated (incorporated by reference to Exhibit
2.2 of our Current Report on Form 8-K, filed September 1,
2006).
|
|
|
2.4
|
Agreement
for the Purchase and Sale of Stock of Nanjing New-Tailun Garments Co.,
Ltd. dated November 9, 2006 (incorporated by reference to Exhibit 2.1 of
our Current Report on Form 8-K, filed November 13,
2006).
|
|
|
3.1
|
Restated
Articles of Incorporation (incorporated by reference to Exhibit 3.1 of our
Annual Report on Form 10-KSB, filed March 29, 2006).
|
|
|
3.2
|
Articles
of Amendment as filed with the Department of State of Florida, effective
November 20, 2007 (incorporated by reference to Exhibit 3.1 of our Current
Report on Form 8-K, filed November 29, 2007).
|
|
|
3.3
|
Amended
and Restated Bylaws (incorporated by reference to Exhibit 3.2(b) of our
Annual Report on Form 10-KSB40, filed April 14, 1998).
|
|
|
4.1
|
Sections
3.10, 7.10, and 7.11of the Amended and Restated Bylaws (incorporated by
reference to Exhibit 3.2(b) of our Annual Report on Form 10-KSB40, filed
April 14, 1998).
|
|
|
4.2
|
Articles
of Association of Perfect Dream (incorporated by reference to Exhibit 4.1
of our Current Report on Form 8-K, filed August 24,
2005).
|
|
|
4.3
|
Articles
of Association of Goldenway (incorporated by reference to Exhibit 4.2 to
our Current Report on Form 8-K, filed August 24, 2005).
|
|
|
10.1
|
Subscription
Agreement (incorporated by reference to Exhibit 10.1 of our Current Report
on Form 8-K, filed August 8,
2007).
|
65
|
10.2
|
Form
of Convertible Note (incorporated by reference to Exhibit 10.2 of our
Current Report on Form 8-K, filed August 8, 2007).
|
|
|
10.3
|
Form
of Class A Common Stock Purchase Warrant (incorporated by reference to
Exhibit 10.3 of our Current Report on Form 8-K, filed August 8,
2007).
|
|
|
10.4
|
Security
Agreement (incorporated by reference to Exhibit 10.4 of our Current Report
on Form 8-K, filed August 8, 2007).
|
|
|
10.5
|
Stock
Pledge Agreement (incorporated by reference to Exhibit 10.5 of our Current
Report on Form 8-K, filed August 8, 2007).
|
|
|
10.6
|
Lockup
Agreement (incorporated by reference to Exhibit 10.6 of our Current Report
on Form 8-K, filed August 8, 2007).
|
|
|
10.7
|
Letter
of Intent to Acquire Branded Retail Division (incorporated by reference to
Exhibit 10.7 of our Current Report on Form 8-K, filed August 8,
2007).
|
|
|
10.8
|
Non-Compete
Agreement (incorporated by reference to Exhibit 10.8 of our Current Report
on Form 8-K, filed August 8, 2007).
|
|
|
10.9
|
Guaranty
(incorporated by reference to Exhibit 10.9 of our Current Report on Form
8-K, filed August 8, 2007).
|
|
|
10.10
|
Equity
Interest Transfer Agreement between Perfect Dream and Ever-Glory
Enterprises (H.K.) Ltd. (incorporated by reference to Exhibit 10.1 of our
Current Report on Form 8-K, filed August 24, 2005).
|
|
|
10.11
|
Equity
Interest Transfer Agreement between Perfect Dream and Jiangsu Ever-Glory
International Group Corporation (incorporated by reference to Exhibit 10.2
of our Current Report on Form 8-K, filed August 24,
2005).
|
|
|
10.12
|
Loan
Agreement between Goldenway Nanjing Garments Co. Ltd. and Nanjing City
Commercial Bank dated August 15, 2006 (incorporated by reference to
Exhibit 10.3 of our Amendment No. 1 to its Annual Report on 10-KSB/A,
filed May 9, 2007).
|
|
|
10.21
|
Capital
Contribution Agreement, dated January 9, 2008 (incorporated by reference
to Exhibit 99.1 of our Current Report on Form 8-K, filed January 15,
2008).
|
|
|
10.22
|
Joint
Venture Establishment Agreement, dated January 9, 2008 (incorporated by
reference to Exhibit 99.2 of our Current Report on Form 8-K, filed January
15, 2008).
|
|
|
10.23
|
Land
Development Agreement between Jiangsu Ever-Glory International Group Corp.
and Nanjing Goldenway Garment Co., Ltd. (incorporated by reference to
Exhibit 10.23 of our Annual Report on Form 10-K, filed March 31,
2009).
|
|
|
10.24
|
Lease
Agreement between Jiangsu Ever-Glory International Group Co. and Nanjing
New-Tailun Garment Co., Ltd. (incorporated by reference to Exhibit 10.24
of our Annual Report on Form 10-K, filed March 31,
2009)
|
|
|
10.25
|
Loan
Agreement between Goldenway Nanjing Garments Company Limited and China
Merchant Bank, Nanjing Branch. (incorporated by reference to Exhibit 10.25
of our Annual Report on Form 10-K, filed March 31,
2009)
|
66
|
10.26
|
Irrevocable
Guaranty Agreement between China Merchant Bank, Nanjing Branch and Edward
Yihua Kang. (incorporated by reference to Exhibit 10.26 of our Annual
Report on Form 10-K, filed March 31, 2009)
|
|
|
10.27
|
Mortgage
Agreement between China Merchant Bank, Nanjing Branch and Edward Yihua
Kang. (incorporated by reference to Exhibit 10.27 of our Annual Report on
Form 10-K, filed March 31, 2009)
|
|
|
10.28
|
Mortgage
Agreement between China Merchant Bank, Nanjing Branch and Huake Kang.
(incorporated by reference to Exhibit 10.28 of our Annual Report on Form
10-K, filed March 31, 2009)
|
|
|
16.2
|
Letter from Moore
Stephens Wurth Frazer and Torbet, LLP dated January 8, 2009 addressed to
the Securities and Exchange Commission. (Incorporated by reference to
Exhibit 16.1 of our Amendment No. 1 to our Current Report on Form 8-K,
filed January 8, 2009).
|
|
|
21.1
|
Subsidiaries
of Registrant.
|
|
|
23.1
|
Consent
of Moore Stephens Wurth Frazer and Torbet, LLP (incorporated by reference
to Exhibit 23.1 of our Annual Report on Form 10-K, filed March 31,
2009).
|
|
|
31.1
|
Certification
by Chief Executive Officer pursuant to Sarbanes Oxley Section
302.
|
|
|
31.2
|
Certification
by Chief Financial Officer pursuant to Sarbanes Oxley Section
302.
|
|
|
32.1
|
Certification
by Chief Executive Officer pursuant to 18 U.S.C. Section
1350.
|
|
|
32.2
|
Certification
by Chief Financial Officer pursuant to 18 U.S.C. Section
1350.
|
SIGNATURES
Pursuant
to the requirements of Section 13 or 15(d) of the Securities Exchange Act of
1934, the registrant has duly caused this report to be signed on its behalf by
the undersigned, thereunto duly authorized on the 31st day of March,
2010.
|
Ever-Glory
International Group, Inc.,
|
||
|
Date:
March 31, 2010
|
By
|
/s/ Edward Yihua Kang
|
|
Edward
Yihua Kang,
|
||
|
Chief
Executive Officer, President and
Chairman
of the Board
|
||
Pursuant
to the requirements of the Securities Exchange Act of 1934, this report has been
signed below by the following persons on behalf of the registrant and in the
capacities and on the dates indicated:
|
Signature
|
Title
|
Date
|
||
|
/s/ Jia Jun Sun
|
Chief
Operating Officer
|
March
31, 2010
|
||
|
Jia
Jun Sun
|
and
Director
|
|||
|
/s/ Yan Guo
|
Chief
Financial Officer
|
|||
|
Yan
Guo
|
(Principal
Financial and Accounting Officer)
|
March
31, 2010
|
||
|
/s/ Changyu Qi
|
Director
|
March
31, 2010
|
||
|
Changyu
Qi
|
||||
|
/s/ Zhixue Zhang
|
Director
|
March
31,2010
|
||
|
Zhixue
Zhang
|
67
INDEX
TO EXHIBITS
|
Exhibit
Number
|
Description
|
|
|
Number
|
Description
|
|
|
2.1
|
Agreement
and Plan of Reorganization as amended, dated as of July 29, 2005, by and
among Andean, Perfect Dream and Perfect Dream Shareholders (incorporated
by reference to Exhibit 2.1 of our Current Report on Form 8-K, filed
August 24, 2005).
|
|
|
2.2
|
Agreement
for the Purchase and Sale of Stock of Nanjing Catch-Luck Garments Co. Ltd.
dated (incorporated by reference to Exhibit 2.1 of our Current Report on
Form 8-K, filed June 29, 2006).
|
|
|
2.3
|
Amendment
No. 1 To Agreement for the Purchase and Sale of Stock of Nanjing
Catch-Luck Garments Co. Ltd. dated (incorporated by reference to Exhibit
2.2 of our Current Report on Form 8-K, filed September 1,
2006).
|
|
|
2.4
|
Agreement
for the Purchase and Sale of Stock of Nanjing New-Tailun Garments Co.,
Ltd. dated November 9, 2006 (incorporated by reference to Exhibit 2.1 of
our Current Report on Form 8-K, filed November 13,
2006).
|
|
|
3.1
|
Restated
Articles of Incorporation (incorporated by reference to Exhibit 3.1 of our
Annual Report on Form 10-KSB, filed March 29, 2006).
|
|
|
3.2
|
Articles
of Amendment as filed with the Department of State of Florida, effective
November 20, 2007 (incorporated by reference to Exhibit 3.1 of our Current
Report on Form 8-K, filed November 29, 2007).
|
|
|
3.3
|
Amended
and Restated Bylaws (incorporated by reference to Exhibit 3.2(b) of our
Annual Report on Form 10-KSB40, filed April 14, 1998).
|
|
|
4.1
|
Sections
3.10, 7.10, and 7.11of the Amended and Restated Bylaws (incorporated by
reference to Exhibit 3.2(b) of our Annual Report on Form 10-KSB40, filed
April 14, 1998).
|
|
|
4.2
|
Articles
of Association of Perfect Dream (incorporated by reference to Exhibit 4.1
of our Current Report on Form 8-K, filed August 24,
2005).
|
|
|
4.3
|
Articles
of Association of Goldenway (incorporated by reference to Exhibit 4.2 to
our Current Report on Form 8-K, filed August 24, 2005).
|
|
|
10.1
|
Subscription
Agreement (incorporated by reference to Exhibit 10.1 of our Current Report
on Form 8-K, filed August 8, 2007).
|
|
|
10.2
|
Form
of Convertible Note (incorporated by reference to Exhibit 10.2 of our
Current Report on Form 8-K, filed August 8, 2007).
|
|
|
10.3
|
Form
of Class A Common Stock Purchase Warrant (incorporated by reference to
Exhibit 10.3 of our Current Report on Form 8-K, filed August 8,
2007).
|
|
|
10.4
|
Security
Agreement (incorporated by reference to Exhibit 10.4 of our Current Report
on Form 8-K, filed August 8,
2007).
|
68
|
10.5
|
Stock
Pledge Agreement (incorporated by reference to Exhibit 10.5 of our Current
Report on Form 8-K, filed August 8, 2007).
|
|
|
10.6
|
Lockup
Agreement (incorporated by reference to Exhibit 10.6 of our Current Report
on Form 8-K, filed August 8, 2007).
|
|
|
10.7
|
Letter
of Intent to Acquire Branded Retail Division (incorporated by reference to
Exhibit 10.7 of our Current Report on Form 8-K, filed August 8,
2007).
|
|
|
10.8
|
Non-Compete
Agreement (incorporated by reference to Exhibit 10.8 of our Current Report
on Form 8-K, filed August 8, 2007).
|
|
|
10.9
|
Guaranty
(incorporated by reference to Exhibit 10.9 of our Current Report on Form
8-K, filed August 8, 2007).
|
|
|
10.10
|
Equity
Interest Transfer Agreement between Perfect Dream and Ever-Glory
Enterprises (H.K.) Ltd. (incorporated by reference to Exhibit 10.1 of our
Current Report on Form 8-K, filed August 24, 2005).
|
|
|
10.11
|
Equity
Interest Transfer Agreement between Perfect Dream and Jiangsu Ever-Glory
International Group Corporation (incorporated by reference to Exhibit 10.2
of our Current Report on Form 8-K, filed August 24,
2005).
|
|
|
10.12
|
Loan
Agreement between Goldenway Nanjing Garments Co. Ltd. and Nanjing City
Commercial Bank dated August 15, 2006 (incorporated by reference to
Exhibit 10.3 of our Amendment No. 1 to its Annual Report on 10-KSB/A,
filed May 9, 2007).
|
|
|
10.21
|
Capital
Contribution Agreement, dated January 9, 2008 (incorporated by reference
to Exhibit 99.1 of our Current Report on Form 8-K, filed January 15,
2008).
|
|
|
10.22
|
Joint
Venture Establishment Agreement, dated January 9, 2008 (incorporated by
reference to Exhibit 99.2 of our Current Report on Form 8-K, filed January
15, 2008).
|
|
|
10.23
|
Land
Development Agreement between Jiangsu Ever-Glory International Group Corp.
and Nanjing Goldenway Garment Co., Ltd. (incorporated by reference to
Exhibit 10.23 of our Annual Report on Form 10-K, filed March 31,
2009).
|
|
|
10.24
|
Lease
Agreement between Jiangsu Ever-Glory International Group Co. and Nanjing
New-Tailun Garment Co., Ltd. (incorporated by reference to Exhibit 10.24
of our Annual Report on Form 10-K, filed March 31,
2009)
|
|
|
10.25
|
Loan
Agreement between Goldenway Nanjing Garments Company Limited and China
Merchant Bank, Nanjing Branch. (incorporated by reference to Exhibit 10.25
of our Annual Report on Form 10-K, filed March 31,
2009)
|
|
|
10.26
|
Irrevocable
Guaranty Agreement between China Merchant Bank, Nanjing Branch and Edward
Yihua Kang. (incorporated by reference to Exhibit 10.26 of our Annual
Report on Form 10-K, filed March 31, 2009)
|
|
|
10.27
|
Mortgage
Agreement between China Merchant Bank, Nanjing Branch and Edward Yihua
Kang. (incorporated by reference to Exhibit 10.27 of our Annual Report on
Form 10-K, filed March 31,
2009)
|
69
|
10.28
|
Mortgage
Agreement between China Merchant Bank, Nanjing Branch and Huake Kang.
(incorporated by reference to Exhibit 10.28 of our Annual Report on Form
10-K, filed March 31, 2009)
|
|
|
16.2
|
Letter from Moore
Stephens Wurth Frazer and Torbet, LLP dated January 8, 2009 addressed to
the Securities and Exchange Commission. (Incorporated by reference to
Exhibit 16.1 of our Amendment No. 1 to our Current Report on Form 8-K,
filed January 8, 2009).
|
|
|
21.1
|
Subsidiaries
of Registrant.
|
|
|
23.1
|
Consent
of Moore Stephens Wurth Frazer and Torbet, LLP (incorporated by reference
to Exhibit 23.1 of our Annual Report on Form 10-K, filed March 31,
2009).
|
|
|
31.1
|
Certification
by Chief Executive Officer pursuant to Sarbanes Oxley Section
302.
|
|
|
31.2
|
Certification
by Chief Financial Officer pursuant to Sarbanes Oxley Section
302.
|
|
|
32.1
|
Certification
by Chief Executive Officer pursuant to 18 U.S.C. Section
1350.
|
|
|
32.2
|
Certification
by Chief Financial Officer pursuant to 18 U.S.C. Section
1350.
|
70