Attached files
| file | filename |
|---|---|
| EX-32.1 - CERTIFICATION BY CHIEF EXECUTIVE OFFICER PURSUANT TO 18 U.S.C. SECTION 1350.* - Ever-Glory International Group, Inc. | f10k2020ex32-1_everglory.htm |
| EX-32.2 - CERTIFICATION BY CHIEF FINANCIAL OFFICER PURSUANT TO 18 U.S.C. SECTION 1350.* - Ever-Glory International Group, Inc. | f10k2020ex32-2_everglory.htm |
| EX-31.2 - CERTIFICATION BY CHIEF FINANCIAL OFFICER PURSUANT TO SARBANES OXLEY SECTION 302. - Ever-Glory International Group, Inc. | f10k2020ex31-2_everglory.htm |
| EX-31.1 - CERTIFICATION BY CHIEF EXECUTIVE OFFICER PURSUANT TO SARBANES OXLEY SECTION 302. - Ever-Glory International Group, Inc. | f10k2020ex31-1_everglory.htm |
| EX-21.1 - SUBSIDIARIES OF REGISTRANT - Ever-Glory International Group, Inc. | f10k2020ex21-1_everglory.htm |
UNITED STATES
SECURITIES AND EXCHANGE COMMISSION
Washington, D.C. 20549
FORM 10-K
(Mark
One)
☒ ANNUAL REPORT PURSUANT
TO SECTION 13 OR 15(d) OF THE SECURITIES EXCHANGE ACT OF 1934
For the fiscal year ended December 31, 2020
Or
☐ TRANSITION REPORT PURSUANT TO SECTION 13 OR 15(d) OF THE SECURITIES EXCHANGE ACT OF 1934
For the transition period from ____________ to ______________
Commission file number: 001-34124
EVER-GLORY INTERNATIONAL GROUP, INC.
(Exact name of registrant as specified in its charter)
| Florida | 65-0420146 | |
| (State or other jurisdiction of incorporation or organization) |
(I.R.S. Employer Identification No.) |
Ever-Glory Commercial Center,
509 Chengxin Road, Jiangning Development Zone,
Nanjing, Jiangsu Province,
Peoples Republic of China
(Address of principal executive offices) (Zip Code)
86-25-52096831
(Registrant’s telephone number, including area code)
Securities registered under Section 12(b) of the Act:
| Title of each class registered | Trading Symbol(s) | Name of each exchange on which registered | ||
| Common Stock | EVK | NASDAQ Global Market |
Securities registered under Section 12(g) of the Act: None.
Indicate by check mark if the registrant is a well-known seasoned issuer, as defined in Rule 405 of the Securities Act. Yes ☐ No ☒
Indicate by check mark if the registrant is not required to file reports pursuant to Section 13 or Section 15(d) of the Act. Yes ☐ No ☒
Indicate by check mark whether the registrant (1) has filed all reports required to be filed by Section 13 or 15(d) of the Securities Exchange Act of 1934 during the preceding 12 months (or for such shorter period that the registrant was required to file such reports), and (2) has been subject to such filing requirements for the past 90 days. Yes ☒ No ☐
Indicate by check mark whether the registrant has submitted electronically, every Interactive Data File required to be submitted pursuant to Rule 405 of Regulation S-T (§ 232.405 of this chapter) during the preceding 12 months (or for such shorter period that the registrant was required to submit and post such files). Yes ☒ No ☐
Indicate by check mark whether the registrant is a large accelerated filer, an accelerated filer, a non-accelerated filer, a smaller reporting company or an emerging growth company. See the definitions of “large accelerated filer,” “accelerated filer,” “smaller reporting company” and “emerging growth company” in Rule 12b-2 of the Exchange Act
| Large accelerated filer | ☐ | Accelerated filer | ☐ |
| Non-accelerated filer | ☒ | Smaller reporting company | ☒ |
| Emerging growth company | ☐ |
If an emerging growth company, indicate by check mark if the registrant has elected not to use the extended transition period for complying with any new or revised financial accounting standards provided pursuant to Section 13(a) of the Exchange Act. ☐
Indicate by check mark whether the registrant is a shell company (as defined in Rule 12b-2 of the Act). Yes ☐ No ☒
As of June 30, 2020, the aggregate market value of the common stock held by non-affiliates of the registrant was approximately $4.2 million based on the closing price of $1.05 for the registrant’s common stock as reported on the NASDAQ Global Market.
As of March 30, 2021, there were 14,810,660 shares of our common stock issued and outstanding.
DOCUMENTS INCORPORATED BY REFERENCE
None.
EVER-GLORY INTERNATIONAL GROUP, INC.
FORM 10-K
For the Year Ended December 31, 2020
TABLE OF CONTENTS
| i |
Cautionary Note Regarding Forward-Looking Statements
Statements contained in this Annual Report on Form 10-K, which are not historical facts, are forward-looking statements, as the term is defined in the Private Securities Litigation Reform Act of 1995. Such forward-looking statements, whether expressed or implied, are subject to risks and uncertainties which can cause actual results to differ materially from those currently anticipated, due to a number of factors, which include, but are not limited to:
| ● | Competition within our industry; | |
| ● | Seasonality of our sales; | |
| ● | Our investments in new product development; | |
| ● | Our plans to open new retail stores; | |
| ● | Our ability to integrate our acquired businesses; | |
| ● | Our relationships with our major customers; | |
| ● | The popularity of our products; | |
| ● | Relationships with suppliers and cost of supplies; | |
| ● | Financial and economic conditions in Asia, Japan, Europe and the U.S.; | |
| ● | Regulatory requirements in the PRC and countries in which we operate; | |
| ● | Anticipated effective tax rates in future years; | |
| ● | Regulatory requirements affecting our business; | |
| ● | Currency exchange rate fluctuations; | |
| ● | Our financing needs; and | |
| ● | Our ability to attract additional investment capital on attractive terms. |
Forward-looking statements also include the assumptions underlying or relating to any of the foregoing or other such statements. When used in this report, the words “may,” “will,” “should,” “could,” “expect,” “plan,” “anticipate,” “believe,” “estimate,” “predict,” “continue,” and similar expressions are generally intended to identify forward-looking statements.
These forward-looking statements are subject to numerous assumptions, risks and uncertainties that may cause our actual results to be materially different from any future results expressed or implied by us in those statements. Some of these risks are described in “Risk Factors” in Item 1A of this Annual Report. These risk factors should be considered in connection with any subsequent written or oral forward-looking statements that we or persons acting on our behalf may issue. All written and oral forward looking statements made in connection with this annual report that are attributable to us or persons acting on our behalf are expressly qualified in their entirety by these cautionary statements. Given these uncertainties, we caution investors not to unduly rely on our forward-looking statements. We do not undertake any obligation to review or confirm analysts’ expectations or estimates or to release publicly any revisions to any forward-looking statements to reflect events or circumstances after the date of this document or to reflect the occurrence of unanticipated events. Further, the information about our intentions contained in this document is a statement of our intention as of the date of this document and is based upon, among other things, the existing regulatory environment, industry conditions, market conditions and prices, the economy in general and our assumptions as of such date. We may change our intentions, at any time and without notice, based upon any changes in such factors, in our assumptions or otherwise.
| ii |
Overview and Corporate History
Ever-Glory International Group, Inc., sometimes referred to in this report as “Ever-Glory”, the “Company”, “we”, or “us”, through its subsidiaries, is a retailer of branded fashion apparel and a leading global apparel supply chain solution provider. Ever-Glory offers apparel to woman under its own brands “La go go”, “Velwin”, “Sea To Sky” and “idole” and currently operates over 936 retail locations in China. Ever-Glory is also a leading global apparel supply chain solution provider with a focus on middle-to-high end casual wear, outerwear, and sportswear brands. Ever-Glory serves a number of well-known domestic and international brands and retail stores by providing a complete set of services of supply chain management on fabric development and design, sampling, sourcing, quality control, manufacturing, logistics, customs clearance, distribution, etc.
The Company was incorporated in Florida on October 19, 1994. We changed our name from Andean Development Corporation to “Ever-Glory International Group, Inc.” on November 17, 2005.
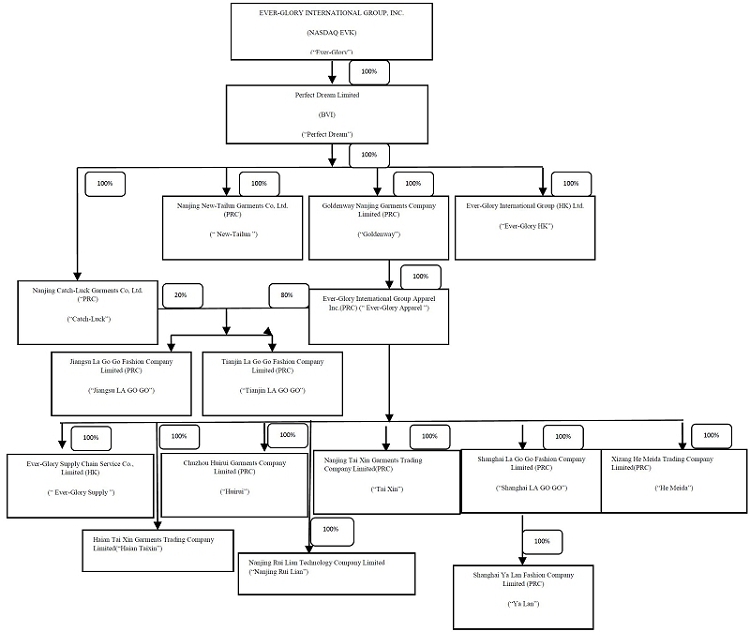
The following is a description of our corporate history and structure:
Perfect Dream Limited (“Perfect Dream”) was incorporated in the British Virgin Islands on July 1, 2004. Perfect Dream was originally formed as a holding company, and it became our wholly-owned subsidiary as a result of a share exchange transaction completed in November 2005.
In January 2005, Perfect Dream acquired 100% of Goldenway Nanjing Garments Company Limited (“Goldenway”). Goldenway, a wholly foreign-owned enterprise in People’s Republic of China (“PRC”), was incorporated on December 31, 1993. Goldenway is principally engaged in outsourcing and sale of garments. Prior to acquisition by Perfect Dream, Goldenway was a joint venture held by Jiangsu Ever-Glory International Group Corporation (“Jiangsu Ever-Glory”).
On November 9, 2006, Perfect Dream entered into a purchase agreement with Ever-Glory Enterprises (HK) Limited (“Ever-Glory Hong Kong”) whereby we acquired a 100% interest in Nanjing New-Tailun Garments Co, Ltd. (“New-Tailun”) from Ever-Glory Hong Kong. New-Tailun is a 100% foreign-owned enterprise incorporated in the PRC and is engaged in the manufacturing and sale of garments.
On August 27, 2007, Perfect Dream acquired Nanjing Catch-Luck Garments Co, Ltd. (“Catch-Luck”), which further expanded our production capacity. Catch-Luck is primarily engaged in the manufacturing and sale of garments in China.
Shanghai La Go Go Fashion Company Limited (“LA GO GO”), a joint venture of Goldenway and Shanghai La Chapelle Garment and Accessories Company Limited (“La Chapelle”), was incorporated in the PRC on January 24, 2008. Goldenway invested approximately $0.8 million (approximately RMB 6.0 million) in cash, and La Chapelle invested approximately $0.6 million (RMB 4.0 million) in cash, for a 60% and 40% ownership interest, respectively, in LA GO GO. In connection with the formation of LA GO GO, Goldenway made a strategic investment in La Chapelle by acquiring a 10% equity interest in La Chapelle with a cash payment of RMB 10 million (approximately USD$1.4 million). The business objective of the joint venture was to establish and create a leading brand of ladies’ garments for the mainland Chinese market. On March 23, 2009, Goldenway transferred all of its ownership interest in LA GO GO to Ever-Glory International Group Apparel Inc. (“Ever-Glory Apparel”), a wholly-owned subsidiary of Goldenway. On April 23, 2010, Ever-Glory Apparel acquired the 40% non-controlling interest in LA GO GO from La Chapelle for approximately $0.9 million (RMB 6.2 million), bringing our ownership in LA GO GO to 100%. In connection with such acquisition, and in order to focus on our core business, Goldenway sold the 10% equity interest in La Chapelle to the original shareholders of La Chapelle and, in return, received a total cash payment of RMB 12.4 million (approximately $1.8 million).
| 1 |
Ever-Glory Apparel was incorporated in the PRC on January 6, 2009. Goldenway invested approximately $16.9 million (RMB110.0 million) into Ever-Glory Apparel. Ever-Glory Apparel is principally engaged in the import and export of apparel, fabric and accessories. Ever-Glory Apparel began to function as our primary import and export agent since 2010.
On March 19, 2012, Nanjing Tai Xin Garments Trading Company Limited (“Tai Xin”), a wholly owned subsidiary of Ever-Glory Apparel was incorporated in PRC. Tai Xin is primarily engaged in the purchasing of raw materials used in the garment manufacturing.
Ever-Glory International Group (HK) Ltd. (“Ever-Glory HK”), a wholly owned subsidiary of Perfect Dream, was incorporated in Samoa on September 15, 2009. Ever-Glory HK is principally engaged in the import and export of apparel, fabric and accessories.
Ever-Glory Supply Chain Service Co., Limited (“Ever-Glory Supply”), a wholly-owned subsidiary of Ever-Glory Apparel, was incorporated in Hong Kong in 2017. Ever-Glory Supply is principally engaged in the import and export of apparel, fabric and accessories.
On March 2019, Haian Tai Xin Garments Trading Company Limited (“Haian Tai Xin”), a wholly owned subsidiary of Ever-Glory Apparel was incorporated in PRC. Haian Tai Xin is engaged in the business of garments manufacturing. Ever-Glory Apparel, Ever-Glory Supply and Ever-Glory HK focus on the import and export business.
In March 2020, the Company incorporated Nanjing Rui Lian Technology Company Limited (“Nanjing Rui Lian”), which is a Company’s wholly-owned PRC subsidiary. Nanjing Rui Lian is engaged in the business of garments trading.
Goldenway focuses primarily on quality and production control, and coordinates with outsourced contract manufacturers. New-Tailun focuses on the Japanese market, and has strengths in the design, production, sale and marketing of jeans and trousers. Catch-Luck is geared toward the European market, and it designs and makes products that complement the product lines of our other subsidiaries. Tai Xin is primarily engaged in the purchasing of raw materials used in the garment manufacturing. Shanghai LA GO GO focuses on establishing and creating a leading brand of ladies’ apparel for the mainland Chinese market.
On November 20, 2013, Jiangsu La Go Go Fashion Company Limited (“Jiangsu LA GO GO”), a joint venture of Ever-Glory Apparel and Catch-Luck, was incorporated in PRC. The business objective of Jiangsu LA GO GO is to carry out our retail operations in different geographic markets than LA GO GO.
On January 26, 2014, Shanghai Ya Lan Fashion Company Limited (“Ya Lan”), a wholly owned subsidiary of Shanghai LA GO GO, was incorporated in PRC. The business objective of Ya Lan is to establish and create another leading brand “Velwin” of ladies’ garments for the mainland Chinese market.
On March 19, 2014, Xizang He Meida Trading Company Limited (“He Meida”), a wholly owned subsidiary of Ever-Glory Apparel, was incorporated in PRC. The business objective of HeMeida is to develop online operation of our retail business in the mainland Chinese market.
On April 29, 2014, Tianjin La Go Go Fashion Company Limited (“Tianjin LA GO GO”), a joint venture of Ever-Glory Apparel and Catch-Luck, was incorporated in PRC. The business objective of Tianjin LA GO GO is to carry out our retail operations in different geographic markets other than Jiangsu LA GO GO.
On July 24, 2014, ChuzhouHuirui Garments Company Limited (“Huirui”), a wholly owned subsidiary of Ever-Glory Apparel, was incorporated in PRC. Huirui is primarily engaged in the management of our outsourced manufacturing factories.
On June 26, 2014, Shanghai LA GO GO entered into a contract with Shanghai Yiduo Fashion Company Limited (“Yiduo”) to acquire 78% of the shares of Yiduo. The Company gained effective control of Yiduo by the end of March 2015 and Yiduo was consolidated on March 31, 2015. The business objective of Yiduo is to establish and create another leading brand “idole” of ladies’ garments for the mainland Chinese market. In December, 2020, Yiduo entered into the bankruptcy liquidation process.
| 2 |
As a result of the foregoing acquisitions and transactions, our current corporate structure is illustrated below.
Business Operations
Our wholesale operations include a complete set of services of supply chain management and worldwide sale of apparel to well-known domestic and international casual wear, sportswear and outerwear brands and retailers in major markets. We conduct our original design manufacturing (“ODM”) operations through nine wholly owned subsidiaries which are located in the Nanjing Jiangning Economic and Technological Development Zone and Shang Fang Town in the Jiangning District in Nanjing, Jiangsu province, China, and Chuzhou, Anhui province, China, which are Ever-Glory International Group Apparel Inc. (“Ever-Glory Apparel”), Goldenway Nanjing Garments Company Limited (“Goldenway”), Nanjing New-Tailun Garments Company Limited (“New Tailun”), Nanjing Catch-Luck Garments Co., Ltd. (“Catch-Luck”), Haian Tai Xin Garments Trading Company Limited (“Haian Tai Xin”), Nanjing Rui Lian Technology Company Limited (“Nanjing Rui Lian”), and ChuzhouHuirui Garments Co., Ltd. (“Huirui”). We have one wholly owned subsidiary registered in Samoa: Ever-Glory International Group (HK) Ltd. (“Ever-Glory HK”). We also have one wholly owned subsidiary registered in Hongkong: Ever-Glory Supply Chain Service Co., Limited (“Ever-Glory Supply”). In our fiscal year ended December 31, 2020, our wholesale segment achieved total sales of $117.2 million.
| 3 |
Although we have our own manufacturing capacity, we currently outsource most of the manufacturing to our strategic long-term contractors as part of our overall business strategy. Outsourcing allows us to maximize our production capacity and remain flexible while reducing capital expenditures and the costs of keeping skilled workers on production lines during times of seasonally lower sales. We inspect products manufactured by our long-term contractors to ensure that they meet our high-quality control standards. Total unit output from our manufacturing facilities and outsourced partners is more than 7.6 million pieces in 2020. See Production and Quality Control below.
Our retail business objective is to establish and develop leading brands of women’s wear and to build a nationwide retail distribution channel in China. We conduct our retail operations through Shanghai LA GO GO Fashion Company Limited (“Shanghai LA GO GO”), Jiangsu LA GO GO Fashion Company Limited (“Jiangsu LA GO GO”), Tianjin LA GO GO Fashion Company Limited (“Tianjin LA GO GO”), Shanghai Ya Lan Fashion Company Limited (“Ya Lan”), Xizang He Meida Trading Company Limited (“He Meida”), Shanghai Yiduo Fashion Company Limited (“Yiduo”) and Nanjing Tai Xin Garments Trading Company Limited (“Tai Xin”). The Company deconsolidated Yiduo due to its bankruptcy in December 2020. Fortunately, the Company retained Yiduo developed brand “idole” as the brand was transferred to La Go Go long before Yiduo’s bankruptcy.As of December 31, 2020, we had approximately 3,932 retail employees and operated 936 retail stores in China. We achieved total retail sales of $150.1 million in the fiscal year of 2020.
Wholesale Segment
Products
We manufacture a broad array of products in various categories for the women’s, men’s and children’s apparel markets. Within those categories, various product classifications including high and middle grade casualwear, sportswear and outwear, including the following product lines:
| Women’s Clothing: | coats, jackets, slacks, skirts, shirts, trousers, and jeans |
| Men’s Clothing: | vests, jackets, trousers, skiwear, shirts, coats, and jeans |
| Children’s Clothing: | coats, vests, down jackets, trousers, knitwear, and jeans |
Customers
We manufacture garments for a number of well-known retail chains and famous domestic and international brands. We also have our own in-house design capabilities and can provide our customers with a selection of original designs that the customer may have manufactured-to-order. We normally supply our customers through purchase orders and we have no long-term supply contracts with any of them.
| 4 |
In the fiscal year ended December 31, 2020, approximately 41.7% of our sales revenue came from customers in China, 0.4% of our sales revenue came from customers in Germany, 24.1% of our wholesales revenue came from customers in United Kingdom and other European countries, 24.0% from customers in the United States, and 9.7% from customers in Japan. In 2020, sales to our five largest customers generated approximately 38.7% of our total wholesale sales and there is no customer represented more than 10% of our total wholesale sales. In 2019, sales to our five largest customers generated approximately 47.3% of our total wholesale sales and one customer represented more than 10% of our total wholesale sales.
Substantially all of our long-lived assets were located in the PRC as of December 31, 2020 and 2019.
Suppliers
We purchase the majority of our raw materials (including fabric, fasteners, thread, buttons, labels and related materials) directly from numerous local fabric and accessories suppliers in China. For our wholesale business, collectively, purchases from our five largest suppliers represented approximately 18.2% and 14.5% of total raw material purchases in 2020 and 2019, respectively. No single supplier provided more than 10% of our total purchases.
We also purchased finished goods from contract manufacturers. For our wholesale business, collectively, purchases from our five largest contract manufacturers represented approximately 45.1% and 41.4% of total finished goods purchases in 2020 and 2019, respectively. Two contract manufacturers provided approximately 12.6% and 11.2% of our total finished goods purchases in 2020. Two contract manufacturers provided approximately 10.4% and 10.2% of our total finished goods purchases in 2019.
For our wholesale business, we generally agree to pay our suppliers within 30 to 90 days after our receipt of goods. We typically place orders for materials from suppliers when we receive orders from our customers. On average, the materials will generally be consumed by production in approximately 20 days.
Sales and Marketing
We have set up our own merchandising department to interface with our customers. We believe we have developed good and stable business relationships with our main customers in Europe, the U.S., Japan and China. Our sales staff typically works directly with our customers and arranges the terms of the contracts with them.
Our management believes that we continue to benefit from our solid reputation for providing high quality goods and professional service in the markets where we have a presence, which provides us further opportunities to work with desirable customers. Our marketing strategy aims to attract customers with outstanding brands from top markets. We seek to attract customers mainly from Europe, the U.S., Japan, and China. In addition, we look for customers with strong brand recognition and product lines that require high quality manufacturing and generate sufficient sales volume to support our sizeable production capacity. Referrals from existing customers have been and will continue to be a fruitful source of new customers. In addition, we aim to maintain an active presence in trade shows around the world, including those in Europe, the U.S., Japan, and China.
Production and Quality Control
In 2020, approximately 6.8% of the products we sold to wholesale customers were in our own manufacturing facilities. We typically outsource the manufacturing of a large portion of our products based upon factory capacity and customer demand. The number of outside contract manufacturers to which we outsource is expected to increase in order to meet the anticipated growth in demand from our customers.
As of December 31, 2020, our total production capacity, including outsourced production, reached 7.6 million pieces per year. As of December 31, 2019, our total production capacity, including outsourced production, reached 13.3 million pieces per year. At present, we believe our production capacity is sufficient to meet customer demand.
We are committed to designing and manufacturing high quality garments. We place the highest standard on quality control because we emphasize the high quality of our products. We have implemented strict quality control and craft discipline systems. Before we manufacture large quantities, we obtain the approval from our customers either through in-person visits to the factories or by shipping samples of our products to our customers for testing, inspection and feedback. This ensures that our products perfectly meet specifications prior to production. In addition, our trained professional quality control personnel periodically inspect the manufacturing process and quality of our apparel products. Our factory is ISO 9001:2000 certified. ISO 9000 is a family of standards for quality management systems maintained by ISO, International Organization for Standardization, and is administered by accreditation and certification bodies. We have been independently audited and certified to be in conformance with ISO 9001 which certifies that formalized business processes are being applied.
| 5 |
Due to our strict quality control and testing process, we have not undergone any significant product or merchandise recalls, and we generally do not receive any significant requests by our customers to return finished goods. Product returns are not a material factor in our business.
We anticipate continuing outsourcing a large portion of our production. Management believes that outsourcing allows us to maximize our production flexibility while reducing significant capital expenditure and the costs associated with managing a large production workforce. We contract for the production of a portion of our products through various outside independent manufacturers. Quality control reviews are done by our employees during and after production before the garments leave the outsourcing factories to ensure that material and component qualities and the products “fits” are in accordance with our specifications. We inspect prototypes of each product prior to cutting by the contractors and conduct a final inspection of finished products prior to shipment to ensure that they meet our high standards.
Delivery and Transportation
We generally do not hold any significant inventory of finished goods for more than ninety days, as we typically ship finished goods to our customers upon completion.
Competition
The garment manufacturing industry is highly competitive, particularly in China. Our competitors include garment manufacturers of all sizes, both within China and elsewhere in the world, many of which have greater financial and manufacturing resources than us. We have been in the garment manufacturing business since 1993 and believe that we have earned a reputation of producing high quality products with high efficiency, competitive prices, and excellent customer service. We believe we provide one-stop total solutions and more valuable products for our customers.
Currently, we have several small-to-large sized competitors in China including some state-owned trading groups and private garment companies. We believe we differentiate ourselves from the competition and will be able to effectively compete with our competitors due to our persistent pursuit of quality control, a diversified casual wear product lineup, and in-house design talent. In addition, we believe we derive advantages from our customer feedback in the supply chain and the use of our advanced Enterprise Resource Planning (“ERP”) system. Our ERP system integrates many of our operational processes into one system including order processing, statistical analysis, purchasing, manufacturing, logistics and financial control systems, providing management with instantaneous feedback on important aspects of our business operations.
Governmental Regulations/Quotas
In 2020, we were not subject to any export quota imposed by countries where our customers are located. Nevertheless, we have noticed that many European countries tightened their chemical inspection requirements after the removal of quotas. In addition, there can be no assurance that additional trade restrictions will not be imposed on the export of our products in the future. Such actions could result in increases in the cost of our products generally and may adversely affect our operating results. On a longer-term basis, we believe that our customer mix and our ability to adjust the types of apparel we manufacture will mitigate our exposure to such trade restrictions in the future.
We are also required to comply with Chinese laws and regulations that apply to some of the products we produce for shipment to the countries to which we export. In order to address these Chinese compliance issues, we have established an advanced fabric testing center to ensure that our products meet certain quality and safety standards in the U.S. and EU. In addition, we work closely with our customers so that they understand our testing and inspection process.
| 6 |
Seasonality
Our business is affected by seasonal trends, with higher levels of wholesale sales in our third and fourth quarters and higher retail sales in our first and fourth quarters. These trends result primarily from the timing of seasonal demand and shipments in our wholesale business and holiday periods in China where our retail business operates.
Retail Segment
As of December 31, 2020, we had 936 retail stores in China selling our own brand clothing. We believe our advantages in the retail segments include our ability to promptly respond to market trends, our quick turn-around in design and production, and appropriate pricing. In 2020, we achieved total net sales of approximately US$150.1 million for our retail business. We operate most of our retail stores in so-called Tier-2 or Tier-3 cities in China, such as Zhengzhou in Henan province, Taizhou in Jiangsu province, etc. We also have penetrated Tier-1 cities, such as Beijing and Shanghai.
Suppliers
We purchase the majority of our raw materials (including fabric, fasteners, thread, buttons, labels and related materials) directly from numerous local fabric and accessories suppliers. For our retail business, collectively, purchases from our five largest suppliers represented approximately 97.1% of total purchases in 2020. There were five suppliers which provided more than 10% of our total raw materials purchases in 2019. We have not experienced difficulty in obtaining raw materials that are essential to our business.
We also purchase finished goods from contract manufacturers. For our retail business, collectively, our five largest contract manufacturers represented approximately 13.4% of total finished goods purchases in 2020. There was no one contract manufacturer which provided more than 10% of our total finished goods purchases in 2019. We have not experienced difficulty in obtaining finished products from our contract manufacturers.
For our retail business, we generally agree to pay our suppliers within 30-180 days after the receipt of goods. We typically place orders for materials from suppliers when the style has been confirmed by our chief designer. On average, the supplies we hold in stock will generally be consumed in production in approximately 20 days.
Customers
We currently have four retail brands. “Sea to Sky” focuses on females between the ages of 18 to 25. “La Go Go” seeks to appeal to fashionable urban females between the ages of 23 to 28. “Velwin” targets females between the ages of 28 to 33 while “idole” targets females between the ages of 28 to 35. Our products are priced at a middle-to-high level in order to appeal to our targeted customers.
Design and Production
We have our own design, production, and quality control departments. Our retail brands release new designs twice a year, during October for the spring/summer season and May for the autumn/winter season. Our design team produces approximately 5,000 designs each year. Each of our retail brands hosts its own order-placing fair twice each year to determine the new products to be released for the spring/summer and autumn/winter season based on the orders placed by all the regional sales managers at such order-placing fair; our chief designer then decides the designs to be manufactured. The production department will then produce samples for the designer’s approval. Our quality control department checks the quality of the final products by follow-up inspection. The final products will be shipped to the logistics and distribution centers for sale.
Sales and Marketing
Products of our retail brands are sold in flagship stores, stores-within-a-store and e-commerce platforms. The sales department is responsible for developing new sales channels. According to our new store opening plan, the ratio of flagship stores and stores-within-a-store are carefully balanced. The store-within-a-store enters into contracts with department stores. The flagship stores are carefully chosen at prominent locations and have lease agreements with each property owner. Under our return and exchange policy, products may be returned or exchanged for any reason within 15 days. During 2020, the return and exchange rate was very low and was not a material factor in our operations.
| 7 |
Store Operation
As of December 31, 2020, we had 936 stores, including 124 flagship stores, with each store generating average revenue of approximately $13,368 per month. The majority of our retail stores are situated as stores-within-a-store in large, mid-tier department stores located in over 20 provinces in China.
Trademarks
We regard our trademarks as an important part of our business due to the name recognition of our customers. We obtained trademark registration at the China Trademark Office for the mark “La Go Go” in class 25 and class 18 in 2010. We obtained trademark registration at the China Trademark Office for the marks “Sea to Sky”, “Velwin” and “Idole” separately in 2012, 2014 and 2015. As of December 31, 2020, we were not aware of any valid claim or challenges to our right to use our registered trademark or any counterfeit or other infringement to our registered trademark.
Information Technology
We recognize the importance of high-quality information management systems in the retail operation. As a result, we use Management Systems to monitor and manage the merchandise planning, inventory and sales information.
Research and Development
We have invested in the research and development of high-tech fabrics.
Our Growth Strategy
Our strategy to grow and expand our business includes the following:
Supply chain management:
| ● | Expand the global sourcing network | |
| ● | Explore the overseas low-cost manufacturing base | |
| ● | Focus on high value-added products and continue our strategy to produce mid-to-high end apparel | |
| ● | Continue to emphasize on product design and technology application | |
| ● | Seek strategic acquisitions of international distributors that could enhance global sales and distribution network | |
| ● | Maintain stable revenue growth in the export markets while shifting focus to higher margin wholesale markets such as mainland China. |
Retail business development:
| ● | Build our brands to be recognized as major players in the mid-to-high women’s apparel market in China; | |
| ● | Expand the retail network throughout China | |
| ● | Improve the retail stores’ efficiency and increase same-store sales | |
| ● | Continue to launch flagship stores in Tier-1 cities and increase penetration and coverage in Tier-2 and Tier-3 cities | |
| ● | Take advantage of our position as a multi-brand operator |
| 8 |
Employees
As of December 31, 2020, we had over 4,700 employees. None of our employees belong to a labor union. We have never experienced a labor strike or work stoppage. We are in full compliance with the Chinese labor laws and regulations and are committed to providing safe and comfortable working conditions and accommodations for our employees.
Labor Costs
The manufacture of garments is a labor-intensive business. Although much of our production process is automated and mechanized, we rely on skilled labor to make our products. During the year ended December 31, 2020, our labor cost increased due to the shortage of skilled workers and rising labor cost in China.
Working Conditions and Employee Benefits
We consider our social responsibilities to our workers to be an important objective, and we are committed to providing a safe, clean, comfortable working environment and accommodations. Our employees are also entitled to paid holidays and vacations. In addition, we frequently monitor our third-party manufacturers’ working conditions to ensure their compliance with related labor laws and regulations. We are in full compliance with our obligations to contribute a certain percentage of our employees’ salaries to social insurance funds, as mandated by the PRC government. We expect the amount of contribution to the government’s social insurance funds to increase in the future as we expand our workforce and operations.
Compliance with Environmental Laws
Based on the present nature of our operations, we do not believe that environmental laws and the cost of compliance with those laws have or will have a material impact on our operations.
Description of Property
In 2020, we operated four facilities on certain land in the Nanjing Jiangning Economic and Technological Development Zone and Huifeng Road, which are located in Nanjing and Chuzhou, China. For further details concerning our property, see Item 2 of this report regarding Properties.
Taxation
Most of our operating subsidiaries, except Ever-Glory HK, are incorporated in the PRC and therefore are governed by PRC income tax laws and are subject to the PRC enterprise income tax. Each of our consolidated entities files its own separate tax return, and we do not file a consolidated tax return.
Goldenway was incorporated in the PRC and is subject to PRC income tax laws and regulations. Goldenway’s income tax rate is 25%.
New-Tailun, Haian Tai Xin, Nanjing Rui Lian and Catch-Luck were incorporated in the PRC and are subject to PRC income tax laws and regulations. Their income tax rate is 25%.
Shanghai LA GO GO was established on January 24, 2008, and its income tax rate is 25%.
Jiangsu LA GO GO was established on November 20, 2013, and its income tax rate is 25%.
Tianjin LA GO GO was established on April 29, 2014, and its income tax rate is 25%.
| 9 |
Shanghai YA LAN was established on January 24, 2014, and its income tax rate is 25%.
Shanghai Yiduo was acquired on March 31, 2015, and its income tax rate is 25%.
Huirui was acquired on July 24, 2014, and its income tax rate is 25%.
Ever-Glory Apparel was established on January 6, 2010, and its income tax rate is 25%.
He Meida was established on March 19, 2014. The local government has implemented an income tax reduction from 15% to 9% valid through December 31, 2019.
Tai Xin was established on March 19, 2012, its income tax rate is 25%.
Perfect Dream was incorporated in British Virgin Islands on July 1, 2004 and has no liabilities for income tax.
Ever-Glory HK was incorporated in Samoa on September 15, 2009 and does not have any income tax obligation.
Ever-Glory Supply Chain Service Co., Limited was incorporated in Hongkong on December 27, 2017. Under the current laws of Hongkong, its income tax rate is 8.25% when its profit is under HKD 2.0 million and its income tax rate is 16.5% when its profit is over HKD 2.0 million.
All of our income tax expenses are related to our operations in China.
On April 4, 2018, the Ministry of Finance and the State Administration of Taxation issued the Notice on Adjustment of VAT Rates, which came into effect on May 1, 2018. According to the abovementioned notice, the taxable goods previously subject to VAT rates of 17% respectively become subject to lower VAT rates of 16% starting from May 1, 2018. According to the 2019 government work report, the VAT rates of 16% will be reduced to 13%. Tax rate changes have little effect on the company.
You should carefully consider the risks described below together with all of the other information included in this Annual Report before making an investment decision with regard to our securities. The statements contained in or incorporated into this Annual Report that are not historic facts are forward-looking statements that are subject to risks and uncertainties that could cause actual results to differ materially from those set forth in or implied by forward-looking statements. If any of the following events described in these risk factors actually occurs, our business, financial condition or results of operations could be harmed. In that case, the trading price of our common stock could decline, and you may lose all or part of your investment.
Risks Relating to Our Industry
Our sales are influenced by general economic cycles. A prolonged period of depressed consumer spending would have a material adverse effect on our profitability.
Apparel is a cyclical industry that is dependent upon the overall level of consumer spending. Purchase of apparel generally declines during recessionary periods when disposable income is low. Our customers anticipate and respond to adverse changes in economic conditions and uncertainty by reducing inventories and canceling orders. As a result, any substantial deterioration in general economic conditions, increases in energy costs or interest rates, acts of war, acts of nature or terrorist or political events that diminish consumer spending and confidence in any of the regions in which we compete, could reduce our sales and adversely affect our business and financial condition. We currently sell to customers in the U.S., the EU and Japan. Accordingly, economic conditions and consumer spending patterns in these regions could affect our sales, and an economic downturn in one or more of these regions could have an adverse effect on our business.
| 10 |
Intense competition in the worldwide apparel industry could reduce our sales and prices.
We face a variety of competitive challenges from other apparel manufacturers both in China and other countries. Some of these competitors have greater financial and marketing resources than we do and may be able to adapt to changes in consumer preferences or retail requirements more quickly, devote greater resources to the marketing and sale of their products or adopt more aggressive pricing policies than we can. As a result, we may not be able to compete with them if we cannot continue enhancing our marketing and management strategies, quality and value or responding appropriately to consumer’s needs.
Our ability to increase our revenues and profits depends upon our ability to offer innovative and upgraded products at attractive price points.
The worldwide apparel industry is characterized by constant product innovation due to changing consumer preferences and by the rapid replication of new products by competitors. As a result, our growth depends in large part on our ability to continuously and rapidly respond to customer requirements for innovative and stylish products at a competitive pace, intensity, and price. Failure on our part to regularly and rapidly respond to customer requirements could adversely affect our ability to retain our existing customers or to acquire new customers which would limit our sales growth.
The worldwide apparel industry is subject to ongoing pricing pressure.
The apparel market is characterized by low barriers to entry for both suppliers and marketers, global sourcing through suppliers located throughout the world, trade liberalization, continuing movement of product sourcing to lower cost countries, ongoing emergence of new competitors with widely varying strategies and resources, and an increasing focus on apparel in the mass merchant channel of distribution. These factors contribute to ongoing pricing pressure throughout the supply chain. This pressure has and may continue to:
| ● | require us to reduce wholesale prices on existing products; | |
| ● | result in reduced gross margins across our product lines; | |
| ● | increase pressure on us to further reduce our production costs and our operating expenses. |
Any of these factors could adversely affect our business and financial condition.
Fluctuations in the price, availability and quality of raw materials could increase our cost of goods and decrease our profitability.
We purchase raw materials directly from local fabric and accessory suppliers. We may also import specialty fabrics to meet specific customer requirements. We also purchase finished goods from other contract manufacturers. The prices we charge for our products are dependent in part on the market price for raw materials used to produce them. The price, availability and quality of our raw materials may fluctuate substantially, depending on a variety of factors, including demand, crop yields, weather patterns, supply conditions, transportation costs, government regulation, economic climates, and other unpredictable factors. Any raw material price increases could increase our cost of goods and decrease our profitability unless we are able to pass higher prices on to our customers.
For the wholesale business, we did not rely on any supplier for more than 10% of all our total raw material purchases in 2020 and 2019. We relied on two manufacturers for 12.6% and 11.2% of purchased finished goods in 2020, and two manufacturers for 10.4% and 10.2% of purchased finished goods in 2019. For the retail business, we did not rely on any one manufacturer for more than 10% of all of our total purchased finished goods during 2020 and 2019. We do not have any long-term written agreements with any of these suppliers and do not anticipate entering into any such agreements in the near future. However, we always execute a written agreement for each order placed with our suppliers. We do not believe that loss of any of these suppliers would have a material adverse effect on our ability to obtain finished goods or raw materials essential to our business because we believe we can locate other suppliers in a timely manner.
| 11 |
Risks Relating to Our Business
Our wholesale business depends on some key customers for a significant portion of our sales. A significant adverse change in a customer relationship or in a customer’s performance or financial position could harm our business and financial condition.
For the year ended December 31, 2020, our five largest customers represented approximately 38.7% of our total net sales. For the year ended December 31, 2019, our five largest customers represented approximately 47.3% of our total net sales. The garment manufacturing industry has experienced substantial consolidation in recent years, which has resulted in increased customer leverage over suppliers, greater exposure for suppliers to credit risk and an increased emphasis by customers on inventory management and productivity.
A decision by a major customer, whether motivated by competitive considerations, strategic shifts, financial requirements or difficulties, economic conditions or otherwise, to decrease its purchases from us or to change its manner of doing business with us, could adversely affect our business and financial condition. In addition, while we have long-standing customer relationships, we do not have long-term contracts with any of our customers.
As a result, purchases generally occur on an order-by-order basis, and the relationship, as well as particular orders, can generally be terminated by either party at any time. We do not believe that there is any material risk of loss of any of these customers during the next 12 months. We also believe that the unexpected loss of these customers could have material adverse effect on our earnings or financial condition. While we believe that we could replace these customers within 12 months, the loss of which will not have material adverse effect on our financial condition in the long term. None of our affiliates are officers, directors, or material shareholders of any of these customers.
Our business relies heavily on our ability to identify changes in fashion trends.
Our results of operations depend in part on our ability to effectively predict and respond to changing fashion tastes by offering appropriate products. Failure to effectively follow the changing fashion trend will lead to higher seasonal inventory levels. Our continuous ability to respond to the changing customer demands constitutes a material risk to the growth of our retail business. For our wholesale business, if we are unable to swiftly respond to the changing fashion trend, the sample we designed for our customers may not be accepted or the products based on our design may be put into inventory, and thus have a negative impact on the number of orders the customers may place with us.
Our ability to attract customers to the stores heavily depends on their location.
Our flagship stores and the store-within-a-stores are selectively located in what we believe to be prominent locations or popular department stores to generate customer traffic. The availability and/or cost of appropriate locations for the existing or future stores may fluctuate for reasons beyond our control. If we are unable to secure these locations or to renew store leases on acceptable terms, we may not continue to attract customers, which will have a material adverse effect on our sales and results of operations.
We may be unable to expand our retail business by opening profitable new stores.
Our future growth in our retail segment requires our continuous increase of new flagship stores and stores-within-a-store in selected cities, improve our operating capabilities, and retaining and hiring qualified sales personnel in these stores. There can be no assurance that we will be able to achieve our store expansion goals, nor any assurance that our newly opened stores will achieve revenue or profitability levels comparable to those of our existing stores. If our stores fail to achieve acceptable revenue, we may incur significant costs associated with closing those stores.
There may be conflicts of interest between Mr. Kang’s role as the Chairman of the Board and CEO of our Company and his role as the majority owner of other entities that we do business with.
Jiangsu Ever-Glory is an entity engaged in importing/exporting, apparel-manufacture, real-estate development, car sales and other activities. Jiangsu Ever-Glory is controlled by Mr. Kang.
| 12 |
The Company and Jiangsu Ever-Glory sometimes purchase raw materials for each other in order to obtain cheaper prices. The Company purchased raw materials on Jiangsu Ever-Glory’s behalf and sold to Jiangsu Ever-Glory at cost for $0.9 million and $2.0 million during 2020 and 2019, respectively. Jiangsu Ever-Glory purchased raw materials on the Company’s behalf and sold to the Company at cost for $1.5 million and $2.0 million during 2020 and 2019, respectively.
In March 2012, in consideration of the guarantees and collateral provided by Jiangsu Ever-Glory and Nanjing Knitting, the Company agreed to provide Jiangsu Ever-Glory a counter guarantee in the form of cash of not less than 70% of the maximum aggregate lines of credit obtained by the Company. Jiangsu Ever-Glory is obligated to return the full amount of the counter-guarantee funds provided upon the expiration or termination of the underlying lines of credit and is to pay an annual interest at the rate of 6.0% of the amounts provided. As of December 31, 2020 and 2019, Jiangsu Ever-Glory had provided guarantees for approximately $36.0 million (RMB 235.0 million) and $33.0 million (RMB 230.0 million) of lines of credit obtained by the Company, respectively. Jiangsu Ever-Glory and Nanjing Knitting have also provided their assets as collateral for certain of these lines of credit. As of December 31, 2020 and 2019, the value of the collateral, as per appraisals obtained by the banks in connection with these lines of credit is approximately $31.5 million (RMB 205.5 million) and $29.9 million (RMB 205.5 million), respectively. Mr. Kang has also provided a personal guarantee for $14.8 million (RMB 96.3 million) and $14.5 million (RMB 100.0 million) at the years ended of December 31, 2020 and 2019, respectively.
As of December 31, 2019, $4.7 million (RMB 32.8 million) was outstanding due from Jiangsu Ever-Glory under the counter guarantee agreement. During the year ended December 31, 2020, an additional $7.7 million (RMB 52.8 million) was provided to and repayment of $9.5 million (RMB 65.6 million) was received from Jiangsu Ever-Glory under the counter-guarantee agreement. As of December 31, 2020, the amount of the counter-guarantee had decreased to $3.1 million (RMB 20.0 million) (the difference represents currency exchange adjustment of $0.1 million), which was 8.5% of the aggregate amount of lines of credit. This amount plus accrued interest of $0.04 million (2020) and $0.3 million (2019) have been classified as a reduction of equity, consistent with the guidance of SEC Staff Accounting Bulletins 4E and 4G. As of December 31, 2020 and 2019, the amount classified as a reduction of equity was $3.4 million and $4.9 million, respectively. Interest of 0.5% is charged on net amounts due from Jiangsu Ever-Glory at each month end. Since January 1, 2019, the interest rate has changed to 0.3625% as the bank benchmark interest rate decreased. Interest income for the years ended December 31, 2020 and 2019 was approximately $0.04 million and $0.3 million, respectively.
It is possible that the terms of the export and import agency transactions and the counter guarantee may not be the same as those that would result from transactions between unrelated parties. Despite of Mr. Kang’s fiduciary duty to us as the CEO and a director, in the event of any conflicts of interests between us and Jiangsu Ever-Glory, he may not act in our best interests and such conflicts of interests may not be resolved in our favor. These conflicts may result in management decisions that could negatively affect our operations.
For a further discussion of these related party transactions, see Notes 12 Related party transactions in the footnotes to the consolidated financial statements and Item 13. Certain Relationships and Related Transactions, and Director Independence
In case Jiangsu Ever-Glory fails to repay the fund we provided to it under the Counter Guarantee Agreement according to its terms, we will suffer significant financial losses.
Despite of management’s belief that Jiangsu Ever-Glory is financially capable of repaying all amount we provided under the counter guarantee and Jiangsu Ever-Glory’s repayment certain portion of the fund by the end of first quarter of 2021, it is possible that we would not be able to collect all amount from Jiangsu Ever-Glory due to factors beyond our control. There is no restriction on how Jiangsu Ever-Glory can use the fund except that it is not allowed to invest in high-risk investments. We were told that Jiangsu Ever-Glory had used the entire amount of the fund we provided under the counter guarantee for its own operations. It is possible that we will not be able to collect the entire amount from Jiangsu Ever-Glory due to reasons beyond its control such as its operational failure or deterioration of the overall economic conditions. In such event, we, as the primary obligor under the lines of credit, would be obligated to repay the entire outstanding borrowing after the banks seek collection from the assets collateralized by Jiangsu Ever-Glory. As a result, we may suffer financial losses which will have material negative effects on our financial condition and results of operations.
| 13 |
Expansion of both our wholesale and retail business depends on our ability to obtain continuous financing at acceptable terms. Failure to do so will result in negative impact on our results of operations.
We have historically relied on debt financing from Chinese banks to satisfy our financing needs. Due to Chinese banks’ stringent underwriting policy to non-state-owned businesses, borrowers generally have to provide properties and land use rights as collaterals or obtain third party guarantees from either high-net-worth individuals or businesses with strong credits with the banks. Although we have certain properties and land use rights to be used as collateral, the value of those properties is not high enough for us to obtain sufficient bank loans to support our projected growth. Therefore, Mr. Kang previously provided personal guarantees and Jiangsu Ever-Glory provided personal guarantees and assets collateral as security interests for the bank loans. In the event Mr. Kang or Jiangsu Ever-Glory refuses to provide sufficient security interests in the future or continue the guarantee and collateral provided in the past, we may not be able to obtain the bank loans on acceptable terms as required by our business plan. As a result, we may have to delay or reduce our retail expansion and limit our wholesale development which may materially harm our business, financial condition, and results of operations.
We depend on key personnel, and our ability to grow and compete will be harmed if we do not retain the continued services of such personnel.
We depend on the efforts and expertise of our management team. The loss of services of one or more members of this team, each of whom have substantial experience in the garment industry, could have an adverse effect on our business. If we are unable to hire and retain qualified management or if any member of our management leaves, such departure could have an adverse effect on our operations. In particular, we believe we have benefited substantially from the leadership and strategic guidance of our CEO and Chairman of the Board, Mr. Edward Yihua Kang.
Our ability to anticipate and effectively respond to changing fashion trends depends in part on our ability to attract and retain key personnel in our design, merchandising and marketing areas. In addition, if we experience material growth, we will need to attract and retain additional qualified personnel. The market for qualified and talented design and marketing personnel in the apparel industry is intensely competitive, and we cannot be sure that we will be able to attract and retain a sufficient number of qualified personnel in future periods. If we are unable to attract or retain qualified personnel as needed, our growth will be hampered and our operating results could be materially adversely affected.
If we fail to protect our trademark and maintain the value of our retail brands, our retail sales are likely to decline.
We intend to vigorously protect our registered trademarks against infringement, but we may be unable to do so. The unauthorized reproduction or other misappropriation of our trademarks would diminish the value of our brands, which could reduce demand for our products or the prices at which we can sell our products. Our ability to grow our retail operation significantly depends on the value and image of the brands. Our brands could be adversely affected if we fail to maintain and promote the brands by marketing efforts.
Failure to maintain and/or upgrade our information technology systems may have an adverse effect on our operation.
We rely on various information technology systems to manage our operations, and we regularly evaluate these systems against our current and expected requirements. Although we have no current plans to implement modifications or upgrades to our systems, we will eventually be required to make changes to legacy systems and acquire new systems with new functionality. We are considering additional investments in updating our ERP system to help us improve our internal control system and to meet compliance requirements under Section 404. We are also continuing to develop and update our internal information systems on a timely basis to meet our business expansion needs. Any information technology system disruptions, if not anticipated and appropriately mitigated, could have an adverse effect on our business and operations.
| 14 |
We may engage in future acquisitions and strategic investments that dilute the ownership percentage of our shareholders and require the use of cash, incur debt or assume contingent liabilities.
As part of our business strategy, we expect to continue to review opportunities to buy or invest in other businesses or technologies that we believe would enhance our manufacturing capabilities, or that may otherwise offer growth opportunities. If we buy or invest in other businesses in the future, this may require the use of cash, or we may incur debt or assume contingent liabilities.
As part of our business strategy, we expect to continue to review opportunities to buy or invest in other businesses or technologies that we believe would complement our current products, expand the breadth of our markets or enhance our technical capabilities, or that may otherwise offer growth opportunities. If we buy or invest in other businesses, products or technologies in the future, we could:
| ● | incur significant unplanned expenses and personnel costs; | |
| ● | issue stock that would dilute our current shareholders’ percentage ownership; | |
| ● | use cash, which may result in a reduction of our liquidity; | |
| ● | incur debt; assume liabilities; and | |
| ● | spend resources on unconsummated transactions. |
We may not realize the anticipated benefits of past or future acquisitions and strategic investments, and integration of acquisitions may disrupt our business and management.
We may in the future acquire or make strategic investments in additional companies. We may not realize the anticipated benefits of these or any other acquisitions or strategic investments, which involve numerous risks, including:
| ● | our inability to integrate the purchased operations, technologies, personnel or products into our existing operations and/or over geographically disparate locations; | |
| ● | unanticipated costs, litigation and other contingent liabilities; | |
| ● | diversion of management’s attention from our core business; | |
| ● | adverse effects on existing business relationships with suppliers and customers; | |
| ● | incurrence of acquisition-related costs or amortization costs for acquired intangible assets that could impact our operating results; | |
| ● | inability to retain key customers, distributors, vendors and other business partners of the acquired business; and | |
| ● | potential loss of our key employees or the key employees of an acquired organization; |
If we are not be able to integrate businesses, products, technologies or personnel that we acquire, or to realize expected benefits of our acquisitions or strategic investments, our business and financial results may be adversely affected.
| 15 |
Changes in international trade policies and international barriers to trade, or the emergence of a trade war, may have an adverse effect on our business and expansion plans.
Political events, international trade disputes, and other business interruptions could harm or disrupt international commerce and the global economy, and could have a material adverse effect on us and our customers, service providers, and other partners. International trade disputes could result in tariffs and other protectionist measures which may materially and adversely affect our business. Tariffs could increase the cost of the goods and products which could affect customers’ spending levels. In addition, political uncertainty surrounding international trade disputes and the potential of the escalation to trade war and global recession could have a negative effect on customer confidence, which could materially and adversely affect our business. We may have also access to fewer business opportunities, and our operations may be negatively impacted as a result. In addition, the current and future actions or escalations by either the United States or China that affect trade relations may cause global economic turmoil and potentially have a negative impact on our markets, our business, or our results of operations, and we cannot provide any assurances as to whether such actions will occur or the form that they may take.
International political instability and concerns about other international crises may increase our cost of doing business and disrupt our business.
International political instability may halt or hinder our ability to do business and may increase our costs. Various events, including the occurrence or threat of terrorist attacks, increased national security measures in the EU, the United States and other countries, and military action and armed conflicts, can suddenly increase international tensions. Increases in energy prices will also impact our costs and could harm our operating results. In addition, concerns about other international crises, such as the global outbreak of COVID-19, spread of avian influenza, or bird flu, and West Nile viruses, may have an adverse effect on the world economy and could adversely affect our business operations or the operations of our OEM partners, contract manufacturer and suppliers. This political instability and concerns about other international crises may, for example:
| ● | negatively affect the reliability and cost of transportation; | |
| ● | negatively affect the desire and ability of our employees and customers to travel; | |
| ● | adversely affect our ability to obtain adequate insurance at reasonable rates; | |
| ● | require us to take extra security precautions for our operations; and | |
| ● | furthermore, to the extent that air or sea transportation is delayed or disrupted, our operations may be disrupted, particularly if shipments of our products are delayed. |
Business interruptions could adversely affect our business.
Our operations and the operations of our suppliers and customers are vulnerable to interruption by fire, earthquake, hurricanes, power loss, telecommunications failure, and other events beyond our control. In the event of a major natural disaster, we could experience business interruptions, destruction of facilities and loss of life. In the event that a material business interruption occurs that affects us or our suppliers or customers, shipments could be delayed, and our business and financial results could be harmed.
| 16 |
The Covid-19 pandemic has adversely affected, and may continue to adversely affect, our results of operations.
The Covid-19 pandemic adversely impacted our business in fiscal year 2020. Among other things, the product manufacturing, logistics and fulfillment of us and certain third-party merchants and brands that cooperated with us were adversely affected due to various travel restrictions and quarantine measures imposed in China. We have implemented preventative measures to protect the health and safety of our employees and made appropriate adjustments to our business operations in response to the pandemic’s impact.
While we have seen gradual recovery of our overall business resulting from improving health statistics in China since March 2020, the pandemic continued to have an adverse effect on our business and results of operations for the past few months and we anticipate the negative impact of the pandemic may continue. As a result, our results of operations for fiscal year 2021 and any period thereof could be worse than our results of operations for fiscal year 2020 and corresponding periods thereof.
The duration and magnitude of the impact from the pandemic on our business will depend on numerous evolving factors that cannot be accurately predicted or assessed, including the duration and scope of the pandemic, the negative impact it has on the Chinese and global economy, its impact on unemployment and consumer confidence, our ability to successfully navigate the impact of the pandemic, as well as actions governments, businesses and individuals take in response to the pandemic.
Unfavorable global economic conditions, including as a result of health and safety concerns, could adversely affect our business, financial condition or results of operations.
Our results of operations could be adversely affected by general conditions in the global economy, including conditions that are outside of our control, such as the impact of health and safety concerns from the outbreak of COVID-19. The outbreak in China has resulted in the reduction of customer traffic and temporary closures of shopping malls as mandated by the provincial governments in various provinces of China from late January to March 2020, which had adversely affected our retail business with a decline in sales since February 2020. Our wholesale business is also significantly affected as we were facing a sharp decline in our order quantities. Some of our wholesale clients cancelled or postponed orders with us. Due to the Chinese factories’ shutdowns and traffic restrictions during the outbreak of COVID-19 in China and potential shutdowns and traffic restrictions in the countries where our suppliers are located, our supply chain and business operations of our suppliers may be affected from time to time. Disruptions from the closure of supplier and manufacturer facilities, interruptions in the supply of raw materials and components, personnel absences, or restrictions on the shipment of our or our suppliers’ or customers’ products, could have adverse ripple effects on our manufacturing output and delivery schedule. We also face difficulties in collecting our accounts receivables due to the effects of COVID-19 on our customers and risk gaining a large amount of bad debt. Global health concerns, such as COVID-19, could also result in social, economic, and labor instability in the countries and localities in which we or our suppliers and customers operate.
Although China has already begun to recover from the outbreak of COVID-19, the epidemic continues to spread on a global scale and there is the risk of the epidemic returning to China in the future, thereby causing further business interruption. While the potential economic impact brought by and the duration of COVID-19 may be difficult to assess or predict, a widespread pandemic could result in significant disruption of global financial markets, reducing our ability to access capital, which could in the future negatively affect our liquidity. In addition, a recession or market correction resulting from the spread of COVID-19 could materially affect our business and the value of our common stock. If our future sales continue to decline significantly, we may risk facing bankruptcy due to our recurring fixed expenses. The extent to which COVID-19 impacts our results will depend on many factors and future developments, including new information about COVID-19 and any new government regulations which may emerge to contain the virus, among others.
| 17 |
Changes to United States tax, tariff and import/export regulations may have a negative effect on global economic conditions, financial markets and our business.
The current political climate has introduced greater uncertainty with respect to trade policies, tariffs and government regulations affecting trade between the U.S. and other countries, especially to trade between U.S. and China. Our products are sold to many countries including the U.S. Major developments in tax policy or trade relations, such as the disallowance of tax deductions for imported products or the imposition of unilateral tariffs on imported products, could have a material adverse effect on our business, results of operations and liquidity.
Risks Related to Doing Business in China
Because our assets are located overseas, shareholders may not receive distributions that they would otherwise be entitled to if we were declared bankrupt or insolvent.
Our assets are, for the most part, located in the PRC. Because our assets are located overseas, our assets may be outside of the jurisdiction of U.S. courts if we are the subject of an insolvency or bankruptcy proceeding. As a result, if we declared bankruptcy or insolvency, our shareholders may not receive the distributions on liquidation that they would otherwise be entitled to if our assets were to be located within the U.S., under U.S. bankruptcy law.
Export quotas imposed by WTO and countries where our customers are located may negatively affect our business and operations, particularly if the Chinese government changes its allocation of such quotas to us.
Pursuant to a World Trade Organization (“WTO”) agreement, effective January 1, 2005, the United States and other WTO member countries agreed to remove quotas applicable to textiles. However, as the removal of quotas resulted in an import surge from China, the U.S. took action in May 2005, and imposed safeguard quotas on seven categories of goods, including certain classes of apparel products, arousing strong objection from China. In 2008, US and EU both lifted these safeguard quotas on products from China. However, there is no assurance that any quota or additional trade restrictions will not be imposed on the exportation of our products in the future. Such actions could result in increases in the cost of our products generally and may adversely affect our results of operations.
Adverse changes in economic and political policies of the PRC government could have a material adverse effect on the overall economic growth of China, which could adversely affect our business.
All of our business operations are currently conducted in the PRC, under the jurisdiction of the PRC government. Accordingly, our results of operations, financial condition and prospects are subject to a significant degree to economic, political and legal developments in China. China’s economy differs from the economies of most developed countries in many respects, including with respect to the amount of government involvement, level of development, growth rate, and control of foreign exchange and allocation of resources. While the PRC economy has experienced significant growth in the past 20 years, growth has been uneven across different regions and among various economic sectors of China. The PRC government has implemented various measures to encourage economic development and guide the allocation of resources. Some of these measures benefit the overall PRC economy, but may also have a negative effect on us. For example, our financial condition and results of operations may be adversely affected by government control over capital investments or changes in tax regulations that are applicable to us. Since early 2004, the PRC government has implemented certain measures to control the pace of economic growth. Such measures may cause a decrease in the level of economic activity in China, which in turn could adversely affect our results of operations and financial condition.
Economic growth in China may increase our costs of doing business, and may negatively impact our profit margins and/or profitability.
Our business depends in part upon the availability of relatively low-cost labor and materials. Rising wages in China may increase our overall costs of production. In addition, rising raw material costs, due to strong demand and greater scarcity, may increase our overall costs of production. If we are not able to pass these costs on to our customers in the form of higher prices, our profit margins and/or profitability could decline.
Increases in labor costs in the PRC may adversely affect our business and results of operations.
The economy in China has experienced increases in inflation and labor costs in recent years. As a result, average wages in the PRC are expected to continue to increase. In addition, we are required by PRC laws and regulations to pay various statutory employee benefits, including pension, housing fund, medical insurance, work-related injury insurance, unemployment insurance and maternity insurance to designated government agencies for the benefit of our employees. The relevant government agencies may examine whether an employer has made adequate payments to the statutory employee benefits, and those employers who fail to make adequate payments may be subject to late payment fees, fines and/or other penalties. We expect that our labor costs, including wages and employee benefits, will continue to increase. Unless we are able to control our labor costs or pass on these increased labor costs to our users by increasing the fees of our services, our financial condition and results of operations may be adversely affected.
| 18 |
Fluctuation in the value of Chinese RMB relative to other currencies may have a material adverse effect on our business and/or an investment in our shares.
The value of RMB against the U.S. Dollar, the Euro and other currencies may fluctuate and is affected by, among other things, changes in political and economic conditions. In the last decade, the RMB has been pegged at RMB 6.9762 to one U.S. Dollar. Following the removal of the peg to the U.S. Dollar and pressure from the United States, the People’s Bank of China also announced that the RMB would be pegged to a basket of foreign currencies, rather than being strictly tied to the U.S. Dollar, and would be allowed to float trade within a narrow 0.3% daily band against this basket of currencies. The PRC government has stated that the basket is dominated by the U.S. Dollar, the Euro, Japanese Yen and South Korean Won, with a smaller proportion made up of the British Pound, Thai Baht, Russian Ruble, Australian Dollar, Canadian Dollar and Singapore Dollar. There can be no assurance that the relationship between the RMB and these currencies will remain stable over time, especially in light of the significant political pressure on the Chinese government to permit the free flotation of the RMB, which could result in greater and more frequent fluctuations in the exchange rate between the RMB, the U.S. Dollar, and the Euro. If the RMB were to increase in value against the U.S. Dollar and other currencies, for example, consumers in the U.S., Japan and Europe would experience an increase in the relative prices of goods and services produced by us, which might translate into a decrease in sales. In addition, if the RMB were to decline in value against these other currencies, the financial value of your investment in our shares would also decline.
The State Administration of Foreign Exchange (“SAFE”) restrictions on currency exchange may limit our ability to receive and use our sales revenue effectively and to pay dividends.
All of our sales revenue and expenses are denominated in RMB. Under PRC law, the RMB is currently convertible under the “current account”, which includes dividends and trade and service-related foreign exchange transactions, but not under the “capital account”, which includes the registered capital and foreign currency loans of a PRC entity. Currently, our PRC operating subsidiaries may purchase foreign currencies for settlement of current account transactions, including payments of dividends to us, without the approval of SAFE, by complying with certain procedural requirements. However, the relevant PRC government authorities may limit or eliminate our ability to purchase foreign currencies in the future. Since a significant amount of our future revenue will be denominated in RMB, any existing and future restrictions on currency exchange may limit our ability to utilize revenue generated in RMB to fund our business activities outside China that are denominated in foreign currencies.
Foreign exchange transactions by PRC operating subsidiaries under the capital account continue to be subject to significant foreign exchange controls and require the approval of or need to register with PRC government authorities, including SAFE. In particular, if our PRC operating subsidiaries desire to borrow foreign currency through loans from us or other foreign lenders, these loans must be registered with SAFE, and if we finance our PRC operating subsidiaries by means of additional capital contributions, these capital contributions must be approved by certain government authorities, including the Ministry of Commerce, or their respective local counterparts. These limitations could affect our PRC operating subsidiaries’ ability to obtain foreign exchange through debt or equity financing.
| 19 |
The PRC government also may at its discretion restrict access in the future to foreign currencies for current account transactions. If the foreign exchange control system prevents us from obtaining foreign currency, we may be unable to pay dividends or meet obligations that may be incurred in the future that require payment in foreign currency.
You may face difficulties in protecting your interests, and your ability to protect your rights through the U.S. federal courts may be limited, because our subsidiaries are incorporated in non-U.S. jurisdictions, we conduct substantially all of our operations in China, and a majority of our officers reside outside the United States.
Although we are incorporated in Florida, we conduct substantially all of our operations in China through our wholly owned subsidiaries in China. The majority of our officers reside outside the United States and some or all of the assets of those persons are located outside of the United States. As a result, it may be difficult or impossible for you to bring an action against us or against these individuals in China in the event that you believe that your rights have been infringed under the securities laws or otherwise. Even if you are successful in bringing an action of this kind, the laws of the PRC may render you unable to enforce a judgment against our assets or the assets of our directors and officers.
As a result of all of the above, our public shareholders may have more difficulty in protecting their interests through actions against our management, directors or major shareholders than would shareholders of a corporation doing business entirely within the United States.
We must comply with the Foreign Corrupt Practices Act.
We are required to comply with the United States Foreign Corrupt Practices Act, which prohibits U.S. companies from engaging in bribery or other prohibited payments to foreign officials for the purpose of obtaining or retaining business. Foreign companies, including some of our competitors, are not subject to these prohibitions. Corruption, extortion, bribery, pay-offs, theft and other fraudulent practices occur from time-to-time in mainland China. If our competitors engage in these practices, they may receive preferential treatment from personnel of some companies, giving our competitors an advantage in securing business or from government officials who might give them priority in obtaining new licenses, which would put us at a disadvantage. Although we inform our personnel that such practices are illegal, we cannot assure you that our employees or other agents will not engage in such conduct for which we might be held responsible. If our employees or other agents are found to have engaged in such practices, we could suffer severe penalties.
If we make equity compensation grants to persons who are PRC citizens, they may be required to register with SAFE. We may also face regulatory uncertainties that could restrict our ability to adopt equity compensation plans for our directors and employees and other parties under PRC laws .
On March 28, 2007, SAFE issued the “Operating Procedures for Administration of Domestic Individuals Participating in the Employee Stock Ownership Plan or Stock Option Plan of An Overseas Listed Company, also known as “Circular 78.” It is not clear whether Circular 78 covers all forms of equity compensation plans or only those which provide for the granting of stock options. For any plans which are so covered and are adopted by a non-PRC listed company, such as our company, after March 28, 2007. Circular 78 requires all participants who are PRC citizens to register with and obtain approvals from SAFE prior to their participation in the plan. In addition, Circular 78 also requires PRC citizens to register with SAFE and make the necessary applications and filings if they participated in an overseas listed company’s covered equity compensation plan prior to March 28, 2007. We believe that the registration and approval requirements contemplated in Circular 78 will be burdensome and time consuming.
We currently have a 2014 equity incentive plan that was approved by the Compensation Committee on May 30, 2014. We plan to make numerous equity instrument grants under the plan to our officers, directors and employees, some of whom are PRC citizens and may be required to register with SAFE. If it is determined that any of our equity compensation plans are subject to Circular 78, failure to comply with such provisions may subject us and participants in our equity incentive plan who are PRC citizens to fines and legal sanctions and prevent us from being able to grant equity compensation to our PRC employees. In that case, our ability to compensate our employees and directors through equity compensation would be hindered and our business operations may be adversely affected.
| 20 |
Due to various restrictions under PRC laws on the distribution of dividends by our PRC operating companies, we may not be able to pay dividends to our shareholders.
The Wholly-Foreign Owned Enterprise Law (1986), as amended and the Wholly-Foreign Owned Enterprise Law Implementing Rules (1990), as amended and the Company Law of the PRC (2006) contain the principal regulations governing dividend distributions by wholly foreign owned enterprises. Under these regulations, wholly foreign owned enterprises (“WFOE”) may pay dividends only out of their accumulated profits, if any, determined in accordance with PRC accounting standards and regulations. Additionally, WFOE is required to set aside a certain amount of their accumulated profits each year, if any, to fund certain reserve funds. These reserves are not distributable as cash dividends except in the event of liquidation and cannot be used for working capital purposes.
Furthermore, if our consolidated subsidiaries in China incur debt on their own in the future, the instruments governing the debt may restrict its ability to pay dividends or make other payments. If we or our consolidated subsidiaries are unable to receive all of the revenues from our operations due to these contractual or dividend arrangements, we may be unable to pay dividends on our common stock. In addition, under current PRC law, we must retain a reserve equal to 10 percent of net income after taxes, not to exceed 50 percent of registered capital. Accordingly, this reserve will not be available to be distributed as dividends to our shareholders. We presently do not intend to pay dividends in the foreseeable future. Our management intends to follow a policy of retaining all of our earnings to finance the development and execution of our strategy and the expansion of our business.
We may be deemed a PRC resident enterprise under the Corporate Income Tax Law and be subject to PRC taxation on our worldwide income.
The Corporate Income Tax Law of PRC provides that enterprises established outside of China whose “de facto management bodies” are located within China are considered “resident enterprises” and are generally subject to the uniform 25% enterprise income tax rate on their worldwide income (including dividend income received from subsidiaries). Under the Implementing Regulations for the Corporate Income Tax Law, “de facto management body” is defined as a body that has material and overall management and control over the manufacturing and business operations, personnel and human resources, finances and treasury, and acquisition and disposition of properties and other assets of an enterprise. Although substantially all of our operational management is currently based in the PRC, it is unclear whether PRC tax authorities would require (or permit) us to be treated as a PRC-resident enterprise. If we were treated as a resident enterprise for PRC tax purposes, we will be subject to PRC tax on our worldwide income at the 25% uniform tax rate, which could have an impact on our effective tax rate and an adverse effect on our net income and the results of operations, although dividends distributed from our PRC subsidiaries to us could be exempted from Chinese dividend withholding tax, since such income is exempted under the new Corporate Income Tax Law for PRC-resident recipients.
Dividends payable by us to our foreign investors and profits on the sale of our shares may be subject to tax under PRC tax laws.
Under the Implementing Regulations for the Corporate Income Tax Law, PRC income tax at the rate of 10% is applicable to dividends payable to investors that are “non-resident enterprises,” not having an establishment or place of business in the PRC, or which do have such establishment or place of business but the relevant income is not effectively connected with the establishment or place of business, to the extent that such dividends have their sources within the PRC. Similarly, any profits realized through the transfer of shares by such investors are also subject to 10% PRC income tax if such profits are regarded as income derived from sources within the PRC. If we are considered a PRC “resident enterprise,” it is unclear whether dividends we pay with respect to our share, or the profits you may realize from the transfer of our shares, would be treated as income derived from sources within the PRC and be subject to PRC tax. If we are required under the Implementing Regulations for the Corporate Income Tax Law to withhold PRC income tax on dividends payable to our non-PRC investors that are “non-resident enterprises,” or if you are required to pay PRC income tax on the transfer of our shares, the value of your investment in our shares may be materially and adversely affected.
| 21 |
As all of our operations and personnel are in the PRC, we may have difficulty establishing adequate western style management, legal and financial controls.
The PRC historically has been deficient in western style management and financial reporting concepts and practices, as well as in modern banking, and other control systems. We may have difficulty in hiring and retaining a sufficient number of qualified employees to work in the PRC. As a result of these factors, we may experience difficulty in establishing management, legal and financial controls, collecting financial data and preparing financial statements, books of account and corporate records and instituting business practices that meet western standards. We may have difficulty establishing adequate management, legal and financial controls in the PRC. Therefore, we may, in turn, experience difficulties in implementing and maintaining adequate internal controls as required under Section 404 of the Sarbanes-Oxley Act and other applicable laws, rules and regulations. This may result in significant deficiencies or material weaknesses in our internal controls which could impact the reliability of our financial statements and prevent us from complying with SEC rules and regulations and the requirements of the Sarbanes-Oxley Act. Any such deficiencies, weaknesses or lack of compliance could have a materially adverse effect on our business and the public announcement of such deficiencies could adversely impact our stock price.
If we become directly subject to the recent scrutiny, criticism and negative publicity involving U.S.-listed Chinese companies, we may have to expend significant resources to investigate and resolve the matter which could harm our business operations, stock price and reputation and could result in a loss of your investment in our stock, especially if such matter cannot be addressed and resolved favorably.
U.S. public companies that have substantially all of their operations in China have been the subject of intense scrutiny, criticism and negative publicity by investors, financial commentators and regulatory agencies, such as the SEC. Much of the scrutiny, criticism and negative publicity has centered on financial and accounting irregularities and mistakes, a lack of effective internal controls over financial accounting, inadequate corporate governance policies or a lack of adherence thereto and, in many cases, allegations of fraud.
On December 7, 2018, the SEC and the PCAOB issued a joint statement highlighting continued challenges faced by the U.S. regulators in their oversight of financial statement audits of U.S.-listed companies with significant operations in China. On April 21, 2020, SEC Chairman Jay Clayton and PCAOB Chairman William D. Duhnke III, along with other senior SEC staff, released a joint statement highlighting the risks associated with investing in companies based in or have substantial operations in emerging markets including China, reiterating past SEC and PCAOB statements on matters including the difficulty associated with inspecting accounting firms and audit work papers in China and higher risks of fraud in emerging markets and the difficulty of bringing and enforcing SEC, Department of Justice and other U.S. regulatory actions, including in instances of fraud, in emerging markets generally.
On May 18, 2020, Nasdaq filed three proposals with the SEC to (i) apply minimum offering size requirement for companies primarily operating in a “Restrictive Market”, (ii) adopt a new requirement relating to the qualification of management or board of director for Restrictive Market companies, and (iii) apply additional and more stringent criteria to an applicant or listed company based on the qualifications of the company’s auditors.
On May 20, 2020, the U.S. Senate passed the Holding Foreign Companies Accountable Act requiring a foreign company to certify it is not owned or controlled by a foreign government if the PCAOB is unable to audit specified reports because the company uses a foreign auditor not subject to PCAOB inspection. If the PCAOB is unable to inspect the company’s auditors for three consecutive years, the issuer’s securities are prohibited to trade on a national exchange. On December 2, 2020, the U.S. House of Representatives approved the Holding Foreign Companies Accountable Act.
The lack of access to the PCAOB inspection in China prevents the PCAOB from fully evaluating audits and quality control procedures of the auditors based in China. As a result, investors may be deprived of the benefits of such PCAOB inspections. The inability of the PCAOB to conduct inspections of auditors in China makes it more difficult to evaluate the effectiveness of these accounting firms’ audit procedures or quality control procedures as compared to auditors outside of China that are subject to the PCAOB inspections, which could cause existing and potential investors in our stock to lose confidence in our audit procedures and reported financial information and the quality of our financial statements.
As a result of these scrutiny, criticism and negative publicity, the publicly traded stock of many U.S. listed Chinese companies sharply decreased in value and, in some cases, has become virtually worthless. Many of these companies are now subject to shareholder lawsuits and SEC enforcement actions and are conducting internal and external investigations into the allegations. It is not clear what effect this sector-wide scrutiny, criticism and negative publicity will have on us, our business and our share price. If we become the subject of any unfavorable allegations, whether such allegations are proven to be true or untrue, we will have to expend significant resources to investigate such allegations and/or defend our company. This situation will be costly and time consuming and distract our management from developing our growth. If such allegations are not proven to be groundless, we and our business operations will be severely affected and you could sustain a significant decline in the value of our common stock.
The disclosures in our reports and other filings with the SEC and our other public pronouncements are not subject to the scrutiny of any regulatory bodies in the PRC.
We are regulated by the SEC and our reports and other filings with the SEC are subject to SEC review in accordance with the rules and regulations promulgated by the SEC under the Securities Act and the Exchange Act. Our SEC reports and other disclosure and public pronouncements are not subject to the review or scrutiny of any PRC regulatory authority. For example, the disclosure in our SEC reports and other filings are not subject to the review by China Securities Regulatory Commission, a PRC regulator that is tasked with oversight of the capital markets in China. Accordingly, you should review our SEC reports, filings and our other public pronouncements with the understanding that no local regulator has done any review of our company, our SEC reports, other filings or any of our other public pronouncements.
| 22 |
Risks Related to an Investment in Our Securities
Our common stock has limited liquidity.
Our common stock has been trading on the NYSE MKT (formerly, the American Stock Exchange and NYSE Alternext US LLC) since July 16, 2008 and then transferred to the NASDAQ Global Market on December 31, 2014, but it is thinly traded compared to larger more widely known companies in the same industry. Thinly traded common stock can be more volatile than stock trading in an active public market. We cannot predict the extent to which an active public market for our common stock will develop or be sustained. The high and low bid price of Ever-Glory’s common stock during the past 52-week period ended December 31, 2020 has been US$5.25 and US$0.65 per share respectively.
We cannot predict the extent to which an active public market for our common stock will develop or be sustained. Our common shares are currently traded, but currently with low volume, based on quotations on the NASDAQ Global Market, meaning that the number of persons interested in purchasing our common shares at or near bid prices at any given time may be relatively small or non-existent. This situation is attributable to a number of factors, including the fact that we are a small company which is still relatively unknown to stock analysts, stock brokers, institutional investors and others in the investment community that generate or influence trading volume. And even if we came to the attention of such persons, they tend to be risk-averse and would be reluctant to follow an unproven company such as ours or purchase or recommend the purchase of our shares until such time as we became more seasoned and viable. As a consequence, there may be periods of several days or more when trading activity in our shares is minimal or non-existent, as compared to a seasoned issuer which has a large and steady volume of trading activity that will generally support continuous trading without an adverse effect on share price. We cannot give you any assurance that a broader or more active public trading market for our common stock will develop or be sustained, or that trading levels will be sustained.
We expect to experience volatility in our stock price, which could negatively affect shareholders’ investments.
The market price for shares of our common stock may be volatile and may fluctuate based upon a number of factors, including, without limitation, business performance, news announcements or changes in general market conditions.
Other factors, in addition to the risks included in this section, that may have a significant impact on the market price of our common stock include, but are not limited to:
| ● | receipt of substantial orders or order cancellations of products; | |
| ● | the effects of COVID-19; | |
| ● | quality deficiencies in services or products; | |
| ● | international developments, such as technology mandates, political developments or changes in economic policies; | |
| ● | changes in recommendations of securities analysts; | |
| ● | shortfalls in our backlog, sales or earnings in any given period relative to the levels expected by securities analysts or projected by us; | |
| ● | government regulations, including stock option accounting and tax regulations; | |
| ● | energy blackouts; | |
| ● | acts of terrorism and war; | |
| ● | widespread illness; | |
| ● | proprietary rights or product or patent litigation; | |
| ● | strategic transactions, such as acquisitions and divestitures; | |
| ● | rumors or allegations regarding our financial disclosures or practices; or | |
| ● | earthquakes or other natural disasters in Nanjing or Shanghai, China where a significant portion of our operations are based. | |
| 23 |
In the past, securities class action litigation has often been brought against a company following periods of volatility in the market price of its securities. Due to changes in the volatility of our common stock price, we may be the target of securities litigation in the future. Securities litigation could result in substantial costs and divert management’s attention and resources.
To date, we have not paid any cash dividends and no cash dividends will be paid in the foreseeable future.
We do not anticipate paying cash dividends on our common stock in the foreseeable future and we may not have sufficient funds legally available to pay dividends. Even if the funds are legally available for distribution, we may nevertheless decide not to pay any dividends. We presently intend to retain all earnings for our operations.
Our corporate actions are substantially controlled by our principal shareholders and affiliated entities.
Our principal shareholders, which include our officers and directors, and their affiliated entities own approximately 73.1% of our outstanding shares of common stock. These shareholders, acting individually or as a group, could exert substantial influence over matters such as electing directors and approving mergers or other business combination transactions. In addition, because of the percentage of ownership and voting concentration in these principal shareholders and their affiliated entities, elections of our Board of Directors will generally be within the control of these shareholders and their affiliated entities. While all of our shareholders are entitled to vote on matters submitted to our shareholders for approval, the concentration of shares and voting control presently lies with these principal shareholders and their affiliated entities. As such, it would be difficult for shareholders to propose and have approved proposals not supported by management. There can be no assurances that matters voted upon by our officers and directors in their capacity as shareholders will be viewed favorably by all of our shareholders.
The elimination of monetary liability against our directors, officers and employees under Florida law and the existence of indemnification rights to our directors, officers and employees may result in substantial expenditures by our company and may discourage lawsuits against our directors, officers and employees.
Our amended and restated Articles of Incorporation contain a provision permitting us to eliminate the liability of our directors for monetary damages to our company and shareholders to the extent provided by Florida law. We may also have contractual indemnification obligations under our employment agreements with our officers. The foregoing indemnification obligations could result in our company incurring substantial expenditures to cover the cost of settlement or damage awards against directors and officers, which we may be unable to recoup. These provisions and resultant costs may also discourage our company from bringing a lawsuit against directors and officers for breaches of their fiduciary duties and may similarly discourage the filing of derivative litigation by our shareholders against our directors and officers even though such actions, if successful, might otherwise benefit our company and shareholders.
ITEM 1B. UNRESOLVED STAFF COMMENTS
None.
| 24 |
Wholesale segment
In 2020, we operated two complexes as our operating and production facilities at 509 Chengxin Road, in the Nanjing Jiangning Economic, China. The following is a description of these facilities:
(i) Goldenway. Our Goldenway facilities include 112,442 square meters of floor space. Our Goldenway facility hosts administrative, sales and distribution functions in addition to manufacturing. In the PRC, all lands are owned by the PRC government. We obtained the right to use the land on which these facilities are constructed for 50 years. The land use rights are used as security to obtain certain loan from banks in China.
(ii) Catch-Luck. Our Catch-Luck facilities include 6,635 square meters of office and production space. Approximately 280 employees work at this location. Our Catch-Luck facility mainly handles manufacturing. These facilities are located on the piece of land for which we have the 50-year land use right.
In addition, Goldenway currently holds the right to lease certain land and use certain building and improvements on that land until 2020. In December 2020 we leased part of this facility to a non- affiliated third party under a lease with an annual rent of approximately $18,000 pursuant to a one year lease.
We believe that our current facilities will be sufficient to sustain our wholesale operations for the foreseeable future.
Retail Segment
For our retail operations, we have a one year lease arrangement for our administrative offices and a three-year lease for our warehouse. The current flagship stores are generally leased under agreements with real estate developers, department stores or shopping mall operators for terms ranging from 2 to 5 years. The store-within-a-store is counters leased from department stores for which we generally pay approximately 20% of sales revenue as rent. We believe the administrative and warehouse facilities are adequate to sustain our operations for the foreseeable future. We also believe that the locations of the flagship stores and the stores-within-a-store units are carefully selected and suitable for the retail operation.
In November 2011, LA GO GO entered into certain lease agreement with Shahe Village in Shanghai for approximately 10 Mu of land located in Huajiang West Road Shahe Village. The term of the lease is 40 years starting from January 1, 2013. We have built an office building on the land and put in use in 2013. The Construction Cost was included in property and equipment (see financial statement Note 6).
In 2014, the Company obtained a fifty year land use right on 23,333 square meters of land located on Suzhou KunshanJinxi Tower Jinxing Road. We built a logistics center for our retail business on the land which was put in use for our retail business in 2015.
In 2015, the Company obtained a fifty year land use right on 33,427 square meters of land located in Tianjin Wuqing Development Zone. We intend to build a logistics center for our retail business for our retail business.
From time to time, we may become involved in claims, suits, investigations and proceedings arising in the ordinary course of business.
| 25 |
Lawsuit against Shanghai Chijing
In March 2019, Shanghai La Go Go Fashion Company Limited (“LA GO GO”) filed a complaint against Shanghai Chijing Investment Management Co., Ltd. (“Shanghai Chijing”) for unpaid rent of RMB0.27 million ($0.04 million) per month in the Shanghai People’s Court for Jiading District (the “District Court”). The rent arrears began accumulating from April 2018 to the actual payment date. In July 2019, Shanghai Chijing filed counterclaims against LA GO GO to claim RMB10.19 million ($1.45 million) in damages, alleging that LA GO GO had not fulfilled its corresponding obligations as a landlord. As a result, the District Court froze the bank accounts of both Shanghai Chijing and LA GO GO. As of December 31, 2019, a total balance of RMB15.38 million ($2.2 million) was frozen in the bank accounts of LA GO GO. As of December 31, 2019, the Company had booked this restricted cash in other receivables. On March 10, 2020, the District Court entered a judgment in favor of LA GO GO and dismissed most of Shanghai Chijing’s counterclaims. The District Court ordered Shanghai Chijing to pay to LA GO GO an aggregate sum of RMB4.77 million ($0.68 million), which is the accumulated unpaid rent from April 2018 to January 2020. The District Court also ordered LA GO GO to pay Shanghai Chijing RMB1.49 ($0.21 million) for the expenses incurred from remodeling. Both parties were required to pay the monetary damages within ten days after the District Court’s decision. LA GO GO appealed to the Shanghai Second Appellate Court (the “Appellate Court”) to claim more damages, while Shanghai Chijing appealed to reverse the judgment. LA GO GO later requested to withdraw its appeal, which was granted by the Appellate Court. In June 2020, the Appellate Court entered a final decision to dismiss the appeal of Shanghai Chijing and sustained the District Court’s judgment. LA GO GO has not received RMB4.77 million ($0.68 million) in monetary damages from Shanghai Chijing as of September 30, 2020, and has applied for compulsory enforcement with the District Court. The total balance of RMB15.38 million ($2.2 million) in LA GO GO’s bank accounts were unfrozen after the final decision in July 2020.
Lawsuits against Client A
In November 2020, the Company’s two subsidiaries, Ever-Glory International Group Apparel Inc. and Goldenway Nanjing Garments Company Limited filed a complaint against Client A (“Client A”) for unpaid goods worth RMB 70.15 million ($10.75 million) in the Tianjin No.1 Intermediate People’s Court based on processing contracts between the parties. The Company has applied for interim measures with the court and has frozen bank accounts of Client A for a total amount of RMB 68.12 million ($10.44 million). The Company has delivered goods worth RMB 62.06 million ($9.51 million) to Client A pursuant to the processing contracts. The Company also seeks Client A for the payment of the loss incurred from the cost of raw materials paid to suppliers in the amount of RMB 8.09 million ($1.24 million) in reliance on the processing contracts. The Company estimated it is not more-likely-than-not the Company would lose the lawsuits.
Liquidation proceeding of Yiduo
On September 21, 2020, Shanghai Yiduo Fashion Company Limited (“Shanghai Yiduo”), one of our subsidiaries, entered involuntary liquidation process in the No. 3 Intermediate People’s Court of Shanghai Municipality. Based on the court’s liquidation order, Jingjiang Maikeer Garment Co., Ltd. (“Maikeer”), which was the petitioner of the involuntary liquidation process, claimed that Shanghai Yiduo owed Maikeer RMB99,162 ($15,201), pursuant to the sales contracts between the parties between 2015 and 2017. The developed brand “idole” owned by Shanghai Yiduo was transferred to La Go Go long before Shanghai Yiduo’s bankruptcy. As of December 31, 2020, 63 stores of Shanghai Yiduo are still in operation.
In addition to the foregoing, we may become subject to other legal proceedings that arise in the ordinary course of business and have not been finally adjudicated. Adverse decisions in any of the foregoing may have a material adverse effect on our results of operations, cash flows or our financial condition.
ITEM 4. MINE SAFETY DISCLOSURES
Not applicable.
| 26 |
ITEM 5. MARKET FOR REGISTRANT’S COMMON EQUITY, RELATED STOCKHOLDER MATTERS AND ISSUER PURCHASES OF EQUITY SECURITIES.
Market for Common Equity
Our common stock was quoted on the Over-The-Counter Bulletin Board (the “OTCBB”) initially under the symbol “EGLY” and then it was changed to “EVGY” in 2007. On July 16, 2008 our common stock commenced trading on NYSE MKT LLC (“NYSE MKT”) (formerly named the NYSE Annex) under the symbol of “EVK” and then transferred to the NASDAQ Global Market on December 31, 2014. As of December 31, 2020, there were approximately 57 shareholders of record of our common stock. The number of registered shareholders excludes any estimate by us of the number of beneficial owners of common shares held in street name. The following table sets forth the high and low bid information for the common stock for each quarter within the last two fiscal years, as reported by the NASDAQ Global Market. These quotations reflect inter-dealer prices, without retail mark-up, mark-down or commission and may not represent actual transactions.
| Bid Price | ||||||||
| HIGH | LOW | |||||||
| NASDAQ | ||||||||
| FISCAL YEAR 2020: | ||||||||
| Fourth Quarter ended December 31, 2020 | $ | 5.25 | $ | 0.81 | ||||
| Third Quarter ended September 30, 2020 | $ | 1.37 | $ | 0.84 | ||||
| Second Quarter ended June 30, 2020 | $ | 1.52 | $ | 0.65 | ||||
| First Quarter ended March 31, 2020 | $ | 1.67 | $ | 1.01 | ||||
| NYSE MKT | ||||||||
| FISCAL YEAR 2019: | ||||||||
| Fourth Quarter ended December 31, 2019 | $ | 3.30 | $ | 1.49 | ||||
| Third Quarter ended September 30, 2019 | $ | 3.35 | $ | 2.40 | ||||
| Second Quarter ended June 30, 2019 | $ | 3.79 | $ | 3.01 | ||||
| First Quarter ended March 31, 2019 | $ | 4.00 | $ | 3.56 | ||||
Securities Authorized for Issuance under Equity Incentive Plans
The following table presents information regarding equity instruments outstanding under our 2014 Equity Incentive Plan as of December 31, 2020:
| Equity Incentive Plan Information | ||||||||||||
| Number of Securities to be issued upon exercise of outstanding options, warrants and rights |
Weighted -average exercise price of outstanding options, warrants and rights |
Number of securities available for future issuance under equity compensation plans (excluding securities reflected in column (a)) |
||||||||||
| Plan Category | (a) | (b) | (c) | |||||||||
| Equity incentive plans approved by security holders | - | $ | - | 1,500,000 | ||||||||
| Total | - | $ | - | 1,500,000 | ||||||||
| 27 |
Dividend Policy
We have never declared or paid any cash dividends on our capital stock. We currently intend to retain all of our net income for use in our business, and do not anticipate paying any cash dividends in the foreseeable future. Any future determination relating to dividend policy will be made at the discretion of our Board of Directors and will depend on a number of factors, including future earnings, capital requirements, financial condition and future prospects and other factors the Board of Directors may deem relevant.
ITEM 6. SELECTED FINANCIAL DATA
Not applicable
ITEM 7. MANAGEMENT’S DISCUSSION AND ANALYSIS OF FINANCIAL CONDITION AND RESULTS OF OPERATIONS
The following discussion and analysis of our financial condition and results of operations for the year ended December 31, 2020 should be read in conjunction with the Financial Statements and corresponding notes included in this annual Report on Form 10-K. Our discussion includes forward-looking statements based upon current expectations that involve risks and uncertainties, such as our plans, objectives, expectations, and intentions. Actual results and the timing of events could differ materially from those anticipated in these forward-looking statements as a result of a number of factors, including those set forth under the Risk Factors and Special Note Regarding Forward-Looking Statements in this report. We use words such as “anticipate,” “estimate,” “plan,” “project,” “continuing,” “ongoing,” “expect,” “believe,” “intend,” “may,” “will,” “should,” “could,” “target”, “forecast” and similar expressions to identify forward-looking statements.
Overview
Our Business
We are a retailer of branded fashion apparel and leading global apparel supply chain solution provider based in China. We are listed on the NASDAQ Global Market under the symbol of “EVK”.
We classify our businesses into two segments: Wholesale and Retail. Our wholesale business consists of wholesale-channel sales made principally to domestically and international recognized brands, and department stores located throughout Europe, the U.S., Japan and the People’s Republic of China (“PRC”). We focus on well-known, middle-to-high end casual wear, sportswear, and outerwear brands. Our retail business consists of retail-channel sales directly to consumers through retail stores located throughout the PRC as well as sales via online stores at Tmall, Dangdang mall, JD.com, VIP.com etc.
Although we have our own manufacturing facilities, we currently outsource most of the manufacturing to our long-term contractors as part of our overall business strategy. We believe outsourcing allows us to maximize our production capacity and maintain flexibility while reducing capital expenditures and the costs of keeping skilled workers on production lines during slow seasons. We oversee our long-term contractors with our advanced management solutions and inspect products manufactured by them to ensure that they meet our high-quality control standards and timely delivery requirement.
| 28 |
Wholesale Business
We conduct our original design manufacturing (“ODM”) operations through seven wholly owned subsidiaries which are located in the Nanjing Jiangning Economic and Technological Development Zone and Shang Fang Town in the Jiangning District in Nanjing, Jiangsu province, China, Chuzhou, Anhui province, China and Samoa: Ever-Glory International Group Apparel Inc. (“Ever-Glory Apparel”), Goldenway Nanjing Garments Company Limited (“Goldenway”), Nanjing New-Tailun Garments Company Limited (“New Tailun”), Nanjing Catch-Luck Garments Co., Ltd. (“Catch-Luck”), Nanjing Rui Lian Technology Company Limited (“Nanjing Rui Lian”), Haian Tai Xin Garments Trading Company Limited (“Haian Tai Xin”), Chuzhou Huirui Garments Co., Ltd. (“Huirui), Ever-Glory Supply Chain Service Co., Limited (“Ever-Glory Supply Chain”) and Ever-Glory International Group (HK) Ltd. (“Ever-Glory HK”).
Retail Business
We conduct our retail operations through Shanghai LA GO GO Fashion Company Limited (“LA GO GO”), Jiangsu LA GO GO Fashion Company Limited (“Jiangsu LA GO GO”), Tianjin LA GO GO Fashion Company Limited (“Tianjin LA GO GO”), Shanghai Ya Lan Fashion Company Limited (“Ya Lan”), Shanghai Yiduo Fashion Company Limited (“Shanghai Yiduo”), Nanjing Tai Xin Garments Trading Company Limited (“Tai Xin”), and Xizang He Meida Trading Company Limited (“He Meida”).
Business Objectives
Wholesale Business
We believe the enduring strength of our wholesale business is mainly due to our consistent emphasis on innovative and distinctive product designs that stand for exceptional styling and quality. We maintain long-term, satisfactory relationships with a portfolio of well-known and mid-class global brands.
The primary business objective for our wholesale segment is to expand our portfolio into higher-class brands, expand our customer base and improve our profit. We believe that our growth opportunities and continued investment initiatives include:
| ● | Expanding our global sourcing network; | |
| ● | Expanding our overseas low-cost manufacturing base (outside of mainland China); | |
| ● | Focusing on high value-added products and continuing our strategy to produce mid-to-high end apparel; | |
| ● | Continuing to emphasize product design and technology utilization; | |
| ● | Seeking strategic acquisitions of international distributors that could enhance global sales and our distribution network; and | |
| ● | Maintaining stable revenue increase in the markets while shifting focus to higher margin wholesale markets such as mainland China. |
Retail Business
The business objectives for our retail segment are to establish leading brands of women’s apparel and to build a nationwide retail network in China. As of December 31, 2020, we had 936 stores (including store-in-stores), including 104 stores were opened and 269 stores were closed in 2020. We expect to open additional 50 to 100 stores in 2021.
We believe that our growth opportunities and continued investment initiatives include:
| ● | Building our retail brand to be recognized as a major player in the mid-to-high end women’s apparel market in China; | |
| ● | Expanding our retail network throughout China; | |
| ● | Improving our retail stores’ efficiency and increasing same-store sales; | |
| 29 |
| ● | Continuing to launch retail flagship stores in Tier-1 cities and increasing our penetration and coverage in Tier-2 and Tier-3 cities; and | |
| ● | Becoming a multi-brand operator. |
Seasonality of Business
Our business is affected by seasonal trends, with higher levels of wholesale sales in our third and fourth quarters and higher retail sales in our first and fourth quarters. These trends primarily result from the timing of seasonal wholesale shipments and holiday periods in the retail segment.
Collection Policy
Wholesale business
For our new customers, we generally require orders placed to be backed by letters of credit. For our long-term and established customers with good payment track records, we generally provide payment terms between 30 to 180 days following the delivery of finished goods.
Retail business
For store-in-store shops, we generally receive payments from the stores between 60 to 90 days following the date of the register receipt. For our own flagship stores, we receive payments on the same day of the register receipt. For sales from e-commerce platforms such as Tmall, Dangdang mall, JD.com, VIP.com and etc., we generally receive payments between 5 to 15 days following the date of the register receipt.
Global Economic Uncertainty
Our business is dependent on consumer demand for our products. We believe that the significant uncertainty in the global economy and the slowdown of economies in the United States and Europe have increased our clients’ sensitivity to the cost of our products. We have experienced continued pricing pressure. If the global economic environment continues to be weak, these worsening economic conditions could have a negative impact on our sales growth and operating margins in our wholesale segment in 2021.
In addition, economic conditions in the United States and other foreign markets in which we operate could substantially affect our sales profitability, cash position and collection of accounts receivable. Global credit and capital markets have experienced unprecedented volatility and disruption. Business credit and liquidity have tightened in much of the world. Some of our suppliers and customers may face credit issues and could experience cash flow problems and other financial hardships. These factors currently have not had an impact on the timeliness of receivable collections from our customers. We cannot predict at this time how this situation will develop and whether accounts receivable may need to be allowed for or written off in the coming quarters.
Despite the various risks and uncertainties associated with the current global economy, we believe our core strengths will continue to allow us to execute our strategy for long-term sustainable growth in revenue, net income and operating cash flow.
Summary of Critical Accounting Policies
We have identified critical accounting policies that, as a result of judgments, uncertainties, uniqueness and complexities of the underlying accounting standards and operation involved could result in material changes to our financial position or results of operations under different conditions or using different assumptions.
| 30 |
Revenue Recognition
We recognize wholesale revenue from product sales, net of value-added taxes, upon delivery for local sales and upon shipment of the products for export sales, at such time title passes to the customer. We recognize wholesale revenue from manufacturing fees charged to buyers for the assembly of garments from materials provided by the buyers upon completion of the manufacturing process and shipment of the products for export sales. Retail sales are recorded net of promotional discounts, rebates, and return allowances. Retail store sales are recognized at the time of the register receipt. Retail online sales are recognized when products are shipped and customers receive the products because we retain a portion of the risk of loss on these sales during transit.
Our revenue recognition policy is in compliance with ASC 606, Revenue from Contracts with Customers that revenue is recognized when a customer obtains control of promised goods and is recognized in an amount that reflects the consideration that we expect to receive in exchange for those goods. In addition, the standard requires disclosure of the nature, amount, timing, and uncertainty of revenue and cash flows arising from contracts with customers. The amount of revenue that is recorded reflects the consideration that we expect to receive in exchange for those goods. We apply the following five-step model in order to determine this amount:
| (i) | identification of the promised goods and services in the contract; | |
| (ii) | determination of whether the promised goods and services are performance obligations, including whether they are distinct in the context of the contract; | |
| (iii) | measurement of the transaction price, including the constraint on variable consideration; | |
| (iv) | allocation of the transaction price to the performance obligations; and | |
| (v) | recognition of revenue when (or as) the Company satisfies each performance obligation. |
We only apply the five-step model to contracts when it is probable that we will collect the consideration it is entitled to in exchange for the goods or services it transfers to the customer. Once a contract is determined to be within the scope of ASC 606 at contract inception, we review the contract to determine which performance obligations we must deliver and which of these performance obligations are distinct. We recognize as revenues the amount of the transaction price that is allocated to the respective performance obligation when the performance obligation is satisfied or as it is satisfied. Generally, our performance obligations are transferred to customers at a point in time, typically upon delivery for local sales and upon shipment of the products for export sale.
For all reporting periods, we have not disclosed the value of unsatisfied performance obligations for all product revenue contracts with an original expected length of one year or less, which is an optional exemption that is permitted under the adopted rules.
Estimates and Assumptions
In preparing our consolidated financial statements, we use estimates and assumptions that affect the reported amounts and disclosures. Our estimates are often based on complex judgments, probabilities and assumptions that we believe to be reasonable, but that are inherently uncertain and unpredictable. We are also subject to other risks and uncertainties that may cause actual results to differ from estimated amounts. Significant estimates in 2020 and 2019 include the assumptions used to value tax liabilities, derivative financial instruments, the estimates of the allowance for deferred tax assets, and the accounts receivable allowance, and impairment of long-lived assets and inventory write-offs.
Recently Issued Accounting Pronouncements
In June 2016, the FASB issued ASU No. 2016-13 “Financial Instruments - Credit Losses (Topic 326): Measurement of Credit Losses on Financial Instruments”; In November 2019, the FASB issued ASU No. 2019-10 “Financial Instruments—Credit Losses (Topic 326), Derivatives and Hedging (Topic 815), and Leases (Topic 842): Effective Dates”; In March 2020, the FASB issued ASU No. 2020-03 “Codification Improvements to Financial Instruments”; which modifies the measurement of expected credit losses of certain financial instruments. This ASU is effective for fiscal years and interim periods within those years beginning after December 15, 2022. The Company is currently assessing the impact of this ASU on its consolidated financial statements.
| 31 |
The Company reviews new accounting standards as issued. Management has not identified any other new standards that it believes will have a significant impact on the Company’s consolidated financial statements.
Results of Operations
The following table summarizes our results of operations for the years ended December 31, 2020 and 2019. The table and the discussion below should be read in conjunction with the consolidated financial statements and the notes thereto appearing elsewhere in this report.
| Year Ended December 31, | ||||||||||||||||
| 2020 | 2019 | |||||||||||||||
| (in thousands of U.S. Dollars, except for percentages) | ||||||||||||||||
| Sales | $ | 267,354 | 100.0 | % | $ | 383,101 | 100.0 | % | ||||||||
| Gross Profit | 91,213 | 34.1 | 118,771 | 31.0 | ||||||||||||
| Operating Expense | 87,070 | 32.6 | 115,303 | 30.1 | ||||||||||||
| Income From Operations | 4,143 | 1.5 | 3,468 | 0.9 | ||||||||||||
| Other Income (Expenses) | 1,599 | 0.6 | 2,313 | 0.6 | ||||||||||||
| Income tax expense | 2,469 | 0.9 | 4,562 | 1.2 | ||||||||||||
| Net Income | $ | 3,273 | 1.2 | % | $ | 1,219 | 0.3 | % | ||||||||
Revenue
The following table sets forth a breakdown of our total sales, by region, for the years ended December 31, 2020 and 2019.
| 2020 | 2019 | Growth (Decrease) |
||||||||||||||||||
| Wholesale business | (In thousands of U.S. dollars) |
% of total sales |
(In thousands of U.S. dollars) |
% of total sales |
in 2019 compared with 2018 |
|||||||||||||||
| Mainland China | $ | 29,055 | 10.9 | % | $ | 74,008 | 19.3 | % | (60.7 | )% | ||||||||||
| Hong Kong China | 19,873 | 7.4 | 26,126 | 6.8 | (23.9 | ) | ||||||||||||||
| Germany | 491 | 0.2 | 3,510 | 0.9 | (86.0 | ) | ||||||||||||||
| United Kingdom | 8,753 | 3.3 | 14,864 | 3.9 | (41.1 | ) | ||||||||||||||
| Europe-Other | 19,459 | 7.3 | 22,158 | 5.8 | (12.2 | ) | ||||||||||||||
| Japan | 11,406 | 4.3 | 18,901 | 4.9 | (39.7 | ) | ||||||||||||||
| United States | 28,172 | 10.5 | 35,589 | 9.3 | (20.8 | ) | ||||||||||||||
| Total Wholesale business | 117,209 | 43.8 | 195,156 | 50.9 | (39.9 | ) | ||||||||||||||
| Retail business | 150,145 | 56.2 | 187,945 | 49.1 | (20.1 | ) | ||||||||||||||
| Total sales | $ | 267,354 | 100.0 | % | $ | 383,101 | 100.0 | % | (30.2 | )% | ||||||||||
Total sales for the year ended December 31, 2020 were $267.4 million, a decrease of 30.2% from the year ended December 31, 2019. This decrease was primarily attributable to a 39.9% decrease in sales in our wholesale business and an 20.1% decrease in sales in our retail business.
Sales generated from our wholesale business contributed 43.8% or $117.2 million of our total sales for the year ended December 31, 2020, a decrease of 39.9% compared with $195.2 million in the year ended December 31, 2019. This decrease was primarily attributable to decreased sales in Mainland China, United Kingdom, Hong Kong China, Germany, Europe-Other, Japan and United States.
| 32 |
Sales generated from our retail business contributed 56.2% or $150.1 million of our total sales for the year ended December 31, 2020, a decrease of 20.1% compared with $187.9 million in the year ended December 31, 2019. This decrease was primarily due to a decrease in same store sales.
Total retail store square footage and sales per square foot for the years ended December 31, 2020 and 2019 are as follows:
| 2020 | 2019 | |||||||
| Total store square footage | 1,001,992 | 1,164,392 | ||||||
| Number of stores | 936 | 1,101 | ||||||
| Average store size, square foot | 1,071 | 1,058 | ||||||
| Total store sales (in thousands of U.S. dollars) | $ | 150,145 | $ | 187,945 | ||||
| Sales per square foot | $ | 150 | $ | 161 | ||||
Same-store sales and newly opened store sales for the years ended December 31, 2020 and 2019 are as follows:
| 2020 | 2019 | |||||||
| (In thousands of U.S. dollars) | ||||||||
| Sales from stores opened for a full year | $ | 120,181 | $ | 161,507 | ||||
| Sales from newly opened store sales | $ | 7,763 | $ | 5,810 | ||||
| Sales from e-commerce platform | $ | 15,348 | $ | 13,660 | ||||
| Other* | $ | 6,853 | $ | 6,968 | ||||
| Total | $ | 150,145 | $ | 187,945 | ||||
| * | Primarily sales from stores that were closed in the current reporting period. |
We remodeled or relocated 54 stores in 2020, and plan to relocate or remodel an aggregate of 50 to 100 stores in 2021. Remodels and relocations typically drive incremental same-store sales growth. A relocation typically results in an improved, more visible and accessible location, and usually includes increased square footage. We believe we will continue to have opportunities for additional remodels and relocations beyond 2020. Same-store sales are calculated based upon stores that were open at least 12 full fiscal months in each reporting period and remain open at the end of each reporting period.
Costs and Expenses
Cost of Sales and Gross Margin
Cost of goods sold includes the direct raw material cost, direct labor cost, and manufacturing overhead including depreciation of production equipment and rent, consistent with the revenue earned. Cost of goods sold excludes warehousing costs, which historically have not been significant.
The following table sets forth the components of our cost of sales and gross profit both in amounts and as a percentage of total sales for the years ended December 31, 2020 and 2019.
| Growth | ||||||||||||||||||||
| (Decrease) in 2020 |
||||||||||||||||||||
| Year ended December 31, | Compared | |||||||||||||||||||
| 2020 | 2019 | with 2019 | ||||||||||||||||||
| (In thousands of U.S. dollars, except for percentages) | ||||||||||||||||||||
| Net Sales for Wholesale Sales | $ | 117,209 | 100.0 | % | $ | 195,156 | 100.0 | % | (39.9 | )% | ||||||||||
| Raw Materials | 48,554 | 41.4 | 88,072 | 45.1 | (44.9 | ) | ||||||||||||||
| Labor | 1,268 | 1.1 | 1,379 | 0.7 | (8.0 | ) | ||||||||||||||
| Outsourced Production Costs | 37,027 | 31.6 | 65,491 | 33.6 | (43.5 | ) | ||||||||||||||
| Other and Overhead | 620 | 0.5 | 345 | 0.2 | 79.9 | |||||||||||||||
| Total Cost of Sales for Wholesale | 87,470 | 74.6 | 155,287 | 79.6 | (43.7 | ) | ||||||||||||||
| Gross Profit for Wholesale | 29,740 | 25.4 | 39,869 | 20.4 | (25.4 | ) | ||||||||||||||
| Net Sales for Retail | 150,145 | 100.0 | 187,945 | 100.0 | (20.1 | ) | ||||||||||||||
| Production Costs | 58,688 | 39.1 | 67,629 | 36.0 | (13.2 | ) | ||||||||||||||
| Rent | 29,984 | 20.0 | 41,414 | 22.0 | (27.6 | ) | ||||||||||||||
| Total Cost of Sales for Retail | 88,672 | 59.1 | 109,043 | 58.0 | (18.7 | ) | ||||||||||||||
| Gross Profit for Retail | 61,473 | 40.9 | 78,902 | 42.0 | (22.1 | ) | ||||||||||||||
| Total Cost of Sales | 176,141 | 65.9 | 264,330 | 69.0 | (33.4 | ) | ||||||||||||||
| Gross Profit | $ | 91,213 | 34.1 | % | $ | 118,771 | 31.0 | % | (23.2 | )% | ||||||||||
| 33 |
Raw material costs for our wholesale business were 41.4% of our total wholesale business sales in 2020, compared with 45.1% in 2019. The decrease was mainly due to lower raw materials prices.
Labor costs for our wholesale business were 1.1% of our total wholesale business sales in 2020, compared with 0.7% in 2019. The marginal increase was mainly due to the higher labor costs.
Outsourced manufacturing costs for our wholesale business were 31.6% of our total wholesale sales in 2020, compared with 33.6% in 2019. This decrease was primarily attributable to increased outsourced orders to our related entities in Vietnam, which have lower labor costs compared to orders outsourced to Chinese factories.
Overhead and other expenses for our wholesale business accounted for 0.5% and 0.2% of our total wholesale sales in 2020 and 2019, respectively.
Gross profit for our wholesale business in 2020 was $29.7 million, a decrease of 25.4% from 2019. As a percentage of total wholesale business sales, gross profit was 25.4% of our total wholesale business sales in 2020, compared with 20.4% in 2019. The increase in gross margin was mainly due to increased outsourced manufacturing costs.
Production costs for our retail business for the year ended December 31, 2020 were $58.7 million compared with $67.6 million for the year ended December 31, 2019. As a percentage of our total retail sales, production costs were 39.1% of our total retail sales for the year ended December 31, 2020, compared with 36.0% for the year ended December 31, 2019. The increase was due to higher discounts on our out-of-season products in the year ended December 31, 2020 compared with the same period of the prior year in percentage of sales.
Rent costs for our retail business for the year ended December 31, 2020 were $30.0 million compared with $41.4 million for the year ended December 31, 2019. As a percentage of total retail sales, rent costs were 20.0% of our total retail sales for the year ended December 31, 2020 compared with 22.0% for the year ended December 31, 2019. The decrease was primarily attributable to lower rent at certain locations.
Gross profit for our retail business for the year ended December 31, 2020 was $61.5 million compared with $79.0 million for the year ended December 31, 2019. Gross margin for our retail business for the year ended December 31, 2020 was 40.9% compared with 42.0% for the year ended December 31, 2019.
Total cost of sales for the year ended December 31, 2020 was $176.1 million, a 33.4% decrease compared with the year ended December 31, 2019. As a percentage of total sales, total costs were 65.9% of total sales for the year ended December 31, 2020, compared with 69.0% for the year ended December 31, 2019. Total gross margin for the year ended December 31, 2020 was 34.1% compared with 31.0% for the year ended December 31, 2019.
We purchase the majority of our raw materials directly from numerous local fabric and accessories suppliers. Some of our customers also furnish us with raw materials so that we can manufacture their products. For our wholesale business, purchases from our five largest suppliers represented in aggregate approximately 18.2% and 14.5%% of raw material purchases for the years ended December 31, 2020 and 2019, respectively. No single supplier provided more than 10% of our raw material purchases for the years ended December 31, 2020 and 2019. For our retail business, purchases from our five largest suppliers represented approximately 97.1% and 93.3% of raw material purchases for the year ended December 31, 2020 and 2019, respectively. Five suppliers provided approximately 34.6%, 19.8%, 16.0%, 15.9% and 10.8% of our raw material purchases for the year ended December 31, 2019. Five suppliers provided approximately 35.6%, 19.6%, 15.2%, 12.9% and 10.2% of our raw material purchases for the year ended December 31, 2019. We have not experienced difficulty in obtaining raw materials essential to our business, and we believe we maintain good relationships with our suppliers.
| 34 |
We also purchase finished goods from contract manufacturers. For our wholesale business, purchases from our five largest contract manufacturers represented approximately 45.1% and 41.4% of finished goods purchases for the year ended December 31, 2020 and 2019, respectively. Two contract manufacturers provided approximately 12.6% and 11.2% of our finished goods purchases for the year ended December 31, 2020. Two contract manufacturers provided approximately 10.4% and 10.2% of our finished goods purchases for the year ended December 31, 2019. For our retail business, our five largest contract manufacturers represented approximately 13.4% and 18.0% of finished goods purchases for the year ended December 31, 2020 and 2019, respectively. No contract manufacturer provided more than 10% of our retail finished goods purchases for the years ended December 31, 2020 and 2019. We have not experienced difficulty in obtaining finished products from our contract manufacturers and we believe we maintain good relationships with our contract manufacturers.
Selling, General and Administrative Expenses
Our selling expenses consist primarily of local transportation, unloading charges, product inspection charges, salaries for retail staff and decoration and marketing expenses associated with our retail business.
Our general and administrative expenses include administrative salaries, office expense, certain depreciation and amortization charges, repairs and maintenance, legal and professional fees, warehousing costs and other expenses that are not directly attributable to our revenues.
Costs of our distribution network that are excluded from cost of sales consist of local transportation and unloading charges, and product inspection charges. Accordingly, our gross profit amounts may not be comparable to those of other companies who include these amounts in costs of sales.
| Year ended December 31, | Increase (Decrease) in 2020 Compared |
|||||||||||||||||||
| 2020 | 2019 | to 2019 | ||||||||||||||||||
| (In thousands of U.S. dollars, except for percentages) | ||||||||||||||||||||
| Gross Profit | $ | 91,213 | 34.1 | % | $ | 118,771 | 31.0 | % | (23.2 | )% | ||||||||||
| Operating Expenses: | ||||||||||||||||||||
| Selling Expenses | 55,894 | 20.9 | 80,180 | 20.9 | (30.3 | ) | ||||||||||||||
| General and Administrative Expenses | 31,176 | 11.7 | 35,123 | 9.2 | (11.2 | ) | ||||||||||||||
| Total | 87,070 | 32.65 | 115,303 | 30.1 | (24.5 | ) | ||||||||||||||
| Income from Operations | $ | 4,143 | 1.5 | % | $ | 3,468 | 0.9 | % | 19.5 | % | ||||||||||
Selling expenses for the year ended December 31, 2020 were $56.0 million, a 30.3% decrease compared with the year ended December 31, 2019. The decrease was attributable to lower retail sales.
General and administrative expenses for the year ended December 31, 2020 were $31.2 million an 11.2% decrease compared with the year ended December 31, 2019. As a percentage of total sales, general and administrative expenses accounted for 11.7% of total sales for the year ended December 31, 2020, compared with 9.2% of total sales for the year ended December 31, 2019. The decrease in absolute amount was mainly attributable to the decline in number of stores.
| 35 |
Income from Operations
Income from operations for the year ended December 31, 2020 was $4.1 million, a 17.1% increase from $3.5 million for the year ended December 31, 2019. This increase was due to decreased selling expenses.
Interest Expense
Interest expense was $2.3 million and $1.2 million for the years ended December 31, 2020 and 2019, respectively. The increase was due to the increased bank loans.
Other Income
Other income was $1.9 million and $0.7 million for the years ended December 31, 2020 and 2019, respectively. The increase was mainly due to the higher other operating income.
Income Tax Expenses
Income tax expense for the year ended December 31, 2020 was $2.5 million, a 45.6% decrease compared to the same period of 2019. The decrease was primarily due to lower taxable income.
The Company’s operating subsidiaries are governed by the Income Tax Law of the PRC concerning Foreign Investment Enterprises and Foreign Enterprises and various local income tax laws (“the Income Tax Laws”).
All PRC subsidiaries, except for He Meida, are subject to income tax at the 25% statutory rate.
He Meida incorporated in Xizang (Tibet) Autonomous Region is subject to income tax at 15% statutory rate. The local government has implemented an income tax reduction from 15% to 9% valid through December 31, 2020.
Perfect Dream was incorporated in the British Virgin Islands (BVI), and under the current laws of the BVI dividends and capital gains arising from the Company’s investments in the BVI are not subject to income taxes.
Ever-Glory HK was incorporated in Samoa, and under the current laws of Samoa has no liabilities for income taxes.
Ever-Glory Supply Chain Service Co., Limited was incorporated in Hongkong on December 27, 2017. Under the current laws of Hongkong, its income tax rate is 8.25% when its profit is under HKD 2.0 million and its income tax rate is 16.5% when its profit is over HKD 2.0 million.
The PRC’s Enterprise Income Tax Law imposes a 10% withholding income tax for dividends distributed by a foreign invested enterprise in PRC to its immediate holding company outside China; such distributions were exempted under the previous income tax law and regulations. A lower withholding tax rate will be applied if there is a tax treaty arrangement between mainland China and the jurisdiction of the foreign holding company. The foreign invested enterprise became subject to the withholding tax starting from January 1, 2008. Given that the undistributed profits of the Company’s subsidiaries in China are intended to be retained in China for business development and expansion purposes, no withholding tax accrual has been made.
New U.S. federal tax legislation, commonly referred to as the Tax Cuts and Jobs Act (the “U.S. Tax Reform”), was signed into law on December 22, 2017. The U.S. Tax Reform modified the U.S. Internal Revenue Code by, among other things, reducing the statutory U.S. federal corporate income tax rate from 35% to 21% for taxable years beginning after December 31, 2017; limiting and/or eliminating many business deductions; migrating the U.S. to a territorial tax system with a one-time transition tax on a mandatory deemed repatriation of previously deferred foreign earnings of certain foreign subsidiaries; subject to certain limitations, generally eliminating U.S. corporate income tax on dividends from foreign subsidiaries; and providing for new taxes on certain foreign earnings. Taxpayers may elect to pay the one-time transition tax over eight years, or in a single lump-sum payment. The Company measured the current and deferred taxes based on the provisions of the Tax legislation. After the Company’s measurement, no deferred tax expense (income) relating to the Tax Act changes for the year ended December 31, 2020.
| 36 |
Net Income attributable to the Company
Net income for the year ended December 31, 2020 was $3.3 million, an increase of 168.5% compared with the same period in 2019. Our basic and diluted earnings per share were $0.22and $0.09 for the years ended December 31, 2020 and 2019, respectively.
Summary of Cash Flows
Summary cash flows information for the years ended December 31, 2020 and 2019 is as follows:
| 2020 | 2019 | |||||||
| (In thousands of U.S. dollars) | ||||||||
| Net cash provided by operating activities | $ | 40,456 | $ | 3,985 | ||||
| Net cash used in investing activities | $ | (10,955 | ) | $ | (8,675 | ) | ||
| Net cash provided by financing activities | $ | 33,919 | $ | 6,117 | ||||
Net cash provided by operating activities was $40.5 million for the year ended December 31, 2020, compared with net cash provided by $4.0 million during the year ended December 31, 2019. The increase was primarily due to decrease in accounts receivable.
Net cash used in investing activities was $11.0 million for the year ended December 31, 2020, compared with $8.7 million during the year ended December 31, 2019. This increase was mainly due to new investment in trading securities and a partnership.
Net cash provided by financing activities was $33.9 million for the year ended December 31, 2020 compared with net cash provided by $6.1 million during the year ended December 31, 2019. During the year ended December 31, 2020, we repaid $58.7 million of bank loans and received bank loan proceeds of $90.7 million. Also, under the counter-
guarantee agreement, we received $9.5 million from and paid $7.7 million to the related party during the year ended December 31, 2020.
Liquidity and Capital Resources
As of December 31, 2020, we had cash and cash equivalents of $81.9 million, other current assets of $166.4 million and current liabilities of $189.3 million. We presently finance our operations primarily from cash flows from operations and bank loans and we anticipate that these will continue to be our primary sources of funds to finance our short-term cash needs.
Bank Loans
In August 2020, Ever-Glory Apparel entered into a line of credit agreement for approximately $3.1 million (RMB20.0 million) with the Shanghai Pudong Development Bank and guaranteed by Goldenway. As of December 31, 2020, Ever-Glory Apparel had borrowed $2.3 million (RMB 15.0 million) under this line of credit with annual interest 3.01% and due on September 2021. As of December 31, 2020, approximately $0.8 million was unused and available under this line of credit.
From March 2020 to July 2020, Ever-Glory Apparel entered into a certificate of three-year time deposit of $29.1 million (RMB190.0 million) with the Shanghai Pudong Development Bank with annual interest rates ranging from 3.75% to 3.99%. From July to November 2020, Ever-Glory Apparel pledged the certificate of three-year time deposit to the Shanghai Pudong Development Bank and Ever-Glory Apparel had borrowed $29.1 million (RMB 190.0 million) under this line of certificate with an annual interest rate from 2.50% to 3.10% and due on between May 2021 and October 2021.
In December 2020, Goldenway entered into a certificate of three-year time deposit of $16.9 million (RMB110.0 million) with the Shanghai Pudong Development Bank with an annual interest rate of 3.85%. From November to December 2020, Goldenway pledged the certificate of three-year time deposit to the Shanghai Pudong Development Bank and Goldenway had borrowed $10.7 million (RMB 70.0 million) under this line of certificate with an annual interest rate 2.90% and due between May 2021 and December 2021.
| 37 |
In April 2020, Goldenway entered into a line of credit agreement with Industrial and Commercial Bank of China, which allows the Company to borrow up to approximately $6.1 million (RMB40.0 million). These loans are collateralized by the Company’s property and equipment. As of December 31, 2020, Goldenway had borrowed $6.1 million (RMB40.0 million) from Industrial and Commercial Bank of China with an annual interest rate 4.57% and due in August 2021.
In July 2019, Ever-Glory Apparel entered into a line of credit agreement for approximately $15.3 million (RMB100.0 million) with Industrial and Commercial Bank of China, which is collateralized by assets of Nanjing Knitting, an equity investee of Jiangsu Ever-Glory International Group Corp. (“Jiangsu Ever-Glory”), under a collateral agreement executed among Ever-Glory Apparel, Nanjing Knitting and the bank. As of December 31, 2020, Ever-Glory Apparel had borrowed $15.3 million (RMB 100.0 million) under this line of credit with annual interest rates ranging from 3.95% to 4.35% and due between March 2021 to October 2021.
In April 2020, Goldenway entered into a line of credit agreement with Nanjing Bank, which allows the Company to borrow up to approximately $6.9 million (RMB45.0 million). These loans are guaranteed by Jiangsu Ever-Glory International Group Corp. (“Jiangsu Ever-Glory”), an entity controlled by Mr. Kang, the Company’s Chairman and Chief Executive Officer. These loans are also collateralized by the Company’s property and equipment. As of December 31, 2020, approximately $6.9 million was unused and available under this line of credit.
In June 2020, LA GO GO entered into a revolving line of credit agreement with Nanjing Bank, which allows the Company to borrow up to approximately $3.1 million (RMB20.0 million). The line of credit is guaranteed by Mr. Kang and Goldenway. As of December 31, 2020, LA GO GO had borrowed $2.3 million (RMB 15.0 million) under this line of credit with annual interest 4.55% and due in September 2021. As of December 31, 2020, approximately $0.8 million was unused and available under this line of credit.
In September 2019, Ever-Glory Apparel entered into a line of credit agreement for approximately $9.2 million (RMB60.0 million) with Nanjing Bank and guaranteed by Jiangsu Ever-Glory, Mr. Kang and Goldenway. As of December 31, 2020, approximately $9.2 million was unused and available under this line of credit.
In August 2019, Ever-Glory Apparel and Goldenway collectively entered into a secured banking facility agreement for a combined revolving import facility, letter of credit, invoice financing facilities and a credit line for treasury products of up to $2.5 million with the Nanjing Branch of HSBC (China) Company Limited (“HSBC”). This agreement is guaranteed by the Company and Mr. Kang. As of December 31, 2020, approximately $2.5 million was unused and available under this line of credit.
In April 2020, Ever-Glory Apparel entered into a line of credit agreement for approximately $4.6 million (RMB30.0 million) with Bank of China and guaranteed by Jiangsu Ever-Glory. These loans are also collateralized by assets of Jiangsu Ever-Glory’s equity investee, Chuzhou Huarui, under a collateral agreement executed by Ever-Glory Apparel, Chuzhou Huarui and Bank of China. As of December 31, 2020, approximately $4.6 million was unused and available under this line of credit.
All bank loans are used to fund our daily operations. All loans have been repaid before or at maturity date.
Capital Commitments
We have a continuing program for the purpose of improving our manufacturing facilities and extending our retail stores. We anticipate that cash flows from operations and borrowings from banks will be used to pay for these capital commitments.
Uses of Liquidity
Our cash requirements for the next year will be primarily to fund daily operations and the growth of our business, some of this being used to fund new stores.
| 38 |
Sources of Liquidity
Our primary sources of liquidity for our short-term cash needs are expected to be from cash flows generated from operations, and cash equivalents currently on hand. We believe that we will be able to borrow additional funds if necessary.
We believe our cash flows from operations together with our cash and cash equivalents currently on hand will be sufficient to meet our needs for working capital, capital expenditure and other commitments for the next year. No assurance can be made that additional financing will be available to us if required, and adequate funds may not be available on terms acceptable to us. If funding is insufficient at any time in the future, we will develop or enhance our products or services and expand our business through our own cash flows from operations.
As of December 31, 2020, we had access to approximately $50.8 million in lines of credit, of which approximately $24.8 million was unused and available. These credit facilities do not include any covenants. We have agreed to provide Jiangsu Ever-Glory a counter-guarantee of not more than 70% of the maximum aggregate lines of credit and borrowings guaranteed by Jiangsu Ever-Glory and collateralized by the assets of Jiangsu Ever-Glory under agreements executed between the Company, Jiangsu Ever-Glory and the banks. The maximum aggregate lines of credit and available borrowings was approximately $36.0 million (RMB 235 million) and approximately $3.1 (RMB 20.0 million) was provided to Jiangsu Ever-Glory as the counter guarantee as of December 31, 2020.
Foreign Currency Translation Risk
Our operations are, for the most part, located in the PRC, which may give rise to significant foreign currency risks from fluctuations and the degree of volatility in foreign exchange rates between the United States dollar and the Chinese RMB. Most of our sales are in dollars. During 2003 and 2004, the exchange rate of RMB to the dollar remained constant at RMB 8.26 to the dollar. On July 21, 2005, the Chinese government adjusted the exchange rate from RMB 8.26 to 8.09 to the dollar. From that time, the RMB continued to appreciate against the U.S. dollar. As of
December 31, 2020, the market foreign exchange rate had increased to RMB 6.98 to one U.S. dollar. We are continuously negotiating price adjustments with most of our customers based on the daily market foreign exchange rates, which we believe will reduce our exposure to exchange rate fluctuations in the future and will pass some of the increased cost to our customers.
In addition, the financial statements of Goldenway, New-Tailun, Catch-Luck, Haian TaiXin, Ever-Glory Apparel, Taixin, He Meida, Huirui, Shanghai LA GO GO, Yalan, Shanghai Yiduo, Tianjin LA GO GO and Jiangsu LA GO GO (whose functional currency is RMB) are translated into US dollars using the closing rate method. The balance sheet items are translated into US dollars using the exchange rates at the respective balance sheet dates. The capital and various reserves are translated at historical exchange rates prevailing at the time of the transactions while income and expenses items are translated at the average exchange rate for the period. All translation adjustments are included in accumulated other comprehensive income in the statement of equity. The foreign currency translation loss for the year ended December 31, 2020 and 2019 was $8.9 million and ($0.7 million), respectively.
OFF-BALANCE SHEET ARRANGEMENTS
We do not have any off-balance sheet arrangements that have or are reasonably likely to have a current or future effect on our financial condition, changes in financial condition, revenues or expenses, results of operations, liquidity, capital expenditures or capital resources that are material to our investors.
ITEM 7A. QUANTITATIVE AND QUALITATIVE DISCLOSURE ABOUT MARKET RISK
Not applicable.
| 39 |
ITEM 8. FINANCIAL STATEMENTS AND SUPPLEMENTARY DATA
CONSOLIDATED FINANCIAL STATEMENTS
As of December 31, 2020
CONTENTS
F-1
REPORT OF INDEPENDENT REGISTERED PUBLIC ACCOUNTING FIRM
To the shareholders and the board of directors of Ever-Glory International Group, Inc.
Opinion on the Financial Statements
We have audited the accompanying consolidated balance sheets of Ever-Glory International Group, Inc. and its subsidiaries (the “Company”) as of December 31, 2020 and 2019, the related consolidated statements of income and comprehensive income, equity, and cash flows for each of the two years in the period ended December 31, 2020, and the related notes (collectively referred to as the “financial statements”). In our opinion, the financial statements present fairly, in all material respects, the financial position of the Company as of December 31, 2020 and 2019, and the results of its operations and its cash flows for each of the two years in the period ended December 31, 2020, in conformity with accounting principles generally accepted in the United States.
Basis for Opinion
These financial statements are the responsibility of the Company’s management. Our responsibility is to express an opinion on the Company’s financial statements based on our audits. We are a public accounting firm registered with the Public Company Accounting Oversight Board (United States) (“PCAOB”) and are required to be independent with respect to the Company in accordance with the U.S. federal securities laws and the applicable rules and regulations of the Securities and Exchange Commission and the PCAOB.
We conducted our audits in accordance with the standards of the PCAOB. Those standards require that we plan and perform the audit to obtain reasonable assurance about whether the financial statements are free of material misstatement, whether due to error or fraud. The Company is not required to have, nor were we engaged to perform, an audit of its internal control over financial reporting. As part of our audits we are required to obtain an understanding of internal control over financial reporting but not for the purpose of expressing an opinion on the effectiveness of the Company’s internal control over financial reporting. Accordingly, we express no such opinion.
Our audits included performing procedures to assess the risks of material misstatement of the financial statements, whether due to error or fraud, and performing procedures that respond to those risks. Such procedures included examining, on a test basis, evidence regarding the amounts and disclosures in the financial statements. Our audits also included evaluating the accounting principles used and significant estimates made by management, as well as evaluating the overall presentation of the financial statements. We believe that our audits provide a reasonable basis for our opinion.
Emphasis of a Matter
The Company has significant transactions and relationships with related parties, including entities controlled by the Company’s Chairman and Chief Executive Officer and by the Company’s major shareholder, which are described in Note 11 to the financial statements. Transactions involving related parties cannot be presumed to be carried out on an arm’s length basis, as the requisite conditions of competitive, free market dealings may not exist.
Critical Audit Matters
The critical audit matters communicated below are matters arising from the current period audit of the financial statements that was communicated or required to be communicated to the audit committee and that: (1) relates to accounts or disclosures that are material to the financial statements and (2) involved our especially challenging, subjective, or complex judgments. The communication of the critical audit matter does not alter in any way our opinion on the Consolidated Financial Statements, taken as a whole, and we are not, by communicating the critical audit matter below, providing a separate opinion on the critical audit matter or on the accounts or disclosures to which it relates.
F-2
Valuation of Accounts Receivable
As described in Note 2 to the financial statements, an allowance for doubtful accounts is established and recorded based on management’s assessment of the credit history of its customers or stores and current relationships with them. The Company writes off accounts receivable when amounts are deemed uncollectible. The assessment gives consideration to overall market conditions, customer credit history and current relationship with it, client’s current performance, and conditions of stores. The assessment also includes certain legal proceedings the Company filed against customers, as described in Note 12 to the financial statements. As of December 31, 2020, the Company’s allowance for doubtful account balance was $6.5 million.
The principal considerations for our determination that auditing management’s assessment of allowance for doubtful accounts is a critical audit matter are there was significant judgment made by management when considering factors in management’s assessment on collectability of the accounts receivables as described above, as well as the likelihood of the occurrence of these factors impacting the collectability. In turn, such management’s assessment led to challenging and subjective auditor judgment in performing our audit procedures.
Our audit procedures included, among others, understanding of controls relating to management assessment of accounts receivable allowance, interviewing customer account managers, examining transactions related documents, testing historical collections for estimation accuracy, and collections subsequent to the balance sheet date. Our procedures also included confirming balances with customers and stores, searching public information for the operating and financial conditions of the customers and stores, and interviewing the business contacts with the Company. To audit management’s assessment of collectability of accounts receivables in legal proceedings, we obtained relevant court documents, legal counsels’ opinions, and evaluating the sufficiency of the Company’s disclosures to such assessment.
Existence and Valuation of Retail Inventories
As described in Note 2 to the consolidated financial statements, retail inventories are stated at the lower of average cost or net realizable value, cost being determined on a specific identification method. As of December 31, 2020, the carrying value of the Company’s retail inventory balance was $ 42.2 million.
The principal considerations for our determination that auditing the existence and valuation of the Company’s retail inventory balance is a critical audit matter are there were 936 retail stores and 3 logistics centers carrying inventories as of the balance sheet dates, and inventory estimating net realizable value requires significant judgment. Accordingly, this led to significant procedures and subjective auditor judgment in performing our audit.
Our audit procedures included, among others, understanding of controls relating to the management’s physical controls in the Company’s logistics centers and retail stores, testing the controls over monthly retail store physical counts, testing the accuracy of the inventory system, observing the physical counts around yearend at all logistics centers and certain retail stores selected by us, and reconciling to the balance sheet date, and comparing the number of items sold to the statements provided by shopping malls. Our audit procedures to test the Company’s retail inventory valuation included testing the Company’s execution of their write-off policy, performing analytical procedures such as gross margin analysis to identify if products were sold below cost, reviewing inventory aging analyses, and comparing sales prices subsequent to the yearend inventory cost.
/s/ B F Borgers CPA PC
We have served as the Company’s auditor since 2017.
Lakewood, Colorado
March 30, 2021
F-3
EVER-GLORY
INTERNATIONAL GROUP, INC. AND SUBSIDIARIES
CONSOLIDATED BALANCE SHEETS
(In thousands of U.S. Dollars, except share and per share data or otherwise stated)
AS OF DECEMBER 31, 2020 AND 2019
| 2020 | 2019 | |||||||
| ASSETS | ||||||||
| CURRENT ASSETS | ||||||||
| Cash and cash equivalents | $ | 81,865 | $ | 48,551 | ||||
| Restricted cash | 39,858 | 2,204 | ||||||
| Trading securities | 1,792 | - | ||||||
| Accounts receivable, net | 53,285 | 78,053 | ||||||
| Inventories | 53,893 | 67,355 | ||||||
| Advances on inventory purchases | 10,261 | 9,681 | ||||||
| Value added tax receivable | 1,244 | 2,495 | ||||||
| Other receivables and prepaid expenses | 5,479 | 5,293 | ||||||
| Amounts due from related parties | 567 | 123 | ||||||
| Total Current Assets | 248,244 | 213,755 | ||||||
| NONCURRENT ASSETS | ||||||||
| Equity security investment | 3,932 | - | ||||||
| Intangible assets, net | 4,794 | 4,729 | ||||||
| Property and equipment, net | 32,164 | 28,812 | ||||||
| Operating lease right-of-use assets | 41,690 | 53,379 | ||||||
| Deferred tax assets | 902 | 996 | ||||||
| Total Non-Current Assets | 83,482 | 87,916 | ||||||
| TOTAL ASSETS | $ | 331,726 | $ | 301,671 | ||||
| LIABILITIES AND STOCKHOLDERS’ EQUITY | ||||||||
| CURRENT LIABILITIES | ||||||||
| Bank loans | $ | 65,919 | $ | 29,931 | ||||
| Accounts payable | 67,762 | 72,418 | ||||||
| Accounts payable and other payables – related parties | 3,764 | 4,811 | ||||||
| Other payables and accrued liabilities | 16,073 | 19,137 | ||||||
| Value added and other taxes payable | 909 | 1,657 | ||||||
| Income tax payable | 1,062 | 1,142 | ||||||
| Current operating lease liabilities | 33,481 | 44,888 | ||||||
| Total Current Liabilities | 188,970 | 173,984 | ||||||
| NONCURRENT LIABILITIES | ||||||||
| Non-current operating lease liabilities | 8,307 | 8,537 | ||||||
| TOTAL LIABILITIES | 197,277 | 182,521 | ||||||
| COMMITMENTS AND CONTINGENCIES (Note 9) | ||||||||
| STOCKHOLDERS’ EQUITY | ||||||||
| Stockholders’ equity: | ||||||||
| Common stock ($0.001 par value, authorized 50,000,000 shares, 14,809,160 and 14,801,770 shares issued and outstanding as of December 31, 2020 and December 31, 2019, respectively) | 15 | 15 | ||||||
| Additional paid-in capital | 3,650 | 3,640 | ||||||
| Retained earnings | 109,171 | 106,328 | ||||||
| Statutory reserve | 20,376 | 19,939 | ||||||
| Accumulated other comprehensive income (loss) | 4,590 | (4,330 | ) | |||||
| Amounts due from related party | (3,353 | ) | (4,932 | ) | ||||
| Total equity attributable to stockholders of the Company | 134,449 | 120,660 | ||||||
| Noncontrolling interest | - | (1,510 | ) | |||||
| Total Equity | 134,449 | 119,150 | ||||||
| TOTAL LIABILITIES AND STOCKHOLDERS’ EQUITY | $ | 331,726 | $ | 301,671 | ||||
See the accompanying notes to the consolidated financial statements.
F-4
EVER-GLORY INTERNATIONAL GROUP, INC.
AND SUBSIDIARIES
CONSOLIDATED STATEMENTS OF INCOME AND COMPREHENSIVE INCOME
(In thousands of U.S. Dollars, except share and per share data or otherwise stated)
FOR THE YEARS ENDED DECEMBER 31, 2020 AND 2019
| 2020 | 2019 | |||||||
| SALES | $ | 267,354 | $ | 383,101 | ||||
| COST OF SALES | 176,141 | 264,330 | ||||||
| GROSS PROFIT | 91,213 | 118,771 | ||||||
| OPERATING EXPENSES | ||||||||
| Selling expenses | 55,894 | 80,180 | ||||||
| General and administrative expenses | 31,176 | 35,123 | ||||||
| Total operating expenses | 87,070 | 115,303 | ||||||
| INCOME FROM OPERATIONS | 4,143 | 3,468 | ||||||
| OTHER INCOME (EXPENSE) | ||||||||
| Interest income | 1,014 | 1,003 | ||||||
| Interest expense | (2,345 | ) | (1,222 | ) | ||||
| Loss on deconsolidation of a subsidiary | (1,085 | ) | - | |||||
| Gain from changes in fair values of investments | 950 | - | ||||||
| Government subsidy | 1,235 | 1,809 | ||||||
| Other income | 1,830 | 723 | ||||||
| Total other income | 1,599 | 2,313 | ||||||
| INCOME BEFORE INCOME TAX EXPENSE | 5,742 | 5,781 | ||||||
| INCOME TAX EXPENSE | (2,469 | ) | (4,562 | ) | ||||
| NET INCOME | 3,273 | 1,219 | ||||||
| Net loss (income) attributable to the non-controlling interest | 7 | 51 | ||||||
| NET INCOME ATTRIBUTABLE TO THE COMPANY | $ | 3,280 | $ | 1,270 | ||||
| NET INCOME | $ | 3,273 | $ | 1,219 | ||||
| Foreign currency translation income (loss) | 8,920 | (660 | ) | |||||
| COMPREHENSIVE INCOME | $ | 12,193 | $ | 559 | ||||
| Comprehensive (loss) income attributable to the noncontrolling interest | 7 | 41 | ||||||
| COMPREHENSIVE INCOME ATTRIBUTABLE TO THE COMPANY | $ | 12,200 | $ | 610 | ||||
| EARNINGS PER SHARE ATTRIBUTABLE TO THE COMPANY’S STOCKHOLDERS: | ||||||||
| Basic and diluted | $ | 0.22 | $ | 0.09 | ||||
| Weighted average number of shares outstanding Basic and diluted | 14,806,778 | 14,801,770 | ||||||
See the accompanying notes to the consolidated financial statements.
F-5
EVER-GLORY INTERNATIONAL GROUP, INC.
AND SUBSIDIARIES
CONSOLIDATED STATEMENTS OF EQUITY
(In thousands of U.S. Dollars, except share and per share data or otherwise stated)
FOR THE YEARS ENDED DECEMBER 31, 2020 AND 2019
| Additional | Retained Earnings | Accumulated other | Amounts due from | Total equity attributable to stockholders | Non- | |||||||||||||||||||||||||||||||||||
| Common Stock | paid-in | Statutory | Comprehensive | related | of the | controlling | Total | |||||||||||||||||||||||||||||||||
| Shares | Amount | capital | Unrestricted | reserve | income | party | Company | Interest | equity | |||||||||||||||||||||||||||||||
| Balance at January 1, 2019 | 14,798,198 | $ | 15 | $ | 3,627 | $ | 105,914 | $ | 19,083 | $ | (3,578 | ) | $ | (10,354 | ) | $ | 114,707 | $ | (1,551 | ) | $ | 113,156 | ||||||||||||||||||
| Stock issued for compensation | 3,572 | - | 13 | - | - | - | - | 13 | 13 | |||||||||||||||||||||||||||||||
| Net income (loss) | - | - | - | 1,270 | - | - | - | 1,270 | (51 | ) | 1,219 | |||||||||||||||||||||||||||||
| Transfer to reserve | - | - | - | (856 | ) | 856 | - | - | - | - | ||||||||||||||||||||||||||||||
| Net cash paid to related party under counter guarantee agreement | - | - | - | - | - | - | 5,422 | 5,422 | - | 5,422 | ||||||||||||||||||||||||||||||
| Foreign currency translation (loss) gain | (752 | ) | (752 | ) | 92 | (660 | ) | |||||||||||||||||||||||||||||||||
| Balance at December 31, 2019 | 14,801,770 | $ | 15 | $ | 3,640 | $ | 106,328 | $ | 19,939 | $ | (4,330 | ) | $ | (4,932 | ) | $ | 120,660 | $ | (1,510 | ) | $ | 119,150 | ||||||||||||||||||
| Stock issued for compensation | 7,390 | - | 10 | - | - | - | - | 10 | 10 | |||||||||||||||||||||||||||||||
| Net income (loss) | - | - | - | 3,280 | - | - | - | 3,280 | (7 | ) | 3,273 | |||||||||||||||||||||||||||||
| Transfer to reserve | - | - | - | (437 | ) | 437 | - | - | - | - | ||||||||||||||||||||||||||||||
| Net cash paid to related party under counter guarantee agreement (Note 11) | - | - | - | - | - | - | 1,579 | 1,579 | - | 1,579 | ||||||||||||||||||||||||||||||
| Deconsolidation of Yiduo | - | - | - | - | - | - | - | - | 1,517 | 1,517 | ||||||||||||||||||||||||||||||
| Foreign currency translation gain | 8,920 | 8,920 | - | 8,920 | ||||||||||||||||||||||||||||||||||||
| Balance at December 31, 2020 | 14,809,160 | $ | 15 | $ | 3,650 | $ | 109,171 | $ | 20,376 | $ | 4,590 | $ | (3,353 | ) | $ | 134,449 | $ | - | $ | 134,449 | ||||||||||||||||||||
See the accompanying notes to the consolidated financial statements.
F-6
EVER-GLORY INTERNATIONAL GROUP, INC.
AND SUBSIDIARIES
CONSOLIDATED STATEMENTS OF CASH FLOWS
(In thousands of U.S. Dollars, except share and per share data or otherwise stated)
FOR THE YEARS ENDED DECEMBER 31, 2020 AND 2019
| 2020 | 2019 | |||||||
| CASH FLOWS FROM OPERATING ACTIVITIES | ||||||||
| Net income | $ | 3,273 | $ | 1,219 | ||||
| Adjustments to reconcile net (loss) income to cash provided by operating activities: | ||||||||
| Depreciation and amortization | 5,291 | 8,239 | ||||||
| Loss from sale of property and equipment | 209 | 9 | ||||||
| Loss on deconsolidation of a subsidiary | 1,085 | - | ||||||
| Provision of bad debt allowance | 1,117 | 1,062 | ||||||
| Provision for obsolete inventories | 6,753 | 2,804 | ||||||
| Changes in fair value of trading securities | (131 | ) | - | |||||
| Changes in fair value of investment | (819 | ) | - | |||||
| Deferred income tax | 154 | (1,472 | ) | |||||
| Stock-based compensation | 10 | 12 | ||||||
| Changes in operating assets and liabilities | ||||||||
| Accounts receivable | 27,173 | 6,652 | ||||||
| Inventories | 10,161 | (5,145 | ) | |||||
| Value added tax receivable | 1,336 | 1,077 | ||||||
| Other receivables and prepaid expenses | (135 | ) | 2,394 | |||||
| Advances on inventory purchases | (28 | ) | (3,395 | ) | ||||
| Amounts due from related parties | (480 | ) | 67 | |||||
| Accounts payable | (9,316 | ) | (2,305 | ) | ||||
| Accounts payable and other payables- related parties | (1,145 | ) | 176 | |||||
| Other payables and accrued liabilities | (3,098 | ) | (4,052 | ) | ||||
| Value added and other taxes payable | (806 | ) | (2,948 | ) | ||||
| Income tax payable | (148 | ) | (409 | ) | ||||
| Net cash provided by operating activities | 40,456 | 3,985 | ||||||
| CASH FLOWS FROM INVESTING ACTIVITIES | ||||||||
| Purchases of property and equipment | (6,354 | ) | (8,675 | ) | ||||
| Purchases of trading securities | (2,644 | ) | - | |||||
| Proceeds from trading securities | 979 | - | ||||||
| Investment in a partnership | (2,936 | ) | - | |||||
| Net cash used in investing activities | (10,955 | ) | (8,675 | ) | ||||
| CASH FLOWS FROM FINANCING ACTIVITIES | ||||||||
| Proceeds from bank loans | 90,729 | 59,528 | ||||||
| Repayment of bank loans | (58,658 | ) | (58,665 | ) | ||||
| Net collection (advance) of amounts due from related party (equity) | 1,848 | 5,254 | ||||||
| Net cash provided by financing activities | 33,919 | 6,117 | ||||||
| EFFECT OF EXCHANGE RATE CHANGES ON CASH | 7,548 | 2,316 | ||||||
| NET INCREASE IN CASH, CASH EQUIVALENTS AND RESTRICTED CASH | 70,968 | 3,743 | ||||||
| CASH, CASH EQUIVALENTS AND RESTRICTED CASH AT BEGINNING OF PERIOD | 50,755 | 47,012 | ||||||
| CASH, CASH EQUIVALENTS AND RESTRICTED CASH AT END OF PERIOD | $ | 121,723 | $ | 50,755 | ||||
| Reconciliation of cash, cash equivalents and restricted cash reported within their consolidated balance sheets: | ||||||||
| Cash and Cash Equivalents | 81,865 | 48,551 | ||||||
| Restricted cash | 39,858 | 2,204 | ||||||
| $ | 121,723 | $ | 50,755 | |||||
| SUPPLEMENTAL DISCLOSURE OF CASH FLOW INFORMATION: | ||||||||
| Net asset (liabilities) derecognized due to deconsolidation of a subsidiary | 1,164 | - | ||||||
| Cash paid during the period for: | ||||||||
| Interest | $ | 2,345 | $ | 1,222 | ||||
| Income taxes | $ | 2,469 | $ | 6,327 | ||||
See the accompanying notes to the consolidated financial statements.
F-7
EVER-GLORY INTERNATIONAL GROUP, INC.
AND SUBSIDIARIES
NOTES TO THE CONSOLIDATED FINANCIAL STATEMENTS
December 31, 2020 AND 2019
NOTE 1 ORGANIZATION AND BASIS OF PRESENTATION
Ever-Glory International Group, Inc. (the “Company”), together with its subsidiaries, is an apparel manufacturer, supplier and retailer in The People’s Republic of China (“China or “PRC”), with a wholesale segment and a retail segment. The Company’s wholesale business consists of recognized brands for department and specialty stores located in China, Europe, Japan and the United States. The Company’s retail business consists of flagship stores and store-in-stores for the Company’s own-brand products. The following are the Company’s subsidiaries as of December 31, 2020:
Perfect Dream Limited (“Perfect Dream”), a wholly-owned subsidiary of Ever-Glory, was incorporated in the British Virgin Islands in 2004.
Ever-Glory International Group (HK) Ltd. (“Ever-Glory HK”), a wholly-owned subsidiary of Perfect Dream, was incorporated in Samoa in 2009. Ever-Glory HK is principally engaged in the import and export of apparel, fabric and accessories.
Goldenway Nanjing Garments Co. Ltd. (“Goldenway”), a wholly-owned subsidiary of Perfect Dream, was incorporated in the PRC in 1993.
Nanjing Catch-Luck Garments Co, Ltd. (“Catch-Luck”), a wholly-owned subsidiary of Perfect Dream, was incorporated in the PRC in 1995.
Nanjing New-Tailun Garments Co. Ltd. (“New-Tailun’), a wholly-owned subsidiary of Perfect Dream, was incorporated in the PRC in 2006.
Ever-Glory International Group Apparel Inc. (“Ever-Glory Apparel”), a wholly-owned subsidiary of Goldenway, was incorporated in the PRC in 2009.
Shanghai LA GO GO Fashion Company Limited (“Shanghai LA GO GO”), a wholly-owned subsidiary of Ever-Glory Apparel, was incorporated in the PRC in 2008.
Nanjing Tai Xin Garments Trading Company Limited (“Tai Xin”), a wholly-owned subsidiary of Ever-Glory Apparel, was incorporated in the PRC in 2012.
Jiangsu LA GO GO Fashion Company Limited (“Jiangsu LA GO GO”), a joint venture of Ever-Glory Apparel and Catch-Luck, was incorporated in the PRC in 2013.
Haian Tai Xin Garments Trading Company Limited (“Haian Tai Xin”), a wholly-owned subsidiary of Ever-Glory Apparel, was incorporated in the PRC in 2019.
Nanjing Rui Lian Technology Company Limited (“Nanjing Rui Lian”) , a wholly-owned subsidiary of Ever-Glory Apparel, was incorporated in the PRC in 2020.
Shanghai Ya Lan Fashion Company Limited (“Ya Lan”), a wholly-owned subsidiary of Shanghai LA GO GO, was incorporated in the PRC in 2014.
Xizang He Meida Trading Company Limited (“He Meida”), a wholly-owned subsidiary of Ever-Glory Apparel, was incorporated in the PRC in 2014.
F-8
Tianjin LA GO GO Fashion Company Limited (“Tianjin LA GO GO”), a joint venture of Ever-Glory Apparel and Catch-Luck, was incorporated in the PRC in 2014.
ChuzhouHuirui Garments Co. Ltd. (“Huirui”), a wholly-owned subsidiary of Ever-Glory Apparel, was incorporated in the PRC in 2014.
Shanghai LA GO GO acquired 78% of the shares of Shanghai Yiduo Fashion Company Limited (“Shanghai Yiduo”) in March 2015. Shanghai Yiduo was incorporated in the PRC in 2011. The Company deconsolidated Yiduo due to its bankruptcy in December 2020. Fortunately, the Company retained Yiduo developed brand “idole” as the brand was transferred to La Go Go long before Yiduo’s bankruptcy.
Ever-Glory Supply Chain Service Co., Limited (“Ever-Glory Supply Chain”), a wholly-owned subsidiary of Ever-Glory Apparel, was incorporated in Hongkong in 2017. Ever-Glory Supply Chain is principally engaged in the import and export of apparel, fabric and accessories.
The Company’s wholesale operations are provided primarily through the Company’s PRC subsidiaries, Goldenway, Catch-Luck, New Tailun, Haian TaiXin, Ever-Glory Apparel, TaiXin, Huirui, the Company’s Hongkong subsidiary, Ever-Glory Supply Chain and the Company’s Samoa subsidiary, Ever-Glory HK. The Company’s retail operations are provided through its subsidiaries, Shanghai LA GO GO, Jiangsu LA GO GO, Tianjin LA GO GO, Ya Lan, He Meida and 78% owned Shanghai Yiduo.
NOTE 2 SUMMARY OF SIGNIFICANT ACCOUNTING POLICIES
Principles of Consolidation
The consolidated financial statements include Ever-Glory International Group, Inc. and its subsidiaries, and are prepared in accordance with accounting principles generally accepted in the United States of America (“GAAP”). All significant intercompany accounts and transactions have been eliminated in consolidation.
Use of Estimates and Assumptions
In preparing our consolidated financial statements, we use estimates and assumptions that affect the reported amounts and disclosures. Our estimates are often based on complex judgments, probabilities and assumptions that we believe to be reasonable, but that are inherently uncertain and unpredictable. We are also subject to other risks and uncertainties that may cause actual results to differ from estimated amounts. Significant estimates include the assumptions used to the estimates of the allowance for deferred tax assets, and the accounts receivable allowance, and impairment of long-lived assets and inventory write off, value tax liabilities, and derivative financial instruments.
Cash, Cash Equivalents, and Restricted Cash
Cash and cash equivalents include cash on hand and demand deposits with banks with original maturities within three months. If cash or bank deposits are held for a specific purpose and thus not available to the Company for immediate or general business use, these restricted cash and deposits are presented as a separate item in the balance sheet when they are material. As of December 31, 2020, the Company pledged $40.0 million with the banks for the bank borrowings. These amounts are restricted within one year and are presented as restricted cash in the balance sheets.
Accounts Receivable, net
The Company extends unsecured credit to its customers in the ordinary course of business but mitigates the associated risks by performing credit checks and actively pursuing past due accounts. An allowance for doubtful accounts is established and recorded based on management’s assessment of the credit history of its customers and current relationships with them. The Company writes off accounts receivable when amounts are deemed uncollectible.
As of December 31, 2020 and 2019, $1.1 million and $1.0 million of bad debt expense have been made in the consolidated financial statements respectively. The allowance for doubtful account balances as of December 31, 2020 and 2019 are $6.5 million and $5.3 million, respectively.
F-9
Inventories
Wholesale inventories are stated at lower of cost or net realizable value, cost being determined on a specific identification method. The Company manufactures products upon receipt of orders from its customers. All products must pass the customers’ quality assurance procedures before delivery. Therefore, products are rarely returned by customers after delivery.
Retail inventories are stated at the lower of average cost or net realizable value, cost being determined on a specific identification method. The Company writes down or writes off slow-moving or obsolete materials and finished goods aged more than two years.
Property and Equipment, net
Property and equipment are stated at cost, less accumulated depreciation. Expenditures for additions, major renewals and betterments are capitalized and expenditures for maintenance and repairs are charged to expense as incurred.
Depreciation is provided on a straight-line basis, less estimated residual value, over the assets’ estimated useful lives. The estimated useful lives are as follows:
| Property and plant | 15-20 Years | |
| Leasehold improvements | 10 Months - 2 Years | |
| Machinery and equipment | 5-10 Years | |
| Office equipment and furniture | 3-5 Years | |
| Motor vehicles | 5 Years |
Land Use Rights
All land in the PRC is owned by the government and cannot be sold to any individual or company. However, the government may grant a “land use right” to occupy, develop and use land. The Company records land use rights obtained as intangible assets at cost, which is amortized evenly over the grant period of 50 years.
Impairment of long-lived assets
Long-lived assets, property, equipment and land use rights held and used by the Company are reviewed for impairment whenever events or changes in circumstances indicate that the carrying amount of an asset may not be recoverable. For purposes of evaluating the recoverability of long-lived assets, when undiscounted future cash flows will not be sufficient to recover an asset’s carrying amount, the asset is written down to its fair value.
Fair Value Measurements
Accounting Standards Codification (“ASC”) 820 “Fair Value Measurements and Disclosures”, establishes a fair value hierarchy that prioritizes the inputs to valuation techniques used to measure fair value. The hierarchy gives the highest priority to unadjusted quoted prices in active markets for identical assets or liabilities (Level 1 measurements) and the lowest priority to unobservable inputs (Level 3 measurements). The three levels of the fair value hierarchy under ASC 820 are described below:
| Level 1 | Unadjusted quoted prices in active markets that are accessible at the measurement date for identical, unrestricted assets or liabilities; | |
| Level 2 | Quoted prices in markets that are not active, or inputs that are observable, either directly or indirectly, for substantially the full term of the asset or liability; | |
| Level 3 | Prices or valuation techniques that require inputs that are both significant to the fair value measurement and unobservable (supported by little or no market activity). |
F-10
At December 31, 2020 and 2019, the Company’s financial assets (all Level 1) consist of cash placed with financial institutions that management considers to be of a high quality, and trading securities, and equity security investment.
Management has estimated that the carrying amounts of non-related party financial instruments approximate their fair values due to their short-term maturities. The fair value of amounts due from (to) related parties is not practicable to estimate due to the related party nature of the underlying transactions.
As of December 31, 2020 and December 31, 2019, the Company has no derivative liability.
The Company has adopted ASC 825-10 “Financial Instruments”, which allows an entity to choose to measure certain financial instruments and liabilities at fair value on a contract-by-contract basis. Subsequent fair value measurement for the financial instruments and liabilities an entity chooses to measure will be recognized in earnings.
Derivative Financial Instruments
From time to time, the Company uses derivative financial instruments to manage its exposure to foreign currency risks arising from operational activities or on certain existing assets and liabilities. The Company does not hold or issue derivative instruments for trading purposes. The Company may enter into forward foreign exchange contracts, foreign exchange options, or foreign exchange currency swap contracts to manage exposure to certain foreign currency operating transactions. These instruments may offset a portion of the foreign currency re-measurement gains or losses, or changes in fair value.
The Company may also enter into above similar derivative instruments to hedge the exposure to variability in the expected cash flows of forecasted transactions such as international sales or purchases that the Company expects to receive or commit to remit foreign currencies. In these cases, the Company designates these instruments as the cash flow hedges.
The Company accounts for derivative and hedging activities in accordance with ASC 815, Derivatives and Hedging, as amended by ASU No. 2017-12. Derivative financial instruments are recognized initially at fair value and transaction costs are expensed immediately. Subsequent to initial recognition, derivative financial instruments are stated at fair value. The gain or loss on re-measurement to fair value is recognized immediately in earnings when such instruments are designated as fair value hedges or ineffective portion of cash flow hedges. The accumulated gain or loss from effective portions of cash flow hedges are recorded in accumulated other comprehensive income/(loss) (“AOCI”) until the hedged item is recognized in earnings. If the hedging instrument no longer meets the criteria for hedge accounting, expires or is sold, terminated or exercised, then hedge accounting is discontinued prospectively.
Operating Leases
The Company adopted ASC No. 842, Leases effective January 1, 2019 to account for all Company’s leases, all leases are recorded in the balance sheets. The lease liability is measured at present value of outstanding lease payments, both at commencement date and subsequently. The discount rate is generally the Company’s incremental borrowing rate as the lessor’s rate implicit in the lease is not readily determinable. The right-of-use (ROU) asset costs at commencement date consist of initial lease liability, any initial direct costs, and any lease payments made to the lessor at or before the commencement date, minus any lease incentives received. Subsequently, the carrying amount of ROU asset is derived from the carrying amount of the lease liability, plus unamortized direct costs and prepaid lease payments, and minus unamortized balance of lease incentives received. The annual amortization expenses will be recorded in consolidated statement of operations and allocating between cost of sales and operating expenses.
F-11
Revenue and Cost Recognition
The Company recognizes wholesale revenue from product sales, net of value-added taxes, upon delivery for local sales and upon shipment of the products for export sales, at such time title passes to the customer. Retail sales are recorded net of promotional discounts, rebates, and return allowances. Retail store sales are recognized at the time of the register receipt. Retail online sales are recognized when products are shipped and customers receive the products because the Company retains a portion of the risk of loss on these sales during transit.
The Company’s revenue recognition policy is in compliance with ASC 606, Revenue from Contracts with Customers that revenue is recognized when a customer obtains control of promised goods and is recognized in an amount that reflects the consideration that the Company expects to receive in exchange for those goods. In addition, the standard requires disclosure of the nature, amount, timing, and uncertainty of revenue and cash flows arising from contracts with customers. The Company applies the following five-step model in order to determine this amount:
| (i) | identification of the promised goods and services in the contract; | |
| (ii) | determination of whether the promised goods and services are performance obligations, including whether they are distinct in the context of the contract; | |
| (iii) | measurement of the transaction price, including the constraint on variable consideration; | |
| (iv) | allocation of the transaction price to the performance obligations; and | |
| (v) | recognition of revenue when (or as) the Company satisfies each performance obligation. |
The Company only applies the five-step model to contracts when it is probable that the Company will collect the consideration it is entitled to in exchange for the goods or services it transfers to the customer. Once a contract is determined to be within the scope of ASC 606 at contract inception, the Company reviews the contract to determine which performance obligations the Company must deliver and which of these performance obligations are distinct. The Company recognizes as revenues the amount of the transaction price that is allocated to the respective performance obligation when the performance obligation is satisfied or as it is satisfied. Generally, the Company’s performance obligations are transferred to customers at a point in time, typically upon delivery for local sales and upon shipment of the products for export sale.
For all reporting periods, the Company has not disclosed the value of unsatisfied performance obligations for all product revenue contracts with an original expected length of one year or less, which is an optional exemption that is permitted under the adopted rules.
Cost of goods sold includes the direct raw material cost, direct labor cost, manufacturing overheads including depreciation of production equipment, and rent and commission due to department stores consistent with the revenue earned. Cost of goods sold excludes warehousing costs, which historically have not been significant.
Local transportation charges and production inspection charges are included in selling expenses and totaled $3.9 million and $3.2 million in the years ended December 31, 2020 and 2019, respectively.
Research and Development Costs
Research and development costs are expensed as incurred. Research and development costs for the years ended December 31, 2020 and 2019 amounted to $1.1 million and $1.0 million, respectively.
F-12
Government subsidies
Government subsidies are recognized when received and when all the conditions for their receipt have been met. Subsidies that compensate the Company for expenses incurred are recognized as a reduction of expenses in the consolidated statements of operations. Subsidies that are not associated with expenses are recognized as government subsidy. Ten of the Company’s PRC subsidiaries received government subsidies of $1.2 million and $1.8 million for the years ended December 31, 2020 and 2019, respectively, which was recorded in other income when subsidies were received and all the conditions were met.
Income Taxes
Deferred tax assets and liabilities are recognized for the future tax consequences attributable to differences between the financial statement carrying amounts of existing assets and liabilities and their respective tax bases. Deferred tax assets and liabilities are measured using enacted tax rates expected to apply to taxable income in the years in which those temporary differences are expected to be recovered or settled. The effect on deferred tax assets and liabilities of a change in tax rates is recognized in income in the period that included the enactment date.
The Company has adopted ASC 740 “Income Taxes” pursuant to which tax positions are recognized as a benefit only if it is “more likely than not” that the tax position would be sustained in a tax examination, with a tax examination being presumed to occur. The amount recognized is the largest amount of tax benefit that is greater than 50% likely of being realized on examination. For tax positions not meeting the “more likely than not” test, no tax benefit is recorded. The Company does not have any material unrecognized tax benefits and the Company does not believe there will be any material changes in its unrecognized tax positions over the next 12 months.
The Company’s policy is to recognize interest and penalties accrued on any unrecognized tax benefits as a component of income tax expense. The Company does not have any accrued interest or penalties associated with any unrecognized tax benefits, nor was any interest expense recognized during the years ended December 31, 2020 and 2019. The Company’s effective tax rate differs from the PRC statutory rate primarily due to non-deductible expenses, temporary differences, and preferential tax treatment.
The Company files income tax returns with the relevant government authorities in the U.S. and the PRC.
Foreign Currency Translation and Other Comprehensive Income
The reporting currency of the Company is the U.S. dollar. The functional currency of Ever-Glory, Perfect Dream, Ever-Glory HK and Ever-Glory Supply Chain is the U.S. dollar. The functional currency of Goldenway, New Tailun, Catch-luck, Haian TaiXin, Nanjing Rui Lian, Ever-Glory Apparel, Shanghai LA GO GO, Jiangsu LA GO GO, Tianjin LA GO GO, He Meida, Huirui, Yalan, Yiduo and Taixin is the Chinese RMB.
For the subsidiaries whose functional currency is the RMB, all assets and liabilities are translated at the exchange rate on the balance sheet date; equity is translated at historical rates and items in the statement of income are translated at the average rate for the period. Translation adjustments resulting from this process are included in accumulated other comprehensive income (loss) in the statement of equity and amounted to $4.6 million and ($4.34 million) as of December 31, 2020 and 2019, respectively. Assets and liabilities at December 31, 2020 and 2019 were translated at RMB6.52 and RMB6.98 to $1.00 respectively. The average translation rates applied to income statement accounts and consolidated statements of cash flows for the years ended December 31, 2020 and 2019 were RMB6.90 and RMB6.90 to $1.00, respectively. As a result, amounts related to assets and liabilities reported on the consolidated statements of cash flows will not necessarily agree with changes in the corresponding balances on the consolidated balance sheets.
Translation gains or losses that arise from exchange rate fluctuations on transactions denominated in a currency other than the functional currency are included in the results of operations as incurred and amounted a loss of $2.5 million and a loss of $0.77 million for the years ended December 31, 2020 and 2019, respectively.
F-13
Earnings Per Share
The Company reports earnings per share in accordance with ASC 260 “Earnings Per Share”, which requires presentation of basic and diluted earnings per share in conjunction with the disclosure of the methodology used in computing such earnings per share. Basic earnings per share excludes dilution and is computed by dividing income available to common stockholders by the weighted average common shares outstanding during the period. Diluted earnings per share takes into account the potential dilution that could occur if securities or other contracts to issue common stock were exercised and converted into common stock. Further, if the number of common shares outstanding increases as a result of a stock dividend or stock split or decreases as a result of a reverse stock split, the computations of a basic and diluted EPS shall be adjusted retroactively for all periods presented to reflect that change in capital structure.
Included in the calculation of basic EPS are shares of restricted common stock that have been issued by the Company, all of which are fully vested. Shares of restricted common stock whose issuance is contingent upon the attainment of specified earnings targets are considered outstanding and included in the computation of basic EPS as of the date that all necessary conditions have been satisfied, which is the date upon which the specified amount of earnings has been attained. These shares are to be considered outstanding and included in the computation of diluted EPS as of the beginning of the period in which the conditions are satisfied. If the specified amount of earnings has not been attained as of the end of the reporting period, the contingently issuable shares are excluded from the calculation of basic and diluted EPS.
Unvested restricted shares to be issued (share-based compensation) under the 2014 Equity Incentive Plan are not included in basic weighted average number of shares but are considered to be outstanding as of the grant date for purposes of computing diluted earnings per share even though the shares are subject to vesting requirements.
As of December 31, 2020 and 2019, there were no securities that could potentially dilute basic EPS and would be included in the calculation of diluted EPS.
Segments
The Company applies ASC 280 “Segment Reporting” which establishes standards for operating information regarding operating segments in financial statements and requires selected information for those segments to be presented in financial reports issued to stockholders. ASC 280 also establishes standards for related disclosures about products and services and geographic areas. Operating segments are identified as components of an enterprise about which separate discrete financial information is available for evaluation by the chief operating decision maker, or decision making group, in making decisions how to allocate resources and assess performance. The Company reports financial and operating information in two segments:
| (1) | Wholesale apparel manufacture and sales |
| (2) | Retail sales of own-brand clothing. There were 936 retail stores and 3 logistics centers carrying inventories as of December 31, 2020.0 |
Recently Issued Accounting Pronouncements
In June 2016, the FASB issued ASU No. 2016-13 “Financial Instruments - Credit Losses (Topic 326): Measurement of Credit Losses on Financial Instruments”; In November 2019, the FASB issued ASU No. 2019-10 “Financial Instruments—Credit Losses (Topic 326), Derivatives and Hedging (Topic 815), and Leases (Topic 842): Effective Dates”; In March 2020, the FASB issued ASU No. 2020-03 “Codification Improvements to Financial Instruments”; which modifies the measurement of expected credit losses of certain financial instruments. This ASU is effective for fiscal years and interim periods within those years beginning after December 15, 2022. The Company is currently assessing the impact of this ASU on its consolidated financial statements.
The Company reviews new accounting standards as issued. Management has not identified any other new standards that it believes will have a significant impact on the Company’s consolidated financial statements.
F-14
NOTE 3 INVESTMENTS
Trading securities
Investments in equity securities of certain US public companies are accounted for as trading securities and measured subsequently at fair value in the consolidated balance sheets. Net gains and losses recognized during the periods are summarized as follows (In thousands of U.S. Dollars).
| December 31, 2020 | December 31, 2019 | |||||||
| (In thousands of U.S. Dollars) | ||||||||
| Net gains and (losses) recognized during the period on equity securities | $ | 131 | $ | - | ||||
| Less: Net gains and (losses) recognized during the period on equity securities sold during the period | 77 | - | ||||||
| Unrealized gains and (losses) recognized during the reporting period on equity securities still held at the reporting date | $ | 54 | $ | - | ||||
Equity security investment
In August 2020, Ever-Glory Apparel invested $2.9 million (RMB 20.0 million) for 2.38% ownership in a partnership (“Partnership”). In December 2020, the Partnership invested in a public company in China. As a limited partner, the Company does not have ability to exercise significant influence due to lack of kick-out rights through voting interests. In the meantime, the Company entered an agreement with the general partner of the Partnership (GP) and an individual that the Company has the privilege to sell the ownership interests in the Partnership to GP or the individual for the consideration of the average net asset value ten trading days prior to the closing date, if the Company is not able to withdraw any part of the original investment from the Partnership in the twelve months period beginning the third year of the initial investment (“optional withdrawal period”). If the Company opts to withdraw entire investment during the optional withdrawal period, the GP will compensate up to 8% of annual return on investment. If the return on investment is in excess of 8% for any portion of the investment withdrawn during the optional withdrawal period, then 20% of the return in excess of 8% will be shared with the individual. The Company may also continue to invest in the Partnership beyond the optional withdrawal period, but none of above agreement with the GP and the individual is in place.
In December 2020, the Partnership invested in a public company in China. Since there is now readily determinable fair value of the equity investment, the Company started to measure its equity investment using the public company’s stock price and the Company’s share. The Company reported this investment at fair value since at December 31, 2020. At each reporting period, the Company made a qualitative assessment considering impairment indicators to evaluate whether the investment is impaired. There is no significant adverse change in the regulatory, economic, or technological environment of the investee. So the investment was not impaired at December 31, 2020.
NOTE 4 INVENTORIES
Inventories at December 31, 2020 and 2019 consisted of the following:
| December 31, 2020 | December 31, 2019 | |||||||
| (In thousands of U.S. Dollars) | ||||||||
| Raw materials | $ | 1,297 | $ | 1,468 | ||||
| Work-in-progress | 8,130 | 8,025 | ||||||
| Finished goods | 44,466 | 57,862 | ||||||
| Total inventories | $ | 53,893 | $ | 67,355 | ||||
Provision for obsolete inventories was $6.8 million and $2.8 million for the years ended December 31, 2020 and 2019, respectively.
F-15
NOTE 5 INTANGIBLE ASSETS
Land use rights
In 2006, the Company obtained a fifty-year land use right on 112,442 square meters of land in the Nanjing Jiangning Economic and Technological Development Zone.
In 2014, the Company obtained a fifty-year land use right on 23,333 square meters of land in the Suzhou Kunshan Jinxi Tower Jinxing Road.
In 2015, the Company obtained a fifty-year land use right on 33,427 square meters of land in the Tianjin Wuqing Development Zone.
Land use rights at December 31, 2020 and 2019 consisted of the following:
| 2020 | 2019 | |||||||
| (In thousands of U.S. Dollars) | ||||||||
| Land use rights | $ | 5,727 | $ | 5,456 | ||||
| Less: accumulated amortization | (1,321 | ) | (727 | ) | ||||
| Land use rights, net | $ | 4,406 | $ | 4,729 | ||||
Amortization expense was $0.11 million and $0.12 million for the years ended December 31, 2020 and 2019, respectively. Future expected amortization expense for land use rights is approximately $0.11 million for each of the next five years.
NOTE 6 PROPERTY AND EQUIPMENT
The following is a summary of property and equipment at December 31, 2020 and 2019
| 2020 | 2019 | |||||||
| (In thousands of U.S. Dollars) | ||||||||
| Property and plant | $ | 26,339 | $ | 24,384 | ||||
| Leasehold improvements | 17,070 | 19,914 | ||||||
| Equipment and machinery | 2,724 | 2,448 | ||||||
| Office equipment and furniture | 8,363 | 7,567 | ||||||
| Motor vehicles | 1,959 | 2,048 | ||||||
| 56,455 | 56,361 | |||||||
| Less: accumulated depreciation | (29,570 | ) | (28,330 | ) | ||||
| Construction-in-progress | 5,279 | 781 | ||||||
| Property and equipment, net | $ | 32,164 | $ | 28,812 | ||||
Depreciation expense was $5.08 million and $8.11 million for the years ended December 31, 2020 and 2019, respectively.
NOTE 7 OTHER PAYABLES AND ACCRUED LIABILITIES
Other payables and accrued liabilities at December 31, 2020 and 2019 consisted of the following:
| 2020 | 2019 | |||||||
| (In thousands of U.S. Dollars) | ||||||||
| Advance from customers | $ | 2,054 | $ | 2,497 | ||||
| Accrued wages and welfare | 5,028 | 7,459 | ||||||
| Supplier quality assurance deposits | 2,217 | 2,431 | ||||||
| Other payables | 6,774 | 6,750 | ||||||
| Total other payables and accrued liabilities | $ | 16,073 | $ | 19,137 | ||||
F-16
NOTE 8 BANK LOANS
Bank loans represent amounts due to various banks and are generally due on demand or within one year. These loans can be renewed with the banks. Short term bank loans consisted of the following as of December 31, 2020, and 2019.
| December 31, 2020 | December 31, 2019 | |||||||
| Bank | (In thousands of U.S. Dollars) | |||||||
| Shanghai Pudong Development Bank | $ | 42,157 | $ | - | ||||
| Industrial and Commercial Bank of China | 21,462 | 18,629 | ||||||
| Nanjing Bank | 2,300 | 6,449 | ||||||
| Bank of Communications | - | 1,426 | ||||||
| HSBC | - | 561 | ||||||
| China Minsheng Bank | - | 2,866 | ||||||
| $ | 65,919 | $ | 29,931 | |||||
In August 2020, Ever-Glory Apparel entered into a line of credit agreement for approximately $3.1 million (RMB20.0 million) with the Shanghai Pudong Development Bank and guaranteed by Goldenway. As of December 31, 2020, Ever-Glory Apparel had borrowed $2.3 million (RMB 15.0 million) under this line of credit with annual interest 3.01% and due on September 2021. As of December 31, 2020, approximately $0.8 million was unused and available under this line of credit.
From March 2020 to July 2020, Ever-Glory Apparel entered into a certificate of three-year time deposit of $29.1 million (RMB190.0 million) with the Shanghai Pudong Development Bank with annual interest rates ranging from 3.75% to 3.99%. From July to November 2020, Ever-Glory Apparel pledged the certificate of three-year time deposit to the Shanghai Pudong Development Bank and Ever-Glory Apparel had borrowed $29.1 million (RMB 190.0 million) under this line of certificate with an annual interest rate from 2.50% to 3.10% and due between May 2021 and October 2021.
In December 2020, Goldenway entered into a certificate of three-year time deposit of $16.9 million (RMB110.0 million) with the Shanghai Pudong Development Bank with an annual interest rate of 3.85%. From November to December 2020, Goldenway pledged the certificate of three-year time deposit to the Shanghai Pudong Development Bank and Goldenway had borrowed $10.7 million (RMB 70.0 million) under this line of certificate with an annual interest rate 2.90% and due between May 2021and December 2021.
In April 2020, Goldenway entered into a line of credit agreement with Industrial and Commercial Bank of China, which allows the Company to borrow up to approximately $6.1 million (RMB40.0 million). These loans are collateralized by the Company’s property and equipment. As of December 31, 2020, Goldenway had borrowed $6.1 million (RMB40.0 million) from Industrial and Commercial Bank of China with an annual interest rate 4.57% and due in August 2021.
In July 2019, Ever-Glory Apparel entered into a line of credit agreement for approximately $15.3 million (RMB100.0 million) with Industrial and Commercial Bank of China, which is collateralized by assets of Nanjing Knitting, an equity investee of Jiangsu Ever-Glory International Group Corp. (“Jiangsu Ever-Glory”), under a collateral agreement executed among Ever-Glory Apparel, Nanjing Knitting and the bank. As of December 31, 2020, Ever-Glory Apparel had borrowed $15.3 million (RMB 100.0 million) under this line of credit with annual interest rates ranging from 3.95% to 4.35% and due between March 2021 to October 2021.
In April 2020, Goldenway entered into a line of credit agreement with Nanjing Bank, which allows the Company to borrow up to approximately $6.9 million (RMB45.0 million). These loans are guaranteed by Jiangsu Ever-Glory International Group Corp. (“Jiangsu Ever-Glory”), an entity controlled by Mr. Kang, the Company’s Chairman and Chief Executive Officer. These loans are also collateralized by the Company’s property and equipment. As of December 31, 2020, approximately $6.9 million was unused and available under this line of credit.
F-17
In June 2020, LA GO GO entered into a revolving line of credit agreement with Nanjing Bank, which allows the Company to borrow up to approximately $3.1 million (RMB20.0 million). The line of credit is guaranteed by Mr. Kang and Goldenway. As of December 31, 2020, LA GO GO had borrowed $2.3 million (RMB 15.0 million) under this line of credit with annual interest 4.55% and due in September 2021. As of December 31, 2020, approximately $0.8 million was unused and available under this line of credit.
In September 2019, Ever-Glory Apparel entered into a line of credit agreement for approximately $9.2 million (RMB60.0 million) with Nanjing Bank and guaranteed by Jiangsu Ever-Glory, Mr. Kang and Goldenway. As of December 31, 2020, approximately $9.2 million was unused and available under this line of credit.
In August 2019, Ever-Glory Apparel and Goldenway collectively entered into a secured banking facility agreement for a combined revolving import facility, letter of credit, invoice financing facilities and a credit line for treasury products of up to $2.5 million with the Nanjing Branch of HSBC (China) Company Limited (“HSBC”). This agreement is guaranteed by the Company and Mr. Kang. As of December 31, 2020, approximately $2.5 million was unused and available under this line of credit.
In April 2020, Ever-Glory Apparel entered into a line of credit agreement for approximately $4.6 million (RMB30.0 million) with Bank of China and guaranteed by Jiangsu Ever-Glory. These loans are also collateralized by assets of Jiangsu Ever-Glory’s equity investee, Chuzhou Huarui, under a collateral agreement executed by Ever-Glory Apparel, Chuzhou Huarui and Bank of China. As of December 31, 2020, approximately $4.6 million was unused and available under this line of credit.
All bank loans are used to fund our daily operations. All loans have been repaid before or at maturity date.
Total interest expense on bank loans amounted to $2.34 million and $1.22 million for the years ended December 31, 2020 and 2019, respectively.
The annual average interest rate of bank loans was 3.60% and 4.60% for the years ended December 31, 2020 and 2019, respectively.
NOTE 9 INCOME TAX
The Company’s operating subsidiaries are governed by the Income Tax Law of the PRC concerning Foreign Investment Enterprises and Foreign Enterprises and various local income tax laws (“the Income Tax Laws”).
All PRC subsidiaries, except for He Meida, are subject to income tax at the 25% statutory rate.
He Meida incorporated in Xizang (Tibet) Autonomous Region is subject to income tax at 15% statutory rate. The local government has implemented an income tax reduction from 15% to 9% valid through December 31, 2020.
Perfect Dream was incorporated in the British Virgin Islands (BVI), and under the current laws of the BVI dividends and capital gains arising from the Company’s investments in the BVI are not subject to income taxes.
Ever-Glory HK was incorporated in Samoa, and under the current laws of Samoa has no liabilities for income taxes.
Ever-Glory Supply Chain Service Co., Limited was incorporated in Hongkong on December 27, 2017. Under the current laws of Hongkong, its income tax rate is 8.25% when its profit is under HKD 2.0 million and its income tax rate is 16.5% when its profit is over HKD 2.0 million.
The PRC’s Enterprise Income Tax Law imposes a 10% withholding income tax for dividends distributed by a foreign invested enterprise in PRC to its immediate holding company outside China; such distributions were exempted under the previous income tax law and regulations. A lower withholding tax rate will be applied if there is a tax treaty arrangement between mainland China and the jurisdiction of the foreign holding company. The foreign invested enterprise became subject to the withholding tax starting from January 1, 2008. Given that the undistributed profits of the Company’s subsidiaries in China are intended to be retained in China for business development and expansion purposes, no withholding tax accrual has been made.
F-18
After the tax liability adjustment resulted from the reevaluation of the Company’s tax position (resulting in the company allocating substantially all of the earnings of the Samoan subsidiary to the PRC and reporting such earnings as taxable in the PRC), pre-tax income for the years ended December 31, 2020 and 2019 was taxable in the following jurisdictions:
| 2020 | 2019 | |||||||
| (In thousands of U.S. Dollars) | ||||||||
| PRC | $ | 5,752 | $ | 6,032 | ||||
| Others | (10 | ) | (251 | ) | ||||
| $ | 5,742 | $ | 5,781 | |||||
The following table reconciles the PRC statutory rates to the Company’s effective tax rate for the years ended December 31, 2020 and 2019, respectively:
| 2020 | 2019 | |||||||
| (In thousands of U.S. Dollars) | ||||||||
| PRC statutory rate | 25.0 | % | 25.0 | % | ||||
| Temporary difference between US GAAP and PRC tax accounting | 18.0 | 53.9 | ||||||
| Effective income tax rate | 43.0 | % | 78.9 | % | ||||
Income tax expense for the years ended December 31, 2020 and 2019 is as follows:
| 2020 | 2019 | |||||||
| (In thousands of U.S. Dollars) | ||||||||
| Current | $ | 2,375 | $ | 5,912 | ||||
| Deferred | 94 | (1,350 | ) | |||||
| Income tax expense | $ | 2,469 | $ | 4,562 | ||||
The Company’s deferred tax assets and liabilities arise from differences between US GAAP and PRC tax accounting for certain revenue and expense items, including timing of deduction of losses from allowances.
The Company has not recorded U.S. deferred income taxes on approximately $111.3 million of its non-U.S. subsidiaries’ undistributed earnings because such amounts are intended to be reinvested outside the United States indefinitely. The U.S. Tax Reform signed into law on December 22, 2017 significantly modified the U.S. Internal Revenue Code by, among other things, reducing the statutory U.S. federal corporate income tax rate from 35% to 21% for taxable years beginning after December 31, 2017; limiting and/or eliminating many business deductions; migrating the U.S. to a territorial tax system with a one-time transition tax on a mandatory deemed repatriation of previously deferred foreign earnings of certain foreign subsidiaries; subject to certain limitations, generally eliminating U.S. corporate income tax on dividends from foreign subsidiaries; and providing for new taxes on certain foreign earnings. The Company measured the current and deferred taxes based on the provisions of the Tax legislation. After the Company’s measurement, no deferred tax expense (income) relating to the Tax Act changes for the year ended December 31, 2020.
F-19
NOTE 10 STOCKHOLDERS’ EQUITY
Stock Issued to Independent Directors
On January 31, 2019, the Company issued 1,942 shares of Company’s common stock to two of the Company’s independent directors as compensation for their services rendered during the third and fourth quarter of 2018. The shares issued in 2019 were valued at $3.8 per share, which was the average market price of the common stock for the five days before the grant date.
On July 26, 2019, the Company issued 1,630 shares of Company’s common stock to two of the Company’s independent directors as compensation for their services rendered during the first and second quarter of 2019. The shares issued in 2019 were valued at $3.04 per share, which was the average market price of the common stock for the five days before the grant date.
On January 15, 2020, the Company issued 3,062 shares of Company’s common stock to two of the Company’s independent directors as compensation for their services rendered during the third and fourth quarter of 2019. The shares issued in 2020 were valued at $1.65 per share, which was the average market price of the common stock for the five days before the grant date.
On July 10, 2020, the Company issued 4,328 shares of Company’s common stock to two of the Company’s independent directors as compensation for their services rendered during the first and second quarter of 2020. The shares issued in 2020 were valued at $1.15 per share, which was the average market price of the common stock for the five days before the grant date.
Statutory Reserve
Subsidiaries incorporated in China are required to make appropriations to reserve funds, comprising the statutory surplus reserve, statutory public welfare fund and discretionary surplus reserve, based on after-tax net income determined in accordance with generally accepted accounting principles of the People’s Republic of China (“PRC GAAP”). Appropriations to the statutory surplus reserve are to be at least 10% of the after tax net income determined in accordance with PRC GAAP until the reserve is equal to 50% of the entities’ registered capital. Appropriations to the statutory public welfare fund are 10% of the after tax net income determined in accordance with PRC GAAP. The statutory public welfare fund is established for the purpose of providing employee facilities and other collective benefits to the employees and is non-distributable other than in liquidation. Appropriations to the surplus reserve are made at the discretion of the Board of Directors. Effective January 1, 2006, the Company is only required to contribute to one statutory reserve fund at 10% of net income after tax per annum, and any contributions are not to exceed 50% of the respective companies’ registered capital.
As of December 31, 2020, New-Tailun, Tianjin La GO GO, Haian TaiXin, Huirui, Nanjing Taixin, and Catch-Luck had fulfilled the 50% statutory reserve contribution requirement; therefore no further transfers are required for those entities. In 2020, Goldenway appropriated $0.08 million and Ever-Glory Apparel appropriated $0.36 million to the statutory reserve.
NOTE 11 RELATED PARTY TRANSACTIONS
Mr. Kang is the Company’s Chairman and Chief Executive Officer. Ever-Glory Enterprises (HK) Ltd. (Ever-Glory Enterprises) is the Company’s major shareholder. Mr. Xiaodong Yan was Ever-Glory Enterprises’ sole shareholder and sole director. Mr. Huake Kang, Mr. Kang’s son, acquired 83% interest of Ever-Glory Enterprises and became its sole director in 2014. All transactions associated with the following companies controlled by Mr. Kang or his son are considered to be related party transactions, and it is possible that the terms of these transactions may not be the same as those that would result from transactions between unrelated parties. All related party outstanding balances are short-term in nature and are expected to be settled in cash.
F-20
Other income from Related Parties
Jiangsu Wubijia Trading Company Limited (“Wubijia”) is an entity engaged in high-grade home goods sales and is controlled by Mr. Kang. Wubijia has sold their home goods on consignment in some Company’s retail stores since the third quarter of 2014.
| 2020 | 2019 | |||||||
| (In thousands of U.S. Dollars) | ||||||||
| The Company received from the customers | $ | 16 | 71 | |||||
| The Company paid to Wubijia | (16 | ) | (58 | ) | ||||
| The net income recorded as other income | $ | - | $ | 13 | ||||
Included in other income for the years ended December 31, 2020 and 2019 is rental income from EsC’Lav, the entity controlled by Mr. Kang under operating lease agreement with term through 2020. The rental income is $23,945 and $26,100 for the years ended December 31, 2020 and 2019, respectively.
Other expenses due to Related Parties
Included in other expenses for the years ended December 31, 2020 and 2019 are rental expenses due to entities controlled by Mr. Kang under operating lease agreements as follows:
| 2020 | 2019 | |||||||
| (In thousands of U.S. Dollars) | ||||||||
| Chuzhou Huarui | $ | 207 | $ | 207 | ||||
| Kunshan Enjin | 87 | 87 | ||||||
| Total | $ | 294 | $ | 294 | ||||
The Company leases Chuzhou Huarui and Kunshan Enjin’s warehouse spaces because the locations are convenient for transportation and distribution.
Purchases from, and Sub-contracts with Related Parties
The Company purchased raw materials of $1.10 million and $1.20 million during the years ended 2020 and 2019, respectively, from Nanjing Knitting.
In addition, the Company sub-contracted certain manufacturing work to related companies totaling $17.0 million and $24.2 million for the years ended December 31, 2020 and 2019, respectively. The Company provided raw materials to the sub-contractors and was charged a fixed fee for labor provided by the sub-contractors.
Purchases with related parties included in cost of sales for the years ended December 31, 2020 and 2019 are as follows:
| 2020 | 2019 | |||||||
| (In thousands of U.S. Dollars) | ||||||||
| Ever-Glory Vietnam | $ | 11,335 | $ | 12,952 | ||||
| Chuzhou Huarui | 2,240 | 6,200 | ||||||
| Fengyang Huarui | 1,352 | 2,225 | ||||||
| Nanjing Ever-Kyowa | 948 | 1,534 | ||||||
| Nanjing Knitting | 1,096 | 1,201 | ||||||
| EsC’Lav | 39 | 136 | ||||||
| Total | $ | 17,010 | $ | 24,248 | ||||
F-21
Accounts Payable – Related Parties
The accounts payable to related parties at December 31, 2020 and 2019 are as follows:
| 2020 | 2019 | |||||||
| (In thousands of U.S. Dollars) | ||||||||
| Ever-Glory Vietnam | $ | 1,727 | 2,260 | |||||
| Fengyang Huarui | 150 | 414 | ||||||
| Nanjing Ever-Kyowa | 384 | 386 | ||||||
| Chuzhou Huarui | 1,234 | 1,064 | ||||||
| Nanjing Knitting | 257 | 186 | ||||||
| Jiangsu Ever-Glory | 12 | 501 | ||||||
| Total | $ | 3,764 | $ | 4,811 | ||||
Amounts Due From Related Parties – Current Assets
The amounts due from related parties at December 31, 2020 and 2019 are as follows:
| 2020 | 2019 | |||||||
| (In thousands of U.S. Dollars) | ||||||||
| Jiangsu Ever-Glory | $ | 567 | $ | 123 | ||||
Jiangsu Ever-Glory is an entity engaged in importing/exporting, apparel-manufacture, real-estate development, car sales and other activities. Jiangsu Ever-Glory is controlled by Mr. Kang. During 2020 and 2019, the Company and Jiangsu Ever-Glory purchased raw materials on behalf of each other in order to obtain cheaper purchase prices. The Company purchased raw materials on Jiangsu Ever-Glory’s behalf and sold to Jiangsu Ever-Glory at cost for $0.9 million and $2.0 million during 2020 and 2019, respectively. Jiangsu Ever-Glory purchased raw materials on the Company’s behalf and sold to the Company at cost for $1.5 million and $2.0 million during 2020 and 2019, respectively.
Amounts Due From Related Party under Counter Guarantee Agreement
In March 2012, in consideration of the guarantees and collateral provided by Jiangsu Ever-Glory and Nanjing Knitting, the Company agreed to provide Jiangsu Ever-Glory a counter guarantee in the form of cash of not less than 70% of the maximum aggregate lines of credit obtained by the Company. Jiangsu Ever-Glory is obligated to return the full amount of the counter-guarantee funds provided upon the expiration or termination of the underlying lines of credit and is to pay an annual interest at the rate of 6.0% of the amounts provided. As of December 31, 2020 and 2019, Jiangsu Ever-Glory had provided guarantees for approximately $36.0 million (RMB 235.0 million) and $33.0 million (RMB 230.0 million) of lines of credit obtained by the Company, respectively. Jiangsu Ever-Glory and Nanjing Knitting have also provided their assets as collateral for certain of these lines of credit. As of December 31, 2020 and 2019, the value of the collateral, as per appraisals obtained by the banks in connection with these lines of credit is approximately $31.5 million (RMB 205.5 million) and $29.4 million (RMB 205.5 million), respectively. Mr. Kang has also provided a personal guarantee for $14.8 million (RMB 96.3 million) and $14.5 million (RMB 100.0 million) at the years ended of December 31, 2020 and 2019, respectively.
As of December 31, 2019, $4.7 million (RMB 32.8 million) was outstanding due from Jiangsu Ever-Glory under the counter guarantee agreement. During the year ended December 31, 2020, an additional $7.7 million (RMB 52.8 million) was provided to and repayment of $9.5 million (RMB 65.6 million) was received from Jiangsu Ever-Glory under the counter-guarantee agreement. As of December 31, 2020, the amount of the counter-guarantee had decreased to $3.1 million (RMB 20.0 million) (the difference represents currency exchange adjustment of $0.1 million), which was 8.5% of the aggregate amount of lines of credit. This amount plus accrued interest of $0.04 million (2020) and $0.3 million (2019) have been classified as a reduction of equity, consistent with the guidance of SEC Staff Accounting Bulletins 4E and 4G. As of December 31, 2020 and 2019, the amount classified as a reduction of equity was $3.4 million and $4.9 million, respectively. Interest of 0.5% is charged on net amounts due from Jiangsu Ever-Glory at each month end. Since January 1, 2019, the interest rate has changed to 0.3625% as the bank benchmark interest rate decreased. Interest income for the years ended December 31, 2020 and 2019 was approximately $0.04 million and $0.3 million, respectively.
F-22
NOTE 12 COMMITMENTS AND CONTINGENCIES
Operating Lease Commitment
The Company recognized operating lease liabilities and operating lease right-of-use (ROU) assets on its balance sheets. ROU assets represent the right to use an underlying asset for the lease term, and lease liabilities represent the obligation to make lease payments arising from the lease. ROU assets and liabilities are recognized at the lease commencement date based on the estimated present value of lease payments over the lease term. The Company has leases with fixed payments for land-use-rights, warehouses and logistics centers, flagship stores, and leases with variable payments for stores within shopping malls (“shopping mall stores”) in the PRC, which are classified as operating leases. Options to extend or renew are recognized as part of the lease liabilities and recognized as right of use assets. There are no residual value guarantees and no restrictions or covenants imposed by the leases.
The weighted average remaining lease term excluding stores in the shopping malls is 31 years and the weighted average discount rate is 4.35%. The lease term for shopping mall stores is commonly one year with options to extend or renew, and the rent is predetermined with a percentage of sales. The Company estimates the next 12 months rent for the shopping mall stores by annualizing current period rent calculated with the percentage of sales. Thus, the ROU assets and lease liabilities may vary significantly at different period ends. For stores closed before the lease end, we would incur insignificant amounts in net of loss on impairment of ROU assets and gain on extinguishment of lease liabilities, which are recorded in the current period statement of income (loss) and comprehensive income (loss).
In the year ended December 31, 2020, the costs of the leases recognized in cost of revenues and general administrative expenses are $29.9 million and $0.8 million, respectively. Cash paid for the operating leases including in the operating cash flows was $30.7 million. In the year ended December 31, 2019, the costs of the leases recognized in cost of revenues and general administrative expenses are $8.0 and $0.7 million, respectively. Cash paid for the operating leases including in the operating cash flows was $8.7 million.
The following table summarizes the maturity of operating lease liabilities:
| Year ending December 31, (In thousands of U.S. Dollars) | ||||
| 2021 | 706 | |||
| 2022 | 706 | |||
| 2023 | 721 | |||
| 2024 | 406 | |||
| 2025 | 406 | |||
| Thereafter | 12,115 | |||
| Total lease payment | 15,060 | |||
| Less: Interest | 6,753 | |||
| Total | $ | 8,307 | ||
Legal Proceedings
From time to time, we may become involved in claims, suits, investigations and proceedings arising in the ordinary course of business.
Lawsuit against Shanghai Chijing
In March 2019, Shanghai La Go Go Fashion Company Limited (“LA GO GO”) filed a complaint against Shanghai Chijing Investment Management Co., Ltd. (“Shanghai Chijing”) for unpaid rent of RMB0.27 million ($0.04 million) per month in the Shanghai People’s Court for Jiading District (the “District Court”). The rent arrears began accumulating from April 2018 to the actual payment date. In July 2019, Shanghai Chijing filed counterclaims against LA GO GO to claim RMB10.19 million ($1.45 million) in damages, alleging that LA GO GO had not fulfilled its corresponding obligations as a landlord. As a result, the District Court froze the bank accounts of both Shanghai Chijing and LA GO GO. As of December 31, 2019, a total balance of RMB15.38 million ($2.2 million) was frozen in the bank accounts of LA GO GO. As of December 31, 2019, the Company had booked this restricted cash in other receivables. On March 10, 2020, the District Court entered a judgment in favor of LA GO GO and dismissed most of Shanghai Chijing’s counterclaims. The District Court ordered Shanghai Chijing to pay to LA GO GO an aggregate sum of RMB4.77 million ($0.68 million), which is the accumulated unpaid rent from April 2018 to January 2020. The District Court also ordered LA GO GO to pay Shanghai Chijing RMB1.49 ($0.21 million) for the expenses incurred from remodeling. Both parties were required to pay the monetary damages within ten days after the District Court’s decision. LA GO GO appealed to the Shanghai Second Appellate Court (the “Appellate Court”) to claim more damages, while Shanghai Chijing appealed to reverse the judgment. LA GO GO later requested to withdraw its appeal, which was granted by the Appellate Court. In June 2020, the Appellate Court entered a final decision to dismiss the appeal of Shanghai Chijing and sustained the District Court’s judgment. LA GO GO has not received RMB4.77 million ($0.68 million) in monetary damages from Shanghai Chijing as of September 30, 2020, and has applied for compulsory enforcement with the District Court. The total balance of RMB15.38 million ($2.2 million) in LA GO GO’s bank accounts were unfrozen after the final decision in July 2020.
F-23
Lawsuits against Client A
In November 2020, the Company’s two subsidiaries, Ever-Glory International Group Apparel Inc. and Goldenway Nanjing Garments Company Limited filed a complaint against Client A (“Client A”) for unpaid goods worth RMB 70.15 million ($10.75 million) in the Tianjin No.1 Intermediate People’s Court based on processing contracts between the parties. The Company has applied for interim measures with the court and has frozen bank accounts of Client A for a total amount of RMB 68.12 million ($10.44 million). The Company has delivered goods worth RMB 62.06 million ($9.51 million) to Client A pursuant to the processing contracts. The Company also seeks Client A for the payment of the loss incurred from the cost of raw materials paid to suppliers in the amount of RMB 8.09 million ($1.24 million) in reliance on the processing contracts. The Company estimated it is not more-likely-than-not the Company would lose the lawsuits.
NOTE 13 LOSS ON DECONSOLIATION OF A SUBSIDIARY
On September 21, 2020, Shanghai Yiduo Fashion Company Limited (“Shanghai Yiduo”), one of our subsidiaries, entered involuntary liquidation process in the No. 3 Intermediate People’s Court of Shanghai Municipality. Based on the court’s liquidation order, Jingjiang Maikeer Garment Co., Ltd. (“Maikeer”), which was the petitioner of the involuntary liquidation process, claimed that Shanghai Yiduo owed Maikeer RMB99,162 ($15,201), pursuant to the sales contracts between the parties between 2015 and 2017. The net loss of disposal for Shanghai Yiduo is $1.09 million, which represented our remaining investment in Yiduo. The transaction that resulted in the deconsolidation was not with a related party. Yiduo’s operations before the bankruptcy were immaterial and did not meet the standard to be separately presented as a discontinued operation.
NOTE 14 RISKS AND UNCERTAINTIES
Economic and Political Risks
The Company’s results of operations could be adversely affected by general conditions in the global economy, including conditions that are outside of its control, such as the impact of health and safety concerns from the outbreak of COVID-19. The outbreak in China has resulted in the reduction of customer traffic and temporary closures of shopping malls as mandated by the provincial governments in various provinces of China from late January to March, which has adversely affected the company in the retail business with a decline in sales since February 2020. The Company’s wholesale business is also significantly affected as the Company is facing a sharp decline in its order quantities. Some of the Company’s wholesale clients have also cancelled or postponed existing orders. Due to the Chinese factories’ shutdowns and traffic restrictions during the outbreak in China and potential shutdowns and traffic restrictions in the countries where the Company’s suppliers are located, The Company’s supply chain and business operations of its suppliers may be affected. Disruptions from the closure of supplier and manufacturer facilities, interruptions in the supply of raw materials and components, personnel absences, or restrictions on the shipment of the Company’s or its suppliers’ or customers’ products, could have adverse ripple effects on the Company’s manufacturing output and delivery schedule. The Company could also face difficulties in collecting its accounts receivables due to the effects of COVID-19 on its customers and risk gaining a large amount of bad debt. Global health concerns, such as COVID-19, could also result in social, economic, and labor instability in the countries and localities in which the Company, its suppliers and customers operate.
F-24
Although China has already begun to recover from the outbreak of COVID-19, the epidemic continues to spread on a global scale and there is the risk of the epidemic returning to China in the future, thereby causing further business interruption. While the potential economic impact brought by and the duration of COVID-19 may be difficult to assess or predict, a widespread pandemic could result in significant disruption of global financial markets, reducing our ability to access capital, which could in the future negatively affect the Company’s liquidity. In addition, a recession or market correction resulting from the spread of COVID-19 could materially affect the Company’s business and the value of its common stock. If the Company’s future sales continue to decline significantly, it may risk facing financial difficulties due to its recurring fixed expenses. The extent to which COVID-19 impacts the Company’s operating is uncertain and cannot be predicted at this time, and it will depend on many factors and future developments, including new information about COVID-19 and any new government regulations which may emerge to contain the virus, among others.
The majority of the Company’s operations are conducted in the PRC. Accordingly, the Company’s business, financial condition and results of operations may be influenced by the political, economic and legal environment in the PRC, and by the general state of the PRC economy. The Company’s operations in the PRC are subject to special considerations and significant risks not typically associated with companies in North America and Western Europe. These include risks associated with, among others, the political, economic and legal environment and foreign currency exchange. The Company’s results may be adversely affected by changes in the political and social conditions in the PRC, and by changes in governmental policies with respect to laws and regulations, anti-inflationary measures, currency conversion, remittances abroad, and rates and methods of taxation.
Credit risks
Management reviews the allowance for doubtful accounts each reporting period based on a detailed analysis of accounts receivable. In the analysis, management primarily considers the age of the customer’s receivable and also considers the credit worthiness of the customer, the economic conditions of the customer’s industry, and general economic conditions and trends, among other factors. If any of these factors change, the Company may also change its original estimates, which could impact the level of the Company’s future allowance for doubtful accounts. If judgments regarding the collectability of accounts receivables are incorrect, adjustments to the allowance may be required, which would reduce profitability.
Concentration risks
For the Company’s wholesale business, the Company had no customer which represented over 10% of the total revenues for the year ended December 31, 2020 and had one customer which represented approximately 24.3% of the total revenues for the year ended December 31, 2019. In 2020 and 2019, sales to our five largest customers generated approximately 38.7% and 47.3% of our total wholesale sales, respectively.
For our wholesale business, purchases from our five largest contract manufacturers represented approximately 45.15% and 41.4% of finished goods purchases for the years ended December 31, 2020 and 2019, respectively.
For the Company’s retail business, the Company had five suppliers represented approximately 10.8%, 15.9%, 16.0%, 19.8% and 34.6% of the total raw materials purchased, respectively during 2020. For the Company’s retail business, the Company had five suppliers represented approximately 10.2%, 12.9%, 15.2%, 19.6% and 35.6% of the total raw materials purchased, respectively during 2019.
For the wholesale business, the Company relied on two manufacturers for 12.6% and 11.2% of total purchased finished goods, respectively during 2020. For the wholesale business, the Company relied on two manufacturers for 10.2% and 10.4% of total purchased finished goods, respectively during 2019.
F-25
The Company’s revenues for the years ended December 31, 2020 and 2019 were earned in the following geographic areas:
| 2020 | 2019 | |||||||
| (In thousands of U.S. Dollars) | ||||||||
| Mainland China | $ | 29,055 | $ | 74,008 | ||||
| Hong Kong China | 19,873 | 26,126 | ||||||
| United Kingdom | 8,753 | 14,864 | ||||||
| Europe-Other | 19,950 | 25,668 | ||||||
| Japan | 11,406 | 18,901 | ||||||
| United States | 28,172 | 35,589 | ||||||
| Total wholesale business | 117,209 | 195,156 | ||||||
| Retail business | 150,145 | 187,945 | ||||||
| Total | $ | 267,354 | $ | 383,101 | ||||
Substantially all of the Company’s long-lived assets are located in the PRC as of December 31, 2020 and 2019.
NOTE 15 SEGMENTS
The Company reports financial and operating information in the following two segments:
| (a) | Wholesale segment |
| (b) | Retail segment |
| Wholesale segment | Retail segment | Total | ||||||||||
| (In thousands of U.S. Dollars) | ||||||||||||
| December 31, 2020 | ||||||||||||
| Segment profit or loss: | ||||||||||||
| Net revenue from external customers | $ | 117,209 | $ | 150,145 | $ | 267,354 | ||||||
| Income (loss) from operations | $ | 6,765 | $ | (2,622 | ) | $ | 4,143 | |||||
| Interest income | $ | 919 | $ | 95 | $ | 1,014 | ||||||
| Interest expense | $ | 2,070 | $ | 275 | $ | 2,345 | ||||||
| Depreciation and amortization | $ | 1,000 | $ | 4,291 | $ | 5,291 | ||||||
| Income (loss) before income tax expense | $ | 8,122 | $ | (2,380 | ) | $ | 5,742 | |||||
| Income tax expense | $ | 2,087 | $ | 382 | $ | 2,469 | ||||||
| Segment assets: | ||||||||||||
| Additions to property, plant and equipment | $ | 4,700 | $ | 1,654 | $ | 6,354 | ||||||
| Inventory | $ | 11,696 | $ | 42,197 | $ | 53,893 | ||||||
| Total assets | $ | 158,857 | $ | 172,869 | $ | 331,726 | ||||||
| December 31, 2019 | ||||||||||||
| Segment profit or loss: | ||||||||||||
| Net revenue from external customers | $ | 195,156 | $ | 187,945 | $ | 383,101 | ||||||
| Income (loss) from operations | $ | 12,376 | $ | (8,908 | ) | $ | 3,468 | |||||
| Interest income | $ | 969 | $ | 34 | $ | 1,003 | ||||||
| Interest expense | $ | 897 | $ | 325 | $ | 1,222 | ||||||
| Depreciation and amortization | $ | 979 | $ | 7,260 | $ | 8,239 | ||||||
| Income (loss) before income tax expense | $ | 13,241 | $ | (7,460 | ) | $ | 5,781 | |||||
| Income tax expense | $ | 3,189 | $ | 1,373 | $ | 4,562 | ||||||
| Segment assets: | ||||||||||||
| Additions to property, plant and equipment | $ | 1,254 | $ | 7,411 | $ | 8,665 | ||||||
| Inventory | $ | 12,659 | $ | 54,696 | $ | 67,355 | ||||||
| Total assets | $ | 88,906 | $ | 212,765 | $ | 301,671 | ||||||
F-26
ITEM 9. CHANGES IN AND DISAGREEMENTS WITH ACCOUNTANTS ON ACCOUNTING AND FINANCIAL DISCLOSURE
ITEM 9A. CONTROLS AND PROCEDURES
Evaluation of Disclosure Controls and Procedures
We maintain disclosure controls and procedures that are designed to ensure that information required to be disclosed in our reports under the Securities Exchange Act of 1934, as amended (the “Exchange Act”) is recorded, processed, summarized and reported within the time periods specified in the SEC’s rules and forms, and that such information is accumulated and communicated to our management, including its chief executive officer and chief financial officer, as appropriate, to allow timely decisions regarding required disclosure.
Limitations on the Effectiveness of Disclosure Controls. In designing and evaluating the disclosure controls and procedures, management recognizes that any controls and procedures, no matter how well designed and operated, can provide only reasonable assurance of achieving the desired control objectives, and management necessarily is required to apply its judgment in evaluating the cost-benefit relationship of possible controls and procedures.
Evaluation of Disclosure Controls and Procedures. Under the supervision and with the participation of our management, including our chief executive officer and our chief financial officer, we carried out an evaluation of the effectiveness of the design and operation of our disclosure controls and procedures for the period ended December 31, 2020. Based on the foregoing, our chief executive officer and chief financial officer concluded that our disclosure controls and procedures (as defined in Rules 13a-15(e) and 15d-15(e) under the Exchange Act) were operating effectively as of December 31, 2020.
Management’s Annual Report on Internal Controls Over Financial Reporting
Our management is also responsible for establishing and maintaining adequate internal controls over financial reporting. Internal control over financial reporting is defined in Rule 13a-15(f) and 15d-15(f) promulgated under the Exchange Act as a process designed by, or under the supervision of, our principal executive and principal financial officers and effected by our Board of Directors (notably, the Audit Committee thereof), management and other personnel, to provide reasonable assurance regarding the reliability of financial reporting and the preparation of financial statements for external purposes in accordance with generally accepted accounting principles and includes those policies and procedures that:
| ● | Pertain to the maintenance of records that in reasonable detail accurately and fairly reflect the transactions and dispositions of the assets of the Company; | |
| ● | Provide reasonable assurance that transactions are recorded as necessary to permit preparation of financial statements in accordance with generally accepted accounting principles, and that receipts and expenditures of the Company are being made only in accordance with authorizations of management and directors of the Company; and | |
| ● | Provide reasonable assurance regarding prevention or timely detection of unauthorized acquisition, use or disposition of our assets that could have a material effect on the financial statements. |
Because of its inherent limitations, our internal control over financial reporting may not prevent or detect all misstatements. Therefore, even those systems determined to be effective can provide only reasonable assurance with respect to financial statement preparation and presentation. Projections of any evaluation of effectiveness to future periods are subject to the risk that controls may become inadequate because of changes in conditions, or that the degree of compliance with the policies or procedures may deteriorate.
Our management, including our Chief Executive Officer and our Chief Financial Officer, has assessed the effectiveness of our internal control over financial reporting as of December 31, 2020. In making this assessment, management used the criteria set forth by the Committee of Sponsoring Organizations of the Tread way Commission (COSO) in Internal Control—Integrated Framework. Based on the criteria described in “Internal Control—Integrated Framework”, our management concluded that our internal control over financial reporting was effective as of December 31, 2020. This annual report does not need an attestation report of our registered public accounting firm regarding internal control over financial reporting.
Changes in Internal Control Over Financial Reporting
During the fourth quarter of the fiscal year ended December 31, 2020, there were no other changes in our internal control over financial reporting that have materially affected, or are reasonably likely to materially affect, our internal control over financial reporting.
None.
40
ITEM 10. DIRECTORS AND EXECUTIVE OFFICERS AND CORPORATE GOVERNANCE
Board of Directors and Management
The Board of Directors oversees our management and our business affairs in order to ensure that our stockholder’s interests are best served. Our Board does not involve itself in our day-to-day operations. It establishes with management the objectives and strategies to be implemented and monitors management’s general performance and conduct.
The following table includes the names, positions held, and ages of our current executive officers and directors as of December 31, 2020:
| Name | Age | Position |
Held Position Since | |||
| Edward Yihua Kang | 58 | Chief Executive Officer, President, and Director | 2005 | |||
| Jiajun Sun | 48 | Chief Operating Officer and Director | 2005 | |||
| Jason Jiansong Wang | 42 | Chief Financial Officer and Secretary | 2010 | |||
| Jianhua Wang (1)(2)(3) | 54 | Director | 2014 | |||
| Zhixue Zhang (1)(2)(3) | 54 | Director | 2008 | |||
| Merry Tang (1) (2)(3) | 61 | Director | 2011 |
| (1) | Member of the Audit Committee |
| (2) | Member of the Compensation Committee |
| (3) | Member of the Nominating and Corporate Governance Committee |
Each director will hold office until the next annual meeting of shareholders and until his or her successor has been elected and qualified.
Edward Yihua Kang has served as our President and Chief Executive Officer and as the Chairman of our Board of Directors, since 2005. From December 1993 to January 2008, Mr. Kang served as the President and Chairman of the Board of Directors of Goldenway. Mr. Kang has extensive worldwide managerial and operational experience focusing upon business development and strategic planning. Mr. Kang formerly was the Senior lecturer at the Management College, Nanjing Aeronautics and Astronautics University, and the Vice General Manager of the Import and Export Department of Nanjing Shenda Company. Mr. Kang earned a MS degree from Peking University, a bachelor’s degree in Management from Beijing Aeronautics and Astronautics University and a bachelor’s degree in Engineering from Nanjing Aeronautics and Astronautics University. Mr. Kang’s extensive experience in the garment industry, his acute vision and outstanding leadership capability, as well as his commitment to the Company since its inception make him well-qualified in the Board’s opinion to serve as our Chairman of the Board.
Jiajun Sun has served as our Chief Operating Officer and a member of our Board of Directors since 2005. Mr. Sun also has served as a member of the Board of Directors of Goldenway since 2000 and as a member of the Board of Directors of New-Tailun since 2006. From July 1996 to November 2002, Mr. Sun was the General Manager of International Trade Department at Goldenway. Mr. Sun has more than 16 years’ experience in import and export in the textile industry. Mr. Sun earned his bachelor’s degree from the Wuhan Textile Industry Institute. Mr. Sun has accumulated substantial institutional knowledge of our business and operations. His managing experiences and analytical skills make him well positioned for his role as one of our Directors.
41
Jianhua Wang was appointed as a member of the Board of Directors and chairman of the nominating & governance committee on September 24, 2014 and serves on the Audit Committee and compensation committee. Mr. Wang is the Chief Lawyer of Wang Jianhua Law Offices, a boutique law firm based in Kunshan city, Jiangsu Province. Mr. Wang had more than 21 years of practicing experience in corporate, securities and business laws in China. He held numerous honors and distinctions, including being listed as one of Outstanding Young Lawyers of Jiangsu Province. He was a member of the Standing Committee of People’s Political Consultant Committee of Kunshan City. He is currently a member of the Advisory Board of Legal Affairs of The People’s Government of Kunshan City, Vice Chairman of the Entrepreneurs Chamber of Commerce of Peking University Alumni of Suzhou City, Vice Chairman of the Bar of Kunshan City, a member of the Social Security and Labor Law Committee of the Jiangsu Provincial Bar. He had a master’s degree in Executive Master of Business Administration (EMBA) from Guanghua School of Management Peking University.
Zhixue Zhang was appointed to the Board of Directors in March 2008 and serves on the Audit Committee and as chairman of the Compensation Committee. Mr. Zhang is a professor of Organizational Management at Peking University, and has held this position since August 2008. Mr. Zhang has over fifteen years of experience in the fields of organizational psychology, management, and organizational culture as it relates to conducting business within China and with Chinese businesses. From August 2001 to July 2008, he was the Associate professor at Peking University. From August 2006 to June 2007, he was a Freeman Fellow at the University of Illinois at Urbana-Champaign. From September 2001 to March 2002, he was a visiting scholar at the Kellogg School of Management at Northwestern University. Mr. Zhang holds a Ph.D. from the University of Hong Kong, and a M.Sc. from Beijing Normal University, and a B.Sc. from Henan University. Mr. Zhang’s life-long background of management education, as well as his business aptitude and strong analytical skills, qualify him for his position as one of our Directors.
Merry Tang was appointed as a member of the Board of Directors and chairwoman of the Audit Committee, and a member of the Compensation Committee and the Nominating and the Corporate Governance Committee of the Board in August 31, 2011. She has been an independent director for China Sunergy Co., Ltd. (Nasdaq: CSUN), a specialized manufacturer of solar cell and module products in China since June 2008. She is currently a principal and managing partner of GTZY CPA Group, LLC. Ms. Tang served a managing director at GTA International, LLC and partner at Tang & Company, PC — both U.S.-based CPA firms offering services in risk assessment, audit engagements and Sarbanes-Oxley related documentation to leading banks, financial service providers and telecommunications firms from 2006 to 2008. Prior to forming GZTY CPA Group, LLC, she served as a senior auditor in PricewaterhouseCoopers, LLC from 2004 to 2006. Ms. Tang graduated from the Central University of Finance & Banking, Beijing, China with a bachelor’s degree in banking in 1983 and a master’s degree in finance in 1986, before going on to receive her master’s degree in accounting from the State University of New York at Albany in 1993.
Jiansong Wang was appointed as the Chief Financial Officer and Corporate Secretary in September 2010. From September 2009 to September 1, 2010, he was the General Manager of the Accounting Department in Ever-Glory International Group Apparel Inc., a subsidiary of the Company. From July 2006 to August 2009, he served as the International Settlement Accountant for Goldenway Nanjing Garments Co. Ltd., a subsidiary of the Company. From March 2004 to June 2006, he served as the General Manager of the Accounting Department in MG Garment Manufacturing Co., Ltd. From July 2002 to February 2004, Mr. Wang served as the Cost Accountant in Nanjing GongNongBing Textile (Group) Co., Ltd. Mr. Wang earned a master’s degree in Master of Professional Accounting (MPACC) from Hohai University in the PRC.
Director Qualifications
We seek directors with established strong professional reputations and experience in areas relevant to the strategy and operations of our businesses. We also seek directors who possess the qualities of integrity and candor, who have strong analytical skills and who are willing to engage management and each other in a constructive and collaborative fashion. We also seek directors who have the ability and commitment to devote significant time and energy to service on the Board and its committees. We believe that all of our directors meet the foregoing qualifications.
Our directors have backgrounds in a variety of different areas including industry, operation, marketing, strategic business management, and finance. We believe that the backgrounds and skills of our directors bring a diverse range of perspectives to the Board.
42
Board Practices
Our business and affairs are managed under the direction of our Board of Directors. The primary responsibilities of our board of directors are to provide oversight, strategic guidance, counseling, and direction to our management. It is our expectation that the Board of Directors will meet regularly on a quarterly basis and additionally as required.
Board Leadership Structure
The Board of Directors believes that Mr. Kang’s service as both Chairman of the Board and Chief Executive Officer is in the best interest of the Company and its shareholders. Mr. Kang possesses detailed and in-depth knowledge of the issues, opportunities and challenges facing the Company and its business and is thus best positioned to develop agendas that ensure that the Board’s time and attention are focused on the most critical matters. His combined role enables decisive leadership, ensures clear accountability, and enhances our ability to communicate its message and strategy clearly and consistently to our shareholders, employees, and customers. We have three independent directors. We do not have a lead independent director.
Board’s Role in Risk Oversight
Our Board of Directors has overall responsibility for risk oversight. To effectively achieve the goal of efficient risk management, the Board has delegated responsibility for the oversight of specific risks to Board committees as follows:
| ● | The Audit Committee oversees our risk policies and processes relating to the financial statements and financial reporting processes, as well as key credit risks, liquidity risks, market risks and compliance, and the guidelines, policies and processes for monitoring and mitigating those risks. | |
| ● | The Compensation Committee oversees risks related to our director compensation. | |
|
●
|
The Nominating and Corporate Governance Committee identifies and proposes new potential director nominees to the board of directors and review our corporate governance policies. |
Our Board of Directors is responsible for the approval of all related party transactions according to our Code of Ethics.
Family relationship
There are no family relationships, or other arrangements or understandings between or among any of the directors, executive officers or other person pursuant to which such person was selected to serve as a director or officer.
Involvement in Certain Legal Proceedings
No director, person nominated to become a director, executive officer, promoter or control person of the Company has, during the last ten years: (i) been convicted in or is currently subject to a pending criminal proceeding (excluding traffic violations and other minor offenses); (ii) been a party to a civil proceeding of a judicial or administrative body of competent jurisdiction and as a result of such proceeding was or is subject to a judgment, decree or final order enjoining future violations of, or prohibiting or mandating activities subject to any Federal or state securities or banking or commodities laws including, without limitation, in any way limiting involvement in any business activity, or finding any violation with respect to such law; (iii) has any bankruptcy petition been filed by or against the business of which such person was an executive officer or a general partner, whether at the time of the bankruptcy or for the two years prior thereto; (iv) been the subject of, or a party to, any Federal or State judicial or administrative order, judgment, decree, or finding, not subsequently reversed, suspended or vacated, relating to an alleged violation of: (a) Any Federal or State securities or commodities law or regulation; or (b) Any law or regulation respecting financial institutions or insurance companies including, but not limited to, a temporary or permanent injunction, order of disgorgement or restitution, civil money penalty or temporary or permanent cease-and-desist order, or removal or prohibition order; or (c) Any law or regulation prohibiting mail or wire fraud or fraud in connection with any business entity; nor (v) been the subject of, or a party to, any sanction or order, not subsequently reversed, suspended or vacated, of any self-regulatory organization (as defined in Section 3(a)(26) of the Exchange Act (15 U.S.C. 78c(a)(26))), any registered entity (as defined in Section 1(a)(29) of the Commodity Exchange Act (7 U.S.C. 1(a)(29))), or any equivalent exchange, association, entity or organization that has disciplinary authority over its members or persons associated with a member. (covering stock, commodities or derivatives exchanges, or other SROs).
43
Board Committees
In March 2008, the Board created the Audit Committee and the Compensation Committee and has adopted charters for these committees. In December 2013, the Board created the Nominating and Corporate Governance Committee and adopted its charter. The Board has determined that in its judgment, Ms. Merry Tang, Mr. Wang and Mr. Zhang are independent directors within the meaning of Rule 5005 of NASDAQ Listing Rules. Accordingly, all members of the Audit Committee are independent within the meaning of Rule 5005 of NASDAQ Listing Rules.
Audit Committee
The Board of Directors adopted and approved a charter for the Audit Committee on March 13, 2008, and the charter was amended on May 26, 2008, on June 20, 2008 and further amended December 22, 2015. Currently, three directors comprise the Audit Committee: Ms. Tang, Mr. Wang and Mr. Zhang. Ms. Tang serves as the chairwoman of the Audit Committee. The members of the Audit Committee are currently “independent directors” as that term is defined in Rule 5005 of NASDAQ Listing Rules. Ms. Tang qualifies as an “audit committee financial expert” as that term is defined in applicable regulations of the SEC.
Our Audit Committee is responsible, in accordance with the Audit Committee charter, for recommending our independent auditors, and overseeing our audit activities and certain financial matters to protect against improper and unsound practices and to furnish adequate protection to all assets and records.
Our Audit Committee pre-approves all audit and non-audit services provided by our independent auditors. These services may include audit services, audit-related services, tax services and other services. Pre-approval is generally provided for up to one year and any pre-approval is detailed as to a particular service or category of services and is generally subject to a specific budget. The Audit Committee has delegated pre-approval authority to its Chairman when expedition of services is necessary. The independent auditors and management are required to periodically report to the full Audit Committee regarding the extent of services provided by the independent auditor in accordance with this pre-approval, and the fees for the services performed to date.
Compensation Committee
The Compensation Committee currently consists of Mr. Wang, Mr. Zhang and Ms. Merry Tang. Mr. Zhang serves as chairman of the Compensation Committee. The members of the Compensation Committee are currently “independent directors” as that term is defined in Rule 5005 of NASDAQ Listing Rules.
In accordance with the Compensation Committee’s Charter, the Compensation Committee is responsible for overseeing and, and as appropriate, making recommendations to the Board regarding the annual salaries and other compensation of our executive officers and general employees and other polices, providing assistance and recommendations with respect to the compensation policies and practices of the Company.
Nominating and Corporate Governance Committee
Nominating and Corporate Governance Committee currently consists of Mr. Wang, Mr. Zhang, and Ms. Tang. Mr. Wang serves as chairman of the Nominating and Corporate Governance Committee. The members of the Nominating and Corporate Governance Committee are currently “independent directors” as that term is defined in Rule 5005 of NASDAQ Listing Rules.
In accordance with the Nominating and Governance Committee’s Charter, the Nominating and Corporate Governance Committee is responsible to identity and propose new potential director nominees to the board of directors for consideration and review our corporate governance policies.
Section 16(a) of the Exchange Act
Section 16(a) of the Exchange Act, as amended, requires our directors and certain of our officers, as well as persons who own more than 10% of a registered class of our equity securities (“Reporting Persons”), to file reports with the SEC. To our knowledge, based solely on review of the copies of such reports furnished to us and written representations that no other reports were required, and all Section 16(a) filing requirements applicable to officers, directors and greater than ten percent shareholders were complied with during the fiscal year ended December 31, 2018.
44
Code of Business Conduct and Ethics
We have adopted a code of business conduct and ethics that applies to our officers, directors, and employees, including our Chief Executive Officer, senior executive officers, principal accounting officer, controller, and other senior financial officers. Our code of business conduct and ethics is available on our website at www.everglorygroup.com. A copy of our code of business conduct will be provided to any person without charge, upon written request sent to us at our offices located at 509 Chengxin Road, Jiangning Development Zone, Nanjing, Jiangsu Province, China, Attention “Shareholder Relations.”
Changes in Nominating Process
There are no material changes to the procedures by which security holders may recommend nominees to our Board.
Meetings of the Board of Directors and Annual Meeting Attendance
Our board of directors met telephonically once in 2020 and also acted by unanimous written consents. Each member of our board of directors was present at one hundred (100%) percent or more of the board of director’s meetings held.
The Company does not have a policy with respect to Board members’ attendance at the annual meeting of stockholders.
ITEM 11. EXECUTIVE COMPENSATION
Compensation Discussion and Analysis
This compensation discussion and analysis describes the material elements of the compensation awarded to our current executive officers. This compensation discussion focuses on the information contained in the following tables and related footnotes and narrative for the last completed fiscal year. Our Board of Directors and the Compensation Committee, since its chartering, has overseen and administered our executive compensation program.
Our current executive compensation program presently includes a base salary. Our compensation program does not include (i) discretionary annual cash performance-based incentives, (ii) termination/severance and change of control payments, or (iii) perquisites and benefits.
Our Compensation Philosophy and Objectives
Our philosophy regarding compensation of our executive officers includes the following principles:
| ● | our compensation program should align the interests of our management team with those of our shareholders; | |
| ● | our compensation program should reward the achievement of our strategic initiatives and short- and long-term operating and financial goals; |
| ● | compensation should appropriately reflect differences in position and responsibility; compensation should be reasonable and bear some relationship with the compensation standards in the market in which our management team operates; and | |
| ● | the compensation program should be understandable and transparent. |
In order to implement such compensation principles, we have developed the following objectives for our executive compensation program:
| ● | overall compensation levels must be sufficiently competitive to attract and retain talented leaders and motivate those leaders to achieve superior results; | |
| ● | a portion of total compensation should be contingent on, and variable with, achievement of objective corporate performance goals, and that portion should increase as an executive’s position and responsibility increases; | |
| ● | total compensation should be higher for individuals with greater responsibility and greater ability to influence our achievement of operating goals and strategic initiatives; |
| ● | the number of elements of our compensation program should be kept to a minimum, and those elements should be readily understandable by and easily communicated to executives, shareholders, and others; and | |
| ● | executive compensation should be set at responsible levels to promote a sense of fairness and equity among all employees and appropriate stewardship of corporate resources among shareholders. |
45
Determination of Compensation Awards
Our Board of Directors is provided with the primary authority to determine the compensation awards available to our executive officers. To aid the Board of Directors in making its determination for the last fiscal year, our current senior management provided recommendations to the Compensation Committee regarding the compensation of Chief Executive Officer and Chief Operating Officer.
Compensation Benchmarking and Peer Group
Our Board of Directors did not rely on any consultants or utilize any peer company comparisons or benchmarking in 2020 in setting executive compensation. However, our management has considered competitive market practices by reviewing publicly available information relating to compensation of executive officers at other comparable companies in the apparel industry in China in making its recommendations to our Board of Directors regarding our executives’ compensation for fiscal year 2020. As our company evolves, we expect to take steps, including the utilization of peer company comparisons and/or hiring of compensation consultants, to ensure that the Board has a comprehensive picture of the compensation paid to our executives and with a goal toward total direct compensation for our executives that are on a par with the median total direct compensation paid to executives in peer companies if annually established target levels of performance at the company and business segment level are achieved.
Elements of Compensation
Presently, we compensate our executives with a base salary and annual a cash performance-based bonus. We do not pay any compensation to our executive officers in the form of discretionary long-term incentive plan awards or perquisites and other compensation, although our Board of Directors may recommend and institute such forms of compensation in the future.
Base Salaries
Base salary is used to recognize the experience, skills, knowledge and responsibilities required of our employees, including our named executive officers. All of our named executive officers, including our Chief Executive Officer, are subject to employment agreements, and accordingly each of their compensation has been determined as set forth in their respective agreement. When establishing base salaries since 2009, subject to the provisions of each person’s employment agreement, our Board and management considered a number of factors, including the seniority of the individual, the functional role of the position, the level of the individual’s responsibility, the ability to replace the individual, the base salary of the individual at their prior employment and the number of well qualified candidates to assume the individual’s role.
Long-Term Incentive Plan Awards
We currently have a 2014 equity incentive plan pursuant to which 1,500,000 shares were authorized. No stock awards or stock option grants were made to any of the named executive officers during the fiscal year ended December 31, 2020. No stock options were held by the named executive officers as of December 31, 2020.
Perquisites and Other Compensation
We do not have any retirement or pension plans in place for any of our named executives. Our named executive officers are eligible for group medical benefits that are generally available to and on the same terms as our other employees.
Management’s Role in the Compensation-Setting Process
Our management plays a role in our compensation-setting process. We believe this input from management to the Compensation Committee is needed for the committee to evaluate the performance of our officers, recommend business performance targets and objectives, and recommend compensation levels. Our management may from time to time, make recommendations to our Board of Directors regarding executive compensation. During this process, management may be asked to provide the board with their evaluation of the executive officers’ performances, the background information regarding our strategic financial and operational objectives, and compensation recommendations as to the executive officers.
46
Summary Compensation Table for Fiscal Years 2020, 2019 and 2018
The following table sets forth information for the fiscal years ended December 31, 2020, 2019 and 2018 concerning the compensation paid and awarded to all individuals serving as (a) our Chief Executive Officer and Chief Financial Officer (b) the three most highly compensated Executive Officers (other than our Chief Executive Officer and Chief Financial Officer) of ours and our subsidiaries at the end of our fiscal years ended December 31, 2020, 2019, and 2018 whose total compensation exceeded $100,000 for these periods, and (c) two additional individuals for whom disclosure would have been provided pursuant to (b) except that they were not serving as executive officers at the end of our fiscal year ended December 31, 2020. These individuals may be collectively referred to in this report as our “Named Executive Officers.”
| Name and Principal Position |
Fiscal Year |
Salary ($) |
Bonus ($) |
Stock Awards ($) |
Option Awards ($) |
Non- Equity Incentive Plan Compensation ($) |
Non- qualified Deferred Compensation Earnings ($) |
All Other Compensation ($) |
Total ($) |
|||||||||||||||||||||||||||
| Edward Yihua Kang | 2020 | 174,000 | 32,957 | 206,957 | ||||||||||||||||||||||||||||||||
| Chairman of the Board, Chief | 2019 | 174,000 | 12,528 | 186,528 | ||||||||||||||||||||||||||||||||
| Executive Officer and President | 2018 | 181,543 | 107,884 | 289,427 | ||||||||||||||||||||||||||||||||
| Jiansong Wang | 2020 | 21,257 | 24,685 | 45,942 | ||||||||||||||||||||||||||||||||
| Chief Financial Officer | 2019 | 21,257 | 22,040 | 43,297 | ||||||||||||||||||||||||||||||||
| 2018 | 20,363 | 20,878 | 41,241 | |||||||||||||||||||||||||||||||||
| (1) | All compensation is paid in Chinese RMB. For reporting purposes, the amounts in the table above have been converted to U.S. Dollars at the conversion rate of 6.90, 6.90 and 6.61 for 2020, 2019 and 2018, respectively. The officers listed in this table received no other form of compensation in the years shown, other than the salary set forth in this table. |
Other Compensation
Other than as described above, there were no post-employment compensation, pension or nonqualified deferred compensation benefits earned by the executive officers during the year ended December 31, 2020. We do not have any retirement, pension, or profit-sharing programs for the benefit of our directors, officers or other employees. The Board of Directors may recommend adoption of one or more such programs in the future.
Employment Contracts and Termination of Employment and Change-In-Control Arrangements
The Company entered into an employment agreement with Edward Yihua Kang on November 1, 2005 pursuant to which Mr. Kang was appointed as the Chief Executive Officer and President of the Company. In determining the compensation to be paid to Mr. Kang, the Board of Directors and the Compensation Committee reviewed the overall performance of the Company and the relative contribution of Mr. Kang in order to arrive at an appropriate compensation level.
The Company entered into an employment agreement with Jiajun Sun on November 1, 2005 pursuant to which Mr. Sun was appointed as the Chief Operating Officer of the Company. In determining the compensation to be paid to Mr. Sun, the Board of Directors and the Compensation Committee reviewed the overall performance of the Company and the relative contribution of Mr. Sun in order to arrive at an appropriate compensation level.
47
Although the Company does not have a written employment agreement with Jiansong Wang, he will be compensated approximately US$43,000 (RMB 290,000) per year for his services as the Chief Financial Officer and Secretary, which was based on the Board of Directors and the Compensation Committee’s review of the overall performance of the Company and the relative contribution of Mr. Wang.
There are no compensatory plans or arrangements, including payments to be received from us, with respect to any director or executive officer of us which would in any way result in payments to any such person because of his resignation, retirement, or other termination of employment with us, any change in control of the Company, or a change in the person’s responsibilities following a change in control of the Company.
Director Compensation for Fiscal 2020
The following table reflects all compensation awarded to, earned by or paid to our directors for the fiscal year ended December 31, 2020. Directors who are also officers do not receive any additional compensation for their services as directors.
| Name | Fees Earned or Paid in Cash ($) |
Stock Awards ($) |
Options Awards ($) |
Non-Equity Incentive Plan Compensation ($) |
Non-Qualified Deferred Compensation Earnings ($) |
All Other Compensation ($) |
Total ($) (1) |
|||||||||||||||||||||
| Edward Yihua Kang | 206,957 | — | — | — | — | — | 206,957 | |||||||||||||||||||||
| Jiajun Sun | 142,029 | — | — | — | — | — | 142,029 | |||||||||||||||||||||
| Jianhua Wang | — | 5,000 | — | — | — | — | 5,000 | |||||||||||||||||||||
| Zhixue Zhang | — | 5,000 | — | — | — | — | 5,000 | |||||||||||||||||||||
| Merry Tang | 34,000 | — | — | — | — | — | 34,000 | |||||||||||||||||||||
| (1) | All cash compensation was paid in RMB except the cash compensation paid to Ms. Tang. The amounts in the foregoing table have been converted into U.S. Dollar at the conversion rate of 6.90 RMB to the dollar. |
| Service Description | Amount (in U.S. dollars) | |||
| Base Compensation | $ | 3,000 | ||
| Audit Committee Member | $ | 1,000 | ||
| Compensation Committee Member | $ | 1,000 | ||
| Audit Committee Chairman | $ | 3,000 | ||
| Audit Committee Financial Expert | $ | 26,000 | ||
Each director may be appointed to perform multiple functions or serve on multiple committees, and accordingly, may be eligible to receive more than one category of compensation described above. Annual compensation will be paid in cash or a combination of stock and cash. Compensation paid in stock will be in the form of a number of shares of our restricted common stock having an aggregate value equal to the annual compensation, as determined by the average per share closing prices of our common stock as quoted on NASDAQ MKT, for the five trading days leading up to and including the last trading date of the quarter following which the shares are to be issued (i.e. when the shares are issued within 30 days following the end of the second quarter, and the fourth quarter when the shares are issued within 30 days following the end of the fourth quarter) of the year for which compensation is being paid. Compensation, in the form of shares, shall be issued and paid semi-annually, within 30 days following the end of the second quarter, and within 30 days after the end of the fourth quarter, of each calendar year. In addition, the annual compensation will be prorated daily (based on a 360-day year) for any portion of the year during which a director serves. Independent directors are also eligible for reimbursement of all travel and other reasonable expenses relating to the directors’ attendance of board meetings. In addition, we have agreed to reimburse independent directors for reasonable expenses incurred in connection with the performance of duties as a director of the Company.
Outstanding Equity Awards at Fiscal Year-End
None of our executive officers was granted or otherwise received any option, stock, or equity incentive plan awards during 2020 and there were no outstanding unexercised options previously awarded to our officers and directors, at the fiscal year end, December 31, 2020.
48
ITEM 12. SECURITY OWNERSHIP OF CERTAIN BENEFICIAL OWNERS AND MANAGEMENT AND RELATED STOCKHOLDER MATTERS
The following table sets forth information regarding the beneficial ownership of our common stock as of March 18, 2020, for each of the following persons:
| ● | each of our directors and each of the named executive officers in the “Management” section of this Annual Report; | |
| ● | all directors and named executive officers as a group; and | |
| ● | each person who is known by us to own beneficially five percent or more of our common stock. |
Beneficial ownership is determined in accordance with the rules of the SEC. Unless otherwise indicated in the table, the persons and entities named in the table have sole voting and sole investment power with respect to the shares set forth opposite the shareholder’s name. Unless otherwise indicated, the address of each beneficial owner listed below is c/o Ever-Glory International Group, Inc. The percentage of class beneficially owned set forth below is based on 14,810,660 shares of our common stock outstanding on March 19, 2021.
| Name of Beneficial Owner | Amount and Nature of Beneficial Ownership of Common Stock (1) | Percent of Class | ||||||
| Executive Officers and Directors | ||||||||
| Edward Yihua Kang | 4,977,115 | 33.60 | % | |||||
| Jiajun Sun | 174,800 | 1.18 | % | |||||
| Jason Jiansong Wang | - | - | ||||||
| Merry Tang | 10,399 | * | ||||||
| Zhixue Zhang | 27,606 | * | ||||||
| Jianhua Wang | 13,086 | * | ||||||
| All Executive Officers and Directors as a Group (six persons) | 5,203,006 | 35.13 | % | |||||
| 5% Holders | ||||||||
| Ever-Glory Enterprises (H.K.) Ltd. (2) | 5,623,098 | 37.97 | % | |||||
| Huake Kang (2) | 5,623,098 | 37.97 | % | |||||
| * | less than 1% |
| (1) | The percentage of shares beneficially owned is based on 14,810,660 shares of common stock outstanding as of March 19, 2021. Except as otherwise noted, shares are owned beneficially and of record, and such record shareholder has sole voting, investment, and dispositive power of the shares. |
| (2) | Huake Kang is the sole director and majority shareholder of Ever-Glory Enterprises (H.K.) Ltd. and, as such, may be deemed to be the beneficial owner of the 5,623,098 shares held by Ever-Glory Enterprises (H.K.) Ltd. Huake Kang is the son of Edward Yihua Kang. |
Equity Compensation Plan Information
See Part II, Item 5, under the heading, “Securities Authorized for Issuance under Equity Compensation Plans” for information on compensation plans under which our equity securities are authorized for issuance.
ITEM 13. CERTAIN RELATIONSHIPS AND RELATED TRANSACTIONS AND DIRECTOR INDEPENDENCE
Related Party Transactions
Mr. Kang is the Company’s Chairman and Chief Executive Officer. Ever-Glory Enterprises (HK) Ltd. (Ever-Glory Enterprises) is the Company’s major shareholder. Mr. Xiaodong Yan was Ever-Glory Enterprises’ sole shareholder and sole director. Mr. Huake Kang, Mr. Kang’s son, acquired 83% interest of Ever-Glory Enterprises and became its sole director in 2014. All transactions associated with the following companies controlled by Mr. Kang or his son are considered to be related party transactions, and it is possible that the terms of these transactions may not be the same as those that would result from transactions between unrelated parties. All related party outstanding balances are short-term in nature and are expected to be settled in cash.
49
Other income from Related Parties
Jiangsu Wubijia Trading Company Limited (“Wubijia”) is an entity engaged in high-grade home goods sales and is controlled by Mr. Kang. Wubijia has sold their home goods on consignment in some Company’s retail stores since the third quarter of 2014.
| 2020 | 2019 | |||||||
(In thousands of U.S. Dollars) | ||||||||
| The Company received from the customers | $ | 16 | 71 | |||||
| The Company paid to Wubijia | (16 | ) | (58 | ) | ||||
| The net income recorded as other income | $ | - | $ | 13 | ||||
Included in other income for the years ended December 31, 2020 and 2019 is rental income from EsC’Lav, the entity controlled by Mr. Kang under operating lease agreement with term though 2020. The rental income is $23,945 and $26,100 for the years ended December 31, 2020 and 2019, respectively.
Other expenses due to Related Parties
Included in other expenses for the years ended December 31, 2020 and 2019 are rental expenses due to entities controlled by Mr. Kang under operating lease agreements as follows:
| 2020 | 2019 | |||||||
| (In thousands of U.S. Dollars) | ||||||||
| Chuzhou Huarui | $ | 207 | $ | 207 | ||||
| Kunshan Enjin | 87 | 87 | ||||||
| Total | $ | 294 | $ | 294 | ||||
The Company leases Chuzhou Huarui and Kunshan Enjin’s warehouse spaces because the locations are convenient for transportation and distribution.
Purchases from, and Sub-contracts with Related Parties
The Company purchased raw materials of $1.10 million and $1.20 million during the years ended 2020 and 2019, respectively, from Nanjing Knitting.
In addition, the Company sub-contracted certain manufacturing work to related companies totaling $17.0 million and $24.2 million for the years ended December 31, 2020 and 2019, respectively. The Company provided raw materials to the sub-contractors and was charged a fixed fee for labor provided by the sub-contractors.
Purchases with related parties included in cost of sales for the years ended December 31, 2020 and 2019 are as follows:
| 2020 | 2019 | |||||||
| (In thousands of U.S. Dollars) | ||||||||
| Ever-Glory Vietnam | $ | 11,335 | $ | 12,952 | ||||
| Chuzhou Huarui | 2,240 | 6,200 | ||||||
| Fengyang Huarui | 1,352 | 2,225 | ||||||
| Nanjing Ever-Kyowa | 948 | 1,534 | ||||||
| Nanjing Knitting | 1,096 | 1,201 | ||||||
| EsC’Lav | 39 | 136 | ||||||
| Total | $ | 17,010 | $ | 24,248 | ||||
50
Accounts Payable – Related Parties
The accounts payable to related parties at December 31, 2020 and 2019 are as follows:
| 2020 | 2019 | |||||||
| (In thousands of U.S. Dollars) | ||||||||
| Ever-Glory Vietnam | $ | 1,727 | 2,260 | |||||
| Fengyang Huarui | 150 | 414 | ||||||
| Nanjing Ever-Kyowa | 384 | 386 | ||||||
| Chuzhou Huarui | 1,234 | 1,064 | ||||||
| Nanjing Knitting | 257 | 186 | ||||||
| Jiangsu Ever-Glory | 12 | 501 | ||||||
| Total | $ | 3,764 | $ | 4,811 | ||||
Amounts Due From Related Parties – Current Assets
The amounts due from related parties at December 31, 2020 and 2019 are as follows:
| 2020 | 2019 | |||||||
| (In thousands of U.S. Dollars) | ||||||||
| Jiangsu Ever-Glory | $ | 567 | $ | 123 | ||||
Jiangsu Ever-Glory is an entity engaged in importing/exporting, apparel-manufacture, real-estate development, car sales and other activities. Jiangsu Ever-Glory is controlled by Mr. Kang. During 2020 and 2019, the Company and Jiangsu Ever-Glory purchased raw materials on behalf of each other in order to obtain cheaper purchase prices. The Company purchased raw materials on Jiangsu Ever-Glory’s behalf and sold to Jiangsu Ever-Glory at cost for $0.9 million and $2.0 million during 2020 and 2019, respectively. Jiangsu Ever-Glory purchased raw materials on the Company’s behalf and sold to the Company at cost for $1.5 million and $2.0 million during 2020 and 2019, respectively.
Amounts Due From Related Party under Counter Guarantee Agreement
In March 2012, in consideration of the guarantees and collateral provided by Jiangsu Ever-Glory and Nanjing Knitting, the Company agreed to provide Jiangsu Ever-Glory a counter guarantee in the form of cash of not less than 70% of the maximum aggregate lines of credit obtained by the Company. Jiangsu Ever-Glory is obligated to return the full amount of the counter-guarantee funds provided upon the expiration or termination of the underlying lines of credit and is to pay an annual interest at the rate of 6.0% of the amounts provided. As of December 31, 2020 and 2019, Jiangsu Ever-Glory had provided guarantees for approximately $36.0 million (RMB 235.0 million) and $33.0 million (RMB 230.0 million) of lines of credit obtained by the Company, respectively. Jiangsu Ever-Glory and Nanjing Knitting have also provided their assets as collateral for certain of these lines of credit. As of December 31, 2020 and 2019, the value of the collateral, as per appraisals obtained by the banks in connection with these lines of credit is approximately $31.5 million (RMB 205.5 million) and $29.4 million (RMB 205.5 million), respectively. Mr. Kang has also provided a personal guarantee for $14.8 million (RMB 96.3 million) and $14.5 million (RMB 100.0 million) at the years ended of December 31, 2020 and 2019, respectively.
As of December 31, 2019, $4.7 million (RMB 32.8 million) was outstanding due from Jiangsu Ever-Glory under the counter guarantee agreement. During the year ended December 31, 2020, an additional $7.7 million (RMB 52.8 million) was provided to and repayment of $9.5 million (RMB 65.6 million) was received from Jiangsu Ever-Glory under the counter-guarantee agreement. As of December 31, 2020, the amount of the counter-guarantee had decreased to $3.1 million (RMB 20.0 million) (the difference represents currency exchange adjustment of $0.1 million), which was 8.5% of the aggregate amount of lines of credit. This amount plus accrued interest of $0.04 million (2020) and $0.3 million (2019) have been classified as a reduction of equity, consistent with the guidance of SEC Staff Accounting Bulletins 4E and 4G. As of December 31, 2020 and 2019, the amount classified as a reduction of equity was $3.4 million and $4.9 million, respectively. Interest of 0.5% is charged on net amounts due from Jiangsu Ever-Glory at each month end. Since January 1, 2019, the interest rate has changed to 0.3625% as the bank benchmark interest rate decreased. Interest income for the years ended December 31, 2020 and 2019 was approximately $0.04 million and $0.3 million, respectively.
51
ITEM 14. PRINCIPAL ACCOUNTANT FEES AND SERVICES
In December 2020 the Audit Committee retained BF Borgers CPA PC as our independent auditor.
Fees for audit services include fees associated with the annual audit and the review of documents filed with the SEC including quarterly reports on Form 10-Q and the Annual Report on Form 10-K. Tax fees included tax compliance, tax advices and tax planning work.
| 2020 | 2019 | |||||||
| (In thousands of U.S. Dollars) | ||||||||
| Audit fees | $ | 316 | $ | 335 | ||||
| Tax fees | $ | 9 | $ | 9 | ||||
52
ITEM 15. EXHIBITS, FINANCIAL STATEMENTS SCHEDULE
| (1) | Financial Statements |
The consolidated financial statements of Ever-Glory International Group, Inc. are included in Part II, Item 8 of this Report.
| (2) | Financial Statement Schedules |
Schedules are omitted because the required information is not present or is not present in amounts sufficient to require submission of the schedule or because the information required is given in the consolidated financial statements or the notes thereto.
| (3) | Exhibits |
53
| * | Filed herein. |
54
Pursuant to the requirements of Section 13 or 15(d) of the Securities Exchange Act of 1934, the registrant has duly caused this report to be signed on its behalf by the undersigned, thereunto duly authorized on the 30 day of March, 2021.
| Ever-Glory International Group, Inc., | ||
| By | /s/ Edward Yihua Kang | |
| Edward Yihua Kang, | ||
| Chief Executive Officer, President and Chairman of the Board | ||
Pursuant to the requirements of the Securities Exchange Act of 1934, this report has been signed below by the following persons on behalf of the registrant and in the capacities and on the dates indicated:
| Signature | Title | Date | ||
| /s/ Jiajun Sun | Chief Operating Officer and Director | March 30, 2021 | ||
| Jiajun Sun | ||||
| /s/ Jiansong Wang | Chief Financial Officer | March 30, 2021 | ||
| Jiansong Wang | (Principal Financial and Accounting Officer) | |||
| /s/ Jianhua Wang | Director | March 30, 2021 | ||
| Jianhua Wang | ||||
| /s/ Zhixue Zhang | Director | March 30, 2021 | ||
| Zhixue Zhang | ||||
| /s/ Merry Tang | Director | March 30, 2021 | ||
| Merry Tang |
55