Attached files
| file | filename |
|---|---|
| EX-21.1 - EXHIBIT 21.1 - DXP ENTERPRISES INC | exhibi21-1_10k2009.htm |
| EX-31.1 - EXHIBIT 31.1 - DXP ENTERPRISES INC | exhibit31-1_10k2009.htm |
| EX-23.1 - EXHIBIT 23.1 - DXP ENTERPRISES INC | exhibit23-1_10k2009.htm |
| EX-32.2 - EXHIBIT 32.2 - DXP ENTERPRISES INC | exhibit32-2_10k2009.htm |
| EX-32.1 - EXHIBIT 32.1 - DXP ENTERPRISES INC | exhibit32-1_10k2009.htm |
| EX-31.2 - EXHIBIT 31.2 - DXP ENTERPRISES INC | exhibit31-2_10k2009.htm |
UNITED STATES
SECURITIES AND EXCHANGE COMMISSION
Washington, D.C. 20549
Form 10-K
(Mark One)
|
|
[X]
|
ANNUAL REPORT PURSUANT TO SECTION 13 OR 15(d) OF THE SECURITIES EXCHANGE ACT OF 1934. For the fiscal year ended December 31, 2009
|
or
|
|
[ ]
|
TRANSITION REPORT PURSUANT TO SECTION 13 OR 15(d) OF THE SECURITIES EXCHANGE ACT OF 1934.
|
For the transition period from
|
to
|
Commission file number 0-21513
DXP Enterprises, Inc.
(Exact name of registrant as specified in its charter)
|
Texas
|
76-0509661
|
|||
|
(State or other jurisdiction
of incorporation or organization)
|
(I.R.S. Employer Identification Number)
|
|||
|
7272 Pinemont, Houston, Texas
|
77040
|
(713) 996-4700
|
||
|
(Address of principal executive offices)
|
(Zip Code)
|
(Registrant’s telephone number,
including area code)
|
Securities registered pursuant to Section 12(b) of the Act: None
Securities registered pursuant to Section 12(g) of the Act:
|
Common Stock, $0.01 Par Value
|
NASDAQ
|
|
|
(Title of Class)
|
(Name of exchange on which registered)
|
Indicate by check mark if the registrant is a well-known seasoned issuer, as defined in Rule 405 of the Securities Act. Yes [ ] No [X]
Indicate by check mark if the registrant is not required to file reports pursuant to Section 13 or Section 15(d) of the Act. Yes [ ] No [X]
Indicate by check mark whether the registrant (1) has filed all reports required to be filed by Section 13 or 15(d) of the Securities Exchange Act of 1934 during the preceding 12 months (or for such shorter period that the registrant was required to file such reports), and (2) has been subject to such filing requirements for the past 90 days. Yes [X] No [ ]
Indicate by check mark whether the registrant has submitted electronically and posted on its corporate Web site, if any, every Interactive Data File required to be submitted and posted pursuant to Rule 405 of Regulation S-T during the preceding 12 months (or for such shorter period that the registrant was required to submit and post such files).
[ ] Yes [ ] No
Indicate by check mark if disclosure of delinquent filers pursuant to Item 405 of Regulation S-K is not contained herein, and will not be contained, to the best of registrant's knowledge, in definitive proxy or information statements incorporated by reference in Part III of this Form 10-K or any amendment to this Form 10-K. [ ]
1
Indicate by check mark whether the registrant is a large accelerated filer, an accelerated filer, a non-accelerated filer, or a smaller reporting company. (See definitions of “large accelerated filer”, “accelerated filer”, and “smaller reporting company” in Rule 12b-2 of the Exchange Act).
Large accelerated filer [ ] Accelerated filer [X]
Non-accelerated filer [ ] (Do not check if a smaller reporting company) Smaller reporting company [ ]
Indicate by check mark whether the registrant is a shell company (as defined in Rule 12b-2 of the Act). Yes [ ] No [X]
Aggregate market value of the registrant's Common Stock held by non-affiliates of registrant as of June 30, 2009: $99,953,629.
Number of shares of registrant's Common Stock outstanding as of March 19, 2010: 12,945,981.
Documents incorporated by reference: Portions of the definitive proxy statement for the annual meeting of shareholders to be held in 2010 are incorporated by reference into Part III hereof.
2
|
TABLE OF CONTENTS
|
|||
|
DESCRIPTION
|
|||
|
Item
|
Page
|
||
|
PART 1
|
|||
|
1.
|
Business
|
4
|
|
|
1A.
|
Risk Factors
|
9
|
|
|
1B.
|
Unresolved Staff Comments
|
11
|
|
|
2.
|
Properties
|
11
|
|
|
3.
|
Legal Proceedings
|
11
|
|
|
4.
|
Submission of Matters to a Vote of Security Holders
|
11
|
|
|
PART II
|
|||
|
5.
|
Market for the Registrant's Common Equity, Related Stockholder Matters and Issuer Purchases of Equity Securities
|
12
|
|
|
6.
|
Selected Financial Data
|
13
|
|
|
7.
|
Management's Discussion and Analysis of Financial Condition and Results of Operations
|
14
|
|
|
7A.
|
Quantitative and Qualitative Disclosures about Market Risk
|
24
|
|
|
8.
|
Financial Statements and Supplementary Data
|
25
|
|
|
9.
|
Changes in and Disagreements with Accountants on Accounting and Financial Disclosure
|
52
|
|
|
9B.
|
Other Information
|
53
|
|
|
PART III
|
|||
|
10.
|
Directors, Executive Officers, and Corporate Governance
|
54
|
|
|
11.
|
Executive Compensation
|
54
|
|
|
12.
|
Security Ownership of Certain Beneficial Owners and Management
|
||
|
and Related Stockholder Matters
|
54
|
||
|
13.
|
Certain Relationships and Related Transactions, and Director Independence
|
54
|
|
|
14.
|
Principal Accountant Fees and Services
|
54
|
|
|
PART IV
|
|||
|
15.
|
Exhibits, Financial Statement Schedules
|
55
|
|
|
Signatures
|
59
|
||
DISCLOSURE REGARDING FORWARD-LOOKING STATEMENTS
This Annual Report on Form 10-K contains statements that constitute “forward-looking statements” within the meaning of the Private Securities Litigation Reform Act of 1995. Such statements can be identified by the use of forward-looking terminology such as “believes”, “expects”, “may”, “estimates”, “will”, “should”, “plans” or “anticipates” or the negative thereof or other variations thereon or comparable terminology, or by discussions of strategy. Any such forward-looking statements are not guarantees of future performance and involve significant risks and uncertainties, and actual results may vary materially from those discussed in the forward-looking statements as a result of various factors. These factors include the effectiveness of management’s strategies and decisions, our ability to affect our internal growth strategy, general economic and business conditions, developments in technology, our ability to effectively integrate businesses we may acquire, new or modified statutory or regulatory requirements and changing prices and market conditions. This report identifies other factors that could cause such differences. We cannot assure you that these are all of the factors that could cause actual results to vary materially from the forward-looking statements. We assume no obligation and do not intend to update these forward-looking statements.
3
PART I
This Annual Report on Form 10-K (this “Report”) contains, in addition to historical information, “forward-looking statements” that involve risks and uncertainties. DXP Enterprises, Inc.'s actual results could differ materially from those discussed in the forward-looking statements. Factors that could cause or contribute to such differences include, but are not limited to, those discussed in "Risk Factors", and elsewhere in this Annual Report on Form 10-K. Unless the context otherwise requires, references in this Report to the "Company" or "DXP" shall mean DXP Enterprises, Inc., a Texas corporation, together with its subsidiaries.
ITEM 1. Business
DXP was incorporated in Texas in 1996 to be the successor to a company founded in 1908. Since our predecessor company was founded, we have primarily been engaged in the business of distributing maintenance, repair and operating (“MRO”) products, equipment and service to industrial customers. We are organized into two segments: MRO and Electrical Contractor. Sales and operating income for 2007, 2008 and 2009, and identifiable assets at the close of such years for our business segments are presented in Note 16 of the Notes to the Consolidated Financial Statements.
The industrial distribution market is highly fragmented. Based on 2008 sales as reported by industry sources, we were the 16th largest distributor of MRO products in the United States. Most industrial customers currently purchase their industrial supplies through numerous local distribution and supply companies. These distributors generally provide the customer with repair and maintenance services, technical support and application expertise with respect to one product category. Products typically are purchased by the distributor for resale directly from the manufacturer and warehoused at distribution facilities of the distributor until sold to the customer. The customer also typically will purchase an amount of product inventory for its near term anticipated needs and store those products at its industrial site until the products are used.
We believe that the distribution system for industrial products in the United States, described in the preceding paragraph, creates inefficiencies at both the customer and the distributor levels through excess inventory requirements and duplicative cost structures. To compete more effectively, our customers and other users of MRO products are seeking ways to enhance efficiencies and lower MRO product and procurement costs. In response to this customer desire, three primary trends have emerged in the industrial supply industry:
|
·
|
Industry Consolidation. Industrial customers have reduced the number of supplier relationships they maintain to lower total purchasing costs, improve inventory management, assure consistently high levels of customer service and enhance purchasing power. This focus on fewer suppliers has led to consolidation within the fragmented industrial distribution industry.
|
|
·
|
Customized Integrated Service. As industrial customers focus on their core manufacturing or other production competencies, they increasingly are demanding customized integration services, ranging from value-added traditional distribution to integrated supply and system design, fabrication, installation and repair and maintenance services.
|
|
·
|
Single Source, First-Tier Distribution. As industrial customers continue to address cost containment, there is a trend toward reducing the number of suppliers and eliminating multiple tiers of distribution. Therefore, to lower overall costs to the MRO customer, some MRO distributors are expanding their product coverage to eliminate second-tier distributors and the difficulties associated with alliances.
|
Recent Acquisitions
Our growth strategy includes effecting acquisitions of businesses with complementary or desirable product lines, locations or customers. We completed 13 acquisitions since the beginning of 2005.
On August 20, 2005, we paid approximately $2.4 million to purchase the assets of a pump remanufacturer. We made this acquisition to enhance our ability to meet customer needs for shorter lead times on selected pumps. We assumed $1.0 million of liabilities and gave a $0.5 million credit to the seller to use to purchase maintenance, repair and operating supplies from us.
4
On December 1, 2005, we purchased 100% of R. A. Mueller, Inc. to expand geographically into Ohio, Indiana, Kentucky and West Virginia. DXP paid $7.3 million ($3.65 million cash and $3.65 million in promissory notes payable to the former owners) and assumed approximately $1.6 million of debt and $1.9 million of accounts payable and other liabilities.
On May 31, 2006, DXP purchased the businesses of Production Pump and Machine Tech. DXP acquired these businesses to strengthen DXP’s position with upstream oil and gas and pipeline customers. DXP paid approximately $8.9 million for the acquired businesses and assumed approximately $1.2 million worth of liabilities. The purchase price consisted of approximately $5.4 million paid in cash and $3.5 million in the form of promissory notes payable to the former owners of the acquired businesses. In addition, DXP may pay up to an additional $1.2 million contingent upon future earnings.
On October 11, 2006, we completed the acquisition of the business of Safety International. DXP acquired this business to strengthen DXP’s expertise in safety products and services. DXP paid $2.2 million in cash for the business of Safety International.
On October 19, 2006, DXP completed the acquisition of the business of Gulf Coast Torch & Regulator. DXP acquired this business to strengthen DXP’s expertise in the distribution of welding supplies. DXP paid approximately $5.5 million, net of $0.5 million of acquired cash, for the business of Gulf Coast Torch & Regulator, and assumed approximately $0.2 million worth of debt. Approximately $2.0 million of the purchase price was paid by issuing promissory notes payable to the former owners of Gulf Coast Torch & Regulator.
On November 1, 2006, DXP completed the acquisition of the business of Safety Alliance. DXP acquired this business to strengthen DXP’s expertise in safety products. DXP paid $2.3 million in cash for the business of Safety Alliance.
On May 4, 2007, DXP completed the acquisition of the business of Delta Process Equipment. DXP paid $10 million in cash for this business. DXP acquired this business to diversify DXP’s customer base in the municipal, wastewater and downstream industrial pump markets. The purchase price was funded by utilizing available capacity under DXP’s credit facility.
On September 10, 2007, DXP completed the acquisition of Precision Industries, Inc. DXP acquired this business to expand DXP’s geographic presence and strengthen DXP’s integrated supply offering. The Company paid $106 million in cash for Precision Industries, Inc. The purchase price was funded using approximately $24 million of cash on hand and approximately $82 million borrowed from a new credit facility.
On October 19, 2007, DXP completed the acquisition of the business of Indian Fire & Safety. DXP acquired this business to strengthen DXP’s expertise in safety products and services in New Mexico and Texas. DXP paid $6.0 million in cash, $3.0 million in the form of a promissory note and up to $3.0 million in future payments contingent upon future earnings.
On January 31, 2008, DXP completed the acquisition of the business of Rocky Mtn. Supply. DXP acquired this business to expand DXP’s presence in the Colorado area. DXP paid $3.9 million in cash and $0.7 million in seller notes.
On August 28, 2008, DXP completed the acquisition of PFI, LLC (“PFI”). DXP acquired this business to strengthen DXP’s expertise in the distribution of fasteners. DXP paid $66.4 million in cash for this business.
On December 1, 2008, DXP completed the acquisition of the business of Falcon Pump. DXP acquired this business to strengthen DXP’s pump offering in the Rocky Mountain area. DXP paid $3.1 million in cash, $0.8 million in seller notes and up to $1.0 million in future payments contingent upon future earnings of the acquired business.
5
MRO Segment
The MRO segment provides MRO products, equipment and integrated services, including technical design expertise and logistics capabilities, to industrial customers. We provide a wide range of MRO products in the fluid handling equipment, bearing, power transmission equipment, general mill, safety supply and electrical products categories. We offer our customers a single source of integrated services and supply on an efficient and competitive basis by being a first-tier distributor that can purchase products directly from the manufacturer. We also provide integrated services such as system design, fabrication, installation, repair and maintenance for our customers. We offer a wide range of industrial MRO products, equipment and services through a complete continuum of customized and efficient MRO solutions, ranging from traditional distribution to fully integrated supply contracts. The integrated solution is tailored to satisfy our customers’ unique needs.
SmartSourceSM, one of our proprietary integrated supply programs, allows a more effective and efficient way to manage the customer’s supply chain needs for MRO products. SmartSourceSM effectively lowers costs by outsourcing the customer’s purchasing, accounting and on-site supply/warehouse management to DXP, which reduces the duplication of effort by the customer and supplier. The program allows the customer to transfer all or part of their supply chain needs to DXP, so the customer can focus on their core business. DXP has a broad range of first-tier products to support a successful integrated supply offering. The program provides a productive, measurable solution to reduce cost and streamline procurement and sourcing operations.
We currently serve as a first-tier distributor of more than 1,000,000 items of which more than 45,000 are stock keeping units ("SKUs") for use primarily by customers engaged in the general manufacturing, oil and gas, petrochemical, service and repair and wood products industries. Other industries served by our MRO segment include mining, construction, chemical, municipal, food and beverage, agriculture and pulp and paper. Our MRO products include a wide range of products in the fluid handling equipment, bearing, power transmission equipment, general mill, safety products and electrical products. Our products are distributed from 112 service centers, 50 supply chain locations and 6 distribution centers.
Our fluid handling equipment line includes a full line of centrifugal pumps for transfer and process service applications, such as petrochemicals, refining and crude oil production; rotary gear pumps for low- to medium-pressure service applications, such as pumping lubricating oils and other viscous liquids; plunger and piston pumps for high-pressure service applications such as salt water injection and crude oil pipeline service; and air-operated diaphragm pumps. We also provide various pump accessories. Our bearing products include several types of mounted and unmounted bearings for a variety of applications. The hose products we distribute include a large selection of industrial fittings and stainless steel hoses, hydraulic hoses, Teflon hoses and expansion joints, as well as hoses for chemical, petroleum, air and water applications. We distribute seal products for downhole, wellhead, valve and completion equipment to oilfield service companies. The power transmission products we distribute include speed reducers, flexible-coupling drives, chain drives, sprockets, gears, conveyors, clutches, brakes and hoses. We offer a broad range of general mill supplies, such as abrasives, tapes and adhesive products, coatings and lubricants, cutting tools, fasteners, hand tools, janitorial products, pneumatic tools, welding supplies and welding equipment. We offer a broad range of fluid power and hydraulics solutions. Our safety products include eye and face protection products, first aid products, hand protection products, hazardous material handling products, instrumentation and respiratory protection products. We distribute a broad range of electrical products, such as wire conduit, wiring devices, electrical fittings and boxes, signaling devices, heaters, tools, switch gear, lighting, lamps, tape, lugs, wire nuts, batteries, fans and fuses.
In addition to distributing MRO products, we provide innovative pumping solutions. DXP provides fabrication and technical design to meet the capital equipment needs of our customers. DXP provides these solutions by utilizing manufacturer- authorized equipment and certified personnel. Pump packages require MRO and original equipment manufacturer, or OEM, equipment and parts such as pumps, motors and valves, and consumable products such as welding supplies. DXP leverages its MRO inventories and breadth of authorized products to lower the total cost and maintain the quality of our innovative pumping solutions.
Our operations managers support the sales efforts through direct customer contact and manage the efforts of the outside and direct sales representatives. We have structured compensation to provide incentives to our sales representatives, through the use of commissions, to increase sales. Our outside sales representatives focus on building long-term rela-
6
tionships with customers and, through their product and industry expertise, providing customers with product application, engineering and after-the sale services. The direct sales representatives support the outside sales representatives and are responsible for entering product orders and providing technical support with respect to our products. Because we offer a broad range of products, our outside and direct sales representatives are able to use their existing customer relationships with respect to one product line to cross-sell our other product lines. In addition, geographic locations in which certain products are sold also are being utilized to sell products not historically sold at such locations. As we expand our product lines and geographical presence through hiring experienced sales representatives, we assess the opportunities and appropriate timing of introducing existing products to new customers and new products to existing customers. Prior to implementing such cross-selling efforts, we provide the appropriate sales training and product expertise to our sales force.
Unlike many of our competitors, we market our products primarily as a first-tier distributor, generally procuring products directly from the manufacturers, rather than from other distributors. As a first-tier distributor, we are able to reduce our customers' costs and improve efficiencies in the supply chain.
We believe we have increased our competitive advantage through our traditional and integrated supply programs, which are designed to address the customer's specific product and procurement needs. We offer our customers various options for the integration of their supply needs, ranging from serving as a single source of supply for all or specific lines of products and product categories to offering a fully integrated supply package in which we assume the procurement and management functions, including ownership of inventory, at the customer's location. Our approach to integrated supply allows us to design a program that best fits the needs of the customer. For those customers purchasing a number of products in large quantities, the customer is able to outsource all or most of those needs to us. For customers with smaller supply needs, we are able to combine our traditional distribution capabilities with our broad product categories and advanced ordering systems to allow the customer to engage in one-stop shopping without the commitment required under an integrated supply contract.
We acquire our products through numerous original equipment manufacturers, or OEMs. We are authorized to distribute the manufacturers' products in specific geographic areas. All of our distribution authorizations are subject to cancellation by the manufacturer upon one-year notice or less. No manufacturer provided products that accounted for 10% or more or our revenues. We believe that alternative sources of supply could be obtained in a timely manner if any distribution authorization were canceled. Accordingly, we do not believe that the loss of any one distribution authorization would have a material adverse effect on our business, financial condition or results of operations. Representative manufacturers of our products include BACOU/DALLOZ, Baldor Electric, Emerson, Falk, G&L, Gates, Gould's, INA/Fag Bearing, LaCross Rainfair Safety Products, Martin Sprocket, National Oilwell, Norton Abrasives, NTN, Rexnord, SKF, ULTRA, 3M, Timken, Tyco, Union Butterfield, Viking and Wilden.
All of the segment’s long-lived assets are located in the U. S. and virtually all sales are recognized in the U. S.
At December 31, 2009, the MRO Segment had 1,687 full-time employees.
Electrical Contractor Segment
The Electrical Contractor segment was formed in 1998 with the acquisition of substantially all of the assets of an electrical supply business. The Electrical Contractor segment sells a broad range of electrical products, such as wire conduit, wiring devices, electrical fittings and boxes, signaling devices, heaters, tools, switch gear, lighting, lamps, tape, lugs, wire nuts, batteries, fans and fuses, to electrical contractors. The segment has one owned warehouse/sales facility in Memphis, Tennessee.
We acquire our electrical products through numerous OEMs. We are authorized to distribute the manufacturers' products in specific geographic areas. All of our distribution authorizations are subject to cancellation by the manufacturer upon one-year notice or less. No one manufacturer provides products that account for 10% or more of our revenues. We believe that alternative sources of supply could be obtained in a timely manner if any distribution authorization were canceled. Accordingly, we do not believe that the loss of any one distribution authorization would have a material adverse effect on our business, financial condition or results of operations. Significant vendors include Cutler-Hammer, Cooper, Killark, 3M, General Electric and Allied. To meet prompt delivery demands of its customers, this segment maintains large inventories.
7
All of the segment’s long-lived assets are located in the U. S. and virtually all sales are recognized in the U. S.
At December 31, 2009, the Electrical Contractor segment had 10 full-time employees.
On March 5, 2010, the Company sold all of the assets of the Electrical Contractor segment for approximately $1.4 million.
Competition
Our business is highly competitive. In the MRO segment we compete with a variety of industrial supply distributors, many of which may have greater financial and other resources than we do. Many of our competitors are small enterprises selling to customers in a limited geographic area. We also compete with larger distributors that provide integrated supply programs and outsourcing services similar to those offered through our SmartSourceSM program, some of which might be able to supply their products in a more efficient and cost-effective manner than we can provide. We also compete with catalog distributors, large warehouse stores and, to a lesser extent, manufacturers. While many of our competitors offer traditional distribution of some of the product groupings that we offer, we are not aware of any major competitor that offers on a non-catalog basis a product grouping as broad as our offering. Further, while certain catalog distributors provide product offerings as broad as ours, these competitors do not offer the product application, technical design and after-the-sale services that we provide. In the Electrical Contractor segment we compete against a variety of suppliers of electrical products, many of which may have greater financial and other resources than we do. We generally compete on service and price.
Insurance
We maintain liability and other insurance that we believe to be customary and generally consistent with industry practice. We retain a portion of the risk for medical claims, general liability, worker’s compensation and property losses. The various deductibles of our insurance policies generally do not exceed $200,000 per occurrence. There are also certain risks for which we do not maintain insurance. There can be no assurance that such insurance will be adequate for the risks involved, that coverage limits will not be exceeded or that such insurance will apply to all liabilities. The occurrence of an adverse claim in excess of the coverage limits that we maintain could have a material adverse effect on our financial condition and results of operations. The premiums for insurance have increased significantly over the past three years. This trend could continue. Additionally, we are partially self-insured for our group health plan, worker’s compensation, auto liability and general liability insurance. The cost of claims for the group health plan has increased over the past three years. This trend is expected to continue.
Government Regulation and Environmental Matters
We are subject to various laws and regulations relating to our business and operations, and various health and safety regulations as established by the Occupational Safety and Health Administration.
Certain of our operations are subject to federal, state and local laws and regulations controlling the discharge of materials into or otherwise relating to the protection of the environment. Although we believe that we have adequate procedures to comply with applicable discharge and other environmental laws, the risks of accidental contamination or injury from the discharge of controlled or hazardous materials and chemicals cannot be eliminated completely. In the event of such a discharge, we could be held liable for any damages that result, and any such liability could have a material adverse effect on us. We are not currently aware of any situation or condition that we believe is likely to have a material adverse effect on our results of operations or financial condition.
Employees
At December 31, 2009, we had 1,697 full-time employees. We believe that our relationship with our employees is good.
8
Available Information
Our Annual Report on Form 10-K, Quarterly Reports on Form 10-Q, Current Reports on Form 8-K, and amendments to those reports filed or furnished pursuant to Section 13(a) or 15(d) of the Securities Exchange Act of 1934 as amended (the “Exchange Act”), are available free of charge through our Internet website (www.dxpe.com) as soon as reasonably practicable after we electronically file such material with, or furnish it to, the Securities and Exchange Commission.
ITEM 1A. Risk Factors
The following is a discussion of significant risk factors relevant to DXP’s business that could adversely affect its business, financial condition or results of operations.
Our future results will be impacted by our ability to implement our internal growth strategy.
Our future results will depend in part on our success in implementing our internal growth strategy, which includes expanding our existing geographic areas, selling additional products to existing customers and adding new customers. Our ability to implement this strategy will depend on our success in selling more products and services to existing customers, acquiring new customers, hiring qualified sales persons, and marketing integrated forms of supply management such as those being pursued by us through our SmartSourceSM program. Although we intend to increase sales and product offerings to existing customers, there can be no assurance that we will be successful in these efforts.
Risks Associated With Acquisition Strategy
Our future results will depend in part on our ability to successfully implement our acquisition strategy. This strategy includes taking advantage of a consolidation trend in the industry and effecting acquisitions of businesses with complementary or desirable new product lines, strategic distribution locations, attractive customer bases or manufacturer relationships. Our ability to implement this strategy successfully will depend on our ability to identify, consummate and successfully assimilate acquisitions on economically favorable terms. Although DXP is actively seeking acquisitions that would meet its strategic objectives, there can be no assurance that we will be successful in these efforts. In addition, acquisitions involve a number of special risks, including possible adverse effects on our operating results, diversion of management’s attention, failure to retain key personnel of the acquired business, risks associated with unanticipated events or liabilities, expenses associated with obsolete inventory of an acquired business and amortization of acquired intangible assets, some or all of which could have a material adverse effect on our business, financial condition and results of operations. There can be no assurance that DXP or other businesses acquired in the future will achieve anticipated revenues and earnings. In addition, our credit agreement with our bank lenders contains certain restrictions that could adversely affect our ability to implement our acquisition strategy. Such restrictions include a provision prohibiting us from merging or consolidating with, or acquiring all or a substantial part of the properties or capital stock of, any other entity without the prior written consent of the lenders. There can be no assurance that we will be able to obtain the lender’s consent to any of our proposed acquisitions.
Risks Related to Acquisition Financing
We may need to finance acquisitions by using shares of Common Stock for a portion or all of the consideration to be paid. In the event that the Common Stock does not maintain a sufficient market value, or potential acquisition candidates are otherwise unwilling to accept Common Stock as part of the consideration for the sale of their businesses, we may be required to use more of our cash resources, if available, to maintain our acquisition program. These cash resources may include borrowings under our credit agreement or equity or debt financings. If we do not have sufficient cash resources, our growth could be limited unless we are able to obtain additional capital through debt or equity financings.
9
Ability to Comply with Financial Covenants of Credit Facility
Our credit facility requires the Company to comply with certain specified covenants, restrictions, financial ratios and other financial and operating tests. The Company’s ability to comply with any of the foregoing restrictions will depend on its future performance, which will be subject to prevailing economic conditions and other factors, including factors beyond the Company’s control. A failure to comply with any of these obligations could result in an event of default under the credit facility, which could permit acceleration of the Company’s indebtedness under the credit facility. The Company from time to time has been unable to comply with some of the financial covenants contained in the credit facility (relating to, among other things, the maintenance of prescribed financial ratios) and has, when necessary, obtained waivers or amendments to the covenants from its lenders. Although the company expects to be able to comply with the covenants, including the financial covenants, of the credit facility, there can be no assurance that in the future the Company will be able to do so or that its lenders will be willing to waive such compliance or further amend such covenants.
Our business has substantial competition and competition could adversely affect our results.
Our business is highly competitive. We compete with a variety of industrial supply distributors, some of which may have greater financial and other resources than us. Although many of our traditional distribution competitors are small enterprises selling to customers in a limited geographic area, we also compete with larger distributors that provide integrated supply programs such as those offered through outsourcing services similar to those that are offered by our SmartSourceSM program. Some of these large distributors may be able to supply their products in a more timely and cost-efficient manner than us. Our competitors include catalog suppliers, large warehouse stores and, to a lesser extent, certain manufacturers. Competitive pressures could adversely affect DXP’s sales and profitability.
The loss of or the failure to attract and retain key personnel could adversely impact our results of operations.
We will continue to be dependent to a significant extent upon the efforts and ability of David R. Little, our Chairman of the Board, President and Chief Executive Officer. The loss of the services of Mr. Little or any other executive officer of our Company could have a material adverse effect on our financial condition and results of operations. In addition, our ability to grow successfully will be dependent upon our ability to attract and retain qualified management and technical and operational personnel. The failure to attract and retain such persons could materially adversely affect our financial condition and results of operations.
The loss of any key supplier could adversely affect DXP’s sales and profitability.
We have distribution rights for certain product lines and depend on these distribution rights for a substantial portion of our business. Many of these distribution rights are pursuant to contracts that are subject to cancellation upon little or no prior notice. Although we believe that we could obtain alternate distribution rights in the event of such a cancellation, the termination or limitation by any key supplier of its relationship with the Company could result in a temporary disruption of our business and, in turn, could adversely affect our results of operations and financial condition.
A slowdown in the economy could negatively impact DXP’s sales growth.
Economic and industry trends affect DXP’s business. Demand for our products is subject to economic trends affecting our customers and the industries in which they compete in particular. Many of these industries, such as the oil and gas industry, are subject to volatility while others, such as the petrochemical industry, are cyclical and materially affected by changes in the economy. As a result, demand for our products could be adversely impacted by changes in the markets of our customers.
Interruptions in the proper functioning of our information systems could disrupt operations and cause increases in costs and/or decreases in revenues.
The proper functioning of DXP’s information systems is critical to the successful operation of our business. Although DXP’s information systems are protected through physical and software safeguards and remote processing capabilities exist, our information systems are still vulnerable to natural disasters, power losses, telecommunication failures and other
10
problems. If critical information systems fail or are otherwise unavailable, DXP’s ability to procure products to sell, process and ship customer orders, identify business opportunities, maintain proper levels of inventories, collect accounts receivable and pay accounts payable and expenses could be adversely affected.
ITEM 1B. Unresolved Staff Comments
None.
ITEM 2. Properties
We own our headquarters facility in Houston, Texas, which has 48,000 square feet of office space. The MRO segment owns or leases 112 facilities located in Alabama, Arkansas, California, Colorado, Florida, Georgia, Idaho, Illinois, Indiana, Iowa, Kansas, Kentucky, Louisiana, Maryland, Massachusetts, Minnesota, Missouri, Montana, Nebraska, New Jersey, New Mexico, New York, North Carolina, North Dakota, Ohio, Oklahoma, Pennsylvania, South Dakota, Tennessee, Texas, Utah, Virginia and Wyoming. In addition, we operate supply chain installations in 50 of our customers’ facilities in Arkansas, Arizona, California, Florida, Georgia, Illinois, Indiana, Louisiana, Maryland, Massachusetts, Michigan, Missouri, Nebraska, New Jersey, New York, Ohio, Oklahoma, Oregon, Pennsylvania, South Carolina, Tennessee, Texas and Virginia, and as well as in Ontario, Canada. The Electrical Contractor segment owns one service center facility in Tennessee. Our owned facilities range from 5,000 square feet to 65,000 square feet in size. We lease facilities for terms generally ranging from one to seven years. The leased facilities range from 1,500 square feet to 170,000 square feet in size. The leases provide for periodic specified rental payments and certain leases are renewable at our option. We believe that our facilities are suitable and adequate for the needs of our existing business. We believe that if the leases for any of our facilities were not renewed, other suitable facilities could be leased with no material adverse effect on our business, financial condition or results of operations. One of the facilities owned by us is pledged to secure our indebtedness.
ITEM 3. Legal Proceedings
On July 22, 2004, DXP and Ameron International Corporation, DXP’s vendor of fiberglass reinforced pipe, were sued in the Twenty-Fourth Judicial District Court, Parish of Jefferson, State of Louisiana by BP America Production Company regarding the failure of Bondstrand PSX JFC pipe, a recently introduced type of fiberglass reinforced pipe which had been installed on four energy production platforms. BP American Production Company alleges negligence, breach of contract, breach of warranty and that damages exceed $20 million. DXP believes the failures were caused by the failure of the pipe itself and not by work performed by DXP. We intend to vigorously defend these claims. Our insurance carrier has agreed, under a reservation of rights to deny coverage, to provide a defense against these claims. The maximum amount of our insurance coverage, if any, is $6 million. Under certain circumstances, our insurance may not cover this claim. DXP currently believes that this claim is without merit.
In 2003, we were notified that we had been sued in various state courts in Nueces County, Texas. The twelve suits allege personal injury resulting from products containing asbestos allegedly sold by us. The suits do not specify what products or the dates we allegedly sold the products. The plaintiffs’ attorney has agreed to a global settlement of all suits for a nominal amount to be paid by our insurance carriers. Settlement has been consummated as to more than 85% of the 133 plaintiffs, and the remaining settlements are in process. The cases are all dismissed or dormant pending the remaining settlements.
From time to time, the Company is a party to various legal proceedings arising in the ordinary course of its business. The Company believes that the outcome of any of these various proceedings will not have a material adverse effect on its business, financial condition or results of operations.
ITEM 4. Submission of Matters to a Vote of Security Holders
None.
11
PART II
|
ITEM 5.
|
Market for the Registrant's Common Equity, Related Stockholder Matters and Issuer Purchases of Equity Securities
|
Our common stock trades on The NASDAQ Global Market under the symbol "DXPE".
The following table sets forth on a per share basis the high and low sales prices for our common stock as reported by NASDAQ for the periods indicated.
|
High
|
Low
|
||
|
2009
|
|||
|
First Quarter
|
$ 15.84
|
$ 8.47
|
|
|
Second Quarter
|
$ 16.40
|
$ 9.52
|
|
|
Third Quarter
|
$ 12.44
|
$ 9.21
|
|
|
Fourth Quarter
|
$ 13.36
|
$ 10.48
|
|
|
2008
|
|||
|
First Quarter
|
$ 23.74
|
$ 14.80
|
|
|
Second Quarter
|
$ 22.82
|
$ 18.83
|
|
|
Third Quarter
|
$ 34.14
|
$ 18.72
|
|
|
Fourth Quarter
|
$ 28.89
|
$ 9.67
|
On March 19, 2010, we had approximately 541 holders of record for outstanding shares of our common stock. This number does not include shareholders for whom shares are held in “nominee” or “street name”.
We anticipate that future earnings will be retained to finance the continuing development of our business. In addition, our bank credit facility prohibits us from declaring or paying any cash dividends or other distributions on our capital stock except for the monthly $0.50 per share dividend on our Series B convertible preferred stock, which amounts to $90,000 in the aggregate per year. Accordingly, we do not anticipate paying cash dividends on our common stock in the foreseeable future. The payment of any future dividends will be at the discretion of our Board of Directors and will depend upon, among other things, future earnings, the success of our business activities, regulatory and capital requirements, our lenders, our general financial condition and general business conditions.
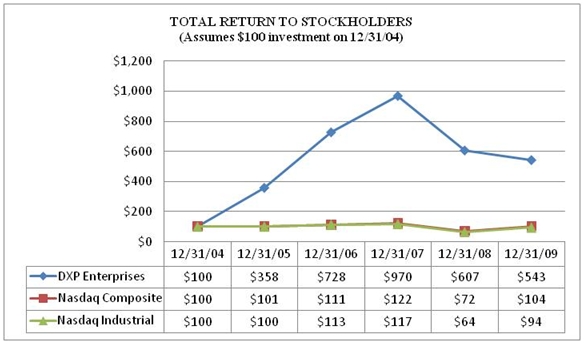
Stock Performance
The following performance graph compares the performance of DXP Common Stock to the NASDAQ Industrial Index and the NASDAQ Composite (US). The graph assumes that the value of the investment in DXP Common Stock and in each index was $100 at December 31, 2004 and that all dividends were reinvested.
12
Equity Compensation Table
The following table provides information regarding shares covered by the Company’s equity compensation plans as of December 31, 2009:
|
Plan category
|
Number
of Shares
to be issued
on exercise of outstanding options
|
Weighted
average
exercise price of outstanding options
|
Non-vested restricted shares outstanding
|
Weighted average
grant price
|
Number of securities remaining available for future issuance under equity compensation
plans
|
|
Equity compensation plans
approved by shareholders
|
50,000
|
$ 2.50
|
223,448
|
$ 15.29
|
221,883(1)
|
|
Equity compensation plans not
approved by shareholders
|
N/A
|
N/A
|
N/A
|
N/A
|
N/A
|
|
Total
|
50,000
|
$ 2.50
|
223,448
|
$ 15.29
|
221,883(1)
|
|
(1) Represents shares of common stock authorized for issuance under the 2005 Restricted Stock Plan. Does not include shares to be issued upon exercise of outstanding options.
|
|||||
ITEM 6. Selected Financial Data
The selected historical consolidated financial data set forth below for each of the years in the five-year period ended December 31, 2009 has been derived from our audited consolidated financial statements. This information should be read in conjunction with "Management's Discussion and Analysis of Financial Condition and Results of Operations" and the consolidated financial statements and notes thereto included elsewhere in this Report.
13
|
Years Ended December 31,
|
|||||
|
2005
|
2006
Restated(1)
|
2007
Restated(1)
|
2008
Restated(1)
|
2009(2)
|
|
|
(in thousands, except per share amounts)
|
|||||
|
Consolidated Statement of Earnings Data:
|
|||||
|
Sales
|
$ 185,364
|
$ 279,820
|
$ 444,547
|
$ 736,883
|
$ 583,226
|
|
Gross Profit
|
49,714
|
78,622
|
125,692
|
206,988
|
151,414
|
|
Operating income
|
9,404
|
20,678
|
31,892
|
48,191
|
(49,332)
|
|
Income (loss) before income taxes
|
8,615
|
19,404
|
28,897
|
42,284
|
(54,482)
|
|
Net income (loss)
|
5,467
|
11,922
|
17,347
|
25,887
|
(42,412)
|
|
Per share amounts
|
|||||
|
Basic earnings (loss) per common share
|
$ 0.62
|
$ 1.17
|
$ 1.46
|
$ 1.99
|
$ (3.24)
|
|
Common shares outstanding
|
8,698
|
10,127
|
11,811
|
12,945
|
13,117
|
|
Diluted earnings (loss) per share
|
$ 0.47
|
$ 1.04
|
$ 1.35
|
$ 1.87
|
$ (3.24)
|
|
Common and common equivalent shares
outstanding
|
11,578
|
11,450
|
12,860
|
13,869
|
13,117
|
|
(1) Basic and diluted earnings per share amounts have been restated due to adoption in the first quarter of 2009 of authoritative guidance which requires awards of unvested restricted stock to be treated as if outstanding in the calculation of earnings per share.
(2) The goodwill and other intangibles impairment charge and the Precision inventory impairment charge in 2009 reduced operating income by $66.8 million and increased basic and diluted loss per share by $3.82.
|
|||||
|
Consolidated Balance Sheet Data
|
As of December 31,
|
||||
|
2005
|
2006
|
2007
|
2008
|
2009
|
|
|
Total assets
|
$ 74,924
|
$ 118,811
|
$ 288,170
|
$ 397,856
|
$ 270,927
|
|
Long-term debt obligations
|
25,109
|
35,174
|
101,989
|
154,591
|
102,916
|
|
Shareholders’ equity
|
20,791
|
36,920
|
102,713
|
130,188
|
90,213
|
ITEM 7. Management's Discussion and Analysis of Financial Condition and Results of Operations
The following discussion and analysis should be read in conjunction with the Consolidated Financial Statements and related notes contained elsewhere in this Report.
General Overview
Our products and services are marketed in at least 37 states in the United States and one province in Canada to over 40,000 customers that are engaged in a variety of industries, many of which may be countercyclical to each other. Demand for our products generally is subject to changes in the United States and global economy and economic trends affecting our customers and the industries in which they compete in particular. Certain of these industries, such as the oil and gas industry, are subject to volatility while others, such as the petrochemical industry and the construction industry, are cyclical and materially affected by changes in the United States and global economy. As a result, we may experience changes in demand within particular markets, segments and product categories as changes occur in our customers' respective markets.
During 2005 the general economy and the oil and gas exploration and production business continued to improve. Our employee headcount increased by 17.9% as a result of two acquisitions and hiring additional personnel to support increased sales. The majority of the 2005 sales increase came from a broad-based increase in sales of pumps, bearings, safety products and mill supplies to customers engaged in oilfield service, oil and gas production, mining, electricity generation and petrochemical processing. Sales by the two businesses acquired in 2005 accounted for $7.3 million of the $24.8 million 2005 sales increase.
14
During 2006 the general economy and the oil and gas exploration and production business continued to be positive. Our employee headcount increased by 45% a result of four acquisitions and hiring additional personnel to support increased sales. The majority of the 2006 sales increase came from a broad-based increase in sales of pumps, bearings, safety products and mill supplies to customers engaged in oilfield service, oil and gas production, mining, electricity generation and petrochemical processing. Sales by the four businesses acquired in 2006 accounted for $11.8 million of the $94.5 million 2006 sales increase.
During 2007 the general economy and the oil and gas exploration and production business continued to be positive. During 2007 our headcount increased by 112% primarily as a result of three acquisitions. Sales by the three businesses acquired in 2007 accounted for $92.3 million of the $164.7 million sales increase. The 2007 sales increase, excluding sales of businesses acquired in 2007, resulted from a broad based increase in sales by our service centers, innovative pumping solution locations and supply chain locations.
During 2008 the general economy weakened. However, the oil and gas exploration and production business continued to be positive during the first half of 2008, before declining during the second half of 2008. During 2008 our headcount increased by 18% primarily as a result of three acquisitions. Sales by the three businesses acquired in 2008 accounted for $33.4 million of the $292.3 million 2008 sales increase. The 2008 sales increase, excluding sales of businesses acquired in 2008, resulted from a broad-based increase in sales by our service centers, innovative pumping solution locations and supply chain locations.
During 2009 the general economy and the oil and gas exploration and production business declined significantly. During 2009 our headcount decreased by approximately 10% as a result of actions taken to reduce operating costs. Sales for 2009 declined by 20.9% from 2008. Sales by businesses acquired during 2008, on a same store sales basis, accounted for $36.1 million of 2009 sales. Excluding these sales by acquired businesses, sales declined by 25.8% from 2008. The 2009 sales decline is primarily due to a broad-based decline in the sales of pumps, bearings, safety products and mill supplies in connection with a broad-based decline in the U.S. economy. This economic decline led to the impairment of goodwill and other intangibles. During the fourth quarter of 2009 the Company recognized an impairment charge of $53.0 million for goodwill and other intangibles and an impairment charge of $13.8 million to reduce the valuation of inventory acquired in the acquisition of Precision. The impairment charges did not result in any cash expenditures, did not adversely affect compliance with covenants under our credit facility, and did not affect our cash position or cash flows from operating activities.
Our sales growth strategy in recent years has focused on internal growth and acquisitions. Key elements of our sales strategy include leveraging existing customer relationships by cross-selling new products, expanding product offerings to new and existing customers, and increasing business-to-business solutions using system agreements and supply chain solutions for our integrated supply customers. We will continue to review opportunities to grow through the acquisition of distributors and other businesses that would expand our geographic breadth and/or add additional products and services. Our results will depend on our success in executing our internal growth strategy and, to the extent we complete any acquisitions, our ability to integrate such acquisitions effectively.
Our strategies to increase productivity include consolidated purchasing programs, centralizing product distribution centers, centralizing certain customer service and inside sales functions, converting selected locations from full warehouse and customer service operations to service centers, and using information technology to increase employee productivity.
15
Results of Operations
|
Years Ended December 31,
|
||||||
|
2007
Restated(1)
|
%
|
2008
Restated(1)
|
%
|
2009(2)
|
%
|
|
|
(in millions, except percentages and per share amounts)
|
||||||
|
Sales
|
$ 444.5
|
100.0
|
$ 736.9
|
100.0
|
$ 583.2
|
100.0
|
|
Cost of sales
|
318.8
|
71.7
|
529.9
|
71.9
|
431.8
|
74.0
|
|
Gross profit
|
125.7
|
28.3
|
207.0
|
28.1
|
151.4
|
26.0
|
|
Selling, general & administrative expense
|
93.8
|
21.1
|
158.8
|
21.6
|
147.8
|
25.3
|
|
Goodwill and other intangibles impairment
|
53.0
|
9.1
|
||||
|
Operating income (loss)
|
31.9
|
7.2
|
48.2
|
6.5
|
(49.3)
|
(8.5)
|
|
Interest expense
|
3.3
|
0.7
|
6.1
|
0.8
|
5.2
|
0.9
|
|
Other income
|
(0.3)
|
-
|
(0.2)
|
-
|
(0.1)
|
-
|
|
Income (loss) before income taxes
|
28.9
|
6.5
|
42.3
|
5.7
|
(54.5)
|
(9.3)
|
|
Provision (benefit) for income taxes
|
11.6
|
2.6
|
16.4
|
2.2
|
(12.1)
|
(2.1)
|
|
Net income (loss)
|
$ 17.3
|
3.9%
|
$ 25.9
|
3.5%
|
$(42.4)
|
(7.3%)
|
|
Per share
|
||||||
|
Basic earnings (loss) per share
|
$ 1.46
|
$ 1.99
|
$(3.24)
|
|||
|
Diluted earnings (loss) per share
|
$ 1.35
|
$ 1.87
|
$(3.24)
|
|||
|
(1) Basic and diluted earnings per share amounts have been restated due to adoption in the first quarter of 2009 of authoritative guidance which requires awards of unvested restricted stock to be treated as if standing in the calculation of earnings per share.
(2) The goodwill and other intangibles impairment charge and the Precision inventory impairment charge in 2009 reduced operating income by $66.8 million and increased basic and diluted loss per share by $3.82.
|
||||||
Year Ended December 31, 2009 Compared to Year Ended December 31, 2008
SALES. Sales for the year ended December 31, 2009 decreased $153.7 million, or 20.9%, to approximately $583.2 million from $736.9 million in 2008. Sales for the MRO segment decreased $152.8 million, or 20.8%, to $580.5 million for the year ended December 31, 2009, from $733.3 million for 2008. Sales by businesses acquired in 2008, on a same store sales basis, accounted for $36.1 million of 2009 sales. Excluding these sales by the acquired businesses, sales for the MRO segment decreased 25.8%. This sales decrease is primarily due to a broad-based decrease in sales of pumps, bearings, safety products and mill supplies in connection with a broad-based decline in the U. S. economy. Sales for the Electrical Contractor segment decreased by $0.9 million, or 24.4%, to $2.7 million for the year ended December 31, 2009 from $3.6 million for 2008, resulting from the decline in the U. S. economy. Sales of commodity and specialty type electrical products declined.
GROSS PROFIT. Gross profit as a percentage of sales decreased by approximately 2.1% for 2009, to 26.0% from 28.1% for 2008. Gross profit as a percentage of sales for the MRO segment decreased to 25.9% for 2009, from 28.1% for 2008. This decrease is the result of the $13.8 million charge in the fourth quarter of 2009 to reduce the value of inventory acquired in connection with the acquisition of Precision on September 10, 2007. Gross profit as a percentage of sales for the Electrical Contractor segment decreased to 35.4% for 2009, from 35.9% for 2008. This decrease resulted from sales of higher margin specialty-type electrical products decreasing more than sales of commodity products decreased.
SELLING, GENERAL AND ADMINISTRATIVE. Selling, general and administrative expense for 2009 decreased by approximately $11.0 million to $147.8 million from $158.8 million for 2008. Selling, general and administrative expense associated with the three businesses acquired in 2008, on a same store basis, accounted for $11.2 million of the 2009 expense. On a same store basis, selling, general and administrative expense decreased approximately $36.5 million. This decrease primarily resulted from reduced salaries, incentive compensation, employee benefits and travel expenses compared to 2008. As a percentage of sales, the 2009 expense increased by approximately 3.8%, to 25.3% for 2009 from 21.6% for 2008. This increase is primarily the result of sales decreasing more than selling, general and administrative expenses decreased combined with the effect of accruing $1.8 million of future rent and related expenses associated with locations closed during 2009.
16
GOODWILL AND OTHER INTANGIBLES IMPAIRMENT. During the fourth quarter of 2009, the Company performed the annual goodwill impairment test based on current and expected market conditions, including reduced operating results. As a result of this test, the Company determined that goodwill and other intangibles associated with the MRO segment were impaired as of December 31, 2009. Accordingly, the Company recognized an impairment charge of $53.0 million for goodwill and other intangibles in the fourth quarter of 2009.
OPERATING INCOME (LOSS). Operating loss for 2009 was $49.3 million compared to $48.2 million of income for 2008. Operating loss for the MRO segment was $49.6 million for 2009 compared to $47.7 million of income for 2008 as a result of a $55.2 million decrease in gross profit and the $53.0 million impairment charge, partially offset by a $10.9 million decrease in selling, general and administrative expense. Operating income for the Electrical Contractor segment decreased 46.2%, to $0.3 million for 2009, from $0.5 million for 2008, primarily as a result of decreased gross profit due to decreased sales.
INTEREST EXPENSE. Interest expense for 2009 decreased by 14.4% from 2008. This decrease primarily resulted from decreased market interest rates.
OTHER INCOME. Other income for 2009 decreased to $0.1 million from $0.2 million for 2008 as a result of reduced interest income.
INCOME TAXES. Our provision for income taxes differed from the U. S. statutory rate of 35% due to state income taxes and non-deductible expenses. Our effective tax rate for 2009 decreased from 38.8% for 2008 primarily as a result of the non-deductible impairment charge for PFI, LLC goodwill.
Year Ended December 31, 2008 Compared to Year Ended December 31, 2007
SALES. Sales for 2008 increased $292.3 million, or 65.8%, to approximately $736.9 million from $444.5 million in 2007. Sales for the MRO segment increased $292.0 million, or 66.2% primarily due to sales by businesses acquired in 2007 and 2008 and partially due to a broad-based increase in sales of pumps, safety products and mill supplies to companies engaged in oilfield service, oil and gas production, food processing, agriculture, mining, electricity generation and petrochemical processing. Sales by businesses acquired during 2007 and 2008, on a same store sales basis, accounted for $233.8 million of the 2008 MRO sales increase. Excluding sales of the acquired businesses, on a same store sales basis, sales for the MRO segment increased 13.2%. Sales for the Electrical Contractor segment increased $0.3 million, or 9.5%, to $3.6 million from $3.3 million for 2007. The sales increase for the Electrical Contractor segment resulted from the sale of more commodity type electrical products.
GROSS PROFIT. Gross profit for 2008 increased 64.7% compared to 2007. Gross profit, as a percentage of sales, decreased by approximately 0.2% for 2008, when compared to 2007. Gross profit as a percentage of sales for the MRO segment decreased to 28.1% in 2008 from 28.2% in 2007. This decrease can be primarily attributed to the lower gross profit on sales by Precision Industries, Inc., which was acquired on September 7, 2007. Gross profit as a percentage of sales for the Electrical Contractor segment decreased to 35.9% for 2008, from 37.1% in 2007. This decrease resulted from the sale of more lower margin commodity type electrical products.
SELLING, GENERAL AND ADMINISTRATIVE. Selling, general and administrative expense for 2008 increased by approximately $65.0 million, or 69.3%, when compared to 2007. The increase is primarily attributed to selling, general and administrative expenses of acquired businesses and increased compensation expense related to increased gross profit. The majority of our employees receive incentive compensation, which is based upon gross profit. As a percentage of revenue, the 2008 expense increased by approximately 0.5% to 21.6% from 21.1% for 2007. This increase resulted from the $3.7 million increase in the amortization of intangibles associated with acquisitions.
OPERATING INCOME. Operating income for 2008 increased by approximately $16.3 million, or 51.1%, when compared to 2007. This increase was the net of a 51.5% increase in operating income for the MRO segment and a 20.8% increase in operating income for the Electrical Contractor segment. Operating income for the MRO segment increased as a result of increased gross profit, partially offset by increased selling, general, and administrative expense. Operating income for the Electrical Contractor segment increased as a result of increased gross profit combined with stable selling, general and administrative costs.
17
INTEREST EXPENSE. Interest expense for 2008 increased by 83.3% from 2007. This increase primarily resulted from increased debt to fund acquisitions and internal growth.
OTHER INCOME. Other income for 2008 decreased to $0.2 million from $0.3 million for 2007 as a result of reduced interest income.
INCOME TAXES. Our provision for income taxes differed from the U. S. statutory rate of 35% due to state income taxes and non-deductible expenses. Our effective tax rate for 2008 decreased to 38.8% from 40.0% for 2007 primarily as a result of a decreased effective state income tax rate.
Liquidity and Capital Resources
General Overview
As a distributor of MRO products and Electrical Contractor products, we require significant amounts of working capital to fund inventories and accounts receivable. Additional cash is required for capital items such as information technology and warehouse equipment. We also require cash to pay our lease obligations and to service our debt.
We generated approximately $51.6 million of cash in operating activities in 2009 as compared to generating $18.5 million in 2008. This change between the two years was primarily attributable to the $24.1 million decrease in accounts receivable and the $46.5 million reduction in inventories in 2009 compared to a $10.9 million increase in accounts receivable and a $11.2 million increase in inventories in 2008.
During 2009 we paid $0.5 million of cash related to the purchase of businesses acquired in earlier years compared to paying $73.9 million for acquisitions in 2008.
We purchased approximately $1.6 million of capital assets during 2009 compared to $5.1 million for 2008. Capital expenditures during 2009 and 2008 were related primarily to computer equipment, computer software, production equipment, inventory handling equipment, safety rental equipment and building improvements. Capital expenditures for 2010 are expected to be more than the 2009 amount.
At December 31, 2009, our total long-term debt, including the current portion, was $115.5 million compared to total capitalization (total long-term debt plus shareholders’ equity) of $205.7 million. Approximately $113.5 million of this outstanding debt bears interest at various floating rates. Therefore, as an example, a 200 basis point increase in interest rates would increase our annual interest expense by approximately $2.3 million.
Our normal trade terms for our customers require payment within 30 days of invoice date. In response to competition and customer demands we will offer extended terms to selected customers with good credit history. Customers that are financially strong tend to request extended terms more often than customers that are not financially strong. Many of our customers, including companies listed in the Fortune 500, do not pay us within stated terms for a variety of reasons, including a general business philosophy to pay vendors as late as possible. We generally collect the amounts due from these large, slow-paying customers.
During 2009, the amount available to be borrowed under our credit facility increased from $37.0 million at December 31, 2008, to $37.3 million at December 31, 2009. The increase in availability is primarily the result of the effect of reduced borrowings on the loan covenant ratios. Our total long-term debt decreased $53.0 million during 2009. Management believes that the liquidity of our balance sheet at December 31, 2009, provides us with the ability to meet our working capital needs, scheduled principal payments, capital expenditures and Series B convertible preferred stock dividend payments during 2010.
To hedge a portion of our floating rate debt, as of January 10, 2008, DXP entered into an interest rate swap agreement with the lead bank of our Facility. Through January 11, 2010, this interest rate swap effectively fixed the interest rate on $40 million of floating rate LIBOR borrowings under the Facility at 3.68% plus the margin (1.75% at December 31, 2009) in effect under the Facility.
18
Credit Facility
On August 28, 2008, DXP entered into a credit agreement with Wells Fargo Bank, National Association, as lead arranger and administrative agent for the lenders (the “Facility). The Facility was amended on March 15, 2010. The Facility consists of a $50 million term loan and a revolving credit facility that provides a $150 million line of credit to the Company. The term loan requires principal payments of $2.5 million per quarter beginning on December 31, 2008. The Facility matures on August 11, 2013. The Facility contains financial covenants defining various financial measures and levels of these measures with which the Company must comply. Covenant compliance is assessed as of each quarter end and certain month ends for the asset test. The asset test is defined under the Facility as the sum of 85% of the Company’s net accounts receivable, 60% of net inventory, and 50% of the net book value of non real estate property and equipment. The Company’s borrowing and letter of credit capacity under the revolving credit portion of the Facility at any given time is $150 million less borrowings under the revolving credit portion of the facility and letters of credit outstanding, subject to the asset test described above.
On December 31, 2009, the LIBOR based rate on the revolving credit portion of the Facility was LIBOR plus l.75%, the prime based rate on the revolving credit portion of the Facility was prime plus 0.25%, the commitment fee was 0.25%, the LIBOR based rate for the term loan was LIBOR plus 2.50% and the prime based rate for the term loan was prime plus 1.00%. At December 31, 2009, $110.5 million was borrowed under the Facility at a weighted average interest rate of approximately 3.5% under the LIBOR options, including the effect of the interest rate swap, and nothing was borrowed under the prime options under the Facility. Beginning on March 15, 2010, the March 15, 2010 amendment to the Facility significantly increases the interest rates and commitment fees applicable at various leverage ratios from levels in effect before March 15, 2010. The revolving credit portion of the Facility provides the option of interest at LIBOR plus a margin ranging from 2.25% to 4.00% or prime plus a margin of 1.25% to 3.00%. If the increased rates had been in effect on December 31, 2009, the LIBOR based rate on the revolving credit portion of the Facility would have been LIBOR plus 4.00%. If the increased rates had been in effect on December 31, 2009 the prime based rate on the revolving credit portion of the Facility would have been prime plus 3.00%. Commitment fees of 0.25% to 0.625% per annum are payable on the portion of the Facility capacity not in use for borrowings or letters of credit at any given time. If the increased rates had been in effect on December 31, 2009, the commitment fee would have been 0.625%. The term loan provides the option of interest at LIBOR plus a margin ranging from 2.75% to 4.50% or prime plus a margin of 1.75% to 3.50%. If the increased rates had been in effect on December 31, 2009, the LIBOR based rate for the term loan would have been LIBOR plus 4.50%. If the increased rates had been in effect on December 31, 2009, the prime based rate for the term loan would have been prime plus 3.50%. Borrowings under the Facility are secured by all of the Company’s accounts receivable, inventory, general intangibles and non real estate property and equipment. The Facility was amended to waive the Fixed Charge Coverage Ratio for the period ended December 31, 2009, and modify the Leverage Ratio for the period ended December 31, 2009, to allow DXP to be in compliance with all financial covenants. DXP would not have been in compliance with the Fixed Charge Coverage Ratio or the Leverage Ratio without the amendment. At December 31, 2009, we had $37.3 million available for borrowing under the most restrictive covenant of the Facility.
The Facility’s principal financial covenants include:
Fixed Charge Coverage Ratio – For the 12 month period ending December 31, 2009, the Fixed Charge Coverage Ratio has been waived. The Facility requires that the Fixed Charge Coverage Ratio for the 12 month period ending on the last day of each quarter from March 31, 2010 through September 30, 2010 be not less than 1.0 to 1.0, stepping up to 1.25 to 1.0 for the quarter ending December 31, 2010 and to 1.50 to 1.0 for the quarter ending March 31, 2011, with “Fixed Charge Coverage Ratio” defined as the ratio of (a) EBITDA for the 12 months ending on such date minus cash taxes, minus Capital Expenditures for such period (excluding acquisitions) to (b) the aggregate of interest expense paid in cash, scheduled principal payments in respect of long-term debt and current portion of capital leases for such 12-month period, determined in each case on a consolidated basis for DXP and its subsidiaries.
19
Leverage Ratio – The Facility requires that the Company’s Leverage Ratio, determined at the end of each fiscal quarter, not exceed 3.75 to 1.0 as of December 31, 2009, 4.25 to 1.0 as of March 31, 2010, 4.00 to 1.00 as of June 30, 2010, 3.75 to 1.0 as of September 30, 2010, and 3.25 to 1.0 as of the last day of each quarter thereafter. Leverage Ratio is defined as the outstanding Indebtedness divided by EBITDA for the twelve months then ended. Indebtedness is defined under the Facility for financial covenant purposes as: (a) all obligations of DXP for borrowed money including but not limited to senior bank debt, senior notes, and subordinated debt; (b) capital leases; (c) issued and outstanding letters of credit; and (d) contingent obligations for funded indebtedness.
EBITDA as defined under the Facility for financial covenant purposes means, without duplication, for any period the consolidated net income (excluding any extraordinary gains or losses) of DXP plus, to the extent deducted in calculating consolidated net income, depreciation, amortization, other non-cash items and non-recurring items (including, without limitation, impairment charges, or asset write-offs and accruals in respect of closed locations), interest expense, and tax expense for taxes based on income and minus, to the extent added in calculating consolidated net income, any non-cash items and non-recurring items; provided that, if DXP acquires the equity interests or assets of any person during such period under circumstances permitted under the Facility, EBITDA shall be adjusted to give pro forma effect to such acquisition assuming that such transaction had occurred on the first day of such period and provided further that, if DXP divests the equity interests or assets of any person during such period under circumstances permitted under this Facility, EBITDA shall be adjusted to give pro forma effect to such divestiture assuming that such transaction had occurred on the first day of such period. Add-backs allowed pursuant to Article 11, Regulation S-X, of the Securities Act of 1933, as amended, will also be included in the calculation of EBITDA.
|
|
Borrowings
|
|
December 31,
|
Increase
(Decrease)
|
||
|
2008
|
2009
|
||
|
(in thousands)
|
|||
|
Current portion of long-term debt
|
$ 13,965
|
$ 12,595
|
$ (1,370)
|
|
Long-term debt, less current portion
|
154,591
|
102,916
|
(51,675)
|
|
Total long-term debt
|
$ 168,556
|
$ 115,511
|
$ (53,045)(2)
|
|
Amount available (1)
|
$ 36,951
|
$ 37,276
|
$ 325(3)
|
|
(1) Represents amount available to be borrowed under the Facility at the indicated date.
(2) The funds obtained from operations, including reduced inventories and receivables, were used to reduce debt.
(3) The $0.3 million increase in the amount available is primarily a result of the effect of reduced debt on the loan covenant ratios.
|
|||
Performance Metrics
|
December 31,
|
Increase
(Decrease)
|
||
|
2008
|
2009
|
||
|
Days of sales outstanding (in days)
|
48.5
|
50.1
|
1.6
|
|
Inventory turns
|
4.7
|
5.9
|
1.2
|
|
Results for businesses acquired in 2008 were annualized to compute these performance metrics.
|
|||
Accounts receivable days of sales outstanding were 50.1 at December 31, 2009 compared to 48.5 days at December 31, 2008. The increase resulted primarily from a change in customer mix which resulted in slower collection of accounts receivable. Annualized inventory turns were 5.9 times at December 31, 2009 compared to 4.7 times at December 31, 2008. The increase in inventory turns resulted from the reduction in inventories, including the $13.8 million reduction in the value of inventory acquired in the acquisition of Precision.
Funding Commitments
We believe our cash generated from operations and available under our Facility will meet our normal working capital needs during the next twelve months. However, we may require additional debt or equity financing to fund potential acquisitions. Such additional financings may include additional bank debt or the public or private sale of debt or equity securities. In connection with any such financing, we may issue securities that substantially dilute the interests of our shareholders. We may not be able to obtain additional financing on acceptable terms, if at all.
20
potential acquisitions. Such additional financings may include additional bank debt or the public or private sale of debt or equity securities. In connection with any such financing, we may issue securities that substantially dilute the interests of our shareholders. We may not be able to obtain additional financing on acceptable terms, if at all.
Contractual Obligations
The impact that our contractual obligations as of December 31, 2009 are expected to have on our liquidity and cash flow in future periods is as follows (in thousands):
|
Payments Due by Period
|
|||||
|
Total
|
Less than 1 Year
|
1–3 Years
|
3-5
Years
|
More than 5 Years
|
|
|
Long-term debt, including current portion (1)
|
$ 115,511
|
$ 12,595
|
$ 20,779
|
$ 82,137
|
$ -
|
|
Operating lease obligations
|
36,335
|
9,700
|
13,286
|
5,889
|
7,460
|
|
Estimated interest payments (2)
|
430
|
156
|
223
|
51
|
-
|
|
Total
|
$ 152,276
|
$ 22,451
|
$ 34,288
|
$ 88,077
|
$ 7,460
|
|
(1) Amounts represent the expected cash payments of our long-term debt and do not include any fair value adjustment.
(2) Assumes interest rates in effect at December 31, 2009. Assumes debt is paid on maturity date and not replaced. Does not include interest on the revolving line of credit as borrowings under the Facility fluctuate. The amounts of interest incurred for borrowings under the revolving lines of credit were $2,595,000, $4,900,000 and $4,700,000 for 2007, 2008 and 2009, respectively. Management anticipates an increased level of interest payments on the Facility in 2010 as a result of increased interest rates.
|
|||||
Off-Balance Sheet Arrangements
As part of our ongoing business, we do not participate in transactions that generate relationships with unconsolidated entities or financial partnerships, such as entities often referred to as structured finance or special purpose entities ("SPE's"), which would have been established for the purpose of facilitating off-balance sheet arrangements or other contractually narrow or limited purposes. As of December 31, 2009, we were not involved in any unconsolidated SPE transactions.
Indemnification
In the ordinary course of business, DXP enters into contractual arrangements under which DXP may agree to indemnify customers from any losses incurred relating to the services we perform. Such indemnification obligations may not be subject to maximum loss clauses. Historically, payments made related to these indemnities have been immaterial.
Discussion of Critical Accounting Policies
The preparation of financial statements in conformity with accounting principles generally accepted in the United States of America requires us to make estimates and assumptions in determining the reported amounts of assets and liabilities and disclosure of contingent assets and liabilities at the date of the financial statements and the reported amounts of revenues and expenses during the reporting period. The significant estimates made by us in the accompanying financial statements relate to reserves for accounts receivable collectability, inventory valuations, income taxes, self-insured liability claims and self-insured medical claims. Actual results could differ from those estimates. Management periodically re-evaluates these estimates as events and circumstances change. Together with the effects of the matters discussed above, these factors may significantly impact the Company’s results of operations from period-to-period.
Critical accounting policies are those that are both most important to the portrayal of a company’s financial position and results of operations, and require management’s subjective or complex judgments. These policies have been discussed with the Audit Committee of the Board of Directors of DXP. Below is a discussion of what we believe are our critical accounting policies. Also, see Note 1 of the Notes to the Consolidated Financial Statements.
21
Revenue Recognition
For binding agreements to fabricate tangible assets to customer specifications, the Company recognizes revenues using the percentage of completion method. For other sales, the Company recognizes revenues when an agreement is in place, the price is fixed, title for product passes to the customer or services have been provided and collectability is reasonably assured. Revenues are recorded net of sales taxes. Revenues recognized include product sales and billings for freight and handling charges.
Allowance for Doubtful Accounts
Provisions to the allowance for doubtful accounts are made monthly and adjustments are made periodically (as circumstances warrant) based upon the expected collectability of all such accounts. Write-offs could be materially different from the reserve provided if economic conditions change or actual results deviate from historical trends.
Inventory
Inventory consists principally of finished goods and is priced at lower of cost or market, cost being determined using the first-in, first-out (FIFO) method. Reserves are provided against inventory for estimated obsolescence based upon the aging of the inventory and market trends. Actual obsolescence could be materially different from the reserve if economic conditions or market trends change significantly.
Self-insured Insurance and Medical Claims
We generally retain up to $100,000 of risk for each claim for workers compensation, general liability, automobile and property loss. We accrue for the estimated loss on the self-insured portion of these claims. The accrual is adjusted quarterly based upon reported claims information. The actual cost could deviate from the recorded estimate.
We generally retain up to $200,000 of risk on each medical claim for our employees and dependents. We accrue for the estimated outstanding balance of unpaid medical claims for our employees and their dependents. The accrual is adjusted monthly based on recent claims experience. The actual claims could deviate from recent claims experience and be materially different from the reserve.
The accrual for these claims at December 31, 2009 and 2008 was approximately $1.3 and $2.0 million, respectively.
Impairment of Long-Lived Assets and Goodwill
Goodwill represents a significant portion of our total assets. We review goodwill for impairment annually during our fourth quarter or more frequently if certain impairment indicators arise under the provisions of authoritative guidance. We review goodwill at the reporting level unit, which is one level below an operating segment. We review the carrying value of the net assets of each reporting unit to the net present value of estimated discounted future cash flows of the reporting unit. If the carrying value exceeds the net present value of estimated discounted future cash flows, an impairment indicator exists and an estimate of the impairment loss is calculated. The fair value calculation includes multiple assumptions and estimates, including the projected cash flows and discount rates applied. Changes in these assumptions and estimates could result in goodwill impairment that could materially adversely impact our financial position or results of operations. All of our goodwill is related to our MRO segment and was included in its two reporting units which are DXP and PFI. Goodwill of $101.0 million, before impairment, was primarily recorded in connection with the 13 acquisitions of the MRO businesses completed since 2004, all of which was included in the two reporting units for our MRO segment. Assets, liabilities, deferred taxes and goodwill for each reporting unit were determined using the balance sheets maintained for each reporting unit. We recorded a partial impairment of goodwill for the PFI reporting unit and a partial impairment of the goodwill for the DXP reporting unit.
22
When estimating fair values of a reporting unit for our goodwill impairment test, we use an income approach which incorporates management’s views. The income approach provides an estimated fair value based on each reporting unit’s anticipated cash flows that are discounted using a weighted average cost of capital rate. The primary assumptions used in the income approach were estimated cash flows and weighted average cost of capital. Estimated cash flows were primarily based on projected revenues, operating costs and capital expenditures and are discounted based on comparable industry average rates for weighted average cost of capital. We utilized discount rates based on weighted average cost of capital ranging from 12.0% to 14.5% when we estimated fair values of our reporting units as of December 31, 2009. To ensure the reasonableness of the estimated fair values of our reporting units, we performed a reconciliation of our total market capitalization to the total estimated fair value of all our reporting units. The assumptions used in estimating fair values of reporting units and performing the goodwill impairment test are inherently uncertain and required management judgment. The assumptions and methodologies used for valuing goodwill in the current year are consistent with those used in the prior year.
During 2009 there were significant declines in the U.S. and global economies and in oil and natural gas prices which led to declines in our sales, margins and cash flows. Our sales and profitability declined throughout the year particularly in the fourth quarter. We considered the impact of these significant adverse changes in the economic and business climate as we performed our annual impairment assessment of goodwill as of December 31, 2009. The estimated fair values of our reporting units were negatively impacted by significant reductions in estimated cash flows for the income approach.
Our goodwill impairment analysis led us to conclude that there was a significant impairment of goodwill for the PFI reporting unit and a significant impairment of goodwill for the DXP reporting unit and, accordingly, we recorded a non-cash charge of $40.7 million to our operating results for the year ended December 31, 2009, for the impairment of our goodwill. If we increased, or decreased, our discount rates by 10% when estimating the fair values of our reporting units, the recognized impairment would have been approximately 7% less, or approximately 10% greater, respectively. If we increased, or decreased, our expected growth rates by 10% when estimating the fair values of our reporting units, the recognized impairment would have been approximately 1% greater, or approximately 1% less, respectively. This impairment charge did not have an impact on our liquidity or financial covenants under our Facility; however it was a reflection of the overall downturn in our industry and decline in our projected cash flows.
Long-lived assets, including property, plant and equipment and amortizable intangible assets, also comprise a significant portion of our total assets. We evaluate the carrying value of long-lived assets when impairment indicators are present or when circumstances indicate that impairment may exist under authoritative guidance. When management believes impairment indicators may exist, projections of the undiscounted future cash flows associated with the use of and eventual disposition of long-lived assets held for use are prepared. If the projections indicate that the carrying values of the long-lived assets are not recoverable, we reduce the carrying values to fair value. For long-lived assets held for sale, we compare the carrying values to an estimate of fair value less selling costs to determine potential impairment. We test for impairment of long-lived assets at the lowest level for which cash flows are measurable. These impairment tests are heavily influenced by assumptions and estimates that are subject to change as additional information becomes available. In connection with our goodwill impairment test we concluded the 2009 decline in the business and economic climate and significant reductions in estimated cash flows for the income approach resulted in a full impairment of the value of customer relationships for the PFI reporting unit. This $12.3 million expense is included in the “Goodwill and other intangible impairment” expense on the Consolidated Statements of Operations. The PFI reporting unit is part of the MRO segment.
Purchase Accounting
The Company estimates the fair value of assets, including property, machinery and equipment and their related useful lives and salvage values, and liabilities when allocating the purchase price of an acquisition.
Cost of Sales and Selling, General and Administrative Expense
Cost of sales includes product and product related costs, inbound freight charges, internal transfer costs and depreciation. Selling, general and administrative expense includes purchasing and receiving costs, inspection costs, warehousing costs, depreciation and amortization. DXP’s gross margins may not be comparable to those of other entities, since some entities include all of the costs related to their distribution network in cost of sales and others like DXP exclude a portion of these costs from gross margin, including the costs in a line item, such as selling, general and administrative expense.
23
Income Taxes
Deferred income tax assets and liabilities are computed for differences between the financial statement and income tax bases of assets and liabilities. Such deferred income tax asset and liability computations are based on enacted tax laws and rates applicable to periods in which the differences are expected to reverse. Valuation allowances are established to reduce deferred income tax assets to the amounts expected to be realized.
Stock-Based Compensation
No future grants will be made under the Company’s existing stock option plans. The Company currently uses restricted stock for share-based compensation programs. Compensation expense recognized for share-based compensation programs in the years ended December 31, 2007, 2008 and 2009 was $591,000, $930,000 and $1,555,000, respectively. Unrecognized compensation expense under the Restricted Stock Plan was $3,092,000 and $2,601,000, respectively, at December 31, 2008 and 2009. As of December 31, 2009, the weighted average period over which the unrecognized compensation expense is expected to be recognized is 30.9 months.
Recent Accounting Pronouncements
See Note 2 of the Notes to the Consolidated Financial Statements for discussion of recent accounting pronouncements.
Inflation
We do not believe the effects of inflation have any material adverse effect on our results of operations or financial condition. We attempt to minimize inflationary trends by passing manufacturer price increases on to the customer whenever practicable.
ITEM 7A. Quantitative and Qualitative Disclosures about Market Risk
Our market risk results primarily from volatility in interest rates. Our exposure to interest rate risk relates primarily to our debt portfolio. Using floating interest rate debt outstanding at December 31, 2009, a 100 basis point increase in interest rates would increase our annual interest expense by approximately $1.1 million.
24
The table below provides information about the Company’s market sensitive financial instruments and constitutes a forward-looking statement.
|
Principal Amount By Expected Maturity
(in thousands, except percentages)
|
||||||||
|
2010
|
2011
|
2012
|
2013
|
2014
|
Thereafter
|
Total
|
Fair Value
|
|
|
Fixed Rate Long- term Debt
|
$ 128
|
$ 106
|
$ 113
|
$ 1,637
|
-
|
-
|
$ 1,984
|
$ 1,984
|
|
Average Interest
Rate
|
5.88%
|
6.25%
|
6.25%
|
6.25%
|
-
|
|||
|
Floating Rate
Long-term Debt
|
$12,467
|
$10,560
|
$10,000
|
$80,500
|
-
|
-
|
$113,527
|
$113,527
|
|
Average Interest
Rate (1)
|
2.52%
|
2.67%
|
2.74%
|
2.04%
|
||||
|
Total Maturities
|
$12,595
|
$10,666
|
$10,113
|
$82,137
|
-
|
$115,511
|
$115,511
|
|
|
(1) Assumes floating interest rates in effect at December 31, 2009.
|
||||||||
To hedge a portion of our floating rate debt, as of January 10, 2008, DXP entered into an interest rate swap agreement with the lead bank of our Facility. Through January 11, 2010 this interest rate swap effectively fixed the interest rate on $40 million of floating rate “LIBOR” borrowings under the Facility at 3.68% plus the margin (1.75% at December 31, 2009) in effect under the Facility.
ITEM 8. Financial Statements and Supplementary Data
|
TABLE OF CONTENTS
|
|
|
Page
|
|
|
Reports of Independent Registered Public Accounting Firm
|
26
|
|
Management Report on Internal Controls
|
28
|
|
Consolidated Balance Sheets
|
29
|
|
Consolidated Statements of Operations
|
30
|
|
Consolidated Statements of Shareholders’ Equity
|
31
|
|
Consolidated Statements of Cash Flows
|
32
|
|
Notes to Consolidated Financial Statements
|
33
|
25
Report Of Independent Registered Public Accounting Firm on Financial Statements
To the Board of Directors and Shareholders of
DXP Enterprises, Inc., and Subsidiaries
Houston, Texas
We have audited the accompanying consolidated balance sheets of DXP Enterprises, Inc. and Subsidiaries as of December 31, 2008 and 2009, and the related consolidated statements of operations, shareholders' equity and cash flows for each of the three years in the period ended December 31, 2009. These consolidated financial statements are the responsibility of the Company's management. Our responsibility is to express an opinion on these consolidated financial statements based on our audits.
We conducted our audits in accordance with auditing standards of the Public Company Accounting Oversight Board (United States). Those standards require that we plan and perform the audits to obtain reasonable assurance about whether the financial statements are free of material misstatement. An audit includes examining, on a test basis, evidence supporting the amounts and disclosures in the financial statements. An audit also includes assessing the accounting principles used and significant estimates made by management, as well as evaluating the overall financial statement presentation. We believe that our audits provide a reasonable basis for our opinion.
In our opinion, the consolidated financial statements referred to above present fairly, in all material respects, the consolidated financial position of DXP Enterprises, Inc., and Subsidiaries at December 31, 2008 and 2009, and the results of their operations and their cash flows for each of the three years in the period ended December 31, 2009, in conformity with accounting principles generally accepted in the United States of America.
We were engaged to audit, in accordance with the standards of the Public Company Accounting Oversight Board (United States), the effectiveness of DXP Enterprises, Inc. and Subsidiaries internal control over financial reporting as of December 31, 2009, based on criteria established in Internal Control Integrated Framework issued by the Committee of Sponsoring Organizations of the Treadway Commission. Our report dated March 23, 2010, expressed an unqualified opinion on the effectiveness of internal control over financial reporting.
Hein & Associates LLP
Houston, Texas
March 23, 2010
26
Report of Independent Registered Public Accounting Firm
on Internal Control over Financial Reporting
To the Board of Directors and Shareholders of
DXP Enterprises, Inc.
Houston, Texas
We were engaged to audit DXP Enterprises, Inc.’s (the “Company”) internal control over financial reporting based upon criteria established in Internal Control — Integrated Framework issued by the Committee of Sponsoring Organizations of the Treadway Commission (“COSO”). The Company’s management is responsible for maintaining effective internal control over financial reporting and for its assessment of the effectiveness of internal control over financial reporting.
A company’s internal control over financial reporting is a process designed to provide reasonable assurance regarding the reliability of financial reporting and the preparation of consolidated financial statements for external purposes in accordance with accounting principles generally accepted in the United States of America. A company’s internal control over financial reporting includes those policies and procedures that (i) pertain to the maintenance of records that, in reasonable detail, accurately and fairly reflect the transactions and dispositions of the assets of the company; (ii) provide reasonable assurance that transactions are recorded as necessary to permit preparation of financial statements in accordance with accounting principles generally accepted in the United States of America, and that receipts and expenditures of the company are being made only in accordance with authorizations of management and directors of the company; and (iii) provide reasonable assurance regarding prevention or timely detection of unauthorized acquisition, use, or disposition of the company’s assets that could have a material effect on the financial statements.
Because of its inherent limitations, internal control over financial reporting may not prevent or detect misstatements. Also, projections of any evaluation of effectiveness to future periods are subject to the risk that controls may become inadequate because of changes in conditions, or that the degree of compliance with the policies or procedures may deteriorate.
In our opinion, the Company maintained, in all material respects, effective internal control over financial reporting as of December 31, 2009, based on criteria established in Internal Control – Integrated Framework issued by the Committee of Sponsoring Organizations of the Treadway Commission (“COSO”).
We have also audited, in accordance with the standards of the Public Company Accounting Oversight Board (United States), the consolidated balance sheets of DXP Enterprises, Inc. as of December 31, 2009 and 2008, and the related consolidated statements of operations, shareholders’ equity, and cash flows for each of the years in the three year period ended December 31, 2009. Our report thereon dated March 23, 2010 expressed an unqualified opinion.
Hein & Associates LLP
Houston, Texas
March 23, 2010
27
MANAGEMENT’S REPORT
ON INTERNAL CONTROL OVER FINANCIAL REPORTING
The Company has assessed the effectiveness of its internal control over financial reporting as of December 31, 2009 based on criteria established by Internal Control – Integrated Framework issued by the Committee of Sponsoring Organizations of the Treadway Commission (“COSO Framework”). The Company’s management is responsible for establishing and maintaining adequate internal controls over financial reporting. The Company’s independent registered public accountants that audited the Company’s financial statements as of December 31, 2009, have issued an attestation report on the Company’s internal control over financial reporting, which appears on page 27.
Internal control over financial reporting is a process designed by, or under the supervision of, a company’s principal executive and principal financial officers, and effected by the Company’s board of directors, management and other personnel, to provide reasonable assurance regarding the reliability of financial reporting and the preparation of financial statements for external purposes in accordance with generally accepted accounting principles. A company’s internal control over financial reporting includes those policies and procedures that (1) pertain to the maintenance of records that, in reasonable detail, accurately and fairly reflect the transactions and dispositions of the assets of the company; (2) provide reasonable assurance that transactions are recorded as necessary to permit preparation of financial statements in accordance with generally accepted accounting principles, and that receipts and expenditures of the company are being made only in accordance with authorizations of management and directors of the company; and (3) provide reasonable assurance regarding prevention or timely detection of unauthorized acquisition, use, or disposition of the company’s assets that could have a material effect on the financial statements. Because of its inherent limitations, internal control over financial reporting may not prevent or detect misstatements. Also, projections of any evaluation of effectiveness to future periods are subject to the risk that controls may become inadequate because of changes in conditions, or that the degree of compliance with policies or procedures may deteriorate.
The Company’s assessment of the effectiveness of its internal control over financial reporting included testing and evaluating the design and operating effectiveness of its internal controls with the participation of its principal executive and principal financial officers. In management’s opinion, the Company has maintained effective internal control over financial reporting as of December 31, 2009, based on criteria established in the COSO Framework.
/s/ David R. Little /s/ Mac McConnell
David R. Little Mac McConnell
Chairman of the Board and Senior Vice President/Finance and
Chief Executive Officer Chief Financial Officer
28
|
DXP ENTERPRISES, INC., AND SUBSIDIARIES
CONSOLIDATED BALANCE SHEETS
(In Thousands, Except Share and Per Share Amounts)
|
|||
|
December 31,
|
|||
|
2008
|
2009
|
||
|
ASSETS
|
|||
|
Current assets:
|
|||
|
Cash
|
$ 5,698
|
$ 2,344
|
|
|
Trade accounts receivable, net of allowances for doubtful accounts
|
|||
|
of $3,494 in 2008 and $3,006 in 2009
|
101,191
|
77,066
|
|
|
Inventories, net
|
119,097
|
72,581
|
|
|
Prepaid expenses and other current assets
|
2,851
|
3,533
|
|
|
Federal income tax recoverable
|
-
|
235
|
|
|
Deferred income taxes
|
3,863
|
7,833
|
|
|
Total current assets
|
232,700
|
163,592
|
|
|
Property and equipment, net
|
20,331
|
16,955
|
|
|
Goodwill
|
98,718
|
60,542
|
|
|
Other intangibles, net of accumulated amortization of $9,605 in 2008
and $13,779 in 2009
|
45,227
|
25,727
|
|
|
Non-current deferred income taxes
|
-
|
3,289
|
|
|
Other assets
|
880
|
822
|
|
|
Total assets
|
$ 397,856
|
$ 270,927
|
|
|
LIABILITIES AND SHAREHOLDERS' EQUITY
|
|||
|
Current liabilities:
|
|||
|
Current portion of long-term debt
|
$ 13,965
|
$ 12,595
|
|
|
Trade accounts payable
|
57,551
|
51,185
|
|
|
Accrued wages and benefits
|
12,869
|
6,633
|
|
|
Customer advances
|
2,719
|
1,008
|
|
|
Federal income taxes payable
|
7,894
|
-
|
|
|
Other accrued liabilities
|
8,660
|
6,377
|
|
|
Total current liabilities
|
103,658
|
77,798
|
|
|
Long-term debt, less current portion
|
154,591
|
102,916
|
|
|
Deferred income taxes
|
9,419
|
-
|
|
|
Commitments and contingencies (Note 11)
|
|||
|
Shareholders’ equity:
|
|||
|
Series A preferred stock, 1/10th vote per share; $1.00 par value;
liquidation preference of $100 per share ($112 at December 31, 2009);
1,000,000 shares authorized; 1,122 shares issued and outstanding
|
1
|
1
|
|
|
Series B convertible preferred stock, 1/10th vote per share; $1.00
par value; $100 stated value; liquidation preference of $100 per
share ($1,500 at December 31, 2009); 1,000,000 shares authorized;
15,000 shares issued and outstanding
|
15
|
15
|
|
|
Common stock, $0.01 par value, 100,000,000 shares authorized;
12,863,304 and 12,935,201 shares issued and outstanding, respectively.
|
128
|
129
|
|
|
Paid-in capital
|
56,206
|
58,037
|
|
|
Retained earnings
|
74,559
|
32,057
|
|
|
Accumulated other comprehensive income (loss)
|
(721)
|
(26)
|
|
|
Total shareholders’ equity
|
130,188
|
90,213
|
|
|
Total liabilities and shareholders’ equity
|
$ 397,856
|
$ 270,927
|
|
|
The accompanying notes are an integral part of these consolidated financial statements.
|
|||
29
|
DXP ENTERPRISES, INC. AND SUBSIDIARIES
CONSOLIDATED STATEMENTS OF OPERATIONS
(In Thousands, Except Per Share Amounts)
|
|||||
|
Years Ended December 31,
|
|||||
|
2007
|
2008
|
2009
|
|||
|
Sales
|
$ 444,547
|
$ 736,883
|
$ 583,226
|
||
|
Cost of sales
|
318,855
|
529,895
|
431,812
|
||
|
Gross profit
|
125,692
|
206,988
|
151,414
|
||
|
Selling, general and administrative expense
|
93,800
|
158,797
|
147,795
|
||
|
Goodwill and other intangible impairment
|
-
|
-
|
52,951
|
||
|
Operating income (loss)
|
31,892
|
48,191
|
(49,332)
|
||
|
Other income
|
349
|
223
|
95
|
||
|
Interest expense
|
(3,344)
|
(6,130)
|
(5,245)
|
||
|
Income (loss) before provision for income taxes
|
28,897
|
42,284
|
(54,482)
|
||
|
Provision (benefit) for income taxes
|
11,550
|
16,397
|
(12,070)
|
||
|
Net income (loss)
|
17,347
|
25,887
|
(42,412)
|
||
|
Preferred stock dividend
|
(90)
|
(90)
|
(90)
|
||
|
Net income (loss) attributable to common shareholders
|
$ 17,257
|
$ 25,797
|
$ (42,502)
|
||
|
Per share and share amounts
|
|||||
|
Basic earnings (loss) per common share –
restated (Note 2)
|
$ 1.46
|
$ 1.99
|
$ (3.24)
|
||
|
Common shares outstanding – restated (Note 2)
|
11,811
|
12,945
|
13,117
|
||
|
Diluted earnings (loss) per share – restated (Note 2)
|
$ 1.35
|
$ 1.87
|
$ (3.24)
|
||
|
Common and common equivalent shares
Outstanding – restated (Note 2)
|
12,860
|
13,869
|
13,117
|
||
|
The accompanying notes are an integral part of these consolidated financial statements.
|
|||||
30
|
DXP ENTERPRISES, INC.
CONSOLIDATED STATEMENTS OF SHAREHOLDERS’ EQUITY
Years Ended December 31, 2007, 2008 and 2009
(in Thousands, Except Share Amounts)
|
|||||||||
|
Series A
Preferred
Stock
|
Series B
Preferred
Stock
|
Common
Stock
|
Paid-In
Capital
|
Retained
Earnings
|
Treasury
Stock
|
Notes
Receivable
From
Share-
holders
|
Accumulated
Other
Comprehensive
Income (Loss)
|
Total
|
|
|
BALANCES AT
DECEMBER 31, 2006
|
$ 1
|
$ 15
|
$ 102
|
$ 6,096
|
$31,505
|
$ -
|
$(799)
|
$ -
|
$ 36,920
|
|
Exchange of note receivable for
40,098 shares of common stock
|
-
|
-
|
-
|
-
|
-
|
(825)
|
799
|
-
|
(26)
|
|
Dividends paid
|
-
|
-
|
-
|
-
|
(90)
|
-
|
-
|
-
|
(90)
|
|
Compensation expense
for restricted stock
|
-
|
-
|
-
|
591
|
-
|
-
|
-
|
-
|
591
|
|
Exercise of stock options for
399,910 shares of common stock
|
-
|
-
|
4
|
3,394
|
-
|
-
|
-
|
-
|
3,398
|
|
Sale of 2,000,000 shares from
public offering
|
-
|
-
|
20
|
44,553
|
-
|
-
|
-
|
-
|
44,573
|
|
Net income
|
-
|
-
|
-
|
-
|
17,347
|
-
|
-
|
-
|
17,347
|
|
BALANCES AT
DECEMBER 31, 2007
|
$ 1
|
$ 15
|
$ 126
|
$54,634
|
$48,762
|
$(825)
|
-
|
-
|
$102,713
|
|
Dividends paid
|
-
|
-
|
-
|
-
|
(90)
|
-
|
-
|
-
|
(90)
|
|
Compensation expense
for restricted stock
|
-
|
-
|
-
|
930
|
-
|
-
|
-
|
-
|
930
|
|
Exercise of stock options and
vesting of restricted stock for
219,160 of common stock
|
-
|
-
|
2
|
642
|
-
|
825
|
-
|
-
|
1,469
|
|
Net loss on interest rate swap
for comprehensive income
|
-
|
-
|
-
|
-
|
-
|
-
|
-
|
(721)
|
(721)
|
|
Net Income
|
-
|
-
|
-
|
-
|
25,887
|
-
|
-
|
-
|
25,887
|
|
BALANCES AT
DECEMBER 31, 2008
|
$ 1
|
$ 15
|
$ 128
|
$56,206
|
$74,559
|
-
|
-
|
$(721)
|
$130,188
|
|
Dividends paid
|
-
|
-
|
-
|
-
|
(90)
|
-
|
-
|
(90)
|
|
|
Compensation expense
for restricted stock
|
-
|
-
|
-
|
1,555
|
-
|
-
|
-
|
1,555
|
|
|
Net gain on interest rate swap
for comprehensive income
|
695
|
695
|
|||||||
|
Excess tax benefit from exercise
of stock options and vesting of
restricted stock
|
-
|
-
|
-
|
266
|
-
|
-
|
-
|
-
|
266
|
|
Exercise of stock options and
vesting of restricted stock for
71,897 shares of common stock
|
-
|
-
|
1
|
10
|
-
|
-
|
-
|
-
|
11
|
|
Net loss
|
-
|
-
|
-
|
-
|
(42,412)
|
-
|
-
|
(42,412)
|
|
|
BALANCES AT
DECEMBER 31, 2009
|
$ 1
|
$ 15
|
$ 129
|
$58,037
|
$32,057
|
-
|
-
|
$(26)
|
$90,213
|
|
The accompanying notes are an integral part of these consolidated financial statements
|
|||||||||
31
|
DXP ENTERPRISES, INC., AND SUBSIDIARIES
CONSOLIDATED STATEMENTS OF CASH FLOWS
(In Thousands)
|
|||||
|
Years Ended December 31
|
|||||
|
2007
|
2008
|
2009
|
|||
|
CASH FLOWS FROM OPERATING ACTIVITIES:
|
|||||
|
Net income (loss)
|
$ 17,347
|
$ 25,887
|
$ (42,412)
|
||
|
Adjustments to reconcile net income (loss) to net cash
provided by operating activities – net of acquisitions
|
|||||
|
Goodwill and other intangible impairment
|
-
|
-
|
52,951
|
||
|
Precision inventory impairment
|
-
|
-
|
13,800
|
||
|
Depreciation
|
2,258
|
4,629
|
4,260
|
||
|
Amortization
|
2,704
|
6,363
|
7,216
|
||
|
Deferred income taxes
|
(559)
|
143
|
(16,678)
|
||
|
Stock-based compensation expense
|
591
|
930
|
1,555
|
||
|
Tax benefit related to exercise of stock options and
vesting of restricted stock
|
(3,197)
|
(1,362)
|
(266)
|
||
|
Gain on sale of property and equipment
|
(8)
|
(116)
|
-
|
||
|
Changes in operating assets and liabilities, net of assets
and liabilities acquired in business combinations:
|
|||||
|
Trade accounts receivable
|
(9,253)
|
(10,876)
|
24,125
|
||
|
Inventories
|
(6,882)
|
(11,161)
|
32,716
|
||
|
Prepaid expenses and other assets
|
3,263
|
366
|
(1,665)
|
||
|
Accounts payable and accrued expenses
|
7,212
|
3,655
|
(24,027)
|
||
|
Net cash provided by operating activities
|
13,476
|
18,458
|
51,575
|
||
|
CASH FLOWS FROM INVESTING ACTIVITIES:
|
|||||
|
Purchase of property and equipment
|
(1,902)
|
(5,134)
|
(1,593)
|
||
|
Purchase of businesses, net of cash acquired
|
(125,869)
|
(73,943)
|
(491)
|
||
|
Proceeds from the sale of property and equipment
|
8
|
158
|
16
|
||
|
Net cash used in investing activities
|
(127,763)
|
(78,919)
|
(2,068)
|
||
|
CASH FLOWS FROM FINANCING ACTIVITIES:
|
|||||
|
Proceeds from debt
|
191,779
|
165,466
|
133,716
|
||
|
Principal payments on revolving line of credit,
long-term debt and notes payable
|
(123,940)
|
(104,662)
|
(186,763)
|
||
|
Dividends paid in cash
|
(90)
|
(90)
|
(90)
|
||
|
Proceeds from exercise of stock options
|
202
|
105
|
10
|
||
|
Proceeds from sale of common stock
|
44,573
|
-
|
-
|
||
|
Tax benefit related to exercise of stock options
|
3,197
|
1,362
|
266
|
||
|
Net cash provided by (used in) financing activities
|
115,721
|
62,181
|
(52,861)
|
||
|
INCREASE (DECREASE) IN CASH
|
1,434
|
1,720
|
(3,354)
|
||
|
CASH AT BEGINNING OF YEAR
|
2,544
|
3,978
|
5,698
|
||
|
CASH AT END OF YEAR
|
$ 3,978
|
$ 5,698
|
$ 2,344
|
||
|
SUPPLEMENTAL DISCLOSURES:
|
|||||
|
Cash paid for --
|
|||||
|
Interest
|
$ 3,158
|
$ 6,207
|
$ 5,338
|
||
|
Income taxes
|
$ 5,879
|
$ 9,263
|
$ 15,053
|
||
|
Cash income tax refunds
|
$ 20
|
$ -
|
$ 73
|
||
|
The accompanying notes are an integral part of these consolidated financial statements.
|
|||||
32
DXP ENTERPRISES INC. AND SUBSIDIARIES
NOTES TO CONSOLIDATED FINANCIAL STATEMENTS
1. ORGANIZATION AND SIGNIFICANT ACCOUNTING POLICIES:
DXP Enterprises, Inc., a Texas corporation, was incorporated on July 26, 1996, to be the successor to SEPCO Industries, Inc.. DXP Enterprises, Inc. and its subsidiaries (“DXP” or the “Company”) is engaged in the business of distributing maintenance, repair and operating products, equipment and service to industrial customers. The Company is organized into two segments: Maintenance, Repair and Operating (MRO) and Electrical Contractor. See Note 16 for discussion of the business segments.
Principles of Consolidation
The accompanying consolidated financial statements include the accounts of the Company and its wholly owned subsidiaries. All significant intercompany accounts and transactions have been eliminated in consolidation.
Receivables and Credit Risk
Trade receivables consist primarily of uncollateralized customer obligations due under normal trade terms, which usually require payment within 30 days of the invoice date. However, these payment terms are extended in select cases and many customers do not pay within stated trade terms.
The Company has trade receivables from a diversified customer base in the Rocky Mountain, Midwestern, Southeastern and Southwestern regions of the United States. The Company believes no significant concentration of credit risk exists. The Company evaluates the creditworthiness of its customers' financial positions and monitors accounts on a regular basis, but generally does not require collateral. Provisions to the allowance for doubtful accounts are made monthly and adjustments are made periodically (as circumstances warrant) based upon management’s best estimate of the collectability of all such accounts. No customer represents more than 10% of consolidated sales.
Inventories
Inventories consist principally of finished goods and are priced at lower of cost or market, cost being determined using the first-in, first-out (“FIFO”) method. Reserves are provided against inventories for estimated obsolescence based upon the aging of the inventories and market trends.
Property and Equipment
Assets are carried on the basis of cost. Provisions for depreciation are computed at rates considered to be sufficient to amortize the costs of assets over their expected useful lives. Depreciation of property and equipment is computed using the straight-line method. Maintenance and repairs of depreciable assets are charged against earnings as incurred. Additions and improvements are capitalized. When properties are retired or otherwise disposed of, the cost and accumulated depreciation are removed from the accounts and gains or losses are credited or charged to earnings.
The principal estimated useful lives used in determining depreciation are as follows:
Buildings 20 – 39 years
Building improvements 10 – 20 years
Furniture, fixtures and equipment 3 – 10 years
Leasehold improvements over the shorter of the estimated useful life or the term of the related lease
33
Cash and Cash Equivalents
The Company’s presentation of cash includes cash equivalents. Cash equivalents are defined as short-term investments with maturity dates of 90 days or less at time of purchase.
Fair Value of Financial Instruments
A summary of the carrying and the fair value of financial instruments, excluding derivatives, at December 31, 2008 and 2009 is as follows (in thousands):
|
2008
|
2009
|
||||||
|
Carrying
Value
|
Fair
Value
|
Carrying
Value
|
Fair
Value
|
||||
|
Cash
|
$ 5,698
|
$ 5,698
|
$2,344
|
$2,344
|
|||
|
Long-term debt, including current portion
|
168,556
|
168,556
|
115,511
|
115,511
|
|||
The carrying value of the long-term debt approximates fair value based upon the current rates and terms available to the Company for instruments with similar remaining maturities. The carrying amounts of accounts receivable and accounts payable approximate their fair values due to the short-term maturities of these instruments.
Stock-Based Compensation
The Company uses restricted stock for share-based compensation programs. No future grants will be made under the Company’s stock option plans. See Note 10 – Shareholders’ Equity for additional information on stock-based compensation.
Revenue Recognition
For binding agreements to fabricate tangible assets to customer specifications, the Company recognizes revenues using the percentage of completion method. The extent of completion is measured as cost incurred divided by the total estimated cost. At December 31, 2008 and 2009, $1.9 million and $0.1 million, respectively, of unbilled costs and estimated earnings are included in accounts receivable. For other sales, the Company recognizes revenues when an agreement is in place, the price is fixed, title for product passes to the customer or services have been provided and collectability is reasonably assured. Revenues are recorded net of sales taxes.
The Company reserves for potential customer returns based upon the historical level of returns.
Shipping and Handling Costs
The Company classifies shipping and handling charges billed to customers as sales. Shipping and handling charges paid to others are classified as a component of cost of sales.
Use of Estimates
The preparation of financial statements in conformity with generally accepted accounting principles requires the Company to make estimates and assumptions in determining the reported amounts of assets and liabilities and disclosure of contingent assets and liabilities at the date of the financial statements and the reported amounts of revenues and expenses during the reporting period. The significant estimates made by the Company in the accompanying financial statements relate to the valuation of intangibles, determination of goodwill impairments, reserves for accounts receivable collectability, inventory valuations, income taxes and self-insured medical and liability claims. Actual results could differ from those estimates and such differences could be material.
34
Self-insured Insurance and Medical Claims
We generally retain up to $100,000 of risk for each claim for workers compensation, general liability, automobile and property loss. We accrue for the estimated loss on the self-insured portion of these claims. The accrual is adjusted quarterly based upon reported claims information. The actual cost could deviate from the recorded estimate.
We generally retain up to $200,000 of risk on each medical claim for our employees and dependents. We accrue for the estimated outstanding balance of unpaid medical claims for our employees and their dependents. The accrual is adjusted monthly based on recent claims experience. The actual claims could deviate from recent claims experience and be materially different from the reserve.
The accrual for these claims at December 31, 2009 and 2008 was approximately $1.3 and $2.0 million, respectively.
Impairment of Long-Lived Assets and Goodwill
Goodwill represents a significant portion of our total assets. We review goodwill for impairment annually during our fourth quarter or more frequently if certain impairment indicators arise under the provisions of authoritative guidance. We review goodwill at the reporting level unit, which is one level below an operating segment. We compare the carrying value of the net assets of each reporting unit to the net present value of estimated discounted future cash flows of the reporting unit. If the carrying value exceeds the net present value of estimated discounted future cash flows, an impairment indicator exists and an estimate of the impairment loss is calculated. The fair value calculation includes multiple assumptions and estimates, including the projected cash flows and discount rates applied. Changes in these assumptions and estimates could result in goodwill impairment that could materially adversely impact our financial position or results of operations. All of our goodwill is related to our MRO segment and was included in its two reporting units which are DXP and PFI. Goodwill of $101.0 million, before impairment, was primarily recorded in connection with the 13 acquisitions of the MRO businesses completed since 2004, all of which was included in the two reporting units for our MRO segment. Assets, liabilities, deferred taxes and goodwill for each reporting unit were determined using the balance sheets maintained for each reporting unit. We recorded a partial impairment of goodwill for the PFI reporting unit and a partial impairment of the goodwill for the DXP reporting unit during 2009.
When estimating fair values of a reporting unit for our goodwill impairment test, we use an income approach which incorporates management’s views. The income approach provides an estimated fair value based on each reporting unit’s anticipated cash flows that are discounted using a weighted average cost of capital rate. The primary assumptions used in the income approach were estimated cash flows and weighted average cost of capital. Estimated cash flows were primarily based on projected revenues, operating costs and capital expenditures and are discounted based on comparable industry average rates for weighted average cost of capital. We utilized discount rates based on weighted average cost of capital ranging from 12.0% to 14.5% when we estimated fair values of our reporting units as of December 31, 2009. To ensure the reasonableness of the estimated fair values of our reporting units, we performed a reconciliation of our total market capitalization to the total estimated fair value of all our reporting units. The assumptions used in estimating fair values of reporting units and performing the goodwill impairment test are inherently uncertain and required management judgment. The assumptions and methodologies used for valuing goodwill in the current year are consistent with those used in the prior year.
During 2009 there were significant declines in the U.S. and global economies and in oil and natural gas prices which led to declines in our sales, margins and cash flows. Our sales and profitability declined throughout the year particularly in the fourth quarter. We considered the impact of these significant adverse changes in the economic and business climate as we performed our annual impairment assessment of goodwill as of December 31, 2009. The estimated fair values of our reporting units were negatively impacted by significant reductions in estimated cash flows for the income approach.
Our goodwill impairment analysis led us to conclude that there was a significant impairment of goodwill for the PFI reporting unit and a significant impairment of goodwill for the DXP reporting unit and, accordingly, we recorded a non-cash charge of $40.7 million to our operating results for the year ended December 31, 2009, for the impairment of our goodwill. If we increased, or decreased, our discount rates by 10% when estimating the fair values of our reporting units, the recognized impairment would have been approximately 7% less, or approximately 10% greater, respectively. If we increased, or decreased, our expected growth rates by 10% when estimating the fair values of our reporting units, the recognized impairment would have been approximately 1% greater, or approximately 1% less, respectively. This impairment charge did not have an impact on our liquidity or financial covenants under our Facility; however it was a reflection of the overall downturn in our industry and decline in our projected cash flows.
35
Long-lived assets, including property, plant and equipment and amortizable intangible assets, also comprise a significant portion of our total assets. We evaluate the carrying value of long-lived assets when impairment indicators are present or when circumstances indicate that impairment may exist under authoritative guidance. When management believes impairment indicators may exist, projections of the undiscounted future cash flows associated with the use of and eventual disposition of long-lived assets held for use are prepared. If the projections indicate that the carrying values of the long-lived assets are not recoverable, we reduce the carrying values to fair value. For long-lived assets held for sale, we compare the carrying values to an estimate of fair value less selling costs to determine potential impairment. We test for impairment of long-lived assets at the lowest level for which cash flows are measurable. These impairment tests are heavily influenced by assumptions and estimates that are subject to change as additional information becomes available. In connection with our goodwill impairment test we concluded the 2009 decline in the business and economic climate and significant reductions in estimated cash flows for the income approach resulted in a full impairment of the value of customer relationships for the PFI reporting unit. This $12.3 million expense is included in the “Goodwill and other intangible impairment” expense on the Consolidated Statements of Operations. The PFI reporting unit is part of the MRO segment.
Goodwill and Other Intangible Assets
The $43.9 million increase in goodwill and the $29.4 million increase in other intangibles from December 31, 2006 to December 31, 2007 results from recording the estimated intangibles for the acquisitions of Delta Process Equipment, Precision Industries, Inc., and Indian Fire and Safety and changes in the estimates of intangibles for businesses acquired during 2006. The changes made in 2007 to the estimates for other intangibles for the 2006 acquisitions relate primarily to increasing the value of customer relationships for Production Pump, Safety International, Safety Alliance and Gulf Coast Torch. The adjustment to goodwill related primarily to the payment of contingent purchase price for Production Pump. At December 31, 2008, $98.7 million and $45.2 million (net of $9.6 million of amortization) of total purchase price for acquisitions were allocated to goodwill and other intangibles, respectively. The $37.9 million increase in goodwill and the $9.4 million increase in other intangibles from December 31, 2007 to December 31, 2008 results from recording the goodwill and estimated intangibles for acquisitions of Rocky Mtn. Supply, PFI and Falcon Pump, contingent purchase price for acquisitions completed in prior years, and changes in the estimates of goodwill and intangibles for businesses acquired in 2007. The changes made in 2008 to the estimates for other intangibles associated with 2007 acquisitions relate primarily to increasing the value of customer relationships for Indian Fire and Safety. The changes made to goodwill during 2008 primarily relate to reducing the value of acquired inventories for Precision and the payment of contingent purchase price for Production Pump. The $2.5 million adjustment to increase goodwill during 2009 primarily results from a $0.9 million reduction in the value of acquired inventories for Rocky Mtn. Supply, Inc. and a $1.2 million reduction in acquired fixed assets for PFI, LLC, both of which were acquired in 2008. Other intangible assets are generally amortized on a straight line basis over the useful lives of the assets. All goodwill and other intangible assets pertain to the MRO segment.
The changes in the carrying amount of goodwill and other intangibles for 2007, 2008 and 2009 are as follows (in thousands):
36
|
Total
|
Goodwill
|
Other
Intangibles
|
|||
|
Net balance as of December 31, 2006
|
$ 23,428
|
$ 16,964
|
$ 6,464
|
||
|
Acquired during the year
|
75,286
|
48,067
|
27,219
|
||
|
Adjustments to prior year estimates
|
691
|
(4,182)
|
4,873
|
||
|
Amortization
|
(2,704)
|
-
|
(2,704)
|
||
|
Balance as of December 31, 2007
|
$ 96,701
|
$ 60,849
|
$ 35,852
|
||
|
Acquired during the year
|
45,682
|
31,402
|
14,280
|
||
|
Adjustments to prior year estimates
|
7,925
|
6,467
|
1,458
|
||
|
Amortization
|
(6,363)
|
-
|
(6,363)
|
||
|
Balance as of December 31, 2008
|
$ 143,945
|
$ 98,718
|
$ 45,227
|
||
|
Adjustments to prior year estimates
|
2,491
|
2,491
|
-
|
||
|
Amortization
|
(7,216)
|
-
|
(7,216)
|
||
|
Impairment
|
(52,951)
|
(40,667)
|
(12,284)
|
||
|
Balance as of December 31, 2009
|
$ 86,269
|
$ 60,542
|
$ 25,727
|
A summary of amortizable other intangible assets follows (in thousands):
|
As of December 31, 2008
|
As of December 31, 2009
|
||||||
|
Gross
Carrying
Amount
|
Accumulated
Amortization
|
Gross
Carrying
Amount
|
Accumulated
Amortization
|
||||
|
Vendor agreements
|
$ 2,496
|
$ (582)
|
$ 2,496
|
$ (706)
|
|||
|
Customer relationships
|
50,416
|
(8,289)
|
35,390
|
(11,908)
|
|||
|
Non-compete agreements
|
1,920
|
(734)
|
1,620
|
(1,165)
|
|||
|
Total
|
$ 54,832
|
$ (9,605)
|
$ 39,506
|
$ (13,779)
|
|||
The estimated future annual amortization of intangible assets for each of the next five years follows (in thousands):
2010 $ 5,113
2011 $ 4,841
2012 $ 4,708
2013 $ 3,988
2014 $ 3,728
The weighted average useful lives of acquired intangibles related to vendor agreements, customer relationships, and non-compete agreements are 20 years, 7.0 years and 3.1 years, respectively. The weighted average useful life of amortizable intangible assets in total is 7.6 years.
Of the $86.3 million net balance of goodwill and other intangibles at December 31, 2009, $71.6 million is expected to be deductible for tax purposes.
Purchase Accounting
DXP estimates the fair value of assets, including property, machinery and equipment and its related useful lives and salvage values, and liabilities when allocating the purchase price of an acquisition.
Cost of Sales and Selling, General and Administrative Expense
Cost of sales includes product and product related costs, inbound freight charges, internal transfer costs and depreciation. Selling, general and administrative expense includes purchasing and receiving costs, inspection costs, warehousing costs, depreciation and amortization. DXP’s gross margins may not be comparable to those of other entities, since some entities include all of the costs related to their distribution network in cost of sales and others like DXP exclude a portion of these costs from gross margin, including the costs in a line item, such as selling, general and administrative expense.
37
Income Taxes
The Company utilizes the asset and liability method of accounting for income taxes. Deferred income tax assets and liabilities are computed for differences between the financial statement and income tax bases of assets and liabilities. Such deferred income tax asset and liability computations are based on enacted tax laws and rates applicable to periods in which the differences are expected to reverse. Valuation allowances are established to reduce deferred income tax assets to the amounts expected to be realized.
Comprehensive Income
Comprehensive income includes net income, foreign currency translation adjustments, unrecognized gains (losses) on postretirement and other employment-related plans, changes in fair value of certain derivatives, and unrealized gains and losses on certain investments in debt and equity securities. The Company’s other comprehensive (loss) income is comprised exclusively of changes in the value of an interest rate swap.
Accounting for Uncertainty in Income Taxes
In July 2006, the Financial Accounting Standards Board (“FASB”) issued authoritative guidance which requires that a position taken or expected to be taken in a tax return be recognized in the financial statements when it is more likely than not (i.e. a likelihood of more than fifty percent) that the position would be sustained upon examination by tax authorities. A recognized tax position is then measured at the largest amount of benefit that is greater than fifty percent likely of being realized upon ultimate settlement. The Company and its subsidiaries file income tax returns in the U.S. federal jurisdiction and various states. With few exceptions, the Company is no longer subject to U. S. federal, state and local tax examination by tax authorities for years prior to 2003. The Company’s policy is to recognize interest related to unrecognized tax benefits as interest expense and penalties as operating expenses. Accrued interest is insignificant and there are no penalties accrued at December 31, 2009. The Company believes that it has appropriate support for the income tax positions taken and to be taken on its tax returns and that its accruals for tax liabilities are adequate for all open years based on an assessment of many factors including past experience and interpretations of tax law applied to the facts of each matter.
2. RECENT ACCOUNTING PRONOUNCEMENTS:
In September 2006, the Financial Accounting Standards Board (“FASB”) issued authoritative guidance which defines fair value, establishes a framework for measuring fair value in accordance with generally accepted accounting principles and expands disclosures about fair value measurements. This authoritative guidance does not require any new fair value measurements; rather, it applies under other accounting pronouncements that require or permit fair value measurements. The provisions of this authoritative guidance are to be applied prospectively as of the beginning of the fiscal year in which this is initially applied, with any transition adjustment recognized as a cumulative-effect adjustment to the opening balance of retained earnings. The provisions of this authoritative guidance are effective for the fiscal years beginning after November 15, 2007. In February 2008, the FASB issued authoritative guidance which delayed the effective date of this authoritative guidance to fiscal years beginning after November 15, 2008 and interim periods within those years for all nonfinancial assets and nonfinancial liabilities, except those that are recognized at fair value in the financial statements on a recurring basis (at least annually). See Note 14 “Fair Value of Financial Assets and Liabilities” for additional information on the adoption of this authoritative guidance.
In December 2007, the FASB issued authoritative guidance which requires the acquiring entity in a business combination to measure the identifiable assets acquired, the liabilities assumed and any noncontrolling interest in the acquiree at their fair values on the acquisition date, with goodwill being the excess value over the net identifiable assets acquired. In addition, immediate expense recognition is required for transaction costs. This authoritative guidance is effective for financial statements issued for fiscal years beginning after December 15, 2008, and adoption is prospective only. As such, if the Company enters into any business combinations in the future, a transaction may significantly affect the Company’s financial position and earnings, but, not cash flows, as compared to the Company’s past acquisitions.
38
In March 2008, the FASB issued authoritative guidance which amends and expands the disclosure requirements of previous authoritative guidance to provide a better understanding of how and why an entity uses derivative instruments, how derivative instruments and related hedged items are accounted for, and their effect on an entity’s financial position, financial performance, and cash flows. This authoritative guidance also requires disclosure of the fair values of derivative instruments and their gains and losses in a tabular format. This authoritative guidance is effective for financial statements issued for fiscal years and interim periods beginning after November 15, 2008, or the Company’s quarter ended March 31, 2009. As this pronouncement is only disclosure-related, it did not have an impact on DXP’s financial position and results of operations.
In April 2008, the FASB issued authoritative guidance which amends the factors that should be considered in developing renewal or extension assumptions used to determine the useful life of a recognized intangible asset. This authoritative guidance requires expanded disclosure related to the determination of useful lives for intangible assets and should be applied to all intangible assets recognized as of, and subsequent to December 31, 2008. The impact of this authoritative guidance will depend on the size and nature of acquisitions completed by the Company on or after January 1, 2009.
In June 2008, the FASB issued authoritative guidance which provides that unvested share-based payment awards that contain non-forfeitable rights to dividends or dividend equivalents (whether paid or unpaid) are participating securities and shall be included in the computation of earnings per share using the two-class method. The authoritative guidance is effective for fiscal years beginning after December 15, 2008 on a retrospective basis and was adopted by the Company in the first quarter of 2009. The Company has granted awards of restricted stock that contain non-forfeitable rights to dividends which are considered participating securities under this authoritative guidance. Because these awards are participating securities under the authoritative guidance, the Company is required to include these instruments in the calculation of earnings per share using the two-class method. The adoption of the authoritative guidance reduced basic and diluted earnings per share by $0.01 for 2007 and by $0.02 for 2008. Basic earnings per share, diluted earnings per share, weighted average common shares outstanding and weighted average common and common equivalent shares outstanding for 2007 and 2008 have been restated.
In May 2009, the FASB issued authoritative guidance which establishes general standards of accounting for and disclosure of events that occur after the balance sheet date but before the financial statements are issued or are available to be issued. The authoritative guidance provides guidance on the period after the balance sheet date during which management of a reporting entity should evaluate events or transactions that may occur for potential recognition or disclosure in the financial statements, the circumstances under which an entity should recognize events or transactions occurring after the balance sheet date in its financial statements and the disclosures that an entity should make about events or transactions that occurred after the balance sheet date. The Company adopted the authoritative guidance during the second quarter of 2009, and its application had no impact on the Company’s consolidated condensed financial statements. The Company evaluated subsequent events through the date this report was filed with the SEC.
3. ACCOUNTING METHODS ADOPTED JANUARY 1, 2008
On January 1, 2008, we elected to change our costing method for our inventories accounted for on the last-in, first-out method (“LIFO”) to the first-in, first-out (“FIFO”) method. The percentage of total inventories accounted for under the LIFO method was approximately 46% at December 31, 2007. We believe the FIFO method is preferable as it conforms the inventory costing methods for all of our inventories to a single method. The FIFO method also better reflects current acquisition costs of those inventories on our consolidated balance sheets and enhances the matching of future cost of sales with revenues. In accordance with authoritative guidance, all prior periods presented have been adjusted to apply the new method retrospectively. The effect of the change in our inventory costing method includes the LIFO reserve and related impact on the obsolescence reserve. This change increased our inventory balance by $2.0 million and increased retained earnings, net of income tax effects, by $1.2 million as of January 1, 2004. The effect of this change in accounting principle was immaterial to the results of operations for all prior periods presented from January 1, 2004 through December 31, 2007.
39
On January 1, 2008, we also changed our accounting method from the completed-contract method to the percentage of completion method for binding agreements to fabricate tangible assets to customers’ specifications in accordance with authoritative guidance. The percentage-of-completion method presents the economic substance of these transactions more clearly and timely than the completed-contract method. The effect of this change in accounting principle was immaterial to results of operations and balance sheets for all prior periods presented.
4. ACQUISITIONS
All of the Company’s acquisitions have been accounted for using the purchase method of accounting. Revenues and expenses of the acquired businesses have been included in the accompanying consolidated financial statements beginning on their respective dates of acquisition. The allocation of purchase price to the acquired assets and liabilities is based on estimates of fair market value and may be prospectively revised if and when additional information the Company is awaiting concerning certain asset and liability valuations is obtained, provided that such information is received no later than one year after the date of acquisition. Any contingent purchase price will increase goodwill when paid.
The initial purchase price allocation for the 2006 acquisitions was adjusted in 2007 to allocate $4.9 million of purchase price to intangibles other than goodwill and record $0.7 million of additional purchase price. The changes made in 2007 to the estimates for other intangibles for the 2006 acquisitions relate primarily to increasing the value of customer relationships for Production Pump, Safety International, Safety Alliance and Gulf Coast Torch. The adjustment to goodwill related primarily to the payment of contingent purchase price for Production Pump.
On May 4, 2007, DXP completed the acquisition of the business of Delta Process Equipment. DXP paid $10.0 million in cash for the business of Delta Process Equipment. DXP acquired this business to diversify DXP’s customer base in the municipal, wastewater and downstream industrial pump markets. The purchase price was funded by utilizing available capacity under DXP’s credit facility.
On September 10, 2007, DXP completed the acquisition of Precision Industries, Inc. (“Precision”). DXP acquired this business to expand DXP’s geographic presence and strengthen DXP’s integrated supply offering. The Company paid $106 million in cash for Precision. The purchase price was funded using approximately $24 million of cash on hand and approximately $82 million borrowed from a new credit facility. In addition, DXP paid $0.1 million additional purchase price contingent upon 2008 and 2009 product savings.
On October 19, 2007, DXP completed the acquisition of the business of Indian Fire & Safety. DXP acquired this business to strengthen DXP’s expertise in safety products and services in New Mexico and Texas. DXP paid $6.0 million in cash, $3.0 million in a seller note and $3.0 million in future payments contingent upon future earnings for the business of Indian Fire & Safety. The seller note bears interest at prime minus 1.75%. The cash portion was funded by utilizing available capacity under DXP’s credit facility.
During 2008 the initial purchase price allocation for 2007 acquisitions was adjusted to allocate $1.5 million of purchase price to other intangibles and increase goodwill by $6.5 million. The changes made in 2008 to the estimates for other intangibles associated with 2007 acquisitions relate primarily to increasing the value of customer relationships for Indian Fire & Safety. The changes made to goodwill primarily relate to reducing the value of acquired inventories for Precision and the payment of contingent purchase price for Production Pump.
On January 31, 2008, DXP completed the acquisition of the business of Rocky Mtn. Supply. DXP acquired this business to expand DXP’s presence in the Colorado area. DXP paid $3.9 million in cash and $0.7 million in seller notes. The seller notes bear interest at prime minus 1.75%.
On August 28, 2008, DXP completed the acquisition of PFI, LLC. DXP acquired this business to strengthen DXP’s expertise in the distribution of fasteners. DXP paid $66.4 million in cash for this business. The cash was funded by utilizing a new credit facility.
On December 1, 2008, DXP completed the acquisition of the business of Falcon Pump. DXP acquired this business to strengthen DXP’s pump offering in the Rocky Mountain area. DXP paid $3.1 million in cash, $0.8 million in seller notes and up to $1.0 million in future payments contingent upon future earnings of the acquired business. The seller notes bear interest at ninety day LIBOR plus 0.75%.
40
The allocation of purchase price for all acquisitions completed in 2008 was preliminary in the December 31, 2008 consolidated balance sheets. The following table summarizes the estimated fair values of the assets acquired and liabilities assumed during 2008 as reflected in the December 31, 2008 consolidated financial statements (in thousands):
|
Cash
|
$ 678
|
|
Accounts Receivable
|
10,336
|
|
Inventory
|
27,793
|
|
Property and equipment
|
2,757
|
|
Goodwill and intangibles
|
45,375
|
|
Other assets
|
339
|
|
Assets acquired
|
87,278
|
|
Current liabilities assumed
|
(6,039)
|
|
Non-current liabilities assumed
|
(5,775)
|
|
Net assets acquired
|
$ 75,464
|
During 2009 the initial purchase price allocation for the 2008 acquisitions was adjusted to allocate $2.5 million of purchase price to goodwill. These increases in goodwill primarily related to reducing the value of inventories and fixed assets for the 2008 acquisitions. During the fourth quarter of 2009 the Company recognized an impairment charge of $53.0 million for goodwill and other intangibles associated with the MRO segment.
The pro forma unaudited results of operations for the Company on a consolidated basis for the years ended December 31, 2007 and 2008, assuming the purchases completed in 2007 and 2008 were consummated as of January 1 of each year follows:
|
Years Ended
December 31,
|
|||
|
2007
|
2008
|
||
|
(Unaudited)
|
|||
|
In Thousands,
except for per share data
|
|||
| Net sales | $740,059 | $796,164 | |
| Net income | $ 22,709 | $ 27,828 | |
| Per share data | |||
| Basic earnings | $1.78 | $2.14 | |
| Diluted earnings | $1.64 | $2.01 | |
5. PRECISION INVENTORY IMPAIRMENT
During the fourth quarter of 2009 the Company determined that the value of inventory acquired in connection with the acquisition of Precision on September 10, 2007, was overstated by $13.8 million because the inventory is obsolete, expired, old and/or slow moving. The $13.8 million charge to reduce the value of this inventory is included in cost of sales for 2009.
41
6. INVENTORIES:
The carrying values of inventories are as follows:
|
December 31,
|
||
|
2008
|
2009
|
|
|
(in Thousands)
|
||
|
Finished goods
|
$117,582
|
$ 72,270
|
|
Work in process
|
1,515
|
311
|
|
Inventories
|
$119,097
|
$ 72,581
|
7. PROPERTY AND EQUIPMENT:
Property and equipment consisted of the following:
|
December 31,
|
|||
|
2008
|
2009
|
||
|
(in Thousands)
|
|||
|
Land
|
$ 1,775
|
$ 1,775
|
|
|
Buildings and leasehold improvements
|
7,480
|
7,672
|
|
|
Furniture, fixtures and equipment
|
24,202
|
22,325
|
|
|
|
33,457
|
31,772
|
|
|
Less – Accumulated depreciation and amortization
|
(13,126)
|
(14,817)
|
|
|
$20,331
|
$16,955
|
||
8. LONG-TERM DEBT:
Long-term debt consisted of the following:
|
December 31,
|
|||
|
2008
|
2009
|
||
|
(in Thousands)
|
|||
|
Line of credit
|
$112,000
|
$ 75,000
|
|
|
Term loan, payable in quarterly installments of $2.5 million through August 2013
|
47,500
|
35,500
|
|
|
Unsecured notes payable to individuals at 6.0%, payable in monthly
installments through December 2009
|
862
|
-
|
|
|
Unsecured notes payable to individuals, at variable rates (1.25% to 3.5%
at December 31, 2009) payable in monthly installments through November 2011
|
5,901
|
3,027
|
|
|
Mortgage loans payable to financial institutions, 6.25% collateralized by real estate,
payable in monthly installments through January 2013
|
2,050
|
1,956
|
|
|
Other notes
|
243
|
28
|
|
|
168,556
|
115,511
|
||
|
Less: Current portion
|
(13,965)
|
(12,595)
|
|
|
$154,591
|
$102,916
|
||
On August 28, 2008, DXP entered into a credit agreement with Wells Fargo Bank, National Association, as lead arranger and administrative agent for the lenders (the “Facility). The Facility was amended on March 15, 2010. The Facility consists of a $50 million term loan and a revolving credit facility that provides a $150 million line of credit to the Company. The term loan requires principal payments of $2.5 million per quarter beginning on December 31, 2008. The Facility matures on August 11, 2013. The Facility contains financial covenants defining various financial measures and levels of these measures with which the Company must comply. Covenant compliance is assessed as of each quarter end and certain month ends for the asset test. The asset test is defined under the Facility as the sum of 85% of the Company’s net accounts receivable, 60% of net inventory, and 50% of the net book value of non real estate property and equipment. The Company’s borrowing and letter of credit capacity under the revolving credit portion of the Facility at any given time is $150 million less borrowings under the revolving credit portion of the facility and letters of credit outstanding, subject to the asset test described above.
42
On December 31, 2009, the LIBOR based rate on the revolving credit portion of the Facility was LIBOR plus l.75%, the prime based rate on the revolving credit portion of the Facility was prime plus 0.25%, the commitment fee was 0.25%, the LIBOR based rate for the term loan was LIBOR plus 2.50% and the prime based rate for the term loan was prime plus 1.00%. At December 31, 2009, $110.5 million was borrowed under the Facility at a weighted average interest rate of approximately 3.5% under the LIBOR options, including the effect of the interest rate swap, and nothing was borrowed under the prime options under the Facility. Beginning on March 15, 2010, the March 15, 2010 amendment to the Facility significantly increases the interest rates and commitment fees applicable at various leverage ratios from levels in effect before March 15, 2010. The revolving credit portion of the Facility provides the option of interest at LIBOR plus a margin ranging from 2.25% to 4.00% or prime plus a margin of 1.25% to 3.00%. If the increased rates had been in effect on December 31, 2009, the LIBOR based rate on the revolving credit portion of the Facility would have been LIBOR plus 4.00%. If the increased rates had been in effect on December 31, 2009 the prime based rate on the revolving credit portion of the Facility would have been prime plus 3.00%. Commitment fees of 0.25% to 0.625% per annum are payable on the portion of the Facility capacity not in use for borrowings or letters of credit at any given time. If the increased rates had been in effect on December 31, 2009, the commitment fee would have been 0.625%. The term loan provides the option of interest at LIBOR plus a margin ranging from 2.75% to 4.50% or prime plus a margin of 1.75% to 3.50%. If the increased rates had been in effect on December 31, 2009, the LIBOR based rate for the term loan would have been LIBOR plus 4.50%. If the increased rates had been in effect on December 31, 2009, the prime based rate for the term loan would have been prime plus 3.50%. Borrowings under the Facility are secured by all of the Company’s accounts receivable, inventory, general intangibles and non real estate property and equipment. The Facility was amended to waive the Fixed Charge Coverage Ratio for the period ended December 31, 2009, and to amend the Leverage Ratio for the period ended December 31, 2009, to allow DXP to be in compliance with all financial covenants. DXP would not have been in compliance with the Fixed Charge Coverage Ratio or the Leverage Ratio without the amendment. At December 31, 2009, we had $37.3 million available for borrowing under the most restrictive covenant of the Facility.
The Facility’s principal financial covenants include:
Fixed Charge Coverage Ratio – For the 12 month period ending December 31, 2009, the Fixed Charge Coverage Ratio has been waived. The Facility requires that the Fixed Charge Coverage Ratio for the 12 month period ending on the last day of each quarter from March 31, 2010 through September 30, 2010 be not less than 1.0 to 1.0, stepping up to 1.25 to 1.0 for the quarter ending December 31, 2010 and to 1.50 to 1.0 for the quarter ending March 31, 2011, with “Fixed Charge Coverage Ratio” defined as the ratio of (a) EBITDA for the 12 months ending on such date minus cash taxes, minus Capital Expenditures for such period (excluding acquisitions) to (b) the aggregate of interest expense paid in cash, scheduled principal payments in respect of long-term debt and current portion of capital leases for such 12-month period, determined in each case on a consolidated basis for DXP and its subsidiaries.
Leverage Ratio – The Facility requires that the Company’s Leverage Ratio, determined at the end of each fiscal quarter, not exceed 3.75 to 1.0 as of December 31, 2009, 4.25 to 1.0 as of March 31, 2010, 4.00 to 1.00 as of June 30, 2010, 3.75 to 1.0 as of September 30, 2010, and 3.25 to 1.0 as of the last day of each quarter thereafter. Leverage Ratio is defined as the outstanding Indebtedness divided by EBITDA for the twelve months then ended. Indebtedness is defined under the Facility for financial covenant purposes as: (a) all obligations of DXP for borrowed money including but not limited to senior bank debt, senior notes, and subordinated debt; (b) capital leases; (c) issued and outstanding letters of credit; and (d) contingent obligations for funded indebtedness.
EBITDA as defined under the Facility for financial covenant purposes means, without duplication, for any period the consolidated net income (excluding any extraordinary gains or losses) of DXP plus, to the extent deducted in calculating consolidated net income, depreciation, amortization, other non-cash items and non-recurring items (including, without limitation, impairment charges, or asset write-offs and accruals in respect of closed locations), interest expense, and tax expense for taxes based on income and minus, to the extent added in calculating consolidated net income, any non-cash items and non-recurring items; provided that, if DXP acquires the equity interests or assets of any person during such period under circumstances permitted under the Facility, EBITDA shall be adjusted to give pro forma effect to such acquisition assuming that such transaction had occurred on the first day of such period and provided further that, if DXP divests the equity interests or assets of any person during such period under circumstances permitted under this Facility, EBITDA shall be adjusted to give pro forma effect to such divestiture assuming that such transaction had occurred on the first day of such period. Add-backs allowed pursuant to Article 11, Regulation S-X, of the Securities Act of 1933 will also be included in the calculation of EBITDA.
43
The Facility prohibits the payment of cash dividends on the Company’s common stock.
The maturities of long-term debt for the next five years and thereafter are as follows (in thousands):
|
2010
|
$ 12,595
|
|
2011
|
10,666
|
|
2012
|
10,113
|
|
2013
|
82,137
|
|
2014
|
-
|
|
Thereafter
|
-
|
9. INCOME TAXES:
The provision for income taxes consists of the following:
|
Years Ended December 31,
|
|||||
|
2007
|
2008
|
2009
|
|||
|
(in Thousands)
|
|||||
|
Current -
|
|||||
|
Federal
|
$ 10,939
|
$ 14,605
|
$ 3,849
|
||
|
State
|
1,170
|
1,649
|
759
|
||
|
12,109
|
16,254
|
4,608
|
|||
|
Deferred
|
(559)
|
143
|
(16,678)
|
||
|
$ 11,550
|
$ 16,397
|
$(12,070)
|
|||
The difference between income taxes computed at the federal statutory income tax rate (35%) and the provision for income taxes is as follows:
|
Years Ended December 31,
|
|||||
|
2007
|
2008
|
2009
|
|||
|
(in Thousands)
|
|||||
|
Income taxes computed at federal statutory rate
|
$ 10 ,114
|
$ 14,799
|
$(19,069)
|
||
|
State income taxes, net of federal benefit
|
760
|
1,072
|
492
|
||
|
Nondeductible impairment expense
|
-
|
-
|
6,852
|
||
|
Other
|
676
|
526
|
(345)
|
||
|
$ 11,550
|
$ 16,397
|
$(12,070)
|
|||
44
The net current and noncurrent components of deferred income tax balances are as follows:
|
December 31,
|
|||
|
2008
|
2009
|
||
|
(in Thousands)
|
|||
|
Net current assets
|
$ 3,863
|
$ 7,833
|
|
|
Net non-current assets
|
-
|
3,289
|
|
|
Net non-current liabilities
|
(9,419)
|
-
|
|
|
Net assets (liabilities)
|
$(5,556)
|
$ 11,122
|
|
Deferred tax liabilities and assets were comprised of the following:
|
December 31,
|
|||
|
2008
|
2009
|
||
|
(in Thousands)
|
|||
|
Deferred tax assets:
|
|||
|
Goodwill
|
$ 440
|
$ 5,778
|
|
|
Allowance for doubtful accounts
|
1,340
|
1,052
|
|
|
Inventories
|
1,316
|
6,792
|
|
|
State net operating loss carryforwards
|
16
|
-
|
|
|
Accruals
|
401
|
936
|
|
|
Interest rate swap
|
481
|
16
|
|
|
Other
|
366
|
280
|
|
|
Total deferred tax assets
|
4,360
|
14,854
|
|
|
Less valuation allowance
|
(16)
|
-
|
|
|
Total deferred tax assets, net of valuation allowance
|
4,344
|
14,854
|
|
|
Deferred tax liabilities
|
|||
|
Goodwill
|
(1,356)
|
(1,028)
|
|
|
Intangibles
|
(7,009)
|
(1,106)
|
|
|
Property and equipment
|
(1,409)
|
(1,499)
|
|
|
Other
|
(126)
|
(99)
|
|
|
Net deferred tax asset (liability)
|
$(5,556)
|
$11,122
|
|
10. SHAREHOLDERS' EQUITY:
On September 30, 2008, DXP paid a two for one common stock dividend. DXP’s financial statements have been restated to reflect the effect of this common stock dividend on all periods presented.
Series A and B Preferred Stock
The holders of Series A preferred stock are entitled to one-tenth of a vote per share on all matters presented to a vote of shareholders generally, voting as a class with the holders of common stock, and are not entitled to any dividends or distributions other than in the event of a liquidation of the Company, in which case the holders of the Series A preferred stock are entitled to a $100 liquidation preference per share. Each share of the Series B convertible preferred stock is convertible into 28 shares of common stock and a monthly dividend per share of $.50. The holders of the Series B convertible stock are also entitled to a $100 liquidation preference per share after payment of the distributions to the holders of the Series A preferred stock and to one-tenth of a vote per share on all matters presented to a vote of shareholders generally, voting as a class with the holders of the common stock.
Restricted Stock
Under a restricted stock plan approved by DXP’s shareholders in July 2005 (the “Restricted Stock Plan”), directors, consultants and employees may be awarded shares of DXP’s common stock. The shares of restricted stock granted to employees as of December 31, 2009, vest 20% each year for five years after the date of grant, 33.3% each year for three years
45
after the grant date or 10% each year for ten years after the grant date. The shares of restricted stock granted to non-employee directors of DXP vest 100% one year after the grant date. The Restricted Stock Plan provides for a grant to each non-employee director of DXP, consisting of the number of whole shares calculated by dividing $75,000 by the closing price of the common stock on the July 1 of the award year. The fair value of restricted stock awards is measured based upon the closing prices of DXP’s common stock on the grant dates and is recognized as compensation expense over the vesting period of the awards.
The following table provides certain information regarding the shares authorized, granted and available for future grant under the Restricted Stock Plan at December 31, 2009:
|
Number of shares authorized for grants
|
600,000
|
|
Number of shares granted
|
400,881
|
|
Number of shares forfeited
|
22,764
|
|
Number of shares available for future grants
|
221,883
|
|
Weighted-average grant price of granted shares
|
$ 15.34
|
Changes in non-vested restricted stock for 2007, 2008 and 2009 were as follows:
|
Number
Of Shares
|
Weighted
Average
Grant Price
|
||
|
Non-vested at December 31, 2006
|
87,396
|
$12.33
|
|
|
Granted
|
161,120
|
$18.54
|
|
|
Vested
|
36,064
|
$13.65
|
|
|
Non-vested at December 31, 2007
|
212,452
|
$16.81
|
|
|
Granted
|
57,506
|
$13.21
|
|
|
Vested
|
(54,708)
|
$16.60
|
|
|
Non-vested at December 31, 2008
|
215,250
|
$15.91
|
|
|
Granted
|
94,859
|
$13.96
|
|
|
Forfeited
|
(22,764)
|
$13.15
|
|
|
Vested
|
(63,897)
|
$16.17
|
|
|
Non-vested at December 31, 2009
|
223,448
|
$15.29
|
Compensation expense recognized for restricted stock in the years ended December 31, 2007, 2008 and 2009 was $591,000, $930,000 and $1,555,000, respectively. Related income tax benefits recognized in earnings were approximately $236,000, $372,000 and $622,000 in 2007, 2008 and 2009, respectively. Unrecognized compensation expense under the Restricted Stock Plan was $3,092,000 and $2,601,000, respectively, at December 31, 2008 and 2009. As of December 31, 2009, the weighted average period over which the unrecognized compensation expense is expected to be recognized is 30.9 months.
Stock Options
The DXP Enterprises, Inc. 1999 Employee Stock Option Plan, the DXP Enterprises, Inc. Long-Term Incentive Plan and the DXP Enterprises, Inc. Director Stock Option Plan authorized the grant of options to purchase 1,800,000, 660,000 and 400,000 shares of the Company’s common stock, respectively. In accordance with these stock option plans that were approved by the Company’s shareholders, options were granted to key personnel for the purchase of shares of the Company’s common stock at prices not less than the fair market value of the shares on the dates of grant. Most options could be exercised not earlier than 12 months nor later than 10 years from the date of grant. No future grants will be made under these stock option plans. Activity during 2007, 2008 and 2009 with respect to the stock options follows:
46
|
Shares
|
Options Price
Per Share
|
Weighted
Average
Exercise
Price
|
Aggregate
Intrinsic
Value
|
|
|
Outstanding at December 31, 2006
|
622,362
|
$0.46 - $3.36
|
$0.70
|
$10,464,000
|
|
Exercised
|
(399,910)
|
$0.46 - $1.25
|
$0.50
|
$ 8,511,000
|
|
Outstanding at December 31, 2007
|
222,452
|
$0.50 - $3.36
|
$1.07
|
$ 4,953,000
|
|
Exercised
|
(164,452)
|
$0.50 - $0.68
|
$0.64
|
$ 3,511,000
|
|
Outstanding and exercisable at
December 31, 2008
|
58,000
|
$1.25 - $3.36
|
$2.33
|
$ 712,000
|
|
Exercised
|
(8,000)
|
$1.25
|
$1.25
|
$ 85,000
|
|
Outstanding and exercisable at
December 31, 2009
|
50,000
|
$1.25 - $3.36
|
$2.50
|
$ 529,000
|
The total intrinsic value, or the difference between the exercise price and the market price on the date of exercise, of all options exercised during 2007, 2008 and 2009, was approximately $8.5 million, $3.5 million and $0.1 million, respectively. Cash received from stock options exercised during 2007, 2008 and 2009 was $202,000, $105,000 and $10,000, respectively.
Stock options outstanding and currently exercisable at December 31, 2009 are as follows:
|
Options Outstanding and Exercisable
|
||||||
|
Weighted Average
|
||||||
|
Remaining
|
Weighted
|
|||||
|
Range of
|
Number
|
Contractual Life
|
Average
|
|||
|
Exercise Prices
|
Outstanding
|
(in years)
|
Exercise Price
|
|||
|
$1.25
|
10,000
|
0.3
|
$1.25
|
|||
|
$2.26 to $3.36
|
40,000
|
4.9
|
$2.81
|
|||
The options outstanding at December 31, 2009, expire between April 2010 and May 2015. The weighted average remaining contractual life was 3.2 years, 4.5 years and 4.0 years at December 31, 2007, 2008 and 2009, respectively.
Certain Equity Related Transactions
During 2007, 2008 and 2009, employees and directors of DXP exercised non-qualified stock options. DXP received a tax deduction for the amount of the difference between the exercise price and the fair market value of the shares recognized as income by the individuals exercising the options. The after tax benefit of the tax deduction is accounted for as an increase in paid-in capital.
During June 2007, DXP sold 2,000,000 shares of common stock in a public offering for proceeds of $44.6 million, net of placement agent commissions and expenses.
On October 24, 2007, DXP exchanged a note receivable from Mr. David Little, Chief Executive Officer, with a value of $825,000, including accrued interest, for 40,098 shares of common stock owned by Mr. Little. The shares were valued at the $20.57 per share closing price on October 24, 2007.
Earnings Per Share
Basic earnings per share is computed based on weighted average shares outstanding and excludes dilutive securities. Diluted earnings per share is computed including the impacts of all potentially dilutive securities. The following table sets forth the computation of basic and diluted earnings per share for the years ended December 31, 2007, 2008 and 2009.
47
|
2007
|
2008
|
2009
|
|||
|
(in Thousands, except per share amounts)
|
|||||
|
Basic:
|
|||||
|
Basic weighted average shares outstanding
|
11,811
|
12,945
|
13,117
|
||
|
Net income (loss)
|
$17,347
|
$25,887
|
$(42,412)
|
||
|
Convertible preferred stock dividend
|
(90)
|
(90)
|
(90)
|
||
|
Net income (loss) attributable to common shareholders
|
$17,257
|
$25,797
|
$(42,502)
|
||
|
Per share amount
|
$1.46
|
$1.99
|
$(3.24)
|
||
|
Diluted:
|
|||||
|
Basic weighted average shares outstanding
|
11,811
|
12,945
|
13,117
|
||
|
Net effect of dilutive stock options based on
the treasury stock method
|
209
|
84
|
-
|
||
|
Assumed conversion of convertible preferred stock
|
840
|
840
|
-
|
||
|
Total common and common equivalent shares outstanding
|
12,860
|
13,869
|
13,117
|
||
|
Net income (loss) attributable to common shareholders
|
$17,257
|
$25,797
|
$(42,502)
|
||
|
Convertible preferred stock dividend
|
90
|
90
|
-
|
||
|
Net income (loss) for diluted earnings per share
|
$17,347
|
$25,887
|
$(42,502)
|
||
|
Per share amount
|
$1.35
|
$1.87
|
$(3.24)
|
||
11. COMMITMENTS AND CONTINGENCIES:
The Company leases equipment, automobiles and office facilities under various operating leases. The future minimum rental commitments as of December 31, 2009, for non-cancelable leases are as follows (in thousands):
|
2010
|
$ 9,700
|
|
2011
|
7,991
|
|
2012
|
5,295
|
|
2013
|
3,452
|
|
2014
|
2,437
|
|
2015
|
985
|
|
Thereafter
|
6,475
|
Rental expense for operating leases was $5,637,000, $10,351,000 and $12,201,000 for the years ended December 31, 2007, 2008 and 2009 respectively.
In 2004, DXP and DXP’s vendor of fiberglass reinforced pipe were sued in Louisiana by a major energy company regarding the failure of Bondstrand PSX JFC pipe, a recently introduced type of fiberglass reinforced pipe which had been installed on four energy production platforms. Plaintiff alleges negligence, breach of contract, warranty and that damages exceed $20 million. DXP believes the failures were caused by the failure of the pipe itself and not by work performed by DXP. DXP intends to vigorously defend these claims. DXP’s insurance carrier has agreed, under a reservation of rights to deny coverage, to provide a defense against these claims. The maximum amount of our insurance coverage, if any, is $6 million. Under certain circumstance, our insurance may not cover this claim. DXP currently believes that this claim is without merit.
In 2003, DXP was notified that it had been sued in various state courts in Nueces County, Texas. The suits allege personal injury resulting from products containing asbestos allegedly sold by the Company. The suits do not specify products or the dates on which the Company allegedly sold the products. The plaintiffs’ attorney has agreed to a global settlement of all suits for a nominal amount to be paid by the Company’s insurance carriers. Settlement has been consummated as to more than 85% of the 133 plaintiffs, and the remaining settlements are in process. The cases are all dismissed or dormant pending the remaining settlements.
48
While DXP is unable to predict the outcome of these lawsuits, it believes that the ultimate resolution will not have, either individually or in the aggregate, a material adverse effect on DXP’s consolidated financial position or results of operations.
12. EMPLOYEE BENEFIT PLANS:
The Company offers a 401(k) plan which is eligible to substantially all employees. During 2007, 2008 and part of 2009, the Company elected to match employee contributions at a rate of 50 percent of up to 4 percent of salary deferral. During 2009 the Company stopped matching employee contributions. The Company contributed $847,000, $1,450,000 and $823,000 to the 401(k) plan in the years ended December 31, 2007, 2008 and 2009, respectively.
13. RELATED-PARTY TRANSACTIONS:
Prior to 2002, the Board of Directors of the Company had approved the Company making advances and loans to the CEO. During 2001, the advances and loans to the CEO were consolidated into three notes receivable, each bearing interest at 3.97 percent per annum and due December 30, 2010. Accrued interest was due annually. On March 31, 2004, DXP exchanged two of the notes receivable from the CEO, with a value of $338,591 including accrued interest, for 161,238 shares of DXP’s common stock held by three trusts for the benefit of Mr. Little’s children. The shares were valued at $2.10 per share, the closing market price of the common stock on March 31, 2004. The balance of the remaining note was $799,000 at December 31, 2006. The note was secured by 1,354,534 shares of the Company’s common stock. The note receivable was reflected as a reduction of shareholders’ equity. On October 24, 2007, DXP exchanged the note receivable from Mr. David Little with a value of $825,000, including accrued interest, for 40,098 shares of common stock owned by Mr. Little. The shares were valued at the $20.57 per share closing price on October 24, 2007.
14: FAIR VALUE OF FINANCIAL ASSETS AND LIABILITIES
Effective January 1, 2008, we adopted authoritative guidance for financial assets and liabilities measured on a recurring basis. This authoritative guidance applies to all financial assets and financial liabilities that are being measured and reported on a fair value basis. Fair value, as defined in the authoritative guidance, is the price that would be received to sell an asset or paid to transfer a liability in an orderly transaction between market participants at the measurement date. The authoritative guidance affects the fair value measurement of an interest rate swap to which the Company is a party, which must be classified in one of the following categories:
Level 1 Inputs
These inputs come from quoted prices (unadjusted) in active markets for identical assets or liabilities.
Level 2 Inputs
These inputs are other than quoted prices that are observable for an asset or liability. These inputs include: quoted prices for similar assets or liabilities in active markets; quoted prices for identical or similar assets or liabilities in markets that are not active; inputs other than quoted prices that are observable for the asset or liability; and inputs that are derived principally from or corroborated by observable market data by correlation or other means.
Level 3 Inputs
These are unobservable inputs for the asset or liability which require the Company’s own assumptions.
Financial assets and liabilities are classified based on the lowest level of input that is significant to the fair value measurement. Our assessment of the significance of a particular input to the fair value measurement requires judgment and may affect the valuation of the fair value of assets and liabilities and their placement within the fair value hierarchy levels.
49
The following table summarizes the valuation of our financial instruments (an interest rate swap) by input levels as of December 31, 2009 (in thousands):
|
Fair Value Measurement
|
||||
|
Description (Liabilities)
|
Level 1
|
Level 2
|
Level 3
|
Total
|
|
Current liabilities – Other accrued liabilities
|
$ -
|
$ -
|
$ (42)
|
$ (42)
|
|
Non-current liabilities
|
-
|
-
|
-
|
-
|
|
Total
|
$ -
|
$ -
|
$ (42)
|
$ (42)
|
The following presents the changes in Level 3 liabilities for 2007, 2008, and 2009 (in thousands):
|
2007
|
2008
|
2009
|
|
|
Fair value at January 1,
|
$ -
|
$ -
|
$ ( 1,202)
|
|
Realized and unrealized gains (losses)
included in other comprehensive income
|
-
|
(1,202)
|
1,160
|
|
Fair value at December 31,
|
$ -
|
$ (1,202)
|
$ ( 42)
|
To hedge a portion of our floating rate debt, as of January 10, 2008, DXP entered into an interest rate swap agreement with the lead bank of the Facility. Through January 11, 2010, this interest rate swap effectively fixes the interest rate on $40 million of floating rate LIBOR borrowings under the Facility at one-month LIBOR of 3.68% plus the margin (1.75% at December 31, 2009) in effect under the Facility. Amounts paid or received in connection with the swap are included in interest expense. This swap is designated as a cash flow hedging instrument. Changes in the fair value of the swap are included in other comprehensive income. See Note 15 “Other Comprehensive Income” for gain and (loss), net of income taxes, on the interest rate swap.
The Company measures certain non-financial assets and liabilities, including long-lived assets, at fair value on a non-recurring basis. In 2009, the Company recorded a charge of $53.0 million related to the impairment of goodwill and other intangibles at the DXP and PFI reporting units. The fair market value of these reporting units was determined using the income approach and Level 3 inputs, which required management to make estimates about future cash flows. Management estimated the amount and timing of future cash flows based on its experience and knowledge of the business environment in which the reporting units operate. This impairment charge is included in operating expenses in the accompanying consolidated statements of income. The Company was not required to measure any other significant non-financial assets and liabilities at fair value.
|
|
15: OTHER COMPREHENSIVE INCOME
|
Other Comprehensive income generally represents all changes in shareholders’ equity during the period, except those resulting from investments by, or distributions to, shareholders. The Company has other comprehensive income related to changes in interest rates in connection with an interest rate swap, which is recorded as follows:
|
Years Ended December 31,
(in thousands)
|
|||
|
2007
|
2008
|
2009
|
|
|
Net income (loss)
|
$17,347
|
$25,887
|
$(42,412)
|
|
Gain (loss) from interest rate swap, net of income taxes
|
-
|
(721)
|
695
|
|
Comprehensive income (loss)
|
$17,347
|
$25,166
|
$(41,717)
|
At December 31, 2007, 2008 and 2009, the accumulated derivative loss, net of income tax was zero, $721,000 and $26,000, respectively.
50
16. SEGMENT DATA:
The MRO segment is engaged in providing maintenance, repair and operating products, equipment and integrated services, including engineering expertise and logistics capabilities, to industrial customers. The Company provides a wide range of MRO products in the fluid handling equipment, bearing, power transmission equipment, general mill, safety supply and electrical products categories. The Electrical Contractor segment sells a broad range of electrical products, such as wire conduit, wiring devices, electrical fittings and boxes, signaling devices, heaters, tools, switch gear, lighting, lamps, tape, lugs, wire nuts, batteries, fans and fuses, to electrical contractors. The Company began offering electrical products to electrical contractors following its acquisition of the assets of an electrical supply business in 1998. All business segments operate in the United States.
The high degree of integration of the Company’s operations necessitates the use of a substantial number of allocations and apportionments in the determination of business segment information. Sales are shown net of intersegment eliminations.
Financial information relating to the Company’s segments is as follows:
|
Electrical
|
|||||
|
MRO
|
Contractor
|
Total
|
|||
|
(in Thousands)
|
|||||
|
2007
|
|||||
|
Sales
|
$ 441,250
|
$ 3,297
|
$ 444,547
|
||
|
Operating income
|
31,483
|
409
|
31,892
|
||
|
Income before tax
|
28,597
|
300
|
28,897
|
||
|
Income tax provision
|
11,430
|
120
|
11,550
|
||
|
Identifiable assets
|
286,693
|
1,477
|
288,170
|
||
|
Capital expenditures
|
1,891
|
11
|
1,902
|
||
|
Depreciation and amortization
|
4,958
|
4
|
4,962
|
||
|
Interest expense
|
3,236
|
108
|
3,344
|
||
|
2008
|
|||||
|
Sales
|
$ 733,273
|
$ 3,610
|
$ 736,883
|
||
|
Operating income
|
47,697
|
494
|
48,191
|
||
|
Income before tax
|
41,922
|
362
|
42,284
|
||
|
Income tax provision
|
16,252
|
145
|
16,397
|
||
|
Identifiable assets
|
396,328
|
1,528
|
397,856
|
||
|
Capital expenditures
|
5,134
|
-
|
5,134
|
||
|
Depreciation and amortization
|
10,988
|
4
|
10,992
|
||
|
Interest expense
|
5,999
|
131
|
6,130
|
||
|
2009
|
|||||
|
Sales
|
$ 580,497
|
$ 2,729
|
$ 583,226
|
||
|
Impairment of goodwill and
other intangibles
|
52,951
|
-
|
52,951
|
||
|
Operating income (loss)
|
(49,598)
|
266
|
(49,332)
|
||
|
Income (loss) before tax
|
(54,629)
|
147
|
(54,482)
|
||
|
Income tax provision
|
(12,129)
|
59
|
(12,070)
|
||
|
Identifiable assets
|
269,607
|
1,320
|
270,927
|
||
|
Capital expenditures
|
1,498
|
95
|
1,593
|
||
|
Depreciation and amortization
|
11,473
|
3
|
11,476
|
||
|
Interest expense
|
5,126
|
119
|
5,245
|
||
On March 5, 2010, the Company sold all of the assets of the Electrical Contractor segment for approximately $1.4 million
51
17. QUARTERLY FINANCIAL INFORMATION (Unaudited)
Summarized quarterly financial information for the years ended December 31, 2007, 2008 and 2009 is as follows:
|
First
|
Second
|
Third
|
Fourth
|
|
|
Quarter
|
Quarter
|
Quarter
|
Quarter
|
|
|
2007
|
||||
|
Sales
|
$ 83.6
|
$ 85.3
|
$ 106.8
|
$ 168.8
|
|
Gross profit
|
24.9
|
24.5
|
29.9
|
46.4
|
|
Net income
|
3.7
|
3.4
|
4.5
|
5.7
|
|
Earnings per share – basic (Restated) – Note 2
|
0.36
|
0.30
|
0.35
|
0.44
|
|
Earnings per share – diluted (Restated) – Note 2
|
0.32
|
0.28
|
0.33
|
0.41
|
|
2008
|
||||
|
Sales
|
$ 168.5
|
$ 187.8
|
$ 186.9
|
$ 193.6
|
|
Gross profit
|
45.9
|
51.9
|
52.3
|
56.9
|
|
Net income
|
5.4
|
6.4
|
7.0
|
7.0
|
|
Earnings per share – basic (Restated) – Note 2
|
0.42
|
0.49
|
0.54
|
0.54
|
|
Earnings per share – diluted (Restated) – Note 2
|
0.39
|
0.46
|
0.51
|
0.51
|
|
2009
|
||||
|
Sales
|
$ 157.6
|
$ 144.4
|
$ 143.4
|
$ 137.8
|
|
Gross profit
|
46.1
|
41.4
|
40.8
|
23.1
|
|
Goodwill and other intangibles impairment
|
-
|
-
|
-
|
(53.0)
|
|
Net income (loss)
|
3.2
|
2.2
|
2.7
|
(50.5)
|
|
Earnings (loss) per share - basic
|
0.24
|
0.16
|
0.20
|
(3.84)
|
|
Earnings (loss) per share - diluted
|
0.23
|
0.15
|
0.19
|
(3.84)
|
The sum of the individual quarterly earnings per share amounts may not agree with year-to-date earnings per share as each quarter’s computation is based on the weighted average number of shares outstanding during the quarter, the weighted average stock price during the quarter and the dilutive effects of the stock options and restricted stock in each quarter.
ITEM 9. Changes in and Disagreements with Accountants on Accounting and Financial Disclosure
None.
ITEM 9A. Controls and Procedures
Disclosure Controls and Procedures
DXP carried out an evaluation, under the supervision and with the participation of its management, including the Chief Executive Officer and the Chief Financial Officer, of the effectiveness as of December 31, 2009, of the design and operation of DXP’s disclosure controls and procedures pursuant to Exchange Act Rules 13a-15 and 15d-15. Disclosure controls and procedures are the controls and other procedures of DXP that are designed to ensure that information required to be disclosed by DXP in the reports that it files or submits under the Securities Exchange Act of 1934, as amended, is recorded, processed, summarized and reported, within the time periods specified in the rules and forms of the U.S. Securities and Exchange Commission (the “Commission”). Disclosure controls and procedures include, without limitation, controls and procedures designed to ensure that information required to be disclosed by DXP in the reports that it files or submits under the Securities Exchange Act of 1934, as amended, is accumulated and communicated to the issuer’s management, including its principal executive and principal financial officers, or persons performing similar functions, as appropriate to allow timely decisions regarding required disclosure. Based upon that evaluation, the Chief Executive Officer and the Chief Financial Officer concluded that DXP’s disclosure controls and procedures were effective as of the end of the period covered by this Report.
52
Internal Control Over Financial Reporting
(A) Management’s Annual Report on Internal Control Over Financial Reporting
|
|
Management’s report on the Company’s internal control over financial reporting is included on page 23 of this Report under the heading Management’s Annual Report on Internal Control Over Financial Reporting.
|
(B) Changes in Internal Control over Financial Reporting
During the fourth quarter of 2009, the control structures between DXP and a significant business acquired in September of 2007 were standardized, including the migration of a large portion of the acquired business systems on to the legacy DXP computer systems. This standardization of control structures, along with improved maintenance of internal control documentation and the testing of general computer controls before the end of 2009 are expected to prevent a recurrence of the material weakness identified at December 31, 2008.
ITEM 9B. Other Information
None.
53
PART III
ITEM 10. Directors, Executive Officers and Corporate Governance
The information required by this item will be included in our Definitive Proxy statement for the 2010 Annual Meeting of Shareholders that we will file with the SEC within 120 days of the end of the fiscal year to which this Report relates (the “Proxy Statement”) and is hereby incorporated by reference thereto.
ITEM 11. Executive Compensation
The information required by this item will be included in the Proxy Statement and is hereby incorporated by reference.
ITEM 12. Security Ownership of Certain Beneficial Owners and Management
The information required by this item will be included in the Proxy Statement and is hereby incorporated by reference.
ITEM 13. Certain Relationships and Related Transactions, and Director Independence
The information required by this item will be included in the Proxy Statement and is hereby incorporated by reference.
ITEM 14. Principal Auditor Fees and Services.
The information required by this item will be included in the Proxy Statement and is hereby incorporated by reference.
54
PART IV
ITEM 15. Exhibits, Financial Statement Schedules.
(a) Documents included in this report:
1. Financial Statements (included under Item 8):
|
DXP Enterprises, Inc. and Subsidiaries:
|
Page
|
|
Reports of Independent Registered Public Accounting Firm
|
26
|
|
Consolidated Financial Statements
|
|
|
Management Report on Internal Controls
|
28
|
|
Consolidated Balance Sheets
|
29
|
|
Consolidated Statements of Operations
|
30
|
|
Consolidated Statements of Shareholders' Equity
|
31
|
|
Consolidated Statements of Cash Flows
|
32
|
|
Notes to Consolidated Financial Statements
|
33
|
|
2.
|
Financial Statement Schedules:
|
|
|
Schedule II – Valuation and Qualifying Accounts
|
All other schedules have been omitted since the required information is not significant or is included in the Consolidated Financial Statements or notes thereto or is not applicable.
3. Exhibits:
The following exhibits are filed herewith or are incorporated by reference to exhibits previously filed with the Commission.
Exhibit
No. Description
|
3.1
|
Restated Articles of Incorporation, as amended (incorporated by reference to Exhibit 4.1 to the Company’s Registration Statement on Form S-8 (Reg. No. 333-61953), filed with the Commission on August 20, 1998).
|
|
3.2
|
Bylaws (incorporated by reference to Exhibit 3.2 to the Company's Registration Statement on Form S-4 (Reg. No. 333-10021), filed with the Commission on August 12, 1996).
|
|
4.1
|
Form of Common Stock certificate (incorporated by reference to Exhibit 4.3 to the Company's Registration Statement on Form S-8 (Reg. No. 333-61953), filed with the Commission on August 20, 1998).
|
|
4.2
|
See Exhibit 3.1 for provisions of the Company's Restated Articles of Incorporation, as amended, defining the rights of security holders.
|
|
4.3
|
See Exhibit 3.2 for provisions of the Company's Bylaws defining the rights of security holders.
|
|
+10.1
|
DXP Enterprises, Inc. 1999 Employee Stock Option Plan (incorporated by reference to Exhibit 10.1 to the Company's Quarterly Report on Form 10-Q for the quarterly period ended June 30, 1999, filed with the Commission on August 16, 1999).
|
55
+10.2 DXP Enterprises, Inc. 1999 Non-Employee Director Stock Option Plan (incorporated by reference to Exhibit 10.2 to the Company's Quarterly Report on Form 10-Q for the quarterly period ended June 30, 1999), filed with the Commission on August 16, 1999.
|
+10.3
|
DXP Enterprises, Inc. Long Term Incentive Plan, as amended (incorporated by reference to Exhibit 4.4 to the Company's Registration Statement on Form S-8 (Reg. No. 333-61953), filed with the Commission on August 20, 1998).
|
|
+10.4
|
Amendment Number One to DXP Enterprises, Inc. Non-Employee Director Stock Option Plan (incorporated by reference to Exhibit 10.8 to the Company’s Annual Report on Form 10-K for the fiscal year ended December 31, 2003, filed with the Commission on March 11, 2004).
|
|
+10.5
|
Employment Agreement dated effective as of January 1, 2004, between DXP Enterprises, Inc. and David R. Little (incorporated by reference to Exhibit 10.10 to the Company’s Annual Report on Form 10-K for the fiscal year ended December 31, 2003, filed with the Commission on March 11, 2004).
|
|
+10.6
|
Employment Agreement dated effective as of June 1, 2004, between DXP Enterprises, Inc. and Mac McConnell (incorporated by reference to Exhibit 10.1 to the Company’s Quarterly Report on Form 10-Q for the quarterly period ended March 31, 2004, filed with the Commission on May 6, 2004).
|
|
+10.7
|
Amendment Number One to DXP Enterprises, Inc. 1999 Employee Stock Option Plan (incorporated by reference to Exhibit 10.10 to the Company’s Annual Report on Form 10-K for the fiscal year ended December 31, 2004, filed with the Commission on March 30, 2005).
|
|
+10.8
|
Summary Description of Director Fees (incorporated by reference to Exhibit 10.11 to the Company’s Annual Report on Form 10-K for the fiscal year ended December 31, 2004, filed with the Commission on March 30, 2005).
|
|
+10.9
|
Summary Description of Executive Officer Cash Bonus Plan (incorporated by reference to Exhibit 10.12 to the Company’s Annual Report on Form 10-K for the fiscal year ended December 31, 2004, filed with the Commission on March 30, 2005).
|
|
+10.10
|
Amendment Number Two to DXP Enterprises, Inc. Non-Employee Director Stock Option Plan (incorporated by reference to Exhibit 10.13 to the Company’s Annual Report on Form 10-K for the fiscal year ended December 31, 2004, filed with the Commission on March 30, 2005).
|
|
+10.11
|
DXP Enterprises, Inc. 2005 Restricted Stock Plan (incorporated by reference to Exhibit 10.14 to the Company’s Annual Report on Form 10-K for the fiscal year ended December 31, 2005, (filed with the Commission on March 10, 2006).
|
|
+10.12
|
Amendment Number One to Employment Agreement dated effective as of January 1, 2004, between DXP Enterprises, Inc. and David R. Little (incorporated by reference to Exhibit 10.1 to the Company’s Current Report on Form 8-K, filed with the Commission on July 26, 2006).
|
|
+10.13
|
Amendment No. One to DXP Enterprises, Inc. 2005 Restricted Stock Plan (incorporated by reference to Exhibit 10.2 to the Company’s Current Report on Form 8-K, filed with the Commission on July 26, 2006).
|
|
10.14
|
Stock Purchase Agreement among DXP Enterprises, Inc., as Purchaser, Precision Industries, Inc., and the selling stockholders dated August 19, 2007, (incorporated by reference to Exhibit 10.1 to the Company’s Current Report on Form 8-K, filed with the Commission on August 21, 2007).
|
|
10.15
|
Asset Purchase Agreement among DXP Enterprises, Inc., as Purchaser, Lone Wolf Rental, LLC, Indian Fire and Safety, Inc., and the other parties named therein dated October 18, 2007, (incorporated by reference to Exhibit 10.1 to the Company’s Current Report on Form 8-K, filed with the Commission on October 22, 2007).
|
56
|
10.16
|
Stock Purchase Agreement among DXP Enterprises, Inc., as Purchaser, Vertex Corporate Holdings, Inc., the stockholders of Vertex Corporate Holdings, Inc. and Watermill-Vertex Enterprises, LLC, dated August 28, 2008, (incorporated by reference to Exhibit 10.1 to the Company’s Current Report on Form 8-K, filed with the Commission on August 29, 2008).
|
|
10.17
|
Credit Agreement among DXP Enterprises, Inc., as Borrower, and Bank of America, N.A., as Syndication Agent, and Wells Fargo Bank, National Association, as Lead Arranger and Administrative Agent for the Lenders and the Lenders party thereto dated August 28, 2008 (incorporated by reference to Exhibit 10.2 to the Company’s Current Report on Form 8-K, filed with the Commission on August 29, 2008 and the Company’s Current Report on Form 8-K/A, filed with the Commission on September 23, 2009).
|
|
10.18
|
Amendment Number Two to Employment Agreement dated effective January 1, 2004 between DXP Enterprises, Inc. and David R. Little (incorporated by reference to Exhibit 10.1 to the Company’s Current Report on Form 8-K filed with the Commission on May 22, 2009).
|
|
10.19
|
Exhibits and schedules to the Credit Agreement among DXP Enterprises, Inc., as Borrower, and Bank of America, N.A., as Syndication Agent, and Wells Fargo Bank, National Association, as Lead Arranger and Administrative Agent for the Lenders and the Lenders party thereto, dated August 28, 2008 (incorporated by reference to Amendment Number Two to the Company’s Current Report on Form 8-K/A, filed with the Commission on September 23, 2009).
|
|
10.20
|
Amendment Number One to Credit Agreement among DXP Enterprises, Inc., as Borrower, and Bank of America, N.A., as Syndication Agent, and Wells Fargo Bank, National Association, as Lead Arranger and Administrative Agent for the Lenders and the Lenders party thereto, dated August 28, 2008 (incorporated by reference to Exhibit 10.2 to the Company’s Current Report on Form 8-K, filed with the Commission on March 16, 2010).
|
|
18.1
|
Letter of Independent Registered Public Accounting Firm Regarding Change in Accounting Principle (incorporated by reference to Exhibit 18.1 to the Company’s Quarterly Report on Form 10-Q for the quarterly period ended March 31, 2008, filed with the Commission on May 12, 2008.)
|
|
*21.1
|
Subsidiaries of the Company.
|
|
*23.1
|
Consent of Hein & Associates LLP, Independent Registered Public Accounting Firm.
|
|
*31.1
|
Certification of Principal Executive Officer pursuant to Rule 13a-14(a) and Rule 15d-14(a) of the Exchange Act, as amended.
|
|
*31.2
|
Certification of Principal Financial Officer pursuant to Rule 13a-14(a) and Rule 15d-14(a) of the Exchange Act, as amended.
|
|
*32.1
|
Certification of Chief Executive Officer pursuant to 18 U.S.C. 1350, as adopted pursuant to Section 906 of the Sarbanes-Oxley Act of 2002, as amended.
|
|
*32.2
|
Certification of Chief Financial Officer pursuant to 18 U.S.C. 1350, as adopted pursuant to Section 906 of the Sarbanes-Oxley Act of 2002, as amended.
|
Exhibits designated by the symbol * are filed with this Annual Report on Form 10-K. All exhibits not so designated are incorporated by reference to a prior filing with the Commission as indicated.
+ Indicates a management contract or compensation plan or arrangement.
The Company undertakes to furnish to any shareholder so requesting a copy of any of the exhibits to this Report on upon payment to the Company of the reasonable costs incurred by the Company in furnishing any such exhibit.
57
INDEPENDENT REGISTERED PUBLIC ACCOUNTING FIRM’S
REPORT ON FINANCIAL STATEMENT SCHEDULE
To the Board of Directors and Shareholders
DXP Enterprises, Inc. and Subsidiaries
Houston, Texas
We have audited, in accordance with auditing standards of the Public Company Accounting Oversight Board (United States), the consolidated financial statements of DXP Enterprises, Inc. and Subsidiaries included in this Form 10-K and have issued our report thereon dated March 23, 2010. Our audits were made for the purpose of forming an opinion on the basic financial statements taken as a whole. The financial statement schedule listed in Item 15 herein (Schedule II-Valuation and Qualifying Accounts) is the responsibility of the Company’s management and is presented for the purpose of complying with the Securities and Exchange Commission’s rules and is not part of the basic financial statements. The financial statement schedule has been subjected to the auditing procedures applied in the audits of the basic financial statements and, in our opinion, is fairly stated in all material respects with the financial data required to be set forth therein in relation to the basic financial statements taken as a whole.
Hein & Associates, LLP
Houston, Texas
March 23, 2010
|
SCHEDULE II – VALUATION AND QUALIFYING ACCOUNTS
DXP ENTERPRISES, INC.
Years Ended December 31, 2009, 2008 and 2007
(in thousands)
|
|||||||||
|
Description
|
Balance at
Beginning
of Year
|
Charged to
Cost and
Expenses
|
Charged to
Other
Accounts
|
Deductions
|
Balance
At End
of Year
|
||||
|
Year ended December 31, 2009
Deducted from assets accounts
Allowance for doubtful accounts
|
$ 3,494
|
$ 675
|
$ -
|
$1,163(1)
|
$3,006
|
||||
|
Valuation allowance for deferred
tax assets
|
$ 16
|
$ -
|
$ -
|
$ (16) (2)
|
-
|
||||
|
Year ended December 31, 2008
Deducted from assets accounts
Allowance for doubtful accounts
|
$ 2,131
|
$ 1,424
|
$ 157(3)
|
$ 218(1)
|
$ 3,494
|
||||
|
Valuation allowance for deferred
tax assets
|
$ 33
|
$ -
|
$ -
|
$ 17(2)
|
16
|
||||
|
Year ended December 31, 2007
Deducted from assets accounts
Allowance for doubtful accounts
|
$ 1,482
|
$ 552
|
$ 253(3)
|
$ 156(1)
|
$ 2,131
|
||||
|
Valuation allowance for deferred
tax assets
|
$ 41
|
$ -
|
$ -
|
$ 8(2)
|
33
|
||||
|
(1) Uncollectible accounts written off, net of recoveries.
|
|||||||||
|
(2) Reduction results from expiration or use of state net operating loss carryforwards.
|
|||||||||
|
(3) Reserve for receivables of acquired businesses.
|
|||||||||
58
SIGNATURES
Pursuant to the requirements of Section 13 or 15(d) of the Securities Exchange Act of 1934, the registrant has duly caused this report to be signed on its behalf by the undersigned, thereunto duly authorized.
DXP ENTERPRISES, INC. (Registrant)
By: /s/DAVID R. LITTLE
David R. Little
Chairman of the Board,
President and Chief Executive Officer
Dated: March 23, 2010
Pursuant to the requirements of the Securities Exchange Act of 1934, this report has been signed below by the following persons on behalf of the registrant and in the capacities and on the dates indicated:
|
NAME
|
TITLE
|
DATE
|
||
|
/s/David R. Little
|
Chairman of the Board, President
|
March 23, 2010
|
||
|
David R. Little
|
Chief Executive Officer and Director
|
|||
|
(Principal Executive Officer)
|
||||
|
/s/Mac McConnell
|
Senior Vice President/Finance and
|
March 23, 2010
|
||
|
Mac McConnell
|
Chief Financial Officer
|
|||
|
(Principal Financial and Accounting Officer)
|
||||
|
/s/Charles R. Strader
|
Senior Vice President of Strategic Initiatives
|
March 23, 2010
|
||
|
Charles R. Strader
|
||||
|
/s/Cletus Davis
|
Director
|
March 23, 2010
|
||
|
Cletus Davis
|
||||
|
/s/Timothy P. Halter
|
Director
|
March 23, 2010
|
||
|
Timothy P. Halter
|
||||
|
/s/Kenneth H. Miller
|
Director
|
March 23, 2010
|
||
|
Kenneth H. Miller
|
59