Attached files
Table of Contents
UNITED STATES
SECURITIES AND EXCHANGE COMMISSION
Washington, DC 20549
FORM 10-K
| x | ANNUAL REPORT PURSUANT TO SECTION 13 OR 15(d) OF THE SECURITIES EXCHANGE ACT OF 1934 |
For the fiscal year ended December 31, 2009
| ¨ | TRANSITION REPORT PURSUANT TO SECTIONS 13 OR 15(d) OF THE SECURITIES EXCHANGE ACT OF 1934 |
For the transition period from to
COMMISSION FILE NUMBER 000-24180
Quality Distribution, Inc.
(Exact name of registrant as specified in its charter)
| Florida | 59-3239073 | |
| (State or other jurisdiction of incorporation or organization) |
(IRS Employer Identification No.) |
4041 Park Oaks Boulevard, Suite 200
Tampa, Florida 33610
(Address of principal executive offices) (zip code)
Registrant’s telephone number, including area code:
813-630-5826
SECURITIES REGISTERED PURSUANT TO SECTION 12(b) OF THE ACT:
| Title of each class | Name of each exchange on which registered | |
| Common Stock (no par value per share) | NASDAQ Global Market |
SECURITIES REGISTERED PURSUANT TO SECTION 12(g) OF THE ACT:
| Title of each class | Name of each exchange on which registered |
None
Indicate by check mark if the registrant is a well-known seasoned issuer, as defined in Rule 405 of the Securities Act. Yes ¨ No x
Indicate by check mark if the registrant is not required to file reports pursuant to Section 13 or Section 15(d) of the Exchange Act. Yes ¨ No x
Indicate by check mark whether the Registrant (1) has filed all reports required to be filed by Section 13 or 15(d) of the Securities Exchange Act of 1934 during the preceding 12 months (or for such shorter period that the Registrant was required to file such reports), and (2) has been subject to such filing requirements for the past 90 days. Yes x No ¨
Indicate by check mark whether the registrant has submitted electronically and posted on its corporate Web site, if any, every Interactive Data File required to be submitted and posted pursuant to Rule 405 of Regulation S-T (§ 232.405 of this chapter) during the preceding 12 months (or for such shorter period that the registrant was required to submit and post such files). Yes ¨ No ¨
Indicate by check mark if disclosure of delinquent filers pursuant to Item 405 of Regulation S-K is not contained herein, and will not be contained, to the best of Registrant’s knowledge, in definitive proxy or information statements incorporated by reference in Part III of this Form 10-K or any amendment to this Form 10-K. x
Indicate by check mark whether the registrant is a large accelerated filer, an accelerated filer, a non-accelerated filer or a smaller reporting company. See the definitions of “large accelerated filer”, “accelerated filer” and “smaller reporting company” in Rule 12b-2 of the Exchange Act. (Check one):
Large accelerated filer ¨ Accelerated filer ¨ Non-accelerated filer ¨ (Do not check if a smaller reporting company) Smaller reporting company x
Indicate by check mark whether the registrant is a shell company (as defined in Exchange Act Rule 12b-2). Yes ¨ No x
Aggregate market value of voting stock held by non-affiliates as of June 30, 2009 was $16.9 million (based on the closing sale price of $2.00 per share).
As of March 8, 2010, the registrant had 20,146,138 outstanding shares of Common Stock, no par value, outstanding.
Table of Contents
Documents Incorporated by Reference: Portions of the Proxy Statement for the registrant’s 2010 Annual Meeting of Shareholders are incorporated by reference into Part III of this Form 10-K.
| 1 | ||||||
| 1 | ||||||
| 3 | ||||||
| ITEM 1. | 3 | |||||
| 13 | ||||||
| ITEM 1A. | 13 | |||||
| ITEM 1B. | 21 | |||||
| ITEM 2. | 21 | |||||
| ITEM 3. | 22 | |||||
| ITEM 4. | 22 | |||||
| 23 | ||||||
| ITEM 5. | 23 | |||||
| ITEM 6. | 25 | |||||
| ITEM 7. | MANAGEMENT’S DISCUSSION AND ANALYSIS OF FINANCIAL CONDITION AND RESULTS OF OPERATIONS |
27 | ||||
| ITEM 7A. | 50 | |||||
| ITEM 8. | 51 | |||||
| ITEM 9. | CHANGES IN AND DISAGREEMENTS WITH ACCOUNTANTS ON ACCOUNTING AND FINANCIAL DISCLOSURE |
51 | ||||
| ITEM 9A. | 51 | |||||
| ITEM 9B. | 52 | |||||
| 53 | ||||||
| ITEM 10. | 53 | |||||
| ITEM 11. | 53 | |||||
| ITEM 12. | SECURITY OWNERSHIP OF CERTAIN BENEFICIAL OWNERS AND MANAGEMENT AND RELATED SHAREHOLDER MATTERS |
53 | ||||
| ITEM 13. | 53 | |||||
| ITEM 14. | 53 | |||||
| 54 | ||||||
| ITEM 15. | 54 | |||||
| 55 | ||||||
| REPORT OF INDEPENDENT REGISTERED CERTIFIED PUBLIC ACCOUNTING FIRM |
F-2 | |||||
| F-3 | ||||||
| F-4 | ||||||
| CONSOLIDATED STATEMENTS OF SHAREHOLDERS’ DEFICIT AND COMPREHENSIVE INCOME (LOSS) |
F-5 | |||||
| F-7 | ||||||
| F-8 | ||||||
Table of Contents
In this Annual Report on Form 10-K, unless the context otherwise indicates, (i) the terms the “Company,” “our Company”, “Quality Distribution,” “QDI,” “we,” “us” and “our” refer to Quality Distribution, Inc. and its consolidated subsidiaries and their predecessors, (ii) the terms “Quality Distribution, LLC” and “QD LLC” refer to our wholly owned subsidiary, Quality Distribution, LLC, a Delaware limited liability company, and its consolidated subsidiaries and their predecessors, (iii) the term “QD Capital” refers to our wholly owned subsidiary, QD Capital Corporation, a Delaware corporation, (iv) the term “QCI” refers to our wholly owned subsidiary, Quality Carriers, Inc., an Illinois Corporation, (v) the term “Boasso” refers to our wholly owned subsidiary, Boasso America Corporation, a Louisiana corporation, (vi) the term “QSI” refers to our wholly owned subsidiary, Quala Systems, Inc., a Delaware corporation and (vii) the term “Apollo” refers to our majority shareholder, Apollo Investment Fund III, L.P. and its affiliates.
FORWARD-LOOKING STATEMENTS AND CERTAIN CONSIDERATIONS
This report, along with other documents that are publicly disseminated by us, contains or might contain forward-looking statements within the meaning of the Securities Exchange Act of 1934, as amended. All statements included in this report and in any subsequent filings made by us with the SEC other than statements of historical fact, that address activities, events or developments that we or our management expect, believe or anticipate will or may occur in the future are forward-looking statements. These statements represent our reasonable judgment on the future based on various factors and using numerous assumptions and are subject to known and unknown risks, uncertainties and other factors that could cause our actual results and financial position to differ materially. We claim the protection of the safe harbor for forward-looking statements provided in the Private Securities Litigation Reform Act of 1995, Section 27A of the Securities Act and Section 21E of the Exchange Act. Examples of forward-looking statements include: (i) projections of revenue, earnings, capital structure and other financial items, (ii) statements of our plans and objectives, (iii) statements of expected future economic performance, and (iv) assumptions underlying statements regarding us or our business. Forward-looking statements can be identified by, among other things, the use of forward-looking language, such as “believes,” “expects,” “estimates,” “may,” “will,” “should,” “could,” “seeks,” “plans,” “intends,” “anticipates” or “scheduled to” or the negatives of those terms, or other variations of those terms or comparable language, or by discussions of strategy or other intentions.
Forward-looking statements are subject to known and unknown risks, uncertainties and other factors that could cause the actual results to differ materially from those contemplated by the statements. The forward-looking information is based on various factors and was derived using numerous assumptions. Important factors that could cause our actual results to be materially different from the forward-looking statements include the following risks and other factors discussed under the Item -1A “Risk Factors” in this Annual Report on Form 10-K. These factors include:
| • | the effect of local and national economic, credit and capital market conditions on the economy in general, and on the industries in which we operate in particular, |
| • | turmoil in credit and capital markets, |
| • | access to available and reasonable financing on a timely basis, |
| • | availability and price of diesel fuel, |
| • | adverse weather conditions, |
| • | competitive rate fluctuations, |
| • | our substantial leverage and restrictions contained in our debt arrangements and interest rate fluctuations in our floating rate indebtedness, |
1
Table of Contents
| • | the cyclical nature of the transportation industry due to various economic factors such as excess capacity in the industry, the availability of qualified drivers, changes in fuel and insurance prices, interest rate fluctuations, and downturns in customers’ business cycles and shipping requirements, |
| • | potential disruption at U.S. ports of entry, |
| • | our dependence on affiliates and independent owner-operators and our ability to attract and retain drivers, |
| • | changes in the future, or our inability to comply with, governmental regulations and legislative changes affecting the transportation industry, |
| • | our material exposure to both historical and changing environmental regulations and the increasing costs relating to environmental compliance including those relating to the control of greenhouse gas emissions, such as market-based (cap-and-trade) mechanisms, |
| • | our liability as a self-insurer to the extent of our deductibles, as well as our ability or inability to reduce our claims exposure through insurance due to changing conditions and pricing in the insurance marketplace, |
| • | the cost of complying with existing and future anti-terrorism security measures enacted by federal, state and municipal authorities, |
| • | the potential loss of our ability to use net operating losses to offset future income, |
| • | increased unionization, which could increase our operating costs or constrain operating flexibility, |
| • | changes in senior management, |
| • | our ability to successfully manage workforce restructurings, |
| • | our ability to effectively manage terminal operations that are converted from company-operated to affiliate, |
| • | our ability to successfully integrate acquired businesses, |
| • | potential future impairment charges, |
| • | changes in planned or actual capital expenditures due to operating needs, changes in regulation, covenants in our debt arrangements and other expenses, including interest expenses, and |
| • | interests of Apollo, our largest shareholder, which may conflict with your interests. |
In addition, there may be other factors that could cause our actual results and financial condition to be materially different from the results referenced in the forward-looking statements. For example, the cost estimates and expected cost savings for our recent reduction in workforce were determined based upon the operating information and upon certain assumptions that we believe to be reasonable. The estimates are subject to a number of assumptions, which depend upon the actions of persons other than us or other factors beyond our control.
All forward-looking statements contained in this Annual Report on Form 10-K are qualified in their entirety by this cautionary statement. Forward-looking statements speak only as of the date they are made, and we do not intend to update or otherwise revise the forward-looking statements to reflect events or circumstances after the date of this Annual Report on Form 10-K or to reflect the occurrence of unanticipated events.
2
Table of Contents
Overview
We operate the largest chemical bulk tank truck network in North America through our wholly owned subsidiary QCI and are a leading provider of ISO (International Organization for Standardization) container and depot services through our wholly owned subsidiary Boasso.
The bulk tank truck market in North America includes all products shipped by bulk tank truck carriers and consists primarily of liquid and dry bulk chemicals (including plastics) and bulk dry and liquid food-grade products. We primarily transport a broad range of chemical products and provide our customers with logistics and other value-added services. We are a core carrier for many of the major companies engaged in chemical processing including BASF, Dow, DuPont, ExxonMobil, Georgia-Pacific, Honeywell, Procter & Gamble, Rohm & Haas, Sunoco and Unilever, and we provide services to most of the top 100 chemical producers with United States operations.
Our transportation revenue is a function of the volume of shipments by the bulk chemical industry, prices, the average number of miles driven per load, our market share and the allocation of shipments between tank truck transportation and other modes of transportation such as rail. The volume of shipments of chemical products is, in turn, affected by many other industries and end use markets, including consumer and industrial products, paints and coatings, paper and packaging, agriculture and food products, and tends to vary with changing economic conditions.
Due to the nature of our customers’ business, our revenues generally decline during winter months, namely the first and fourth fiscal quarters and over holidays. Highway transportation can be adversely affected depending upon the severity of the weather in various sections of the country during the winter months. Our operating expenses also are somewhat higher in the winter months, due primarily to decreased fuel efficiency, increased utility costs and increased maintenance costs of equipment in colder months.
Our wholly owned subsidiary, Boasso, is the leading North American provider of ISO tank container transportation and depot services with eight terminals located in the eastern half of the United States. In addition to intermodal ISO tank transportation services, Boasso provides tank cleaning, heating, testing, maintenance and storage services to customers. Boasso provides local and over-the-road trucking primarily within the proximity of the port cities where its depots are located and also sells equipment that its customers use for portable alternative storage or office space.
Demand for ISO tank containers is impacted by the volume of imports and exports of chemicals through United States ports. Boasso’s revenues are accordingly impacted by this import/export volume in particular the number of shipments through ports at which Boasso has terminals and the volume of rail shipments from ports at which Boasso has terminals as well as by Boasso’s market share. Economic conditions and differences among the laws and currencies of nations may impact the volume of shipments as well.
Financial Reporting Segments
We have two reportable business segments for financial reporting purposes that are distinguished primarily on the basis of services offered:
| • | Trucking, which consists of truckload transportation of bulk chemicals, and |
| • | Container Services, specifically ISO tank container transportation and depot services. |
Additional financial information about each of these segments is presented in Item 7. “Management’s Discussion and Analysis of Financial Condition and Results of Operations” of this Annual Report on Form 10-K. Further information about each of our segments, and our business as a whole, is presented below.
3
Table of Contents
Our History
QDI was formed in 1994 as a holding company known as MTL, Inc. In 1998, we acquired Chemical Leaman Corporation (“CLC”), thereby combining two of the then-leading bulk service providers, Montgomery Tank Lines and Chemical Leaman Tank Lines. In 1999, QDI changed its name from “MTL, Inc.” to “Quality Distribution, Inc.” On November 13, 2003, QDI consummated the initial public offering of its common stock. Boasso became our wholly owned subsidiary in December 2007, when we acquired all of its outstanding capital stock from a third party.
QDI is owned principally by Apollo. As of December 31, 2009, Apollo owned or controlled approximately 52.2% of QDI’s outstanding common stock, and approximately 47.1% of QDI’s common stock on a fully diluted basis.
Our Industry
Trucking
We estimate, based on industry sources, that the highly fragmented North American for-hire segment of the bulk transport market generated revenues of approximately $6.5 billion in 2008. We specifically operate in the for-hire chemical and food grade bulk transport market (estimated at $4.0 billion in 2008) where we believe, based on published reports, we have achieved leading market share (estimated at 15% in 2009), based on revenues. Based on revenues, we operate the largest for-hire chemical bulk tank truck network comprising terminals, tractors and trailers in North America. We believe being a larger carrier facilitates customer service and lane density, and provides a better cost structure. As such, we are well-positioned to expand our business by increasing our market share.
The chemical bulk tank truck industry growth is generally dependent on (i) volume growth in the industrial chemical industry, (ii) the rate at which chemical companies outsource their transportation needs, (iii) the overall capacity of the rail system, and, in particular (iv) the extent to which chemical companies make use of the rail system for their bulk chemical transportation needs. As competitive pressures force chemical companies to reduce costs and focus on their core businesses, we believe that chemical companies will consolidate their shipping relationships and outsource a greater portion of their logistics needs to third-party tank truck carriers. We believe that large, national full-service carriers will benefit from any such consolidation of relationships and outsourcing of logistics needs and will be able to grow faster than the overall bulk tank truck industry. As a result of our leading market position, breadth of customer services, flexible business model and decentralized operating structure, we believe we are well positioned to benefit from industry outsourcing trends.
We expect the complexities and operational challenges faced by chemical manufacturers to continue to grow as the chemical industry evolves. These complexities and challenges are driven by a variety of industry trends including customer demand for constantly lower prices, global import/export of bulk liquid products and the need to get product into the pipeline. In order to meet these challenges, we believe chemical producers will sell more through distribution as they look for ways to further reduce their costs by streamlining the supply chain. We believe supply chain efficiencies will be one of the necessary fundamentals for chemical manufacturers’ competitiveness.
We believe the most significant factors relevant to our future business growth are the ability to (i) obtain additional business from existing customers, (ii) add new customers, (iii) improve the utilization of our trailer fleet and (iv) add and retain qualified drivers. While many of our customers source some of their logistics needs with rail, we expect our customers to continue to outsource a greater proportion of their logistics needs to full service tank truck carriers. As a result of our leading market position, strong customer relationships and flexible business model, we believe we are well-positioned to benefit from customers seeking consolidation of their shipping relationships and those opting to outsource a greater portion of their logistics needs to third-party tank truck carriers.
4
Table of Contents
Container Services
We estimate that the North American ISO tank container transportation and depot services market generated revenues of approximately $250.0 million in 2008. The ISO tank container business generally provides services that facilitate the global movement of liquid and dry bulk chemicals, pharmaceuticals and food grade products.
The proliferation of global import/export of bulk liquid chemicals has driven the movement of basic manufacturing out of the United States and has resulted in an increase in chemical plant infrastructure to service these off-shore industries. Driven by this globalization, the ISO tank container market is a growing sector of the overall liquid bulk chemical transportation sector. If the chemical industry continues the recent trend towards the globalization of petro-chemical manufacturing capacity, greater quantities of chemicals will be imported into the United States. Further, chemical manufacturers have sought to efficiently transport their products by utilizing ISO tank containers. The resulting demand for distributors that can offer a broad range of services within the supply chain will drive future industry growth in this sector. We believe that Boasso will benefit from these trends because of its market leadership.
Competitive Barriers
Our industry is characterized by high barriers to entry such as (i) the time and cost required to develop the operational infrastructure necessary to handle sensitive chemical cargo, (ii) the financial and managerial resources required to recruit and train drivers, (iii) substantial industry regulatory requirements, and (iv) the significant capital investments required to build a fleet of equipment and establish a network of terminals. In addition, the industry continues to experience consolidation due to economic and competitive pressures, increasing operating costs for driver recruitment and insurance, and increasing capital investments for equipment and technology. As the cost and complexity of operating a bulk tank truck business and ISO tank container and depot services increase, we believe that large, well-established carriers like us will gain market share.
Customers
Our revenue base consists of customers located throughout North America, including many Fortune 500 companies and other major companies engaged in chemical processing, such as Dow Chemical Company, Procter & Gamble, Ashland Chemical Company, PPG Industries, and Rohm & Haas. In 2009, 2008 and 2007, our 10 largest customers accounted for 32.4%, 30.9% and 34.1%, respectively, of total revenues for our trucking segment.
Competition
The tank truck business is competitive and fragmented. We compete primarily with other tank truck carriers and dedicated private fleets in various states within the United States and Canada. Competition from for-hire carriers is comprised of fewer than ten large carriers, many with other businesses that do not compete with ours, and more than 200 smaller, primarily regional carriers. With respect to certain aspects of our business, we also compete with intermodal transportation and railroads. Intermodal transportation has increased in recent years.
Competition for the bulk tank truck services is based primarily on rates and service. We believe that we enjoy significant competitive advantages over other tank truck carriers because of our variable cost structure, overall fleet size and national terminal network.
Boasso competes primarily with other national, regional and local tank truck carriers and dedicated private fleets as well as local and regional dry container transporters. Competition in the ISO container services business depends on which competitors have facilities that are proximate to the ports serviced by Boasso. Among competitors for a port location, competition is based primarily on rates and service.
Competition from non-trucking modes of transportation and from intermodal transportation would likely increase if state or federal fuel taxes were to increase without a corresponding increase in taxes imposed upon other modes of transportation.
5
Table of Contents
Our Competitive Strengths
Following are our strengths that we believe will allow us to successfully exploit the market opportunities described above.
Largest Tank Truck Network in a Fragmented Industry
We provide our customers with access to the largest tractor and tank trailer network in the North American bulk tank truck industry. In addition, our nationwide network consisting on December 31, 2009 of 99 trucking terminals and eight ISO depot services terminals covers all major North American chemical markets and enables us to serve customers with international, national and regional shipping requirements. Our size allows us, our affiliates and our independent owner-operators to benefit from economies of scale in the purchasing of supplies and services, including fuel, tires and insurance coverage. Our greater network density allows us to create efficiencies by increasing utilization through reduced “empty miles” with more opportunities to generate backhaul loads. Our size also enables us to invest in new technologies that increase our operating efficiency, improve customer service and lower our costs.
Asset Light Business Model
Our extensive use of affiliates and independent owner-operators results in a highly variable cost structure and significantly reduces our capital investment, thereby allowing us to increase our asset utilization. This model also contributes to the stability of our cash flow and margins and increases our return on capital. Affiliates are responsible for capital investments and most of the operating expenses related to the business they service. Typically, affiliates purchase or lease tractors for their business directly from the manufacturers and lease trailers from us. Independent owner-operators are independent contractors who supply one or more tractors and drivers for our own or our affiliates’ exclusive use. As with affiliates, independent owner-operators are responsible for most of the operating expenses related to the business they transport (excluding costs related to the acquisition and maintenance of trailers). With our extensive use of independent owner-operators and affiliates, we can reduce the high capital costs of purchasing and maintaining tractors.
Broad Menu of Complementary Services
Our ability to provide value-added services that enhance our core service differentiates us from smaller competitors and enables us to gain market share, particularly with large customers that seek to use a limited number of core carriers. Our ability to offer an additional complement of services to our customers corroborates our position as a leading national full-service provider in the industry. These services include storage and warehousing, vendor managed inventory, load tendering, liquid and dry bulk rail to truck transfer facilities, border crossing operations and managing private fleets.
Enhanced Productivity, Efficiency and Customer Service through Installed Technology
We are proactive in our utilization of technology aimed at improving our customer service and operating efficiency. In contrast to many of our smaller competitors, we have equipped our drivers with various mobile communications systems which enable us to monitor our tractors and communicate with our drivers in the field and enable customers to track the location and monitor the progress of their cargo through the Internet. We also have satellite tracking devices on our trailers to enable us to increase trailer utilization. Our website allows our customers to view bills and generate customized service reports. We have a centralized order entry, dispatch and billing program system, which enhances our control over our equipment and drivers. This technology is increasingly important when transporting sensitive cargo in today’s heightened security environment.
6
Table of Contents
Our Operations Strategy
We have simplified our business model to focus on our core operations. During 2008 and 2009 we implemented substantial cost reduction initiatives and transitioned company-owned terminals and operations to our affiliates. Additionally, on October 10, 2009, we sold substantially all of the operating assets of our QSI tank wash subsidiary. As a result, we have generally exited the tank wash market and operate our chemical bulk tank truck network primarily through our affiliates.
We believe that our focus on core operations and our cost reductions will enable us to operate our business more efficiently and build a solid infrastructure to position us for growth once the economic environment improves. Our focus on our affiliate model, use of independent owner-operators, safety and training and asset utilization as described below has gained momentum and has positioned us to capitalize on the market opportunities that lie ahead.
Affiliate Trucking Operations
We continue to focus on a less capital intensive business model based on affiliates and independent owner-operators. In 2009, we transitioned the majority of company-operated terminals to affiliates. These actions resulted in a larger portion of our revenue being generated by affiliates in 2009 as compared to 2008, and we expect an even larger portion of our revenue to be generated by affiliates in 2010. We believe these actions will reduce certain fixed costs and provide a more variable cost structure.
Each affiliate is an independent company that has an exclusive contract with us to operate under the identity of QCI and receive a percentage of gross revenues collected on each shipment they transport. Affiliates are responsible for their own operating expenses and they own or lease their terminals. We reimburse affiliates for certain expenses billed back to customers, including fuel surcharges, tolls and scaling charges. Affiliates employ drivers and manage independent owner-operators, pay all tractor operating expenses, lease trailers from us and provide a national network capacity. We provide cash flow, back office and sales support, technology and regulatory oversight. Affiliate contracts generally contain restrictive covenants prohibiting them from competing directly with QCI for a period of at least one year following termination of the contract.
Independent Owner-Operators
We and our affiliates extensively utilize independent owner-operators. Independent owner-operators are independent contractors who, through a contract with QCI, supply one or more tractors and drivers for QCI or affiliate use. Independent owner-operators’ contracts generally are terminable by either party upon short notice.
In exchange for the services rendered, independent owner-operators are normally paid a fixed percentage of the revenues collected on each load hauled or on a per mile rate. The percentage of revenues paid to independent owner-operators by us is lower than the percentage paid to affiliates. Independent owner-operators pay all tractor operating expenses such as fuel, physical damage insurance, tractor maintenance, fuel taxes and highway use taxes. However, we reimburse independent owner-operators for certain expenses passed through to our customers, such as tolls and scaling charges. We operate programs intended to benefit independent owner-operators by reducing their operating expenses such as tractors, fuel, tires, occupational accident insurance and physical damage insurance.
We compete with other motor carriers for the services of our drivers and independent owner-operators. Our overall size and our reputation for good relations have enabled us to attract qualified professional drivers and independent owner-operators.
7
Table of Contents
Safety and Training
We have made safety a main focus of our organization. We implemented several comprehensive process improvement programs to further identify and implement opportunities for sustainable safety improvement. Tangible results of this focus have already manifested themselves in a substantial decrease in preventable events and claim frequency. We also redesigned our driver training program and updated our online training system to make safety awareness training portable and available to the drivers, dispatchers and terminal managers via the internet.
Trailer Utilization
At December 31, 2009, we owned more than 4,900 trailers, the majority of which we lease to affiliates. Trailer leasing is a key component of our business model. Affiliates are contractually precluded from leasing or purchasing trailers from sources other than us. We are also focused on increased utilization of our idle trailers. We have a relationship with a third-party trailer leasing company to identify opportunities to place our trailers in service and better realize their revenue potential.
Employees and Independent Owner-Operators
At December 31, 2009, we utilized 2,591 drivers. Of this total, 1,499 were independent owner-operators, 885 were affiliate drivers, and 207 were company employee drivers.
Company Personnel
At December 31, 2009, we employed 810 personnel, approximately 51.6% fewer than at December 31, 2008.
We provide our employees with health, dental, vision, life, and other insurance coverage subject to certain premium sharing and deductible provisions.
Union Labor
At December 31, 2009, we had 147 employees and our affiliates had 8 employees who were members of the International Brotherhood of Teamsters.
Tractors and Trailers
As of December 31, 2009, we managed a fleet of approximately 2,800 tractors and 6,400 tank trailers. The majority of our tanks are single compartment, chemical-hauling trailers. The balance of the fleet is made up of multi-compartment trailers, dry bulk trailers, and special use equipment. The chemical transport units typically have a capacity between 5,000 and 7,800 gallons and are designed to meet DOT specifications for transporting hazardous materials. Each trailer is designed for a useful service life of 15 to 20 years, though this can be extended through upgrades and modifications. Each tractor is designed for a useful life of five to seven years, though this can be extended through upgrades and modifications. We acquire new tractors for an initial utilization period of seven years.
We utilize third party repair shops for inspecting and repairing our fleets. Our systems enable us to determine when inspections and scheduled maintenance needs to be performed.
8
Table of Contents
The following tables show the approximate number and age of trailers and tractors we managed as of December 31, 2009:
| TRACTORS (1) |
LESS THAN 3 YEARS |
3~5 YEARS |
6~10 YEARS |
GREATER THAN 10 YEARS |
TOTAL | |||||
| Company |
251 | 177 | 258 | 18 | 704 | |||||
| Affiliate |
237 | 314 | 228 | 83 | 862 | |||||
| Independent Owner-Operator |
98 | 175 | 488 | 512 | 1,273 | |||||
| Total |
586 | 666 | 974 | 613 | 2,839 | |||||
| TRAILERS (1) |
LESS THAN 3 YEARS |
3~5 YEARS |
6~10 YEARS |
11~15 YEARS |
16~20 YEARS |
GREATER THAN 20 YEARS |
TOTAL | |||||||
| Company |
356 | 206 | 253 | 1,709 | 718 | 1,681 | 4,923 | |||||||
| Affiliate |
81 | 121 | 123 | 347 | 164 | 388 | 1,224 | |||||||
| Independent Owner-Operator |
— | — | — | 3 | — | 2 | 5 | |||||||
| Shipper-Owned |
17 | 124 | 32 | 20 | 13 | 52 | 258 | |||||||
| Total |
454 | 451 | 408 | 2,079 | 895 | 2,123 | 6,410 | |||||||
| (1) | Age based upon original date of manufacture; tractor/trailer may be substantially refurbished or re-manufactured. |
Risk Management, Insurance and Safety
The primary insurable risks associated with our business are motor vehicle related bodily injury and property damage, workers’ compensation and cargo loss and damage (which includes spills and chemical releases). We maintain insurance against these risks and are subject to liability as a self-insurer to the extent of the deductible under each policy. We currently maintain liability insurance for bodily injury and property damage with an aggregate limit on the coverage in the amount of $40.0 million, with a $2.0 million per incident deductible.
QDI currently maintains a $1.0 million per incident deductible for workers’ compensation insurance coverage. We are insured over our deductible up to the statutory requirement by state and we are self-insured for damage or loss to the equipment we own or lease and for cargo losses.
We employ personnel to perform compliance checks and conduct safety tests throughout our operations. A number of safety programs are conducted that are designed to promote compliance with rules and regulations and to reduce accidents and cargo claims. These programs include training programs, driver recognition programs, safety awards, driver safety meetings, distribution of safety bulletins to drivers and participation in national safety associations.
ENVIRONMENTAL MATTERS
It is our policy to comply with all applicable environmental, safety, and health laws. We also are committed to the principles of Responsible Care®, an international chemical industry initiative to enhance the industry’s responsible management of chemicals. We have obtained independent certification that our management system is in place and functions according to professional standards and we continue to evaluate and continuously improve our Responsible Care® Management System performance.
Our activities involve the handling, transportation and storage of bulk chemicals, both liquid and dry, many of which are classified as hazardous materials or hazardous substances. Our operations involve the generation, storage, discharge and disposal of wastes that may contain hazardous substances, the inventory and use of
9
Table of Contents
cleaning materials that may contain hazardous substances and the control and discharge of storm-water from industrial sites. In addition, we may store diesel fuel, materials containing oil and other hazardous products at our terminals. As such, we and others who operate in our industry are subject to environmental, health and safety laws and regulation by U.S. federal, state and local agencies as well as foreign governmental authorities. Environmental laws and regulations are complex, and address emissions to the air, discharge onto land or water, and the generation, handling, storage, transportation, treatment and disposal of waste materials. These laws change frequently and generally require us to obtain and maintain various licenses and permits. Environmental laws have tended to become more stringent over time, and most provide for substantial fines and potential criminal sanctions for violations. Some of these laws and regulations are subject to varying and conflicting interpretations. Under certain of these laws, we could also be subject to allegations of liability for the activities of our affiliates or independent owner-operators.
We are potentially subject to strict, joint and several liability for investigating and rectifying the consequences of spills and other releases of such substances. From time to time, we have incurred remedial costs and regulatory penalties with respect to chemical or wastewater spills and releases at our facilities and on the road, and, notwithstanding the existence of our environmental management program, we cannot assure that such obligations will not be incurred in the future, predict with certainty the extent of future liabilities and costs under environmental, health, and safety laws, or assure that such liabilities will not result in a material adverse effect on our business, financial condition, operating results or cash flow. We have established reserves for remediation expenses at known contamination sites when it is probable that such efforts will be required of us and the related expenses can be reasonably estimated. Additional information about our reserves, our estimates underlying them and the known contamination sites may be found at Note 19 to our consolidated financial statements contained herein, “Commitments and Contingencies—Environmental Matters.”
We have also incurred in the past, and expect to incur in the future, capital and other expenditures related to environmental compliance for current and planned operations. Such expenditures are generally included in our overall capital and operating budgets and are not accounted for separately. However, we do not anticipate that compliance with existing environmental laws in conducting current and planned operations will have a material adverse effect on our capital expenditures, earnings or competitive position.
Reserves
Our policy is to accrue remediation expenses when it is probable that such efforts will be required and the related expenses can be reasonably estimated. Estimates of costs for future environmental compliance and remediation may be adversely affected by such factors as changes in environmental laws and regulatory requirements, the availability and application of technology, the identification of currently unknown potential remediation sites and the allocation of costs among the potentially responsible parties under the applicable statutes. The recorded liabilities are adjusted periodically as remediation efforts progress or as additional technical or legal information becomes available. As of December 31, 2009 and December 31, 2008, we had reserves in the amount of $11.6 million and $10.9 million, respectively, for all environmental matters of which the more significant are discussed below.
The balances presented include both long term and current environmental reserves. We expect these environmental obligations to be paid over the next five years. Additions to the environmental liability reserves are classified in our consolidated statements of operations within the “Selling and administrative” category.
Property Contamination Liabilities
We have been named as (or are alleged to be) a potentially responsible party under the Comprehensive Environmental Response, Compensation and Liability Act of 1980, as amended (“CERCLA”) and similar state laws at approximately 24 sites. At 17 of the 24 sites, we are one of many parties with alleged liability and are negotiating with Federal, State or private parties on the scope of our obligations, if any. At 2 of the 17 sites, we
10
Table of Contents
will be participating in the initial studies to determine site remediation objectives. Since our overall liability cannot be estimated at this time, we have set reserves for only the initial remedial investigation phase. At 3 of the 17 sites, we have explicitly denied any liability and since there has been no subsequent demand for payment we have not established a reserve for these matters. We have estimated future expenditures for these off-site multi-party environmental matters to be in the range of $2.5 million to $3.8 million.
At 7 of the 24 sites, we are the only responsible party and are in the process of conducting investigations and/or remediation projects. Four of these projects relate to operations conducted by CLC and its subsidiaries prior to our acquisition of CLC in 1998. These four sites are: (1) Bridgeport, New Jersey; (2) William Dick, Pennsylvania; (3) Tonawanda, New York; and (4) Scary Creek, West Virginia. The remaining three sites relate to investigations and potential remediation that were triggered by the New Jersey Industrial Site Remediation Act (“ISRA”), which requires such investigations and remediation following the sale of industrial facilities. Each of these sites is discussed in more detail below. We have estimated future expenditures for these seven properties to be in the range of $9.1 million to $16.7 million.
Bridgeport, New Jersey
QDI is required under the terms of two federal consent decrees to perform remediation at this operating truck terminal and tank wash site. CLC entered into consent orders with the U.S. Environmental Protection Agency (“USEPA”) in May 1991 for the treatment of groundwater and in October 1998 for the removal of contamination in the wetlands. In addition, we were required to assess the remediation of contaminated soils.
The groundwater treatment remedy negotiated with USEPA calls for a treatment facility for in-place treatment of groundwater contamination and a local discharge. Treatment facility construction was completed in early 2007. After various start-up issues, we expect the treatment facility to begin operating in 2010. Wetlands contamination has been remediated with localized restoration expected to be completed in 2010. In regard to contaminated soils, we believe that USEPA is now in the process of finalizing a feasibility study for the limited areas that show contamination and warrant additional investigation or work. We have estimated expenditures to be in the range of $5.5 million to $8.5 million.
William Dick, Pennsylvania
CLC entered into a consent order with the Pennsylvania DEP and USEPA in October 1995 obligating it to provide a replacement water supply to area residents, treat contaminated groundwater, and perform remediation of contaminated soils at this former wastewater disposal site. The replacement water supply is complete. We completed construction of a treatment facility with local discharge for groundwater treatment in the fourth quarter of 2007. Plant start-up issues are on-going. The agencies have approved a contaminated soils remedy, which requires both thermal treatment of contaminated soils and treatment of residuals via soil vapor extraction. The remedy expanded to include off-site shipment of contaminated soils. Soil treatment was completed in September 2007. Site sampling has been conducted and the results indicate that the soil clean-up objectives have not been fully achieved. Negotiations are on-going with USEPA over further remedial actions that may be needed at the site. We have estimated expenditures to be in the range of $1.1 million to $3.4 million.
Other Properties
Scary Creek, West Virginia: CLC received a clean up notice from the State environmental authority in August 1994. The State and we have agreed that remediation can be conducted under the State’s voluntary clean-up program (instead of the state superfund enforcement program). We are currently completing the originally planned remedial investigation and the additional site investigation work.
Tonawanda, New York: CLC entered into a consent order with the New York Department of Environmental Conservation on June 22, 1999 obligating it to perform soil and groundwater remediation at this former truck terminal and tank wash site. We have completed a remedial investigation and a feasibility study. The State issued a record of decision in May 2006. The site is currently in remedial design phase.
11
Table of Contents
ISRA New Jersey Facilities: We are obliged to conduct investigations and remediation at three current or former New Jersey tank wash and terminal sites pursuant to the state’s Industrial Sites Remediation Act, which requires such remediation following the sale of facilities after 1983. These sites are in the process of remedial investigation with projections set in contemplation of limited soil remediation expense for contaminated areas.
We have estimated future expenditures for Scary Creek, Tonawanda and ISRA to be in the range of $2.5 million to $4.8 million.
OTHER LEGAL MATTERS
We are from time to time involved in routine litigation incidental to the conduct of our business. We believe that no such routine litigation currently pending against us, if adversely determined, would have a material adverse effect on our consolidated financial position, results of operations or cash flows.
MOTOR CARRIER REGULATION
As a motor carrier, we are subject to regulation by the Federal Motor Carrier Safety Administration (“FMCSA”), and the Surface Transportation Board, or STB, both of which are units of the Department of Transportation (“DOT”). The FMCSA enforces comprehensive trucking safety regulations and performs certain functions relating to such matters as motor carrier registration, cargo and liability insurance, extension of credit to motor carrier customers, and leasing of equipment by motor carriers from independent owner-operators. The STB has authority to resolve certain types of pricing disputes and authorize certain types of intercarrier agreements. There are additional regulations specifically relating to the tank truck industry, including testing and specifications of equipment and product handling requirements. We may transport most types of freight to and from any point in the United States over any route selected by us. The trucking industry is subject to possible regulatory and legislative changes, including changes intended to address climate change, that may affect the economics of the industry by requiring changes in operating practices, restricting and taxing emissions or by changing the demand for common or contract carrier services or the cost of providing truckload services. Some of these possible changes may include increasingly stringent environmental regulations, increasing control over the transportation of hazardous materials, changes in the hours-of-service regulations which govern the amount of time a driver may drive in any specific period of time, mandatory onboard black box recorder devices or limits on vehicle weight and size.
Interstate motor carrier operations are subject to safety requirements prescribed by the DOT. To a large degree, intrastate motor carrier operations are subject to safety and hazardous material transportation regulations that mirror federal regulations. Such matters as weight and dimension of equipment are also subject to federal and state regulations. DOT regulations mandate drug and alcohol testing of drivers and other safety personnel. Beginning July 1, 2010, the FMSCA, for the first time, will rate individual driver safety performance inclusive of all driver violations over 3-year time periods under new regulations known as the Comprehensive Safety Analysis 2010. Prior to these regulations, only carriers were rated by the DOT and the rating only included out of service violations and ticketed offenses associated with out of service violations.
Title VI of The Federal Aviation Administration Authorization Act of 1994, generally prohibits individual states, political subdivisions thereof and combinations of states from regulating price, entry, routes or service levels of most motor carriers. However, the states retained the right to continue to require certification of carriers, based upon two primary fitness criteria—safety and insurance—and retained certain other limited regulatory rights. Prior to January 1, 1995, we held intra-state authority in several states. Since that date, we have either been “grandfathered” or have obtained the necessary certification to continue to operate in those states. In states in which we were not previously authorized to operate intra-state, we have obtained certificates or permits allowing us to operate.
We are subject to compliance with cargo security and transportation regulations issued by the Transportation Security Administration and by the Department of Homeland Security, including regulation by
12
Table of Contents
the new Bureau of Customs and Border Protection. We believe that we will be able to comply with Bureau of Customs and Border Protection rules, requiring pre-notification of cross-border shipments, with no material effect on our operations. We are also subject to the motor carrier laws of Canada and Mexico.
From time to time, various legislative proposals are introduced including proposals to increase federal, state, or local taxes, including taxes on motor fuels, which may increase our costs and adversely impact the recruitment of drivers. We cannot predict whether, or in what form, any increase in such taxes applicable to us will be enacted.
ADDITIONAL INFORMATION AVAILABLE ON COMPANY WEBSITE
Our most recent Annual Report on Form 10-K, Quarterly Reports on Form 10-Q, Current Reports on Form 8-K and amendments to those reports may be viewed or downloaded electronically or as paper copies from our website: http://www.qualitydistribution.com as soon as reasonably practicable after we electronically file such material with, or furnish it to, the SEC. Our recent press releases are also available to be viewed or downloaded electronically at http://www.qualitydistribution.com. We will also provide electronic or paper copies of our SEC filings free of charge on request. We regularly post or otherwise make available information on the Investor Relations section of our website that may be important to investors. Any information on or linked from our website is not incorporated by reference into this Annual Report on Form 10-K.
Risks Related to Our Business
Our business is subject to general and industry specific economic factors that are largely out of our control and could affect our operations and profitability.
Our business is dependent on various economic factors over which we have little control, that include:
| • | the availability of qualified drivers, |
| • | access to the credit and capital markets, |
| • | changes in regulations concerning shipment and storage of material we transport and depot, |
| • | increases in fuel prices, taxes and tolls, |
| • | interest rate fluctuations, |
| • | excess capacity in the tank trucking industry, |
| • | changes in license and regulatory fees, |
| • | potential disruptions at U.S. ports of entry, |
| • | downturns in customers’ business cycles, and |
| • | reductions in customers’ shipping requirements. |
As a result, we may experience periods of overcapacity, declining prices, lower profit margins and less availability of cash in the future. We have a large number of customers in the chemical-processing and consumer-goods industries. If these customers experience fluctuations in their business activity due to an economic downturn, work stoppages or other industry conditions, the volume of freight transported by us or container services provided by us on behalf of those customers may decrease. The trucking industry has experienced a slowdown due to lower demand resulting from slowing economic conditions through 2008 and 2009. We expect these weak conditions to continue in 2010.
13
Table of Contents
Our debt agreements contain restrictions that could limit our flexibility in operating our business.
Our asset-based loan facility (“the ABL Facility”) and the indentures governing our 10% Senior Notes due 2013 (the “2013 Senior Notes”) and our 11.75% Senior Subordinated PIK Notes due 2013 (the “2013 PIK Notes”) contain covenants that limit or prohibit our ability, among other things, to:
| • | incur or guarantee additional indebtedness or issue certain preferred shares; |
| • | redeem, repurchase, make payments on or retire subordinated indebtedness or make other restricted payments; |
| • | make certain loans, acquisitions, capital expenditures or investments; |
| • | sell certain assets, including stock of our subsidiaries; |
| • | enter into sale and leaseback transactions; |
| • | create or incur liens; |
| • | consolidate, merge, sell, transfer or otherwise dispose of all or substantially all of our assets; and |
| • | enter into certain transactions with our affiliates. |
These covenants may prohibit or impair us from taking actions that we believe are best for our business. Further, under the ABL Facility we may be required to satisfy and maintain specified financial ratios. Our ability to meet those financial ratios can be affected by events beyond our control, and we may not meet those ratios. In addition, covenants in our debt agreements limit our use of proceeds from our ordinary operations and from extraordinary transactions. These limits may require us to apply proceeds in a certain manner or prohibit us from utilizing the proceeds in our operations or from prepaying or retiring indebtedness that we desire.
A failure to comply with any of the covenants contained in the ABL Facility or our other indebtedness could result in an event of default, which, if not cured or waived, could have a material adverse affect on our business, financial condition and results of operations. In the event of any default, the lenders of the defaulted indebtedness:
| • | will not be required to lend any additional amounts to us under the ABL Facility; |
| • | could elect to declare all borrowings outstanding, together with accrued and unpaid interest and fees, to be due immediately and terminate all commitments to extend further credit; or |
| • | require us to apply all of our available cash to repay these borrowings. |
Such actions by the lenders could cause cross defaults under our other indebtedness. If we were unable to repay amounts under the ABL Facility, the lenders under the ABL Facility could proceed against the collateral granted to them to secure that indebtedness. If any of our indebtedness is accelerated, there can be no assurance that our assets would be sufficient to repay such indebtedness in full.
We have substantial indebtedness and may not be able to make required payments on our indebtedness.
At December 31, 2009, we had consolidated long-term indebtedness and capital lease obligations, including current maturities, of $321.3 million, most of which matures during the next five years. We must make regular payments under the ABL Facility and our capital leases, and semi-annual and quarterly interest payments under our outstanding notes. In addition, subject to certain exceptions, we are required to make regular redemptions of our 2013 Senior Notes.
Our 2013 Senior Notes and 2013 PIK Notes issued in the quarter ended December 31, 2009 carry higher rates of interest and higher cash rates of interest than the notes for which they were exchanged. In addition, interest on amounts borrowed under our ABL Facility is variable and will increase as market rates of interest
14
Table of Contents
increase. Our higher interest expense may reduce our future profitability. Our future higher interest expense and future redemption obligations could have other important consequences with respect to our ability to manage our business successfully, including the following:
| • | it may make it more difficult for us to satisfy our obligations for our indebtedness, and any failure to comply with these obligations could result in an event of default; |
| • | using a portion of our cash flow to make interest or redemption payments on our indebtedness will reduce the availability of our cash flow to fund working capital, capital expenditures and other business activities; |
| • | it increases our vulnerability to adverse economic and industry conditions; |
| • | it limits our flexibility in planning for, or reacting to, changes in our business and the industry in which we operate; |
| • | it may make us more vulnerable to further downturns in our business or the economy; and |
| • | it limits our ability to exploit business opportunities. |
Our 9% Senior Subordinated Notes due 2010 (the “9% Notes”) mature November 15, 2010. The ABL Facility matures June 18, 2013. However, the maturity date of the ABL Facility may be accelerated if we default on our obligations under the ABL Facility. If the maturity of the ABL Facility is accelerated, we do not believe that we will have sufficient cash on hand to repay the ABL Facility or, unless conditions in the credit markets improve significantly, that we will be able to refinance the ABL Facility on acceptable terms, or at all. The failure to repay or refinance the ABL Facility at final maturity will have a material adverse effect on our business and financial condition, would cause substantial liquidity problems and may result in the bankruptcy of us and/or our subsidiaries. Any actual or potential bankruptcy or liquidity crisis may materially harm our relationships with our customers, suppliers and affiliates.
Our ability to satisfy our interest, redemption and principal payment obligations will depend upon, among other things:
| • | our future financial and operating performance, which will be affected by many factors beyond our control; and |
| • | our future ability to borrow under the ABL Facility, the availability of which depends on, among other things, our complying with the covenants in the ABL Facility. |
We may not generate sufficient cash flow from operations, and we may not be able to draw under the ABL Facility, in an amount sufficient to fund our liquidity needs. If our cash flows and capital resources are insufficient to service our indebtedness or fund our operations, we may be forced to reduce or delay capital expenditures, sell assets, seek additional capital or restructure or refinance our indebtedness. Our ability to restructure or refinance our debt will depend on the condition of the capital markets and our financial condition at such time. Any refinancing of our debt could be at higher interest rates and may require us to comply with more onerous covenants, which could further restrict our business operations. If we are not be able to refinance any of our indebtedness, sell assets or raise capital on commercially reasonable terms or at all or for sufficient proceeds, we could default on our obligations and impair our liquidity. Our inability to generate sufficient cash flow to satisfy our debt obligations or to refinance our obligations on commercially reasonable terms would have a material adverse effect on our business, financial condition, results of operations or cash flows.
Our reliance upon affiliates and independent owner-operators could adversely affect our operations and profitability.
We rely heavily upon participants in our affiliate program and independent owner-operators to perform the services for which we contract with our customers. A reduction in the number of independent owner-operators,
15
Table of Contents
whether due to capital requirements related to the expense of obtaining, operating and maintaining equipment or for other reasons, could have a negative effect on our operations and profitability. Similarly the loss of one or more affiliates could adversely affect our profitability.
Contracts with affiliates are for various terms and contracts with independent owner-operators may be terminated by either party on short notice. Although affiliates and independent owner-operators are responsible for paying for their own equipment and other operating costs, significant increases in these costs could cause them to seek a higher percentage of the revenue generated if we are unable to increase our rates commensurately. A continued decline in the rates we pay to our affiliates and independent owner-operators could adversely affect our ability to maintain our existing affiliates and independent owner-operators and attract new affiliates, independent owner-operators and drivers. Disagreements with affiliates or independent owner-operators as to payment or other terms, or the failure of a key affiliate to meet our contractual obligations or otherwise perform consistent with our requirements may require us to utilize alternative suppliers, in each case at potentially higher prices or with disruption of the services that we provide to our customers. If we fail to deliver on time or if the costs of our services increase, then our profitability and customer relationships could be harmed.
Although our affiliates and independent owner-operators have substantial contractual obligations to us, we do not control them. These affiliates and independent owner-operators typically utilize tractors and trailers bearing our tradenames and trademarks. To the extent that one of our affiliates or independent owner-operators are subject to negative publicity, they could be confused with us and it could have a material adverse effect on our business, results of operations, cash flows or financial condition.
We are self-insured and have exposure to certain claims and are subject to the insurance marketplace, all of which could affect our profitability.
The primary accident risks associated with our business are:
| • | motor-vehicle related bodily injury and property damage, |
| • | workers’ compensation claims, |
| • | cargo loss and damage, and |
| • | general liability claims. |
We currently maintain insurance for:
| • | motor-vehicle related bodily injury and property damage claims, covering all employees, owner operators and affiliates, |
| • | workers’ compensation insurance coverage on our employees and company drivers, and |
| • | general liability claims. |
Our insurance program includes a self insured deductible of $2.0 million per incident for bodily injury and property damage and a $1.0 million deductible for workers’ compensation. In addition, we currently maintain insurance policies with a total limit of $40.0 million. The $2.0 million deductible per incident could adversely affect our profitability, particularly in the event of an increase in the number or severity of incidents. Additionally, we are self-insured for damage to the equipment that we own and lease, for cargo losses and such self-insurance is not subject to any maximum limitation. We extend insurance coverage to our affiliates for (i) motor vehicle related bodily injury, (ii) property damage, and (iii) cargo loss and damage. Under this extended coverage, affiliates are responsible for only a small portion of the applicable deductibles.
We are subject to changing conditions and pricing in the insurance marketplace and we cannot assure you that the cost or availability of various types of insurance may not change dramatically in the future. To the extent these costs cannot be passed on to our customers in increased freight rates, increases in insurance costs could reduce our future profitability and cash flow.
16
Table of Contents
The trucking industry is subject to regulation, and changes in trucking regulations may increase costs.
As a motor carrier, we are subject to regulation by the Federal Motor Carrier Safety Administration and the U.S. Department of Transportation, and by various state, federal and provincial agencies. These regulatory authorities exercise broad powers governing activities such as operating authority, safety, hours of service, hazardous materials transportation, financial reporting and acquisitions. There are additional regulations specifically relating to the trucking industry, including testing and specification of equipment, product-handling requirements and drug testing of drivers. The trucking industry is subject to possible regulatory and legislative changes that may affect the economics of the industry by requiring changes in operating practices, emissions or by changing the demand for common or contract carrier services or the cost of providing truckload services. Possible changes include:
| • | increasingly stringent environmental regulations, including changes intended to address climate change, |
| • | restrictions, taxes or other controls on emissions, |
| • | increasing control over the transportation of hazardous materials, |
| • | changes in the hours-of-service regulations, which govern the amount of time a driver may drive in any specific period, |
| • | onboard black box recorder devices, |
| • | requirements leading to accelerated purchases of new trailers, |
| • | mandatory limits on vehicle weight and size, and |
| • | mandatory regulations imposed by the Department of Homeland Security. |
From time to time, various legislative proposals are introduced, including proposals to increase federal, state, or local taxes, including taxes on motor fuels and emissions, which may increase our operating costs, require capital expenditures or adversely impact the recruitment of drivers.
Restrictions on emissions or other climate change laws or regulations could also affect our customers that use significant amounts of energy or burn fossil fuels in producing or delivering the products we carry. We could also lose revenue if our customers divert business from us because we have not complied with their sustainability requirements.
Increased unionization could increase our operating costs or constrain operating flexibility.
Although only approximately 3.1% of our driver population, including independent owner-operators and employees of affiliates, was subject to collective bargaining agreements at December 31, 2009, unions such as the International Brotherhood of Teamsters have traditionally been active in the U.S. trucking industry. Unionized workers could disrupt our operations by strike, work stoppage or other slowdown. In addition, our non-union workforce has been subject to unionization efforts in the past, and we could be subject to future unionization. Increased unionization of our workforce could result in higher compensation and working condition demands that could increase our operating costs or constrain our operating flexibility.
Our operations involve hazardous materials, which could create environmental liabilities.
Our activities, particularly those relating to our handling, transporting and storage of bulk chemicals, are subject to environmental, health and safety laws and regulation by governmental authorities in the United States as well as foreign governmental authorities. Among other things, these environmental laws and regulations address emissions to the air, discharges on land and in water, the generation, handling, storage, transportation, treatment and disposal of waste materials, and the health and safety of our employees. These laws generally require us to obtain and maintain various licenses and permits. Most environmental laws provide for substantial
17
Table of Contents
fines and potential criminal sanctions for violations. Environmental, health and safety laws and regulations are complex, change frequently and have tended to become stricter over time. Some of these laws and regulations are subject to varying and conflicting interpretations. There can be no assurance that violations of such laws, regulations, permits or licenses will not be identified or occur in the future, or that such laws and regulations will not change in a manner that could impose material costs on us.
As a handler of hazardous substances, we are potentially subject to strict, joint and several liability for investigating and rectifying the consequences of spills and other environmental releases of these substances. We have incurred remedial costs and regulatory penalties for chemical or wastewater spills and releases at our facilities or over the road. As a result of environmental studies conducted at our facilities or at third party sites, we have identified environmental contamination at certain sites that will require remediation and we are currently conducting investigation and remediation projects at seven of our facilities. Future liabilities and costs under environmental, health, and safety laws are not easily predicted, and such liabilities could result in a material adverse effect on our financial condition, results of operations or business reputation.
In addition, we have been named a potentially responsible party at various sites under the Comprehensive Environmental Response Compensation and Liability Act of 1980 and other environmental regulatory programs. Our current reserves provided for these sites may prove insufficient, which would result in future charges against earnings. Further, we could be named a potentially responsible party at other sites in the future and the costs associated with such future sites could be material.
Potential disruptions at U.S. ports of entry could adversely affect our business, financial condition and results of operations.
Any disruption of the delivery of ISO tank containers to those ports where we do business would reduce the number of ISO tank containers that we transport, store, clean or maintain. This reduced activity may have a material adverse effect on our operations.
If fuel prices increase significantly, our results of operations could be adversely affected.
We are subject to risk with respect to purchases of fuel. Prices and availability of petroleum products are subject to political, economic and market factors that are generally outside our control. Political events in the Middle East, Venezuela, and elsewhere, as well as hurricanes and other weather-related events, and current and future market-based (cap-and-trade) greenhouse gas emissions control mechanisms, also may cause the price of fuel to increase. Because our operations are dependent upon diesel fuel, significant increases in diesel fuel costs could materially and adversely affect our results of operations and financial condition if we are unable to pass increased costs on to customers through rate increases or fuel surcharges. Historically, we have recovered the majority of the increases in fuel prices from customers through fuel surcharges. Fuel surcharges that can be collected may not always fully offset the increase in the cost of diesel fuel. To the extent fuel surcharges are insufficient to offset our fuel costs, our results of operations may be adversely affected.
Loss of qualified drivers or other personnel could limit our growth and negatively affect operations.
During periods of high trucking volumes, there is substantial competition for qualified drivers in the trucking industry. Furthermore, certain geographic areas have a greater shortage of qualified drivers than other areas. We operate in many of the geographic areas where there have been driver shortages in the past and have turned down new business opportunities as a result of the lack of qualified new drivers. Difficulty in attracting qualified personnel, particularly qualified drivers, could require us to increase driver compensation, forego available customer opportunities and underutilize the tractors and trailers in our network. These actions could result in increased costs and decreased revenues. In addition, we may not be able to recruit other qualified personnel in the future.
18
Table of Contents
The loss of one or more significant customers may adversely affect our business.
We are dependent upon a limited number of large customers. Our top ten customers accounted for approximately 32.4% of our total revenues during 2009. The loss of one or more of our other major customers, or a material reduction in services performed for such customers, may have a material adverse effect on our results of operations.
Our business may be harmed by terrorist attacks, future wars or anti-terrorism measures.
In the aftermath of the terrorist attacks of September 11, 2001, federal, state and municipal authorities have implemented and are implementing various security measures, including checkpoints and travel restrictions on large trucks and fingerprinting of drivers in connection with new hazardous materials endorsements on their licenses. Such existing measures and future measures may have significant costs associated with them which a motor carrier is forced to bear. Moreover, large trucks carrying toxic chemicals are a potential terrorist target, and we may be obligated to take measures, including possible capital expenditures intended to protect our trucks. In addition, the insurance premiums charged for some or all of the coverage currently maintained by us could continue to increase dramatically or such coverage could be unavailable in the future.
We depend on members of our senior management.
We believe that our ability to successfully implement our business strategy and to operate profitably depends in large part on the continued employment of our senior management team. If members of senior management become unable or unwilling to continue in their present positions, our business or financial results could be adversely affected.
Our long-lived assets are subject to potential asset impairment.
At December 31, 2009, goodwill and other intangible assets represented approximately $45.5 million, or approximately 16.3% of our total assets and approximately 24.5% of our non-current assets, the carrying value of which may be reduced if we determine that those assets are impaired. In addition, net property and equipment totaled approximately $127.3 million, or approximately 45.5% of our total assets.
We review for potential goodwill impairment on an annual basis as part of our goodwill impairment testing in the second quarter of each year with a measurement date of June 30, and more often if a triggering event or circumstance occurs making it likely that impairment exists. In addition, we test for the recoverability of long-lived assets at year end, and more often if an event or circumstance indicates the carrying value may not be recoverable. We conduct impairment testing based on our current business strategy in light of present industry and economic conditions, as well as future expectations.
The annual goodwill impairment review performed in June 2009 indicated there was goodwill impairment. As a result of the analysis, we concluded that a total impairment charge to goodwill of $146.2 million was necessary at June 30, 2009, of which $144.3 million was related to our trucking segment, eliminating 100% of the carrying amount of goodwill, and $1.9 million was related to our container services segment.
If there are changes to the methods used to allocate carrying values, if management’s estimates of future operating results change, if there are changes in the identified reporting units or if there are changes to other significant assumptions, the estimated carrying values and the estimated fair value of our goodwill could change significantly, and could result in future impairment charges, which could materially impact our results of operations and financial condition.
19
Table of Contents
Our restructuring involves risks to our business operations and may not reduce our costs.
During 2008 and 2009, we eliminated non-driver positions, consolidated and closed under-performing company terminals, implemented certain contract terminations, transitioned company-owned terminals to affiliates and took other measures intended to reduce future costs. These steps have placed, and will continue to place, pressures on our management, administrative and operational infrastructure as well as on our results of operations. Employees that departed in connection with the restructuring possessed knowledge of our business, skills and relationships with our customers, affiliates, drivers and other employees that were not replaced. As a result, our remaining employees may be required to serve new operational roles in which they have limited experience, which may reduce employee satisfaction and productivity. New relationships may also reduce customer, affiliate or driver satisfaction. Additionally, our restructuring plans and related efforts may divert management’s and other employee’s attention from other business concerns.
Due to the restructuring, we took pre-tax charges in 2008 and 2009, which represent severance-related costs and costs associated with lease and contract terminations. The majority of these costs were cash expenditures paid during 2008 and 2009 or costs that we expect to pay in the future. Actual costs may exceed our estimates, and we expect to take additional charges in 2010. Furthermore, we have formulated this restructuring plan with the goal of reducing our future operating expenses. Our future operating expenses may not be reduced as we expect, or reductions may be offset in the future by other expenses.
In addition, risks and uncertainties not currently known to us or that we currently deem to be immaterial may also materially adversely affect our business, financial condition and/or operating results.
Interests of Apollo may conflict with your interests.
At March 8, 2010, Apollo and its affiliated funds owned or controlled approximately 52.0% of our outstanding common stock. As a result, Apollo can influence substantially all matters requiring shareholder approval, including the election of directors, the approval of significant corporate transactions, such as acquisitions and the ability to block an unsolicited tender offer. The interests of Apollo may conflict with your interests. For example, if we encounter financial difficulties, or are unable to pay our debts as they mature, Apollo may have an interest in pursuing acquisitions, divestitures, financings or other transactions that, in their judgment, could enhance their equity investment, even though these transactions might involve risk to our shareholders or debt holders. Similarly, if our financial performance and creditworthiness significantly improve in the future, Apollo may have an interest in pursuing reorganizations, restructurings, or other transactions that could increase our leverage or impair our creditworthiness or otherwise, in their judgment, enhance Apollo’s equity investment in QDI, even though these transactions might involve risk to our shareholders or debt holders.
Risks Related to our Common Stock
We have a majority shareholder who can substantially influence the outcome of all matters voted upon by our shareholders and prevent actions which a shareholder may otherwise view favorably.
As of March 8, 2010, Apollo and its affiliated funds owned or controlled approximately 52.0% of our outstanding common stock. As a result, Apollo can influence substantially all matters requiring shareholder approval, including the election of directors, the approval of significant corporate transactions, such as acquisitions, the ability to block an unsolicited tender offer and any other matter requiring a vote of shareholders. This concentration of ownership could delay, defer or prevent a change in control of our Company or impede a merger, consolidation, takeover or other business combination which a shareholder, may otherwise view favorably.
20
Table of Contents
Our ability to issue “blank check” preferred stock and Florida law may prevent a change in control of our Company that a shareholder may consider favorable.
Provisions of our articles of incorporation and Florida law may discourage, delay or prevent a change in control of our Company that a shareholder may consider favorable. These provisions include:
| • | authorization of the issuance of “blank check” preferred stock that could be issued by our Board of Directors to increase the number of outstanding shares in order to control a takeover attempt which the Board viewed unfavorably, |
| • | elimination of the voting rights of shareholders with respect to shares that are acquired without prior Board approval that would otherwise entitle such shareholder to exercise certain amounts of voting power in the election of directors, and |
| • | prohibition on business combinations with interested shareholders unless particular conditions are met. |
As a result, these provisions could limit the price that investors are willing to pay in the future for shares of our common stock.
Future sales and issuances of our common stock in the public market may depress our stock price and result in dilution.
The market price of our common stock could decline as a result of sales by our existing shareholders of a large number of shares of our common stock. These sales might also make it more difficult for us to sell additional equity securities at a time and price that we deem appropriate. As of March 8, 2010, there are approximately 20.1 million shares of common stock outstanding. Approximately 11.7 million shares of common stock are “restricted securities” as defined in Rule 144 under the Securities Act of 1933 or are held by affiliates.
In addition, as of March 8, 2010, we have 3.1 million shares of common stock available for issuance under our stock option plan. As of March 8, 2010, there were outstanding options for 2.2 million shares and warrants for 1.75 million shares of our common stock. Exercise of the warrants and of options that are in-the-money will result in dilution to existing shareholders in an amount equal to the difference in the market and exercise prices multiplied by the number of shares exercised. In addition, prior to their exercise, these options and warrants may depress the market price for our common stock.
We currently do not intend to pay dividends on our common stock.
We do not expect to pay dividends on our common stock in the foreseeable future. In addition, the ABL Facility and indentures governing our 2013 Senior Notes and 2013 PIK Notes contain certain restrictions on our ability to pay dividends on our common stock. Accordingly, the price of our common stock must appreciate in order to realize a gain on one’s investment. This may not occur.
ITEM 1B. UNRESOLVED STAFF COMMENTS
None.
Currently we lease approximately 68,000 square feet for our administrative and corporate office headquarters in Tampa, Florida. The lease for our corporate headquarters expires in December 2017. The corporate headquarters, for our subsidiary, Boasso, is located in Chalmette, Louisiana, and consists of 20,000 square feet of office space. The lease expires April 2013.
We have no other location that is material to our operations. We engage in bulk transportation of liquid and dry chemical products through our subsidiary, QCI. Our container services are operated through our subsidiary, Boasso.
21
Table of Contents
As of December 31, 2009, our terminals and facilities consisted of the following:
| Terminals Operated |
Segment | |||
| QCI Affiliate trucking terminals |
83 | Trucking | ||
| QCI trucking terminals |
16 | Trucking | ||
| Boasso container services terminals |
8 | Container Services | ||
| QSI tank wash facility (1) |
1 | Other | ||
| Total |
108 | |||
| (1) | This tank wash facility was closed in January 2010. |
We currently own 44 properties from which we operate or lease trucking, tank wash and container services terminals.
We consider our properties to be in good condition generally and believe that our facilities are adequate to meet our anticipated requirements.
In addition to those items disclosed under Item 1. “Business—Environmental Matters,” “Business—Other Legal Matters” and Note 19 to our consolidated financial statements contained herein, “Commitments and Contingencies—Environmental Matters,” we are from time to time involved in routine litigation incidental to the conduct of our business. We believe that no such routine litigation currently pending against us, if adversely determined, would have a material adverse effect on our consolidated financial position, results of operations or cash flows.
EXECUTIVE OFFICERS OF THE REGISTRANT
Our executive officers, as of March 8, 2010 were as follows:
| Name |
Age | Position | ||
| Gary R. Enzor |
47 | President and Chief Executive Officer | ||
| Stephen R. Attwood |
58 | Senior Vice President and Chief Financial Officer | ||
| Jonathan C. Gold |
46 | Senior Vice President, General Counsel and Secretary |
Gary R. Enzor (47) has served as our Chief Executive Officer since June 2007 and as President of QDI since November 2005. Mr. Enzor joined QDI in December 2004 as Executive Vice President and Chief Operating Officer. Prior to joining QDI, Mr. Enzor served as Executive Vice President and Chief Financial Officer of Swift Transportation Company, Inc. since August 2002. Prior to Swift, Mr. Enzor held executive positions with Honeywell, Dell Computer and AlliedSignal, Inc. (now Honeywell International, Inc.).
Stephen R. Attwood (58) joined QDI in July 2008 as Senior Vice President and Chief Financial Officer. Prior to joining QDI, Mr. Attwood served as Controller and Vice President of Swift Transportation Co., Inc. Previously, Mr. Attwood held senior management positions with Dell Computer and AlliedSignal Inc. (now Honeywell International, Inc.).
Jonathan C. Gold (46) has served as our Senior Vice President, General Counsel and Secretary since April 1, 2007. Mr. Gold joined QDI in January 2005 as Vice President, Associate General Counsel and Assistant Secretary. Prior to his employment with the Company, Mr. Gold served as corporate counsel with CSX Transportation, Inc. and Vice President, General Counsel and Secretary with Softmart, Inc. In addition, Mr. Gold was in private practice in Washington, D.C. and served as Judicial Clerk to the Honorable Harvey E. Schlesinger, Senior U.S. District Judge for the Middle District of Florida. Mr. Gold retired from the U.S. Army Reserve in 2007 after more than 20 years of active and reserve military service and is a decorated veteran of Operation Iraqi Freedom.
22
Table of Contents
| ITEM 5. | MARKET FOR REGISTRANT’S COMMON EQUITY, RELATED SHAREHOLDER MATTERS AND ISSUER’S PURCHASES OF EQUITY SECURITIES |
Our common stock is traded on NASDAQ Global Market (“NASDAQ”) under the symbol “QLTY”. The table below sets forth the quarterly high and low sale prices for our common stock as reported on NASDAQ.
| Common Stock | ||||||
| High | Low | |||||
| 2009 |
||||||
| 1st quarter |
$ | 3.23 | $ | 1.25 | ||
| 2nd quarter |
2.30 | 1.62 | ||||
| 3rd quarter |
4.51 | 1.82 | ||||
| 4th quarter |
4.20 | 3.15 | ||||
| 2008 |
||||||
| 1st quarter |
$ | 5.17 | $ | 2.57 | ||
| 2nd quarter |
4.00 | 2.42 | ||||
| 3rd quarter |
4.90 | 2.22 | ||||
| 4th quarter |
4.28 | 1.22 | ||||
As of March 8, 2010, there were approximately 88 holders of record of our common stock.
DIVIDEND POLICY
We have not declared cash dividends on our common stock for the periods presented above and have no present intention of doing so. We currently intend to retain our future earnings, if any, to repay debt or to finance the further expansion and continued growth of our business. Additionally, the ABL Facility and the indentures governing our 2013 Senior Notes and our 2013 PIK Notes limit QDI’s ability to pay dividends on its common stock. Future dividends, if any, will be determined by our Board of Directors.
UNREGISTERED SALES OF EQUITY SECURITIES
None
23
Table of Contents
PERFORMANCE GRAPH
The following graph depicts a comparison of cumulative total shareholder returns for us as compared to the NASDAQ Trucking & Transportation Index and the NASDAQ Stock Market (U.S.) Index. The graph assumes the investment of $100 on December 31, 2004 through December 31, 2009 and the reinvestment of any dividends issued during the period.
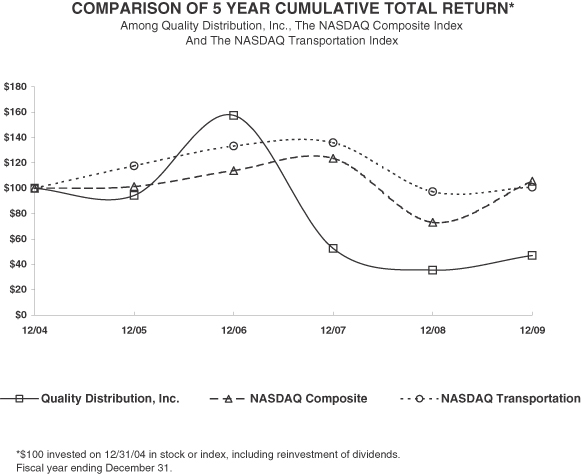
24
Table of Contents
ITEM 6. SELECTED FINANCIAL DATA
The selected historical consolidated financial information set forth below is qualified in its entirety by reference to, and should be read in conjunction with, our consolidated financial statements and notes thereto included elsewhere in this report and Item 7. “Management’s Discussion and Analysis of Financial Condition and Results of Operations.”
The consolidated statements of operations data set forth below for the years ended December 31, 2009, 2008 and 2007 and the historical balance sheet data as of December 31, 2009 and 2008 are derived from our audited consolidated financial statements included under Item 8 of this report. The historical statements of operations data for the years ended December 31, 2006 and 2005 and the historical balance sheet data as of December 31, 2007, 2006 and 2005 are derived from our audited consolidated financial statements that are not included in this report.
| YEAR ENDED DECEMBER 31 | ||||||||||||||||||||
| 2009 | 2008 | 2007 | 2006 | 2005 | ||||||||||||||||
| (DOLLARS IN THOUSANDS, EXCEPT PER SHARE DATA) | ||||||||||||||||||||
| Statements of Operations Data (1) |
||||||||||||||||||||
| Operating revenues |
$ | 613,609 | $ | 815,290 | $ | 751,558 | $ | 730,159 | $ | 678,076 | ||||||||||
| Operating expenses: |
||||||||||||||||||||
| Purchased transportation |
373,539 | 466,823 | 471,531 | 493,686 | 471,238 | |||||||||||||||
| Depreciation and amortization |
20,218 | 21,002 | 17,544 | 16,353 | 17,278 | |||||||||||||||
| Impairment charge (2) |
148,630 | — | — | — | — | |||||||||||||||
| Other operating expenses |
186,398 | 294,487 | 238,630 | 171,842 | 149,741 | |||||||||||||||
| Operating (loss) income |
(115,176 | ) | 32,978 | 23,853 | 48,278 | 39,819 | ||||||||||||||
| Interest expense, net |
28,047 | 35,120 | 30,524 | 29,388 | 26,712 | |||||||||||||||
| Write-off of debt issuance costs |
20 | 283 | 2,031 | — | 1,110 | |||||||||||||||
| Gain on extinguishment of debt |
(1,870 | ) | (16,532 | ) | — | — | — | |||||||||||||
| Other expense (income) |
1,912 | (2,945 | ) | 940 | 888 | (222 | ) | |||||||||||||
| (Loss) income before taxes |
(143,285 | ) | 17,052 | (9,642 | ) | 18,002 | 12,219 | |||||||||||||
| Provision for (benefit from) income taxes |
37,249 | 4,940 | (2,079 | ) | (38,168 | ) | 352 | |||||||||||||
| Net (loss) income attributable to common shareholders |
$ | (180,534 | ) | $ | 12,112 | $ | (7,563 | ) | $ | 56,170 | $ | 11,867 | ||||||||
| Net (loss) income per common share: |
||||||||||||||||||||
| Basic |
$ | (9.28 | ) | $ | 0.63 | $ | (0.39 | ) | $ | 2.97 | $ | 0.63 | ||||||||
| Diluted |
(9.28 | ) | 0.62 | (0.39 | ) | 2.87 | 0.61 | |||||||||||||
| Weighted average common shares outstanding: |
||||||||||||||||||||
| Basic |
19,449 | 19,379 | 19,336 | 18,920 | 18,934 | |||||||||||||||
| Diluted |
19,449 | 19,539 | 19,336 | 19,571 | 19,301 | |||||||||||||||
25
Table of Contents
| YEAR ENDED DECEMBER 31 | ||||||||||||||||||||
| 2009 | 2008 | 2007 | 2006 | 2005 | ||||||||||||||||
| (DOLLARS IN THOUSANDS, EXCEPT TERMINAL, TRAILER AND TRACTOR DATA) |
||||||||||||||||||||
| Other Data (1) |
||||||||||||||||||||
| Net cash provided by operating activities |
$ | 39,756 | $ | 19,593 | $ | 14,052 | $ | 28,236 | $ | 9,039 | ||||||||||
| Net cash provided by (used in) investing activities |
9,577 | (8,524 | ) | (63,399 | ) | (10,591 | ) | (16,063 | ) | |||||||||||
| Net cash (used in) provided by financing activities |
(50,515 | ) | (13,485 | ) | 52,194 | (12,474 | ) | 5,858 | ||||||||||||
| Number of terminals at end of period |
108 | 149 | 169 | 165 | 165 | |||||||||||||||
| Number of trailers operated at end of period |
6,410 | 7,115 | 7,506 | 7,769 | 7,461 | |||||||||||||||
| Number of tractors operated at end of period |
2,839 | 3,224 | 3,927 | 3,829 | 3,539 | |||||||||||||||
| Balance Sheet Data at Year End (1) |
||||||||||||||||||||
| Working capital |
$ | 19,016 | $ | 44,967 | $ | 67,093 | $ | 59,673 | $ | 43,079 | ||||||||||
| Total assets |
279,616 | 502,103 | 493,976 | 417,873 | 377,053 | |||||||||||||||
| Total indebtedness, including current maturities |
321,284 | 362,586 | 349,271 | 279,122 | 289,116 | |||||||||||||||
| Shareholders’ (deficit) equity |
(140,736 | ) | 31,020 | 27,300 | 31,774 | (27,462 | ) | |||||||||||||
| (1) | On December 17, 2007, we acquired 100% of the stock of Boasso America Corporation. The results of Boasso have been included in our results since the date of the acquisition. |
| (2) | The impairment charge resulted from an impairment analysis of goodwill and intangible assets performed during the quarter ended June 30, 2009. Refer to Note 12 to the consolidated financial statements contained herein. |
26
Table of Contents
| ITEM 7. | MANAGEMENT’S DISCUSSION AND ANALYSIS OF FINANCIAL CONDITION AND RESULTS OF OPERATIONS |
The following discussion of our results of operations and financial condition should be read in conjunction with our consolidated financial statements and the related notes included elsewhere in this report. The following discussion includes forward-looking statements. For a discussion of important factors that could cause actual results to differ from results discussed in the forward-looking statements, see “Forward-Looking Statements and Certain Considerations” contained in the Introduction to this report.
OVERVIEW
We operate the largest chemical bulk tank truck network in North America through our wholly owned subsidiary QCI and are a leading provider of ISO (International Organization for Standardization) container and depot services through our wholly owned subsidiary Boasso.
The bulk tank truck market in North America includes all products shipped by bulk tank truck carriers and consists primarily of liquid and dry bulk chemicals (including plastics) and bulk dry and liquid food-grade products. We primarily transport a broad range of chemical products and provide our customers with logistics and other value-added services. We are a core carrier for many of the major companies engaged in chemical processing including BASF, Dow, DuPont, ExxonMobil, Georgia-Pacific, Honeywell, Procter & Gamble, Rohm & Haas, Sunoco and Unilever, and we provide services to most of the top 100 chemical producers with United States operations.
Our transportation revenue is a function of the volume of shipments by the bulk chemical industry, prices, the average number of miles driven per load, our market share and the allocation of shipments between tank truck transportation and other modes of transportation such as rail. The volume of shipments of chemical products is, in turn, affected by many other industries and end use markets, including consumer and industrial products, paints and coatings, paper and packaging, agriculture and food products, and tends to vary with changing economic conditions.
Due to the nature of our customers’ business, our revenues generally decline during winter months, namely the first and fourth fiscal quarters and over holidays. Highway transportation can be adversely affected depending upon the severity of the weather in various sections of the country during the winter months. Our operating expenses also are somewhat higher in the winter months, due primarily to decreased fuel efficiency, increased utility costs and increased maintenance costs of equipment in colder months.
Boasso is the leading North American provider of ISO tank container transportation and depot services with eight terminals located in the eastern half of the United States. In addition to intermodal ISO tank transportation services, Boasso provides tank cleaning, heating, testing, maintenance and storage services to customers. Boasso provides local and over-the-road trucking primarily within the proximity of the port cities where its depots are located and also sells equipment that its customers use for portable alternative storage or office space.
Demand for ISO tank containers is impacted by the volume of imports and exports of chemicals through United States ports. Boasso’s revenues are accordingly impacted by this import/export volume in particular the number of shipments through ports at which Boasso has terminals, the volume of rail shipments to and from ports at which Boasso has terminals and by Boasso’s market share. Economic conditions and differences among the laws and currencies of nations may impact the volume of shipments as well.
Our bulk service network consists primarily of independently owned third-party affiliate terminals, company-operated terminals and independent owner-operator drivers. Affiliates are independent companies we contract with to operate trucking terminals exclusively on our behalf in defined markets. The affiliates provide the capital necessary to service their contracted business and are also responsible for most of the operating costs associated with servicing the contracted business. Independent owner-operators are generally individual drivers
27
Table of Contents
who own or lease their tractors and agree to provide transportation services to us under contract. We believe the use of affiliates and independent owner-operators provides the following key competitive advantages to us in the marketplace:
| • | Locally owned and operated affiliate terminals can provide superior, tailored customer service. |
| • | Affiliates and independent owner-operators generally are paid a fixed, contractual percentage of revenue collected on each load they transport creating a variable cost structure that mitigates against cyclical downturns. |
| • | Reliance on affiliates and independent owner-operators creates an asset-light business model that generally reduces our capital investment. |
In the first quarter of 2009, we began consolidating certain company-operated terminals and transitioning other company-operated terminals to affiliates. These actions continued throughout 2009 and have resulted in a larger portion of our revenue being generated by affiliates and a substantial reduction in the number of terminals in our network. We believe these actions will reduce certain fixed costs, provide a more variable cost structure and position us with a financially flexible business platform.
We believe the most significant factors relevant to our future business growth are the ability to (i) obtain additional business from existing customers, (ii) add new customers, (iii) improve the utilization of our trailer fleet and (iv) add and retain qualified drivers. While many of our customers source some of their logistics needs with rail, we expect our customers to continue to outsource a greater proportion of their logistics needs to full service tank truck carriers. As a result of our leading market position, strong customer relationships and flexible business model, we believe we are well-positioned to benefit from customers seeking consolidation of their shipping relationships and those opting to outsource a greater portion of their logistics needs to third-party tank truck carriers.
On October 15, 2009, we received approximately $134.5 million of our 2012 Notes in exchange for new 2013 Senior Notes. We also received approximately $83.6 million for our 9% Notes in exchange for approximately $80.7 million aggregate principal amount of our new 2013 PIK Notes, approximately 1.75 million warrants and $1.8 million in cash. The warrants are exercisable to purchase shares of our common stock at an exercise price of $0.01 per share, during the period beginning April 16, 2010 and ending on November 1, 2013.
Acquisitions and Dispositions
During 2009, we did not complete any asset or other acquisitions of businesses or affiliates.
On October 10, 2009, we sold substantially all of the operating assets of our tank wash subsidiary, QSI, for $13.0 million, of which $10.0 million was paid in cash and the remaining $3.0 million in a subordinated note. The subordinated note is a five year non-amortizing note which matures on December 31, 2014. The principal is payable in a lump sum at maturity. Interest is payable quarterly at 7% per annum commencing December 31, 2009. In connection with the sale, QSI entered into various agreements with the purchaser, which is not affiliated with us, including long-term leases of real estate used in the tank wash business and various operating agreements. The assets sold had a net book value of $4.9 million which included $4.3 million of equipment, $0.4 million of inventory, and $0.2 million of intangibles. The sold QSI business generated approximately $19.5 million of revenue in 2009 from tank wash and related operations. We recorded a pre-tax gain the fourth quarter of $7.1 million.
During 2008, we purchased the assets of two transportation companies and the assets of an affiliate for $2.1 million, in the aggregate, of which $1.4 million was paid in cash at closing and the remaining $0.7 million is payable over future periods. Of the total $2.1 million, we allocated $1.0 million to property and equipment, $0.9 million to goodwill, and $0.2 million to other intangible assets such as non-compete agreements.
28
Table of Contents
CRITICAL ACCOUNTING POLICIES AND ESTIMATES
Our discussion and analysis of our financial condition and results of operations are based upon our consolidated financial statements, which have been prepared in accordance with GAAP. We believe the following are the more critical accounting policies that impact the financial statements, some of which are based on management’s best estimates available at the time of preparation. Actual future experience may differ from these estimates.
Property and equipment—Property and equipment expenditures, including tractor and trailer rebuilds that extend the useful lives of such equipment, are capitalized and recorded at cost. For financial statement purposes, these assets are depreciated using the straight-line method over the estimated useful lives of the assets to an estimated salvage value.
The asset lives used are presented in the following table:
| Average Lives (in years) | ||
| Buildings and improvements |
10 - 25 | |
| Tractors and terminal equipment |
5 - 7 | |
| Trailers |
15 - 20 | |
| Furniture and fixtures |
3 - 5 | |
| Other equipment |
3 - 10 |
Tractor and trailer rebuilds, which are recurring in nature and extend the lives of the related assets, are capitalized and depreciated over the period of extension, generally 3 to 10 years, based on the type and extent of these rebuilds. Maintenance and repairs are charged directly to expense as incurred. Management estimates the useful lives of these assets based on historical trends and the age of the assets when placed in service. Any changes in the actual lives could result in material changes in the net book value of these assets. Additionally, we estimate the salvage values of these assets based on historical sales or disposals, and any changes in the actual salvage values could also affect the net book value of these assets.
Furthermore, we evaluate the recoverability of our long-lived assets whenever adverse events or changes in the business climate indicate that the expected undiscounted future cash flows from the related asset may be less than previously anticipated. If the net book value of the related asset exceeds the undiscounted future cash flows of the asset, the carrying amount would be reduced to the present value of its expected future cash flows and an impairment loss would be recognized. This analysis requires us to make significant estimates and assumptions in projecting future cash flows, and changes in facts and circumstances could result in material changes in the amount of any write-offs for impairment.
Goodwill and Intangible Assets—We evaluate goodwill and indefinite-lived intangible assets for impairment annually during the second quarter with a measurement date of June 30, and more frequently if indicators of impairment arise, in accordance with the FASB guidance. We evaluate goodwill for impairment by determining the fair value based on criteria in the FASB guidance for each reporting unit, our trucking segment and our container services segment. These reporting units contain goodwill and other identifiable intangible assets as a result of previous business acquisitions. As a result of our annual impairment test conducted as of June 30, 2009, we concluded a total impairment charge of $148.6 million was necessary, of which $144.3 million of goodwill was related to our trucking segment, eliminating 100% of the carrying amount of goodwill of that segment, $1.9 million was related to our container services segment and $2.4 million was related to the tradename of our container services segment.
We recorded a provision for income taxes of $36.3 million associated with the impairment charge. The impairment charge related to both deductible and nondeductible tax goodwill. The impairment would have normally resulted in a tax benefit of $52.0 million, but this was offset by $46.7 million of tax expense related to
29
Table of Contents
the nondeductible portion of the goodwill. Additionally, the recording of this impairment charge caused an increase to the valuation allowance against deferred tax assets that we no longer believe are more likely than not to be realized. The increase to the valuation allowance resulted in an increase to tax expense of $41.6 million. The increase to the valuation allowance was triggered by the impairment charge.
We have evaluated at least quarterly whether indicators of impairment exist in accordance with applicable guidance. Prior to our June 30, 2009 analysis, we did not believe that factors attributable to the economic downturn would impact the recoverability of our goodwill. Our performance since the prior period’s goodwill impairment test at June 30, 2008 through year end 2008 trended positive and there were no indications from our quarterly reviews that a triggering event had occurred. The first quarter of 2009 showed improved operating income year over year and strong operating cash flow; however, due to the continuing economic downturn, we reviewed not only our market capitalization, but also performed a discounted cash flow analysis based on assumptions adjusted to reflect the current economic environment and which we believed to be appropriate at the time. The conclusions from our extended analysis at March 31, 2009 did not indicate a trend in operating results that would foretell of impairment to our goodwill. For our June 30, 2009 analysis, we adjusted further our assumptions used, such as growth and discount rates, in the annual impairment test to reflect the persistence of the downward economic trend. We continued to evaluate indicators of impairment quarterly following our annual goodwill impairment test at June 30, 2009 through year end 2009, including the quarter ended December 31, 2009. There were no indications that a triggering event had occurred as of December 31, 2009. As of December 31, 2009, we had total goodwill of $27.0 million, all of which was allocated to container services.
Goodwill
Under the FASB guidance, the process of evaluating the potential impairment of goodwill involves a two-step process and requires significant judgment at many points during the analysis. In the first step, we determine whether there is an indication of impairment by comparing the fair value of a reporting unit to its carrying amount, including goodwill. If, based on the first step, we determine that there is an indication of goodwill impairment, we assess the impairment in step two in accordance with the FASB guidance.
In the first step, we determine the fair value for our reporting units using a combination of two valuation approaches: the market approach and the income approach. The market approach uses a guideline company methodology which is based upon a comparison of us to similar publicly-traded companies within our industry. We derive a market value of invested capital or business enterprise value for each comparable company by multiplying the price per share of common stock of the publicly traded companies by their total common shares outstanding and adding each company’s current level of debt. We calculate a business enterprise multiple based on revenue and earnings from each company then apply those multiples to each reporting unit’s revenue and earnings to conclude a reporting unit business enterprise value. Assumptions regarding the selection of comparable companies are made based on, among other factors, capital structure, operating environment and industry. As the comparable companies were typically larger and more diversified than our reporting units, multiples were adjusted prior to application to our reporting units’ revenues and earnings to reflect differences in margins, long-term growth prospects and market capitalization.
The income approach uses a discounted debt-free cash flow analysis to measure fair value by estimating the present value of future economic benefits. To perform the discounted debt-free cash flow analysis, we develop a pro forma analysis of each reporting unit to estimate future available debt-free cash flow and discounting estimated debt-free cash flow by an estimated industry weighted average cost of capital based on the same comparable companies used in the market approach. Per the FASB guidance, the weighted average cost of capital is based on inputs (e.g., capital structure, risk, etc.) from a market participant’s perspective and not necessarily from the reporting unit or QDI’s perspective. Future cash flow is projected based on assumptions for our economic growth, industry expansion, future operations and the discount rate, all of which require significant judgments by management.
30
Table of Contents
After computing a separate business enterprise value under the income approach and market approach, we apply a weighting to them to derive the business enterprise value of the reporting unit. The income approach and market approach were both weighted 50% in the analysis performed at June 30, 2009. The weightings are evaluated each time a goodwill impairment assessment is performed and give consideration to the relative reliability of each approach at that time. Given that the business enterprise value derived from the market approach supported what was calculated in the income approach, we believed that both approaches should be equally weighted. Based on these weightings we concluded a business enterprise value for each reporting unit. We then add debt-free liabilities of the reporting unit to the concluded business enterprise value to derive an implied fair value of the reporting unit. The implied fair value is compared to the reporting unit’s carrying value of total assets. Upon completion of the analysis in step one, we determined that the carrying amount of our trucking reporting unit exceeded its fair value and the carrying amount of our container services reporting unit was nearly breakeven with its fair value, requiring a step two analysis to be performed for both reporting units.
In step two of the goodwill impairment test, the amount of impairment loss is determined by comparing the implied fair value of each reporting unit’s goodwill with the carrying value of the reporting unit’s goodwill. This involves testing the definite-lived assets in accordance with the FASB guidance using undiscounted cash flows. Then a fair value allocation is performed in accordance with the FASB guidance for each reporting unit based on the business enterprise value obtained in step one. From that we determine the actual goodwill impairment for each reporting unit based on the goodwill residual amount. If the carrying amount of reporting unit goodwill exceeds the implied fair value of that goodwill, an impairment loss must be recognized in an amount equal to the excess. The loss recognized cannot exceed the carrying amount of goodwill. After a goodwill impairment loss is recognized, the adjusted carrying amount of goodwill will be its new accounting basis. Upon completion of step two of the analysis, an impairment charge was determined related to our trucking and container services segments.
Intangible assets
To determine the implied fair value of our indefinite-lived intangible assets, we utilize the relief from royalty method, pursuant to which those assets are valued by reference to the amount of royalty income they would generate if licensed in an arm’s length transaction. Under the relief from royalty method, similar to the discounted cash flow method, estimated net revenues expected to be generated by the asset during its life are multiplied by a benchmark royalty rate and then discounted by the estimated weighted average cost of capital associated with the asset. The resulting capitalized royalty stream is an indication of the value of owning the asset. Based upon management’s review of the value of the indefinite-lived intangible assets in our container services segment, we determined that the carrying value of the Boasso tradename exceeded its implied fair value by $2.4 million. Accordingly, we recorded an impairment charge of $2.4 million related to our container services segment.
The methodology applied in the analysis performed at June 30, 2009 was consistent with the methodology applied in prior years, but was based on updated assumptions, as appropriate. As a result of the downturn in the economic environment during 2008 and 2009, determining the fair value of the individual reporting units required more judgment on the part of management than in the past. Given the continued recessionary conditions in our industry, estimates of future cash flows used in the analysis performed at June 30, 2009 were lower than those used in the prior year analysis. In addition, our weighted average cost of capital used in the analysis at June 30, 2009 was higher than that used in 2008 due to an increase in the reporting unit risk premium coupled with the market driven inputs to weighted average cost of capital. The discount rates utilized in the analysis also reflect market-based estimates of the risks associated with the projected cash flows of individual reporting units and were increased from the prior year analysis to reflect increased risk due to current volatility in the economic environment.
If there are changes to the methods used to allocate carrying values, if management’s estimates of future operating results change, if there are changes in the identified reporting units or if there are changes to other
31
Table of Contents
significant assumptions, the estimated carrying values for each reporting unit and the estimated fair value of our goodwill could change significantly, and could result in future impairment charges, which could materially impact our results of operations and financial condition.
Deferred Tax Asset—In accordance with FASB guidance, we use the liability method of accounting for income taxes. Significant management judgment is required in determining the provision for income taxes and, in particular, any valuation allowance that is recorded or released against our deferred tax assets.
We continue to evaluate quarterly the positive and negative evidence regarding the realization of net deferred tax assets. The carrying value of our net deferred tax assets is based on our belief that it is more likely than not that we will generate sufficient future taxable income to realize these deferred tax assets. The Company reviews a rolling thirty-six month calculation of U.S. earnings to determine if we are in a cumulative loss position.
During the second quarter of 2009, an impairment charge of $148.6 million was recorded, and as a result of this charge, we determined that we were in a cumulative loss position. Based on this negative evidence we concluded that it was no longer more likely than not that our net deferred tax asset was realizable. For purposes of assessing realizability of the deferred tax assets, this cumulative financial reporting loss position is considered significant negative evidence that we will not be able to fully realize the deferred tax assets in the future. As a result, a $41.2 million deferred tax valuation allowance was recorded. Our judgments regarding future taxable income may change due to changes in market conditions, changes in tax laws, operating results or other factors. If any of these factors and related estimates change in the future, it may increase or decrease the valuation allowance and related income tax expense in the same period
At December 31, 2009 we had an estimated $95.7 million in federal net operating loss carryforwards, $2.3 million in alternative minimum tax credit carryforwards and $3.1 million in foreign tax credit carryforwards. The net operating loss carryforwards will expire in the years 2018 through 2027, while the alternative minimum tax credits may be carried forward indefinitely and the foreign tax credits may be carried forward for 10 years.
Uncertain Income Tax Positions—In accordance with FASB guidance, we account for uncertainty in income taxes, using a two-step process. The first step is to evaluate the tax position for recognition by determining if the weight of available evidence indicates that it is more likely than not that the position will be sustained on audit, including resolution of related appeals or litigation processes, if any. The second step requires us to estimate and measure the tax benefit as the largest amount that is more than 50% likely to be realized upon ultimate settlement. It is inherently difficult and subjective to estimate such amounts, as we have to determine the probability of various possible outcomes. We re-evaluate these uncertain tax positions on a quarterly basis. This evaluation is based on factors including, but not limited to, changes in facts or circumstances, changes in tax law, effectively settled issues under audit, and new audit activity. Such a change in recognition and measurement would result in recognition of a tax benefit and/or an additional charge to the tax provision.
The provision for income taxes was $37.2 million in 2009 as compared to $4.9 million in 2008. The effective rate for 2009 was negative 26.0%, which is lower than our normalized tax rate of 39.0%, in large part due to the recording of a deferred tax valuation allowance and an impairment charge.
Environmental liabilities—We have reserved for potential environmental liabilities based on the best estimates of potential clean-up and remediation for known environmental sites. We employ a staff of environmental professionals to administer all phases of our environmental programs and use outside experts where needed. These professionals develop estimates of potential liabilities at these sites based on projected and known remediation costs. These cost projections are determined through previous experiences with other sites and through bids from third-party contractors. Management believes current reserves are reasonable based on current information.
32
Table of Contents
Accrued loss and damage claims—We currently maintain liability insurance for bodily injury and property damage claims, covering all employees, independent owner-operators and affiliates, and workers’ compensation insurance coverage on our employees and company drivers. This insurance includes deductibles of $2.0 million per incident for bodily injury and property damage and $1.0 million for workers’ compensation for periods after March 31, 2008. Prior to March 30, 2008, our insurance deductible was $5.0 million per incident for bodily injury and property damage. As such, we are subject to liability as a self-insurer to the extent of these deductibles under the policy. We are self-insured for damage to the equipment we own or lease and for cargo losses. As of December 31, 2009, we had $33.6 million in an outstanding letter of credit to our insurance administrator to guarantee the self-insurance portion of our liability. If we fail to meet certain terms of our agreement, the insurance administrator may draw down the letter of credit. In developing liability reserves, we rely on professional third party claims administrators, insurance company estimates and the judgment of our own personnel, and independent professional actuaries and attorneys. The most significant assumptions used in the estimation process include determining the trends in loss costs, the expected consistency in the frequency and severity of claims incurred but not yet reported to prior-year claims, and expected costs to settle unpaid claims. Management believes reserves are reasonable given known information, but as each case develops, estimates may change to reflect the effect of new information.
Revenue recognition—Transportation revenue, including fuel surcharges, and related costs are recognized on the date freight is delivered. Other service revenue consists primarily of rental revenues, container revenues and tank wash revenues. Rental revenues from affiliates, independent owner-operators and third parties are recognized ratably over the lease period. Container revenues, consisting primarily of repair and storage services, are recognized when the services are rendered. Tank wash revenues are recognized when the wash is completed. Service revenues on insurance policies are recorded as a contractual percentage of premiums received ratably over the period that the insurance covers. We recognize all revenues on a gross basis as the principal and primary obligor with risk of loss in relation to our responsibility for completion of services as contracted with our customers.
Allowance for uncollectible receivables—The allowance for all potentially uncollectible receivables is based on a combination of historical data, cash payment trends, specific customer issues, write-off trends, general economic conditions and other factors. These factors are continuously monitored by our management to arrive at the estimate for the amount of accounts receivable that may be ultimately uncollectible. The receivables analyzed include trade receivables, as well as loans and advances made to independent owner-operators and affiliates. If the financial condition of our customers were to deteriorate, resulting in an impairment of their ability to make payments, an additional allowance could be required.
Stock compensation plans—Stock compensation is determined by the assumptions required under the FASB guidance. The fair values of stock option grants are based upon the Black-Scholes option-pricing model and amortized as compensation expense on a straight-line basis over the vesting period of the grants. Restricted stock awards are issued and measured at market value on the date of grant and related compensation expense is recognized over time on a straight-line basis over the vesting period of the grants. Stock-based compensation expense related to stock options and restricted stock was $0.7 million and $0.4 million, respectively, for fiscal year 2009. As of December 31, 2009, there was approximately $5.2 million of total unrecognized compensation cost related to the unvested portion of our stock-based awards. The recognition period for the remaining unrecognized stock-based compensation cost generally varies from two to four years. For further discussion on stock-based compensation, see Note 18 of Notes to Consolidated Financial Statements included in Item 15 of this report.
Pension plans—We maintain two noncontributory defined-benefit plans resulting from a prior acquisition that cover certain full-time salaried employees and certain other employees under a collective bargaining agreement. Both plans are frozen and, as such, no future benefits accrue. We record annual amounts relating to these plans based on calculations specified by GAAP, which include various actuarial assumptions such as discount rates (6.25% to 6.30%) and assumed rates of return (7.00% to 8.00%) depending on the pension plan.
33
Table of Contents
Material changes in pension costs may occur in the future due to changes in these assumptions. Future annual amounts could be impacted by changes in the discount rate, changes in the expected long-term rate of return, changes in the level of contributions to the plans and other factors.
We had an accumulated net pension equity credit (after-tax) of $1.0 million at December 31, 2009 compared to a charge of $9.7 million at December 31, 2008. The equity charge in 2008 reflected the decline in our funded status as a result of significant negative asset returns during 2008.
The discount rate is based on a model portfolio of AA-rated bonds with a maturity matched to the estimated payouts of future pension benefits. The expected return on plan assets is based on our expectation of the long-term rates of return on each asset class based on the current asset mix of the funds, considering the historical returns earned on the type of assets in the funds, plus an assumption of future inflation. The current inflation assumption is 3.00%. We review our actuarial assumptions on an annual basis and make modifications to the assumptions based on current rates and trends when appropriate. The effects of the modifications are amortized over future periods.
Assumed discount rates and expected return on plan assets have a significant effect on the amounts reported for the pension plan. At December 31, 2009, our projected benefit obligation (“PBO”) was $47.3 million. Our projected 2010 net periodic pension expense is $1.9 million. A 1.0% decrease in our assumed discount rate would increase our PBO to $52.3 million and increase our 2010 net periodic pension expense less than $0.1 million. A 1.0% increase in our assumed discount rate would decrease our PBO to $43.1 million and decrease our 2010 net periodic pension expense less than $0.1 million. A 1.0% decrease in our assumed rate of return would not change our PBO but would increase our 2010 net periodic pension expense to $2.2 million. A 1.0% increase in our assumed rate of return would not change our PBO but would decrease our 2010 net periodic pension expense to $1.6 million.
Restructuring—We account for restructuring costs associated with one-time termination benefits, costs associated with lease and contract terminations and other related exit activities in accordance with the FASB’s guidance. We have made estimates of the costs to be incurred as part of our restructuring plan. During the quarter ended June 30, 2008, we committed to a plan of restructure resulting in the termination of non-driver positions and the consolidation, closure and affiliation of underperforming company terminals. We continued our plan of restructure throughout 2008 which resulted in a restructuring charge of $5.3 million, of which the majority related to our trucking segment. Our restructuring plan continued in 2009 and resulted in charges of $3.5 million, of which the majority related to our trucking segment. The charges in 2008 and 2009 related to employee termination benefits and other related exit activities, and included the termination of approximately 350 non-driver positions. We expect to conclude our restructuring plan in 2010 and to take additional related charges during the year. At December 31, 2009, $1.1 million was accrued related to the restructuring charges, which are expected to be paid through 2010.
NEW ACCOUNTING PRONOUNCEMENTS
Refer to Note 2, “Summary of Significant Accounting Policies—New Accounting Pronouncements” for discussion of recent accounting pronouncements and for additional discussion surrounding the adoption of accounting standards.
34
Table of Contents
RESULTS OF OPERATIONS
The following table sets forth for the periods indicated the percentage of total revenue represented by certain items in our Consolidated Statements of Operations:
| Year Ended December 31, | |||||||||
| 2009 | 2008 | 2007 | |||||||
| OPERATING REVENUES: |
|||||||||
| Transportation |
74.1 | % | 69.4 | % | 77.3 | % | |||
| Other service revenue |
17.1 | 12.8 | 10.1 | ||||||
| Fuel surcharge |
8.8 | 17.8 | 12.6 | ||||||
| Total operating revenues |
100.0 | 100.0 | 100.0 | ||||||
| OPERATING EXPENSES: |
|||||||||
| Purchased transportation |
60.9 | 57.3 | 62.7 | ||||||
| Compensation |
12.5 | 13.4 | 11.4 | ||||||
| Fuel, supplies and maintenance |
10.2 | 14.0 | 10.8 | ||||||
| Depreciation and amortization |
3.3 | 2.6 | 2.3 | ||||||
| Selling and administrative |
4.0 | 4.4 | 4.2 | ||||||
| Insurance costs |
2.3 | 1.8 | 3.2 | ||||||
| Taxes and licenses |
0.6 | 0.6 | 0.5 | ||||||
| Communication and utilities |
1.3 | 1.6 | 1.5 | ||||||
| Gain on sale of tank wash assets |
(1.2 | ) | — | — | |||||
| Loss (gain) on disposal of property and equipment |
0.1 | (0.4 | ) | 0.1 | |||||
| Impairment charge |
24.2 | — | — | ||||||
| Restructuring costs |
0.6 | 0.7 | — | ||||||
| Total operating expenses |
118.8 | 96.0 | 96.7 | ||||||
| Operating (loss) income |
(18.8 | ) | 4.0 | 3.3 | |||||
| Interest expense, net |
4.6 | 4.3 | 4.1 | ||||||
| Write-off of debt issuance costs |
— | — | 0.3 | ||||||
| Gain on extinguishment of debt |
(0.3 | ) | (2.0 | ) | — | ||||
| Other expense (income) |
0.3 | (0.4 | ) | 0.1 | |||||
| (Loss) income before income taxes |
(23.4 | ) | 2.1 | (1.2 | ) | ||||
| Provision for (benefit from) income taxes |
6.1 | 0.6 | (0.3 | ) | |||||
| Net (loss) income |
(29.5 | ) | 1.5 | (0.9 | ) | ||||
The following table sets forth for the periods indicated the number of terminals, tractors and trailers utilized in our business (including affiliates and independent owner-operators) as of December 31:
| 2009 | 2008 | 2007 | ||||
| Terminals |
108 | 149 | 169 | |||
| Number of Drivers |
2,591 | 3,053 | 3,486 | |||
| Trailers |
6,410 | 7,115 | 7,506 | |||
| Tractors |
2,839 | 3,224 | 3,927 | |||
| Transportation billed miles (in thousands) |
108,302 | 136,234 | 154,340 |
35
Table of Contents
YEAR ENDED DECEMBER 31, 2009 COMPARED TO YEAR ENDED DECEMBER 31, 2008
Total revenues for 2009 were $613.6 million, a decrease of $201.7 million, or 24.7%, compared to 2008 revenues. Transportation revenue decreased by $111.2 million, or 19.6%, primarily due to a decrease in linehaul revenue due to continuing softness in the housing and automotive industries and general weakening of our economy. We had a 20.0% decrease in the total number of miles driven as the average number of miles per load decreased over the prior year along with a 22.7% decrease in overall loads.
Other service revenue increased by $0.9 million, or 0.9%, compared to 2008. This increase was primarily due to $11.6 million of increased rental income from the conversion of certain company-operated terminals to affiliate terminals, offset by reductions in tank wash revenue of $8.9 million due to tank wash closures, reduced business and the sale of substantially all of our tank wash business in the fourth quarter of 2009.
Fuel surcharge revenue decreased $91.4 million, or 62.9%, primarily due to a decrease in fuel prices and a decrease in the total number of miles driven.
Purchased transportation decreased by $93.3 million, or 20.0%, due primarily to the decrease in linehaul revenue, miles driven and loads. Total purchased transportation as a percentage of transportation revenue and fuel surcharge revenue increased to 73.4% in 2009, versus 65.6% for 2008 due to the conversion of certain company-operated terminals to affiliate terminals. Our affiliates generated 72.8% of our transportation revenue and fuel surcharge revenue for 2009 compared to 50.7% for 2008. We pay our affiliates a greater percentage of transportation revenues generated by them than is paid to independent owner-operators, so our purchased transportation costs will change as revenues generated by affiliates change as a percentage of total transportation revenue. During the 2009 and 2008 periods, we paid our affiliates approximately 85% of transportation revenue and paid independent owner-operators approximately 65% of transportation revenue.
In 2009, we transitioned the majority of company-operated terminals to affiliates. These actions resulted in a larger portion of our revenue being generated by affiliates in 2009 and we expect an even larger portion to be generated by affiliates in 2010. We believe these actions will reduce certain fixed costs and provide a more variable cost structure.
Compensation expense decreased $32.2 million, or 29.5%, primarily due to $30.0 million of reduced expense from corporate headcount reductions, terminal consolidations, and conversions of company-operated terminals to affiliate terminals offset by $2.2 million increase in pension expense. In addition, we had a reduction in compensation expense of $4.7 million for QSI due to tank wash closures, reduced business, and the sale of substantially all of our tank wash business in the fourth quarter of 2009.
Fuel, supplies and maintenance decreased $51.9 million, or 45.4%, due to lower fuel costs of $26.8 million, lower repairs and maintenance expense of $17.7 million, lower equipment rent expense of $4.8 million and lower QSI expenses of $3.9 million due to tank wash closures, reduced business and the sale of substantially all of our tank wash business in the fourth quarter of 2009 offset by an increase in Boasso terminal operations.
Selling and administrative expenses decreased $11.3 million, or 31.4%, primarily due to $4.2 million reduction in building rent expense and other expenses related to closed or converted terminals. In addition, we had a decrease of $4.1 million in professional fees, $1.6 million in travel-related costs, and $1.8 million for QSI due to tank wash closures and the sale of substantially all of our tank wash business in the fourth quarter of 2009, offset by an increase in our bad debt reserve of $0.7 million.
Insurance costs decreased $0.9 million, or 5.9%, primarily due to a reduction in the number and severity of accidents that occurred during 2009.
36
Table of Contents
Communication and utilities expense decreased $4.8 million, or 37.8%, primarily due to reduced expense from terminal consolidations, conversions of company-operated terminals to affiliate terminals, tank wash closures and the sale of substantially all of our tank wash business in the fourth quarter of 2009.
Gain on sale of tank wash equipment of $7.1 million resulted from the sale of substantially all of QSI’s operating assets for $13.0 million to a third party on October 10, 2009.
Loss on disposal of property and equipment was $0.5 million in 2009 as compared to a gain of $3.1 million in 2008. The loss in 2009 resulted from the disposals of revenue equipment compared with a gain in 2008 resulting from the sale of land not used in our business.
In 2009, we recorded a non-cash impairment charge to goodwill and intangibles totaling $148.6 million as a result of our impairment analysis, which is performed at least annually every June 30 on both our trucking and container services segments. We recorded a charge of $144.3 million for the impairment of goodwill in our trucking segment. We also recorded a charge of $1.9 million for the impairment of goodwill in our container services segment and a charge of $2.4 million for the impairment of the tradename in our container services segment. Further information regarding our impairment analysis is included in “Goodwill and Intangible Assets” in our “Critical Accounting Policies and Estimates”.
We incurred restructuring costs of $3.5 million in 2009 and $5.3 million in 2008 primarily due to expenses associated with our restructuring plan which began during the second quarter of 2008. These costs consist of employee termination benefits and other related exit activities. As of December 31, 2009 we had accrued $1.1 of additional expense related to this plan. We expect to conclude our restructuring plan in 2010 and to take additional related charges during the year.
Operating loss was $115.2 million in 2009 as compared to operating income of $33.0 million in 2008. The operating margin for 2009 was (18.8%) compared to 4.0% for 2008 as a result of the above items.
Interest expense decreased by $7.2 million, or 20.3%, in 2009 compared to 2008 primarily due to a decrease in interest rates on our floating rate debt partially offset by higher interest rates following our note exchange in the fourth quarter of 2009. In addition, the outstanding principal amount of our 9% Notes was lower due to our note repurchases during 2009 and 2008, and the outstanding balance on our ABL Facility was lower. We expect our interest expense to increase in 2010 as our 2013 Senior Notes and our 2013 PIK Notes bear higher rates of interest than the notes for which they were exchanged.
In 2009, gain on debt extinguishment of $1.9 million resulted from the repurchase of $4.0 million of our 9% Notes. In 2008, gain on debt extinguishment of $16.5 million resulted from the repurchase of $24.2 million of our 9% Notes.
Other expense of $1.9 million in 2009 consists primarily of $2.3 million of costs related to refinancing activities related to our note exchanges offset by $0.4 million in foreign currency conversions. Other income of $2.9 million in 2008 resulted primarily from the settlement of an acquired pension liability of $3.4 million offset by $0.3 million in foreign currency conversion.
The provision for income taxes was $37.2 million in 2009 as compared to a provision for income taxes of $4.9 million in 2008. The effective rate for 2009 was (26.0%), which is lower than our normalized tax rate of 39.0%, in large part due to the recording of a deferred tax valuation allowance and an impairment charge.
Net loss was $180.5 million for 2009 compared with a net income of $12.1 million for 2008 for the reasons outlined above.
37
Table of Contents
YEAR ENDED DECEMBER 31, 2008 COMPARED TO YEAR ENDED DECEMBER 31, 2007
Total revenues for 2008 were $815.3 million, an increase of $63.7 million or 8.5%, compared to 2007 revenues. Transportation revenue decreased by $14.9 million or 2.6%, primarily due to a $43.0 million increase from the acquired Boasso operations offset by a $57.9 million decrease in our pre-existing business due to continuing softness in the housing and automotive industries and general weakening of our economy. We had an 11.5% decrease in the total number of miles driven as the average number of miles per load decreased over the prior year along with a 7.7% decrease in overall loads.
Other service revenue increased by $27.8 million, or 36.5%, compared to 2007. This increase was primarily due to a $30.4 million increase in revenue generated by the acquired Boasso operations.
Fuel surcharge revenue increased $50.8 million, or 53.6%, primarily due to an increase in fuel prices, and to the acquisition of Boasso, offset in part by a decrease in the total number of miles driven.
Purchased transportation decreased by $4.7 million, or 1.0%, due primarily to a reduction in our pre-existing business due to a weakened economy offset by $26.8 million of expense from the acquired Boasso operations. Total purchased transportation as a percentage of transportation revenue and fuel surcharge revenue decreased to 65.6% in 2008 versus 69.8% for the prior year due to the conversion of certain affiliate terminals to company-operated terminals. Our affiliates generated 50.7% of our transportation revenue and fuel surcharge revenue for 2008 compared to 56.7% for the prior year. We pay our affiliates a greater percentage of transportation revenues generated by them than is paid to independent owner-operators, so our purchased transportation costs will change as revenues generated by affiliates change as a percentage of total transportation revenue. During the 2008 and 2007 periods, we paid our affiliates approximately 85% of the transportation revenue and paid independent owner-operators approximately 65% of transportation revenue.
Compensation expense increased $23.3 million, or 27.1%, due primarily to $18.5 million of expense from the acquired Boasso operations. In addition, we had an increase of $6.1 million due to new or converted Company terminals added over the prior year and $0.9 million increase in healthcare costs partially offset by a reduction of approximately $2.3 million from wages and payroll taxes for positions eliminated in our plan of restructure.
Fuel, supplies and maintenance increased $33.0 million, or 40.6%, due primarily to $20.5 million of expense from the acquired Boasso operations, increased fuel costs of $11.7 million, increased equipment maintenance of $1.5 million and increased equipment lease costs of $0.6 million as we increase the capacity of our equipment.
Depreciation and amortization expense increased $3.5 million, or 19.7%, due primarily to increased depreciation and amortization from the acquired Boasso operations.
Selling and administrative expenses increased $4.5 million, or 14.5%, due primarily to $4.1 million of expense from the acquired Boasso operations. We also incurred an increase of $0.3 million in bad debt expense in 2008 due to credit adjustments in 2007 resulting from a reduction in days sales outstanding in 2007, and an increase of $0.4 million in professional fees offset by a decrease of $0.6 million of travel related costs.
Insurance claims expense decreased $8.9 million, or 37.2%, due primarily to a reduction in the number and severity of accidents that occurred during 2008 offset by an increase of $1.8 million for the acquired Boasso operations.
Gain on disposal of property and equipment was $3.1 million in 2008 as compared to a loss of $1.0 million in 2007. The gain in the current year period resulted from the sale of land not used in our business compared with a loss in the prior year resulting from the disposals of certain tank wash equipment.
38
Table of Contents
In 2008, we incurred restructuring costs of $5.3 million primarily due to employee termination benefits and costs associated with lease and contract terminations and other related exit activities related to our restructuring plan. The majority of these costs were related to our trucking operations.
Operating income increased $9.1 million, or 38.3%, compared to 2007. The operating margin for 2008 was 4.0% compared to 3.3% for 2007 as a result of the above items.
Interest expense increased by $4.2 million, or 13.4%, in 2008 compared to 2007 primarily due to interest on our new $50 million of the 2012 Notes issued in December 2007. These notes, along with our entry into a new asset-based loan facility in December 2007, were issued primarily to fund the acquisition of Boasso, and to repay a portion of the term loan under our previous credit facility. In conjunction with these notes, we are incurring increased amortization of the original issue discount related to these notes. In addition, the amortization of deferred financing costs has increased due to the refinancing of our previous revolving credit facility in December 2007.
We wrote off debt issuance costs of $0.3 million related to the partial repurchase of our 9% Notes in 2008. In 2007, we wrote off $1.2 million of debt issuance costs due to the refinancing of our previous revolving credit facility and term loan with our new asset-based loan facility and recorded a charge of $0.8 million for bridge loan commitment fees related to the Boasso acquisition in 2007.
Gain on debt extinguishment of $16.5 million resulted from the repurchase of $24.2 million of our 9% Notes.
Other income of $2.9 million in 2008 resulted primarily from the settlement of an acquired pension liability of $3.4 million offset by $0.3 million in foreign currency conversion. Other expense in 2007 contained $1.6 million of costs related to an unconsummated acquisition and refinancing activities offset by $0.7 million in foreign currency conversions.
The provision for income taxes was $4.9 million in 2008 as compared to a benefit from income taxes of $2.1 million in 2007. The effective rate for 2008 was 29.0%, which is lower than our anticipated 39.0% effective rate in large part due to recording a $1.2 million reduction to tax expense related to a pension adjustment. The Company’s effective rate would have been higher if this pension adjustment had not been recorded. This pension adjustment was related to an income item related to the release of a pension obligation that would never be subject to income tax.
Net income was $12.1 million for 2008 compared with a net loss of $7.6 million for 2007 for the reasons outlined above.
Segment Operating Results
We have two reportable business segments for financial reporting purposes that are distinguished primarily on the basis of services offered:
| • | Trucking, which consists of truckload transportation of bulk chemicals, and |
| • | Container Services, specifically ISO tank container transportation and depot services. |
Segment revenues and operating income include the allocation of fuel surcharge to the trucking and container services segments. The operating income reported in our segments excludes amounts reported in Other operating income, such as gains and losses on disposal of property and equipment, restructuring costs, impairment charge, corporate and other unallocated amounts. Corporate and unallocated amounts include depreciation and amortization and other gains and losses. Although these amounts are excluded from the business segment results, they are included in reported consolidated earnings. Included in Other revenues are revenues from our tank wash services and other value-added services. We have not provided specific asset information by segment, as it is not regularly provided to our chief operating decision maker for review.
39
Table of Contents
Summarized segment operating results are as follows (in thousands):
| Year ended December 31, | Change | ||||||||||||||||||
| 2009 | % of Total |
2008 | % of Total |
$ | % | ||||||||||||||
| Operating revenues: |
|||||||||||||||||||
| Trucking |
$ | 460,390 | 75.0 | % | $ | 653,618 | 80.2 | % | (193,228 | ) | (29.6 | )% | |||||||
| Container Services |
79,499 | 13.0 | 89,715 | 11.0 | (10,216 | ) | (11.4 | )% | |||||||||||
| Other revenue |
73,720 | 12.0 | 71,957 | 8.8 | 1,763 | 2.5 | % | ||||||||||||
| Total |
$ | 613,609 | 100.0 | % | $ | 815,290 | 100.0 | % | |||||||||||
| Operating income: |
|||||||||||||||||||
| Trucking |
$ | 35,217 | 69.7 | % | $ | 41,291 | 73.5 | % | (6,074 | ) | (14.7 | )% | |||||||
| Container Services |
11,287 | 22.4 | 10,934 | 19.5 | 353 | 3.2 | % | ||||||||||||
| Other operating income |
3,984 | 7.9 | 3,988 | 7.0 | (4 | ) | (0.1 | )% | |||||||||||
| Total |
$ | 50,488 | 100.0 | % | $ | 56,213 | 100.0 | % | |||||||||||
| Year ended December 31, | Change | ||||||||||||||||||
| 2008 | % of Total |
2007 | % of Total |
$ | % | ||||||||||||||
| Operating revenues: |
|||||||||||||||||||
| Trucking |
$ | 653,618 | 80.2 | % | $ | 666,199 | 88.6 | % | (12,581 | ) | (1.9 | )% | |||||||
| Container Services |
89,715 | 11.0 | 12,168 | 1.6 | 77,547 | 637.3 | % | ||||||||||||
| Other revenue |
71,957 | 8.8 | 73,191 | 9.8 | (1,234 | ) | (1.7 | )% | |||||||||||
| Total |
$ | 815,290 | 100.0 | % | $ | 751,558 | 100.0 | % | |||||||||||
| Operating income: |
|||||||||||||||||||
| Trucking |
$ | 41,291 | 73.5 | % | $ | 37,421 | 88.3 | % | 3,870 | 10.3 | % | ||||||||
| Container Services |
10,934 | 19.5 | (93 | ) | (0.2 | ) | 11,027 | 11,857.0 | % | ||||||||||
| Other operating income |
3,988 | 7.0 | 5,028 | 11.9 | (1,040 | ) | (20.7 | )% | |||||||||||
| Total |
$ | 56,213 | 100.0 | % | $ | 42,356 | 100.0 | % | |||||||||||
Year Ended December 31, 2009 Compared to Year Ended December 31, 2008
Operating revenue:
Trucking—revenues decreased $193.2 million, or 29.6%, for 2009 compared to 2008 due to fewer miles driven due to a weakened economy and a decrease in fuel surcharge resulting from lower fuel prices in 2009.
Container Services—revenues decreased $10.2 million, or 11.4%, for 2009 compared to 2008 due to a decrease of $6.5 million in fuel surcharge and a decrease of $3.7 million in linehaul revenue.
Other revenue—revenues increased $1.8 million, or 2.5%, for 2009 compared to 2008 due primarily to an increase of $11.6 million in rental revenue offset by a decrease of $8.9 million in our tank wash revenue.
Operating income:
Trucking—operating income decreased $6.1 million, or 14.7%, for 2009 compared to 2008 primarily due to a decrease in linehaul revenue offset by cost savings initiatives and the conversion of company-operated terminals to affiliates terminals.
Container Services—operating income increased $0.4 million, or 3.2%, for 2009 compared to 2008 due to expanded terminal operations.
40
Table of Contents
Other operating income—operating income decreased less than $0.1 million, or less than 1.0%, for 2009 compared to 2008, primarily due to reduced tank wash revenue.
Year Ended December 31, 2008 Compared to Year Ended December 31, 2007
Operating revenue:
Trucking—revenues decreased $12.6 million, or 1.9%, for 2008 compared to 2007 due to fewer miles driven due to a weakened economy partially offset by an increase in fuel surcharge resulting from increased fuel prices in 2008.
Container Services—revenues increased $77.5 million, or more than 100.0%, for 2008 compared to 2007 due to the acquired Boasso operations.
Other revenue—revenues decreased $1.2 million, or 1.7%, for 2008 compared to 2007 due primarily to a decrease in our tank wash revenue.
Operating income:
Trucking—operating income increased $3.9 million, or 10.3%, for 2008 compared to 2007 primarily due to cost savings initiatives offset by fewer billed miles and the conversion of affiliates to company terminals which increased facility, leasing, and maintenance costs.
Container Services—operating income increased $11.0 million, or more than 100.0%, for 2008 compared to 2007 due to the acquired Boasso operations.
Other operating income—operating income decreased $1.0 million, or 20.7%, for 2008 compared to 2007, primarily due to reduced tank wash revenue.
EXCHANGE RATES
We operate in Canada and Mexico as well as in the United States. Our results of operations are affected by the relative strength of currencies in the countries where we operate. Approximately 6.1%, 6.4% and 7.0% of our revenue in 2009, 2008 and 2007, respectively, was generated outside the United States.
In comparing the average exchange rates between 2009 and 2008, the Canadian dollar depreciated against the United States dollar by approximately 6.6% while the Mexican peso appreciated against the United States dollar by approximately 17.4%. The change in exchange rates negatively impacted revenue by approximately $2.7 million in 2009. The depreciation of the Canadian dollar was the primary reason for the $0.1 million net increase in cumulative currency translation loss in shareholders’ deficit for 2009.
Gains and losses included in the consolidated statements of operations from foreign currency transactions included a $0.4 million gain in 2009, a $0.3 million gain in 2008, and a $0.3 million gain in 2007. Risks associated with foreign currency fluctuations are discussed further in Item 7A. “Quantitative and Qualitative Disclosures about Market Risk.”
41
Table of Contents
LIQUIDITY AND CAPITAL RESOURCES
We believe that our liquidity, asset-light business model, and streamlined operations will enable us to weather a continued economic downturn in 2010 while providing us with the flexibility to benefit from economic improvement. Although 2009 miles driven were approximately 20.0% lower than in 2008, we still generated positive cash flow from operations. Additionally, at December 31, 2009, we had $44.7 million of borrowing availability under our asset-based loan facility (the “ABL Facility”).
The following summarizes our cash flows for fiscal years 2009, 2008 and 2007 as reported in our consolidated statements of cash flows in the accompanying consolidated financial statements:
| Year Ended December 31, | ||||||||||||
| (In Thousands) | 2009 | 2008 | 2007 | |||||||||
| Net cash provided by operating activities |
$ | 39,756 | $ | 19,593 | $ | 14,052 | ||||||
| Net cash provided by (used in) investing activities |
9,577 | (8,524 | ) | (63,399 | ) | |||||||
| Net cash (used in) provided by financing activities |
(50,515 | ) | (13,485 | ) | 52,194 | |||||||
| Effect of exchange rates |
28 | (508 | ) | 23 | ||||||||
| Net (decrease) increase in cash |
(1,154 | ) | (2,924 | ) | 2,870 | |||||||
| Cash at beginning of period |
6,787 | 9,711 | 6,841 | |||||||||
| Cash at end of period |
$ | 5,633 | $ | 6,787 | $ | 9,711 | ||||||
Historically, our primary source of liquidity has been cash flow from operations and borrowing availability under our ABL Facility. Our primary cash needs consist of working capital, capital expenditures and debt service including our ABL Facility and our notes. We incur capital expenditures for the purpose of purchasing tractors and trailers to meet our strategic needs during the year, and maintaining and improving our infrastructure. We expect capital expenditures for 2010 to be approximately $9.0 million, although the actual amount of capital expenditures could differ materially because of operating needs, regulatory changes, covenants in our debt arrangements, other expenses, including interest expense, or other factors.
In 2010, $16.0 million of our 9% Notes mature in addition to our regular payment obligations on capital leases, other notes and other indebtedness. We expect to fund payment of the maturing notes and redemption obligations under our 2013 Senior Notes through cash from operations. We expect to fund any cash needs for our operations during this period from borrowings under our ABL Facility.
During the fourth quarter of 2008, we repurchased $24.2 million in aggregate principal amount of the 9% Notes for an aggregate purchase price of $7.7 million. During the first quarter of 2009, we purchased an additional $1.0 million in aggregate principal amount of the 9% Notes for an aggregate purchase price of $0.3 million. We believe that these purchases at a substantial discount to their principal amount were a good investment for us because the prices were substantially less than the amount that we would owe for the repurchased notes upon maturity, and we had adequate liquidity for such purchases.
As described above, on October 15, 2009, we completed exchange and tender offers for our 2012 Notes and our 9% Notes. In connection with the exchange and tender offers, we received approximately $134.5 million of our 2012 Notes in exchange for $134.5 million of our new 2013 Senior Notes. We received approximately $83.6 million of our 9% Notes in exchange for approximately $80.7 million aggregate principal amount of our new 2013 PIK Notes, approximately 1.75 million warrants to purchase our common stock and $1.8 million in cash.
We have accrued $11.6 million for environmental claims and $19.4 million for loss and damage claims and the timing of the cash payment for such claims fluctuates from quarter to quarter.
42
Table of Contents
We generated $39.8 million, $19.6 million and $14.1 million in net cash from operating activities in 2009, 2008 and 2007, respectively. The increase in net cash provided by operating activities in 2009 as compared to 2008 is primarily due to increased collections of outstanding accounts receivable, lower loss and damage claim payments and lower operating expenses due to our restructuring and transition to affiliates or closure of many of our trucking terminals. The increase in net cash provided by operating activities in 2008 as compared to 2007 is primarily due to our net income for the year. We continued to experience softness in demand throughout 2009; however our continued restructuring and cost reduction efforts have enabled us to generate stronger operating cash. We have aligned our cost structure to allow for flat or declining revenues. The cash required to pay in 2010 on our higher rate 2013 Senior Notes and 2013 PIK Notes will be mitigated in part because interest equal to 2.75% payable on the 2013 PIK Notes is payable through the issuance of additional notes rather than cash.
Net cash provided by (used in) investing activities in 2009, 2008 and 2007 was $9.6 million, $(8.5) million and $(63.4) million, respectively. Capital expenditures totaled $8.2 million, $14.8 million and $10.6 million in 2009, 2008 and 2007, respectively while proceeds from sales of property and equipment were $7.5 million, $6.3 million and $6.4 million, respectively. In 2009, we received cash of $10.0 million from the sale of tank wash assets. In 2008, we used net cash of $8.4 million to purchase new revenue equipment, the assets of two businesses and the assets of one affiliate. We used net cash of $52.4 million for the acquisition of Boasso and $6.8 million of cash to purchase the assets of two businesses and the assets of six affiliates in 2007, issued notes payable for $2.4 million and assumed $2.5 million in liabilities as part of the total consideration of these acquisitions.
Net cash (used in) provided by financing activities was $(50.5) million, $(13.5) million and $52.2 million in 2009, 2008 and 2007, respectively. In 2009, we primarily utilized cash to repay $19.0 million of our borrowings under our ABL facility, $17.7 million to pay down other debt and capital lease obligations including $2.1 million used to repurchase $4.0 million of 9% Notes and to pay financing fees of $4.9 million in connection with our exchange and tender offers. In 2008, we used cash of $7.7 million to repurchase $24.2 million of our 9% Notes. In addition, we generated cash from operations and sale of properties to pay down approximately $9.0 million of our debt obligations. We utilized a portion of our ABL Facility to finance the acquisition of Boasso in 2007.
Off-Balance Sheet Arrangements
We have no off-balance sheet arrangements as defined under Item 303(a) (4) of Regulation S-K.
Contractual Obligations
The following is a schedule of our long-term contractual commitments, including the current portion of our long-term indebtedness at December 31, 2009 over the periods we expect them to be paid (dollars in thousands):
| TOTAL | Year 2010 |
Years 2011 & 2012 |
Years 2013 & 2014 |
The Five Years after 2014 | |||||||||||
| Operating leases (1) |
$ | 46,384 | $ | 15,906 | $ | 17,742 | $ | 6,538 | $ | 6,198 | |||||
| Total indebtedness (2) |
312,802 | 19,866 | 4,916 | 286,888 | 1,132 | ||||||||||
| Capital leases |
17,165 | 5,322 | 9,027 | 2,816 | — | ||||||||||
| Interest on indebtedness (3) |
98,086 | 28,591 | 54,152 | 15,261 | 82 | ||||||||||
| Total |
$ | 474,437 | $ | 69,685 | $ | 85,837 | $ | 311,503 | $ | 7,412 | |||||
| (1) | These obligations represent the minimum rental commitments under all non-cancelable operating leases. See Note 19 of the consolidated financial statements. We entered into a new lease, commencing in May 2007, for our corporate headquarters that requires us to spend $15.8 million over the term of the lease. We expect that some of our operating lease obligations for tractors will be partially offset by rental revenue from sub-leasing the tractors to independent owner-operators or affiliates. |
43
Table of Contents
| (2) | Includes aggregate unamortized discount of $8.7 million. |
| (3) | Amounts presented for interest payments assume that all long-term debt obligations outstanding as of December 31, 2009 will remain outstanding until maturity and interest rates on variable-rate debt in effect as of December 31, 2009 will remain in effect until maturity. As discussed below, the maturity date of the ABL Facility may be accelerated if we default on our obligations under the ABL Facility. |
Other Liabilities and Obligations
We have $11.6 million of environmental liabilities, $18.9 million of pension plan obligations and $19.4 million of insurance claim obligations. We expect to incur additional environmental costs in the future for environmental studies and remediation efforts that we will be required to undertake related to legacy Chemical Leaman sites. As of December 31, 2009, we had $40.0 million in outstanding letters of credit. We are required to provide letters of credit to our insurance administrator to cover the payment of claims. The outstanding letter of credit as of December 31, 2009 for our insurance administrator was $33.6 million. The remaining $6.4 million of outstanding letters of credit relate to various leasing obligations and to satisfy certain EPA requirements. If we fail to meet certain terms of our agreement, the insurance administrator may draw down the entire letter of credit. We have $1.8 million of total gross unrecognized tax benefits.
Long-term Debt
Our principal debt sources at December 31, 2009 comprise $16.0 million aggregate principal amount of 9% Senior Subordinated Notes due 2010, $0.5 million principal amount of our Senior Floating Rate Notes due 2012, $134.5 million aggregate principal amount of 10% Senior Notes due 2013, $81.2 million aggregate principal amount of 11.75% Senior Subordinated PIK Notes due 2013 and a $225 million asset-based loan facility.
The ABL Facility
The ABL Facility which was effective December 18, 2007, consists of a current asset-based revolving facility in an amount of $200.0 million (the “current asset tranche”) and a fixed asset-based revolving facility in an amount of $25.0 million (the “fixed asset tranche”). The total commitments under the fixed asset tranche will be reduced and the total commitments under the current asset tranche correspondingly increased by $5.0 million on December 18, 2010. Borrowings of revolving loans under the ABL Facility are allocated pro rata to the current asset tranche and the fixed asset tranche based on the then-current asset borrowing base and the then-current fixed asset borrowing base. The ABL Facility matures June 18, 2013. The maturity date of the ABL Facility may be accelerated if we default on our obligations under the ABL Facility.
The ABL Facility includes borrowing capacity of up to $150.0 million for letters of credit, which are allocated pro rata between the two tranches based on the then-current borrowing base for each tranche (or, if the credit extensions under the fixed asset tranche are repaid and the commitments there under are terminated prior to the termination of the ABL Facility, to the current asset tranche), and up to $10.0 million for swingline borrowings on same-day notice, which are allocated under the current asset tranche. The proceeds of the ABL Facility were used, together with the proceeds from an additional private offering of $50 million of Senior Floating Rate Notes (described below under “Senior Floating Rate Notes”), to finance a portion of the Boasso acquisition. The ABL Facility contains a fixed charge coverage ratio of 1.0 to 1.0 which only needs to be met if borrowing availability is less than $20 million. At December 31, 2009, we had $44.7 million of borrowing availability under the ABL Facility. Borrowings under the ABL Facility bear interest at a rate equal to an applicable margin plus, at our option, either a base rate or LIBOR. The applicable margin for borrowings under the current asset tranche at December 31, 2009 was 1.00% with respect to base rate borrowings and 2.00% with respect to LIBOR borrowings. The applicable margin for borrowings under the fixed asset tranche at December 31, 2009 was 1.25% with respect to base rate borrowings and 2.25% with respect to LIBOR borrowings. The applicable margin for such borrowings will be reduced or increased based on the aggregate borrowing base availability under the ABL Facility over the life of the ABL Facility. The base rate for the ABL
44
Table of Contents
Facility is the higher of the prime rate and the federal funds overnight rate plus 0.50%. We are also required to pay a fee for utilized commitments under the ABL Facility at a rate equal to 0.25% per annum. The ABL Facility is required to be prepaid only to the extent that the aggregate amount of outstanding borrowings, unreimbursed letter of credit drawings and undrawn letters of credit under the relevant tranche exceeds the lesser of the applicable commitments and the applicable borrowing base in effect at such time for such tranche. The borrowing base for the current asset tranche consists of eligible accounts receivable, eligible inventory and eligible truck and trailer fleet, and the borrowing base for the fixed asset tranche consists of eligible real property and certain eligible equipment. We may voluntarily repay outstanding loans under the ABL Facility at any time without premium or penalty, other than customary “breakage” costs with respect to LIBOR loans. The interest rate on the ABL Facility at December 31, 2009 and 2008 was 2.4% and 3.3%, respectively. The weighted average interest rate during fiscal year 2009 was 2.4%. All obligations under the ABL Facility are guaranteed by QDI and each of our wholly-owned domestic restricted subsidiaries (other than our immaterial subsidiaries). Obligations under the current asset tranche, and the guarantees of those obligations (as well as cash management obligations and any interest hedging or other swap agreements), are secured by a first priority lien on certain assets of QD LLC and the guarantors, including eligible accounts, eligible inventory and eligible truck and trailer fleet (“current asset tranche priority collateral”) and a second priority lien on all other assets of QD LLC and the guarantors, including eligible real property and certain eligible equipment (“fixed asset tranche priority collateral”). Obligations under the fixed asset tranche, and the guarantees of those obligations, are secured by a first-priority lien on fixed asset tranche priority collateral and a second priority lien on current asset tranche priority collateral.
We incurred $6.9 million in debt issuance costs relating to the ABL Facility. We are amortizing these costs over the term of the ABL Facility.
9% Senior Subordinated Notes Due 2010
On September 30, 2003, we issued $125.0 million aggregate principal amount of our 9% Notes. During the fourth quarter of 2008 and the first quarter of 2009, we repurchased $25.2 million in principal amount of the 9% Notes. On October 15, 2009, we completed exchange and tender offers to exchange approximately $80.7 million of our 9% Notes for $80.7 million aggregate principal amount of our new 2013 PIK Notes and approximately 1.75 million warrants and retired an additional $2.9 million of our 9% Notes for $1.8 million in cash. Upon the completion of the exchange and tender offer, we also amended the 9% Notes to eliminate or waive substantially all of the restrictive covenants, to eliminate certain events of default, to modify covenants regarding mergers and consolidations and modify or eliminate certain other provisions contained in the indentures governing the 9% Notes. As of December 31, 2009, approximately $16.0 million total principal amount of the 9% Notes remained outstanding.
The 9% Notes are the unsecured and senior subordinated obligations of QD LLC and QD Capital and are fully and unconditionally guaranteed on an unsecured and senior subordinated basis, jointly and severally, by QDI and certain of its U.S. restricted subsidiaries. We have the right to redeem the 9% Notes in whole or in part from time to time at 100% of the principal amount plus accrued and unpaid interest if any, to the date of redemption. The 9% Notes will mature on November 15, 2010. Interest on the 9% Notes is payable at the rate of 9% per annum and is payable semi-annually in cash on each May 15 and November 15.
We incurred $5.5 million in debt issuance costs relating to the issuance of the 9% Notes. During 2008 and 2009, we wrote-off approximately $0.3 million in debt issuance costs relating to repurchases of 9% Notes. Additionally $0.5 million of unamortized debt issuance costs relating to the 9% Notes are included in debt issuance costs related to the 2013 PIK Notes following their exchange for the 9% Notes. We are amortizing the remaining $0.1 million of debt issuance costs over the remaining term of the 9% Notes.
Senior Floating Rate Notes Due 2012
On January 28, 2005, we issued $85.0 million aggregate principal amount of our 2012 Notes. On December 18, 2007, we issued a second series of 2012 Notes in the original principal amount of $50.0 million. On October 15, 2009, we completed exchange and tender offers to exchange approximately $134.5 million of
45
Table of Contents
2012 Notes for $134.5 million of our 2013 Senior Notes. Upon the completion of the exchange offer, we amended the 2012 Notes to eliminate or waive substantially all of the restrictive covenants, to eliminate certain events of default, to modify covenants regarding mergers and consolidations and modify or eliminate certain other provisions contained in the indentures governing the 2012 Notes. As of December 31, 2009, approximately $0.5 million total principal amount of the 2012 Notes remained outstanding.
The 2012 Notes are the unsecured and unsubordinated obligations of QD LLC and QD Capital and are fully and unconditionally guaranteed on an unsecured and unsubordinated basis, jointly and severally, by QDI and certain of its U.S. restricted subsidiaries. We may redeem all or any portion of the 2012 Notes upon not less than 30, nor more than 60, days’ notice at 100% of the principal amount plus accrued and unpaid interest if any, to the date of redemption. The 2012 Notes will mature on January 15, 2012. Interest on the 2012 Notes is payable quarterly in cash in arrears on each January 15, April 15, July 15 and October 15. The interest rate on the 2012 Notes at December 31, 2009 and 2008 was 4.8% and 9.3%, respectively. The weighted average interest rate during fiscal year 2009 and 2008 was 5.3% and 8.4%, respectively.
We incurred $2.5 million in debt issuance costs relating to the initial $85.0 million of the 2012 Notes and $2.3 million related to the second $50.0 million of the 2012 Notes. All of these unamortized debt issuance costs are included in debt issuance costs related to the 2013 Senior Notes in connection with the exchange offer.
10% Senior Notes Due 2013
On October 15, 2009, we issued approximately $134.5 million aggregate principal amount of our 2013 Senior Notes. The 2013 Senior Notes are the unsecured and unsubordinated obligations of QD LLC and QD Capital and are fully and unconditionally guaranteed on an unsecured and unsubordinated basis, jointly and severally, by QDI and certain of our U.S. restricted subsidiaries.
In connection with the issuance of the 2013 Senior Notes, we have agreed pursuant to a registration rights agreement to file a registration statement, relating to an offer to exchange the 2013 Senior Notes for new debt securities which are substantially identical in all material respects, by February 12, 2010, and to use our commercially reasonable efforts to cause the registration statement to be declared effective by the SEC by April 13, 2010. The registration statement was filed pursuant to these obligations on December 18, 2009. If the registration statement is not declared effective by the SEC by April 13, 2010 or if we do not consummate the exchange offer by May 23, 2010, we will be required to pay additional interest.
Interest on the 2013 Senior Notes is payable at a rate of 10% per annum, semiannually on June 1 and December 1 of each year, commencing on June 1, 2010. The 2013 Senior Notes mature on June 1, 2013.
We may redeem the 2013 Senior Notes, in whole or part, at any time at a price equal to 100% of the principal amount of the 2013 Senior Notes redeemed plus accrued and unpaid interest to the redemption date. Subject to certain conditions, we are obligated to redeem $6.0 million of 2013 Senior Notes on each June 1 and December 1, commencing December 1, 2010. Beginning in 2011, promptly following the delivery of our Annual Report on Form 10-K for each fiscal year, the 2013 Senior Notes are subject to additional mandatory redemption in an amount equal to 50% of the excess cash flow we generate minus $12.0 million. Both required redemption amounts will be reduced to the extent necessary so that:
| • | the sum of borrowing availability under the ABL Facility, plus unrestricted cash and cash equivalents, is at least $37.5 million; |
| • | the minimum borrowing availability requirements under the ABL Facility are satisfied; |
| • | there is fixed charge coverage ratio of at least 1.0 to 1.0 as calculated under the ABL Facility; and |
| • | no other event of default is otherwise caused under the ABL Facility by the redemption. |
The required redemption amounts are also reduced by any optional redemptions and repurchases during the redemption period.
46
Table of Contents
We recorded $3.6 million in debt issuance costs relating to the 2013 Senior Notes, of which $2.0 million of unamortized debt issuance costs related to the 2012 Notes and $1.6 million was related to the new issuance. We are amortizing these costs over the remaining term of the 2013 Senior Notes.
11.75% Senior Subordinated PIK Notes Due 2013
On October 15, 2009, we issued $80.7 million aggregate principal amount of our 2013 PIK Notes. The 2013 PIK Notes are the unsecured and senior subordinated obligations of QD LLC and QD Capital and are fully and unconditionally guaranteed on an unsecured and senior subordinated basis, jointly and severally, by QDI and certain of our U.S. restricted subsidiaries.
In connection with the issuance of the 2013 PIK Notes, we have agreed pursuant to registration rights agreements to file a registration statement, relating to an offer to exchange the 2013 PIK Notes for new debt securities which are substantially identical in all material respects by February 12, 2010 and to use our commercially reasonable efforts to cause the registration statement to be declared effective by the SEC by April 13, 2010. The registration statement was filed pursuant to these obligations on December 18, 2009. If the registration statement is not declared effective by the SEC by April 13, 2010 or if we do not consummate the exchange offer by May 23, 2010, we will be required to pay additional interest.
Interest is payable on the 2013 PIK Notes at 11.75% per annum, payable 9% in cash and 2.75% in the form of additional 2013 PIK Notes, quarterly on February 1, May 1, August 1 and November 1 of each year, commencing on February 1, 2010.
The 2013 PIK Notes mature on November 1, 2013. We may redeem the 2013 PIK Notes, in whole or part, at any time prior to October 15, 2010, at a price equal to 100% of the principal amount of the 2013 PIK Notes redeemed plus accrued and unpaid interest to the redemption date plus an additional “make-whole premium.” After October 15, 2010, we may redeem the Subordinated Notes, in whole or part, at any time at a price equal to 100% of the principal amount of the Subordinated Notes redeemed plus accrued and unpaid interest to the redemption date. Additionally, at any time prior to October 15, 2010, we may redeem up to 35% of the principal amount of the 2013 PIK Notes at a redemption premium equal to 11.75% of the face amount thereof with the net proceeds of one or more equity offerings so long as at least 65% of the aggregate original principal amount of the 2013 PIK Notes remains outstanding afterwards.
We recorded $1.5 million in debt issuance costs relating to the 2013 PIK Notes, of which $0.5 million of unamortized debt issuance costs related to the 9% Notes and $1.0 million were related to the new issuance. In addition, we recorded $6.7 million in note issuance discount due to the warrants issued. The amount represents the fair market value of the warrants at time of issuance. We are amortizing these costs over the remaining term of the 2013 PIK Notes.
The note exchanges described above were treated as a debt modification in accordance with applicable FASB guidance.
Boasso Note
The Boasso Note was a $2.5 million 7% promissory note with a maturity on December 18, 2009 issued as part of the purchase price of the Boasso acquisition. The holder of the Boasso Note had the option to require prepayment of the Boasso note, which he exercised on December 18, 2008. The Boasso Note was paid in full in January 2009.
Collateral, Guarantees and Covenants
The ABL Facility contains a number of covenants that, among other things, restrict, subject to certain exceptions, our ability to (i) sell assets; (ii) incur additional indebtedness; (iii) prepay other indebtedness (including the 2013 Senior Notes, the 2012 Notes, the 2013 PIK Notes and the 9% Notes); (iv) repurchase or pay dividends on QDI’s common stock; (v) create liens on assets; (vi) make investments; (vii) make certain
47
Table of Contents
acquisitions; (viii) engage in mergers or consolidations; (ix) engage in certain transactions with affiliates; (x) amend certain charter documents and material agreements governing subordinated indebtedness, including the 2013 Senior Notes, the 2012 Notes, the 2013 PIK Notes and the 9% Notes; (xi) change the business conducted by us and our subsidiaries; and (xii) enter into agreements that restrict dividends from subsidiaries. The ABL Facility also contains certain customary events of default, which, if any of them occurs, may result in the principal, interest and any other monetary obligations under the ABL Facility becoming immediately payable.
The indentures governing our 2013 Senior Notes and our 2013 PIK Notes contain covenants that restrict, subject to certain exceptions, our ability to, among other things: (i) incur additional debt or issue certain preferred shares; (ii) pay dividends on or make other distributions in respect of QDI’s common stock or make other restricted payments; (iii) make certain investments; (iv) sell certain assets; (v) create or permit to exist dividend and/or payment restrictions affecting their restricted subsidiaries; (vi) create liens on certain assets to secure debt; (vii) consolidate, merge, sell or otherwise dispose of all or substantially all of their assets; (viii) enter into certain transactions with their affiliates; and (ix) designate their subsidiaries as unrestricted subsidiaries. The indentures also provide certain customary events of default, which, if any of them occurs, may result in the principal, interest and any other monetary obligations on the then outstanding 2013 Senior Notes and 2013 PIK Notes becoming payable immediately.
The payment obligations under the ABL Facility are senior secured obligations of QD LLC and QD Capital and are secured by certain assets and its subsidiaries. The payment obligations of QD LLC and QD Capital under the 9% Notes, the 2012 Notes, the 2013 Senior Notes and the 2013 PIK Notes are guaranteed by QDI, and by all of its domestic subsidiaries. The 9% Notes and the 2013 PIK Notes, and the guarantees thereof are senior subordinated unsecured obligations ranking junior in right of payment to all of our existing and future senior debt, and all liabilities of our subsidiaries that do not guarantee the 9% Notes the 2013 PIK Notes, as applicable. All of the notes are effectively junior to all of our existing and future secured debt, including borrowings under the ABL Facility, to the extent of the value of the assets securing such debt.
We were in compliance with the covenants under the ABL Facility, the 2013 Senior Notes and the 2013 PIK Notes at December 31, 2009.
Debt Retirement
The following is a schedule of our indebtedness at December 31, 2009 over the periods we are required to pay such indebtedness (in thousands):
| 2010 | 2011 | 2012 | 2013 | 2014 and after |
Total | |||||||||||||
| Capital lease obligations |
$ | 5,322 | $ | 4,279 | $ | 4,748 | $ | 2,253 | $ | 563 | $ | 17,165 | ||||||
| ABL Facility |
— | — | — | 68,000 | — | 68,000 | ||||||||||||
| 9% Senior Subordinated Notes, due 2010 |
16,031 | — | — | — | — | 16,031 | ||||||||||||
| Senior Floating Rate Notes, due 2012 |
— | — | 501 | — | — | 501 | ||||||||||||
| 10% Senior Notes, due 2013 (1) |
— | — | — | 134,499 | — | 134,499 | ||||||||||||
| 11.75% Senior Subordinated PIK Notes, due 2013 (1) |
— | — | — | 81,211 | — | 81,211 | ||||||||||||
| Other Notes |
3,835 | 2,311 | 2,104 | 2,231 | 2,079 | 12,560 | ||||||||||||
| Total |
$ | 25,188 | $ | 6,590 | $ | 7,353 | $ | 288,194 | $ | 2,642 | $ | 329,967 | ||||||
| (1) | Amounts do not include the remaining aggregate unamortized original issue discount of $8.7 million. |
48
Table of Contents
The following table represents our debt issuance costs at December 31, 2009 and 2008 (in thousands):
| 2008 | Write-off of Issuance Costs |
Additional Debt Issuance Costs |
Transfer Related to Exchange Offers |
Current year amortization expense |
2009 | ||||||||||||||||
| ABL Facility |
$ | 5,552 | $ | — | $ | — | $ | — | $ | (1,268 | ) | $ | 4,284 | ||||||||
| 9% Senior Subordinated Notes, due 2010 |
1,150 | (20 | ) | — | (537 | ) | (524 | ) | 69 | ||||||||||||
| Senior Floating Rate Notes, due 2012 |
2,794 | — | — | (2,059 | ) | (735 | ) | — | |||||||||||||
| 10% Senior Notes, due 2013 |
— | — | 1,584 | 2,059 | (218 | ) | 3,425 | ||||||||||||||
| 11.75% Senior Subordinated PIK Notes, due 2013 |
— | — | 970 | 537 | (81 | ) | 1,426 | ||||||||||||||
| Total |
$ | 9,496 | $ | (20 | ) | $ | 2,554 | $ | — | $ | (2,826 | ) | $ | 9,204 | |||||||
Amortization expense of deferred issuance costs was $2.8 million, $3.0 million, and $1.9 million for years ending December 31, 2009, 2008, and 2007, respectively. We are amortizing these costs over the term of the debt instruments.
Liquidity
We believe that, based on current operations and anticipated growth, our cash flow from operations, together with available sources of liquidity, including borrowings under the ABL Facility, will be sufficient to fund anticipated capital expenditures, make required payments of principal and interest on our debt, including obligations under our credit agreement, and satisfy other long-term contractual commitments for the next twelve months.
However, for periods extending beyond twelve months, if our operating cash flow and borrowings under the ABL Facility are not sufficient to satisfy our capital expenditures, debt service and other long-term contractual commitments, we would be required to seek alternative financing. These alternatives would likely include another restructuring or refinancing of our long-term debt, the sale of a portion or all of our assets or operations, or the sale of additional debt or equity securities. If these alternatives were not available in a timely manner or on satisfactory terms, or were not permitted under any of our debt agreements and we default on our obligations, our indebtedness could be accelerated and our assets might not be sufficient to repay in full all of our indebtedness.
Other Issues
While uncertainties relating to environmental, labor and other regulatory matters exist within the trucking industry, management is not aware of any trends or events likely to have a material adverse effect on liquidity or the accompanying financial statements. Our credit rating is affected by many factors, including our financial results, operating cash flows and total indebtedness.
The ABL Facility and the indentures governing our 2013 Senior Notes and our 2013 PIK Notes contain certain limitations on QD LLC’s ability to make distributions to QDI. We do not consider these restrictions to be significant, because QDI is a holding company with no significant operations or assets, other than ownership of 100% of QD LLC’s membership units. QD LLC’s direct and indirect wholly owned subsidiaries are generally permitted to make distributions to QD LLC, which is the principal obligor under the ABL Facility, the 9% Notes, the 2012 Notes, the 2013 Senior Notes and the 2013 PIK Notes.
49
Table of Contents
Apollo as our controlling shareholder may have an interest in pursuing reorganizations, restructurings or other transactions involving us that, in their judgment, could enhance their equity investment even though those transactions might involve increasing QD LLC’s leverage or impairing QD LLC’s creditworthiness in order to decrease QDI’s leverage. While the restrictions in our ABL Facility cover a wide variety of arrangements that have traditionally been used to effect highly leveraged transactions, the ABL Facility and the indentures governing our 2013 Senior Notes and our 2013 PIK Notes may not afford the holders of our debt protection in all circumstances from the adverse aspects of a highly leveraged transaction, reorganization, restructuring, merger or similar transaction.
ITEM 7A. QUANTITATIVE AND QUALITATIVE DISCLOSURES ABOUT MARKET RISK
We are subject to market risks from (i) interest rates due to our variable interest rate indebtedness, (ii) foreign currency fluctuations due to our international operations and (iii) increased commodity prices due to the diesel consumption necessary for our operations. During the last three years, we have not held derivative instruments or engaged in other hedging transactions to reduce our exposure to such risks.
Interest Rate Risk
We are exposed to the impact of interest rate changes through our variable-rate borrowings under the ABL Facility and the 2012 Notes. With regard to the ABL Facility at QD LLC’s option, the applicable margin for borrowings under the current asset tranche at December 31, 2009 was 1.00% with respect to base rate borrowings and 2.00% with respect to LIBOR borrowings. The applicable margin for borrowings under the fixed asset tranche at December 31, 2009 was 1.25% with respect to base rate borrowings and 2.25% with respect to LIBOR borrowings. The applicable margin for such borrowings will be reduced or increased based on aggregate borrowing base availability under the ABL Facility over the life of the ABL Facility. The base rate under the ABL Facility is equal to the higher of the prime rate and the federal funds overnight rate plus 0.50%. The base rate for our 2012 Notes is LIBOR plus 4.50%.
| Balance at December 31, 2009 |
Interest Rate at December 31, 2009 |
Effect of 1% Increase | |||||||
| ($ in 000s) | ($ in 000s) | ||||||||
| ABL Facility |
$ | 68,000 | 2.36 | % | $ | 680 | |||
| Senior Floating Rate Notes, due 2012 |
501 | 4.78 | % | 5 | |||||
| Total |
$ | 68,501 | $ | 685 | |||||
At December 31, 2009, a 1% point increase in the current per annum interest rate for each would result in $0.7 million of additional interest expense during the next year. The foregoing calculation assumes an instantaneous one percentage point increase in the rates of all of our indebtedness and that the principal amount of each is the amount outstanding as of December 31, 2009. The calculation therefore does not account for the differences in the market rates upon which the interest rates of our indebtedness are based, our various options to elect the lower of two different interest rates under our borrowings or other possible actions, such as prepayment, that we might take in response to any rate increase.
We reduced our exposure to variable borrowings on October 15, 2009, when we exchanged substantially all of our floating rate 2012 Notes for our fixed rate 2013 Senior Notes.
Foreign Currency Exchange Rate Risk
Operating in international markets involves exposure to the possibility of volatile movements in foreign exchange rates. The currencies in each of the countries in which we operate affect:
| • | the results of our international operations reported in United States dollars; and |
| • | the value of the net assets of our international operations reported in United States dollars. |
50
Table of Contents
These exposures may impact future earnings or cash flows. Revenue from foreign locations (Canada and Mexico) represented approximately 6.1% of our consolidated revenue in 2009 and 6.4% of our consolidated revenue in 2008. The economic impact of foreign exchange rate movements is complex because such changes are often linked to variability in real growth, inflation, interest rates, governmental actions and other factors. These changes, if material, could cause us to adjust our financing and operating strategies. Therefore, to isolate the effect of changes in currency does not accurately portray the effect of these other important economic factors. As foreign exchange rates change, translation of the income statements of our international subsidiaries into U.S. dollars affects year-over-year comparability of operating results. While we may hedge specific transaction risks, we generally do not hedge translation risks because we believe there is no long-term economic benefit in doing so.
Assets and liabilities for our Canadian operations are matched in the local currency, which reduces the need for dollar conversion. Our Mexican operations use the United States dollar as their functional currency. Any foreign currency impact on translating assets and liabilities into dollars is included as a component of shareholders’ equity. Our revenue results for 2009 were negatively impacted by a $2.7 million foreign currency movement, primarily due to the weakening of the Canadian dollar against the United States dollar.
Changes in foreign exchange rates that had the largest impact on translating our international operating profits for 2009 related to the Canadian dollar versus the United States dollar. We estimate that a 1% adverse change in the Canadian dollar foreign exchange rate would have increased our revenues by approximately $0.4 million in 2009, assuming no changes other than the exchange rate itself. Our inter-company loans are subject to fluctuations in exchange rates primarily between the United States dollar and the Canadian dollar. Based on the outstanding balance of our inter-company loans at December 31, 2009, a change of 1% in the exchange rate for the Canadian dollar would cause a change in our foreign exchange result of less than $0.1 million.
Commodity Price Risk
The price and availability of diesel fuel are subject to fluctuations due to changes in the level of global oil production, seasonality, weather, global politics and other market factors. Historically, we have been able to recover a majority of fuel price increases from our customers in the form of fuel surcharges. The price and availability of diesel fuel can be unpredictable as well as the extent to which fuel surcharges can be collected to offset such increases. In 2009 and 2008, a majority of fuel costs were covered through fuel surcharges.
| ITEM 8. | FINANCIAL STATEMENTS AND SUPPLEMENTARY DATA |
Financial statements and exhibits filed under this item are listed in the index appearing in Item 15 of this report.
| ITEM 9. | CHANGES IN AND DISAGREEMENTS WITH ACCOUNTANTS ON ACCOUNTING AND FINANCIAL DISCLOSURE |
None.
| ITEM 9A. | CONTROLS AND PROCEDURES |
Attached as exhibits to this Form 10-K are certifications of our Chief Executive Officer and Chief Financial Officer, which are required in accordance with Rule 13a-14 of the Securities Exchange Act. This “Controls and Procedures” section includes information concerning the controls and controls evaluation referred to in the certifications.
51
Table of Contents
Evaluation of Disclosure Controls and Procedures
As required by Exchange Act Rules 13a-15(b) and 15d-15(b), management has evaluated, with the participation of our Chief Executive Officer and Chief Financial Officer, the effectiveness of our disclosure controls and procedures as of the end of the period covered by this report. Based on their evaluation, management concluded our disclosure controls and procedures (as defined in Securities Exchange Act Rules 13a-15(e) and 15d-15(e)) were effective as of December 31, 2009 to ensure that information required to be disclosed by us in reports that we file or submit under the Securities Exchange Act is recorded, processed, summarized and reported within the time periods specified in Securities and Exchange Commission rules and forms and were effective as of December 31, 2009 to ensure that information required to be disclosed by us in the reports that we file or submit under the Securities Exchange Act is accumulated and communicated to management, including our Chief Executive Officer and Chief Financial Officer, or persons performing similar functions, as appropriate, to allow timely decisions regarding required disclosure.
Management’s Report on Internal Control over Financial Reporting
Management is responsible for establishing and maintaining adequate internal control over financial reporting, as such term is defined in Exchange Act Rules 13a-15(e) and 15d-15(e). Our internal control over financial reporting is a process designed under the supervision of the Chief Executive Officer and Chief Financial Officer and effected by the Board of Directors and management, to provide reasonable assurance regarding the reliability of financial reporting and the preparation of consolidated financial statements for external purposes in accordance with accounting principles generally accepted in the United States of America. Our internal control over financial reporting includes those policies and procedures that (i) pertain to the maintenance of records that, in reasonable detail, accurately and fairly reflect the transactions and dispositions of the assets of the company; (ii) provide reasonable assurance that transactions are recorded as necessary to permit preparation of financial statements in accordance with generally accepted accounting principles, and that receipts and expenditures of the company are being made only in accordance with authorizations of management and directors of the company; and (iii) provide reasonable assurance regarding prevention or timely detection of unauthorized acquisition, use, or disposition of the company’s assets that could have a material effect on the financial statements.
Because of its inherent limitations, internal control over financial reporting may not prevent or detect misstatements. Also, projections of any evaluation of effectiveness to future periods are subject to the risk that controls may become inadequate because of changes in conditions, or that the degree of compliance with the policies or procedures may deteriorate.
Management has assessed the effectiveness of our internal control over financial reporting as of December 31, 2009, using the criteria established in Internal Control—Integrated Framework issued by the Committee of Sponsoring Organizations of the Treadway Commission. Based on that assessment and those criteria, management has determined that our internal control over financial reporting was effective as of December 31, 2009.
PricewaterhouseCoopers LLP, our independent registered public accounting firm, has audited the effectiveness of the Company’s internal controls over financial reporting as of December 31, 2009, as stated in their report which is included herein.
Changes in Internal Control over Financial Reporting
There were no changes in our internal control over financial reporting during the quarter ended December 31, 2009 that have materially affected, or are reasonably likely to materially affect, our internal control over financial reporting.
| ITEM 9B. | OTHER INFORMATION |
Not applicable.
52
Table of Contents
| ITEM 10. | DIRECTORS, EXECUTIVE OFFICERS AND CORPORATE GOVERNANCE |
Information with respect to the directors, the Audit Committee of the Board of Directors, the Nomination Committee of the Board of Directors (known as the Corporate Governance Committee), and the Audit Committee financial expert, will be contained in our 2010 Proxy Statement. The 2010 Proxy Statement is expected to be filed on or about April 22, 2010. Such information is incorporated herein by reference.
Information with respect to our executive officers who are not directors is located in Part I, Item 4 of this report.
Code of Ethics
We have adopted a Code of Conduct, which is applicable to all of our directors and employees, including our principal executive officer, our principal financial officer and our controller. A copy of the Code of Conduct can be found on our website at www.qualitydistribution.com. Any possible future amendments to or waivers from the Code of Conduct will be posted on our website.
Section 16(a) Beneficial Ownership Reporting Compliance
Information regarding compliance with Section 16(a) of the Exchange Act is set forth under the heading “Section 16(a) Beneficial Ownership Reporting Compliance” will be in our 2010 Proxy Statement and is incorporated herein by reference.
| ITEM 11. | EXECUTIVE COMPENSATION |
For information regarding our Executive Compensation, Compensation Committee Interlocks and Insider Participation, and our Compensation Committee Report, we direct you to the section entitled “Executive Compensation,” and “Report of the Executive Compensation Committee” that will be in the 2010 Proxy Statement. We are incorporating the information contained in that section of our Proxy Statement here by reference.
| ITEM 12. | SECURITY OWNERSHIP OF CERTAIN BENEFICIAL OWNERS AND MANAGEMENT AND RELATED STOCKHOLDER MATTERS |
Information regarding the security ownership of certain beneficial owners and management and related shareholder matters and equity compensation plans will be set forth under the heading “Security Ownership of Certain Beneficial Owners and Management and Related Shareholder Matters” and “Equity Compensation Plan Information” in our 2010 Proxy Statement and is incorporated herein by reference.
| ITEM 13. | CERTAIN RELATIONSHIPS AND RELATED TRANSACTIONS AND DIRECTOR INDEPENDENCE |
The information required by this item will be incorporated by reference in our 2010 Proxy Statement under the headings “Certain Relationships and Related Party Transactions” and “Corporate Governance”.
| ITEM 14. | PRINCIPAL ACCOUNTANT FEES AND SERVICES |
The information appearing in our 2010 Proxy Statement under the headings “Report of the Audit Committee of the Board of Directors,” “Appointment of the Independent Registered Certified Public Accounting Firm” and “Fees Paid to the Independent Registered Certified Public Accounting Firm in 2008 and 2009” is incorporated by reference.
53
Table of Contents
| ITEM 15. | EXHIBITS, FINANCIAL STATEMENT SCHEDULES |
| (a) | The documents filed as part of this report are as follows: |
1. The consolidated financial statements and accompanying report of independent certified public accountants are listed in the Index to Financial Statements and are filed as part of this report.
All consolidated financial statement schedules are omitted because they are inapplicable, not required or the information is included elsewhere in the consolidated financial statements or the notes thereto.
2. Exhibits required by Item 601 of Regulation S-K are submitted as a separate section herein immediately following the “Exhibit Index”.
| (b) | Other Exhibits |
No exhibits in addition to those previously filed or listed in item 15(a) (2) and filed herein.
| (c) | Not Applicable |
54
Table of Contents
Pursuant to the requirements of Section 13 or 15(d) of the Securities Exchange Act of 1934, the registrant has duly caused this report to be signed on its behalf by the undersigned, thereunto duly authorized.
| QUALITY DISTRIBUTION, INC. | ||||
| March 12, 2010 | /s/ GARY R. ENZOR | |||
| GARY R. ENZOR PRESIDENT AND CHIEF EXECUTIVE OFFICER (DULY AUTHORIZED OFFICER) | ||||
Pursuant to the requirements of the Securities Exchange Act of 1934, this report has been signed below by the following persons on behalf of the Registrant and in the capacities and on the dates indicated.
| DATE |
SIGNATURE |
TITLE | ||
| March 12, 2010 |
/s/ Gary R. Enzor Gary R. Enzor |
President, Chief Executive Officer, and Director (Principal Executive Officer) | ||
| March 12, 2010 |
/s/ Stephen R. Attwood Stephen R. Attwood |
Senior Vice President and Chief Financial Officer (Principal Financial and Accounting Officer) | ||
| March 12, 2010 |
* Thomas M. White |
Director and Chairman of the Board | ||
| March 12, 2010 |
* Marc E. Becker |
Director | ||
| March 12, 2010 |
* Kevin E. Crowe |
Director | ||
| March 12, 2010 |
* Richard B. Marchese |
Director | ||
| March 12, 2010 |
* Thomas R. Miklich |
Director | ||
| March 12, 2010 |
* M. Ali Rashid |
Director | ||
| March 12, 2010 |
* Alan H. Schumacher |
Director | ||
| *By: | /s/ Gary R. Enzor | |
| Gary R. Enzor | ||
| Attorney-in-fact | ||
55
Table of Contents
QUALITY DISTRIBUTION, INC. AND SUBSIDIARIES
INDEX TO CONSOLIDATED FINANCIAL STATEMENTS
F-1
Table of Contents
REPORT OF INDEPENDENT REGISTERED CERTIFIED PUBLIC ACCOUNTING FIRM
To: Board of Directors and shareholders of Quality Distribution, Inc.
In our opinion, the accompanying consolidated balance sheets and the related consolidated statements of operations, of shareholders’ equity (deficit) and comprehensive income (loss) and of cash flows present fairly, in all material respects, the financial position of Quality Distribution, Inc. and its subsidiaries at December 31, 2009 and December 31, 2008, and the results of their operations and their cash flows for each of the three years in the period ended December 31, 2009 in conformity with accounting principles generally accepted in the United States of America. Also in our opinion, the Company maintained, in all material respects, effective internal control over financial reporting as of December 31, 2009, based on criteria established in Internal Control—Integrated Framework issued by the Committee of Sponsoring Organizations of the Treadway Commission (COSO). The Company’s management is responsible for these financial statements, for maintaining effective internal control over financial reporting and for its assessment of the effectiveness of internal control over financial reporting, included in Management’s Report on Internal Control over Financial Reporting. Our responsibility is to express opinions on these financial statements and on the Company’s internal control over financial reporting based on our integrated audits. We conducted our audits in accordance with the standards of the Public Company Accounting Oversight Board (United States). Those standards require that we plan and perform the audits to obtain reasonable assurance about whether the financial statements are free of material misstatement and whether effective internal control over financial reporting was maintained in all material respects. Our audits of the financial statements included examining, on a test basis, evidence supporting the amounts and disclosures in the financial statements, assessing the accounting principles used and significant estimates made by management, and evaluating the overall financial statement presentation. Our audit of internal control over financial reporting included obtaining an understanding of internal control over financial reporting, assessing the risk that a material weakness exists, and testing and evaluating the design and operating effectiveness of internal control based on the assessed risk. Our audits also included performing such other procedures as we considered necessary in the circumstances. We believe that our audits provide a reasonable basis for our opinions.
A company’s internal control over financial reporting is a process designed to provide reasonable assurance regarding the reliability of financial reporting and the preparation of financial statements for external purposes in accordance with generally accepted accounting principles. A company’s internal control over financial reporting includes those policies and procedures that (i) pertain to the maintenance of records that, in reasonable detail, accurately and fairly reflect the transactions and dispositions of the assets of the company; (ii) provide reasonable assurance that transactions are recorded as necessary to permit preparation of financial statements in accordance with generally accepted accounting principles, and that receipts and expenditures of the company are being made only in accordance with authorizations of management and directors of the company; and (iii) provide reasonable assurance regarding prevention or timely detection of unauthorized acquisition, use, or disposition of the company’s assets that could have a material effect on the financial statements.
Because of its inherent limitations, internal control over financial reporting may not prevent or detect misstatements. Also, projections of any evaluation of effectiveness to future periods are subject to the risk that controls may become inadequate because of changes in conditions, or that the degree of compliance with the policies or procedures may deteriorate.
PricewaterhouseCoopers LLP
Tampa, Florida
March 12, 2010
F-2
Table of Contents
QUALITY DISTRIBUTION, INC. AND SUBSIDIARIES
CONSOLIDATED STATEMENTS OF OPERATIONS
For the Years Ended December 31, 2009, 2008 and 2007
(In thousands) Except Per Share Data
| Years ended December 31, | ||||||||||||
| 2009 | 2008 | 2007 | ||||||||||
| OPERATING REVENUES: |
||||||||||||
| Transportation |
$ | 454,658 | $ | 565,814 | $ | 580,676 | ||||||
| Other service revenue |
104,954 | 104,039 | 76,221 | |||||||||
| Fuel surcharge |
53,997 | 145,437 | 94,661 | |||||||||
| Total operating revenues |
613,609 | 815,290 | 751,558 | |||||||||
| OPERATING EXPENSES: |
||||||||||||
| Purchased transportation |
373,539 | 466,823 | 471,531 | |||||||||
| Compensation |
76,955 | 109,110 | 85,820 | |||||||||
| Fuel, supplies and maintenance |
62,448 | 114,351 | 81,316 | |||||||||
| Depreciation and amortization |
20,218 | 21,002 | 17,544 | |||||||||
| Selling and administrative |
24,572 | 35,836 | 31,291 | |||||||||
| Insurance costs |
14,119 | 14,999 | 23,883 | |||||||||
| Taxes and licenses |
3,578 | 5,242 | 3,980 | |||||||||
| Communication and utilities |
7,910 | 12,716 | 11,381 | |||||||||
| Gain on sale of tank wash assets |
(7,130 | ) | — | — | ||||||||
| Loss (gain) on disposal of property and equipment |
450 | (3,092 | ) | 959 | ||||||||
| Impairment charge |
148,630 | — | — | |||||||||
| Restructuring costs |
3,496 | 5,325 | — | |||||||||
| Total operating expenses |
728,785 | 782,312 | 727,705 | |||||||||
| Operating (loss) income |
(115,176 | ) | 32,978 | 23,853 | ||||||||
| Interest expense |
28,335 | 35,546 | 31,342 | |||||||||
| Interest income |
(288 | ) | (426 | ) | (818 | ) | ||||||
| Write-off of debt issuance costs |
20 | 283 | 2,031 | |||||||||
| Gain on extinguishment of debt |
(1,870 | ) | (16,532 | ) | — | |||||||
| Other expense (income) |
1,912 | (2,945 | ) | 940 | ||||||||
| (Loss) income before income taxes |
(143,285 | ) | 17,052 | (9,642 | ) | |||||||
| Provision for (benefit from) income taxes |
37,249 | 4,940 | (2,079 | ) | ||||||||
| Net (loss) income |
$ | (180,534 | ) | $ | 12,112 | $ | (7,563 | ) | ||||
| PER SHARE DATA: |
||||||||||||
| Net (loss) income per common share |
||||||||||||
| Basic |
$ | (9.28 | ) | $ | 0.63 | $ | (0.39 | ) | ||||
| Diluted |
$ | (9.28 | ) | $ | 0.62 | $ | (0.39 | ) | ||||
| Weighted-average number of shares |
||||||||||||
| Basic |
19,449 | 19,379 | 19,336 | |||||||||
| Diluted |
19,449 | 19,539 | 19,336 | |||||||||
The accompanying notes are an integral part of these consolidated financial statements.
F-3
Table of Contents
QUALITY DISTRIBUTION, INC. AND SUBSIDIARIES
CONSOLIDATED BALANCE SHEETS
December 31, 2009 and 2008
(In thousands)
| December 31, 2009 |
December 31, 2008 |
|||||||
| ASSETS |
||||||||
| Current assets: |
||||||||
| Cash and cash equivalents |
$ | 5,633 | $ | 6,787 | ||||
| Accounts receivable, net |
69,625 | 81,612 | ||||||
| Prepaid expenses |
8,584 | 12,922 | ||||||
| Deferred tax asset, net |
5,506 | 14,707 | ||||||
| Other |
4,420 | 7,950 | ||||||
| Total current assets |
93,768 | 123,978 | ||||||
| Property and equipment, net |
127,329 | 148,692 | ||||||
| Goodwill |
27,023 | 173,519 | ||||||
| Intangibles, net |
18,467 | 22,698 | ||||||
| Non-current deferred tax asset, net |
— | 22,636 | ||||||
| Other assets |
13,029 | 10,580 | ||||||
| Total assets |
$ | 279,616 | $ | 502,103 | ||||
| LIABILITIES, REDEEMABLE NONCONTROLLING INTEREST AND SHAREHOLDERS’ (DEFICIT) EQUITY |
||||||||
| Current liabilities: |
||||||||
| Current maturities of indebtedness |
$ | 19,866 | $ | 8,361 | ||||
| Current maturities of capital lease obligations |
5,322 | 7,994 | ||||||
| Accounts payable |
6,182 | 16,126 | ||||||
| Affiliates and independent owner-operators payable |
9,734 | 7,649 | ||||||
| Accrued expenses |
21,378 | 25,357 | ||||||
| Environmental liabilities |
3,408 | 4,819 | ||||||
| Accrued loss and damage claims |
8,862 | 8,705 | ||||||
| Total current liabilities |
74,752 | 79,011 | ||||||
| Long-term indebtedness, less current maturities |
284,253 | 330,409 | ||||||
| Capital lease obligations, less current maturities |
11,843 | 15,822 | ||||||
| Environmental liabilities |
8,241 | 6,035 | ||||||
| Accrued loss and damage claims |
10,534 | 12,815 | ||||||
| Other non-current liabilities |
28,896 | 25,158 | ||||||
| Total liabilities |
418,519 | 469,250 | ||||||
| Commitments and contingencies—Note 19 |
||||||||
| Redeemable noncontrolling interest |
1,833 | 1,833 | ||||||
| SHAREHOLDERS’ (DEFICIT) EQUITY |
||||||||
| Common stock, no par value; 29,000 shares authorized; 20,297 issued and 20,077 outstanding at December 31, 2009 and 19,754 issued and 19,549 outstanding at December 31, 2008, respectively |
364,046 | 362,945 | ||||||
| Treasury stock, 220 and 205 shares at December 31, 2009 and December 31, 2008, respectively |
(1,580 | ) | (1,580 | ) | ||||
| Accumulated deficit |
(294,568 | ) | (114,034 | ) | ||||
| Stock recapitalization |
(189,589 | ) | (189,589 | ) | ||||
| Accumulated other comprehensive loss |
(25,587 | ) | (26,488 | ) | ||||
| Stock purchase warrants |
6,696 | — | ||||||
| Stock subscriptions receivable |
(154 | ) | (234 | ) | ||||
| Total shareholders’ (deficit) equity |
(140,736 | ) | 31,020 | |||||
| Total liabilities, redeemable noncontrolling interest and shareholders’ (deficit) equity |
$ | 279,616 | $ | 502,103 | ||||
The accompanying notes are an integral part of these consolidated financial statements.
F-4
Table of Contents
QUALITY DISTRIBUTION, INC. AND SUBSIDIARIES
CONSOLIDATED STATEMENTS OF SHAREHOLDERS’ EQUITY (DEFICIT) AND COMPREHENSIVE INCOME (LOSS)
For the Years Ended December 31, 2009, 2008 and 2007 (In thousands)
| Compre- hensive Income (Loss) |
Shares of Common Stock |
Shares of Treasury Stock |
Common Stock |
Treasury Stock |
Accumulated Deficit |
Stock Recapitalization |
Accumulated Other Comprehensive Loss |
Stock Purchase Warrants |
Stock Subscription Receivables |
Total Shareholders’ Equity (Deficit) |
|||||||||||||||||||||||||||||||||
| Balance, December 31, 2006 |
— | 19,210 | (172 | ) | 359,995 | (1,527 | ) | (118,255 | ) | (189,589 | ) | (18,531 | ) | 21 | (340 | ) | 31,774 | ||||||||||||||||||||||||||
| Net loss |
$ | (7,563 | ) | — | — | — | — | (7,563 | ) | — | — | — | — | (7,563 | ) | ||||||||||||||||||||||||||||
| Issuance of restricted stock |
— | 47 | 11 | (25 | ) | 25 | — | — | — | — | — | — | |||||||||||||||||||||||||||||||
| Forfeiture of restricted stock |
— | — | (2 | ) | 11 | (11 | ) | — | — | — | — | — | — | ||||||||||||||||||||||||||||||
| Amortization of restricted stock |
— | — | — | 295 | — | — | — | — | — | — | 295 | ||||||||||||||||||||||||||||||||
| Amortization of non-employee options |
— | — | — | 125 | — | — | — | — | — | — | 125 | ||||||||||||||||||||||||||||||||
| Amortization of stock options |
— | — | — | 1,143 | — | — | — | — | — | — | 1,143 | ||||||||||||||||||||||||||||||||
| Stock warrant exercise |
— | 80 | — | 21 | — | — | — | — | (21 | ) | — | — | |||||||||||||||||||||||||||||||
| Stock option exercise |
— | — | 8 | 52 | 19 | — | — | — | — | — | 71 | ||||||||||||||||||||||||||||||||
| Acquisition of treasury stock |
— | (3 | ) | (3 | ) | — | (70 | ) | — | — | — | — | 70 | — | |||||||||||||||||||||||||||||
| FIN 48 Adjustment |
— | — | — | — | — | (328 | ) | — | — | — | — | (328 | ) | ||||||||||||||||||||||||||||||
| Translation adjustment, net of tax |
182 | — | — | — | — | — | — | 182 | — | — | 182 | ||||||||||||||||||||||||||||||||
| Adjustment to pension obligation, net of a deferred tax liability of $1,009 |
1,601 | — | — | — | — | — | — | 1,601 | — | — | 1,601 | ||||||||||||||||||||||||||||||||
| Balance, December 31, 2007 |
$ | (5,780 | ) | 19,334 | (158 | ) | $ | 361,617 | $ | (1,564 | ) | $ | (126,146 | ) | $ | (189,589 | ) | $ | (16,748 | ) | $ | — | $ | (270 | ) | $ | 27,300 | ||||||||||||||||
| Net income |
$ | 12,112 | — | — | — | — | 12,112 | — | — | — | — | 12,112 | |||||||||||||||||||||||||||||||
| Issuance of restricted stock |
— | 468 | — | — | — | — | — | — | — | — | — | ||||||||||||||||||||||||||||||||
| Forfeiture of restricted stock |
— | (48 | ) | (47 | ) | — | — | — | — | — | — | — | — | ||||||||||||||||||||||||||||||
| Amortization of restricted stock |
— | — | — | 208 | — | — | — | — | — | — | 208 | ||||||||||||||||||||||||||||||||
| Amortization of non-employee options |
— | — | — | 119 | — | — | — | — | — | — | 119 | ||||||||||||||||||||||||||||||||
| Amortization of stock options |
— | — | — | 1,001 | — | — | — | — | — | — | 1,001 | ||||||||||||||||||||||||||||||||
| Acquisition of treasury stock |
— | — | — | — | (16 | ) | — | — | — | — | 36 | 20 | |||||||||||||||||||||||||||||||
| Translation adjustment, net of tax |
(79 | ) | — | — | — | — | — | — | (79 | ) | — | — | (79 | ) | |||||||||||||||||||||||||||||
| Adjustment to pension obligation, net of tax |
(9,661 | ) | — | — | — | — | — | — | (9,661 | ) | — | — | (9,661 | ) | |||||||||||||||||||||||||||||
| Balance, December 31, 2008 |
$ | 2,372 | $ | 19,754 | (205 | ) | $ | 362,945 | $ | (1,580 | ) | $ | (114,034 | ) | $ | (189,589 | ) | $ | (26,488 | ) | — | $ | (234 | ) | $ | 31,020 | |||||||||||||||||
The accompanying notes are an integral part of these consolidated financial statements.
F-5
Table of Contents
QUALITY DISTRIBUTION, INC. AND SUBSIDIARIES
CONSOLIDATED STATEMENTS OF SHAREHOLDERS’ EQUITY (DEFICIT) AND COMPREHENSIVE INCOME (LOSS)
For the Years Ended December 31, 2009, 2008 and 2007 (In thousands) continued
| Comprehensive (Loss) Income |
Shares of Common Stock |
Shares of Treasury Stock |
Common Stock |
Treasury Stock |
Accumulated Deficit |
Stock Recapitalization |
Accumulated Other Comprehensive Loss |
Stock Purchase Warrants |
Stock Subscription Receivables |
Total Shareholders’ Equity (Deficit) |
|||||||||||||||||||||||||||||
| Balance, December 31, 2008 |
19,754 | (205 | ) | $ | 362,945 | $ | (1,580 | ) | $ | (114,034 | ) | $ | (189,589 | ) | $ | (26,488 | ) | — | $ | (234 | ) | $ | 31,020 | ||||||||||||||||
| Net loss |
$ | (180,534 | ) | — | — | — | — | (180,534 | ) | — | — | — | — | (180,534 | ) | ||||||||||||||||||||||||
| Issuance of restricted stock |
— | 543 | — | — | — | — | — | — | — | — | — | ||||||||||||||||||||||||||||
| Forfeiture of restricted stock |
— | — | (15 | ) | — | — | — | — | — | — | — | — | |||||||||||||||||||||||||||
| Amortization of restricted stock |
— | — | — | 388 | — | — | — | — | — | — | 388 | ||||||||||||||||||||||||||||
| Amortization of stock options |
— | — | — | 713 | — | — | — | — | — | — | 713 | ||||||||||||||||||||||||||||
| Forgiveness of stock subscription receivable |
— | — | — | — | — | — | — | — | — | 80 | 80 | ||||||||||||||||||||||||||||
| Issuance of stock purchase warrants |
— | — | — | — | — | — | — | — | 6,696 | — | 6,696 | ||||||||||||||||||||||||||||
| Translation adjustment, net of tax |
(134 | ) | — | — | — | — | — | — | (134 | ) | — | — | (134 | ) | |||||||||||||||||||||||||
| Adjustment to pension obligation, net of tax |
1,035 | — | — | — | — | — | — | 1,035 | — | — | 1,035 | ||||||||||||||||||||||||||||
| Balance, December 31, 2009 |
$ | (179,633 | ) | 20,297 | (220 | ) | $ | 364,046 | $ | (1,580 | ) | $ | (294,568 | ) | $ | (189,589 | ) | $ | (25,587 | ) | $ | 6,696 | $ | (154 | ) | $ | (140,736 | ) | |||||||||||
The accompanying notes are an integral part of these consolidated financial statements.
F-6
Table of Contents
QUALITY DISTRIBUTION, INC. AND SUBSIDIARIES
CONSOLIDATED STATEMENTS OF CASH FLOWS
For the Years Ended December 31, 2009, 2008 and 2007
(In thousands)
| Years Ended December 31, | ||||||||||||
| 2009 | 2008 | 2007 | ||||||||||
| CASH FLOWS FROM OPERATING ACTIVITIES: |
||||||||||||
| Net (loss) income |
$ | (180,534 | ) | $ | 12,112 | $ | (7,563 | ) | ||||
| Adjustments to reconcile to net cash and cash equivalents provided by (used in) operating activities: |
||||||||||||
| Deferred income tax benefit |
(4,222 | ) | (657 | ) | (6,029 | ) | ||||||
| Depreciation and amortization |
20,218 | 21,002 | 17,544 | |||||||||
| Bad debt expense |
1,838 | 1,086 | 796 | |||||||||
| Gain on sale of tank wash assets |
(7,130 | ) | — | — | ||||||||
| Loss (gain) on disposal of property and equipment |
450 | (3,092 | ) | 959 | ||||||||
| Impairment charge |
148,630 | — | — | |||||||||
| Gain on pension settlement |
— | (3,410 | ) | — | ||||||||
| PIK interest on Senior Subordinated Notes |
469 | — | — | |||||||||
| Gain on extinguishment of debt |
(1,870 | ) | (16,532 | ) | — | |||||||
| Financing costs |
2,323 | — | — | |||||||||
| Write-off of deferred financing costs |
20 | 283 | 2,031 | |||||||||
| Stock based compensation |
1,101 | 1,328 | 1,563 | |||||||||
| Amortization of deferred financing costs |
2,826 | 3,005 | 1,865 | |||||||||
| Amortization of bond discount |
1,358 | 1,100 | 279 | |||||||||
| Noncontrolling interest dividends |
145 | 145 | 145 | |||||||||
| Increase in deferred tax asset valuation allowance |
41,566 | — | 1,403 | |||||||||
| Changes in assets and liabilities: |
||||||||||||
| Accounts and other receivables |
9,945 | 16,755 | (2,545 | ) | ||||||||
| Prepaid expenses |
5,254 | 1,765 | (309 | ) | ||||||||
| Other assets |
2,776 | 2,456 | 910 | |||||||||
| Accounts payable |
(2,844 | ) | (2,685 | ) | (288 | ) | ||||||
| Accrued expenses |
(4,150 | ) | (860 | ) | 2,784 | |||||||
| Environmental liabilities |
794 | (315 | ) | (657 | ) | |||||||
| Accrued loss and damage claims |
(2,124 | ) | (10,392 | ) | (1,155 | ) | ||||||
| Affiliates and independent owner-operators payable |
2,085 | (4,949 | ) | 816 | ||||||||
| Other liabilities |
233 | 3,127 | 545 | |||||||||
| Current income taxes |
599 | (1,679 | ) | 958 | ||||||||
| Net cash provided by operating activities |
39,756 | 19,593 | 14,052 | |||||||||
| CASH FLOWS FROM INVESTING ACTIVITIES: |
||||||||||||
| Capital expenditures |
(8,221 | ) | (14,791 | ) | (10,557 | ) | ||||||
| Acquisition of businesses and assets |
— | (1,399 | ) | (6,836 | ) | |||||||
| Acquisition of Boasso America Corporation |
— | — | (53,415 | ) | ||||||||
| Cash acquired from Boasso America Corporation |
— | — | 1,015 | |||||||||
| Boasso purchase adjustment |
266 | 1,318 | — | |||||||||
| Proceeds from sale of tank wash assets |
10,000 | — | — | |||||||||
| Proceeds from sales of property and equipment |
7,532 | 6,348 | 6,394 | |||||||||
| Net cash provided by (used in) investing activities |
9,577 | (8,524 | ) | (63,399 | ) | |||||||
| CASH FLOWS FROM FINANCING ACTIVITIES: |
||||||||||||
| Proceeds from issuance of long-term debt |
— | 1,049 | 46,809 | |||||||||
| Principal payments on long-term debt |
(9,829 | ) | (12,900 | ) | (65,450 | ) | ||||||
| Principal payments on capital lease obligations |
(7,913 | ) | (3,835 | ) | (1,204 | ) | ||||||
| Proceeds from revolver |
28,600 | 115,700 | 123,030 | |||||||||
| Payments on revolver |
(47,600 | ) | (112,830 | ) | (41,400 | ) | ||||||
| Payments on acquisition notes |
(966 | ) | (1,015 | ) | (592 | ) | ||||||
| Financing costs |
(2,323 | ) | — | — | ||||||||
| Deferred financing costs |
(2,554 | ) | (860 | ) | (9,170 | ) | ||||||
| Stock offering costs |
— | — | (787 | ) | ||||||||
| Change in book overdraft |
(7,785 | ) | 1,331 | 1,033 | ||||||||
| Minority dividends |
(145 | ) | (145 | ) | (145 | ) | ||||||
| Other stock transactions |
— | 20 | 70 | |||||||||
| Net cash (used in) provided by financing activities |
(50,515 | ) | (13,485 | ) | 52,194 | |||||||
| Effect of exchange rate changes on cash |
28 | (508 | ) | 23 | ||||||||
| Net (decrease) increase in cash and cash equivalents |
(1,154 | ) | (2,924 | ) | 2,870 | |||||||
| Cash and cash equivalents, beginning of period |
6,787 | 9,711 | 6,841 | |||||||||
| Cash and cash equivalents, end of period |
$ | 5,633 | $ | 6,787 | $ | 9,711 | ||||||
| SUPPLEMENTAL DISCLOSURE OF CASH FLOW INFORMATION |
||||||||||||
| Cash paid during the year for: |
||||||||||||
| Interest |
$ | 22,704 | $ | 30,690 | $ | 28,850 | ||||||
| Income Taxes |
182 | 2,019 | 438 | |||||||||
| SUPPLEMENTAL DISCLOSURES OF NON-CASH FLOW INFORMATION: |
||||||||||||
| Minimum pension liability accrual, net of tax |
$ | 248 | $ | 12,565 | $ | 2,422 | ||||||
| Original and amended capital lease obligations |
1,280 | 22,368 | 1,094 | |||||||||
| Notes issued to seller for sale (purchase) of business assets |
3,000 | (1,121 | ) | (4,956 | ) | |||||||
| Notes payable - capital expenditures |
— | 12,658 | — | |||||||||
| Notes payable - insurance fundings |
1,879 | 6,537 | — | |||||||||
| Deferred tax adjustment related to Boasso acquisition |
— | — | 10,050 | |||||||||
| Adjustment to deferred taxes for FIN 48 adoption |
— | — | 972 | |||||||||
| Transfer of tractors from other assets to fixed assets |
— | — | 2,950 | |||||||||
| Warrant discount on notes issuance |
6,696 | — | — | |||||||||
| Long-term liability assumed with purchase of business |
— | (3,410 | ) | — | ||||||||
The accompanying notes are an integral part of these consolidated financial statements.
F-7
Table of Contents
Quality Distribution, Inc. and Subsidiaries
Notes to Consolidated Financial Statements
For the Years Ended December 31, 2009, 2008 and 2007
1. BUSINESS ORGANIZATION
Quality Distribution, Inc. (the “Company”, “QDI”, or “we”) and its subsidiaries are engaged primarily in truckload transportation of bulk chemicals in North America. We conduct a significant portion of our business through a network of affiliates and independent owner-operators. Affiliates are independent companies, which enter into various term contracts with the Company. Affiliates are responsible for paying for their own power equipment (including debt service), fuel and other operating costs. Certain affiliates lease trailers from us. Independent owner-operators are independent contractors, who, through a contract with us, supply one or more tractors and drivers for our use. Contracts with independent owner-operators may be terminated by either party on short notice. We charge affiliates and third parties for the use of tractors and trailers as necessary. In exchange for the services rendered, affiliates and independent owner-operators are normally paid a percentage of the revenues collected on each load hauled.
2. SIGNIFICANT ACCOUNTING POLICIES
Basis of Presentation
These consolidated financial statements have been prepared in accordance with accounting principles generally accepted in the United States using U.S. dollars as the reporting currency as the majority of our business is in the U.S. The consolidated financial statements include the accounts of QDI and its subsidiaries. All significant intercompany accounts and transactions have been eliminated in consolidation. Redeemable noncontrolling interest reflects outstanding preferred stock of Chemical Leaman Corp. (“CLC”), a subsidiary of QDI.
Cash and Cash Equivalents
We consider all highly liquid investments with original maturities of three months or less to be cash equivalents. Book overdrafts are included in accounts payable.
Allowance for Uncollectible Receivables
We have established a reserve for uncollectible receivables based on a combination of historical data, cash payment trends, specific customer issues, write-off trends, general economic conditions and other factors. We charge uncollectible amounts to our allowance based on various issues, including cash payment trends and specific customer issues. These factors are continuously monitored by our management to arrive at the estimate for the amount of accounts receivable that may be ultimately uncollectible. The receivables analyzed include trade receivables, as well as loans and advances made to independent owner-operators.
Inventories
Inventories are stated at the lower of cost (first-in, first-out method) or market and consist primarily of tires, parts, fuel and supplies for servicing our revenue equipment (tractors and trailers).
Tires
We capitalize the cost of tires mounted on purchased revenue equipment as a part of the total equipment cost and depreciate the cost over the useful life of the related equipment. Subsequent replacement tires are expensed at the time those tires are placed in service similar to other repairs and maintenance costs.
F-8
Table of Contents
Quality Distribution, Inc. and Subsidiaries
Notes to Consolidated Financial Statements—(Continued)
For the Years Ended December 31, 2009, 2008 and 2007
Property and Equipment and Impairment on Long-Lived Assets
Property and equipment expenditures, including tractor and trailer rebuilds that extend the useful lives of such equipment, are capitalized and recorded at cost. For financial statement purposes, these assets are depreciated using the straight-line method over the estimated useful lives of the assets to an estimated salvage value.
The asset lives used are presented in the following table:
| Average Lives (in years) | ||
| Buildings and improvements |
10 - 25 | |
| Tractors and terminal equipment |
5 - 7 | |
| Trailers |
15 - 20 | |
| Furniture and fixtures |
3 - 5 | |
| Other equipment |
3 - 10 |
Tractor and trailer rebuilds, which are recurring in nature and extend the lives of the related assets, are capitalized and depreciated over the period of extension, generally 3 to 10 years, based on the type and extent of these rebuilds. Maintenance and repairs are charged directly to expense as incurred. Major improvements that extend the lives of the assets are capitalized. Management estimates the useful lives of these assets based on historical trends and the age of the assets when placed in service, and any changes in the actual lives could result in material changes in the periodic depreciation and resulting net book value of these assets. Additionally, we estimate the salvage values of these assets based on historical sales of disposals, and any changes in the actual salvage values could also affect the periodic depreciation and resulting net book value of these assets.
Furthermore, we evaluate the recoverability of our long-lived assets whenever adverse events or changes in the business climate indicate that the expected undiscounted future cash flows from the related category of assets may be less than previously anticipated. We assess whether there has been an impairment of long-lived assets and definite lived intangibles in accordance with the FASB guidance. If the carrying value of an asset, including associated intangibles, exceeds the sum of estimated undiscounted future cash flows, then an impairment loss is recognized for the difference between estimated fair value and carrying value. When assets are disposed of, the cost and related accumulated depreciation are removed from the accounts, and any gains or losses are reflected in operating expenses.
Goodwill and Intangible Assets
We evaluate goodwill and indefinite–lived intangible assets for impairment annually during the second quarter with a measurement date of June 30, or more frequently if indicators of impairment arise, in accordance the FASB guidance. We have identified three reporting units: trucking, container services and other. Our evaluation of goodwill is measured through a two-step impairment test. The first step compares the fair value of a reporting unit to its carrying amount, including goodwill. If the fair value of a reporting unit exceeds its carrying amount, goodwill of the reporting unit is considered not impaired, thus the second step of the impairment test is unnecessary. If the carrying amount of a reporting unit exceeds its fair value, the second step of the goodwill impairment test shall be performed to measure the amount of impairment loss. The second step compares the implied fair value of reporting unit goodwill with the carrying amount of that goodwill. If the carrying amount of reporting unit goodwill exceeds the implied fair value of that goodwill, an impairment loss must be recognized in an amount equal to the excess. The loss recognized cannot exceed the carrying amount of goodwill. After a
F-9
Table of Contents
Quality Distribution, Inc. and Subsidiaries
Notes to Consolidated Financial Statements—(Continued)
For the Years Ended December 31, 2009, 2008 and 2007
goodwill impairment loss is recognized, the adjusted carrying amount of goodwill will be its new accounting basis. Subsequent reversal of a previously recognized goodwill impairment loss is prohibited once the measurement of that loss is completed.
Impairment of Long-Lived Assets Other than Goodwill
Long-lived assets held and used, including revenue earning equipment, operating property and equipment and intangible assets with finite lives, are tested for recoverability when circumstances indicate that the carrying amount of assets may not be recoverable. Recoverability of long-lived assets is evaluated by comparing the carrying amount of an asset or asset group to management’s best estimate of the undiscounted future operating cash flows (excluding interest charges) expected to be generated by the asset or asset group. If these comparisons indicate that the asset or asset group is not recoverable, an impairment loss is recognized at the amount by which the carrying value of the asset or asset group exceeds fair value. Fair value is determined by quoted market price, if available, or an estimate of projected future operating cash flows, discounted using a rate that reflects the related operating segment’s average cost of funds. Long-lived assets to be disposed of including revenue earning equipment, operating property and equipment and indefinite-lived intangible assets, are reported at the lower of carrying amount or fair value less costs to sell.
Other Assets—Deferred Loan Costs
Costs incurred to issue debt are deferred and amortized as a component of interest expense over the estimated term of the related debt using the effective interest rate method.
Taxation—We use the liability method of accounting for income taxes. If, on the basis of available evidence, it is more likely than not that all or a portion of the deferred tax asset will not be realized, the asset must be reduced by a valuation allowance. Since realization is not assured as of December 31, 2009, management has deemed it appropriate to establish a valuation allowance against the net deferred tax assets. Any change in the actual future results of operations could impact the valuation of the net deferred tax asset.
A valuation allowance has been established for 100% of our net deferred tax asset as we no longer believe it meets the “more likely than not” criteria. Our judgments regarding future taxable income may change due to changes in market conditions, changes in tax laws or other factors. If any of the assumptions and related estimates change in the future, it may increase or decrease the valuation allowance and related income tax expense in the same period.
During the second quarter of 2009, an impairment charge of $148.6 million was recorded and as result we were in a cumulative loss position. We base this cumulative loss analysis on a rolling thirty-six month calculation of U.S. earnings. As a result of this negative evidence it was determined that is was no longer more likely than not our net deferred tax asset was realizable. For purposes of assessing realizability of the deferred tax assets, this cumulative financial reporting loss position is considered significant negative evidence and has caused us to conclude that we will not fully realize the deferred tax assets. This evidence was weighed against positive evidence such as positive forecasted earnings and when net operating losses are expected to expire. The negative evidence out weighed the positive evidence and as a result, a $41.2 million deferred tax valuation allowance was recorded.
At December 31, 2009 we had an estimated $95.7 million in federal net operating loss carryforwards, $2.3 million in alternative minimum tax credit carryforwards and $3.1 million in foreign tax credit carryforwards. The net operating loss carryforwards will expire in the years 2018 through 2027, while the alternative minimum tax credits may be carried forward indefinitely and the foreign tax credits may be carried forward for 10 years. We
F-10
Table of Contents
Quality Distribution, Inc. and Subsidiaries
Notes to Consolidated Financial Statements—(Continued)
For the Years Ended December 31, 2009, 2008 and 2007
do not have a history of net operating loss or tax credit carryforwards expiring unused; however, we have determined based on the weight of available evidence that it is more likely than not that some or all of the carryforwards may expire.
We continue to evaluate quarterly, the positive and negative evidence regarding the realization of net deferred tax assets in accordance with FASB guidance for income taxes. Included in this assessment are estimates of projected future taxable income. Significant management judgment is required in this process and although realization is not assured, based on our assessment, we concluded it is more likely than not, such assets will not continue to be realized.
FASB guidance requires that companies recognize the effect of a tax position in their consolidated financial statements if there is a greater likelihood than not of the position being sustained upon audit based on the technical merits of the position. We adopted accounting for uncertain tax positions effective January 1, 2007. As a result of the implementation, we recognized an increase to reserves for uncertain tax positions of $0.3 million. The increase to the reserve was accounted for as an adjustment to accumulated deficit to recognize the cumulative effect of adoption on the balance sheet.
Under FASB guidance, we account for uncertain tax positions using a two-step process. The first step is to evaluate the tax position for recognition by determining if the weight of available evidence indicates that it is more likely than not that the position will be sustained on audit, including resolution of related appeals or litigation processes, if any. The second step requires us to estimate and measure the tax benefit as the largest amount that is more than 50% likely to be realized upon ultimate settlement. It is inherently difficult and subjective to estimate such amounts, as we have to determine the probability of various possible outcomes. We re-evaluate these uncertain tax positions on a quarterly basis. This evaluation is based on factors including, but not limited to, changes in facts or circumstances, changes in tax law, effectively settled issues under audit, and new audit activity. Such a change in recognition or measurement would result in the recognition of a tax benefit or an additional charge to the tax provision
Environmental liabilities
We have reserved for potential environmental liabilities based on the best estimates of potential clean-up and remediation for known environmental sites. We employ a staff of environmental professionals to administer all phases of our environmental programs and use outside experts where needed. These professionals develop estimates of potential liabilities at these sites based on projected and known remediation costs. These cost projections are determined through previous experiences with other sites and through bids from third-party contractors. Management believes current reserves are reasonable based on current information.
Accrued Loss and Damage and Claims
We currently maintain liability insurance for bodily injury and property damage claims, covering all employees, independent owner-operators and affiliates, and workers’ compensation insurance coverage on our employees and company drivers. This insurance includes deductibles of $2.0 million per incident for bodily injury and property damage and $1.0 million for workers’ compensation for periods after March 31, 2008. Prior to March 30, 2008, our insurance deductible was $5.0 million per incident for bodily injury and property damage. As such, we are subject to liability as a self-insurer to the extent of these deductibles under the policy. We are self-insured for damage to the equipment we own or lease and for cargo losses. As of December 31, 2009, we had $33.6 million in an outstanding letter of credit to our insurance administrator to guarantee the self-insurance portion of our liability. If we fail to meet certain terms of our agreement, the insurance administrator may draw
F-11
Table of Contents
Quality Distribution, Inc. and Subsidiaries
Notes to Consolidated Financial Statements—(Continued)
For the Years Ended December 31, 2009, 2008 and 2007
down the letter of credit. In developing liability reserves, we rely on professional third party claims administrators, insurance company estimates and the judgment of our own safety department personnel, and independent professional actuaries and attorneys. The most significant assumptions used in the estimation process include determining the trends in loss costs, the expected consistency in the frequency and severity of claims incurred but not yet reported to prior-year claims, and expected costs to settle unpaid claims. Management believes reserves are reasonable given known information, but as each case develops, estimates may change to reflect the effect of new information.
Redeemable Noncontrolling Interest
Shares of Series C preferred stock of our subsidiary, Chemical Leaman Corporation (“CLC”) are held by two shareholders that are not affiliated with us. These shareholders are entitled to dividends on their shares of Series C preferred stock, payable quarterly, at a rate of 8.0% (or $480 per share) per annum on each share of Series C preferred stock. As of December 31, 2009 all 302 shares were outstanding, fully redeemable and carried at a maximum aggregate redemption value of $1.8 million in accordance with FASB guidance. In 2009, we adopted FASB guidance that requires us to report the noncontrolling interest as a temporary equity item.
Foreign Currency Translation
The translation from Canadian dollars to U.S. dollars is performed for balance sheet accounts using current exchange rates in effect at the balance sheet date and for revenue and expense accounts using a weighted-average exchange rate in effect during the period. The gains or losses, net of income taxes, resulting from such translation are included in shareholders’ deficit as a component of accumulated other comprehensive loss. Gains or losses from foreign currency transactions are included in other expense.
Accumulated Other Comprehensive Loss
The components of accumulated other comprehensive loss are as follows at December 31 (in thousands):
| 2009 | 2008 | |||||
| Unrecognized loss and prior service costs |
$ | 24,511 | $ | 25,546 | ||
| Foreign currency translation adjustment |
1,076 | 942 | ||||
| $ | 25,587 | $ | 26,488 | |||
Revenue Recognition
Transportation revenue, including fuel surcharges, and related costs are recognized on the date freight is delivered. Other service revenue consists primarily of rental revenues, container revenues and tank wash revenues. Rental revenues from affiliates, independent owner-operators and third parties, are recognized ratably over the lease period. Container revenues, consisting primarily of repair and storage services, are recognized when the services are rendered. Tank wash revenues are recognized when the wash is completed. Service revenues on insurance policies are recorded as a contractual percentage of premiums received ratably over the period that the insurance covers. We recognize all revenues on a gross basis as the principal and primary obligor with risk of loss in relation to our responsibility for completion of services as contracted with our customers.
F-12
Table of Contents
Quality Distribution, Inc. and Subsidiaries
Notes to Consolidated Financial Statements—(Continued)
For the Years Ended December 31, 2009, 2008 and 2007
Other Service Revenue
The components of Other service revenue are as follows at December 31 (in thousands):
| 2009 | 2008 | 2007 | |||||||
| Rental revenue |
$ | 42,115 | $ | 30,508 | $ | 31,422 | |||
| Container revenues |
31,161 | 31,413 | 2,264 | ||||||
| Tank wash revenue |
19,530 | 28,395 | 31,136 | ||||||
| Other revenue |
12,148 | 13,723 | 11,399 | ||||||
| $ | 104,954 | $ | 104,039 | $ | 76,221 | ||||
Share-Based Compensation
Under the FASB guidance, we apply the Black-Scholes valuation model in determining the fair value of share-based payments to employees. The resulting compensation expense is recognized over the requisite service period, which is generally the option vesting term of four years. Please refer to Note 18 for further discussion regarding stock-based compensation.
Leased Assets
We have both capital and operating leases. The leases for most of our tractors and trailers have terms that range from three to seven years. Some leases require us to pay the lessor a minimum residual amount at the end of the lease. For operating leases, we accrue this residual by recording a prepaid rent amount and amortizing a monthly amount as rental expense and also record a liability that is increased every year by recognizing interest expense. This residual amount is recorded in the balance sheet category “Other non-current liabilities.” For capital leases, the residual is included as part of the cost of the capitalized leased asset.
Use of Estimates
The preparation of financial statements in conformity with generally accepted accounting principles requires management to make estimates and assumptions that affect the reported amounts of assets and liabilities and disclosure of contingent assets and liabilities at the date of the financial statements and the reported amounts of revenues and expenses during the reporting period. Actual results could differ from those estimates.
Net (Loss) Income Per Common Share
Basic net (loss) income per common share is calculated based on the weighted-average common shares outstanding during each period. Diluted (loss) income per common share includes the dilutive effect, if any, of common equivalent shares outstanding during each period.
New Accounting Pronouncements
During 2009, the Financial Accounting Standards Board (“FASB”) issued the FASB Accounting Standards Codification, or Codification. The Codification became the single source for all authoritative generally accepted accounting principles. The Codification does not change GAAP and did not impact our financial position or results of operations.
F-13
Table of Contents
Quality Distribution, Inc. and Subsidiaries
Notes to Consolidated Financial Statements—(Continued)
For the Years Ended December 31, 2009, 2008 and 2007
In June 2009, FASB issued new guidance which revises and updates previously issued guidance related to variable interest entities. The new guidance eliminates the exceptions to consolidating qualifying special-purpose entities that were included in the prior guidance. The new guidance contains new criteria for determining the primary beneficiary and increases the frequency of required reassessments to determine whether a company is the primary beneficiary of a variable interest entity. The guidance also contains a new requirement that any term, transaction, or arrangement that does not have a substantive effect on an entity’s status as a variable interest entity, a company’s power over a variable interest entity, or a company’s obligation to absorb losses or its right to receive benefits of an entity must be disregarded. The elimination of the qualifying special-purpose entity concept and its consolidation exceptions means more entities will be subject to consolidation assessments and reassessments. The new guidance will be effective for our fiscal year beginning January 1, 2010. This guidance has no impact on our consolidated financial statements.
In June 2009, the FASB issued guidance that eliminates the concept of a qualifying special-purpose entity, creates more stringent conditions for reporting a transfer of a portion of a financial asset as a sale, clarifies other sale-accounting criteria, and changes the initial measurement of a transferor’s interest in transferred financial assets. This guidance will be effective for our fiscal year beginning January 1, 2010. This guidance has no impact on our consolidated financial statements.
In May 2009, the FASB issued guidance related to subsequent events that provides general standards of accounting for and disclosure of events that occur after the balance sheet date but before financial statements are issued or are available to be issued. It requires the disclosure of the date through which an entity has evaluated subsequent events and the basis for that date; that is, whether that date represents the date the financial statements were issued or were available to be issued. We adopted this guidance in the second quarter of 2009, as it became effective for interim or annual financial periods ending after June 15, 2009. In February 2010 the guidance was amended, eliminating the requirement to disclose the date through which subsequent events were evaluated.
On April 9, 2009, the Securities and Exchange Commission (“SEC”) issued guidance that amended and supplemented its previous guidance on other than temporary impairment of certain investments in debt and equity securities. The newly issued guidance maintains the SEC staff’s previous views related to equity securities; however, debt securities are excluded from its scope. The guidance provides that “other-than-temporary” impairment is not necessarily the same as “permanent” impairment and unless evidence exists to support a value equal to or greater than the carrying value of the equity security investment, a write-down to fair value should be recorded and accounted for as a realized loss. The guidance was effective upon issuance and had no impact on our consolidated financial statements.
On April 9, 2009, the FASB issued guidance which requires an entity to provide disclosures about fair value of financial instruments in interim financial information. The disclosures are required prospectively and are effective for interim and annual periods ending after June 15, 2009. We adopted this guidance, and the required disclosures are included herein. This guidance had no impact on our consolidated financial statements.
On April 1, 2009, the FASB issued guidance requiring that assets acquired and liabilities assumed in a business combination that arise from a contingency must be recognized at fair value. If fair value cannot be determined during the measurement period defined in the guidance, the asset or liability can still be recognized if it can be determined that it is probable that the asset existed or the liability had been incurred as of the measurement date and if the amount of the asset or liability can be reasonably estimated. If it is not determined to be probable that the asset/liability existed/was incurred or no reasonable amount can be determined, no asset or liability is recognized. The entity should determine a rational basis for subsequently measuring the acquired assets and assumed liabilities. Contingent consideration agreements should be recognized initially at fair value
F-14
Table of Contents
Quality Distribution, Inc. and Subsidiaries
Notes to Consolidated Financial Statements—(Continued)
For the Years Ended December 31, 2009, 2008 and 2007
and subsequently reevaluated in accordance with the guidance. The guidance is effective for business combinations with an acquisition date on or after the beginning of the Company’s first annual reporting period beginning on or after December 15, 2008. The Company will assess the impact of this guidance if and when a future acquisition occurs.
On January 1, 2009, we adopted newly issued guidance from the FASB regarding business combinations. This guidance significantly changes the financial accounting and reporting of business combination transactions but retains the fundamental requirements of the prior guidance, including utilizing the purchase method for all business combinations and identifying an acquirer for each business combination. The impact of adopting the new guidance will depend on the nature, terms and size of business combinations completed.
On January 1, 2009, we adopted the FASB’s amended guidance on noncontrolling interests in consolidated financial statements. This guidance requires the reporting of all noncontrolling interests as a separate component of stockholders’ equity, the reporting of consolidated net income (loss) as the amount attributable to both the parent and the noncontrolling interests, and the separate disclosure of net income (loss) attributable to the parent and to the noncontrolling interests. Other than the reporting requirements described above which require retrospective application, the remaining provisions are to be applied prospectively in the first annual reporting period beginning on or after December 15, 2008. The adoption of this guidance had an immaterial impact on our consolidated financial statements.
In conjunction with guidance on noncontrolling interests, we adopted guidance on classification and measurement of redeemable securities. This standard is applicable for all noncontrolling interests where the Company is subject to equity classified securities that are redeemable or may become redeemable at a fixed or determinable price on a fixed or determinable date, at the option of the holder, or upon the occurrence of an event that is not solely within the control of the issuer. A subsidiary of QDI has issued and outstanding preferred stock that is held by holders other than QDI and its other subsidiaries. The holders have the right to cause us to redeem their shares of preferred stock. The redemption value of the preferred stock held by these noncontrolling holders equals the fair value of $1.8 million at December 31, 2009 and is reflected in our consolidated balance sheets as redeemable noncontrolling interest.
On January 1, 2009, we adopted new guidance from the FASB on determining the useful life of intangible assets which amends the factors that should be considered in developing renewal or extension assumptions used to determine the useful life of a recognized intangible asset. The amended guidance removes an earlier requirement to consider whether an intangible asset can be renewed without substantial cost or material modifications to the existing terms and conditions; instead, it requires an entity to consider its own historical experience in renewing similar arrangements. The guidance also requires expanded disclosure related to the determination of intangible asset useful lives. The adoption of this guidance had no impact on our consolidated financial statements.
On January 1, 2009, we adopted the FASB’s guidance to assist in determining whether instruments granted in share-based payment transactions are participating securities. The guidance addresses whether unvested equity-based awards are participating securities and, therefore, need to be included in the earnings allocation in computing earnings per share under the two-class method The adoption of this guidance had no impact on our consolidated financial statements.
In December 2008, the FASB issued guidance on an employer’s disclosures about plan assets of a defined benefit pension or other postretirement plan. This guidance is intended to ensure that an employer meets the objectives of the disclosures about plan assets in an employer’s defined benefit pension or other postretirement
F-15
Table of Contents
Quality Distribution, Inc. and Subsidiaries
Notes to Consolidated Financial Statements—(Continued)
For the Years Ended December 31, 2009, 2008 and 2007
plan to provide users of financial statements with an understanding of the following: how investment allocation decisions are made, the major categories of plan assets, the inputs and valuation techniques used to measure the fair value of plan assets, the effect of fair value measurements using significant unobservable inputs on changes in plan assets, and significant concentrations of risk within plan assets. The disclosures required become effective for us on December 31, 2009. We have determined that the adoption of this guidance will not have an impact on our consolidated financial statements.
On January 1, 2008, we adopted the FASB’s guidance on fair value measurements which provides a consistent definition of fair value that focuses on exit price and prioritizes, within a measurement of fair value, the use of market-based inputs over company-specific inputs. The guidance requires expanded disclosures about fair value measurements and establishes a three-level hierarchy for fair value measurements based on the observable inputs to the valuation of an asset or liability at the measurement date. The standard also requires that a company consider its own nonperformance risk when measuring liabilities carried at fair value, including derivatives. In February 2008, the FASB permitted companies to partially defer the effective date of its fair value measurement guidance for one year for nonfinancial assets and nonfinancial liabilities that are recognized or disclosed at fair value in the financial statements on a nonrecurring basis, and we elected to do so. On January 1, 2009, we adopted the fair value measurement guidance for nonfinancial assets and nonfinancial liabilities. The effect of our adoption was not material to our consolidated financial statements.
On January 1, 2008, we adopted the FASB’s guidance on the fair value option for financial assets and financial liabilities which permits a company to measure certain financial assets and financial liabilities at fair value that were not previously required to be measured at fair value. We have not elected to measure any financial assets and financial liabilities at fair value which were not previously required to be measured at fair value; therefore, the adoption of this guidance has had no effect on our results of operations.
3. FAIR VALUE OF FINANCIAL INSTRUMENTS
The three-level valuation hierarchy for fair value measurements is based upon observable and unobservable inputs. Observable inputs reflect market data obtained from independent sources, while unobservable inputs reflect our market assumptions. These two types of inputs create the following fair value hierarchy:
| • | Level 1 — Quoted prices for identical instruments in active markets; |
| • | Level 2 — Quoted prices for similar instruments in active markets; quoted prices for identical or similar instruments in markets that are not active; and model-derived valuations whose significant inputs are observable: and |
| • | Level 3 — Instruments whose significant inputs are unobservable. |
Following is a description of the valuation methodologies we used for instruments measured at fair value, as well as the general classification of such instruments pursuant to the valuation hierarchy.
F-16
Table of Contents
Quality Distribution, Inc. and Subsidiaries
Notes to Consolidated Financial Statements—(Continued)
For the Years Ended December 31, 2009, 2008 and 2007
Fair Value Measurements on a Nonrecurring Basis
The following tables summarize assets measured at fair value on a nonrecurring basis subsequent to initial recognition:
| December 31, 2009 | Significant Unobservable Inputs (Level 3) |
Total Loss |
||||||||
| Assets |
||||||||||
| Goodwill |
$ | 27,023 | $ | 27,023 | $ | (146,230 | ) | |||
| Intangibles |
18,467 | 18,467 | (2,400 | ) | ||||||
| Total |
$ | 45,490 | $ | 45,490 | $ | (148,630 | ) | |||
We review the carrying value of our assets measured at fair value on a nonrecurring basis when events and circumstances warrant. This review requires the comparison of the fair value of our assets to their respective carrying values. The fair value of our assets is determined based on valuation techniques using the best information that is available, and may include quoted market prices, market comparables, and discounted cash flow projections. An impairment charge is recorded whenever a decline in fair value below the carrying value is determined to be other than temporary.
Goodwill and Intangibles
Goodwill and intangible assets may become impaired as a result of declines in profitability due to changes in volume, pricing or costs. Fair value is determined using a combination of two valuation approaches: the market approach and the income approach. As of December 31, 2009, the carrying value of our goodwill was $27.0 million, and the carrying value of our intangibles was $18.5 million. These values reflect adjustments to fair value made as of June 30, 2009 as a result of our annual impairment analysis. Refer to Note 2 for further information on the valuation process of our goodwill and intangibles.
Long-term indebtedness
The fair value of our 9% Senior Subordinated Notes (“9% Notes”), our Senior Floating Rate Notes (“2012 Notes”), our 10% Senior Notes (“2013 Senior Notes”) and our 11.75% Senior Subordinated PIK Notes (“2013 PIK Notes”) were based on quoted market prices. As of December 31, 2009, the carrying value of our 9% Notes was $16.0 million with a fair value of $14.0 million. As of December 31, 2009, the carrying value of our 2012 Notes was $0.5 million with a fair value of $0.4 million. As of December 31, 2009, the carrying value of our 2013 Senior Notes was $134.5 million with a fair value of $118.4 million. As of December 31, 2009, the carrying value of our 2013 PIK Notes was $81.2 million with a fair value of $64.2 million. Our asset-based loan facility (the “ABL Facility”) is variable rate debt and approximates fair value.
The carrying amounts reported in the accompanying balance sheets for cash and cash equivalents, accounts receivable, and accounts payable approximate fair value because of the immediate or short-term maturities of these financial instruments.
F-17
Table of Contents
Quality Distribution, Inc. and Subsidiaries
Notes to Consolidated Financial Statements—(Continued)
For the Years Ended December 31, 2009, 2008 and 2007
4. (LOSS) INCOME PER COMMON SHARE
A reconciliation of the numerators and denominators of the basic and diluted (loss) earnings from continuing operations to (loss) earnings per share computations follows (in thousands except per share amounts):
| December 31, 2009 | December 31, 2008 | December 31, 2007 | ||||||||||||||||||||||||||
| Loss from continuing operations (numerator) |
Shares (denominator) |
Per- share amount |
Earnings from continuing operations (numerator) |
Shares (denominator) |
Per- share amount |
Loss from continuing operations (numerator) |
Shares (denominator) |
Per- share amount |
||||||||||||||||||||
| Basic (loss) earnings available to common shareholders: |
||||||||||||||||||||||||||||
| Net (loss) earnings from continuing operations |
$ | (180,534 | ) | $ | 12,112 | $ | (7,563 | ) | ||||||||||||||||||||
| Dividends and accretion on preferred stock and minority stock dividends |
— | — | — | |||||||||||||||||||||||||
| (Loss) earnings |
(180,534 | ) | 19,449 | $ | (9.28 | ) | 12,112 | 19,379 | $ | 0.63 | (7,563 | ) | 19,336 | $ | (0.39 | ) | ||||||||||||
| Effect of dilutive securities: |
||||||||||||||||||||||||||||
| Stock options |
— | 8 | — | |||||||||||||||||||||||||
| Unvested restricted stock |
— | 152 | — | |||||||||||||||||||||||||
| Stock units |
— | — | — | |||||||||||||||||||||||||
| Stock warrants |
— | — | — | |||||||||||||||||||||||||
| Diluted (loss) earnings available to common shareholders: |
||||||||||||||||||||||||||||
| (Loss) earnings |
$ | (180,534 | ) | 19,449 | $ | (9.28 | ) | $ | 12,112 | 19,539 | $ | 0.62 | $ | (7,563 | ) | 19,336 | $ | (0.39 | ) | |||||||||
The effect of our stock options, restricted stock and stock warrants which represent the shares shown in the table above are included in the computation of diluted earnings per share for each year. There is no effect of our stock options, restricted stock and stock warrants in the computation of diluted earnings per share for the year ended December 31, 2009 due to a net loss in the period.
The following securities were not included in the calculation of diluted EPS because such inclusion would be anti-dilutive (in thousands):
| For the years ended December 31, | ||||||
| 2009 | 2008 | 2007 | ||||
| Stock options |
2,171 | 1,917 | 2,790 | |||
| Restricted stock |
610 | — | 125 | |||
| Warrants |
1,747 | — | — | |||
5. ACQUISITIONS AND DISPOSITIONS
During 2009, we did not complete any asset or other acquisitions of businesses or affiliates.
On October 10, 2009, we sold substantially all of the operating assets of our tank wash subsidiary, QSI, for $13.0 million, of which $10.0 million was paid in cash and the remaining $3.0 million in a subordinated note.
F-18
Table of Contents
Quality Distribution, Inc. and Subsidiaries
Notes to Consolidated Financial Statements—(Continued)
For the Years Ended December 31, 2009, 2008 and 2007
The subordinated note is a five year non-amortizing note which matures on December 31, 2014. The principal is payable in a lump sum at maturity. Interest is payable quarterly at 7% per annum commencing December 31, 2009. In connection with the sale, QSI entered into various agreements with the purchaser, which is not affiliated with us, including long-term leases of real estate used in the tank wash business and various operating agreements. The assets sold had a net book value of $4.9 million which included $4.3 million of equipment, $0.4 million of inventory, and $0.2 million of intangibles. The sold QSI business generated approximately $19.5 million of revenue in 2009 from tank wash and related operations. Following the sale of the QSI business, we have purchased tank wash services (which were previously provided by QSI) from the acquirer of QSI’s tank wash assets and we expect to continue to do so in the future. Since we expect these continuing cash outflows to be significant, the sold QSI business does not qualify as a discontinued operation under FASB guidance. Therefore, we recorded a pre-tax gain in the fourth quarter of $7.1 million as part of our operating income.
During 2008, we purchased assets of two transportation companies and the assets of an affiliate for $2.1 million, in the aggregate, of which $1.4 million was paid in cash at closing and the remaining $0.7 million is payable over future periods. Of the total $2.1 million, we allocated $1.0 million to property and equipment, $0.9 million to goodwill, and $0.2 million to other intangible assets such as non-compete agreements.
6. SELECTED QUARTERLY FINANCIAL DATA (Unaudited) (In thousands, except per share data)
| Quarter Ended | ||||||||||||||
| March 31 | June 30 | September 30 | December 31 | |||||||||||
| 2009 |
||||||||||||||
| Operating revenues |
$ | 149,732 | $ | 149,786 | $ | 162,805 | $ | 151,286 | ||||||
| Operating income (loss) |
5,993 | (143,231 | ) | 7,896 | 14,166 | |||||||||
| Net (loss) income |
(302 | ) | (186,227 | ) | 1,426 | 4,569 | ||||||||
| (Loss) income per share—basic |
(0.02 | ) | (9.58 | ) | 0.07 | 0.23 | ||||||||
| (Loss) income per share—diluted |
(0.02 | ) | (9.58 | ) | 0.07 | 0.21 | ||||||||
| 2008 |
||||||||||||||
| Operating revenues |
$ | 208,501 | $ | 223,962 | $ | 214,741 | $ | 168,086 | ||||||
| Operating income |
5,797 | 9,576 | 9,763 | 7,842 | ||||||||||
| Net (loss) income |
(1,919 | ) | 352 | 717 | 12,962 | |||||||||
| (Loss) income per share—basic |
(0.10 | ) | 0.02 | 0.04 | 0.67 | |||||||||
| (Loss) income per share—diluted |
(0.10 | ) | 0.02 | 0.04 | 0.66 | |||||||||
In 2009, we recognized $3.5 million in restructuring costs. Results for the second quarter of 2009 include an impairment charge of $148.6 million related to goodwill and intangible assets. Results for the fourth quarter of 2009 include a $7.1 million gain on sale of tank wash assets, $1.2 million gain on extinguishment of debt and $2.3 million of refinancing costs.
In 2008, we recognized $5.3 million in restructuring costs. Results for the fourth quarter of 2008 include $16.5 million of gain on extinguishment of debt and $0.3 million write-off of debt issuance costs due to the repurchase of our 9% Notes. In addition, results for the fourth quarter in 2008 include a gain of $3.4 million related to the reduction of an acquired pension liability.
F-19
Table of Contents
Quality Distribution, Inc. and Subsidiaries
Notes to Consolidated Financial Statements—(Continued)
For the Years Ended December 31, 2009, 2008 and 2007
7. RESTRUCTURING
We account for restructuring costs associated with one-time termination benefits, costs associated with lease and contract terminations and other related exit activities in accordance FASB guidance. We have made estimates of the costs to be incurred as part of our restructuring plan. During the quarter ended June 30, 2008, we committed to a plan of restructure resulting in the termination of non-driver positions and the consolidation, closure or affiliation of underperforming company terminals. We continued our plan of restructure throughout 2008 which resulted in a restructuring charge of $5.3 million of which the majority related to our trucking segment. Our restructuring plan continued in 2009 and resulted in charges of $3.5 million of which the majority related to our trucking segment. The charges in 2008 and 2009 related to employee termination benefits and other related exit activities, and included the termination of approximately 350 non-driver positions. We expect to conclude our restructuring plan in 2010 and to take additional related charges during the year. At December 31, 2009, $1.1 million was accrued related to the restructuring charges, which are expected to be paid through 2010.
In the year ended December 31, 2009, we had the following activity in our restructuring accruals (in thousands):
| Balance at December 31, 2008 |
Additions | Payments | Reductions | Balance at December 31, 2009 | ||||||||||||
| Restructuring costs |
$ | 786 | $ | 3,496 | $ | (3,219 | ) | $ | — | $ | 1,063 | |||||
8. SEGMENT REPORTING
Reportable Segments
We have two reportable business segments for financial reporting purposes that are distinguished primarily on the basis of services offered:
| • | Trucking, which consists of truckload transportation of bulk chemicals; and |
| • | Container Services, specifically International Organization for Standardization, or ISO tank container transportation and depot services. |
Segment revenues and operating income include the allocation of fuel surcharge to the trucking and container services segments. The operating income reported in our segments excludes amounts reported in Other operating income, such as gains and losses on disposal of property and equipment, restructuring costs, impairment charge, corporate and other unallocated amounts. Corporate and unallocated amounts include depreciation and amortization and other gains and losses. Although these amounts are excluded from the business segment results, they are included in reported consolidated earnings. Included in Other revenue are revenues from our tank wash services and other value-added services. We have not provided specific asset information by segment, as it is not regularly provided to our chief operating decision maker for review.
F-20
Table of Contents
Quality Distribution, Inc. and Subsidiaries
Notes to Consolidated Financial Statements—(Continued)
For the Years Ended December 31, 2009, 2008 and 2007
Summarized segment data and a reconciliation to (loss) income before income taxes for the years ended December 31 (in thousands):
| 2009 | 2008 | 2007 | ||||||||||
| Operating revenues: |
||||||||||||
| Trucking |
$ | 460,390 | $ | 653,618 | $ | 666,199 | ||||||
| Container Services |
79,499 | 89,715 | 12,168 | |||||||||
| Other revenue |
73,720 | 71,957 | 73,191 | |||||||||
| Total |
613,609 | 815,290 | 751,558 | |||||||||
| Operating income: |
||||||||||||
| Trucking |
35,217 | 41,291 | 37,421 | |||||||||
| Container Services |
11,287 | 10,934 | (93 | ) | ||||||||
| Other operating income |
3,984 | 3,988 | 5,028 | |||||||||
| Total segment operating income |
50,488 | 56,213 | 42,356 | |||||||||
| Depreciation and amortization expense |
20,218 | 21,002 | 17,544 | |||||||||
| Impairment charge (1) |
148,630 | — | — | |||||||||
| Other (income) expense |
(3,184 | ) | 2,233 | 959 | ||||||||
| Total |
(115,176 | ) | 32,978 | 23,853 | ||||||||
| Interest expense |
28,335 | 35,545 | 31,342 | |||||||||
| Interest income |
(288 | ) | (426 | ) | (818 | ) | ||||||
| Other expense (income) |
62 | (19,193 | ) | 2,971 | ||||||||
| (Loss) Income before income taxes |
$ | (143,285 | ) | $ | 17,052 | $ | (9,642 | ) | ||||
| (1) | Includes an impairment charge of $144.3 million related to our trucking segment and an impairment charge of $4.3 million related to our container services segment. |
F-21
Table of Contents
Quality Distribution, Inc. and Subsidiaries
Notes to Consolidated Financial Statements—(Continued)
For the Years Ended December 31, 2009, 2008 and 2007
9. GEOGRAPHIC SEGMENTS
Our operations are located primarily in the United States, Canada, and Mexico. Inter-area sales are not significant to the total revenue of any geographic area. Information about our operations in different geographic areas for the years ended December 31 is as follows (in thousands):
| 2009 | |||||||||||
| U.S. | International | Consolidated | |||||||||
| Total operating revenues |
$ | 576,405 | $ | 37,204 | $ | 613,609 | |||||
| Operating (loss) income |
(119,288 | ) | 4,112 | (115,176 | ) | ||||||
| Long-term identifiable assets (1) |
137,807 | 7,989 | 145,796 | ||||||||
| 2008 | |||||||||||
| U.S. | International | Consolidated | |||||||||
| Total operating revenues |
$ | 763,155 | $ | 52,135 | $ | 815,290 | |||||
| Operating income |
28,043 | 4,935 | 32,978 | ||||||||
| Long-term identifiable assets (1) |
164,068 | 7,322 | 171,390 | ||||||||
| 2007 | |||||||||||
| U.S. | International | Consolidated | |||||||||
| Total operating revenues |
$ | 698,797 | $ | 52,761 | $ | 751,558 | |||||
| Operating income |
17,415 | 6,438 | 23,853 | ||||||||
| Long-term identifiable assets (1) |
138,827 | 7,332 | 146,159 | ||||||||
| (1) | includes property and equipment and intangible assets. |
10. ACCOUNTS RECEIVABLE
Accounts receivable consisted of the following at December 31 (in thousands):
| 2009 | 2008 | |||||||
| Trade accounts receivable |
$ | 64,810 | $ | 76,871 | ||||
| Affiliate and independent owner-operator receivables |
5,401 | 4,981 | ||||||
| Other receivables |
1,218 | 2,698 | ||||||
| 71,429 | 84,550 | |||||||
| Less allowance for doubtful accounts |
(1,804 | ) | (2,938 | ) | ||||
| $ | 69,625 | $ | 81,612 | |||||
The activity in the allowance for doubtful accounts for the years ended December 31 is as follows (in thousands):
| 2009 | 2008 | |||||||
| Balance, beginning of period |
$ | 2,938 | $ | 3,454 | ||||
| Adjustment to bad debt expense |
1,838 | 1,086 | ||||||
| Write-offs, net of recoveries |
(2,972 | ) | (1,602 | ) | ||||
| Balance, end of period |
$ | 1,804 | $ | 2,938 | ||||
F-22
Table of Contents
Quality Distribution, Inc. and Subsidiaries
Notes to Consolidated Financial Statements—(Continued)
For the Years Ended December 31, 2009, 2008 and 2007
11. PROPERTY AND EQUIPMENT
Property and equipment consisted of the following at December 31 (in thousands):
| 2009 | 2008 | |||||||
| Land and improvements |
$ | 12,041 | $ | 12,041 | ||||
| Buildings and improvements |
21,642 | 27,248 | ||||||
| Revenue equipment |
247,110 | 266,482 | ||||||
| Other equipment |
29,739 | 53,377 | ||||||
| Total property and equipment |
310,532 | 359,148 | ||||||
| Accumulated depreciation |
(183,203 | ) | (210,456 | ) | ||||
| Property and equipment, net |
$ | 127,329 | $ | 148,692 | ||||
From time to time, we identify real properties that are not needed in our current operations and such properties are sold. During 2008, we sold four properties with a net book value of approximately $0.7 million for which we recognized a $2.2 million gain.
Depreciation expense was $18.6 million, $19.3 million and $17.2 million for the years ending December 31, 2009, 2008 and 2007, respectively. At December 31, 2009 and 2008, we had $23.5 million and $26.5 million of capitalized cost and $6.1 million and $4.0 million of accumulated depreciation of equipment under capital leases, respectively, included in revenue equipment in the above schedule.
12. GOODWILL AND INTANGIBLE ASSETS
Goodwill
Under the FASB guidance, goodwill and intangible assets are subject to an annual impairment test as well as impairment assessments of certain triggering events. We evaluate goodwill for impairment by determining the fair value based on criteria in the FASB guidance for each reporting unit, our trucking segment and our container services segment. These reporting units contain goodwill and other identifiable intangible assets as a result of previous business acquisitions. Our annual impairment test is performed during the second quarter with a measurement date of June 30th. The methodology applied in the analysis performed this current fiscal year at June 30, 2009 was consistent with the methodology applied in prior years, but was based on updated assumptions, as appropriate. As a result of our analysis we concluded a total impairment charge to goodwill of $146.2 million was necessary at June 30, 2009, of which $144.3 million was related to our trucking segment, eliminating 100% of the carrying amount of goodwill of that segment, and $1.9 million was related to our container services segment. We continued to evaluate indicators of impairment quarterly following our annual goodwill impairment test at June 30, 2009 through year end 2009, including the quarter ended December 31, 2009. There were no indications that a triggering event had occurred for the remainder of the year ended December 31, 2009. As of December 31, 2009, we had total goodwill of $27.0 million, all of which relates to our container services segment.
We have evaluated at least quarterly whether indicators of impairment in accordance with applicable guidance. Prior to our June 30, 2009 analysis, we did not believe that factors attributable to the economic downturn would impact the recoverability of our goodwill. Our performance since the prior period’s goodwill impairment test at June 30, 2008 through year end 2008 trended positive and there were no indications from our quarterly reviews that a triggering event had occurred. The first quarter of 2009 showed improved operating income year over year and strong operating cash flow; however, due to the continuing economic downturn, we
F-23
Table of Contents
Quality Distribution, Inc. and Subsidiaries
Notes to Consolidated Financial Statements—(Continued)
For the Years Ended December 31, 2009, 2008 and 2007
reviewed not only our market capitalization, but also performed a discounted cash flow analysis based on assumptions adjusted to reflect the current economic environment and which we believed to be appropriate at the time. The conclusions from our extended analysis at March 31, 2009 did not indicate a trend in operating results that would foretell of impairment to our goodwill. For our June 30, 2009 analysis, we adjusted further our assumptions used, such as growth and discount rates, in the annual impairment test to reflect the persistence of the downward economic trend.
As the result of the impairment charge, we determined that we were in a cumulative loss position. Based on this negative evidence we concluded that it was no longer more likely than not that our net deferred tax asset was realizable. For purposes of assessing realizability of the deferred tax assets, this cumulative financial reporting loss position is considered significant negative evidence we will not be able to fully realize the deferred tax assets in the future. As a result, a $41.2 million deferred tax valuation allowance was recorded. Our judgments regarding future taxable income may change due to changes in market conditions, changes in tax laws, operating results or other factors. If any of these factors and related estimates change in the future, it may increase or decrease the valuation allowance and related income tax expense in the same period
Under the FASB guidance, the process of evaluating the potential impairment of goodwill requires significant judgment at many points during the analysis and involves a two-step process. In the first step, we determine whether there is an indication of impairment by comparing the fair value of a reporting unit to its carrying amount, including goodwill. If, based on the first step, we determine that there is an indication of goodwill impairment, the Company will measure any identified goodwill impairment in accordance with the FASB guidance.
In the first step, we determine the fair value for our reporting units using a combination of two valuation approaches: the market approach and the income approach. The market approach uses a guideline company methodology which is based upon a comparison of us to similar publicly-traded companies within our industry. We derive a market value of invested capital or business enterprise value for each comparable company by multiplying the price per share of common stock of the publicly traded companies by their total common shares outstanding and adding each company’s current level of debt. We calculate a business enterprise multiple based on revenue and earnings from each company then apply those multiples to each reporting unit’s revenue and earnings to conclude a reporting unit business enterprise value. Assumptions regarding the selection of comparable companies are made based on, among other factors, capital structure, operating environment and industry. As the comparable companies were typically larger and more diversified than our reporting units, multiples were adjusted prior to application to our reporting units’ revenues and earnings to reflect differences in margins, long-term growth prospects and market capitalization.
The income approach uses a discounted debt-free cash flow analysis to measure fair value by estimating the present value of future economic benefits. To perform the discounted debt-free cash flow analysis, we develop a pro forma analysis of each reporting unit to estimate future available debt-free cash flow and discounting estimated debt-free cash flow by an estimated industry weighted average cost of capital based on the same comparable companies used in the market approach. Per the FASB guidance, the weighted average cost of capital is based on inputs (e.g., capital structure, risk, etc.) from a market participant’s perspective and not necessarily from the reporting unit or QDI’s perspective. Future cash flow is projected based on assumptions for our economic growth, industry expansion, future operations and the discount rate, all of which require significant judgments by management.
F-24
Table of Contents
Quality Distribution, Inc. and Subsidiaries
Notes to Consolidated Financial Statements—(Continued)
For the Years Ended December 31, 2009, 2008 and 2007
As of December 31, 2008 and 2007 the goodwill balance was $173.5 million and $173.6 million, respectively. The allocation of goodwill changed from 2007 to 2008 due to the requirement to report segment operating results because of our December 2007 acquisition of Boasso, which created two reportable business segments for financial reporting purposes specifically, trucking and container services. Per FASB guidance, when an entity reorganizes its reporting structure, goodwill shall be reassigned to reporting units affected using a relative fair value allocation approach. Based on the relative fair values of the reporting units, goodwill of $3.9 million and $1.1 million was reallocated from Other and Container Services, respectively, to the Trucking segment.
Pursuant to the Stock Purchase Agreement between our company and Boasso America Corporation, and based on an evaluation of the net working capital as of the date of the acquisition, approximately $1.3 million of the purchase price was refunded to us in cash. Additionally during fiscal 2008, $0.3 million of additional liabilities were recorded with a corresponding increase in goodwill. Therefore, the goodwill in fiscal 2008 was reduced by a net $1.0 million related to these purchase price adjustments. The goodwill in fiscal 2009 was reduced by $0.3 million due to a final purchase price adjustment.
Goodwill by segment and the related changes for each segment for 2008 were as follows (in thousands):
| 2007 | Acquisitions | Purchase Price Adjustments |
Reallocation | 2008 | |||||||||||||
| Trucking |
$ | 138.4 | $ | 0.9 | — | $ | 5.0 | $ | 144.3 | ||||||||
| Container services |
31.3 | — | (1.0 | ) | (1.1 | ) | 29.2 | ||||||||||
| Other revenue |
3.9 | — | — | (3.9 | ) | — | |||||||||||
| $ | 173.6 | $ | 0.9 | $ | (1.0 | ) | $ | — | $ | 173.5 | |||||||
Goodwill by segment and the related changes by segment for 2009 were as follows (in thousands):
| 2008 | Impairment | Purchase Price Adjustments |
2009 | |||||||||||
| Trucking |
$ | 144.3 | $ | (144.3 | ) | — | $ | — | ||||||
| Container services |
29.2 | (1.9 | ) | (0.3 | ) | 27.0 | ||||||||
| Other revenue |
— | — | — | — | ||||||||||
| $ | 173.5 | $ | (146.2 | ) | $ | (0.3 | ) | $ | 27.0 | |||||
Intangible Assets
Intangible assets at December 31, 2009 are as follows (in thousands):
| Gross value |
Accumulated amortization |
Impairment Charge |
Sold to third party |
Net book value |
Average lives (in years) | |||||||||||||||
| Tradename |
$ | 9,800 | $ | — | $ | (2,400 | ) | $ | — | $ | 7,400 | Indefinite | ||||||||
| Customer relationships |
11,998 | (2,031 | ) | — | (51 | ) | 9,916 | 12 | ||||||||||||
| Non-compete agreements |
3,053 | (1,768 | ) | — | (134 | ) | 1,151 | 3 – 5 | ||||||||||||
| $ | 24,851 | $ | (3,799 | ) | $ | (2,400 | ) | $ | (185 | ) | $ | 18,467 | ||||||||
F-25
Table of Contents
Quality Distribution, Inc. and Subsidiaries
Notes to Consolidated Financial Statements—(Continued)
For the Years Ended December 31, 2009, 2008 and 2007
Amortization expense for the years ended December 31, 2009, 2008, and 2007 was $1.6 million, $1.7 million and $0.3 million, respectively. Estimated amortization expense for intangible assets are as follows (in thousands):
| 2010 |
$ | 1,543 | |
| 2011 |
1,369 | ||
| 2012 |
1,205 | ||
| 2013 |
996 | ||
| 2014 and after |
5,954 |
13. ACCOUNTS PAYABLE AND ACCRUED EXPENSES
Accounts payable includes $0.1 million and $7.9 million of book overdrafts at December 31, 2009 and 2008, respectively.
Accrued expenses include the following at December 31 (in thousands):
| 2009 | 2008 | |||||
| Salaries, wages and benefits |
$ | 5,505 | $ | 7,215 | ||
| Accrued interest |
4,679 | 4,375 | ||||
| Claims and deposits |
3,747 | 4,917 | ||||
| Taxes |
1,435 | 1,671 | ||||
| Other |
6,012 | 7,179 | ||||
| $ | 21,378 | $ | 25,357 | |||
14. LONG-TERM INDEBTEDNESS
Long-term debt consisted of the following at December 31 (in thousands):
| 2009 | 2008 | |||||||
| Capital lease obligations |
$ | 17,165 | $ | 23,816 | ||||
| ABL Facility |
68,000 | 87,000 | ||||||
| Senior Floating Rate Notes due 2012 |
501 | 135,000 | ||||||
| 9% Senior Subordinated Notes due 2010 |
16,031 | 100,761 | ||||||
| 10% Senior Notes due 2013 |
134,499 | — | ||||||
| 11.75% Senior Subordinated PIK Notes due 2013 |
81,211 | — | ||||||
| Boasso Note |
— | 2,500 | ||||||
| Other Notes |
12,560 | 16,855 | ||||||
| Long-term debt, including current maturities |
329,967 | 365,932 | ||||||
| Discount on Senior Floating Rate Notes |
(8,683 | ) | (3,346 | ) | ||||
| 321,284 | 362,586 | |||||||
| Less current maturities of long-term debt (including capital lease obligations) |
(25,188 | ) | (16,355 | ) | ||||
| Long-term debt, less current maturities |
$ | 296,096 | $ | 346,231 | ||||
F-26
Table of Contents
Quality Distribution, Inc. and Subsidiaries
Notes to Consolidated Financial Statements—(Continued)
For the Years Ended December 31, 2009, 2008 and 2007
Our principal debt sources at December 31, 2009 comprise $16.0 million aggregate principal amount of 9% Senior Subordinated Notes due 2010 (the “9% Notes”), $0.5 million principal amount of our Senior Floating Rate Notes due 2012 (the “2012 Notes”), $134.5 million aggregate principal amount of 10% Senior Notes due 2013 (the “2013 Senior Notes”), $81.2 million aggregate principal amount of 11.75% Senior Subordinated PIK Notes due 2013 (“2013 PIK Notes”) and a $225 million asset-based loan facility (the “ABL Facility”).
The ABL Facility
The ABL Facility which was effective December 18, 2007, consists of a current asset-based revolving facility in an amount of $200.0 million (the “current asset tranche”) and a fixed asset-based revolving facility in an amount of $25.0 million (the “fixed asset tranche”). The total commitments under the fixed asset tranche will be reduced and the total commitments under the current asset tranche correspondingly increased by $5.0 million on December 18, 2010. Borrowings of revolving loans under the ABL Facility are allocated pro rata to the current asset tranche and the fixed asset tranche based on the then-current asset borrowing base and the then-current fixed asset borrowing base. The ABL Facility matures June 18, 2013. The maturity date of the ABL Facility may be accelerated if we default on our obligations under the ABL Facility.
The ABL Facility includes borrowing capacity of up to $150.0 million for letters of credit, which are allocated pro rata between the two tranches based on the then-current borrowing base for each tranche (or, if the credit extensions under the fixed asset tranche are repaid and the commitments there under are terminated prior to the termination of the ABL Facility, to the current asset tranche), and up to $10.0 million for swingline borrowings on same-day notice, which are allocated under the current asset tranche. The proceeds of the ABL Facility were used, together with the proceeds from an additional private offering of $50 million of Senior Floating Rate Notes (described below under “Senior Floating Rate Notes”), to finance a portion of the Boasso acquisition. The ABL Facility contains a fixed charge coverage ratio of 1.0 to 1.0 which only needs to be met if borrowing availability is less than $20 million. At December 31, 2009, we had $44.7 million of borrowing availability under the ABL Facility.
Borrowings under the ABL Facility bear interest at a rate equal to an applicable margin plus, at our option, either a base rate or LIBOR. The applicable margin for borrowings under the current asset tranche at December 31, 2009 was 1.00% with respect to base rate borrowings and 2.00% with respect to LIBOR borrowings. The applicable margin for borrowings under the fixed asset tranche at December 31, 2009 was 1.25% with respect to base rate borrowings and 2.25% with respect to LIBOR borrowings. The applicable margin for such borrowings will be reduced or increased based on the aggregate borrowing base availability under the ABL Facility over the life of the ABL Facility. The base rate for the ABL Facility is the higher of the prime rate and the federal funds overnight rate plus 0.50%. We are also required to pay a fee for utilized commitments under the ABL Facility at a rate equal to 0.25% per annum. The ABL Facility is required to be prepaid only to the extent that the aggregate amount of outstanding borrowings, unreimbursed letter of credit drawings and undrawn letters of credit under the relevant tranche exceeds the lesser of the applicable commitments and the applicable borrowing base in effect at such time for such tranche. The borrowing base for the current asset tranche consists of eligible accounts receivable, eligible inventory and eligible truck and trailer fleet, and the borrowing base for the fixed asset tranche consists of eligible real property and certain eligible equipment. We may voluntarily repay outstanding loans under the ABL Facility at any time without premium or penalty, other than customary “breakage” costs with respect to LIBOR loans. The interest rate on the ABL Facility at December 31, 2009 and 2008 was 2.4% and 3.3%, respectively. The weighted average interest rate during fiscal year 2009 was 2.4%. All obligations under the ABL Facility are guaranteed by QDI and each of our wholly-owned domestic restricted subsidiaries (other than our immaterial subsidiaries). Obligations under the current
F-27
Table of Contents
Quality Distribution, Inc. and Subsidiaries
Notes to Consolidated Financial Statements—(Continued)
For the Years Ended December 31, 2009, 2008 and 2007
asset tranche, and the guarantees of those obligations (as well as cash management obligations and any interest hedging or other swap agreements), are secured by a first priority lien on certain assets of QD LLC and the guarantors, including eligible accounts, eligible inventory and eligible truck and trailer fleet (“current asset tranche priority collateral”) and a second priority lien on all other assets of QD LLC and the guarantors, including eligible real property and certain eligible equipment (“fixed asset tranche priority collateral”). Obligations under the fixed asset tranche, and the guarantees of those obligations, are secured by a first-priority lien on fixed asset tranche priority collateral and a second priority lien on current asset tranche priority collateral.
We incurred $6.9 million in debt issuance costs relating to the ABL Facility. We are amortizing these costs over the term of the ABL Facility.
9% Senior Subordinated Notes Due 2010
On September 30, 2003, we issued $125.0 million aggregate principal amount of our 9% Notes. During the fourth quarter of 2008 and the first quarter of 2009, we repurchased $25.2 million in principal amount of the 9% Notes. On October 15, 2009, we completed exchange and tender offers to exchange approximately $80.7 million of our 9% Notes for $80.7 million aggregate principal amount of our new 2013 PIK Notes and approximately 1.75 million warrants and retired an additional $2.9 million of our 9% Notes for $1.8 million in cash. Upon the completion of the exchange and tender offer, we also amended the 9% Notes to eliminate or waive substantially all of the restrictive covenants, to eliminate certain events of default, to modify covenants regarding mergers and consolidations and modify or eliminate certain other provisions contained in the indentures governing the 9% Notes. As of December 31, 2009, approximately $16.0 million total principal amount of the 9% Notes remained outstanding.
The 9% Notes are the unsecured and senior subordinated obligations of QD LLC and QD Capital and are fully and unconditionally guaranteed on an unsecured and senior subordinated basis, jointly and severally, by QDI and certain of its U.S. restricted subsidiaries. We have the right to redeem the 9% Notes in whole or in part from time to time at 100% of the principal amount plus accrued and unpaid interest if any, to the date of redemption. The 9% Notes will mature on November 15, 2010. Interest on the 9% Notes is payable at the rate of 9% per annum and is payable semi-annually in cash on each May 15 and November 15.
We incurred $5.5 million in debt issuance costs relating to the issuance of the 9% Notes. During 2008 and 2009, we wrote-off approximately $0.3 million in debt issuance costs relating to repurchases of 9% Notes. Additionally $0.5 million of unamortized debt issuance costs relating to the 9% Notes are included in debt issuance costs related to the 2013 PIK Notes following their exchange for the 9% Notes. We are amortizing the remaining $0.1 million of debt issuance costs over the remaining term of the 9% Notes.
Senior Floating Rate Notes Due 2012
On January 28, 2005, we issued $85.0 million aggregate principal amount of our 2012 Notes. On December 18, 2007, we issued a second series of 2012 Notes in the original principal amount of $50.0 million. On October 15, 2009, we completed exchange and tender offers to exchange approximately $134.5 million of 2012 Notes for $134.5 million of our 2013 Senior Notes. Upon the completion of the exchange offer, we amended the 2012 Notes to eliminate or waive substantially all of the restrictive covenants, to eliminate certain events of default, to modify covenants regarding mergers and consolidations and modify or eliminate certain other provisions contained in the indentures governing the 2012 Notes. As of December 31, 2009, approximately $0.5 million total principal amount of the 2012 Notes remained outstanding.
F-28
Table of Contents
Quality Distribution, Inc. and Subsidiaries
Notes to Consolidated Financial Statements—(Continued)
For the Years Ended December 31, 2009, 2008 and 2007
The 2012 Notes are the unsecured and unsubordinated obligations of QD LLC and QD Capital and are fully and unconditionally guaranteed on an unsecured and unsubordinated basis, jointly and severally, by QDI and certain of its U.S. restricted subsidiaries. We may redeem all or any portion of the 2012 Notes upon not less than 30, nor more than 60, days’ notice at 100% of the principal amount plus accrued and unpaid interest if any, to the date of redemption. The 2012 Notes will mature on January 15, 2012. Interest on the 2012 Notes is payable quarterly in cash in arrears on each January 15, April 15, July 15 and October 15. The interest rate on the 2012 Notes at December 31, 2009 and 2008 was 4.8% and 9.3%, respectively. The weighted average interest rate during fiscal year 2009 and 2008 was 5.3% and 8.4%, respectively.
We incurred $2.5 million in debt issuance costs relating to the initial $85.0 million of the 2012 Notes and $2.3 million related to the second $50.0 million of the 2012 Notes. All of these unamortized debt issuance costs are included in debt issuance costs related to the 2013 Senior Notes in connection with the exchange offer.
10% Senior Notes Due 2013
On October 15, 2009, we issued approximately $134.5 million aggregate principal amount of our 2013 Senior Notes. The 2013 Senior Notes are the unsecured and unsubordinated obligations of QD LLC and QD Capital and are fully and unconditionally guaranteed on an unsecured and unsubordinated basis, jointly and severally, by QDI and certain of our U.S. restricted subsidiaries.
In connection with the issuance of the 2013 Senior Notes, we have agreed pursuant to a registration rights agreement to file a registration statement, relating to an offer to exchange the 2013 Senior Notes for new debt securities which are substantially identical in all material respects, by February 12, 2010, and to use our commercially reasonable efforts to cause the registration statement to be declared effective by the SEC by April 13, 2010. The registration statement was filed pursuant to these obligations on December 18, 2009. If the registration statement is not declared effective by the SEC by April 13, 2010 or if we do not consummate the exchange offer by May 23, 2010, we will be required to pay additional interest.
Interest on the 2013 Senior Notes is payable at a rate of 10% per annum, semiannually on June 1 and December 1 of each year, commencing on June 1, 2010. The 2013 Senior Notes mature on June 1, 2013.
We may redeem the 2013 Senior Notes, in whole or part, at any time at a price equal to 100% of the principal amount of the 2013 Senior Notes redeemed plus accrued and unpaid interest to the redemption date. Subject to certain conditions, we are obligated to redeem $6.0 million of 2013 Senior Notes on each June 1 and December 1, commencing December 1, 2010. Beginning in 2011, promptly following the delivery of our Annual Report on Form 10-K for each fiscal year, the 2013 Senior Notes are subject to additional mandatory redemption in an amount equal to 50% of the excess cash flow we generate minus $12.0 million. Both required redemption amounts will be reduced to the extent necessary so that:
| • | the sum of borrowing availability under the ABL Facility, plus unrestricted cash and cash equivalents, is at least $37.5 million; |
| • | the minimum borrowing availability requirements under the ABL Facility are satisfied; |
| • | there is fixed charge coverage ratio of at least 1.0 to 1.0 as calculated under the ABL Facility; and |
| • | no other event of default is otherwise caused under the ABL Facility by the redemption. |
The required redemption amounts are also reduced by any optional redemptions and repurchases during the redemption period.
F-29
Table of Contents
Quality Distribution, Inc. and Subsidiaries
Notes to Consolidated Financial Statements—(Continued)
For the Years Ended December 31, 2009, 2008 and 2007
We recorded $3.6 million in debt issuance costs relating to the 2013 Senior Notes, of which $2.0 million of unamortized debt issuance costs related to the 2012 Notes and $1.6 million was related to the new issuance. We are amortizing these costs over the remaining term of the 2013 Senior Notes.
11.75% Senior Subordinated PIK Notes Due 2013
On October 15, 2009, we issued $80.7 million aggregate principal amount of our 2013 PIK Notes. The 2013 PIK Notes are the unsecured and senior subordinated obligations of QD LLC and QD Capital and are fully and unconditionally guaranteed on an unsecured and senior subordinated basis, jointly and severally, by QDI and certain of our U.S. restricted subsidiaries.
In connection with the issuance of the 2013 PIK Notes, we have agreed pursuant to registration rights agreements to file a registration statement, relating to an offer to exchange the 2013 PIK Notes for new debt securities which are substantially identical in all material respects, by February 12, 2010, and to use our commercially reasonable efforts to cause the registration statement to be declared effective by the SEC by April 13, 2010. The registration statement was filed pursuant to these obligations on December 18, 2009. If the registration statement is not declared effective by the SEC by April 13, 2010 or if we do not consummate the exchange offer by May 23, 2010, we will be required to pay additional interest.
Interest is payable on the 2013 PIK Notes at 11.75% per annum, payable 9% in cash and 2.75% in the form of additional 2013 PIK Notes, quarterly on February 1, May 1, August 1 and November 1 of each year, commencing on February 1, 2010.
The 2013 PIK Notes mature on November 1, 2013. We may redeem the 2013 PIK Notes, in whole or part, at any time prior to October 15, 2010, at a price equal to 100% of the principal amount of the 2013 PIK Notes redeemed plus accrued and unpaid interest to the redemption date plus an additional “make-whole premium.” After October 15, 2010, we may redeem the Subordinated Notes, in whole or part, at any time at a price equal to 100% of the principal amount of the Subordinated Notes redeemed plus accrued and unpaid interest to the redemption date. Additionally, at any time prior to October 15, 2010, we may redeem up to 35% of the principal amount of the 2013 PIK Notes at a redemption price equal to 11.75% of the face amount thereof with the net proceeds of one or more equity offerings so long as at least 65% of the aggregate original principal amount of the 2013 PIK Notes remains outstanding afterwards.
We recorded $1.5 million in debt issuance costs relating to the 2013 PIK Notes, of which $0.5 million of unamortized debt issuance costs related to the 9% Notes and $1.0 million was related to the new issuance. In addition, we recorded $6.7 million in note issuance discount due to the warrants issued. The amount represents the fair market value of the warrants at time of issuance. We are amortizing these costs over the remaining term of the 2013 PIK Notes.
Accounting Treatment of Note Exchanges and Redemption of Notes for Cash
The exchanges of a portion of the 9% Notes and 2012 Notes for 2013 PIK Notes and 2013 Senior Notes (collectively, “the 2013 Notes”), respectively, described above were treated as a debt modification in accordance with applicable FASB guidance. We did not recognize a gain or loss on the modification since the exchanges were a par for par exchange.
The portion of the 9% Notes redeemed for cash was treated as an extinguishment of debt resulting in a gain on extinguishment of $1.1 million.
F-30
Table of Contents
Quality Distribution, Inc. and Subsidiaries
Notes to Consolidated Financial Statements—(Continued)
For the Years Ended December 31, 2009, 2008 and 2007
Under applicable FASB guidance, costs incurred in connection with a modification and any existing unamortized discount are amortized as an adjustment to interest expense over the remaining term of the modified debt instruments using the effective interest method. Accordingly, a pro-rata share of the existing unamortized deferred financing costs and original issue discount related to the 9% Notes and the 2012 Notes that were exchanged has been aggregated with the debt issuance costs and original issue discount related the 2013 Notes, and will be amortized over the remaining term of these new notes.
The remaining 9% Notes which were not exchanged, will continue to be accounted for in the same manner prior to the exchange, as the original terms related to the remaining balances did not change. The unamortized deferred financing costs associated with the remaining 9% Notes will continue to be amortized over the original term of the 9% Notes.
Boasso Note
The Boasso Note was a $2.5 million 7% promissory note with a maturity on December 18, 2009 issued as part of the purchase price of the Boasso acquisition. The holder of the Boasso Note had the option to require prepayment of the Boasso note, which he exercised on December 18, 2008. The Boasso Note was paid in full in January 2009.
Collateral, Guarantees and Covenants
The ABL Facility contains a number of covenants that, among other things, restrict, subject to certain exceptions, our ability to (i) sell assets; (ii) incur additional indebtedness; (iii) prepay other indebtedness (including the 2013 Senior Notes, the 2012 Notes, the 2013 PIK Notes and the 9% Notes); (iv) repurchase or pay dividends on QDI’s common stock; (v) create liens on assets; (vi) make investments; (vii) make certain acquisitions; (viii) engage in mergers or consolidations; (ix) engage in certain transactions with affiliates; (x) amend certain charter documents and material agreements governing subordinated indebtedness, including the 2013 Senior Notes, the 2012 Notes, the 2013 PIK Notes and the 9% Notes; (xi) change the business conducted by us and our subsidiaries; and (xii) enter into agreements that restrict dividends from subsidiaries. The ABL Facility also contains certain customary events of default, which, if any of them occurs, may result in the principal, interest and any other monetary obligations under the ABL Facility becoming immediately payable.
The indentures governing our 2013 Senior Notes and our 2013 PIK Notes contain covenants that restrict, subject to certain exceptions, our ability to, among other things: (i) incur additional debt or issue certain preferred shares; (ii) pay dividends on or make other distributions in respect of QDI’s common stock or make other restricted payments; (iii) make certain investments; (iv) sell certain assets; (v) create or permit to exist dividend and/or payment restrictions affecting their restricted subsidiaries; (vi) create liens on certain assets to secure debt; (vii) consolidate, merge, sell or otherwise dispose of all or substantially all of their assets; (viii) enter into certain transactions with their affiliates; and (ix) designate their subsidiaries as unrestricted subsidiaries. The indentures also provide certain customary events of default, which, if any of them occurs, may result in the principal, interest and any other monetary obligations on the then outstanding 2013 Senior Notes and 2013 PIK Notes becoming payable immediately.
The payment obligations under the ABL Facility are senior secured obligations of QD LLC and QD Capital and are secured by certain assets and its subsidiaries. The payment obligations of QD LLC and QD Capital under the 9% Notes, the 2012 Notes, the 2013 Senior Notes and the 2013 PIK Notes are guaranteed by QDI, and by all of its domestic subsidiaries. The 9% Notes and the 2013 PIK Notes, and the guarantees thereof are senior subordinated unsecured obligations ranking junior in right of payment to all of our existing and future senior
F-31
Table of Contents
Quality Distribution, Inc. and Subsidiaries
Notes to Consolidated Financial Statements—(Continued)
For the Years Ended December 31, 2009, 2008 and 2007
debt, and all liabilities of our subsidiaries that do not guarantee the 9% Notes and the 2013 PIK Notes, as applicable. All of the notes are effectively junior to all of our existing and future secured debt, including borrowings under the ABL Facility, to the extent of the value of the assets securing such debt.
We were in compliance with the covenants under the ABL Facility, the 2013 Senior Notes and the 2013 PIK Notes at December 31, 2009.
Debt Retirement
The following is a schedule of our indebtedness at December 31, 2009 over the periods we are required to pay such indebtedness (in thousands):
| 2010 | 2011 | 2012 | 2013 | 2014 and after |
Total | |||||||||||||
| Capital lease obligations |
$ | 5,322 | $ | 4,279 | $ | 4,748 | $ | 2,253 | $ | 563 | $ | 17,165 | ||||||
| ABL Facility |
— | — | — | 68,000 | — | 68,000 | ||||||||||||
| 9% Senior Subordinated Notes, due 2010 |
16,031 | — | — | — | — | 16,031 | ||||||||||||
| Senior Floating Rate Notes, due 2012 |
— | — | 501 | — | — | 501 | ||||||||||||
| 10% Senior Notes, due 2013 (1) |
— | — | — | 134,499 | — | 134,499 | ||||||||||||
| 11.75% Senior Subordinated PIK Notes, due 2013 (1) |
— | — | — | 81,211 | — | 81,211 | ||||||||||||
| Other Notes |
3,835 | 2,311 | 2,104 | 2,231 | 2,079 | 12,560 | ||||||||||||
| Total |
$ | 25,188 | $ | 6,590 | $ | 7,353 | $ | 288,194 | $ | 2,642 | $ | 329,967 | ||||||
| (1) | Amounts do not include the remaining aggregate unamortized original issue discount of $8.7 million. |
The following table represents our debt issuance costs at December 31, 2009 and 2008 (in thousands):
| 2008 | Write-off of Issuance Costs |
Additional Debt Issuance Costs |
Transfer Related to Exchange Offers |
Current year amortization expense |
2009 | ||||||||||||||||
| ABL Facility |
$ | 5,552 | $ | — | $ | — | $ | — | $ | (1,268 | ) | $ | 4,284 | ||||||||
| 9% Senior Subordinated Notes, due 2010 |
1,150 | (20 | ) | — | (537 | ) | (524 | ) | 69 | ||||||||||||
| Senior Floating Rate Notes, due 2012 |
2,794 | — | — | (2,059 | ) | (735 | ) | — | |||||||||||||
| 10% Senior Notes, due 2013 |
— | — | 1,584 | 2,059 | (218 | ) | 3,425 | ||||||||||||||
| 11.75% Senior Subordinated PIK Notes, due 2013 |
— | — | 970 | 537 | (81 | ) | 1,426 | ||||||||||||||
| Total |
$ | 9,496 | $ | (20 | ) | $ | 2,554 | $ | — | $ | (2,826 | ) | $ | 9,204 | |||||||
Amortization expense of deferred issuance costs was $2.8 million, $3.0 million, and $1.9 million for years ending December 31, 2009, 2008, and 2007, respectively. We are amortizing these costs over the term of the debt instruments.
F-32
Table of Contents
Quality Distribution, Inc. and Subsidiaries
Notes to Consolidated Financial Statements—(Continued)
For the Years Ended December 31, 2009, 2008 and 2007
Liquidity
We believe that, based on current operations and anticipated growth, our cash flow from operations, together with available sources of liquidity, including borrowings under the ABL Facility, will be sufficient to fund anticipated capital expenditures, make required payments of principal and interest on our debt, including obligations under our credit agreement, and satisfy other long-term contractual commitments for the next twelve months.
However, for periods extending beyond twelve months, if our operating cash flow and borrowings under the revolving portions of the ABL Facility are not sufficient to satisfy our capital expenditures, debt service and other long-term contractual commitments, we would be required to seek alternative financing. These alternatives would likely include another restructuring or refinancing of our long-term debt, the sale of a portion or all of our assets or operations, or the sale of additional debt or equity securities. If these alternatives were not available in a timely manner or on satisfactory terms, or were not permitted under our existing agreements, we might default on some or all of our obligations. If we default on our obligations under our ABL Facility, the maturity date of the ABL may be accelerated. If this occurs, our assets might not be sufficient to repay in full all of our indebtedness, and we might be forced into bankruptcy.
15. INCOME TAXES
For financial reporting purposes, (loss) income before income taxes includes the following components (in thousands):
| 2009 | 2008 | 2007 | |||||||||
| Domestic |
$ | (144,136 | ) | $ | 15,950 | $ | (10,805 | ) | |||
| Mexico |
637 | 1,058 | 694 | ||||||||
| Canada |
214 | 44 | 469 | ||||||||
| (143,285 | ) | 17,052 | (9,642 | ) | |||||||
F-33
Table of Contents
Quality Distribution, Inc. and Subsidiaries
Notes to Consolidated Financial Statements—(Continued)
For the Years Ended December 31, 2009, 2008 and 2007
The components of the provision for (benefit from) income tax for the years ended December 31 are as follows (in thousands):
| 2009 | 2008 | 2007 | ||||||||||
| Current taxes: |
||||||||||||
| Federal |
$ | (792 | ) | $ | (211 | ) | $ | (168 | ) | |||
| State |
486 | (820 | ) | 1,119 | ||||||||
| Mexico |
92 | 298 | 300 | |||||||||
| Canada |
120 | 245 | 1,296 | |||||||||
| (94 | ) | (488 | ) | 2,547 | ||||||||
| Deferred taxes: |
||||||||||||
| Federal |
(3,609 | ) | 5,635 | (7,325 | ) | |||||||
| State |
(625 | ) | (417 | ) | 2,218 | |||||||
| Mexico |
— | — | (106 | ) | ||||||||
| Canada |
— | — | (131 | ) | ||||||||
| (4,234 | ) | 5,218 | (5,344 | ) | ||||||||
| Valuation Allowance |
||||||||||||
| Federal |
38,131 | 210 | 1,625 | |||||||||
| State |
3,446 | — | (907 | ) | ||||||||
| Mexico |
— | — | — | |||||||||
| Canada |
— | — | — | |||||||||
| 41,577 | 210 | 718 | ||||||||||
| Provision for (benefit from) income taxes |
$ | 37,249 | $ | 4,940 | $ | (2,079 | ) | |||||
F-34
Table of Contents
Quality Distribution, Inc. and Subsidiaries
Notes to Consolidated Financial Statements—(Continued)
For the Years Ended December 31, 2009, 2008 and 2007
The net deferred tax asset (liability) consisted of the following at December 31 (in thousands):
| 2009 | 2008 | |||||||
| Deferred tax assets: |
||||||||
| Environmental reserve |
$ | 7,848 | $ | 8,302 | ||||
| Tax credit carryforwards |
5,812 | 5,292 | ||||||
| Self-insurance reserves |
7,639 | 8,357 | ||||||
| Allowance for doubtful accounts |
699 | 1,109 | ||||||
| Pension |
7,409 | 7,414 | ||||||
| Net operating loss carryforwards |
36,596 | 37,559 | ||||||
| Accrued interest and original issue discount |
974 | — | ||||||
| Other accruals |
3,989 | 3,980 | ||||||
| Accrued losses and damage claims |
91 | 209 | ||||||
| 71,057 | 72,222 | |||||||
| Less valuation allowance |
(43,032 | ) | (1,855 | ) | ||||
| 28,025 | 70,367 | |||||||
| Deferred tax liabilities: |
||||||||
| Property and equipment basis differences |
(25,625 | ) | (24,687 | ) | ||||
| Intangible basis differences |
(2,400 | ) | (8,337 | ) | ||||
| Net deferred tax asset |
— | 37,343 | ||||||
| Comprised of: |
||||||||
| Current deferred tax asset |
5,506 | 14,707 | ||||||
| Long-term deferred tax asset |
— | 22,636 | ||||||
| Long-term deferred tax liability |
(5,506 | ) | — | |||||
| Net deferred tax asset |
$ | — | $ | 37,343 | ||||
We have established a 100% valuation allowance against net deferred tax assets as it is no longer more likely than not that the deferred asset will be realized. This determination is based on the weight of available evidence which includes cumulative historical losses in recent years. The valuation allowance against net deferred tax assets increased by $41.2 million from 2008 to 2009.
F-35
Table of Contents
Quality Distribution, Inc. and Subsidiaries
Notes to Consolidated Financial Statements—(Continued)
For the Years Ended December 31, 2009, 2008 and 2007
Our effective tax rate differs from the federal statutory rate. The reasons for those differences are as follows for the years ended December 31 (in thousands):
| 2009 | 2008 | 2007 | ||||||||||
| Tax (benefit) expense at the statutory rate |
$ | (50,150 | ) | $ | 5,968 | $ | (3,375 | ) | ||||
| State income taxes, net of federal benefit |
(225 | ) | (127 | ) | 299 | |||||||
| FIN 48 adjustments |
(937 | ) | (698 | ) | — | |||||||
| Goodwill impairment |
46,688 | — | — | |||||||||
| Restricted stock |
154 | 423 | — | |||||||||
| Pension adjustment |
— | (1,193 | ) | — | ||||||||
| Foreign taxes |
(86 | ) | 158 | 951 | ||||||||
| Valuation allowance |
41,577 | 210 | 1,625 | |||||||||
| Work Opportunity Tax Credit |
(206 | ) | — | — | ||||||||
| Increase in federal NOL |
— | — | (1,007 | ) | ||||||||
| IRC Section 956 income |
419 | 253 | 401 | |||||||||
| Foreign tax credit |
(190 | ) | (302 | ) | (1,122 | ) | ||||||
| Secondary offering costs |
— | — | (304 | ) | ||||||||
| Other |
205 | 248 | 453 | |||||||||
| Provision for (benefit from) income taxes |
$ | 37,249 | $ | 4,940 | $ | (2,079 | ) | |||||
At December 31, 2009, we had approximately $95.7 million in federal net operating loss carryforwards, $2.3 million in alternative minimum tax credit carry forwards and $3.1 million in foreign tax credit carryforwards. We do not have a history of net operating loss or tax credit carryforwards expiring unused; however, we have determined based on the weight of available evidence that it is more likely than not that some or all of the carryforwards may expire. As a result, we have established a valuation allowance of $43.0 million. The net operating loss carryforwards will expire in the years 2018 through 2027 while the alternative minimum tax credits may be carried forward indefinitely and the foreign tax credits may be carried forward for ten years. We have approximately $47.0 million in state net operating loss carryforwards, which expire over the next 1 to 18 years.
Significant judgment is required in determining our provision for income taxes. In the ordinary course of an international business, there are many transactions for which the ultimate tax outcome is uncertain. We review our tax contingencies on a regular basis and make appropriate accruals as needed. As of December 31, 2009, United States taxes were not provided on income of our foreign subsidiaries, as we have invested or expect to invest the undistributed earnings indefinitely.
Rollforward of valuation allowance (in thousands):
| 2009 | 2008 | |||||||
| Beginning balance |
$ | (1,855 | ) | $ | (1,645 | ) | ||
| (Increase)/decrease attributable to current year operations |
(417 | ) | — | |||||
| (Increase)/decrease attributable to other comprehensive income |
400 | — | ||||||
| (Increase)/decrease attributable to FIN 48 |
— | — | ||||||
| (Increase)/decrease attributable to AMT & foreign tax credit carryforwards |
(3,628 | ) | (210 | ) | ||||
| (Increase)/decrease attributable to Federal & State NOL carryforwards |
(37,532 | ) | — | |||||
| Ending balance |
$ | (43,032 | ) | $ | (1,855 | ) | ||
F-36
Table of Contents
Quality Distribution, Inc. and Subsidiaries
Notes to Consolidated Financial Statements—(Continued)
For the Years Ended December 31, 2009, 2008 and 2007
At December 31, 2009 and 2008, we had approximately $1.8 and $2.0 million, respectively, of total gross unrecognized tax benefits. Of the total gross unrecognized tax benefits at December 31, 2009, $1.2 million (net of federal benefit on state tax issues) represents the amount of unrecognized tax benefits that, if recognized would favorably affect the effective income tax rate in any future periods.
Included in the balance of gross unrecognized tax benefits at December 31, 2009 is $0.7 million related to tax positions for which it is reasonably possible that the total amounts could significantly change during the next twelve months due to expiration of the applicable statute of limitations. A reconciliation of the total amount of unrecognized tax benefits follows (in thousands):
| 2009 | 2008 | |||||||
| Total unrecognized tax benefits as of January 1, 2009 |
$ | 2,043 | $ | 3,193 | ||||
| Increases in tax positions taken during prior period |
— | 209 | ||||||
| Decreases in tax positions taken during prior period |
(118 | ) | (381 | ) | ||||
| Increases in tax positions taken during the current period |
10 | 32 | ||||||
| Settlements with taxing authorities |
— | (212 | ) | |||||
| Decrease due to lapse of applicable statute of limitations |
(159 | ) | (798 | ) | ||||
| Total unrecognized tax benefits as of December 31, 2009 |
$ | 1,776 | $ | 2,043 | ||||
Our continuing practice is to recognize interest and/or penalties related to income tax matters in income tax expense. For the year ended December 31, 2009, we recognized additional benefit of $0.7 million of interest and penalties in the provision for income taxes. As of January 1, 2009 we had accrued interest of $1.3 million (net of federal benefit) and $0.4 million accrued for penalties. At December 31, 2009 we had accrued interest of $0.7 million (net of federal benefit) and $0.3 million accrued for penalties.
We are subject to the income tax jurisdiction of U.S., Canada, and Mexico, as well as income tax of multiple state jurisdictions. We believe we are no longer subject to U.S. federal income tax examinations for the years before 2006, to international examinations for years before 2004 and with few exceptions, to state exams before 2005.
In accordance with FASB guidance, we updated the presentation of our deferred tax asset and valuation allowance to remove any unrecognized tax benefit. In the first quarter of 2007, we reversed the remaining $0.9 million deferred tax valuation allowance and the associated deferred tax asset on state tax net operating losses that contained unrecognized tax benefits.
16. EMPLOYEE BENEFIT PLANS
We maintain two noncontributory defined benefit plans resulting from a prior acquisition that cover certain full-time salaried employees (“CLC Plan”) and certain other employees under a collective bargaining agreement (“TTWU Plan”). Retirement benefits for employees covered by the salaried plan are based on years of service and compensation levels. The monthly benefit for employees under the collective bargaining agreement plan is based on years of service multiplied by a monthly benefit factor. Pension costs are funded in accordance with the provisions of the applicable law. Both pension plans have been frozen since prior to January 1, 1998. There are no new participants and no future accruals of benefits from the time the plans were frozen.
We use a December 31 measurement date for both of our plans.
We follow the recognition and disclosure requirements under the FASB guidance that require us to recognize the funded status of our postretirement benefit plans in the consolidated statement of financial position
F-37
Table of Contents
Quality Distribution, Inc. and Subsidiaries
Notes to Consolidated Financial Statements—(Continued)
For the Years Ended December 31, 2009, 2008 and 2007
at December 31, 2009, with a corresponding adjustment to accumulated other comprehensive income. The funded status is the difference between the fair value of plan assets and the benefit obligation. The adjustment to accumulated other comprehensive income represents the net unrecognized actuarial gains or losses and unrecognized prior service costs. Future actuarial gains or losses that are not recognized as net periodic benefit cost in the same periods will be recognized as a component of other comprehensive income (in thousands):
| 2009 | |||
| Items not yet recognized as a component of net periodic cost: |
|||
| Unrecognized net actuarial loss |
$ | 28,062 | |
| Unamortized prior service cost |
604 | ||
| Unrecognized loss and prior service costs recorded as a component of accumulated other comprehensive loss |
$ | 28,666 | |
| Items to be recognized in 2010 as a component of net periodic cost: |
|||
| Net actuarial loss |
$ | 1,200 | |
| Prior service cost |
94 | ||
| Net periodic cost to be recorded in 2010 as a component of accumulated other comprehensive loss |
$ | 1,294 | |
Obligations and Funded Status
The following table sets forth the change in the projected benefit obligation, change in plan assets and unfunded status of the two plans at December 31 (in thousands):
| 2009 | 2008 | |||||||
| Change in Projected Benefit Obligation |
||||||||
| Benefit obligation at beginning of year |
$ | 45,641 | $ | 45,827 | ||||
| Service cost |
203 | 214 | ||||||
| Interest cost |
2,752 | 2,729 | ||||||
| Actuarial loss |
2,175 | 354 | ||||||
| Benefits and expenses paid |
(3,469 | ) | (3,483 | ) | ||||
| Benefit obligation at end of year |
$ | 47,302 | $ | 45,641 | ||||
| 2009 | 2008 | |||||||
| Change in Plan Assets |
||||||||
| Fair value of plan assets at beginning of year |
$ | 26,989 | $ | 42,138 | ||||
| Actual return (loss) on plan assets |
3,964 | (12,545 | ) | |||||
| Contributions by company |
1,005 | 878 | ||||||
| Benefits and expenses paid |
(3,469 | ) | (3,483 | ) | ||||
| Fair value of plan assets at end of year |
$ | 28,489 | $ | 26,988 | ||||
| 2009 | 2008 | |||||||
| Unfunded Status of Plans |
||||||||
| Projected benefit obligation |
$ | (47,302 | ) | $ | (45,641 | ) | ||
| Fair value of plan assets |
28,489 | 26,988 | ||||||
| Unfunded status |
$ | (18,813 | ) | $ | (18,653 | ) | ||
F-38
Table of Contents
Quality Distribution, Inc. and Subsidiaries
Notes to Consolidated Financial Statements—(Continued)
For the Years Ended December 31, 2009, 2008 and 2007
The accumulated benefit obligation for both defined benefit pension plans equaled the projected benefit obligations of $47.3 million and $45.6 million at December 31, 2009 and 2008, respectively.
Accumulated Other Comprehensive Loss (in thousands)
| 2009 | 2008 | 2007 | ||||||||
| Net actuarial loss, net of tax of $0, $6,087 and ($1,009), respectively |
$ | 941 | $ | (9,755 | ) | $ | 1,507 | |||
| Prior service cost |
94 | 94 | 94 | |||||||
| Adjustment to pension benefit obligation |
$ | 1,035 | $ | (9,661 | ) | $ | 1,601 | |||
We had an accumulated net pension equity credit of $1.0 million at December 31, 2009 compared to a charge of $9.7 million at December 31, 2008. The equity charge in 2008 reflected the decline in our funded status as a result of significant negative asset returns during 2008.
Periodic Pension Costs
The components of net periodic pension cost are as follows for the years ended December 31 (in thousands):
| 2009 | 2008 | 2007 | ||||||||||
| Service cost |
$ | 203 | $ | 214 | $ | 256 | ||||||
| Interest cost |
2,752 | 2,729 | 2,680 | |||||||||
| Amortization of loss |
1,154 | 354 | 415 | |||||||||
| Amortization of prior service cost |
94 | 94 | 94 | |||||||||
| Expected return on plan assets |
(2,003 | ) | (3,202 | ) | (3,284 | ) | ||||||
| Net periodic pension cost |
$ | 2,200 | $ | 189 | $ | 161 | ||||||
Pension expense significantly increased in 2009 due to poor performance in the overall stock market in 2008.
Assumptions
Weighted average assumptions used to determine benefit obligations at December 31:
| 2009 | 2008 | 2007 | |||||||
| Discount rate |
5.60 | % | 6.28 | % | 6.13 | % |
Weighted average assumptions used to determine net periodic benefit cost at December 31:
| 2009 | 2008 | 2007 | |||||||
| TTWU Plan |
|||||||||
| Discount rate |
6.30 | % | 6.00 | % | 5.75 | % | |||
| Expected long-term rate of return on plan assets |
7.00 | % | 7.50 | % | 7.50 | % | |||
| CLC Plan |
|||||||||
| Discount rate |
6.25 | % | 6.25 | % | 5.50 | % | |||
| Expected long-term rate of return on plan assets |
8.00 | % | 8.00 | % | 8.00 | % |
F-39
Table of Contents
Quality Distribution, Inc. and Subsidiaries
Notes to Consolidated Financial Statements—(Continued)
For the Years Ended December 31, 2009, 2008 and 2007
The discount rate is based on a model portfolio of AA-rated bonds with a maturity matched to the estimated payouts of future pension benefits. The TTWU Plan’s expected return on plan assets is based on our expectation of the long-term average rate of return on assets in the pension funds, which is based on the allocation of assets and includes approximately 16% of the assets being held in a low return insurance company annuity. The CLC Plan’s expected return on plan assets is based on historical and future returns of the multiple asset classes from which a weighted average was developed based on the asset allocation of the Plan.
Asset Mix
Our pension plan weighted-average asset allocations by asset category at December 31 are as follows:
| 2009 | 2008 | |||||
| TTWU Plan |
||||||
| Equity securities and mutual funds |
58.7 | % | 57.3 | % | ||
| Debt securities |
11.2 | % | 22.6 | % | ||
| Other investments |
25.1 | % | 18.4 | % | ||
| Cash and cash equivalents |
5.0 | % | 1.7 | % | ||
| CLC Plan |
||||||
| Equity securities and mutual funds |
70.3 | % | 58.0 | % | ||
| Debt securities |
12.9 | % | 42.0 | % | ||
| Other investments |
10.3 | % | — | |||
| Cash and cash equivalents |
6.5 | % | — |
Plan Assets
Our investment policy is that plan assets will be managed utilizing an investment philosophy and approach characterized by all of the following, but listed in priority order: (1) emphasis on total return, (2) emphasis on high-quality securities, (3) sufficient income and stability of income, (4) safety of principal with limited volatility of capital through proper diversification and (5) sufficient liquidity. None of our equity or debt securities are included in plan assets.
Our retirement plans’ assets were accounted for at fair value and are classified in their entirety based on the lowest level of any input that is significant to the fair value measurement. For a description of the fair value hierarchy, see Note 3.
Our actual retirement plans’ asset allocations by level within the fair value hierarchy at December 31, 2009, are presented in the table below (in thousands):
| TTWU Plan | CLC Plan | |||||||||||||||||||||||||||
| Level 1 | Level 2 | Level 3 | Total | % Total | Level 1 | Level 2 | Level 3 | Total | % Total | |||||||||||||||||||
| Cash & cash equivalents |
$ | 366 | $ | — | $ | — | $ | 366 | 5.0% | $ | 1,374 | $ | — | $ | — | $ | 1,374 | 6.5% | ||||||||||
| Equity securities |
2,330 | — | — | 2,330 | 31.6% | 7,698 | — | — | 7,698 | 36.4% | ||||||||||||||||||
| Mutual funds |
1,999 | — | — | 1,999 | 27.1% | 7,165 | — | 7,165 | 33.9% | |||||||||||||||||||
| Corporate bonds |
— | 408 | — | 408 | 5.5% | — | 1,327 | — | 1,327 | 6.3% | ||||||||||||||||||
| Asset-backed securities |
— | 420 | — | 420 | 5.7% | — | 1,385 | — | 1,385 | 6.6% | ||||||||||||||||||
| Other investments |
— | 326 | 1,526 | 1,852 | 25.1% | — | 1,104 | 1,061 | 2,165 | 10.3% | ||||||||||||||||||
| Total assets |
$ | 4,695 | $ | 1,154 | $ | 1,526 | $ | 7,375 | 100.0% | $ | 16,237 | $ | 3,816 | $ | 1,061 | $ | 21,114 | 100.0% | ||||||||||
F-40
Table of Contents
Quality Distribution, Inc. and Subsidiaries
Notes to Consolidated Financial Statements—(Continued)
For the Years Ended December 31, 2009, 2008 and 2007
Level 1 includes investments in common stock and open-ended mutual funds. Fair values for these investments are measured using unadjusted quoted prices in active markets.
Level 2 includes investments in corporate bonds and asset-backed securities that are measured based on quoted prices for similar assets in active markets; quoted prices for identical or similar assets in inactive markets; inputs other than quoted prices that are observable for the asset; and inputs that are derived principally from or corroborated by observable market data by correlation or other means. The fair values for Level 2 assets are generally obtained from third-party broker quotes, independent pricing services and exchanges.
Level 3 includes investments in an insurance annuity contract and an interval fund containing a lock-up period that are valued using unobservable inputs. Valuation may be performed using a financial model with estimated inputs entered into the model.
The following is a reconciliation of assets in Level 3 of the fair value hierarchy (in thousands):
| TTWU | CLC | |||||
| Beginning balance at January 1, 2009 |
$ | 1,358 | $ | — | ||
| Return on plan assets |
69 | 42 | ||||
| Purchases, sales, settlements and expenses |
99 | 1,019 | ||||
| Ending balance at December 31, 2009 |
$ | 1,526 | $ | 1,061 | ||
Cash Flows
We expect to contribute $0.4 million to the TTWU pension plan and $2.2 million to the CLC pension plan during the year ending December 31, 2010.
The following benefit payments are expected to be paid (in thousands):
| 2010 |
$ | 3,491 | |
| 2011 |
3,457 | ||
| 2012 |
3,465 | ||
| 2013 |
3,438 | ||
| 2014 |
3,451 | ||
| 2015 – 2019 |
17,179 |
We charged to operations, payments to multi-employer pension plans required by collective bargaining agreements of approximately $2.7 million, $2.3 million and $2.2 million for the years ended December 31, 2009, 2008 and 2007, respectively. These defined benefit plans cover substantially all of our union employees not covered under the TTWU pension plan. The actuarial present value of accumulated plan benefits and net assets available for benefits to employees under these multi-employer plans is not readily available.
In 2001, we established a Deferred Compensation Plan for our executives and other key employees. The plan is a non-qualified deferral plan that allows participants to contribute a portion of their wages on a pre-tax basis and includes a death benefit. We may credit participants’ accounts with a discretionary contribution at our sole discretion. No contributions were made in 2009, 2008 and 2007.
Substantially all of our U.S. employees are entitled to participate in our profit sharing plan established under Section 401(k) of the U.S. Internal Revenue Code. Employees are eligible to contribute voluntarily to the plan after 90 days of employment. At our discretion, we may also contribute to the plan. Employees are always vested
F-41
Table of Contents
Quality Distribution, Inc. and Subsidiaries
Notes to Consolidated Financial Statements—(Continued)
For the Years Ended December 31, 2009, 2008 and 2007
in their contributed balance and become fully vested in our contributions after four years of service. The expenses related to contributions to the plan for the years ended December 31, 2008 and 2007 were approximately $0.4 million and $0.2 million, respectively. In 2009, we did not contribute to the plan.
17. CAPITAL STOCK
Authorized Capital Stock
In accordance with our Amended and Restated Articles of Incorporation dated November 4, 2003, the Company is authorized to issue 30 million shares of capital stock, 29 million shares of no par value common stock and 1 million shares of no par value preferred stock.
Our ABL Facility and indentures governing the 2013 Senior Notes and the 2013 PIK Notes contain restrictions on QDI’s ability to pay dividends on its common stock.
Preferred Stock
Of the 1 million shares of preferred stock authorized, 600,000 shares were designated as convertible preferred stock, of which 510,000 were issued and outstanding prior to the initial public offering of shares of our common stock, when they were converted into shares of common stock pursuant to our Amended and Restated Articles of Incorporation. The remaining shares of preferred stock may be issued from time to time in one or more classes or series, with such relative rights, preferences, qualifications, and limitations as our Board of Directors may adopt by resolution.
Warrants
On October 15, 2009 in conjunction with the note exchange offer, we issued 1,752,895 aggregate amount of warrants to purchase shares of the Company’s common stock at an exercise price of $0.01 per share. The warrants are exercisable during the period beginning April 16, 2010 and ending November 1, 2013. The warrants were accounted for at their fair value on October 15, 2009, which is based on the closing price of our common stock on that date. $6.7 million representing the fair value of the warrants was recorded to stock purchase warrants within shareholders’ deficit, with a corresponding discount on the 2013 PIK Notes. The discount will be amortized over the term of the 2013 PIK Notes. As of December 31, 2009, we have warrants outstanding of approximately $6.7 million.
Treasury Stock
As of December 31, 2009 and 2008, we had approximately 220,000 and 205,000 treasury shares carried at a cost of approximately $1.6 million and $1.6 million, respectively. These shares were acquired pursuant to our initial public offering, the return of shares under limited recourse secured loans to shareholders and forfeitures.
18. STOCK COMPENSATION PLANS
We account for our equity compensation plans and expense related to all stock option awards granted under the FASB guidance. We apply the Black-Scholes valuation model in determining the fair value of share-based payments to employees. The resulting compensation expense is recognized over the requisite service period, which is generally the vesting term of four years.
Performance Incentive Plans
As of December 31, 2009, we have two active stock-based compensation plans. As of December 31, 2008, there was an agreement regarding stock units which applied solely to Mr. Gerald L. Detter, our former Chief Executive Officer, and a third stock-based compensation plan, which expired in 2008.
F-42
Table of Contents
Quality Distribution, Inc. and Subsidiaries
Notes to Consolidated Financial Statements—(Continued)
For the Years Ended December 31, 2009, 2008 and 2007
2003 Stock Option Plan
The 2003 Stock Option Plan was adopted on November 5, 2003 in connection with our IPO and expires 10 years after adoption. It was amended on May 13, 2005. It provides for the grant of nonqualified stock options that become exercisable, with limited exceptions, in 25% increments on each of the first four anniversaries of the date upon which the options are granted or vest 50% in the third and 50% in the fourth year after issuance of the grant. The contractual term of each grant is ten years. The number of shares available for issuance under this plan automatically increases on January 1 of each year commencing with January 1, 2004 unless otherwise determined by the Board of Directors. The current year increase is 2.5% of the outstanding shares as of December 31 of the prior year. No more than 6,500,000 shares of common stock may be issued under the 2003 Stock Option Plan.
The 2003 Stock Option Plan activity for the year ended December 31, 2009 is as follows (in thousands, except per share data):
| Number of Shares Outstanding |
Weighted Average Exercise Price |
Weighted Average Remaining contractual Term (in years) |
Aggregate Intrinsic Value (in thousands) (a) | |||||||
| Options outstanding at December 31, 2008 |
1,947 | $ | 9.19 | |||||||
| 2009 option activity: |
||||||||||
| Granted |
1,094 | $ | 3.02 | |||||||
| Exercised (b) |
— | — | ||||||||
| Expired |
(338 | ) | $ | 6.48 | ||||||
| Canceled |
(532 | ) | $ | 11.10 | ||||||
| Options outstanding at December 31, 2009 |
2,171 | $ | 4.93 | |||||||
| Options exercisable at December 31, 2009 |
696 | $ | 7.93 | 4.8 | — | |||||
| (a) | The intrinsic value of a stock option is the amount by which the market value of the underlying stock as of December 31, 2009 exceeds the exercise price of the option. |
| (b) | Any options that are exercised are issued out of our treasury share account. |
During the years ended December 31, 2009, 2008 and 2007:
| • | the weighted-average grant date fair value per share of stock-based compensation granted to employees was $1.96, $2.30 and $5.56, respectively; |
| • | there were no options exercised in 2009 and 2008. The total intrinsic value of stock options exercised was nominal in 2007, and |
| • | the total fair value of stock options that vested during the three periods above was $344, $984 and $1,324, respectively. |
During the year ended December 31, 2009, cash was not used to settle any equity instruments previously granted.
F-43
Table of Contents
Quality Distribution, Inc. and Subsidiaries
Notes to Consolidated Financial Statements—(Continued)
For the Years Ended December 31, 2009, 2008 and 2007
1998 Stock Option Plan
Until adoption of the 2003 Stock Option Plan, we administered the 1998 Stock Option Plan pursuant to which a total of 377,400 shares of our common stock were available for grant at an exercise price of $23.53. The maximum term of granted options is ten years. Fifty percent of each new option granted vested in equal increments over four years. The remaining fifty percent of each new option will vest in nine years from grant date, subject to acceleration if certain per-share equity value targets are achieved or in the event of a sale of the Company. Vesting of the new options occurs only during an employee’s term of employment. The new options will become fully vested in the event of a termination of employment without “cause” or for “good reason” within nine months following a sale of the Company.
The 1998 Stock Option Plan activity for the year ended December 31, 2009 is as follows (in thousands, except per share data):
| Number of Shares Outstanding |
Weighted Average Exercise Price |
Weighted Average Remaining Contractual Term (in years) |
Aggregate Intrinsic Value (in thousands) (a) | ||||||
| Options outstanding at December 31, 2008 |
12 | $ | 23.53 | ||||||
| 2009 option activity: |
|||||||||
| Expired |
— | — | |||||||
| Canceled |
— | — | |||||||
| Options outstanding at December 31, 2009 (b) |
12 | $ | 23.53 | ||||||
| Options exercisable at December 31, 2009 |
6 | $ | 23.53 | 0.7 | — | ||||
| (a) | The intrinsic value of a stock option is the amount by which the market value of the underlying stock as of December 31, 2009 exceeds the exercise price of the option. |
| (b) | Although we cannot issue additional stock options under the 1998 Stock Option Plan, stock options that were previously granted under the 1998 Stock Option Plan continue to be subject to its terms. |
During the years ended December 31, 2009, 2008 and 2007:
| • | no options were granted, respectively; |
| • | no options were exercised, and |
| • | no options vested during the three periods above. |
2003 Restricted Stock Incentive Plan
On November 5, 2003, our Board of Directors approved the 2003 Restricted Stock Incentive Plan, which terminates ten years from the approval date. The 2003 Restricted Stock Incentive Plan was amended on May 13, 2005. The restricted stock issuances to persons initially receiving a grant generally vest by December 31, 2009 regardless of when issued. The vesting periods for other grant recipients are at the discretion of the Compensation Committee of the Board of Directors. In subsequent years, participants in the plan may be granted an annual, aggregate amount of up to $1 million of shares, valued at our common stock closing price at the date of grant, at the direction of the Board of Directors. No more than 700,000 shares of common stock may be issued under this plan nor may more than $7.5 million of stock be issued under this plan.
F-44
Table of Contents
Quality Distribution, Inc. and Subsidiaries
Notes to Consolidated Financial Statements—(Continued)
For the Years Ended December 31, 2009, 2008 and 2007
The 2003 Restricted Stock Incentive plan activity for the year ended December 31, 2009 is as follows (in thousands, except per share data):
| Number of Shares Outstanding |
Weighted Average Grant Date Fair Value |
Aggregate Intrinsic Value | ||||||
| Stock unvested at December 31, 2008 |
136 | $ | 4.97 | |||||
| 2009 activity: |
||||||||
| Granted |
536 | $ | 3.66 | |||||
| Vested |
(47 | ) | $ | 5.78 | ||||
| Canceled |
(15 | ) | $ | 3.40 | ||||
| Stock unvested at December 31, 2009 |
610 | $ | 3.89 | 423 | ||||
Accounting for Stock-Based Compensation
Compensation expense is recognized only for those options expected to vest, with forfeitures estimated based on our historical experience and future expectations.
The fair value of options granted during 2009, 2008 and 2007 was based upon the Black-Scholes option-pricing model. The expected term of the options represents the estimated period of time until exercise giving consideration to the contractual terms, vesting schedules and expectations of future employee behavior. Expected stock price volatility is based on the historical volatility of our common stock, which began trading on November 13, 2003. The risk-free interest rate is based on the U.S. Treasury yield curve in effect at the time of grant with an equivalent remaining term. The Company has not paid dividends in the past and does not currently plan to pay any dividends in the foreseeable future. The Black-Scholes model was used with the following weighted-average assumptions:
| 2009 | 2008 | 2007 | |||||||
| Risk free rate |
2.05 | % | 3.18 | % | 4.35 | % | |||
| Expected life |
5 years | 5 years | 5 years | ||||||
| Volatility |
79 | % | 67 | % | 68 | % | |||
| Expected dividend |
nil | nil | nil |
Restricted stock awards and stock units are measured at fair value at time of issuance and recognized on a straight line basis over the vesting period.
Stock-based compensation expense recognized during the years ended December 31, 2009, 2008 and 2007 for each of the types of stock-based awards was (in thousands):
| 2009 | 2008 | 2007 | |||||||
| Stock options |
$ | 713 | $ | 995 | $ | 1,143 | |||
| Restricted stock |
388 | 333 | 420 | ||||||
| Total stock-based compensation expense |
$ | 1,101 | $ | 1,328 | $ | 1,563 | |||
All stock-based compensation expense is classified within “Compensation” on the Consolidated Statements of Operations. None of the stock-based compensation was capitalized during 2009. Fourteen of our employees and three members of our Board of Directors participated in an option exchange (the “Option Exchange”) on March 11, 2009. Prior to the Option Exchange, the Compensation Committee recognized that due to the historically low trading prices of our common stock, many options previously granted under the 2003 Stock
F-45
Table of Contents
Quality Distribution, Inc. and Subsidiaries
Notes to Consolidated Financial Statements—(Continued)
For the Years Ended December 31, 2009, 2008 and 2007
Option Plan ceased to satisfy their intended purpose. As such, the Option Exchange was initiated and certain stock option grants were canceled and new stock options were issued covering shares of our common stock at an exercise price equal to the closing price of our common stock on March 11, 2009. All options issued in the Option Exchange vest in four equal annual installments on the anniversary of grant. In connection with the Option Exchange, an incremental cost of less than $0.1 million was recognized in 2009.
The following table summarizes unrecognized stock-based compensation and the weighted average period over which such stock-based compensation is expected to be recognized as of December 31, 2009 (in thousands):
| In $ | Remaining years | ||||
| Stock options |
$ | 3,132 | 4 | ||
| Restricted stock |
2,105 | 4 | |||
| $ | 5,237 | ||||
These amounts do not include the cost of any additional awards that may be granted in future periods nor any changes in our forfeiture rate. These amounts do not include the cost of any additional options or restricted stock that may be granted in future periods or any changes in the Company’s forfeiture rate.
19. COMMITMENTS AND CONTINGENCIES
Operating Leases
We are obligated under various noncancelable operating leases for our office facilities, office equipment, revenue equipment and vehicles. Future noncancelable lease commitments (excluding any sublease income) as of December 31, 2009, are as follows (in thousands):
| 2010 |
$ | 15,906 | |
| 2011 |
10,515 | ||
| 2012 |
7,227 | ||
| 2013 |
4,218 | ||
| 2014 |
2,320 | ||
| 2015 and after |
6,198 | ||
| Total |
$ | 46,384 | |
The operating lease commitments include minimum lease commitments for tractors that we expect will be partially offset by rental revenue from sub-leasing the tractors to independent owner-operators or affiliates. Rent expense under operating leases was $21.6 million, $28.7 million and $23.5 million for the years ended December 31, 2009, 2008 and 2007, respectively.
Environmental Matters
It is our policy to comply with all applicable environmental, safety, and health laws. We also are committed to the principles of Responsible Care®, an international chemical industry initiative to enhance the industry’s responsible management of chemicals. We have obtained independent certification that our management system is in place and functions according to professional standards and we continue to evaluate and continuously improve our Responsible Care® Management System performance.
Our activities involve the handling, transportation and storage of bulk chemicals, both liquid and dry, many of which are classified as hazardous materials or hazardous substances. Our operations involve the generation, storage, discharge and disposal of wastes that may contain hazardous substances, the inventory and use of cleaning materials that may contain hazardous substances and the control and discharge of storm-water from
F-46
Table of Contents
Quality Distribution, Inc. and Subsidiaries
Notes to Consolidated Financial Statements—(Continued)
For the Years Ended December 31, 2009, 2008 and 2007
industrial sites. In addition, we may store diesel fuel, materials containing oil and other hazardous products at our terminals. As such, we and others who operate in our industry are subject to environmental, health and safety laws and regulation by U.S. federal, state and local agencies as well as foreign governmental authorities. Environmental laws and regulations are complex, and address emissions to the air, discharge onto land or water, and the generation, handling, storage, transportation, treatment and disposal of waste materials. These laws change frequently and generally require us to obtain and maintain various licenses and permits. Environmental laws have tended to become more stringent over time, and most provide for substantial fines and potential criminal sanctions for violations. Some of these laws and regulations are subject to varying and conflicting interpretations. Under certain of these laws, we could also be subject to allegations of liability for the activities of our affiliates or independent owner-operators.
We are potentially subject to strict, joint and several liability for investigating and rectifying the consequences of spills and other releases of such substances. From time to time, we have incurred remedial costs and regulatory penalties with respect to chemical or wastewater spills and releases at our facilities and on the road, and, notwithstanding the existence of our environmental management program, we cannot assure that such obligations will not be incurred in the future, predict with certainty the extent of future liabilities and costs under environmental, health, and safety laws, or assure that such liabilities will not result in a material adverse effect on our business, financial condition, operating results or cash flow. We have established reserves for remediation expenses at known contamination sites when it is probable that such efforts will be required of us and the related expenses can be reasonably estimated. Additional information about our reserves, our estimates underlying them and the known contamination sites may be found at Note 19 to our consolidated financial statements contained herein, “Commitments and Contingencies—Environmental Matters.”
We have also incurred in the past, and expect to incur in the future, capital and other expenditures related to environmental compliance for current and planned operations. Such expenditures are generally included in our overall capital and operating budgets and are not accounted for separately. However, we do not anticipate that compliance with existing environmental laws in conducting current and planned operations will have a material adverse effect on our capital expenditures, earnings or competitive position.
Reserves
Our policy is to accrue remediation expenses when it is probable that such efforts will be required and the related expenses can be reasonably estimated. Estimates of costs for future environmental compliance and remediation may be adversely affected by such factors as changes in environmental laws and regulatory requirements, the availability and application of technology, the identification of currently unknown potential remediation sites and the allocation of costs among the potentially responsible parties under the applicable statutes. The recorded liabilities are adjusted periodically as remediation efforts progress or as additional technical or legal information becomes available. As of December 31, 2009 and December 31, 2008, we had reserves in the amount of $11.6 million and $10.9 million, respectively, for all environmental matters of which the more significant are discussed below.
The balances presented include both long term and current environmental reserves. We expect these environmental obligations to be paid over the next five years. Additions to the environmental liability reserves are classified in our consolidated statements of operations within the “Selling and administrative” category.
F-47
Table of Contents
Quality Distribution, Inc. and Subsidiaries
Notes to Consolidated Financial Statements—(Continued)
For the Years Ended December 31, 2009, 2008 and 2007
Property Contamination Liabilities
We have been named as (or are alleged to be) a potentially responsible party under the Comprehensive Environmental Response, Compensation and Liability Act of 1980, as amended (“CERCLA”) and similar state laws at approximately 24 sites. At 17 of the 24 sites, we are one of many parties with alleged liability and are negotiating with Federal, State or private parties on the scope of our obligations, if any. At 2 of the 17 sites, we will be participating in the initial studies to determine site remediation objectives. Since our overall liability cannot be estimated at this time, we have set reserves for only the initial remedial investigation phase. At 3 of the 17 sites, we have explicitly denied any liability and since there has been no subsequent demand for payment we have not established a reserve for these matters. We have estimated future expenditures for these off-site multi-party environmental matters to be in the range of $2.5 million to $3.8 million.
At 7 of the 24 sites, we are the only responsible party and are in the process of conducting investigations and/or remediation projects. Four of these projects relate to operations conducted by CLC prior to our acquisition with CLC in 1998. These four sites are: (1) Bridgeport, New Jersey; (2) William Dick, Pennsylvania; (3) Tonawanda, New York; and (4) Scary Creek, West Virginia. The remaining three sites related to investigations and potential remediation that were triggered by the New Jersey Industrial Site Remediation Act (“ISRA”), which requires such investigations and remediation following the sale of industrial facilities. Each of these sites is discussed in more detail below. We have estimated future expenditures for these seven properties to be in the range of $9.1 million to $16.7 million.
Bridgeport, New Jersey
QDI is required under the terms of two federal consent decrees to perform remediation at this operating truck terminal and tank wash site. CLC entered into consent orders with the U.S. Environmental Protection Agency (“USEPA”) in May 1991 for the treatment of groundwater and in October 1998 for the removal of contamination in the wetlands. In addition, we were required to assess the remediation of contaminated soils.
The groundwater treatment remedy negotiated with USEPA calls for a treatment facility for in-place treatment of groundwater contamination and a local discharge. Treatment facility construction was completed in early 2007. After various start-up issues, we expect the treatment facility to begin operating in 2010. Wetlands contamination has been remediated with localized restoration expected to be completed in 2010. In regard to contaminated soils, we believe that USEPA is now in the process of finalizing a feasibility study for the limited areas that show contamination and warrant additional investigation or work. We have estimated expenditures to be in the range of $5.5 million to $8.5 million.
William Dick, Pennsylvania
CLC entered into a consent order with the Pennsylvania DEP and USEPA in October 1995 obligating it to provide a replacement water supply to area residents, treat contaminated groundwater, and perform remediation of contaminated soils at this former wastewater disposal site. The replacement water supply is complete. We completed construction of a treatment facility with local discharge for groundwater treatment in the fourth quarter of 2007. Plant start-up issues are on-going. The agencies have approved a contaminated soils remedy, which requires both thermal treatment of contaminated soils and treatment of residuals via soil vapor extraction. The remedy expanded to include off-site shipment of contaminated soils. Soil treatment was completed in September 2007. Site sampling has been conducted and the results indicate that the soil clean-up objectives have not been fully achieved. Negotiations are on-going with USEPA over further remedial actions that may be needed at the site. We have estimated expenditures to be in the range of $1.1 million to $3.4 million.
F-48
Table of Contents
Quality Distribution, Inc. and Subsidiaries
Notes to Consolidated Financial Statements—(Continued)
For the Years Ended December 31, 2009, 2008 and 2007
Other Properties
Scary Creek, West Virginia: CLC received a clean up notice from the State environmental authority in August 1994. The State and we have agreed that remediation can be conducted under the State’s voluntary clean-up program (instead of the state superfund enforcement program). We are currently completing the originally planned remedial investigation and the additional site investigation work.
Tonawanda, New York: CLC entered into a consent order with the New York Department of Environmental Conservation on June 22, 1999 obligating it to perform soil and groundwater remediation at this former truck terminal and tank wash site. We have completed a remedial investigation and a feasibility study. The State issued a record of decision in May 2006. The site is currently in remedial design phase.
ISRA New Jersey Facilities: We are obliged to conduct investigations and remediation at three current or former New Jersey tank wash and terminal sites pursuant to the state’s Industrial Sites Remediation Act, which requires such remediation following the sale of facilities after 1983. These sites are in the process of remedial investigation with projections set in contemplation of limited soil remediation expense for contaminated areas.
We have estimated future expenditures for Scary Creek, Tonawanda and ISRA to be in the range of $2.5 million to $4.8 million.
Other Legal Matters
We are from time to time involved in routine litigation incidental to the conduct of our business. We believe that no such routine litigation currently pending against us, if adversely determined, would have a material adverse effect on our consolidated financial position, results of operations or cash flows.
20. TRANSACTIONS WITH RELATED PARTIES
At December 31, 2009, Apollo and its affiliated funds owned or controlled approximately 52.2% of QDI’s outstanding common stock. As a result, Apollo can influence substantially all matters requiring shareholder approval, including the election of directors, the approval of significant corporate transactions, such as acquisitions and the ability to block an unsolicited tender offer.
Two of our customers (Hexion Specialty Chemicals and Momentive Performance Materials) are controlled by Apollo. Revenues from these two customers was $12.6 million, $15.0 million and $15.9 million in 2009, 2008 and 2007, respectively. All pricing with the companies controlled by Apollo Management was based on market rates, including such factors as total expected revenue to be generated by the customer, number of loads to be hauled and the number of miles to be driven.
Of the $0.2 million stock subscription receivable, less than $0.1 million relates to current members of management.
21. GUARANTOR SUBSIDIARIES
The 2013 Senior Notes and 2012 Notes are our subsidiaries’, QD LLC and QD Capital, senior unsecured obligations and are fully and unconditionally guaranteed on a senior unsecured basis, jointly and severally, by QDI, our other subsidiary guarantors, and certain of our future U.S. restricted subsidiaries. The 2013 PIK Notes and 9% Notes are our subsidiaries’, QD LLC and QD Capital Corporation, unsecured and senior subordinated
F-49
Table of Contents
Quality Distribution, Inc. and Subsidiaries
Notes to Consolidated Financial Statements—(Continued)
For the Years Ended December 31, 2009, 2008 and 2007
obligations and are fully and unconditionally guaranteed on an unsecured and senior subordinated basis, jointly and severally, by QDI, our other subsidiary guarantors, and certain of our future U.S. restricted subsidiaries. The subsidiary guarantors of all of the notes are all of our direct and indirect domestic subsidiaries. All non-domestic subsidiaries including Levy Transport, Ltd. are not guarantor subsidiaries. QD Capital has no material assets or operations. QD LLC, all its subsidiary guarantors and QD Capital are 100% owned by QDI.
QD LLC conducts substantially all of its business through and derives virtually all of its income from its subsidiaries. Therefore, its ability to make required principal and interest payments with respect to its indebtedness depends on the earnings of subsidiaries and its ability to receive funds from its subsidiaries through dividend and other payments. The subsidiary guarantors are 100% owned subsidiaries of QD LLC and have fully and unconditionally guaranteed the 9% Notes and the 2012 Notes, and the 2013 Senior Notes and the 2013 PIK Notes on a joint and several basis.
QDI has no significant restrictions on its ability to receive funds from its subsidiaries. The ABL Facility and the indentures governing our 2013 Senior Notes and our 2013 PIK Notes contain certain limitations on QD LLC’s ability to make distributions to QDI. We do not consider these restrictions to be significant, because QDI is a holding company with no significant operations or assets, other than ownership of 100% of QD LLC’s membership units. QD LLC’s direct and indirect wholly owned subsidiaries are generally permitted to make distributions to QD LLC, which is the principal obligor under the ABL Facility, the 9% Notes, the 2012 Notes, the 2013 Senior Notes and the 2013 PIK Notes.
We have not presented separate financial statements and other disclosures concerning subsidiary guarantors because management has determined such information is not material to the holders of the above-mentioned notes.
The following condensed consolidating financial information for QDI, QD LLC, QD Capital, which has no assets or operations), non-guarantor subsidiaries and combined guarantor subsidiaries presents:
| • | Condensed consolidating balance sheets at December 31, 2009 and 2008 and condensed consolidating statements of operations and of cash flows for each of the three years ended December 31, 2009, 2008 and 2007. |
| • | Elimination entries necessary to consolidate the parent company and all its subsidiaries. |
F-50
Table of Contents
Quality Distribution, Inc. and Subsidiaries
Notes to Consolidated Financial Statements—(Continued)
For the Years Ended December 31, 2009, 2008 and 2007
Condensed Consolidating Statement of Operations
For the Year Ended December 31, 2009
(in thousands)
| QDI | QD LLC & QD Capital |
Guarantor Subsidiaries |
Non-Guarantor Subsidiaries |
Eliminations | Consolidated | ||||||||||||||||||
| Operating revenues: |
|||||||||||||||||||||||
| Transportation |
$ | — | $ | — | $ | 454,658 | $ | — | $ | — | $ | 454,658 | |||||||||||
| Other service revenue |
— | — | 104,716 | 238 | — | 104,954 | |||||||||||||||||
| Fuel surcharge |
— | — | 53,997 | — | — | 53,997 | |||||||||||||||||
| Total operating revenues |
— | — | 613,371 | 238 | — | 613,609 | |||||||||||||||||
| Operating expenses: |
|||||||||||||||||||||||
| Purchased transportation |
— | — | 373,539 | — | — | 373,539 | |||||||||||||||||
| Compensation |
— | — | 76,955 | — | — | 76,955 | |||||||||||||||||
| Fuel, supplies and maintenance |
— | — | 62,448 | — | — | 62,448 | |||||||||||||||||
| Depreciation and amortization |
— | — | 20,218 | — | — | 20,218 | |||||||||||||||||
| Selling and administrative |
— | 268 | 24,259 | 45 | 24,572 | ||||||||||||||||||
| Insurance costs |
— | — | 14,096 | 23 | — | 14,119 | |||||||||||||||||
| Taxes and licenses |
— | — | 3,578 | — | — | 3,578 | |||||||||||||||||
| Communication and utilities |
— | — | 7,910 | — | — | 7,910 | |||||||||||||||||
| Gain on sale of tank wash assets |
— | — | (7,130 | ) | — | — | (7,130 | ) | |||||||||||||||
| Loss on disposal of property and equipment |
— | — | 450 | — | — | 450 | |||||||||||||||||
| Impairment charge |
— | — | 148,630 | — | — | 148,630 | |||||||||||||||||
| Restructuring costs |
— | — | 3,496 | — | — | 3,496 | |||||||||||||||||
| Operating (loss) income |
— | (268 | ) | (115,078 | ) | 170 | — | (115,176 | ) | ||||||||||||||
| Interest (income) expense, non-related party, net |
(5 | ) | 25,689 | 2,412 | (49 | ) | — | 28,047 | |||||||||||||||
| Interest (income) expense, related party, net |
— | (25,689 | ) | 26,116 | (427 | ) | — | — | |||||||||||||||
| Gain on extinguishment of debt |
— | (1,870 | ) | — | — | — | (1,870 | ) | |||||||||||||||
| Other expense (income) |
— | 2,343 | (206 | ) | (205 | ) | — | 1,932 | |||||||||||||||
| Income (loss) before income taxes |
5 | (741 | ) | (143,400 | ) | 851 | — | (143,285 | ) | ||||||||||||||
| Provision for income taxes |
119 | — | 37,038 | 92 | — | 37,249 | |||||||||||||||||
| Equity in loss of subsidiaries |
(180,420 | ) | (179,679 | ) | — | — | 360,099 | — | |||||||||||||||
| Net (loss) income |
$ | (180,534 | ) | $ | (180,420 | ) | $ | (180,438 | ) | $ | 759 | $ | 360,099 | $ | (180,534 | ) | |||||||
F-51
Table of Contents
Quality Distribution, Inc. and Subsidiaries
Notes to Consolidated Financial Statements—(Continued)
For the Years Ended December 31, 2009, 2008 and 2007
Condensed Consolidating Statement of Operations
For the Year Ended December 31, 2008
(in thousands)
| QDI | QD LLC & QD Capital |
Guarantor Subsidiaries |
Non-Guarantor Subsidiaries |
Eliminations | Consolidated | |||||||||||||||||||
| Operating revenues: |
||||||||||||||||||||||||
| Transportation |
$ | — | $ | — | $ | 565,814 | $ | — | $ | — | $ | 565,814 | ||||||||||||
| Other service revenue |
— | — | 103,661 | 378 | — | 104,039 | ||||||||||||||||||
| Fuel surcharge |
— | — | 145,437 | — | — | 145,437 | ||||||||||||||||||
| Total operating revenues |
— | — | 814,912 | 378 | — | 815,290 | ||||||||||||||||||
| Operating expenses: |
||||||||||||||||||||||||
| Purchased transportation |
— | — | 466,823 | — | — | 466,823 | ||||||||||||||||||
| Compensation |
— | — | 109,110 | — | — | 109,110 | ||||||||||||||||||
| Fuel, supplies and maintenance |
— | — | 114,351 | — | — | 114,351 | ||||||||||||||||||
| Depreciation and amortization |
— | — | 21,024 | (22 | ) | — | 21,002 | |||||||||||||||||
| Selling and administrative |
— | 234 | 35,539 | 63 | 35,836 | |||||||||||||||||||
| Insurance costs |
— | — | 15,007 | (8 | ) | — | 14,999 | |||||||||||||||||
| Taxes and licenses |
— | — | 5,241 | 1 | — | 5,242 | ||||||||||||||||||
| Communication and utilities |
— | — | 12,716 | — | — | 12,716 | ||||||||||||||||||
| (Gain) loss on disposal of property and equipment |
— | — | (3,067 | ) | (25 | ) | — | (3,092 | ) | |||||||||||||||
| Restructuring costs |
— | — | 5,325 | — | — | 5,325 | ||||||||||||||||||
| Operating (loss) income |
— | (234 | ) | 32,843 | 369 | — | 32,978 | |||||||||||||||||
| Interest (income) expense, non-related party, net |
(16 | ) | 33,150 | 2,086 | (100 | ) | — | 35,120 | ||||||||||||||||
| Interest (income) expense, related party, net |
— | (33,150 | ) | 33,669 | (519 | ) | — | — | ||||||||||||||||
| Write-off of debt issuance costs |
— | 283 | — | — | — | 283 | ||||||||||||||||||
| Gain on extinguishment of debt |
— | (16,532 | ) | — | — | — | (16,532 | ) | ||||||||||||||||
| Other (income) expense |
— | — | (2,831 | ) | (114 | ) | — | (2,945 | ) | |||||||||||||||
| Income (loss) before income taxes |
16 | 16,015 | (81 | ) | 1,102 | — | 17,052 | |||||||||||||||||
| Provision for (benefit from) income taxes |
18 | — | 4,643 | 279 | — | 4,940 | ||||||||||||||||||
| Equity in earnings (loss) of subsidiaries |
12,114 | (3,901 | ) | — | — | (8,213 | ) | — | ||||||||||||||||
| Net income (loss) |
$ | 12,112 | $ | 12,114 | $ | (4,724 | ) | $ | 823 | $ | (8,213 | ) | $ | 12,112 | ||||||||||
F-52
Table of Contents
Quality Distribution, Inc. and Subsidiaries
Notes to Consolidated Financial Statements—(Continued)
For the Years Ended December 31, 2009, 2008 and 2007
Condensed Consolidating Statement of Operations
For the Year Ended December 31, 2007
(in thousands)
| QDI | QD LLC & QD Capital |
Guarantor Subsidiaries |
Non-Guarantor Subsidiaries |
Eliminations | Consolidated | ||||||||||||||||||
| Operating revenues: |
|||||||||||||||||||||||
| Transportation |
$ | — | $ | — | $ | 580,676 | $ | — | $ | — | $ | 580,676 | |||||||||||
| Other service revenue |
— | — | 75,444 | 777 | — | 76,221 | |||||||||||||||||
| Fuel surcharge |
— | — | 94,661 | — | — | 94,661 | |||||||||||||||||
| Total operating revenues |
— | — | 750,781 | 777 | — | 751,558 | |||||||||||||||||
| Operating expenses: |
|||||||||||||||||||||||
| Purchased transportation |
— | — | 471,531 | — | — | 471,531 | |||||||||||||||||
| Compensation |
— | — | 85,838 | (18 | ) | — | 85,820 | ||||||||||||||||
| Fuel, supplies and maintenance |
— | — | 81,316 | — | — | 81,316 | |||||||||||||||||
| Depreciation and amortization |
— | — | 16,903 | 641 | — | 17,544 | |||||||||||||||||
| Selling and administrative |
1 | 1 | 31,166 | 123 | — | 31,291 | |||||||||||||||||
| Insurance costs |
— | — | 23,883 | — | — | 23,883 | |||||||||||||||||
| Taxes and licenses |
— | — | 3,980 | — | — | 3,980 | |||||||||||||||||
| Communication and utilities |
— | — | 11,381 | — | — | 11,381 | |||||||||||||||||
| Loss (gain) on disposal of property and equipment |
— | — | 1,150 | (191 | ) | — | 959 | ||||||||||||||||
| Operating (loss) income |
(1 | ) | (1 | ) | 23,633 | 222 | — | 23,853 | |||||||||||||||
| Interest (income) expense, non-related party, net |
(6 | ) | 29,580 | 1,025 | (75 | ) | — | 30,524 | |||||||||||||||
| Interest (income) expense, related party, net |
— | (29,019 | ) | 29,500 | (481 | ) | — | — | |||||||||||||||
| Write-off of debt issuance costs |
— | 2,031 | — | — | — | 2,031 | |||||||||||||||||
| Other expense (income) |
5 | 1,555 | (234 | ) | (386 | ) | — | 940 | |||||||||||||||
| (Loss) income before income taxes |
— | (4,148 | ) | (6,658 | ) | 1,164 | — | (9,642 | ) | ||||||||||||||
| (Benefit from) provision for income taxes |
(981 | ) | — | (1,562 | ) | 464 | — | (2,079 | ) | ||||||||||||||
| Equity in loss of subsidiaries |
(8,544 | ) | (4,396 | ) | — | — | 12,940 | — | |||||||||||||||
| Net (loss) income |
$ | (7,563 | ) | $ | (8,544 | ) | $ | (5,096 | ) | $ | 700 | $ | 12,940 | $ | (7,563 | ) | |||||||
F-53
Table of Contents
Quality Distribution, Inc. and Subsidiaries
Notes to Consolidated Financial Statements—(Continued)
For the Years Ended December 31, 2009, 2008 and 2007
Consolidating Balance Sheet, December 31, 2009
(in thousands)
| QDI | QD LLC and QD Capital |
Guarantor Subsidiaries |
Non-Guarantor Subsidiaries |
Eliminations | Consolidated | |||||||||||||||||||
| ASSETS |
||||||||||||||||||||||||
| Current Assets: |
||||||||||||||||||||||||
| Cash and cash equivalents |
$ | — | $ | — | $ | 3,531 | $ | 2,102 | $ | — | $ | 5,633 | ||||||||||||
| Accounts receivable, net |
52 | — | 69,477 | 96 | — | 69,625 | ||||||||||||||||||
| Prepaid expenses |
— | 96 | 8,473 | 15 | — | 8,584 | ||||||||||||||||||
| Deferred tax asset, net |
— | — | 5,506 | — | — | 5,506 | ||||||||||||||||||
| Other |
(104 | ) | — | 4,460 | 64 | — | 4,420 | |||||||||||||||||
| Total current assets |
(52 | ) | 96 | 91,447 | 2,277 | — | 93,768 | |||||||||||||||||
| Property and equipment, net |
— | — | 127,329 | — | — | 127,329 | ||||||||||||||||||
| Goodwill |
— | — | 27,023 | — | — | 27,023 | ||||||||||||||||||
| Intangibles, net |
— | — | 18,467 | — | — | 18,467 | ||||||||||||||||||
| Investment in subsidiaries |
(143,830 | ) | 456,186 | 21,229 | — | (333,585 | ) | — | ||||||||||||||||
| Other assets |
— | 9,204 | 3,825 | — | — | 13,029 | ||||||||||||||||||
| Total assets |
$ | (143,882 | ) | $ | 465,486 | $ | 289,320 | $ | 2,277 | $ | (333,585 | ) | $ | 279,616 | ||||||||||
| LIABILITIES, REDEEMABLE NONCONTROLLING INTEREST AND SHAREHOLDERS’ EQUITY (DEFICIT) |
||||||||||||||||||||||||
| Current Liabilities: |
||||||||||||||||||||||||
| Current maturities of indebtedness |
$ | — | $ | 16,031 | $ | 3,835 | $ | — | $ | — | $ | 19,866 | ||||||||||||
| Current maturities of capital lease obligations |
— | — | 5,322 | — | — | 5,322 | ||||||||||||||||||
| Accounts payable |
— | — | 6,182 | — | — | 6,182 | ||||||||||||||||||
| Intercompany |
(2,139 | ) | 312,705 | (283,664 | ) | (5,673 | ) | (21,229 | ) | — | ||||||||||||||
| Affiliates and independent owner-operators payable |
— | — | 9,734 | — | — | 9,734 | ||||||||||||||||||
| Accrued expenses |
— | 5,053 | 16,313 | 12 | — | 21,378 | ||||||||||||||||||
| Environmental liabilities |
— | — | 3,408 | — | — | 3,408 | ||||||||||||||||||
| Accrued loss and damage claims |
— | — | 8,862 | — | — | 8,862 | ||||||||||||||||||
| Total current liabilities |
(2,139 | ) | 333,789 | (230,008 | ) | (5,661 | ) | (21,229 | ) | 74,752 | ||||||||||||||
| Long-term indebtedness, less current maturities |
— | 275,527 | 8,726 | — | — | 284,253 | ||||||||||||||||||
| Capital lease obligations, less current maturities |
— | — | 11,843 | — | — | 11,843 | ||||||||||||||||||
| Environmental liabilities |
— | — | 8,241 | — | — | 8,241 | ||||||||||||||||||
| Accrued loss and damage claims |
— | — | 10,534 | — | — | 10,534 | ||||||||||||||||||
| Other non-current liabilities |
(1,007 | ) | — | 29,044 | 859 | — | 28,896 | |||||||||||||||||
| Total liabilities |
(3,146 | ) | 609,316 | (161,620 | ) | (4,802 | ) | (21,229 | ) | 418,519 | ||||||||||||||
| Redeemable noncontrolling interest in subsidiary |
— | — | 1,833 | — | — | 1,833 | ||||||||||||||||||
| Shareholders’ equity (deficit): |
||||||||||||||||||||||||
| Common Stock |
364,046 | 354,963 | 493,861 | 6,933 | (855,757 | ) | 364,046 | |||||||||||||||||
| Treasury stock |
(1,580 | ) | — | — | — | — | (1,580 | ) | ||||||||||||||||
| Accumulated (deficit) retained earnings |
(294,568 | ) | (290,784 | ) | (20,611 | ) | 1,174 | 310,221 | (294,568 | ) | ||||||||||||||
| Stock recapitalization |
(189,589 | ) | (189,589 | ) | — | (55 | ) | 189,644 | (189,589 | ) | ||||||||||||||
| Accumulated other comprehensive loss |
(25,587 | ) | (25,116 | ) | (24,143 | ) | (973 | ) | 50,232 | (25,587 | ) | |||||||||||||
| Stock purchase warrants |
6,696 | 6,696 | — | — | (6,696 | ) | 6,696 | |||||||||||||||||
| Stock subscriptions receivable |
(154 | ) | — | — | — | — | (154 | ) | ||||||||||||||||
| Total shareholders’ (deficit) equity |
(140,736 | ) | (143,830 | ) | 449,107 | 7,079 | (312,356 | ) | (140,736 | ) | ||||||||||||||
| Total liabilities, redeemable noncontrolling interest and shareholders’ (deficit) equity |
$ | (143,882 | ) | $ | 465,486 | $ | 289,320 | $ | 2,277 | $ | (333,585 | ) | $ | 279,616 | ||||||||||
F-54
Table of Contents
Quality Distribution, Inc. and Subsidiaries
Notes to Consolidated Financial Statements—(Continued)
For the Years Ended December 31, 2009, 2008 and 2007
Consolidating Balance Sheet, December 31, 2008
(in thousands)
| QDI | QD LLC and QD Capital |
Guarantor Subsidiaries |
Non- Guarantor Subsidiaries |
Eliminations | Consolidated | |||||||||||||||||||
| ASSETS |
||||||||||||||||||||||||
| Current Assets: |
||||||||||||||||||||||||
| Cash and cash equivalents |
$ | — | $ | — | $ | 4,725 | $ | 2,062 | $ | — | $ | 6,787 | ||||||||||||
| Accounts receivable, net |
71 | — | 81,470 | 71 | — | 81,612 | ||||||||||||||||||
| Prepaid expenses |
— | 96 | 12,811 | 15 | — | 12,922 | ||||||||||||||||||
| Deferred tax asset, net |
— | — | 14,707 | — | — | 14,707 | ||||||||||||||||||
| Other |
(9 | ) | — | 7,888 | 71 | — | 7,950 | |||||||||||||||||
| Total current assets |
62 | 96 | 121,601 | 2,219 | — | 123,978 | ||||||||||||||||||
| Property and equipment, net |
— | — | 148,692 | — | — | 148,692 | ||||||||||||||||||
| Goodwill |
— | — | 173,519 | — | — | 173,519 | ||||||||||||||||||
| Intangibles, net |
— | — | 22,698 | — | — | 22,698 | ||||||||||||||||||
| Investment in subsidiaries |
28,523 | 635,195 | 21,234 | — | (684,952 | ) | — | |||||||||||||||||
| Non-current deferred tax asset, net |
1,007 | — | 21,629 | — | — | 22,636 | ||||||||||||||||||
| Other assets |
— | 9,496 | 1,084 | — | — | 10,580 | ||||||||||||||||||
| Total assets |
$ | 29,592 | $ | 644,787 | $ | 510,457 | $ | 2,219 | $ | (684,952 | ) | $ | 502,103 | |||||||||||
| LIABILITIES, REDEEMABLE NONCONTROLLING INTEREST AND SHAREHOLDERS’ EQUITY (DEFICIT) |
||||||||||||||||||||||||
| Current Liabilities: |
||||||||||||||||||||||||
| Current maturities of indebtedness |
$ | — | $ | 2,500 | $ | 5,861 | $ | — | $ | — | $ | 8,361 | ||||||||||||
| Current maturities of capital lease obligations |
— | — | 7,994 | — | — | 7,994 | ||||||||||||||||||
| Accounts payable |
— | — | 16,126 | — | — | 16,126 | ||||||||||||||||||
| Intercompany |
(1,428 | ) | 289,974 | (261,748 | ) | (5,564 | ) | (21,234 | ) | — | ||||||||||||||
| Affiliates and independent owner-operators payable |
— | — | 7,649 | — | — | 7,649 | ||||||||||||||||||
| Accrued expenses |
— | 4,375 | 20,970 | 12 | — | 25,357 | ||||||||||||||||||
| Environmental liabilities |
— | — | 4,819 | — | — | 4,819 | ||||||||||||||||||
| Accrued loss and damage claims |
— | — | 8,705 | — | — | 8,705 | ||||||||||||||||||
| Total current liabilities |
(1,428 | ) | 296,849 | (189,624 | ) | (5,552 | ) | (21,234 | ) | 79,011 | ||||||||||||||
| Long-term indebtedness, less current maturities |
— | 319,415 | 10,994 | — | — | 330,409 | ||||||||||||||||||
| Capital lease obligations, less current maturities |
— | — | 15,822 | — | — | 15,822 | ||||||||||||||||||
| Environmental liabilities |
— | — | 6,035 | — | — | 6,035 | ||||||||||||||||||
| Accrued loss and damage claims |
— | — | 12,815 | — | — | 12,815 | ||||||||||||||||||
| Other non-current liabilities |
— | — | 24,383 | 775 | — | 25,158 | ||||||||||||||||||
| Total liabilities |
(1,428 | ) | 616,264 | (119,575 | ) | (4,777 | ) | (21,234 | ) | 469,250 | ||||||||||||||
| Redeemable noncontrolling interest in subsidiary |
— | — | 1,833 | — | — | 1,833 | ||||||||||||||||||
| Shareholders’ equity (deficit): |
||||||||||||||||||||||||
| Common Stock |
362,945 | 354,963 | 493,866 | 7,629 | (856,458 | ) | 362,945 | |||||||||||||||||
| Treasury stock |
(1,580 | ) | — | — | — | — | (1,580 | ) | ||||||||||||||||
| Accumulated (deficit) retained earnings |
(114,034 | ) | (110,364 | ) | 159,827 | 415 | (49,878 | ) | (114,034 | ) | ||||||||||||||
| Stock recapitalization |
(189,589 | ) | (189,589 | ) | — | (55 | ) | 189,644 | (189,589 | ) | ||||||||||||||
| Accumulated other comprehensive income |
(26,488 | ) | (26,487 | ) | (25,494 | ) | (993 | ) | 52,974 | (26,488 | ) | |||||||||||||
| Stock subscriptions receivable |
(234 | ) | — | — | — | — | (234 | ) | ||||||||||||||||
| Total shareholders’ equity (deficit) |
31,020 | 28,523 | 628,199 | 6,996 | (663,718 | ) | 31,020 | |||||||||||||||||
| Total liabilities, redeemable noncontrolling interest and shareholders’ equity (deficit) |
$ | 29,592 | $ | 644,787 | $ | 510,457 | $ | 2,219 | $ | (684,952 | ) | $ | 502,103 | |||||||||||
F-55
Table of Contents
Quality Distribution, Inc. and Subsidiaries
Notes to Consolidated Financial Statements—(Continued)
For the Years Ended December 31, 2009, 2008 and 2007
Condensed Consolidating Statement of Cash Flows
For the Year Ended December 31, 2009
(in thousands)
| QDI | QD LLC and QD Capital |
Guarantor Subsidiaries |
Non-Guarantor Subsidiaries |
Eliminations | Consolidated | |||||||||||||||||||
| Cash flows from operating activities: |
||||||||||||||||||||||||
| Net (loss) income |
$ | (180,534 | ) | $ | (180,420 | ) | $ | (180,438 | ) | $ | 759 | $ | 360,099 | $ | (180,534 | ) | ||||||||
| Adjustments for non-cash charges |
180,420 | 159,261 | 228,567 | (427 | ) | (360,099 | ) | 207,722 | ||||||||||||||||
| Net changes in assets and liabilities |
(893 | ) | 970 | 12,482 | 9 | — | 12,568 | |||||||||||||||||
| Intercompany activity |
1,007 | 20,189 | (20,895 | ) | (301 | ) | — | — | ||||||||||||||||
| Net cash provided by operating activities |
— | — | 39,716 | 40 | — | 39,756 | ||||||||||||||||||
| Cash flows from investing activities: |
||||||||||||||||||||||||
| Capital expenditures |
— | — | (8,221 | ) | — | — | (8,221 | ) | ||||||||||||||||
| Boasso purchase adjustment |
— | 266 | — | — | — | 266 | ||||||||||||||||||
| Proceeds from sale of tank wash assets |
— | — | 10,000 | — | — | 10,000 | ||||||||||||||||||
| Proceeds from sales of property and equipment |
— | — | 7,532 | — | — | 7,532 | ||||||||||||||||||
| Net cash used in investing activities |
— | 266 | 9,311 | — | — | 9,577 | ||||||||||||||||||
| Cash flows from financing activities: |
||||||||||||||||||||||||
| Proceeds from issuance of long-term debt |
— | — | — | — | — | — | ||||||||||||||||||
| Principal payments on long-term debt and capital lease obligations |
— | (4,618 | ) | (13,124 | ) | — | — | (17,742 | ) | |||||||||||||||
| Proceeds from revolver |
— | 28,600 | — | — | — | 28,600 | ||||||||||||||||||
| Payments on revolver |
— | (47,600 | ) | — | — | — | (47,600 | ) | ||||||||||||||||
| Financing costs |
— | (2,323 | ) | — | — | — | (2,323 | ) | ||||||||||||||||
| Deferred financing costs |
— | (2,554 | ) | — | — | — | (2,554 | ) | ||||||||||||||||
| Other |
— | (145 | ) | (8,751 | ) | — | — | (8,896 | ) | |||||||||||||||
| Intercompany activity |
— | 28,374 | (28,374 | ) | — | — | — | |||||||||||||||||
| Net cash used in financing activities |
— | (266 | ) | (50,249 | ) | — | — | (50,515 | ) | |||||||||||||||
| Effect of exchange rate changes on cash |
— | — | 28 | — | — | 28 | ||||||||||||||||||
| Net (decrease) increase in cash and cash equivalents |
— | — | (1,194 | ) | 40 | — | (1,154 | ) | ||||||||||||||||
| Cash and cash equivalents, beginning of period |
— | — | 4,725 | 2,062 | — | 6,787 | ||||||||||||||||||
| Cash and cash equivalents, end of period |
$ | — | $ | — | $ | 3,531 | $ | 2,102 | $ | — | $ | 5,633 | ||||||||||||
F-56
Table of Contents
Quality Distribution, Inc. and Subsidiaries
Notes to Consolidated Financial Statements—(Continued)
For the Years Ended December 31, 2009, 2008 and 2007
Condensed Consolidating Statement of Cash Flows
For the Year Ended December 31, 2008
(in thousands)
| QDI | QD LLC and QD Capital |
Guarantor Subsidiaries |
Non-Guarantor Subsidiaries |
Eliminations | Consolidated | |||||||||||||||||||
| Cash flows from operating activities: |
||||||||||||||||||||||||
| Net income (loss) |
$ | 12,112 | $ | 12,114 | $ | (4,724 | ) | $ | 823 | $ | (8,213 | ) | $ | 12,112 | ||||||||||
| Adjustments for non-cash charges |
(12,112 | ) | (45,149 | ) | 53,353 | (47 | ) | 8,213 | 4,258 | |||||||||||||||
| Net changes in assets and liabilities |
8 | 2,936 | (18 | ) | 297 | — | 3,223 | |||||||||||||||||
| Intercompany activity |
(8 | ) | 30,099 | (29,111 | ) | (980 | ) | — | — | |||||||||||||||
| Net cash provided by operating activities |
— | — | 19,500 | 93 | — | 19,593 | ||||||||||||||||||
| Cash flows from investing activities: |
||||||||||||||||||||||||
| Capital expenditures |
— | — | (14,791 | ) | — | — | (14,791 | ) | ||||||||||||||||
| Acquisition of businesses and assets |
— | — | (1,399 | ) | — | — | (1,399 | ) | ||||||||||||||||
| Boasso purchase adjustment |
— | 1,318 | — | — | — | 1,318 | ||||||||||||||||||
| Proceeds from sales of property and equipment |
— | — | 6,348 | — | — | 6,348 | ||||||||||||||||||
| Net cash provided by (used in) investing activities |
— | 1,318 | (9,842 | ) | — | — | (8,524 | ) | ||||||||||||||||
| Cash flows from financing activities: |
||||||||||||||||||||||||
| Proceeds from issuance of long-term debt |
— | — | 1,049 | — | — | 1,049 | ||||||||||||||||||
| Principal payments on long-term debt and capital lease obligations |
— | (7,707 | ) | (9,028 | ) | — | — | (16,735 | ) | |||||||||||||||
| Proceeds from revolver |
— | 115,700 | — | — | — | 115,700 | ||||||||||||||||||
| Payments on revolver |
— | (112,830 | ) | — | — | — | (112,830 | ) | ||||||||||||||||
| Deferred financing costs |
— | (860 | ) | — | — | (860 | ) | |||||||||||||||||
| Other |
20 | (145 | ) | 316 | — | — | 191 | |||||||||||||||||
| Intercompany activity |
(20 | ) | 4,524 | (4,504 | ) | — | — | — | ||||||||||||||||
| Net cash used in financing activities |
— | (1,318 | ) | (12,167 | ) | — | — | (13,485 | ) | |||||||||||||||
| Effect of exchange rate changes on cash |
— | — | (105 | ) | (403 | ) | — | (508 | ) | |||||||||||||||
| Net decrease in cash and cash equivalents |
— | — | (2,614 | ) | (310 | ) | — | (2,924 | ) | |||||||||||||||
| Cash and cash equivalents, beginning of period |
— | — | 7,339 | 2,372 | — | 9,711 | ||||||||||||||||||
| Cash and cash equivalents, end of period |
$ | — | $ | — | $ | 4,725 | $ | 2,062 | $ | — | $ | 6,787 | ||||||||||||
F-57
Table of Contents
Quality Distribution, Inc. and Subsidiaries
Notes to Consolidated Financial Statements—(Continued)
For the Years Ended December 31, 2009, 2008 and 2007
Condensed Consolidating Statement of Cash Flows
For the Year Ended December 31, 2007
(in thousands)
| QDI | QD LLC and QD Capital |
Guarantor Subsidiaries |
Non-Guarantor Subsidiaries |
Eliminations | Consolidated | |||||||||||||||||||
| Cash flows from operating activities: |
||||||||||||||||||||||||
| Net (loss) income |
$ | (7,563 | ) | $ | (8,544 | ) | $ | (5,096 | ) | $ | 700 | $ | 12,940 | $ | (7,563 | ) | ||||||||
| Adjustments for non-cash charges |
7,563 | (24,699 | ) | 49,795 | 837 | (12,940 | ) | 20,556 | ||||||||||||||||
| Net changes in assets and liabilities |
(753 | ) | 218 | 725 | 869 | — | 1,059 | |||||||||||||||||
| Intercompany activity |
753 | 33,025 | (31,220 | ) | (2,558 | ) | — | — | ||||||||||||||||
| Net cash provided by (used in) operating activities |
— | — | 14,204 | (152 | ) | — | 14,052 | |||||||||||||||||
| Cash flows from investing activities: |
||||||||||||||||||||||||
| Capital expenditures |
— | — | (10,557 | ) | — | — | (10,557 | ) | ||||||||||||||||
| Acquisition of Boasso and business assets |
— | (60,251 | ) | — | — | — | (60,251 | ) | ||||||||||||||||
| Cash acquired in Boasso acquisition |
— | 1,015 | — | — | — | 1,015 | ||||||||||||||||||
| Proceeds from sales of property and equipment |
— | — | 5,325 | 1,069 | — | 6,394 | ||||||||||||||||||
| Net cash (used in) provided by investing activities |
— | (59,236 | ) | (5,232 | ) | 1,069 | — | (63,399 | ) | |||||||||||||||
| Cash flows from financing activities: |
||||||||||||||||||||||||
| Proceeds from the issuance of debt |
— | 46,809 | — | — | — | 46,809 | ||||||||||||||||||
| Principal payments of long-term debt and capital lease obligations |
— | (64,746 | ) | (2,500 | ) | — | — | (67,246 | ) | |||||||||||||||
| Proceeds from revolver |
— | 123,030 | — | — | — | 123,030 | ||||||||||||||||||
| Payments on revolver |
— | (41,400 | ) | — | — | — | (41,400 | ) | ||||||||||||||||
| Deferred financing fees |
— | (9,170 | ) | — | — | — | (9,170 | ) | ||||||||||||||||
| Other |
(717 | ) | (145 | ) | 1,033 | — | — | 171 | ||||||||||||||||
| Intercompany activity |
717 | 4,858 | (5,575 | ) | — | — | — | |||||||||||||||||
| Net cash provided by (used in) financing activities |
— | 59,236 | (7,042 | ) | — | — | 52,194 | |||||||||||||||||
| Effect of exchange rate changes on cash |
— | — | 23 | — | — | 23 | ||||||||||||||||||
| Net increase in cash and cash equivalents |
— | — | 1,953 | 917 | — | 2,870 | ||||||||||||||||||
| Cash and cash equivalents, beginning of period |
— | — | 5,386 | 1,455 | — | 6,841 | ||||||||||||||||||
| Cash and cash equivalents, end of period |
$ | — | $ | — | $ | 7,339 | $ | 2,372 | $ | — | $ | 9,711 | ||||||||||||
F-58
Table of Contents
EXHIBIT INDEX
| Exhibit No. |
Description | |
| 3.1 | Amended and Restated Articles of Incorporation of Quality Distribution, Inc., dated November 4, 2003. Incorporated herein by reference to Exhibit 3.1 to Quality Distribution, Inc.’s Amendment No. 3 to Registration Statement on Form S-1 filed on November 5, 2003 (Registration No. 333-108344). | |
| 3.2 | Amended and Restated Bylaws of Quality Distribution. Inc., dated June 28, 2005. Incorporated herein by reference to Exhibit 3.2 to Quality Distribution, Inc.’s Current Report on Form 8-K filed on June 28, 2005 (Registration No. 333-108344). | |
| 3.3 | Articles of Amendment, dated June 28, 2005 to Amended and Restated Articles of Incorporation of Quality Distribution, Inc. Incorporated herein by reference to Exhibit 3.1 to Quality Distribution, Inc.’s Current Report on Form 8-K filed on June 28, 2005. | |
| 4.1 | Indenture governing the 9% Senior Subordinated Notes due 2010, dated as of November 13, 2003, among Quality Distribution, LLC, QD Capital Corporation, the guarantors named therein and The Bank of New York, as trustee. Incorporated herein by reference to Exhibit 4.5 to Quality Distribution, Inc.’s Annual Report on Form 10-K filed on March 30, 2004. | |
| 4.2 | Supplemental Indenture to the Indenture governing the 9% Senior Subordinated Notes due 2010, dated as of December 18, 2007, among Quality Distribution, LLC, QD Capital Corporation, Boasso America Corporation and The Bank of New York Trust Company, N.A., as trustee. Incorporated herein by reference to Exhibit 10.6 to Quality Distribution, Inc.’s Current Report on Form 8-K filed on December 24, 2007. | |
| 4.3 | Second Supplemental Indenture to the Indenture governing the 9% Senior Subordinated Notes due 2010, dated as of August 27, 2009, among Quality Distribution, LLC, QD Capital Corporation, QD Risk Services, Inc. and The Bank of New York Mellon, as trustee. Incorporated herein by reference to Exhibit 10.1 to Quality Distribution, Inc.’s Current Report on Form 8-K filed on August 31, 2009. | |
| 4.4 | Third Supplemental Indenture to the Indenture governing the Quality Distribution, LLC and QD Capital Corporation’s 9% Senior Subordinated Notes due 2010, dated as of October 14, 2009, among Quality Distribution, LLC, QD Capital Corporation, the guarantors named therein and The Bank of New York Mellon, as trustee. Incorporated herein by reference to Exhibit 4.1 to Quality Distribution, Inc.’s Current Report on Form 8-K filed on October 14, 2009. | |
| 4.5 | Form of Exchange Note for the 9% Senior Subordinated Notes due 2010 (included as Exhibit B to Exhibit 4.1). | |
| 4.6 | Indenture governing the Senior Floating Rate Notes due 2012, dated as of January 28, 2005, among Quality Distribution, LLC, QD Capital Corporation, the guarantors named therein and The Bank of New York Trust Company, N.A. as trustee. Incorporated herein by reference to Exhibit 10.2 to Quality Distribution, Inc.’s Current Report on Form 8-K filed on January 28, 2005. | |
| 4.7 | Supplemental Indenture to the Indenture governing the Senior Floating Rate Notes due 2012, dated as of December 18, 2007, among Quality Distribution, LLC, QD Capital Corporation, the guarantors named therein, Boasso America Corporation and The Bank of New York Trust Company, N.A., as trustee. Incorporated herein by reference to Exhibit 10.7 to Quality Distribution, Inc.’s Current Report on Form 8-K filed on December 24, 2007. | |
| 4.8 | Second Supplemental Indenture to the Indenture governing the Senior Floating Rate Notes due 2012, Series A, dated as of August 27, 2009, among Quality Distribution, LLC, QD Capital Corporation, the guarantors named therein, QD Risk Services, Inc. and The Bank of New York Mellon Trust Company, N.A., as trustee. Incorporated herein by reference to Exhibit 10.2 to Quality Distribution, Inc.’s Current Report on Form 8-K filed on August 31, 2009. | |
Table of Contents
| Exhibit No. |
Description | |
| 4.9 | Third Supplemental Indenture to the Indenture governing the Senior Floating Rate Notes due 2012, Series A, dated as of September 29, 2009, among Quality Distribution, LLC, QD Capital Corporation, the guarantors named therein and The Bank of New York Mellon Trust Company, N.A., as trustee. Incorporated herein by reference to Exhibit 4.1(a) to Quality Distribution, Inc.’s Current Report on Form 8-K filed on September 30, 2009. | |
| 4.10 | Form of Exchange Note for the Senior Floating Rate Notes due 2012, Series A (included as Exhibit B to Exhibit 4.6). | |
| 4.11 | Indenture with respect to the Senior Floating Rate Notes due 2012, Series B, dated as of December 18, 2007, among Quality Distribution, LLC, QD Capital Corporation, the guarantors named therein and The Bank of New York Trust Company, N.A., as trustee. Incorporated herein by reference to Exhibit 10.1 to Quality Distribution, Inc.’s Current Report on Form 8-K filed on December 24, 2007. | |
| 4.12 | Supplemental Indenture to the Indenture governing the Senior Floating Rate Notes due 2012, Series B, dated as of August 27, 2009, among Quality Distribution, LLC, QD Capital Corporation, the guarantors named therein, QD Risk Services, Inc. and The Bank of New York Mellon Trust Company, N.A., as trustee. Incorporated herein by reference to Exhibit 10.3 to Quality Distribution, Inc.’s Current Report on Form 8-K filed on August 31, 2009. | |
| 4.13 | Second Supplemental Indenture to the Indenture governing the Senior Floating Rate Notes due 2012, Series B, dated as of September 29, 2009, among Quality Distribution, LLC, QD Capital Corporation, the guarantors named therein and The Bank of New York Mellon Trust Company, N.A., as trustee. Incorporated herein by reference to Exhibit 4.1(b) to Quality Distribution, Inc.’s Current Report on Form 8-K filed on September 30, 2009. | |
| 4.14 | Form of Exchange Note for the Senior Floating Rate Notes due 2012, Series B (included as Exhibit B to Exhibit 4.11). | |
| 4.15 | Credit Agreement, dated as of December 18, 2007, among Quality Distribution, Inc., Quality Distribution, LLC, Credit Suisse, Cayman Islands Branch, as administrative agent, General Electric Capital Corporation, as collateral agent, SunTrust Bank, as syndication agent the lenders party thereto. Incorporated herein by reference to Exhibit 10.3 to Quality Distribution, Inc.’s Current Report on Form 8-K filed on December 24, 2007. | |
| 4.16 | Current Asset Revolving Facility Guarantee and Collateral Agreement, dated as of December 18, 2007, among Quality Distribution, Inc., Quality Distribution, LLC, its subsidiaries party thereto, Credit Suisse, Cayman Islands Branch, as current asset revolving facility administrative agent, General Electric Capital Corporation, as current asset revolving facility collateral agent and SunTrust Bank, as syndication agent. Incorporated herein by reference to Exhibit 10.4 to Quality Distribution, Inc.’s Current Report on Form 8-K filed on December 24, 2007. | |
| 4.17 | Fixed Asset Revolving Facility Guarantee and Collateral Agreement, dated as of December 18, 2007, among Quality Distribution, Inc., Quality Distribution, LLC, its subsidiaries party thereto, Credit Suisse, Cayman Islands Branch, as fixed asset revolving facility administrative agent, and General Electric Capital Corporation, as fixed asset revolving facility collateral agent. Incorporated herein by reference to Exhibit 10.5 to Quality Distribution, Inc.’s Current Report on Form 8-K filed on December 24, 2007. | |
| 4.18 | Indenture with respect to the 10% Senior Notes due 2013, dated as of October 15, 2009, among Quality Distribution, LLC, QD Capital Corporation, the guarantors named therein and The Bank of New York Mellon Trust Company, N.A., as trustee. Incorporated herein by reference to Exhibit 4.1 to Quality Distribution, Inc.’s Current Report on Form 8-K filed on October 16, 2009. | |
| 4.19 | Form of Exchange Note for the 10% Senior Notes due 2013 (included as Exhibit B to Exhibit 4.18). | |
Table of Contents
| Exhibit No. |
Description | |
| 4.20 | Registration Rights Agreement with respect to the 10% Senior Notes due 2013, dated as October 15, 2009, among Quality Distribution, LLC, QD Capital Corporation, the guarantors named therein, and Credit Suisse Securities (USA) LLC and Moelis & Company LLC, as dealer managers. Incorporated herein by reference to Exhibit 4.2 to Quality Distribution, Inc.’s Current Report on Form 8-K filed on October 16, 2009. | |
| 4.21 | Indenture with respect to the 11.75% Senior Subordinated PIK Notes due 2013, dated as of October 15, 2009, among Quality Distribution, LLC, QD Capital Corporation, the guarantors named therein and The Bank of New York Mellon Trust Company, N.A., as trustee. Incorporated herein by reference to Exhibit 4.3 to Quality Distribution, Inc.’s Current Report on Form 8-K filed on October 16, 2009. | |
| 4.22 | Form of Exchange Note for the 11.75% Senior Subordinated PIK Notes due 2013 (included as Exhibit B to Exhibit 4.21). | |
| 4.23 | Registration Rights Agreement with respect to the 11.75% Senior Subordinated PIK Notes due 2013, dated as October 15, 2009, among Quality Distribution, LLC, QD Capital Corporation, the guarantors named therein and Credit Suisse Securities (USA) LLC and Moelis & Company LLC, as dealer managers. Incorporated herein by reference to Exhibit 4.4 to Quality Distribution, Inc.’s Current Report on Form 8-K filed on October 16, 2009. | |
| 4.24 | Warrant Agreement, dated as October 15, 2009, between Quality Distribution, Inc. and The Bank of New York Mellon Trust Company, N.A., as warrant agent. Incorporated herein by reference to Exhibit 4.5 to Quality Distribution, Inc.’s Current Report on Form 8-K filed on October 16, 2009. | |
| 10.1 | Amended and Restated Shareholders’ Agreement, dated as of February 10, 1998, among MTL Inc., Apollo Investment Fund III, L.P., Apollo Overseas Partners III, L.P., Apollo U.K. Fund III, L.P. and certain shareholders of MTL Inc. Incorporated herein by reference to Exhibit 4.13 to Quality Distribution, Inc.’s Annual Report on Form 10-K filed on March 29, 2002. | |
| 10.2 | Amended and Restated Common and Preferred Stock Purchase and Shareholders’ Agreement, dated as of August 28, 1998, among BT Investment Partners, Inc., MTL Equity Investors, L.L.C., Apollo Investment Fund III, L.P., Apollo Overseas Partners III, L.P., Apollo U.K. Fund III, L.P. and MTL, Inc. Incorporated herein by reference to Exhibit 4.14 to Quality Distribution, Inc.’s Annual Report on Form 10-K filed on March 29, 2002. | |
| 10.3 | Amendment No. 1, dated as of April 2, 2002, to the Amended and Restated Common and Preferred Stock Purchase and Shareholders’ Agreement, dated as of August 28, 1998, among BT Investment Partners, Inc., MTL Equity Investors, L.L.C., Apollo Investment Fund III, L.P., Apollo Overseas Partners III, L.P., Apollo U.K. Fund III, L.P. and MTL, Inc. Incorporated herein by reference to Exhibit 10.3 to Quality Distribution, LLC’s Registration Statement on Form S-4 filed on August 14, 2002 (Registration No. 333-98077). | |
| 10.4 | Second Amended and Restated Registration Rights Agreement, dated as of August 28, 1998, among Apollo Investment Fund III, L.P., Apollo Overseas Partners III, L.P., Apollo U.K. Fund III, L.P., Quality Distribution, Inc. and certain shareholders of Quality Distribution, Inc.. Incorporated herein by reference to Exhibit 10.4 to Quality Distribution, LLC’s Registration Statement on Form S-4 filed on August 14, 2002 (Registration No. 333-98077). | |
| 10.5 | Agreement, dated as of May 30, 2002, among Apollo Investment Fund III, L.P., Apollo Overseas Partners III, L.P., Apollo U.K. Fund III, L.P., Quality Distribution, Inc., and certain shareholders of Quality Distribution, Inc. Incorporated herein by reference to Exhibit 10.5 to Quality Distribution, LLC’s Registration Statement on Form S-4 filed on August 14, 2002 (Registration No. 333-98077). | |
| 10.6† | Quality Distribution, Inc. 1998 Stock Option Plan of Incorporated herein by reference to Exhibit 10.1 to Quality Distribution, Inc.’s Registration Statement on Form S-4 filed on November 3, 1998 (Registration No. 333-66711). | |
Table of Contents
| Exhibit No. |
Description | |
| 10.7† | Employment Agreement, dated June 23, 1998, between Quality Distribution, Inc. and Dennis R. Copeland. Incorporated herein by reference to Exhibit 10.7 to Quality Distribution, Inc.’s Annual Report on Form 10-K filed on March 29, 2002. | |
| 10.8 | Warrant Agreement (including form of warrant certificate), dated as of May 30, 2002, between Quality Distribution, Inc. and The Bank of New York. Incorporated herein by reference to Exhibit 10.32 to Quality Distribution, Inc.’s Amendment No. 2 to Registration Statement on Form S-1 filed on October 24, 2003 (Registration No. 333-108344). | |
| 10.9† | Form of Stock Option Agreement Under 2003 Stock Option Plan of Quality Distribution, Inc. Incorporated herein by reference to Exhibit 10.34 to Quality Distribution, Inc.’s Amendment No. 3 to Registration Statement on Form S-1 filed on November 5, 2003 (Registration No. 333-108344). | |
| 10.10† | Form of Restricted Award Agreement Under 2003 Restricted Stock Plan of Quality Distribution, Inc. Incorporated herein by reference to Exhibit 10.36 to Quality Distribution, Inc.’s Amendment No. 3 to Registration Statement on Form S-1 filed on November 5, 2003 (Registration No. 333-108344). | |
| 10.11† | Employment Agreement dated November 3, 2004 between Quality Distribution, Inc. and Gary Enzor. Incorporated herein by reference to Exhibit 99.2 to Quality Distribution, Inc.’s Current Report on Form 8-K filed on November 9, 2004. | |
| 10.12† | Quality Distribution, Inc. 2003 Stock Option Plan, as amended. Incorporated herein by reference to Exhibit 10.1 to Quality Distribution, Inc.’s Current Report on Form 8-K filed on May 16, 2005. | |
| 10.13† | Quality Distribution, Inc. 2003 Restricted Stock Incentive Plan, as amended. Incorporated herein by reference to Exhibit 10.2 to Quality Distribution, Inc.’s Current Report on Form 8-K filed on May 16, 2005. | |
| 10.14† | Form of Non Qualified Stock Option Agreement. Incorporated herein by reference to Exhibit 10.5 to Quality Distribution, Inc.’s Current Report on Form 8-K filed on June 7, 2005. | |
| 10.15† | Form of Restricted Stock Award Agreement. Incorporated herein by reference to Exhibit 10.6 to Quality Distribution, Inc.’s Current Report on Form 8-K filed on June 7, 2005. | |
| 10.16† | Employment Agreement dated April 1, 2007 between Quality Distribution, Inc. and Jonathan C. Gold. Incorporated herein by reference to Exhibit 10.2 to Quality Distribution, Inc.’s Quarterly Report on Form 10-Q filed on May 9, 2007. | |
| 10.17† | Agreement and Release, effective as of April 24, 2008, between Quality Distribution, Inc. and Virgil Leslie. Incorporated herein by reference to Exhibit 10.1 to Quality Distribution, Inc.’s Quarterly Report on Form 10-Q filed on August 8, 2008. | |
| 10.18† | Separation Agreement and General Release, effective as of July 25, 2008, between Quality Distribution, Inc. and Timothy B. Page. Incorporated herein by reference to Exhibit 10.1 to Quality Distribution, Inc.’s Quarterly Report on Form 10-Q filed on November 7, 2008. | |
| 10.19† | Employment Agreement, dated July 28, 2008, between Quality Distribution, Inc. and Stephen R. Attwood. Incorporated herein by reference to Exhibit 10.2 to Quality Distribution, Inc.’s Quarterly Report on Form 10-Q filed on November 7, 2008. | |
| 10.20† | Quality Distribution, Inc. Key Employee Deferred Compensation Plan, as Amended and Restated January 1, 2009. Incorporated herein by reference to Exhibit 10.23 to Quality Distribution, Inc.’s Annual Report on Form 10-K filed on March 13, 2009. | |
| 10.21† | Separation Agreement and General Release dated December 31, 2009, between Quality Distribution, Inc. and Dennis R. Copeland. Incorporated herein by reference to Exhibit 10.26 to Quality Distribution, LLC and QD Capital Corporation’s Amendment No. 1 to Registration Statement on Form S-4 (Registration No. 333-163868) filed on February 5, 2010. | |
Table of Contents
| Exhibit No. |
Description | |
| 10.22† | Professional Services Agreement, dated December 31, 2009, between Quality Distribution, Inc. and Dennis R. Copeland. Incorporated herein by reference to Exhibit 10.27 to Quality Distribution, LLC and QD Capital Corporation’s Amendment No. 1 to Registration Statement on Form S-4 (Registration No. 333-163868) filed on February 5, 2010. | |
| 21.1 | Subsidiaries of the Registrant. Incorporated herein by reference to Exhibit 10.27 to Quality Distribution, LLC and QD Capital Corporation’s Amendment No. 1 to Registration Statement on Form S-4 (Registration No. 333-163868) filed on February 5, 2010. | |
| 23 * | Consent of PricewaterhouseCoopers, LLP | |
| 24 * | Powers of Attorney | |
| 31.1 * | Certification of Chief Executive Officer pursuant to Rule 13(a) – 14(a). | |
| 31.2 * | Certification of Chief Financial Officer pursuant to Rule 13(a) – 14(a). | |
| 32.1 * | Certification of Chief Executive Officer and Chief Financial Officer pursuant to 18 U.S.C. Section 1350, as adopted pursuant to Section 906 of the Sarbanes-Oxley Act of 2002. | |
| * | Document is filed with this Form 10-K |
| † | Indicates a compensatory plan or arrangement contemplated by Item 15 a (3) of Form 10-K. |