Attached files
| file | filename |
|---|---|
| EX-23 - CONSENT - QUALITY DISTRIBUTION INC | d828579dex23.htm |
| EX-21 - SUBSIDIARIES - QUALITY DISTRIBUTION INC | d828579dex21.htm |
| EX-32.1 - CERTIFICATION - QUALITY DISTRIBUTION INC | d828579dex321.htm |
| EX-31.1 - CERTIFICATION - QUALITY DISTRIBUTION INC | d828579dex311.htm |
| EX-31.2 - CERTIFICATION - QUALITY DISTRIBUTION INC | d828579dex312.htm |
| EX-10.34 - EMPLOYMENT AGREEMENT - QUALITY DISTRIBUTION INC | d828579dex1034.htm |
| EX-10.35 - MODIFICATION TO TERMS OF EMPLOYMENT - QUALITY DISTRIBUTION INC | d828579dex1035.htm |
| EXCEL - IDEA: XBRL DOCUMENT - QUALITY DISTRIBUTION INC | Financial_Report.xls |
| EX-3.4 - AMENDED AND RESTATED BYLAWS OF QUALITY DISTRIBUTION. INC. - QUALITY DISTRIBUTION INC | d828579dex34.htm |
Table of Contents
UNITED STATES
SECURITIES AND EXCHANGE COMMISSION
Washington, DC 20549
FORM 10-K
| x | ANNUAL REPORT PURSUANT TO SECTION 13 OR 15(d) OF THE SECURITIES EXCHANGE ACT OF 1934 |
For the fiscal year ended December 31, 2014
| ¨ | TRANSITION REPORT PURSUANT TO SECTIONS 13 OR 15(d) OF THE SECURITIES EXCHANGE ACT OF 1934 |
For the transition period from to
COMMISSION FILE NUMBER 000-24180
Quality Distribution, Inc.
(Exact name of registrant as specified in its charter)
| Florida | 59-3239073 | |
| (State or other jurisdiction of incorporation or organization) |
(IRS Employer Identification No.) |
4041 Park Oaks Boulevard, Suite 200
Tampa, Florida 33610
(Address of principal executive offices) (zip code)
Registrant’s telephone number, including area code:
813-630-5826
SECURITIES REGISTERED PURSUANT TO SECTION 12(b) OF THE ACT:
| Title of each class |
Name of each exchange on which registered | |
| Common Stock (no par value per share) | NASDAQ Global Market |
SECURITIES REGISTERED PURSUANT TO SECTION 12(g) OF THE ACT:
| Title of each class |
Name of each exchange on which registered |
None
Indicate by check mark if the registrant is a well-known seasoned issuer, as defined in Rule 405 of the Securities Act. Yes ¨ No x
Indicate by check mark if the registrant is not required to file reports pursuant to Section 13 or Section 15(d) of the Exchange Act. Yes ¨ No x
Indicate by check mark whether the Registrant (1) has filed all reports required to be filed by Section 13 or 15(d) of the Securities Exchange Act of 1934 during the preceding 12 months (or for such shorter period that the Registrant was required to file such reports), and (2) has been subject to such filing requirements for the past 90 days. Yes x No ¨
Indicate by check mark whether the registrant has submitted electronically and posted on its corporate Web site, if any, every Interactive Data File required to be submitted and posted pursuant to Rule 405 of Regulation S-T (§ 232.405 of this chapter) during the preceding 12 months (or for such shorter period that the registrant was required to submit and post such files). Yes x No ¨
Indicate by check mark if disclosure of delinquent filers pursuant to Item 405 of Regulation S-K is not contained herein, and will not be contained, to the best of Registrant’s knowledge, in definitive proxy or information statements incorporated by reference in Part III of this Form 10-K or any amendment to this Form 10-K. ¨
Indicate by check mark whether the registrant is a large accelerated filer, an accelerated filer, a non-accelerated filer or a smaller reporting company. See the definitions of “large accelerated filer,” “accelerated filer” and “smaller reporting company” in Rule 12b-2 of the Exchange Act. (Check one):
| Large accelerated filer | ¨ | Accelerated filer | x | |||
| Non-accelerated filer | ¨ (Do not check if a smaller reporting company) | Smaller reporting company | ¨ | |||
Indicate by check mark whether the registrant is a shell company (as defined in Exchange Act Rule 12b-2). Yes ¨ No x
Aggregate market value of voting stock held by non-affiliates as of June 30, 2014 was $408.8 million (based on the closing sale price of $14.86 per share).
As of March 9, 2015, the registrant had 28,060,384 outstanding shares of Common Stock, no par value, outstanding.
Table of Contents
DOCUMENTS INCORPORATED BY REFERENCE
1. Portions of Quality Distribution, Inc. Notice of Annual Meeting and Proxy Statement (“Proxy Statement”) for our Annual Meeting of Shareholders which will be held May 28, 2015. The Proxy Statement will be filed within 120 days of the end of the fiscal year ended December 31, 2014. (Part III of Form 10-K).
Table of Contents
In this Annual Report on Form 10-K, unless the context otherwise requires or indicates, the terms (i) “Company,” “our Company,” “Quality Distribution,” “QDI,” “we,” “us” and “our” refer to Quality Distribution, Inc. and its consolidated subsidiaries and their predecessors, (ii) “Quality Distribution, LLC” and “QD LLC” refer to our wholly-owned subsidiary, Quality Distribution, LLC, a Delaware limited liability company, and its consolidated subsidiaries and their predecessors, (iii) “QD Capital” means our wholly owned subsidiary, QD Capital Corporation, a Delaware corporation, (iv) “QCI” means our wholly-owned subsidiary, Quality Carriers, Inc., an Illinois corporation, (v) “Boasso” means our wholly-owned subsidiary, Boasso America Corporation, a Louisiana corporation, (vi) “QCER” means, collectively, our wholly-owned subsidiary, QC Energy Resources, Inc., a Delaware corporation, and its wholly-owned subsidiaries, QC Energy Resources, LLC, a Delaware limited liability company, QC Energy Resources Northwest, LLC, a Delaware limited liability company, and QC Energy Resources Texas, LLC, a Delaware limited liability company, as well as our wholly-owned subsidiary, QC Environmental Services, Inc., a North Dakota corporation, and (vii) “CLC” refers to our wholly-owned subsidiary, Chemical Leaman Corporation, a Pennsylvania corporation.
FORWARD-LOOKING STATEMENTS AND CERTAIN CONSIDERATIONS
This report and other documents that are publicly disseminated by us contain or might contain forward-looking statements within the meaning of the Securities Act of 1933 (the “Securities Act”), the Securities Exchange Act of 1934 (the “Exchange Act”), and the Private Securities Litigation Reform Act of 1995. All statements included in this report and in any subsequent filings made by us with the SEC, other than statements of historical fact, that address activities, events or developments that we or our management expect, believe or anticipate will or may occur in the future, are forward-looking statements. These statements represent our reasonable judgment on the future based on various factors and using numerous assumptions and are subject to known and unknown risks, uncertainties and other factors that could cause our actual results and financial position to differ materially. We claim the protection of the safe harbor for forward-looking statements provided in the Private Securities Litigation Reform Act of 1995, Section 27A of the Securities Act and Section 21E of the Exchange Act. Examples of forward-looking statements include: (i) projections of revenue, earnings, capital structure and other financial items, (ii) statements of our plans and objectives, (iii) statements of expected future economic performance, and (iv) assumptions underlying statements regarding us or our business. Forward-looking statements can be identified by, among other things, the use of forward-looking language, such as “believes,” “expects,” “estimates,” “may,” “will,” “should,” “could,” “seeks,” “plans,” “intends,” “anticipates” or “scheduled to,” or the negatives of those terms, or other variations of those terms or comparable language, or by discussions of strategy or other intentions.
Forward-looking statements are subject to known and unknown risks, uncertainties and other factors that could cause our actual results to differ materially from those contemplated by the statements. The forward-looking information is based on various factors and was derived using numerous assumptions. Important factors that could cause our actual results to be materially different from the forward-looking statements include the risks and other factors discussed under Item 1A “Risk Factors” in this Annual Report on Form 10-K. Some of these factors include:
| • | the effect of local, national and international economic, credit, capital and labor market conditions on the economy in general, and on the particular industries in which we operate, including capacity challenges in the industry, changes in fuel and insurance prices, interest rate fluctuations, and downturns in customers’ business cycles and shipping requirements; |
| • | our substantial leverage and our ability to make required payments and comply with restrictions contained in our debt arrangements or to otherwise generate sufficient cash from operations or borrowings under the senior secured credit facilities to fund our liquidity needs; |
| • | competition and rate fluctuations, including fluctuations in prices and demand for transportation services as well as for commodities such as natural gas and oil; |
| • | our reliance on independent affiliates and independent owner-operators; |
| • | reclassification of our independent contractors, such as our independent owner-operators, as a result of legislative, judicial or regulatory changes or for any other reason; |
| • | our ability to attract and retain qualified drivers; |
| • | our potential liability related to our financial support obligations for third-party equipment leasing programs; |
| • | the impact of changes in unconventional oil and gas (“UCO&G”) production, whether due to changes in oil and gas prices or other reasons, on demand for our energy logistics services; |
1
Table of Contents
| • | our liability as a self-insurer to the extent of our deductibles or other self-insured expenses, as well as changing conditions and pricing in the insurance marketplace; |
| • | increased unionization, which could increase our operating costs or constrain operating flexibility; |
| • | changes in or our inability to comply with governmental regulations and legislative changes affecting the transportation industry generally or in the particular segments in which we operate; |
| • | federal and state legislative and regulatory initiatives, which could result in increased costs and additional operating restrictions upon us or our customers; |
| • | our costs and environmental liabilities from operations involving hazardous materials; |
| • | potential disruption at U.S. ports of entry; |
| • | diesel fuel prices and our ability to recover costs through fuel surcharges; |
| • | our ability to access and use our salt water disposal wells and other disposal sites and methods in our energy logistics business; |
| • | terrorist attacks and the cost of complying with existing and future anti-terrorism security measures; |
| • | our dependence on senior management; |
| • | the potential loss of our ability to use net operating losses to offset future income; |
| • | potential future impairment charges; |
| • | our ability to realize benefits from prior and any future acquisitions; |
| • | adverse weather conditions; |
| • | disruptions of our information technology and communications systems; |
| • | changes in health insurance benefit regulations; |
| • | our liability for our proportionate share of unfunded vested benefit liabilities, particularly in the event of our withdrawal from any of our multi-employer pension plans; |
| • | the assumptions underlying our expectations of financial results in 2015; and |
| • | changes in planned or actual capital expenditures due to operating needs, changes in regulation, covenants in our debt arrangements and other expenses, including interest expenses. |
In addition, there may be other factors that could cause our actual results to be materially different from the results referenced in the forward-looking statements. All forward-looking statements contained in this Annual Report on Form 10-K are qualified in their entirety by this cautionary statement. Forward-looking statements speak only as of the date they are made, and we do not intend to update or otherwise revise the forward-looking statements to reflect events or circumstances after the date of this Annual Report on Form 10-K or to reflect the occurrence of unanticipated events. If we update one or more forward-looking statements, no inference should be made that we will make additional updates with respect to those or other forward-looking statements.
2
Table of Contents
PART I
| ITEM 1. | BUSINESS |
Overview
We operate the largest chemical bulk tank truck network in North America through QCI , and are also the largest provider of intermodal International Organization for Standardization (“ISO”) tank container and depot services in North America through Boasso. We also provide logistics and transportation services, including the transportation of crude oil, production fluids and fresh water to the UCO&G market through QCER. We operate an asset-light business model and service customers across North America through a network of 95 terminals servicing the chemical market, 19 terminals servicing the energy market and 9 ISO tank depot services terminals (intermodal) servicing the chemical and other bulk liquid markets.
Financial Reporting Segments
We have three reportable business segments for financial reporting purposes that are distinguished primarily on the basis of services offered. Our segments are delineated as follows:
| • | Chemical Logistics, which consists of the transportation of bulk chemicals primarily through our network that includes company-operated terminals and terminals operated by 28 independent affiliates, and equipment rental income; |
| • | Intermodal, which consists of Boasso’s intermodal ISO tank container transportation and depot services business primarily supporting the international movement of bulk liquids; and |
| • | Energy Logistics, which consists primarily of the transportation of crude oil, disposal water and fresh water for the UCO&G market, through our network that includes one company-operated terminal and terminals operated by 4 independent affiliates, and equipment rental income. |
Beginning with 2014, we have allocated certain corporate and shared service overhead costs to “Shared Services.” Shared Services consists of information technology, driver recruiting, safety, accounting, tax, stock-based compensation, pension, environmental and other corporate headquarters costs.
Chemical Logistics
Our subsidiary, QCI, coordinates the transport of a broad range of chemical products and provides our customers with logistics and other value-added services. We are a core carrier for most of the major companies engaged in chemical processing, including Arclin, Ashland, BASF, Bayer, Dow, DuPont, Honeywell, PPG Industries, Procter & Gamble, Shell Oil Company, Unilever and Valspar, and we provide services to most of the top 100 chemical producers with U.S. operations.
The chemical tank truck market in North America includes all products shipped by bulk tank truck carriers and consists mainly of liquid and dry bulk chemicals (including plastics) and bulk dry and liquid food-grade products. Based on industry sources, we estimate that the highly fragmented North American for-hire segment of the bulk transport market generated revenues of approximately $6.9 billion in 2013. We specifically operate in the for-hire chemical and food grade bulk transport market (which we estimated to be $4.3 billion in 2013). We believe we have the leading market share (estimated at 14% in 2013) in this sector based on revenues. In 2014, we announced the addition to our network of six new terminals operated by independent affiliates, as well as a bulk rail intermodal service. We believe being a larger carrier facilitates customer service and lane density and provides a more favorable cost structure. As such, we believe we are well-positioned to expand our business by increasing our market share.
Chemical bulk tank truck industry growth is generally dependent on volume growth in the industrial chemical industry, the rate at which chemical companies outsource their transportation needs, the overall capacity of the rail system, and, in particular, the extent to which chemical companies make use of the rail system for their bulk chemical transportation needs. We also believe that North American chemical producers will gain a global competitive advantage and grow domestic production (thus shipments which we can service) through the use of low-cost energy sources, primarily natural gas and natural gas liquids.
The chemical bulk tank truck industry is characterized by high barriers to entry such as the time and cost required to develop the operational infrastructure necessary to handle sensitive chemical cargo, the financial and managerial resources required to recruit and train drivers, substantial industry regulatory requirements, strong customer relationships and the significant capital investments required to build a fleet of equipment and establish a network of terminals. The tank truck business is competitive and fragmented, and we compete primarily with other tank truck carriers and dedicated private fleets in various states within the United States and Canada. Competition from for-hire carriers is composed of fewer than ten large carriers, most of which have other businesses that do not compete with ours, and more than 200 smaller, primarily regional carriers. With respect to certain aspects of our business, we also
3
Table of Contents
compete with other modes of transportation including pipelines and railroads. Intermodal transportation has increased in recent years, and we recently launched an intermodal initiative to grow our chemical business. Competition for bulk tank truck services is based primarily on rates and service, as well as driver and equipment capacity. We believe that we enjoy significant competitive advantages over other tank truck carriers because of our market share, overall fleet size, asset-light model, variable cost structure, strength of our independent affiliates and our national terminal network.
Our transportation revenue in the chemical logistics segment is principally a function of the volume of shipments by the bulk chemical industry, prices, the average number of miles driven per load, our market share and the allocation of shipments between tank truck transportation and other modes of transportation such as rail. Additionally, it is common practice in the bulk tank truck industry for customers to pay fuel surcharges.
Intermodal
Our subsidiary, Boasso, provides intermodal ISO tank container transportation and depot services through terminals located in the eastern half of the United States. Boasso’s terminals are strategically positioned near all major shipping ports along the Gulf and East Coasts, as well as inland ports in Chicago and Detroit. In addition to intermodal tank transportation services, Boasso provides tank cleaning, heating, testing, maintenance and storage services to customers. Boasso also provides local and over-the-road trucking, primarily within the proximity of the port cities where its depots are located.
Boasso’s revenues are impacted by U. S. chemical import/export volume, in particular the number and volume of shipments through ports where Boasso has terminals, as well as Boasso’s market share in those locations. Chemical manufacturers have sought to efficiently transport their products on a global basis by utilizing ISO tank containers, and we believe the resulting demand for providers that can offer a broad range of services within the supply chain will drive future growth in this sector. Additionally, North American Intermodal chemical transportation volume continues to shift towards ISO tank containers versus conventional drums. We believe that our intermodal business will benefit from these trends because of its market leadership, experience and track record.
Boasso operates in the intermodal ISO tank container transportation and depot services market, which we believe was approximately a $1.0 to $1.5 billion market in 2013. The intermodal ISO tank container business generally provides services that facilitate the global movement of liquid and dry bulk chemicals, pharmaceuticals and food grade products.
The proliferation of global import/export of bulk liquid chemicals has driven the movement of basic manufacturing out of the United States and has resulted in an increase in chemical plant infrastructure to service these off-shore industries. Driven by this globalization, the intermodal ISO tank container market is a growing sector of the overall liquid bulk chemical transportation sector. Demand for intermodal ISO tank containers is impacted by the aggregate volume of imports and exports of chemicals through United States ports. Demand is also impacted by the shift in modes of transportation, from drums to larger and more efficient ISO tank containers. Additionally, we believe our intermodal business will benefit from the low cost energy from the UCO&G market. We believe that Boasso will benefit from these trends because of its market leadership, geographic positioning, experience and track record.
Energy Logistics
Our subsidiary, QCER, services the UCO&G market through the transportation of crude oil, flowback and produced brine water, fresh water and the disposal of flowback and produced brine water, as well as providing services ancillary to these activities.
As of December 31, 2014, we operate in the Bakken, Denver-Julesburg, Eagle Ford, Marcellus, Mississippian Limestone, Mowry, Niobrara, Permian Basin, Powder River, Utica and Woodford shale regions in North America, all of which have experienced drilling for both oil and natural gas, with the exception of Marcellus, which is solely natural gas. Our strategy to target multiple resource-rich shales helps to diversify our customer offerings, lessen the impact of swings in any one commodity or regional activity and optimize equipment utilization. Our energy logistics business is primarily involved in fluid management and logistics in the upstream segment of the energy industry, in connection with the establishment and servicing of production wells, and the midstream segment of the energy industry in connection with the transportation of crude oil. Demand for our services is driven by the number of active and producing wells, which impacts the transportation of crude oil and produced water, as well as the level of new drilling activity, which influences the transportation of fresh water and flowback water. Demand is also driven by market prices for oil and gas, which influence the exploration and production activities of our customers, the prices they are willing to pay for our services and the shales in which they operate. We are currently prioritizing increasing our transportation of crude oil and produced water, which we refer to as post-production activities, over the transportation of fresh water and flowback water, which we refer to as production activities. We believe that our focus on post-production activities will lessen our reliance on production and drilling related activities, which tend to be more volatile. We expect regulation of this industry to increase over time but believe that the scope of our operations and experience with regulation in our chemical logistics business may provide us with an advantage over our competitors.
4
Table of Contents
Seasonality
Due to the nature of our customers’ business, our revenues are seasonal. Revenues generally decline during winter months, namely our first and fourth fiscal quarters and over holidays, and rise during our second and third fiscal quarters. Highway transportation can be adversely affected depending upon the severity of the weather in various sections of the country during the winter months. During periods of heavy snow, ice or rain, we may not be able to move our trucks and equipment between locations, thereby reducing our ability to provide services and generate revenues. Additionally, in our energy logistics segment, drilling within certain shales that we service may be adversely affected by the severity of weather in various sections of the country.
Competition
The tank truck business is competitive and fragmented. In our chemical logistics segment, we compete primarily with other tank truck carriers and dedicated private fleets in various states within the United States and Canada. Competition from for-hire carriers is composed of fewer than ten large carriers, most of which have other businesses that do not compete with ours, and more than 200 smaller, primarily regional carriers. With respect to certain aspects of our business, we also compete with other modes of transportation including pipelines and railroads. Intermodal transportation has increased in recent years. Competition for bulk tank truck services is based primarily on rates and service, as well as driver and equipment capacity. We believe that we enjoy significant competitive advantages over other tank truck carriers because of our market share, overall fleet size, asset-light model, variable cost structure, strength of our independent affiliates and our national terminal network.
Our intermodal business competes primarily with other national, regional and local tank truck carriers and dedicated private fleets, as well as local and regional ISO tank and dry container transporters. Competition in our intermodal ISO tank container services business primarily depends on which competitors have facilities that are proximate to the ports serviced by Boasso. Among competitors in a given port location, competition is based primarily on rates and service.
Our energy logistics business competes with national, regional and local trucking companies, dedicated private fleets, providers of above ground pipeline services and the integrated oil companies. In certain aspects of our energy business, we may also compete with rail and pipeline companies, as well as companies offering produced water recycling services. Competition in the provision of energy logistics services is primarily based on rates and service within particular shales.
Our Competitive Strengths
We believe the following competitive strengths will enable us to sustain our market leadership and continue to grow our business:
Comprehensive Geographic Footprints Across our Businesses
We operate the largest chemical bulk tank truck network in North America with an approximate 14% share of the highly fragmented $4.3 billion for-hire chemical and food grade bulk transport market (which excludes fuel transportation), in each case estimated by us based on industry data contained in Bulk Transporter’s Tank Truck Carrier 2013 Annual Gross Revenue Report. We are also the largest provider of intermodal ISO tank container and depot services in North America, strategically located throughout the major port cities on the East and Gulf Coasts as well as in the Midwest. In our energy logistics business, we maintain a presence in all of the major United States shales. This breadth of geographic footprint in each of our businesses enables us to offer our customers best in class services where they need them and to rapidly respond as those needs change. Further, we have begun to leverage this geographic diversity combined with our operational expertise across our businesses to expand our customer relationships and capture additional revenue opportunities.
We believe that our unique large nationwide networks create significant barriers to entry that benefit our businesses. Our chemical logistics business covers substantially all major North American chemical shippers and enables us to serve customers with both international and national requirements better than our competitors, the majority of which are regionally focused. Similarly, our Intermodal ISO tank business is strategically located in all major port locations on the East Coast and Gulf Coast, as well as being the leading full-service provider of transportation, storage, heating and repair services for ISO tank containers in the market. Although the demand for energy logistics services tends to be shale specific, many of our energy customers operate across multiple shales, and we believe the breadth of our network provides us with the opportunity to build relationships with those customers on a national basis. In all of our businesses, we believe our size allows us, our independent affiliates and our independent owner-operators to benefit from economies of scale in the purchasing of supplies and services, including fuel, tires and insurance coverage as well as equipment.
Asset-Light Business Model
Our extensive use of independent affiliates and independent owner-operators results in a highly variable cost structure with relatively minimal sustaining net capital expenditure requirements. The independent affiliates are generally responsible for facility
5
Table of Contents
capital investments and most of the operating expenses related to the business they service, including the capital costs related to purchasing and maintaining tractors. Typically, independent affiliates purchase or lease tractors for their business directly from the manufacturers, and to a lesser extent from us, and lease most of their non-owned trailers from us. Independent owner-operators are independent contractors who, through a contract with us, supply one or more tractors and drivers for our use. As with independent affiliates, independent owner-operators are responsible for most of the operating expenses related to the business they service, including costs related to the acquisition and maintenance of tractors. Some independent owner operators have lease-to-buy arrangements with us, our independent affiliates or with third-party financing sources for tractors. Because we typically invest in trailers that have long, useful lives, and do not own ISO tank containers, we generally expect sustaining capital expenditures for our chemical, energy and intermodal businesses, net of proceeds from property and equipment sales, to be approximately 1% to 2.0% of operating revenues annually, compared to the industry average of more than 10% for truckload carrier companies. This model contributes to the stability of cash flow and margins and results in higher returns on invested capital.
We prefer to own the trailers as they provide us with a stable source of lease income, as well as access to attractive capital through our asset-based loan facility. Through proper maintenance, we are typically able to extend the useful lives of trailers beyond 20 years, leading to operational flexibility.
Established Blue Chip Customer Base
We serve customers in a number of different industries, whose products reach a diverse group of end-markets. Our chemical logistics business services most of the top 100 chemical producers with U.S. operations, our intermodal business provides services to all major non-vessel operating common carriers engaged in our operating footprint, and our energy logistics business provides services to a diversified base of participants in the energy exploration and production market in the U.S. Our key customers include Arclin, Arkema, Ashland, BASF, Chesapeake Energy, Dow, DuPont, Hess, Hoyer Global, Inc., Newport Tank Container, PPG Industries, Procter & Gamble, Stolt-Nielsen USA, Talisman and Valspar, among others. In each of 2014, 2013 and 2012, no single customer accounted for more than 5.0% of total revenues. In many cases, we have established long-term relationships with these clients, which we believe helps us attract and retain experienced independent affiliate terminal operators and drivers. Our national account representatives and executives have significant experience in our industries, which we believe enables them to provide practical solutions to complex customer issues.
Exposure to High Growth International Markets
Through Boasso’s operations, we have significant exposure to high growth international markets. Boasso is the largest provider of intermodal ISO tank container and depot services in North America. The intermodal tank container transportation market has experienced significant growth as international chemical trade has increased and chemical manufacturers move towards greater utilization of intermodal tanks and standardized intermodal tank containers to efficiently transport their products around the world via sea, land and air. Our intermodal tank container depots, which provide transportation, cleaning, heating, testing, maintenance and storage services, are located at or near ports in New Orleans, LA; Houston, TX; Newark, NJ; Charleston, SC; Chicago, IL; Detroit, MI; Savannah, GA; Jacksonville, FL; and Norfolk, VA.
Environment
We believe pricing in the chemical tank truck and ISO tank container markets tends to be more stable than pricing in the overall trucking industry. We believe the specialized nature of our industries, including specifically licensed drivers, specialized equipment and more stringent safety requirements, creates barriers to entry, which limit the more drastic swings in supply experienced by the broader trucking industry. Further, current high levels of demand for chemical tank truck and ISO tank container services, which we believe will increase in the next few years as chemical production increases, create a favorable pricing environment. Additionally, it is common practice in the chemical tank truck and ISO tank container industries for customers to pay fuel surcharges, which enables trucking companies to mitigate the impact from rising fuel costs.
While pricing in the energy markets tends to be less stable than in the other markets in which we operate, we believe pricing in the crude oil hauling portion of the energy market is more stable. We have shifted our efforts to haul more oil, versus water hauling which tends to have greater pricing pressure from customers. In addition, crude oil hauling pricing tends to be higher than water hauling pricing due to certain equipment requirements and driver certifications. We also believe that pricing differs among major shale regions based on capacity constraints and other market conditions.
Safe and Efficient Operations
We have a strong emphasis on safety in our operations and have a consistent focus on improving productivity and efficiency. Given the nature of the cargo we haul, which requires a high degree of careful handling, we believe that our strong and proactive focus on safety creates a competitive advantage for us. For example, although there remains no regulatory requirement to implement electronic logging devices (“ELDs”), previously referred to as electronic on-board recorders (“EOBRs”), we completed the installation of ELDs, in substantially all of our U.S. chemical logistics fleet in 2011 and our intermodal logistics fleet in 2012. In
6
Table of Contents
2012, federal legislation was enacted to mandate the use of ELDs; however, the required implementing regulations have not yet been issued. Once that legislation is implemented, the rest of the industry will be required to implement similar safety technology. We are also testing ELD alternatives in our energy logistics business. We believe this strong and proactive focus positions us well to comply with the Federal Motor Carrier Safety Administration (“FMCSA”) Compliance, Safety and Accountability (“CSA”) program, which imposes additional safety standards on the industry. Additionally, we believe that our historical ability to maintain insurance costs consistently below industry averages is a reflection of our consistent record of safety and the strength of our safety procedures versus our competitors.
Strong Management Team with a Track Record of Success
As demonstrated by both the recent upswing in the chemical market as well as the last economic downturn, the transportation industry presents opportunities and challenges that require an experienced management team to navigate. Led by our Chairman and Chief Executive Officer, Gary Enzor, our Executive Vice President and Chief Financial Officer, Joseph Troy, and our business unit Presidents Randall Strutz, Scott Giroir and Christopher Broussard, we believe our management team provides a depth and breadth of significant managerial, operational and financial experience that provides us with a competitive advantage.
Independent Affiliates
In our chemical logistics segment and our energy logistics segment, we operate with an asset-light structure designed to reduce our assets employed and capital expenditure requirements. In furtherance of this, we maintain contractual relationships with independent trucking companies who agree to provide their equipment and expertise to support the provision of transportation services exclusively to our customers in defined markets. We refer to these independent companies as our independent affiliates.
In exchange for the services rendered, independent affiliates are normally paid an agreed upon percentage of the revenues collected on each load hauled, which is referred to as “Purchased Transportation” in our Consolidated Statements of Operations. In addition, we have provided growth incentive programs to certain independent affiliates in our chemical logistics business that enable them to earn a greater percentage of chemical logistics transportation revenues in 2014 and in future periods. Independent affiliates pay all tractor operating expenses for tractors they own and lease such as fuel, physical damage insurance, tractor maintenance, fuel taxes and highway use taxes. However, we reimburse independent affiliates for certain expenses passed through to our customers, such as tolls and scaling charges. We generated approximately 93%, 90% and 90% of our chemical logistics transportation revenue in the years ended December 31, 2014, 2013 and 2012, respectively, from independent affiliates. We generated approximately 54%, 33% and 23% of our energy logistics transportation revenue in the years ended December 31, 2014, 2013 and 2012, respectively, from independent affiliates. The change in our energy logistics transportation revenue was the result of the affiliation of company-operated terminals which we expect to continue. Due to several factors, including our ownership of the customer contracts and relationships, our provision of back-office support in areas such as collections, billing and claims, our direct relationships with independent owner-operators, the presence of non-compete agreements with the independent affiliates, and, in some cases, our ownership of the trailers utilized in the contracted business, our relationships with our independent affiliates tend to be long-term in nature, with minimal turnover. We also monitor volume performance of each independent affiliate on a regular basis to ensure operating performance is in line with management’s expectations. We work proactively with our independent affiliates to take corrective action or render assistance where appropriate and have certain contractual mechanisms in place to remedy underperformance.
Independent Owner-Operators
We and our independent affiliates extensively utilize independent owner-operators. Independent owner-operators are independent contractors who, through contracts with our operating subsidiaries, supply one or more tractors and drivers for our subsidiaries’ or independent affiliates’ use. Independent owner-operators’ contracts generally are terminable by either party upon short notice.
In exchange for the services rendered, independent owner-operators are normally paid an agreed upon percentage of the revenues collected on each load hauled or on a per mile rate, which is referred to as “Purchased Transportation” in our Consolidated Statements of Operations. The percentage of revenues paid to independent owner-operators by us is lower than the percentage paid to our independent affiliates, which have a different cost structure. Independent owner-operators pay all tractor operating expenses such as fuel, physical damage insurance, tractor maintenance, fuel taxes and highway use taxes. However, we reimburse independent owner-operators for certain expenses passed through to our customers, such as tolls and scaling charges.
We compete with other motor carriers for the services of our drivers and independent owner-operators. We operate programs intended to benefit independent owner-operators by reducing their operating expenses for business requirements such as tractors, fuel, tires, occupational accident insurance and physical damage insurance. In addition, we have established lease purchase programs with certain third-party financing providers to facilitate certain independent owner-operators to lease tractors from those third parties. Our overall size and our reputation for good relations have enabled us to attract qualified professional drivers and independent owner-operators.
7
Table of Contents
Employees and Independent Owner-Operators
At December 31, 2014, we utilized 3,538 drivers of which 2,429 were utilized in our chemical logistics segment, 677 were utilized in our energy logistics segment and 432 were utilized in our intermodal segment. Of this total, 1,659 were independent affiliate drivers, 1,495 were independent owner-operators, and 384 were company employee drivers.
Company Personnel
At December 31, 2014, we employed 804 personnel (excluding drivers). Of this total, 399 were employed in our intermodal segment, 150 were employed in our chemical logistics segment, 86 were employed in our energy logistics segment, and 169 were corporate personnel reflected in shared services for financial reporting purposes.
Union Labor
At December 31, 2014, we had 182 company employees who were members of the International Brotherhood of Teamsters. All such unionized company employees are utilized in our chemical logistics segment. In addition, certain independent affiliates providing transportation services to us in the chemical logistics segment had 4 employees of their companies who were members of the International Brotherhood of Teamsters.
Tractors, Trailers and Energy Logistics Equipment
As of December 31, 2014, we managed a fleet of approximately 3,200 tractors, 5,700 trailers and 1,200 pieces of energy logistics equipment utilized by us, our independent affiliates, independent owner-operators or shippers. The majority of our trailers are single compartment, chemical-hauling trailers. The balance of the fleet is made up of multi-compartment trailers, dry bulk trailers, and special-use energy equipment. The chemical transport units typically have a capacity between 5,000 and 7,800 gallons and are designed to meet DOT specifications for transporting hazardous materials. Each trailer is designed for a useful service life of 15 to 20 years, though this has successfully been extended by us through upgrades and modifications. Each tractor is designed for a useful life of 5 to 7 years, though this can also be extended through upgrades and modifications. Our energy logistics equipment utilized for transporting fresh water and disposal water typically has a capacity between 4,600 and 5,500 gallons, is designed to meet DOT specifications, and typically has a useful service life of 4 to 15 years. Our energy logistics equipment utilized for hauling oil typically has a capacity between 8,000 and 10,000 gallons, is designed to meet DOT specifications, and typically has a useful service life of 10 to 15 years.
We utilize our own and third-party repair shops for inspecting and repairing our fleets. Our systems enable us to determine when inspections and scheduled maintenance needs to be performed.
The following tables show the approximate number and age of tractors, trailers and energy logistics equipment we managed in all of our businesses as of December 31, 2014 and 2013:
| TRACTORS (1) |
LESS THAN 4 YEARS |
4~5 YEARS |
6~10 YEARS |
GREATER THAN 10 YEARS |
2014 TOTAL |
2013 TOTAL |
||||||||||||||||||||||
| Company |
668 | 105 | 127 | 22 | 922 | 832 | ||||||||||||||||||||||
| Independent Affiliate |
536 | 203 | 485 | 119 | 1,343 | 1,178 | ||||||||||||||||||||||
| Independent Owner-Operator |
128 | 58 | 413 | 331 | 930 | 889 | ||||||||||||||||||||||
|
|
|
|
|
|
|
|
|
|
|
|
|
|||||||||||||||||
| Total |
1,332 | 366 | 1,025 | 472 | 3,195 | 2,899 | ||||||||||||||||||||||
|
|
|
|
|
|
|
|
|
|
|
|
|
|||||||||||||||||
| TRAILERS (1)(2) |
LESS THAN 6 YEARS |
6~10 YEARS |
11~15 YEARS |
16~20 YEARS |
GREATER THAN 20 YEARS |
2014 TOTAL |
2013 TOTAL |
|||||||||||||||||||||
| Company (3) |
723 | 506 | 340 | 938 | 664 | 3,171 | 3,384 | |||||||||||||||||||||
| Independent Affiliate |
308 | 337 | 255 | 691 | 702 | 2,293 | 1,638 | |||||||||||||||||||||
| Shipper-Owned |
7 | 142 | 19 | 22 | 55 | 245 | 233 | |||||||||||||||||||||
|
|
|
|
|
|
|
|
|
|
|
|
|
|
|
|||||||||||||||
| Total |
1,038 | 985 | 614 | 1,651 | 1,421 | 5,709 | 5,255 | |||||||||||||||||||||
8
Table of Contents
| TRACTORS (1) |
LESS THAN 4 YEARS |
4~5 YEARS |
6~10 YEARS |
GREATER THAN 10 YEARS |
2014 TOTAL |
2013 TOTAL |
||||||||||||||||||||||
| ENERGY LOGISTICS EQUIPMENT (4) |
LESS THAN 4 YEARS |
4-5 YEARS |
6-10 YEARS |
11-15 YEARS |
GREATER THAN 15 YEARS |
2014 TOTAL |
2013 TOTAL |
|||||||||||||||||||||
| Company |
779 | 48 | 55 | 9 | 1 | 892 | 922 | |||||||||||||||||||||
| Independent Affiliate |
87 | 2 | 11 | 1 | — | 101 | 143 | |||||||||||||||||||||
| Independent Owner-Operator |
21 | 11 | 79 | 56 | 18 | 185 | 236 | |||||||||||||||||||||
| Shipper-Owned |
— | — | — | — | — | — | 79 | |||||||||||||||||||||
|
|
|
|
|
|
|
|
|
|
|
|
|
|
|
|||||||||||||||
| Total |
887 | 61 | 145 | 66 | 19 | 1,178 | 1,380 | |||||||||||||||||||||
|
|
|
|
|
|
|
|
|
|
|
|
|
|
|
|||||||||||||||
| (1) | Age based upon original date of manufacture; tractor, trailer or equipment may be substantially refurbished or re-manufactured. Most company tractors are leased to independent affiliates or independent owner-operators. |
| (2) | Excludes approximately 1,700 chassis utilized in the intermodal segment. |
| (3) | Excludes approximately 300 chassis utilized in the chemical logistics segment. |
| (4) | Includes tractors, trailers and service equipment. |
Technology
We rely heavily on information technology and communications systems to operate our business and manage our network in an efficient manner. In contrast to many of our smaller competitors, we have equipped our drivers with various mobile communications systems that enable us to monitor our tractors and communicate with our drivers in the field and enable customers to track the location and monitor the progress of their cargo through the Internet. We have implemented ELDs within our U.S. chemical logistics business and our intermodal business, and are testing ELD alternatives in our energy logistics business. Despite redundancies and security measures, our information technology and communications systems remain susceptible to outages, computer viruses, break-ins, human error, data leakage and other disruptions and imperfections.
Risk Management, Insurance and Safety
The primary insurable risks associated with our business are motor vehicle related bodily injury and property damage, workers’ compensation and cargo loss and damage (which includes spills, chemical releases, contaminations and damage or loss to the equipment we own or lease). We maintain insurance and self-insurance programs against these risks and are subject to liability as a self-insurer to the extent of the deductible under each policy or the amount of such self-insurance programs. We currently maintain liability insurance limits of $65.0 million for bodily injury and property damage, subject to a $2.0 million deductible per occurrence.
We currently maintain a $1.0 million per incident deductible for workers’ compensation insurance coverage, except in those states where state-run workers’ compensation programs do not provide for deductibles. We are insured over our deductible up to the statutory requirement.
We employ personnel to perform compliance checks and conduct safety tests throughout our operations. A number of safety programs are conducted that are designed to promote compliance with rules and regulations and to reduce accidents. These programs include training programs, driver recognition programs, safety awards, driver safety meetings, distribution of safety bulletins to drivers and participation in national safety associations.
Environmental Matters
It is our policy to comply with all applicable environmental, safety, and health laws. We also are committed to the principles of Responsible Care®, an international chemical industry initiative to enhance the industry’s responsible management of chemicals. We have obtained independent certification that our chemical logistics’ management system is in place and functions according to professional standards, and we continue to evaluate and continuously improve our Responsible Care® Management System performance. Our current activities involve the handling, transportation and storage of bulk chemicals, both liquid and dry, wastewater from oil and gas wells and crude oil, which in many cases are classified as hazardous materials or hazardous substances. The energy logistics business operates disposal wells for non-conventional oil drilling wastewater. In addition, our former tank wash business (which was sold in 2009) and the remaining limited tank wash activities we continue to conduct, involve the generation, storage, discharge and disposal of wastes that may contain hazardous substances. As such, we and others who operate in our industry are subject to environmental, health and safety laws and regulation by U.S. federal, state and local agencies as well as foreign
9
Table of Contents
governmental authorities. Environmental laws and regulations are complex, and address emissions to the air, discharge onto land or water, and the generation, handling, storage, transportation, treatment and disposal of waste materials. These laws change frequently and generally require us to obtain and maintain various licenses and permits. Environmental laws have tended to become more stringent over time, and most provide for substantial fines and potential criminal sanctions for violations. Some of these laws and regulations are subject to varying and conflicting interpretations. Under certain of these laws, we could also be subject to allegations of liability for the activities of our independent affiliates or independent owner-operators.
We are potentially subject to strict joint and several liability for investigating and rectifying the consequences of spills and other releases and accidents involving such substances. From time to time, we have incurred remedial costs and regulatory penalties with respect to chemical or wastewater spills and releases at our facilities and on the road, and, notwithstanding the existence of our environmental management program, we cannot: (1) assure that such obligations will not be incurred in the future, (2) predict with certainty the extent of future liabilities and costs under environmental, health, and safety laws, or (3) assure that such liabilities will not result in a material adverse effect on our business, financial condition, operating results or cash flow. We have established reserves for remediation expenses at known contamination sites when it is probable that such efforts will be required of us and the related expenses can be reasonably estimated. We have also incurred in the past, and expect to incur in the future, expenditures related to environmental compliance; however, we do not anticipate that compliance with existing environmental laws will have a material adverse effect on our earnings or competitive position.
10
Table of Contents
Reserves
Our policy is to accrue remediation expenses when it is probable that such efforts will be required and the related expenses can be reasonably estimated. Estimates of costs for future environmental compliance and remediation may be impacted by such factors as changes in environmental laws and regulatory requirements, the availability and application of technology, the identification of currently unknown potential remediation sites and the allocation of costs among the potentially responsible parties under the applicable statutes. Our reserves for environmental compliance and remediation are adjusted periodically as remediation efforts progress or as additional technical or legal information becomes available. It is difficult to quantify with certainty the potential financial impact of actions regarding expenditures for environmental matters, particularly remediation, and future capital expenditures for environmental control equipment. Nevertheless, based upon the information currently available, we believe that our ultimate liability arising from such environmental matters, taking into account the reserves described below, should not be material to our business or financial condition. As of December 31, 2014 and December 31, 2013, we had reserves in the amount of approximately $8.2 million and $8.3 million, respectively, for all environmental matters, of which the most significant are presented and discussed below.
| Number of Sites | Reserves (in millions) | |||||||||||||||
| December 31, 2014 |
December 31, 2013 |
December 31, 2014 |
December 31, 2013 |
|||||||||||||
| Multi-party sites |
17 | 17 | $ | 1.7 | $ | 2.1 | ||||||||||
| Sole party major sites: |
||||||||||||||||
| Bridgeport, New Jersey |
1 | 1 | 4.4 | 3.6 | ||||||||||||
| William Dick, Pennsylvania |
1 | 1 | 0.3 | 0.7 | ||||||||||||
| Other Properties |
7 | 7 | 1.8 | 1.9 | ||||||||||||
|
|
|
|
|
|
|
|
|
|||||||||
| Total |
26 | 26 | $ | 8.2 | $ | 8.3 | ||||||||||
|
|
|
|
|
|
|
|
|
|||||||||
The following descriptions of environmental matters include estimates for future expenditures that we believe are probable and are reasonably estimable. The estimate of the range of reasonably possible costs is less certain than the estimates upon which the reserves are based, and the estimated high ends of the ranges do not represent our maximum theoretical liability.
Changes to the environmental reserves are reflected in our Consolidated Statements of Operations within the “Selling and administrative” category.
Property Contamination Liabilities
We have been named as (or are alleged to be) a potentially responsible party under the Comprehensive Environmental Response, Compensation and Liability Act of 1980, as amended (“CERCLA”) and similar state laws at approximately 26 sites at December 31, 2014.
Multi-Party Sites
At 17 of the 26 sites, we are one of many parties with alleged liability and are negotiating with Federal, State or private parties on the scope of our obligations, if any. At 2 of the 17 sites, we have explicitly denied any liability and since there has been no subsequent demand for payment, we have not established a reserve for these matters. At 4 of the 17 sites, we have received notices about our potential liability; however, we do not have enough information upon which to estimate our potential liability at this time, and as a result we have not established a reserve for these matters. At 10 of the 17 sites, 2 are in settlement discussions, 4 are in long-term operation and maintenance, and 4 are in various stages of remedial investigation or remedial action work.
At 1 of the 17 sites, we are one of approximately 70 companies party to a May 2007 Administrative Order on Consent (“AOC”) with the U.S. Environmental Protection Agency (“USEPA”) to perform a Remedial Investigation/Feasibility Study (“RI/FS”) of the contaminants in the lower seventeen-mile stretch of the Passaic River, known as the Lower Passaic River Study Area. The RI/FS is expected to be submitted to the USEPA by the end of the second quarter of 2015. Sampling results indicate that the primary contaminants of concern in the river are dioxin, mercury and PCBs. Separately, in April 2014 USEPA released its Focused Feasibility Study (the “FFS”) with its proposed plan for an interim remedy of the lower eight miles of the Lower Passaic River Study Area. The USEPA’s preferred plan in the FFS would involve dredging the river bank to bank and installing an engineered cap. The USEPA accepted public comments on the FFS through August 20, 2014, and the comment period has closed. The AOC for the RI/FS does not obligate us to fund or perform any remedial action contemplated by the FFS or any permanent remedy that may be recommended in the RI/FS. There are many uncertainties associated with the final cost and allocation of potential liability for any remedial actions
11
Table of Contents
on the river, and the Company cannot reliably estimate its portion, if any, of the final costs for this matter at this time. We have found no evidence that the Company’s operations at this location contributed any contaminants of concern to the river, and the Company believes that the evidence developed so far indicates that companies other than ours are responsible for substantially all of the remediation that may be ultimately required. We have set reserves for only our share of the costs of the RI/FS and a small dredging and capping project at River Mile 10 performed by the 70 companies that has now been completed, except for operations and maintenance of less than $0.1 million. The Company will vigorously defend itself in this matter.
We have estimated future expenditures for these 17 multi-party environmental matters to be in the range of $1.7 million to $3.8 million. As of December 31, 2014, we have reserved $1.7 million.
Sole Party Major Sites
At 9 of the 26 sites, we are alleged to be the only responsible party and are in the process of conducting investigations and/or remediation projects. Six of these projects relate to operations conducted by CLC and its subsidiaries prior to our acquisition of CLC in 1998. These six sites are: (1) Bridgeport, New Jersey; (2) William Dick, Pennsylvania; (3) Tonawanda, New York; (4) Scary Creek, West Virginia; (5) Charleston, West Virginia; and (6) East Rutherford, New Jersey. The remaining three sites relate to investigations and potential remediation that were triggered by the New Jersey Industrial Site Recovery Act (“ISRA”), which requires such investigations and remediation following the sale of industrial facilities. Each of the six CLC sites is discussed in more detail below. We have estimated future expenditures for these 9 properties to be in the range of $6.5 million to $16.7 million. As of December 31, 2014, we have reserved $6.5 million.
Bridgeport, New Jersey
QDI is required under the terms of three federal consent decrees to perform remediation work at this operating truck terminal and tank wash site. CLC entered into consent orders with USEPA in 1991 to treat groundwater, in 1998 to remove contamination in the wetlands, and in 2010 to assess and remediate contaminated soils at the site.
The groundwater treatment remedy negotiated with USEPA required us to construct a treatment facility for in-place treatment of groundwater contamination and a local discharge which was completed in early 2007. After various start-up issues, the treatment facility began long-term operations in July 2011 and is in the operations and maintenance phase. The plant appears to be performing in accordance with its design criteria and meeting permit requirements. Based on the second annual groundwater report, contamination was not completely delineated at the site and a limited number of additional monitoring wells were installed during 2014. The additional monitoring results appeared to indicate that the groundwater contamination at the site has now been completely delineated, and no further monitoring wells are expected to be required. Wetlands contamination has been remediated with localized restoration completed. Monitoring of the restored wetlands is required by USEPA and is on-going. USEPA has requested additional monitoring through 2017. In regard to contaminated soils, USEPA finalized the feasibility study and issued a record of decision in 2009 for the limited areas that show contamination and warrant additional investigation or work. We entered into a consent order with USEPA in 2010 to perform the remediation work, which will consist primarily of in-place thermal treatment. In late 2012, USEPA concluded that our additional required site investigation work for delineation purposes was complete. We have finished the preliminary engineering design phase, the 95% design and the 100% design report for the thermal treatment of contaminated soils. The final design also includes limited groundwater extraction with treatment through the existing plant. Comments from USEPA on the 100% thermal design report have been received and substantially addressed. A Design Addendum has been submitted to address the additional limited groundwater extraction and treatment needed. The project is now entering the construction site activity phase for the thermal remediation, which starts with the installation of the thermal wells needed to perform the work. We have estimated aggregate expenditures for the Bridgeport location to be in the range of $4.4 million to $8.5 million. As of December 31, 2014, we have reserved $4.4 million.
William Dick, Pennsylvania
CLC entered into a consent order with the Pennsylvania Department of Environmental Protection and USEPA in 1995 to provide a replacement water supply to area residents, treat contaminated groundwater, and perform remediation of contaminated soils at this former wastewater disposal site. The replacement water supply is complete. We completed construction of an interim remedy that consisted of a groundwater treatment facility with local discharge in 2007 and the treatment facility began full-time operations in 2010. In order to negotiate a final long-term groundwater remedy with USEPA, a feasibility study workplan was submitted to the Agency. Although the planned soil treatment work was completed in 2007, test results indicated that soil clean-up objectives were not fully achieved in certain areas of both the shallow and deep soil subzones. Soil piles generated from isolated discrete removal actions were subsequently treated on-site and used as backfill at the site. The fieldwork for the additional limited soil remediation consisting of targeted in-situ chemical treatment of the shallow and deep soil subzones at the site was completed in 2014. USEPA issued a letter on September 30, 2014 stating that the construction phase of the remedy is complete and the remedy is operating as intended. This
12
Table of Contents
concludes the remedial action work for the soils operable unit in accordance with the approved remedial design. We have estimated aggregate expenditures for the William Dick location to be in the range of $0.3 million to $3.4 million. As of December 31, 2014, we have reserved $0.3 million.
Other Properties
Tonawanda, New York: CLC entered into a consent order with the New York Department of Environmental Conservation (“NYSDEC”) in 1999 obligating it to perform soil and groundwater remediation at this former truck terminal and tank wash site. The state issued a record of decision in 2006. The remedial design work plan has been approved by the NYSDEC, and the remedial action phase is expected to begin during the second quarter of 2015.
Scary Creek, West Virginia: CLC received a cleanup notice from the state environmental authority in 1994. The state and we have agreed that remediation can be conducted under the state’s voluntary clean-up program (instead of the state superfund enforcement program). We are currently completing the originally planned remedial investigation and the additional site investigation work which, for 2015 only, will include groundwater monitoring.
Charleston, West Virginia: CLC completed its remediation plan for a former drum disposal area in 1995 at this truck terminal and tank wash site under the terms of a state hazardous waste permit. Supplemental groundwater monitoring was also required and completed. In 2012, we entered into the state’s voluntary clean-up program which requires us to perform additional sampling to close the site. The sampling work phase that was negotiated with the State of West Virginia has been completed at the site, and a report was submitted to the West Virginia Department of Environmental Protection (“WVDEP”) in which we requested confirmation from the WVDEP that no additional sampling work was necessary. WVDEP concurred and approved the Site Assessment Report in July 2014. A Risk Assessment Report was then prepared, as requested, and submitted to WVDEP for review and approval on September 30, 2014.
East Rutherford, New Jersey: This former truck terminal property was sold after CLC completed a plan of remediation relating to a diesel fuel release, but the New Jersey Department of Environmental Protection (“NJDEP”) did not grant closure. Additional soil sampling and groundwater monitoring work was deemed necessary to close the site under the technical requirements of the State’s licensed site remediation professional program. Soil sampling results indicate further sampling is necessary to delineate the extent of soil contamination in one area at the property that may require limited remediation. Soil delineation work is expected to be completed during 2015.
ISRA New Jersey Facilities: We are obliged to conduct investigations and remediation at three current or former New Jersey tank wash and terminal sites pursuant to the state’s ISRA program, which requires such remediation following the sale of facilities after 1983. Two of the sites are in the process of remedial investigation with projections set in contemplation of limited soil remediation expense for contaminated areas.
One site has completed the investigation phase and a final report was submitted to NJDEP. In accordance with the report findings and with the concurrence of the NJDEP, remedial efforts included limited soil excavation at the site, deed recordation, placement of clean fill and the designation of a classification exception area for the groundwater. No further field remediation work is expected, and this site has entered a long-term monitoring phase.
We have estimated aggregate future expenditures for Tonawanda, Scary Creek, Charleston, East Rutherford and ISRA New Jersey to be in the range of $1.8 million to $4.8 million. As of December 31, 2014, we have reserved $1.8 million.
Other Legal Matters
We are from time to time involved in routine litigation incidental to the conduct of our business. We believe that no such routine litigation currently pending against us, if adversely determined, would have a material adverse effect on our consolidated financial position, results of operations or cash flows.
Motor Carrier and Other Regulation
As a motor carrier, we are subject to regulation by the FMCSA, which is a unit of the DOT. The FMCSA enforces comprehensive trucking safety regulations and performs certain functions relating to such matters as motor carrier registration, cargo and liability insurance, extension of credit to motor carrier customers, and leasing of equipment by motor carriers from independent owner-operators. There are additional regulations specifically relating to the tank truck industry generally, as well as the handling of hazardous materials, including testing and specifications of equipment and product handling requirements. We may transport most types of freight to and from any point in the United States over any route selected by us. The trucking industry is subject to possible and anticipated regulatory and legislative changes, including changes contemplated by the Moving Ahead for Progress in the 21st
13
Table of Contents
Century Act (“Map-21”), that may affect the economics of the industry by requiring changes in operating practices, restricting and taxing emissions or by changing the demand for common or contract carrier services or the cost of providing services. Some of these possible changes may include increasingly more stringent environmental regulations, increasing control over the transportation of hazardous materials, changes in the hours-of-service regulations which govern the amount of time a driver may drive in any specific period of time, safety-based driver hiring restrictions, heightened bonding or insurance requirements, limits on vehicle weight and size and changes intended to address climate change. Map-21 requires the FMCSA to promulgate rules and regulations mandating the use of ELDs. In 2014, the FMCSA indicated that rules will be finalized in 2015 mandating the use of ELDs and updating ELD standards. We have already implemented ELDs within our U.S. chemical logistics business and our intermodal business, and are testing ELD alternatives in our energy business. Due to the proactive actions we have taken, we believe we are well-positioned to comply with any new regulations related to ELDs. FMCSA rules regulating the hours-of-service requirements, which place certain restrictions on the length of time that drivers are allowed to operate, became effective July 2013. The new rules retained the 11-hour daily driving limit, but effectively reduced the total maximum work week for drivers from 82 hours to 70 hours. Furthermore, the rules require that drivers observe 30 minutes of off-duty time for every eight consecutive hours of driving. These new rules may result in a modest reduction in driver productivity.
Interstate motor carrier operations are subject to safety requirements prescribed by the DOT. To a large degree, intrastate motor carrier operations are subject to safety and hazardous material transportation regulations that mirror federal regulations. Such matters as weight and dimension of equipment are also subject to federal and state regulations. DOT regulations mandate drug and alcohol testing of drivers and other safety personnel. Any downgrade in our DOT safety rating could adversely affect our business.
The FMCSA rates individual driver safety performance inclusive of all driver violations over 3-year time periods under the CSA. CSA is an FMCSA initiative designed to provide motor carriers and drivers with attention from FMCSA and state partners about their safety profiles with an ultimate goal of achieving a greater reduction in large truck and bus crashes, injuries and fatalities. Prior to these regulations, only carriers were rated by the DOT and the rating only included out-of-service violations and ticketed offenses associated with out-of-service violations. Under the CSA, the FMCSA may deem carriers with poor safety performance unfit to operate, which serves to prohibit the carrier from operating until its safety fitness determination improves.
Title VI of the Federal Aviation Administration Authorization Act of 1994 generally prohibits individual states, political subdivisions thereof and combinations of states from regulating price, entry, routes or service levels of most motor carriers. However, the states retained the right to continue to require certification of carriers, based upon two primary fitness criteria—safety and insurance—and retained certain other limited regulatory rights. Included in those rights, certain states require motor carriers to register with a state if operating on an intrastate basis within that state. In those states in which we operate on an intrastate basis and are required to obtain certifications or permits allowing us to so operate, we obtain those certifications or permits.
We are subject to compliance with cargo security and transportation regulations issued by the Transportation Security Administration and by the Department of Homeland Security, including regulation by the Bureau of Customs and Border Protection. We believe that we will be able to comply with Bureau of Customs and Border Protection rules, requiring pre-notification of cross-border shipments, with no material effect on our operations. We are also subject to the motor carrier laws of Canada and Mexico.
From time to time, various legislative proposals are introduced including proposals to increase federal, state, or local taxes, including taxes on motor fuels, which may increase our costs and adversely impact the recruitment of drivers. We cannot predict whether, or in what form, any increase in such taxes applicable to us will be enacted.
Material regulatory regimes specifically designed to regulate the UCO&G industry continue to develop, primarily at the state level. However, certain Congressional bills have been advanced that, if enacted, would subject this industry to additional federal governmental regulation. Further, federal and state environmental and other agencies might enact rules under existing statutory authority to govern this industry. The enactment of legislation regulating the frac shale natural gas and oil drilling industry, or the exercise of rulemaking authority by governmental agencies, could have a material adverse effect on the customers we serve in this industry and, accordingly, could adversely affect demand for our energy logistics services, impact the profitability of this business or subject us to additional regulation.
The federal Oil Pollution Act was enacted in 1990 and amends provisions of the federal Water Pollution Control Act of 1972, the federal Clean Water Act, and other statutes as they pertain to prevention and response to oil spills. The Oil Pollution Act, and analogous state and local laws, subject owners of facilities used for storing, handling or transporting oil, including trucks, to strict joint and potentially unlimited liability for containment and removal costs, natural resource damages and certain other consequences of an oil spill, where such spill is into navigable waters, along shorelines or in the exclusive economic zone of the United States.
Disposal wells are subject to the federal Clean Water Act, the Safe Drinking Water Act, state and local laws and regulations relating to all such laws, including those established by the Underground Injection Control Program of the EPA. All of our disposal wells require a permit for operation. These permits may be suspended or modified if a well operation is likely to result in pollution of
14
Table of Contents
fresh water, if there is substantial violation of permit conditions or applicable rules, or if the well leaks. Any loss or modification of permit would adversely affect our operation of the affected well, and we could incur substantial costs to return the well to compliance, to close the well and to mitigate any impact on the environment.
Corporate Information
QDI is a Florida corporation formed in 1994. QDI is a holding company with no significant assets or operations other than the ownership of 100% of the membership units of QD LLC. QD LLC, in turn, owns direct and indirect interests in our operating subsidiaries.
ADDITIONAL INFORMATION AVAILABLE ON COMPANY WEBSITE
Our most recent Annual Report on Form 10-K, Quarterly Reports on Form 10-Q, Current Reports on Form 8-K and amendments to those reports may be viewed or downloaded electronically or as paper copies from our website: http://www.qualitydistribution.com as soon as reasonably practicable after we electronically file such material with, or furnish it to, the SEC. Our recent press releases are also available to be viewed or downloaded electronically at http://www.qualitydistribution.com. We will also provide electronic or paper copies of our SEC filings free of charge on request. We regularly post or otherwise make available information on the Investor Relations section of our website that may be important to investors. Any information on or linked from our website is not incorporated by reference into this Annual Report on Form 10-K.
15
Table of Contents
| ITEM 1A. | RISK FACTORS |
Risks Related to Our Business
Our business is subject to general and industry-specific economic factors that are largely out of our control and could affect our operations, profitability and cash flow.
Our business is dependent on various economic factors over which we have little control, that include:
| • | the availability of qualified drivers; |
| • | access to the credit and capital markets; |
| • | changes in regulations concerning production, shipment, storage or disposal of material we transport, depot or dispose; |
| • | increases in fuel prices, taxes and tolls; |
| • | increases in costs of equipment; |
| • | fluctuations in interest rates, natural gas prices, oil prices and currencies; |
| • | excess capacity in the chemical logistics, energy logistics and intermodal industries; |
| • | changes in laws or regulations or changes in license and regulatory fees; |
| • | potential disruptions at U.S. ports of entry; |
| • | downturns in customers’ business cycles; and |
| • | reductions in customers’ shipping requirements. |
As a result, we may experience periods of overcapacity, driver shortages, declining prices, lower profit margins and less availability of cash in the future. We have a large number of customers in the chemical processing, oil, gas, and consumer goods industries. If these customers experience fluctuations in their business activity due to an economic downturn, work stoppages, commodity price changes or other industry conditions, transportation and other services provided by us on behalf of those customers may decrease. The volume of shipments of chemical products is affected by many other industries and end-use markets. Natural gas and oil drilling are affected by the market prices for those commodities. There is also no assurance our strategic initiatives will be successful or that the assumptions driving such initiatives, including, for example, anticipated growth in chemical production, will come to fruition.
Our debt agreements contain restrictions that could limit our flexibility in operating our business.
The loan agreement (the “ABL Facility”) governing both our $350.0 million senior secured asset-based revolving credit facility (the “ABL”) and our $17.5 million senior secured FILO term loan (the “Term Loan”) and the indentures governing our 9.875% Second-Priority Senior Secured Notes due 2018 (the “2018 Notes”) contain covenants that limit or prohibit our ability, among other things, to:
| • | incur or guarantee additional indebtedness or issue certain preferred shares; |
| • | redeem, repurchase, make payments on or retire subordinated indebtedness or make other restricted payments; |
| • | make certain loans, acquisitions, capital expenditures or investments; |
| • | sell certain assets, including stock, of our subsidiaries; |
| • | enter into sale and leaseback transactions; |
| • | create or incur liens; |
| • | consolidate, merge, sell, transfer or otherwise dispose of all or substantially all of our assets; and |
| • | enter into certain transactions with our independent affiliates. |
These covenants may prohibit or impair us from taking actions that we believe are best for our business. Furthermore, under the ABL Facility, we may be required to satisfy and maintain specified financial ratios under certain conditions. Our ability to meet those financial ratios can be affected by events beyond our control, and we may not meet those ratios. In addition, covenants in our debt agreements limit our use of proceeds from our ordinary operations and from extraordinary transactions. These limits may require us to apply proceeds in a certain manner or prohibit us from utilizing the proceeds in the manner we believe most beneficial.
16
Table of Contents
A failure to comply with any of the covenants contained in the ABL Facility or our other indebtedness could result in an event of default, which, if not cured or waived, could have a material adverse effect on our business, financial condition and results of operations. In the event of any default, the lenders of the defaulted indebtedness:
| • | would not be required to lend any additional amounts to us under the ABL Facility; |
| • | could elect to declare all borrowings outstanding, together with accrued and unpaid interest and fees, to be due immediately and terminate all commitments to extend further credit; or |
| • | could require us to apply all of our available cash to repay these borrowings. |
Such actions by the lenders could cause cross defaults under our other indebtedness. If we are unable to repay amounts under the ABL Facility, the lenders under the ABL Facility could proceed against the collateral granted to them to secure that indebtedness. If any of our indebtedness is accelerated, there can be no assurance that our assets would be sufficient to repay such indebtedness in full.
We have substantial indebtedness and may not be able to make required payments on our indebtedness.
We had consolidated indebtedness and capital lease obligations, including current maturities of $351.3 million, as of December 31, 2014. We must make regular payments under the ABL Facility, including the Term Loan, thereunder, and our capital leases and semi-annual interest payments under our 2018 Notes.
Our 2018 Notes issued in the quarter ended December 31, 2010 carry high fixed rates of interest. In addition, interest on amounts borrowed under our ABL Facility, including the Term Loan, is variable and will increase as market rates of interest increase. We do not presently hedge against the risk of rising interest rates. Our higher interest expense may reduce our future profitability. Our future higher interest expense and future redemption obligations could have other important consequences with respect to our ability to manage our business successfully, including the following:
| • | it may make it more difficult for us to satisfy our obligations for our indebtedness, and any failure to comply with these obligations could result in an event of default; |
| • | it will reduce the availability of our cash flow to fund working capital, capital expenditures and other business activities; |
| • | it increases our vulnerability to adverse economic and industry conditions; |
| • | it limits our flexibility in planning for, or reacting to, changes in our business and the industry in which we operate; and |
| • | it limits our ability to exploit business opportunities. |
The ABL will mature at the earlier of November 2019 and the date that is 91 days prior to the maturity of the Company’s currently outstanding 2018 Notes or any replacement notes if the outstanding amount of such debt is above a certain threshold. The Term Loan matures on November 3, 2017 but we are subject to mandatory prepayment of the principal amount of the Term Loan in equal quarterly payments beginning as early as November 2015. The maturity date of the ABL Facility, including the Term Loan, may be accelerated if we default on our obligations. If the maturity of the ABL Facility and/or such other debt is accelerated, we may not have sufficient cash on hand to repay the ABL Facility and/or such other debt or be able to refinance the ABL Facility and/or such other debt on acceptable terms, or at all. The failure to repay or refinance the ABL Facility and/or such other debt at maturity would have a material adverse effect on our business and financial condition, would cause substantial liquidity problems and may result in the bankruptcy of us and/or our subsidiaries. Any actual or potential bankruptcy or liquidity crisis may materially harm our relationships with our customers, suppliers and independent affiliates.
Our ability to satisfy our interest and principal payment obligations will depend upon, among other things:
| • | our future financial and operating performance, which will be affected by many factors beyond our control; and |
| • | our future ability to borrow under the ABL Facility, the availability of which depends on, among other things, our complying with the covenants in the ABL Facility. |
17
Table of Contents
We may not generate sufficient cash flow from operations, and we may not be able to draw under the ABL, in an amount sufficient to fund our liquidity needs. If our cash flows and capital resources are insufficient to service our indebtedness or fund our operations, we may be forced to reduce or delay capital expenditures, sell assets, seek additional capital or restructure or refinance our indebtedness. Our ability to restructure or refinance our debt will depend on the condition of the capital markets and our financial condition at such time. Any refinancing of our debt could be at higher interest rates and may require us to comply with more onerous covenants, which could further restrict our business operations. If we are not able to refinance any of our indebtedness, sell assets or raise capital on commercially reasonable terms, or at all, or for sufficient proceeds, we could default on our obligations and impair our liquidity. Our inability to generate sufficient cash flow to satisfy our debt obligations or to refinance our obligations on commercially reasonable terms would have a material adverse effect on our business, financial condition, results of operations and cash flows.
Despite our substantial indebtedness, we may incur significantly more indebtedness, which could have a material adverse effect on our business, financial condition, results of operations or cash flows.
The ABL Facility and the indentures governing the 2018 Notes contain restrictions on our ability to incur additional indebtedness. These restrictions are subject to a number of important qualifications and exceptions, and the indebtedness incurred in compliance with these restrictions could be substantial. Accordingly, we or our subsidiaries could incur significant additional indebtedness in the future. We had $62.0 million available for additional borrowing under the ABL Facility as of December 31, 2014, including a subfacility for letters of credit, subject to customary conditions, including borrowing base availability, and the covenants under our debt agreements would allow us to borrow a significant amount of indebtedness beyond this amount. Additional leverage could have a material adverse effect on our business, financial condition, results of operations or cash flows and could increase the risks described in “Our debt agreements contain restrictions that could limit our flexibility in operating our business,” and “We have substantial indebtedness and may not be able to make required payments on our indebtedness.”
Stock repurchases under our share repurchase program will diminish our cash resources, may not enhance shareholder value and could adversely affect trading in our common stock.
Our Board of Directors has approved a share repurchase program for up to $15.0 million in shares of our common stock. As of March 9, 2015, we have repurchased approximately $8.5 million of our common stock under this program. Any further repurchases under the program would diminish our cash resources and increase our leverage, which could impact our ability to reduce our indebtedness or pursue other business opportunities that may be more valuable to our shareholders. There is no assurance that we would be able to replenish our cash resources in the future. Share repurchases may not enhance shareholder value as the price of our common stock may decline below our repurchase prices, or the repurchase prices may exceed the intrinsic value of our assets or business. The current share repurchase program does not have an expiration date, does not obligate us to acquire a particular number of shares, and may be discontinued at any time; however, the Board of Directors may elect to increase share repurchase programs in the future. Any discontinuation of or limited repurchases under our program could negatively impact our stock price. Any repurchases would reduce the number of shares available for the public to trade, which could diminish trading volumes, increase the price volatility of our common stock and reduce our equity.
The trucking industry is extremely competitive and fragmented.
The trucking industry is extremely competitive and fragmented. No single carrier in the chemical logistics or energy logistics business has a significant market share. We compete with many other carriers of varying sizes, customers’ private fleets, railroads and, in the energy logistics market, with pipelines, all of which may limit our growth opportunities and reduce profitability. Historically, competition has created downward pressure on the trucking industry’s pricing structure. Some trucking companies with which we compete have greater financial resources than we do.
We believe that the most significant competitive factor that impacts demand for our services is rates, and depending on our competitors’ pricing decisions, we may be forced to lower our rates, which would reduce our profitability. In fact, certain markets that we serve have experienced significant price competition in recent years. With respect to certain aspects of our business, we also compete with intermodal transportation, pipelines and railroads. Intermodal transportation has increased in recent years. Growth in such forms of transport could adversely affect our market share, net sales and profit margins. Competition from non-trucking modes of transportation and from intermodal transportation would likely increase if state or federal fuel taxes or other regulatory costs for trucking were to increase without a corresponding increase in taxes or regulation imposed upon other modes of transportation.
Additional trends include current and anticipated consolidation among our competitors which may put downward pressure on pricing. Some of our competitors are larger, have greater financial resources and have less debt than we do. As a result, those competitors may be better able to withstand a change in conditions within our industry and in the economy as a whole. If we do not compete successfully, our operating margins, financial condition, cash flows and profitability could be adversely affected.
18
Table of Contents
Our reliance upon independent affiliates and independent owner-operators could adversely affect customer relationships, our operations and our financial performance.
We rely heavily upon independent affiliates and independent owner-operators to perform the services for which we contract with our customers. We believe that our independent affiliate and independent owner-operator relationships can facilitate our financial and operational goals. However, there can be no assurance that the structure will accomplish the goals for which it was created, and our reliance upon independent affiliates and independent owner-operators creates numerous risks for our business. In addition, while certain of these risks are shared characteristics of both independent affiliates and independent owner-operators, the degree of these risks may differ between the two and certain risks may be characteristic of only one.
We contract with our customers to perform the services provided by our businesses. If our independent affiliates or independent owner-operators fail to meet our contractual obligations or otherwise fail to perform in a manner consistent with our requirements, we may be required to utilize alternative service providers at potentially higher prices or with some degree of disruption of the services that we provide to our customers. If we fail to deliver on time, if our contractual obligations are not otherwise met, or if the costs of our services increase, then our profitability and customer relationships could be harmed.
The financial condition and operating costs of our independent affiliates and independent owner-operators are affected by conditions and events that are beyond our control and may also be beyond their control. Adverse changes in the financial condition of our independent affiliates and independent owner-operators or increases in their equipment or operating costs could cause them to seek higher revenues or to cease their business relationships with us. The prices we charge our customers could be impacted by such issues, which may in turn limit our pricing flexibility with customers, resulting in fewer customer contracts and decreasing our revenues.
Although our independent affiliates have substantial contractual obligations to us, we do not control them. Independent affiliates may take actions that maximize their short-term profits or other interests even if they are detrimental to us. Due to their importance in our operations, we have loaned money to, facilitated certain tractor leases for and entered into other financing arrangements with certain independent affiliates and may do so again. The inability of our independent affiliates to satisfy their obligations to us could result in accounting charges and losses that materially adversely affect our results of operations. We have in certain instances acquired the operations of underperforming independent affiliates and could again in the future. While these acquisitions seek to preserve our customer relationships and the scope of our operations, there is no assurance that they will succeed in doing so. Further, any such acquisition could require the use of liquidity sources, capital investment and management attention and could materially impact our profitability, cash flows and business.
Independent affiliates and independent owner-operators typically utilize tractors, trailers and other equipment bearing our tradenames and trademarks. If one of our independent affiliates or independent owner-operators is subject to negative publicity, it could reflect on us and have a material adverse effect on our business, brand and financial performance. Under certain laws, we could also be subject to allegations of liability for the activities of our independent affiliates or independent owner-operators.
Competition for qualified independent owner-operators is substantial, and currently and otherwise from time to time there are shortages of available qualified independent owner-operators. Shortages can result from causes beyond our control or from contractual terms or company policies that make contracting with us less desirable to certain owner-operators. Due to the absence of long-term contracts, independent owner-operators can quickly terminate their relationships with us. We may have insufficient driver capacity to meet the needs of our customers and be forced to forego business that would otherwise be available to us. Driver shortages may decrease our revenues and have a material adverse effect on our results of operations.
We maintain equipment leasing programs with third party vendors that could increase our costs and adversely impact our business if we are required to provide contractually mandated financial support for a significant amount of repossessed equipment.
We maintain agreements with various third-party equipment financing companies to establish leasing programs to facilitate equipment acquisitions by our independent contractors. These agreements provide, in part, that we will provide remarketing support as well as, in many cases, defined levels of financial support with respect to equipment under those leasing programs that are repossessed by those equipment financing companies. If repossessions under those programs are significant and we are not able to mitigate our required support levels through established means, the costs of our obligations under these programs could have a material adverse effect on our results of operations and our financial position.
19
Table of Contents
Reclassification of our independent contractors, such as our independent owner-operators, as employees could increase our costs and adversely impact our business.
We use a significant number of independent contractors, such as our independent owner-operators, in all three segments of our business, consistent with long-standing industry practices. Regulatory authorities and private parties have recently asserted within the trucking industry that some independent contractors should be classified as employees based upon their interpretations of existing rules and regulations. Legislative, judicial, or regulatory (including tax) authorities could also introduce proposals or assert interpretations of existing rules and regulations that would change the classification of a significant number of independent contractors doing business with us from independent contractor to an employee. The costs associated with reclassification, including any related regulatory action or litigation, could have a material adverse effect on our results of operations and our financial position.
The loss of qualified drivers or other personnel could limit our growth and negatively affect operations.
During periods of high trucking volumes, there is substantial competition for qualified drivers in the trucking industry. Regulatory requirements, including electronic logging, and an improvement in the economy could reduce the number of eligible drivers. Furthermore, certain geographic areas have a greater shortage of qualified drivers than other areas. We operate in many of the geographic areas where there have been driver shortages in the past and have turned down new business opportunities as a result of the lack of qualified new drivers. Our voluntary implementation of ELDs prior to implementation of the regulatory requirement resulted in greater driver turnover in 2011 and 2012 and lower revenues in our chemical segment, and could become an on-going competitive disadvantage until our competitors are compelled to implement ELDs as we anticipate. Difficulty in attracting qualified personnel, particularly qualified drivers, could require us to increase driver compensation, forego available customer opportunities and underutilize the tractors and trailers in our network. These actions could result in increased costs and decreased revenues. In addition, we may not be able to recruit other qualified personnel in the future.
Changes in UCO&G exploration, development and production in the U.S. impact the demand for the services of our energy logistics business.
Our energy logistics business serves customers in the energy market in numerous shale regions in the United States. Customers’ expectations for lower market prices for oil and natural gas may cause them to curtail spending, and reduce demand for our services, particularly services we provide related to oil and gas exploration activities. Customers may also curtail activity in the U.S. due to the relative costs and stability of non-U.S. oil and gas fields or due to U.S. regulation. Hydraulic fracturing is under significant legislative and regulatory scrutiny and the adoption of new laws or regulations at the federal, state or local level could adversely affect our customers’ UCO&G operations. Even if new laws or regulations are not implemented, heightened political, regulatory and public scrutiny of hydraulic fracturing practices could reduce demand for UCO&G activity in the U.S. Market prices and these other factors may lead to curtailed activity for a sustained period of time.
In the past, frac shale drilling activity has shifted among U.S. shales as the relative prices of oil and gas make drilling for one commodity more profitable than another. Oil or gas drilling may shift away from the shale regions in which we have operations for reasons over which we have no control, such as relative commodity prices, resource discovery, new pipeline access, transportation constraints, proximity to end-users, local drilling costs, state regulation or weather conditions. While certain business assets may be redistributed among shales, assets such as terminals, disposal wells and certain customer contracts are specific to discrete shale regions. Even business assets that may be redistributed or repositioned may require time and expenditures for conversion to different shale regions or for a different service.
In the energy logistics market, we have experienced and expect to continue to face adverse consequences from the cyclical nature of the energy industry. Slowdowns in exploration and production activity have caused and may continue to cause a decline in the demand for our services in the affected regions where we operate, the price of our services and our asset utilization. A shift away from or slowdown in drilling in the shales in which we have operations could also result in asset-related impairment charges and decreased revenues. Any of these effects could in turn adversely affect our operating margins, financial condition, cash flows and profitability.
We are self-insured and/or have deductible exposure to certain claims and are subject to the fluctuation of the insurance marketplace, all of which could affect our profitability.
The primary accident risks associated with our business are:
| • | motor-vehicle related bodily injury and property damage; |
| • | workers’ compensation claims; |
20
Table of Contents
| • | environmental pollution liability claims; |
| • | cargo loss and damage; and |
| • | general liability claims. |
We currently maintain insurance for:
| • | motor vehicle related third-party bodily injury and property damage claims, covering all employees, independent owner operators and independent affiliates; |
| • | workers’ compensation insurance coverage on our employees; |
| • | environmental pollution liability claims; and |
| • | general liability claims. |
Our insurance program includes a self-insured deductible of $2.0 million per incident for bodily injury and property damage and a $1.0 million deductible for workers’ compensation. In addition, we currently maintain insurance policies with a total limit of $65.0 million, of which $60.0 million is provided under umbrella and excess liability policies and $5.0 million is provided under a primary liability policy. The $2.0 million deductible per incident could adversely affect our profitability, particularly in the event of an increase in the frequency or severity of incidents. Additionally, we are self-insured for damage to the equipment that we own and lease, as well as for cargo losses and such self-insurance is not subject to any maximum limitation. We extend insurance coverage to our independent affiliates and independent owner-operators for (i) motor vehicle related bodily injury, (ii) motor vehicle related property damage, and (iii) cargo loss and damage. Under this extended coverage, independent affiliates and independent owner-operators are responsible for only a small portion of the applicable deductibles. In addition, even where we have insurance, our insurance policies may not provide coverage for certain claims against us or may not be sufficient to cover all possible liabilities.
We are subject to changing conditions and pricing in the insurance marketplace and we cannot assure you that the cost or availability of various types of insurance may not change dramatically in the future. To the extent these costs cannot be passed on to our customers in increased prices, increases in insurance costs could reduce our future profitability and cash flow.
The trucking industry is subject to regulation, and changes in trucking regulations may increase costs.
As a motor carrier, we are subject to regulation by the FMCSA and the DOT, and by various federal, state, and provincial agencies. These regulatory authorities exercise broad powers governing various aspects such as operating authority, safety, hours of service, hazardous materials transportation, financial reporting and acquisitions. There are additional regulations specifically relating to the trucking industry, including testing and specification of equipment, product-handling requirements and drug testing of drivers. Any downgrade in our DOT safety rating (as a result of the new CSA regulations described below or otherwise) could adversely affect our business.
The trucking industry is subject to possible regulatory and legislative changes that may affect the economics of the industry by requiring changes in operating practices, emissions or by changing the demand for common or contract carrier services or the cost of providing trucking services. Possible changes include:
| • | increasingly stringent environmental regulations, including changes intended to address climate change; |
| • | restrictions, taxes or other controls on emissions; |
| • | regulation specific to the energy market and logistics providers to the industry; |
| • | changes in the hours-of-service regulations, which govern the amount of time a driver may drive in any specific period; |
| • | driver and vehicle electronic logging requirements; |
| • | requirements leading to accelerated purchases of new trailers; |
| • | mandatory limits on vehicle weight and size; |
| • | driver hiring restrictions; |
| • | increased bonding or insurance requirements; and |
| • | mandatory regulations imposed by the Department of Homeland Security. |
21
Table of Contents
From time to time, various legislative proposals are introduced, including proposals to increase federal, state, or local taxes, including taxes on motor fuels and emissions, which may increase our or our independent affiliates’ operating costs, require capital expenditures or adversely impact the recruitment of drivers.
Restrictions on emissions or other climate change laws or regulations could also affect our customers that use significant amounts of energy or burn fossil fuels in producing or delivering the products we carry. We also could lose revenue if our customers divert business from us because we have not complied with their sustainability requirements.
Federal and state legislative and regulatory initiatives could result in increased costs and additional operating restrictions upon us or our customers in the energy logistics market.
Frac shale drilling is under significant legislative, regulatory and public scrutiny. Legislation to modify the treatment of hydraulic fracturing under the Safe Drinking Water Act has been proposed in Congress, the EPA is studying the potential environmental impacts of frac shale drilling activities, and the U.S. Department of the Interior has proposed requiring companies to publicly disclose the chemicals used in hydraulic fracturing operations on public lands. In addition, some states and localities have adopted, and others are reportedly considering adopting, regulations or ordinances that could restrict frac shale drilling and injection wells in certain circumstances, or that would impose higher taxes, fees or royalties on us or on our energy logistics market customers. For example, several states have adopted regulations requiring the permitting and bonding of injection wells, disclosure of fluids utilized in the hydraulic fracturing process, and reporting of disposal volumes.
Future U.S. federal, state or local laws or regulations could significantly restrict, or increase costs associated with, hydraulic fracturing and make it more difficult or costly for producers to conduct hydraulic fracturing operations, which could result in a decline in exploration and production. New laws and regulations, and new enforcement policies by regulatory agencies, could also expressly restrict the quantities, sources and methods of water use and disposal, including in injection wells, and otherwise increase our and our customers’ costs of compliance, which could minimize water use and disposal needs even if other limits on drilling and completing new wells were not imposed. Any decline in exploration and production or any restrictions on water use and disposal could negatively impact our operation of disposal wells, result in a decline in demand for our energy logistics business and have a material adverse effect on our business, financial condition, results of operations and cash flows.
Our operations involve hazardous materials, which could create environmental liabilities.
Our activities, particularly those relating to our handling, transportation, storage and disposal of bulk chemicals, flowback and produced water and oil, are subject to environmental, health and safety laws and regulation by governmental authorities in the United States as well as foreign governmental authorities. Among other things, these environmental laws and regulations address emissions to the air, discharges onto land and into water, the generation, handling, storage, transportation, treatment and disposal of waste materials, and the health and safety of our employees. These laws change frequently and generally require us to obtain and maintain various licenses and permits. Environmental laws have tended to become more stringent over time, and most provide for substantial fines and potential criminal sanctions for violations. Some of these laws and regulations are subject to varying and conflicting interpretations. There can be no assurance that violations of such laws, regulations, permits or licenses will not be identified or occur in the future, or that such laws and regulations will not change in a manner that could impose material costs on us. Additionally, we have been, and may in the future be required to obtain financial guarantees, such as letters of credit, for environmental obligations.
As a handler of hazardous substances, we are potentially subject to strict joint and several liability for investigating and rectifying the consequences of accidents, spills, leakage from injection wells and other environmental releases of these substances to surface or subsurface soils, surface water or groundwater. We have incurred remedial costs and regulatory penalties for chemical, crude oil or wastewater spills and releases at our facilities or over the road. As a result of environmental studies conducted at our facilities or at third-party sites, we have identified environmental contamination at certain sites that will require remediation and we are currently conducting investigation and remediation projects at eight of our facilities. In addition, we may be liable for environmental damages caused by previous owners of property purchased by us. Future liabilities and costs under environmental, health, and safety laws are not easily predicted, and such liabilities could result in a material adverse effect on our financial condition, results of operations or business reputation.
In addition, we have been named a potentially responsible party at various sites under the CERCLA and other environmental regulatory programs. Our current reserves provided for these sites may prove insufficient, which would result in future charges against earnings. Furthermore, we could be named a potentially responsible party at other sites in the future and the costs associated with such future sites could be material.
22
Table of Contents
Potential disruptions at U.S. ports of entry could adversely affect our business, financial condition and results of operations.
Any disruption of the delivery of intermodal ISO tank containers to those ports where we do business would reduce the number of intermodal tank containers that we transport, store, clean or maintain. This reduced activity may have a material adverse effect on our business, results of operations or financial condition.
If fuel prices increase significantly, our results of operations could be adversely affected.
We are subject to risk with respect to purchases of fuel. Prices and availability of petroleum products are subject to political, economic and market factors that are generally outside our control. Political events as well as hurricanes and other weather-related events, and current and future legislation (such as market-based (cap-and-trade) greenhouse gas emissions control mechanisms) also may cause the price of fuel to increase. Because our operations and operations of our independent affiliates are dependent upon diesel fuel, significant increases in diesel fuel costs could materially and adversely affect our results of operations and financial condition and operations and financial condition of our independent affiliates if we are unable to pass increased costs on to customers through rate increases or fuel surcharges. Historically, we have recovered the majority of the increases in fuel prices from chemical logistics and intermodal customers through fuel surcharges. However, most of our energy customer contracts do not have fuel surcharges. Fuel surcharges that can be collected may not always fully offset the increase in the cost of diesel fuel. To the extent fuel surcharges are insufficient to offset our or our independent affiliates’ fuel costs or we are unable to continue passing on increased fuel costs to our customers, our results of operations may be adversely affected.
There are risks inherent in utilizing disposal wells and other disposal sites in our energy logistics business.
Rights to deposit flowback and/or production water in disposal wells and other disposal sites proximate to our shales are important to our energy logistics business. We currently achieve these rights in the various shales in which we operate through a variety of means including direct disposal well ownership or leasing rights, through contracts with third-party disposal wells, or on a spot basis from third-party disposal wells. Neither we nor the third-party disposal sites we utilize can fully control the performance of disposal wells. Even though a well is legally permitted to accept a certain amount of water, there is no assurance that the well or any specific zone in the well will be capable of absorbing an anticipated amount. Disposal wells may also be ruined or rendered unusable during operations due to technical or mechanical difficulties or natural disaster. Disposal wells can encounter problems that render the well unusable even after a period of successful operation. Further, we will be obligated to retire wells that we own following their productive use in compliance with applicable laws. There can be no assurance that we will be able to successfully operate or access any specific disposal well or other disposal site, or will be able to obtain sufficient well or other disposal site access to achieve efficient operation in any shale. There can be no assurance that our estimates of the useful lives and costs of retirement of wells that we own will prove accurate.
Our business may be harmed by terrorist attacks, future wars or anti-terrorism measures.
In the aftermath of the terrorist attacks of September 11, 2001, federal, state and municipal authorities have implemented and are implementing various security measures, including checkpoints and travel restrictions on large trucks and fingerprinting of drivers in connection with new hazardous materials endorsements on their licenses. Such existing measures and future measures may have significant costs associated with them which a motor carrier is forced to bear. Moreover, large trucks carrying toxic chemicals and oil are potential terrorist targets, and we may be obligated to take measures, including possible capital expenditures intended to protect our trucks. In addition, the insurance premiums charged for some or all of the coverage currently maintained by us could continue to increase dramatically or such coverage could be unavailable in the future.
If our information technology and communications systems are disrupted, the disruption could impair our operations and harm our reputation among customers.
We rely heavily on information technology and communications systems to operate our business and manage our network in an efficient manner. We have equipped our drivers with various mobile communications systems and ELDs that enable us to monitor our tractors and communicate with our drivers in the field and enable customers to track the location and monitor the progress of their cargo through the Internet. Despite redundancies and security measures, our information technology and communications systems remain susceptible to outages, computer viruses, break-ins, human error, data leakage and other disruptions and imperfections. Any of these could impair the efficiency of our operations, inhibit our customer service or reduce customer access to information. In addition, there could be a loss of confidential information, corruption of data, or damage to our reputation. Demand for our services or the profitability of operations could in turn be affected, which could have a negative impact on our results of operations or cash flows.
23
Table of Contents
We depend on members of our senior management.
We believe that our ability to successfully implement our business strategy and to operate profitably depends in large part on the continued employment of our senior management team. If members of senior management become unable or unwilling to continue in their present positions, our business or financial results could be adversely affected.
Our goodwill and long-lived assets are subject to potential asset impairment.
At December 31, 2014, goodwill and other intangible assets represented approximately $50.3 million, or approximately 11.8% of our total assets and approximately 21.3% of our non-current assets, the carrying value of which may be reduced if we determine that those assets are impaired. In addition, at December 31, 2014, net property and equipment totaled approximately $156.2 million, or approximately 36.5% of our total assets.
We review for potential goodwill impairment by reporting unit on an annual basis as part of our goodwill impairment testing in the second quarter of each year with a measurement date of June 30, and more often if a triggering event or circumstance occurs making it likely that impairment exists. In addition, we test for the recoverability of long-lived assets at year end, and more often if an event or circumstance indicates the carrying value may not be recoverable. We conduct impairment testing based on our current business strategy in light of present industry and economic conditions, as well as future expectations.
During 2013, we recognized impairment charges aggregating $91.3 million, of which $72.8 million related to goodwill and $18.5 million related to intangibles, all in our energy logistics reporting unit. This impairment testing utilized the same methodologies as in prior periods for our energy logistics reporting unit, but utilized updated assumptions reflecting updated market and segment operating conditions and results.
If there are changes to the methods used to allocate carrying values, if management’s estimates of future operating results change, if there are changes in the identified reporting units or if there are changes to other significant assumptions, the estimated carrying values and the estimated fair value of our goodwill and long-lived assets could change significantly, and could result in future impairment charges, which could materially impact our results of operations and financial condition.
We may be unable to successfully realize all of the intended benefits from prior or future acquisitions and other transactions.
We may be unable to realize all of the intended benefits of any prior or future acquisitions. As part of our business strategy, we have previously acquired and continually evaluate acquisitions, including acquisitions leading to the creation of new independent affiliates. We cannot assure you that suitable acquisition candidates will be identified and acquired in the future, that the financing of any such acquisition will be available on satisfactory terms, that we will be able to complete any such acquisition or that we will be able to accomplish our strategic objectives as a result of any such acquisition. Certain prior acquisitions have not produced results consistent with our expectations and future acquisitions may not be viewed positively by customers or achieve their intended benefits. We encounter various risks in acquiring other companies, including the possible inability to integrate an acquired business into our operations, diversion of management’s attention and unanticipated problems or liabilities, or inefficiencies or difficulties that arise due to unfamiliarity with geographic areas that are new to us. We conduct due diligence investigations of the business operations of companies that we have acquired prior to consummating these acquisitions, but our due diligence investigations may not be sufficient to uncover all material information concerning such operations. As a result of such acquisitions, we may be held liable for risks and liabilities of which we are not aware at the present time. Any of these risks related to prior or future acquisitions, if realized, could have a material adverse effect on our business, financial condition, and results of operations or cash flows.
Increased unionization could increase our operating costs or constrain operating flexibility.
Although only approximately 3.4% of our driver population, including independent owner-operators and employees of independent affiliates, was subject to collective bargaining agreements at December 31, 2014, unions such as the International Brotherhood of Teamsters have traditionally been active in the U.S. trucking industry. Unionized workers could disrupt our operations by strike, work stoppage or other slowdown. In addition, our non-union workforce has been subject to unionization efforts in the past, and we could be subject to future unionization. Increased unionization of our workforce could result in higher compensation and working condition demands that could increase our operating costs or constrain our operating flexibility.
24
Table of Contents
If we withdraw from any of our multi-employer pension plans, we will be liable for a proportionate share of such plan’s unfunded vested benefit liabilities upon our withdrawal.
By their nature, multi-employer pension plans carry with them risks that differ from single-employer plans. We contribute to multi-employer pension and postretirement plans in accordance with our collective bargaining agreements. Other unrelated employers contribute to (or have contributed to) those multi-employer plans pursuant to their respective collective bargaining agreements. Assets contributed by an employer to a multi-employer pension plan are not segregated into a separate account and are not restricted to provide benefits only to the employees of that contributing employer. If a participating employer to a multi-employer pension plan no longer contributes to the plan, as has happened in the past and may happen in the future, the unfunded obligations of the plan, including obligations to former employees of the no longer-contributing employer, may be borne by the remaining participating employers, such as us. In the event of the termination of a multi-employer pension plan, union decertification, the mass withdrawal of other employers or if we withdraw from a multi-employer pension plan, we would have material liabilities for our share of the unfunded vested liabilities of such plan.
As of December 31, 2014, we contributed to three separate multi-employer pension plans for employees under collective bargaining agreements. All of these multi-employer pension plans, the Employer-Teamsters Local Nos. 175 & 505 Pension Trust Fund, the Central States Southeast and Southwest Areas Pension Fund (“Central States Plan”) and the New York State Teamsters Conference Pension and Retirement Fund, have been classified as carrying red zone status under the Pension Protection Act of 2006 (the “PPA”), indicating that they are less than 65% funded.
We do not currently intend to withdraw from the three multi-employer pension plans or take any actions that would subject us to payment of contingent obligations upon withdrawal from such plans. However, the actions of others could trigger this withdrawal liability. Based on information provided to us from the trustees of these plans, we estimate our portion of the contingent liability in the case of a full withdrawal or termination from these plans to be approximately $90.9 million, of which $85.1 million relates to the Central States Plan. In the event that we were required to pay this unfunded liability, such payment, if it could be made at all, would have a material impact on our liquidity, operations and financial results.
Risks Related to our Common Stock
Our ability to issue “blank check” preferred stock and Florida law may prevent a change in control of our Company that a shareholder may consider favorable.
Provisions of our articles of incorporation and Florida law may discourage, delay or prevent a change in control of our Company that a shareholder may consider favorable. These provisions include:
| • | authorization of the issuance of “blank check” preferred stock that could be issued by our Board of Directors to increase the number of outstanding shares in order to control a takeover attempt which the Board viewed unfavorably; |
| • | elimination of the voting rights of shareholders with respect to shares that are acquired without prior Board approval that would otherwise entitle such shareholders to exercise certain amounts of voting power in the election of directors; and |
| • | prohibition on business combinations with interested shareholders unless particular conditions are met. |
As a result, these provisions could limit the price that investors are willing to pay in the future for shares of our common stock.
Future sales and issuances of our common stock in the public market may depress our stock price and result in dilution.
The market price of our common stock could decline as a result of sales by our existing shareholders of a large number of shares of our common stock. These sales might also make it more difficult for us to sell additional equity securities at a time and price that we deem appropriate. As of March 9, 2015, there are approximately 28.1 million shares of common stock outstanding. Approximately 1.2 million shares of common stock, as of March 9, 2015, are “restricted securities,” as defined in Rule 144 under the Securities Act, or are held by affiliates.
In addition, as of March 9, 2015, we have 1.0 million shares of common stock available for issuance under our 2012 Equity Incentive Plan. As of March 9, 2015, there were outstanding options for approximately 1.1 million shares. Exercise of the options that are in-the-money will result in dilution to existing shareholders in an amount equal to the difference in the market and exercise prices multiplied by the number of shares exercised. In addition, prior to their exercise, these options may depress the market price for our common stock.
25
Table of Contents
We currently do not intend to pay dividends on our common stock.
We do not expect to pay dividends on our common stock in the foreseeable future. In addition, the ABL Facility and indentures governing our 2018 Notes contain certain restrictions on our ability to pay dividends on our common stock. Accordingly, the price of our common stock must appreciate in order to realize a gain on one’s investment. This may not occur.
| ITEM 1B. | UNRESOLVED STAFF COMMENTS |
None.
| ITEM 2. | PROPERTIES |
Currently, we lease approximately 68,000 square feet for our administrative and corporate office headquarters in Tampa, Florida. We are not currently using all of this space and have subleased a portion of the unused space, and may seek opportunities to sublet the remainder of the unused space. Our chemical logistics business and our energy logistics business do not have separate headquarters. The lease for our corporate headquarters expires in December 2017. The corporate headquarters for our Intermodal business is located in Chalmette, Louisiana, and consists of 20,000 square feet of office space. The lease expires in November 2023. We have no other location that is material to our operations.
As of December 31, our network of terminals and facilities consisted of the following:
| 2014 Terminals |
2013 Terminals |
2012 Terminals |
||||||||||
| Chemical logistics independent affiliate trucking terminals |
91 | 85 | 79 | |||||||||
| Chemical logistics company-operated trucking terminals |
4 | 4 | 10 | |||||||||
| Energy logistics independent affiliate energy terminals |
17 | 11 | 2 | |||||||||
| Energy logistics company-operated energy terminals |
2 | 3 | 8 | |||||||||
| Intermodal container services terminals/depots |
9 | 9 | 9 | |||||||||
|
|
|
|
|
|
|
|||||||
| Total |
123 | 112 | 108 | |||||||||
|
|
|
|
|
|
|
|||||||
We currently own 40 properties, many of which are leased to independent affiliates or third parties. We operate trucking, energy and container services terminals and repair services as well as owning or having disposal rights with respect to 7 disposal wells.
We consider our properties to be in good condition generally and believe that our facilities are adequate to meet our anticipated requirements.
| ITEM 3. | LEGAL PROCEEDINGS |
In addition to those items disclosed under Item 1. “Business—Environmental Matters,” “Business—Other Legal Matters” and Note 20 to our consolidated financial statements contained herein, “Commitments and Contingencies—Environmental Matters,” we are from time to time involved in routine litigation incidental to the conduct of our business. We believe that no such routine litigation currently pending against us, if adversely determined, would have a material adverse effect on our consolidated financial position, results of operations or cash flows.
| ITEM 4. | MINE SAFETY DISCLOSURES |
Not applicable
ITEM 5—Other Information
Executive Officers of the Registrant
Our executive officers, as of March 9, 2015 were as follows:
| Name |
Age |
Position | ||
| Gary R. Enzor |
52 | Chairman and Chief Executive Officer | ||
| Joseph J. Troy |
51 | Executive Vice President and Chief Financial Officer | ||
| John T. Wilson |
40 | Senior Vice President, General Counsel and Secretary | ||
| Melissa M. Ernst |
44 | Senior Vice President, Human Resources and Driver Services | ||
| Randall T. Strutz |
50 | President, Quality Carriers | ||
| Scott D. Giroir |
52 | President, Boasso America Corporation | ||
| Christopher E Broussard |
44 | President, QC Energy Resources |
26
Table of Contents
Gary R. Enzor was appointed the Chairman of the Board of QDI in August 2013 and has served as a Director since 2008. He has served as QDI’s Chief Executive Officer since June 2007 and as President of QDI since November 2005. Mr. Enzor joined QDI in December 2004 as Executive Vice President and Chief Operating Officer. Prior to joining QDI, Mr. Enzor served as Executive Vice President and Chief Financial Officer of Swift Transportation Company, Inc. since August 2002. Prior to Swift, Mr. Enzor held executive positions with Honeywell, Dell Computer and AlliedSignal, Inc. (now Honeywell International, Inc.). Mr. Enzor has served on the board of directors of USA Truck, Inc. since September 2014.
Joseph J. Troy joined QDI in August 2010 as Executive Vice President and Chief Financial Officer. Prior to joining QDI, Mr. Troy held various senior leadership positions with Walter Industries, Inc. (predecessor to Walter Energy), including Executive Vice President and Chief Financial Officer. Prior to that, Mr. Troy held various banking positions with NationsBank and its predecessor institutions. Mr. Troy previously served on the board of directors of Cellu Tissue Holdings, Inc., a producer and seller of tissue papers in the United States, previously served on the board of Fisher Communications, Inc., a media company with television, radio, internet and mobile operations, and currently serves on one charitable board.
John T. Wilson joined QDI in July 2012 as our Senior Vice President, General Counsel and Secretary. From March 2011 until July 2012, Mr. Wilson was in private practice. Prior to that, Mr. Wilson held various positions of increasing responsibility at Spectrum Brands Holdings, Inc. and its predecessor Spectrum Brands, Inc. from May 2005 until March 2011, including serving as Spectrum Brands’ General Counsel and Secretary from May 2007 until March 2011. Prior to joining Spectrum Brands, Mr. Wilson was an attorney with the firm of Sutherland Asbill & Brennan LLP.
Melissa M. Ernst became Sr. Vice President, Human Resources and Driver Services of QDI in April 2014. She assumed responsibility QDI’s Driver Recruiting and Retention organization in April 2013 and became Vice President of Human Resources in 2005. She joined QDI in May 2001. Prior to joining QDI, Ms. Ernst held various human resources roles with IPAXS Corporation, Southern Company Energy Marketing (now Mirant) and Tech Data Corporation.
Randall T. Strutz joined QDI in April of 2010 and serves as President, Quality Carriers, the Company’s chemical logistics business. Prior to assuming his current position in April 2012, he served as QDI’s Senior Vice President of Sales and New Business Development. Before joining QDI, Mr. Strutz held the position of Chief Executive Officer with Morgan Systems, Inc., from 2008 to 2010. Prior to Morgan Systems, Mr. Strutz worked at Pacer International from 2001 to 2007, where he held the positions of Chief Commercial Officer as well as the President of Rail Brokerage and Chief Operating Officer.
Scott D. Giroir joined Boasso America on October 1, 1985 when he started Boasso’s first transportation division. In March of 1988, Mr. Giroir was named General Manager of Boasso America Corporation, which at the time had four divisions, all located in New Orleans, LA. In 1992, Mr. Giroir was promoted to Executive Vice-President/COO, and today Mr. Giroir is the President of Boasso America. Prior to joining Boasso America, Mr. Giroir spent a short time designing off-shore platforms and drilling rigs for Petro Marine Engineering.
Christopher E. Broussard joined QDI in July 2014 and serves as President, QCER, the Company’s energy logistics business. From September 2011 until he joined QDI, Mr. Broussard was President of Oilfield Trucking Solutions, which had been a subsidiary of Chesapeake Energy Corporation. From July 2011 to September 2011, Mr. Broussard was the Co-Founder and Vice President of HSSE and Human Resources for Falco Energy Group. From December 2005 until June 2011, Mr. Broussard served in various leadership positions within the Occidental Petroleum Corporation family of companies.
27
Table of Contents
| ITEM 5. | MARKET FOR REGISTRANT’S COMMON EQUITY, RELATED SHAREHOLDER MATTERS AND ISSUER’S PURCHASES OF EQUITY SECURITIES |
Our common stock is traded on NASDAQ Global Market (“NASDAQ”) under the symbol “QLTY.” The table below sets forth the quarterly high and low sale prices for our common stock as reported on NASDAQ.
| Common Stock | ||||||||
| High | Low | |||||||
| 2014 |
||||||||
| 1st quarter |
$ | 15.07 | $ | 12.12 | ||||
| 2nd quarter |
15.83 | 12.12 | ||||||
| 3rd quarter |
15.83 | 12.70 | ||||||
| 4th quarter |
13.15 | 8.79 | ||||||
| 2013 |
||||||||
| 1st quarter |
$ | 9.49 | $ | 6.18 | ||||
| 2nd quarter |
10.44 | 7.01 | ||||||
| 3rd quarter |
10.97 | 8.51 | ||||||
| 4th quarter |
13.50 | 9.21 | ||||||
As of March 9, 2015, there were approximately 60 holders of record of our common stock.
DIVIDEND POLICY
We have not declared cash dividends on our common stock for the periods presented above and have no present intention of doing so. We currently intend to retain our future earnings and cash flow, if any, to repay debt, to finance the further expansion and continued growth of our business, or to repurchase shares of our common stock pursuant to our share repurchase program. Additionally, our ABL Facility and the indenture governing our 2018 Notes limit QDI’s ability to pay dividends on its common stock. Future dividends, if any, will be determined by our Board of Directors.
EQUITY COMPENSATION PLAN INFORMATION
The Company currently has one active and two frozen equity compensation plans. A description of our equity-based compensation plans can be found in Note 19 of the Notes to Consolidated Financial Statements for the year ended December 31, 2014. Each of these equity compensation plans was approved by our shareholders. The following table sets forth information regarding outstanding options and shares available for future issuance under these plans as of December 31, 2014:
| Plan category |
Number of shares to (a) |
Weighted-average exercise and rights (b) |
Number of shares remaining in column (a)) (c) |
|||||||||
| Equity compensation plans approved by shareholders |
1,060,848 | $ | 6.75 | 1,303,573 | ||||||||
| Equity compensation plans not approved by shareholders |
— | — | — | |||||||||
|
|
|
|
|
|
|
|||||||
| Total |
1,060,848 | $ | 6.75 | 1,303,573 | ||||||||
|
|
|
|
|
|
|
|||||||
ISSUER’S PURCHASES OF EQUITY SECURITIES
On November 20, 2012, we announced a share repurchase program pursuant to which our Board of Directors authorized the repurchase of up to $15.0 million of our common stock in an open-ended repurchase program (the “Repurchase Program”). Stock has been, and may in the future be, purchased pursuant to the Repurchase Program, from time to time, in the open market or through private transactions, subject to market conditions. Subject to applicable laws, repurchases under the Repurchase Program may be made at such times and in such amounts as we deem appropriate and may be made pursuant to Rule 10b5-1. We are not obligated to purchase any shares under the Repurchase Program, and it can be discontinued at any time that we feel additional purchases are not warranted.
28
Table of Contents
As of December 31, 2014, we have repurchased approximately 1.2 million shares valued at $8.5 million under the Repurchase Program, with authority to repurchase an additional $6.5 million of shares. During the three months ended December 31, 2014, we repurchased 36,700 shares under the Repurchase Program at an average share price per share of $11.27. There were no shares surrendered during the period by employees in order to satisfy statutory tax withholding obligations in connection with the vesting of stock-based compensation awards.
PERFORMANCE GRAPH
The following graph depicts a comparison of cumulative total shareholder returns for us as compared to the NASDAQ Transportation Index and the NASDAQ Stock Market (U.S.) Index. The graph assumes the investment of $100 on December 31, 2009 through December 31, 2014 and the reinvestment of any dividends issued during the period.
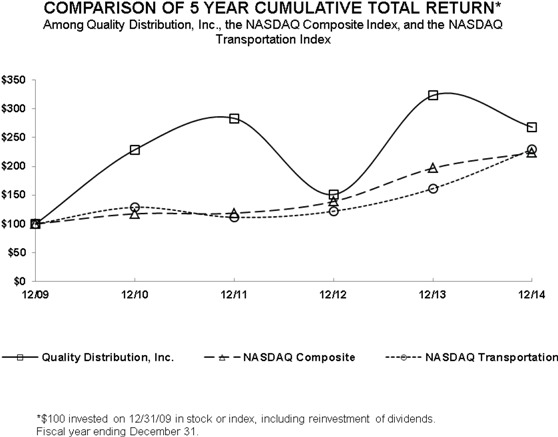
The comparisons shown in the graph above are based upon historical data. We caution that the stock price performance shown in the graph above is not necessarily indicative of, nor is it intended to forecast, the potential future performance of our common stock. Information used in the graph was obtained from Research Data Group.
| ITEM 6. | SELECTED FINANCIAL DATA |
The selected historical consolidated financial information set forth below is qualified in its entirety by reference to, and should be read in conjunction with, our consolidated financial statements and notes thereto included elsewhere in this report and Item 7. “Management’s Discussion and Analysis of Financial Condition and Results of Operations.”
29
Table of Contents
The consolidated statements of operations data set forth below for the years ended December 31, 2014, 2013 and 2012 and the historical balance sheet data as of December 31, 2014 and 2013 are derived from our audited consolidated financial statements included under Item 8 of this report. The historical statements of operations data for the years ended December 31, 2011 and 2010 and the historical balance sheet data as of December 31, 2012, 2011 and 2010 are derived from our audited consolidated financial statements that are not included in this report.
| YEAR ENDED DECEMBER 31 | ||||||||||||||||||||
| 2014 | 2013 | 2012 | 2011 | 2010 | ||||||||||||||||
| (DOLLARS IN THOUSANDS, EXCEPT PER SHARE DATA) | ||||||||||||||||||||
| Statements of Operations Data (1) |
||||||||||||||||||||
| Operating revenues |
$ | 991,758 | $ | 929,810 | $ | 842,118 | $ | 745,951 | $ | 686,598 | ||||||||||
| Operating expenses: |
||||||||||||||||||||
| Purchased transportation |
667,799 | 594,708 | 552,524 | 522,866 | 471,792 | |||||||||||||||
| Depreciation and amortization |
21,617 | 26,121 | 21,090 | 14,413 | 16,004 | |||||||||||||||
| Impairment charges (2) |
— | 91,296 | — | — | — | |||||||||||||||
| Other operating expenses |
251,112 | 260,449 | 219,361 | 150,993 | 162,067 | |||||||||||||||
|
|
|
|
|
|
|
|
|
|
|
|||||||||||
| Operating income (loss) |
51,230 | (42,764 | ) | 49,143 | 57,679 | 36,735 | ||||||||||||||
| Interest expense, net |
28,066 | 30,292 | 29,258 | 28,912 | 35,548 | |||||||||||||||
| Gain on extinguishment of debt |
(4,217 | ) | — | — | — | — | ||||||||||||||
| Write-off of debt issuance costs |
476 | 521 | — | 3,181 | 7,391 | |||||||||||||||
| Other (income) expense |
(144 | ) | (7,256 | ) | (2,864 | ) | 214 | 791 | ||||||||||||
|
|
|
|
|
|
|
|
|
|
|
|||||||||||
| Income (loss) before taxes |
27,049 | (66,321 | ) | 22,749 | 25,372 | (6,995 | ) | |||||||||||||
| Provision for (benefit from) income taxes |
6,409 | (24,283 | ) | (27,327 | ) | 1,941 | 411 | |||||||||||||
|
|
|
|
|
|
|
|
|
|
|
|||||||||||
| Net income (loss) attributable to common shareholders |
$ | 20,640 | $ | (42,038 | ) | $ | 50,076 | $ | 23,431 | $ | (7,406 | ) | ||||||||
|
|
|
|
|
|
|
|
|
|
|
|||||||||||
| Net income (loss) per common share: |
||||||||||||||||||||
| Basic |
$ | 0.75 | $ | (1.58 | ) | $ | 1.89 | $ | 1.01 | $ | (0.36 | ) | ||||||||
| Diluted |
0.74 | (1.58 | ) | 1.84 | 0.96 | (0.36 | ) | |||||||||||||
| Weighted average common shares outstanding: |
||||||||||||||||||||
| Basic |
27,539 | 26,560 | 26,502 | 23,088 | 20,382 | |||||||||||||||
| Diluted |
28,077 | 26,560 | 27,207 | 24,352 | 20,382 | |||||||||||||||
|
YEAR ENDED DECEMBER 31 |
||||||||||||||||||||
| 2014 | 2013 | 2012 | 2011 | 2010 | ||||||||||||||||
|
(DOLLARS IN THOUSANDS, EXCEPT TERMINAL, TRAILER, TRACTOR AND ENERGY LOGISTICS EQUIPMENT DATA) |
||||||||||||||||||||
| Other Data (1) |
||||||||||||||||||||
| Net cash provided by operating activities |
$ | 34,170 | $ | 45,970 | $ | 17,002 | $ | 35,399 | $ | 21,071 | ||||||||||
| Net cash used in investing activities |
(12,898 | ) | (3,355 | ) | (131,683 | ) | (30,458 | ) | (1,079 | ) | ||||||||||
| Net cash (used in) provided by financing activities |
(21,871 | ) | (43,362 | ) | 113,332 | (2,642 | ) | (23,879 | ) | |||||||||||
| Number of terminals at end of period |
123 | 112 | 108 | 106 | 102 | |||||||||||||||
| Number of trailers managed at end of period |
5,709 | 5,255 | 5,155 | 5,414 | 5,738 | |||||||||||||||
| Number of tractors managed at end of period |
3,195 | 2,899 | 2,775 | 2,802 | 2,901 | |||||||||||||||
| Number of chassis managed at end of period |
1,956 | 1,801 | 1,743 | 1,606 | 1,366 | |||||||||||||||
| Number of energy logistics equipment managed at end of period |
1,178 | 1,380 | 1,359 | 217 | — | |||||||||||||||
| Balance Sheet Data at Year-End (1) |
||||||||||||||||||||
| Working capital |
$ | 115,018 | $ | 88,762 | $ | 77,570 | $ | 45,790 | $ | 34,955 | ||||||||||
| Total assets |
427,783 | 427,249 | 513,603 | 302,395 | 271,335 | |||||||||||||||
| Total indebtedness, including current maturities |
351,295 | 383,305 | 418,806 | 307,063 | 317,332 | |||||||||||||||
| Shareholders’ deficit |
(31,694 | ) | (56,251 | ) | (18,440 | ) | (106,185 | ) | (146,379 | ) | ||||||||||
| (1) | On November 1, 2011, we acquired 100% of the stock of Greensville Transport Company (“Greensville”). The results of Greensville have been included in our results since the date of the acquisition and are included in our intermodal segment. On April 1, 2012, we acquired certain operating assets of Trojan Vacuum Services (“Trojan”). The results of the Trojan acquisition have been included in our results since the date of acquisition and are included in our energy logistics segment. On June 1, 2012, we acquired certain operating assets of Wylie Bice Trucking, LLC and the operating assets and rights of RM Resources, LLC, collectively (“Bice”). The results of the Bice acquisition have been included in our results since the date of acquisition and are included in our energy logistics segment. On August 1, 2012, we acquired certain operating assets of Dunn’s Tank Service, Inc. and the operating assets and rights of Nassau Disposal, Inc., collectively (“Dunn’s”). The results of Dunn’s have been included in our results since the date of acquisition and are included in our energy logistics segment. |
| (2) | The impairment charge resulted from an impairment analysis of goodwill and intangible assets performed during the quarters ended June 30 and December 31, 2013. |
30
Table of Contents
| ITEM 7. | MANAGEMENT’S DISCUSSION AND ANALYSIS OF FINANCIAL CONDITION AND RESULTS OF OPERATIONS |
The following discussion of our results of operations and financial condition should be read in conjunction with our consolidated financial statements and the related notes included elsewhere in this report. The following discussion includes forward-looking statements. For a discussion of important factors that could cause actual results to differ from results discussed in the forward-looking statements, see “Forward-Looking Statements and Certain Considerations” contained in the Introduction to this report.
OVERVIEW
We operate the largest chemical bulk tank truck network in North America and are also the largest provider of intermodal ISO tank container and depot services in North America. We also provide logistics services to the unconventional oil and gas (“UCO&G”) market. We operate an asset-light business model and service customers across North America through our network of 95 terminals servicing the chemical market, 19 terminals servicing the energy market and 9 ISO tank depot services terminals (intermodal) servicing the chemical and other bulk liquid markets.
Chemical Logistics
We coordinate the transport of a broad range of chemical products and provide our customers with logistics and other value-added services. Through our North American network, we are a core carrier for most of the major companies engaged in chemical processing. We believe the diversity of our customer base, geography and end-markets provide a competitive advantage.
The bulk tank truck market in North America includes all products shipped by bulk tank truck carriers and consists mainly of liquid and dry bulk chemicals (including plastics) and bulk dry and liquid food-grade products. Based on industry sources, we estimate that the highly fragmented North American for-hire segment of the bulk tank transport market generated revenues of approximately $6.9 billion in 2013. We specifically operate in the for-hire chemical and food grade bulk transport market (which we estimate at $4.3 billion in 2013). We believe we have the leading market share (estimated at 14% in 2013) in this sector based on revenues. In 2014, we announced the addition to our network of six new terminals operated by independent affiliates, as well as a bulk rail intermodal service. We believe being a larger carrier facilitates customer service and lane density, and provides a more favorable cost structure. As such, we believe we are well-positioned to expand our business by increasing our market share.
Chemical bulk tank truck industry growth is generally dependent on volume growth in the industrial chemical industry, the rate at which chemical companies outsource their transportation needs, the overall capacity of the rail system, and, in particular, the extent to which chemical companies make use of the rail system for their bulk chemical transportation needs. We also believe that North American chemical producers will gain a global competitive advantage and grow domestic production (thus shipments which we can service) through the use of low-cost energy sources, primarily natural gas and natural gas liquids.
The chemical bulk tank truck industry is characterized by high barriers to entry such as the time and cost required to develop the operational infrastructure necessary to handle sensitive chemical cargo, the financial and managerial resources required to recruit and train drivers, substantial industry regulatory requirements, strong customer relationships and the significant capital investments required to build a fleet of equipment and establish a network of terminals.
Our transportation revenue in the chemical logistics segment is principally a function of the volume of shipments by the bulk chemical industry, prices, the average number of miles driven per load, our market share and the allocation of shipments between tank truck transportation and other modes of transportation such as rail. Additionally, it is common practice in the bulk tank truck industry for customers to pay fuel surcharges.
Intermodal
Our subsidiary, Boasso, provides intermodal ISO tank container transportation and depot services through terminals located in the eastern half of the United States. Boasso’s terminals are strategically positioned near all major shipping ports along the Gulf and East Coasts, as well as inland ports in Chicago and Detroit. In addition to intermodal tank transportation services, Boasso provides tank cleaning, heating, testing, maintenance and storage services to customers. Boasso also provides local and over-the-road trucking, primarily within the proximity of the port cities where its depots are located.
Boasso’s revenues are impacted by U. S. chemical import/export volume, in particular the number and volume of shipments through ports where Boasso has terminals, as well as Boasso’s market share in those locations. Chemical manufacturers have sought to efficiently transport their products on a global basis by utilizing ISO tank containers, and we believe the resulting demand for providers that can offer a broad range of services within the supply chain will drive future growth in this sector. Additionally, North American Intermodal chemical transportation volume continues to shift towards ISO tank containers versus conventional drums. We believe that our intermodal business will benefit from these trends because of its market leadership, experience and track record.
31
Table of Contents
Boasso operates in the intermodal ISO tank container transportation and depot services market, which we believe was approximately a $1.0 to $1.5 billion market in 2013. The intermodal ISO tank container business generally provides services that facilitate the global movement of liquid and dry bulk chemicals, pharmaceuticals and food grade products.
The proliferation of global import/export of bulk liquid chemicals has driven the movement of basic manufacturing out of the United States and has resulted in an increase in chemical plant infrastructure to service these off-shore industries. Driven by this globalization, the intermodal ISO tank container market is a growing sector of the overall liquid bulk chemical transportation sector. Furthermore, chemical manufacturers have sought to efficiently transport their products by utilizing ISO tank containers. The resulting demand for distributors that can offer a broad range of services within the supply chain will drive future growth in this sector. Demand for intermodal ISO tank containers is impacted by the aggregate volume of imports and exports of chemicals through United States ports. Demand is also impacted by the shift in modes of transportation, from drums to larger and more efficient ISO tank containers. Additionally, we believe our intermodal business will benefit from the low cost energy from the UCO&G market. We believe that Boasso will benefit from these trends because of its market leadership, geographic positioning, experience and track record.
Energy Logistics
Our energy logistics business services the UCO&G market through the transportation of crude oil, flowback and produced brine water, fresh water and the disposal of flowback and produced brine water, as well as providing services ancillary to these activities. During 2012, we expanded our energy logistics business through the following acquisitions:
| • | On April 1, 2012, we acquired certain operating assets of Trojan Vacuum Services (“Trojan”), which operated in the Eagle Ford shale. We paid $8.7 million in cash at closing, and paid $1.0 million in cash in January 2013 upon the satisfaction of certain operating and financial performance criteria. |
| • | On June 1, 2012, we acquired certain operating assets of Wiley Bice Trucking, LLC and certain operating assets and rights of RM Resources, LLC, (collectively “Bice”), which operated in the Bakken shale region, for $81.4 million in aggregate consideration, with up to an additional $19.0 million in cash consideration payable one year after the closing date if certain future operating and financial performance criteria were satisfied. These criteria were not met. |
| • | On August 1, 2012, we acquired certain operating assets of Dunn’s Tank Services, Inc. and its related company Nassau Disposal, Inc., (collectively “Dunn’s”), which operated in the Marcellus, Woodford and Utica shale regions, for an aggregate purchase price of $34.3 million, with up to an additional $3.6 million in cash consideration payable one year after the closing date if certain future operating and financial performance criteria were satisfied. These criteria were not met. |
During 2013 and 2014, we affiliated certain company-operated terminals with independent affiliates and entered into new independent affiliate relationships as we implemented our planned affiliation of this business. On February 1, 2015, we affiliated our Eagle Ford shale disposal water business, leaving us with one remaining company-operated terminal in the Bakken shale region.
As of December 31, 2014, we operate in the Bakken, Denver-Julesburg, Eagle Ford, Marcellus, Mississippian Limestone, Mowry, Niobrara, Permian Basin, Powder Ridge, Utica and Woodford shale regions in North America, all of which have experienced drilling for both oil and natural gas, with the exception of Marcellus, which is solely natural gas. Our strategy to target multiple resource-rich shales helps to diversify our customer offerings, lessen the impact of swings in any one commodity or regional activity and optimize equipment utilization. Our energy logistics business is primarily involved in fluid management and logistics in the upstream segment of the energy industry, through its services in connection with the establishment and servicing of production wells, and the midstream segment of the energy industry, in connection with the transportation of crude oil. We are currently prioritizing increasing our transportation of crude oil and produced water, which we refer to as post-production activities, over the transportation of fresh water and flowback water, which we refer to as production activities. We believe that our focus on post-production activities will lessen our reliance on production and drilling related activities, which tend to be more volatile. We believe the market for services such as those provided by our energy logistics business was approximately $9.0 billion in 2013. The industry is made up of providers that include independent national or regional trucking and logistics companies such as QCER, trucking and logistics companies owned by or dedicated to large oil and gas companies, and local providers focused on one or more particular shales. Demand for our services is driven by the number of active and producing wells, which impacts the transportation of crude oil and produced water, as well as the level of new drilling activity, which influences the transportation of fresh water and flowback water. Demand is also driven by market prices for oil and gas, which influence the exploration and production activities of our customers, the prices they are willing to pay for
32
Table of Contents
our services and the shales in which they operate. We expect regulation of this industry to increase over time but believe that the scope of our operations and experience with regulation in our chemical logistics business may provide us with an advantage over our competitors.
Our Networks
Our businesses have networks that consist of terminals owned or operated by independent affiliates and terminals owned or operated by us and a driver pool consisting of independent owner-operator drivers, affiliate-employed drivers and company-employed drivers. Independent affiliates are independent companies with which we contract to operate chemical and energy trucking terminals and provide transportation services exclusively on our behalf in defined markets. The independent affiliates generally provide the capital necessary to service their contracted business and are also responsible for most of the operating costs associated with servicing the contracted business. Due to several factors, including our ownership of the customer contracts and relationships, our provision of back-office support in areas such as claims, our direct relationship with independent owner-operators, the presence of non-compete agreements with the independent affiliates, and, in some cases, our ownership of the trailers utilized in the contracted business, our relationships with the independent affiliates tend to be long-term in nature, with minimal voluntary turnover. Independent owner-operators are generally individual drivers who own or lease their tractors and agree to provide transportation services to us under contract.
We believe our use of independent affiliates and independent owner-operators provides us with the following benefits:
| • | Locally owned and operated independent affiliate terminals can provide superior, tailored customer service. |
| • | Independent affiliates and independent owner-operators generally are paid a fixed, contractual percentage of revenue collected on each load they transport creating a variable cost structure that mitigates against cyclical downturns. |
| • | Reliance on independent affiliates and independent owner-operators creates an asset-light business model that generally reduces our capital investment. |
At present, our businesses rely upon independent affiliates and independent owner-operators to varying degrees. Our chemical logistics business operates primarily through independent affiliate terminals located throughout the continental United States and independent owner-operator drivers. During 2014, we announced the addition to our network of six new terminals operated by independent affiliates. Our intermodal business relies solely on company terminals located near ports in the eastern half of the United States and primarily independent owner-operator drivers. Our energy logistics business increasingly relies upon independent affiliate terminals, which affects the overall mix of our asset-light business. We expect to continue to add independent affiliates and independent owner-operators. As of December 31, 2014, we had transitioned all but a single terminal in the Eagle Ford shale and our operation in the Bakken shale, to independent affiliates in our energy logistics business, with the goal of reducing capital investment needs while improving return on invested capital. We transitioned our Eagle Ford shale company terminal to independent affiliates in February 2015, leaving only our Bakken shale operations non-affiliated.
The following table shows the approximate number of terminals, drivers, tractors, trailers, energy logistics equipment, intermodal chassis and chemical logistics transportation billed miles that we manage (including independent affiliates and independent owner-operators) as of December 31:
| 2014 | 2013 | 2012 | ||||||||||
| Terminals (1) |
123 | 112 | 108 | |||||||||
| Drivers |
3,538 | 3,382 | 3,277 | |||||||||
| Tractors |
3,195 | 2,899 | 2,775 | |||||||||
| Trailers |
5,709 | 5,255 | 5,155 | |||||||||
| Chassis |
1,956 | 1,801 | 1,743 | |||||||||
| Energy logistics equipment (2) |
1,178 | 1,380 | 1,359 | |||||||||
| Chemical Logistics Transportation Billed Miles (in thousands) |
109,409 | 107,405 | 103,347 | |||||||||
| (1) | Refer to Item 2. Properties for terminals by segment |
| (2) | Includes tractors, trailers and service equipment. |
33
Table of Contents
Recent Significant Transactions
November 2014 ABL Facility Amendment
On November 3, 2014, we entered into an amended and restated agreement with lenders covering our asset-based loan facility (“ABL Facility”) and our term loan (the “Term Loan”) under our ABL Facility. Total borrowing capacity under the ABL Facility and the Term Loan remain at $350.0 million and $17.5 million, respectively. The maturity of the Term Loan was extended to November 2017. The maturity of the ABL Facility was extended to the earlier of November 2019 and the date that is 91 days prior to the maturity of the Company’s 2018 Notes or replacement notes if the amount of the debt is above a certain threshold. Borrowing availability under the ABL Facility was expanded to include additional eligible accounts receivable, and the credit spreads under both the ABL Facility and the Term Loan were reduced.
July 2014 Notes Redemption
On July 16, 2014, we redeemed a portion of our 2018 Notes in the aggregate principal amount of $22.5 million. The redemption price for these 2018 Notes equaled 100% of the aggregate principal amount of $22.5 million, plus accrued but unpaid interest up to the redemption date, plus a 3.0% premium. The redemption was funded with proceeds from borrowings under our ABL Facility and cash on hand.
June 2014 5% Subordinated Notes Payoff
As part of the consideration we paid for a 2012 acquisition, we issued notes in an aggregate principal amount of $21.3 million (the “Acquisition Notes”). The Acquisition Notes contained a fixed interest rate of 5.0% per annum and had a maturity date of June 1, 2017. On November 12, 2013, we made optional principal payments of $2.1 million. On June 12, 2014, we extinguished the remaining principal balance of the Acquisition Notes of $19.2 million at a discount for a cash payment of $15.0 million. As a result of this transaction, we recognized a gain on extinguishment of debt of approximately $4.2 million for the three months ended June 30, 2014. The cash payment on the Acquisition Notes was funded with proceeds from borrowings under our ABL Facility and cash on hand.
August 2013 Secondary Offering
On August 14, 2013, former shareholders including funds affiliated with Apollo Global Management, LLC, sold 4.7 million shares of our common stock in an underwritten public offering, at a gross price of $8.60 per share. We did not receive any proceeds from the sale of the shares by the selling shareholders in this offering; however, we incurred and paid approximately $0.5 million in underwriting fees and expenses associated with this offering.
July 2013 Notes Redemption
On July 15, 2013, we redeemed a portion of our 2018 Notes in the aggregate principal amount of $22.5 million. The redemption price for these 2018 Notes equaled 100% of the aggregate principal amount of $22.5 million, plus accrued but unpaid interest up to the redemption date, plus a 3.0% premium. The redemption was funded with proceeds from the Term Loan (described below) together with borrowings under our ABL Facility.
June 2013 ABL Facility Amendment—Term Loan Facility
On June 14, 2013, our ABL Facility was amended to provide for a new $17.5 million senior secured term loan facility which was fully funded on July 15, 2013 (the “Term Loan”). Borrowings under the Term Loan bear interest at a rate equal to an applicable margin plus, at our option, either a base rate or LIBOR. The applicable margin at December 31, 2014 was 2.00% for base rate borrowings and 3.00% for LIBOR borrowings, with a potential step-down of 0.25% after 3 months from inception if a senior secured leverage ratio is met. We may voluntarily repay the outstanding amount under the Term Loan at any time without premium or penalty, other than customary “breakage” costs with respect to the LIBOR loans.
CRITICAL ACCOUNTING POLICIES AND ESTIMATES
Our discussion and analysis of our financial condition and results of operations are based upon our consolidated financial statements, which have been prepared in accordance with Generally Accepted Accounting Principles (“GAAP”). We identified what we believe to be the more critical accounting policies that impact the financial statements, some of which are based on management’s best estimates available at the time of preparation. Actual future experience may differ from these estimates.
Property and equipment—Property and equipment expenditures, including tractor and trailer rebuilds that extend the useful lives of such equipment, are capitalized and recorded at cost. For financial statement purposes, these assets are depreciated using the straight-line method over the estimated useful lives of the assets to an estimated salvage value.
34
Table of Contents
The asset lives used are presented in the following table:
| Average Lives (in years) | ||
| Buildings and improvements |
10 – 25 | |
| Tractors and terminal equipment |
5 – 7 | |
| Trailers and chassis |
15 – 20 | |
| Energy logistics equipment |
4 – 15 | |
| Disposal wells |
5 – 15 | |
| Furniture and fixtures |
3 – 5 | |
| Other equipment |
3 – 10 |
Building improvements are recorded at the shorter of the lease term or useful life. Tractor and trailer rebuilds, which are recurring in nature and extend the lives of the related assets, are capitalized and depreciated over the period of extension, generally 3 to 10 years, based on the type and extent of these rebuilds. Maintenance and repairs are charged directly to expense as incurred. Management estimates the useful lives of these assets based on historical trends and the age of the assets when placed in service. Any changes in the actual lives could result in material changes in the net book value of these assets. Additionally, we estimate the salvage values of these assets based on historical sales or disposals, and any changes in the actual salvage values could also affect the net book value of these assets.
Furthermore, we evaluate the recoverability of our long-lived assets whenever adverse events or changes in the business climate indicate that the expected undiscounted future cash flows from the related asset may be less than previously anticipated. If the net book value of the related asset exceeds the undiscounted future cash flows of the asset, the carrying amount would be reduced to the present value of its expected future cash flows and an impairment loss would be recognized. This analysis requires us to make significant estimates and assumptions in projecting future cash flows, and changes in facts and circumstances could result in material changes in the amount of any write-offs for impairment.
Goodwill and Intangibles
Goodwill
We evaluate goodwill and indefinite-lived intangible assets for impairment at least annually during the second quarter with a measurement date of June 30, and more frequently if indicators of impairment, often referred to as “triggering events,” arise, in accordance with Financial Accounting Standards Board (“FASB”) guidance. Impairment of goodwill is tested at the reporting unit level. A reporting unit is an operating segment or one level below an operating segment (referred to as a ‘component’). We have determined that our reporting units for which goodwill has been allocated are equivalent to our operating segments, as all of the components of each segment meet the criteria for aggregation.
When testing goodwill for impairment, we have the option to first assess qualitative factors to determine whether the existence of events or circumstances leads to a determination that it is more likely than not that the estimated fair value of a reporting unit is less than its carrying amount. If we elect to perform a qualitative assessment and determine that an impairment is more likely than not, we are then required to perform the two-step quantitative impairment test; otherwise, no further analysis is required. Under the qualitative assessment, we considered various qualitative factors, including macroeconomic conditions, relevant industry and market trends, cost factors, overall financial performance, other entity-specific events and events affecting the reporting unit that could indicate a potential change in the fair value of our reporting unit or the composition of its carrying values. We also considered the specific future outlook for the reporting unit based on our most recent forecasts.
We also may elect not to perform the qualitative assessment and, instead, proceed directly to the two-step quantitative impairment test. In the first step of the quantitative impairment test, the fair value of a reporting unit is compared to its carrying value, including goodwill. If the carrying value of a reporting unit, including goodwill, exceeds its fair value, the second step of the impairment test is performed for purposes of measuring the impairment. In the second step, the fair value of the reporting unit is allocated to all of the assets and liabilities of the reporting unit to determine an implied goodwill value. This allocation is similar to a purchase price allocation. If the carrying amount of the reporting unit’s goodwill exceeds the implied fair value of goodwill, an impairment loss will be recognized in an amount equal to that excess.
We estimate the fair value for each reporting unit considering three basic valuation approaches (i) the cost approach, based on the cost to reproduce assets; (ii) the market approach, which considers market exchange for comparable assets; and (iii) the income approach, which relies on capitalization of potential future income.
The cost approach is a valuation methodology that develops value estimates of the underlying assets and liabilities of a business enterprise (values are based on a range, from orderly liquidation to forced liquidation, depending on how quickly a company’s assets and liabilities could be liquidated). The liabilities are subtracted from the assets to derive a value for the business enterprise.
35
Table of Contents
The market approach is a valuation methodology in which the market value of the enterprise is estimated based on public market prices and actual transactions. The methodology consists of undertaking a detailed market analysis of publicly traded companies within our industry (guideline company method) and/or acquisitions of companies/assets in our industry (guideline transactions method) that provides a reasonable basis for comparison to the relevant investment characteristics of the respective reporting units. Valuation ratios and multiples derived from the guideline companies and guideline transactions methods are then selected and applied to the reporting unit after consideration of adjustments for dissimilarities in financial position, growth, markets, profitability, risk and other factors.
We derive a market value of invested capital or business enterprise value for each comparable company by multiplying the current price per share of common stock of the publicly traded companies by their total common shares outstanding and adding each company’s current level of debt. We calculate a business enterprise valuation multiple based on revenue and earnings from each company, then apply those multiples to each of our reporting units’ revenues and earnings to conclude a reporting unit’s business enterprise value. Assumptions regarding the selection of comparable companies are made based on, among other factors, capital structure, operating environment and industry. As the comparable companies are typically larger and more diversified than our reporting units, multiples are adjusted prior to application to our reporting units’ revenues and earnings to reflect differences in margins, long-term growth prospects and market capitalization.
The income approach is based on the present value of expected future cash flows over a 5-year period utilizing a discount rate generally equivalent to the estimated market-based weighted average cost of capital (“WACC”) determined separately for each reporting unit. To estimate the present value of the estimated cash flows that extend beyond the final year of the discounted cash flow model, we employ a terminal value technique, whereby we use estimated operating cash flows minus capital expenditures and adjust for changes in working capital requirements in the final year of the model, then discount this amount by the WACC to establish the terminal value. The determination of fair value using the income approach requires judgment and involves the use of significant estimates and assumptions about expected future cash flows derived from internal forecasts and the impact of market conditions on those assumptions. Critical assumptions primarily include economic growth, industry expansion, future operations which drive our revenue and margin assumptions and the discount rate.
The use of more than one approach is desirable because it provides a balanced valuation. In some cases, all three approaches are applicable. However, normally one or two approaches are utilized. Weights given to each approach vary directly with the amount of information available and the relative quality of that information. Available information and business fundamentals dictate which approach or approaches are employed to value a reporting unit.
In 2014, we performed our annual impairment test in the second quarter for our intermodal and chemical logistics reporting units. We conducted our analysis under the revised goodwill impairment rules in which we qualitatively assessed whether it was more likely than not that the respective fair value of these reporting units was less than the carrying amount. We determined that impairment of goodwill was not likely in either of our intermodal and chemical logistics reporting units and thus we were not required to perform a quantitative analysis. In addition, there were no indicators that a triggering event in our chemical logistics, energy logistics or intermodal reporting units had occurred through any subsequent quarter end through December 31, 2014.
In 2013, we performed our annual impairment test in the second quarter for all reporting units. For our chemical logistics reporting unit, we qualitatively assessed whether it was more likely than not that the respective fair value of this reporting unit was less than the carrying amount, including goodwill. We considered various qualitative factors, including macroeconomic conditions, relevant industry and market trends, cost factors, overall financial performance, other entity-specific events and events affecting the reporting unit that could indicate a potential change in the fair value of our reporting unit or the composition of its carrying values. We also considered the specific future outlook for the reporting unit based on our most recent forecasts. We determined that an impairment in our chemical logistics reporting unit was not likely and did not perform a quantitative analysis. For the intermodal and energy logistics reporting units, we proceeded directly to the two-step quantitative impairment test. In 2013, it was determined that a cost approach was not relevant for the Company’s reporting units. Enterprise value estimates were determined under the guideline company method, guideline transactions method and the income approach, and they were weighted to derive the enterprise value of the reporting units. For the intermodal reporting unit, which had goodwill of approximately $31.4 million as of June 30, 2013, the calculated fair value, using the income approach and market approach, which were weighted 50% and 50%, respectively, substantially exceeded its carrying value. For the energy logistics reporting unit, which had goodwill of approximately $71.3 million as of June 30, 2013, the calculated fair value, including goodwill, using the income approach and market approach, which were weighted 50% and 50%, respectively, showed that the reporting unit’s fair value was less than its carrying amount, indicating a potential impairment. The projections used in the income approach for the energy logistics reporting unit took into consideration the weak market conditions and the volatile nature of the industry. The projections assumed a recovery of operating margins and volumes over the ensuing year based on a strategic plan developed and implemented by management. The market-based WACC used in the income approach for the energy logistics reporting unit was 18.5%. The revenue growth rate and terminal year growth rate used in the discounted cash flow model were 3.9% and 3.0%, respectively. For the market approach, we used an average sales and EBITDA multiple of 0.6 and 4.6 times, respectively, in determining the market value. These multiples were used as a valuation metric applied to our respective financial performance period. We used sales and EBITDA as indicators of value because they are widely used key indicators of the cash generating capacity of similar companies. Based on the second step of the quantitative impairment test, we concluded that the implied fair value of goodwill for the energy logistics reporting unit was less than its carrying amount, resulting in an impairment of goodwill of approximately $55.2 million recorded for the three-month period ending June 30, 2013. The remaining goodwill of the energy logistics reporting unit after the second-quarter impairment was approximately $17.6 million.
36
Table of Contents
In the fourth quarter of fiscal 2013, we identified triggering events in our energy logistics reporting unit, which were the combination of the continued challenging market conditions, the reporting unit’s recent financial performance, and decreases in the projected results as compared to prior periods, requiring an interim impairment test of goodwill. The decrease in recent financial performance and projected results was mainly due to poor performance and increased reorganizational costs. For the energy logistics reporting unit, the calculated fair value using the income approach and market approach, which were weighted 50% and 50%, respectively, showed that the reporting unit’s fair value was less than its carrying amount, indicating a potential impairment. The projections used in the income approach for the energy logistics reporting unit took into consideration the continued weak market conditions and the volatility in the industry. The projections assumed a gradual recovery of operating margins over a multi-year period. The market-based WACC used in the income approach for the energy logistics reporting unit was 19.0%, compared to 18.5% used in the energy logistics annual impairment test performed in the second quarter of fiscal 2013. The higher WACC was the result of an increase in the risk-free market interest rate. The revenue growth rate and terminal year growth rate used in the discounted cash flow model for the fourth quarter of 2013 impairment test were 2.9% and 2.0%, respectively. For the market approach, we used an average sales and EBITDA multiple of 0.5 and 4.6 times, respectively, in determining the market value. Based on the second step of the impairment test, we concluded that the implied fair value of goodwill for the energy logistics reporting unit was less than its carrying amount, resulting in an impairment of goodwill of approximately $17.6 million for the three-month period ending December 31, 2013.
As a result of the uncertainty associated with forming the estimate inherent in the goodwill impairment test, actual results could differ from those estimates. Future events and changing market conditions may impact our assumptions as to future revenue growth rates, pace and extent of operating margin and volume recovery, market-based WACC and other factors that may result in changes in our estimates of our reporting units’ fair value. Although we believe the assumptions used in testing our reporting units’ goodwill for impairment are reasonable, it is possible that market and economic conditions could deteriorate further or not improve as expected. Additional declines in or a lack of recovery in market conditions from current levels, a trend of weaker than anticipated financial performance including the pace and extent of operating margin and volume recovery, a further decline in our share price from current levels, or an increase in the market-based WACC, among other factors, could significantly impact our impairment analysis and may result in further goodwill impairment charges that, if incurred, could have a material adverse effect on our financial condition and results of operations.
Intangible Assets
In 2014, our intangible assets included a tradename, customer relationships and non-compete agreements. We performed our annual impairment test in the second quarter with a measurement date of June 30 for the indefinite-lived intangible assets related to a tradename of approximately $7.4 million in the intermodal reporting unit. We conducted our analysis under the revised intangibles – goodwill and other impairment rules – in which we qualitatively assessed whether it was more likely than not that the respective fair value of these indefinite-lived assets was less than the carrying amount. We considered various qualitative factors, including macroeconomic conditions, relevant industry and market trends, cost factors, overall financial performance, other entity-specific events and events that could indicate a potential change in the fair value of indefinite-lived assets or the composition of their carrying values. We determined that impairment of the indefinite-lived assets was not likely and thus we were not required to perform a quantitative analysis. In addition, there were no indicators that a triggering event in our intermodal reporting unit had occurred through any subsequent quarter end through December 31, 2014.
In 2013, our intangible assets included non-compete agreements, a service agreement, customer relationships and tradenames. The Company tests intangible assets for impairment when certain triggering events or circumstances indicate that their carrying value may be impaired. Triggering events are assessed on an intangible by intangible basis and, if identified, the specific asset or assets are valued and compared to their carrying value. If the carrying value exceeds the projected discounted cash flows attributed to the indefinite-lived intangible asset, the carrying value is no longer considered recoverable and the Company will record an impairment charge. The non-compete agreements are continually monitored to ensure they remain in full force and effect. The service agreement and customer relationships were valued using the income approach, specifically the excess earnings method. The excess earnings analysis consists of discounting to present value the projected cash flows attributable to the service agreement and customer relationships, with consideration given to cost savings, customer attrition, the importance or lack thereof of existing customer relationships to our business plan, income taxes and required growth rates. The tradenames, both indefinite and definite-lived, were tested for impairment by using the income approach, specifically the relief-from-royalty method. This approach is based on the assumption that in lieu of ownership, a company would be willing to pay a royalty in order to utilize the related benefits of the intangible asset.
We performed our annual impairment test in the second quarter of 2013 for the indefinite-lived intangible assets related to the intermodal tradename. For the intermodal tradename of approximately $7.4 million as of June 30, 2013, the calculated fair value using the relief-from-royalty method of the income approach substantially exceeded its carrying value. The discount rate used in the income
37
Table of Contents
approach was 17.5%. The long-term growth rate and royalty rate used in the discounted cash flow model were 3.0% and 2.0%, respectively. During the second quarter of 2013, we recorded an impairment charge of approximately $0.5 million related to the definite-lived tradenames for the energy logistics reporting unit. This valuation was based on the discontinued use of the tradenames and lack of marketability. The definite-lived tradenames were fully impaired as a result of the second quarter of 2013 impairment test.
Similar to goodwill, in the fourth quarter of fiscal 2013, we identified the combination of the continued challenging market conditions, the recent financial performance, and decreases in the projected results as compared to prior periods as triggering events requiring an impairment test of the customer relationships and the service agreement related to our energy logistics reporting unit. For the energy logistics reporting unit, the calculated fair value using the income approach showed that the fair value of the customer relationships was substantially less than their carrying amount, indicating an impairment of approximately $17.1 million. The projections used in the income approach for the customer relationships took into consideration the continued weak market conditions and the historical and expected customer attrition. The discount rate used in the income approach was 21.0%. The long-term growth rate used in the discounted cash flow model was 2.0%. Furthermore, for the energy logistics reporting unit, the calculated fair value using the income approach showed that the service agreement fair value was less than its carrying amount, indicating an impairment of approximately $0.9 million. The projections used in the income approach for the service agreement took into consideration the increased costs of fulfilling the contract. The discount rate used in the income approach was 20.0%. The long-term growth rate used in the discounted cash flow model was 2.0%. The customer relationships and service agreement were fully impaired as a result of the fourth quarter of 2013 impairment test.
As a result of the uncertainty associated with forming the estimate inherent in the intangible assets impairment test, actual results could differ from those estimates. Future events and changing market conditions may impact our assumptions as to future revenue growth rates, pace and extent of operating margin and volume recovery, market-based WACC and other factors that may result in changes in our estimates of our reporting units’ fair value. Although we believe the assumptions used in testing our reporting units’ intangible assets for impairment are reasonable, it is possible that market and economic conditions could deteriorate further or not improve as expected. Additional declines in or a lack of recovery in market conditions from current levels, a trend of weaker than anticipated financial performance including the pace and extent of operating margin and volume recovery, a further decline in our share price from current levels, or an increase in the market-based WACC, among other factors, could significantly impact our impairment analysis and may result in further goodwill impairment charges that, if incurred, could have a material adverse effect on our financial condition and results of operations.
Our long-lived assets, including revenue earning equipment, operating property and equipment and intangible assets with finite lives, are tested for recoverability when events or changes in circumstances indicate that the carrying amount of assets may not be recoverable. Based upon management’s review of the value of the finite-lived intangible assets in our intermodal and energy logistics reporting units, we determined that no indicators of impairment existed as of December 31, 2014 and 2013.
Deferred Tax Asset—In accordance with FASB guidance, we use the asset and liability method of accounting for income taxes. Significant management judgment is required in determining the provision for income taxes and, in particular, any valuation allowance that is recorded or released against our deferred tax assets.
We continue to evaluate quarterly the positive and negative evidence regarding the realization of net deferred tax assets. The carrying value of our net deferred tax assets is based on our belief that it is more likely than not that we will generate sufficient future taxable income to realize these deferred tax assets. We review a rolling thirty-six month calculation of U.S. earnings, and consider other criteria at each reporting date, to determine if we have incurred cumulative income or losses in recent years. In addition, we review future reversal of existing taxable temporary differences, the ability to carry back tax attributes to prior years, feasibility of tax planning strategies and estimated future taxable income.
During 2012, we recorded a deferred tax benefit of $28.1 million of which $35.3 million related to a prior-year valuation allowance release. These releases of the valuation allowance are a result of our consistent cumulative income position, improved operating results, and recent expansion of our energy business through acquisition. Our assessment of the recoverability of the deferred tax assets primarily relied on the positive evidence related to our cumulative income position as of December 31, 2012. We have determined that it is more likely than not that expected future taxable income will be sufficient to utilize substantially all of our U.S. federal and state net deferred tax assets.
At December 31, 2014, we had an estimated $47.4 million in federal net operating loss carryforwards, $8.8 million of unrecognized federal operating loss carryforwards related to excess stock compensation deductions and uncertain tax position deductions, $2.3 million in alternative minimum tax credit carryforwards and $5.4 million in foreign tax credit carryforwards. The net operating loss carryforwards will expire in the years 2020 through 2030, while the alternative minimum tax credits may be carried forward indefinitely and the foreign tax credits will expire in years 2015 through 2024.
38
Table of Contents
Uncertain Income Tax Positions—In accordance with FASB guidance, we account for uncertainty in income taxes, using a two-step process. The first step is to evaluate the tax position for recognition by determining if the weight of available evidence indicates that it is more likely than not that the position will be sustained upon audit, including resolution of related appeals or litigation processes, if any. The second step requires us to estimate and measure the tax benefit as the largest amount that is more than 50% likely to be realized upon ultimate settlement. It is inherently difficult and subjective to estimate such amounts, as we have to determine the probability of various possible outcomes. We re-evaluate these uncertain tax positions on a quarterly basis. This evaluation is based on factors including, but not limited to, changes in facts or circumstances, changes in tax law, effectively settled issues under audit, and new audit activity. Such a change in recognition and measurement would result in recognition of a tax benefit and/or an additional charge to the tax provision.
Environmental Liabilities—We have reserved for potential environmental liabilities based on the best estimates of potential clean-up and remediation for known environmental sites. We employ a staff of environmental professionals to administer all phases of our environmental programs and use outside experts where needed. These professionals develop estimates of potential liabilities at these sites based on projected and known remediation costs. These cost projections are determined through previous experiences with other sites and through bids from third-party contractors. Management believes its existing reserves are reasonable based on current information, but estimates of environmental reserves and exposures may be affected by information subsequently received.
Accrued Loss and Damage Claims—We currently maintain liability insurance for bodily injury and property damage claims, covering all employees, independent owner-operators and independent affiliates, and workers’ compensation insurance coverage on our employees and company drivers. This insurance includes a self-insured deductible of $2.0 million per incident for bodily injury and property damage and a $1.0 million deductible for workers’ compensation. As such, we are subject to liability as a self-insurer to the extent of these deductibles under various policies. We are self-insured for damage to the equipment we own or lease and for cargo losses. As of December 31, 2014, we had $19.0 million in an outstanding letter of credit to our insurance company to guarantee the self-insurance portion of our liability. If we fail to meet certain terms of our agreement, the insurance company may draw down the letter of credit. In developing liability reserves, we rely on insurance company estimates, the judgment of our own licensed claims adjusters, and independent professional actuaries and attorneys. The most significant assumptions used in the estimation process include determining the trends in loss costs, the expected consistency in the frequency and severity of claims incurred but not yet reported to prior-year claims, and expected costs to settle unpaid claims. Management believes reserves are reasonable given known information, but as each case develops, estimates may change to reflect the effect of new information.
Revenue Recognition—Transportation revenue, including fuel surcharges and related costs, is recognized on the date freight is delivered. Service revenue consists primarily of rental revenues (primarily tractor and trailer rental), intermodal and depot revenues, disposal well services revenues and insurance-related administrative services revenues. Rental revenues from independent affiliates, independent owner-operators and third parties are recognized ratably over the lease period. Intermodal and depot revenues, consisting primarily of repair and storage services, are recognized when the services are rendered. Disposal well services revenues are recognized when the services are rendered. Insurance-related administrative services revenues are recorded ratably over the service period. We recognize all revenues on a gross basis as the principal and primary obligor with risk of loss in relation to our responsibility for completion of services as contracted with our customers.
Allowance for Uncollectible Receivables—The allowance for all potentially uncollectible receivables is based on a combination of historical data, cash payment trends, specific customer issues, write-off trends, general economic conditions and other factors. These factors are continuously monitored by our management to arrive at the estimate for the amount of accounts receivable that may be ultimately uncollectible. The receivables analyzed include trade receivables, as well as loans and advances made to independent owner-operators and independent affiliates. If the financial condition of our customers were to deteriorate, resulting in an impairment of their ability to make payments, an additional allowance could be required.
Stock Compensation Plans—Stock compensation is determined by the assumptions required under the FASB guidance. The fair values of stock option grants are based upon the Black-Scholes option-pricing model and amortized as compensation expense on a straight-line basis over the vesting period of the grants. Restricted stock awards and restricted stock units are measured at fair value at the time of issuance. Expense for restricted stock awards and time-based restricted stock units is recognized based on fair value on a straight-line basis over the vesting period. Expense for performance-based restricted stock units is recognized on a straight-line basis over the vesting period in an amount, if any, based upon our estimation of the probability that such fair value will be realized should performance criteria be satisfied. Stock-based compensation expense related to stock options, restricted stock awards and restricted stock units was $3.8 million and $3.1 million for the year ended December 31, 2014 and 2013, respectively. As of December 31, 2014, there was approximately $6.8 million of total unrecognized compensation cost related to the unvested portion of our stock-based awards. The recognition period for the remaining unrecognized stock-based compensation cost generally varies from two to four years. For further discussion on stock-based compensation, see Note 19 of Notes to Consolidated Financial Statements included in Item 15 of this report.
Pension Plans—We maintain two noncontributory defined benefit plans resulting from a prior acquisition that cover certain vested salaried participants and retirees and certain other vested participants and retirees under an expired collective bargaining agreement. Both plans are frozen and, as such, no future benefits accrue. We record annual amounts relating to these plans based on calculations specified by GAAP, which include various actuarial assumptions such as net periodic benefit cost discount rates (4.10% to 4.50%) and expected rates of return (7.00% to 7.50%) depending on the pension plan. Material changes in pension costs may occur
39
Table of Contents
in the future due to changes in these assumptions. Future annual amounts could be impacted by changes in the discount rate, changes in the expected long-term rate of return, changes in the level of contributions to the plans, changes in the mortality rates and other factors.
We had an accumulated net pension equity charge (after-tax) of $3.8 million at December 31, 2014 and an accumulated net pension equity credit (after-tax) of ($4.2) million at December 31, 2013.
Assumptions as to mortality of the participants in our pension plans are a key estimate in measuring the expected payments participants may receive over their lifetime and, therefore, the amount of expense we will recognize. During 2014, the Society of Actuaries released a series of updated mortality tables resulting from recent studies conducted by them measuring mortality rates for various groups of individuals. The updated mortality tables reflect improved trends in longevity and, therefore, have the effect of increasing the estimate of benefits to be received by plan participants. While we updated our mortality assumptions by taking into consideration the recently issued mortality tables as well as our own historical experience, we continue to analyze the available mortality information, which may lead to further updates of these assumptions.
The discount rate is based on a model portfolio of AA-rated bonds with a maturity matched to the estimated payouts of future pension benefits. The expected return on plan assets is based on our expectation of the long-term rates of return on each asset class based on the current asset mix of the funds, considering the historical returns earned on the type of assets in the funds, plus an assumption of future inflation. The current inflation assumption is 2.25%. We review our actuarial assumptions on an annual basis and make modifications to the assumptions based on current rates and trends when appropriate. The effects of the modifications are amortized over future periods.
Assumed discount rates and expected return on plan assets have a significant effect on the amounts reported for the pension plan. At December 31, 2014, our projected benefit obligation (“PBO”) was $51.9 million. Our projected 2015 net periodic pension expense is $0.9 million. A 1.0% decrease in our assumed discount rate would increase our PBO to $57.9 million and decrease our 2015 net periodic pension expense less than $0.1 million. A 1.0% increase in our assumed discount rate would decrease our PBO to $46.9 million and increase our 2015 net periodic pension expense less than $0.1 million. A 1.0% decrease in our assumed rate of return would not change our PBO but would increase our 2015 net periodic pension expense to $1.2 million. A 1.0% increase in our assumed rate of return would not change our PBO but would decrease our 2015 net periodic pension expense to $0.5 million.
NEW ACCOUNTING PRONOUNCEMENTS
Refer to Note 2, “Summary of Significant Accounting Policies—New Accounting Pronouncements” for discussion of recent accounting pronouncements and for additional discussion surrounding the adoption of accounting standards.
RESULTS OF OPERATIONS
The following table presents certain condensed consolidated financial information, as a percentage of revenue, for the years ended December 31, 2014, 2013 and 2012:
| Year Ended December 31, | ||||||||||||
| 2014 | 2013 | 2012 | ||||||||||
| OPERATING REVENUES: |
||||||||||||
| Transportation |
72.3 | % | 72.6 | % | 70.9 | % | ||||||
| Service revenue |
13.8 | 14.0 | 14.4 | |||||||||
| Fuel surcharge |
13.9 | 13.4 | 14.7 | |||||||||
|
|
|
|
|
|
|
|||||||
| Total operating revenues |
100.0 | 100.0 | 100.0 | |||||||||
| OPERATING EXPENSES: |
||||||||||||
| Purchased transportation |
67.3 | 64.0 | 65.6 | |||||||||
| Compensation |
9.3 | 10.6 | 9.8 | |||||||||
| Fuel, supplies and maintenance |
10.1 | 11.4 | 9.7 | |||||||||
| Depreciation and amortization |
2.2 | 2.8 | 2.5 | |||||||||
| Selling and administrative |
3.3 | 3.4 | 4.0 | |||||||||
| Insurance costs |
2.1 | 2.1 | 1.9 | |||||||||
| Taxes and licenses |
0.4 | 0.4 | 0.3 | |||||||||
| Communication and utilities |
0.4 | 0.4 | 0.4 | |||||||||
| Gain on disposal of property and equipment |
(0.3 | ) | (0.3 | ) | (0.1 | ) | ||||||
| Impairment charges |
— | 9.8 | — | |||||||||
|
|
|
|
|
|
|
|||||||
| Total operating expenses |
94.8 | 104.6 | 94.1 | |||||||||
|
|
|
|
|
|
|
|||||||
40
Table of Contents
| Year Ended December 31, | ||||||||||||
| 2014 | 2013 | 2012 | ||||||||||
| Operating income (loss) |
5.2 | (4.6 | ) | 5.9 | ||||||||
|
|
|
|
|
|
|
|||||||
| Interest expense, net |
2.9 | 3.2 | 3.5 | |||||||||
| Gain on extinguishment of debt |
(0.4 | ) | — | — | ||||||||
| Write-off of debt issuance costs |
— | 0.1 | — | |||||||||
| Other income, net |
— | (0.8 | ) | (0.3 | ) | |||||||
|
|
|
|
|
|
|
|||||||
| Income (loss) before income taxes |
2.7 | (7.1 | ) | 2.7 | ||||||||
| Provision for (benefit from) income taxes |
0.6 | (2.6 | ) | (3.2 | ) | |||||||
|
|
|
|
|
|
|
|||||||
| Net income (loss) |
2.1 | % | (4.5 | )% | 5.9 | % | ||||||
|
|
|
|
|
|
|
|||||||
YEAR ENDED DECEMBER 31, 2014 COMPARED TO YEAR ENDED DECEMBER 31, 2013
For the year ended December 31, 2014, total revenues were $991.8 million, an increase of $61.9 million, or 6.7%, from revenues of $929.8 million for the same period in 2013, driven primarily by our chemical logistics and intermodal business segments. Transportation revenue increased $42.4 million, or 6.3%, primarily due to an increase of $41.1 million in our chemical logistics business resulting from increased volumes and positive contributions from new terminals established in 2014. We had an increase of $7.6 million in our intermodal business due to stronger demand for ISO container shipments. Our energy logistics transportation revenue decreased $6.3 million due to reduced drilling activity in certain of our shale regions partially offset by increased oil hauling activity in other shale regions. Aggressive driver recruiting and retention actions resulted in a higher number of drivers during 2014 compared to 2013.
Service revenue increased $6.9 million, or 5.3%, primarily due to higher chemical logistics service revenue of $3.8 million resulting from increased equipment rental income and a $4.4 million improvement in our intermodal service revenue resulting from higher depot services revenue. These increases were partially offset by a reduction in our energy logistics service revenue of $1.8 million.
Fuel surcharge revenue increased $12.7 million, or 10.1%, due to higher fuel prices in each of our business segments. We have fuel surcharge programs in place with the majority of our chemical logistics and intermodal customers and certain energy logistics customers. Many of these programs involve a specified computation based on the changes in fuel prices. As a result, some of these programs have a short time lag between when fuel prices change and when this change is reflected in revenues. It is not meaningful to compare the amount of fuel surcharge revenue or the change in fuel surcharge revenue between reporting periods to fuel expense, or the change in fuel expense between periods, as a significant portion of fuel costs are included in purchased transportation.
Purchased transportation increased $73.1 million, or 12.3%, due primarily to servicing our chemical logistics, energy logistics and intermodal businesses of $39.4 million, $18.2 million and $6.9 million, respectively. The majority of the increases resulted from higher transportation volumes due in part to new terminals opened during 2014. Total purchased transportation as a percentage of transportation revenue and fuel surcharge revenue increased to 78.1% for the year ended December 31, 2014 versus 74.3% for the same period in 2013 primarily due to affiliation of prior company-owned terminals. Our independent affiliates generated 93.0% of our chemical logistics revenue and fuel surcharge revenue for the year ended December 31, 2014 compared to 89.9% for the comparable prior-year period primarily due to new independent affiliate terminals opened during 2014. During the year ended December 31, 2014 and 2013, we generally paid our independent affiliates approximately 85% of chemical logistics transportation revenue and paid independent owner-operators approximately 65% of chemical logistics transportation revenue. Certain independent affiliates could earn and have earned an even greater percentage of chemical logistics transportation revenue during the 2014 period and in the future due to company-provided growth incentive programs.
During the year ended December 31, 2014 and 2013, company-operated terminals generated approximately 46% and 67%, respectively, of energy logistics revenue, and independent affiliate-operated terminals and third-party carriers generated approximately 54% and 33%, respectively, due to affiliation of company-operated terminals during 2013 and 2014. We expect the percentage of energy logistics revenue generated from independent affiliates in 2015 to be higher than in 2014 because terminals affiliated in 2014 will be reflected for all of 2015 and an additional terminal was affiliated in February 2015. We generally pay independent affiliates, independent owner-operators and third-party carriers between 70% and 90% of energy logistics transportation revenue depending on the type of product hauled and their type of association with the Company.
41
Table of Contents
Compensation expense decreased $6.2 million, or 6.3%, due primarily to the affiliation of certain company-operated terminals in our energy logistics segment, partially offset by higher corporate expenses from performance-based incentive compensation programs. We expect non-cash expenses from performance-based incentive compensation to be higher in 2015 than in 2014 due to required amortization of existing multi-year performance-based awards.
Fuel, supplies and maintenance decreased $5.9 million, or 5.6%, due primarily to a decrease in fuel costs of $6.3 million, and a reduction in wastewater disposal costs of $3.3 million, partially offset by an increase in equipment rent expense of $3.1 million and an increase in maintenance and other terminal costs of $0.6 million.
Depreciation and amortization expense decreased $4.5 million, or 17.2%, due to a decrease in amortization expense of $2.5 million for acquired intangibles that were impaired in 2013 and a decrease in depreciation of $2.0 million due to sales of underutilized revenue equipment.
Selling and administrative expenses increased $1.3 million, or 4.0%, due to an increase in driver recruiting and retention costs and bad debt expense, partially offset by a reduction in terminal costs and professional fees.
Insurance costs increased $1.9 million, or 9.9%, primarily due to higher transportation volumes. As a percentage of revenue, insurance costs were within the Company’s target range of 2% to 3% of total revenue.
For the year ended December 31, 2014, we recognized a net gain on property and equipment of $2.6 million primarily from the sale of equipment. For the year ended December 31, 2013, we recognized a net gain on disposal of property and equipment of $2.5 million which was comprised of a net gain of $3.0 million on the sale of properties, partially offset by a net loss of $0.5 million on the disposal of equipment.
We did not incur any impairment charges for the year ended December 31, 2014. For the year ended December 31, 2013, we recorded non-cash impairment charges to goodwill and intangibles in the amount of $91.3 million as a result of our impairment analyses performed as of June 30, 2013 and December 31, 2013. The charges related to our energy logistics segment. Further information regarding our impairment analyses is included in our Critical Accounting Policies and Estimates regarding Goodwill and Intangible Assets.
For the year ended December 31, 2014, operating income was $51.2 million compared to an operating loss of $42.8 million for the same period in 2013. The increase was primarily due to the non-cash impairment charges in 2013 that did not recur in 2014.
Interest expense decreased $2.2 million, or 7.3%, in the year ended December 31, 2014, primarily due to the redemptions of a portion of our high cost 2018 Notes during the third quarters of 2014 and 2013 and the full extinguishment of our Acquisition Notes through payments in the fourth quarter of 2013 and the second quarter of 2014. We expect our interest expense for 2015 to be lower than for 2014, due to the partial redemptions of the 2018 Notes in 2014 and January 2015, and the full payment of our Acquisition Notes, provided that the rates of interest on our floating rate indebtedness do not increase substantially.
For the year ended December 31, 2014, we recognized a gain on extinguishment of debt of $4.2 million, resulting from the full payoff of our Acquisition Notes at a discount.
Other income of $7.3 million for the year ended December 31, 2013 consisted primarily of adjustments to our liability for contingent consideration payments related to a 2012 acquisition.
We recognized an income tax expense of $6.4 million for the year ended December 31, 2014, compared to an income tax benefit of $24.3 million for the same period in 2013. The effective tax rates for the years ended December 31, 2014 and 2013 were 23.7% and 36.6%, respectively. The effective tax rate for the year ended December 31, 2014 was impacted by release of the foreign tax credit valuation allowance and a decrease in our reserve for uncertain tax positions. The effective tax rate in the same period in 2013 was impacted by an increase in our reserve for uncertain tax positions.
For the year ended December 31, 2014, we had net income of $20.6 million compared to a net loss of $42.0 million for the same period in 2013 as a result of the above-mentioned items.
YEAR ENDED DECEMBER 31, 2013 COMPARED TO YEAR ENDED DECEMBER 31, 2012
Comparability for the year ended December 31, 2013 to the year ended December 31, 2012 is affected by the acquisitions of Trojan, Bice and Dunn’s in 2012 (“the 2012 Energy Acquisitions”) which are included in our energy logistics segment.
42
Table of Contents
For the year ended December 31, 2013, total revenues were $929.8 million, an increase of $87.7 million, or 10.4%, from revenues of $842.1 million for the same period in 2012. Transportation revenue increased $77.7 million, or 13.0%, primarily due to an increase in energy logistics revenue of $54.9 million, of which $35.0 million related to the 2012 Energy Acquisitions. In addition, we had an increase of $19.1 million in our chemical logistics revenue due to increased pricing and higher volumes and an increase of $3.7 million in our intermodal business due to an increase in demand for ISO container shipments.
Service revenue increased $8.7 million, or 7.2%. This increase was primarily due to higher intermodal depot services revenue of $5.5 million, higher energy logistics revenue of $2.2 million, and an increase in our chemical logistics revenue of $1.0 million.
Fuel surcharge revenue increased $1.3 million, or 1.1%, primarily due to an increase in our chemical logistics business of $1.1 million and an increase of $0.9 million in our intermodal business, partially offset by a decrease in our energy logistics business of $0.7 million. We have fuel surcharge programs in place with the majority of our chemical logistics and intermodal customers. Most of these programs typically involve a specified computation based on the changes in fuel prices. As a result, some of these programs have a short time lag between when fuel prices change and when this change is reflected in revenues. It is not meaningful to compare the amount of fuel surcharge revenue or the change in fuel surcharge revenue between reporting periods to fuel expense, or the change in fuel expense between periods, as a significant portion of fuel costs are included in purchased transportation.
Purchased transportation increased $42.2 million, or 7.6%, primarily due to an increase of $26.4 million in costs related to servicing the energy logistics market, and partly due to the 2012 Energy Acquisitions. Purchased transportation also increased $14.0 million related to our chemical logistics business and $1.8 million related to our intermodal business. Total purchased transportation as a percentage of transportation revenue and fuel surcharge revenue decreased to 74.3% for the year ended December 31, 2013 versus 76.6% for the same period in 2012. Our independent affiliates generated 89.9% of our chemical logistics transportation revenue and fuel surcharge revenue for the year ended December 31, 2013 compared to 90.4% for the comparable prior-year period. During the 2013 and 2012 periods, we paid our independent affiliates approximately 85% of chemical logistics transportation revenue and paid independent owner-operators approximately 65% of chemical logistics transportation revenue.
During the year ended December 31, 2013, hauling for the energy market was performed by company-operated terminals, independent affiliates and independent third-party carriers. During this period, company-operated terminals generated approximately 67.4% of the energy logistics revenue, and independent affiliates and third-party carriers generated approximately 32.6%. During the year ended December 31, 2012, company-operated terminals generated approximately 77.0% of the energy logistics revenue and independent affiliates and third-party carriers generated approximately 23.0%. We expect the percentage of energy logistics revenue generated by independent affiliates to continue to increase in 2014 due to the affiliations that occurred in 2013 and the contemplated affiliations in 2014. We typically pay these independent contractors between 70% and 95% of energy logistics transportation revenue depending on their type of association with the company.
Compensation expense increased $16.5 million, or 20.1%, due primarily to an increase of $11.3 million in our energy logistics business, of which $9.6 million was due to the 2012 Energy Acquisitions, an increase of $4.3 million in our chemical logistics business from an increase in company-operated terminals, prior to their re-affiliation beginning in the second quarter of 2013, and an increase in our intermodal business of $0.9 million.
Fuel, supplies and maintenance increased $23.9 million, or 29.1%, due primarily to an increase of $15.4 million related to our energy logistics business, of which $11.6 million was due to the 2012 Energy Acquisitions. We also had an increase of $5.5 million related to our chemical logistics business resulting primarily from an increase in fuel costs of $1.7 million, an increase in equipment rent expense of $3.0 million, and an increase in repairs and maintenance expense and other terminal costs of $0.8 million, primarily at our company-operated terminals. In addition, we had an increase of $3.0 million related to our intermodal business primarily due to higher maintenance costs of $2.1 million, an increase in equipment rent of $0.7 million and an increase in fuel costs of $0.2 million.
Depreciation and amortization expense increased $5.0 million, or 23.9%, primarily due to an increase in depreciation in our energy logistics business and an increase in amortization expense for acquired intangible assets. We expect our depreciation and amortization expense to be lower in 2014 than in 2013 due to sales of energy logistics equipment and the impairment of substantially all of the energy logistics intangible assets in 2013.
Selling and administrative expenses decreased $2.3 million, or 6.9%. Increases in our energy logistics business of $2.9 million, of which $2.4 million was due to the 2012 Energy Acquisitions, and increases of $0.3 million in our intermodal business, were offset by a decrease in our chemical logistics business of $5.5 million, which is primarily due to a reduction in energy acquisition-related costs and professional fees.
43
Table of Contents
Insurance costs increased $3.3 million, or 21.1%, due to higher claims in our energy logistics business from increased trucking activity and an increase in severity of claims in our chemical logistics business. As a percentage of revenue, insurance expense was within the Company’s target range of 2% to 3% of total revenue.
For the year ended December 31, 2013, we recognized a net gain on disposal of property and equipment of $2.5 million which was comprised of a net gain of $3.0 million on the sale of properties offset by a net loss of $0.5 million on the disposal of equipment. For the year ended December 31, 2012, we recognized a gain on disposal of equipment of $1.0 million.
For the year ended December 31, 2013, we recorded a non-cash impairment charge to goodwill and intangibles in the amount of $91.3 million as a result of our impairment analyses performed as of June 30, 2013 and as of December 31, 2013. These charges related to our energy logistics segment.
For the year ended December 31, 2013, we incurred an operating loss of $42.8 million compared to operating income of $49.1 million for the same period in 2012. The decrease was primarily due to the non-cash impairment charge described above.
Interest expense increased $1.1 million, or 3.5%, in the year ended December 31, 2013, primarily due to an increase in our weighted average ABL Facility borrowings which were primarily used to fund the 2012 Energy Acquisitions and the $0.7 million premium paid on the redemption of a portion of our 2018 Notes.
Other income of $7.3 million for the year ended December 31, 2013 consists primarily of adjustments to our liability for contingent consideration payments related to a 2012 Energy Acquisition. Other income of $2.9 million for the year ended December 31, 2012 consists primarily of the net adjustments to our liability for contingent consideration payments related to two of the 2012 Energy Acquisitions.
We recognized an income tax benefit of $24.3 million for the year ended December 31, 2013, compared to an income tax benefit of $27.3 million for the same period in 2012. The effective tax rates for the years ended December 31, 2013 and 2012 were 36.6% and (120.1)%, respectively. The effective tax rate for the year ended December 31, 2013 was impacted by an increase in our reserve for uncertain tax positions. The effective tax rate in the same period in 2012 was impacted by a release of $35.3 million in the aggregate of our deferred tax valuation allowance.
For the year ended December 31, 2013, we incurred a net loss of $42.0 million compared to net income of $50.1 million for the same period in 2012 as a result of the above-mentioned items.
Segment Operating Results
The Company has three reportable business segments for financial reporting purposes that are distinguished primarily on the basis of services offered. Historically, the Company included certain shared services and corporate expenses within its Chemical Logistics segment. Beginning with 2014, the Company has allocated these items to “Shared Services.” The allocation represents a change in our segment measure as opposed to a change in operating or reportable segments. Shared Services consists of corporate and shared services overhead costs, including information technology, driver recruiting, safety, accounting, tax, stock-based compensation, pension, environmental and other corporate headquarters costs. Segment results for the 2013 and 2012 periods were reclassified to conform to the current year presentation. Our segments are delineated as follows:
| • | Chemical Logistics, which consists of the transportation of bulk chemicals primarily through our network that includes company-operated terminals and terminals operated by 28 independent affiliates, and equipment rental income; |
| • | Energy Logistics, which consists primarily of the transportation of crude oil, disposal water and fresh water for the UCO&G market, through our network that includes one company-operated terminal and terminals operated by 4 independent affiliates, and equipment rental income; and |
| • | Intermodal, which consists of Boasso’s intermodal ISO tank container transportation and depot services business primarily supporting the international movement of bulk liquids. |
Segment operating income reported in our segment tables excludes amounts such as depreciation and amortization, gains and losses on disposal of property and equipment, restructuring costs and impairment charges. Although these amounts are excluded from the business segment operating income results, they are included in our reported Consolidated Statements of Operations. We have not provided specific asset information by segment, as it is not regularly provided to our chief operating decision maker for review.
44
Table of Contents
Summarized segment operating results for the periods below are as follows (in thousands):
| Year Ended December 31, 2014 | ||||||||||||||||||||
| Chemical Logistics |
Energy Logistics |
Intermodal | Shared Services |
Total | ||||||||||||||||
| Operating Revenues: |
||||||||||||||||||||
| Transportation |
$ | 483,272 | $ | 154,282 | $ | 79,941 | $ | — | $ | 717,495 | ||||||||||
| Service revenue |
71,803 | 8,867 | 54,846 | 1,136 | 136,652 | |||||||||||||||
| Fuel surcharge |
113,348 | 4,333 | 19,930 | — | 137,611 | |||||||||||||||
|
|
|
|
|
|
|
|
|
|
|
|||||||||||
| Total operating revenue |
668,423 | 167,482 | 154,717 | 1,136 | 991,758 | |||||||||||||||
|
|
|
|
|
|
|
|
|
|
|
|||||||||||
| Segment revenue % of total revenue |
67.4 | % | 16.9 | % | 15.6 | % | 0.1 | % | 100.0 | % | ||||||||||
| Segment operating income (loss) |
79,905 | 9,044 | 25,785 | (44,468 | ) | 70,266 | ||||||||||||||
| Depreciation and amortization |
9,654 | 8,351 | 3,349 | 263 | 21,617 | |||||||||||||||
| (Gain) loss on disposal of property and equipment |
(4,791 | ) | 3,035 | (35 | ) | (790 | ) | (2,581 | ) | |||||||||||
|
|
|
|
|
|
|
|
|
|
|
|||||||||||
| Operating income (loss) |
$ | 75,042 | $ | (2,342 | ) | $ | 22,471 | $ | (43,941 | ) | $ | 51,230 | ||||||||
|
|
|
|
|
|
|
|
|
|
|
|||||||||||
| Year Ended December 31, 2013 | ||||||||||||||||||||
| Chemical Logistics |
Energy Logistics |
Intermodal | Shared Services |
Total | ||||||||||||||||
| Operating Revenues: |
||||||||||||||||||||
| Transportation |
$ | 442,164 | $ | 160,614 | $ | 72,316 | $ | — | $ | 675,094 | ||||||||||
| Service revenue |
68,029 | 10,617 | 50,489 | 630 | 129,765 | |||||||||||||||
| Fuel surcharge |
106,845 | 273 | 17,833 | — | 124,951 | |||||||||||||||
|
|
|
|
|
|
|
|
|
|
|
|||||||||||
| Total operating revenue |
617,038 | 171,504 | 140,638 | 630 | 929,810 | |||||||||||||||
|
|
|
|
|
|
|
|
|
|
|
|||||||||||
| Segment revenue % of total revenue |
66. 4 | % | 18.4 | % | 15.1 | % | 0.1 | % | 100.0 | % | ||||||||||
| Segment operating income (loss) |
80,146 | 10,634 | 23,174 | (41,751 | ) | 72,203 | ||||||||||||||
| Depreciation and amortization |
11,147 | 11,173 | 3,322 | 479 | 26,121 | |||||||||||||||
| Impairment charges (1) |
— | 91,296 | — | — | 91,296 | |||||||||||||||
| (Gain) loss on disposal of property and equipment |
(4,234 | ) | 4,809 | (161 | ) | (2,864 | ) | (2,450 | ) | |||||||||||
|
|
|
|
|
|
|
|
|
|
|
|||||||||||
| Operating income (loss) |
$ | 73,233 | $ | (96,644 | ) | $ | 20,013 | $ | (39,366 | ) | $ | (42,764 | ) | |||||||
|
|
|
|
|
|
|
|
|
|
|
|||||||||||
| Year Ended December 31, 2012 | ||||||||||||||||||||
| Chemical Logistics |
Energy Logistics |
Intermodal | Shared Services |
Total | ||||||||||||||||
| Operating Revenues: |
||||||||||||||||||||
| Transportation |
$ | 423,077 | $ | 105,679 | $ | 68,650 | $ | — | $ | 597,406 | ||||||||||
| Service revenue |
67,097 | 8,461 | 45,008 | 535 | 121,101 | |||||||||||||||
| Fuel surcharge |
105,767 | 926 | 16,918 | — | 123,611 | |||||||||||||||
|
|
|
|
|
|
|
|
|
|
|
|||||||||||
| Total operating revenue |
595,941 | 115,066 | 130,576 | 535 | 842,118 | |||||||||||||||
|
|
|
|
|
|
|
|
|
|
|
|||||||||||
| Segment revenue % of total revenue |
70.7 | % | 13.7 | % | 15.5 | % | 0.1 | % | 100.0 | % | ||||||||||
| Segment operating income (loss) |
83,069 | 12,177 | 19,259 | (45,260 | ) | 69,245 | ||||||||||||||
| Depreciation and amortization |
10,803 | 6,310 | 3,487 | 490 | 21,090 | |||||||||||||||
| (Gain) loss on disposal of property and equipment |
(1,327 | ) | 391 | (52 | ) | — | (988 | ) | ||||||||||||
|
|
|
|
|
|
|
|
|
|
|
|||||||||||
| Operating income (loss) |
$ | 73,593 | $ | 5,476 | $ | 15,824 | $ | (45,750 | ) | $ | 49,143 | |||||||||
|
|
|
|
|
|
|
|
|
|
|
|||||||||||
| 2014 vs 2013 |
Chemical Logistics |
Energy Logistics |
Intermodal | Shared Services |
Total | |||||||||||||||||
| Segment operating revenues |
$ change | $ | 51,385 | $ | (4,022 | ) | $ | 14,079 | $ | 506 | $ | 61,948 | ||||||||||
| % change | 8.3 | % | (2.3 | )% | 10.0 | % | 80.3 | % | 6.7 | % | ||||||||||||
| Segment operating revenues (excluding fuel surcharge) |
$ change | $ | 44,882 | $ | (8,082 | ) | $ | 11,982 | $ | 506 | $ | 49,288 | ||||||||||
| % change | 8.8 | % | (4.7 | )% | 9.8 | % | 80.3 | % | 6.1 | % | ||||||||||||
| Segment operating (loss) income |
$ change | $ | (241 | ) | $ | (1,590 | ) | $ | 2,611 | $ | (2,717 | ) | $ | (1,937 | ) | |||||||
| % change | (0.3 | )% | (15.0 | )% | 11.3 | % | (6.5 | )% | (2.7 | )% | ||||||||||||
45
Table of Contents
| 2013 vs 2012 |
Chemical Logistics |
Energy Logistics |
Intermodal | Shared Services |
Total | |||||||||||||||||
| Segment operating revenues |
$ change | $ | 21,097 | $ | 56,438 | $ | 10,062 | $ | 95 | $ | 87,692 | |||||||||||
| % change | 3.5 | % | 49.0 | % | 7.7 | % | 17.8 | % | 10.4 | % | ||||||||||||
| Segment operating revenues (excluding fuel surcharge) |
$ change | $ | 20,019 | $ | 57,091 | $ | 9,147 | $ | 95 | $ | 86,352 | |||||||||||
| % change | 4.1 | % | 50.0 | % | 8.0 | % | 17.8 | % | 12.0 | % | ||||||||||||
| Segment operating (loss) income |
$ change | $ | (2,923 | ) | $ | (1,543 | ) | $ | 3,915 | $ | 3,509 | $ | 2,958 | |||||||||
| % change | (3.5 | )% | (12.7 | )% | 20.3 | % | 7.8 | % | 4.3 | % | ||||||||||||
| (1) | Includes impairment charges of $72.8 million of goodwill and $18.5 million of intangible assets related to our energy logistics segment. |
Year Ended December 31, 2014 Compared to Year Ended December 31, 2013
Operating revenue:
Chemical Logistics—revenues increased $51.4 million, or 8.3%, for the year ended December 31, 2014 primarily due to an increase in transportation revenue of $41.1 million, resulting from increased prices and higher volumes, benefits from a dry bulk business acquired by an independent affiliate in late March 2014, and new terminal locations established during 2014. In addition, fuel surcharge revenue increased $6.5 million and service revenue increased $3.8 million due to higher equipment rental revenue. Driver counts were higher in 2014 due to continued aggressive focus on recruiting and retention, and new terminal locations in 2014.
Energy Logistics—revenues decreased $4.0 million, or 2.3%, for the year ended December 31, 2014 primarily due to lower transportation revenues of $6.3 million. This decline was primarily due to reductions in the Bakken and Oklahoma shale regions and, to a lesser extent, decreases in the Marcellus shale region. These decreases were offset in part by increased oil hauling activity in the Eagle Ford and Permian Basin shale regions, as well as increased revenue from newer markets such as Wyoming and Colorado. Fuel surcharge revenue increased $4.1 million due to more fuel surcharge programs being put in place with some of our energy customers, and service revenue declined $1.8 million primarily due to lower disposal well volumes, partially offset by increased equipment rental income.
Intermodal—revenues increased $14.1 million, or 10.0%, for the year ended December 31, 2014 due to increases in transportation revenue of $7.6 million, resulting from higher import and export shipments due to strong international customer demand and an increase in fuel surcharge revenue of $2.1 million. Other service revenue increased $4.4 million due to higher depot service revenues driven by increased import volumes. Demand for ISO container shipments continues to be favorable.
Operating income:
Chemical Logistics—operating income decreased $0.2 million, or 0.3%, for the year ended December 31, 2014 primarily due to incentives provided to an independent affiliate that acquired a business in late March 2014 and new start-up terminal locations established by our independent affiliates during 2014. Additionally, the first quarter of 2014 was impacted by adverse weather conditions and insurance costs were higher in 2014.
Energy Logistics—operating income decreased $1.6 million, or 15.0%, for the year ended December 31, 2014 due to operating losses from our company-operated Jourdanton, Texas terminal and to incentives provided to terminals which converted from company-operated to independent affiliate-operated in 2013. In the first quarter of 2015, we affiliated our Jourdanton, Texas terminal and expect to see improved operating results as a result of this conversion. These operating losses were offset in part by increased operating results in our Marcellus and Bakken shale regions, due to lower operating costs and better asset utilization.
Intermodal —operating income increased $2.6 million, or 11.3%, for the year ended December 31, 2014 due to higher trucking volumes and higher depot service revenues, partially offset by higher maintenance costs and adverse weather conditions in the first quarter of 2014 which impacted the segment’s three largest terminals.
Shared Services—net expenses increased $2.7 million, or 6.5%, for the year ended December 31, 2014 due primarily to increased expenses from driver recruiting and retention efforts and performance-based incentive compensation.
46
Table of Contents
Year Ended December 31, 2013 Compared to Year Ended December 31, 2012
Comparability for the year ended December 31, 2013 to the year ended December 31, 2012 is affected by the 2012 Energy Acquisitions which are included in our energy logistics segment.
Operating revenue:
Chemical Logistics—revenues increased $21.1 million, or 3.5%, for the year ended December 31, 2013 primarily due to an increase in transportation revenue of $19.1 million which was driven by increased pricing and higher volumes. Chemical logistics shipment demand continues to be strong with a favorable pricing environment. We had an increase of $1.1 million in fuel surcharge revenue due to higher transportation revenue and an increase in service revenue of $0.9 million due primarily to increased trailer rent. Driver counts were slightly higher in 2013 due to continued aggressive focus on recruiting and retention.
Energy Logistics—revenues increased $56.4 million, or 49.0%, for the year ended December 31, 2013 due to a full year of our 2012 Energy Acquisitions, increased revenue driven by organic oil business growth in our Eagle Ford shale region and the on-boarding of our new Marcellus independent affiliate. These increases were partially offset by reduced new drilling activity in the Bakken shale region which resulted in a decline in fresh and disposal water transportation revenues and a slowdown in production water hauling volumes in the Eagle Ford shale region.
Intermodal —revenues increased $10.1 million, or 7.7%, for the year ended December 31, 2013 due to continued strong demand for ISO container shipments which led to increases in trucking volumes and a stable to upward environment for pricing. Revenue also increased due to stronger storage, rental and service revenue.
Segment operating income:
Chemical Logistics—operating income decreased $2.9 million, or 3.5%, for the year ended December 31, 2013 primarily due to higher equipment lease expense, higher medical claims and incremental depreciation expense from the independent affiliate asset acquisition in the fourth quarter of 2012. The company-operated terminals we took over from the independent affiliate conversion in the third quarter of 2013 negatively impacted our margins during 2013.
Energy Logistics—operating income decreased $1.5 million, or 12.7%, for the year ended December 31, 2013 primarily due to reduced profitability within the Bakken shale region, lower margins on fresh water business in the Eagle Ford shale region, costs associated with the reorganization of this segment including severance and lease termination costs, reduced asset utilization in Oklahoma, and high equipment repositioning costs. This decrease was partially offset by a full year of our 2012 Energy Acquisitions, the affiliation of our Marcellus shale business and improved results from crude oil hauling in the Eagle Ford shale region. In December 2013, we affiliated our Woodford shale operations.
Intermodal —operating income increased $3.9 million, or 20.3%, for the year ended December 31, 2013 due primarily to increased storage and service revenues which carry higher margins, improved profitability in our Northeast region and the non-recurrence of steep equipment repair costs which impacted the prior-year period.
Shared Services—net expense decreased $3.5 million, or 7.8%, primarily due to a reduction in professional fees related to the 2012 Energy Acquisitions.
EXCHANGE RATES
We operate primarily in the United States but also have operations in Canada and Mexico. Our results of operations are affected by the relative strength of currencies in the countries where we operate. Approximately 4.1%, 4.1% and 4.7% of our revenue in 2014, 2013 and 2012, respectively, was generated outside the United States.
In comparing the average exchange rates between 2014 and 2013, the Canadian dollar fell against the United States dollar by approximately 6.7%. The change in exchange rates negatively impacted revenue by approximately $2.9 million and had a corresponding positive impact on purchased transportation of approximately $2.4 million in 2014. The depreciation of the Canadian dollar was the primary reason for the $0.2 million net decrease in cumulative currency translation loss in shareholders’ deficit for 2014.
Gains and losses included in the consolidated statements of operations from foreign currency transactions included a $0.4 million loss in 2014, a $0.3 million loss in 2013, and a less than $0.1 million gain in 2012. Risks associated with foreign currency fluctuations are discussed further in Item 7A. “Quantitative and Qualitative Disclosures about Market Risk.”
47
Table of Contents
LIQUIDITY AND CAPITAL RESOURCES
Our primary cash needs consist of debt service, working capital, capital expenditures and share repurchases. Our working capital needs depend upon the timing of our collections from customers and payments to others, as well as our capital and operating lease payment obligations. Our capital expenditures primarily relate to acquiring trailers, and at times tractors, to growing and maintaining the chemical and energy logistics fleet and acquiring tractors, lifts and chassis to support our Intermodal business. We reduce our net capital expenditure requirements for our chemical logistics and energy logistics businesses by utilizing independent affiliates and independent owner-operators.
Independent affiliates and independent owner-operators typically supply their own tractors, which reduces our capital investment requirements. For 2014, capital expenditures were $40.1 million and proceeds from sales of property and equipment were $34.1 million. We generally expect our sustaining capital expenditures, net of proceeds from property and equipment sales, to be approximately 1% to 2% of operating segment revenues annually. We expect net capital expenditures to be approximately $10.0 to $15.0 million for 2015, which is higher than in 2014. Some of our independent affiliates who are engaged with us in the chemical logistics or energy logistics markets may at times purchase some portion of this equipment from us. Actual amounts could differ materially because of operating needs, growth needs, regulatory changes, covenants in our debt arrangements, other expenses or other factors.
Debt service currently consists of required interest payments on the outstanding balance of our ABL Facility, our Term Loan, and our 2018 Notes. In addition, mandatory principal payments under the Term Loan could begin as early as the fourth quarter of 2015. We have no major debt maturities prior to August 2018, when our ABL Facility is presently set to mature. We may from time to time repurchase or redeem additional amounts of our outstanding debt or may repurchase outstanding shares of our common stock. Our Board of Directors has approved a share repurchase program for up to $15.0 million in shares of our common stock, of which $6.5 million remained available at December 31, 2014. Separately, we have a long-term goal to reduce our leverage, lower the outstanding amount of our indebtedness and reduce our interest expense. Any repurchases, redemptions, restructuring or refinancing of our indebtedness would depend upon prevailing market conditions, our liquidity requirements, contractual restrictions and other factors we consider important. Any future repurchases, redemptions, restructuring or refinancing may materially impact our liquidity, future tax liability and results of operations.
Our primary sources of liquidity for operations during the 2014 and 2013 periods have been cash flow from operations and borrowing availability under the ABL Facility. On November 3, 2014, our ABL Facility and the Term Loan under our ABL Facility were amended to extend their maturities and reduce credit spreads. Our total borrowing capacity was not changed. At December 31, 2014, we had $62.0 million of borrowing availability under the ABL Facility. On June 12, 2014, we extinguished the remaining principal balance of the Acquisition Notes of $19.2 million at a discount for $15.0 million in cash. The cash payment on the Acquisition Notes was funded with proceeds from borrowings under our ABL Facility and cash on hand. On July 16, 2014, we redeemed an additional $22.5 million in original principal amount of our 2018 Notes utilizing proceeds from our ABL Facility and cash on hand. On January 15, 2015, we redeemed an additional $10.0 million in original principal amount of our 2018 Notes utilizing proceeds from our ABL Facility and cash on hand.
We believe that, based on current operations and anticipated growth, our cash flow from operations, together with other available sources of liquidity, will be sufficient to fund anticipated capital expenditures, operating expenses and our other anticipated liquidity needs for the next 12 months. Anticipated debt maturities in 2018, the acquisition of other businesses or other events that we do not foresee may require us to seek alternative financing, such as restructuring or refinancing our long-term debt, selling assets or operations or selling additional debt or equity securities. If these alternatives were not available in a timely manner or on satisfactory terms or were not permitted under any of our debt agreements and we default on our obligations, our debt could be accelerated and our assets might not be sufficient to repay in full all of our obligations.
Cash Flows
The following summarizes our cash flows for 2014, 2013 and 2012 as reported in our consolidated statements of cash flows in the accompanying consolidated financial statements:
| Year Ended December 31, | ||||||||||||
| (In Thousands) | 2014 | 2013 | 2012 | |||||||||
| Net cash provided by operating activities |
$ | 34,170 | $ | 45,970 | $ | 17,002 | ||||||
| Net cash used in investing activities |
(12,898 | ) | (3,355 | ) | (131,683 | ) | ||||||
| Net cash (used in) provided by financing activities |
(21,871 | ) | (43,362 | ) | 113,332 | |||||||
|
|
|
|
|
|
|
|||||||
48
Table of Contents
| Year Ended December 31, | ||||||||||||
| (In Thousands) | 2014 | 2013 | 2012 | |||||||||
| Net decrease in cash |
(599 | ) | (747 | ) | (1,349 | ) | ||||||
| Cash and cash equivalents at beginning of period |
1,957 | 2,704 | 4,053 | |||||||||
|
|
|
|
|
|
|
|||||||
| Cash and cash equivalents at end of period |
$ | 1,358 | $ | 1,957 | $ | 2,704 | ||||||
|
|
|
|
|
|
|
|||||||
We generated $34.2 million, $46.0 million and $17.0 million in net cash provided by operating activities in 2014, 2013 and 2012, respectively. In 2014, cash provided by operating activities was primarily due to operating income and was utilized to repay debt and fund capital expenditures. In 2013, cash provided by operating activities was primarily due to operating income excluding non-cash impairment charges and higher net collections of receivables primarily from our energy logistics business compared to 2012. In addition, the increase in other assets in 2013 was lower than in 2012 when we issued $6.3 million in notes to a former independent affiliate. In 2012, cash provided by operating activities was lower than in 2011 primarily due to lower operating income and the 2012 Energy Acquisitions.
Net cash used in investing activities in 2014, 2013 and 2012 was $(12.9) million, $(3.4) million and $(131.7) million, respectively. Capital expenditures totaled $40.1 million, $26.2 million and $32.3 million in 2014, 2013 and 2012, respectively, while proceeds from sales of property and equipment were $34.1 million, $24.7 million and $13.5 million, respectively. In 2014, we used $34.1 million of sales of property and equipment to fund a majority of the $40.1 million of new revenue equipment. In addition, we purchased the assets of an independent affiliate for $6.7 million. In 2013, we used proceeds of $24.7 million from sales of property and equipment to fund a majority of the $26.2 million of new revenue equipment. In addition, we acquired a customer list for $1.0 million and paid $1.0 million of contingent consideration for Trojan. In 2012, the increase in cash used for investing activities was primarily due to the 2012 Energy Acquisitions of $95.2 million, $18.8 million of net capital expenditure to support our energy logistics business growth initiatives and purchase of an independent affiliate’s assets of $17.1 million.
Net cash used in financing activities was $(21.9) million and $(43.4) million in 2014 and 2013, respectively. Net cash provided by financing activities was $113.3 million in 2012. In 2014, we utilized net borrowings of $15.0 million under the ABL Facility, cash from operations and proceeds from the exercise of stock options of $5.0 million to partially redeem $22.5 million of our 2018 Notes, to satisfy the remaining Acquisition Notes for $15.0 million in cash, to purchase revenue equipment, to pay down $4.1 million of other debt and capital lease obligations, and to fund share repurchases of $0.4 million. In 2013, we received proceeds of $17.5 million from the Term Loan which was utilized towards the partial redemption of $22.5 million of our 2018 Notes. In addition, cash flow from operations, proceeds from property and equipment sales and proceeds from the exercise of stock options of $1.6 million enabled us to pay down $25.2 million of the ABL Facility. We also paid down $9.0 million of other debt and capital lease obligations, funded share repurchases of $4.5 million and paid $1.0 million of financing costs associated with our Term Loan and ABL Facility amendment in 2013. In 2012, increased net borrowings of $95.7 million under our ABL Facility and net cash received from our equity offering of approximately $30.5 million was utilized to fund the 2012 Energy Acquisitions, pay down $8.5 million of other debt and capital lease obligations, fund share repurchases of $3.7 million and pay financing fees of $1.0 million in connection with our ABL Facility and its amendment in 2012.
Off-Balance Sheet Arrangements
We guarantee total remaining lease payment obligations aggregating approximately $37.9 million as of December 31, 2014, of certain independent owner-operators and independent affiliates for their tractors to certain third-party vendors. The guarantees expire at various dates beginning in 2015 to 2021 and would require us to make lease payments in the event of a default by an independent owner-operator or independent affiliate. Further, upon a default, we are likely to take actions to reduce or recoup our expenditures, including purchasing the tractor and reselling it to recover all or a portion of the amounts paid, or facilitating an arrangement between the third-party vendor and another independent owner-operator to assume the lease. In addition, up to 50% of any realized losses related to independent owner-operators managed by independent affiliates could be recouped from those independent affiliates. We believe our potential exposure is substantially less than $37.9 million and would not have a material adverse effect on our consolidated financial position, results of operations or cash flows.
Contractual Obligations
The following is a schedule of our long-term contractual commitments, including the current portion of our long-term indebtedness at December 31, 2014, over the periods we expect them to be paid (in thousands):
49
Table of Contents
| TOTAL | Year 2015 |
Years 2016 & 2017 |
Years 2018 & 2019 |
The Five Years after 2019 |
||||||||||||||||
| Operating leases (1) |
$ | 97,824 | $ | 26,276 | $ | 49,549 | $ | 18,060 | $ | 3,939 | ||||||||||
| Total indebtedness (2)(3) |
351,466 | 2,700 | 17,766 | 331,000 | — | |||||||||||||||
| Capital leases |
516 | 334 | 182 | — | — | |||||||||||||||
| Interest on indebtedness (4) |
84,545 | 22,659 | 44,565 | 17,321 | — | |||||||||||||||
|
|
|
|
|
|
|
|
|
|
|
|||||||||||
| Total contractual cash obligations (5) (6) (7) (8) (9) |
$ | 534,351 | $ | 51,969 | $ | 112,062 | $ | 366,381 | $ | 3,939 | ||||||||||
|
|
|
|
|
|
|
|
|
|
|
|||||||||||
| (1) | These obligations represent the minimum rental commitments under all non-cancelable operating leases including the guaranteed residual values at the end of the leases. Commitments also include the operating lease for our corporate headquarters. We expect that some of our operating lease obligations for tractors and trailers will be partially offset by rental revenue from subleasing the tractors to independent affiliates and independent owner-operators and subleasing trailers to independent affiliates. |
| (2) | Includes aggregate unamortized discount of $0.7 million related to the 2018 Notes. |
| (3) | Assumes repayment of the principal amount of the Term Loan in equal quarterly amounts beginning the second quarter of 2016. |
| (4) | Amounts presented for interest payments assume that all long-term debt obligations outstanding as of December 31, 2014 will remain outstanding until maturity, and interest rates on variable-rate debt in effect as of December 31, 2014 will remain in effect until maturity. |
50
Table of Contents
| (5) | Excludes long-term pension obligations as we are unable to reasonably estimate the ultimate amount or timing of settlement of such obligations. As of December 31, 2014, obligations of $16.4 million were reflected in the Consolidated Balance Sheet. This amount represented our unfunded status of such plans, which is the difference between our projected benefit obligation and the fair value of plan assets, as of such date. |
| (6) | Excludes liabilities associated with environmental matters as we are unable to reasonably estimate the ultimate amount or timing of settlement of such liabilities. Liabilities of $8.2 million, which represent our reserves for environmental compliance and remediation, were reflected in the Consolidated Balance Sheet as of December 31, 2014. See Note 20 of the Notes to Consolidated Financial Statements. |
| (7) | Excludes accrued loss and damage claims as we are unable to reasonably estimate the ultimate amount or timing of settlement of such claims. As of December 31, 2014, accrued loss and damage claims of $19.3 million, which represented the balance of our reserves for such liabilities, were reflected in the Consolidated Balance Sheet. |
| (8) | Excludes liabilities associated with uncertain tax positions as we are unable to reasonably estimate the ultimate amount or timing of settlement of such positions. See Note 15 of the Notes to Consolidated Financial Statements. |
| (9) | Excludes potential liabilities associated with our guarantees on leases aggregating approximately $37.9 million as of December 31, 2014 of certain independent owner-operators and independent affiliates because we are unable to reasonably estimate our probable exposure to loss. See Note 21 of the Notes to Consolidated Financial Statements. |
Long-term Debt
Long-term debt consisted of the following (in thousands):
| December 31, 2014 |
December 31, 2013 |
|||||||
| Capital lease obligations |
$ | 516 | $ | 4,883 | ||||
| ABL Facility |
151,000 | 136,000 | ||||||
| Term Loan |
17,500 | 17,500 | ||||||
| 9.875% Second-Priority Senior Secured Notes, due 2018 |
180,000 | 202,500 | ||||||
| 5% Subordinated Acquisition Notes |
— | 19,170 | ||||||
| Other Notes |
2,966 | 4,209 | ||||||
|
|
|
|
|
|||||
| Long-term debt, including current maturities |
351,982 | 384,262 | ||||||
| Discount on Notes |
(687 | ) | (957 | ) | ||||
|
|
|
|
|
|||||
| Total indebtedness (including capital lease obligations) |
351,295 | 383,305 | ||||||
| Less current maturities of long-term debt (including capital lease obligations) |
(3,033 | ) | (10,580 | ) | ||||
|
|
|
|
|
|||||
| Long-term debt, less current maturities (including capital lease obligations) |
$ | 348,262 | $ | 372,725 | ||||
|
|
|
|
|
|||||
Debt Retirement
The following is a schedule of our indebtedness at December 31, 2014 over the periods we are required to pay such indebtedness (in thousands):
| 2015 | 2016 | 2017 | 2018 | 2019 | Thereafter | Total | ||||||||||||||||||||||
| Capital lease obligations |
$ | 334 | $ | 106 | $ | 76 | $ | — | $ | — | $ | — | $ | 516 | ||||||||||||||
| ABL Facility |
— | — | — | 151,000 | — | — | 151,000 | |||||||||||||||||||||
| Term Loan (1) |
— | 10,500 | 7,000 | — | — | — | 17,500 | |||||||||||||||||||||
| 9.875% Second-Priority Senior Secured Notes, due 2018 (2) |
— | — | — | 180,000 | — | — | 180,000 | |||||||||||||||||||||
| Other notes |
2,700 | 266 | — | — | — | — | 2,966 | |||||||||||||||||||||
|
|
|
|
|
|
|
|
|
|
|
|
|
|
|
|||||||||||||||
| Total |
$ | 3,034 | $ | 10,872 | $ | 7,076 | $ | 331,000 | $ | — | $ | — | $ | 351,982 | ||||||||||||||
|
|
|
|
|
|
|
|
|
|
|
|
|
|
|
|||||||||||||||
| (1) | Assumes repayment of the principal amount of the Term Loan in equal quarterly amounts beginning the second quarter of 2016. |
| (2) | Amounts do not include the remaining unamortized original issue discount of $0.7 million related to the 2018 Notes. |
51
Table of Contents
The following is a schedule of our debt issuance costs (in thousands) for the year ended December 31:
| December 31, 2013 |
Write-off of Debt Issuance Costs |
Additional Debt Issuance Costs |
2014 Amortization Expense |
December 31, 2014 |
||||||||||||||||
| ABL Facility |
$ | 3,745 | $ | (54 | ) | $ | 4 | $ | (1,323 | ) | $ | 2,372 | ||||||||
| Term Loan |
490 | — | — | (189 | ) | 301 | ||||||||||||||
| 2014 Amendment of ABL Facility |
— | — | 1,957 | (62 | ) | 1,895 | ||||||||||||||
| 9.875% Second-Priority Senior Secured Notes, due 2018 |
3,447 | (340 | ) | 652 | (677 | ) | 3,082 | |||||||||||||
|
|
|
|
|
|
|
|
|
|
|
|||||||||||
| Total |
$ | 7,682 | (394 | ) | $ | 2,613 | $ | (2,251 | ) | $ | 7,650 | |||||||||
|
|
|
|
|
|
|
|
|
|
|
|||||||||||
Amortization expense of deferred issuance costs was $2.3 million, $2.4 million, and $2.1 million for the years ending December 31, 2014, 2013 and 2012, respectively, and is included in interest expense. We are amortizing these costs over the term of the debt instruments.
The ABL Facility
Amended and Restated ABL Facility and Term Loan
On November 3, 2014, the ABL Facility and the Term Loan were amended and restated. Total borrowing capacity under the ABL Facility and the Term Loan remain at $350.0 million and $17.5 million, respectively. Obligations under the Term Loan will mature on the earlier of November 2017 and the maturity of obligations under the ABL Facility. Obligations under the ABL Facility mature on the earlier of November 2019 and the date that is 91 days prior to the maturity of the Company’s 2018 Notes or replacement notes if the amount of the debt is above a certain threshold. Borrowing availability under the revolving credit facility was expanded to include additional eligible accounts receivable, and the credit spreads under both the ABL Facility and the Term Loan were reduced.
Accounting Treatment for Amended and Restated ABL Facility and Term Loan
The amendment and restatement of the ABL Facility was treated as a debt modification in accordance with FASB guidance. Under applicable FASB guidance, we compared the product of the remaining term multiplied by the maximum borrowing capacity of our previous ABL Facility to the maximum borrowing capacity of the new arrangement on a creditor-by-creditor basis to determine the accounting treatment. For each creditor, if the borrowing capacity of the new arrangement is greater than or equal to the maximum borrowing capacity of the old arrangement, then the exchange of arrangements is classified as a modification, and, if not, the exchange is classified as an extinguishment in proportion to the percentage of the decrease. If the exchange is classified as a modification, then any unamortized debt issuance costs relating to our previous ABL Facility are allocated to the amended and restated ABL Facility and amortized over the term of the ABL Facility using the effective interest method. Furthermore, if the exchange is classified as an extinguishment, then any unamortized debt issuance costs relating to our previous ABL Facility would be written off in proportion to the decrease in maximum borrowing capacity of the amended and restated ABL Facility. Upon the amendment and restatement of the ABL Facility, the remaining unamortized debt issuance costs and the new debt issuance costs of $1.9 million will be amortized over the term of the amended and restated ABL Facility.
Revolving Credit Facility
Our ABL Facility provides for a revolving credit facility that had a maturity of August 2018 as of December 31, 2014. The ABL Facility includes borrowing capacity of up to $150.0 million for letters of credit and up to $30.0 million for swingline borrowings on same-day notice. The ABL Facility is available for working capital needs and general corporate purposes, including permitted acquisitions. At December 31, 2014, we had $62.0 million of borrowing availability under the ABL Facility.
Borrowings under the revolving credit facility bear interest at a rate equal to an applicable margin plus, at our option, either a base rate or LIBOR. The applicable margin at December 31, 2014 was 1.00% for base rate borrowings and 2.00% for LIBOR borrowings. The applicable margin for borrowings will be reduced or increased based on aggregate borrowing base availability under the ABL Facility and may be further reduced in the event that our aggregate borrowing base availability and our fixed charge coverage ratio as calculated under the ABL Facility exceed a target level. The base rate is equal to the highest of the prime rate, the federal funds overnight rate plus 0.50% and 30-day LIBOR plus 1.00%. In addition to paying interest on outstanding principal under the ABL Facility, we are required to pay an unutilized commitment fee to the lenders quarterly at a rate ranging from 0.25% to 0.375%,
52
Table of Contents
depending on the average utilization of the ABL Facility. We also pay customary letter of credit fees quarterly. We may voluntarily repay outstanding borrowings under the revolving credit facility of the ABL Facility at any time without premium or penalty, other than customary “breakage” costs with respect to LIBOR loans. The interest rate on borrowings under the revolving credit facility at December 31, 2014 and December 31, 2013 was 2.2% in both periods.
The borrowing base for the ABL Facility consists of eligible accounts receivable, inventory, tractor and trailer equipment, real property and certain other equipment.
We recorded $6.9 million in debt issuance costs relating to the ABL Facility. We are amortizing the debt issuance costs over the remaining term of the ABL Facility. The September 2012 amendment to our ABL Facility was treated as a modification under FASB guidance.
Term Loan Facility
On June 14, 2013, our ABL Facility was amended to provide for a new $17.5 million senior secured term loan facility which was fully funded on July 15, 2013. Borrowings under the Term Loan bear interest at a rate equal to an applicable margin plus, at our option, either a base rate or LIBOR. The applicable margin at December 31, 2014 was 2.00% for base rate borrowings and 3.00% for LIBOR borrowings, with a potential step-down of 0.25% after 3 months from inception if a senior secured leverage ratio is met. As of December 31, 2014, obligations under the Term Loan mature November 2017. Following the amendment and restatement of our Term Loan in November 2014, we are subject to mandatory repayment of the principal amount of the Term Loan in equal quarterly payments beginning no earlier than the 12-month anniversary of the amendment and restatement and no later than the 24-month anniversary of the amendment and restatement. As of December 31, 2014, we estimated that repayments would begin in the second quarter of 2016. We may voluntarily repay the outstanding amount under the Term Loan at any time without premium or penalty, other than customary “breakage” costs with respect to the LIBOR loans. As of December 31, 2014, the balance of the Term Loan was $17.5 million. The interest rate on borrowings under the Term Loan at December 31, 2014 and December 31, 2013 was 3.2% and 3.7%, respectively.
We recorded $0.6 million in debt issuance costs relating to the Term Loan, and we are amortizing the debt issuance costs over the term of the Term Loan.
9.875% Second-Priority Senior Secured Notes Due 2018
On November 3, 2010, we issued $225.0 million aggregate principal amount of the 2018 Notes. With the proceeds of the issuance of the 2018 Notes, we repaid and redeemed certain of our previously outstanding notes and paid down a portion of our outstanding borrowings under the predecessor facility to the ABL Facility. We recorded $6.0 million in debt issuance costs relating to the 2018 Notes, of which $5.8 million was related to the new issuance and $0.2 million of unamortized debt issuance costs related to our 10% Senior Notes due 2013 which are no longer outstanding. We are amortizing these costs over the term of the 2018 Notes. Interest on the 2018 Notes is payable at a rate of 9.875% per annum, semiannually on May 1 and November 1 of each year. The payment obligations of QD LLC and QD Capital under the 2018 Notes are guaranteed by QDI and by all of its 100%-owned domestic subsidiaries other than immaterial subsidiaries. The 2018 Notes are senior obligations of QD LLC and QD Capital and are secured by a second-priority lien on certain assets. Pursuant to an intercreditor agreement, the liens on the collateral securing the 2018 Notes rank junior in right of payment to the ABL Facility, including the Term Loan, and obligations under certain hedging agreements, cash management obligations and certain other first-lien obligations.
The 2018 Notes mature on November 1, 2018. Since November 1, 2014, we may redeem the 2018 Notes, in whole or in part, at the following prices (expressed as a percentage of principal amount), plus accrued and unpaid interest to the redemption date, if redeemed during the 12-month period commencing on November 1 of the years set forth below:
| Period |
Redemption Price |
|||
| 2014 |
104.938 | % | ||
| 2015 |
102.469 | % | ||
| 2016 and thereafter |
100.000 | % | ||
Prior to November 1, 2014, redemption of the 2018 Notes was permitted, in whole or in part, at a price equal to 100% of the principal amount of the 2018 Notes redeemed, plus accrued and unpaid interest to the redemption date, plus an additional “make-whole premium” intended to capture the value of holding the 2018 Notes through November 1, 2014, but not less than 1%. During any twelve-month period prior to November 1, 2014, redemption was permitted up to 10% of the original aggregate principal amount of the 2018 Notes at a redemption price of 103%, plus accrued and unpaid interest to the redemption date.
53
Table of Contents
On July 15, 2013, we redeemed a portion of the 2018 Notes in the aggregate principal amount of $22.5 million for a redemption price equal to 100% of the aggregate principal amount of $22.5 million, plus accrued but unpaid interest up to the redemption date, plus a 3.0% premium of $0.7 million. On July 16, 2014, we redeemed another portion of the 2018 Notes in the aggregate principal amount of $22.5 million. The redemption price for these 2018 Notes equaled 100% of the aggregate principal amount of $22.5 million, plus accrued but unpaid interest up to the redemption date, plus a 3.0% premium of $0.7 million. In the third quarters of 2014 and 2013, $0.4 million and $0.5 million, respectively, of unamortized debt issuance costs related to these redemptions were written off.
On January 15, 2015, we redeemed another portion of the 2018 Notes in the aggregate principal amount of $10.0 million. The redemption price for these 2018 Notes equaled 100% of the aggregate principal amount of $10.0 million, plus accrued but unpaid interest up to the redemption date, plus a 4.9% premium of $0.5 million. In the first quarter of 2015, $0.2 million of unamortized debt issuance costs related to this redemption will be written off.
5% Subordinated Acquisition Notes
As part of the consideration we paid for a 2012 acquisition, we issued the Acquisition Notes. The Acquisition Notes contained a fixed interest rate of 5.0% per annum, had a maturity date of June 1, 2017 and were unsecured and subordinated. On November 12, 2013, we made optional principal payments of $2.1 million. On June 12, 2014, we extinguished the remaining principal balance of the Acquisition Notes of $19.2 million at a discount for a cash payment of $15.0 million. As a result of this transaction, we recognized a gain on extinguishment of debt of $4.2 million during 2014. The cash payment on the Acquisition Notes was funded with proceeds from borrowings under our ABL Facility and cash on hand.
Collateral, Guarantees and Covenants
The ABL Facility contains a fixed charge coverage ratio which only needs to be met if borrowing availability is less than the greater of $20.0 million and 10% of our borrowing base. The ABL Facility contains a number of covenants that, among other things, restrict, subject to certain exceptions: (i) our ability to sell assets; (ii) incur additional indebtedness; (iii) prepay other indebtedness, including the 2018 Notes; (iv) pay dividends and distributions or repurchase QDI’s capital stock; (v) create liens on assets; (vi) make investments; (vii) make certain acquisitions; (viii) engage in mergers or consolidations; (ix) engage in certain transactions with affiliates; (x) amend certain charter documents and material agreements governing subordinated indebtedness, including the 2018 Notes; (xi) change our business; and (xii) enter into agreements that restrict dividends from QD LLC’s subsidiaries. The ABL Facility also contains certain customary affirmative covenants and events of default.
The indenture governing the 2018 Notes contains covenants that restrict, subject to certain exceptions, our ability to, among other things: (i) incur additional debt or issue certain preferred shares; (ii) pay dividends on or make other distributions in respect of QDI’s common stock or make other restricted payments; (iii) make certain investments; (iv) sell certain assets; (v) create or permit to exist dividend and/or payment restrictions affecting restricted subsidiaries; (vi) create liens on certain assets to secure debt; (vii) consolidate, merge, sell or otherwise dispose of all or substantially all assets; (viii) enter into certain transactions with affiliates; and (ix) designate subsidiaries as unrestricted subsidiaries. The indenture also provides certain customary events of default, which, if any of them occurs, may result in the principal, interest and any other monetary obligations on the then outstanding 2018 Notes becoming payable immediately.
The payment obligations under the ABL Facility, including the Term Loan, are senior secured obligations of QD LLC and QD Capital and are secured by a first-priority lien on certain assets and guaranteed by QDI and by all of its domestic restricted subsidiaries other than immaterial subsidiaries. The payment obligations of QD LLC and QD Capital under the 2018 Notes are guaranteed by QDI and by all of its domestic subsidiaries other than immaterial subsidiaries. The 2018 Notes, and the guarantees thereof, are senior obligations of QD LLC and QD Capital and are secured by a second-priority lien on certain assets. Pursuant to an intercreditor agreement, the liens on the collateral securing the 2018 Notes rank junior in right of payment to the ABL Facility, including the Term Loan, and obligations under certain hedging agreements, cash management obligations and certain other first-lien obligations. We were in compliance with the covenants under the ABL Facility, including the Term Loan, and the 2018 Notes, at December 31, 2014.
Other Liabilities and Obligations
As of December 31, 2014, we had $23.3 million in outstanding letters of credit issued under the ABL Facility that may be drawn by third parties to satisfy some of the obligations described above and certain other obligations. We are required to provide letters of credit to our insurance administrator to support our claims paying capability. The letter of credit issued to our insurance administrator had a maximum draw amount of $19.0 million as of December 31, 2014. If we fail to meet certain terms of our agreement, the insurance administrator may draw down the entire letter of credit. The remaining $4.3 million of outstanding letters of credit as of December 31, 2014 relates to various other obligations.
54
Table of Contents
Our obligations for environmental matters, accrued loss and damage claims and long-term pension obligations are considered within “Contractual Obligations.” Our obligations for certain lease guarantees are considered within “Off-Balance Sheet Arrangements.”
Other Issues
While uncertainties relating to environmental, labor and other regulatory matters exist within the trucking industry, management is not aware of any trends or events likely to have a material adverse effect on liquidity or the accompanying consolidated financial statements. Our credit ratings are affected by many factors, including our financial results, operating cash flows and total indebtedness.
The ABL Facility and the indentures governing the 2018 Notes contain certain limitations on QD LLC’s ability to make distributions to QDI. We do not consider these restrictions to be significant, because QDI is a holding company with no significant operations or assets, other than ownership of 100% of QD LLC’s membership units. QD LLC’s direct and indirect wholly-owned subsidiaries are generally permitted to make distributions to QD LLC, which is the principal obligor under the ABL Facility and the 2018 Notes.
| ITEM 7A. | QUANTITATIVE AND QUALITATIVE DISCLOSURES ABOUT MARKET RISK |
We are subject to market risks from (i) interest rates due to our variable interest rate indebtedness, (ii) foreign currency fluctuations due to our international operations and (iii) increased commodity prices due to the diesel consumption necessary for our operations. During the last three years, we have not held derivative instruments or engaged in other hedging transactions to reduce our exposure to such risks.
Interest Rate Risk
We are exposed to the impact of interest rate changes through our variable-rate borrowings under the ABL Facility. With regard to the revolving credit facility of the ABL Facility, borrowings under the revolving credit facility bear interest at a rate equal to an applicable margin plus, at QD LLC’s option, either a base rate or LIBOR. The applicable margin for borrowings at December 31, 2014 was 1.00% with respect to base rate borrowings and 2.00% with respect to LIBOR borrowings. The applicable margin for such borrowings will be reduced or increased based on aggregate borrowing base availability under the ABL Facility and may be further reduced in the event that our aggregate borrowing base availability and our fixed charge coverage ratio as calculated under the ABL Facility exceed a target level. The base rate under the ABL Facility is equal to the highest of the prime rate, the federal funds overnight rate plus .50%, and 30-day LIBOR plus 1.00%. With respect to the Term Loan, at December 31, 2014, the applicable margin for borrowings is 2.00% for base rate borrowings and 3.00% for LIBOR borrowings, with a potential step-down of 0.25% after 3 months from inception if a senior secured leverage ratio is met.
| Balance at December 31, 2014 ($ in 000s) |
Interest Rate at December 31, 2014 |
Effect of 1% Increase ($ in 000s) |
||||||||||
| ABL Facility |
$ | 151,000 | 2.2 | % | $ | 1,510 | ||||||
| Term Loan |
17,500 | 3.2 | % | 175 | ||||||||
|
|
|
|
|
|||||||||
| Total |
$ | 168,500 | $ | 1,685 | ||||||||
|
|
|
|
|
|||||||||
At December 31, 2014, a 1% increase in the current per annum interest rate would result in $1.7 million of additional interest expense during the next 12 months. The foregoing calculation assumes an instantaneous 1% increase in the rates under the ABL Facility and that the principal amount under both the revolving credit facility and the Term Loan is the amount outstanding as of December 31, 2014. The calculation therefore does not account for the differences in the market rates upon which the interest rates of our indebtedness are based, our option to elect the lowest of three different interest rates under our borrowings or other possible actions, such as prepayment, that we might take in response to any rate increase.
55
Table of Contents
Foreign Currency Exchange Rate Risk
Operating in international markets involves exposure to the possibility of volatile movements in foreign exchange rates. The currencies in each of the countries in which we operate affect:
| • | the results of our international operations reported in United States dollars; and |
| • | the value of the net assets of our international operations reported in United States dollars. |
These exposures may impact future earnings or cash flows. Revenue from foreign locations (Canada and Mexico) represented approximately 4.1% of our consolidated revenue in 2014, 4.1% of our consolidated revenue in 2013 and 4.7% of our consolidated revenue in 2012. The economic impact of foreign exchange rate movements is complex because such changes are often linked to variability in real growth, inflation, interest rates, governmental actions and other factors. These changes, if material, could cause us to adjust our financing and operating strategies. Therefore, to isolate the effect of changes in currency does not accurately portray the effect of these other important economic factors. As foreign exchange rates change, translation of the income statements of our international subsidiaries into U.S. dollars affects year-over-year comparability of operating results. While we may hedge specific transaction risks, we generally do not hedge translation risks because we believe there is no long-term economic benefit in doing so.
Assets and liabilities for our Canadian operations are matched in the local currency, which reduces the need for dollar conversion. Our Mexican operations use the United States dollar as their functional currency. Any foreign currency impact on translating assets and liabilities into dollars is included as a component of shareholders’ deficit. Our revenue results for 2014 were negatively impacted by approximately $2.9 million and we had a corresponding positive impact on purchased transportation of approximately $2.4 million from foreign currency movement, primarily due to the weakening of the Canadian dollar against the United States dollar.
Changes in foreign exchange rates that had the largest impact on translating our international operating profits for 2014 related to the Canadian dollar versus the United States dollar. We estimate that a 1% adverse change in the Canadian dollar foreign exchange rate would have decreased our revenues by approximately $0.4 million in 2014, assuming no changes other than the exchange rate itself. Our intercompany loans are subject to fluctuations in exchange rates primarily between the United States dollar and the Canadian dollar. Based on the outstanding balance of our intercompany loans at December 31, 2014, a change of 1% in the exchange rate for the Canadian dollar would cause a change in our foreign exchange result of less than $0.1 million.
Commodity Price Risk
We have a large number of customers in the chemical processing, oil, gas, and consumer goods industries. If these customers experience fluctuations in their business activity due to commodity price changes or other industry conditions, their demand for our transportation, depot and other services may decrease. Demand from our chemical logistics and intermodal customers may be affected by their use or production of bulk chemicals and the prices for these chemicals. In addition, natural gas and oil production and drilling is affected by the market prices for those commodities. Demand for our energy logistics services relating to production and drilling activities may be more volatile in response to natural gas and oil price changes than demand for our services relating to post-production activities.
| ITEM 8. | FINANCIAL STATEMENTS AND SUPPLEMENTARY DATA |
Financial statements and exhibits filed under this item are listed in the index appearing in Item 15 of this report.
| ITEM 9. | CHANGES IN AND DISAGREEMENTS WITH ACCOUNTANTS ON ACCOUNTING AND FINANCIAL DISCLOSURE |
None.
| ITEM 9A. | CONTROLS AND PROCEDURES |
Attached as exhibits to this Form 10-K are certifications of our Chief Executive Officer and Chief Financial Officer, which are required in accordance with Rule 13a-14 of the Securities Exchange Act. This “Controls and Procedures” section includes information concerning the controls and controls evaluation referred to in the certifications.
Evaluation of Disclosure Controls and Procedures
As required by Exchange Act Rules 13a-15(b) and 15d-15(b), management has evaluated, with the participation of our Chief Executive Officer and Chief Financial Officer, the effectiveness of our disclosure controls and procedures as of the end of the period covered by this report. Based on their evaluation, management concluded our disclosure controls and procedures (as defined in Securities Exchange Act Rules 13a-15(e) and 15d-15(e)) were effective as of December 31, 2014 to ensure that information required to be disclosed by us in reports that we file or submit under the Securities Exchange Act is recorded, processed, summarized and reported within the time periods specified in Securities and Exchange Commission rules and forms and were effective as of December 31, 2014 to ensure that information required
56
Table of Contents
to be disclosed by us in the reports that we file or submit under the Securities Exchange Act is accumulated and communicated to management, including our Chief Executive Officer and Chief Financial Officer, or persons performing similar functions, as appropriate, to allow timely decisions regarding required disclosure.
Management’s Report on Internal Control over Financial Reporting
Management is responsible for establishing and maintaining adequate internal control over financial reporting, as such term is defined in Exchange Act Rules 13a-15(e) and 15d-15(e). Our internal control over financial reporting is a process designed under the supervision of the Chief Executive Officer and Chief Financial Officer and effected by the Board of Directors and management, to provide reasonable assurance regarding the reliability of financial reporting and the preparation of consolidated financial statements for external purposes in accordance with accounting principles generally accepted in the United States of America. Our internal control over financial reporting includes those policies and procedures that (i) pertain to the maintenance of records that, in reasonable detail, accurately and fairly reflect the transactions and dispositions of the assets of the company; (ii) provide reasonable assurance that transactions are recorded as necessary to permit preparation of financial statements in accordance with generally accepted accounting principles, and that receipts and expenditures of the company are being made only in accordance with authorizations of management and directors of the company; and (iii) provide reasonable assurance regarding prevention or timely detection of unauthorized acquisition, use, or disposition of the company’s assets that could have a material effect on the financial statements.
Because of its inherent limitations, internal control over financial reporting may not prevent or detect misstatements. Also, projections of any evaluation of effectiveness to future periods are subject to the risk that controls may become inadequate because of changes in conditions, or that the degree of compliance with the policies or procedures may deteriorate.
Management has assessed the effectiveness of our internal control over financial reporting as of December 31, 2014, using the criteria established in Internal Control—Integrated Framework (2013) issued by the Committee of Sponsoring Organizations of the Treadway Commission. Based on that assessment and those criteria, management has determined that our internal control over financial reporting was effective as of December 31, 2014.
PricewaterhouseCoopers LLP, our independent registered certified public accounting firm, has audited the effectiveness of the Company’s internal controls over financial reporting as of December 31, 2014, as stated in their report which is included herein.
Changes in Internal Control over Financial Reporting
There were no changes in our internal control over financial reporting during the quarter ended December 31, 2014 that have materially affected, or are reasonably likely to materially affect, our internal control over financial reporting.
| ITEM 9B. | OTHER INFORMATION |
Not applicable
| ITEM 10. | DIRECTORS, EXECUTIVE OFFICERS AND CORPORATE GOVERNANCE |
Information with respect to the directors, the Audit Committee of the Board of Directors, the Nomination Committee of the Board of Directors (known as the Corporate Governance Committee), and the Audit Committee financial expert, will be contained in our 2015 Proxy Statement. The 2015 Proxy Statement is expected to be filed on or about April 25, 2015. Such information is incorporated herein by reference.
Information with respect to our executive officers is located in Part I, Item 5 of this report.
Code of Ethics
We have adopted a Code of Conduct, which is applicable to all of our directors and employees, including our principal executive officer, our principal financial officer and our controller. A copy of the Code of Conduct can be found on our website at www.qualitydistribution.com. Any possible future amendments to or waivers from the Code of Conduct will be posted on our website.
57
Table of Contents
Section 16(a) Beneficial Ownership Reporting Compliance
Information regarding compliance with Section 16(a) of the Exchange Act set forth under the heading “Section 16(a) Beneficial Ownership Reporting Compliance” will be in our 2015 Proxy Statement and is incorporated herein by reference.
| ITEM 11. | EXECUTIVE COMPENSATION |
For information regarding our Executive Compensation, Compensation Committee Interlocks and Insider Participation, and our Compensation Committee Report, we direct you to the section entitled “Executive Compensation” that will be in the 2015 Proxy Statement. We are incorporating the information contained in that section of our Proxy Statement here by reference.
| ITEM 12. | SECURITY OWNERSHIP OF CERTAIN BENEFICIAL OWNERS AND MANAGEMENT AND RELATED SHAREHOLDER MATTERS |
Information regarding the security ownership of certain beneficial owners and management and related shareholder matters and equity compensation plans will be set forth under the heading “Security Ownership of Certain Beneficial Owners and Management and Related Shareholder Matters” in our 2015 Proxy Statement and is incorporated herein by reference.
| ITEM 13. | CERTAIN RELATIONSHIPS AND RELATED TRANSACTIONS AND DIRECTOR INDEPENDENCE |
The information required by this item will be incorporated by reference from our 2015 Proxy Statement under the headings “Certain Relationships and Related Party Transactions” and “Corporate Governance.”
| ITEM 14. | PRINCIPAL ACCOUNTANT FEES AND SERVICES |
The information appearing in our 2015 Proxy Statement under the headings “Report of the Audit Committee of the Board of Directors,” “Appointment of the Independent Registered Certified Public Accounting Firm” and “Fees Paid to the Independent Registered Certified Public Accounting Firm in 2014 and 2013” is incorporated by reference.
| ITEM 15. | EXHIBITS AND FINANCIAL STATEMENT SCHEDULES |
(a) The documents filed as part of this report are as follows:
1. The consolidated financial statements and accompanying report of independent registered certified public accountants are listed in the Index to Financial Statements and are filed as part of this report.
All consolidated financial statement schedules are omitted because they are inapplicable, not required or the information is included elsewhere in the consolidated financial statements or the notes thereto.
2. Exhibits required by Item 601 of Regulation S-K are submitted as a separate section herein immediately following the “Exhibit Index.”
(b) Other Exhibits
No exhibits in addition to those previously filed or listed in item 15(a) (2) and filed herein.
(c) Not Applicable
58
Table of Contents
SIGNATURES
Pursuant to the requirements of Section 13 or 15(d) of the Securities Exchange Act of 1934, the registrant has duly caused this report to be signed on its behalf by the undersigned, thereunto duly authorized.
| QUALITY DISTRIBUTION, INC. | ||||||
| March 13, 2015 | /s/ GARY R. ENZOR | |||||
| GARY R. ENZOR | ||||||
| CHAIRMAN AND CHIEF EXECUTIVE OFFICER | ||||||
| (DULY AUTHORIZED OFFICER) | ||||||
Pursuant to the requirements of the Securities Exchange Act of 1934, this report has been signed below by the following persons on behalf of the Registrant and in the capacities and on the dates indicated.
| DATE |
SIGNATURE |
TITLE | ||
| March 13, 2015 |
/s/ Gary R. Enzor Gary R. Enzor |
Chairman of the Board and Chief Executive Officer (Principal Executive Officer) | ||
| March 13, 2015 |
/s/ Joseph J. Troy Joseph J. Troy |
Executive Vice President and Chief Financial Officer (Principal Financial and Accounting Officer) | ||
| March 13, 2015 |
/s/ Alan H. Schumacher Alan H. Schumacher |
Lead Independent Director | ||
| March 13, 2015 |
/s/ Richard B. Marchese Richard B. Marchese |
Director | ||
| March 13, 2015 |
/s/ Thomas R. Miklich Thomas R. Miklich |
Director | ||
| March 13, 2015 | /s/ Annette M. Sandberg Annette M. Sandberg |
Director | ||
59
Table of Contents
QUALITY DISTRIBUTION, INC. AND SUBSIDIARIES
INDEX TO CONSOLIDATED FINANCIAL STATEMENTS
Table of Contents
Report of Independent Registered Certified Public Accounting Firm
To Board of Directors and Shareholders of Quality Distribution, Inc.
In our opinion, the accompanying consolidated balance sheets and the related consolidated statements of operations, of comprehensive (loss) income, of shareholders’ deficit, and of cash flows present fairly, in all material respects, the financial position of Quality Distribution, Inc. and its subsidiaries (the “Company”) at December 31, 2014 and December 31, 2013, and the results of their operations and their cash flows for each of the three years in the period ended December 31, 2014 in conformity with accounting principles generally accepted in the United States of America. Also in our opinion, the Company maintained, in all material respects, effective internal control over financial reporting as of December 31, 2014, based on criteria established in Internal Control - Integrated Framework (2013) issued by the Committee of Sponsoring Organizations of the Treadway Commission (COSO). The Company’s management is responsible for these financial statements, for maintaining effective internal control over financial reporting and for its assessment of the effectiveness of internal control over financial reporting, included in Management’s Report on Internal Control over Financial Reporting appearing under Item 9A. Our responsibility is to express opinions on these financial statements and on the Company’s internal control over financial reporting based on our integrated audits. We conducted our audits in accordance with the standards of the Public Company Accounting Oversight Board (United States). Those standards require that we plan and perform the audits to obtain reasonable assurance about whether the financial statements are free of material misstatement and whether effective internal control over financial reporting was maintained in all material respects. Our audits of the financial statements included examining, on a test basis, evidence supporting the amounts and disclosures in the financial statements, assessing the accounting principles used and significant estimates made by management, and evaluating the overall financial statement presentation. Our audit of internal control over financial reporting included obtaining an understanding of internal control over financial reporting, assessing the risk that a material weakness exists, and testing and evaluating the design and operating effectiveness of internal control based on the assessed risk. Our audits also included performing such other procedures as we considered necessary in the circumstances. We believe that our audits provide a reasonable basis for our opinions.
A company’s internal control over financial reporting is a process designed to provide reasonable assurance regarding the reliability of financial reporting and the preparation of financial statements for external purposes in accordance with generally accepted accounting principles. A company’s internal control over financial reporting includes those policies and procedures that (i) pertain to the maintenance of records that, in reasonable detail, accurately and fairly reflect the transactions and dispositions of the assets of the company; (ii) provide reasonable assurance that transactions are recorded as necessary to permit preparation of financial statements in accordance with generally accepted accounting principles, and that receipts and expenditures of the company are being made only in accordance with authorizations of management and directors of the company; and (iii) provide reasonable assurance regarding prevention or timely detection of unauthorized acquisition, use, or disposition of the company’s assets that could have a material effect on the financial statements.
Because of its inherent limitations, internal control over financial reporting may not prevent or detect misstatements. Also, projections of any evaluation of effectiveness to future periods are subject to the risk that controls may become inadequate because of changes in conditions, or that the degree of compliance with the policies or procedures may deteriorate.
| /s/ PricewaterhouseCoopers LLP |
| Tampa, Florida |
| March 13, 2015 |
F-1
Table of Contents
QUALITY DISTRIBUTION, INC. AND SUBSIDIARIES
CONSOLIDATED STATEMENTS OF OPERATIONS
For the Years Ended December 31, 2014, 2013 and 2012
(In thousands, Except Per Share Data)
| Years ended December 31, | ||||||||||||
| 2014 | 2013 | 2012 | ||||||||||
| OPERATING REVENUES: |
||||||||||||
| Transportation |
$ | 717,495 | $ | 675,094 | $ | 597,406 | ||||||
| Service revenue |
136,652 | 129,765 | 121,101 | |||||||||
| Fuel surcharge |
137,611 | 124,951 | 123,611 | |||||||||
|
|
|
|
|
|
|
|||||||
| Total operating revenues |
991,758 | 929,810 | 842,118 | |||||||||
|
|
|
|
|
|
|
|||||||
| OPERATING EXPENSES: |
||||||||||||
| Purchased transportation |
667,799 | 594,708 | 552,524 | |||||||||
| Compensation |
92,435 | 98,681 | 82,143 | |||||||||
| Fuel, supplies and maintenance |
99,985 | 105,917 | 82,033 | |||||||||
| Depreciation and amortization |
21,617 | 26,121 | 21,090 | |||||||||
| Selling and administrative |
32,795 | 31,534 | 33,882 | |||||||||
| Insurance costs |
21,070 | 19,169 | 15,830 | |||||||||
| Taxes and licenses |
3,536 | 3,758 | 2,825 | |||||||||
| Communication and utilities |
3,872 | 3,840 | 3,636 | |||||||||
| Gain on disposal of property and equipment |
(2,581 | ) | (2,450 | ) | (988 | ) | ||||||
| Impairment charges |
— | 91,296 | — | |||||||||
|
|
|
|
|
|
|
|||||||
| Total operating expenses |
940,528 | 972,574 | 792,975 | |||||||||
|
|
|
|
|
|
|
|||||||
| Operating income (loss) |
51,230 | (42,764 | ) | 49,143 | ||||||||
| Interest expense |
28,562 | 31,147 | 30,089 | |||||||||
| Interest income |
(496 | ) | (855 | ) | (831 | ) | ||||||
| Gain on extinguishment of debt |
(4,217 | ) | — | — | ||||||||
| Write-off of debt issuance costs |
476 | 521 | — | |||||||||
| Other income, net |
(144 | ) | (7,256 | ) | (2,864 | ) | ||||||
|
|
|
|
|
|
|
|||||||
| Income (loss) before income taxes |
27,049 | (66,321 | ) | 22,749 | ||||||||
| Provision for (benefit from) income taxes |
6,409 | (24,283 | ) | (27,327 | ) | |||||||
|
|
|
|
|
|
|
|||||||
| Net income (loss) |
$ | 20,640 | $ | (42,038 | ) | $ | 50,076 | |||||
|
|
|
|
|
|
|
|||||||
| PER SHARE DATA: |
||||||||||||
| Net income (loss) per common share |
||||||||||||
| Basic |
$ | 0.75 | $ | (1.58 | ) | $ | 1.89 | |||||
|
|
|
|
|
|
|
|||||||
| Diluted |
$ | 0.74 | $ | (1.58 | ) | $ | 1.84 | |||||
|
|
|
|
|
|
|
|||||||
| Weighted-average number of shares |
||||||||||||
| Basic |
27,539 | 26,560 | 26,502 | |||||||||
|
|
|
|
|
|
|
|||||||
| Diluted |
28,077 | 26,560 | 27,207 | |||||||||
|
|
|
|
|
|
|
|||||||
The accompanying notes are an integral part of these consolidated financial statements.
F-2
Table of Contents
QUALITY DISTRIBUTION, INC. AND SUBSIDIARIES
CONSOLIDATED STATEMENTS OF COMPREHENSIVE INCOME (LOSS)
For the Years Ended December 31, 2014, 2013 and 2012
(In thousands)
| Years ended December 31, | ||||||||||||
| 2014 | 2013 | 2012 | ||||||||||
| Net income (loss) |
$ | 20,640 | $ | (42,038 | ) | $ | 50,076 | |||||
|
|
|
|
|
|
|
|||||||
| Other comprehensive income (loss): |
||||||||||||
| Adjustment to pension obligation, net of tax |
(3,758 | ) | 4,156 | (328 | ) | |||||||
| Translation adjustment, net of tax |
230 | 119 | (43 | ) | ||||||||
|
|
|
|
|
|
|
|||||||
| Total other comprehensive income (loss) |
(3,528 | ) | 4,275 | (371 | ) | |||||||
|
|
|
|
|
|
|
|||||||
| Comprehensive income (loss) |
$ | 17,112 | $ | (37,763 | ) | $ | 49,705 | |||||
|
|
|
|
|
|
|
|||||||
The accompanying notes are an integral part of these consolidated financial statements.
F-3
Table of Contents
QUALITY DISTRIBUTION, INC. AND SUBSIDIARIES
CONSOLIDATED BALANCE SHEETS
December 31, 2014 and 2013
(In thousands)
| December 31, 2014 |
December 31, 2013 |
|||||||
| ASSETS |
||||||||
| Current assets: |
||||||||
| Cash and cash equivalents |
$ | 1,358 | $ | 1,957 | ||||
| Accounts receivable, net |
136,790 | 120,932 | ||||||
| Prepaid expenses |
14,118 | 13,401 | ||||||
| Deferred tax asset, net |
29,333 | 20,709 | ||||||
| Other |
10,374 | 9,919 | ||||||
|
|
|
|
|
|||||
| Total current assets |
191,973 | 166,918 | ||||||
| Property and equipment, net |
156,249 | 170,114 | ||||||
| Assets held-for-sale |
2,040 | 1,129 | ||||||
| Goodwill |
34,896 | 32,955 | ||||||
| Intangibles, net |
15,388 | 16,149 | ||||||
| Non-current deferred tax asset, net |
18,942 | 31,401 | ||||||
| Other assets |
8,295 | 8,583 | ||||||
|
|
|
|
|
|||||
| Total assets |
$ | 427,783 | $ | 427,249 | ||||
|
|
|
|
|
|||||
| LIABILITIES AND SHAREHOLDERS’ DEFICIT |
||||||||
| Current liabilities: |
||||||||
| Current maturities of indebtedness |
$ | 2,699 | $ | 8,692 | ||||
| Current maturities of capital lease obligations |
334 | 1,888 | ||||||
| Accounts payable |
12,955 | 10,248 | ||||||
| Independent affiliates and independent owner-operators payable |
15,110 | 14,398 | ||||||
| Accrued expenses |
32,617 | 30,580 | ||||||
| Environmental liabilities |
4,389 | 3,818 | ||||||
| Accrued loss and damage claims |
8,851 | 8,532 | ||||||
|
|
|
|
|
|||||
| Total current liabilities |
76,955 | 78,156 | ||||||
| Long-term indebtedness, less current maturities |
348,080 | 369,730 | ||||||
| Capital lease obligations, less current maturities |
182 | 2,995 | ||||||
| Environmental liabilities |
3,830 | 4,479 | ||||||
| Accrued loss and damage claims |
10,493 | 10,747 | ||||||
| Other non-current liabilities |
19,937 | 17,393 | ||||||
|
|
|
|
|
|||||
| Total liabilities |
459,477 | 483,500 | ||||||
|
|
|
|
|
|||||
| Commitments and contingencies—Note 20 |
||||||||
| SHAREHOLDERS’ DEFICIT |
||||||||
| Common stock, no par value; 49,000 shares authorized; 29,725 issued and 28,027 outstanding at December 31, 2014 and 28,779 issued and 27,203 outstanding at December 31, 2013. |
450,625 | 441,877 | ||||||
| Treasury stock, 1,698 shares at December 31, 2014 and 1,576 shares at December 31, 2013. |
(11,860 | ) | (10,557 | ) | ||||
| Accumulated deficit |
(249,865 | ) | (270,505 | ) | ||||
| Stock recapitalization |
(189,589 | ) | (189,589 | ) | ||||
| Accumulated other comprehensive loss |
(31,005 | ) | (27,477 | ) | ||||
|
|
|
|
|
|||||
| Total shareholders’ deficit |
(31,694 | ) | (56,251 | ) | ||||
|
|
|
|
|
|||||
| Total liabilities and shareholders’ deficit |
$ | 427,783 | $ | 427,249 | ||||
|
|
|
|
|
|||||
The accompanying notes are an integral part of these consolidated financial statements.
F-4
Table of Contents
QUALITY DISTRIBUTION, INC. AND SUBSIDIARIES
CONSOLIDATED STATEMENTS OF SHAREHOLDERS’ DEFICIT
For the Years Ended December 31, 2014, 2013 and 2012 (In thousands)
| Shares of Common Stock |
Shares of Treasury Stock |
Common Stock |
Treasury Stock |
Accumulated Deficit |
Stock Recapitalization |
Accumulated Other Comprehensive Loss |
Stock Purchase Warrants |
Total Shareholders’ Deficit |
||||||||||||||||||||||||||||
| Balance, December 31, 2011 |
24,207 | (267 | ) | $ | 393,859 | $ | (1,878 | ) | $ | (278,543 | ) | $ | (189,589 | ) | $ | (31,381 | ) | $ | 1,347 | $ | (106,185 | ) | ||||||||||||||
| Net income |
— | — | — | — | 50,076 | — | — | — | 50,076 | |||||||||||||||||||||||||||
| Issuance of restricted stock |
182 | — | — | — | — | — | — | — | — | |||||||||||||||||||||||||||
| Forfeiture of restricted stock |
— | (37 | ) | — | (313 | ) | — | — | — | — | (313 | ) | ||||||||||||||||||||||||
| Amortization of restricted stock |
— | — | 1,497 | — | — | — | — | — | 1,497 | |||||||||||||||||||||||||||
| Amortization of stock options |
— | — | 1,741 | — | — | — | — | — | 1,741 | |||||||||||||||||||||||||||
| Stock warrant exercise |
346 | — | 1,322 | — | — | — | — | (1,322 | ) | — | ||||||||||||||||||||||||||
| Stock option exercise |
82 | — | 360 | — | — | — | — | — | 360 | |||||||||||||||||||||||||||
| Proceeds from equity offering, net of transaction costs |
2,500 | — | 30,493 | — | — | — | — | — | 30,493 | |||||||||||||||||||||||||||
| Issuance of stock for acquisitions |
785 | — | 7,920 | — | — | — | — | — | 7,920 | |||||||||||||||||||||||||||
| Purchases of treasury stock |
— | (575 | ) | — | (3,658 | ) | — | — | — | — | (3,658 | ) | ||||||||||||||||||||||||
| Translation adjustment, net of tax |
— | — | — | — | — | — | (43 | ) | — | (43 | ) | |||||||||||||||||||||||||
| Adjustment to pension obligation, net of tax |
— | — | — | — | — | — | (328 | ) | — | (328 | ) | |||||||||||||||||||||||||
|
|
|
|
|
|
|
|
|
|
|
|
|
|
|
|
|
|
|
|||||||||||||||||||
| Balance, December 31, 2012 |
28,102 | (879 | ) | $ | 437,192 | $ | (5,849 | ) | $ | (228,467 | ) | $ | (189,589 | ) | $ | (31,752 | ) | $ | 25 | $ | (18,440 | ) | ||||||||||||||
|
|
|
|
|
|
|
|
|
|
|
|
|
|
|
|
|
|
|
|||||||||||||||||||
| Net loss |
— | — | — | — | (42,038 | ) | — | — | — | (42,038 | ) | |||||||||||||||||||||||||
| Issuance of restricted stock |
257 | — | — | — | — | — | — | — | — | |||||||||||||||||||||||||||
| Forfeiture of restricted stock |
— | (80 | ) | — | (254 | ) | — | — | — | — | (254 | ) | ||||||||||||||||||||||||
| Amortization of restricted stock |
— | — | 1,561 | — | — | — | — | — | 1,561 | |||||||||||||||||||||||||||
| Amortization of stock options |
— | — | 1,533 | — | — | — | — | — | 1,533 | |||||||||||||||||||||||||||
| Stock warrant exercise |
4 | — | 17 | — | — | — | — | (17 | ) | — | ||||||||||||||||||||||||||
| Expiration of warrants |
— | — | — | — | — | — | — | (8 | ) | (8 | ) | |||||||||||||||||||||||||
| Stock option exercise |
416 | — | 1,574 | — | — | — | — | — | 1,574 | |||||||||||||||||||||||||||
| Purchases of treasury stock |
— | (617 | ) | — | (4,454 | ) | — | — | — | — | (4,454 | ) | ||||||||||||||||||||||||
| Translation adjustment, net of tax |
— | — | — | — | — | — | 119 | — | 119 | |||||||||||||||||||||||||||
| Adjustment to pension obligation, net of tax |
— | — | — | — | — | — | 4,156 | — | 4,156 | |||||||||||||||||||||||||||
|
|
|
|
|
|
|
|
|
|
|
|
|
|
|
|
|
|
|
|||||||||||||||||||
| Balance, December 31, 2013 |
28,779 | (1,576 | ) | $ | 441,877 | $ | (10,557 | ) | $ | (270,505 | ) | $ | (189,589 | ) | $ | (27,477 | ) | $ | — | $ | (56,251 | ) | ||||||||||||||
|
|
|
|
|
|
|
|
|
|
|
|
|
|
|
|
|
|
|
|||||||||||||||||||
The accompanying notes are an integral part of these consolidated financial statements.
F-5
Table of Contents
| Shares of Common Stock |
Shares of Treasury Stock |
Common Stock |
Treasury Stock |
Accumulated Deficit |
Stock Recapitalization |
Accumulated Other Comprehensive Loss |
Stock Purchase Warrants |
Total Shareholders’ Deficit |
||||||||||||||||||||||||||||
| Net income |
— | — | — | — | 20,640 | — | — | — | 20,640 | |||||||||||||||||||||||||||
| Issuance of restricted stock |
19 | — | — | — | — | — | — | — | — | |||||||||||||||||||||||||||
| Forfeiture of restricted stock |
— | (56 | ) | — | (472 | ) | — | — | — | — | (472 | ) | ||||||||||||||||||||||||
| Amortization of restricted stock |
— | — | 2,816 | — | — | — | — | — | 2,816 | |||||||||||||||||||||||||||
| Amortization of stock options |
— | — | 946 | — | — | — | — | — | 946 | |||||||||||||||||||||||||||
| Stock option exercises |
927 | (29 | ) | 4,986 | (414 | ) | — | — | — | — | 4,572 | |||||||||||||||||||||||||
| Purchases of treasury stock |
— | (37 | ) | — | (417 | ) | — | — | — | — | (417 | ) | ||||||||||||||||||||||||
| Translation adjustment, net of tax |
— | — | — | — | — | — | 230 | — | 230 | |||||||||||||||||||||||||||
| Adjustment to pension obligation, net of tax |
— | — | — | — | — | — | (3,758 | ) | — | (3,758 | ) | |||||||||||||||||||||||||
|
|
|
|
|
|
|
|
|
|
|
|
|
|
|
|
|
|
|
|||||||||||||||||||
| Balance, December 31, 2014 |
29,725 | (1,698 | ) | $ | 450,625 | $ | (11,860 | ) | $ | (249,865 | ) | $ | (189,589 | ) | $ | (31,005 | ) | $ | — | $ | (31,694 | ) | ||||||||||||||
|
|
|
|
|
|
|
|
|
|
|
|
|
|
|
|
|
|
|
|||||||||||||||||||
The accompanying notes are an integral part of these consolidated financial statements.
F-6
Table of Contents
QUALITY DISTRIBUTION, INC. AND SUBSIDIARIES
CONSOLIDATED STATEMENTS OF CASH FLOWS
For the Years Ended December 31, 2014, 2013 and 2012
(In thousands)
| Years Ended December 31, | ||||||||||||
| 2014 | 2013 | 2012 | ||||||||||
| CASH FLOWS FROM OPERATING ACTIVITIES: |
||||||||||||
| Net income (loss) |
$ | 20,640 | $ | (42,038 | ) | $ | 50,076 | |||||
| Adjustments to reconcile to net cash and cash equivalents provided by operating activities: |
||||||||||||
| Provision for (benefit from) deferred income tax |
10,705 | (26,659 | ) | 7,174 | ||||||||
| Depreciation and amortization |
21,617 | 26,121 | 21,090 | |||||||||
| Bad debt expense (recoveries) |
1,217 | (657 | ) | 120 | ||||||||
| Gain on disposal of property and equipment |
(2,581 | ) | (2,450 | ) | (988 | ) | ||||||
| Impairment charges |
— | 91,296 | — | |||||||||
| Gain on extinguishment of long-term debt |
(4,217 | ) | — | — | ||||||||
| Write-off of deferred financing costs |
394 | 420 | — | |||||||||
| Write-off of bond discount |
82 | 101 | — | |||||||||
| Stock-based compensation |
3,762 | 3,085 | 3,238 | |||||||||
| Amortization of deferred financing costs |
2,251 | 2,398 | 2,133 | |||||||||
| Amortization of bond discount |
189 | 207 | 216 | |||||||||
| Contingent consideration adjustment |
— | (7,800 | ) | (2,651 | ) | |||||||
| (Benefit from) provision for deferred tax asset valuation allowance |
(4,504 | ) | 246 | (35,282 | ) | |||||||
| Changes in assets and liabilities: |
||||||||||||
| Accounts and other receivables |
(14,201 | ) | (5,649 | ) | (24,166 | ) | ||||||
| Prepaid expenses |
4,175 | 4,379 | 727 | |||||||||
| Other assets |
(1,526 | ) | 613 | (5,340 | ) | |||||||
| Accounts payable |
(362 | ) | 570 | 1,964 | ||||||||
| Independent affiliates and independent owner-operators payable |
712 | 155 | 4,448 | |||||||||
| Accrued expenses |
(1,184 | ) | 425 | (508 | ) | |||||||
| Environmental liabilities |
(77 | ) | (744 | ) | (1,059 | ) | ||||||
| Accrued loss and damage claims |
66 | 2,458 | (1,562 | ) | ||||||||
| Other liabilities |
(3,055 | ) | (657 | ) | (1,669 | ) | ||||||
| Current income taxes |
67 | 150 | (959 | ) | ||||||||
|
|
|
|
|
|
|
|||||||
| Net cash provided by operating activities |
34,170 | 45,970 | 17,002 | |||||||||
|
|
|
|
|
|
|
|||||||
| CASH FLOWS FROM INVESTING ACTIVITIES: |
||||||||||||
| Capital expenditures |
(40,140 | ) | (26,177 | ) | (32,317 | ) | ||||||
| Greensville Transport Company purchase price adjustment |
— | — | (566 | ) | ||||||||
| Acquisition of Trojan Vacuum Services |
— | — | (8,657 | ) | ||||||||
| Trojan Vacuum Services purchase price adjustment |
— | (857 | ) | — | ||||||||
| Acquisition of Wylie Bice Trucking and RM Resources |
— | — | (52,176 | ) | ||||||||
| Acquisition of Dunn’s Tank Service and Nassau Disposal |
— | — | (34,321 | ) | ||||||||
| Acquisition of an independent affiliate’s assets |
(6,747 | ) | — | (17,143 | ) | |||||||
| Onboarding payments to independent affiliates |
(125 | ) | (1,000 | ) | — | |||||||
| Proceeds from sales of property and equipment |
34,114 | 24,679 | 13,497 | |||||||||
|
|
|
|
|
|
|
|||||||
| Net cash used in investing activities |
(12,898 | ) | (3,355 | ) | (131,683 | ) | ||||||
|
|
|
|
|
|
|
|||||||
| CASH FLOWS FROM FINANCING ACTIVITIES: |
||||||||||||
| Proceeds from issuance of long-term debt |
— | 17,500 | — | |||||||||
| Principal payments on long-term debt |
(40,923 | ) | (29,235 | ) | (4,754 | ) | ||||||
| Principal payments on capital lease obligations |
(723 | ) | (1,826 | ) | (3,786 | ) | ||||||
| Proceeds from revolver |
356,522 | 236,600 | 236,800 | |||||||||
| Payments on revolver |
(341,522 | ) | (261,800 | ) | (141,100 | ) | ||||||
| Payments on acquisition notes |
(200 | ) | (443 | ) | (465 | ) | ||||||
F-7
Table of Contents
QUALITY DISTRIBUTION, INC. AND SUBSIDIARIES
CONSOLIDATED STATEMENTS OF CASH FLOWS
For the Years Ended December 31, 2014, 2013 and 2012 (continued)
(In thousands)
| Years Ended December 31, | ||||||||||||
| 2014 | 2013 | 2012 | ||||||||||
| Deferred financing costs |
(2,613 | ) | (990 | ) | (989 | ) | ||||||
| Change in bank overdraft |
3,019 | (288 | ) | 431 | ||||||||
| Purchases of treasury stock |
(417 | ) | (4,454 | ) | (3,658 | ) | ||||||
| Proceeds from equity offering, net of transaction costs |
— | — | 30,493 | |||||||||
| Proceeds from exercise of stock options |
4,986 | 1,574 | 360 | |||||||||
|
|
|
|
|
|
|
|||||||
| Net cash (used in) provided by financing activities |
(21,871 | ) | (43,362 | ) | 113,332 | |||||||
|
|
|
|
|
|
|
|||||||
| Net decrease in cash and cash equivalents |
(599 | ) | (747 | ) | (1,349 | ) | ||||||
| Cash and cash equivalents, beginning of year |
1,957 | 2,704 | 4,053 | |||||||||
|
|
|
|
|
|
|
|||||||
| Cash and cash equivalents, end of year |
$ | 1,358 | $ | 1,957 | $ | 2,704 | ||||||
|
|
|
|
|
|
|
|||||||
| SUPPLEMENTAL DISCLOSURE OF CASH FLOW INFORMATION |
||||||||||||
| Cash paid during the year for: |
||||||||||||
| Interest |
$ | 26,017 | $ | 28,725 | $ | 27,409 | ||||||
|
|
|
|
|
|
|
|||||||
| Income taxes |
813 | 694 | 1,538 | |||||||||
|
|
|
|
|
|
|
|||||||
| SUPPLEMENTAL DISCLOSURES OF NON-CASH FLOW INFORMATION: |
||||||||||||
| Minimum pension liability accrual, net of tax |
$ | (7,388 | ) | $ | 5,233 | $ | 1,989 | |||||
|
|
|
|
|
|
|
|||||||
| Original and amended capital lease obligations and lease residual guarantees |
2,734 | 3,349 | 7,688 | |||||||||
|
|
|
|
|
|
|
|||||||
| Notes payable for purchase of business assets or acquisitions |
— | — | 21,300 | |||||||||
|
|
|
|
|
|
|
|||||||
| Notes payable—insurance fundings |
2,227 | 2,242 | 2,011 | |||||||||
|
|
|
|
|
|
|
|||||||
| Dunn’s Tank Service and Nassau Disposal purchase price adjustment |
— | 1,430 | — | |||||||||
|
|
|
|
|
|
|
|||||||
| Earnouts related to acquisitions |
— | — | 11,533 | |||||||||
|
|
|
|
|
|
|
|||||||
| Stock issuance related to acquisitions |
— | — | 7,920 | |||||||||
|
|
|
|
|
|
|
|||||||
The accompanying notes are an integral part of these consolidated financial statements.
F-8
Table of Contents
QUALITY DISTRIBUTION, INC. AND SUBSIDIARIES
Notes to Consolidated Financial Statements
For the Years Ended December 31, 2014, 2013 and 2012
1. BUSINESS ORGANIZATION
Quality Distribution, Inc. (the “Company”, “QDI”, or “we”) and its subsidiaries are engaged primarily in transportation of bulk chemicals in North America. We are the largest provider of intermodal ISO tank container and depot services in North America through our wholly-owned subsidiary, Boasso America Corporation (“Boasso”). In 2011, we entered the unconventional oil and gas (“UCO&G”) market, providing logistics and transportation services to this market, including the transportation of crude oil, fresh water and production fluids, through our wholly-owned subsidiaries, QC Energy Resources, Inc. and QC Environmental Services, Inc., collectively (“QCER”). We conduct a significant portion of our business through a network of independent affiliates and independent owner-operators. Independent affiliates are companies which enter into various term contracts with the Company. Independent affiliates are responsible for paying for their own revenue equipment (including debt service), fuel and other operating costs. Most of the independent affiliates lease trailers from us. Independent owner-operators are independent contractors who, through a contract with us, supply one or more tractors and drivers for our use. Contracts with independent owner-operators may be terminated by either party on short notice. We charge independent affiliates and third parties for the use of tractors and trailers as necessary. In exchange for the services rendered, independent affiliates and independent owner-operators are normally paid a percentage of the revenues collected on each load hauled.
2. SIGNIFICANT ACCOUNTING POLICIES
Basis of Presentation
These consolidated financial statements have been prepared in accordance with accounting principles generally accepted in the United States using U.S. dollars as the reporting currency as the majority of our business is in the U.S. The consolidated financial statements include the accounts of QDI and its subsidiaries. All significant intercompany accounts and transactions have been eliminated in consolidation.
Cash and Cash Equivalents
We consider all highly liquid investments with original maturities of three months or less to be cash equivalents. Bank overdrafts are included in accounts payable.
Reclassification
Certain prior-period amounts have been reclassified amongst operating expense line items to conform to the current-year presentation.
Allowance for Uncollectible Receivables
We have established a reserve for uncollectible receivables based on a combination of historical data, cash payment trends, specific customer issues, write-off trends, general economic conditions and other factors. We charge uncollectible amounts to our allowance based on various issues, including cash payment trends and specific customer issues. These factors are continuously monitored by our management to arrive at the estimate for the amount of accounts receivable that may ultimately be uncollectible. The receivables analyzed include trade receivables, as well as loans and advances made to independent affiliates and independent owner-operators.
Tires
We capitalize the cost of tires mounted on tractors and trailers that we acquire as a part of the total equipment cost and depreciate the cost over the useful life of the related equipment. Subsequent replacement tires are expensed at the time those tires are placed in service similar to other repairs and maintenance costs.
F-9
Table of Contents
Property and equipment
Property and equipment expenditures, including tractor and trailer rebuilds that extend the useful lives of such equipment, are capitalized and recorded at cost. For financial statement purposes, these assets are depreciated using the straight-line method over the estimated useful lives of the assets to an estimated salvage value.
The asset lives used are presented in the following table:
| Average Lives (in years) | ||
| Buildings and improvements |
10 - 25 | |
| Tractors and terminal equipment |
5 - 7 | |
| Trailers and chassis |
15 - 20 | |
| Energy logistics equipment |
4 - 15 | |
| Disposal wells |
5 - 15 | |
| Furniture and fixtures |
3 - 5 | |
| Other equipment |
3 - 10 |
Building improvements are recorded at the shorter of the lease term or useful life. Tractor and trailer rebuilds, which are recurring in nature and extend the lives of the related assets, are capitalized and depreciated over the period of extension, generally 3 to 10 years, based on the type and extent of these rebuilds. Maintenance and repairs are charged directly to expense as incurred. Management estimates the useful lives of these assets based on historical trends and the age of the assets when placed in service. Any changes in the actual lives could result in material changes in the net book value of these assets. Additionally, we estimate the salvage values of these assets based on historical sales or disposals, and any changes in the actual salvage values could also affect the net book value of these assets.
Furthermore, we evaluate the recoverability of our long-lived assets whenever adverse events or changes in the business climate indicate that the expected undiscounted future cash flows from the related asset may be less than previously anticipated. If the net book value of the related asset exceeds the undiscounted future cash flows of the asset, the carrying amount would be reduced to the present value of its expected future cash flows and an impairment loss would be recognized. This analysis requires us to make significant estimates and assumptions in projecting future cash flows, and changes in facts and circumstances could result in material changes in the amount of any write-offs for impairment.
Assets held-for-sale
We review our fleet requirements to determine if any of our revenue generating equipment should be classified as held-for-sale when certain criteria are met. These criteria include, whether the asset is available for sale in its present condition, whether we are actively looking for a buyer at a price that approximates the asset’s fair value and evaluating whether a sale of the asset within one year is probable. Further, we suspend the depreciation for assets which are classified as held-for-sale.
Goodwill
Goodwill represents the excess of the purchase price over the net amount of identifiable assets acquired and liabilities assumed in a business combination measured at fair value. We evaluate goodwill and indefinite-lived intangible assets for impairment at least annually during the second quarter with a measurement date of June 30, and more frequently if indicators of impairment, often referred to as “triggering events,” arise, in accordance with Financial Accounting Standards Board (“FASB”) guidance. Impairment of goodwill is tested at the reporting unit level. A reporting unit is an operating segment or one level below an operating segment (referred to as a ‘component’). We have determined that our reporting units for which goodwill has been allocated are equivalent to our operating segments, as all of the components of each segment meet the criteria for aggregation.
When testing goodwill for impairment, we have the option to first assess qualitative factors to determine whether the existence of events or circumstances leads to a determination that it is more likely than not that the estimated fair value of a reporting unit is less than its carrying amount. If we elect to perform a qualitative assessment and determine that an impairment is more likely than not, we are then required to perform the two-step quantitative impairment test, otherwise, no further analysis is required. Under the qualitative assessment, we considered various qualitative factors, including macroeconomic conditions, relevant industry and market trends, cost factors, overall financial performance, other entity-specific events and events affecting the reporting unit that could indicate a potential change in the fair value of our reporting unit or the composition of its carrying values. We also considered the specific future outlook for the reporting unit based on our most recent forecasts.
F-10
Table of Contents
We also may elect not to perform the qualitative assessment and, instead, proceed directly to the two-step quantitative impairment test. In the first step of the quantitative impairment test, the fair value of a reporting unit is compared to its carrying value, including goodwill. If the carrying value of a reporting unit, including goodwill, exceeds its fair value, the second step of the impairment test is performed for purposes of measuring the impairment. In the second step, the fair value of the reporting unit is allocated to all of the assets and liabilities of the reporting unit to determine an implied goodwill value. This allocation is similar to a purchase price allocation. If the carrying amount of the reporting unit’s goodwill exceeds the implied fair value of goodwill, an impairment loss will be recognized in an amount equal to that excess.
We estimate the fair value for each reporting unit considering three basic valuation approaches (i) the cost approach, based on the cost to reproduce assets; (ii) the market approach, which considers market exchange for comparable assets; and (iii) the income approach, which relies on capitalization of potential future income.
The cost approach is a valuation methodology that develops value estimates of the underlying assets and liabilities of a business enterprise (values are based on a range, from orderly liquidation to forced liquidation, depending on how quickly a company’s assets and liabilities could be liquidated). The liabilities are subtracted from the assets to derive a value for the business enterprise.
The market approach is a valuation methodology in which the market value of the enterprise is estimated based on public market prices and actual transactions. The methodology consists of undertaking a detailed market analysis of publicly traded companies within our industry (guideline company method) and/or acquisitions of companies/assets in our industry (guideline transactions method) that provides a reasonable basis for comparison to the relevant investment characteristics of the respective reporting units. Valuation ratios and multiples derived from the guideline company and guideline transactions methods are then selected and applied to the reporting unit after consideration of adjustments for dissimilarities in financial position, growth, markets, profitability, risk and other factors.
We derive a market value of invested capital or business enterprise value for each comparable company by multiplying the current price per share of common stock of the publicly traded companies by their total common shares outstanding and adding each company’s current level of debt. We calculate a business enterprise valuation multiple based on revenue and earnings from each company, then apply those multiples to each of our reporting unit’s revenue and earnings to conclude a reporting unit’s business enterprise value. Assumptions regarding the selection of comparable companies are made based on, among other factors, capital structure, operating environment and industry. As the comparable companies are typically larger and more diversified than our reporting units, multiples are adjusted prior to application to our reporting units’ revenues and earnings to reflect differences in margins, long-term growth prospects and market capitalization.
The income approach is based on the present value of expected future cash flows over a 5-year period utilizing a discount rate generally equivalent to the estimated market-based weighted average cost of capital (“WACC”) determined separately for each reporting unit. To estimate the present value of the estimated cash flows that extend beyond the final year of the discounted cash flow model, we employ a terminal value technique, whereby we use estimated operating cash flows minus capital expenditures and adjust for changes in working capital requirements in the final year of the model, then discount this amount by the WACC to establish the terminal value. The determination of fair value using the income approach requires judgment and involves the use of significant estimates and assumptions about expected future cash flows derived from internal forecasts and the impact of market conditions on those assumptions. Critical assumptions primarily include economic growth, industry expansion, future operations which drive our revenue and margin assumptions and the discount rate.
The use of more than one approach is desirable because it provides a balanced valuation. In some cases, all three approaches are applicable. However, normally one or two approaches are utilized. Weights given to each approach vary directly with the amount of information available and the relative quality of that information. Available information and business fundamentals dictate which approach or approaches are employed to value a reporting unit. Refer to Critical Accounting Policies and Estimates under Item 7 – Management’s Discussion and Analysis of Financial Condition and Results of Operations for further detail.
Intangible Assets
In 2014, our intangible assets included a tradename, customer relationships and non-compete agreements. We performed our annual impairment test in the second quarter for the indefinite-lived intangible assets related to a tradename in the intermodal reporting unit. We conducted our analysis under the revised intangibles – goodwill and other impairment rules – in which we qualitatively assessed whether it was more likely than not that the respective fair value of this indefinite-lived asset was less than its carrying amount. We considered various qualitative factors, including macroeconomic conditions, relevant industry and market trends, cost factors, overall financial performance, other entity-specific events and events that could indicate a potential change in the fair value of indefinite-lived assets or the composition of their carrying values. The indefinite-lived tradename was tested for impairment by using the income approach, specifically the relief-from-royalty method. This approach is based on the assumption that in lieu of ownership, a company would be willing to pay a royalty in order to utilize the related benefits of this intangible asset.
F-11
Table of Contents
The Company tests intangible assets for impairment when certain triggering events or circumstances indicate that their carrying value may be impaired. Triggering events are assessed on an intangible by intangible basis and, if identified, the specific asset or assets are valued and compared to their carrying value. If the carrying value exceeds the projected discounted cash flows attributed to the indefinite-lived intangible asset, the carrying value is no longer considered recoverable and the Company will record an impairment charge. The customer relationships are valued using the income approach, specifically the excess earnings method. The excess earnings analysis consists of discounting to present value the projected cash flows attributable to the customer relationships, with consideration given to cost savings, customer attrition, the importance, or lack thereof, of existing customer relationships to our business plan, income taxes and required growth rates.
Other Assets—Deferred Loan Costs
Costs incurred to issue debt are deferred and amortized as a component of interest expense over the estimated term of the related debt using the straight-line method, which approximates the effective interest method.
Taxation
We use the asset and liability method of accounting for income taxes. If, on the basis of available evidence, it is more likely than not that all or a portion of the deferred tax asset will not be realized, the asset must be reduced by a valuation allowance. Any change in the actual future results of operations could impact the valuation of the net deferred tax asset.
During 2012, we recorded a deferred tax benefit of $28.1 million of which $35.3 related to a prior-year valuation allowance release. These releases of the valuation allowance are a result of our consistent cumulative income position, improved operating results, and recent expansion of our energy business through acquisition. Our assessment of the recoverability of the deferred tax assets primarily relied on the positive evidence related to our cumulative income position. We have determined that it is more likely than not that expected future taxable income will be sufficient to utilize substantially all of our U.S. federal and state net deferred tax assets.
We account for uncertain tax positions using a two-step process. The first step is to evaluate the tax position for recognition by determining if the weight of available evidence indicates that it is more likely than not that the position will be sustained on audit, including resolution of related appeals or litigation processes, if any. The second step requires us to estimate and measure the tax benefit as the largest amount that is more than 50% likely to be realized upon ultimate settlement. It is inherently difficult and subjective to estimate such amounts, as we have to determine the probability of various possible outcomes. We re-evaluate these uncertain tax positions on a quarterly basis. This evaluation is based on factors including, but not limited to, changes in facts or circumstances, changes in tax law, effectively settled issues under audit, and new audit activity. Such a change in recognition or measurement would result in the recognition of a tax benefit or an additional charge to the tax provision.
Environmental liabilities
We have reserved for potential environmental liabilities based on the best estimates of potential clean-up and remediation for known environmental sites. We employ a staff of environmental professionals to administer all phases of our environmental programs and use outside experts where needed. These professionals develop estimates of potential liabilities at these sites based on projected and known remediation costs. These cost projections are determined through previous experiences with other sites and through bids from third-party contractors. Management believes current reserves are reasonable based on current information, but estimates of environmental reserves and exposures may be affected by information subsequently received.
Accrued Loss and Damage Claims
Our insurance program includes a self-insured deductible of $2.0 million per incident for bodily injury and property damage and a $1.0 million deductible for workers’ compensation. In addition, we currently maintain insurance policies with a total limit of $65.0 million, of which $60.0 million is provided under umbrella and excess liability policies and $5.0 million is provided under a primary liability policy. The $2.0 million deductible per incident could adversely affect our profitability, particularly in the event of an increase in the frequency or severity of incidents. Additionally, we are self-insured for damage to the equipment that we own and lease, as well as for cargo losses, and such self-insurance is not subject to any maximum limitation. We extend insurance coverage to our independent affiliates and independent owner-operators for (i) motor vehicle related bodily injury, (ii) motor vehicle related property damage, and (iii) cargo loss and damage. Under this extended coverage, independent affiliates and independent owner-operators are responsible for only a small portion of the applicable deductibles. In addition, even where we have insurance, our insurance policies
F-12
Table of Contents
may not provide coverage for certain claims against us or may not be sufficient to cover all possible liabilities. As of December 31, 2014, we had $19.0 million in an outstanding letter of credit to our insurance company to guarantee the self-insurance portion of our liability. If we fail to meet certain terms of our agreement, the insurance company may draw down the letter of credit. In developing liability reserves, we rely on insurance company estimates, the judgment of our own licensed claims adjusters, and independent professional actuaries and attorneys. The most significant assumptions used in the estimation process include determining the trends in loss costs, the expected consistency in the frequency and severity of claims incurred but not yet reported to prior-year claims, and expected costs to settle unpaid claims. Management believes reserves are reasonable given known information, but as each case develops, estimates may change to reflect the effect of new information.
Foreign Currency Translation
The translation from Canadian dollars to U.S. dollars is performed for balance sheet accounts using exchange rates in effect at the balance sheet date and for revenue and expense accounts using a weighted-average exchange rate in effect during the period. The gains or losses, net of income taxes, resulting from such translation are included in our Consolidated Statements of Shareholders’ Deficit as a component of accumulated other comprehensive loss. Gains or losses from foreign currency transactions are included in our Consolidated Statements of Operations as a component of other expense.
Accumulated Other Comprehensive Loss
The components of accumulated other comprehensive loss are as follows as of December 31 (in thousands):
| 2014 | 2013 | |||||||
| Unrecognized loss and prior service costs |
$ | 30,174 | $ | 26,416 | ||||
| Foreign currency translation adjustment |
831 | 1,061 | ||||||
|
|
|
|
|
|||||
| $ | 31,005 | $ | 27,477 | |||||
|
|
|
|
|
|||||
Revenue Recognition
Transportation revenue, including fuel surcharges and related costs, is recognized on the date freight is delivered. Service revenue consists primarily of rental revenues (primarily tractor and trailer rental), intermodal and depot revenues, disposal well services revenues and insurance-related administrative services revenues. Rental revenues from independent affiliates, independent owner-operators and third parties are recognized ratably over the lease period. Intermodal and depot revenues, consisting primarily of repair and storage services, are recognized when the services are rendered. Disposal well services revenues are recognized when the services are rendered. Insurance-related administrative services revenues are recorded ratably over the service period. We recognize all revenues on a gross basis as the principal and primary obligor with risk of loss in relation to our responsibility for completion of services as contracted with our customers.
Service Revenue
The components of service revenue are as follows for the year ended December 31 (in thousands):
| 2014 | 2013 | 2012 | ||||||||||
| Rental revenue |
$ | 59,891 | $ | 56,249 | $ | 53,044 | ||||||
| Intermodal and depot revenues |
54,846 | 50,489 | 45,008 | |||||||||
| Other revenue |
21,915 | 23,027 | 23,049 | |||||||||
|
|
|
|
|
|
|
|||||||
| $ | 136,652 | $ | 129,765 | $ | 121,101 | |||||||
|
|
|
|
|
|
|
|||||||
Share-Based Compensation
Under FASB guidance, we apply the Black-Scholes valuation model in determining the fair value of share-based payments to employees and directors. The resulting compensation expense is recognized over the requisite service period, which is generally the option vesting term of two to four years. Please refer to Note 19 for further discussion regarding stock-based compensation.
F-13
Table of Contents
Leased Assets
We have both capital and operating leases. The initial leases for most of our tractors and trailers have terms that range from four to six years. Some leases require us to pay the lessor a minimum residual amount at the end of the lease. For operating leases, we accrue this residual by recording a prepaid rent amount and amortizing a monthly amount as rental expense and also record a liability that is increased every year by recognizing interest expense. This residual amount is recorded in the balance sheet category “Other non-current liabilities.” For capital leases, the residual is included as part of the cost of the capitalized leased asset.
Use of Estimates
The preparation of consolidated financial statements in conformity with generally accepted accounting principles requires management to make estimates and assumptions that affect the reported amounts of assets and liabilities and disclosure of contingent assets and liabilities at the date of the financial statements and the reported amounts of revenues and expenses during the reporting period. Actual results could differ from those estimates.
Net Income (Loss) Per Common Share
Basic net income (loss) per common share is calculated based on the weighted-average common shares outstanding during each period. Diluted income (loss) per common share includes the dilutive effect, if any, of common equivalent shares outstanding during each period.
New Accounting Pronouncements
In February 2015, the Financial Accounting Standards Board (“FASB”) issued guidance to improve targeted areas of consolidation guidance for legal entities such as limited partnerships, limited liability corporations, and securitization structures (collateralized debt obligations, collateralized loan obligations, and mortgage-backed security transactions). The guidance will be effective beginning January 1, 2016, and it is not expected to have a material impact on our consolidated financial statements.
In January 2015, the FASB issued an update to authoritative guidance to remove the concept of extraordinary items from U.S. GAAP. Therefore, events or transactions that are of an unusual nature and occur infrequently will no longer be allowed to be separately disclosed, net of tax, in the income statement after income from continuing operations. The standard is effective for the company beginning January 1, 2016. The company does not expect a significant impact from the adoption of this guidance.
In August 2014, the FASB issued an update to authoritative guidance related to disclosure of uncertainties about an entity’s ability to continue as a going concern. The amendments in this update require management to assess an entity’s ability to continue as a going concern by incorporating and expanding upon certain principles that are currently in U.S. auditing standards. Specifically, the amendments (1) provide a definition of the term substantial doubt, (2) require an evaluation every reporting period including interim periods, (3) provide principles for considering the mitigating effect of management’s plans, (4) require certain disclosures when substantial doubt is alleviated as a result of consideration of management’s plans, (5) require an express statement and other disclosures when substantial doubt is not alleviated, and (6) require an assessment for a period of one year after the date that the financial statements are issued (or available to be issued). The guidance is effective for annual periods ending December 31, 2016 and early adoption is permitted. The Company does not expect this guidance to have a material impact on our consolidated financial statements.
In June 2014, the FASB issued an update to authoritative guidance related to accounting for share-based payments when the terms of an award provide that a performance target could be achieved after the requisite service period. The guidance will be effective beginning January 1, 2016, and it is not expected to have a material impact on our consolidated financial statements.
In May 2014, the FASB issued an accounting pronouncement related to revenue recognition, which amends the prior guidance and provides a single, comprehensive revenue recognition model for all contracts with customers. Principles apply to the measurement of revenue and timing of its recognition. The new standard requires entities to recognize revenue to reflect the transfer of promised goods or services to customers in an amount that reflects the consideration which the entity expects to be entitled to in exchange for those goods or services. This pronouncement is effective for fiscal years, and interim periods within those years, beginning after December 15, 2016, and early adoption is not permitted. The Company is currently evaluating the impact of this pronouncement.
In April 2014, the FASB issued authoritative guidance, which specifies that only disposals representing a strategic shift in operations, such as a disposal of a major line of business, should be presented as discontinued operations. In addition, the new guidance requires expanded disclosures for discontinued operations, including disclosure of pre-tax profit or loss of an individually significant component of an entity that does not qualify for discontinued operations reporting. This guidance is effective for the Company prospectively in the first quarter of fiscal 2016. Principles of the new guidance are not applicable to a component that is classified as held for sale before the effective date even if disposed of after the effective date. As the accounting standard will only impact presentation, the new standard will not have an impact on the Company’s financial position, results of operations or cash flows.
F-14
Table of Contents
3. VARIABLE INTEREST ENTITIES
At December 31, 2014 and 2013, we have a variable interest in one variable interest entity (“VIE”), for which we are not the primary beneficiary. We have concluded, based on our qualitative consideration of our contracts with the VIE, the operating structure of the VIE and our role with the VIE, that we do not have the power to direct the activities that most significantly impact their economic performance. Therefore, we are not required to consolidate the operations of this VIE.
This VIE is an independent affiliate that is directly engaged in the dry bulk and chemical business through the management of trucking terminals in the North East region of the U.S. We are involved with this VIE as a non-controlling interest. Our maximum exposure to loss as a result of our involvement with this unconsolidated VIE is limited to our recorded loans receivable which aggregated approximately $3.9 million and $3.2 million at December 31, 2014 and 2013, respectively. These loans are secured by second-priority liens on certain assets of the VIE.
4. FAIR VALUE OF FINANCIAL INSTRUMENTS
The three-level valuation hierarchy for fair value measurements is based upon observable and unobservable inputs. Observable inputs reflect market data obtained from independent sources, while unobservable inputs reflect our market assumptions. These two types of inputs create the following fair value hierarchy:
| • | Level 1—Quoted prices for identical instruments in active markets; |
| • | Level 2—Quoted prices for similar instruments in active markets, quoted prices for identical or similar instruments in markets that are not active, and model-derived valuations whose significant inputs are observable; and |
| • | Level 3—Instruments whose significant inputs are unobservable. |
Following is a description of the valuation methodologies we used for instruments measured at fair value, as well as the general classification of such instruments pursuant to the valuation hierarchy.
Fair Value Measurements on a Nonrecurring Basis
The fair value of our long-term indebtedness is based on level 2 quoted market prices. As of December 31, 2014, the carrying value and fair value are as follows (in thousands):
| Carrying Value |
Fair Value | |||||||
| 9.875% Second-Priority Senior Secured Notes due 2018 (“2018 Notes”) |
$ | 180,000 | $ | 189,000 | ||||
|
|
|
|
|
|||||
The fair value of the revolving credit facility and term loan under our asset-based loan facility (the “ABL Facility”), which is variable rate debt, is estimated using a coupon rate on borrowings with similar maturities, current remaining average life to maturity, borrower credit quality, and current market conditions and approximates fair value. The fair value of the 2018 Notes is estimated using various techniques including recently executed transactions in securities of the issuer or comparable issuers, market price quotations (where observable), bond spreads, fundamental data relating to the issuer, and credit default swap spreads adjusted for any basis difference between cash and derivative instruments.
The carrying amounts reported in the accompanying Consolidated Balance Sheets for cash and cash equivalents, accounts receivable and accounts payable approximate fair value because of the immediate or short-term maturities of these financial instruments.
We used a third-party appraisal for the fair value of our intangible assets. Refer to Note 12 — Goodwill and Intangible Assets.
F-15
Table of Contents
5. INCOME (LOSS) PER COMMON SHARE
A reconciliation of the numerators and denominators of the basic and diluted income (loss) per share computations follows (in thousands except per share amounts):
| December 31, 2014 | December 31, 2013 | December 31, 2012 | ||||||||||||||||||||||||||||||||||
| Net income (numerator) |
Shares (denominator) |
Per- share amount |
Net loss (numerator) |
Shares (denominator) |
Per- share amount |
Net income (numerator) |
Shares (denominator) |
Per- share amount |
||||||||||||||||||||||||||||
| Basic income (loss) available to common shareholders: |
$ | 20,640 | 27,539 | $ | 0.75 | $ | (42,038 | ) | 26,560 | $ | (1.58 | ) | $ | 50,076 | 26,502 | $ | 1.89 | |||||||||||||||||||
|
|
|
|
|
|
|
|||||||||||||||||||||||||||||||
| Effect of dilutive securities: |
||||||||||||||||||||||||||||||||||||
| Stock options |
— | 371 | — | — | — | 566 | ||||||||||||||||||||||||||||||
| Unvested restricted stock |
— | 123 | — | — | — | 126 | ||||||||||||||||||||||||||||||
| Unvested restricted stock units |
— | 44 | — | — | — | — | ||||||||||||||||||||||||||||||
| Stock warrants |
— | — | — | — | — | 13 | ||||||||||||||||||||||||||||||
|
|
|
|
|
|
|
|
|
|
|
|
|
|||||||||||||||||||||||||
| Diluted income (loss) available to common shareholders: |
$ | 20,640 | 28,077 | $ | 0.74 | $ | (42,038 | ) | 26,560 | $ | (1.58 | ) | $ | 50,076 | 27,207 | $ | 1.84 | |||||||||||||||||||
|
|
|
|
|
|
|
|
|
|
|
|
|
|
|
|
|
|
|
|||||||||||||||||||
F-16
Table of Contents
The effect of our stock options, restricted stock, restricted stock units and stock warrants which represent the shares shown in the table above are included in the computation of diluted earnings per share for each year. There is no effect of our stock options, restricted stock and stock warrants in the computation of diluted earnings per share for the year ended December 31, 2013 due to a net loss in the period.
The following securities were not included in the calculation of diluted income (loss) per share because such inclusion would be anti-dilutive (in thousands):
| For the years ended December 31, | ||||||||||||
| 2014 | 2013 | 2012 | ||||||||||
| Stock options |
690 | 1,625 | 1,686 | |||||||||
| Restricted stock units |
521 | — | — | |||||||||
| Restricted stock |
71 | 245 | 119 | |||||||||
| Warrants |
— | 1 | 1 | |||||||||
6. ACQUISITIONS
On November 7, 2014, we acquired certain portions of the business of and certain operating assets of one of our independent affiliates for a purchase price of $6.5 million. Of the total $6.5 million, we allocated $4.9 million to property and equipment and $1.6 million to goodwill. This purchase price allocation is preliminary and subject to change. The business acquired from this independent affiliate consisted of four terminals operating within the energy logistics segment. Concurrent with the purchase, these four terminals were transitioned to other existing independent affiliates.
During 2013, we did not complete any acquisitions or dispositions of businesses or independent affiliates.
7. SELECTED QUARTERLY FINANCIAL DATA (Unaudited) (In thousands, except per share data)
| Quarter Ended | ||||||||||||||||
| March 31 | June 30 | September 30 | December 31 | |||||||||||||
| 2014 |
||||||||||||||||
| Operating revenues |
$ | 234,487 | $ | 255,599 | $ | 258,490 | $ | 243,182 | ||||||||
| Operating income |
12,102 | 14,872 | 13,490 | 10,766 | ||||||||||||
| Net income |
3,073 | 11,369 | 3,574 | 2,624 | ||||||||||||
| Net income per share—basic |
0.11 | 0.41 | 0.13 | 0.09 | ||||||||||||
| Net income per share—diluted |
0.11 | 0.41 | 0.13 | 0.09 | ||||||||||||
| 2013 |
||||||||||||||||
| Operating revenues |
$ | 229,422 | $ | 239,296 | $ | 235,671 | $ | 225,421 | ||||||||
| Operating income (loss) |
15,444 | (41,683 | ) | 11,617 | (28,142 | ) | ||||||||||
| Net income(loss) |
9,144 | (31,147 | ) | 2,763 | (22,798 | ) | ||||||||||
| Net income (loss) per share—basic |
0.34 | (1.18 | ) | 0.10 | (0.85 | ) | ||||||||||
| Net income (loss) per share—diluted |
0.34 | (1.18 | ) | 0.10 | (0.85 | ) | ||||||||||
In 2014, we incurred $1.2 million of costs related to the partial redemption of our 2018 Notes, $0.3 million of severance, $0.2 million of costs associated with the termination of an independent affiliate, $9.8 million of energy reorganization costs, offset by a gain of $4.2 million on the extinguishment of debt.
In 2013, we recorded $91.3 million of impairment charges related to goodwill and intangibles in our energy logistics segment of which $55.7 million was recorded in the second quarter of 2013 and $35.6 million was recorded in the fourth quarter of 2013. In 2013, we also incurred $1.2 million of costs related to the partial redemption of our 2018 Notes, $0.7 million of severance, $1.4 million of excess claims settlement expenses, $0.4 million of costs associated with the termination of an independent affiliate, $9.3 million of energy reorganization costs, $0.5 million of equity offering costs, offset by an acquisition earnout benefit of $6.8 million and net gain on the disposition of property of $2.5 million.
F-17
Table of Contents
8. SEGMENT REPORTING
Reportable Segments
The Company has three reportable business segments for financial reporting purposes that are distinguished primarily on the basis of services offered. Historically, the Company included certain shared services and corporate expenses within its Chemical Logistics segment. Beginning with 2014, the Company has allocated these items to “Shared Services.” The allocation represents a change in our segment measure as opposed to a change in operating or reportable segments. Shared Services consists of corporate and shared services overhead costs, including information technology, driver recruiting, safety, accounting, tax, stock-based compensation, pension, environmental and other corporate headquarters costs. Segment results for the 2013 and 2012 periods were reclassified to conform to the current year presentation. Our segments are delineated as follows:
| • | Chemical Logistics, which consists of the transportation of bulk chemicals primarily through our network that includes company-operated terminals and terminals operated by 28 independent affiliates, and equipment rental income; |
| • | Energy Logistics, which consists primarily of the transportation of crude oil, disposal water and fresh water for the unconventional oil and gas (“UCO&G”) market, through our network that includes one company-operated terminal and terminals operated by 4 independent affiliates, and equipment rental income; and |
| • | Intermodal, which consists of Boasso’s intermodal ISO tank container transportation and depot services business primarily supporting the international movement of bulk liquids. |
Segment operating income reported in our segment tables excludes amounts such as depreciation and amortization, gains and losses on disposal of property and equipment, restructuring costs and impairment charges. Although these amounts are excluded from the reportable business segment operating income results, they are included in our reported Consolidated Statements of Operations. We have not provided specific asset information by segment, as it is not regularly provided to our chief operating decision maker for review.
Summarized segment data and a reconciliation to income before income taxes for the years ended December 31 follow (in thousands):
| December 31, 2014 | ||||||||||||||||||||
| Chemical Logistics |
Energy Logistics |
Intermodal | Shared Services | Total | ||||||||||||||||
| Operating Revenues: |
||||||||||||||||||||
| Transportation |
$ | 483,272 | $ | 154,282 | $ | 79,941 | $ | — | $ | 717,495 | ||||||||||
| Service revenue |
71,803 | 8,867 | 54,846 | 1,136 | 136,652 | |||||||||||||||
| Fuel surcharge |
113,348 | 4,333 | 19,930 | — | 137,611 | |||||||||||||||
|
|
|
|
|
|
|
|
|
|
|
|||||||||||
| Total operating revenues |
668,423 | 167,482 | 154,717 | 1,136 | 991,758 | |||||||||||||||
|
|
|
|
|
|
|
|
|
|
|
|||||||||||
| Segment operating income (loss) |
79,905 | 9,044 | 25,785 | (44,468 | ) | 70,266 | ||||||||||||||
| Depreciation and amortization |
9,654 | 8,351 | 3,349 | 263 | 21,617 | |||||||||||||||
| (Gain) loss on disposal of property and equipment |
(4,791 | ) | 3,035 | (35 | ) | (790 | ) | (2,581 | ) | |||||||||||
|
|
|
|
|
|
|
|
|
|
|
|||||||||||
| Operating income (loss) |
75,042 | (2,342 | ) | 22,471 | (43,941 | ) | 51,230 | |||||||||||||
|
|
|
|
|
|
|
|
|
|
|
|||||||||||
| Interest expense |
8,313 | 14,160 | 6,051 | 38 | 28,562 | |||||||||||||||
| Interest income |
(474 | ) | (22 | ) | — | — | (496 | ) | ||||||||||||
| Other (income) expense |
(1,354 | ) | — | 1,210 | (3,741 | ) | (3,885 | ) | ||||||||||||
|
|
|
|
|
|
|
|
|
|
|
|||||||||||
| Income (loss) before income taxes |
$ | 68,557 | $ | (16,480 | ) | $ | 15,210 | $ | (40,238 | ) | $ | 27,049 | ||||||||
|
|
|
|
|
|
|
|
|
|
|
|||||||||||
F-18
Table of Contents
| December 31, 2013 | ||||||||||||||||||||
| Chemical Logistics |
Energy Logistics |
Intermodal | Shared Services |
Total | ||||||||||||||||
| Operating Revenues: |
||||||||||||||||||||
| Transportation |
$ | 442,164 | $ | 160,614 | $ | 72,316 | $ | — | $ | 675,094 | ||||||||||
| Service revenue |
68,029 | 10,617 | 50,489 | 630 | 129,765 | |||||||||||||||
| Fuel surcharge |
106,845 | 273 | 17,833 | — | 124,951 | |||||||||||||||
|
|
|
|
|
|
|
|
|
|
|
|||||||||||
| Total operating revenues |
617,038 | 171,504 | 140,638 | 630 | 929,810 | |||||||||||||||
|
|
|
|
|
|
|
|
|
|
|
|||||||||||
| Segment operating income (loss) |
80,146 | 10,634 | 23,174 | (41,751 | ) | 72,203 | ||||||||||||||
| Depreciation and amortization |
11,147 | 11,173 | 3,322 | 479 | 26,121 | |||||||||||||||
| Impairment charges (1) |
— | 91,296 | — | — | 91,296 | |||||||||||||||
| (Gain) loss on disposal of property and equipment |
(4,234 | ) | 4,809 | (161 | ) | (2,864 | ) | (2,450 | ) | |||||||||||
|
|
|
|
|
|
|
|
|
|
|
|||||||||||
| Operating income (loss) |
73,233 | (96,644 | ) | 20,013 | (39,366 | ) | (42,764 | ) | ||||||||||||
|
|
|
|
|
|
|
|
|
|
|
|||||||||||
| Interest expense |
9,060 | 15,960 | 6,043 | 84 | 31,147 | |||||||||||||||
| Interest income |
(846 | ) | (9 | ) | — | — | (855 | ) | ||||||||||||
| Other expense (income) |
65 | (6,800 | ) | — | — | (6,735 | ) | |||||||||||||
|
|
|
|
|
|
|
|
|
|
|
|||||||||||
| Income (loss) before income taxes |
$ | 64,954 | $ | (105,795 | ) | $ | 13,970 | $ | (39,450 | ) | $ | (66,321 | ) | |||||||
|
|
|
|
|
|
|
|
|
|
|
|||||||||||
| December 31, 2012 | ||||||||||||||||||||
| Chemical Logistics |
Energy Logistics |
Intermodal | Shared Services |
Total | ||||||||||||||||
| Operating Revenues: |
||||||||||||||||||||
| Transportation |
$ | 423,077 | $ | 105,679 | $ | 68,650 | $ | — | $ | 597,406 | ||||||||||
| Service revenue |
67,097 | 8,461 | 45,008 | 535 | 121,101 | |||||||||||||||
| Fuel surcharge |
105,767 | 926 | 16,918 | — | 123,611 | |||||||||||||||
|
|
|
|
|
|
|
|
|
|
|
|||||||||||
| Total operating revenues |
595,941 | 115,066 | 130,576 | 535 | 842,118 | |||||||||||||||
|
|
|
|
|
|
|
|
|
|
|
|||||||||||
| Segment operating income (loss) |
83,069 | 12,177 | 19,259 | (45,260 | ) | 69,245 | ||||||||||||||
| Depreciation and amortization |
10,803 | 6,310 | 3,487 | 490 | 21,090 | |||||||||||||||
| (Gain) loss on disposal of property and equipment |
(1,327 | ) | 391 | (52 | ) | — | (988 | ) | ||||||||||||
|
|
|
|
|
|
|
|
|
|
|
|||||||||||
| Operating income (loss) |
73,593 | 5,476 | 15,824 | (45,750 | ) | 49,143 | ||||||||||||||
|
|
|
|
|
|
|
|
|
|
|
|||||||||||
| Interest expense |
16,322 | 7,731 | 6,036 | — | 30,089 | |||||||||||||||
| Interest income |
(831 | ) | — | — | — | (831 | ) | |||||||||||||
| Other (income) expense |
(1,248 | ) | (2,733 | ) | 1,117 | — | (2,864 | ) | ||||||||||||
|
|
|
|
|
|
|
|
|
|
|
|||||||||||
| Income (loss) before income taxes |
$ | 59,350 | $ | 478 | $ | 8,671 | $ | (45,750 | ) | $ | 22,749 | |||||||||
|
|
|
|
|
|
|
|
|
|
|
|||||||||||
| (1) | Includes impairment charges of $72.8 million of goodwill and $18.5 million of intangible assets related to our energy logistics segment. |
9. GEOGRAPHIC INFORMATION
Our operations are located primarily in the United States, Canada, and Mexico. Inter-area sales are not significant to the total revenue of any geographic area. Information about our operations in different geographic areas for the years ended December 31 is as follows (in thousands):
| 2014 | ||||||||||||
| U.S. | International | Consolidated | ||||||||||
| Total operating revenues |
$ | 951,555 | $ | 40,203 | $ | 991,758 | ||||||
| Operating income |
45,208 | 6,022 | 51,230 | |||||||||
| Long-term identifiable assets (1) |
152,716 | 3,533 | 156,249 | |||||||||
F-19
Table of Contents
| 2013 | ||||||||||||
| U.S. | International | Consolidated | ||||||||||
| Total operating revenues |
$ | 891,589 | $ | 38,221 | $ | 929,810 | ||||||
| Operating (loss) income |
(49,730 | ) | 6,966 | (42,764 | ) | |||||||
| Long-term identifiable assets (1) |
166,394 | 3,720 | 170,114 | |||||||||
| 2012 | ||||||||||||
| U.S. | International | Consolidated | ||||||||||
| Total operating revenues |
$ | 802,715 | $ | 39,403 | $ | 842,118 | ||||||
| Operating income |
42,346 | 6,797 | 49,143 | |||||||||
| Long-term identifiable assets (1) |
184,510 | 5,832 | 190,342 | |||||||||
| (1) | Includes property and equipment. |
10. ACCOUNTS RECEIVABLE, NET
Accounts receivable, net consisted of the following at December 31 (in thousands):
| 2014 | 2013 | |||||||
| Trade accounts receivable |
$ | 125,906 | $ | 111,609 | ||||
| Independent affiliate and independent owner-operator receivables |
8,929 | 7,483 | ||||||
| Other receivables |
4,417 | 2,592 | ||||||
|
|
|
|
|
|||||
| 139,252 | 121,684 | |||||||
| Less allowance for doubtful accounts |
(2,462 | ) | (752 | ) | ||||
|
|
|
|
|
|||||
| $ | 136,790 | $ | 120,932 | |||||
|
|
|
|
|
|||||
The activity in the allowance for doubtful accounts for the years ended December 31 is as follows (in thousands):
| 2014 | 2013 | 2012 | ||||||||||
| Balance, beginning of period |
$ | (752 | ) | $ | (706 | ) | $ | (674 | ) | |||
| Adjustment to bad debt expense |
(1,217 | ) | 657 | (120 | ) | |||||||
| Write-offs, net of recoveries |
(493 | ) | (703 | ) | 88 | |||||||
|
|
|
|
|
|
|
|||||||
| Balance, end of period |
$ | (2,462 | ) | $ | (752 | ) | $ | (706 | ) | |||
|
|
|
|
|
|
|
|||||||
11. PROPERTY AND EQUIPMENT
Property and equipment consisted of the following at December 31 (in thousands):
| 2014 | 2013 | |||||||
| Land and improvements |
$ | 13,492 | $ | 14,077 | ||||
| Buildings and improvements |
29,160 | 28,875 | ||||||
| Revenue equipment |
216,297 | 224,319 | ||||||
| Other equipment and disposal wells |
36,284 | 42,435 | ||||||
|
|
|
|
|
|||||
| Total property and equipment |
295,233 | 309,706 | ||||||
| Accumulated depreciation |
(138,984 | ) | (139,592 | ) | ||||
|
|
|
|
|
|||||
| Property and equipment, net |
$ | 156,249 | $ | 170,114 | ||||
|
|
|
|
|
|||||
Depreciation expense was $20.2 million, $22.1 million and $17.8 million for the years ending December 31, 2014, 2013 and 2012, respectively. At December 31, 2014 and 2013, we had $1.4 million and $7.5 million of capitalized cost, respectively, and $0.7 million and $1.2 million of accumulated depreciation of equipment under capital leases, respectively, included in revenue equipment in the above schedule.
F-20
Table of Contents
12. GOODWILL AND INTANGIBLE ASSETS
Goodwill
In 2014, we performed our annual impairment test in the second quarter for the intermodal and chemical logistics reporting units. For our intermodal and chemical logistics reporting units, we qualitatively assessed whether it was more likely than not that the respective fair value of these reporting units was less than the carrying amount. We determined that an impairment in either of our intermodal or chemical logistics reporting units was not likely; thus, we did not perform quantitative analyses.
In 2013, we performed our annual impairment test in the second quarter for all reporting units. For our chemical logistics reporting unit, we qualitatively assessed whether it was more likely than not that the respective fair value of this reporting unit was less than the carrying amount, including goodwill. We determined that an impairment in our chemical logistics reporting unit was not likely and did not perform a quantitative analysis. For the intermodal and energy logistics reporting units, we proceeded directly to the two-step quantitative impairment test. The intermodal reporting unit had goodwill of approximately $31.4 million as of June 30, 2013, and the energy logistics reporting unit had goodwill of approximately $71.3 million as of June 30, 2013. Based on the second step of the quantitative impairment test, we concluded that the implied fair value of goodwill for the intermodal reporting unit substantially exceeded its carrying value and there was no impairment. For the energy logistics reporting unit, we concluded that the implied fair value of goodwill was less than its carrying amount, resulting in an impairment of goodwill of approximately $55.2 million recorded for the three-month period ending June 30, 2013. The remaining goodwill of the energy logistics reporting unit after the second quarter impairment was approximately $17.6 million.
In the fourth quarter of fiscal 2013, we identified triggering events in our energy logistics reporting unit, which were the combination of the continued challenging market conditions, the recent financial performance, and decreases in the projected results as compared to prior periods, requiring an interim impairment test of goodwill. The decrease in financial performance and projected results was mainly due to poor performance and increased reorganizational costs. Based on the second step of the impairment test, we concluded that the implied fair value of goodwill for the energy logistics reporting unit was less than its carrying amount, resulting in an impairment of goodwill of approximately $17.6 million for the three-month period ending December 31, 2013. There was no remaining goodwill for the energy logistics reporting unit at December 31, 2013, after the fourth quarter of 2013 impairment charge.
Goodwill within our reporting units and the related changes for the year ended December 31, 2014 were as follows (in thousands):
| December 31, 2013 |
Additions (1) | December 31, 2014 |
||||||||||
| Intermodal |
$ | 31,410 | $ | — | $ | 31,410 | ||||||
| Chemical Logistics |
1,545 | — | 1,545 | |||||||||
| Energy Logistics |
— | 1,941 | 1,941 | |||||||||
|
|
|
|
|
|
|
|||||||
| Total |
$ | 32,955 | $ | 1,941 | $ | 34,896 | ||||||
|
|
|
|
|
|
|
|||||||
| (1) | Additions due to business assets acquired from an independent affiliate. |
Goodwill within our reporting units and the related changes for the year ended December 31, 2013 were as follows (in thousands):
| December 31, 2012 |
Purchase Price Adjustment |
Impairment | December 31, 2013 |
|||||||||||||
| Energy Logistics (1) |
$ | 71,339 | $ | 1,430 | $ | (72,769 | ) | $ | — | |||||||
| Intermodal |
31,410 | — | — | 31,410 | ||||||||||||
| Chemical Logistics |
1,545 | — | — | 1,545 | ||||||||||||
|
|
|
|
|
|
|
|
|
|||||||||
| Total |
$ | 104,294 | $ | 1,430 | $ | (72,769 | ) | $ | 32,955 | |||||||
|
|
|
|
|
|
|
|
|
|||||||||
| (1) | Measurement period adjustment for the Dunn’s acquisition as the Company finalized its valuation which reduced fixed assets and increased goodwill. |
F-21
Table of Contents
Intangible Assets
In 2014, our intangible assets included a tradename, customer relationships and non-compete agreements. We performed our annual impairment test in the second quarter of fiscal 2014 with a measurement date of June 30 for the indefinite-lived intangible assets related to a tradename in the intermodal reporting unit. We conducted our analysis under the revised intangibles – goodwill and other impairment rules. We determined that impairment of the indefinite-lived assets was not likely and thus we were not required to perform a quantitative analysis. In addition, there were no indicators that a triggering event in our intermodal reporting unit had occurred as of the quarter ending December 31, 2014.
The Company tests intangible assets for impairment when certain triggering events or circumstances indicate that their carrying value may be impaired. Triggering events are assessed on an intangible by intangible basis and, if identified, the specific asset or assets are valued and compared to their carrying value. If the carrying value exceeds the projected discounted cash flows attributed to the indefinite-lived intangible assets, the carrying value is no longer considered recoverable and the Company will record an impairment charge. The non-compete agreements are continually monitored to ensure they remain in full force and effect. The customer relationships are valued using the income approach, specifically the excess earnings method. There were no indicators that a triggering event had occurred as of the quarter ending December 31, 2014.
Intangible assets at December 31, 2014 are as follows (in thousands):
| Gross Book Value |
2014 Additions (1) |
Accumulated Amortization |
Net Book Value |
Average Lives (in years) |
||||||||||||||||
| Tradename—Intermodal |
$ | 7,400 | $ |
— |
|
$ | — | $ | 7,400 | Indefinite | ||||||||||
| Customer relationships—Intermodal, Energy Logistics and Chemical Logistics |
14,260 | 668 | (7,573 | ) | 7,355 | 10-12 | ||||||||||||||
| Non-compete agreements—Intermodal and Energy Logistics |
1,620 | — | (987 | ) | 633 | 3-6 | ||||||||||||||
|
|
|
|
|
|
|
|
|
|||||||||||||
| $ | 23,280 | $ | 668 | $ | (8,560 | ) | $ | 15,388 | ||||||||||||
|
|
|
|
|
|
|
|
|
|||||||||||||
| (1) | Additions relate to the onboarding of two new independent affiliates. |
Of the net book value of intangibles of approximately $15.4 million at December 31, 2014, $14.1 million was allocated to our intermodal reporting unit, $0.7 million was allocated to our energy logistics reporting unit and $0.6 million was allocated to our chemical logistics reporting unit.
Intangible assets at December 31, 2013 are as follows (in thousands):
| Gross Book Value |
2013 Additions (1) |
Impairment | Accumulated Amortization |
Net Book Value |
Average Lives (in years) |
|||||||||||||||||||
| Tradename—Intermodal |
$ | 7,400 | $ | — | $ | — | $ | — | $ | 7,400 | Indefinite | |||||||||||||
| Tradename—Energy Logistics |
1,100 | — | (521 | ) | (579 | ) | — | — | ||||||||||||||||
| Customer relationships |
33,410 | 1,000 | (17,065 | ) | (9,462 | ) | 7,883 | 10-12 | ||||||||||||||||
| Non-compete agreements |
4,311 | — | — | (3,445 | ) | 866 | 3-6 | |||||||||||||||||
| Service agreement |
1,120 | — | (942 | ) | (178 | ) | — | — | ||||||||||||||||
|
|
|
|
|
|
|
|
|
|
|
|||||||||||||||
| $ | 47,341 | $ | 1,000 | $ | (18,528 | ) | $ | (13,664 | ) | $ | 16,149 | |||||||||||||
|
|
|
|
|
|
|
|
|
|
|
|||||||||||||||
| (1) | Additions relate to the onboarding of a new independent affiliate. |
Of the net book value of intangibles of approximately $16.1 million at December 31, 2013, $15.3 million was allocated to our intermodal reporting unit and $0.8 million was allocated to our energy logistics reporting unit.
Amortization expense for the years ended December 31, 2014, 2013, and 2012 was $1.4 million, $4.0 million and $3.3 million, respectively. Estimated amortization expense for intangible assets is as follows (in thousands):
| 2015 |
$ | 1,485 | ||
| 2016 |
1,480 | |||
| 2017 |
1,404 | |||
| 2018 |
1,285 | |||
| 2019 |
1,337 | |||
| Thereafter |
997 | |||
|
|
|
|||
| Total |
$ | 7,988 | ||
|
|
|
F-22
Table of Contents
13. ACCOUNTS PAYABLE AND ACCRUED EXPENSES
Accrued expenses include the following at December 31 (in thousands):
| 2014 | 2013 | |||||||
| Lease residual guarantees |
$ | 11,250 | $ | 8,183 | ||||
| Salaries, wages and benefits |
7,389 | 5,440 | ||||||
| Interest |
3,512 | 3,892 | ||||||
| Claims and deposits |
3,862 | 2,396 | ||||||
| Taxes |
1,071 | 1,286 | ||||||
| Other |
5,533 | 9,383 | ||||||
|
|
|
|
|
|||||
| $ | 32,617 | $ | 30,580 | |||||
|
|
|
|
|
|||||
Accounts payable includes $4.7 million and $1.7 million of bank overdrafts at December 31, 2014 and 2013, respectively.
14. LONG-TERM INDEBTEDNESS
Long-term debt consisted of the following at December 31 (in thousands):
| 2014 | 2013 | |||||||
| Capital lease obligations |
$ | 516 | $ | 4,883 | ||||
| ABL Facility |
151,000 | 136,000 | ||||||
| Term Loan |
17,500 | 17,500 | ||||||
| 9.875% Second-Priority Senior Secured Notes, due 2018 |
180,000 | 202,500 | ||||||
| 5% Subordinated Acquisition Notes |
— | 19,170 | ||||||
| Other notes |
2,966 | 4,209 | ||||||
|
|
|
|
|
|||||
| Long-term debt, including current maturities |
351,982 | 384,262 | ||||||
| Discount on notes |
(687 | ) | (957 | ) | ||||
|
|
|
|
|
|||||
| Total indebtedness (including capital lease obligations) |
351,295 | 383,305 | ||||||
| Less current maturities of long-term debt (including capital lease obligations) |
(3,033 | ) | (10,580 | ) | ||||
|
|
|
|
|
|||||
| Long-term debt, less current maturities (including capital lease obligations) |
$ | 348,262 | $ | 372,725 | ||||
|
|
|
|
|
|||||
Amended and Restated ABL Facility and Term Loan
On November 3, 2014, the ABL Facility and the Term Loan were amended and restated. Total borrowing capacity under the ABL Facility and the Term Loan remain at $350.0 million and $17.5 million, respectively. Obligations under the Term Loan will mature on the earlier of November 2017 and the maturity of obligations under the ABL Facility. Obligations under the ABL Facility mature on the earlier of November 2019 and the date that is 91 days prior to the maturity of the Company’s 2018 Notes or replacement notes if the amount of the debt is above a certain threshold. Borrowing availability under the ABL Facility was expanded to include additional eligible accounts receivable, and the credit spreads under both the ABL Facility and the Term Loan were reduced.
F-23
Table of Contents
Accounting Treatment for Amended and Restated ABL Facility and Term Loan
The amendment and restatement of the ABL Facility was treated as a debt modification in accordance with FASB guidance. Under applicable FASB guidance, we compared the product of the remaining term multiplied by the maximum borrowing capacity of our previous ABL Facility to the maximum borrowing capacity of the new arrangement on a creditor-by-creditor basis to determine the accounting treatment. For each creditor, if the borrowing capacity of the new arrangement is greater than or equal to the maximum borrowing capacity of the old arrangement, then the exchange of arrangements is classified as a modification, and, if not, the exchange is classified as an extinguishment in proportion to the percentage of the decrease. If the exchange is classified as a modification, then any unamortized debt issuance costs relating to our previous ABL Facility are allocated to the amended and restated ABL Facility and amortized over the term of the amended and restated ABL Facility using the effective interest method. Furthermore, if the exchange is classified as an extinguishment, then any unamortized debt issuance costs relating to our previous ABL Facility would be written off in proportion to the decrease in maximum borrowing capacity of the amended and restated ABL Facility. Upon the amendment and restatement of the ABL Facility, the remaining unamortized debt issuance costs and new debt issuance costs of $1.9 million will be amortized over the term of the amended and restated ABL Facility.
Revolving Credit Facility
Our ABL Facility provides for a revolving credit facility that had a maturity of August 2018 as of December 31, 2014. The ABL Facility includes borrowing capacity of up to $150.0 million for letters of credit and up to $30.0 million for swingline borrowings on same-day notice. The ABL Facility is available for working capital needs and general corporate purposes, including permitted acquisitions. At December 31, 2014, we had $62.0 million of borrowing availability under the ABL Facility.
Borrowings under the revolving credit facility bear interest at a rate equal to an applicable margin plus, at our option, either a base rate or LIBOR. The applicable margin at December 31, 2014 was 1.00% for base rate borrowings and 2.00% for LIBOR borrowings. The applicable margin for borrowings will be reduced or increased based on aggregate borrowing base availability under the ABL Facility and may be further reduced in the event that our aggregate borrowing base availability and our fixed charge coverage ratio as calculated under the ABL Facility exceed a target level. The base rate is equal to the highest of the prime rate, the federal funds overnight rate plus 0.50% and 30-day LIBOR plus 1.00%. In addition to paying interest on outstanding principal under the ABL Facility, we are required to pay an unutilized commitment fee to the lenders quarterly at a rate ranging from 0.25% to 0.375%, depending on the average utilization of the ABL Facility. We also pay customary letter of credit fees quarterly. We may voluntarily repay outstanding borrowings under the revolving credit facility of the ABL Facility at any time without premium or penalty, other than customary “breakage” costs with respect to LIBOR loans. The interest rate on borrowings under the revolving credit facility at December 31, 2014 and December 31, 2013 was 2.2% in both periods.
The borrowing base for the ABL Facility consists of eligible accounts receivable, inventory, tractor and trailer equipment, real property and certain other equipment.
We recorded $6.9 million in debt issuance costs relating to the ABL Facility. We are amortizing the debt issuance costs over the remaining term of the ABL Facility. The September 2012 amendment to our ABL Facility was treated as a modification under FASB guidance.
F-24
Table of Contents
Term Loan Facility
On June 14, 2013, our ABL Facility was amended to provide for a new $17.5 million senior secured term loan facility which was fully funded on July 15, 2013. Borrowings under the Term Loan bear interest at a rate equal to an applicable margin plus, at our option, either a base rate or LIBOR. The applicable margin at December 31, 2014 was 2.00% for base rate borrowings and 3.00% for LIBOR borrowings, with a potential step-down of 0.25% after 3 months from inception if a senior secured leverage ratio is met. As of December 31, 2014, obligations under the Term Loan mature November 2017. Following the amendment and restatement of our Term Loan in November 2014, we are subject to mandatory repayment of the principal amount of the Term Loan in equal quarterly payments beginning no earlier than the 12-month anniversary of the amendment and restatement and no later than the 24-month anniversary of the amendment and restatement. As of December 31, 2014, we estimated that repayments would begin in the second quarter of 2016. We may voluntarily repay the outstanding amount under the Term Loan at any time without premium or penalty, other than customary “breakage” costs with respect to the LIBOR loans. As of December 31, 2014, the balance of the Term Loan was $17.5 million. The interest rate on borrowings under the Term Loan at December 31, 2014 and December 31, 2013, was 3.2% and 3.7%, respectively.
We recorded $0.6 million in debt issuance costs relating to the Term Loan, and we are amortizing the debt issuance costs over the term of the Term Loan.
9.875% Second-Priority Senior Secured Notes Due 2018
On November 3, 2010, we issued $225.0 million aggregate principal amount of the 2018 Notes. With the proceeds of the issuance of the 2018 Notes, we repaid and redeemed certain of our previously outstanding notes and paid down a portion of our outstanding borrowings under the previous ABL Facility. We recorded $6.0 million in debt issuance costs relating to the 2018 Notes, of which $5.8 million was related to the new issuance and $0.2 million of unamortized debt issuance costs related to our 10% Senior Notes due 2013 which are no longer outstanding. We are amortizing these costs over the term of the 2018 Notes.
Interest on the 2018 Notes is payable at a rate of 9.875% per annum, semiannually on May 1 and November 1 of each year. The payment obligations of Quality Distribution, LLC (“QD LLC”) and QD Capital Corporation (“QD Capital”) under the 2018 Notes are guaranteed by QDI and by all of its 100%-owned domestic subsidiaries other than immaterial subsidiaries. The 2018 Notes are senior obligations of QD LLC and QD Capital and are secured by a second-priority lien on certain assets. Pursuant to an intercreditor agreement, the liens on the collateral securing the 2018 Notes rank junior in right of payment to the ABL Facility, including the Term Loan, and obligations under certain hedging agreements, cash management obligations and certain other first-lien obligations.
The 2018 Notes mature on November 1, 2018. Since November 1, 2014, we may redeem the 2018 Notes, in whole or in part, at the following prices (expressed as a percentage of principal amount), plus accrued and unpaid interest to the redemption date, if redeemed during the 12-month period commencing on November 1 of the years set forth below:
| Period |
Redemption Price |
|||
| 2014 |
104.938 | % | ||
| 2015 |
102.469 | % | ||
| 2016 and thereafter |
100.000 | % | ||
Prior to November 1, 2014, redemption of the 2018 Notes was permitted, in whole or in part, at a price equal to 100% of the principal amount of the 2018 Notes redeemed, plus accrued and unpaid interest to the redemption date, plus an additional “make-whole premium” intended to capture the value of holding the 2018 Notes through November 1, 2014, but not less than 1%. During any twelve-month period prior to November 1, 2014, redemption was permitted up to 10% of the original aggregate principal amount of the 2018 Notes at a redemption price of 103%, plus accrued and unpaid interest to the redemption date.
On July 15, 2013, we redeemed a portion of our 2018 Notes in the aggregate principal amount of $22.5 million for a redemption price equal to 100% of the aggregate principal amount of $22.5 million, plus accrued but unpaid interest up to the redemption date, plus a 3.0% premium of $0.7 million. On July 16, 2014, we redeemed another portion of the 2018 Notes in the aggregate principal amount of $22.5 million. The redemption price for these 2018 Notes equaled 100% of the aggregate principal amount of $22.5 million, plus accrued but unpaid interest up to the redemption date, plus a 3.0% premium of $0.7 million. In the third quarters of 2014 and 2013, $0.4 million and $0.5 million, respectively, of unamortized debt issuance costs related to these redemptions were written off.
F-25
Table of Contents
On January 15, 2015, we redeemed another portion of the 2018 Notes in the aggregate principal amount of $10.0 million. The redemption price for these 2018 Notes equaled 100% of the aggregate principal amount of $10.0 million, plus accrued but unpaid interest up to the redemption date, plus a 4.9% premium of $0.5 million. In the first quarter of 2015, $0.2 million of unamortized debt issuance costs related to this redemption will be written off.
5% Subordinated Acquisition Notes
As part of the consideration we paid for a 2012 acquisition, we issued notes in an aggregate principal amount of $21.3 million, (the “Acquisition Notes”). The Acquisition Notes contained a fixed interest rate of 5.0% per annum, had a maturity date of June 1, 2017 and were unsecured and subordinated. On November 12, 2013 we made optional principal payments of $2.1 million. On June 12, 2014, we extinguished the remaining principal balance of the Acquisition Notes of $19.2 million at a discount for a cash payment of $15.0 million. As a result of this transaction, we recognized a gain on extinguishment of debt of $4.2 million for 2014. The cash payment on the Acquisition Notes was funded with proceeds from borrowings under our ABL Facility and cash on hand.
Collateral, Guarantees and Covenants
The ABL Facility contains a fixed charge coverage ratio which only needs to be met if borrowing availability is less than the greater of $20.0 million and 10% of our borrowing base. The ABL Facility contains a number of covenants that, among other things, restrict, subject to certain exceptions: (i) our ability to sell assets; (ii) incur additional indebtedness; (iii) prepay other indebtedness, including the 2018 Notes; (iv) pay dividends and distributions or repurchase QDI’s capital stock; (v) create liens on assets; (vi) make investments; (vii) make certain acquisitions; (viii) engage in mergers or consolidations; (ix) engage in certain transactions with affiliates; (x) amend certain charter documents and material agreements governing subordinated indebtedness, including the 2018 Notes; (xi) change our business; and (xii) enter into agreements that restrict dividends from QD LLC’s subsidiaries. The ABL Facility also contains certain customary affirmative covenants and events of default.
The indenture governing the 2018 Notes contains covenants that restrict, subject to certain exceptions, our ability to, among other things: (i) incur additional debt or issue certain preferred shares; (ii) pay dividends on or make other distributions in respect of QDI’s common stock or make other restricted payments; (iii) make certain investments; (iv) sell certain assets; (v) create or permit to exist dividend and/or payment restrictions affecting restricted subsidiaries; (vi) create liens on certain assets to secure debt; (vii) consolidate, merge, sell or otherwise dispose of all or substantially all assets; (viii) enter into certain transactions with affiliates; and (ix) designate subsidiaries as unrestricted subsidiaries. The indenture also provides certain customary events of default, which, if any of them occurs, may result in the principal, interest and any other monetary obligations on the then outstanding 2018 Notes becoming payable immediately.
The payment obligations under the ABL Facility, including the Term Loan, are senior secured obligations of QD LLC and QD Capital and are secured by a first-priority lien on certain assets and guaranteed by QDI and by all of its domestic restricted subsidiaries other than immaterial subsidiaries. The payment obligations of QD LLC and QD Capital under the 2018 Notes are guaranteed by QDI and by all of its domestic subsidiaries other than immaterial subsidiaries. The 2018 Notes, and the guarantees thereof, are senior obligations of QD LLC and QD Capital and are secured by a second-priority lien on certain assets. Pursuant to an intercreditor agreement, the liens on the collateral securing the 2018 Notes rank junior in right of payment to the ABL Facility, including the Term Loan, and obligations under certain hedging agreements, cash management obligations and certain other first-lien obligations. We were in compliance with the covenants under the ABL Facility, including the Term Loan and the 2018 Notes, at December 31, 2014.
Debt Retirement
The following is a schedule of our total indebtedness outstanding at December 31, 2014 over the periods we are required to pay such indebtedness (in thousands):
| 2015 | 2016 | 2017 | 2018 | 2019 | Total | |||||||||||||||||||
| Capital lease obligations |
$ | 334 | $ | 106 | $ | 76 | $ | — | $ | — | $ | 516 | ||||||||||||
| ABL Facility |
— | — | — | 151,000 | — | 151,000 | ||||||||||||||||||
| Term Loan (1) |
— | 10,500 | 7,000 | — | — | 17,500 | ||||||||||||||||||
| 9.875% Second–Priority Senior Notes, due 2018 (2) |
— | — | — | 180,000 | — | 180,000 | ||||||||||||||||||
| Other Notes |
2,700 | 266 | — | — | — | 2,966 | ||||||||||||||||||
|
|
|
|
|
|
|
|
|
|
|
|
|
|||||||||||||
| Total |
$ | 3,034 | $ | 10,872 | $ | 7,076 | 331,000 | $ | — | $ | 351,982 | |||||||||||||
|
|
|
|
|
|
|
|
|
|
|
|
|
|||||||||||||
| (1) | Assumes repayment of the principal amount of the Term Loan in equal quarterly amounts beginning in the second quarter of 2016. |
| (2) | Amounts do not include the remaining unamortized original issue discount of $0.7 million related to the 2018 Notes. |
F-26
Table of Contents
The following is a schedule of our debt issuance costs included in “Other assets” in the Consolidated Balance Sheet (in thousands) for the year ended:
| December 31, 2013 |
Write-off of Issuance Costs |
Additional Debt Issuance Costs |
2014 Amortization Expense |
December 31, 2014 |
||||||||||||||||
| ABL Facility |
$ | 3,745 | $ | (54 | ) | $ | 4 | $ | (1,323 | ) | $ | 2,372 | ||||||||
| Term Loan |
490 | — | — | (189 | ) | 301 | ||||||||||||||
| Amendment and Restatement of ABL Facility |
— | — | 1,957 | (62 | ) | 1,895 | ||||||||||||||
| 9.875% Second–Priority Senior Notes, due 2018 |
3,447 | (340 | ) | 652 | (677 | ) | 3,082 | |||||||||||||
|
|
|
|
|
|
|
|
|
|
|
|||||||||||
| Total |
$ | 7,682 | (394 | ) | $ | 2,613 | $ | (2,251 | ) | $ | 7,650 | |||||||||
|
|
|
|
|
|
|
|
|
|
|
|||||||||||
Amortization expense of debt issuance costs was approximately $2.3 million, $2.4 million and $2.1 million for the years ending December 31, 2014, 2013, and 2012, respectively, and is included in interest expense. Write-offs of debt issuance costs in connection with debt retirement are reported separately as “Write-off of debt issuance costs” and were $0.4 million and $0.5 million for the years ending December 31, 2014 and 2013, respectively. There was no write-off of debt issuance costs in 2012.
15. INCOME TAXES
For financial reporting purposes, income (loss) before income taxes includes the following components for years ended December 31 (in thousands):
| 2014 | 2013 | 2012 | ||||||||||
| Domestic |
$ | 27,153 | $ | (67,437 | ) | $ | 21,853 | |||||
| Mexico |
153 | 1,281 | 851 | |||||||||
| Canada |
(257 | ) | (165 | ) | 45 | |||||||
|
|
|
|
|
|
|
|||||||
| Income (loss) before income taxes |
$ | 27,049 | $ | (66,321 | ) | $ | 22,749 | |||||
|
|
|
|
|
|
|
|||||||
The components of the provision for (benefit from) income tax for the years ended December 31 are as follows (in thousands):
| 2014 | 2013 | 2012 | ||||||||||
| Current taxes: |
||||||||||||
| Federal |
$ | — | $ | (38 | ) | $ | (337 | ) | ||||
| State |
215 | 1,216 | 516 | |||||||||
| Mexico |
(86 | ) | 388 | 166 | ||||||||
| Canada |
79 | 564 | 436 | |||||||||
|
|
|
|
|
|
|
|||||||
| 208 | 2,130 | 781 | ||||||||||
|
|
|
|
|
|
|
|||||||
| Deferred taxes: |
||||||||||||
| Federal |
9,960 | (24,011 | ) | 7,038 | ||||||||
| State |
745 | (2,648 | ) | 136 | ||||||||
|
|
|
|
|
|
|
|||||||
| 10,705 | (26,659 | ) | 7,174 | |||||||||
|
|
|
|
|
|
|
|||||||
| Valuation Allowance |
||||||||||||
| Federal |
(4,504 | ) | 246 | (32,586 | ) | |||||||
| State |
— | — | (2,696 | ) | ||||||||
|
|
|
|
|
|
|
|||||||
| (4,504 | ) | 246 | (35,282 | ) | ||||||||
|
|
|
|
|
|
|
|||||||
| Provision for (benefit from) income taxes |
$ | 6,409 | $ | (24,283 | ) | $ | (27,327 | ) | ||||
|
|
|
|
|
|
|
|||||||
F-27
Table of Contents
The net deferred tax asset (liability) consisted of the following at December 31 (in thousands):
| 2014 | 2013 | |||||||
| Deferred tax assets: |
||||||||
| Environmental reserve |
$ | 7,891 | $ | 7,936 | ||||
| Tax credit carryforwards |
7,924 | 8,692 | ||||||
| Self-insurance reserves |
7,536 | 7,527 | ||||||
| Pension |
6,569 | 5,081 | ||||||
| Net operating loss carryforwards |
19,245 | 27,381 | ||||||
| Stock compensation |
2,285 | 2,762 | ||||||
| Intangible basis differences |
24,232 | 26,965 | ||||||
| Other |
5,488 | 4,909 | ||||||
|
|
|
|
|
|||||
| 81,170 | 91,253 | |||||||
| Less valuation allowance |
— | (4,504 | ) | |||||
|
|
|
|
|
|||||
| $ | 81,170 | $ | 86,749 | |||||
|
|
|
|
|
|||||
| Deferred tax liabilities: |
||||||||
| Property and equipment basis differences |
(28,018 | ) | (29,628 | ) | ||||
| Accrued interest and original issue discount |
(2,208 | ) | (2,698 | ) | ||||
| Depreciation of environmental costs |
(2,669 | ) | (2,313 | ) | ||||
|
|
|
|
|
|||||
| Net deferred tax asset |
$ | 48,275 | $ | 52,110 | ||||
|
|
|
|
|
|||||
| Comprised of: |
||||||||
| Current deferred tax asset |
$ | 29,333 | $ | 20,709 | ||||
| Long-term deferred tax asset |
51,851 | 66,040 | ||||||
| Long-term deferred tax liability |
(32,909 | ) | (34,639 | ) | ||||
|
|
|
|
|
|||||
| Net deferred tax asset |
$ | 48,275 | $ | 52,110 | ||||
|
|
|
|
|
|||||
Our effective tax rate differs from the federal statutory rate. The reasons for those differences are as follows for the years ended December 31 (in thousands):
| 2014 | 2013 | 2012 | ||||||||||
| Tax expense (benefit) at the statutory rate |
$ | 9,467 | $ | (23,212 | ) | $ | 7,962 | |||||
| State income taxes, net of federal benefit |
1,120 | (2,054 | ) | 679 | ||||||||
| Uncertain tax position adjustments |
(474 | ) | 928 | 49 | ||||||||
| Valuation allowance |
(4,504 | ) | 246 | (35,282 | ) | |||||||
| Foreign tax credit |
521 | (975 | ) | (525 | ) | |||||||
| Federal provision to return and deferred tax adjustment |
234 | (123 | ) | (608 | ) | |||||||
| Other |
45 | 907 | 398 | |||||||||
|
|
|
|
|
|
|
|||||||
| Provision for (benefit from) income taxes |
$ | 6,409 | $ | (24,283 | ) | $ | (27,327 | ) | ||||
|
|
|
|
|
|
|
|||||||
F-28
Table of Contents
At December 31, 2014, we had an estimated $47.4 million in federal net operating loss carryforwards, an additional $8.8 million of unrecognized federal operating loss carryforwards related to excess stock compensation deductions and uncertain tax position deductions, $2.3 million in alternative minimum tax credit carryforwards and $5.4 million in foreign tax credit carryforwards. The net operating loss carryforwards will expire in the years 2020 through 2030 while the alternative minimum tax credits may be carried forward indefinitely and the foreign tax credits will expire in years 2015 through 2024.
Significant judgment is required in determining our provision for income taxes. In the ordinary course of an international business, there are many transactions for which the ultimate tax outcome is uncertain. We review our tax contingencies on a regular basis and make appropriate accruals as needed. As of December 31, 2014, U.S. taxes were not provided on income of our foreign subsidiaries, as we have invested or expect to invest the undistributed earnings indefinitely.
Rollforward of valuation allowance (in thousands):
| 2014 | 2013 | 2012 | ||||||||||
| Beginning balance |
$ | (4,504 | ) | $ | (4,258 | ) | $ | (39,540 | ) | |||
| Change in assessments about the realization of deferred income tax assets |
4,504 | (246 | ) | 35,282 | ||||||||
|
|
|
|
|
|
|
|||||||
| Ending balance |
$ | — | $ | (4,504 | ) | $ | (4,258 | ) | ||||
|
|
|
|
|
|
|
|||||||
At December 31, 2014 and 2013, we had approximately $2.0 million and $2.5 million, respectively, of total gross unrecognized tax benefits. Of the total gross unrecognized tax benefits at December 31, 2014, $0.8 million (net of federal benefit on state tax issues) represents the amount of unrecognized tax benefits that, if recognized, would favorably affect the effective income tax rate in any future periods.
Included in the balance of gross unrecognized tax benefits at December 31, 2014, is less than $0.1 million related to tax positions for which it is reasonably possible that the total amounts could significantly change during the next twelve months due to expiration of the applicable statute of limitations. A reconciliation of the total amount of unrecognized tax benefits as of December 31 follows (in thousands):
| 2014 | 2013 | 2012 | ||||||||||
| Total unrecognized tax benefits as of January 1, |
$ | 2,453 | $ | 1,652 | $ | 1,628 | ||||||
| Increases in tax positions taken during prior period |
— | — | 359 | |||||||||
| Decreases in tax positions taken during prior period |
— | (88 | ) | (75 | ) | |||||||
| Increases in tax positions taken in the current period |
124 | 893 | 85 | |||||||||
| Decreases in tax positions taken in the current period |
— | — | (20 | ) | ||||||||
| Settlements with taxing authorities |
— | — | (85 | ) | ||||||||
| Decrease due to lapse of applicable statute of limitations |
(594 | ) | (4 | ) | (240 | ) | ||||||
|
|
|
|
|
|
|
|||||||
| Total unrecognized tax benefits as of December 31, |
$ | 1,983 | $ | 2,453 | $ | 1,652 | ||||||
|
|
|
|
|
|
|
|||||||
Our continuing practice is to recognize interest and/or penalties related to income tax matters in income tax expense. For the year ended December 31, 2014, we recognized tax benefit of $0.2 million of interest and penalties in the provision for income taxes. As of December 31, 2013, we had accrued interest of $0.5 million (net of federal benefit) and $0.2 million accrued for penalties. At December 31, 2014, we had accrued interest of $0.3 million (net of federal benefit) and $0.2 million accrued for penalties.
We are subject to the income tax jurisdiction of the U.S., Canada, and Mexico, as well as multiple state jurisdictions. We believe we are no longer subject to U.S. federal income tax examinations for the years before 2011, to international examinations for years before 2009 and, with few exceptions, to state examinations before 2010.
16. EMPLOYEE BENEFIT PLANS
We maintain two noncontributory defined benefit plans resulting from a prior acquisition that cover certain vested salaried participants and retirees (“CLC Plan”) and certain other vested participants and retirees under an expired collective bargaining agreement (“TTWU Plan”). Retirement benefits for employees covered by the CLC Plan are based on years of service and compensation levels. The monthly benefit for employees under the TTWU Plan is based on years of service multiplied by a monthly benefit factor. Pension costs are funded in accordance with the provisions of the applicable law. Both pension plans have been frozen since prior to January 1, 1998. There are no new participants and no future accruals of benefits from the time the plans were frozen.
F-29
Table of Contents
We use a December 31 measurement date for both of our plans.
We follow the recognition and disclosure requirements under FASB guidance that require us to recognize the funded status of our postretirement benefit plans in the Consolidated Balance Sheet at December 31, 2014, with a corresponding adjustment to accumulated other comprehensive loss. The funded status is the difference between the fair value of plan assets and the benefit obligation. The adjustment to accumulated other comprehensive loss represents the net unrecognized actuarial gains or losses and unrecognized prior service costs. Future actuarial gains or losses that are not recognized as net periodic cost in the same periods will be recognized as a component of other comprehensive loss (in thousands):
| 2014 | 2013 | |||||||
| Items not yet recognized as a component of net periodic cost: |
||||||||
| Unrecognized net actuarial loss |
$ | 34,150 | $ | 27,932 | ||||
| Unamortized prior service cost |
135 | 229 | ||||||
|
|
|
|
|
|||||
| Unrecognized loss and prior service costs recorded as a component of accumulated other comprehensive loss |
$ | 34,285 | $ | 28,161 | ||||
|
|
|
|
|
|||||
| Items to be recognized in 2015/2014 as a component of net periodic cost: |
||||||||
| Net actuarial loss |
$ | 1,413 | $ | 1,347 | ||||
| Prior service cost |
94 | 94 | ||||||
|
|
|
|
|
|||||
| Net periodic cost to be recorded in 2015/2014 from accumulated other comprehensive loss |
$ | 1,507 | $ | 1,441 | ||||
|
|
|
|
|
|||||
Obligations and Funded Status
The following table sets forth the change in the projected benefit obligation, change in plan assets and unfunded status of the two plans at 2014 and 2013 (in thousands):
| 2014 | 2013 | |||||||
| Change in Projected Benefit Obligation |
||||||||
| Benefit obligation at January 1, |
$ | 47,207 | $ | 52,637 | ||||
| Service cost |
165 | 165 | ||||||
| Interest cost |
2,013 | 1,853 | ||||||
| Actuarial loss (gain) |
5,769 | (4,170 | ) | |||||
| Benefits and expenses paid |
(3,274 | ) | (3,278 | ) | ||||
|
|
|
|
|
|||||
| Benefit obligation at December 31, |
$ | 51,880 | $ | 47,207 | ||||
|
|
|
|
|
|||||
| 2014 | 2013 | |||||||
| Change in Plan Assets |
||||||||
| Fair value of plan assets at January 1, |
$ | 34,609 | $ | 31,560 | ||||
| Actual return on plan assets |
949 | 3,400 | ||||||
| Contributions by Company |
3,181 | 2,927 | ||||||
| Benefits and expenses paid |
(3,274 | ) | (3,278 | ) | ||||
|
|
|
|
|
|||||
| Fair value of plan assets at December 31, |
$ | 35,465 | $ | 34,609 | ||||
|
|
|
|
|
|||||
| 2014 | 2013 | |||||||
| Unfunded Status of Plans |
||||||||
| Projected benefit obligation |
$ | (51,880 | ) | $ | (47,207 | ) | ||
| Fair value of plan assets |
35,465 | 34,609 | ||||||
|
|
|
|
|
|||||
| Unfunded status as of December 31, |
$ | (16,415 | ) | $ | (12,598 | ) | ||
|
|
|
|
|
|||||
The accumulated benefit obligation for both defined benefit pension plans equaled the projected benefit obligations of $51.9 million and $47.2 million at December 31, 2014 and 2013, respectively.
F-30
Table of Contents
We had the following net pension equity (charges) credits, net of tax, that were recorded as part of other comprehensive income and accumulated other comprehensive income:
| 2014 | 2013 | 2012 | ||||||||||
| Net actuarial (loss) income, net of tax |
$ | (3,852 | ) | $ | 4,062 | $ | (422 | ) | ||||
| Prior service cost |
94 | 94 | 94 | |||||||||
|
|
|
|
|
|
|
|||||||
| Adjustment to pension benefit obligation |
$ | (3,758 | ) | $ | 4,156 | $ | (328 | ) | ||||
|
|
|
|
|
|
|
|||||||
Periodic Pension Costs
The components of net periodic pension cost are as follows for the years ended December 31 (in thousands):
| 2014 | 2013 | 2012 | ||||||||||
| Service cost |
$ | 165 | $ | 165 | $ | 166 | ||||||
| Interest cost |
2,013 | 1,853 | 2,102 | |||||||||
| Amortization of loss |
1,170 | 1,451 | 1,352 | |||||||||
| Amortization of prior service cost |
94 | 94 | 94 | |||||||||
| Expected return on plan assets |
(2,568 | ) | (2,334 | ) | (2,219 | ) | ||||||
|
|
|
|
|
|
|
|||||||
| Net periodic pension cost |
$ | 874 | $ | 1,229 | $ | 1,495 | ||||||
|
|
|
|
|
|
|
|||||||
Assumptions
Weighted average assumptions used to determine benefit obligations at December 31:
| 2014 | 2013 | 2012 | ||||||||||
| Discount rate |
3.55 | % | 4.30 | % | 3.48 | % | ||||||
Weighted average assumptions used to determine net periodic benefit cost at December 31:
| 2014 | 2013 | 2012 | ||||||||||
| TTWU Plan |
||||||||||||
| Discount rate |
4.10 | % | 3.20 | % | 3.90 | % | ||||||
| Expected long-term rate of return on plan assets |
7.00 | % | 7.00 | % | 7.00 | % | ||||||
| CLC Plan |
||||||||||||
| Discount rate |
4.50 | % | 3.75 | % | 4.50 | % | ||||||
| Expected long-term rate of return on plan assets |
7.50 | % | 7.50 | % | 8.00 | % | ||||||
The discount rate is based on a model portfolio of AA-rated bonds with a maturity matched to the estimated payouts of future pension benefits. The TTWU Plan’s expected return on plan assets is based on our expectation of the long-term average rate of return on assets in the pension funds, which is based on the allocation of assets. The CLC Plan’s expected return on plan assets is based on historical and future returns of the multiple asset classes from which a weighted average was developed based on the asset allocation of the Plan.
Asset Mix
Our pension plan weighted-average asset allocations by asset category at December 31 are as follows:
| 2014 | 2013 | |||||||
| TTWU Plan |
||||||||
| Cash and cash equivalents |
4.3 | % | 5.0 | % | ||||
| Equity securities and mutual funds |
80.5 | % | 78.7 | % | ||||
| Debt securities |
15.2 | % | 16.3 | % | ||||
|
|
|
|
|
|||||
| 100.0 | % | 100.0 | % | |||||
|
|
|
|
|
|||||
| CLC Plan |
||||||||
| Cash and cash equivalents |
4.3 | % | 4.9 | % | ||||
| Equity securities and mutual funds |
81.5 | % | 79.9 | % | ||||
| Debt securities |
14.2 | % | 15.2 | % | ||||
|
|
|
|
|
|||||
| 100.0 | % | 100.0 | % | |||||
|
|
|
|
|
|||||
F-31
Table of Contents
Plan Assets
Our investment policy is that plan assets will be managed utilizing an investment philosophy and approach characterized by all of the following, but listed in priority order: (1) emphasis on total return, (2) emphasis on high-quality securities, (3) sufficient income and stability of income, (4) safety of principal with limited volatility of capital through proper diversification and (5) sufficient liquidity. None of our equity or debt securities are included in plan assets.
Our retirement plans’ assets were accounted for at fair value and are classified in their entirety based on the lowest level of any input that is significant to the fair value measurement. For a description of the fair value hierarchy, see Note 4.
Our actual retirement plans’ asset allocations by level within the fair value hierarchy at December 31, 2014, are presented in the table below (in thousands):
| TTWU Plan | CLC Plan | |||||||||||||||||||||||||||||||||||||||
| Level 1 | Level 2 | Level 3 | Total | % Total | Level 1 | Level 2 | Level 3 | Total | % Total | |||||||||||||||||||||||||||||||
| Cash and cash equivalents |
$ | 321 | $ | — | $ | — | $ | 321 | 4.3 | % | $ | 1,217 | $ | — | $ | — | $ | 1,217 | 4.3 | % | ||||||||||||||||||||
| Mutual funds |
5,425 | 572 | — | 5,997 | 80.5 | % | 18,597 | 4,229 | — | 22,826 | 81.5 | % | ||||||||||||||||||||||||||||
| Corporate bonds |
— | 553 | — | 553 | 7.4 | % | — | 1,794 | — | 1,794 | 6.4 | % | ||||||||||||||||||||||||||||
| Asset-backed securities |
— | 581 | — | 581 | 7.8 | % | — | 2,176 | — | 2,176 | 7.8 | % | ||||||||||||||||||||||||||||
|
|
|
|
|
|
|
|
|
|
|
|
|
|
|
|
|
|
|
|
|
|||||||||||||||||||||
| Total assets |
$ | 5,746 | $ | 1,706 | $ | — | $ | 7,452 | 100.0 | % | $ | 19,814 | $ | 8,199 | $ | — | $ | 28,013 | 100.0 | % | ||||||||||||||||||||
|
|
|
|
|
|
|
|
|
|
|
|
|
|
|
|
|
|
|
|
|
|||||||||||||||||||||
Our actual retirement plans’ asset allocations by level within the fair value hierarchy at December 31, 2013, are presented in the table below (in thousands):
| TTWU Plan | CLC Plan | |||||||||||||||||||||||||||||||||||||||
| Level 1 | Level 2 | Level 3 | Total | % Total | Level 1 | Level 2 | Level 3 | Total | % Total | |||||||||||||||||||||||||||||||
| Cash and cash equivalents |
$ | 365 | $ | — | $ | — | $ | 365 | 5.0 | % | $ | 1,341 | $ | — | $ | — | $ | 1,341 | 4.9 | % | ||||||||||||||||||||
| Mutual funds |
5,256 | 553 | — | 5,809 | 78.7 | % | 17,880 | 3,886 | — | 21,766 | 79.9 | % | ||||||||||||||||||||||||||||
| Corporate bonds |
— | 588 | — | 588 | 8.0 | % | — | 1,984 | — | 1,984 | 7.3 | % | ||||||||||||||||||||||||||||
| Asset-backed securities |
— | 616 | — | 616 | 8.3 | % | — | 2,140 | — | 2,140 | 7.9 | % | ||||||||||||||||||||||||||||
|
|
|
|
|
|
|
|
|
|
|
|
|
|
|
|
|
|
|
|
|
|||||||||||||||||||||
| Total assets |
$ | 5,621 | $ | 1,757 | $ | — | $ | 7,378 | 100.0 | % | $ | 19,221 | $ | 8,010 | $ | — | $ | 27,231 | 100.0 | % | ||||||||||||||||||||
|
|
|
|
|
|
|
|
|
|
|
|
|
|
|
|
|
|
|
|
|
|||||||||||||||||||||
Level 1 includes cash and cash equivalents, equity securities and mutual funds. Fair values for these investments are measured using unadjusted quoted prices in active markets.
Level 2 includes investments in mutual funds, corporate bonds and asset-backed securities that are measured based on quoted prices for similar assets in active markets; quoted prices for identical or similar assets in inactive markets; inputs other than quoted prices that are observable for the asset; and inputs that are derived principally from or corroborated by observable market data by correlation or other means. The fair values for Level 2 assets are generally obtained from third-party broker quotes, independent pricing services and exchanges.
F-32
Table of Contents
Cash Flows
We expect to contribute $0.6 million to the TTWU pension plan and $2.5 million to the CLC pension plan during the year ending December 31, 2015.
The following benefit payments are expected to be paid (in thousands):
| 2015 |
$ | 3,378 | ||
| 2016 |
3,374 | |||
| 2017 |
3,381 | |||
| 2018 |
3,384 | |||
| 2019 |
3,345 | |||
| 2020 – 2024 |
16,023 |
Substantially all of our U.S. employees are entitled to participate in our profit sharing plan established under Section 401(k) of the U.S. Internal Revenue Code. Employees are eligible to contribute voluntarily to the plan after 90 days of employment. At our discretion, we may also contribute to the plan. Employees are always vested in their contributed balance and become fully vested in our contributions after four years of service. The expenses related to contributions to the plan for the years ended December 31, 2014, 2013 and 2012 were approximately $0.3 million in each year.
Multi-employer pension plans
We contribute to multi-employer pension plans under the terms of collective bargaining agreements that cover union-represented employees. The risk of participating in these multi-employer pension plans is different from a single-employer pension plan in the following aspects: (a) assets contributed to a multi-employer pension plan by one employer may be used to provide benefits to employees of other participating employers; (b) if a participating employer stops contributing to the plan, the unfunded obligations of the plan may be borne by the remaining participating employers; and (c) if an employer chooses to stop participating in a plan, it may be required to pay those plans an amount based on the unfunded status of the plan, referred to as a withdrawal liability.
At December 31, 2014, we contributed to three separate multi-employer pension plans for employees under collective bargaining agreements. These agreements cover approximately 3.4% of our total workforce including our independent affiliates’ employees and independent owner-operators providing service to us. These multi-employer pension plans provide defined benefits to retired participants. We do not directly or indirectly manage any of these multi-employer pension plans. Trustees, half of whom are appointed by the International Brotherhood of Teamsters (the “Teamsters”) and half of whom various contributing employers appoint, manage the trusts covering these plans. Our collective bargaining agreements with the Teamsters determine the amounts of our ongoing contributions to these plans.
Our participation in these plans is outlined in the table below (contributions in thousands):
| Pension Plan |
EIN/Pension Plan Number (1) |
Pension Protection Act Zone Status (2) |
FIP/RP Status Pending/ Implemented (3) |
Contributions | Expiration Date of Collective- Bargaining Agreement |
|||||||||||||||||||||||||||
| 2014 | 2013 | 2014 | 2013 | 2012 | ||||||||||||||||||||||||||||
| Employer-Teamsters Local Nos. 175 & 505 Pension Trust Fund |
55-6021850 | Red | Red | RP Adopted | $ | 45 | $ | 40 | $ | 41 | 2/8/2016 | |||||||||||||||||||||
| New York State Teamsters Conference Pension and Retirement Fund |
16-6063585 | Red | Red | RP Adopted | 228 | 197 | 140 | 7/14/2017 | ||||||||||||||||||||||||
| Central States Southeast and Southwest Areas Pension Fund |
36-6044243 | Red | Red | RP Adopted | 2,855 | 2,819 | 2,647 | |
2/28/2015 to 4/30/2017 |
| ||||||||||||||||||||||
|
|
|
|
|
|
|
|||||||||||||||||||||||||||
| $ | 3,128 | $ | 3,056 | $ | 2,828 | |||||||||||||||||||||||||||
|
|
|
|
|
|
|
|||||||||||||||||||||||||||
| (1) | The “EIN/Pension Plan Number” column provides the Employee Identification Number (EIN) and the three-digit plan number, if applicable. |
F-33
Table of Contents
| (2) | Unless otherwise noted, the most recent Pension Protection Act zone status available in 2014 and 2013 is for the plan’s year-end at December 31, 2013 and December 31, 2012, respectively. The zone status is based on information that we received from the plan. Among other factors, plans in the red zone are generally less than 65% funded, plans in the yellow zone are less than 80% funded, and plans in the green zone are at least 80% funded. |
| (3) | The “FIP/RP Status Pending/Implemented” column indicates plans for which a financial improvement plan (FIP) or a rehabilitation plan (RP) is either pending or has been implemented. No surcharge has been imposed for any of these plans. |
We do not currently intend to withdraw from the three multi-employer pension plans or take any actions that would subject us to payment of contingent obligations upon withdrawal from such plans. Based on information provided to us from the trustees of these plans, we estimate our portion of the contingent liability in the case of a full withdrawal or termination from these plans to be approximately $90.9 million, of which $85.1 million relates to the Central States Southeast and Southwest Areas Pension Plan.
17. ACCUMULATED OTHER COMPREHENSIVE LOSS
The components and changes to accumulated other comprehensive loss as of December 31 are as follows (in thousands):
| 2014 | 2013 | 2012 | ||||||||||
| Foreign currency translation |
||||||||||||
| Beginning balance |
$ | (1,061 | ) | $ | (1,180 | ) | $ | (1,137 | ) | |||
| Net gain on foreign currency translation, net of tax |
230 | 119 | (43 | ) | ||||||||
|
|
|
|
|
|
|
|||||||
| Ending balance |
$ | (831 | ) | $ | (1,061 | ) | $ | (1,180 | ) | |||
|
|
|
|
|
|
|
|||||||
| Pension benefits |
||||||||||||
| Beginning balance |
$ | (26,416 | ) | $ | (30,572 | ) | $ | (30,244 | ) | |||
| Amortization of prior service cost (1) |
94 | 94 | 94 | |||||||||
| Amortization of loss (1) |
(3,852 | ) | 4,062 | (422 | ) | |||||||
|
|
|
|
|
|
|
|||||||
| Ending balance |
$ | (30,174 | ) | $ | (26,416 | ) | $ | (30,572 | ) | |||
|
|
|
|
|
|
|
|||||||
| Total Accumulated Other Comprehensive Loss ending balance |
$ | (31,005 | ) | $ | (27,477 | ) | $ | (31,752 | ) | |||
|
|
|
|
|
|
|
|||||||
| (1) | Prior service cost and actuarial loss are included as part of the Company’s net periodic benefit cost. Refer to Note 16. |
Reclasses out of Accumulated Other Comprehensive Loss were nominal.
18. CAPITAL STOCK
Authorized Capital Stock
In accordance with our Amended and Restated Articles of Incorporation dated November 4, 2003, the Company is authorized to issue 50 million shares of capital stock, which includes 49 million shares of no par value common stock and 1 million shares of no par value preferred stock.
Our ABL Facility, including the Term Loan, and indenture governing the 2018 Notes contain restrictions on QDI’s ability to pay dividends on its common stock.
Preferred Stock
Of the 1 million shares of preferred stock authorized, 600,000 shares were designated as convertible preferred stock, of which 510,000 were issued and outstanding prior to the initial public offering of shares of our common stock, when they were converted into shares of common stock pursuant to our Amended and Restated Articles of Incorporation. The remaining shares of preferred stock may be issued from time to time in one or more classes or series, with such relative rights, preferences, qualifications, and limitations as our Board of Directors may adopt by resolution.
F-34
Table of Contents
August 2013 Secondary Offering
On August 14, 2013, former shareholders including funds affiliated with Apollo Global Management, LLC (“Apollo”), sold 4.7 million shares of our common stock in an underwritten public offering, at a gross price of $8.60 per share. We did not receive any proceeds from the sale of the shares by the selling shareholders in this offering. However, we incurred and paid approximately $0.5 million in underwriting fees and expenses associated with this offering. Apollo no longer owns any of our common stock.
Treasury Stock
As of December 31, 2014 and 2013, we had approximately 1.7 million and 1.6 million treasury shares, respectively, carried at a cost of approximately $11.9 million and $10.6 million, respectively. These shares were acquired pursuant to our initial public offering, our publicly announced share repurchase program, the return of shares under limited recourse secured loans to shareholders, forfeitures and share withholdings.
Share Repurchase Program
On November 20, 2012, we announced a share repurchase program pursuant to which our Board of Directors authorized the repurchase of up to $15.0 million of our common stock in an open-ended repurchase program (the “Repurchase Program”). The Repurchase Program does not have an expiration date. Stock has been, and may in the future be, purchased pursuant to the Repurchase Program, from time to time, in the open market or through private transactions, subject to market conditions. Subject to applicable laws, repurchases under the Repurchase Program may be made at such times and in such amounts as we deem appropriate and may be made pursuant to Rule 10b5-1. We are not obligated to purchase any shares under the Repurchase Program and it can be discontinued at any time that we feel additional purchases are not warranted. As of December 31, 2013, we had repurchased approximately 1.2 million shares valued at $8.1 million under the Repurchase Program. As of December 31, 2014, we have repurchased approximately 1.2 million shares valued at $8.5 million under the Repurchase Program, with authority to repurchase an additional $6.5 million of shares.
19. STOCK COMPENSATION PLANS
We account for our equity compensation plans and expense related to all stock option awards granted under FASB guidance. We apply the Black-Scholes valuation model in determining the fair value of share-based payments to employees and directors. The resulting compensation expense is recognized over the requisite service period, which is generally the vesting term of two to four years.
Active Performance Incentive Plan
As of December 31, 2014, we maintain one active stock-based incentive plan, the Quality Distribution, Inc. 2012 Equity Incentive Plan (the “2012 Equity Incentive Plan”), under which stock options, restricted shares, restricted share units and other types of equity and cash incentive awards may be granted to employees, non-employee directors and service providers. The 2012 Equity Incentive Plan became effective May 30, 2012 upon receipt of shareholder approval and expires May 30, 2022. There are 2,000,000 shares of common stock reserved for issuance under the 2012 Equity Incentive Plan.
On March 7, 2014, the Compensation Committee of the Board of Directors granted executives and certain employees 566,168 restricted stock units (“RSUs”) under our 2012 Equity Incentive Plan of which 375,584 RSUs are performance based and 190,584 RSUs are time based. The performance RSUs are based on the achievement of multi-year financial objectives established by the Compensation Committee for a performance period from January 1, 2014 through December 31, 2016. The number of shares that may be earned from the performance RSUs is based upon a target number of shares, subject to minimum and maximum numbers of shares and certain performance criteria, with shares earned for performance between the minimum performance level and the maximum performance level calculated based on a linear interpolation. The time-based RSUs vest ratably on each anniversary of the grant date over a three-year period ending March 7, 2017.
F-35
Table of Contents
The 2012 Equity Incentive Plan activity for the years ended December 31, 2014 and 2013 is as follows (in thousands, except per share data):
2012 Equity Incentive Plan — Stock Options
| Number of Shares Outstanding |
Weighted Average Exercise Price Per Share |
Weighted Average Remaining contractual Term (in years) |
Aggregate Intrinsic Value (in thousands) (a) |
|||||||||||||
| Options outstanding at December 31, 2012 |
48 | $ | 10.54 | |||||||||||||
| 2013 option activity: |
||||||||||||||||
| Granted |
335 | $ | 6.56 | |||||||||||||
| Exercised |
— | $ | — | |||||||||||||
| Canceled |
(33 | ) | $ | 6.48 | ||||||||||||
|
|
|
|
|
|||||||||||||
| Options outstanding at December 31, 2013 |
350 | $ | 7.11 | |||||||||||||
|
|
|
|
|
|||||||||||||
| 2014 option activity: |
||||||||||||||||
| Granted |
— | $ | — | |||||||||||||
| Exercised |
(37 | ) | $ | 7.93 | ||||||||||||
| Canceled |
(32 | ) | $ | 7.33 | ||||||||||||
|
|
|
|
|
|||||||||||||
| Options outstanding at December 31, 2014 |
281 | $ | 6.98 | |||||||||||||
|
|
|
|
|
|||||||||||||
| Options exercisable and expected to vest at December 31, 2014 |
269 | $ | 6.98 | 7.9 | $ | 985 | ||||||||||
|
|
|
|
|
|
|
|
|
|||||||||
| (a) | The intrinsic value of a stock option is the amount by which the market value of the underlying stock as of December 31, 2014 exceeds the exercise price of the option multiplied by the number of shares represented by such option. |
During the year ended December 31, 2014 and 2013 (in thousands, except per share data):
| • | the weighted-average grant date fair value per share of stock-based compensation granted to employees was $4.94 and $4.10, respectively; |
| • | there were approximately 37,000 stock options exercised for the year ended December 31, 2014 and none exercised for the year ended December 31, 2013; and |
| • | the total fair value of stock options that vested during the two periods above was $380 and $77, respectively. During the years ended December 31, 2014 and 2013, cash was not used to settle any equity instruments previously granted. |
2012 Equity Incentive Plan — Restricted Stock and Restricted Stock Units
| Number of Shares Outstanding |
Weighted Average Grant Date Fair Value Per Share |
Aggregate Intrinsic Value |
||||||||||
| Restricted stock and restricted stock units unvested at December 31, 2012 |
26 | $ | 10.39 | |||||||||
| 2013 activity: |
||||||||||||
| Granted |
257 | $ | 6.68 | |||||||||
| Vested |
(19 | ) | $ | 7.69 | ||||||||
| Canceled |
(41 | ) | $ | 7.30 | ||||||||
|
|
|
|
|
|||||||||
| Restricted stock and restricted stock units unvested at December 31, 2013 |
223 | $ | 6.91 | $ | 2,866 | |||||||
|
|
|
|
|
|||||||||
| 2014 activity: |
||||||||||||
| Granted |
598 | $ | 13.56 | |||||||||
| Vested |
(67 | ) | $ | 6.97 | ||||||||
| Canceled |
(28 | ) | $ | 10.15 | ||||||||
|
|
|
|
|
|||||||||
| Restricted stock and restricted stock units unvested at December 31, 2014 |
726 | $ | 12.26 | $ | 7,729 | |||||||
|
|
|
|
|
|||||||||
F-36
Table of Contents
Frozen Performance Incentive Plans
We maintain two other stock-based incentive plans, the 2003 Stock Option Plan and the 2003 Restricted Stock Incentive Plan, under which stock options and restricted shares have been granted to employees, non-employee directors, consultants and advisors but under which no additional awards may be made after May 30, 2012 because we agreed to “freeze” them from further issuances in connection with the approval of the 2012 Equity Incentive Plan.
2003 Stock Option Plan
On November 5, 2003, our Board of Directors approved the 2003 Stock Option Plan in connection with our IPO. Nonqualified stock options that were granted under the 2003 Stock Option Plan become exercisable, with limited exceptions, in 25% increments on each of the first four anniversaries of the date upon which the options are granted or vest 50% in the third and 50% in the fourth year after issuance of the grant. The contractual term of each grant is ten years.
The 2003 Stock Option Plan activity for the years ended December 31, 2014 and 2013 is as follows (in thousands, except per share data):
| Number of Shares Outstanding |
Weighted Average Exercise Price Per Share |
Weighted Average Remaining contractual Term (in years) |
Aggregate Intrinsic Value (in thousands) (a) |
|||||||||||||
| Options outstanding at December 31, 2012 |
2,204 | $ | 5.99 | |||||||||||||
| 2013 option activity: |
||||||||||||||||
| Granted |
— | $ | — | |||||||||||||
| Exercised (b)(c) |
(416 | ) | $ | 3.78 | ||||||||||||
| Canceled |
(25 | ) | $ | 11.25 | ||||||||||||
| Expired |
(56 | ) | $ | 17.00 | ||||||||||||
|
|
|
|
|
|||||||||||||
| Options outstanding at December 31, 2013 |
1,707 | $ | 6.09 | |||||||||||||
|
|
|
|
|
|||||||||||||
| 2014 option activity: |
||||||||||||||||
| Granted |
— | $ | — | |||||||||||||
| Exercised (b)(c) |
(919 | ) | $ | 5.54 | ||||||||||||
| Canceled |
(8 | ) | $ | 11.74 | ||||||||||||
| Expired |
— | $ | — | |||||||||||||
|
|
|
|
|
|||||||||||||
| Options outstanding at December 31, 2014 |
780 | $ | 6.67 | |||||||||||||
|
|
|
|
|
|||||||||||||
| Options exercisable and expected to vest at December 31, 2014 |
778 | $ | 6.65 | 5.14 | $ | 3,432 | ||||||||||
| (a) | The intrinsic value of a stock option is the amount by which the market value of the underlying stock as of December 31, 2014 exceeds the exercise price of the option multiplied by the number of shares represented by such option. |
| (b) | Shares issued upon the exercise of stock options were treated as newly issued shares. |
| (c) | There was no tax benefit recognized in 2014, 2013 and 2012 related to stock-based compensation. |
During the years ended December 31, 2014, 2013 and 2012 (in thousands, except per share data):
| • | the weighted-average grant date fair value per share of stock-based compensation granted to employees during the year ended December 31, 2012 was $8.09. There were no grants in 2013 and 2014. |
| • | the total intrinsic value of stock options exercised in 2014, 2013 and 2012 was $7.7 million, $2.6 million and $0.5 million, respectively; and |
| • | the total fair value of stock options that vested during the three periods above was $798, $1,308 and $1,223, respectively. |
During the year ended December 31, 2014, cash was not used to settle any equity instruments previously granted.
F-37
Table of Contents
2003 Restricted Stock Incentive Plan
On November 5, 2003, our Board of Directors approved the 2003 Restricted Stock Incentive Plan, in connection with our IPO. The vesting periods for grant recipients were at the discretion of the Compensation Committee of the Board of Directors.
The 2003 Restricted Stock Incentive Plan activity for the years ended December 31, 2014 and 2013 is as follows (in thousands, except per share data):
| Number of Shares Outstanding |
Weighted Average Grant Date Fair Value Per Share |
Aggregate Intrinsic Value |
||||||||||
| Restricted stock unvested at December 31, 2012 |
219 | $ | 9.19 | |||||||||
| 2013 activity: |
||||||||||||
| Granted |
— | $ | — | |||||||||
| Vested |
(89 | ) | $ | 4.43 | ||||||||
| Canceled |
(9 | ) | $ | 12.62 | ||||||||
|
|
|
|
|
|||||||||
| Restricted stock unvested at December 31, 2013 |
121 | $ | 12.40 | $ | 1,553 | |||||||
|
|
|
|
|
|||||||||
| 2014 activity: |
||||||||||||
| Granted |
— | $ | — | |||||||||
| Vested |
(80 | ) | $ | 12.58 | ||||||||
| Canceled |
(8 | ) | $ | 10.18 | ||||||||
|
|
|
|
|
|||||||||
| Restricted stock unvested at December 31, 2014 |
33 | $ | 12.50 | $ | 347 | |||||||
|
|
|
|
|
|||||||||
Accounting for Stock-Based Compensation
Restricted stock and RSUs are measured at fair value at the time of issuance. Expense for restricted stock and time-based RSUs is recognized based on fair value on a straight-line basis over the vesting period. Expense for performance RSUs is recognized on a straight-line basis over the vesting period in an amount based upon our estimation of the probability that such fair value will be realized when performance criteria are satisfied.
Compensation expense is recognized only for those options expected to vest, with forfeitures estimated based on our historical experience and future expectations.
There were no options granted during 2014. The fair value of options granted during 2013 and 2012 was based upon the Black-Scholes option-pricing model. The expected term of the options represents the estimated period of time until exercise giving consideration to the contractual terms, vesting schedules and expectations of future employee behavior. Expected stock price volatility is based on the historical volatility of our common stock, which began trading on November 13, 2003. The risk-free interest rate is based on the U.S. Treasury yield curve in effect at the time of grant with an equivalent remaining term. The Company has not paid dividends in the past and does not currently plan to pay any dividends in the foreseeable future. The Black-Scholes model was used with the following weighted-average assumptions:
| 2013 | 2012 | |||||||
| Risk free rate |
0.8 | % | 0.8 | % | ||||
| Expected life |
5 years | 5 years | ||||||
| Volatility |
78.2 | % | 77.6 | % | ||||
| Expected dividend |
— | — | ||||||
Stock-based compensation expense recognized during the years ended December 31, 2014, 2013 and 2012 for each of the types of stock-based awards was (in thousands):
| 2014 | 2013 | 2012 | ||||||||||
| Restricted stock and restricted stock units |
$ | 2,816 | $ | 1,551 | $ | 1,497 | ||||||
| Stock options |
946 | 1,534 | 1,741 | |||||||||
|
|
|
|
|
|
|
|||||||
| Total stock-based compensation expense |
$ | 3,762 | $ | 3,085 | $ | 3,238 | ||||||
|
|
|
|
|
|
|
|||||||
F-38
Table of Contents
All stock-based compensation expense is classified within “Compensation” on the Consolidated Statements of Operations. None of the stock-based compensation was capitalized during 2014, 2013 and 2012.
The following table summarizes unrecognized stock-based compensation and the weighted average period over which such stock-based compensation is expected to be recognized as of December 31, 2014 (in thousands):
| Remaining years |
||||||||
| Restricted stock and restricted stock units |
$ | 5,890 | 2.0 | |||||
| Stock options |
912 | 1.6 | ||||||
|
|
|
|||||||
| $ | 6,802 | |||||||
|
|
|
|||||||
These amounts do not include the cost of any additional awards that may be granted in future periods nor any changes in our forfeiture rate. These amounts do not include the cost of any additional restricted stock units or stock options or restricted stock that may be granted in future periods or any changes in the Company’s forfeiture rate.
20. COMMITMENTS AND CONTINGENCIES
Operating Leases
We are obligated under various noncancelable operating leases for our office facilities, office equipment, revenue equipment and vehicles. Future noncancelable lease commitments (excluding any sublease income) as of December 31, 2014, are as follows (in thousands):
| 2015 |
$ | 26,276 | ||
| 2016 |
26,273 | |||
| 2017 |
23,276 | |||
| 2018 |
12,437 | |||
| 2019 |
5,623 | |||
| Thereafter |
3,939 | |||
|
|
|
|||
| Total |
$ | 97,824 | ||
|
|
|
We expect that some of our operating lease commitments for tractors and trailers will be partially offset by rental revenue from subleasing the tractors to independent affiliates and independent owner-operators and subleasing trailers to independent affiliates. Rent expense under operating leases was $32.2 million, $30.3 million and $23.2 million for the years ended December 31, 2014, 2013 and 2012, respectively.
Environmental Matters
It is our policy to comply with all applicable environmental, safety, and health laws. We also are committed to the principles of Responsible Care®, an international chemical industry initiative to enhance the industry’s responsible management of chemicals. We have obtained independent certification that our chemical logistics’ management system is in place and functions according to professional standards, and we continue to evaluate and continuously improve our Responsible Care® Management System performance. Our current activities involve the handling, transportation and storage of bulk chemicals, both liquid and dry, wastewater from oil and gas wells and crude oil, which in many cases are classified as hazardous materials or hazardous substances. The energy logistics business operates disposal wells for non-conventional oil drilling wastewater. In addition, our former tank wash business (which was sold in 2009) and the remaining limited tank wash activities we continue to conduct, involve the generation, storage, discharge and disposal of wastes that may contain hazardous substances. As such, we and others who operate in our industry are subject to environmental, health and safety laws and regulation by U.S. federal, state and local agencies as well as foreign governmental authorities. Environmental laws and regulations are complex, and address emissions to the air, discharge onto land or water, and the generation, handling, storage, transportation, treatment and disposal of waste materials. These laws change frequently and generally require us to obtain and maintain various licenses and permits. Environmental laws have tended to become more stringent over time, and most provide for substantial fines and potential criminal sanctions for violations. Some of these laws and regulations are subject to varying and conflicting interpretations. Under certain of these laws, we could also be subject to allegations of liability for the activities of our independent affiliates or independent owner-operators.
F-39
Table of Contents
We are potentially subject to strict joint and several liability for investigating and rectifying the consequences of spills and other releases and accidents involving such substances. From time to time, we have incurred remedial costs and regulatory penalties with respect to chemical or wastewater spills and releases at our facilities and on the road, and, notwithstanding the existence of our environmental management program, we cannot: (1) assure that such obligations will not be incurred in the future, (2) predict with certainty the extent of future liabilities and costs under environmental, health, and safety laws, or (3) assure that such liabilities will not result in a material adverse effect on our business, financial condition, operating results or cash flow. We have established reserves for remediation expenses at known contamination sites when it is probable that such efforts will be required of us and the related expenses can be reasonably estimated. We have also incurred in the past, and expect to incur in the future, expenditures related to environmental compliance; however, we do not anticipate that compliance with existing environmental laws will have a material adverse effect on our earnings or competitive position.
F-40
Table of Contents
Reserves
Our policy is to accrue remediation expenses when it is probable that such efforts will be required and the related expenses can be reasonably estimated. Estimates of costs for future environmental compliance and remediation may be impacted by such factors as changes in environmental laws and regulatory requirements, the availability and application of technology, the identification of currently unknown potential remediation sites and the allocation of costs among the potentially responsible parties under the applicable statutes. Our reserves for environmental compliance and remediation are adjusted periodically as remediation efforts progress or as additional technical or legal information becomes available. It is difficult to quantify with certainty the potential financial impact of actions regarding expenditures for environmental matters, particularly remediation, and future capital expenditures for environmental control equipment. Nevertheless, based upon the information currently available, we believe that our ultimate liability arising from such environmental matters, taking into account the reserves described below, should not be material to our business or financial condition. As of December 31, 2014 and December 31, 2013, we had reserves in the amount of approximately $8.2 million and $8.3 million, respectively, for all environmental matters, of which the most significant are presented and discussed below.
| Number of Sites | Reserves (in millions) | |||||||||||||||
| December 31, 2014 |
December 31, 2013 |
December 31, 2014 |
December 31, 2013 |
|||||||||||||
| Multi-party sites |
17 | 17 | $ | 1.7 | $ | 2.1 | ||||||||||
| Sole party major sites: |
||||||||||||||||
| Bridgeport, New Jersey |
1 | 1 | 4.4 | 3.6 | ||||||||||||
| William Dick, Pennsylvania |
1 | 1 | 0.3 | 0.7 | ||||||||||||
| Other Properties |
7 | 7 | 1.8 | 1.9 | ||||||||||||
|
|
|
|
|
|
|
|
|
|||||||||
| Total |
26 | 26 | $ | 8.2 | $ | 8.3 | ||||||||||
|
|
|
|
|
|
|
|
|
|||||||||
The following descriptions of environmental matters include estimates for future expenditures that we believe are probable and are reasonably estimable. The estimate of the range of reasonably possible costs is less certain than the estimates upon which the reserves are based, and the estimated high ends of the ranges do not represent our maximum theoretical liability.
Changes to the environmental reserves are reflected in our Consolidated Statements of Operations within the “Selling and administrative” category.
Property Contamination Liabilities
We have been named as (or are alleged to be) a potentially responsible party under the Comprehensive Environmental Response, Compensation and Liability Act of 1980, as amended (“CERCLA”) and similar state laws at approximately 26 sites at December 31, 2014.
Multi-Party Sites
At 17 of the 26 sites, we are one of many parties with alleged liability and are negotiating with Federal, State or private parties on the scope of our obligations, if any. At 2 of the 17 sites, we have explicitly denied any liability and since there has been no subsequent demand for payment, we have not established a reserve for these matters. At 4 of the 17 sites, we have received notices about our potential liability; however, we do not have enough information upon which to estimate our potential liability at this time, and as a result we have not established a reserve for these matters. At 10 of the 17 sites, 2 are in settlement discussions, 4 are in long-term operation and maintenance, and 4 are in various stages of remedial investigation or remedial action work.
At 1 of the 17 sites, we are one of approximately 70 companies party to a May 2007 Administrative Order on Consent (“AOC”) with the U.S. Environmental Protection Agency (“USEPA”) to perform a Remedial Investigation/Feasibility Study (“RI/FS”) of the contaminants in the lower seventeen-mile stretch of the Passaic River, known as the Lower Passaic River Study Area. The RI/FS is expected to be submitted to the USEPA by the end of the second quarter of 2015. Sampling results indicate that the primary contaminants of concern in the river are dioxin, mercury and PCBs. Separately, in April 2014, USEPA released its Focused Feasibility Study (the “FFS”) with its proposed plan for an interim remedy of the lower eight miles of the Lower Passaic River Study Area. The USEPA’s preferred plan in the FFS would involve dredging the river bank to bank and installing an engineered cap. The
F-41
Table of Contents
USEPA accepted public comments on the FFS through August 20, 2014, and the comment period closed. The AOC for the RI/FS does not obligate us to fund or perform any remedial action contemplated by the FFS or any permanent remedy that may be recommended in the RI/FS. There are many uncertainties associated with the final cost and allocation of potential liability for any remedial actions on the river, and the Company cannot reliably estimate its portion, if any, of the final costs for this matter at this time. We have found no evidence that the Company’s operations at this location contributed any contaminants of concern to the river, and the Company believes that the evidence developed so far indicates that companies other than ours are responsible for substantially all of the remediation that may be ultimately required. We have set reserves for only our share of the costs of the RI/FS and a small dredging and capping project at River Mile 10 performed by the 70 companies that has now been completed, except for operations and maintenance of less than $0.1 million. The Company will vigorously defend itself in this matter.
We have estimated future expenditures for these 17 multi-party environmental matters to be in the range of $1.7 million to $3.8 million. As of December 31, 2014, we have reserved $1.7 million.
Sole Party Major Sites
At 9 of the 26 sites, we are alleged to be the only responsible party and are in the process of conducting investigations and/or remediation projects. Six of these projects relate to operations conducted by CLC and its subsidiaries prior to our acquisition of CLC in 1998. These six sites are: (1) Bridgeport, New Jersey; (2) William Dick, Pennsylvania; (3) Tonawanda, New York; (4) Scary Creek, West Virginia; (5) Charleston, West Virginia; and (6) East Rutherford, New Jersey. The remaining three sites relate to investigations and potential remediation that were triggered by the New Jersey Industrial Site Recovery Act (“ISRA”), which requires such investigations and remediation following the sale of industrial facilities. Each of the 6 CLC sites is discussed in more detail below. We have estimated future expenditures for these 9 properties to be in the range of $6.5 million to $16.7 million. As of December 31, 2014, we have reserved $6.5 million.
Bridgeport, New Jersey
QDI is required under the terms of three federal consent decrees to perform remediation work at this operating truck terminal and tank wash site. CLC entered into consent orders with USEPA in 1991 to treat groundwater, in 1998 to remove contamination in the wetlands, and in 2010 to assess and remediate contaminated soils at the site.
The groundwater treatment remedy negotiated with USEPA required us to construct a treatment facility for in-place treatment of groundwater contamination and a local discharge which was completed in early 2007. After various start-up issues, the treatment facility began long-term operations in July 2011 and is in the operations and maintenance phase. The plant appears to be performing in accordance with its design criteria and meeting permit requirements. Based on the second annual groundwater report, contamination was not completely delineated at the site and a limited number of additional monitoring wells were installed during 2014. The additional monitoring results appeared to indicate that the groundwater contamination at the site has now been completely delineated and no further monitoring wells are expected to be required. Wetlands contamination has been remediated with localized restoration completed. Monitoring of the restored wetlands is required by USEPA and is on-going. USEPA has requested additional monitoring through 2017. In regard to contaminated soils, USEPA finalized the feasibility study and issued a record of decision in 2009 for the limited areas that show contamination and warrant additional investigation or work. We entered into a consent order with USEPA in 2010 to perform the remediation work, which will consist primarily of in-place thermal treatment. In late 2012, USEPA concluded that our additional required site investigation work for delineation purposes was complete. We have finished the preliminary engineering design phase, the 95% design and the 100% design report for the thermal treatment of contaminated soils. The final design also includes limited groundwater extraction with treatment through the existing plant. Comments from USEPA on the 100% thermal design report have been received and substantially addressed. A Design Addendum has been submitted to address the additional limited groundwater extraction and treatment needed. The project is now entering the construction site activity phase for the thermal remediation, which starts with the installation of the thermal wells needed to perform the work. We have estimated aggregate expenditures for the Bridgeport location to be in the range of $4.4 million to $8.5 million. As of December 31, 2014, we have reserved $4.4 million.
William Dick, Pennsylvania
CLC entered into a consent order with the Pennsylvania Department of Environmental Protection and USEPA in 1995 to provide a replacement water supply to area residents, treat contaminated groundwater, and perform remediation of contaminated soils at this former wastewater disposal site. The replacement water supply is complete. We completed construction of an interim remedy that consisted of a groundwater treatment facility with local discharge in 2007 and the treatment facility began full-time operations in 2010. In order to negotiate a final long-term groundwater remedy with USEPA, a feasibility study workplan was submitted to the
F-42
Table of Contents
Agency. Although the planned soil treatment work was completed in 2007, test results indicated that soil clean-up objectives were not fully achieved in certain areas of both the shallow and deep soil subzones. Soil piles generated from isolated discrete removal actions were subsequently treated on-site and used as backfill at the site. The fieldwork for the additional limited soil remediation consisting of targeted in-situ chemical treatment of the shallow and deep soil subzones at the site was completed in 2014. USEPA issued a letter on September 30, 2014 stating that the construction phase of the remedy is complete and the remedy is operating as intended. This concludes the remedial action work for the soils operable unit in accordance with the approved remedial design. We have estimated aggregate expenditures for the William Dick location to be in the range of $0.3 million to $3.4 million. As of December 31, 2014, we have reserved $0.3 million.
Other Properties
Tonawanda, New York: CLC entered into a consent order with the New York Department of Environmental Conservation (“NYSDEC”) in 1999 obligating it to perform soil and groundwater remediation at this former truck terminal and tank wash site. The state issued a record of decision in 2006. The remedial design work plan has been approved by the NYSDEC, and the remedial action phase is expected to begin during the second quarter of 2015.
Scary Creek, West Virginia: CLC received a cleanup notice from the state environmental authority in 1994. The state and we have agreed that remediation can be conducted under the state’s voluntary clean-up program (instead of the state superfund enforcement program). We are currently completing the originally planned remedial investigation and the additional site investigation work which, for 2015 only, will include groundwater monitoring.
Charleston, West Virginia: CLC completed its remediation plan for a former drum disposal area in 1995 at this truck terminal and tank wash site under the terms of a state hazardous waste permit. Supplemental groundwater monitoring was also required and completed. In 2012, we entered into the state’s voluntary clean-up program which requires us to perform additional sampling to close the site. The sampling work phase that was negotiated with the State of West Virginia has been completed at the site, and a report was submitted to the West Virginia Department of Environmental Protection (“WVDEP”) in which we requested confirmation from the WVDEP that no additional sampling work was necessary. WVDEP concurred and approved the Site Assessment Report in July 2014. A Risk Assessment Report was then prepared, as requested, and submitted to WVDEP for review and approval on September 30, 2014.
East Rutherford, New Jersey: This former truck terminal property was sold after CLC completed a plan of remediation relating to a diesel fuel release but New Jersey Department of Environmental Protection (“NJDEP”) did not grant closure. Additional soil sampling and groundwater monitoring work was deemed necessary to close the site under the technical requirements of the State’s licensed site remediation professional program. Soil sampling results indicate further sampling is necessary to delineate the extent of soil contamination in one area at the property that may require limited remediation. Soil delineation work is expected to be completed during 2015.
ISRA New Jersey Facilities: We are obliged to conduct investigations and remediation at three current or former New Jersey tank wash and terminal sites pursuant to the state’s ISRA program, which requires such remediation following the sale of facilities after 1983. Two of the sites are in the process of remedial investigation with projections set in contemplation of limited soil remediation expense for contaminated areas.
One site has completed the investigation phase and a final report was submitted to NJDEP. In accordance with the report findings and with the concurrence of the NJDEP, remedial efforts included limited soil excavation at the site, deed recordation, placement of clean fill and the designation of a classification exception area for the groundwater. No further field remediation work is expected, and this site has entered a long-term monitoring phase.
We have estimated aggregate future expenditures for Tonawanda, Scary Creek, Charleston, East Rutherford and ISRA New Jersey to be in the range of $1.8 million to $4.8 million. As of December 31, 2014, we have reserved $1.8 million.
Other Legal Matters
We are from time to time involved in routine litigation incidental to the conduct of our business. We believe that no such routine litigation currently pending against us, if adversely determined, would have a material adverse effect on our consolidated financial position, results of operations or cash flows.
F-43
Table of Contents
21. GUARANTEES
In conjunction with certain third-party financing vendors, we have established a lease purchase program to enable certain independent owner-operators and independent affiliates to lease tractors from those third-party vendors. As part of this program, we have agreed with those third-party vendors to guarantee certain lease payment obligations of participating independent owner-operators and independent affiliates in certain circumstances. The guarantees expire at various dates beginning in 2015 through 2021 and are for an average outstanding loan amount per tractor of approximately $0.1 million.
Our estimated aggregate maximum exposure under these lease guarantees was approximately $37.9 million and $13.5 million as of December 31, 2014 and 2013, respectively, which represents the total amount of the remaining lease payments on all outstanding guaranteed leases as of that date. However, upon a default, we are likely to, and have contractual rights to, take actions to reduce or recoup our expenditures, including purchasing the tractor and reselling it to recover all or a portion of the amounts paid, or facilitating an arrangement between the third-party vendor and another independent owner-operator or independent affiliate to assume the lease. In addition, up to 50% of any realized losses related to independent owner-operators managed by independent affiliates could be recouped from those independent affiliates pursuant to agreements with those independent affiliates. Therefore, we believe our potential exposure is substantially less than $37.9 million and would not have a material adverse effect on our consolidated financial position, results of operations or cash flows. We did not incur any material levels of default under these leases during the years ended December 31, 2014 and 2013.
22. TRANSACTIONS WITH RELATED PARTIES
On August 14, 2013, Apollo and its affiliated funds sold all of its QDI common stock in an underwritten public offering. As a result, Apollo can no longer influence matters requiring shareholder approval.
As of August 13, 2013, prior to the sale of all of Apollo’s QDI common stock, two of our customers (Momentive Specialty Chemicals and Taminco) were controlled by Apollo. Revenues from these customers were $14.3 million in 2013. In 2012, three of our customers (Momentive Specialty Chemicals, Taminco and Lyondell Chemical) were controlled by Apollo. Revenues from these customers were $14.1 million in 2012. All pricing with the companies controlled by Apollo was based on market rates, including such factors as total expected revenue to be generated by the customer, number of loads to be hauled and the number of miles to be driven.
23. GUARANTOR SUBSIDIARIES
At and during the year ended December 31, 2014, there were outstanding 2018 Notes that were issued by our subsidiaries, QD LLC and QD Capital. The payment obligations of QD LLC and QD Capital under the 2018 Notes are guaranteed by QDI and by all of its domestic subsidiaries other than immaterial subsidiaries as further described below.
The 2018 Notes are the senior obligations of our subsidiaries, QD LLC and QD Capital, and are secured by a subordinated, second-priority lien on assets that secure our ABL Facility through a collateral agreement that is separate from the indenture under which these notes were issued. Pursuant to an intercreditor agreement, the liens on the collateral securing the 2018 Notes rank junior in right of payment to the ABL Facility, including the Term Loan, and obligations under certain hedging agreements, cash management obligations and certain other first-lien obligations. Decisions regarding the maintenance and release of the collateral secured by the collateral agreement are made by the lenders under our ABL Facility, and neither the indenture trustee nor the holders of the 2018 Notes have control of decisions regarding the release of the collateral.
The 2018 Notes are also guaranteed on a second-priority senior secured basis, jointly and severally, by QDI, subsidiary guarantors, and certain of our future U.S. restricted subsidiaries. The guarantees of the subsidiary guarantors are full and unconditional subject to customary release provisions for sales of a subsidiary in compliance with other provisions of the indenture for the 2018 Notes (the “Notes Indenture”), foreclosures of a pledge of the equity interests of the subsidiary, the right to designate a subsidiary as unrestricted under the terms of the Notes Indenture, the discharge of the 2018 Notes or the defeasance of the Notes Indenture. The guarantee of QDI is full and unconditional.
The subsidiary guarantors of all of the 2018 Notes are all of our direct and indirect domestic subsidiaries other than immaterial subsidiaries. No non-domestic subsidiaries are guarantor subsidiaries. QD Capital has no material assets or operations. QD LLC, all of the subsidiary guarantors and QD Capital are 100% owned by QDI. The subsidiary guarantors are 100%-owned subsidiaries of QD LLC. QD LLC conducts substantially all of its business through and derives virtually all of its income from its subsidiaries. Therefore, its ability to make required principal and interest payments with respect to its indebtedness depends on the earnings of subsidiaries and its ability to receive funds from its subsidiaries through dividend and other payments.
F-44
Table of Contents
QDI has no significant restrictions on its ability to receive funds from its subsidiaries. The ABL Facility, including the Term Loan, and the Notes Indenture contain certain limitations on QD LLC’s ability to make distributions to QDI. We do not consider these restrictions to be significant, because QDI is a holding company with no significant operations or assets, other than ownership of 100% of QD LLC’s membership units. QD LLC’s direct and indirect wholly-owned subsidiaries are generally permitted to make distributions to QD LLC, which is the principal obligor under the ABL Facility, the Term Loan and the 2018 Notes. We do not believe that additional financial or narrative information about QDI, QD LLC, QD Capital or the subsidiary guarantors would be material to evaluating the guarantees.
The following condensed consolidating financial information for QDI, QD LLC, and QD Capital, which has no material assets or operations, non-guarantor subsidiaries and combined guarantor subsidiaries presents:
| • | Condensed consolidating balance sheets at December 31, 2014 and December 31, 2013 and condensed consolidating statements of operations for the years ended December 31, 2014 and 2013, and the condensed consolidating statements of cash flows for each of the years ended December 31, 2014 and 2013. |
| • | Elimination entries necessary to consolidate the parent company and all its subsidiaries. |
In 2014, the Company revised certain amounts within its guarantor subsidiaries condensed consolidating balance sheet. Specifically, the investment in subsidiary, intercompany, and retained earnings balances have been adjusted resulting in revisions between QDI, QD LLC and QD Capital, and its guarantor subsidiaries. The impact of the revision, which impacted only the condensed consolidating balance sheet, is not material in the aggregate and had no impact or effect on our consolidated financial statements for any periods presented. Financial definitions and provisions under the 2018 Notes, the ABL Facility and the Term Loan are calculated solely on the basis of our consolidated financial statements, and the revision has no impact on our compliance with the provisions of our indebtedness. As prior period information is presented, the Company will similarly revise the condensed consolidating balance sheets in future filings.
Condensed Consolidating Balance Sheet—Revised
As of December 31, 2013
| QDI | QD LLC and QD Capital |
Guarantor Subsidiaries |
Non-Guarantor Subsidiaries |
Eliminations | Consolidated | |||||||||||||||||||||||||||||||||||||||||||
| Previously Reported |
As Reported |
Previously Reported |
As Reported |
Previously Reported |
As Reported |
Previously Reported |
As Reported |
Previously Reported |
As Reported |
Previously Reported |
As Reported |
|||||||||||||||||||||||||||||||||||||
| ASSETS |
||||||||||||||||||||||||||||||||||||||||||||||||
| Investment in subsidiaries — long-term |
$ | (123,790 | ) | $ | (123,790 | ) | $ | 388,157 | $ | 322,433 | $ | — | $ | — | $ | — | $ | — | $ | (264,367 | ) | $ | (198,643 | ) | $ | — | $ | — | ||||||||||||||||||||
| Intercompany—long-term |
$ | 144,057 | $ | 144,057 | $ | 194,293 | $ | 260,017 | $ | 359,733 | $ | 223,304 | $ | 12,213 | $ | 6,375 | $ | (710,296 | ) | $ | (633,753 | ) | $ | — | $ | — | ||||||||||||||||||||||
| Total |
$ | 20,267 | $ | 20,267 | $ | 582,450 | $ | 582,450 | $ | 359,733 | $ | 223,304 | $ | 12,213 | $ | 6,375 | $ | (974,663 | ) | $ | (832,396 | ) | $ | — | $ | — | ||||||||||||||||||||||
| LIABILITIES AND |
||||||||||||||||||||||||||||||||||||||||||||||||
| Intercompany—long-term |
$ | — | $ | — | $ | 355,044 | $ | 355,044 | $ | 350,562 | $ | 278,581 | $ | 4,690 | $ | 128 | $ | (710,296 | ) | $ | (633,753 | ) | $ | — | $ | — | ||||||||||||||||||||||
| Accumulated (deficit) retained earnings |
$ | (270,505 | ) | $ | (270,505 | ) | $ | (262,159 | ) | $ | (262,159 | ) | $ | 15,881 | $ | (48,567 | ) | $ | 5,085 | $ | 3,809 | $ | 241,193 | $ | 306,917 | $ | (270,505 | ) | $ | (270,505 | ) | |||||||||||||||||
| Total |
$ | (270,505 | ) | $ | (270,505 | ) | $ | 92,885 | $ | 92,885 | $ | 366,443 | $ | 230,014 | $ | 9,775 | $ | 3,937 | $ | (469,103 | ) | $ | (326,836 | ) | $ | (270,505 | ) | $ | (270,505 | ) | ||||||||||||||||||
F-45
Table of Contents
QUALITY DISTRIBUTION, INC. AND SUBSIDIARIES
Condensed Consolidating Statement of Operations
For the Year Ended December 31, 2014
(in thousands)
| QDI | QD LLC & QD Capital |
Guarantor Subsidiaries |
Non-Guarantor Subsidiaries |
Eliminations | Consolidated | |||||||||||||||||||
| Operating revenues: |
||||||||||||||||||||||||
| Transportation |
$ | — | $ | — | $ | 717,495 | $ | — | $ | — | $ | 717,495 | ||||||||||||
| Service revenue |
— | — | 136,599 | 53 | — | 136,652 | ||||||||||||||||||
| Fuel surcharge |
— | — | 137,611 | — | — | 137,611 | ||||||||||||||||||
|
|
|
|
|
|
|
|
|
|
|
|
|
|||||||||||||
| Total operating revenues |
— | — | 991,705 | 53 | — | 991,758 | ||||||||||||||||||
|
|
|
|
|
|
|
|
|
|
|
|
|
|||||||||||||
| Operating expenses: |
||||||||||||||||||||||||
| Purchased transportation |
— | — | 667,795 | 4 | — | 667,799 | ||||||||||||||||||
| Compensation |
— | — | 92,435 | — | — | 92,435 | ||||||||||||||||||
| Fuel, supplies and maintenance |
— | — | 99,992 | (7 | ) | — | 99,985 | |||||||||||||||||
| Depreciation and amortization |
— | — | 21,617 | — | — | 21,617 | ||||||||||||||||||
| Selling and administrative |
— | 123 | 32,617 | 55 | — | 32,795 | ||||||||||||||||||
| Insurance costs |
— | — | 21,040 | 30 | — | 21,070 | ||||||||||||||||||
| Taxes and licenses |
— | — | 3,529 | 7 | — | 3,536 | ||||||||||||||||||
| Communication and utilities |
— | — | 3,872 | — | — | 3,872 | ||||||||||||||||||
| Gain on disposal of property and equipment |
— | — | (2,581 | ) | — | — | (2,581 | ) | ||||||||||||||||
|
|
|
|
|
|
|
|
|
|
|
|
|
|||||||||||||
| Operating (loss) income |
— | (123 | ) | 51,389 | (36 | ) | — | 51,230 | ||||||||||||||||
| Interest expense, non-related party, net |
— | 27,448 | 618 | — | — | 28,066 | ||||||||||||||||||
| Interest (income) expense, related party, net |
— | (27,448 | ) | 27,616 | (168 | ) | — | — | ||||||||||||||||
| Gain on extinguishment of debt |
— | — | (4,217 | ) | — | — | (4,217 | ) | ||||||||||||||||
| Write-off of debt issuance costs |
— | 476 | — | — | — | 476 | ||||||||||||||||||
| Other expense (income) |
2 | — | (403 | ) | 257 | — | (144 | ) | ||||||||||||||||
|
|
|
|
|
|
|
|
|
|
|
|
|
|||||||||||||
| (Loss) income before income taxes |
(2 | ) | (599 | ) | 27,775 | (125 | ) | — | 27,049 | |||||||||||||||
| (Benefit from) provision for income taxes |
(537 | ) | — | 7,032 | (86 | ) | — | 6,409 | ||||||||||||||||
| Equity in income of subsidiaries |
20,105 | 20,704 | — | — | (40,809 | ) | — | |||||||||||||||||
|
|
|
|
|
|
|
|
|
|
|
|
|
|||||||||||||
| Net income (loss) |
$ | 20,640 | $ | 20,105 | $ | 20,743 | $ | (39 | ) | $ | (40,809 | ) | $ | 20,640 | ||||||||||
|
|
|
|
|
|
|
|
|
|
|
|
|
|||||||||||||
| Total other comprehensive (loss) income |
(3,528 | ) | (3,528 | ) | (3,758 | ) | 230 | 7,056 | (3,528 | ) | ||||||||||||||
|
|
|
|
|
|
|
|
|
|
|
|
|
|||||||||||||
| Comprehensive income |
$ | 17,112 | $ | 16,577 | $ | 16,985 | $ | 191 | $ | (33,753 | ) | $ | 17,112 | |||||||||||
|
|
|
|
|
|
|
|
|
|
|
|
|
|||||||||||||
F-46
Table of Contents
QUALITY DISTRIBUTION, INC. AND SUBSIDIARIES
Condensed Consolidating Statement of Operations
For the Year Ended December 31, 2013
(in thousands)
| QDI | QD LLC & QD Capital |
Guarantor Subsidiaries |
Non-Guarantor Subsidiaries |
Eliminations | Consolidated | |||||||||||||||||||
| Operating revenues: |
||||||||||||||||||||||||
| Transportation |
$ | — | $ | — | $ | 675,094 | $ | — | $ | — | $ | 675,094 | ||||||||||||
| Service revenue |
— | — | 129,612 | 153 | — | 129,765 | ||||||||||||||||||
| Fuel surcharge |
— | — | 124,951 | — | — | 124,951 | ||||||||||||||||||
|
|
|
|
|
|
|
|
|
|
|
|
|
|||||||||||||
| Total operating revenues |
— | — | 929,657 | 153 | — | 929,810 | ||||||||||||||||||
|
|
|
|
|
|
|
|
|
|
|
|
|
|||||||||||||
| Operating expenses: |
||||||||||||||||||||||||
| Purchased transportation |
— | — | 594,708 | — | — | 594,708 | ||||||||||||||||||
| Compensation |
— | — | 98,681 | — | — | 98,681 | ||||||||||||||||||
| Fuel, supplies and maintenance |
— | — | 105,910 | 7 | — | 105,917 | ||||||||||||||||||
| Depreciation and amortization |
— | — | 26,121 | — | — | 26,121 | ||||||||||||||||||
| Selling and administrative |
— | 160 | 31,321 | 53 | — | 31,534 | ||||||||||||||||||
| Insurance costs |
— | — | 19,137 | 32 | — | 19,169 | ||||||||||||||||||
| Taxes and licenses |
— | — | 3,758 | — | — | 3,758 | ||||||||||||||||||
| Communication and utilities |
— | — | 3,840 | — | — | 3,840 | ||||||||||||||||||
| Gain on disposal of property and equipment |
— | — | (1,579 | ) | (871 | ) | — | (2,450 | ) | |||||||||||||||
| Impairment charges |
— | — | 91,296 | — | — | 91,296 | ||||||||||||||||||
|
|
|
|
|
|
|
|
|
|
|
|
|
|||||||||||||
| Operating (loss) income |
— | (160 | ) | (43,536 | ) | 932 | — | (42,764 | ) | |||||||||||||||
| Interest expense (income), non-related party, net |
— | 29,427 | 868 | (3 | ) | — | 30,292 | |||||||||||||||||
| Interest (income) expense, related party, net |
— | (29,427 | ) | 29,758 | (331 | ) | — | — | ||||||||||||||||
| Write-off of debt issuance costs |
— | 521 | — | — | — | 521 | ||||||||||||||||||
| Other expense (income) |
398 | — | (7,803 | ) | 149 | — | (7,256 | ) | ||||||||||||||||
|
|
|
|
|
|
|
|
|
|
|
|
|
|||||||||||||
| (Loss) income before income taxes |
(398 | ) | (681 | ) | (66,359 | ) | 1,117 | — | (66,321 | ) | ||||||||||||||
| (Benefit from) provision for income taxes |
(61 | ) | — | (24,610 | ) | 388 | — | (24,283 | ) | |||||||||||||||
| Equity in loss of subsidiaries |
(41,701 | ) | (41,020 | ) | — | — | 82,721 | — | ||||||||||||||||
|
|
|
|
|
|
|
|
|
|
|
|
|
|||||||||||||
| Net (loss) income |
$ | (42,038 | ) | $ | (41,701 | ) | $ | (41,749 | ) | $ | 729 | $ | 82,721 | $ | (42,038 | ) | ||||||||
|
|
|
|
|
|
|
|
|
|
|
|
|
|||||||||||||
| Total other comprehensive income |
4,275 | 4,275 | 4,156 | 119 | (8,550 | ) | 4,275 | |||||||||||||||||
|
|
|
|
|
|
|
|
|
|
|
|
|
|||||||||||||
| Comprehensive (loss) income |
$ | (37,763 | ) | $ | (37,426 | ) | $ | (37,593 | ) | $ | 848 | $ | 74,171 | $ | (37,763 | ) | ||||||||
|
|
|
|
|
|
|
|
|
|
|
|
|
|||||||||||||
F-47
Table of Contents
QUALITY DISTRIBUTION, INC. AND SUBSIDIARIES
Condensed Consolidating Statement of Operations
For the Year Ended December 31, 2012
(in thousands)
| QDI | QD LLC & QD Capital |
Guarantor Subsidiaries |
Non-Guarantor Subsidiaries |
Eliminations | Consolidated | |||||||||||||||||||
| Operating revenues: |
||||||||||||||||||||||||
| Transportation |
$ | — | $ | — | $ | 597,406 | $ | — | $ | — | $ | 597,406 | ||||||||||||
| Service revenue |
— | — | 120,698 | 403 | — | 121,101 | ||||||||||||||||||
| Fuel surcharge |
— | — | 123,611 | — | — | 123,611 | ||||||||||||||||||
|
|
|
|
|
|
|
|
|
|
|
|
|
|||||||||||||
| Total operating revenues |
— | — | 841,715 | 403 | — | 842,118 | ||||||||||||||||||
|
|
|
|
|
|
|
|
|
|
|
|
|
|||||||||||||
| Operating expenses: |
||||||||||||||||||||||||
| Purchased transportation |
— | — | 552,524 | — | — | 552,524 | ||||||||||||||||||
| Compensation |
— | — | 82,143 | — | — | 82,143 | ||||||||||||||||||
| Fuel, supplies and maintenance |
— | — | 82,033 | — | — | 82,033 | ||||||||||||||||||
| Depreciation and amortization |
— | — | 21,090 | — | — | 21,090 | ||||||||||||||||||
| Selling and administrative |
— | 39 | 33,758 | 85 | — | 33,882 | ||||||||||||||||||
| Insurance costs |
— | — | 15,821 | 9 | — | 15,830 | ||||||||||||||||||
| Taxes and licenses |
— | — | 2,825 | — | — | 2,825 | ||||||||||||||||||
| Communication and utilities |
— | — | 3,636 | — | — | 3,636 | ||||||||||||||||||
| Gain on disposal of property and equipment |
— | — | (846 | ) | (142 | ) | — | (988 | ) | |||||||||||||||
|
|
|
|
|
|
|
|
|
|
|
|
|
|||||||||||||
| Operating (loss) income |
— | (39 | ) | 48,731 | 451 | — | 49,143 | |||||||||||||||||
| Interest expense (income), non-related party, net |
— | 28,490 | 782 | (14 | ) | — | 29,258 | |||||||||||||||||
| Interest (income) expense, related party, net |
— | (28,490 | ) | 28,905 | (415 | ) | — | — | ||||||||||||||||
| Other expense |
— | — | (2,849 | ) | (15 | ) | — | (2,864 | ) | |||||||||||||||
|
|
|
|
|
|
|
|
|
|
|
|
|
|||||||||||||
| (Loss) income before income taxes |
— | (39 | ) | 21,893 | 895 | — | 22,749 | |||||||||||||||||
| Provision for (benefit from) income taxes |
3,306 | — | (30,799 | ) | 166 | — | (27,327 | ) | ||||||||||||||||
| Equity in earnings of subsidiaries |
53,382 | 53,421 | — | — | (106,803 | ) | — | |||||||||||||||||
|
|
|
|
|
|
|
|
|
|
|
|
|
|||||||||||||
| Net income |
$ | 50,076 | $ | 53,382 | $ | 52,692 | $ | 729 | $ | (106,803 | ) | $ | 50,076 | |||||||||||
|
|
|
|
|
|
|
|
|
|
|
|
|
|||||||||||||
| Total other comprehensive loss |
(371 | ) | (371 | ) | (328 | ) | (43 | ) | 742 | (371 | ) | |||||||||||||
|
|
|
|
|
|
|
|
|
|
|
|
|
|||||||||||||
| Comprehensive income |
$ | 49,705 | $ | 53,011 | $ | 52,364 | $ | 686 | $ | (106,061 | ) | $ | 49,705 | |||||||||||
|
|
|
|
|
|
|
|
|
|
|
|
|
|||||||||||||
F-48
Table of Contents
QUALITY DISTRIBUTION, INC. AND SUBSIDIARIES
Consolidating Balance Sheet, December 31, 2014
(in thousands)
| QDI | QD LLC and QD Capital |
Guarantor Subsidiaries |
Non-Guarantor Subsidiaries |
Eliminations | Consolidated | |||||||||||||||||||
| ASSETS |
||||||||||||||||||||||||
| Current assets: |
||||||||||||||||||||||||
| Cash and cash equivalents |
$ | — | $ | — | $ | 1,221 | $ | 137 | $ | — | $ | 1,358 | ||||||||||||
| Accounts receivable, net |
— | — | 136,786 | 4 | — | 136,790 | ||||||||||||||||||
| Prepaid expenses |
— | 58 | 14,013 | 47 | — | 14,118 | ||||||||||||||||||
| Deferred tax asset, net |
— | — | 29,333 | — | — | 29,333 | ||||||||||||||||||
| Intercompany |
— | — | 457,540 | 96 | (457,636 | ) | — | |||||||||||||||||
| Other |
34 | — | 10,346 | (6 | ) | — | 10,374 | |||||||||||||||||
|
|
|
|
|
|
|
|
|
|
|
|
|
|||||||||||||
| Total current assets |
34 | 58 | 649,239 | 278 | (457,636 | ) | 191,973 | |||||||||||||||||
| Property and equipment, net |
— | — | 156,249 | — | — | 156,249 | ||||||||||||||||||
| Assets-held-for-sale |
— | — | 2,040 | — | — | 2,040 | ||||||||||||||||||
| Goodwill |
— | — | 34,896 | — | — | 34,896 | ||||||||||||||||||
| Intangibles, net |
— | — | 15,388 | — | — | 15,388 | ||||||||||||||||||
| Non-current deferred tax asset, net |
(1,702 | ) | — | 20,644 | — | — | 18,942 | |||||||||||||||||
| Investment in subsidiaries |
(107,213 | ) | 339,715 | — | — | (232,502 | ) | — | ||||||||||||||||
| Intercompany |
158,130 | 250,160 | 221,885 | 6,633 | (636,808 | ) | — | |||||||||||||||||
| Other assets |
— | 7,649 | 646 | — | — | 8,295 | ||||||||||||||||||
|
|
|
|
|
|
|
|
|
|
|
|
|
|||||||||||||
| Total assets |
$ | 49,249 | $ | 597,582 | $ | 1,100,987 | $ | 6,911 | $ | (1,326,946 | ) | $ | 427,783 | |||||||||||
|
|
|
|
|
|
|
|
|
|
|
|
|
|||||||||||||
| LIABILITIES AND SHAREHOLDERS’ (DEFICIT) EQUITY |
||||||||||||||||||||||||
| Current liabilities: |
||||||||||||||||||||||||
| Current maturities of indebtedness |
$ | — | $ | — | $ | 2,699 | $ | — | $ | — | $ | 2,699 | ||||||||||||
| Current maturities of capital lease obligations |
— | — | 334 | — | — | 334 | ||||||||||||||||||
| Accounts payable |
— | — | 12,955 | — | — | 12,955 | ||||||||||||||||||
| Intercompany |
80,943 | — | 376,693 | — | (457,636 | ) | — | |||||||||||||||||
| Independent affiliates and independent owner-operators payable |
— | — | 15,110 | — | — | 15,110 | ||||||||||||||||||
| Accrued expenses |
— | 3,512 | 29,061 | 44 | — | 32,617 | ||||||||||||||||||
| Environmental liabilities |
— | — | 4,389 | — | — | 4,389 | ||||||||||||||||||
| Accrued loss and damage claims |
— | — | 8,851 | — | — | 8,851 | ||||||||||||||||||
|
|
|
|
|
|
|
|
|
|
|
|
|
|||||||||||||
| Total current liabilities |
80,943 | 3,512 | 450,092 | 44 | (457,636 | ) | 76,955 | |||||||||||||||||
| Long-term indebtedness, less current maturities |
— | 347,814 | 266 | — | — | 348,080 | ||||||||||||||||||
| Capital lease obligations, less current maturities |
— | — | 182 | — | — | 182 | ||||||||||||||||||
| Environmental liabilities |
— | — | 3,830 | — | — | 3,830 | ||||||||||||||||||
| Accrued loss and damage claims |
— | — | 10,493 | — | — | 10,493 | ||||||||||||||||||
| Intercompany |
— | 353,469 | 283,056 | 283 | (636,808 | ) | — | |||||||||||||||||
| Other non-current liabilities |
— | — | 19,937 | — | — | 19,937 | ||||||||||||||||||
|
|
|
|
|
|
|
|
|
|
|
|
|
|||||||||||||
| Total liabilities |
80,943 | 704,795 | 767,856 | 327 | (1,094,444 | ) | 459,477 | |||||||||||||||||
|
|
|
|
|
|
|
|
|
|
|
|
|
|||||||||||||
| Shareholders’ (deficit) equity: |
||||||||||||||||||||||||
| Common stock |
450,625 | 354,963 | 390,760 | 3,597 | (749,320 | ) | 450,625 | |||||||||||||||||
| Treasury stock |
(11,860 | ) | — | — | — | — | (11,860 | ) | ||||||||||||||||
| Accumulated (deficit) retained earnings |
(249,865 | ) | (242,054 | ) | (27,824 | ) | 3,770 | 266,108 | (249,865 | ) | ||||||||||||||
| Stock recapitalization |
(189,589 | ) | (189,589 | ) | — | (55 | ) | 189,644 | (189,589 | ) | ||||||||||||||
| Accumulated other comprehensive loss |
(31,005 | ) | (30,533 | ) | (29,805 | ) | (728 | ) | 61,066 | (31,005 | ) | |||||||||||||
|
|
|
|
|
|
|
|
|
|
|
|
|
|||||||||||||
| Total shareholders’ (deficit) equity |
(31,694 | ) | (107,213 | ) | 333,131 | 6,584 | (232,502 | ) | (31,694 | ) | ||||||||||||||
|
|
|
|
|
|
|
|
|
|
|
|
|
|||||||||||||
| Total liabilities and shareholders’ (deficit) equity |
$ | 49,249 | $ | 597,582 | $ | 1,100,987 | $ | 6,911 | $ | (1,326,946 | ) | $ | 427,783 | |||||||||||
|
|
|
|
|
|
|
|
|
|
|
|
|
|||||||||||||
F-49
Table of Contents
QUALITY DISTRIBUTION, INC. AND SUBSIDIARIES
Consolidating Balance Sheet, December 31, 2013
(in thousands)
| QDI | QD LLC and QD Capital |
Guarantor Subsidiaries |
Non-Guarantor Subsidiaries |
Eliminations | Consolidated | |||||||||||||||||||
| ASSETS |
||||||||||||||||||||||||
| Current assets: |
||||||||||||||||||||||||
| Cash and cash equivalents |
$ | — | $ | — | $ | 1,876 | $ | 81 | $ | — | $ | 1,957 | ||||||||||||
| Accounts receivable, net |
— | — | 120,916 | 16 | — | 120,932 | ||||||||||||||||||
| Prepaid expenses |
— | 58 | 13,321 | 22 | — | 13,401 | ||||||||||||||||||
| Deferred tax asset, net |
— | — | 20,709 | — | — | 20,709 | ||||||||||||||||||
| Intercompany |
— | — | 410,521 | 109 | (410,630 | ) | — | |||||||||||||||||
| Other current assets |
(18 | ) | — | 10,084 | (147 | ) | — | 9,919 | ||||||||||||||||
|
|
|
|
|
|
|
|
|
|
|
|
|
|||||||||||||
| Total current assets |
(18 | ) | 58 | 577,427 | 81 | (410,630 | ) | 166,918 | ||||||||||||||||
| Property and equipment, net |
— | — | 170,114 | — | — | 170,114 | ||||||||||||||||||
| Assets held-for-sale |
— | — | 1,129 | — | — | 1,129 | ||||||||||||||||||
| Goodwill |
— | — | 32,955 | — | — | 32,955 | ||||||||||||||||||
| Intangibles, net |
— | — | 16,149 | — | — | 16,149 | ||||||||||||||||||
| Non-current deferred tax asset, net |
(2,239 | ) | — | 33,640 | — | — | 31,401 | |||||||||||||||||
| Investment in subsidiaries |
(123,790 | ) | 322,433 | — | — | (198,643 | ) | — | ||||||||||||||||
| Intercompany |
144,057 | 260,017 | 223,304 | 6,375 | (633,753 | ) | — | |||||||||||||||||
| Other assets |
— | 7,681 | 902 | — | — | 8,583 | ||||||||||||||||||
|
|
|
|
|
|
|
|
|
|
|
|
|
|||||||||||||
| Total assets |
$ | 18,010 | $ | 590,189 | $ | 1,055,620 | $ | 6,456 | $ | (1,243,026 | ) | $ | 427,249 | |||||||||||
|
|
|
|
|
|
|
|
|
|
|
|
|
|||||||||||||
| LIABILITIES, REDEEMABLE NONCONTROLLING INTEREST AND SHAREHOLDERS’ (DEFICIT) EQUITY |
||||||||||||||||||||||||
| Current liabilities: |
||||||||||||||||||||||||
| Current maturities of indebtedness |
$ | — | $ | 5,833 | $ | 2,859 | $ | — | $ | — | $ | 8,692 | ||||||||||||
| Current maturities of capital lease obligations |
— | — | 1,888 | — | — | 1,888 | ||||||||||||||||||
| Accounts payable |
— | — | 10,248 | — | — | 10,248 | ||||||||||||||||||
| Intercompany |
74,246 | — | 336,384 | — | (410,630 | ) | — | |||||||||||||||||
| Independent affiliates and independent owner-operators payable |
— | — | 14,398 | — | — | 14,398 | ||||||||||||||||||
| Accrued expenses |
15 | 3,892 | 26,672 | 1 | — | 30,580 | ||||||||||||||||||
| Environmental liabilities |
— | — | 3,818 | — | — | 3,818 | ||||||||||||||||||
| Accrued loss and damage claims |
— | — | 8,532 | — | — | 8,532 | ||||||||||||||||||
|
|
|
|
|
|
|
|
|
|
|
|
|
|||||||||||||
| Total current liabilities |
74,261 | 9,725 | 404,799 | 1 | (410,630 | ) | 78,156 | |||||||||||||||||
| Long-term indebtedness, less current maturities |
— | 349,210 | 20,520 | — | — | 369,730 | ||||||||||||||||||
| Capital lease obligations, less current maturities |
— | — | 2,995 | — | — | 2,995 | ||||||||||||||||||
| Environmental liabilities |
— | — | 4,479 | — | — | 4,479 | ||||||||||||||||||
| Accrued loss and damage claims |
— | — | 10,747 | — | — | 10,747 | ||||||||||||||||||
| Intercompany |
— | 355,044 | 278,581 | 128 | (633,753 | ) | — | |||||||||||||||||
| Other non-current liabilities |
— | — | 17,353 | 40 | — | 17,393 | ||||||||||||||||||
|
|
|
|
|
|
|
|
|
|
|
|
|
|||||||||||||
| Total liabilities |
74,261 | 713,979 | 739,474 | 169 | (1,044,383 | ) | 483,500 | |||||||||||||||||
| Shareholders’ (deficit) equity: |
||||||||||||||||||||||||
| Common stock |
441,877 | 354,963 | 390,760 | 3,491 | (749,214 | ) | 441,877 | |||||||||||||||||
| Treasury stock |
(10,557 | ) | — | — | — | — | (10,557 | ) | ||||||||||||||||
| Accumulated (deficit) retained earnings |
(270,505 | ) | (262,159 | ) | (48,567 | ) | 3,809 | 306,917 | (270,505 | ) | ||||||||||||||
| Stock recapitalization |
(189,589 | ) | (189,589 | ) | — | (55 | ) | 189,644 | (189,589 | ) | ||||||||||||||
| Accumulated other comprehensive loss |
(27,477 | ) | (27,005 | ) | (26,047 | ) | (958 | ) | 54,010 | (27,477 | ) | |||||||||||||
|
|
|
|
|
|
|
|
|
|
|
|
|
|||||||||||||
| Total shareholders’ (deficit) equity |
(56,251 | ) | (123,790 | ) | 316,146 | 6,287 | (198,643 | ) | (56,251 | ) | ||||||||||||||
|
|
|
|
|
|
|
|
|
|
|
|
|
|||||||||||||
| Total liabilities and shareholders’ (deficit) equity |
$ | 18,010 | $ | 590,189 | $ | 1,055,620 | $ | 6,456 | $ | (1,243,026 | ) | $ | 427,249 | |||||||||||
|
|
|
|
|
|
|
|
|
|
|
|
|
|||||||||||||
F-50
Table of Contents
QUALITY DISTRIBUTION, INC. AND SUBSIDIARIES
Condensed Consolidating Statement of Cash Flows
For the Year Ended December 31, 2014
(in thousands)
| QDI | QD LLC and QD Capital |
Guarantor Subsidiaries |
Non-Guarantor Subsidiaries |
Eliminations | Consolidated | |||||||||||||||||||
| Cash flows from operating activities: |
||||||||||||||||||||||||
| Net income (loss) |
$ | 20,640 | $ | 20,105 | $ | 20,743 | $ | (39 | ) | $ | (40,809 | ) | $ | 20,640 | ||||||||||
| Adjustments for non-cash charges |
(16,880 | ) | (45,236 | ) | 50,390 | (168 | ) | 40,809 | 28,915 | |||||||||||||||
| Net changes in assets and liabilities |
469 | (348 | ) | (15,479 | ) | (27 | ) | — | (15,385 | ) | ||||||||||||||
| Intercompany activity |
(4,229 | ) | 25,479 | (21,540 | ) | 290 | — | — | ||||||||||||||||
|
|
|
|
|
|
|
|
|
|
|
|
|
|||||||||||||
| Net cash provided by operating activities |
— | — | 34,114 | 56 | — | 34,170 | ||||||||||||||||||
|
|
|
|
|
|
|
|
|
|
|
|
|
|||||||||||||
| Cash flows from investing activities: |
||||||||||||||||||||||||
| Capital expenditures |
— | — | (40,140 | ) | — | — | (40,140 | ) | ||||||||||||||||
| Acquisition of an independent affiliate’s assets |
— | — | (6,747 | ) | — | — | (6,747 | ) | ||||||||||||||||
| Onboarding payment to independent affiliate |
— | — | (125 | ) | — | — | (125 | ) | ||||||||||||||||
| Proceeds from sales of property and equipment |
— | — | 34,114 | — | — | 34,114 | ||||||||||||||||||
|
|
|
|
|
|
|
|
|
|
|
|
|
|||||||||||||
| Net cash used in investing activities |
— | — | (12,898 | ) | — | — | (12,898 | ) | ||||||||||||||||
|
|
|
|
|
|
|
|
|
|
|
|
|
|||||||||||||
| Cash flows from financing activities: |
||||||||||||||||||||||||
| Principal payments on long-term debt and capital lease obligations |
— | (22,500 | ) | (19,146 | ) | — | — | (41,646 | ) | |||||||||||||||
| Proceeds from revolver |
— | 356,522 | — | — | — | 356,522 | ||||||||||||||||||
| Payments on revolver |
— | (341,522 | ) | — | — | — | (341,522 | ) | ||||||||||||||||
| Deferred financing costs |
— | (2,613 | ) | — | — | — | (2,613 | ) | ||||||||||||||||
| Proceeds from exercise of stock options |
4,986 | — | — | — | — | 4,986 | ||||||||||||||||||
| Purchases of treasury stock |
(417 | ) | — | — | — | — | (417 | ) | ||||||||||||||||
| Other |
— | — | 2,819 | — | — | 2,819 | ||||||||||||||||||
| Intercompany activity |
(4,569 | ) | 10,113 | (5,544 | ) | — | — | — | ||||||||||||||||
|
|
|
|
|
|
|
|
|
|
|
|
|
|||||||||||||
| Net cash used in financing activities |
— | — | (21,871 | ) | — | — | (21,871 | ) | ||||||||||||||||
|
|
|
|
|
|
|
|
|
|
|
|
|
|||||||||||||
| Net (decrease) increase in cash and cash equivalents |
— | — | (655 | ) | 56 | — | (599 | ) | ||||||||||||||||
| Cash and cash equivalents, beginning of year |
— | — | 1,876 | 81 | — | 1,957 | ||||||||||||||||||
|
|
|
|
|
|
|
|
|
|
|
|
|
|||||||||||||
| Cash and cash equivalents, end of year |
$ | — | $ | — | $ | 1,221 | $ | 137 | $ | — | $ | 1,358 | ||||||||||||
|
|
|
|
|
|
|
|
|
|
|
|
|
|||||||||||||
F-51
Table of Contents
QUALITY DISTRIBUTION, INC. AND SUBSIDIARIES
Condensed Consolidating Statement of Cash Flows
For the Year Ended December 31, 2013
(in thousands)
| QDI | QD LLC and QD Capital |
Guarantor Subsidiaries |
Non-Guarantor Subsidiaries |
Eliminations | Consolidated | |||||||||||||||||||
| Cash flows from operating activities: |
||||||||||||||||||||||||
| Net (loss) income |
$ | (42,038 | ) | $ | (41,701 | ) | $ | (41,749 | ) | $ | 729 | $ | 82,721 | $ | (42,038 | ) | ||||||||
| Adjustments for non-cash charges |
44,811 | 14,719 | 110,701 | (1,202 | ) | (82,721 | ) | 86,308 | ||||||||||||||||
| Net changes in assets and liabilities |
138 | 1,350 | 88 | 124 | — | 1,700 | ||||||||||||||||||
| Intercompany activity |
(2,911 | ) | 25,632 | (23,027 | ) | 306 | — | — | ||||||||||||||||
|
|
|
|
|
|
|
|
|
|
|
|
|
|||||||||||||
| Net cash provided by (used in) operating activities |
— | — | 46,013 | (43 | ) | — | 45,970 | |||||||||||||||||
|
|
|
|
|
|
|
|
|
|
|
|
|
|||||||||||||
| Cash flows from investing activities: |
||||||||||||||||||||||||
| Capital expenditures |
— | — | (26,177 | ) | — | — | (26,177 | ) | ||||||||||||||||
| Trojan purchase price adjustment |
— | — | (857 | ) | — | — | (857 | ) | ||||||||||||||||
| Onboarding payment to independent affiliate |
— | — | (1,000 | ) | — | — | (1,000 | ) | ||||||||||||||||
| Proceeds from sales of property and equipment |
— | — | 24,679 | — | — | 24,679 | ||||||||||||||||||
|
|
|
|
|
|
|
|
|
|
|
|
|
|||||||||||||
| Net cash used in investing activities |
— | — | (3,355 | ) | — | — | (3,355 | ) | ||||||||||||||||
|
|
|
|
|
|
|
|
|
|
|
|
|
|||||||||||||
| Cash flows from financing activities: |
||||||||||||||||||||||||
| Proceeds from issuance of long-term debt |
— | 17,500 | — | — | — | 17,500 | ||||||||||||||||||
| Principal payments on long-term debt and capital lease obligations |
— | (22,500 | ) | (8,561 | ) | — | — | (31,061 | ) | |||||||||||||||
| Proceeds from revolver |
— | 236,600 | — | — | — | 236,600 | ||||||||||||||||||
| Payments on revolver |
— | (261,800 | ) | — | — | — | (261,800 | ) | ||||||||||||||||
| Deferred financing costs |
— | (990 | ) | — | — | — | (990 | ) | ||||||||||||||||
| Proceeds from exercise of stock options |
1,574 | — | — | — | — | 1,574 | ||||||||||||||||||
| Purchases of treasury stock |
(4,454 | ) | — | — | — | — | (4,454 | ) | ||||||||||||||||
| Other |
— | — | (731 | ) | — | — | (731 | ) | ||||||||||||||||
| Intercompany activity |
2,880 | 31,190 | (34,070 | ) | — | — | — | |||||||||||||||||
|
|
|
|
|
|
|
|
|
|
|
|
|
|||||||||||||
| Net cash used in financing activities |
— | — | (43,362 | ) | — | — | (43,362 | ) | ||||||||||||||||
|
|
|
|
|
|
|
|
|
|
|
|
|
|||||||||||||
| Net decrease in cash and cash equivalents |
— | — | (704 | ) | (43 | ) | — | (747 | ) | |||||||||||||||
| Cash and cash equivalents, beginning of year |
— | — | 2,580 | 124 | — | 2,704 | ||||||||||||||||||
|
|
|
|
|
|
|
|
|
|
|
|
|
|||||||||||||
| Cash and cash equivalents, end of year |
$ | — | $ | — | $ | 1,876 | $ | 81 | $ | — | $ | 1,957 | ||||||||||||
|
|
|
|
|
|
|
|
|
|
|
|
|
|||||||||||||
F-52
Table of Contents
QUALITY DISTRIBUTION, INC. AND SUBSIDIARIES
Condensed Consolidating Statement of Cash Flows
For the Year Ended December 31, 2012
(in thousands)
| QDI | QD LLC and QD Capital |
Guarantor Subsidiaries |
Non-Guarantor Subsidiaries |
Eliminations | Consolidated | |||||||||||||||||||
| Cash flows from operating activities: |
||||||||||||||||||||||||
| Net income |
$ | 50,076 | $ | 53,382 | $ | 52,692 | $ | 729 | $ | (106,803 | ) | $ | 50,076 | |||||||||||
| Adjustments for non-cash charges |
(46,838 | ) | (79,562 | ) | 15,204 | (557 | ) | 106,803 | (4,950 | ) | ||||||||||||||
| Net changes in assets and liabilities |
(2,908 | ) | 1,305 | (26,519 | ) | (2 | ) | — | (28,124 | ) | ||||||||||||||
| Intercompany activity |
(330 | ) | 24,875 | (23,986 | ) | (559 | ) | — | — | |||||||||||||||
|
|
|
|
|
|
|
|
|
|
|
|
|
|||||||||||||
| Net cash provided by (used in) operating activities |
— | — | 17,391 | (389 | ) | — | 17,002 | |||||||||||||||||
|
|
|
|
|
|
|
|
|
|
|
|
|
|||||||||||||
| Cash flows from investing activities: |
||||||||||||||||||||||||
| Capital expenditures |
— | — | (32,317 | ) | — | — | (32,317 | ) | ||||||||||||||||
| Greensville purchase price adjustment |
— | — | (566 | ) | — | — | (566 | ) | ||||||||||||||||
| Acquisition of Trojan |
— | — | (8,657 | ) | — | — | (8,657 | ) | ||||||||||||||||
| Acquisition of Bice |
— | — | (52,176 | ) | — | — | (52,176 | ) | ||||||||||||||||
| Acquisition of Dunn’s |
— | — | (34,321 | ) | — | — | (34,321 | ) | ||||||||||||||||
| Acquisition of independent affiliate’s assets |
— | — | (17,143 | ) | — | — | (17,143 | ) | ||||||||||||||||
| Proceeds from sales of property and equipment |
— | — | 13,497 | — | — | 13,497 | ||||||||||||||||||
|
|
|
|
|
|
|
|
|
|
|
|
|
|||||||||||||
| Net cash used in investing activities |
— | — | (131,683 | ) | — | — | (131,683 | ) | ||||||||||||||||
|
|
|
|
|
|
|
|
|
|
|
|
|
|||||||||||||
| Cash flows from financing activities: |
||||||||||||||||||||||||
| Principal payments on long-term debt and capital lease obligations |
— | — | (8,540 | ) | — | — | (8,540 | ) | ||||||||||||||||
| Proceeds from revolver |
— | 236,800 | — | — | — | 236,800 | ||||||||||||||||||
| Payments on revolver |
— | (141,100 | ) | — | — | — | (141,100 | ) | ||||||||||||||||
| Deferred financing costs |
— | (989 | ) | — | — | — | (989 | ) | ||||||||||||||||
| Proceeds from equity offering, net of transaction costs |
30,493 | — | — | — | — | 30,493 | ||||||||||||||||||
| Proceeds from exercise of stock options |
360 | — | — | — | — | 360 | ||||||||||||||||||
| Purchases of treasury stock |
(3,658 | ) | — | — | — | — | (3,658 | ) | ||||||||||||||||
| Other |
— | — | (34 | ) | — | — | (34 | ) | ||||||||||||||||
| Intercompany activity |
(27,195 | ) | (94,711 | ) | 121,906 | — | — | — | ||||||||||||||||
|
|
|
|
|
|
|
|
|
|
|
|
|
|||||||||||||
| Net cash provided by financing activities |
— | — | 113,332 | — | — | 113,332 | ||||||||||||||||||
|
|
|
|
|
|
|
|
|
|
|
|
|
|||||||||||||
| Net decrease in cash and cash equivalents |
— | — | (960 | ) | (389 | ) | — | (1,349 | ) | |||||||||||||||
| Cash and cash equivalents, beginning of year |
— | — | 3,540 | 513 | — | 4,053 | ||||||||||||||||||
|
|
|
|
|
|
|
|
|
|
|
|
|
|||||||||||||
| Cash and cash equivalents, end of year |
$ | — | $ | — | $ | 2,580 | $ | 124 | $ | — | $ | 2,704 | ||||||||||||
|
|
|
|
|
|
|
|
|
|
|
|
|
|||||||||||||
F-53
Table of Contents
24. Subsequent Event
On January 15, 2015, we redeemed a portion of our 2018 Notes in the aggregate principal amount of $10.0 million. The redemption price for these 2018 Notes equaled 100% of the aggregate principal amount of $10.0 million, plus accrued but unpaid interest up to the redemption date, plus a 4.9% premium of $0.5 million. The redemption was funded with borrowings under our ABL Facility and cash on hand. In the first quarter of 2015, $0.2 million of unamortized debt issuance costs related to this redemption will be written off.
F-54
Table of Contents
EXHIBIT INDEX
| Exhibit |
Description | |
| 3.1 | Amended and Restated Articles of Incorporation of Quality Distribution, Inc., dated November 4, 2003. Incorporated herein by reference to Exhibit 3.1 to Quality Distribution, Inc.’s Amendment No. 3 to Registration Statement on Form S-1 filed on November 5, 2003 (Registration No. 333-108344). | |
| 3.2 | Articles of Amendment, dated June 28, 2005 to Amended and Restated Articles of Incorporation of Quality Distribution, Inc. Incorporated herein by reference to Exhibit 3.1 to Quality Distribution, Inc.’s Current Report on Form 8-K filed on June 28, 2005. | |
| 3.3 | Articles of Amendment to Articles of Incorporation of Quality Distribution, Inc., filed May 28, 2010. Incorporated herein by reference to Exhibit 3.1 to Quality Distribution, Inc.’s Current Report on Form 8-K filed on May 28, 2010. | |
| 3.4* | Amended and Restated Bylaws of Quality Distribution. Inc., as amended December 23, 2014. | |
| 4.1 | Warrant Agreement, dated as October 15, 2009, between Quality Distribution, Inc. and The Bank of New York Mellon Trust Company, N.A., as warrant agent. Incorporated herein by reference to Exhibit 4.5 to Quality Distribution, Inc.’s Current Report on Form 8-K filed on October 16, 2009. | |
| 4.2 | Indenture with respect to the 9.875% Second-Priority Senior Secured Notes due 2018, dated as of November 3, 2010, among Quality Distribution, LLC, QD Capital Corporation, the guarantors named therein and The Bank of New York Mellon Trust Company, N.A., as Trustee and The Bank of New York Mellon Trust Company, N.A., as Collateral Agent. Incorporated herein by reference to Exhibit 4.1 to Quality Distribution, Inc.’s Current Report on Form 8-K filed on November 3, 2010. | |
| 4.3 | First Supplemental Indenture to Indenture with respect to the 9.875% Second-Priority Senior Secured Notes due 2018, dated as of August 19, 2011, among Quality Distribution, LLC, QD Capital Corporation, the guarantors named therein and The Bank of New York Mellon Trust Company, N.A., as Trustee and The Bank of New York Mellon Trust Company, N.A., as Collateral Agent. Incorporated herein by reference to Exhibit 4.24 to Quality Distribution Inc.’s Annual Report on Form 10-K for the year ended December 31, 2012. | |
| 4.4 | Second Supplemental Indenture to Indenture with respect to the 9.875% Second-Priority Senior Secured Notes due 2018, dated as of August 1, 2012, among Quality Distribution, LLC, QD Capital Corporation, the guarantors named therein and The Bank of New York Mellon Trust Company, N.A., as Trustee and The Bank of New York Mellon Trust Company, N.A., as Collateral Agent. Incorporated herein by reference to Exhibit 4.1 to Quality Distribution, Inc.’s Quarterly Report on Form 10-Q for the quarter ended June 30, 2012. | |
| 4.5 | Form of Initial Note for the 9.875% Second-Priority Senior Secured Notes due 2018 (included as Exhibit B to Exhibit 4.25). | |
| 4.6 | Collateral Agreement dated and effective as of November 3, 2010, among Quality Distribution Inc., Quality Distribution, LLC, QD Capital Corporation, each subsidiary of QD LLC identified on Schedule I thereto and The Bank of New York Mellon Trust Company, N.A. as collateral agent. Incorporated herein by reference to Exhibit 10.2 to Quality Distribution, Inc.’s Current Report on Form 8-K filed on November 3, 2010. | |
| 10.1† | Employment Agreement dated November 3, 2004 between Quality Distribution, Inc. and Gary Enzor. Incorporated herein by reference to Exhibit 99.2 to Quality Distribution, Inc.’s Current Report on Form 8-K filed on November 9, 2004. | |
| 10.2† | Quality Distribution, Inc. 2003 Restricted Stock Incentive Plan. Incorporated herein by reference to Exhibit 10.1 to Quality Distribution, Inc.’s Current Report on Form 8-K filed on May 28, 2010. | |
Table of Contents
| Exhibit |
Description | |
| 10.3† | Quality Distribution, Inc. 2003 Restricted Stock Incentive Plan, as amended. Incorporated herein by reference to Exhibit 10.2 to Quality Distribution, Inc.’s Current Report on Form 8-K filed on May 16, 2005. | |
| 10.4† | Form of Non Qualified Stock Option Agreement. Incorporated herein by reference to Exhibit 10.5 to Quality Distribution, Inc.’s Current Report on Form 8-K filed on June 7, 2005. | |
| 10.5† | Form of Restricted Stock Award Agreement. Incorporated herein by reference to Exhibit 10.6 to Quality Distribution, Inc.’s Current Report on Form 8-K filed on June 7, 2005. | |
| 10.6† | Modification to Terms of Employment for Gary R. Enzor dated June 14, 2007 between Quality Distribution, Inc. and Gary R. Enzor. Incorporated herein by reference to Exhibit 10.3 to Quality Distribution, Inc.’s Quarterly Report on Form 10-Q for the quarter ended June 30, 2007. | |
| 10.7† | Employment Agreement, dated July 28, 2008, between Quality Distribution, Inc. and Stephen R. Attwood. Incorporated herein by reference to Exhibit 10.2 to Quality Distribution, Inc.’s Quarterly Report on Form 10-Q filed on November 7, 2008. | |
| 10.8† | Employment Agreement dated March 12, 2010 between Quality Distribution, Inc. and Randall Strutz. Incorporated herein by reference to Exhibit 10.23 to Quality Distribution, LLC’s Registration Statement on Amendment No. 3 to Form S-4 dated April 7, 2010 (Registration No. 333-163868). | |
| 10.9† | Employment Agreement, dated July 16, 2010 between Quality Distribution, Inc. and Joseph J. Troy. Incorporated herein by reference to Exhibit 10.1 to Quality Distribution, Inc.’s Current Report on Form 8-K filed on July 22, 2010. | |
| 10.10 | Amended and Restated Credit Agreement, dated as of November 3, 2014, by and among Quality Distribution, Inc., Quality Distribution, LLC, the other loan parties party thereto, Bank of America, N.A., as administrative agent and collateral agent, JPMorgan Chase Bank, N.A. and Suntrust Bank, as co-syndication agents, and the lenders party thereto from time to time. Incorporated herein by reference to Exhibit 10.1 to Quality Distribution, Inc.’s Current Report on Form 8-K filed November 5, 2014. | |
| 10.11 | Guarantee and Collateral Agreement, dated as of August 19, 2011, among Quality Distribution, Inc., Quality Distribution, LLC, the Company’s subsidiaries party thereto, and Bank of America, N.A., as administrative agent and collateral agent. Incorporated herein by reference to Exhibit 10.2 to Quality Distribution, Inc.’s Current Report on Form 8-K filed on August 22, 2011. | |
| 10.12 | Quality Distribution, Inc. 2012 Equity Incentive Plan. Incorporated herein by reference to Exhibit 10.1 to Quality Distribution, Inc.’s Current Report on Form 8-K, filed May 31, 2012. | |
| 10.13 | Form of Quality Distribution, Inc. 2012 Equity Incentive Plan Nonqualified Stock Option Award Agreement. Incorporated herein by reference to Exhibit 10.2 to Quality Distribution, Inc.’s Current Report on Form 8-K, filed May 31, 2012. | |
| 10.14 | Form of Quality Distribution, Inc. 2012 Equity Incentive Plan Restricted Stock Award Agreement. Incorporated herein by reference to Exhibit 10.3 to Quality Distribution, Inc.’s Current Report on Form 8-K, filed May 31, 2012. | |
| 10.15 | Form of Quality Distribution, Inc. 2012 Equity Incentive Plan Restricted Stock Unit Award Agreement. Incorporated herein by reference to Exhibit 10.4 to Quality Distribution, Inc.’s Current Report on Form 8-K, filed May 31, 2012. | |
| 10.16† | Employment Agreement, effective July 9, 2012, between Quality Distribution, Inc. and John T. Wilson. Incorporated herein by reference to Exhibit 10.6 to Quality Distribution, Inc.’s Quarterly Report on Form 10-Q for the quarter ended June 30, 2012. | |
| 10.17 | Amendment to Credit Agreement, dated as of September 27, 2012 by and among Quality Distribution, Inc., Quality Distribution, LLC, the other loan parties party thereto, Bank of America, N.A., as administrative agent and collateral agent, and the lenders party thereto. Incorporated herein by reference to Exhibit 10.1 to Quality Distribution, Inc.’s Current Report on Form 8-K filed on October 1, 2012. | |
| 10.18† | Modification to Terms of Employment for Gary R. Enzor dated December 30, 2012 between Quality Distribution, Inc. and Gary R. Enzor. Incorporated herein by reference to Exhibit 10.25 to Quality Distribution Inc.’s Annual Report on Form 10-K for the year ended December 31, 2012. | |
Table of Contents
| Exhibit |
Description | |
| 10.19† | Modification to Terms of Employment for Joseph J. Troy dated December 30, 2012 between Quality Distribution, Inc. and Joseph J. Troy. Incorporated herein by reference to Exhibit 10.26 to Quality Distribution Inc.’s Annual Report on Form 10-K for the year ended December 31, 2012. | |
| 10.20† | Modification to Terms of Employment for Stephen R. Attwood dated December 30, 2012 between Quality Distribution, Inc. and Stephen R. Attwood. Incorporated herein by reference to Exhibit 10.27 to Quality Distribution Inc.’s Annual Report on Form 10-K for the year ended December 31, 2012. | |
| 10.21† | Modification to Terms of Employment for Randall T. Strutz dated December 30, 2012 between Quality Distribution, Inc. and Randall T. Strutz. Incorporated herein by reference to Exhibit 10.28 to Quality Distribution Inc.’s Annual Report on Form 10-K for the year ended December 31, 2012. | |
| 10.22† | Modification to Terms of Employment for John T. Wilson dated December 30, 2012 between Quality Distribution, Inc. and John T. Wilson. Incorporated herein by reference to Exhibit 10.29 to Quality Distribution Inc.’s Annual Report on Form 10-K for the year ended December 31, 2012. | |
| 10.23† | Agreement of Separation and General Release, effective April 4, 2013, between Quality Distribution, Inc. and Stephen R. Atwood. Incorporated herein by reference to Exhibit 10.2 to Quality Distribution, Inc.’s Quarterly Report on Form 10-Q for the quarter ended June 30, 2013 | |
| 10.24† | Second Amendment to Credit Agreement, dated as of June 14, 2013 by and among Quality Distribution, Inc., Quality Distribution, LLC, the other loan parties party thereto, Bank of America, N.A., as administrative agent and collateral agent, and the lenders party thereto. Incorporated herein by reference to Exhibit 10.1 to Quality Distributions, Inc.’s Current Report on Form 8-K filed June 18, 2013. | |
| 10.25† | Modification to Terms of Employment for Gary R. Enzor dated March 27, 2014 between Quality Distribution, Inc. and Gary R. Enzor. Incorporated herein by reference to Exhibit 10.1 to Quality Distribution, Inc.’s Current Report on Form 8-K filed April 2, 2014. | |
| 10.26† | Modification to Terms of Employment for Joseph J. Troy dated March 27, 2014 between Quality Distribution, Inc. and Joseph J. Troy. Incorporated herein by reference to Exhibit 10.2 to Quality Distribution, Inc.’s Current Report on Form 8-K filed April 2, 2014. | |
| 10.27† | Modification to Terms of Employment for Randall T. Strutz dated March 27, 2014 between Quality Distribution, Inc. and Randall T. Strutz. Incorporated herein by reference to Exhibit 10.3 to Quality Distribution, Inc.’s Current Report on Form 8-K filed April 2, 2014. | |
| 10.28† | Modification to Terms of Employment for John T. Wilson dated March 27, 2014 between Quality Distribution, Inc. and John T. Wilson. Incorporated herein by reference to Exhibit 10.4 to Quality Distribution, Inc.’s Current Report on Form 8-K filed April 2, 2014. | |
| 10.29 | Form of Quality Distribution, Inc. 2012 Equity Incentive Plan Performance Share Award Agreement. Incorporated herein by reference to Exhibit 10.4 to Quality Distribution, Inc.’s Current Report on Form 8-K filed April 2, 2014. | |
| 10.30† | Employment Agreement, dated March 21, 2012 between Quality Distribution, Inc. and Scott D. Giroir. Incorporated herein by reference to Exhibit 10.1 to Quality Distribution, Inc.’s Quarterly Report on Form 10-Q filed on May 9, 2014. | |
| 10.31† | Modification to Terms of Employment for Scott D. Giroir dated March 27, 2014 between Quality Distribution, Inc. and Scott D. Giroir. Incorporated herein by reference to Exhibit 10.1 to Quality Distribution, Inc.’s Quarterly Report on Form 10-Q filed on May 9, 2014. | |
| 10.32† | Employment Agreement, dated July 6, 2014 between Quality Distribution, Inc. and Christopher Broussard. Incorporated herein by reference to Exhibit 10.1 to Quality Distribution, Inc.’s Quarterly Report on Form 10-Q filed on November 6, 2014. | |
Table of Contents
| Exhibit |
Description | |
| 10.33 | Subsidiary Loan Party Acknowledgement, dated as of November 3, 2014, by and among certain subsidiaries of Quality Distribution LLC, and Bank of America, N.A., as administrative agent and collateral agent. Incorporated herein by reference to Exhibit 10.2 to Quality Distributions, Inc.’s Current Report on Form 8-K filed November 5, 2014. | |
| 10.34†* | Employment Agreement, effective April 1, 2010, as amended on February 17, 2011, between Quality Distribution, Inc. and Melissa Ernst. | |
| 10.35†* | Modification to Terms of Employment for Melissa Ernst dated March 7, 2014 between Quality Distribution, Inc. and Melissa Ernst. | |
| 21* | Subsidiaries of the Registrant. | |
| 23* | Consent of PricewaterhouseCoopers LLP | |
| 31.1* | Certification of Chief Executive Officer pursuant to Rule 13(a) – 14(a). | |
| 31.2* | Certification of Chief Financial Officer pursuant to Rule 13(a) – 14(a). | |
| 32.1* | Certification of Chief Executive Officer and Chief Financial Officer pursuant to 18 U.S.C. Section 1350, as adopted pursuant to Section 906 of the Sarbanes-Oxley Act of 2002. | |
| 101 | Interactive Data File | |
| * | Document is filed with this Form 10-K. |
| † | Indicates a compensatory plan or arrangement contemplated by Item 15 a (3) of Form 10-K. |