Attached files
Table of Contents
UNITED STATES
SECURITIES AND EXCHANGE COMMISSION
WASHINGTON, D.C. 20549
FORM 10-K
(Mark One)
| x | ANNUAL REPORT PURSUANT TO SECTION 13 OR 15(d) OF THE SECURITIES EXCHANGE ACT OF 1934 |
For the fiscal year ended December 31, 2009.
OR
| ¨ | TRANSITION REPORT PURSUANT TO SECTION 13 OR 15(d) OF THE SECURITIES EXCHANGE ACT OF 1934 |
For the transition period from to .
Commission File Number: 001-33739
STREAM GLOBAL SERVICES, INC.
(Exact name of registrant as specified in its charter)
| Delaware |
26-0420454 | |
| (State or Other Jurisdiction of Incorporation or Organization) | (I.R.S. Employer Identification No.) | |
| 20 William Street, Suite 310 Wellesley, Massachusetts |
02481 | |
| (Address of Principal Executive Offices) | (Zip Code) | |
(781) 304-1800
(Registrant’s Telephone Number, Including Area Code)
Securities registered pursuant to Section 12(b) of the Act:
| Title of Each Class |
Name of Each Exchange on Which Registered | |
| Units |
NYSE Amex | |
| Common Stock, $0.001 Par Value |
NYSE Amex | |
| Warrants |
NYSE Amex |
Securities registered pursuant to Section 12(g) of the Act:
None
Title of Class
Indicate by check mark if the registrant is a well-known seasoned issuer, as defined in Rule 405 of the Securities Act.
Yes No X
Indicate by check mark if the registrant is not required to file reports pursuant to Section 13 or Section 15(d) of the Act.
Yes No X
Indicate by check mark whether the registrant (1) has filed all reports required to be filed by Section 13 or 15(d) of the Securities Exchange Act of 1934 during the preceding 12 months (or for such shorter period that the registrant was required to file such reports), and (2) has been subject to such filing requirements for the past 90 days.
| Yes |
No X
|
Indicate by check mark whether the registrant has submitted electronically and posted on its corporate Web site, if any, every Interactive Data File required to be submitted and posted pursuant to Rule 405 of Regulation S-T (§232.405 of this chapter) during the preceding 12 months (or for such shorter period that the registrant was required to submit and post such files).
| Yes |
No
|
Indicate by check mark if disclosure of delinquent filers pursuant to Item 405 of Regulation S-K is not contained herein, and will not be contained, to the best of registrant’s knowledge, in definitive proxy or information statements incorporated by reference in Part III of this Form 10-K or any amendment to this Form 10-K. x
Indicate by check mark whether the registrant is a large accelerated filer, an accelerated filer, a non-accelerated filer, or a smaller reporting company. See the definitions of “large accelerated filer,” “accelerated filer” and “smaller reporting company” in Rule 12b-2 of the Exchange Act. (Check one):
| Large Accelerated Filer ¨ |
Accelerated Filer ¨ | |
| Non-accelerated Filer x |
Smaller reporting company ¨ | |
| (Do not check if a smaller reporting company) |
Indicate by check mark whether the registrant is a shell company (as defined in Rule 12b-2 of the Exchange Act).
| Yes |
No X |
The aggregate market value of the voting and non-voting common equity held by non-affiliates of the registrant was approximately $15,057,952 based on the last reported sale price of the registrant’s Common Stock on the NYSE Amex on June 30, 2009, which was the last business day of the registrant’s most recently completed second fiscal quarter.
There were 80,296,892 shares of the Registrant’s common stock, $0.001 par value per share, issued and outstanding as of March 3, 2010.
DOCUMENTS INCORPORATED BY REFERENCE
Portions of the registrant’s definitive proxy statement for its 2010 annual meeting of stockholders, to be filed pursuant to Regulation 14A with the Securities and Exchange Commission not later than 120 days after the registrant’s fiscal year end of December 31, 2009, are incorporated herein by reference.
Table of Contents
| Page | ||||
| PART I. | ||||
| Item 1. |
4 | |||
| Item 1A. |
14 | |||
| Item 1B. |
31 | |||
| Item 2. |
31 | |||
| Item 3. |
31 | |||
| Item 4. |
31 | |||
| PART II. | ||||
| Item 5. |
32 | |||
| Item 6. |
35 | |||
| Item 7. |
Management’s Discussion and Analysis of Financial Condition and Results of Operations |
37 | ||
| Item 7A. |
50 | |||
| Item 8. |
53 | |||
| Consolidated Balance Sheets as of December 31, 2009 and 2008 and pro forma as of December 31, 2008 |
55 | |||
| 56 | ||||
| 57 | ||||
| 58 | ||||
| 60 | ||||
| Item 9. |
Changes in and Disagreements with Accountants on Accounting and Financial Disclosure |
96 | ||
| Item 9A. |
96 | |||
| PART III. | ||||
| Item 10. |
97 | |||
| Item 11. |
97 | |||
| Item 12. |
Security Ownership of Certain Beneficial Owners and Management and Related Stockholder Matters |
97 | ||
| Item 13. |
Certain Relationships and Related Transactions, and Director Independence |
97 | ||
| Item 14. |
97 | |||
| PART IV. | ||||
| Item 15. |
98 | |||
| SIGNATURES | 99 | |||
Stream is a registered trademark of Stream Global Services, Inc.
2
Table of Contents
CAUTIONARY NOTE REGARDING FORWARD-LOOKING STATEMENTS
This Report includes forward-looking statements within the meaning of Section 27A of the Securities Act of 1933, as amended, and Section 21E of the Securities Exchange Act of 1934, as amended, or the Exchange Act. We have based these forward-looking statements on our current expectations and projections about future events. These forward-looking statements are subject to known and unknown risks, uncertainties and assumptions about us that may cause our actual results, levels of activity, performance or achievements to be materially different from any future results, levels of activity, performance or achievements expressed or implied by such forward-looking statements. In some cases, you can identify forward-looking statements by terminology such as “may,” “should,” “could,” “would,” “expect,” “plan,” “target,” “goal,” “anticipate,” “believe,” “estimate,” “continue,” or the negative of such terms or other similar expressions. Factors that might cause or contribute to such a discrepancy include, but are not limited to, those described in Item 1A, “Risk Factors,” of this Report and in our other Securities and Exchange Commission filings.
Except as required by applicable law, including the securities laws of the United States and the rules and regulations of the U.S. Securities and Exchange Commission (“SEC”), we explicitly disclaim any obligation to update or revise any forward-looking statement, whether as a result of new information, future events or otherwise to reflect actual results or changes in factors or assumptions affecting such forward-looking statements. You are advised, however, to consult any further disclosure we make in our reports filed with the SEC.
3
Table of Contents
PART I
| ITEM 1. | BUSINESS |
Overview
Stream Global Services, Inc. (“we”, “us”, “Stream”, or “SGS”) is a corporation organized under the laws of the State of Delaware. We were incorporated on June 26, 2007 as a blank check company for the purpose of acquiring, through a merger, capital stock exchange, asset or stock acquisition, exchangeable share transaction or other similar business combination, one or more domestic or international operating businesses.
In October 2007, we consummated our initial public offering (“IPO”) in which we sold 31,250,000 units, each consisting of one share of our common stock and a warrant to purchase one share of our common stock. We received total gross proceeds of $250.0 million and net proceeds of $246.3 million, including $7.5 million of proceeds from the sale of 7,500,000 warrants to certain of our founding stockholders, which were deposited into a trust account. In connection with our IPO, a total of $7.5 million of underwriters’ fees were deferred until the completion of our initial acquisition. In 2008 the underwriter’s fees were reduced to $2.8 million.
In July 2008, we acquired Stream Holdings Corporation (“SHC”) for $128.8 million (which reflected the $200.0 million purchase price less assumed indebtedness, transaction fees, employee transaction related bonuses, professional fees, stock option payments and payments for working capital). Also in July 2008, holders of 8,947,000 shares of our common stock exercised their conversion rights in connection with the acquisition, and we paid an aggregate of $70.59 million to such holders. In connection with our acquisition of SHC, we changed our name from Global BPO Services Corp. to Stream Global Services, Inc.
In October 2009, pursuant to a Share Exchange Agreement, dated as of August 14, 2009 (“Exchange Agreement”), among EGS Corp., a Philippine corporation (“EGS”), the parent company of eTelecare Global Solutions, Inc., a Philippine company (“eTelecare”), EGS Dutchco B.V., a corporation organized under the laws of the Netherlands (“Dutchco”), and NewBridge International Investment Ltd., a British Virgin Islands company (“NewBridge” and, together with Dutchco, the “EGS Stockholders”), we acquired EGS in a stock-for-stock exchange (the “Combination”). At the closing of the Combination (the “Closing”), we acquired all of the issued and outstanding capital stock of EGS (the “EGS Shares”) from the EGS Stockholders, and NewBridge and/or its affiliate contributed, and we accepted, the rights of such transferor with respect to approximately $35,841,000 in principal under a bridge loan of EGS (the “Bridge Loan”) in consideration for the issuance and delivery of an aggregate of 23,851,561 shares of our common stock and 9,800,000 shares of our non-voting common stock, and the payment of $9,990 in cash. Subsequent to the Closing, all of the 9,800,000 shares of non-voting common stock held by the EGS Stockholders were converted into shares of our voting common stock on a one-for-one basis. As of the Closing, the pre-Combination Stream stockholders and the EGS Stockholders owned approximately 57.5% and 42.5%, respectively, of the combined entity.
Also in October 2009, pursuant to an indenture, dated as of October 1, 2009 (the “Indenture”), among Stream, certain of our subsidiaries and Wells Fargo Bank, National Association (“Wells Fargo”), as trustee, we issued $200 million aggregate principal amount of 11.25% Senior Secured Notes due 2014 (the “Notes”) at an initial offering price of 95.454% of the principal amount. In addition, we and certain of our subsidiaries (collectively, the “Borrowers”) entered into a credit agreement, dated as of October 1, 2009 (the “Credit Agreement”), with Wells Fargo Foothill, LLC (“WFF”), as agent and co-arranger, and Goldman Sachs Lending Partners LLC, as co-arranger, and each of the lenders party thereto, as lenders, providing for revolving credit financing (the “ABL Facility”) of up to $100 million, including a $20 million sub-limit for letters of credit. The ABL Facility has a maturity of four years.
We used the proceeds from the offering of the Notes, together with approximately $26.0 million of cash on hand, to repay certain outstanding indebtedness, and to pay fees and expenses incurred in connection with the Combination, the Note offering and the ABL Facility.
4
Table of Contents
Our Business
We are a leading global business process outsourcing (“BPO”) service provider specializing in customer relationship management (“CRM”) including sales, customer care and technical support for Fortune 1000 companies. Our clients include leading technology, computing, telecommunications, retail, entertainment/media, and financial services companies. Our service programs are delivered through a set of standardized best practices and sophisticated technologies by a highly skilled multilingual workforce capable of supporting over 35 languages across 50 locations in 22 countries. We continue to expand our global presence and service offerings to increase revenue, improve operational efficiencies and drive brand loyalty for our clients.
We seek to establish long-term, strategic relationships with our clients by delivering high-value solutions that help improve our clients’ revenue generation, reduce operating costs, and improve customer satisfaction. To achieve these objectives, we work closely with our clients in order to understand what drives their economic value, and then implement processes and performance metrics to optimize results for our clients. We believe that this approach is crucial to winning and retaining clients and increasing our ability to withstand competitive pricing pressure. We view our investments in human capital as a critical value proposition and thus our culture is metric-driven and performance based.
The success of our differentiated client value proposition is demonstrated, in part, by the tenure of our client relationships. Several of our top clients have been with us for over a decade and the average duration of our relationship with our top ten clients by revenue is approximately ten years. Our clients include leading technology, software, and telecommunications companies, such as our three largest clients, Dell Inc., the Hewlett-Packard Company and AT&T Inc., which, on a pro forma basis giving effect to the Combination as if it occurred on January 1, 2009, accounted for 19%, 12% and 9%, respectively, of our revenues for the year ended December 31, 2009. We target these sectors because of their growth potential, their propensity to outsource, their large, global customer bases, and their complex product and service offerings, which often require sophisticated customer interactions.
For many of our clients, we service multiple customer touch points that may encompass several product and service lines. For several of our large, global clients, we perform more than 15 different programs across 10 different languages in multiple countries around the world. In most cases, our services for each client are performed under discrete, renewable, multi-year contracts that are individually negotiated with separate business leaders at the client and define, among other things, the service level requirements, the tools and technology, the operating metrics, and various pricing grids depending on volume requirements. We typically bill our clients on a monthly basis either by the minute, the hour, or the transaction. In some cases, we also receive incentive based compensation from our clients that is directly connected to our performance and/or our ability to generate sales for our clients. The types of CRM and BPO services that we deliver are generally characterized by higher margins than those in the overall BPO sector. We had relationships with over 90 clients as of December 31, 2009. We believe that there are various barriers to entering the CRM and BPO services industry, including the need to establish a reputation in the marketplace, the importance of offering a global footprint, the value clients place on existing relationships, and the requirement to significantly invest in technology.
Our Industry
According to the 2009 IDC report titled “Worldwide and U.S. Outsourced Customer Care Services 2009-2013 Forecast Update: In the Wake of the Great Recession,” the global CRM market, which IDC refers to as the “Worldwide Customer Care Services” market, totaled $59 billion in 2009 and is expected to grow to $76 billion by 2013, a 6.8% compound annual growth rate. Additionally, according to IDC, only 25% of the total customer care market is estimated to be outsourced in 2009, a number that is expected to grow to 40% by 2013. The contact center outsourcing industry is highly fragmented and competitive, with the largest company representing 7% of the market, according to Frost & Sullivan. Despite an increasingly competitive market, we believe outsourcing will continue to grow as a result of higher client demand for cost savings along with a need for high- quality customer interactions and innovative service solutions that deliver real value. We also believe the desire
5
Table of Contents
for companies to focus on core competencies remains strong and will continue to drive them to outsource certain non-core functions to experienced outsource providers with the global scale, processes and technologies.
Additionally, as business becomes more global, many companies find that they do not have sufficient capacity or the optimal infrastructure, international experience or technology tools to service their customers. Therefore, they increasingly look to global BPO service providers like us, who have invested in technology and infrastructure and who have established a global presence, to deliver customer facing services in both established and emerging markets. The largest CRM and BPO customers are typically large multinational companies that require global outsourcing solutions to service segments of their customer base in multiple countries, languages, and service offerings. At the same time, they seek to work with a service partner that they are confident will not only be able to serve their needs over the long-term, but also be able to adjust scale quickly as volume requirements change. We believe that large corporations are increasingly outsourcing their CRM and BPO solutions as part of an overall effort to focus internal resources on their core competencies, improve customer satisfaction and retention, improve operating efficiencies, and reduce their overall cost of service. We believe that many of our clients have reduced or are considering reducing their number of service providers to a few core global relationships that can provide an integrated multi-service platform of offerings in a cost efficient manner. We also believe that many of our clients are seeking global BPO service providers that can provide services from many different countries where we currently do business, in geographic areas such as Europe, Africa, the Middle East, Central America, North America, India and the Philippines. We also believe that our clients will seek in-country services in the future from countries that include China, Japan, Brazil and Argentina.
Our global clients require (i) global servicing capabilities to fit the needs of particular products or programs in multiple languages, (ii) a sophisticated technology infrastructure that enables fully integrated customer interaction channels that are analytics enabled and virtually accessible across a global delivery platform, (iii) a solution driven approach that solves multiple customer needs, such as total customer experience, retention and lower customer churn rates, and creates new or expanded revenue opportunities for our clients, and (iv) a competitive total cost of solution that takes advantage of technology, applications, defined processes and a diverse global operation.
Our Strengths
Leading CRM and BPO services provider.
We believe that we are one of the leading publicly traded global CRM and BPO services providers based on annual revenues. Our service offerings include a full portfolio of sales and revenue generation, warranty management, customer loyalty and brand management, customer care, technical support, and customer life cycle management services. We believe this broad and integrated portfolio of global services is a key differentiating factor to win new clients and realize attractive cross-selling opportunities among our existing clients.
Strong global presence.
We operate 50 locations across North America, Central America, Europe, the Philippines, India, the Middle East, and Africa. In addition, we expect to commence operations in one or more of the following countries in the near future: Brazil, Argentina, China, or Japan. We believe that our customers value this strong global presence and our ability to do business in multiple geographies depending on factors such as the life cycle of their products, the complexity of the work being performed, the cultural and language requirements, and the economics of the total service solution. As a result, our ability to customize a multi-shore strategy enhances our ability to win new clients or expand our market share of existing clients.
High quality, loyal client base in attractive sectors.
We maintain broad and long-standing relationships with leading technology, software and telecommunications companies, such as Dell Inc., the Hewlett-Packard Company and AT&T Inc. In many cases,
6
Table of Contents
we service multiple customer touch points that may encompass several product and service lines and deliver services in a number of languages. For several of our large, global clients, we perform more than 15 different programs across 10 different languages in multiple countries around the world. Several of our clients have been with us for over a decade and the average duration of our relationship with our top ten clients by revenue is approximately ten years. We believe that we have sustainable and long-term relationships with our clients that make us an integral component of their planning, strategy, and cost model. Our clients seek our services due to our ability to provide scalable and timely solutions that leverage our proven processes and technology investments. We believe that our approach to client service and our relationships will allow us to maintain our existing base of business and grow new business as our clients launch new products and enter new geographies. Our long-term client relationships enable us to establish recurring and predictable revenue. We have historically had a high level of success of renewing existing contracts and growing our base business with existing clients. In many cases, these long-term relationships allow us to sole source bid for opportunities and customize value-added CRM and BPO services for our clients in multi-geographic locations.
Strong industry growth opportunities.
We have traditionally focused on the technology, software, and telecommunications segments within the CRM and BPO market because of their growth potential and attractive operating margins. IDC anticipates the CRM market growing from $59 billion in 2009 to $76 billion in 2013, a 6.8% compound annual growth rate. In addition, we seek to capitalize on the global trend toward outsourcing CRM and BPO services. We also believe that the current economic slowdown has increased demand for outsourcing not only because it can reduce customer service costs, but also because it offers an incremental channel to increase sales. At the same time, we expect to benefit from growth in emerging markets such as China and South America, including countries such as Argentina and Brazil, where we expect to provide services to a combination of in-country clients and our existing multi-national clients. These emerging markets are estimated to grow at a higher rate than the developed markets. We employ a dedicated sales force that seeks to capitalize on and outperform these industry growth trends by winning new clients, increasing our market share of our existing client’s outsourced business, and introducing new service offerings at existing clients. We also believe that many large, multi-national companies are consolidating the number of global service providers they use to increasingly rely on those that offer a broad global footprint, advanced technology, and proven processes. We believe that the combination of these factors will allow us to continue to grow and gain market share over the next several years.
Opportunity for margin and cash flow enhancement.
We have increased our gross margins as a percentage of revenue by over 200 basis points year over year from 2008 compared to 2009. We have achieved this improvement by focusing on key operating metrics such as average handle time, utilization, productivity, and attrition of our service professionals. We have also implemented new technologies in 2009 that have made our operations more efficient for our clients that have in turn increased gross margins. We expect that future technology advances in Sessions Interaction (“SIP”), cloud computing and other applications and technologies will continue to increase our gross margins and improve our efficiency. In addition, we service our clients in established programs at a substantially higher gross margin than our new clients while they are in a ramp-up period because of unpaid training and production inefficiencies. Over the past six months have won a number of new clients that will increase revenues but will reduce short term gross margins in 2010 as we ramp these new programs. We also believe that our future gross margins will increase over the long term due to a higher proportion of our service delivery being performed offshore in places like the Philippines, where we currently have approximately 10,000 employees. We also believe that new emerging markets such as Brazil, Argentina and China will also generate higher gross margins due to the lower cost of labor and rapid growth.
Strong executive leadership.
Our management team is comprised of an experienced group of executives with a proven track record of creating value for clients, employees, and investors. Led by industry veteran, founder, chairman and chief
7
Table of Contents
executive officer, R. Scott Murray, our management team has extensive experience in the CRM and BPO industry. In the past twelve months we have added several experienced executives who have extensive industry experience, including a few of our competitors (many of whom are much larger than we are in terms of annual revenues). In addition, over 40 members of our management team, including our founder, chairman and chief executive officer, have previously worked together at Stream and other technology and service businesses, thereby adding to the depth of experience of our management team.
Committed financial sponsorship.
Our financial sponsors, including Ares Corporate Opportunities Fund II, L.P (“Ares”), Providence Equity Partners (“Providence”), the Ayala Corporation and its affiliates (“Ayala”), and other members of our board of directors, including our founder, chairman and chief executive officer, R. Scott Murray, have invested a total of approximately $335 million of cash equity into Stream and eTelecare. Each of these financial sponsors and our founder, chairman and chief executive officer, is represented on our board of directors and has agreed to resale restrictions on their shares until October 2011, demonstrating their long-term commitment to our company.
Our Strategy
Our strategy is to be a leading provider of integrated, global CRM and BPO services that allow our clients to create maximum value for their customers over the long-term. In order to achieve this strategy, we intend to offer a broad suite of services that leverages an integrated technology platform on a global basis. We expect to increase our revenues and profitability while further growing our market position by implementing our global business strategy, which includes, among other things, the following key elements:
Expand organic revenue growth.
We expect to increase our revenue through a combination of winning business from new clients and increasing our service offerings and market share for existing clients. We expect to continue to win new clients in the future as more companies outsource their CRM and BPO services. Additionally, many of our clients are consolidating their CRM and BPO relationships to vendors who can provide multiple service offerings on a global basis. We expect to capitalize on this trend by increasing our service offerings for existing clients and winning a greater share of services that they currently outsource. We also expect to generate new business by working with our clients to outsource non-core programs that are currently managed internally.
Enhance margins through global expansion and operating efficiency.
We seek to enhance our gross and operating margins by improving our systems and infrastructure and by expanding our global operations. We also continue to work to improve our operating metrics, such as utilization and productivity, employee attrition, and workforce management, and take advantage of advanced technology tools, such as voice over internet protocol (“VoIP”), SIP, cloud computing, virtualization of the desktop, data center consolidation and hosting, learning and development platforms and standardized global processes to increase accessibility and quality of information and data exchange. As a result of these efforts, our gross margins increased by over 200 basis points year over year from 2008 compared to 2009. We also believe that we will continue to improve our margins with our expanded presence in the Philippines, a market characterized by higher gross margins than other onshore locations in North America and Europe due to the high quality of low cost labor, a dependable telecommunication infrastructure, and a general acceptance by most clients of the Philippines as a location to provide CRM services. We also believe that the emerging markets in Asia and South America offer attractive growth opportunities and are experiencing higher than average economic growth rates. As a result we intend to expand our service offerings into China, Japan, and/or South America.
Expand our revenue growth and market share through targeted acquisitions.
We plan to grow our revenues and market share both organically and through targeted acquisitions. Our desire to enter new geographies, such as China, Japan and South America, as well as expand our service offerings
8
Table of Contents
to include new offerings, such as data management and possibly credit and collections, may be accomplished most efficiently and cost effectively through the acquisition of companies or assets, or through joint venture arrangements with third parties.
Expand current, and develop and implement new, BPO service offerings to increase market share.
We expect to expand our current service offerings, such as sales services, customer lifecycle management, and warranty services, within our existing client base to increase returns and profitability. Many of our clients are looking for global service providers that can not only provide an efficient and flexible cost model, but can also generate revenues to help reduce the overall cost of service and enhance customer interaction.
In the future, in addition to our core services, we expect to provide new BPO services that cross vertical segments, such as data management, language transcription and interpretation, and credit and collections to expand our business within our existing client base, as well as provide entry into new vertical markets, such as financial services, healthcare and government, and thereby increasing our market share. We believe that we will be able to provide such services from our offshore centers during local day time hours. These services are typically characterized by a lower employee wage, which does not require as high a degree of English proficiency as our core CRM services. We believe this will allow us to leverage our existing technology and facilities to gain a higher rate of return on our service locations. And as our industry develops further, we anticipate that our clients may outsource many other back-office infrastructure elements of their business to take advantage of our flexibility, technology, global infrastructure and standardized processes – all from one integrated service provider.
Build and implement a multi-year global technology roadmap.
We believe that technology applications and infrastructure are critical to our business and allow us to offer our clients efficient services on a cost-effective basis. We expect to continue to invest in technology and will evaluate opportunities including complex VoIP and SIP telecommunications (which allows for faster service at lower costs) and cloud computing (which allows our employees to download user applications tools and data, making our operations more efficient and lowering costs) and virtualization of the desktop (which increases efficiency, work force and capacity management and lowers cost of applications). During 2009, we invested in technology applications that enhance efficiency such as applicant tracking, human resource information management systems, data and information portals, screen consolidation tools, learning and development tools, self-help portals for employees to manage their benefits, and real-time web-based training. We may also implement various client-facing technologies that are expected to enhance our relationships and revenue creation opportunities with our clients. Examples of these programs include fee-based services for our clients’ end user customers, remote diagnostics and security management, and analytical and data reporting services.
Our Service Offerings
Our fully integrated service offerings enable our clients to increase revenue and enhance overall brand value and customer loyalty at many customer touch points. Our full breadth of outsourced services includes technical support, customer care, sales and revenue generation, as well as other professional back-office services. We blend agility and flexibility with a global, standardized delivery model to create solutions that deliver real value – even in highly specialized industries.
We utilize a proprietary “Smart Shore” methodology to determine the optimal mix of support locations – onshore, nearshore, or offshore – and delivery mechanisms (voice, email, chat and self-service) to meet our clients’ complete customer care objectives. We meet the challenge of staffing to complex technical and sales requirements with multilingual skill sets across our global presence of 50 locations and 22 countries.
Whether delivered through voice, email or chat technologies, our complete suite of service offerings encompass the entire customer lifecycle, from technical support – typically the first point of post-sales contact – through ongoing customer care and cross-sell/up-sell opportunities. Our technical support services are designed
9
Table of Contents
to provide clients with a high-quality, cost-effective and efficient service delivery platform to handle transactions from multiple market segments. Using multimedia service delivery channels, we enable our clients to expand their current technical support service delivery platforms with cost effective and robust solutions for consumer and business customers.
Technical support services include transactions executed by end user customers who contact a solution center after they have purchased a product and/or service and are looking for assistance with its operation or usage. Technical support transactions may be initiated via a voice or via self-help, e-mail, chat/web collaboration and callback. To provide quality service, we integrate our service mediums so that end users are able to easily choose the medium that best meets their support needs.
In addition to technical support solutions, we offer ongoing customer service and customer care offerings. These are designed to manage customer relationships for our clients on an ongoing basis. We view each customer contact as an opportunity to build a relationship for our clients and enhance their overall brand value. We manage our clients’ vital customer relationships through our standardized best practices that begin with the recruitment, hiring and training of our service professionals. We employ such practices in order to identify the right customer service support professionals and equip them with the tools and training necessary to provide high levels of customer service.
We service many demanding and complex customer care engagements where a highly skilled workforce and specialized training are required. Our ability to resolve customer issues in a timely manner builds brand value for our clients and lays the foundation for future cross-sell and upsell opportunities. The blended care and sales programs that we develop help our clients reduce their operational costs while at the same time providing them the opportunity to increase their revenues. We place a high value on quality service delivery to create satisfied customers and strengthen brand loyalty.
Our customer retention programs are designed to help our clients build brand loyalty by utilizing the right CRM techniques and tools to improve response rates, increase order values and maximize revenues and profit. Since it is much more expensive to recruit a new customer than to retain an existing one, we tailor the approach we take with each client to ensure we are delivering a unique customer experience that secures brand loyalty. As customer satisfaction and loyalty increase, the number of “brand advocates” who are eager to spread the news about the client’s services/products increases.
Our customer service and retention programs build ongoing, solid relationships with customers, thereby positioning us to maximize ongoing sales opportunities through cross-sell and upsell opportunities and revenue generation services. Our revenue generation services are designed to provide our clients with the tools necessary to meet their corporate strategic goals for profitability and revenue. As restrictions on outbound calling campaigns increase and customers become increasingly resistant to unsolicited contacts, more companies are looking for ways to develop a system that enables them to maximize the revenue potential of customer support interactions, while maintaining high levels of customer service and satisfaction.
Our technology platform and application programs are central to providing BPO services to our clients. We provide a fully integrated comprehensive contact center delivery platform composed of interaction services that provide integrated customer interaction channels, contact center management services that allow us to efficiently deploy and optimize the use of our resources, and information services that provide for real-time analytics and reporting tools. Each of these three services is delivered virtually across our global infrastructure on a real-time basis. We employ a combination of our tools to provide services to our clients that allow them to leverage our best-of-breed technology.
Our interaction services utilize a combination of VoIP and SIP to deliver a rich set of integrated customer channels, including voice, speech, email and chat, that are integrated into a set of information and analytic platforms providing for the ability to leverage real time analytics and data analytic tools focused on enhancing the value of the customer interaction.
10
Table of Contents
Our proprietary contact center management platform is a comprehensive management framework developed with a combination of proprietary applications and customized off-the-shelf software and tools, such as Oracle (for financial reporting and human resources management), Kronos (for time and attendance), Taleo (for applicant tracking), Aspect eWFM (for workforce management) and includes proprietary, quality monitoring, learning and development tools (including eLearning that allows for push-training directly to agent desktops) and workforce management tools.
Our proprietary and customized technology and application platform provides powerful CRM features and scalable solutions for our clients on a global basis and when combined with our proprietary operating methods, creates a unique ability for us to deliver a richer customer experience at a lower cost, which is one of the critical factors that attract clients to us. Our clients are able to take advantage of our significant technology investment on a global basis.
Markets and Clients
We focus our marketing efforts on high growth companies in the technology, computing and hardware, telecommunications, retail, entertainment/media and financial services industries. Pro forma for the Combination, revenue from our three largest clients, Dell Inc., Hewlett-Packard Company and AT&T, Inc., accounted for 19%, 12% and 9%, respectively, of revenues for the year ended December 31, 2009.
We expect to expand our existing service segments into areas such as healthcare, government and financial service industries in the future.
Sales and Marketing
We have a direct sales force and sales support organization focused on high growth companies in the target industries in North America, Latin America, Asia and Europe. We use a consultative solution selling approach to our client relationships and generally focus our marketing efforts at the senior executive levels where decisions are made with respect to outsourcing critical CRM functions. We work closely with our clients at all phases of the service delivery process to develop and refine custom solutions to meet their needs that maximize customer experience, effective cost management, technology tool utilization and revenue generations through various selling services.
We practice a consultative approach to our sales process, which involves understanding the intricacies of our potential client’s business and their particular needs and formulating a value proposition that directly speaks to these needs. First, we must fully understand the needs requirement for that particular client. Second, we assist in designing the solution for the client’s needs. Third, we must customize the solution and implement the service requirements across many different geographic locations using a combination of our and our client’s technology platforms. In addition, as we continue to develop relationships with senior management, such as the chief services officer, chief technology officer, chief financial officer, business unit leader and chief executive officer of our clients, our business model will continue to evolve into a trusted business advisor to our clients.
Our sales and marketing group also evaluates entry into new end markets, as well as identifying potential new clients within specific end markets. The factors that are considered in evaluating new market opportunities or winning new clients include potential market size, industry participants, market dynamics and trends, growth prospects and the propensity for outsourcing services. With respect to an individual client, the sales and marketing group will review its financial strength and market position and its anticipated need for long-term outsourcing services. We consider the ability to deliver those services, our competitive positioning and the likelihood of winning the contract in making such determinations. Over the past year we have been successful in winning several new logo clients in the computing, telecommunications, media distribution, software, and travel industry.
11
Table of Contents
Employees
Our success in recruiting, hiring and training highly skilled employees is key to our ability to provide high-quality CRM and BPO solutions to our clients on a global basis. We generally locate our service centers in locations that have access to higher education and a major transportation infrastructure. We generally offer a competitive pay scale, hire primarily full-time employees who are eligible to receive the full range of employee benefits, and seek to provide employees with a clear, viable career path. We also offer a combination of client based training, language training and internal technology certification courses to our employees. The combination of our training programs with close manager mentoring programs enables our employees to not only provide excellent service to our clients, but also progress into management positions within Stream.
As of December 31, 2009, we had over 30,000 employees providing services to our client’s customers and administrative services in our business. Except for our service centers in some countries within Europe and Africa where approximately 3,400 of our employees are subject to collective bargaining agreements using workers’ councils (which are typical in these regions), our employees are not subject to collective bargaining agreements. We believe relations with our employees are good.
Competition
The industry in which we operate is very competitive and highly fragmented. Our competitors range in size from very small firms offering specialized applications or short-term projects, to large independent firms, and the in-house operations of many clients and potential clients. A number of our competitors have greater capabilities and resources than we do. We compete directly and indirectly with certain companies that provide CRM and other BPO solutions on an outsourced basis, including, but not limited to, Aditya Birla Minacs, APAC Customer Services, Inc., TIVIT Terceirizacao de Tecnologia e Servicos SA Contax Participacoes SA, Atento Brasil S.A, Convergys Corporation, EXLService Holdings, Inc., Genpact Limited, Philippine Long Distance Telephone Company, SITEL Corporation, StarTek, Inc., Sutherland Global Services, Sykes Enterprises, Incorporated, TechTeam Global, Inc., Teleperformance S.A., Teletech Holdings, Inc., TransCom Worldwide SA, West Corporation, Wipro Limited and WNS (Holdings) Limited. The list of potential competitors includes both publicly traded and privately held companies.
Service Professional Tools
We believe in making the necessary investments to ensure that each of our service professionals has the tools required to provide high quality service to end-users. We leverage a mix of in-house developed and third party software solutions across all of our enterprises. Many of these solutions are customized for our enterprise and facilitate data capture and transfer from the service professional to our various data storage and network systems. Our systems must also be flexible enough to operate clients’ CRM interfaces, which operate on our desktops. Most of our client programs utilize our client’s CRM interface and tools.
Intellectual Property
As of December 31, 2009, we had 12 registered trademarks in seven jurisdictions. In addition, we had 11 registered domain names that have expiration dates from September 3, 2010 through October 15, 2015.
Corporate Information
Stream Global Services, Inc. is a Delaware corporation. Our principal office is located at 20 William Street, Suite 310, Wellesley, Massachusetts 02481, and our telephone number is (781) 304-1800. Our website address is www.stream.com.
12
Table of Contents
MANAGEMENT
Information concerning our executive officers as of March 9, 2010 is set forth below:
| Name |
Age | Position | ||
| R. Scott Murray |
46 | Chairman of the Board of Directors, Chief Executive Officer and President | ||
| Sheila M. Flaherty |
44 | Executive Vice President, Chief Legal and Administrative Officer and Corporate Secretary | ||
| Robert Dechant |
48 | Executive Vice President, Global Sales and Marketing | ||
| Dennis Lacey |
56 | Executive Vice President and Chief Financial Officer |
R. Scott Murray, our founder, has served as chairman of the board of directors, chief executive officer and president since our inception on June 26, 2007. From February 2006 to February 2008, Mr. Murray served as non-executive chairman of the board of Protocol Communications, Inc., a privately held provider of fully integrated marketing services in the business process outsourcing sector. In 2006, he served as chief executive officer and a director of 3Com Corporation and the chairman of the board of H3C, a joint venture operating in mainland China with Huawei Technologies. From August 2002 to August 2004, Mr. Murray was chief executive officer and a director of Modus Media, Inc., a privately held business process outsourcer in the global supply chain and hosting services sector. Modus had operations located around the world including North America, Mexico, Europe and Asia (including five locations in mainland China). From January 2000 until January 2002, following its acquisition in 2001 by Solectron Corporation, Mr. Murray served as president and chief operating officer of Stream International, Inc (a predecessor company to SGS). From February 1994 through May 1999, Mr. Murray served as the executive vice president and chief financial officer of The Learning Company, which was a publicly traded consumer software company. Mr. Murray is a Canadian chartered accountant and a graduate of the University of Western Ontario and holds a finance and administration degree.
Sheila M. Flaherty has been our executive vice president, chief legal and administrative officer (formerly general counsel) and corporate secretary since July 2007. From January 2006 to May 2007, Ms. Flaherty was general counsel and vice president of Abiomed, Inc., a publicly traded medical technology company. From November 1998 to August 2004, Ms. Flaherty held several positions, including vice president, general counsel and secretary, at Modus Media, Inc., a privately held business process outsourcer in the global supply chain and hosting services sector. From 1996 through 1997, Ms. Flaherty served as associate general counsel at Astra Pharmaceuticals, Inc., a pharmaceutical company. From 1993 to 1996, Ms. Flaherty practiced law with the law firm of Nutter, McClennen & Fish. Ms. Flaherty received a bachelor’s degree from the University of Massachusetts and a Juris Doctorate from Georgetown University Law Center.
Robert Dechant has served as our executive vice president global sales and marketing since August 2008. Prior to joining us, Mr. Dechant served as senior vice president of sales and marketing and general manager of the Data and Voice Business Unit for 3Com Corporation from April 2006 through June 2008. From February 2003 to October 2004, Mr. Dechant also served as executive vice president of sales and marketing of Modus Media Inc. From 1997 through 2003, Mr. Dechant handled several roles for Stream International as senior vice president of sales and marketing and chief operating officer. From 1994 to 1997, Mr. Dechant also served as vice president of sales for Software Support Inc. (acquired by Convergys Corp in 1996) and also held various roles at IBM Corp. Mr. Dechant received a bachelor’s of science degree from Fairfield University.
Dennis Lacey has served as our executive vice president and chief financial officer since January 2010. Prior to joining us, Mr. Lacey served as head of capital markets of Republic Financial Corporation, a private investment firm from September 2006 through September 2009. Prior to that, Mr. Lacey served as executive vice president and chief financial officer of TeleTech Holdings, Inc., a global CRM services provider from May 2003 to August 2006. Prior to that, Mr. Lacey was served as executive vice president and chief financial officer of CKE Restaurants Inc., a nationwide operator of fast food restaurants, from April 2001 to March 2003. Prior to that, Mr. Lacey served as executive vice president and chief financial officer of Imperial Bancorporation, a
13
Table of Contents
NYSE listed commercial bank focused on high tech lending and film finance, from April 1998 to January 2001. Prior to that, Mr. Lacey served as chief executive officer of Capital Associates, a NASDAQ listed equipment leasing company, from September 1989 to March 1998. Prior to that, Mr. Lacey served as an audit partner at Coopers & Lybrand, an international accounting firm.
| ITEM 1A. | RISK FACTORS |
Our business is subject to numerous risks. The risk factors listed below include any material changes to and supersede the description of the risk factors associated with our business previously disclosed in Item 1A of our Quarterly Report on Form 10-Q for the fiscal quarter ended September 30, 2009. The risk factors that appear below, among others, could cause our actual results to differ materially from those expressed in forward-looking statements made by us or on our behalf in filings with the Securities and Exchange Commission, press releases, communications with investors and oral statements. Such forward-looking statements are discussed under “Cautionary Note Regarding Forward-Looking Statements.”
Risks Relating to Our Business
We have a history of losses and there can be no assurance that we will become or remain profitable or that losses will not continue to occur.
For the year ended December 31, 2009, we had a net loss of $28.6 million. We may not achieve or sustain profitability in the future. Our ability to achieve profitability will depend, in part, on our ability to:
| • | attract and retain an adequate client base; |
| • | manage effectively a large global business; |
| • | react to changes, including technological changes, in the markets we target or operate in; |
| • | deploy our services in additional markets or industry segments; |
| • | continue to maintain operating efficiencies in our service centers across the globe; |
| • | respond to competitive developments and challenges; |
| • | attract and retain experienced and talented personnel; and |
| • | establish strategic business relationships. |
We may not be able to do any of these successfully, and our failure to do so is likely to have a negative impact on our operating results.
A substantial portion of our revenue is generated from a limited number of clients, and the loss of one or more of these clients or a decline in end user acceptance of our client’s products would materially reduce our revenue and cash flow and adversely affect our business.
We have derived, and we believe that we will continue to derive a substantial portion of our revenue from a limited number of clients. Revenue from our three largest clients, our three largest clients Dell Inc., the Hewlett-Packard Company and AT&T Inc., which, on a pro forma basis giving effect to our acquisition of EGS Corp. as if it occurred on January 1, 2009, accounted for 19%, 12% and 9%, respectively, of our revenues for the year ended December 31, 2009. Although we generally enter into multi-year contracts with clients, most of which are typically renewable, these contracts generally do not require clients to provide a minimum amount of revenues and allow clients to terminate earlier for convenience. There can be no assurance that we will be able to retain, renew or extend our contracts with our major clients. Although some of these contracts require the client to pay a contractually agreed upon amount in the event of early termination, there can be no assurance that we will be able to collect such amount or that such amount, if received, will sufficiently compensate us for any significant investment we may have made to support the cancelled program or for the revenues we may lose as a result of the early termination.
14
Table of Contents
There can also be no assurance that if we were to lose one or more of our major clients, we would be able to replace such clients with new clients that generate a comparable amount of revenues. A number of factors could cause us to lose business or revenue from a client, and some of these factors are not predictable and are beyond our control. For example, a client may demand price reductions, change its outsourcing strategy, move work in-house or reduce previously forecasted demand. In addition, the volume of work we perform for specific clients may vary from year to year. In most cases, if a client terminates its contract with us or does not meet its forecasted demand, we would have no contractual recourse even if we have built-out facilities and/or hired and trained service professionals to provide services to the client. Thus, a major client in one year may not provide the same level of revenue in any subsequent year. Consequently, the loss of one or more of our major clients, or the inability to generate anticipated revenues from them, would have a material adverse effect on our business, results of operations, financial condition and cash flows. Our operating results for the foreseeable future will continue to depend on our ability to effect sales to a small number of clients and any revenue growth will depend on our success selling additional services to our large clients and expanding our client base.
We typically charge our clients based on the number of inbound calls that we service, or the amount of time, by the minute or by the hour in most cases, our service professionals spend with end-users relating to our clients’ products. We also provide inbound sales services to our clients, whereby we are paid based on our level of sales success and other client driven metrics. To the extent there is a decline in spending for our clients’ products, whether as a result of a decline in product acceptance or general economic conditions, our business will be adversely affected. There are a number of factors relating to discretionary consumer and business spending, including economic conditions affecting disposable income (such as employment, business conditions, taxation and interest rates) which impact the ability of our clients to sell their products, and most of which are outside of our control. There can be no assurance that spending for our clients’ products will not be affected by adverse economic conditions, thereby affecting our business, results of operations, financial condition and cash flows.
Our revenue is highly dependent on a few industries and any decrease in demand for outsourced business processes in these industries could reduce our revenue and seriously harm our business.
Most of our revenue is derived from clients concentrated in the technology, software, computing and telecommunications industries. The success of our business largely depends on continued demand for our services from clients in these industries, as well as on trends in these industries to outsource business processes on a global basis. A downturn in any of the industries we serve, a slowdown or reversal of the trend to outsource business processes in any of these industries or the introduction of regulations that restrict or discourage companies from outsourcing could result in a decrease in the demand for our services, which in turn could materially harm our business, results of operations, financial condition and cash flows. The current global recession has negatively affected the business of many of our clients and has in some cases resulted in lower volumes of work for us. In the event that the global recession continues or worsens, this may in turn continue to have a negative impact on our business due to lower volumes or pricing pressures.
Other developments may also lead to a decline in the demand for our services in these industries. For example, the industries we primarily serve, particularly the communications industry, have experienced a significant level of consolidation in recent years. Consolidation in any of these industries or acquisitions, particularly involving our clients, may decrease the potential number of buyers of our services. Furthermore, many of our existing and new clients have begun or plan to consolidate or reduce the number of service providers that they use for various services in various geographies. To the extent that we are not successful in becoming the recipient of the consolidation of services by these clients our business and revenues will suffer. Any significant reduction in, or the elimination of, the use of the services we provide within any of these industries would reduce our revenue and cause our profitability to decline. Our clients may experience rapid changes in their prospects, substantial price competition and pressure on their results of operations. This may result in increasing pressure on us from clients in these key industries to lower our prices, which could negatively affect our business, results of operations, financial condition and cash flows.
15
Table of Contents
We may be unable to successfully execute on any of our identified business opportunities or other business opportunities that we determine to pursue.
In order to pursue business opportunities, we will need to continue to build our infrastructure, our client initiatives and operational capabilities. Our ability to do any of these successfully could be affected by one or more of the following factors:
| • | the ability of our technology and hardware, suppliers and service providers to perform as we expect; |
| • | our ability to execute our strategy and continue to operate a large, more diverse business efficiently on a global basis; |
| • | our ability to effectively manage our third party relationships; |
| • | our ability to attract and retain qualified personnel; |
| • | our ability to effectively manage our employee costs and other expenses; |
| • | our ability to retain and grow our clients and the current portfolio of business with each client; |
| • | technology and application failures and outages, security breaches or interruption of service, which could adversely affect our reputation and our relations with our clients; |
| • | our ability to accurately predict and respond to the rapid technological changes in our industry and the evolving service and pricing demands of the markets we serve; and |
| • | our ability to raise additional capital to fund our growth. |
Our failure to adequately address the above factors would have a significant impact on our ability to implement our business plan and our ability to pursue other opportunities that arise, which might negatively affect our business.
Our business may be impacted by the performance of our clients.
The current economic environment and global recession is having a negative impact on the revenue and sales unit volumes of many of our clients. Our revenue and call volume is often highly correlated with units sold, renewals from our clients’ customers or end users, and revenue of our clients. In addition, many of our clients are seeking to consolidate their current group of service providers to a smaller more manageable group that is able to provide integrated service offerings on a global basis. In some cases we do not currently offer or have service locations in those geographic locations where our clients are seeking services. Our ability to sustain growth and profitability in the current environment is very dependent upon our ability to maintain and/or gain a greater share of business within our current clients, and to attract new clients. There can be no assurance that we will be able to do so in the future. Moreover, we are exposed to additional risks related to our clients’ ability to pay and the resulting uncollectability of our accounts receivables. The economic slowdown, coupled with tightened credit availability, could adversely affect our clients’ liquidity and cause them to delay or reduce their payments to us. Such delays or reductions or the non-payment by our clients of amounts owed to us may require us to incur a bad debt expense. To the extent that one of our major clients should file for bankruptcy protection or otherwise fail, it could have a material effect on our future business, results of operations, financial condition and cash flows. In the event that some of our service centers do not receive sufficient call volume in the future we may be required to close them and relocate business in other centers. This would require substantial employee severance, lease termination costs and other re-organization costs.
We may not be able to achieve incremental revenue growth or profitability.
Our strategy calls for us to achieve incremental revenue growth and profitability through initiatives, such as opening new or expanding our existing internationally located service locations in places like China, Egypt, Japan, and South America. Other initiatives we may pursue include, the addition or expansion of services, such
16
Table of Contents
as sales services, warranty services, credit and collection services, data management and hosting, and language translation and interpretation services. Our strategy also includes the introduction of front-end technology-driven service solutions for fee-based services, self-help, and other technology driven solutions. Additionally, our strategy includes operational improvements in areas such as employee attrition, site capacity utilization, centralization of certain administrative services, productivity rates, use of technology and other operating metrics. We are also in process of consolidating and rationalizing certain of our service facilities and legacy administrative offices to improve our profitability. However, there can be no assurance that we will not encounter difficulties or delays in implementing these initiatives, and any such difficulties or delays would adversely affect our future operating results and financial performance.
We have, on a consolidated basis, a substantial amount of debt, which could impact our ability to obtain future financing or pursue our growth strategy.
We have substantial indebtedness. As of December 31, 2009, we had approximately $223.8 million of indebtedness (including capital leases) and up to an additional $84.5 million of borrowings available under the ABL Credit Facility, before taking into account outstanding letters of credit, subject to borrowing base limitations and other specified terms and conditions.
Our high level of indebtedness could have important consequences and significant adverse effects on our business, including the following:
| • | we must use a substantial portion of our cash flow from operations to pay interest on our indebtedness, which will reduce the funds available to us for operations and other purposes; |
| • | our ability to obtain additional financing for working capital, capital expenditures, acquisitions or general corporate purposes may be impaired; |
| • | our high level of indebtedness could place us at a competitive disadvantage compared to our competitors that may have proportionately less debt; |
| • | our flexibility in planning for, or reacting to, changes in our business and the industry in which we operate may be limited; |
| • | our high level of indebtedness may make us more vulnerable to economic downturns and adverse developments in our business; and |
| • | our ability to fund a change of control offer may be limited. |
The instruments governing our ABL Credit Facility contain, and the instruments governing any indebtedness we may incur in the future may contain, restrictive covenants that limit our ability to engage in activities that may be in our long-term best interests. Our failure to comply with these covenants could result in an event of default which, if not cured or waived, could result in the acceleration of all or a portion of our outstanding indebtedness.
Payments on our indebtedness will require a significant amount of cash. Our ability to meet our cash requirements and service our debt is impacted by many factors that are outside of our control.
We expect to obtain the funds to pay our expenses and to pay the amounts due under the Notes primarily from our operations and borrowings under our ABL Credit Facility. Our ability to meet our expenses and make these payments thus depends on our future performance, which will be affected by financial, business, economic and other factors, many of which we cannot control. Our business may not generate sufficient cash flow from operations in the future and our currently anticipated growth in revenue and cash flow may not be realized, either or both of which could result in our being unable to repay indebtedness, including the Notes, or to fund other liquidity needs. Our ability to borrow amounts under our ABL Credit Facility will be subject to borrowing base limitations and other specified terms and conditions, and the ability of certain of our foreign subsidiaries to
17
Table of Contents
borrow amounts under our ABL Credit Facility in the future is also subject, among other conditions, to our provision of security interests in certain assets of those foreign subsidiaries, which we did not provide upon the closing of the ABL Credit Facility and we may not be able to provide in the future. If we do not have sufficient cash resources in the future, we may be required to refinance all or part of our then existing debt, sell assets or borrow more money. We might not be able to accomplish any of these alternatives on terms acceptable to us or at all. In addition, the terms of existing or future debt agreements may restrict us from adopting any of these alternatives. Our failure to generate sufficient cash flow or to achieve any of these alternatives could materially adversely affect the value of the notes and our ability to pay the amounts due under the notes.
We may be able to incur substantial additional indebtedness that could further exacerbate the risks associated with our indebtedness.
We may incur substantial additional indebtedness in the future. Although the indenture governing the Notes and the loan agreement governing our ABL Credit Facility contain restrictions on our incurrence of additional debt, these restrictions are subject to a number of qualifications and exceptions, and we could incur substantial additional indebtedness, including additional secured indebtedness. If we incur additional debt, the risks described above under “We have, on a consolidated basis, a substantial amount of debt, which could impact our ability to obtain future financing or pursue our growth strategy” and “Payments on our indebtedness will require a significant amount of cash. Our ability to meet our cash requirements and service our debt is impacted by many factors that are outside of our control” would intensify.
Our business may not develop in ways that we currently anticipate due to negative public reaction to outsourcing and recently proposed legislation.
We have based our growth strategy on certain assumptions regarding our industry, services and future demand in the market for our services. However, the trend to outsource business processes may not continue and could reverse. Outsourcing is a politically sensitive topic in the United States and elsewhere. For example, several organizations in the United States have publicly expressed concern about a perceived association between outsourcing providers and the loss of jobs in the United States. Public figures, such as President Obama, have supported legislation that they contend will generate new jobs in the United States, including limiting income tax credits for companies that offshore American jobs. This may also have a significant effect on government regulated companies or financial institutions or other businesses that have recently received financial aid from the U.S. Federal government.
There has been recent publicity about some negative experiences that organizations have had with outsourcing, such as theft and misappropriation of sensitive client data. Current or prospective clients may elect to perform such services themselves or may be discouraged from transferring these services from onshore to off-shore providers to avoid negative perceptions that may be associated with using an off-shore provider. Any slowdown or reversal of existing industry trends towards off-shore outsourcing would seriously harm our ability to compete effectively with competitors that operate solely out of facilities located in the United States or Canada.
A variety of U.S. federal and state legislation has been proposed that, if enacted, could restrict or discourage U.S. companies from outsourcing services outside the United States. For example, legislation has been proposed that would require offshore providers of services requiring direct interaction with clients’ customers to identify to clients’ customers where the offshore provider is located. Because most of our clients are U.S. companies located in the United States, any expansion of existing laws or the enactment of new legislation restricting offshore outsourcing could harm our business, results of operations and financial condition. It is possible that legislation could be adopted that would restrict U.S. private sector companies that have federal or state government contracts from outsourcing their services to off-shore service providers. This would also affect our ability to attract or retain clients that have these contracts.
18
Table of Contents
We may be unable to cost-effectively attract and retain qualified personnel, which could materially increase our costs.
Our business is dependent on our ability to attract, retain and motivate key executives, including our, founder, Chairman and Chief Executive Officer, Mr. R. Scott Murray, and also recruit, hire, train and retain highly qualified technical and managerial personnel, including individuals with significant experience in the industries that we have targeted. The CRM and BPO service industry is labor intensive and is normally characterized by high monthly employee turnover. Any increase in our employee turnover rate would increase our recruiting and training costs, decrease our operating effectiveness and productivity and delay or deter us from taking on additional business resulting in lower financial performance. Also, the introduction of significant new clients or the implementation of new large-scale programs may require us to recruit, hire and train personnel at an accelerated rate. In addition, some of our facilities are located in geographic areas with relatively low unemployment rates, thus potentially making it more difficult and costly to attract and retain qualified personnel. There can be no assurance that we will be able to continue to hire, train and retain sufficient qualified personnel to adequately staff our business.
We may not be able to predict our future tax liabilities. If we become subject to increased levels of taxation or if tax contingencies are resolved adversely, our results of operations and financial performance could be adversely affected.
Due to the international nature of our operations, we are subject to the complex and varying tax laws and rules of several foreign jurisdictions. We may not be able to predict the amount of future tax liabilities to which we may become subject due to some of these complexities if our positions are challenged by local tax authorities. Any increase in the amount of taxation incurred as a result of challenges to our tax filing positions or due to legislative or regulatory changes could result in a material adverse effect on our business, results of operations and financial condition. We are subject to ongoing tax audits, including issues related to transfer pricing, in the United States and other jurisdictions. We have material tax-related contingent liabilities that are difficult to predict or quantify. While we believe that our current tax provisions are reasonable and appropriate, we cannot be assured that these items will be settled for the amounts accrued or that additional exposures will not be identified in the future or that additional tax reserves will not be provided for any such exposures.
Our financial results may be impacted by significant fluctuations in foreign currency exchange rates.
A substantial amount of our operating costs is incurred in foreign currencies. In many cases, we bill our clients in U.S. dollar, Canadian dollar, Euro and U.K. pound sterling denominated amounts and incur costs in the host country in local currency. In recent periods, the U.S. dollar has dropped in value relative to other currencies and therefore our cost of providing services outside the United States has increased accordingly when measured in U.S. dollars. Any continued significant fluctuations in the currency exchange rates between the U.S. dollar, Canadian dollar, Euro and U.K. pounds sterling and the currencies of countries in which we operate may affect our business, results of operations, financial condition and cash flows.
A substantial portion of our costs are incurred and paid in Philippine pesos. Therefore, we are exposed to the risk of an increase in the value of the Philippine peso relative to the U.S. dollar, which would increase the value of those expenses when measured in U.S. dollars. Although we engage in hedging relating to the Canadian dollar, the Indian rupee and the Philippine peso, our hedging strategy may not sufficiently protect us from further strengthening of these currencies against the U.S. dollar. As a result, our expenses could increase and harm our operating results. In the converse, if the U.S. dollar strengthens against the Canadian dollar, the Indian rupee or the Philippine peso, our hedging strategy could reduce the potential benefits we would otherwise expect from a strengthening U.S. dollar. We are also doing business in Latin America but do not yet hedge currencies from these countries.
19
Table of Contents
Our international operations and sales subject us to additional risks, including risks associated with unexpected events.
We conduct business in various countries outside of the United States, including Canada, the Netherlands, the United Kingdom, Italy, Ireland, Spain, Sweden, France, Germany, Poland, Denmark, Bulgaria, India, the Philippines, El Salvador, Egypt, Tunisia, South Africa, Nicaragua, the Dominican Republic and Costa Rica. A key component of our growth strategy is our continued international expansion, especially in new markets, such as China, Eastern Europe, Japan, and South America. There can be no assurance that we will be able to successfully market, sell and deliver our services in these markets, or that we will be able to successfully expand international operations. The global reach of our business could cause us to be subject to unexpected, uncontrollable and rapidly changing events and circumstances. The following factors, among others, could adversely affect our business and earnings:
| • | failure to properly comply with foreign laws and regulations applicable to our foreign activities including, without limitation, employment law requirements; |
| • | compliance with multiple and potentially conflicting regulations in the countries where we operate now and in the future, including employment laws, intellectual property requirements, and the Foreign Corrupt Practices Act and other anti-corruption laws; |
| • | difficulties in managing foreign operations and attracting and retaining appropriate levels of senior management and staffing; |
| • | longer cash collection cycles; |
| • | seasonal reductions in business activities, particularly throughout Europe; |
| • | proper compliance with local tax laws which can be complex and may result in unintended adverse tax consequences; |
| • | anti-American sentiment due to American policies that may be unpopular in certain countries; |
| • | difficulties in enforcing agreements through foreign legal systems; |
| • | fluctuations in exchange rates that may affect product demand and may adversely affect the profitability in U.S. dollars of services we provide in foreign markets, where payment for our products and services is made in the local currency and revenues are earned in U.S. dollars or other currency; |
| • | changes in general economic and political conditions in countries where we operate; |
| • | the ability to efficiently repatriate cash to the United States and transfer cash between foreign jurisdictions; |
| • | changes in transfer pricing policies for income tax purposes in countries where we operate; |
| • | restrictions on downsizing operations and personnel in Europe and other jurisdictions (i.e. regulatory or works council restrictions) and expenses and delays associated with any such activities; and |
| • | changes to or elimination of the international tax holiday for our subsidiaries in India or the Philippines. |
As we continue to expand our business globally, our success will depend, in large part, on our ability to anticipate and effectively manage these and other risks associated with our international operations. Our failure to manage any of these risks successfully could harm our global operations and reduce our global sales, adversely affecting our business and future financial performance.
20
Table of Contents
Countries where we do business have experienced political and economic instability and periodically experience civil unrest and terrorism, which could disrupt our operations and cause our business to suffer.
Countries where we do business, and in particular the Philippines, have experienced significant inflation, currency declines and shortages of foreign exchange. We are exposed to the risk of rental and other cost increases due to inflation in the Philippines, which has historically been at a much higher rate than in the United States. Certain countries where we do business, such as the Philippines, India, Egypt and certain Latin American countries, also periodically experience civil unrest, terrorism and political turmoil and U.S. companies in particular may experience greater risk. In addition, we expect to enter into new markets in places such as China, Japan, South America and Eastern Europe, which may have similar risks. These conditions could disrupt our operations and cause our business to suffer.
Current tax holidays in the Philippines will expire within the next several years.
We currently benefit from income tax holiday incentives in the Philippines pursuant to the registrations with the Philippine Economic Zone Authority, or PEZA, of our various projects and operations. Under such PEZA registrations, the income tax holiday of our various PEZA-registered projects in the Philippines expire at staggered dates through 2012. The expiration of these tax holidays will increase our effective income tax rate.
Our revenues and costs are subject to quarterly variations that may adversely affect quarterly financial results.
We have experienced, and in the future could experience, quarterly variations in revenues as a result of a variety of factors, many of which are outside our control, including:
| • | the timing of new client contracts; |
| • | the timing of new service offerings or modifications in client strategies; |
| • | our ability to attract and retain and increase sales to existing customers; |
| • | the timing of acquisitions of businesses and products by us and our competitors; |
| • | our ability to effectively build and start-up new solution centers; |
| • | product and price competition; |
| • | our ability to build an integrated service offering on a common technology platform; |
| • | changes in our operating expenses; |
| • | software defects or other product quality problems; |
| • | the ability to implement new technologies on a timely basis; |
| • | the expiration or termination of existing contracts; |
| • | the timing of increased expenses incurred to obtain and support new business; |
| • | currency fluctuations; and |
| • | changes in our revenue mix among our various service offerings. |
In addition, our planned staffing levels, investments and other operating expenditures are based on revenue forecasts provided by our clients. If actual revenues are below these forecasts or our own expectations in any given quarter, our business, results of operations, financial condition and cash flows would likely be materially adversely affected for that quarter and thereafter. In addition, to the extent that we enter into mergers and acquisitions or new business ventures in the future, our quarterly or future results may be impacted.
21
Table of Contents
Our financial results may be adversely affected by increases in labor-related costs.
Because a significant portion of our operating costs relate to labor costs, an increase in U.S. or foreign wages, costs of employee benefits or taxes could have a material adverse effect on our business, results of operations and financial condition. For example, over the past several years, healthcare costs have increased at a rate much greater than that of general cost or price indices. Increases in our pricing may not fully compensate us for increases in labor and other costs incurred in providing services. Some of our facilities are located in jurisdictions, such as France, Italy and Germany, where it is difficult or expensive to temporarily or permanently lay off hourly workers due to both local laws and practices within these jurisdictions. Such laws will make it more expensive for us to respond to adverse economic conditions. There can be no assurance that we will be able to increase our pricing or reduce our workforce to fully compensate for the increases in the costs to provide services.
We may need to increase the levels of employee compensation more rapidly than in the past to remain competitive in attracting and retaining the quality and number of employees that our business requires. Wage costs in India and other offshore locations have historically been significantly lower than wage costs in the North America and Europe for comparably skilled professionals, which has been one of Stream’s competitive advantages. However, because of rapid economic growth in India, increased demand for CRM and BPO services from India and increased competition for skilled employees in offshore low cost locations like India and the Philippines, wages for comparably skilled employees in offshore low cost locations like India and the Philippines are increasing at a faster rate than in North America and Europe, which may reduce this competitive advantage. In addition, although eTelecare has not historically experienced significant wage inflation with its Philippine employees, we are faced with increasing competition in the Philippines for service professionals and technicians who generate revenue for us, and we expect this competition will continue to increase as additional outsourcing companies enter the market and expand their operations. In particular, there may be limited availability of qualified middle and upper management candidates. We have benefited from a suitable supply of college graduates in the Philippines. If this favorable supply changes due to increased competition, it could affect the availability and the cost of service professionals and increase our attrition rate.
Wages are generally higher for employees performing data analytics services and risk and financial management services than for employees performing CRM and BPO services. As the scale of our data analytics services and our risk and financial management services increases, wages as a percentage of revenues will likely increase. Wage increases in the long term may reduce our profit margins. Additionally, because substantially all of our employees based outside the United States are paid in local currency, while our revenues are collected in other currencies (primarily in U.S. dollars, the Euro and U.K. pounds sterling), our employee costs as a percentage of revenues may increase or decrease significantly if the exchange rates between these currencies fluctuate significantly.
We have not experienced significant union activity or organized labor activity in the past. There can be no assurance that we will not experience increased union organizing activity in the future. Such organization could increase our cost of labor, limit our ability to modify work schedules and cause work stoppage.
Our profitability will be adversely affected if we do not maintain sufficient capacity utilization.
Our profitability is influenced significantly by the capacity utilization of our service centers. Because our business consists of inbound contacts from end-users, we have no control of when or how many end user customer contacts are made. Moreover, we have significantly higher utilization during peak (week day) periods than during off-peak (night and weekend) periods and therefore we need to reserve capacity at our service centers to anticipate peak periods. In the future, we may consolidate or close under-performing service centers in order to maintain or improve targeted utilization and margins. If we close service centers in the future due to insufficient customer demand, we may be required to record restructuring or impairment charges, which could adversely impact our business, results of operations and financial condition. There can be no assurance that we will be able to achieve or maintain optimal service center capacity utilization.
22
Table of Contents
Many of our existing or emerging competitors are better established and have significantly greater resources, which may make it difficult to attract and retain clients and grow revenues.
The market in which we compete is highly competitive and fragmented. We expect competition to persist and intensify in the future. Our competitors include small firms offering specific applications, divisions of large entities, large independent firms and, most significantly, the in-house operations of clients or potential clients.
Because we compete with the in-house operations of existing or potential clients, our business, results of operations, financial condition and cash flows could be adversely affected if our existing clients decide to provide CRM and other BPO solutions that currently are outsourced or if potential clients retain or increase their in-house customer service and product support capabilities. In addition, competitive pressures from current or future competitors or in-house operations could cause our services to lose market acceptance or result in significant price erosion, which would have a material adverse effect upon our business, results of operations, financial condition and cash flows. Some of our clients may in the future seek to consolidate services that we provide, which may in turn reduce the amount of work we perform for them.
Some of our existing and future competitors have greater financial, human and other resources, longer operating histories, greater technological expertise, more recognizable brand names and more established relationships than we do in the industries that we currently serve or may serve in the future. Some of our competitors may enter into merger, strategic or commercial relationships among themselves or with larger, more established companies in order to increase their ability to address client needs. Increased competition, pricing pressure or loss of market share could reduce our operating margin, which could harm our business, results of operations, financial condition and cash flows.
We may engage in future acquisitions that could disrupt our business, cause dilution to our stockholders and harm our financial position and operating results.
We may pursue acquisitions of companies or assets in order to enhance our market position and/or expand the types of services that we offer to our clients and may enter geographic markets where we do not currently conduct business. We may also acquire minority interest in companies or enter into joint venture arrangements with other parties, which may include existing clients. We may also pursue certain acquisitions on an unsolicited basis, which may cause management distractions and increased legal costs. We may not be able to find suitable acquisition candidates and we may not be able to consummate such acquisitions on favorable terms, if at all. If we do complete acquisitions, we cannot be sure that they will ultimately strengthen our competitive position, or that our clients, employees or investors will not view them negatively. Acquisitions may disrupt our ongoing operations, divert management from day-to-day responsibilities, increase our indebtedness, liabilities, exposure to different legal regimes and/or regulations, and expenses and harm our operating results or financial condition. We may not be able to successfully integrate these acquisitions into our operations and may lose key clients, employees, members of management or not achieve the synergies and other benefits expected from the acquisition or investment. Future acquisitions may reduce our cash available for operations and other uses and could result in an increase in amortization expense, potentially dilutive issuances of equity securities or the incurrence of debt, which could harm our business, results of operations, financial condition and cash flows.
Our business depends on uninterrupted service to our clients. A system failure or labor shortage could cause delays or interruptions of service, which could cause us to lose clients.
Our operations are dependent upon our ability to protect our service centers, computer and telecommunications equipment and software systems against damage or interruption from fire, power loss, telecommunications interruption or failure, natural disaster, breaches in data and technology security integrity and other similar events in order to provide our clients with reliable services. Additionally, we depend on our employees to perform our services on behalf of our clients. If employees miss work due to labor shortages, natural disasters and other similar events, our ability to provide our clients with reliable services will be hindered. Some of the events that could adversely affect our ability to deliver reliable service include physical damage to
23
Table of Contents
our network operations centers; disruptions, power surges or outages to our computer and telecommunications technologies which are beyond our control; sabotage or terrorist attacks and cyber attacks or data theft; software defects; fire or natural disasters such as typhoons, hurricanes, floods and earthquakes; and labor shortages or walk-outs.
Technology is a critical foundation in our service delivery. We utilize and deploy internally developed and third party software solutions that is often customized by us across various hardware and software environments. We operate an extensive internal voice and data network that links our global sites together in a multi-hub model that enables the rerouting of call volumes. We also rely on multiple public communication channels for connectivity to our clients. Maintenance of and investment in these foundational components are critical to our success. If the reliability of technology or network operations fall below required service levels, or a systemic fault affects the organization broadly, business from our existing and potential clients may be jeopardized and cause our revenue to decrease.
If we experience a temporary or permanent interruption at one or more of our service centers and/or data centers, through casualty, operating malfunction, labor shortage or otherwise, our business could be materially adversely affected and we may be required to pay contractual damages to affected clients or allow some clients to terminate or renegotiate their contracts with us. Although we maintain property, business interruption and general liability insurance, including coverage for errors and omissions, there can be no assurance that our existing coverage will continue to be available on reasonable terms or will be available in amounts sufficient to cover one or more large claims, or that the insurer will not disclaim coverage as to any future claim. The occurrence of errors could result in a loss of data to us or our clients, which could cause a loss of revenues, failure to achieve product acceptance, increased insurance costs, product returns, legal claims, including product liability claims, against us, delays in payment to us by clients, increased service and warranty expenses or financial concessions, diversion of resources, injury to our reputation, or damages to our efforts to build brand awareness, any of which could have a material adverse effect on our market share and, in turn, our business, results of operations, financial condition and cash flows.
We are subject to U.S. and foreign jurisdiction laws relating to individually identifiable information, and failure to comply with those laws, whether or not inadvertent, could subject us to legal actions and negatively impact our operations.
We process, transmit and store information relating to identifiable individuals, both in our role as a service provider and as an employer. As a result, we are subject to numerous U.S. (both federal and state) and foreign jurisdiction laws and regulations, such as the U.S. Health Insurance Portability and Accountability Act and the European Union Data Protection Directive 95/46/EC, governing the protection and processing of individually identifiable information, including social security numbers, financial and health information. Failure to comply with these types of laws may subject us to, among other things, liability for monetary damages, fines and/or criminal prosecution, unfavorable publicity, restrictions on our ability to process information and allegations by our clients that we have not performed our contractual obligations, any of which may have a material adverse effect on our profitability and cash flow.
Unauthorized disclosure of sensitive or confidential data could expose us to protracted and costly litigation and penalties and may cause us to lose clients.
We are dependent on information technology networks and systems to process, transmit and store electronic information and to communicate among our locations and with our partners and clients. Security breaches of this infrastructure could lead to shutdowns or disruptions of our systems and potential unauthorized disclosure of confidential information. We are also required at times to manage, utilize, record and store sensitive or confidential data. As a result, we are subject to numerous federal and state laws and regulations designed to protect this information. If any person, including any of our employees, negligently disregards or intentionally breaches our established controls with respect to such data or otherwise mismanages or misappropriates that data,
24
Table of Contents
we could be subject to monetary damages, fines and/or criminal prosecution. Unauthorized disclosure or recording of sensitive or confidential client or customer data, whether through system failure, employee negligence, fraud or misappropriation, could damage our reputation and cause us to lose clients. Similarly, unauthorized access to or through our information systems, whether by our employees or third parties, could result in negative publicity, legal liability and damage to our reputation, business, results of operations, financial condition and cash flows.
We have a long selling cycle for our CRM and BPO services that requires significant funds and management resources and a long implementation cycle that requires significant resource commitments.
We have a long selling cycle for our CRM and BPO services for new clients, which requires significant investment of capital, resources and time by both our clients and us. Typically, before committing to use our services, potential clients require us to expend substantial time and resources educating them as to the value of our services and assessing the feasibility of integrating our systems and processes with theirs. Our clients then evaluate our services before deciding whether to use them. Therefore, our selling cycle, which generally ranges from six to twelve months, is subject to many risks and delays over which we have little or no control, including our clients’ decision to choose alternatives to our services (such as other providers or in-house offshore resources) and the timing of our clients’ budget cycles and approval processes. In addition, we may not be able to successfully conclude a contract after the selling cycle is complete.
Implementing our services involves a significant commitment of resources over an extended period of time from both our clients and us. Our clients may also experience delays in obtaining internal approvals or delays associated with technology or system implementations, thereby delaying further the implementation process. Our clients and future clients may not be willing or able to invest the time and resources necessary to implement our services, and we may fail to close sales with potential clients to which we have devoted significant time and resources, which could have a material adverse effect on our business, results of operations, financial condition and cash flows.
Once we are engaged by a client, it may take us several months before we start to recognize significant revenues.
When we are engaged by a client after the selling process for our CRM and BPO services, it takes from four to six weeks to integrate the client’s systems with ours and up to three months thereafter to ramp up our services and staff levels, including hiring and training qualified service professionals and technicians, to the client’s requirements. Depending on the complexity of the processes being implemented, these time periods may be significantly longer. Implementing processes can be subject to potential delays similar to certain of those affecting the selling cycle. Therefore, we do not recognize significant revenues until after we have completed the implementation phase.
If we are unable to adjust our pricing terms or the mix of products and services we provide to meet the changing demands of our CRM and BPO clients and potential CRM and BPO clients, our business, results of operations and financial condition may be adversely affected.
Industry pricing models are evolving, and we anticipate that clients may increasingly request transaction-based pricing. This pricing model will place additional pressure on the efficiency of our service delivery so that we can maintain reasonable operating margins. If we are unable to adapt our operations to evolving pricing protocols, our results of operations may be adversely affected or we may not be able to offer pricing that is attractive relative to our competitors.
In addition, the CRM and BPO services we provide to our clients, and the revenues and income from those services, may decline or vary as the type and quantity of services we provide under those contracts changes over time, including as a result of a shift in the mix of products and services we provide. Furthermore, our clients,
25
Table of Contents
some of which have experienced rapid changes in their prospects, substantial price competition and pressures on their profitability, have in the past and may in the future demand price reductions, automate some or all of their processes or change their outsourcing strategy by moving more work in-house or to other providers, any of which could reduce our profitability. Any significant reduction in or the elimination of the use of the services we provide to any of our clients, or any requirement to lower our prices, would harm our business.
We depend on third-party technology that, if it should become unavailable, contain defects, or infringe on another party’s intellectual property rights, could result in increased costs or delays in the production and improvement of our products or result in liability claims.
We license critical third-party technology that we incorporate into our services on a non-exclusive basis. We customize the third-party software in many cases to our specific needs and content requirements. While we monitor our usage of third-party technology and our compliance with our licenses to use such technology, we may inadvertently violate the terms of our license agreements, which could subject us to liability, including the termination of our rights to use such software or the imposition of additional license fees. If our relations with any of these third-party technology providers become impaired, or if the cost of licensing any of these third-party technologies increases, our gross margin levels could significantly decrease and our business could be harmed.
The operation of our business would also be impaired if errors occur in the third-party software that we utilize or the third-party software infringes upon another party’s intellectual property rights. It may be more difficult for us to correct any defects or viruses in third-party software because the software is not within our control. If we are unable to correct such errors, our business could be adversely affected. There can be no assurance that these third parties will continue to invest the appropriate resources in their products and services to maintain and enhance the capabilities of their software. In addition, although we try to limit our exposure to potential claims and liabilities arising from third-party infringement claims arising out of, and errors, defects or viruses in, such third-party software, in the license agreements that we enter into with such third-party software providers, such provisions may not effectively protect us against such claims in all cases and in all jurisdictions.
If we are unable to keep pace with technological changes, our business will be harmed.
Our business is highly dependent on our computer and telecommunications equipment, infrastructure and software capabilities. Our failure to maintain the competitiveness of our technological capabilities or to respond effectively to technological changes could have a material adverse effect on our business, results of operations or financial condition. Our continued growth and future profitability will be highly dependent on a number of factors, including our ability to:
| • | expand our existing solutions offerings; |
| • | achieve cost efficiencies in our existing service center operations; |
| • | introduce new solutions that leverage and respond to changing technological developments; and |
| • | remain current with technology advances. |
There can be no assurance that technologies, applications or services developed by our competitors or vendors will not render our products or services non-competitive or obsolete, that we can successfully develop and market any new services or products, that any such new services or products will be commercially successful or that the integration of automated customer support capabilities will achieve intended cost reductions. In addition, the inability of equipment vendors and service providers to supply equipment and services on a timely basis could harm our operations and financial condition.
26
Table of Contents
Defects or errors within our software could adversely affect our business and results of operations.
Design defects or software errors may delay software introductions or reduce the satisfaction level of clients and may have a materially adverse effect on our business and results of operations. Our software is highly complex and may, from time to time, contain design defects or software errors that may be difficult to detect and/or correct. Since both our clients and we use our software to perform critical business functions, design defects, software errors or other potential problems within or outside of our control may arise from the use of our software. It may also result in financial or other damages to our clients, for which we may be held responsible. Although our license agreements with our clients often contain provisions designed to limit our exposure to potential claims and liabilities arising from client problems, these provisions may not effectively protect us against such claims in all cases and in all jurisdictions. Claims and liabilities arising from client problems could result in monetary damages to us and could cause damage to our reputation, adversely affecting our business and results of operations.
Failure to comply with internal control attestation requirements could lead to loss of public confidence in our financial statements.
Any future acquisitions and other material changes in our operations likely will require us to expand and possibly revise our disclosure controls and procedures, internal controls over our financial reporting and related corporate governance policies. In addition, the Sarbanes-Oxley Act of 2002 and associated regulations relating to effectiveness of internal controls over financial reporting are subject to varying interpretations in many cases due to their lack of specificity and, as a result, their application in practice may evolve over time as new guidance is provided by regulatory and governing bodies. If we fail to comply with these laws and regulations or our efforts to comply with these laws and regulations differ from the conduct intended by regulatory or governing bodies due to ambiguities or varying interpretations of the law, we could be subject to regulatory sanctions, the public may lose confidence in our internal controls and the reliability of our financial statements, and our reputation may be harmed.
The industries in which we operate are continually evolving. Our services may become obsolete, and we may not be able to develop competitive services on a timely basis or at all.
The CRM and BPO service industry is characterized by rapid technological change, competitive pricing, frequent new service introductions and evolving industry standards. The success of our company will depend on our ability to anticipate and adapt to these challenges and to offer competitive services on a timely basis. We face a number of difficulties and uncertainties associated with this reliance on technological development, such as:
| • | competition from service providers using other means to deliver similar or alternative services; |
| • | realizing economies of scale on a global basis (including conducting future business in places such as Eastern Europe, China, Japan and South America); |
| • | responding successfully to advances in competing technologies and network security in a timely and cost-effective manner; and |
| • | existing, proposed or undeveloped technologies that may render our services less profitable or obsolete. |
If we fail to manage future growth effectively, we may be unable to execute our business plan, maintain high levels of service or address competitive challenges adequately.
We plan to expand our business. We anticipate that this expansion will require substantial management effort and significant additional investment in infrastructure, service offerings and service center expansion. In addition, we will be required to continue to improve our operational, financial and management controls and our reporting procedures. Future growth of our company will place a significant strain on managerial, administrative, operational, financial and other resources. If we are unable to manage growth successfully, our business will be harmed.
27
Table of Contents
Government regulation of our industry and the industries we serve may increase our costs and restrict the operation and growth of our business.
Both the U.S. Federal and various state governments regulate our business and the outsourced business services industry as a whole. The Federal Telemarketing and Consumer Fraud and Abuse Prevention Act of 1994 broadly authorizes the FTC to issue regulations restricting certain telemarketing practices and prohibiting misrepresentations in telephone sales. The FTC regulations implementing this Act are commonly referred to as the Telemarketing Sales Rule. Our operations outside the United States are also subject to regulation. In addition to current laws, rules and regulations that regulate our business, bills are frequently introduced in Congress to regulate the use of credit information. We cannot predict whether additional Federal or state legislation that regulates our business will be enacted. Additional Federal or state legislation could limit our activities or increase our cost of doing business, which could cause our operating results to suffer.
We could be subject to a variety of regulatory enforcement or private actions for our failure or the failure of our clients to comply with these regulations. Our results of operations could be adversely impacted if the effect of government regulation of the industries we serve is to reduce the demand for our services or expose us to potential liability.
We may become involved in litigation that may materially adversely affect us.
We are currently, and from time to time in the future we may become involved in various legal proceedings relating to matters incidental to the ordinary course of our business, including patent, software, commercial, product liability, employment, class action, whistleblower and other litigation and claims, and governmental and other regulatory investigations and proceedings. Such matters can be time-consuming, divert management’s attention and resources and cause us to incur significant expenses. Furthermore, because litigation is inherently unpredictable, there can be no assurance that the results of any of these actions will not have a material adverse effect on our business, results of operations or financial condition.
An outbreak of a pandemic, flu or other disease, or the threat of a pandemic, flu or other disease, may adversely impact our ability to perform our services or may adversely impact client and consumer demand.
We have a large number of employees across the world in many different countries with different levels of healthcare monitoring. Most of these employees work in relatively close proximity to each other in our service centers. A significant or widespread outbreak of a pandemic, such as the flu or other contagious illness, or even a perceived threat of such an outbreak, could cause significant disruptions to our employee base and could adversely impact our ability to provide our services and deliver our products. This could have a significant impact on our business and our results of operations.
Risks Related to Our Equity Securities
There can be no assurance that NYSE Amex will continue to list our securities on its exchange, and any delisting could limit investors’ ability to make transactions in our securities and subject us to additional trading restrictions.
Our units, common stock and warrants are listed on NYSE Amex, a national securities exchange. We cannot assure you that our securities will continue to be listed on NYSE Amex in the future. If NYSE Amex delists our securities from trading on its exchange and we are unable to list our securities on another exchange, our securities could be quoted on the OTC Bulletin Board, or “pink sheets.” As a result, we could face significant adverse consequences, including but not limited to the following:
| • | a limited availability of market quotations for our securities; |
| • | a determination that our common stock is a “penny stock” which will require brokers trading in our common stock to adhere to more stringent rules and possibly resulting in a reduced level of trading activity in the secondary trading market for our securities; |
28
Table of Contents
| • | a reduced liquidity for our securities; |
| • | a decreased ability to obtain new financing or issue new securities on favorable terms in the future; |
| • | a decreased ability to issue additional securities or obtain additional financing in the future; and |
| • | a decreased ability of our security holders to sell their securities in certain states. |
The value of our units, common stock and warrants may be adversely affected by market volatility.
The market price of our units, shares and warrants has been highly volatile and subject to wide fluctuations. In addition, our management and financial sponsors hold a large percentage of our outstanding shares, which are subject to certain restrictions on resale, and our relatively low trading volume causes significant price variations to occur. If the market prices of our units, shares and warrants decline significantly, you may be unable to resell your units, shares and warrants at or above your purchase price, if at all. We cannot assure you that the market price of our units, shares and warrants will not fluctuate or decline significantly in the future. Some of the factors that could negatively affect the price of our units, shares and warrants or result in fluctuations in the price or trading volume of our units, shares and warrants include:
| • | significant volatility in the market price and trading volume of comparable companies; |
| • | actual or anticipated changes in our earnings or fluctuations in our operating results or in the expectations of securities analysts; |
| • | the exercise of participation rights held by certain of our stockholders in connection with the exercise of our warrants; |
| • | announcements of technological innovations, new products, strategic alliances or significant agreements by us or by our competitors; |
| • | general economic conditions and trends; |
| • | catastrophic events; or |
| • | recruitment or departure of key personnel. |
The control that our financial sponsors have over us and provisions in our organizational documents and Delaware law might limit your ability to influence the outcome of key transactions, including a change in control, and, therefore, depress the trading price of our common stock.
Our financial sponsors, Ares Corporate Opportunities Fund II, L.P., NewBridge International Investment Ltd. and EGS Dutchco B.V., collectively own approximately 87% of our common stock and are parties to a stockholders agreement that restricts our ability to undertake certain actions. Therefore, our financial sponsors collectively are able to determine the outcome of all matters requiring stockholder approval, are able to cause or prevent a change of control of our company or a change in the composition of our board of directors, and could preclude any unsolicited acquisition of our company. The market price of our shares could be adversely affected to the extent that this concentration of ownership and stockholders agreement, as well as provisions of our organizational documents, discourage or impede potential takeover attempts that our other stockholders may favor. Furthermore, our financial sponsors may, in the future, own businesses that directly or indirectly compete with us. Our financial sponsors may also pursue acquisition opportunities that may be complementary to our business, and as a result, those acquisition opportunities may not be available to us.
Provisions in our organizational documents and Delaware law may also discourage, delay or prevent a merger, acquisition or other change in control that stockholders may consider favorable, including transactions in which you might otherwise receive a premium for your shares of our common stock. These provisions may also prevent or frustrate attempts by our stockholders to replace or remove our management. For example, our organizational documents require advance notice for proposals by stockholders and nominations, place
29
Table of Contents
limitations on convening stockholder meetings and authorize the issuance of preferred shares that could be issued by our board of directors to thwart a takeover attempt. Moreover, certain provisions of Delaware law may delay or prevent a transaction that could cause a change in our control.
Our outstanding warrants have been, and in the future may be, exercised and trigger the exercise of certain participation rights held by our major stockholders, which have increased, and in the future would increase, the number of shares eligible for future resale in the public market and result in dilution to our stockholders. This might have an adverse effect on the market price of our common stock.
In November 2009, pursuant to an agreement with Ares, we bought 425,000 of our public warrants at a price of $0.15 per warrant for a total of $63,750. In December 2009, we closed our self-tender offer to purchase up to 17,500,000 of our public warrants and accepted for purchase 9,956,689 warrants for a total cost of approximately $4,978,000, excluding fees and expenses related to the tender offer. As of December 31, 2009, 131,402 of our publicly traded warrants have been exercised for a total exercise price of $788,412, leaving 10,008,526 shares subject to outstanding warrants, including 30,223 shares of common stock underlying warrants embedded in our units. To the extent that additional warrants are exercised, additional shares of our common stock will be issued, which will result in further dilution to our stockholders and increase the number of shares eligible for resale in the public market. In addition, the exercise of any of our publicly traded warrants triggers contractual participation rights for Ares, NewBridge and Dutchco, pursuant to which they would have the right to purchase from us 2.4364 additional shares of common stock at $6.00 per share for each of our publicly traded warrants that are exercised, up to a maximum of approximately 24,385,000. In connection with the exercise of 131,402 of our publicly traded warrants, Ayala Corporation exercised its contractual participation rights to purchase an additional 320,146 shares of common stock at $6.00 per share, for a total purchase price of approximately $1,921,000. Sales in the public market of substantial numbers of shares acquired through either the exercise of these participation rights or the exercise of these warrants could adversely affect the market price of our shares.
We do not expect to pay any dividends on our common stock for the foreseeable future.
You should not rely on an investment in our common stock to provide dividend income. We do not anticipate that we will pay any dividends to holders of our common stock in the foreseeable future. Instead, we plan to retain any earnings to maintain and expand our existing operations. In addition, we are restricted from paying dividends in certain circumstances under the terms of the indenture governing our Notes and the ABL Credit Facility. Accordingly, investors must rely on sales of their common stock after price appreciation, which may never occur, as the only way to realize any return on their investment. As a result, investors seeking cash dividends should not purchase our common stock.
We may choose to redeem our outstanding warrants at a time that is disadvantageous to our warrant holders.
We may redeem the warrants issued as a part of our publicly traded units at any time in whole and not in part, at a price of $0.01 per warrant, upon a minimum of 30 days’ prior written notice of redemption, if and only if, the last sales price of our common stock equals or exceeds $11.50 per share for any 20 trading days within a 30 trading day period ending three business days before we send the notice of redemption. Redemption of the warrants could force the warrant holders (1) to exercise the warrants and pay the exercise price therefore at a time when it may be disadvantageous for the holders to do so, (2) to sell the warrants at the then current market price when they might otherwise wish to hold the warrants or (3) to accept the nominal redemption price which, at the time the warrants are called for redemption, is likely to be substantially less than the market value of the warrants.
30
Table of Contents
We have broad discretion in the use of the net proceeds from the exercise of the warrants.
We cannot specify with certainty the particular uses of the net proceeds we will receive from the exercise of the warrants. Our management will have broad discretion in the application of the net proceeds. Accordingly, you will have to rely upon the judgment of our management with respect to the use of the proceeds, with only limited information concerning management’s specific intentions. Our management may spend a portion or all of the net proceeds from this offering in ways that our stockholders may not desire or that may not yield a favorable return.
| ITEM 1B. | UNRESOLVED STAFF COMMENTS |
None.
| ITEM 2. | PROPERTIES |
Description of Property
We have 50 locations in 22 countries that are designed to be globally integrated. Our facilities are organized into two regions: Americas, which includes the United States, Canada, the Philippines, India, Costa Rica, the Dominican Republic, Nicaragua and El Salvador; and EMEA, which includes Europe, the Middle East and Africa.
We do not own offices or properties but rather lease offices in the United States, Canada, the Netherlands, the United Kingdom, Italy, Ireland, Spain, Sweden, France, Germany, Poland, India, Tunisia, the Dominican Republic, Costa Rica, El Salvador, Nicaragua, the Philippines, Egypt, South Africa, Denmark and Bulgaria. Our headquarters are located in Wellesley, Massachusetts.
We believe that our facilities are adequate for our present needs in all material respects.
| ITEM 3. | LEGAL PROCEEDINGS |
We have been named as a third-party defendant in a putative class action captioned Kambiz Batmanghelich, on behalf of himself and all others similarly situated and on behalf of the general public, v. Sirius XM Radio, Inc., filed in the Los Angeles County Superior Court on November 10, 2009, and removed to the United States District Court for the Central District of California. The Plaintiff alleges that Sirius XM Radio, Inc. recorded telephone conversations between Plaintiff and members of the proposed class of Sirius customers, on the one hand, and Sirius and its employees, on the other, without the Plaintiff’s and class members’ consent in violation of California’s telephone recording laws. The Plaintiff also alleges negligence and violation of the common law right of privacy, and seeks injunctive relief. On December 21, 2009, Sirius XM Radio, Inc. filed a Third-Party Complaint in the action against us seeking indemnification for any defense costs and damages that result from the putative class action. The Plaintiff has not alleged any claims against us. We believe that we have meritorious defenses to Sirius XM Radio, Inc.’s claims, but there can be no assurance as to the outcome of this lawsuit and an adverse outcome could have a material adverse effect on our business, results of operations or financial condition.
| ITEM 4. | RESERVED |
31
Table of Contents
PART II
| ITEM 5. | MARKET FOR REGISTRANT’S COMMON EQUITY, RELATED STOCKHOLDER MATTERS AND ISSUER PURCHASES OF EQUITY SECURITIES |
On October 18, 2007, our units began trading on NYSE Amex under the symbol “OOO.U”. Each of our units consists of one share of common stock and one warrant. On November 27, 2007, the common stock and warrants underlying our units began to trade separately on NYSE Amex under the symbols “OOO” and “OOO.WS”, respectively. On October 26, 2009, we changed our symbols to “SGS,” “SGS.U” and “SGS.WS”, respectively.
The following sets forth the high and low sales price of our common stock, warrants and units, as reported on NYSE Amex for the periods shown:
| Common Stock | Warrants | Units | ||||||||||||||||
| High | Low | High | Low | High | Low | |||||||||||||
| Fiscal Year Ended December 31, 2007 |
||||||||||||||||||
| 4th Quarter (commencing October 18, 2007) |
$ | 7.30 | $ | 7.15 | $ | 0.68 | $ | 0.61 | $ | 8.10 | $ | 7.75 | ||||||
| Fiscal Year Ending December 31, 2008 |
||||||||||||||||||
| 1st Quarter |
$ | 7.65 | $ | 7.21 | $ | 0.65 | $ | 0.18 | $ | 8.20 | $ | 7.63 | ||||||
| 2nd Quarter |
$ | 7.78 | $ | 7.24 | $ | 0.91 | $ | 0.12 | $ | 8.55 | $ | 7.50 | ||||||
| 3rd Quarter |
$ | 7.99 | $ | 2.05 | $ | 0.79 | $ | 0.05 | $ | 8.50 | $ | 2.50 | ||||||
| 4th Quarter |
$ | 6.20 | $ | 1.14 | $ | 0.59 | $ | 0.01 | $ | 7.50 | $ | 1.02 | ||||||
| Fiscal Year Ending December 31, 2009 |
||||||||||||||||||
| 1st Quarter |
$ | 4.35 | $ | 2.84 | $ | 0.22 | $ | 0.06 | $ | 3.51 | $ | 4.50 | ||||||
| 2nd Quarter |
$ | 5.05 | $ | 2.95 | $ | 0.80 | $ | 0.11 | $ | 3.75 | $ | 4.98 | ||||||
| 3rd Quarter |
$ | 5.50 | $ | 3.39 | $ | 0.35 | $ | 0.06 | $ | 4.27 | $ | 5.43 | ||||||
| 4th Quarter |
$ | 7.01 | $ | 5.30 | $ | 0.35 | $ | 0.06 | $ | 5.25 | $ | 7.44 | ||||||
On March 3, 2010, there were approximately 290 holders of record of our common stock, 1 holder of record of our warrants and 1 holder of record of our units.
Dividend Policy
We have not paid any dividends on our common stock to date. Our board does not anticipate declaring any dividends on the common stock in the foreseeable future. The payment of dividends on the common stock in the future, if any, will be within the discretion of our then Board of Directors and will be contingent upon our revenues and earnings, if any, capital requirements and general financial condition.
During 2009, holders of the Series A and Series B Preferred Stock received dividends of $58,018. As discussed in the accompanying financial statements, all Preferred Stock outstanding was converted to shares of our common stock during 2009 in connection with the closing of the Combination with eTelecare on October 1, 2009.
32
Table of Contents
Equity Compensation Plan Information
Securities Authorized for Issuance under our Equity Compensation Plans
At December 31, 2009, we had only one equity compensation plan, our 2008 Stock Incentive Plan. The following table contains information about our 2008 Stock Incentive Plan. See Note 14 in our Notes to Consolidated Financial Statements for a description of our 2008 Stock Incentive Plan.
| Plan Category |
Number of Shares to be Issued upon Exercise of Outstanding Options (Column A) |
Weighted Average Exercise Price of Outstanding Options (Column B) |
Number of Shares Remaining Available for Future Issuance under Equity Compensation Plans (Excluding Shares Reflected in Column A) | |||||
| Equity compensation plans that have been approved by our stockholders |
6,977,500 | (1) | $ | 6.15 | 2,368,119 | |||
| Equity compensation plans that have not been approved by our stockholders |
— | — | — | |||||
| Total |
6,977,500 | 6.15 | 2,368,119 | |||||
| (1) | This amount does not include 654,381 shares of outstanding restricted stock granted to our employees. |
33
Table of Contents
Performance Graph
The following graph compares the cumulative total return of our common stock from November 27, 2007, the date that our common stock first became separately tradable, through December 31, 2009 with the cumulative total return of (1) the Russell 2000 Index, (2) the peer group of companies that we used for this graph in our Annual Report on Form 10-K for the year ended December 31, 2008, as described below (our “Peer Group 2008”), and (3) a revised peer group of companies that we chose for this Annual Report, as described below (our “Peer Group 2009”). The graph assumes $100 invested on November 27, 2007 in our common stock, the Russell 2000 Index, the Peer Group 2008 and the Peer Group 2009. This information shall not be deemed to be “filed” with the Securities and Exchange Commission and shall not be incorporated by reference into any filing under the Securities Act of 1933, as amended, or the Securities Exchange Act of 1934, as amended, unless we specifically incorporate it by reference.
COMPARISON OF 25 MONTH CUMULATIVE TOTAL RETURN*
Among Stream Global Services, Inc., The Russell 2000 Index,
Peer Group 2008 And Peer Group 2009
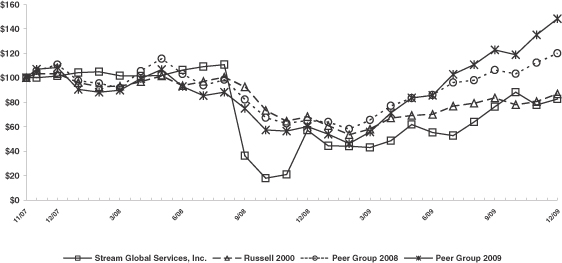
| * | $100 invested on 11/27/07 in stock or index, including reinvestment of dividends. Fiscal year ending December 31. |
| 11/27/2007 | 12/31/2007 | 12/31/2008 | 12/31/2009 | |||||
| SGS |
100.00 | 101.39 | 57.15 | 82.64 | ||||
| Russell 2000 Index |
100.00 | 103.26 | 68.37 | 86.95 | ||||
| Peer Group 2008 |
100.00 | 110.80 | 65.02 | 120.16 | ||||
| Peer Group 2009 |
100.00 | 108.48 | 60.06 | 148.29 |
34
Table of Contents
| Our Peer Group 2009 consists of the following companies: • APAC Customer Services Inc. • Convergys Corporation • EXLService Holdings, Inc. • Startek Inc. • Sykes Enterprises, Incorporated • TechTeam Global, Inc. • Teleperformance S.A. • TeleTech Holdings Inc. • Tivit Terceirizacao Processos Servicos • Wipro Ltd. • WNS (Holdings) Limited |
Our Peer Group 2008 consists of the following companies: • Affiliated Computer Services, Inc. • The Capita Group Plc • Convergys Corporation • EXLService Holdings, Inc. • Genpact Limited • Infosys Technologies Limited • Sykes Enterprises, Incorporated • TechTeam Global, Inc. • Teleperformance S.A. • TeleTech Holdings Inc. • Wipro Ltd. • WNS (Holdings) Limited |
Issuer Purchases of Equity Securities
During the fourth quarter of 2009, we repurchased the following number of our public warrants:
| Period |
(a) Total Number of Warrants Purchased |
(b) Average Price Paid per Warrant |
(c) Total Number of Warrants Purchased as Part of Publicly Announced Plans or Programs |
(d) Maximum Number of Warrants that may yet be Purchased under the Plan or Program | ||||||
| October 2009 (Oct. 1, 2009 – Oct. 31, 2009) |
0 | $ | 0 | 0 | 0 | |||||
| November 2009 (Nov. 1, 2009 – Nov. 30, 2009) |
425,000 | $ | 0.15 | 0 | 0 | |||||
| December 2009 (Dec. 1, 2009 – Dec. 31, 2009) |
9,956,689 | $ | 0.50 | 9,956,689 | (1) | 0 | ||||
| Total |
10,381,689 | 9,956,689 | 0 | |||||||
| (1) | On November 13, 2009 we commenced our publicly announced self-tender offer to purchase up to 17,500,000 of our public warrants that are exercisable for one share of our common stock for $6.00 in cash, at a purchase price of $.50 per warrant net to the seller in cash, without interest, for a total purchase price of up to $8,750,000. We closed the self-tender on December 14, 2009, at which time we accepted for purchase 9,956,689 warrants for a total cost of approximately $4,978,000, excluding fees and expenses related to the tender offer. |
| ITEM 6. | SELECTED FINANCIAL DATA |
The data set forth below should be read in conjunction with Item 7, “Management’s Discussion and Analysis of Financial Condition and Results of Operations,” and our consolidated financial statements and related notes appearing elsewhere in this Annual Report on Form 10-K.
In October 2007, we consummated our initial public offering in which we sold 31,250,000 units, each consisting of one share of our common stock and a warrant to purchase one share of our common stock. We received total gross proceeds of $250.0 million and net proceeds of $246.3 million, including $7.5 million of proceeds from the sale of 7,500,000 warrants to certain of our founding stockholders, which were deposited into a trust account. Our founders subsequently sold their 7,500,000 warrants to Ares, who have since sold them back to us in exchange for the issuance of 1,000,000 shares.
In July 2008, we acquired SHC for $128.8 million (which reflected the $200.0 million purchase price less assumed indebtedness, transaction fees, employee transaction related bonuses, professional fees, stock option
35
Table of Contents
payments and payments for working capital). Also in July 2008, holders of 8,947,000 shares of our common stock exercised their conversion rights in connection with the acquisition of SHC, and we paid an aggregate of $70.59 million to such holders. In connection with our acquisition of SHC, we changed our name from Global BPO Services Corp. to Stream Global Services, Inc., or SGS.
In August 2009, Stream, EGS, the parent company of eTelecare and other parties signatory thereto, entered into a definitive agreement to combine in a stock-for-stock exchange. On October 1, 2009, the Combination closed, with the pre-Combination Stream and EGS stockholders owning approximately 57.5% and 42.5%, respectively, of the combined entity.
The following balance sheet data and statements of operations data for each of the three years ended December 31, 2009 were derived from SHC’s and SGS’s audited consolidated financial statements. Consolidated balance sheets as of December 31, 2009 and 2008 and the related consolidated statements of operations and cash flows for each of the three years in the period ended December 31, 2008 and notes thereto appear elsewhere in this Annual Report on Form 10-K.
In addition, in order to assist investors in better understanding the historical performance of our operating business, we have also included below financial information for SHC for periods before we acquired SHC.
SGS
| Years Ended December 31, | ||||||||||||
| (In thousands, except per share amounts) |
2009 | 2008 | 2007 | |||||||||
| Revenue |
$ | 584,769 | $ | 211,373 | $ | — | ||||||
| Gross profit |
242,576 | 83,095 | — | |||||||||
| Income (loss) from operations |
(5,545 | ) | 5,229 | (242 | ) | |||||||
| Net income (loss) |
(28,573 | ) | 796 | 1,117 | ||||||||
| Income (loss) per share attributable to common stockholders per share: |
$ | (3.46 | ) ) | $ | (2.20 | ) | $ | 0.07 | ||||
SHC
| Seven months ended July 31, 2008 |
Years Ended December 31, | |||||||||||||||
| (In thousands, except per share amounts) |
2007 | 2006 | 2005 | |||||||||||||
| Revenue |
$ | 312,085 | $ | 483,569 | $ | 405,547 | $ | 310,905 | ||||||||
| Gross profit |
109,409 | 162,634 | 128,679 | 93,827 | ||||||||||||
| Income (loss) from operations |
(14,667 | ) | 5,894 | 5,470 | (11,114 | ) | ||||||||||
| Net income (loss) |
$ | (25,372 | ) | $ | (11,323 | ) | $ | (5,349 | ) | $ | (17,544 | ) | ||||
SGS
| December 31, | ||||||
| (In thousands) |
2009 | 2008 | ||||
| Total current assets |
$ | 227,386 | $ | 146,856 | ||
| Property, equipment and fixtures, net |
96,816 | 41,634 | ||||
| Total assets |
680,823 | 329,945 | ||||
| Total current liabilities |
115,337 | 79,392 | ||||
| Long term debt and capital leases |
218,159 | 69,108 | ||||
| Preferred stock |
— | 145,911 | ||||
| Stockholders’ equity |
$ | 303,411 | $ | 1,751 | ||
36
Table of Contents
SHC
| December 31, | |||||||||
| (In thousands) |
2007 | 2006 | 2005 | ||||||
| Total current assets |
$ | 138,914 | $ | 102,825 | $ | 78,635 | |||
| Property, equipment and fixtures, net |
36,656 | 25,977 | 21,975 | ||||||
| Total assets |
193,416 | 145,117 | 118,722 | ||||||
| Total current liabilities |
148,685 | 60,674 | 54,111 | ||||||
| Long term debt and capital leases |
28,692 | 66,207 | 42,264 | ||||||
| Stockholders’ equity |
$ | 7,352 | $ | 10,309 | $ | 12,234 | |||
| ITEM 7. | MANAGEMENT’S DISCUSSION AND ANALYSIS OF FINANCIAL CONDITION AND RESULTS OF OPERATIONS |
This Annual Report on Form 10-K includes forward-looking statements within the meaning of Section 27A of the Securities Act of 1933, as amended, and Section 21E of the Securities Exchange Act of 1934, as amended, or the Exchange Act. We have based these forward-looking statements on our current expectations and projections about future events. These forward-looking statements are subject to known and unknown risks, uncertainties and assumptions about us that may cause our actual results, levels of activity, performance or achievements to be materially different from any future results, levels of activity, performance or achievements expressed or implied by such forward-looking statements. In some cases, you can identify forward-looking statements by terminology such as “may,” “should,” “could,” “would,” “expect,” “plan,” “anticipate,” “believe,” “estimate,” “continue,” or the negative of such terms or other similar expressions. Factors that might cause or contribute to such a discrepancy include, but are not limited to, those described in our other SEC filings.
Overview
Stream Global Services, Inc. (“we”, “us”, “Stream”, or “SGS”) is a corporation organized under the laws of the State of Delaware and was incorporated on June 26, 2007. We were formed as a blank check company for the purpose of acquiring, through a merger, capital stock exchange, asset or stock acquisition, exchangeable share transaction or other similar business combination, one or more domestic or international operating businesses.
In October 2007, we consummated our initial public offering (“IPO”) in which we sold 31,250,000 units, each consisting of one share of our common stock, $0.001 par value per share (“common stock”), and a warrant to purchase one share of our common stock. We received total gross proceeds of $250.0 million and net proceeds of $246.3 million, including $7.5 million of proceeds from the sale of 7,500,000 warrants to certain of our founding stockholders, which were deposited into a trust account. In connection with our IPO, a total of $7.5 million of underwriters’ fees were deferred until the completion of our initial acquisition. In 2008, the underwriter’s fees were reduced to $2.8 million.
In July 2008, we acquired Stream Holdings Corporation (“SHC”) for $128.8 million (which reflected the $200.0 million purchase price less assumed indebtedness, transaction fees, employee transaction related bonuses, professional fees, stock option payments and payments for working capital). Also in July 2008, holders of 8,947,000 shares of our common stock exercised their conversion rights in connection with the acquisition of SHC, and we paid an aggregate of $70.59 million to such holders. In connection with our acquisition of SHC, we changed our name from Global BPO Services Corp. to Stream Global Services, Inc.
In August 2008, we issued and sold 150,000 shares of our Series A Convertible Preferred Stock, $0.001 par value per share (the “Series A Preferred Stock”), in a private placement with Ares Corporate Opportunities Fund II, L.P. (“Ares”) for an aggregate purchase price of $150 million, and our founders also sold their 7,500,000 warrants to Ares. Also in August 2008, we commenced a self-tender offer to purchase up to 20,757,000 shares of our common stock at a purchase price of $8.00 per share. In September 2008, we closed the self-tender and
37
Table of Contents
accepted for purchase 20,757,000 shares of our common stock, for a total cost of approximately $166.0 million, excluding fees and expenses related to the offer.
In January 2009, we entered into the Fifth Amended and Restated Revolving Credit, Term Loan and Security Agreement, dated as of January 8, 2009 (the “Amended Credit Agreement”), with PNC Bank, National Association (“PNC”), as lender and as agent, Steel City Capital Funding, LLC, as term B lender and as term B agent, PNC Capital Markets LLC, as lead arranger, Stream Holdings Corporation (“SHC”), as borrowing agent, and the other loan parties signatory thereto, pursuant to which we borrowed an aggregate principal amount of $25 million in order to reduce the senior secured revolving credit facility from $100 million to approximately $77 million and to repay approximately $2 million in outstanding loans made to certain Foreign Borrowers (as defined in the Amended Credit Agreement).
In March 2009, we entered into an Amendment No. 1 and Waiver to the Amended Credit Agreement and certain of our subsidiaries (the “Stream Entities”) entered into a Guarantee and Reimbursement Agreement, dated as of March 2, 2009 (the “Reimbursement Agreement”) with Ares pursuant to which Ares or one or more of its affiliates provided, or caused one or more financial institutions or other entities to provide, certain letters of credit or other guarantees or backstop arrangements for the benefit of the Stream Entities in consideration of the issuance to Ares of one share of our Series B Convertible Preferred Stock, $0.001 par value per share (the “Series B Preferred Stock”). In addition, we entered into a Subordination and Intercreditor Agreement, dated as of March 2, 2009, with PNC Bank, as agent, Steel City Capital Funding, LLC, as agent for term B lenders and as term B agent, Ares and the other loan parties signatory thereto, pursuant to which the liens granted under the Reimbursement Agreement were made junior and subordinate to the obligations of the Stream Entities under, and to liens granted in connection with, the Amended Credit Agreement.
In October 2009, pursuant to a Share Exchange Agreement, dated as of August 14, 2009 (“the Exchange Agreement”), among us, EGS Corp., a Philippine corporation (“EGS”), the parent company of eTelecare Global Solutions, Inc., a Philippine company (“eTelecare”), EGS Dutchco B.V., a corporation organized under the laws of the Netherlands (“Dutchco”), and NewBridge International Investment Ltd., a British Virgin Islands company (“NewBridge” and, together with Dutchco, the “EGS Stockholders”), we acquired EGS in a stock-for-stock exchange (the “Combination”). At the closing of the Combination (the “Closing”), we acquired all of the issued and outstanding capital stock of EGS (the “EGS Shares”) from the EGS Stockholders, and NewBridge and/or its affiliate contributed, and we accepted, the rights of such transferor with respect to approximately $35,841,000 in principal under a bridge loan of EGS (the “Bridge Loan”) in consideration for the issuance and delivery of an aggregate of 23,851,561 shares of our common stock and 9,800,000 shares of our non-voting common stock, and the payment of $9,990 in cash. Subsequent to the Closing, all of the 9,800,000 shares of non-voting common stock held by the EGS Stockholders were converted into shares of our voting common stock on a one-for-one basis. As of the Closing, the pre-Combination Stream stockholders and the EGS Stockholders owned approximately 57.5% and 42.5%, respectively, of the combined entity.
Immediately prior to the Closing, pursuant to a certain letter agreement, dated as of August 14, 2009, between us and Ares, all of the issued and outstanding shares of our Series A Preferred Stock and Series B Preferred Stock held by Ares were converted into 35,085,134 shares of our common stock. In addition, we purchased from Ares 7,500,000 warrants to purchase Stream common stock that it held in consideration for the issuance of 1,000,000 shares of our common stock.
Also in October 2009, pursuant to an indenture, dated as of October 1, 2009 (the “Indenture”), among Stream, certain of our subsidiaries and Wells Fargo Bank, National Association (“Wells Fargo”), as trustee, we issued $200 million aggregate principal amount of 11.25% Senior Secured Notes due 2014 (the “Notes”) at an initial offering price of 95.454% of the principal amount. In addition, we and certain of our subsidiaries entered into a credit agreement, dated as of October 1, 2009 (the “Credit Agreement”), with Wells Fargo Foothill, LLC (“WFF”), as agent and co-arranger, and Goldman Sachs Lending Partners LLC, as co-arranger, and each of the lenders party thereto, as lenders, providing for revolving credit financing (the “ABL Facility”) of up to
38
Table of Contents
$100 million, including a $20 million sub-limit for letters of credit. The ABL Facility has a maturity of four years.
We used the proceeds from the offering of the Notes, together with approximately $26.0 million of cash on hand, to repay all outstanding indebtedness under the Amended Credit Agreement, as amended by Amendment No. 1, the Bridge Loan, and to pay fees and expenses incurred in connection with the Combination, the Note offering and the ABL Facility.
In November 2009, we commenced a self-tender offer to purchase up to 17,500,000 of our public warrants, each of which is exercisable for one share of our common stock for $6.00 in cash, at a purchase price of $.50 per warrant net to the seller in cash. In December 2009, we closed the self-tender and accepted for purchase 9,956,689 warrants for a total purchase price of approximately $4,978,000, excluding fees and expenses related to the tender offer.
We are a leading global business process outsourcing (“BPO) service provider specializing in customer relationship management (“CRM”) including sales, customer care and technical support for Fortune 1000 companies. Our clients include leading technology, computing, telecommunications, retail, entertainment/media, and financial services companies. Our service programs are delivered through a set of standardized best practices and sophisticated technologies by a highly skilled multilingual workforce capable of supporting over 35 languages across 50 locations in 22 countries. We continue to expand our global presence and service offerings to increase revenue, improve operational efficiencies and drive brand loyalty for our clients. As of December 31, 2009, we had over 30,000 employees worldwide.
We are subject to quarterly fluctuations in our revenues and earnings, based on the timing of new and expiring client programs and seasonality in certain client programs. From time to time clients seek to shift their CRM programs to lower cost providers, which may interrupt or decrease our results of operations as we seek to shift personnel and other resources to the CRM and other BPO services provided to our higher margin clients.
We bill monthly for our services in a variety of manners, including per minute, per contact, per hour and per full-time employee equivalent. Revenues also include reimbursement of certain expenses including telecom, training and miscellaneous costs for certain customers. A substantial amount of our operating costs is incurred in foreign currencies. In many cases, we bill our clients in U.S. dollar, Canadian Dollar, Euro and U.K. pound sterling denominated amounts and incur costs in the host country in local currency.
A substantial portion of our costs are incurred and paid in Philippine pesos. Therefore, we are exposed to the risk of an increase in the value of the Philippine peso relative to the U.S. dollar, which would increase the value of our expenses when measured in U.S. dollars. We occasionally use derivatives to mitigate risk relating to the Canadian dollar, the Indian rupee and the Philippine peso against the U.S. dollar. We are also doing business in Central America but do not yet hedge currencies from these countries.
Critical Accounting Policies
Use of Estimates
The preparation of consolidated financial statements in conformity with generally accepted accounting principles in the United States requires the appropriate application of accounting policies, many of which require management to make estimates and assumptions about future events and their impact on amounts reported in our consolidated financial statements and related notes. Since future events and their impact cannot be determined with certainty, the actual results may differ from estimates. Such differences may be material to the consolidated financial statements.
39
Table of Contents
Equipment and Fixtures
Equipment and fixtures are recorded at cost and depreciated using the straight-line method over the estimated useful lives of the assets. Furniture and fixtures are depreciated over a five-year life, software over a three- to five-year life and equipment generally over a three- to five-year life. Leasehold improvements are depreciated over the shorter of their estimated useful life or the remaining term of the associated lease. Assets held under capital leases are recorded at the lower of the net present value of the minimum lease payments or the fair value of the leased asset at the inception of the lease. Amortization expense is computed using the straight-line method over the shorter of the estimated useful lives of the assets or the period of the related lease and is recorded in depreciation and amortization expense. Repair and maintenance costs are expensed as incurred.
The carrying value of equipment and fixtures to be held and used is evaluated for impairment whenever events or changes in circumstances indicate that the carrying amount may not be recoverable in accordance with authoritative guidance. An asset is considered to be impaired when the sum of the undiscounted future net cash flows expected to result from the use of the asset and its eventual disposition does not exceed its carrying amount. The amount of the impairment loss, if any, is measured as the amount by which the carrying value of the asset exceeds its estimated fair value, which is generally determined based on appraisals or sales prices of comparable assets. Occasionally, we redeploy equipment and fixtures from underutilized centers to other locations to improve capacity utilization if it is determined that the related undiscounted future cash flows in the underutilized centers would not be sufficient to recover the carrying amount of these assets. We estimate fair value of our asset retirement obligations, if any, associated with the retirement of tangible long-lived assets such as property and equipment when the long-lived asset is acquired, constructed, developed or through normal operations.
Goodwill and Other Intangible Assets
In accordance with the authoritative guidance goodwill is reviewed for impairment annually and on an interim basis if events or changes in circumstances between annual tests indicate that an asset might be impaired. Impairment occurs when the carrying amount of goodwill exceeds its estimated fair value. The impairment, if any, is measured based on the estimated fair value of the reporting unit. We operate in one reporting unit, which is the basis for impairment testing and the allocation of acquired goodwill.
Intangible assets with a finite life are recorded at cost and amortized using their projected cash flows over their estimated useful life. Client lists and relationships are amortized over periods up to ten years, market adjustments related to facility leases are amortized over the term of the respective lease and developed software is amortized over five years. Brands and trademarks are not amortized as their life is indefinite. In accordance with the authoritative guidance, indefinite lived intangible assets are reviewed for impairment annually and on an interim basis if events or changes in circumstances between annual tests indicate that an asset might be impaired.
The carrying value of intangibles is evaluated for impairment whenever events or changes in circumstances indicate that the carrying amount may not be recoverable in accordance with the authoritative guidance. An asset is considered to be impaired when the sum of the undiscounted future net cash flows expected to result from the use of the asset and its eventual disposition does not exceed its carrying amount. The amount of the impairment loss, if any, is measured as the amount by which the carrying value of the asset exceeds its estimated fair value, which is generally determined based on appraisals or sales prices of comparable assets.
Stock-Based Compensation
At December 31, 2009 and 2008, we had a stock-based compensation plan for employees and directors.
For share-based payments, the fair value of each grant, including both the time-based grants and the performance-based grants, is estimated on the date of grant using the Black-Scholes-Merton option valuation
40
Table of Contents
model. With the exception of one grant to R Scott Murray, our founder, Chairman and Chief Executive Officer that was valued using a Monte Carlo simulation and assumes the performance goals will be achieved. If such goals are not met, no compensation cost is recognized and any previously recognized cost is reversed. Stock compensation expense is recognized on a straight-line basis over the vesting term, net of an estimated future forfeiture rate. The forfeiture rate assumption (19.5% as of December 31, 2009 and 2008) is based on historical experience.
Income Taxes
We recognize income taxes in accordance with the authoritative guidance, which requires recognition of deferred assets and liabilities for the future income tax consequence of transactions that have been included in the consolidated financial statements or tax returns. Under this method deferred tax assets and liabilities are determined based on the difference between the carrying amounts of assets and liabilities for financial reporting purposes, and the amounts used for income tax, using the enacted tax rates for the year in which the differences are expected to reverse. We provide valuation allowances against deferred tax assets whenever we believe it is more likely than not, based on available evidence, that the deferred tax asset will not be realized. Further we provide for the accounting for uncertainty in income taxes recognized in financial statements and the impact of a tax position in the financial statements if that position is more likely than not of being sustained by the taxing authority.
Contingencies
We consider the likelihood of various loss contingencies, including non-income tax and legal contingencies arising in the ordinary course of business, and our ability to reasonably estimate the amount of loss in determining loss contingencies. An estimated loss contingency is accrued in accordance with the authoritative guidance, when it is probable that a liability has been incurred and the amount of loss can be reasonably estimated. We regularly evaluate current information available to determine whether such accruals should be adjusted.
Recent Accounting Pronouncements
In December 2007, the Financial Accounting Standards Board (“FASB”) issued new guidance on business combinations. This guidance establishes principles and requirements for how we: (1) recognize and measure in our financial statements the identifiable assets acquired, the liabilities assumed, and any noncontrolling interest in the acquiree; (2) recognize and measure the goodwill acquired in the business combination or a gain from a bargain purchase; and (3) determine what information to disclose to enable users of the financial statements to evaluate the nature and financial effects of the business combination. The business combinations guidance also requires acquisition-related transaction and restructuring costs to be expensed rather than treated as part of the cost of the acquisition. This guidance applies prospectively to business combinations for which the acquisition date is on or after the beginning of the first annual reporting period beginning on or after December 15, 2008. We adopted the business combination guidance on January 1, 2009.
Our nonfinancial assets and liabilities measured at fair value on a nonrecurring basis include assets and liabilities acquired in connection with a business combination, goodwill and intangible assets. We adopted the fair value measurement guidance as it relates to these assets and liabilities on January 1, 2009. In April 2009, the FASB issued additional guidance on fair value measurements and disclosures. Fair value is defined as the price that would be received to sell an asset or paid to transfer a liability in an orderly transaction between market participants under current market conditions. The new guidance requires an evaluation of whether there has been a significant decrease in the volume and level of activity for the asset or liability in relation to normal market activity for the asset or liability. If there has been a significant decrease in activity, transactions or quoted prices may not be indicative of fair value and a significant adjustment may need to be made to those prices to estimate fair value. Additionally, an entity must consider whether the observed transaction was orderly (that is, not
41
Table of Contents
distressed or forced). If the transaction was orderly, the obtained price can be considered a relevant, observable input for determining fair value. If the transaction is not orderly, other valuation techniques must be used when estimating fair value. This guidance, which was applied by us prospectively as of June 30, 2009, did not impact our results of operations, cash flows or financial position for the year ended December 31, 2009.
In April 2008, the FASB issued guidance on determining the useful life of intangible assets. The intent of the guidance is to improve the consistency between the useful life of a recognized intangible asset and the period of expected cash flows used to measure the fair value of the asset. This guidance requires an entity to disclose information for a recognized intangible asset that enables users of the financial statements to assess the extent to which the expected future cash flows associated with the asset are affected by the entity’s intent and/or ability to renew or extend the arrangement. This guidance is effective for financial statements issued for fiscal years beginning after December 15, 2008, and interim periods within those fiscal years. We adopted this guidance on January 1, 2009. The adoption of this guidance did not have a material impact on our financial position or results of operations.
In May 2009, the FASB issued guidance on subsequent events which establishes general standards of accounting for and disclosure of events that occur after the balance sheet date but before financial statements are issued or are available to be issued. This guidance is based on the same principles as currently exist in auditing standards and was issued by the FASB to include accounting guidance that originated as auditing standards into the body of authoritative literature issued by the FASB. The standard addresses the period after the balance sheet date during which management of a reporting entity should evaluate events or transactions that may occur for potential recognition or disclosure in the financial statements, the circumstances under which an entity should recognize events or transactions occurring after the balance sheet date in its financial statements and the disclosures that an entity should make about events or transactions that occurred after the balance sheet date. We adopted this guidance during the quarterly period ended June 30, 2009.
Unaudited Pro Forma and Adjusted Pro Forma Financial Information
The following unaudited pro forma financial information presents the consolidated results of operations of SGS and EGS as if the acquisition of EGS had occurred as of the beginning of the periods presented below. The historical financial information has been adjusted to give effect to events that are directly attributable to the combination (including amortization of purchased intangible assets and debt costs associated with acquisition, debt costs associated with high yield debt offering and conversion of preferred stock to common stock), and in case of the pro forma statements of operations, have a recurring impact. The unaudited pro forma financial information is not intended, and should not be taken as representative of our future consolidated results of operations or financial condition or the results that would have occurred had the acquisition occurred as of the beginning of the earliest period.
| 2009 | 2008 | |||||||
| Revenue |
$ | 797,005 | $ | 823,239 | ||||
| Net income (loss) attributable to common shareholders |
(40,698 | ) | (44,026 | ) | ||||
| Basic and diluted net loss per share |
$ | (0.51 | ) | $ | (0.56 | ) | ||
In the fourth quarter of 2009, the former eTelecare business generated revenue of $69.3 million and a net loss of $4.5 million.
EGS was acquired on October 1, 2009 and thus its results of operations are included in the actual results of SGS for the period October 1, 2009 to December 31, 2009.
The acquisition of SHC in July 2008 was our first business combination and, accordingly, we do not believe a historical comparison of the results of operations and cash flows for the years ended December 31, 2009 compared to December 31, 2008 and December 31, 2008 compared to December 31, 2007 are beneficial to our stockholders. In order to assist readers to better understand the changes in our business between the years ended
42
Table of Contents
December 31, 2009, 2008 and 2007, we are presenting in management’s discussion and analysis section below the pro forma results of operations for SGS and SHC for the year ended December 31, 2008 as if the acquisition of SHC occurred on January 1, 2008. We derived the pro forma results of operations from (i) the consolidated financial statements of SHC for the period from January 1, 2008 to July 31, 2008 (the date of the SHC acquisition) and (ii) our consolidated financial statements for the years ended December 31, 2008. We are presenting the pro forma information in order to provide a more meaningful comparison of our operating results with prior periods. The pro forma results of operations are not necessarily indicative of results of operations that may have actually occurred had the merger taken place on the dates noted, or the future financial position or operating results of SHC. The pro forma adjustments are based upon available information and assumptions that we believe are reasonable and provide useful information to the reader of this section. The pro forma adjustments include adjustments for interest expense, reversal of interest income for SGS, amortization of intangible assets, transaction costs, depreciation expense for assets written up and market lease amortization.
The following are actual results of operations for the year ended December 31, 2009, which include the consolidated results of operations of EGS for the fourth quarter of 2009, and pro forma unaudited results of operations for the years ended December 31, 2008 and 2007 assuming the acquisition of SHC occurred on January 1, 2008 and 2007, respectively:
Stream Global Services, Inc.
Consolidated Statements of Operations
(unaudited)
| Years ended December 31, | ||||||||||||
| ProForma | ProForma | |||||||||||
| 2009 | 2008 | 2007 | ||||||||||
| Revenue |
$ | 584,769 | $ | 523,458 | $ | 483,569 | ||||||
| Direct cost of revenue |
342,193 | 330,955 | 320,935 | |||||||||
| Gross profit |
242,576 | 192,503 | 162,634 | |||||||||
| Operating expenses: |
||||||||||||
| Selling, general and administrative expenses |
198,212 | 160,824 | 143,117 | |||||||||
| Stock based compensation expense |
1,242 | 1,330 | 1,013 | |||||||||
| Transaction related costs |
12,245 | — | — | |||||||||
| Depreciation and amortization expense |
36,422 | 24,359 | 19,550 | |||||||||
| Total operating expenses |
248,121 | 186,513 | 163,680 | |||||||||
| Income (loss) from operations |
(5,545 | ) | 5,990 | (1,046 | ) | |||||||
| Other (income) expenses, net: |
||||||||||||
| Foreign currency transaction loss (gain) |
236 | (535 | ) | 11 | ||||||||
| Other (income) expense, net |
— | 1,593 | (1,008 | ) | ||||||||
| Interest expense, net |
18,410 | 6,894 | 8,692 | |||||||||
| Total other (income) expenses, net |
18,646 | 7,952 | 7,695 | |||||||||
| Income (loss) before provision for income taxes |
(24,191 | ) | (1,962 | ) | (8,741 | ) | ||||||
| Provision for Income taxes |
4,382 | 9,697 | 5,938 | |||||||||
| Net income (loss) |
$ | (28,573 | ) | $ | (11,659 | ) | $ | (14,679 | ) | |||
43
Table of Contents
Amounts as a percentage of pro forma revenue:
| 2009 | 2008 | 2007 | |||||||
| Revenue |
100.0 | % | 100.0 | % | 100.0 | % | |||
| Direct cost of revenue |
58.5 | 63.2 | 66.4 | ||||||
| Gross profit |
41.5 | 36.8 | 33.6 | ||||||
| Operating expenses: |
|||||||||
| Selling, general and administrative expenses |
33.9 | 30.7 | 29.6 | ||||||
| Stock based compensation expense |
0.2 | 0.2 | 0.2 | ||||||
| Transaction related costs |
2.1 | — | — | ||||||
| Depreciation and amortization expense |
6.2 | 4.7 | 4.0 | ||||||
| Total operating expenses |
42.4 | 35.6 | 33.8 | ||||||
| Income (loss) from operations |
(0.9 | ) | 1.2 | (0.2 | ) | ||||
| Other (income) expenses, net: |
|||||||||
| Foreign currency transaction loss (gain) |
(0.0 | ) | (0.1 | ) | 0.0 | ||||
| Other (income) expense, net |
0.0 | 0.3 | (0.2 | ) | |||||
| Interest expense, net |
3.1 | 1.3 | 1.8 | ||||||
| Total other (income) expenses, net |
3.2 | 1.5 | 1.6 | ||||||
| Income (loss) before provision for income taxes |
(4.1 | ) | (0.3 | ) | (1.8 | ) | |||
| Provision for Income taxes |
0.7 | 1.9 | 1.2 | ||||||
| Net income (loss) |
(4.9 | )% | (2.2 | )% | (3.0 | )% |
Revenues
We derive the majority of our revenues by providing CRM services such as technical support, sales and revenue generation services and customer care services. Our services are typically bundled together to include our work provided by our service professionals, our hosted technology, our data management and reporting and other professional services. We bill monthly for our services in a variety of manners, including per minute, per contact, per hour and per full-time employee equivalent. Certain customer contracts contain provisions under which we can earn bonuses or pay penalties on a monthly basis based upon performance.
Direct Cost of Revenue
We record the costs specifically associated with client programs as direct cost of revenues. These costs include direct labor wages and benefits of service professionals as well as reimbursable expenses such as telecommunication charges. The most significant portion of our direct cost of revenue is attributable to employee compensation, benefits and payroll taxes. These costs are expensed as they are incurred. Direct costs are affected by prevailing wage rates in the countries in which they are incurred and are subject to the effects of foreign currency fluctuations.
Operating Expenses
Our operating expenses consist of all expenses of operations other than direct costs of revenue, such as information technology, telecommunications, sales and marketing costs, finance, human resource management and other functions and service center operational expenses such as facilities, operations and training and depreciation and amortization. Also included in operating expenses are transaction costs related to acquisitions.
Other Income and Expenses
Other income and expenses consists of the foreign currency transaction gains or losses, other income, interest income and interest expense. Interest expense includes interest expense and amortization of debt issuance costs associated with our indebtedness under our credit lines, term loans, and capitalized lease obligations.
44
Table of Contents
We generate revenue and incur expenses in several different currencies. We do not operate in any countries subject to hyper-inflationary accounting treatment. Our most common transaction currencies are the U.S. Dollar, the Euro, the Canadian Dollar, the British Pound, Philippine Peso and the Indian Rupee. Our customers are most commonly billed in the U.S. Dollar or the Euro. We report our operating results using the average actual exchange rates in effect during the accounting period.
Income Taxes
We account for income taxes in accordance with the authoritative guidance which requires recognition of deferred assets and liabilities for the future income tax consequence of transactions that have been included in the consolidated financial statements or tax returns. Under this method, deferred tax assets and liabilities are determined based on the difference between the carrying amounts of assets and liabilities for financial reporting purposes and the amounts used for income tax, using the enacted tax rates for the year in which the differences are expected to reverse. We provide valuation allowances against deferred tax assets whenever we believe it is more likely than not, based on available evidence, that the deferred tax asset will not be realized. Further this guidance clarifies the accounting for uncertainty in income taxes recognized in financial statements and requires the impact of a tax position to be recognized in the financial statements if that position is more likely than not of being sustained by the taxing authority.
Results of Operations
Year ended December 31, 2009 compared with year ended December 31, 2008
Revenues. Revenues increased $61.3 million, or 11.7%, to $584.8 million for the year ended December 31, 2009, compared to $523.5 million for the year ended December 31, 2008. The increase is primarily attributable to the acquisition of EGS on October 1, 2009 and the inclusion of $69.3 million of EGS prior to its acquisition of Stream (“Legacy EGS”) revenue in the fourth quarter of 2009.
Stream prior to the acquisition of eTelecare (“Legacy Stream”) revenues for services performed in our U.S. and Canada service centers decreased $25.8 million, or 11.5%, for the year ended December 31, 2009, compared to the year ended December 31, 2008 as a result of the loss of large volumes from a seasonal client in the year ended December 31, 2008, coupled with the termination of an internet service provider client contract which ended in the last half of 2008. Legacy Stream revenues for services performed in European service centers decreased $33.6 million, or 15.7% for the year ended December 31, 2009, compared to the year ended December 31, 2008. The majority of this decrease was attributable to decreased volumes from our clients, coupled with decreased revenue due to a weakening Euro relative to the U.S. dollar. Legacy Stream revenues for services performed in offshore service centers in India, the Philippines, El Salvador, Egypt, Costa Rica, the Dominican Republic and Tunisia increased $51.5 million, or 61.1%, for the year ended December 31, 2009, compared to the year ended December 31, 2008, due to additional volume from our clients. Revenues in our offshore service centers represented 26.3% of consolidated revenues for the year ended December 31, 2009, compared to 16.1% in the same period in 2008.
Direct Cost of Revenue. Direct cost of revenue (exclusive of depreciation and amortization) increased $11.2 million, or 3.4%, to $342.2 million for the year ended December 31, 2009, compared to $331.0 million for the year ended December 31, 2008. This increase was primarily attributable to the acquisition of EGS on October 1, 2009 and the inclusion of $37.7 million of Legacy EGS results in the fourth quarter of 2009.
Gross Profit. Gross profit increased $50.1 million, or 26.0%, to $242.6 million for the year ended December 31, 2009 from $192.5 million for the year ended December 31, 2008. Gross profit as a percentage of revenue increased from 36.8% to 41.5%. Gross margin percentage increased primarily due to the acquisition of EGS on October 1, 2009 and the inclusion of $31.5 million of Legacy EGS results in the fourth quarter of 2009. Following the acquisition of SHC, we implemented a number of changes, including hiring key operating
45
Table of Contents
personnel in the America’s operations. Our focus on operations improved certain metrics such as agent utilization, average call handle time, agent attrition and productivity. In addition, our focus on operating metrics resulted in an increase in customer satisfaction.
We expect gross profit as a percentage of revenues to continue to improve in fiscal 2010 due to continuing improvements in operating metrics and investment in new tools and technologies to improve efficiencies. We also anticipate expanding into new geographic regions such as South America and Asia. These new regions are expected to produce higher gross profit as a percentage of revenues due to the lower labor rates in those countries.
Operating Expenses. Operating expenses (which includes depreciation and amortization expense) increased $61.6 million, or 33.0%, to $248.1 million or 42.4% of revenues for the year ended December 31, 2009, compared to $186.5 million or 35.6% of revenues for the year ended December 31, 2008, primarily due to the acquisition of EGS on October 1, 2009 and the inclusion of $34.5 million of Legacy EGS results in the fourth quarter of 2009. In conjunction with this acquisition we incurred $12.2 million of transaction related costs in the year ended December 31, 2009.
Depreciation and amortization increased $12.1 million to $36.4 million for the year ended December 31, 2009 as compared to $24.4 million for the year ended December 31, 2008 as a result of the amortization of intangibles related to the acquisition of EGS and additions to equipment and fixtures totaling $33.1 million including capital leases during the twelve months ended December 31, 2009. The additions to equipment and fixtures were to support new business, open new service centers and maintain and upgrade our technology infrastructure.
Other (Income) Expenses, Net. Other (income) expenses, net increased $10.7 million, or 134.5%, to $18.7 million for the year ended December 31, 2009, compared to $8.0 million for the year ended December 31, 2008. This increase was due to an increase in interest expense related to the interest on the debt used to purchase EGS in October 1, 2009 and associated write-offs of capitalized costs of $4.9 million associated with the debt that was repaid during the year.
Income Taxes. Income taxes decreased $5.3 million, or 54.8%, to $4.4 million for the year ended December 31, 2009, compared to $9.7 million for the year ended December 31, 2008. We operate in a number of countries outside the U.S. that generally have lower tax rates than the U.S. and this can have a significant impact on the effective tax rate.
Net Income (Loss). Net loss increased by $16.9 million, or 145.1%, to $28.6 million for the year ended December 31, 2009, compared to $11.7 million for the year ended December 31, 2008. This increase was primarily due to increased amortization costs, increased interest costs, and transaction costs related to the acquisition of EGS that was consummated in October 2009.
Year ended December 31, 2008 compared with year ended December 31, 2007
Revenues. Revenues increased $39.9 million, or 8.3%, to $523.5 million for the year ended December 31, 2008, compared to $483.6 million for the year ended December 31, 2007. The increase is primarily attributable to growth in revenue due to increased volumes with our ten largest clients from both existing and new services provided to those clients in 2008.
Revenues for services performed in our U.S. and Canada service centers decreased $32.1 million, or 12.5%, for the year ended December 31, 2008, as a result of large volumes from a seasonal client in the year ended December 31, 2007, coupled with an ISP client contract which ended in the last half of 2007. Revenues for services performed in European service centers increased $50.4 million, or 30.7%. The majority of this increase is attributable to increased volumes from both new and existing clients, coupled with additional revenue due to a
46
Table of Contents
strengthened Euro relative to the U.S. dollar. Revenues for services performed in offshore service centers in India, Costa Rica, the Dominican Republic and Tunisia increased $21.6 million, or 35.0%, due to additional volume from existing and new clients. Revenues in our offshore service centers represented 15.9% of consolidated revenues for the year ended December 31, 2008, compared to 12.8% in the same period in 2007. Our revenue growth is a result of a number of factors. These factors include a re-vamp of our sales and client management teams, introduction of new services such as warranty and up-sell programs and winning of new client contracts from both existing and new accounts. We believe that our growth is being effected positively by a number of macro economic factors that include our clients propensity to outsource to gain flexible solutions, our clients seeking to work with more global service providers like us and an ongoing effort by certain of our clients to consolidate service providers to those with global operations and broader service offerings.
Direct Cost of Revenue. Direct cost of revenue (exclusive of depreciation and amortization) increased $10.0 million, or 3.1%, to $331.0 million for the year ended December 31, 2008, compared to $320.9 million for the year ended December 31, 2007. This increase is primarily attributable to incremental labor cost required to support revenue growth. After excluding the $8.9 million Canadian and Euro currency exchange impact, direct labor costs increased from $329.8 million to $331.0 million, or 0.1%. We expect cost of services as a percentage of revenues to decline in the future.
Gross Profit. Gross profit increased $29.9 million, or 18.4%, to $192.5 million for the year ended December 31, 2008 from $162.6 million for the year ended December 31, 2007. Gross profit as a percentage of revenue increased from 33.6% to 36.8%. Gross margin percentage increased primarily due to higher margin contracts implemented and better management of our costs in connection with services performed in our European service centers. Following the acquisition of SHC, we implemented a number of changes, including hiring key operating personnel in the America’s operations. Our focus on operations improved certain metrics such as agent utilization, average call handle time, agent attrition and productivity. In addition, our focus on operating metrics resulted in an increase in customer satisfaction.
We are also expanding into new geographic regions such as Egypt, South America, Latin America and the Philippines. These new regions are expected to produce higher gross profit as a percentage of revenues due to the lower labor rates in those countries.
Operating Expenses. Operating expenses (which includes depreciation and amortization expense) increased $22.8 million, or 13.9%, to $186.5 million or 35.6% of revenues for the year ended December 31, 2008, compared to $163.7 million or 33.8% of revenues for the year ended December 31, 2007, primarily due to an increase in selling, general and administrative expense, which grew from $143.1 million to $160.8 million, or 12.5%. The increase in selling, general and administrative expense was due to (i) a $3.7 million increase in labor costs due to incremental management, operations and administrative staff required to support our revenue growth, and (ii) an occupancy expense increase of $6.3 million primarily attributable to new service center openings after the first half of 2007, and a $4.0 million Canadian and Euro currency exchange impact. Selling, general and administrative expenses as a percentage of revenue were approximately 31% for the year ended December 31, 2008 as compared to 30% for the year ended December 31, 2007. Depreciation and amortization increased $4.6 million as a result of additions to equipment and fixtures totaling $17.3 million including capital leases during the twelve months ended December 31, 2008. The additions to equipment and fixtures were to support new business, open new service centers and maintain and upgrade our technology infrastructure. Operating expenses as a percentage of revenues increased to 35.6% for the year ended December 31, 2008 compared to 33.9% for the year ended December 31, 2007.
Other (Income) Expenses, Net. Other (income) expenses, net increased $0.3 million, or 3.7%, to $8.0 million for the year ended December 31, 2008, compared to $7.7 million for the year ended December 31, 2007. This
47
Table of Contents
increase consisted of a foreign exchange gain for the year ended December 31, 2008 of $0.5 million, compared to a foreign exchange loss of $0.0 million for the year ended December 31, 2007. Foreign exchange gains and losses are primarily the result of intercompany activity and related hedging.
Income Taxes. Income taxes increased $3.8 million, or 63.5%, to $9.7 million for the year ended December 31, 2008, compared to $5.9 million for the year ended December 31, 2007. Foreign tax expense comprised $9.3 million for the year ended December 31, 2008 and $5.2 million for the same period in 2007 and the effective foreign tax rate increased from 28.5% to 32.5%. The increase in expense was driven by a $2.5 million charge in respect to additional foreign tax liabilities, higher income in foreign jurisdictions offset by the decrease in the effective rate reflecting changes in the mix of operations. We operate in a number of countries outside the U.S. that are generally taxed at lower rates and this can have a significant impact on the effective tax rate.
Net Income (Loss). Net loss decreased by $3.0 million, or 20.9%, to $11.7 million for the year ended December 31, 2008, compared to $14.7 million for the year ended December 31, 2007. This decrease is primarily due to increased revenue and margins offset by increased income tax expense.
Liquidity and Capital Resources
Our primary liquidity needs are for financing working capital associated with the expenses we incur in performing services under our client contracts and capital expenditures for the opening of new service centers, including the purchase of computers and related equipment. We have in place a credit facility that consists of a revolving line of credit that allows us to manage our cash flows. Our ability to make payments on the credit facility, to replace our indebtedness, and to fund working capital and planned capital expenditures will depend on our ability to generate cash in the future. We have secured our working capital facility through our accounts receivable and therefore, our ability to continue servicing debt is dependent upon the timely collection of those receivables.
We made capital expenditures of $33.1 million in the year ended December 31, 2009 as compared to $17.4 million on a pro forma basis for the year ended December 31, 2008. We continue to make capital expenditures to build new service centers, meet new contract requirements and maintain and upgrade our technology. We expect to continue to expand into new facilities in 2010 that might include places such as the Philippines, Egypt, Tunisia, China and South and Central America. We also expect to invest in technology initiatives such as unified communications and enabling technology, business continuity and data security, web based solutions and applications and distributed collaboration networking. The convergence of voice and data as well as the demand for real time diagnostics and analytics by our clients are requiring us to make substantial future investments in technology and solutions that will require additional capital investments.
On October 1, 2009, we closed the Combination, with the pre-Combination Stream and EGS stockholders owning approximately 57.5% and 42.5%, respectively, of the combined entity.
On October 1, 2009, we issued $200 million aggregate principal amount of 11.25% Senior Secured Notes due 2014 (the “Notes”). The Notes were issued pursuant to an indenture, dated as of October 1, 2009 (the “Indenture”), among us, certain of our subsidiaries (the “Note Guarantors”) and Wells Fargo Bank, National Association, as trustee. The Notes were issued by us at an initial offering price of 95.454% of the principal amount. The indenture contains restrictions on our ability to incur additional secured indebtedness under certain circumstances.
The Notes mature on October 1, 2014. The Notes bear interest at a rate of 11.25% per annum. Interest on the Notes is computed on the basis of a 360-day year composed of twelve 30-day months and is payable semi-annually on April 1 and October 1 of each year, beginning on April 1, 2010.
48
Table of Contents
The obligations under the Notes are fully and unconditionally guaranteed, jointly and severally, by certain of our direct and indirect subsidiaries and will be so guaranteed by any future domestic subsidiaries of ours, subject to certain exceptions.
The Notes and the Note Guarantors’ guarantees of the Notes are secured by senior liens on our and the Guarantors’ Primary Notes Collateral and by junior liens on our and the Guarantors’ Primary ABL Collateral (each as defined in the Indenture).
On October 1, 2009, we, Stream Holdings Corporation, Stream International, Inc., Stream New York, Inc., eTelecare Global Solutions-US, Inc., eTelecare Global Solutions-AZ, Inc. and Stream International Europe B.V. (collectively, the “U.S. Borrowers”), and SGS Netherland Investment Corporation B.V., Stream International Service Europe B.V., and Stream International Canada Inc., (collectively, the “Foreign Borrowers” and together with the U.S. Borrowers, the “Borrowers”), entered into the Credit Agreement, with Wells Fargo Foothill, LLC, as agent and co-arranger, Goldman Sachs Lending Partners LLC, as co-arranger, and each of the lenders party thereto, as lenders, providing for the ABL Credit Facility of up to $100.0 million, including a $20.0 million sub-limit for letters of credit, in each case, with certain further sub-limits for certain Foreign Borrowers. The ABL Credit Facility has a maturity of four years.
Letters of Credit. We have certain standby letters of credit for the benefit of landlords of certain sites in the United States and Canada. As of December 31, 2009, we had approximately $2.0 million of these letters of credit in place under our Amended Credit Agreement and approximately $6.6 million of letters of credit under the Reimbursement Agreement with Ares described above in this Liquidity and Capital Resources section.
Contractual Obligations. We have various contractual obligations that will affect our liquidity. The following table sets forth our contractual obligations as of December 31, 2009:
| Payments Due by Period | |||||||||||||||
| Total | Less than 1 year |
1-3 years | 3-5 years | More than 5 years | |||||||||||
| (in thousands) | |||||||||||||||
| Long-term debt obligations |
$ | 200,000 | $ | — | $ | — | $ | — | $ | 200,000 | |||||
| Revolving debt obligations |
15,501 | — | — | 15,501 | — | ||||||||||
| Operating lease obligations |
123,352 | 39,291 | 49,624 | 21,428 | 13,009 | ||||||||||
| Capital lease obligations |
19,609 | 6,865 | 8,926 | 3,233 | 585 | ||||||||||
| Total |
$ | 358,462 | $ | 46,156 | $ | 58,550 | $ | 40,162 | $ | 213,594 | |||||
Certain facility leases were backed by letters of credit totaling approximately $8.6 million at December 31, 2009. The obligations under the letters of credit decline annually as the underlying obligations are satisfied.
As of December 31, 2009, we had $14.6 million in unrestricted cash and cash equivalents, and working capital (measured by current assets less current liabilities) of $112.0 million.
Net cash used in operating activities totaled $25.2 million for the year ended December 31, 2009, a $10.6 million increase from the $14.6 million used in the year ended December 31, 2008. Non-cash charges were $28.3 million greater in the year ended December 31, 2009 than those generated in the period ended December 31, 2008 primarily as a result of the $25.4 million increase for the depreciation and amortization of acquired assets related to the purchases of SHC and EGS. The increase of $9.5 million in changes from operating assets and liabilities is due primarily to the increase of $9.6 million in cash used for other assets. Net cash provided by investing activities totaled $11.3 million for the year ended December 31, 2009 a $119.8 million decrease from the $131.1 million provided by the period ended December 31, 2008. This is primarily attributable cash acquired in the acquisition of EGS in 2009 as opposed to 2008 where the acquisition of SHC was paid for in cash. We used $22.1 million for additions to equipment and fixtures, net for the year ended December 31, 2009 as compared to $9.1 million use of cash for the year ended December 31, 2008.
49
Table of Contents
Net cash provided by financing activities totaled $13.3 million for the year ended December 31, 2009, a $88.7 million increase from the $102.0 million of cash used in financing activities for the period ended December 31, 2008. The increase is due to 2008 activity which had proceeds from issuance of the Series A Preferred Stock offset by cash used to purchase shares of common stock in our self-tender offer and the proceeds from the sale of units in our IPO in the period ended December 31, 2007.
Our foreign exchange forward contracts require the exchange of foreign currencies for U.S. Dollars or vice versa, and generally mature in one to 24 months. We had outstanding foreign exchange forward contracts with aggregate notional amounts of $112.0 million as of December 31, 2009 and $20.7 million as of December 31, 2008.
We are studying site rationalization as a consequence of the EGS acquisition and this may result in future charges to operations and the use of cash.
We believe that our cash generated from operations, existing cash and cash equivalents, and available credit will be sufficient to meet expected operating and capital expenditures for the next 12 months.
Off-Balance Sheet Arrangements
We do not have any off-balance sheet arrangements.
Seasonality
We are exposed to seasonality in our revenues because of the nature of certain consumer-based clients. We may experience approximately 10% increased volume associated with the peak processing needs in the fourth quarter coinciding with the holiday period and a somewhat seasonal overflow into the first quarter of the following calendar year.
| ITEM 7A. | QUANTITATIVE AND QUALITATIVE DISCLOSURES ABOUT MARKET RISK |
We are exposed to a variety of market risks, including the effects of changes in foreign currency exchange rates and interest rates. Market risk is the potential loss arising from adverse changes in market rates and prices. Our risk management strategy includes the use of derivative instruments to reduce the effects on our operating results and cash flows from fluctuations caused by volatility in currency exchange and interest rates. In using derivative financial instruments to hedge exposures to changes in exchange rates we exposes ourselves to counterparty credit risk.
Interest Rate Risk
We are exposed to interest rate risk primarily through our debt facilities since some of those instruments, including capital leases, bear interest at variable rates. At December 31, 2009, we had outstanding borrowings under variable debt agreements that totaled approximately $15.5 million. A hypothetical 1.0% increase in the interest rate would have increased interest expense by approximately $0.2 million and would have decreased annual cash flow by a comparable amount. The carrying amount of our borrowings reflects fair value due to their short-term and variable interest rate features.
There were no outstanding interest rate swaps covering interest rate exposure at December 31, 2009.
Foreign Currency Exchange Rate Risk
We serve many of our U.S.-based clients using our service centers in Canada, India, the Dominican Republic, El Salvador, Egypt, the Philippines, Nicaragua and Costa Rica. Although the contracts with these clients are typically priced in U.S. dollars, a substantial portion of the costs incurred to render services under these contracts are denominated in the local currency of the country in which the contracts are serviced which creates foreign exchange exposure. We serve most of our EMEA based clients using our service centers in the
50
Table of Contents
Netherlands, the United Kingdom, Italy, Ireland, Spain, Sweden, France, Germany, Poland, Denmark, Bulgaria, Egypt, Tunisia and South Africa. We typically bill our EMEA based clients in EURO or British Pound Sterling. While a substantial portion of the costs incurred to render services under these contracts are denominated in EURO, a part is also denominated in the local currency in which the contracts are serviced which creates foreign exchange exposure.
The expenses from these foreign operations create exposure to changes in exchange rates between the local currencies and the contractual currencies – primarily the U.S. dollar and EURO. As a result, we may experience foreign currency gains and losses, which may positively or negatively affect our results of operations attributed to these subsidiaries. The majority of this exposure is related to work performed from call centers in Canada, India and the Philippines.
In order to manage the risk of these foreign currencies from strengthening against the currency used for billing, which thereby decreases the economic benefit of performing work in these countries, we may hedge a portion, though not 100%, of these foreign currency exposures. While our hedging strategy may protect us from adverse changes in foreign currency rates in the short term, an overall strengthening of the foreign currencies would adversely impact margins over the long term.
The following summarizes the relative (weakening)/strengthening of the U.S. Dollar against the local currency during the years presented:
| Year Ended December 31, |
|||||||||
| 2009 | 2008 | 2007 | |||||||
| U.S. Dollar vs. Canadian Dollar |
(14.2 | %) | 24.5 | % | (15.8 | %) | |||
| U.S. Dollar vs. EURO |
(1.7 | %) | 4.3 | % | (11.6 | %) | |||
| U.S. Dollar vs. Indian Rupee |
(4.6 | %) | 24.7 | % | (10.6 | %) | |||
| U.S. Dollar vs. Philippine Peso |
(2.6 | %) | 15.2 | % | (15.8 | %) | |||
| U.S. Dollar vs. S. African Rand |
(21.7 | %) | 38.1 | % | (2.8 | %) | |||
| U.S. Dollar vs. U.K. Pound Sterling |
(10.0 | %) | 37.9 | % | (1.9 | %) | |||
Cash Flow Hedging Program
Substantially all of our subsidiaries use the local currency as their functional currency as a result of paying labor and operating costs in those local currencies. Certain of our subsidiaries in the Philippines use the U.S. dollar as their functional currency while paying their labor and operating cost in local currency. Conversely, revenue for most of these foreign subsidiaries is derived principally from client contracts that are invoiced and collected in U.S. dollars and other foreign currencies. To mitigate against the risk of principally a weaker U.S. dollar we purchase forward contracts to acquire the local currency of the foreign subsidiary at a fixed exchange rate at specific dates in the future. We have designated and account for certain of these derivative instruments as cash flow hedges where applicable, as defined by the authoritative guidance.
Given the significance of our foreign operations and the potential volatility of the certain of these currencies versus the U.S. dollar, we use forward purchases of Philippine peso, Canadian dollars and Indian rupees to minimize the impact of currency fluctuations. As of December 31, 2009, we had entered into forward contracts with three financial institutions to acquire a total of approximately $112.0 million at prices ranging from 46.63 to 50.49 PHP/USD. We do not hedge any currencies related to our EMEA operation.
While we have implemented certain strategies to mitigate risks related to the impact of fluctuations in currency exchange rates, we cannot ensure that we will not recognize gains or losses from international transactions, as this is part of transacting business in an international environment. Not every exposure is or can be hedged and, where hedges are put in place based on expected foreign exchange exposure, they are based on
51
Table of Contents
forecasts for which actual results may differ from the original estimate. Failure to successfully hedge or anticipate currency risks properly could affect our consolidated operating results.
Market Risk
Market risk is the sensitivity of income to changes in interest rates, foreign exchanges, commodity prices, equity prices, and other market-driven rates or prices.
Changes in market rates may impact the banks’ LIBOR rate or prime rate. For instance, if either the LIBOR or prime rate were to increase or decrease by one percentage point (1.0%), our annual interest expense would change by approximately $0.2 million based upon our total credit facility.
52
Table of Contents
| ITEM 8. | FINANCIAL STATEMENTS AND SUPPLEMENTARY DATA |
REPORT OF INDEPENDENT REGISTERED PUBLIC ACCOUNTING FIRM
The Board of Directors and Shareholders
Stream Global Services, Inc.
We have audited the accompanying consolidated balance sheets of Stream Global Services, Inc. (formerly Global BPO Services Corporation) (the successor) as of December 31, 2009 and 2008, and the related consolidated statements of operations, stockholders’ equity, and cash flows for each of the years ended December 31, 2009 and December 31, 2008. We have also audited the accompanying consolidated statements of operations, stockholders’ equity and cash flows of Stream Holdings Corporation (the predecessor) for the seven month period ended July 31, 2008 and for the year ended December 31, 2007. These financial statements are the responsibility of the Company’s management. Our responsibility is to express an opinion on these financial statements based on our audits.
We conducted our audits in accordance with the standards of the Public Company Accounting Oversight Board (United States). Those standards require that we plan and perform the audit to obtain reasonable assurance about whether the financial statements are free of material misstatement. We were not engaged to perform an audit of the Company’s internal control over financial reporting. Our audits included consideration of internal control over financial reporting as a basis for designing audit procedures that are appropriate in the circumstances, but not for the purpose of expressing an opinion on the effectiveness of the Company’s internal control over financial reporting. Accordingly, we express no such opinion. An audit also includes examining, on a test basis, evidence supporting the amounts and disclosures in the financial statements, assessing the accounting principles used and significant estimates made by management, and evaluating the overall financial statement presentation. We believe that our audits provide a reasonable basis for our opinion.
In our opinion, the financial statements referred to above present fairly, in all material respects, the consolidated financial position of Stream Global Services, Inc. at December 31, 2009 and 2008, and the consolidated results of its operations and its cash flows for the years then ended and the consolidated results of operations and cash flows of Stream Holdings Corporation for the seven month period ended July 31, 2008 and the year ended December 31, 2007, in conformity with U.S. generally accepted accounting principles.
As discussed in Note 5 to the consolidated financial statements, the Company changed its method of accounting for business combinations with the adoption of the guidance originally issued in FASB Statement No. 141(R), Business Combinations (codified in FASB ASC Topic 805, Business Combinations) effective January 1, 2009.
/s/ Ernst & Young LLP
Boston, Massachusetts
March 10, 2010
53
Table of Contents
REPORT OF INDEPENDENT REGISTERED PUBLIC ACCOUNTING FIRM
To the Board of Directors and the Stockholders of
Global BPO Services Corp.
We have audited the accompanying consolidated statements of operations, stockholders’ equity and cash flows of Global BPO Services Corp. (a development stage company) and subsidiary for the period from June 26, 2007 (date of inception) to December 31, 2007. These financial statements are the responsibility of the Company’s management. Our responsibility is to express an opinion on these financial statements based on our audit.
We conducted our audit in accordance with the standards of the Public Company Accounting Oversight Board (United States). Those standards require that we plan and perform the audit to obtain reasonable assurance about whether the financial statements are free from material misstatement. The Company is not required to have, nor were we engaged to perform, an audit of its internal control over financial reporting. Our audit included consideration of internal control over financial reporting as a basis for designing audit procedures that are appropriate in the circumstances, but not for the purpose of expressing an opinion on the effectiveness of the Company’s internal control over financial reporting. Accordingly, we express no such opinion. An audit also includes examining, on a test basis, evidence supporting the amounts and disclosures in the financial statements, assessing the accounting principles used and significant estimates made by management, as well as evaluating the overall financial statement presentation. We believe that our audit provides a reasonable basis for our opinion.
In our opinion, the consolidated financial statements referred to above present fairly, in all material respects, the results of operations and cash flows of Global BPO Services Corp. (a development stage company) and subsidiary for the period from June 26, 2007 (date of inception) to December 31, 2007 in conformity with accounting principles generally accepted in the United States of America.
/s/ BDO SEIDMAN, LLP
Boston, Massachusetts
March 17, 2008
54
Table of Contents
CONSOLIDATED BALANCE SHEETS
(In thousands, except per share amounts)
| December 31, | ||||||||
| 2009 | 2008 | |||||||
| Assets |
||||||||
| Current assets: |
||||||||
| Cash and cash equivalents |
$ | 14,928 | $ | 10,660 | ||||
| Accounts receivable, net of allowance for bad debts of $532 and $267 at December 31, 2009 and 2008, respectively |
175,557 | 109,385 | ||||||
| Income taxes receivable |
2,988 | 1,559 | ||||||
| Deferred income taxes |
15,870 | 14,899 | ||||||
| Prepaid expenses and other current assets |
18,043 | 10,353 | ||||||
| Total current assets |
227,386 | 146,856 | ||||||
| Equipment and fixtures, net |
96,816 | 41,634 | ||||||
| Deferred income taxes |
5,306 | 2,698 | ||||||
| Goodwill |
226,027 | 47,686 | ||||||
| Intangible assets, net |
104,834 | 83,319 | ||||||
| Other assets |
20,454 | 7,752 | ||||||
| Total assets |
$ | 680,823 | $ | 329,945 | ||||
| Liabilities and Stockholders’ Equity |
||||||||
| Current liabilities: |
||||||||
| Accounts payable |
$ | 13,532 | $ | 9,058 | ||||
| Accrued employee compensation and benefits |
57,475 | 40,335 | ||||||
| Other accrued expenses |
28,499 | 15,550 | ||||||
| Income taxes payable |
2,199 | 3,449 | ||||||
| Current portion of long-term debt |
90 | 2,614 | ||||||
| Current portion of capital lease obligations |
5,529 | 2,260 | ||||||
| Other liabilities |
8,013 | 6,126 | ||||||
| Total current liabilities |
115,337 | 79,392 | ||||||
| Long-term debt, net of current portion |
206,880 | 63,624 | ||||||
| Capital lease obligations, net of current portion |
11,279 | 5,484 | ||||||
| Deferred income taxes |
21,050 | 17,396 | ||||||
| Other long-term liabilities |
22,866 | 16,387 | ||||||
| Total liabilities |
377,412 | 182,283 | ||||||
| Convertible Series A Preferred Stock, par value $0.001 per share, 1,000 shares authorized; 0 and 150 shares issued and outstanding at December 31, 2009 and 2008 |
— | 145,911 | ||||||
| Stockholders’ equity: |
||||||||
| Common stock, par value $0.001 per share, shares authorized—200,000 shares and 149,000 authorized at December 31, 2009 and 2008, respectively, issued and outstanding shares—79,616 and 9,458 shares at December 31, 2009 and 2008, respectively |
80 | 9 | ||||||
| Additional paid-in-capital |
337,035 | 11,330 | ||||||
| Retained deficit |
(29,972 | ) | (1,399 | ) | ||||
| Accumulated other comprehensive income (loss) |
(3,732 | ) | (8,189 | ) | ||||
| Total stockholders’ equity |
303,411 | 1,751 | ||||||
| Total liabilities and stockholders’ equity |
$ | 680,823 | $ | 329,945 | ||||
See accompanying notes to consolidated financial statements.
55
Table of Contents
CONSOLIDATED STATEMENTS OF OPERATIONS
(In thousands, except per share amounts)
| Year Ended December 31, 2009 |
Year Ended December 31, 2008 |
For the period from June 26, 2007 (date of inception) to December 31, 2007 |
Seven Months Ended July 31, 2008 Predecessor (“SHC”) |
Year Ended December 31, 2007 Predecessor (“SHC”) |
||||||||||||||||
| Revenue |
$ | 584,769 | $ | 211,373 | $ | — | $ | 312,085 | $ | 483,569 | ||||||||||
| Direct cost of revenue |
342,193 | 128,278 | — | 202,676 | 320,935 | |||||||||||||||
| Gross profit |
242,576 | 83,095 | — | 109,409 | 162,634 | |||||||||||||||
| Operating expenses: |
||||||||||||||||||||
| Selling, general and administrative expenses |
199,454 | 66,884 | 240 | 95,751 | 144,681 | |||||||||||||||
| Depreciation and amortization |
36,422 | 10,982 | 2 | 8,810 | 12,059 | |||||||||||||||
| Transaction related costs |
12,245 | — | — | 19,515 | — | |||||||||||||||
| Total operating expenses |
248,121 | 77,866 | 242 | 124,076 | 156,740 | |||||||||||||||
| Income (loss) from operations |
(5,545 | ) | 5,229 | (242 | ) | (14,667 | ) | 5,894 | ||||||||||||
| Other (income) expenses, net: |
||||||||||||||||||||
| Foreign currency transaction loss (gain) |
236 | 981 | — | (1,517 | ) | 11 | ||||||||||||||
| Other (income) expense, net |
— | 260 | — | (87 | ) | (1,008 | ) | |||||||||||||
| Interest (income) expense, net |
18,410 | (2,167 | ) | (2,119 | ) | 7,214 | 12,055 | |||||||||||||
| Total other (income) expenses, net |
18,646 | (926 | ) | (2,119 | ) | 5,610 | 11,058 | |||||||||||||
| Income (loss) before income taxes |
(24,191 | ) | 6,155 | 1,877 | (20,277 | ) | (5,164 | ) | ||||||||||||
| Provision (benefit) for income taxes |
4,382 | 5,359 | 760 | 5,095 | 6,159 | |||||||||||||||
| Net income (loss) |
$ | (28,573 | ) | $ | 796 | $ | 1,117 | $ | (25,372 | ) | $ | (11,323 | ) | |||||||
| Series A Preferred Stock beneficial conversion feature |
— | 49,503 | — | — | — | |||||||||||||||
| Cumulative convertible Preferred Stock dividends |
58,018 | 1,790 | — | — | — | |||||||||||||||
| Preferred Stock accretion |
6,397 | 367 | — | — | — | |||||||||||||||
| Warrant issuance costs |
— | 298 | — | — | — | |||||||||||||||
| Net income (loss) attributable to common stockholders |
$ | (92,988 | ) | $ | (51,162 | ) | $ | 1,117 | $ | (25,372 | ) | $ | (11,323 | ) | ||||||
| Net income (loss) attributable to common stockholders per share: |
||||||||||||||||||||
| Basic |
$ | (3.46 | ) | $ | (2.20 | ) | $ | 0.07 | N/A | N/A | ||||||||||
| Diluted |
$ | (3.46 | ) | $ | (2.20 | ) | $ | 0.07 | N/A | N/A | ||||||||||
| Shares used in computing per share amounts: |
||||||||||||||||||||
| Basic |
26,887 | 23,258 | 16,189 | N/A | N/A | |||||||||||||||
| Diluted |
26,887 | 23,258 | 16,189 | N/A | N/A | |||||||||||||||
See accompanying notes to consolidated financial statements.
56
Table of Contents
CONSOLIDATED STATEMENTS OF STOCKHOLDERS’ EQUITY
(In thousands)
| Series A Convertible Preferred Stock |
Common Stock | Additional Paid in Capital |
Retained Earnings (Deficit) |
Accumulated Other Comprehensive Income (Loss) |
Total | |||||||||||||||||||||||||
| Shares | Par Value |
Shares | Par Value |
|||||||||||||||||||||||||||
| Balances at June 30, 2007 |
— | $ | — | — | $ | — | $ | — | $ | — | $ | — | $ | — | ||||||||||||||||
| Sale of common stock to founding stockholders |
— | — | 8,984 | 9 | 41 | — | — | 50 | ||||||||||||||||||||||
| Proceeds from sale of underwriters purchase option |
— | — | — | — | — | — | — | — | ||||||||||||||||||||||
| Proceeds from sale of warrants to founding stockholders |
— | — | — | — | 7,500 | — | — | 7,500 | ||||||||||||||||||||||
| Sale of 31,250 units through initial public offering, net of underwriters’ discount of $17,500 and offering expenses of $1,005 and net of $73,875 proceeds allocable to 9,375 shares of common stock subject to possible conversion |
— | — | 21,875 | 22 | 157,597 | — | — | 157,619 | ||||||||||||||||||||||
| Common shares repurchased from founding stockholders |
— | — | (1,171 | ) | (1 | ) | (5 | ) | — | — | (6 | ) | ||||||||||||||||||
| Net income |
— | — | — | — | — | 1,117 | — | 1,117 | ||||||||||||||||||||||
| Balances at December 31, 2007 |
— | $ | — | 29,688 | $ | 30 | $ | 165,133 | $ | 1,117 | $ | — | $ | 166,280 | ||||||||||||||||
| Net income |
— | — | — | — | — | 796 | — | 796 | ||||||||||||||||||||||
| Currency translation adjustment |
— | — | — | — | — | — | (9,430 | ) | (9,430 | ) | ||||||||||||||||||||
| Unrealized loss on derivatives, net of tax of $0 |
— | — | — | — | — | — | 1,241 | 1,241 | ||||||||||||||||||||||
| Comprehensive loss |
— | — | — | — | — | — | — | (7,393 | ) | |||||||||||||||||||||
| Accretion of beneficial conversion premium on preferred stock |
— | — | — | — | (46,191 | ) | (3,312 | ) | — | (49,503 | ) | |||||||||||||||||||
| Beneficial conversion premium on preferred stock |
— | — | — | — | 49,503 | — | — | 49,503 | ||||||||||||||||||||||
| Cumulative dividends on preferred stock |
— | — | — | — | (1,790 | ) | — | — | (1,790 | ) | ||||||||||||||||||||
| Reduction in deferred IPO costs preferred stock |
— | — | — | — | 4,718 | — | — | 4,718 | ||||||||||||||||||||||
| Common shares purchased from stockholders as a result of tender offer |
— | — | (20,757 | ) | (21 | ) | (166,038 | ) | — | — | (166,059 | ) | ||||||||||||||||||
| Common shares issued under stock plans, net of cancellations |
— | — | 99 | — | 50 | — | — | 50 | ||||||||||||||||||||||
| Stock-based compensation expense |
— | — | — | — | 73 | — | — | 73 | ||||||||||||||||||||||
| Warrant value associated with the issue of preferred stock to Ares |
— | — | — | — | 3,253 | — | — | 3,253 | ||||||||||||||||||||||
| Warrant issuance costs |
— | — | — | — | (298 | ) | — | — | (298 | ) | ||||||||||||||||||||
| Common stock released from redemption restriction |
— | — | 428 | — | 3,572 | — | — | 3,572 | ||||||||||||||||||||||
| Accretion of preferred stock discount |
— | — | — | — | (367 | ) | — | (367 | ) | |||||||||||||||||||||
| Accretion of in-trust account |
— | — | — | — | (288 | ) | — | (288 | ) | |||||||||||||||||||||
| Balances at December 31, 2008 |
— | $ | — | 9,458 | $ | 9 | $ | 11,330 | $ | (1,399 | ) | $ | (8,189 | ) | $ | 1,751 | ||||||||||||||
| Net loss |
— | — | — | — | — | (28,573 | ) | — | (28,573 | ) | ||||||||||||||||||||
| Currency translation adjustment |
— | — | — | — | — | — | 5,785 | 5,785 | ||||||||||||||||||||||
| Unrealized loss on derivatives, net of tax of $0 |
— | — | — | — | — | — | (1,328 | ) | (1,328 | ) | ||||||||||||||||||||
| Comprehensive loss |
— | — | — | — | — | — | — | (24,116 | ) | |||||||||||||||||||||
| Cumulative dividends on preferred stock |
— | 57,729 | — | — | (58,018 | ) | — | — | (289 | ) | ||||||||||||||||||||
| Transfer of Preferred A Stock to equity from mezzanine equity |
150 | 145,394 | — | — | — | — | — | 145,394 | ||||||||||||||||||||||
| Accretion of preferred stock discount |
— | 6,397 | — | — | (6,397 | ) | — | — | — | |||||||||||||||||||||
| Preferred stock conversion to common stock |
(150 | ) | (209,520 | ) | 36,085 | 36 | 210,476 | — | — | 992 | ||||||||||||||||||||
| Stock-based compensation expense |
— | — | — | — | 1,242 | — | 1,242 | |||||||||||||||||||||||
| Common shares cancelled |
— | — | (18 | ) | — | (1 | ) | — | — | (1 | ) | |||||||||||||||||||
| Repurchase of public warrants |
— | — | — | — | (7,373 | ) | — | — | (7,373 | ) | ||||||||||||||||||||
| Warrant exercises |
— | — | 131 | — | 788 | — | — | 788 | ||||||||||||||||||||||
| Common stock and pre-emptive rights issued for acquisition of eTelecare |
— | — | 33,652 | 34 | 183,068 | — | — | 183,102 | ||||||||||||||||||||||
| Common stock issued for pre-emptive rights |
— | — | 308 | 1 | 1,920 | — | — | 1,921 | ||||||||||||||||||||||
| Balances at December 31, 2009 |
— | — | 79,616 | $ | 80 | $ | 337,035 | $ | (29,972 | ) | $ | (3,732 | ) | $ | 303,411 | |||||||||||||||
See accompanying notes to consolidated financial statements
57
Table of Contents
CONSOLIDATED STATEMENTS OF CASH FLOWS
(In thousands)
| Year ended December 31, 2009 |
Year ended December 31, 2008 |
For the period from June 26, 2007 (date of inception) to December 31, 2007 |
Predecessor (“SHC”) Seven months ended July 31, 2008 |
Predecessor (“SHC”) Year ended December 31, 2007 |
||||||||||||||||
| Operating activities: |
||||||||||||||||||||
| Net income (loss) |
$ | (28,573 | ) | $ | 796 | $ | 1,117 | $ | (25,372 | ) | $ | (11,323 | ) | |||||||
| Adjustments to reconcile net income (loss) to net cash provided by (used in) operating activities: |
||||||||||||||||||||
| Depreciation and amortization |
36,422 | 10,982 | 2 | 8,810 | 12,059 | |||||||||||||||
| Amortization of debt issuance costs |
5,579 | 206 | — | 1,070 | 1,285 | |||||||||||||||
| Interest income |
— | — | (2,119 | ) | — | — | ||||||||||||||
| Deferred taxes |
(3,598 | ) | 318 | — | 683 | 255 | ||||||||||||||
| Market lease reserve |
(1,203 | ) | (917 | ) | — | — | (1,558 | ) | ||||||||||||
| Amortization of bond discount |
324 | — | — | — | — | |||||||||||||||
| Loss on disposal of assets |
203 | — | — | — | — | |||||||||||||||
| Noncash stock compensation |
1,242 | 122 | — | 290 | 1,013 | |||||||||||||||
| Noncash interest expense |
— | — | — | — | 841 | |||||||||||||||
| Changes in operating assets and liabilities, net of the effect of acquisitions: |
||||||||||||||||||||
| Accounts receivable |
(10,203 | ) | (11,865 | ) | — | 15,139 | (27,085 | ) | ||||||||||||
| Income taxes receivable |
(863 | ) | (938 | ) | — | 824 | (392 | ) | ||||||||||||
| Prepaid expenses and other current assets |
1,767 | (1,932 | ) | (151 | ) | 876 | (834 | ) | ||||||||||||
| Other assets |
(10,906 | ) | (1,350 | ) | — | (1,151 | ) | (1,019 | ) | |||||||||||
| Accounts payable |
(93 | ) | 4,049 | — | (1,827 | ) | 569 | |||||||||||||
| Accrued expenses and other liabilities |
(15,285 | ) | (14,037 | ) | 897 | 14,936 | 13,780 | |||||||||||||
| Net cash provided by (used in) operating activities |
(25,187 | ) | (14,566 | ) | (254 | ) | 14,278 | (12,409 | ) | |||||||||||
| Investing activities: |
||||||||||||||||||||
| Decrease in restricted cash |
— | 246,404 | — | (104 | ) | 437 | ||||||||||||||
| Cash contributed to trust account |
— | — | (246,300 | ) | — | — | ||||||||||||||
| Withdrawal from trust account for working capital purposes (including taxes) |
— | — | 1,206 | — | — | |||||||||||||||
| Acquisition of businesses, net of cash acquired |
33,400 | (106,131 | ) | — | — | (2,594 | ) | |||||||||||||
| Additions to equipment and fixtures, net |
(22,064 | ) | (9,128 | ) | (29 | ) | (6,719 | ) | (17,145 | ) | ||||||||||
| Net cash provided by (used in) investing activities |
11,336 | 131,145 | (245,123 | ) | (6,823 | ) | (19,302 | ) | ||||||||||||
| Financing activities: |
||||||||||||||||||||
| Net borrowings (repayments) on line of credit |
(43,924 | ) | (8,236 | ) | — | (276 | ) | 30,077 | ||||||||||||
| Proceeds from issuance of long-term debt |
216,187 | — | — | 120 | 7,014 | |||||||||||||||
| Payments on long-term debt |
(152,059 | ) | (1,081 | ) | — | (334 | ) | (1,187 | ) | |||||||||||
| Payment of capital lease obligations |
(3,702 | ) | (1,300 | ) | — | (1,186 | ) | (2,343 | ) | |||||||||||
| Proceeds from capital leases |
1,518 | — | — | — | — | |||||||||||||||
| Proceeds from issuance of Preferred Stock |
— | 145,217 | — | — | — | |||||||||||||||
| Proceeds from exercise of warrants |
788 | — | — | — | — | |||||||||||||||
| Proceeds from issuance of common stock related to pre-emptive rights and stock options |
1,921 | — | — | — | 39 | |||||||||||||||
| Proceeds from issuance of common stock to founding stockholders |
— | — | 50 | — | — | |||||||||||||||
| Proceeds from notes payable to stockholders |
— | — | 200 | — | — | |||||||||||||||
| Repayments of notes payable to stockholders |
— | — | (200 | ) | — | — | ||||||||||||||
| Proceeds from issuance of warrants to founding stockholders |
— | — | 7,500 | — | — | |||||||||||||||
| Portion of net proceeds from sale of units through public offering allocable to shares of common stock subject to possible conversion |
— | — | 73,875 | — | — | |||||||||||||||
| Re-purchase of common shares from founding stockholders |
— | — | (7 | ) | — | — | ||||||||||||||
| Re-purchase of warrants |
(7,373 | ) | — | — | — | — | ||||||||||||||
| Net proceeds from sales of units |
— | — | 165,120 | — | ||||||||||||||||
| Repurchases of common stock |
(10 | ) | (236,648 | ) | — | — | (164 | ) | ||||||||||||
| Net cash provided by (used in) financing activities |
13,346 | (102,048 | ) | 246,538 | (1,676 | ) | 33,436 | |||||||||||||
| Effect of exchange rates on cash and cash equivalents |
4,773 | (5,032 | ) | — | (2,953 | ) | 4,702 | |||||||||||||
| Net increase (decrease) in cash and cash equivalents |
4,268 | 9,499 | 1,161 | 2,826 | 6,427 | |||||||||||||||
| Cash and cash equivalents, beginning of period |
10,660 | 1,161 | — | 12,577 | 6,150 | |||||||||||||||
| Cash and cash equivalents, end of period |
$ | 14,928 | $ | 10,660 | $ | 1,161 | $ | 15,403 | $ | 12,577 | ||||||||||
58
Table of Contents
| Year ended December 31, 2009 |
Year ended December 31, 2008 |
For the period from June 26, 2007 (date of inception) to December 31, 2007 |
Predecessor (“SHC”) Seven months ended July 31, 2008 |
Predecessor (“SHC”) Year ended December 31, 2007 | |||||||||||
| Supplemental cash flow information: |
|||||||||||||||
| Cash paid for interest |
$ | 4,843 | $ | 737 | $ | 3 | $ | 4,849 | $ | 9,695 | |||||
| Cash paid for income taxes |
$ | 8,246 | $ | 5,077 | $ | — | $ | 3,000 | $ | 3,618 | |||||
| Noncash financing activities: |
|||||||||||||||
| Deferred transaction cost incurred |
$ | — | $ | — | $ | 165 | $ | — | $ | — | |||||
| Accrued interest held in trust |
— | — | 913 | — | — | ||||||||||
| Fair value of underwriting purchase option included in offering costs |
— | — | 4,594 | — | — | ||||||||||
| Deferred underwriting fee |
— | — | 7,500 | — | — | ||||||||||
| Gain (loss) on forward |
1,327 | — | — | — | — | ||||||||||
| Capital lease financing |
11,082 | 1,298 | — | 333 | 3,151 | ||||||||||
| Cumulative dividends on preferred stock |
58,018 | — | — | — | — | ||||||||||
| Accretion of preferred stock discount |
6,397 | — | — | — | — | ||||||||||
| Preferred stock conversion to common stock |
210,512 | — | — | — | — | ||||||||||
| Common stock and pre-emptive rights issued for acquisition of EGS |
$ | 183,102 | $ | — | $ | — | $ | — | $ | — | |||||
See accompanying notes to consolidated financial statements.
59
Table of Contents
NOTES TO CONSOLIDATED FINANCIAL STATEMENTS
December 31, 2009
(In thousands, except per share amounts)
Note 1—Our History and Summary of Various Transactions
Stream Global Services, Inc. (“we”, “us”, “Stream”, or “SGS”) is a corporation organized under the laws of the State of Delaware. We were incorporated on June 26, 2007 as a blank check company for the purpose of acquiring, through a merger, capital stock exchange, asset or stock acquisition, exchangeable share transaction or other similar business combination, one or more domestic or international operating businesses.
In October 2007, we consummated our initial public offering (“IPO”) from which we received total gross proceeds of $250,000 and net proceeds of $246,300, which were deposited into a trust account, which included $7,500 of proceeds from the sale of 7,500 warrants purchased by certain of our founding stockholders. In connection with the IPO, a total of $7,500 of underwriters fees were deferred until the completion of our initial acquisition. In 2008, deferred the underwriter’s fees were reduced by $4,700 due to stockholders who elected conversion rights and a negotiated fee reduction by us. In order to consummate an initial business combination, our certificate of incorporation provided that holders of no more than 29.9% of our common stock, or 9,375 shares of common stock, vote against our initial business combination and seek conversion rights for their pro rata share of the funds held in trust.
We sold the units issued in our IPO, each unit consisting of one share of our common stock and a warrant to purchase one share of our common stock, to the underwriters at a price of $7.44 per unit (a discount of $0.56 per unit), resulting in an aggregate underwriting discount of $17,500. In connection with our IPO, we also sold to the underwriters, for $0.1, an option to purchase up to a total of 1,563 units (the “Unit Purchase Option”). Upon the consummation of our acquisition of Stream Holdings Corporation (“SHC”), as described below, the underwriters sold the Unit Purchase Option back to us for $0.1 per option.
In July 2008, we acquired Stream Holdings Corporation (“SHC”) for $128,815 in cash (which reflected the $200,000 purchase price less assumed indebtedness, transaction fees, professional fees, stock option payments and payments for working capital). Also in July 2008, holders of 8,947 shares of our common stock exercised their conversion rights in connection with the acquisition, and we paid an aggregate of $70,590 to such holders. In connection with our acquisition of SHC, we changed our name from Global BPO Services Corp. to Stream Global Services, Inc. In connection with this acquisition we exited the development stage of operations.
In August 2008, we issued and sold 150 shares of our Series A Convertible Preferred Stock, $0.001 par value per share (the “Series A Preferred Stock”), in a private placement with Ares for an aggregate purchase price of $150,000 and our founders also sold their 7,500 warrants to Ares. Also in August 2008, we commenced a self-tender offer to purchase up to 20,757 shares of our common stock at a purchase price of $8.00 per share. In September 2008, we closed the self-tender and accepted for purchase 20,757 shares of our common stock for a total cost of approximately $166,000 in cash, excluding fees and expenses related to the self-tender offer.
In August 2009, Stream, EGS Corp. (“EGS”), the parent company of eTelecare Global Solutions, Inc. (“eTelecare”) and other parties signatory thereto, entered into a definitive agreement to combine in a stock-for-stock exchange (the “Combination”). On October 1, 2009, the Combination closed, with the pre-Combination Stream and EGS stockholders owning approximately 57.5% and 42.5%, respectively, of the combined entity.
Immediately prior to the Closing, pursuant to a certain letter agreement, dated as of August 14, 2009, between us and Ares, all of the issued and outstanding shares of our Series A Preferred Stock and Series B Convertible Preferred Stock, $0.001 par value per share (the “Series B Preferred Stock”), held by Ares were converted into 35,085,134 shares of our common stock. In addition, we purchased from Ares 7,500,000 ten-year
60
Table of Contents
term private warrants to purchase Stream common stock at a strike price of $6.00 per share that it held in consideration for the issuance of 1,000,000 shares of our common stock.
In November 2009, we commenced a self-tender offer to purchase up to 17,500,000 of our public warrants, each of which is exercisable for one share of our common stock for $6.00 in cash, at a purchase price of $.50 per warrant net to the seller in cash. In December 2009, we closed the self-tender and accepted for purchase 9,956,689 warrants for a total purchase price of approximately $4,978, excluding fees and expenses related to the tender offer.
eTelecare results of operations are included in the consolidated results for the period October 1, 2009 (the date of the acquisition) through December 31, 2009.
Note 2—Our Business
We are a leading global business process outsourcing (“BPO”) service provider specializing in customer relationship management (“CRM”) including sales, customer care and technical support for Fortune 1000 companies. Our clients include leading technology, computing, telecommunications, retail, entertainment/media, and financial services companies. Our service programs are delivered through a set of standardized best practices and sophisticated technologies by a highly skilled multilingual workforce capable of supporting over 35 languages across 50 locations in 22 countries. We continue to expand our global presence and service offerings to increase revenue, improve operational efficiencies and drive brand loyalty for our clients.
Pro Forma Results of Operations
Following are pro forma unaudited results of operations for the year ended December 31, 2008 assuming the acquisition of SHC occurred on January 1, 2008:
We derived the pro forma results of operations from (i) the audited consolidated financial statements of SHC for the period from January 1, 2008 to July 31, 2008 (the date of the SHC acquisition) and (ii) our audited consolidated financial statements for the year ended December 31, 2008. The pro forma results of operations are not necessarily indicative of results of operations that may have actually occurred had the acquisition taken place on the dates noted, or the future financial position or operating results of SHC. The pro forma adjustments are based upon available information and assumptions that we believe are reasonable. The pro forma adjustments include adjustments for interest expense, reversal of interest income for SGS, amortization of intangible assets, transaction costs, depreciation expense for assets written up and market lease amortization.
61
Table of Contents
Stream Global Services, Inc.
Pro Forma Consolidated Statements of Operations
(unaudited)
| Year Ended December 31, 2008 |
||||
| Revenue |
$ | 523,458 | ||
| Direct cost of revenue |
330,955 | |||
| Gross profit |
192,503 | |||
| Operating expenses: |
||||
| Selling, general and administrative expenses |
160,824 | |||
| Stock-based compensation expense |
1,330 | |||
| Depreciation and amortization expense |
24,359 | |||
| Total operating expenses |
186,513 | |||
| Income (loss) from operations |
5,990 | |||
| Other (income) expenses, net: |
||||
| Foreign currency transaction loss (gain) |
(535 | ) | ||
| Other (income) expense, net |
1,593 | |||
| Interest expense, net |
6,894 | |||
| Total other (income) expenses, net |
7,952 | |||
| Income (loss) before provision for income taxes |
(1,962 | ) | ||
| Provision for income taxes |
9,697 | |||
| Net income (loss) |
$ | (11,659 | ) | |
Note 3—Basis of Presentation
Our consolidated financial statements of SGS as of December 31, 2009 and 2008, and for the years ended December 31, 2009, 2008 and 2007, respectively, include our accounts and those of our wholly owned subsidiaries. All significant intercompany transactions and balances have been eliminated in consolidation. In the opinion of management, all normal recurring adjustments considered necessary for a fair presentation have been included.
On July 31, 2008, we consummated our initial business acquisition with the acquisition of SHC and emerged from a development stage corporation. Prior to July 31, 2008, we were a blank check company formed for the purpose of acquiring an operating company. Accordingly, we had no revenues prior to July 31, 2008 because we were in the development stage. SHC is deemed to be our “predecessor”. As a result, the statement of operations and statement of cash flows of SHC for the period ended December 31, 2007 are presented for comparative purposes. The accompanying consolidated statements of operations and cash flows of SGS present the results of operations and cash flows for (i) the seven month period preceding the acquisition of SHC on July 31, 2008, exclusive of SHC results of operations and cash flows and (ii) for the periods succeeding the acquisition, the consolidated results of operations including SHC are included in these financial statements. The results of operations and cash flows on a consolidated basis subsequent to the acquisition of SHC are not comparative to the predecessor SHC results of operations and cash flows because the basis for the acquired assets and liabilities of SHC have been adjusted to fair value pursuant to the authoritative guidance nor are they indicative of future results.
On October 1, 2009, we acquired EGS, the parent company of eTelecare, in a stock-for-stock exchange. The accompanying consolidated statements of operations and cash flows of SGS present the results of operations and cash flows for (i) the nine month period preceding the acquisition of EGS on October 1, 2009, exclusive of EGS results of operations and cash flows and (ii) for the periods succeeding the acquisition on October 1, 2009, the
62
Table of Contents
consolidated results of operations including EGS are included in these financial statements. Refer to Note 5 for pro forma results.
Note 4—Summary of Significant Accounting Policies
Use of Estimates
The preparation of consolidated financial statements in conformity with generally accepted accounting principles in the United States requires the appropriate application of accounting policies, many of which require management to make estimates and assumptions about future events and their impact on amounts reported in our consolidated financial statements and related notes. Since future events and their impact cannot be determined with certainty, the actual results could differ from estimates. Such differences may be material to the consolidated financial statements.
Cash Equivalents
We consider all highly liquid investments with maturities at the date of purchase of three-months or less to be cash equivalents. Cash and cash equivalents of $12,180 and $6,549 December 31, 2009 and 2008, respectively, were held in international locations and may be subject to additional taxes if repatriated to the United States. Cash balances held in international currency are also subject to fluctuation in their exchange rate if and when converted to U.S. currency.
Accounts Receivable and Concentration of Credit Risk
Financial instruments that potentially subject us to significant concentrations of credit risk are principally accounts receivable. Services are provided to clients throughout the world and in various currencies. Accounts receivable includes accrued revenues of $25,117 and $16,889 at December 31, 2009 and 2008, respectively, for services rendered but not yet invoiced. We generally invoice our clients within thirty to sixty days subsequent to the performance of services.
We extend credit to our clients in the normal course of business. We do not require collateral from our clients. We evaluate the collectability of our accounts receivable based on a combination of factors that include the payment history and financial stability of our clients, our clients’ future plans and various market conditions. In circumstances where we are aware of a specific client’s inability to meet its financial obligations, we record a specific reserve against amounts due. Historically, we have not experienced significant losses on uncollectible accounts receivable. We have a reserve for doubtful accounts of $532 and $267 as of December 31, 2009 and 2008, respectively. We recorded a bad debt expense of $191, $164 and $0 for the years ended December 31, 2009 and 2008 and the period from June 26, 2007 to December 31, 2007, respectively.
Equipment & Fixtures and Operating Leases
Equipment and fixtures are recorded at cost and depreciated using the straight-line method over the estimated useful lives of the assets. Furniture and fixtures are depreciated over a five-year life, software over a three- to five-year life and equipment generally over a three- to five-year life. Leasehold improvements are depreciated over the shorter of their estimated useful life or the remaining term of the associated lease. Assets held under capital leases are recorded at the lower of the net present value of the minimum lease payments or the fair value of the leased asset at the inception of the lease. Amortization expense is computed using the straight-line method over the shorter of the estimated useful lives of the assets or the period of the related lease and is recorded in depreciation and amortization expense. Repair and maintenance costs are expensed as incurred.
The carrying value of equipment and fixtures to be held and used is evaluated for impairment whenever events or changes in circumstances indicate that the carrying amount may not be recoverable in accordance with
63
Table of Contents
the authoritative guidance. An asset is considered to be impaired when the sum of the undiscounted future net cash flows expected to result from the use of the asset and its eventual disposition does not exceed its carrying amount. The amount of the impairment loss, if any, is measured as the amount by which the carrying value of the asset exceeds its estimated fair value, which is generally determined based on appraisals or sales prices of comparable assets. Occasionally, we redeploy equipment and fixtures from underutilized centers to other locations to improve capacity utilization if it is determined that the related undiscounted future cash flows in the underutilized centers would not be sufficient to recover the carrying amount of these assets.
Where we have negotiated rent holidays and landlord or tenant incentives, we record them ratably over the initial term of the operating lease, which commences with the build-out period where not rent payments are typically due under the lease. We estimate fair value of our asset retirement obligations associated with the retirement of tangible long-lived assets such as property and equipment when the long-lived asset is acquired, constructed, developed or through normal operations. We depreciate leasehold improvements over the initial lease term.
Goodwill and Other Intangible Assets
In accordance with the authoritative guidance goodwill is reviewed for impairment annually and on an interim basis if events or changes in circumstances between annual tests indicate that an asset might be impaired. Impairment occurs when the carrying amount of goodwill exceeds its estimated fair value. The impairment, if any, is measured based on the estimated fair value of the reporting unit. Fair value is determined based on discounted cash flows. We operate in one reporting unit, which is used for impairment testing and the allocation of acquired goodwill. We test our goodwill for impairment as of the first day of our fourth quarter. We concluded that there was no impairment for 2009.
Intangible assets with a finite life are recorded at cost and amortized using their projected cash flows over their estimated useful life. Client lists and relationships are amortized over periods of up to ten years, market adjustments related to facility leases are amortized over the term of the respective lease and developed software is amortized over five years. Brands and trademarks are not amortized as their life is indefinite. We evaluate the continuing value of brands and trademarks on a quarterly basis based upon their usage and value. We concluded that there was no impairment for 2009.
The carrying value of intangibles is evaluated for impairment whenever events or changes in circumstances indicate that the carrying amount may not be recoverable in accordance with the authoritative guidance. An asset is considered to be impaired when the sum of the undiscounted future net cash flows expected to result from the use of the asset and its eventual disposition does not exceed its carrying amount. The amount of the impairment loss, if any, is measured as the amount by which the carrying value of the asset exceeds its estimated fair value, which is generally determined based on appraisals or sales prices of comparable assets.
Financial Information Regarding Segment Reporting
We have one reportable segment and, therefore, all segment-related financial information required by the authoritative guidance is included in the consolidated financial statements. The reportable segment reflects our operating and reporting structure.
Revenue Recognition
We recognize revenues as the related services are performed if evidence of an arrangement exists, delivery of the service has occurred, the fee is fixed or determinable, and collection is considered probable. If any of those criteria are not met, revenue recognition is deferred until such time as all of the criteria are met.
Our client contracts generally specify the metrics by which we bill for our services and the service requirements. We may be paid on a per minute, per hour, per call, per month, per participant, or per transaction basis.
64
Table of Contents
We derive our revenues by providing various business processing services that include technical support, sales and revenue generation services and customer care services. Our services are typically bundled together to include the services provided by our service professionals, our hosted technology, our data management and reporting and other professional services.
Direct Cost of Revenue
We record the costs specifically associated with client programs as direct cost of revenues. These costs include direct labor wages and benefits of service professionals as well as reimbursable expenses such as telecommunication charges. Telecommunication charges that are directly reimbursable are included in direct cost of revenue while telecommunication charges that are not directly reimbursed are included in operating expenses. The most significant portion of our direct cost of revenue is attributable to compensation, benefits and payroll taxes.
Operating Expenses
Our operating expenses consist of all expenses of operations other than direct costs of revenue, such as information technology, telecommunication sales and marketing costs, finance, human resource management and other functions and service center operational expenses such as facility, operations and training and depreciation and amortization.
Income Taxes
We recognize income taxes in accordance with the authoritative guidance, which requires recognition of deferred assets and liabilities for the future income tax consequence of transactions that have been included in the consolidated financial statements or tax returns. Under this method deferred tax assets and liabilities are determined based on the difference between the carrying amounts of assets and liabilities for financial reporting purposes, and the amounts used for income tax, using the enacted tax rates for the year in which the differences are expected to reverse. We provide valuation allowances against deferred tax assets whenever we believe it is more likely than not, based on available evidence, that the deferred tax asset will not be realized. Further we provide for the accounting for uncertainty in income taxes recognized in financial statements and the impact of a tax position in the financial statements if that position is more likely than not of being sustained by the taxing authority.
Contingencies
We consider the likelihood of various loss contingencies, including non-income tax and legal contingencies arising in the ordinary course of business, and our ability to reasonably estimate the amount of loss in determining loss contingencies. An estimated loss contingency is accrued in accordance with the authoritative guidance, when it is probable that a liability has been incurred and the amount of loss can be reasonably estimated. We regularly evaluate current information available to determine whether such accruals should be adjusted.
Foreign Currency Translation and Derivative Instruments
We account for financial derivative instruments utilizing the authoritative guidance. We generally utilize forward contracts expiring within one to 24 months to reduce our foreign currency exposure due to exchange rate fluctuations on forecasted cash flows denominated in non-functional foreign currencies. Upon proper designation, certain of these contracts are accounted for as cash-flow hedges, as defined by the authoritative guidance. These contracts are entered into to protect against the risk that the eventual cash flows resulting from such transactions will be adversely affected by changes in exchange rates. In using derivative financial instruments to hedge exposures to changes in exchange rates, we expose ourselves to counterparty credit risk. We do not believe that we are exposed to a concentration of credit risk with our derivative financial instruments as the counterparties are well established institutions and counterparty credit risk information is monitored on an ongoing basis.
65
Table of Contents
All derivatives, including foreign currency forward contracts, are recognized in other current assets on the balance sheet at fair value. Fair values for our derivative financial instruments are based on quoted market prices of comparable instruments or, if none are available, on pricing models or formulas using current market and model assumptions. On the date the derivative contract is entered into, we determine whether the derivative contract should be designated as a cash flow hedge. Changes in the fair value of derivatives that are highly effective and designated as cash flow hedges are recorded in “Accumulated other comprehensive income (loss)”, until the forecasted underlying transactions occur. To date we have not experienced any hedge ineffectiveness of our cash flow hedges. Any realized gains or losses resulting from the cash flow hedges are recognized together with the hedged transaction within “Other Income (expense)”. Cash flows from the derivative contracts are classified within “Cash flows from operating activities” in the accompanying Consolidated Statement of Cash Flows. Ineffectiveness is measured based on the change in fair value of the forward contracts and the fair value of the hypothetical derivatives with terms that match the critical terms of the risk being hedged.
We may also enter into derivative contracts that are intended to economically hedge certain risks, even though we elect not to apply hedge accounting as defined by the authoritative guidance.
Changes in fair value of derivatives not designated as hedges are reported in income. Upon settlement of the derivatives qualifying as hedges, a gain or loss is reported in income.
The assets and liabilities of our foreign subsidiaries, whose functional currency is their local currency, are translated at the exchange rate in effect on the reporting date, and income and expenses are translated at the average exchange rate during the period. The net effect of translation gains and losses is not included in determining net income (loss), but is reflected in accumulated other comprehensive income (loss) as a separate component of stockholders’ equity until the sale or until the liquidation of the net investment in the foreign subsidiary. Foreign currency transaction gains and losses are included in determining net income (loss), and are categorized as “Other income (expense)”.
We formally document all relationships between hedging instruments and hedged items, as well as our risk management objective and strategy for undertaking various hedging activities. This process includes linking all derivatives that are designated as cash flow hedges to forecasted transactions. We also formally assess, both at the hedge’s inception and on an ongoing basis (as required), whether the derivatives that are used in hedging transactions are highly effective in offsetting changes in cash flows of hedged items on a prospective and retrospective basis. When it is determined that a derivative is not highly effective as a hedge or that it has ceased to be a highly effective hedge or if a forecasted hedge is no longer probable of occurring, we discontinue hedge accounting prospectively. At December 31, 2009, all hedges in Philippines Peso entered into since October 1, 2009 were determined to be highly effective.
Our hedging program has been effective in all periods presented (except for contracts for the hedge of Indian Rupees entered into prior to November 30, 2008 and expiring after November 30, 2008, all contracts for the hedge of the Philippine Peso entered into prior to October 1, 2009, and all contracts for the hedge of the Canadian Dollar which were cancelled on September 30, 2009 by the Company’s bank upon the early termination of credit arrangements with the bank), and the amount of hedge ineffectiveness has not been material. The value of the Canadian dollar contracts cancelled on September 30, 2009 was a gain of $156, which was recognized in Other Income/(Expense) on the Statement of Operations.
Hedge accounting is also discontinued prospectively when (1) the derivative is no longer effective in offsetting changes in cash flow of a hedged item; (2) the derivative expires or is sold, terminated, or exercised; (3) it is no longer probable that the forecasted transaction will occur; (4) a hedged firm commitment no longer meets the definition of a firm commitment; (5) the derivative as a hedging instrument is no longer effective; or (6) when assumed in purchase accounting.
66
Table of Contents
As of December 31, 2009 and 2008, we had approximately $111,994 and $20,704, respectively, of foreign exchange risk hedged using forward exchange contracts and SHC as of December 31, 2007 had approximately $33,827. As of December 31 2009, the $111,994 of forward exchange contracts we held were comprised of $80,470 of contracts previously determined to be effective cash flow hedges but as of October 1, 2009 subsequently determined to be ineffective, $7,733 of contracts determined to be effective cash flow hedges and $23,791 of contracts for which we elected not to apply hedge accounting.
As of December 31, 2009 and 2008, the fair market value of these derivative instruments designated as cash flow hedges was a loss of $87 and a gain of $1,241, respectively, and as of December 31, 2007, SHC had gain of $251, which is reflected in accumulated other comprehensive income (loss). As of December 31, 2009, the fair market value of derivatives previously determined to be effective cash flow hedges but as of October 1, 2009 subsequently determined to be ineffective was a gain of $3,767, of which $2,265 was recognized in Other Income/Expense in the Statement of Operations. As of December 31, 2009, the fair market value of derivatives for which we elected not to apply hedge accounting was a gain of $238, which was recognized in Other Income/Expense in the Statement of Operations.
Fair Value of Financial Instruments
Effective January 1, 2008, we implemented the authoritative guidance, for our financial assets and liabilities that are re-measured and reported at fair value at each reporting period, and non-financial assets and liabilities that are re-measured and reported at fair value at least annually.
The following table presents information about our assets and liabilities and indicates the fair value hierarchy of the valuation techniques we utilized to determine such fair value. In general, fair values determined by Level 1 inputs utilize quoted prices (unadjusted) in active markets for identical assets or liabilities. Fair values determined by Level 2 inputs utilize data points that are observable such as quoted prices, interest rates and yield curves. Fair values determined by Level 3 inputs are unobservable data points for the asset or liability, and includes situations where there is little, if any, market activity for the asset or liability:
| December 31, 2009 |
Quoted Prices in Active Markets (Level 1) |
Significant Other Observable Inputs (Level 2) |
Significant Unobservable (Level 3) | |||||||||
| Description |
||||||||||||
| Long-term debt |
$ | 223,000 | $ | 223,000 | $ | — | $ | — | ||||
| Forward exchange contracts |
3,919 | — | 3,919 | — | ||||||||
| Total |
$ | 226,919 | $ | 223,000 | $ | 3,919 | $ | — | ||||
The fair value of our long term debt is determined from market quotations obtained from Bloomberg Finance, L.P. The fair values of our forward exchange contracts are determined through market, observable and corroborated sources.
The carrying amounts reflected in the consolidated balance sheets for other current assets, accounts payable, and accrued expenses approximate fair value due to their short-term maturities. To the extent we have any outstanding borrowings under our revolving credit facility, the fair value would approximate its reported value because the interest rate is variable and reflects current market rates.
Net Income (Loss) Per Share
In 2009 and 2008, we calculated net income (loss) per share in accordance with the authoritative guidance which clarifies the use of the “two-class” method of calculating earnings per share. We determined that our Series A Preferred Stock represents a participating security for purposes of computing earnings per share and allocated earnings per share to a participating security using the two-class method for computing basic earnings per share.
67
Table of Contents
Under the two-class method, basic net income (loss) per share is computed by dividing the net income (loss) applicable to common stockholders by the weighted-average number of common shares outstanding for the period. Diluted net income (loss) per share is computed using the more dilutive of (a) the two-class method or (b) the if-converted method. We allocated net income first to preferred stockholders based on dividend rights under our certificate of incorporation and then to common and preferred stockholders based on ownership interests. Net losses are not allocated to preferred stockholders. Diluted net income (loss) per share gives effect to all potentially dilutive securities.
| Year Ended December 31, 2009 |
Year Ended December 31, 2008 |
|||||||
| Net income (loss) |
$ | (28,573 | ) | $ | 796 | |||
| Series A Preferred Stock beneficial conversion feature |
— | 49,503 | ||||||
| Cumulative Convertible Preferred Stock dividends |
58,018 | 1,790 | ||||||
| Preferred Stock accretion |
6,397 | 367 | ||||||
| Warrant issuance costs |
— | 298 | ||||||
| Net income (loss) attributable for common stockholders |
$ | (92,988 | ) | $ | (51,162 | ) | ||
The following common stock equivalents were excluded from computing diluted net loss per share attributable to common stockholders because they had an anti-dilutive impact:
| Year Ended December 31, 2009 |
Year Ended December 31, 2008 | |||
| Options to purchase common stock at $6.00 per share |
6,978 | 3,210 | ||
| Pre-emptive rights at $6.00 per share |
24,385 | — | ||
| Preferred stock convertible to common stock at $6.00 per share |
— | 25,298 | ||
| Ares warrants to purchase common stock at $6.00 per share |
— | 7,500 | ||
| Publicly held warrants at $6.00 per share |
10,009 | 31,250 | ||
| Restricted stock units |
58 | 93 | ||
| Total options, warrants and restricted stock units exercisable into common stock |
41,430 | 67,351 |
In January 2010 1,000 non-qualified options were issued to our founder, Chairman and Chief Executive Officer with a strike price based on the quoted market price on the date of issue. These options will be accounted for in our first fiscal quarter of 2010.
Accumulated other comprehensive income (loss) consists of the following:
| December 31, 2009 |
December 31, 2008 |
|||||||
| Unrealized (loss) gain on forward exchange contracts |
$ | (87 | ) | $ | 1,241 | |||
| Cumulative Translation adjustment |
(3,645 | ) | (9,430 | ) | ||||
| $ | (3,732 | ) | $ | (8,189 | ) | |||
Market Lease Reserve
We assumed facility leases in connection with the acquisition of SHC and EGS. Under the authoritative guidance, the operating leases are to be recorded at fair value at the date of acquisition. We determined that certain of the facility lease contract rates were in excess of the market rates at the date of acquisition, resulting in an above market lease reserve. The above and below market lease values for the assumed facility leases were recorded based on the present value (using a discount rate which reflects the risks associated with the leases acquired) of the difference between (i) the contractual amounts to be paid pursuant to each operating lease and (ii) management’s estimate of fair market lease rates for each corresponding operating lease, measured over a
68
Table of Contents
period equal to the remaining term of the lease. The market lease reserves are amortized as a reduction of base rental expense over the remaining term of the respective leases.
In 2009, we recorded market lease adjustments of $3,778 of liabilities and $1,694 of assets due to the October 1, 2009 acquisition of EGS. In 2008, we recorded market lease adjustments of $15,258 of liabilities and $3,337 of assets due to the July 31, 2008 acquisition of SHC and October 15, 2008 acquisition of a call center business in El Salvador. For the years ended December 31, 2009 and 2008, the amortization of the market lease reserve, including imputed interest, was $680 and $1,046, respectively, and for SHC for the year ended December 31, 2007 was $2,658.
Stock-Based Compensation
At December 31, 2009 and 2008, we had a stock-based compensation plan for employees and directors. We adopted the fair value recognition provisions of the financial guidance at our inception. For share-based payments, the fair value of each grant (time-based grants with performance acceleration) is estimated on the date of grant using the Black-Scholes-Merton option valuation with the exception of a grant to our founder, Chairman and Chief Executive Officer that was valued under the Monte Carlo simulation method. Stock compensation expense is recognized on a straight-line basis over the vesting term with the exception of one grant that is accelerated, net of an estimated future forfeiture rate. The forfeiture rate assumption (19.5% as of December 31, 2009 and 2008) is based on the predecessor’s historical experience.
Recent Accounting Pronouncements
In December 2007, the Financial Accounting Standards Board (“FASB”) issued new guidance on business combinations. This guidance establishes principles and requirements for how we: (1) recognize and measure in our financial statements the identifiable assets acquired, the liabilities assumed, and any noncontrolling interest in the acquiree; (2) recognize and measure the goodwill acquired in the business combination or a gain from a bargain purchase; and (3) determine what information to disclose to enable users of the financial statements to evaluate the nature and financial effects of the business combination. The business combinations guidance also requires acquisition-related transaction and restructuring costs to be expensed rather than treated as part of the cost of the acquisition. This guidance applies prospectively to business combinations for which the acquisition date is on or after the beginning of the first annual reporting period beginning on or after December 15, 2008. We adopted the business combination guidance on January 1, 2009.
Our nonfinancial assets and liabilities measured at fair value on a nonrecurring basis include assets and liabilities acquired in connection with a business combination, goodwill and intangible assets. We adopted the fair value measurement guidance as it relates to these assets and liabilities on January 1, 2009. In April 2009, the FASB issued additional guidance on fair value measurements and disclosures. Fair value is defined as the price that would be received to sell an asset or paid to transfer a liability in an orderly transaction between market participants under current market conditions. The new guidance requires an evaluation of whether there has been a significant decrease in the volume and level of activity for the asset or liability in relation to normal market activity for the asset or liability. If there has been a significant decrease in activity, transactions or quoted prices may not be indicative of fair value and a significant adjustment may need to be made to those prices to estimate fair value. Additionally, an entity must consider whether the observed transaction was orderly (that is, not distressed or forced). If the transaction was orderly, the obtained price can be considered a relevant, observable input for determining fair value. If the transaction is not orderly, other valuation techniques must be used when estimating fair value. This guidance, which was applied by us prospectively as of June 30, 2009, did not impact our results of operations, cash flows or financial position for the year ended December 31, 2009.
In May 2009, the FASB issued guidance on subsequent events which establishes general standards of accounting for and disclosure of events that occur after the balance sheet date but before financial statements are issued or are available to be issued. This guidance is based on the same principles as currently exist in auditing
69
Table of Contents
standards and was issued by the FASB to include accounting guidance that originated as auditing standards into the body of authoritative literature issued by the FASB. The standard addresses the period after the balance sheet date during which management of a reporting entity should evaluate events or transactions that may occur for potential recognition or disclosure in the financial statements, the circumstances under which an entity should recognize events or transactions occurring after the balance sheet date in its financial statements and the disclosures that an entity should make about events or transactions that occurred after the balance sheet date. We adopted this guidance during the quarterly period ended June 30, 2009.
Note 5—Acquisitions
EGS Acquisition:
On October 1, 2009, we consummated the acquisition of EGS, pursuant to which we acquired all of the outstanding shares of capital stock of EGS and EGS became a wholly-owned subsidiary of SGS.
SGS acquired EGS to create one of the leading CRM and BPO services companies in the world. With 50 locations in 22 countries and over 30,000 employees worldwide, we will be able to offer our clients customized global capabilities that can deliver integrated services in almost any geographic region across the world. EGS gives SGS the ability to broaden service offerings to include a full portfolio of sales and revenue generation, warranty management, customer loyalty and brand management, customer care, technical support, and customer life cycle management services. We believe this broad and integrated portfolio of global services is a key differentiating factor to win new clients and realize attractive cross selling opportunities between clients.
SGS and EGS entered into a share exchange agreement pursuant to which Stream issued 33,652 shares of our common stock for all the outstanding shares of EGS. The purchase price calculation is as follows:
| Purchase price in common shares |
$ | 181,718 | |
| Value of pre-emptive rights |
1,384 | ||
| Total allocable purchase price |
$ | 183,102 |
The acquisition was accounted for in accordance with the authoritative guidance. The transaction was valued for accounting purposes at $183,102.
The exercise of our public warrants trigger certain participation rights held by the following shareholders: Ares Management, Ayala Corporation and Providence Equity Partners (the “Participating Shareholders”). The Participating Shareholders have participation rights to purchase, for $6.00 per share, an aggregate number of shares of our common stock equal to 2.4364 multiplied by the number of shares actually issued upon exercise of the public warrants. Ayala and Providence received these participation rights in association with the acquisition of EGS and accordingly we have treated the value of these rights as additional purchase consideration.
Under the purchase method of accounting, the assets and liabilities of EGS acquired are recorded as of the acquisition date at their respective fair values. The excess purchase price over those values is recorded as goodwill. The goodwill recognized is attributable primarily to the fair value of the going-concern element and the fair value of expected synergies to be achieved. The following table summarizes the estimated fair value of assets acquired and the liabilities assumed and related deferred income taxes at the date of the acquisition.
70
Table of Contents
| Current assets |
$ | 99,631 | ||
| Property and equipment |
46,952 | |||
| Goodwill |
177,478 | |||
| Trade names |
100 | |||
| Customer relationships |
30,300 | |||
| Customer contracts |
1,701 | |||
| Other non-current assets |
4,898 | |||
| Total assets acquired |
361,060 | |||
| Current liabilities |
(81,866 | ) | ||
| Related party debt |
(85,254 | ) | ||
| Other liabilities |
(10,838 | ) | ||
| Total liabilities assumed |
(177,958 | ) | ||
| Allocated purchase price |
$ | 183,102 |
The related party debt was subsequently refinanced as part of our high yield debt offering on October 1, 2009. Ayala Corporation and Providence Equity Partners received $74,408 and $15,210 including accrued interest, respectively in repayments on October 1, 2009 related to the acquired related party debt from EGS.
We recognized $12,245 of transaction related costs that were expenses in the year ended December 31, 2009. These costs are included in the consolidated income statement in the line titled “transaction related costs”.
The purchased intangibles and goodwill are not deductible for income tax purposes. However, for accounting purposes deferred income tax liabilities on purchased intangibles (other than goodwill and indefinite life assets) will be credited to our future consolidated condensed statements of operations in proportion to and over the amortization period of related intangible assets.
We have not identified any material unrecorded pre-acquisition contingencies where the related asset, liability, or impairment is probable and the amount can be reasonably estimated. Our purchase accounting for the EGS acquisition is preliminarily therefore, prior to the end of the measurement period, if information becomes available that would indicate it is probable that such events had occurred and the amounts can be reasonably estimated, such items will be included in the final purchase price allocation and may adjust goodwill.
Certain of the representations and warranties, as well as the pre-closing covenants set forth in the exchange agreement, survive the date of the closing and continue for 12 months thereafter. The representations and warranties that survive the closing and that may serve as the basis for an indemnification claim are those relating to ownership of shares, capitalization, corporate authority, government filings and no violations, financial statements, compliance with laws, tax matters, and brokers’ fees.
The following unaudited pro forma financial information presents the consolidated results of operations of SGS and EGS as if the acquisition of EGS had occurred as of the beginning of the periods presented below. The historical financial information has been adjusted to give effect to events that are directly attributable to the combination (including amortization of purchased intangible assets and debt costs associated with acquisition, debt costs associated with high yield debt offering and conversion of preferred stock to common stock), and in case of the pro forma statements of operations, have a recurring impact. The unaudited pro forma financial information is not intended, and should not be taken as representative of our future consolidated results of operations or financial condition or the results that would have occurred had the acquisition occurred as of the beginning of the earliest period.
71
Table of Contents
| 2009 | 2008 | |||||||
| Revenue |
$ | 797,005 | $ | 823,239 | ||||
| Net income (loss) attributable to common shareholders |
(40,698 | ) | (44,026 | ) | ||||
| Basic and diluted net loss per share |
$ | (0.51 | ) | $ | (0.56 | ) | ||
In the fourth quarter of 2009, the former eTelecare business generated revenue of $69.3 million and a net loss of $4.5 million.
SHC Acquisition
On July 31, 2008, we consummated the acquisition of SHC, pursuant to which we acquired all of the outstanding shares of capital stock of SHC and SHC became a wholly owned subsidiary of SGS.
The amended and restated merger agreement dated June 2, 2008, by and among SGS, SHC, and River Acquisition Subsidiary Corp., stated that the purchase price would be determined as $200,000 in cash less assumed indebtedness, transaction costs and payments for stock options and bonuses. The purchase price calculation is as follows:
| Purchase price |
$ | 200,000 | ||
| Purchase adjustments for working capital items and cash acquired |
9,887 | |||
| Purchase price before liabilities |
209,887 | |||
| Assumed indebtedness |
(89,221 | ) | ||
| Net cash paid at closing |
120,666 | |||
| SGS transaction-related costs |
5,404 | |||
| Total allocable purchase price |
$ | 126,070 |
The acquisition of SHC was accounted for in accordance with the provisions of SFAS No. 141. The transaction was valued for accounting purposes at $126,070. Included in the SGS transaction related costs are direct costs associated with investment banker fees and professional services for legal and accounting costs.
Under the purchase method of accounting, the assets and liabilities of SHC acquired are recorded as of the acquisition date at their respective fair values, and added to those ours. The excess purchase price over those values is recorded as goodwill. The following table summarizes the estimated fair value of assets acquired and the liabilities assumed and related deferred income taxes at the date of the acquisition.
| Current assets |
$ | 131,172 | ||
| Property and equipment |
40,961 | |||
| Goodwill |
48,549 | |||
| Trade names |
16,100 | |||
| Customer relationships |
67,200 | |||
| Technology-based intangible assets |
1,870 | |||
| Other non-current assets |
7,375 | |||
| Total assets acquired |
313,227 | |||
| Current liabilities |
(75,829 | ) | ||
| Bank indebtedness |
(75,555 | ) | ||
| Obligations under capital lease |
(7,745 | ) | ||
| Other liabilities |
(28,028 | ) | ||
| Total liabilities assumed |
(187,157 | ) | ||
| Allocated purchase price |
$ | 126,070 |
72
Table of Contents
The purchased intangibles and goodwill are not deductible for income tax purposes. However, for accounting purposes deferred income tax liabilities on purchased intangibles (other than goodwill) will be charged to our future consolidated condensed statements of operations in proportion to and over the amortization period of related intangible assets.
In accordance with the authoritative guidance, we accrued $1,428 of severance related costs incurred directly as a result of the acquisition. At December 31, 2009 the outstanding liability was $86.
At the time of the closing of the acquisition of SHC, $10,000 of the purchase price was placed into escrow with an escrow agent (the “Escrow Fund”) to secure the indemnity obligations of the SHC stockholders and the holders of vested options under the merger agreement for damages sustained by us and our subsidiaries as a result of breaches of representation and warranties and covenants by SHC. In 2008, we received $1,200 in payments from the Escrow Fund for claims related to working capital adjustments. In 2009, we received $3,470 in claims against the remaining Escrow Fund and recorded the cash receipts as a reduction to goodwill.
In 2009, we recorded an additional $4,333 to the purchase price of SHC resulting in an increase in goodwill to settle a contingent liability that existed prior to our acquisition of SHC relating to a dispute involving our Indian subsidiaries.
The following is a rollforward of goodwill from December 31, 2008:
| Balance at 12/31/08 |
$ | 47,686 | ||
| Settlement of a contingent liability |
4,333 | |||
| Escrow claims |
(3,470 | ) | ||
| Acquisition of EGS |
177,478 | |||
| Balance at 12/31/09 |
226,027 |
Intangibles and amortization
Intangible assets at December 31, 2009 consist of the following:
| Estimated useful life |
Weighted average remaining life |
Gross cost |
Accumulated amortization |
Net | ||||||
| Customer relationships |
Up to 10 years | 7.7 | 100,037 | 12,638 | 87,399 | |||||
| Technology-based intangible assets |
5 years | 3.6 | 1,870 | 535 | 1,335 | |||||
| Government grants |
7.5 months | — | 1,100 | 1,100 | — | |||||
| Trade names |
indefinite | indefinite | 16,200 | 100 | 16,100 | |||||
| 119,207 | 14,373 | 104,834 |
Amortization expense consists of the following:
| Year Ended December 31, 2009 |
Year Ended December 31, 2008 |
For the period from June 26, 2007 (date of inception) to December 31, 2007 |
Seven Months Ended July 31, 2008 Predecessor (“SHC”) |
Year Ended December 31, 2007 Predecessor (“SHC”) | |||||||||||
| Amortization expense |
$ | 10,826 | $ | 3,781 | $ | — | $ | — | $ | — | |||||
Future amortization expense of our intangible assets for the next five years is expected to be as follows:
| 2010 | 2011 | 2012 | 2013 | 2014 | ||||||
| Amortization |
15,295 | 18,390 | 17,280 | 15,695 | 10,194 |
73
Table of Contents
Note 6—Preferred Stock
On August 7, 2008, we issued and sold 150 shares of our Series A Preferred Stock to Ares for an aggregate purchase price of $150,000. The Series A Preferred Stock was convertible at the option of Ares subject to adjustment for stock dividends, subdivisions, reclassifications, combinations or similar type events was redeemable at our option after August 7, 2015; and voted together with common stock, except on certain matters that affect the Series A Preferred Stock, in which case the Series A Preferred Stock voted as a separate class.
On March 11, 2009, we filed an amendment to the certificate of designations of Series A Preferred Stock (the “Certificate of Amendment”) with the Secretary of State of the State of Delaware that amended the terms of the Series A Preferred Stock as follows:
Dividends. The holders of the Series A Preferred Stock were entitled to receive dividends at a rate of 5% per annum, an increase from 3% per annum, commencing on March 11, 2009 or 10% per annum if we did not redeem at our option all of the then outstanding shares of Series A Preferred Stock prior to two business days after August 7, 2015 or all of the Series A Preferred Stock has not been converted into our common stock. If an Acceleration Event (as defined in the Certificate of Amendment) occurred before August 7, 2015, then the Stated Value of each share of Series A Preferred Stock would automatically increase by adding to the Stated Value all dividends that would otherwise be payable on a share of Series A Preferred Stock on each dividend payment date from the date on which the Acceleration Event occurs until August 7, 2015. The “Stated Value” for each share of Series A Preferred Stock equals the sum of (i) $1 plus (ii) all accrued but unpaid dividends (including, without duplication, dividends added to Stated Value) on such Series A Preferred Stock as of the date of calculation. In 2009, we accrued dividends of $57,729 for the Series A Preferred Stock.
We accounted for the amended terms of the Series A Preferred Stock at fair value on the date of the amendment. Consistent with the provisions of the authoritative guidance, we determined that the fair value of the modified security was equal to the fair value of the initial security. Accordingly, we did not record any amount in earnings per share at the modification date and the increase in the dividend rate would be reflected in earnings per share as it is payable.
On March 20, 2009, we issued one share of our Series B Preferred Stock to Ares in consideration of Ares’ issuance of three letters of credit with a one year term in an aggregate amount of $7,006 pursuant to our request under the Guarantee and Reimbursement Agreement dated March 2, 2009 among Stream and some of its subsidiaries and Ares. We accounted for this preferred stock issuance as a guarantee and recorded at fair value as an asset and will amortize over one year into interest expense. The terms of the Series B Preferred Stock were similar to the terms of the Series A Preferred Stock except as follows:
Dividends. Holders of the Series B Preferred Stock were entitled to receive dividends at a rate of 5% per annum, payable semi-annually in arrears every June 30 and December 31, commencing on September 30, 2009. An amount equal to the sum of all accrued but unpaid dividends was also payable upon a Fundamental Transaction that the holders of Series B Preferred Stock treated as a Liquidation Event (each as defined in the Certificate of Designations for the Series B Preferred Stock). Many of the events that would have triggered a Fundamental Transaction were similar to those contained in the definition of Acceleration Event for the Series A Preferred Stock in the Certificate of Amendment. In 2009, we accrued dividends of $289 for the Series B Preferred Stock.
On October 1, 2009, upon the closing of the Combination all of the outstanding Series A Preferred Stock and Series B Preferred Stock was converted into 35,085 shares of our common stock. In addition, we purchased from Ares, the ten-year private warrant to purchase 7,500 shares of our common stock with an exercise price of $6.00 per share and exercisable until 2018, in consideration for 1,000 shares of our common stock. The sum of the Preferred Stock conversion and the warrant repurchase of 36,085 shares is recorded in Stockholders’ Equity.
74
Table of Contents
Note 7—Warrants
Pursuant to our IPO, we sold 31,250 units, each consisting of one share of our common stock and one warrant entitling the holder to purchase one share of our common stock at an exercise price of $6.00 per share.
The warrants became exercisable beginning on October 17, 2008 and will expire on October 17, 2011, unless redeemed earlier. Beginning October 17, 2008, we may redeem the warrants at a price of $0.01 per warrant upon a minimum of 30 days prior written notice of redemption if, and only if, the last sales price of our common stock equals or exceeds $11.50 per share for any 20 trading days within a 30 trading day period ending three business days before we send the notice of redemption.
During 2009, we repurchased 21,110 public warrants from holders for $7,188 in privately negotiated transactions and closed our self-tender offer to purchase up to 17,500 of our public warrants and accepted for purchase 9,957 warrants for a total purchase price of approximately $4,978. Also during the year holders of our warrants exercised 131 warrants for proceeds to us of $788. As of December 31, 2009 there were 10,009 warrants outstanding, including 30 shares of common stock underlying warrants embedded in our units.
The exercise of our public warrants triggers certain participation rights held by the following shareholders: Ares Management, Ayala Corporation and Providence Equity Partners (the “Participating Shareholders”). The Participating Shareholders have participation rights to purchase, for $6.00 per share, an aggregate number of shares of our common stock equal to 2.4364 multiplied by the number of shares actually issued upon exercise of the public warrants. As of December 31, 2009, Stream had 10,009 public warrants outstanding to acquire common stock at a cash exercise price of $6.00 per common stock that expire on October 17, 2011. In addition the Participating Shareholders have remaining participation rights to acquire 24,385 common shares for $6.00 per common share in cash, at a rate of 2.4364 common shares for each public warrant that is exercised for cash at $6.00 per share, if and when any of the public warrants are exercised. These participation rights expire when the public warrants expire on October 17, 2011 or are reduced pro rata as the number of public warrants outstanding are reduced.
Note 8—Equipment and Fixtures, Net
Equipment and fixtures, net, consists of the following:
| December 31, 2009 |
December 31, 2008 |
|||||||
| Furniture and fixtures |
$ | 10,948 | $ | 6,221 | ||||
| Building improvements |
32,044 | 10,820 | ||||||
| Computer equipment |
31,142 | 11,244 | ||||||
| Software |
14,586 | 2,266 | ||||||
| Telecom and other equipment |
38,157 | 16,651 | ||||||
| Fixed assets held for sale |
228 | — | ||||||
| Equipment and fixtures not yet placed in service |
1,415 | 1,695 | ||||||
| 128,520 | 48,897 | |||||||
| Less: accumulated depreciation |
(31,704 | ) | (7,263 | ) | ||||
| $ | 96,816 | $ | 41,634 | |||||
Depreciation expense consists of the following:
| Year Ended December 31, 2009 |
Year Ended December 31, 2008 |
For the period from June 26, 2007 (date of inception) to December 31, 2007 |
Seven Months Ended July 31, 2008 Predecessor (“SHC”) |
Year Ended December 31, 2007 Predecessor (“SHC”) | |||||||||||
| Depreciation expense |
$ | 25,596 | $ | 7,201 | $ | 2 | $ | 8,810 | $ | 12,059 | |||||
75
Table of Contents
Note 9—Accrued Employee Compensation and Benefits
Accrued employee compensation and benefits consists of the following:
| December 31, 2009 |
December 31, 2008 | |||||
| Compensation related amounts |
$ | 29,213 | $ | 16,374 | ||
| Vacation liabilities |
13,492 | 10,091 | ||||
| Medical and dental liabilities |
2,972 | 713 | ||||
| Employer taxes |
1,531 | 2,838 | ||||
| Retirement plans |
7,806 | 7,924 | ||||
| Other benefit related liabilities |
2,461 | 2,395 | ||||
| $ | 57,475 | $ | 40,335 | |||
Note 10—Other Accrued Expenses and Other Liabilities
Other accrued expenses consists of the following:
| December 31, 2009 |
December 31, 2008 | |||||
| Professional fees |
5,447 | 5,091 | ||||
| Accrued interest |
6,041 | 324 | ||||
| Occupancy expense |
3,678 | 1,451 | ||||
| Technology expense |
4,050 | 2,275 | ||||
| Other accrued expenses |
9,283 | 6,409 | ||||
| $ | 28,499 | $ | 15,550 | |||
Other liabilities consists of the following:
| December 31, 2009 |
December 31, 2008 | |||||
| Lease exit reserve |
$ | 924 | $ | 738 | ||
| Deferred revenue |
635 | 1,480 | ||||
| Market lease reserves |
5,548 | 3,460 | ||||
| Other |
906 | 448 | ||||
| Total current liabilities |
$ | 8,013 | $ | 6,126 | ||
| Deferred revenue |
$ | — | $ | 1,049 | ||
| Deferred rent |
955 | 183 | ||||
| Accrued income taxes |
11,976 | 6,245 | ||||
| Market value lease reserves |
7,418 | 8,910 | ||||
| Asset retirement obligation |
2,162 | — | ||||
| Other |
355 | — | ||||
| Total long-term |
$ | 22,866 | $ | 16,387 | ||
76
Table of Contents
Note 11—Long-Term Debt and Revolving Credit Facility
On July 31, 2008, we, as guarantor, entered into the Fourth Amended and Restated Revolving Credit Term Loan and Security Agreement (the “PNC Credit Agreement”) with PNC Bank, National Association (“PNC”), as Lender and as agent, PNC Capital Markets LLC, as lead arranger, SHC, as Borrowing agent, and the other Loan Parties signatory thereto, as loan parties. The PNC Credit Agreement amended and restated SHC’s credit facility with PNC, providing for an increase in the revolving credit from $86,000 to $100,000, extending the maturity date by five years to 2013 and providing for SGS as a guarantor. The PNC Credit Agreement included a $10,000 collateral reserve. The PNC Credit Agreement did not otherwise materially change the terms of SHC’s credit facility. This financing comprised a $100,000 senior secured revolving credit facility under which borrowing availability was based on, among other things, the Borrowers’ (as defined in the PNC Credit Agreement) eligible billed and unbilled accounts receivable. The financing facilities had a five-year term. Outstanding balances under the revolving credit facility incurred interest at either LIBOR plus a margin ranging from 200 to 250 basis points or at the base rate plus a margin ranging from 0 to 25 basis points. The term loans incurred interest at LIBOR plus a margin ranging from 275 to 325 basis points or at the base rate plus a margin ranging from 25 to 75 basis points, in each case based on the combined fixed charge coverage ratio of SHC. The interest rate was subject to change under additional circumstances. The facility also required compliance with certain financial covenants. On November 14, 2008, we amended the PNC Credit Agreement to extend the date for delivery of an audited opening balance sheet of the borrowers to April 1, 2009. The obligations of the Borrowers’ under the facility were secured by certain assets of the Borrowers’ and by certain assets of SHC. In connection with the financing we paid a fee of $2,316 to PNC. This amount was being amortized over the life of the facility of five years but $984 was charged to interest expense in January 2009 in connection with the Amended Credit Agreement described below.
In January 2009, we entered into the Fifth Amended and Restated Revolving Credit, Term Loan and Security Agreement, dated as of January 8, 2009 (the “Amended Credit Agreement”), with PNC as lender and as agent, Steel City Capital Funding, LLC, as term B lender and as term B agent, PNC Capital Markets LLC, as lead arranger, SHC, as borrowing agent, and the other loan parties signatory thereto, pursuant to which we borrowed an aggregate principal amount of $25 million in order to reduce the senior secured revolving credit facility from $100 million to approximately $77 million and to repay approximately $2 million in outstanding loans made to certain Foreign Borrowers (as defined in the Amended Credit Agreement).
In March 2009, we entered into an Amendment No. 1 and Waiver to the Amended Credit Agreement and certain of our subsidiaries (the “Stream Entities”) entered into a Guarantee and Reimbursement Agreement, dated as of March 2, 2009 (the “Reimbursement Agreement”) with Ares, pursuant to which Ares or one or more of its affiliates provided, or caused one or more financial institutions or other entities to provide, certain letters of credit or other guarantees or backstop arrangements for the benefit of the Stream Entities in consideration of the issuance to Ares of one share of our Series B Preferred Stock. In addition, we entered into a Subordination and Intercreditor Agreement, dated as of March 2, 2009, with PNC, as agent, Steel City Capital Funding, LLC, as agent for term B lenders and as term B agent, Ares and the other loan parties signatory thereto, pursuant to which the liens granted under the Reimbursement Agreement were made junior and subordinate to the obligations of the Stream Entities under, and to liens granted in connection with, the Amended Credit Agreement. We expensed in the year ended December 31, 2009, $3,882 related to this agreement, including $3,148 of fees associated with terminating the agreement, that were previously capitalized related to the PNC debt agreement.
In October 2009, pursuant to an indenture, dated as of October 1, 2009 (the “Indenture”), among Stream, certain of our subsidiaries and Wells Fargo Bank, National Association (“Wells Fargo”), as trustee, we issued $200 million aggregate principal amount of 11.25% Senior Secured Notes due 2014 (the “Notes”) at an initial offering price of 95.454% of the principal amount, the purpose of which was to pay off the debt from the PNC agreement along with debt acquired from EGS. In addition, we and certain of our subsidiaries (collectively, the “Borrowers”) entered into a credit agreement, dated as of October 1, 2009 (the “Credit Agreement”), with Wells Fargo, as agent and co-arranger, and Goldman Sachs Lending Partners LLC, as co-arranger, and each of the
77
Table of Contents
lenders party thereto, as lenders, providing for revolving credit financing (the “ABL Facility”) of up to $100 million, including a $20 million sub-limit for letters of credit. The ABL Facility has a maturity of four years. We capitalized fees of $7,552 and $3,631 associated with the Notes and the Credit Agreement, respectively, at the inception of these agreements that are being amortized over their respective lives. We expensed in the year ended December 31, 2009, $269 and $214, respectively, related to the Notes and the Credit Agreement.
We are in compliance with the financial covenants as of December 31, 2009. Substantially all of the assets of the Company excluding intangible assets secure the Notes and the ABL Facility. See Note 17 for Guarantor Financial Information.
Long-term borrowings consist of the following:
| December 31, 2009 |
December 31, 2008 |
|||||||
| Revolving line of credit |
$ | 15,501 | $ | 59,425 | ||||
| 11.25% Senior Secured Notes |
200,000 | 6,789 | ||||||
| Other |
237 | 24 | ||||||
| 215,738 | 66,238 | |||||||
| Less: current portion |
(90 | ) | (2,614 | ) | ||||
| Long-term debt |
$ | 215,648 | $ | 63,624 | ||||
Minimum principal payments on long-term debt subsequent to December 31, 2009 are as follows:
| Total | |||
| 2010 |
$ | 90 | |
| 2011 |
96 | ||
| 2012 |
51 | ||
| 2013 |
15,501 | ||
| 2014 |
200,000 | ||
| Total |
$ | 215,738 | |
On March 18, 2009, in response to our request under the Reimbursement Agreement, Ares issued three letters of credit in an aggregate amount of $7,006, and we issued 1 share of Series B Preferred Stock to Ares in consideration of such letters of credit.
We had $6,600 LC Guarantees outstanding at December 31, 2009 and zero at December 31, 2008, respectively.
There was $82,429 available on the ABL Facility at December 31, 2009.
We have $359 and $160 of restricted cash as of December 31, 2009 and 2008, respectively.
Note 12—Defined Contribution and Benefit Plans
We have defined contribution and benefit plans in various countries. The plans cover all full-time employees other than excluded employees as defined in the plans. The participants may make pretax contributions to the plans, and we can make both matching and discretionary contributions. In the years ended December 31, 2009 and 2008, we recorded $3,126 and $1,112 in matching contributions to the plans. Our defined benefit plans are funded primarily through annuity contracts with third party insurance companies. We do not have any material obligations under these plans other than funding the annual insurance premiums.
78
Table of Contents
Note 13—Income Taxes
The change in valuation allowances is net of the effect of foreign currency translation adjustments included in accumulated other comprehensive income (loss).
The domestic and foreign source component of income (loss) before tax is as follows:
| December 31, 2009 |
December 31, 2008 |
December 31, 2007 |
Predecessor (“SHC”) Seven Months Ended July 31, 2008 |
Predecessor (“SHC”) Year Ended December 31, 2007 |
|||||||||||||||
| Total US |
$ | (45,244 | ) | $ | (5,431 | ) | $ | 1,877 | $ | (39,508 | ) | $ | (26,718 | ) | |||||
| Total Foreign |
21,053 | 11,586 | — | 19,231 | 21,554 | ||||||||||||||
| Total |
$ | (24,191 | ) | $ | 6,155 | $ | 1,877 | $ | (20,277 | ) | $ | (5,164 | ) | ||||||
The components of the income expense (benefit) are as follows:
| December 31, 2009 |
December 31, 2008 |
December 31, 2007 |
Predecessor (“SHC”) Seven Months Ended July 31, 2008 |
Predecessor (“SHC”) December 31, 2007 | |||||||||||||
| Current |
|||||||||||||||||
| Federal |
$ | (17 | ) | $ | 234 | $ | 580 | $ | — | $ | — | ||||||
| State |
15 | 147 | 180 | 75 | 10 | ||||||||||||
| Foreign |
6,128 | 5,569 | — | 4,277 | 4,933 | ||||||||||||
| Total Current |
6,126 | 5,950 | $ | 760 | 4,352 | 4,943 | |||||||||||
| Deferred |
|||||||||||||||||
| Federal |
(664 | ) | — | — | — | — | |||||||||||
| State |
26 | — | — | — | — | ||||||||||||
| Foreign |
(1,106 | ) | (591 | ) | — | 743 | 1,216 | ||||||||||
| Total Deferred |
(1,744 | ) | (591 | ) | — | 743 | 1,216 | ||||||||||
| Total |
$ | 4,382 | $ | 5,359 | $ | 760 | $ | 5,095 | $ | 6,159 | |||||||
79
Table of Contents
A reconciliation of the provision for income taxes with amounts determined by applying the statutory US Federal rate is as follows:
| December 31, 2009 |
December 31, 2008 |
December 31, 2007 |
Seven Months Ended July 31, 2008 Predecessor (“SHC”) |
Year Ended December 31, 2007 Predecessor (“SHC”) |
|||||||||||||||
| Federal tax rate |
$ | (8,467 | ) | $ | 2,154 | $ | 580 | $ | (6,894 | ) | $ | (1,756 | ) | ||||||
| State and local income taxes, net of federal income tax benefits |
(20 | ) | 232 | 180 | 34 | (73 | ) | ||||||||||||
| Foreign income taxed at different rate to US |
3,340 | 937 | — | 967 | 1,304 | ||||||||||||||
| Change in Valuation Allowance |
10,000 | (150 | ) | — | 6,748 | 4,370 | |||||||||||||
| Non deductible expenses related to foreign tax holiday |
7,936 | — | — | — | — | ||||||||||||||
| Credits and tax holidays |
(6,709 | ) | (1,386 | ) | — | (980 | ) | (1,523 | ) | ||||||||||
| Benefit of prior year net operating losses |
(2,141 | ) | — | — | — | — | |||||||||||||
| FIN 48 Reserve |
819 | 1,334 | |||||||||||||||||
| Permanent items |
50 | 1,995 | — | 5,136 | 3,954 | ||||||||||||||
| Other differences |
(426 | ) | 243 | — | 84 | (117 | ) | ||||||||||||
| Provision for income taxes |
$ | 4,382 | $ | 5,359 | $ | 760 | $ | 5,095 | $ | 6,159 | |||||||||
Deferred income taxes consist of the following:
| December 31, 2009 |
December 31, 2008 |
|||||||
| Deferred tax assets: |
||||||||
| Accruals, allowances, and reserves |
$ | 8,629 | $ | 9,808 | ||||
| Tax credits and loss carry forwards |
19,403 | 19,163 | ||||||
| Depreciation |
4,910 | 2,620 | ||||||
| Payables |
22,252 | 16,030 | ||||||
| Other |
732 | 458 | ||||||
| 55,926 | 48,079 | |||||||
| Valuation allowance |
(18,234 | ) | (8,257 | ) | ||||
| Total deferred tax assets |
37,692 | 39,822 | ||||||
| Deferred tax liabilities: |
||||||||
| Intangible assets |
31,700 | 29,333 | ||||||
| Other liabilities |
5,462 | 9,553 | ||||||
| Unrealized foreign exchange |
404 | 735 | ||||||
| Total deferred tax liabilities |
37,566 | 39,621 | ||||||
| Net deferred tax assets |
$ | 126 | $ | 201 | ||||
Following the acquisitions of EGS on October 1, 2009 and SHC on July 31, 2008, we recognized certain deferred tax assets and liabilities associated with the estimated fair value of assets acquired and the liabilities assumed. The most significant items were the deferred tax liabilities associated with the intangible and tangible assets in the US and the Philippines, and the deferred tax assets attributed to the market lease reserve in both the US and foreign jurisdictions. As a result of the increase in the deferred tax liabilities associated with the amortizable intangible assets the valuation allowance for the US deferred tax assets was reduced.
80
Table of Contents
At December 31, 2009 and 2008, we had $28,578 and $34,334, respectively, of U.S. federal net operating losses, which will expire between 2024 and 2028. At December 31, 2009 and 2008, we had $16,745 and $15,824, respectively of state net operating losses. At December 31, 2009 and 2008 the foreign operating loss carry forwards includes $4,277 and $1,852 with no expiration date, and $7,959 and $9,950, respectively, of foreign-generated net operating losses, which will expire over various periods through 2016. The net operating losses are evaluated for each foreign jurisdiction and a full valuation allowance established where we believe that it is more likely than not based on available evidence that the asset will not be realized.
At December 31, 2009, we had $1,563 of credits available for carry forward which will expire between 2014 and 2028, and $2,547 of credits with no expiration date.
As a result of the acquisitions of EGS on October 1, 2009 and SHC on July 31, 2008, we acquired net operating loss carry forwards. The utilization of these losses is subject to the Internal Revenue Code Section 382 limitations, and we have established a valuation allowance against the deferred tax assets for an amount that is more likely than not to be recognized. We have estimated the annual limitation imposed by the provisions of Section 382, and do not expect such limitation to restrict its ability to utilize the losses within the carry forward period. In 2008 we also forfeited $1,000 of existing net operating losses in foreign jurisdictions where the change of control resulted in a limitation of offset against future taxable income.
We had recorded a valuation allowance of $18,234 and $8,257 for the periods ended December 31, 2009 and 2008, respectively, against net operating losses and deferred tax assets for which realization of any future benefit is uncertain due to taxable income limitations.
We file income tax returns in the U.S. federal jurisdiction and various state jurisdictions. Currently, we are under federal audit for the year 2007. We operate in a number of international tax jurisdictions and are subject to audits of income tax returns by tax authorities in those jurisdictions. We have open audit periods after 2002 in India, Canada and Europe, including France, Italy, Ireland, the Netherlands and the United Kingdom and are currently under audit in India and Canada.
We have been granted various tax holidays in foreign jurisdictions. These tax holidays are given as an incentive to attract foreign investment and under agreements relating to such tax holidays we receive certain exemptions from taxation on income from export related activities. The income tax benefit from foreign tax holidays was $5,472 and $705 for the periods ended December 31, 2009 and December 31, 2008. Certain of the tax holidays are set to expire between 2010 and 2012.
We currently benefit from income tax holiday incentives in the Philippines pursuant to the registrations with the Philippine Economic Zone Authority, or PEZA, of our various projects and operations. Under such PEZA registrations, the income tax holiday of our various PEZA-registered projects in the Philippines expire at staggered dates through 2012. The expiration of these tax holidays will increase our effective income tax rate.
We have not provided taxes related to the potential repatriation of foreign subsidiary earnings because we believe they will be indefinitely reinvested outside of the United States. If future events necessitate that these earnings should be repatriated to the United States, an additional tax provision and related liability would be required.
81
Table of Contents
Reconciliation of the beginning and ending total amounts of unrecognized tax benefits (exclusive of interest and penalties) is as follows:
| Beginning balance January 1, 2009 |
$ | 3,512 | ||
| Additions to tax positions related to the current year |
2,834 | |||
| Reductions for tax positions related to current year |
— | |||
| Additions for tax positions related to the prior year |
5,125 | |||
| Reductions for tax positions related to prior year |
(554 | ) | ||
| Settlements with tax authorities |
(191 | ) | ||
| Lapse of statute of limitations |
(429 | ) | ||
| Ending balance December 31, 2009 |
$ | 10,297 |
We adopted the provisions of FIN 48 upon inception. Pursuant to the adoption of FIN 48, we recorded a reserve for unrecognized tax benefits of zero.
As of December 31, 2009 and 2008, the liability for unrecognized tax benefits (including interest and penalties) was $13,319 and $6,778, respectively, of which $1,344 and $533, respectively, was recorded in current liabilities and $11,975 and $6,245, respectively, was recorded within other long term liabilities in our consolidated financial statements. Included in these amounts are approximately $1,291 and $1,308, respectively, of unbenefitted tax losses, which would be realized if the related uncertain tax positions were settled. As of January 1, 2009, we had reserved $1,958 for accrued interest and penalties, which had increased to $2,472 as at December 31, 2009 and is included in the $13,319 of liability. We recognize accrued interest and penalties associated with uncertain tax positions as part of the income tax provision. The total amount of net unrealizable tax benefits that would affect the income tax expense, if ever recognized in our consolidated financial statements is $12,769. This amount includes interest and penalties of $2,472. We estimate that within the next 12 months, our unrecognized tax benefits, and interest and penalties, could decrease as a result of settlements with taxing authorities or the expiration of the statute of limitations by $1,047 and $842, respectively.
The acquisition of EGS Corp resulted in an increase in the amount of unrecognized tax benefits of $5,884 on October 1, 2009.
Note 14—Stock Options
The 2008 Stock Incentive Plan (the “Plan”) provides for the grant of incentive and nonqualified stock options. The Plan has authorized grants of up to 10,000 shares of common stock at an exercise price not less than 100% of the fair value of the common stock at the date of grant. The Plan provides that the options shall be outstanding for a period not to exceed ten years from the grant date. During the years ended December 31, 2009 and 2008, we granted options to purchase 4,903 and 3,230 shares of our common stock to our employees with an exercise price at the greater of $6.00 per share or fair value of the underlying common stock at the date of grant. Generally, options vest over a five-year period. In 2009, we granted options to certain former eTelecare employees that have 20% of the options vest on January 1, 2010 approximately two months after the initial grant. During 2009, our founder, Chairman, and Chief Executive Officer was granted 1,000 options that are subject to a time-based vesting schedule and become exercisable under certain conditions. The options become exercisable upon our common stock closing price at or above $10.60 for 60 consecutive trading days and public float, excluding affiliates, equals or exceeds $300,000 or the affiliated stockholders have, in the aggregate sold 25% or more of their aggregate ownership as measured against their ownership as of November 10, 2009. We have used the Monte Carlo method to value these options. The accounting guidance requires us to recognize compensation expense related to options with market or performance conditions using an accelerated attribution method instead of on a straight-line basis over the requisite service period. The derived service period, as defined by the accounting guidance, was determined with the assistance of the valuation specialist and compensation expense will be recorded ratably for each tranche over the requisite service period.
82
Table of Contents
At December 31, 2009 and 2008, 534 and zero stock option grants were vested, none had been exercised, and 1,062 and none had been forfeited.
The per share fair value of options granted was determined using the Black-Scholes-Merton model.
The following assumptions were used for the option grants in the year ended December 31, 2009:
| Year Ended December 31, 2009 |
Year Ended December 31, 2008 |
|||||||
| Option term (years) |
6.375 | 6.375 | ||||||
| Volatility |
43%-63 | % | 43 | % | ||||
| Risk-free interest rate |
1.91-2.96 | % | 2.41-3.27 | % | ||||
| Dividend yield |
0 | % | 0 | % | ||||
| Weighted-average grant date fair value per option granted |
$ | 3.36 | $ | 0.76 | ||||
The option term for 2009 and 2008 was calculated under the simplified method for all option grants during for the year ended December 31, 2009 and 2008 as we do not have a long history of granting options. As we are beginning to get a history in our common stock we transitioned in 2009 to have the expected volatility assumption be based on a weighted average of the historical volatilities for Stream and its peer group, while due to lack of stock trading history the assumption for 2008 was based upon the historical volatility of comparable companies from a representative peer group selected based on industry and market capitalization. The risk-free interest rate assumption was based upon the implied yields from the U.S. Treasury zero-coupon yield curve with a remaining term equal to the expected term in options. The expected term of employee stock options granted was based on our estimated life of the options at the grant date.
Stock options under the Plan during year ended December 31, 2009 were as follows:
| Number of options |
Weighted Average Exercise Price |
Weighted Average Fair Value |
Weighted Average Remaining Contractual Term (Years) | ||||||||
| Outstanding at December 31, 2008 |
3,210 | $ | 6.00 | 9.74 | |||||||
| Granted |
4,903 | 6.22 | $ | 3.36 | |||||||
| Exercised |
— | — | |||||||||
| Forfeited or canceled |
(1,135 | ) | 6.02 | ||||||||
| Outstanding at December 31, 2009 |
6,978 | $ | 6.15 | 9.39 | |||||||
At December 31, 2009, we had stock options to purchase 535 shares that were exercisable. The weighted-average exercise price of options currently exercisable is $6.00 at December 31, 2009. The weighted average remaining contractual term of options currently exercisable is 8.8 years at December 31, 2009. The total fair value of options vested during the year ended December 31, 2009 was $495. There are 4,611 shares outstanding, vested, and expected to vest (including forfeiture adjusted unvested shares) with a weighted average exercise price of $6.14 and a weighted average remaining contractual term of 9.39 years.
For the years ended December 31, 2009, 2008, and 2007, we recognized net stock compensation expense of $1,097, $73 and zero, respectively, for the stock options in the table above. SHC recorded stock compensation expense of $1,234 and $887 respectively, for the 7 months ended July 31, 2008 and for the year ended December 31, 2007.
As of December 31, 2009 and 2008, the aggregate intrinsic value (i.e., the difference in the estimated fair value of our common stock and the exercise price to be paid by the option holder) of stock options outstanding,
83
Table of Contents
excluding the effects of expected forfeitures, was zero. The aggregate intrinsic value of the shares of exercisable stock at December 31, 2009 and 2008 was zero. The intrinsic value of options exercised for the years ended December 31, 2009 and 2008, was zero.
As of December 31, 2009 and 2008, there was $10,325 and $1,312, respectively, of unrecognized compensation cost related to the unvested portion of time-based arrangements granted under the Plan. That cost is expected to be recognized over a weighted-average period of 4.6 years from issue date.
Restricted stock award activity during the year ended December 31, 2009 and 2008 was as follows:
| Number of Shares |
Weighted average Grant-Date Fair Value | |||||
| Outstanding December 31, 2008 |
92 | $ | 7.85 | |||
| Granted |
575 | 6.12 | ||||
| Vested |
(16 | ) | 7.85 | |||
| Forfeited |
(19 | ) | 7.85 | |||
| Outstanding December 31, 2009 |
632 | $ | 6.28 | |||
For the year ended December 31, 2009 and 2008, we recognized net compensation expense of $146 and $28, respectively, for the restricted stock awards. Restricted stock awards vest either quarterly over four years for grants in 2008 or semi-annually over a five year for grants in 2009.
Note 15—Commitments and Contingencies
Leases
We lease our operating facilities and equipment under non-cancelable operating leases, which expire at various dates through 2015, and we have a capital lease obligation related to one facility. In addition, we have capital leases for furniture, computer and telephone equipment. The assets under capital lease are included in equipment and fixtures, net, on our consolidated balance sheets are as follows:
| December 31, 2009 |
December 31, 2008 |
|||||||
| Furniture and fixtures |
$ | 1,182 | $ | 235 | ||||
| Building improvements |
8,588 | 3,117 | ||||||
| Computer equipment |
3,946 | 696 | ||||||
| Telecom and other equipment |
6,341 | 3,631 | ||||||
| 20,057 | 7,679 | |||||||
| Less: accumulated depreciation |
(3,221 | ) | (771 | ) | ||||
| $ | 16,836 | $ | 6,908 | |||||
84
Table of Contents
Future minimum payments under capital and operating leases consist of the following at December 31, 2009:
| Capital Leases |
Operating Leases | ||||||
| 2010 |
$ | 6,865 | $ | 39,291 | |||
| 2011 |
5,350 | 30,732 | |||||
| 2012 |
3,576 | 18,892 | |||||
| 2013 |
2,489 | 13,344 | |||||
| 2014 |
744 | 8,084 | |||||
| Thereafter |
585 | 13,009 | |||||
| Total future minimum lease payments |
19,609 | $ | 123,352 | ||||
| Less amount representing interest |
(2,801 | ) | |||||
| 16,808 | |||||||
| Less current portion |
(5,529 | ) | |||||
| $ | 11,279 | ||||||
Rent expense is included in our consolidated statements of operations in selling, general and administrative expenses as follows:
| Year Ended December 31, 2009 |
Year Ended December 31, 2008 |
For the period from June 26, 2007 (date of inception) to December 31, 2007 |
Seven Months Ended July 31, 2008 Predecessor (“SHC”) |
Year Ended December 31, 2007 Predecessor (“SHC”) |
|||||||||||||||
| Rent expense |
$ | 35,751 | $ | 11,102 | $ | — | $ | 17,646 | $ | 25,019 | |||||||||
| Market lease reserve amortization |
(3,687 | ) | (1,422 | ) | — | (2,046 | ) | (3,632 | ) | ||||||||||
| Net rent expense |
$ | 32,064 | $ | 9,680 | $ | 0 | $ | 15,600 | $ | 21,387 | |||||||||
Contingencies
We are self-insured with respect to medical and dental claims by our employees located in the United States, subject to an annual insured stop-loss limit on per-claim payments of $125 for legacy Stream and $150 for legacy eTelecare employees and an overall insured stop-loss limit of $1.875 per covered participant. We believe that our self-insurance reserves of $1,371 at December 31, 2009 and $713 at December 31, 2008 are adequate to provide for future payments required related to claims prior to that date.
We are also subject to various lawsuits and claims in the normal course of business. In addition, from time to time, we receive communications from government or regulatory agencies concerning investigations or allegations of non-compliance with laws or regulations in jurisdictions in which we operate. We establish reserves for specific liabilities in connection with regulatory and legal actions that we deem to be probable and estimable, and we believe that our reserves for such liabilities are adequate.
We have been named as a third-party defendant in a putative class action captioned Kambiz Batmanghelich, on behalf of himself and all others similarly situated and on behalf of the general public, v. Sirius XM Radio, Inc., filed in the Los Angeles County Superior Court on November 10, 2009, and removed to the United States District Court for the Central District of California. The Plaintiff alleges that Sirius XM Radio, Inc. recorded telephone conversations between Plaintiff and members of the proposed class of Sirius customers, on the one hand, and Sirius and its employees, on the other, without the Plaintiff’s and class members’ consent in violation of California’s telephone recording laws. The Plaintiff also alleges negligence and violation of the common law
85
Table of Contents
right of privacy, and seeks injunctive relief. On December 21, 2009, Sirius XM Radio, Inc. filed a Third-Party Complaint in the action against us seeking indemnification for any defense costs and damages that result from the putative class action. The Plaintiff has not alleged any claims against us. We believe that we have meritorious defenses to Sirius XM Radio, Inc.’s claims, but there can be no assurance as to the outcome of this lawsuit and an adverse outcome could have a material adverse effect on our business, results of operations or financial condition.
Note 16—Geographic Operations and Concentrations
We operate in one operating segment, but provide services primarily in two regions: “Americas”, which includes United States, Canada, the Philippines, India, Costa Rica, Nicaragua, Dominican Republic, and El Salvador; and “EMEA”, which includes Europe, Middle East, and Africa.
The following table presents geographic information regarding our operations:
| Year Ended December 31, 2009 |
Year Ended December 31, 2008 |
For the period from June 26, 2007 (date of inception) to December 31, 2007 |
Seven Months Ended July 31, 2008 Predecessor (“SHC”) |
Year Ended December 31, 2007 Predecessor (“SHC”) | |||||||||||
| Revenues |
|||||||||||||||
| Americas |
$ | 371,944 | $ | 122,090 | $ | — | $ | 169,402 | $ | 309,299 | |||||
| EMEA |
212,825 | 89,283 | — | 142,683 | 174,270 | ||||||||||
| $ | 584,769 | $ | 211,373 | $ | — | $ | 312,085 | $ | 483,569 | ||||||
| December 31, 2009 |
December 31, 2008 | ||||||||||||||
| Total assets: |
|||||||||||||||
| Americas |
$ | 594,116 | $ | 259,432 | |||||||||||
| EMEA |
86,707 | 70,513 | |||||||||||||
| $ | 680,823 | $ | 329,945 | ||||||||||||
We derive significant revenues from three significant clients. At December 31, 2009, two of our largest clients are global computer companies, and the other client is a satellite radio provider.
| Year Ended December 31, 2009 |
Year Ended December 31, 2008 |
For the period from June 26, 2007 (date of inception) to December 31, 2007 |
Seven Months Ended July 31, 2008 Predecessor (“SHC”) |
Year Ended December 31, 2007 Predecessor (“SHC”) |
||||||||||
| Dell Inc. |
19 | % | 17 | % | — | 16 | % | 16 | % | |||||
| Hewlett-Packard Company |
17 | % | 17 | % | — | 13 | % | 13 | % | |||||
| Sirius XM Radio Inc. |
10 | % | 12 | % | — | 11 | % | 13 | % |
Related accounts receivable from these three clients were 29%, 15% and 6%, respectively, of our total accounts receivable at December 31, 2009.
86
Table of Contents
Note 17—Guarantor Financial Information
Our Notes are guaranteed by Stream, which is the parent company, along with certain of our wholly owned subsidiaries. Such guarantees are full, unconditional and joint and several. Condensed consolidating financial information related to us, our guarantor subsidiaries and our non-guarantor subsidiaries as of December 31, 2009, 2008 and 2007 are reflected below:
Condensed Consolidating Statement of Operations
For the year ended December 31, 2009
| Parent | Guarantor subsidiaries |
Non-Guarantor subsidiaries |
Elimination | Total | ||||||||||||||||
| Net revenue: |
||||||||||||||||||||
| Customers |
$ | — | $ | 517,373 | $ | 67,396 | $ | — | $ | 584,769 | ||||||||||
| Intercompany |
— | 88,067 | 231,805 | (319,872 | ) | — | ||||||||||||||
| — | 605,440 | 299,201 | (319,872 | ) | 584,769 | |||||||||||||||
| Direct cost of revenue |
||||||||||||||||||||
| Customers |
— | 171,587 | 170,606 | 342,193 | ||||||||||||||||
| Intercompany |
— | 293,155 | 26,717 | (319,872 | ) | — | ||||||||||||||
| — | 464,742 | 197,323 | (319,872 | ) | 342,193 | |||||||||||||||
| Gross Profit |
— | 140,698 | 101,878 | — | 242,576 | |||||||||||||||
| Operating expenses: |
||||||||||||||||||||
| Selling, general and administrative expenses |
1,650 | 117,080 | 80,724 | — | 199,454 | |||||||||||||||
| Transaction related costs |
6,832 | 5,413 | — | — | 12,245 | |||||||||||||||
| Depreciation and amortization |
44 | 25,178 | 11,200 | — | 36,422 | |||||||||||||||
| Total operating expenses |
8,526 | 147,671 | 91,924 | — | 248,121 | |||||||||||||||
| Income (loss) from operations |
(8,526 | ) | (6,973 | ) | 9,954 | — | (5,545 | ) | ||||||||||||
| Other (income) expenses, net: |
||||||||||||||||||||
| Foreign currency transaction loss (gain) |
— | 1,289 | (1,053 | ) | — | 236 | ||||||||||||||
| Other (income) expense, net |
— | — | — | — | — | |||||||||||||||
| Interest (income) expense, net |
2,165 | 11,898 | 4,347 | — | 18,410 | |||||||||||||||
| Equity in earnings of subsidiaries |
18,924 | — | — | (18,924 | ) | — | ||||||||||||||
| Total other (income) expenses, net |
21,089 | 13,187 | 3,294 | (18,924 | ) | 18,646 | ||||||||||||||
| Income (loss) before income taxes |
(29,615 | ) | (20,160 | ) | 6,660 | 18,924 | (24,191 | ) | ||||||||||||
| Provision (benefit) for income taxes |
(1,042 | ) | 4,729 | 695 | — | 4,382 | ||||||||||||||
| Net income (loss) |
(28,573 | ) | (24,889 | ) | 5,965 | 18,924 | (28,573 | ) | ||||||||||||
| Cumulative convertible Preferred Stock dividends |
58,018 | — | — | — | 58,018 | |||||||||||||||
| Preferred Stock accretion |
6,397 | — | — | — | 6,397 | |||||||||||||||
| Net income (loss) attributable to common stockholders |
$ | (92,988 | ) | $ | (24,889 | ) | $ | 5,965 | $ | 18,924 | $ | (92,988 | ) | |||||||
87
Table of Contents
Condensed Consolidating Statement of Operations
For the year ended December 31, 2008
| Parent | Guarantor subsidiaries |
Non-Guarantor subsidiaries |
Elimination | Total | ||||||||||||||||
| Net revenue: |
||||||||||||||||||||
| Customers |
$ | — | $ | 200,119 | $ | 11,254 | $ | — | $ | 211,373 | ||||||||||
| Intercompany |
— | 13,851 | 92,986 | (106,837 | ) | — | ||||||||||||||
| — | 213,970 | 104,240 | (106,837 | ) | 211,373 | |||||||||||||||
| Direct cost of revenue |
||||||||||||||||||||
| Customers |
— | 70,908 | 57,370 | — | 128,278 | |||||||||||||||
| Intercompany |
— | 93,903 | 12,934 | (106,837 | ) | — | ||||||||||||||
| — | 164,811 | 70,304 | (106,837 | ) | 128,278 | |||||||||||||||
| Gross Profit |
— | 49,159 | 33,936 | — | 83,095 | |||||||||||||||
| Operating expenses: |
||||||||||||||||||||
| Selling, general and administrative expenses |
1,254 | 41,462 | 24,168 | — | 66,884 | |||||||||||||||
| Transaction related costs |
— | — | — | — | — | |||||||||||||||
| Depreciation and amortization |
21 | 8,119 | 2,842 | — | 10,982 | |||||||||||||||
| Total operating expenses |
1,275 | 49,581 | 27,010 | — | 77,866 | |||||||||||||||
| Income (loss) from operations |
(1,275 | ) | (422 | ) | 6,926 | — | 5,229 | |||||||||||||
| Other (income) expenses, net: |
||||||||||||||||||||
| Foreign currency transaction loss (gain) |
— | 995 | (14 | ) | — | 981 | ||||||||||||||
| Other (income) expense, net |
— | — | 260 | — | 260 | |||||||||||||||
| Interest (income) expense, net |
(4,229 | ) | 1,854 | 208 | — | (2,167 | ) | |||||||||||||
| Equity in Earnings of Subsidiaries |
1,074 | — | — | (1,074 | ) | — | ||||||||||||||
| Total other (income) expenses, net |
(3,155 | ) | 2,849 | 454 | (1,074 | ) | (926 | ) | ||||||||||||
| Income (loss) before income taxes |
1,880 | (3,271 | ) | 6,472 | 1,074 | 6,155 | ||||||||||||||
| Provision (benefit) for income taxes |
1,084 | 2,432 | 1,843 | — | 5,359 | |||||||||||||||
| Net income (loss) |
796 | (5,703 | ) | 4,629 | 1,074 | 796 | ||||||||||||||
| Series A Preferred Stock beneficial conversion feature |
49,503 | — | — | — | 49,503 | |||||||||||||||
| Cumulative convertible Preferred Stock dividends |
1,790 | — | — | — | 1,790 | |||||||||||||||
| Preferred Stock accretion |
367 | — | — | — | 367 | |||||||||||||||
| Warrant issuance costs |
298 | — | — | — | 298 | |||||||||||||||
| Net income (loss) attributable to common stockholders |
$ | (51,162 | ) | $ | (5,703 | ) | $ | 4,629 | $ | 1,074 | $ | (51,162 | ) | |||||||
88
Table of Contents
Condensed Consolidating Statement of Operations
For the year ended December 31, 2007
| Parent | Guarantor subsidiaries |
Non- Guarantor subsidiaries |
Elimination | Total | |||||||||||||
| Revenue: |
|||||||||||||||||
| Customers |
$ | — | $ | — | $ | — | $ | — | $ | — | |||||||
| Intercompany |
— | — | — | — | — | ||||||||||||
| — | — | — | — | — | |||||||||||||
| Direct cost of revenue |
|||||||||||||||||
| Customers |
— | — | — | — | — | ||||||||||||
| Intercompany |
— | — | — | — | — | ||||||||||||
| — | — | — | — | — | |||||||||||||
| Gross Profit |
— | — | — | — | — | ||||||||||||
| Operating expenses: |
|||||||||||||||||
| Selling, general and administrative expenses |
240 | — | — | — | 240 | ||||||||||||
| Transaction related costs |
— | — | — | — | — | ||||||||||||
| Depreciation and amortization |
2 | — | — | — | 2 | ||||||||||||
| Total operating expenses |
242 | — | — | — | 242 | ||||||||||||
| Income (loss) from operations |
(242 | ) | — | — | — | (242 | ) | ||||||||||
| Other (income) expenses, net: |
|||||||||||||||||
| Foreign currency transaction loss (gain) |
— | — | — | — | — | ||||||||||||
| Other (income) expense, net |
— | — | — | — | — | ||||||||||||
| Interest (income) expense, net |
(2,119 | ) | — | — | — | (2,119 | ) | ||||||||||
| Equity in Earnings of Subsidiaries |
— | — | — | — | — | ||||||||||||
| Total other (income) expenses, net |
(2,119 | ) | — | — | — | (2,119 | ) | ||||||||||
| Income (loss) before income taxes |
1,877 | — | — | — | 1,877 | ||||||||||||
| Provision (benefit) for income taxes |
760 | — | — | — | 760 | ||||||||||||
| Net income (loss) |
$ | 1,117 | $ | — | $ | — | $ | — | $ | 1,117 | |||||||
89
Table of Contents
Condensed Consolidating Balance Sheet
As of December 31, 2009
| Parent | Guarantor subsidiaries |
Non- Guarantor subsidiaries |
Elimination | Total | |||||||||||||
| Assets |
|||||||||||||||||
| Current assets: |
|||||||||||||||||
| Cash and cash equivalents |
$ | 126 | $ | 3,195 | $ | 11,607 | $ | — | $ | 14,928 | |||||||
| Accounts receivable, net |
— | 139,025 | 36,532 | — | 175,557 | ||||||||||||
| Income taxes receivable |
— | 2,473 | 515 | — | 2,988 | ||||||||||||
| Deferred income taxes |
— | 15,241 | 629 | — | 15,870 | ||||||||||||
| Prepaid expenses and other current assets |
2,083 | 5,726 | 10,234 | — | 18,043 | ||||||||||||
| Total current assets |
2,209 | 165,660 | 59,517 | — | 227,386 | ||||||||||||
| Equipment and fixtures, net |
44 | 45,678 | 51,094 | — | 96,816 | ||||||||||||
| Deferred income taxes |
— | 1,902 | 3,404 | — | 5,306 | ||||||||||||
| Investment in Subsidiary |
390,971 | 160,798 | 27 | (551,796 | ) | — | |||||||||||
| Goodwill |
— | 119,906 | 106,121 | — | 226,027 | ||||||||||||
| Intangible assets, net |
— | 85,035 | 19,799 | — | 104,834 | ||||||||||||
| Other assets |
8,618 | 1,886 | 9,950 | — | 20,454 | ||||||||||||
| Total assets |
$ | 401,842 | $ | 580,865 | $ | 249,912 | $ | (551,796 | ) | $ | 680,823 | ||||||
| Liabilities and Stockholders’ Equity |
|||||||||||||||||
| Current liabilities: |
|||||||||||||||||
| Accounts payable |
$ | — | $ | 6,521 | $ | 7,011 | $ | — | $ | 13,532 | |||||||
| Accrued employee compensation and benefits |
— | 23,414 | 34,061 | — | 57,475 | ||||||||||||
| Other accrued expenses |
6,936 | 10,334 | 11,229 | — | 28,499 | ||||||||||||
| Income taxes payable |
(1,736 | ) | 3,907 | 28 | — | 2,199 | |||||||||||
| Current portion of long-term debt |
— | 90 | — | — | 90 | ||||||||||||
| Intercompany Payable (Receivable) |
(137,232 | ) | 44,407 | 92,825 | — | — | |||||||||||
| Current portion of capital lease obligations |
— | 3,181 | 2,348 | — | 5,529 | ||||||||||||
| Other liabilities |
— | 4,630 | 3,383 | — | 8,013 | ||||||||||||
| Total current liabilities |
(132,032 | ) | 96,484 | 150,885 | — | 115,337 | |||||||||||
| Long-term debt, net of current portion |
206,733 | 147 | — | — | 206,880 | ||||||||||||
| Capital lease obligations, net of current portion |
— | 4,132 | 7,147 | — | 11,279 | ||||||||||||
| Deferred income taxes |
— | 20,002 | 1,048 | — | 21,050 | ||||||||||||
| Other long-term liabilities |
— | 16,381 | 6,485 | — | 22,866 | ||||||||||||
| Total liabilities |
74,701 | 137,146 | 165,565 | — | 377,412 | ||||||||||||
| Total shareholders’ equity (deficit) |
327,141 | 443,719 | 84,347 | (551,796 | ) | 303,411 | |||||||||||
| Total liabilities and stockholders’ equity |
$ | 401,842 | $ | 580,865 | $ | 249,912 | $ | (551,796 | ) | $ | 680,823 | ||||||
90
Table of Contents
Condensed Consolidating Balance Sheet
As of December 31, 2008
| Parent | Guarantor subsidiaries |
Non- Guarantor subsidiaries |
Elimination | Total | ||||||||||||||
| Assets |
||||||||||||||||||
| Current assets: |
||||||||||||||||||
| Cash and cash equivalents |
$ | 3,090 | $ | 2,676 | $ | 4,894 | $ | — | $ | 10,660 | ||||||||
| Accounts receivable, net |
— | 101,250 | 8,135 | — | 109,385 | |||||||||||||
| Income taxes receivable |
— | 1,292 | 267 | — | 1,559 | |||||||||||||
| Deferred income taxes |
98 | 14,050 | 751 | — | 14,899 | |||||||||||||
| Prepaid expenses and other current assets |
501 | 5,520 | 4,332 | — | 10,353 | |||||||||||||
| Total current assets |
3,689 | 124,788 | 18,379 | — | 146,856 | |||||||||||||
| Equipment and fixtures, net |
88 | 28,100 | 13,446 | — | 41,634 | |||||||||||||
| Deferred income taxes |
— | 886 | 1,812 | — | 2,698 | |||||||||||||
| Investment in Subsidiary |
128,635 | 12,479 | 27 | (141,141 | ) | — | ||||||||||||
| Goodwill |
— | 47,686 | — | — | 47,686 | |||||||||||||
| Intangible assets, net |
— | 81,788 | 1,531 | — | 83,319 | |||||||||||||
| Other assets |
— | 3,594 | 4,158 | — | 7,752 | |||||||||||||
| Total assets |
$ | 132,412 | $ | 299,321 | $ | 39,353 | $ | (141,141 | ) | $ | 329,945 | |||||||
| Liabilities and Stockholders’ Equity |
||||||||||||||||||
| Current liabilities: |
||||||||||||||||||
| Accounts payable |
1,084 | 4,495 | 3,479 | — | 9,058 | |||||||||||||
| Accrued employee compensation and benefits |
(25 | ) | 17,768 | 22,592 | — | 40,335 | ||||||||||||
| Other accrued expenses |
563 | 8,809 | 6,178 | — | 15,550 | |||||||||||||
| Income taxes payable |
(333 | ) | 1,903 | 1,879 | — | 3,449 | ||||||||||||
| Current portion of long-term debt |
— | 2,614 | — | — | 2,614 | |||||||||||||
| Intercompany Payable (Receivable) |
(25,800 | ) | 44,583 | (18,783 | ) | — | — | |||||||||||
| Current portion of capital lease obligations |
— | 2,128 | 132 | — | 2,260 | |||||||||||||
| Other liabilities |
— | 4,824 | 1,302 | — | 6,126 | |||||||||||||
| Total current liabilities |
(24,511 | ) | 87,124 | 16,779 | — | 79,392 | ||||||||||||
| Long-term debt, net of current portion |
— | 63,624 | — | — | 63,624 | |||||||||||||
| Capital lease obligations, net of current portion |
— | 4,332 | 1,152 | — | 5,484 | |||||||||||||
| Deferred income taxes |
— | 17,396 | — | — | 17,396 | |||||||||||||
| Other long-term liabilities |
— | 13,731 | 2,656 | — | 16,387 | |||||||||||||
| Total liabilities |
(24,511 | ) | 186,207 | 20,587 | — | 182,283 | ||||||||||||
| Convertible Series A Preferred Stock |
145,911 | — | — | — | 145,911 | |||||||||||||
| Total shareholders’ equity (deficit) |
11,012 | 113,114 | 18,766 | (141,141 | ) | 1,751 | ||||||||||||
| Total liabilities and stockholders’ equity |
$ | 132,412 | $ | 299,321 | $ | 39,353 | $ | (141,141 | ) | $ | 329,945 | |||||||
91
Table of Contents
Condensed Statements of Cash Flows
For the year ended December 31, 2009
| Parent | Guarantor subsidiaries |
Non-Guarantor subsidiaries |
Elimination | Total | ||||||||||||||||
| Cash Flows from operating activities: |
||||||||||||||||||||
| Net income |
(28,573 | ) | (24,889 | ) | 5,965 | 18,924 | (28,573 | ) | ||||||||||||
| Undistributed equity in earnings of subsidiaries |
18,924 | — | — | (18,924 | ) | — | ||||||||||||||
| Adjustments to reconcile net income to cash provided by (used in) operating activities, net |
(4,362 | ) | 15,135 | (7,387 | ) | — | 3,386 | |||||||||||||
| Net cash provided by (used in) operating activities |
(14,011 | ) | (9,754 | ) | (1,422 | ) | — | (25,187 | ) | |||||||||||
| Cash Flows from investing activities: |
||||||||||||||||||||
| Acquisition of businesses, net of cash acquired |
— | 182 | 33,218 | — | 33,400 | |||||||||||||||
| Investment in Subsidiary |
(80,721 | ) | 79,221 | 1,500 | — | |||||||||||||||
| Additions to equipment and fixtures, net |
— | (9,223 | ) | (12,841 | ) | — | (22,064 | ) | ||||||||||||
| Other, net |
— | — | — | — | — | |||||||||||||||
| Net cash provided by (used in) investing activities |
(80,721 | ) | 70,180 | 21,877 | — | 11,336 | ||||||||||||||
| Cash Flows from financing activities: |
||||||||||||||||||||
| Net borrowings (repayments) on line of credit |
15,501 | (59,425 | ) | — | — | (43,924 | ) | |||||||||||||
| Net borrowings (repayments) on long term debt |
190,908 | (6,577 | ) | (120,203 | ) | — | 64,128 | |||||||||||||
| Net borrowings (repayments) on capital leases |
— | (1,255 | ) | (929 | ) | — | (2,184 | ) | ||||||||||||
| Net Intercompany |
(109,967 | ) | 3,845 | 106,122 | — | — | ||||||||||||||
| Proceeds from exercise of warrants |
788 | — | — | — | 788 | |||||||||||||||
| Proceeds from issuance of common stock related to pre-emptive rights and stock options |
1,921 | — | — | — | 1,921 | |||||||||||||||
| Re-purchase of warrants |
(7,373 | ) | — | — | — | (7,373 | ) | |||||||||||||
| Repurchases of common stock |
(10 | ) | — | — | — | (10 | ) | |||||||||||||
| Net cash provided by financing activities |
91,768 | (63,412 | ) | (15,010 | ) | — | 13,346 | |||||||||||||
| Effect of exchange rates on cash and cash equivalents |
— | 3,505 | 1,268 | — | 4,773 | |||||||||||||||
| Net increase (decrease) in cash and cash equivalents |
(2,964 | ) | 519 | 6,713 | — | 4,268 | ||||||||||||||
| Cash and cash equivalents, beginning of period |
3,090 | 2,676 | 4,894 | — | 10,660 | |||||||||||||||
| Cash and cash equivalents, end of period |
$ | 126 | $ | 3,195 | $ | 11,607 | $ | — | $ | 14,928 | ||||||||||
92
Table of Contents
Condensed Statements of Cash Flows
For the year ended December 31, 2008
| Parent | Guarantor subsidiaries |
Non-Guarantor subsidiaries |
Elimination | Total | ||||||||||||||||
| Cash Flows from operating activities: |
||||||||||||||||||||
| Net income |
$ | 796 | $ | (5,703 | ) | $ | 4,629 | $ | 1,074 | $ | 796 | |||||||||
| Undistributed equity in earnings of subsidiaries |
1,074 | — | — | (1,074 | ) | — | ||||||||||||||
| Adjustments to reconcile net income to cash provided by (used in) operating activities, net |
(5,520 | ) | (11,377 | ) | 1,535 | — | (15,362 | ) | ||||||||||||
| Net cash provided by (used in) operating activities |
(3,650 | ) | (17,080 | ) | 6,164 | — | (14,566 | ) | ||||||||||||
| Cash Flows from investing activities: |
||||||||||||||||||||
| Decrease in restricted cash |
246,300 | — | 104 | — | 246,404 | |||||||||||||||
| Acquisition of businesses, net of cash acquired |
(123,415 | ) | 9,480 | 7,804 | (106,131 | ) | ||||||||||||||
| Additions to equipment and fixtures, net |
(75 | ) | (6,221 | ) | (2,832 | ) | — | (9,128 | ) | |||||||||||
| Other, net |
— | — | — | — | — | |||||||||||||||
| Net cash provided by (used in) investing activities |
122,810 | 3,259 | 5,076 | — | 131,145 | |||||||||||||||
| Cash Flows from financing activities: |
||||||||||||||||||||
| Net borrowings (repayments) on line of credit |
— | (8,236 | ) | — | — | (8,236 | ) | |||||||||||||
| Net borrowings (repayments) on long term debt |
— | (1,081 | ) | — | — | (1,081 | ) | |||||||||||||
| Net borrowings (repayments) on capital leases |
— | (1,169 | ) | (131 | ) | — | (1,300 | ) | ||||||||||||
| Net Intercompany |
(25,800 | ) | 31,498 | (5,698 | ) | — | — | |||||||||||||
| Proceeds from issuance of Preferred Stock |
145,217 | — | — | — | 145,217 | |||||||||||||||
| Repurchases of common stock |
(236,648 | ) | — | — | — | (236,648 | ) | |||||||||||||
| Net cash provided by financing activities |
(117,231 | ) | 21,012 | (5,829 | ) | — | (102,048 | ) | ||||||||||||
| Effect of exchange rates on cash and cash equivalents |
— | (4,515 | ) | (517 | ) | — | (5,032 | ) | ||||||||||||
| Net increase (decrease) in cash and cash equivalents |
1,929 | 2,676 | 4,894 | — | 9,499 | |||||||||||||||
| Cash and cash equivalents, beginning of period |
1,161 | — | — | — | 1,161 | |||||||||||||||
| Cash and cash equivalents, end of period |
$ | 3,090 | $ | 2,676 | $ | 4,894 | $ | — | $ | 10,660 | ||||||||||
93
Table of Contents
Condensed Statements of Cash Flows
For the year ended December 31, 2007
| Parent | Guarantor subsidiaries |
Non-Guarantor subsidiaries |
Elimination | Total | |||||||||||||
| Cash Flows from operating activities: |
|||||||||||||||||
| Net income |
$ | 1,117 | $ | — | $ | — | $ | — | $ | 1,117 | |||||||
| Undistributed equity in earnings of subsidiaries |
— | — | — | — | — | ||||||||||||
| Adjustments to reconcile net income to cash provided by (used in) operating activities, net |
(1,371 | ) | — | — | — | (1,371 | ) | ||||||||||
| Net cash provided by (used in) operating activities |
(254 | ) | — | — | — | (254 | ) | ||||||||||
| Cash Flows from investing activities: |
|||||||||||||||||
| Cash contributed to trust account |
(246,300 | ) | — | — | — | (246,300 | ) | ||||||||||
| Additions to equipment and fixtures, net |
(29 | ) | — | — | — | (29 | ) | ||||||||||
| Withdrawal from trust account for working capital purposes (including taxes) |
1,206 | — | — | — | 1,206 | ||||||||||||
| (245,123 | ) | — | — | — | (245,123 | ) | |||||||||||
| Cash Flows from financing activities: |
|||||||||||||||||
| Proceeds from issuance of common stock to founding stockholders |
50 | — | — | — | 50 | ||||||||||||
| Proceeds from notes payable to stockholders |
200 | — | — | — | 200 | ||||||||||||
| Repayments of notes payable to stockholders |
(200 | ) | — | — | — | (200 | ) | ||||||||||
| Proceeds from issuance of warrants to founding stockholders |
7,500 | — | — | — | 7,500 | ||||||||||||
| Portion of net proceeds from sale of units through public offering allocable to shares of common stock subject to possible conversion |
73,875 | — | — | — | 73,875 | ||||||||||||
| Re-purchase of common shares from founding stockholders |
(7 | ) | — | — | — | (7 | ) | ||||||||||
| Net proceeds from sales of units |
165,120 | — | — | — | 165,120 | ||||||||||||
| Net cash provided by financing activities |
246,538 | — | — | — | 246,538 | ||||||||||||
| Effect of exchange rates on cash and cash equivalents |
— | — | — | — | — | ||||||||||||
| Net increase (decrease) in cash and cash equivalents |
1,161 | — | — | — | 1,161 | ||||||||||||
| Cash and cash equivalents, beginning of period |
— | — | — | — | — | ||||||||||||
| Cash and cash equivalents, end of period |
$ | 1,161 | $ | — | $ | — | $ | — | $ | 1,161 | |||||||
94
Table of Contents
Note 18—Quarterly Results of Operations (Unaudited)
SGS quarterly operating results were as follows:
| 2009 | 2008 | ||||||||||||||||||||||||||||||
| First Quarter |
Second Quarter |
Third Quarter |
Fourth Quarter |
First Quarter |
Second Quarter |
Third Quarter |
Fourth Quarter |
||||||||||||||||||||||||
| Revenue |
$ | 135,614 | $ | 125,670 | $ | 121,875 | $ | 201,610 | $ | — | $ | — | $ | 81,537 | $ | 129,836 | |||||||||||||||
| Gross profit |
57,001 | 52,265 | 49,306 | 84,004 | — | — | 31,008 | 52,087 | |||||||||||||||||||||||
| Operating income (loss) |
6,834 | 3,136 | (3,059 | ) | (12,456 | ) | (267 | ) | (287 | ) | 1,371 | 4,412 | |||||||||||||||||||
| Net income (loss) attributable to common stockholders |
$ | 180 | $ | (4,726 | ) | $ | (9,358 | ) | $ | (79,084 | ) | $ | 1,172 | $ | 403 | $ | (51,232 | ) | $ | (1,505 | ) | ||||||||||
| Net income (loss) attributable to common stockholders per share: Basic and diluted |
$ | 0.02 | $ | (0.50 | ) | $ | (0.99 | ) | $ | (0.99 | ) | $ | 0.04 | $ | 0.01 | $ | (2.12 | ) | $ | (0.16 | ) | ||||||||||
SHC quarterly operating results were as follows:
| 2008 | |||||||||||||||
| First Quarter |
Second Quarter |
Third Quarter * |
Fourth Quarter | ||||||||||||
| Revenue |
$ | 140,372 | $ | 128,714 | $ | 42,999 | $ | — | |||||||
| Gross profit |
46,461 | 45,127 | 14,821 | — | |||||||||||
| Operating income (loss) |
3,710 | 1,599 | (17,042 | ) | — | ||||||||||
| Net income (loss) |
$ | (2,004 | ) | $ | (4,172 | ) | $ | (19,197 | ) | $ | — | ||||
*—represents the one month ended July 31, 2008
95
Table of Contents
| ITEM 9. | CHANGES IN AND DISAGREEMENTS WITH ACCOUNTANTS ON ACCOUNTING AND FINANCIAL DISCLOSURE |
None.
| ITEM 9A. | CONTROLS AND PROCEDURES |
(a) Disclosure Controls and Procedures
Our Chief Executive Officer, R. Scott Murray, and our Chief Financial Officer, Dennis Lacey, (our principal executive officer and principal financial officer, respectively) have concluded that our disclosure controls and procedures (as defined in Exchange Act Rule 13a-15(e) and 15d-15(e)) were effective as of December 31, 2009, to ensure that information required to be disclosed by us in the reports filed or submitted by us under the Exchange Act is recorded, processed, summarized and reported within the time periods specified in the Securities and Exchange Commission’s rules and forms, and include controls and procedures designed to ensure that information required to be disclosed by Stream in such reports is accumulated and communicated to our management, including our Chief Executive Officer and Chief Financial Officer, or persons performing similar functions, as appropriate to allow timely decisions regarding required disclosure. In designing and evaluating the disclosure controls and procedures, our management recognized that any controls and procedures, no matter how well designed and operated, can provide only reasonable assurances of achieving the desired control objectives, and management necessarily was required to apply its judgment in designing and evaluating the controls and procedures. On an on-going basis, we review and document our disclosure controls and procedures, and our internal control over financial reporting and may from time to time make changes aimed at enhancing their effectiveness and to ensure that our systems evolve with our business.
(b) Management’s Annual Report on Internal Control over Financial Reporting
Our management is responsible for establishing and maintaining adequate internal control over financial reporting as defined in Rule 13a-15(f) and 15d-15(f) of the Exchange Act. Because of its inherent limitations, internal control over financial reporting may not prevent or detect all errors or fraud. Also, projections of any evaluation of effectiveness to future periods are subject to the risk that controls may become inadequate because of changes in conditions, or that the degree of compliance with the policies or procedures may deteriorate.
We assessed the effectiveness of the Company’s internal control over financial reporting as of December 31, 2009. In making this assessment, we used the criteria set forth by the Committee of Sponsoring Organizations of the Treadway Commission (COSO) in Internal Control—Integrated Framework. Based on our assessment using those criteria, we concluded and hereby report that our internal control over financial reporting was effective as of December 31, 2009. Management reviewed its assessment of our internal control over financial reporting with our Audit Committee of the Board of Directors.
Management’s report on internal control over financial reporting contained in this paragraph (b) of Item 9A shall not be deemed “filed” for purposes of Section 18 of the Exchange Act or otherwise subject to the liabilities of that section, nor shall it be deemed incorporated by reference in any filing by us under the Securities Act of 1933 or the Exchange Act, except as expressly set forth by specific reference in such filing.
This Annual Report does not include an attestation report of the Company’s registered public accounting firm regarding internal control over financial reporting. Management’s report was not subject to attestation by the Company’s registered public accounting firm pursuant to temporary rules of the Securities and Exchange Commission that permit the Company to provide only management’s report in this Annual Report.
(c) Changes in Internal Control over Financial Reporting
There were no changes in our internal control over financial reporting identified in connection with the evaluation required by paragraph (d) of Rule 13a-15 or Rule 15d-15 of the Exchange Act that occurred during the period covered by this Annual Report that have materially affected, or is reasonably likely to materially affect, our internal control over financial reporting.
96
Table of Contents
PART III
| ITEM 10. | DIRECTORS, EXECUTIVE OFFICERS AND CORPORATE GOVERNANCE |
The information required by this item is incorporated herein by reference to the information contained in a definitive proxy statement for our 2010 annual meeting of stockholders (the “Proxy Statement”) to be pursuant to Regulation 14A with the Securities and Exchange Commission not later than 120 days after our fiscal year end of December 31, 2009.
| ITEM 11. | EXECUTIVE COMPENSATION |
The information required by this item is incorporated herein by reference to the information contained in the Proxy Statement to be filed not later than 120 days after our fiscal year end of December 31, 2009.
| ITEM 12. | SECURITY OWNERSHIP OF CERTAIN BENEFICIAL OWNERS AND MANAGEMENT AND RELATED STOCKHOLDER MATTERS |
The information required by this item is incorporated herein by reference to the information contained in the Proxy Statement, to be filed not later than 120 days after our fiscal year end of December 31, 2009.
| ITEM 13. | CERTAIN RELATIONSHIPS AND RELATED TRANSACTIONS, AND DIRECTOR INDEPENDENCE |
The information required by this item is incorporated herein by reference to the information contained in the Proxy Statement, to be filed not later than 120 days after our fiscal year end of December 31, 2009.
| ITEM 14. | PRINCIPAL ACCOUNTANT FEES AND SERVICES |
The information required by this item is incorporated herein by reference to the information contained in the Proxy Statement, to be filed not later than 120 days after our fiscal year end of December 31, 2009.
97
Table of Contents
PART IV
| ITEM 15. | EXHIBITS AND FINANCIAL STATEMENT SCHEDULES |
Documents filed as a part of this Report:
1. Financial Statements. We are filing our Consolidated Financial Statements as part of this Report, which include:
Consolidated Balance Sheets as of December 31, 2009 and 2008
Consolidated Statements of Operations for the years ended December 31, 2009 and 2008 and the period of inception to December 31, 2007, and for the year ended December 31, 2007 and the seven months ended July 31, 2008 for Predecessor (“SHC”)
Consolidated Statements of Stockholders’ Equity for the years ended December 31, 2009 and 2008 and the period of inception to December 31, 2007
Consolidated Statements of Cash Flows for the years ended December 31, 2009 and 2008 and the period of inception to December 31, 2007, and for the year ended December 31, 2007 and the seven months ended July 31, 2008 for the Predecessor (“SHC”)
Notes to Consolidated Financial Statements
2. Financial Statement Schedule. No financial statement schedules are provided as all required information is included in the consolidated financial statements.
3. Exhibits. We are filing as part of this Report the Exhibits listed in the Exhibit Index following the signature page to this Report.
98
Table of Contents
Pursuant to the requirements of Section 13 or 15(d) of the Securities Exchange Act of 1934, the registrant has duly caused this report to be signed on its behalf by the undersigned, thereunto duly authorized.
| STREAM GLOBAL SERVICES, INC. | ||||||
| March 10, 2010 | By: | /s/ R. Scott Murray | ||||
| R. Scott Murray Chairman, Chief Executive Officer and President (Principal Executive Officer) | ||||||
| March 10, 2010 | By: | /s/ Dennis Lacey | ||||
| Dennis Lacey Executive Vice President and Chief Financial Officer (Principal Financial and Accounting Officer) | ||||||
Pursuant to the requirements of the Securities Exchange Act of 1934, this report has been signed below by the following persons on behalf of the registrant and in the capacities and on the dates indicated.
| Signature |
Title |
Date | ||
| /s/ R. Scott Murray R. Scott Murray |
Chairman of the Board of Directors, Chief Executive Officer and President | March 10, 2010 | ||
| /s/ G. Drew Conway G. Drew Conway |
Director | March 10, 2010 | ||
| /s/ Paul G. Joubert Paul G. Joubert |
Director | March 10, 2010 | ||
| /s/ Julie G. Richardson Julie G. Richardson |
Director | March 10, 2010 | ||
| /s/ David B. Kaplan David B. Kaplan |
Director | March 10, 2010 | ||
| /s/ Alfredo I. Ayala Alfredo I. Ayala |
Director | March 10, 2010 | ||
| /s/ Gerardo C. Ablaza, Jr. Gerardo C. Ablaza, Jr. |
Director | March 10, 2010 | ||
|
Kevin T. O’Leary |
Director | |||
| /s/ Jeffrey B. Schwartz Jeffrey B. Schwartz |
Director | March 10, 2010 | ||
| /s/ R. Davis Noell R. Davis Noell |
Director | March 10, 2010 | ||
| /s/ Nathan Walton Nathan Walton |
Director | March 10, 2010 | ||
99
Table of Contents
EXHIBIT INDEX
| Exhibit No. |
Description | |
| 2.1 | Amended and Restated Agreement and Plan of Merger, dated as of June 2, 2008, among the Registrant, River Acquisition Subsidiary Corp. and Stream Holdings Corporation (filed as Exhibit 2.1 to the Registrant’s Current Report on Form 8-K (File No. 001-33739), as filed with the SEC on June 5, 2008 and incorporated herein by reference). | |
| 2.2 | Share Exchange Agreement, dated as of August 14, 2009, among the Registrant, EGS Corp., EGS Dutchco B.V. and NewBridge International Investment Ltd., (filed as Exhibit 2.1 to the Registrant’s Current Report on Form 8-K (File No. 001-33739), as filed with the SEC on August 20, 2009 and incorporated herein by reference). | |
| 3.1 | Third Amended and Restated Certificate of Incorporation, filed with the Secretary of State of the State of Delaware on July 31, 2008 (filed as Exhibit 3.1 to the Registrant’s Current Report on Form 8-K (File No. 001-33739), filed with the SEC on August 6, 2008 and incorporated herein by reference). | |
| 3.2 | Certificate of Amendment to Certificate of Incorporation, filed with the Secretary of State of the State of Delaware on September 29, 2009 (filed as Exhibit 3.1 to the Registrant’s Current Report on Form 8-K (File No. 001-33739), filed with the SEC on October 5, 2009 and incorporated herein by reference). | |
| 3.3 | Certificate of Amendment to Certificate of Incorporation, filed with the Secretary of State of the State of Delaware on September 29, 2009 (filed as Exhibit 3.2 to the Registrant’s Current Report on Form 8-K (File No. 001-33739), filed with the SEC on October 5, 2009 and incorporated herein by reference). | |
| 3.4 | By-Laws of the Registrant (filed as Exhibit 3.2 to the Registrant’s Current Report on Form 8-K (File No. 001-33739), as filed with the SEC on August 20, 2009 and incorporated herein by reference). | |
| 4.1 | Specimen common stock certificate (filed as Exhibit 4.2 to the Registrant’s Current Report on Form 8-K (File No. 001-33739), as filed with the SEC on August 6, 2008 and incorporated herein by reference). | |
| 4.2 | Specimen unit certificate (filed as Exhibit 4.1 to the Registrant’s Current Report on Form 8-K (File No. 001-33739), as filed with the SEC on August 6, 2008 and incorporated herein by reference). | |
| 4.3 | Specimen warrant certificate (filed as Exhibit 4.3 to the Registrant’s Current Report on Form 8-K (File No. 001-33739), as filed with the SEC on August 6, 2008 and incorporated herein by reference). | |
| 4.4 | Form of Warrant Agreement between the Registrant and Continental Stock Transfer & Trust Company (filed as Exhibit 4.5 to the Registrant’s Registration Statement on Form S-1 (File No. 333- 144447), effective as of October 17, 2007 and incorporated herein by reference). | |
| 4.5 | Amended and Restated Registration Rights Agreement, dated as of August 14, 2009, among the Registrant, Ares Corporate Opportunities Fund II, L.P., NewBridge International Investment Ltd., EGS Dutchco B.V., Mr. R. Scott Murray, and certain stockholders of the Registrant (filed as Exhibit 4.2 to the Registrant’s Current Report on Form 8-K (File No. 001-33739), as filed with the SEC on August 20, 2009 and incorporated herein by reference). | |
| 4.6 | Indenture, dated as of October 1, 2009, among the Registrant, the Guarantors named therein and Wells Fargo Bank, National Association, as Trustee, governing the 11.25% Senior Secured Notes due 2014, including the form of 11.25% Senior Secured Notes due 2014 (filed as Exhibit 4.1 to the Registrant’s Current Report on Form 8-K (File No. 001-33739), as filed with the SEC on October 5, 2009 and incorporated herein by reference). | |
100
Table of Contents
| Exhibit No. |
Description | |
| 4.7 | Exchange and Registration Rights Agreement, dated as of October 1, 2009, among the Registrant, the Guarantors listed on the signature pages thereto and the Purchasers named therein (filed as Exhibit 4.2 to the Registrant’s Current Report on Form 8-K (File No. 001-33-739), as filed with the SEC on October 5, 2009 and incorporated herein by reference). | |
| 4.8 | Security Agreement, dated as of October 1, 2009, among the Registrant, the other Guarantors listed on the signature pages thereto and Wells Fargo Foothill, LLC (filed as Exhibit 4.3 to the Registrant’s Current Report on Form 8-K (File No. 001-33739), as filed with the SEC on October 5, 2009 and incorporated herein by reference). | |
| 4.9 | Security Agreement, dated as of October 1, 2009, among the Registrant, the other Guarantors listed on the signature pages thereto and Wilmington Trust FSB (filed as Exhibit 4.4 to the Registrant’s Current Report on Form 8-K (File No. 001-33739), as filed with the SEC on October 5, 2009 and incorporated herein by reference). | |
| 4.10 | Collateral Trust Agreement, dated as of October 1, 2009, among the Registrant, the Guarantors from time to time party thereto, Wells Fargo Bank, National Association, as Trustee, the other Secured Debt Representatives from time to time party thereto and Wilmington Trust FSB (filed as Exhibit 4.5 to the Registrant’s Current Report on Form 8-K (File No. 001-33739), as filed with the SEC on October 5, 2009 and incorporated herein by reference). | |
| 4.11 | Lien Subordination and Intercreditor Agreement, dated as of October 1, 2009, among the Registrant, the subsidiaries of the Registrant listed on the signature pages thereto, Wells Fargo Foothill, LLC and Wilmington Trust FSB (filed as Exhibit 4.6 to the Registrant’s Current Report on Form 8-K (File No. 001-33739), as filed with the SEC on October 5, 2009 and incorporated herein by reference). | |
| 4.12 | Letter Agreement, dated as of August 14, 2009, between the Registrant and Ares Corporate Opportunities Fund II, L.P. (filed as Exhibit 4.3 to the Registrant’s Current Report on Form 8-K (File No. 001-33739), as filed with the SEC on August 20, 2009 and incorporated herein by reference). | |
| 10.1 | Description of the Registrant’s 2010 management incentive plan (reported in the Registrant’s Current Report on Form 8-K (File No. 001-33739), as filed with the SEC on February 3, 2010 and incorporated herein by reference). | |
| 10.2* | Description of the Registrant’s 2009 management incentive plan (reported in the Registrant’s Current Report on Form 8-K (File No. 001-33739), as filed with the SEC on December 23, 2008 and incorporated herein by reference). | |
| 10.3* | Employment Agreement between the Registrant and R. Scott Murray, dated July 15, 2008 (filed as Exhibit 10.1 to the Registrant’s Current Report on Form 8-K (File No. 001-33739), as filed with the SEC on July 17, 2008 and incorporated herein by reference). | |
| 10.4* | Letter Amendment to Employment Agreement between the Registrant and R. Scott Murray dated December 29, 2008 (filed as Exhibit 10.4 to the Registrant’s Annual Report on Form 10-K for the year ended December 31, 2008 (File No. 001-33739), as filed with the SEC on March 17, 2009 and incorporated herein by reference). | |
| 10.5* | Letter Amendment to Employment Agreement between the Registrant and R. Scott Murray, dated May 6, 2009 (filed as Exhibit 10.1 to the Registrant’s Quarterly Report on Form 10-Q for the quarter ended June 30, 2009 (File No. 001-33739), as filed with the SEC on August 5, 2009 and incorporated herein by reference). | |
| 10.6* | Letter Amendment to Employment Agreement between the Registrant and R. Scott Murray, dated November 10, 2009 (filed as Exhibit 10.2 to the Registrant’s Current Report on Form 8-K (File No. 001-33739), as filed with the SEC on November 13, 2009 and incorporated herein by reference). | |
101
Table of Contents
| Exhibit No. |
Description | |
| 10.7* | Employment Agreement between the Registrant and Robert Dechant, dated August 7, 2008 (filed as Exhibit 10.5 to the Registrant’s Annual Report on Form 10-K for the year ended December 31, 2008 (File No. 001-33739), as filed with the SEC on March 17, 2009 and incorporated herein by reference). | |
| 10.8* | Letter Amendment to Employment Agreement between the Registrant and Robert Dechant, dated December 29, 2008 (filed as Exhibit 10.6 to the Registrant’s Annual Report on Form 10-K for the year ended December 31, 2008 (File No. 001-33739), as filed with the SEC on March 17, 2009 and incorporated herein by reference). | |
| Description of the Registrant’s 2009 management incentive plan (reported in the Registrant’s Current Report on Form 8-K (File No. 001-33739), as filed with the SEC on December 23, 2008 and incorporated herein by reference). | ||
| 10.9* | Letter Amendment to Employment Agreement between the Registrant and Robert Dechant, dated May 6, 2009 (filed as Exhibit 10.2 to the Registrant’s Quarterly Report on Form 10-Q for the quarter ended June 30, 2009 (File No. 001-33739), as filed with the SEC on August 5, 2009 and incorporated herein by reference). | |
| 10.10* | Letter Amendment to Employment Agreement between the Registrant and Robert Dechant, dated November 9, 2009 (filed as Exhibit 10.4 to the Registrant’s Current Report on Form 8-K (File No. 001-33739), as filed with the SEC on November 13, 2009 and incorporated herein by reference). | |
| 10.11* | Employment Agreement between the Registrant and Stephen C. Farrell, dated October 14, 2008 (filed as Exhibit 10.1 to the Registrant’s Current Report on Form 8-K (File No. 001-33739), as filed with the SEC on October 15, 2008 and incorporated herein by reference). | |
| 10.12* | Letter Amendment to Employment Agreement between the Registrant and Stephen C. Farrell, dated December 29, 2008 (filed as Exhibit 10.8 to the Registrant’s Annual Report on Form 10-K for the year ended December 31, 2008 (File No. 001-33739), as filed with the SEC on March 17, 2009 and incorporated herein by reference). | |
| 10.13* | Employment Agreement between the Registrant and Sheila M. Flaherty, dated July 16, 2008 (filed as Exhibit 10.2 to the Registrant’s Current Report on Form 8-K (File No. 001-33739), as filed with the SEC on July 17, 2008 and incorporated herein by reference). | |
| 10.14* | Letter Amendment to Employment Agreement between the Registrant and Sheila M. Flaherty, dated December 29, 2008 (filed as Exhibit 10.10 to the Registrant’s Annual Report on Form 10-K for the year ended December 31, 2008 (File No. 001-33739), as filed with the SEC on March 17, 2009 and incorporated herein by reference). | |
| 10.15* | Letter Amendment to Employment Agreement between the Registrant and Sheila M. Flaherty, dated May 6, 2009 (filed as Exhibit 10.3 to the Registrant’s Quarterly Report on Form 10-Q for the quarter ended June 30, 2009 (File No. 001-33739), as filed with the SEC on August 5, 2009 and incorporated herein by reference). | |
| 10.16* | Letter Amendment to Employment Agreement between the Registrant and Sheila M. Flaherty, dated November 9, 2009 (filed as Exhibit 10.3 to the Registrant’s Current Report on Form 8-K (File No. 001-33739), as filed with the SEC on November 13, 2009 and incorporated herein by reference). | |
| 10.17* | Employment Agreement between the Registrant and Dennis Lacey, dated December 15, 2009 (filed as Exhibit 10.1 to the Registrant’s Current Report on Form 8-K (File No. 001-33739), as filed with the SEC on December 21, 2009 and incorporated herein by reference). | |
| 10.18* | 2008 Stock Incentive Plan (filed as Annex D to the Registrant’s Definitive Proxy Statement, as filed with the SEC on July 7, 2008 and incorporated herein by reference). | |
102
Table of Contents
| Exhibit No. |
Description | |
| 10.19* | Form of Incentive Stock Option Agreement under the 2008 Stock Incentive Plan (filed as Exhibit 10.2 to the Registrant’s Quarterly Report on Form 10-Q for the quarter ended September 30, 2009 (File No. 001-33739), as filed with the SEC on November 6, 2009 and incorporated herein by reference). | |
| 10.20* | Form of Non-Statutory Stock Option Agreement under the 2008 Stock Incentive Plan (filed as Exhibit 10.2 to the Registrant’s Quarterly Report on Form 10-Q for the quarter ended September 30, 2009 (File No. 001-33739), as filed with the SEC on November 6, 2009 and incorporated herein by reference). | |
| 10.21* | Form of Restricted Stock Agreement under the 2008 Stock Incentive Plan (filed as Exhibit 10.3 to the Registrant’s Quarterly Report on Form 10-Q for the quarter ended September 30, 2009 (File No. 001-33739), as filed with the SEC on November 6, 2009 and incorporated herein by reference). | |
| 10.22* | Form of Restricted Stock Unit Agreement under the 2008 Stock Incentive Plan (filed as Exhibit 10.4 to the Registrant’s Current Report on Form 8-K (File No. 001-33739), as filed with the SEC on August 4, 2008 and incorporated herein by reference). | |
| 10.23* | Option Agreement between the Registrant and R. Scott Murray, dated as of November 10, 2009 (filed as Exhibit 10.1 to the Registrant’s Current Report on Form 8-K (File No. 001-33739), as filed with the SEC on November 13, 2009). | |
| 10.24 | Form of Management Rights Letter (filed as Exhibit 10.5 to the Registrant’s Current Report on Form 8-K (File No. 001-33739), as filed with the SEC on June 5, 2008 and incorporated herein by reference). | |
| 10.25 | Preferred Stock Purchase Agreement between the Registrant and Ares Corporate Opportunities Fund II, L.P., dated as of June 2, 2008 (filed as Exhibit 10.1 to the Registrant’s Current Report on Form 8-K (File No 001-33739), as filed with the SEC on June 5, 2008 and incorporated herein by reference). | |
| 10.26 | Amendment No. 2 to Preferred Stock Purchase Agreement between the Registrant and Ares Corporate Opportunities Fund II, L.P., dated as of July 17, 2008 (filed as Exhibit 10.1 to the Registrant’s Current Report on Form 8-K File No. 001-33739), as filed with the SEC on July 22, 2008 and incorporated herein by reference). | |
| 10.27 | Stockholders Agreement, dated as of October 1, 2009, among the Registrant, Ares Corporate Opportunities Fund II, L.P., EGS Dutchco B.V., NewBridge International Investment Ltd., R. Scott Murray and Trillium Capital LLC. (filed as Exhibit 10.2 to the Registrant’s Current Report on Form 8-K (File No. 001-33739), as filed with the SEC on October 5, 2009 and incorporated herein by reference). | |
| 10.28 | Form of Indemnification Agreement entered into between the Registrant and its directors and officers (filed as Exhibit 10.1 to the Registrant’s Current Report on Form 8-K (File No. 001-33739), as filed with the SEC on August 12, 2008 and incorporated herein by reference). | |
| 10.29 | Credit Agreement, dated as of October 1, 2009, among Wells Fargo Foothill, LLC, Goldman Sachs Lending Partners LLC, and each of the other Lenders party thereto, the Registrant and its subsidiaries identified therein (filed as Exhibit 10.1 to the Registrant’s Current Report on Form 8-K (File No. 001-33739), as filed with the SEC on October 5, 2009 and incorporated herein by reference). | |
| 12.1# | Statement of Computation of Ratio of Earnings to Fixed Charges. | |
| 14.1 | Code of Business Conduct and Ethics (filed as Exhibit 14.1 to the Registrant’s Current Report on Form 8-K (File No. 001-33739), as filed with the SEC on September 26, 2008 and incorporated herein by reference). | |
| 21.1# | Subsidiaries of the Registrant. | |
| 23.1# | Consent of Ernst & Young LLP, Independent Registered Public Accounting Firm. | |
103
Table of Contents
| Exhibit No. |
Description | |
| 23.2# | Consent of BDO Seidman LLP, Independent Registered Public Accounting Firm. | |
| 31.1# | Certification pursuant to Section 302 of the Sarbanes-Oxley Act of 2002, Rule 13(a)- 14(a)/15d-14(a), by Chief Executive Officer (principal executive officer). | |
| 31.2# | Certification pursuant to Section 302 of the Sarbanes-Oxley Act of 2002, Rule 13(a)-14(a)/15d-14(a), by Chief Financial Officer (principal financial officer). | |
| 32.1# | Certification pursuant to 18 U.S.C. Section 1350, as adopted pursuant to Section 906 of the Sarbanes-Oxley Act of 2002, by Chief Executive Officer (principal executive officer). | |
| 32.2# | Certification pursuant to 18 U.S.C. Section 1350, as adopted pursuant to Section 906 of the Sarbanes-Oxley Act of 2002, by Chief Financial Officer (principal financial officer). | |
| * | Management contracts or compensatory plans or arrangements required to be filed as an exhibit hereto pursuant to Item 15(a) of Form 10-K. |
| # | Filed herewith. |
104