Attached files
| file | filename |
|---|---|
| 10-K - FIRST SOUTH BANCORP INC /VA/ | v176839_10k.htm |
| EX-21 - FIRST SOUTH BANCORP INC /VA/ | v176839_ex21.htm |
| EX-23 - FIRST SOUTH BANCORP INC /VA/ | v176839_ex23.htm |
| EX-32 - FIRST SOUTH BANCORP INC /VA/ | v176839_ex32.htm |
| EX-31.2 - FIRST SOUTH BANCORP INC /VA/ | v176839_ex31-2.htm |
| EX-31.1 - FIRST SOUTH BANCORP INC /VA/ | v176839_ex31-1.htm |
Exhibit
13
Annual
Report to Stockholders for the Fiscal Year Ended December 31,
2009
2009
Annual Report
First
South Bancorp
TABLE
OF CONTENTS
|
Letter
to Stockholders
|
2
|
|
|
Selected
Consolidated Financial Information and Other Data
|
3
|
|
|
Management's
Discussion and Analysis of Financial Condition and Results of
Operation
|
4
|
|
|
Report
of Independent Registered Public Accounting Firm
|
17
|
|
|
Consolidated
Statements of Financial Condition
|
18
|
|
|
Consolidated
Statements of Operations
|
19
|
|
|
Consolidated
Statements of Changes in Stockholders' Equity
|
20
|
|
|
Consolidated
Statements of Cash Flows
|
21
|
|
|
Notes
to Consolidated Financial Statements
|
22
|
|
|
Board
of Directors
|
41
|
|
|
Executive
Officers
|
41
|
|
|
Area
Executives and Subsidiary Executives
|
41
|
|
|
City
Executives
|
41
|
|
|
First
South Bank Office Locations
|
42
|
|
|
Stockholder
Information
|
43
|
|
|
Comparative
Stock Performance Graph
|
44
|
MISSION
STATEMENT
"Our
mission is to become the premier community bank in eastern North Carolina. We
will enhance shareholder value by serving the personal and business needs of our
markets, providing superior customer service, investing in the communities that
we serve, and enriching the lives of our employees."
LETTER
TO STOCKHOLDERS
To Our
Stockholders:
On behalf
of First South Bancorp (“First South”) and its wholly owned subsidiary, First
South Bank (“Bank”), we are pleased to provide you our 2009 Annual
Report.
First
South earned net income of $7.0 million in 2009 compared to $11.0 million earned
in 2008. Diluted earnings per share were $0.72 per share for 2009
versus $1.12 per share for 2008. At December 31, 2009, our total
assets were $829.9 million; net loans and leases receivable $658.7 million; cash
and investments $127.3 million; deposits and borrowings $736.2 million;
stockholders’ equity $86.2 million and the allowance for credit losses was $13.7
million, representing 2.04% of loans outstanding. During 2009, we recorded $7.2
million of provisions for credit losses necessary to replenish net charge-offs
and strengthen the allowance for credit losses. Our net interest
margin to average earning assets of 4.12% and our efficiency ratio of 57.63% for
fiscal 2009 places us in the top portion of our peer group in margin production
and operating efficiency.
The
significance of our 2009 earnings has been the Bank’s ability of managing its
net interest margin, managing its credit risk, maintaining adequate liquidity
levels and maintaining a consistent level of fee and service charge income from
both loan and deposit products and services. We accomplished this
during one of the deepest economic recessions and lowest interest rate
environments in the banking sector’s history. We are working diligently with our
customers to assist them through these extraordinary times.
We
welcome news from economists that the current recession may begin
easing. However, the current economic environment continues to
present a challenging credit environment for both our customers and the banking
industry. As we address and manage through these challenges, we
remain focused on long-term strategies. These strategies include
remediating problem assets, maintaining adequate levels of capital and
liquidity, improving efficiency in our operations, building core customer
relationships and improving our franchise value along with shareholder
value. First South remains profitable, continues to maintain a strong
capital position in excess of the well-capitalized regulatory guidelines, and
combined with strengthening of the allowance for credit losses should enhance
our future earnings as recessionary economic conditions substantially improve.
Additionally, after careful review and consideration, First South determined not
to participate in the U.S. Treasury’s TARP program.
Based on
our strong capital position, your Board of Directors continued the quarterly
dividend payments during 2009 by declaring four quarterly cash dividends
totaling $0.80 per share. This resulted in a 111.1% dividend payout ratio to our
shareholders. Future dividends will depend upon the Company’s financial
condition, earnings, equity structure, capital needs, regulatory requirements
and economic conditions.
Each year
I compliment the performance of our dedicated and professional staff and 2009 is
no exception. We appreciate the quality of their work and are proud of their
many accomplishments achieved during this most challenging year. They are
committed to providing our customers the highest possible standards of
service. We will continue to invest in our employees, which will
ultimately result in better service to our customers and enhance both our
franchise and shareholder value.
Each
member of your Board of Directors, along with our officers and employees, join
me in thanking you for supporting First South Bancorp. As always, we
welcome your comments or suggestions and we look forward to your continued
support.
|
Sincerely,
|
|
/s/
Tom Vann
|
|
Tom
Vann
|
|
President
and
|
|
Chief
Executive Officer
|
2
SELECTED
CONSOLIDATED FINANCIAL INFORMATION AND OTHER DATA
|
At or For the Years Ended December
31,
|
|||||||||||||||||||||
|
2009
|
2008
|
2007
|
2006
|
2005
|
|||||||||||||||||
|
(dollars
in thousands, except per share data)
|
|||||||||||||||||||||
|
Selected Financial Condition
Data
|
|||||||||||||||||||||
|
Total
assets
|
$ | 829,891 | $ | 875,855 | $ | 909,288 | $ | 910,548 | $ | 834,234 | |||||||||||
|
Loans
receivable, net
|
658,656 | 744,731 | 765,083 | 761,437 | 708,929 | ||||||||||||||||
|
Cash
and investment securities
|
30,045 | 63,284 | 73,094 | 82,258 | 74,771 | ||||||||||||||||
|
Mortgage-backed
securities
|
97,239 | 32,827 | 39,120 | 36,729 | 22,702 | ||||||||||||||||
|
Deposits
|
688,511 | 716,427 | 761,370 | 800,188 | 733,753 | ||||||||||||||||
|
Borrowings
|
47,690 | 62,868 | 52,377 | 21,450 | 22,098 | ||||||||||||||||
|
Stockholders'
equity
|
86,214 | 87,821 | 86,035 | 78,797 | 68,190 | ||||||||||||||||
|
Selected Operations Data
|
|||||||||||||||||||||
|
Interest
income
|
$ | 49,060 | $ | 59,364 | $ | 70,078 | $ | 67,752 | $ | 53,176 | |||||||||||
|
Interest
expense
|
16,094 | 23,317 | 29,111 | 25,607 | 15,464 | ||||||||||||||||
|
Net
interest income
|
32,966 | 36,047 | 40,967 | 42,145 | 37,712 | ||||||||||||||||
|
Provision
for credit losses
|
7,180 | 4,044 | 350 | 933 | 1,711 | ||||||||||||||||
|
Noninterest
income
|
10,960 | 10,084 | 10,137 | 9,259 | 8,207 | ||||||||||||||||
|
Noninterest
expenses
|
25,345 | 24,165 | 22,911 | 22,207 | 21,132 | ||||||||||||||||
|
Income
before income taxes
|
11,401 | 17,922 | 27,843 | 28,264 | 23,076 | ||||||||||||||||
|
Income
taxes
|
4,365 | 6,934 | 10,840 | 11,072 | 8,947 | ||||||||||||||||
|
Net
income
|
$ | 7,036 | $ | 10,988 | $ | 17,003 | $ | 17,192 | $ | 14,129 | |||||||||||
|
Per Share Data
|
|||||||||||||||||||||
|
Earnings per share -
basic
|
(1)
|
$ | 0.72 | $ | 1.13 | $ | 1.71 | $ | 1.77 | $ | 1.49 | ||||||||||
|
Earnings per share -
diluted
|
(1)
|
0.72 | 1.12 | 1.70 | 1.72 | 1.41 | |||||||||||||||
|
Dividends per
share
|
(1)
|
0.80 | 0.80 | 0.76 | 0.68 | 0.53 | |||||||||||||||
|
Selected Financial Ratios and Other
Data
|
|||||||||||||||||||||
|
Performance
Ratios:
|
|||||||||||||||||||||
|
Return
on average assets
|
0.81 | % | 1.22 | % | 1.87 | % | 1.93 | % | 1.78 | % | |||||||||||
|
Return
on average equity
|
7.98 | 12.53 | 20.34 | 23.45 | 21.92 | ||||||||||||||||
|
Interest
rate spread
|
4.04 | 4.18 | 4.63 | 4.94 | 5.04 | ||||||||||||||||
|
Net
interest margin
|
4.12 | 4.30 | 4.80 | 5.05 | 5.11 | ||||||||||||||||
|
Average
earning assets/average interest bearing liabilities
|
117.90 | 117.77 | 120.41 | 119.20 | 118.66 | ||||||||||||||||
|
Noninterest
expense/average assets
|
2.92 | 2.68 | 2.53 | 2.50 | 2.67 | ||||||||||||||||
|
Efficiency
ratio
|
57.63 | 52.31 | 44.99 | 43.14 | 45.95 | ||||||||||||||||
|
Dividend
payout ratio
|
111.11 | 70.80 | 44.44 | 38.42 | 35.87 | ||||||||||||||||
|
Quality
Ratios:
|
|||||||||||||||||||||
|
Nonperforming
assets/total assets
|
2.50 | % | 2.59 | % | 1.01 | % | 0.37 | % | 0.27 | % | |||||||||||
|
Nonperforming
loans/total loans
|
1.51 | 1.98 | 0.97 | 0.35 | 0.31 | ||||||||||||||||
|
Allowance
for credit losses/total loans
|
2.04 | 1.58 | 1.27 | 1.29 | 1.29 | ||||||||||||||||
|
Provision
for credit losses/total loans
|
1.07 | 0.53 | 0.05 | 0.12 | 0.24 | ||||||||||||||||
|
Capital
Ratios and Other Data:
|
|||||||||||||||||||||
|
Equity/total
assets, end of period
|
10.39 | % | 10.03 | % | 9.46 | % | 8.65 | % | 8.18 | % | |||||||||||
|
Average
equity/average assets
|
10.17 | 9.72 | 9.21 | 8.24 | 8.13 | ||||||||||||||||
|
Full
service offices
|
28 | 28 | 29 | 26 | 26 | ||||||||||||||||
|
Loans
serviced for others
|
$ | 289,324 | $ | 255,510 | $ | 254,671 | $ | 245,633 | $ | 260,632 | |||||||||||
(1)
Adjusted for three-for-two stock split on May 25, 2006.
3
MANAGEMENT'S
DISCUSSION AND ANALYSIS
OF
FINANCIAL CONDITION AND RESULTS OF OPERATION
General. First South
Bancorp, Inc. (the "Company") was formed to issue common stock, owning 100% of
First South Bank (the "Bank") and operating through the Bank a commercial
banking business; therefore, this discussion and analysis of consolidated
financial condition and results of operation relates primarily to the
Bank. The business of the Bank consists principally of attracting
deposits from the general public and using them to originate secured and
unsecured commercial and consumer loans, permanent mortgage and construction
loans secured by single-family residences and other loans. The Bank's
earnings depend primarily on its net interest income, the difference between
interest earned on interest earning assets and interest paid on interest-bearing
liabilities. The volume of noninterest income and noninterest
expenses also impacts the Bank’s earnings.
Prevailing
economic conditions, competition, as well as federal and state regulations,
affect the operations of the Bank. The Bank's cost of funds is
influenced by interest rates paid on competing investments, rates offered on
deposits by other financial institutions in the Bank's market area and by
general market interest rates. Lending activities are affected by the
demand for financing of real estate and various types of commercial, consumer
and mortgage loans, and by the interest rates offered on such
financing. The Bank's business emphasis is to operate as a
well-capitalized, profitable and independent community oriented financial
institution dedicated to providing quality customer service and meeting the
financial needs of the communities it serves. The Bank believes it has been
effective in serving its customers because of its ability to respond quickly and
effectively to customer needs and inquiries. The Bank's ability to
provide these services has been enhanced by the stability of the Bank's senior
management team.
The
Company's common stock is listed and trades on the NASDAQ Global Select Market
under the symbol FSBK.
Liquidity
and Capital Resources. Liquidity
generally refers to the Bank's ability to generate adequate amounts of cash to
meet its funding needs. Adequate liquidity guarantees sufficient
funds are available to meet deposit withdrawals, fund loan commitments, maintain
adequate reserve requirements, pay operating expenses, provide funds for debt
service, pay dividends to stockholders, and meet other general
commitments. The Bank maintains its liquidity position under policy
guidelines based on liquid assets in relationship to deposits and short-term
borrowings. The Bank's primary sources of funds are customer
deposits, loan principal and interest payments, proceeds from loan and
securities sales, and advances from the Federal Home Loan Bank of Atlanta (the
"FHLB"). While maturities and scheduled amortization of loans are predictable
sources of funds, deposit flows and loan prepayments are influenced by interest
rates, economic conditions and local competition. The Bank’s primary
investing activity is originating commercial, consumer and mortgage loans, lease
financing receivables and purchases and sales of investment
securities. The Bank’s primary financing activities are attracting
checking, certificate, savings deposits, repurchase agreements, obtaining FHLB
advances and payment of dividends.
The
levels of cash and cash equivalents depend on the Bank's operating, financing,
lending and investing activities during any given period. Cash and
cash equivalents increased to $29.6 million at December 31, 2009, from $26.7
million at December 31, 2008. The Bank has other sources of liquidity
if a need for additional funds arises. Investment and mortgage-backed
securities available for sale totaled $97.1 million at December 31, 2009,
compared to $68.6 million at December 31, 2008. During the years ended December
31, 2009 and 2008, the Bank sold or exchanged real estate loans of $109.8
million and $41.1 million, respectively. Borrowings consisting of
FHLB advances, junior subordinated debentures and retail repurchase agreements
were $47.7 million at December 31, 2009, compared to $62.9 million at December
31, 2008. The Bank has pledged its FHLB Atlanta stock and certain
loans as collateral for actual or potential FHLB advances. The Bank
has minimum credit availability with the FHLB of 20% of the Bank’s total
assets. The Bank had $154.0 million of credit available with the FHLB
at December 31, 2009, compared to $125.1 million at December 31,
2008.
The
Company had $10.3 million of junior subordinated debentures at December 31, 2009
and 2008, respectively, issued through a private placement pooled trust
preferred securities offering by First South Preferred Trust I, a Delaware
statutory trust. The trust preferred securities bear interest at
three-month LIBOR plus 2.95% payable quarterly. They have a 30-year
maturity and were first redeemable, in whole or in part, on or after September
30, 2008, with certain exceptions. For regulatory purposes, the $10.0
million total of trust preferred securities qualifies as Tier 1 capital for the
Company and the Bank, to the extent such proceeds have been invested in the Bank
and the Company. Proceeds from the trust preferred securities were
used by the statutory trust to purchase junior subordinated debentures issued by
the Company. See Note 20 of the “Notes to Consolidated Financial
Statements” for additional information.
4
As a
North Carolina chartered commercial bank and a Federal Deposit Insurance
Corporation (the "FDIC") insured institution, the Bank is required to meet
various state and federal regulatory capital standards. The Bank's total
regulatory capital was $88.3 million at December 31, 2009, compared to $90.1
million at December 31, 2008. The North Carolina Commissioner of
Banks (the “Commissioner”) requires the Bank to maintain a capital surplus of
not less than 50% of common capital stock. The FDIC requires the Bank
to meet a minimum leverage capital requirement of Tier 1 capital (consisting of
retained earnings and common stockholders' equity, less any intangible assets)
to assets ratio of at least 4%, and a total capital to risk-weighted assets
ratio of 8%, of which 4% must be in the form of Tier 1 capital. The
Bank was in compliance with all regulatory capital requirements at December 31,
2009 and 2008. See Note 11 of the “Notes to Consolidated Financial
Statements” for a description of the Bank’s actual regulatory capital amounts
and ratios as of December 31, 2009 and 2008.
Stockholders'
equity was $86.2 million at December 31, 2009, compared to $87.8 million at
December 31, 2008. Net income was $7.0 million for fiscal 2009, compared to
$11.0 million for fiscal 2008. There were 9,742,296 shares of common
stock outstanding at December 31, 2009, net of 1,511,926 treasury
shares.
Contractual
Obligations and Commitments. In the normal
course of business there are various outstanding contractual obligations of the
Company that will require future cash outflows. In addition, there
are commitments and contingent liabilities, such as commitments to extend
credit, which may or may not require future cash outflows. Table 1
below reflects contractual obligations of the Company outstanding as of December
31, 2009.
Table
1 – Contractual Obligations and Commitments
|
Payments Due by Period
|
||||||||||||||||||||
|
Less Than
|
Over
|
|||||||||||||||||||
|
Contractual Obligations
|
Total
|
1 Year
|
1-3 Years
|
4-5 Years
|
5 Years
|
|||||||||||||||
|
(In thousands)
|
||||||||||||||||||||
|
Borrowed
money
|
$ | 37,380 | $ | 25,000 | $ | 12,380 | $ | - | $ | - | ||||||||||
|
Junior
subordinated debentures
|
10,310 | - | - | - | 10,310 | |||||||||||||||
|
Lease
obligations
|
1,535 | 482 | 747 | 284 | 22 | |||||||||||||||
|
Deposits
|
688,511 | 649,236 | 38,268 | 1,007 | - | |||||||||||||||
|
Total
contractual cash obligations
|
$ | 737,736 | $ | 674,718 | $ | 51,395 | $ | 1,291 | $ | 10,332 | ||||||||||
|
Amount of Commitment Expiration Per
Period
|
||||||||||||||||||||
|
Total
|
||||||||||||||||||||
|
Amounts
|
Less
than
|
Over
|
||||||||||||||||||
|
Other Commitments
|
Committed
|
1 Year
|
1-3 Years
|
4-5 Years
|
5 Years
|
|||||||||||||||
|
(In
thousands)
|
||||||||||||||||||||
|
Commitments
to originate loans
|
$ | 47,338 | $ | 39,162 | $ | 8,176 | $ | - | $ | - | ||||||||||
|
Undrawn
balances on lines of credit and
|
||||||||||||||||||||
|
undrawn
balances on credit reserves
|
49,756 | 1,004 | 3,654 | 6,029 | 39,069 | |||||||||||||||
|
Standby
letters of credit
|
1,007 | 1,007 | - | - | - | |||||||||||||||
|
Total
other commitments
|
$ | 98,101 | $ | 41,173 | $ | 11,830 | $ | 6,029 | $ | 39,069 | ||||||||||
In the
normal course of business, the Company may enter into purchase agreements for
goods or services. In management’s opinion, the dollar amount of such
agreements at December 31, 2009 is not material and has not been included in
Table 1 above. See Notes 5, 6, 9 and 14 of the “Notes to Consolidated Financial
Statements” for additional information.
Asset/Liability
Management. The Bank strives
to maintain consistent net interest income and reduce its exposure to adverse
changes in interest rates by matching the terms to repricing of its
interest-sensitive assets and liabilities. Factors beyond the Bank's
control, such as market interest rates and competition, may also impact interest
income and interest expense. The Bank's net interest income will
generally increase when interest rates rise over an extended period of time, and
conversely, will decrease when interest rates decline. The Bank can
significantly influence its net interest income by controlling the increases and
decreases in its interest income and interest expense, which are primarily
caused by changes in market interest rates. See Table 2 below for
additional information on the effects of net interest income caused by changes
in interest rates.
5
Interest
rate risk and trends, liquidity and capital ratio requirements are reported to
the Board of Directors (the “Board”) on a regular basis. The Board
reviews the maturities of the Bank's assets and liabilities and establishes
policies and strategies designed to regulate the flow of funds and to coordinate
the sources, uses and pricing of such funds. The first priority in
structuring and pricing assets and liabilities is to maintain an acceptable
interest rate spread while reducing the net effects of changes in interest
rates. The Bank's management is responsible for administering the
policies and determinations of the Board with respect to the Bank's asset and
liability goals and strategies.
A primary
component in managing interest rate risk is based on the volume of interest
sensitive assets such as commercial loans, consumer loans and lease financing
receivables. The Bank had $620.6 million of commercial loans,
consumer loans and lease receivables at December 31, 2009, compared to $710.4
million at December 31, 2008. The Bank had $6.5 million of loans held
for sale at December 31, 2009, compared to $5.6 million at December 31,
2008. Depending on conditions existing at a given time, the Bank may
sell fixed-rate residential mortgage loans in the secondary
market. In managing its portfolio of investment securities, a
majority of investment and mortgage-backed securities are held as
available for sale, allowing the Bank to sell a security in a timely manner
should an immediate liquidity need arise. The Bank had $97.1 million of
investment and mortgage-backed securities classified as available for sale at
December 31, 2009, compared to $68.6 million at December 31, 2008.
Market
Risk. Market risk
reflects the risk of economic loss resulting from changes in market prices and
interest rates. The risk of loss can be reflected in diminished current market
values and/or reduced potential net interest income in future periods. Market
risk arises primarily from interest rate risk inherent in lending and deposit
taking activities. The Bank does not maintain a trading account for any class of
financial instruments, nor does it engage in hedging activities or purchase
high-risk derivative instruments. The Bank is also not subject to
foreign currency exchange risk or commodity price risk.
The Bank
considers interest rate risk to be its most significant market risk, which could
potentially have the greatest impact on operating earnings. Interest
rate risk is measured by computing estimated changes in net interest income and
the net portfolio value ("NPV") of its cash flows from assets, liabilities and
off-balance sheet items in the event of a range of assumed changes in market
interest rates. The Bank's exposure to interest rates is reviewed on a quarterly
basis by management and the Board. Exposure to interest rate risk is measured
with the use of interest rate sensitivity analysis to determine the change in
NPV in the event of hypothetical changes in interest rates, while interest rate
sensitivity gap analysis is used to determine the repricing characteristics of
assets and liabilities. If estimated changes to NPV and net interest income are
not within the limits established by the Board, it may direct management to
adjust the Bank's asset and liability mix to bring interest rate risk within
Board approved limits.
NPV
represents the market value of portfolio equity and is equal to the market value
of assets minus the market value of liabilities, with adjustments made for
off-balance sheet items. The interest rate sensitivity analysis assesses the
potential loss in risk sensitive instruments in the event of sudden and
sustained 1% to 3% increases and decreases in market interest rates. With the
Federal Reserve’s current policy of continuing to hold interest rates at
historical low levels, it is not foreseeable that interest rates can decline
farther. In this extraordinary interest rate environment, rates would be driven
below zero if downward rate environment assumptions were run. Any data produced
by these assumptions would not be reliable. Therefore, the Bank will not run any
downward rate assumptions until interest rates increase. The Board has adopted
an interest rate risk policy that establishes maximum increases in NPV of 19%,
39% and 60% and maximum decreases in NPV of 19%, 37% and 54% in the event of
sudden and sustained 1% to 3% increases or decreases in market interest rates.
Table 2 below presents the Bank's projected changes in NPV and net interest
income before provision for credit losses, only in the event of sudden and
sustained increases in market interest rates for the various rate shock levels
at December 31, 2009. At December 31, 2009, the Bank's estimated changes in NPV
and net interest income were within the targets established by the
Board.
Table
2 - Projected Change in NPV and Net Interest Income
|
Net Portfolio Value
|
Net Interest Income Before PCL
|
|||||||||||||||||||||||
|
Change in Rates
|
Amount
|
Change
|
% Change
|
Amount
|
Change
|
% Change
|
||||||||||||||||||
|
(Dollars
in thousands)
|
||||||||||||||||||||||||
|
+
300 bp
|
$ | 101,140 | $ | (16,163 | ) | (13.8 | )% | $ | 38,270 | $ | (290 | ) | (1.2 | )% | ||||||||||
|
+
200 bp
|
105,092 | (12,211 | ) | (10.4 | ) | 38,391 | (169 | ) | (0.4 | ) | ||||||||||||||
|
+
100 bp
|
110,860 | (6,443 | ) | (5.5 | ) | 38,530 | (30 | ) | (0.1 | ) | ||||||||||||||
|
Base
|
117,303 | - | - | 38,560 | - | - | ||||||||||||||||||
6
The NPV
calculation is based on the net present value of discounted cash flows utilizing
market prepayment assumptions. Computations of prospective effects of
hypothetical interest rate changes are based on numerous assumptions, including
relative levels of market interest rates, loan prepayments and deposit decay
rates, and should not be relied upon as indicative of actual results. Further,
the computations do not contemplate any actions the Bank may undertake in
response to changes in interest rates.
Certain
shortcomings are inherent in the method of analysis presented in Table 2. For
example, although certain assets and liabilities may have similar maturities to
repricing, they may react in differing degrees to changes in market interest
rates. The interest rates on certain types of assets and liabilities may
fluctuate in advance of changes in market interest rates, while interest rates
on other types may lag behind changes in market rates. Certain assets, such as
adjustable-rate loans, have features that restrict changes in interest rates on
a short-term basis and over the life of the asset. In addition, the proportion
of adjustable-rate loans in the Bank's portfolio could decrease in future
periods due to refinance activity if market interest rates remain at or decrease
below current levels. Further, in the event of a change in interest rates,
prepayment and early withdrawal levels would likely deviate from those assumed
in the table. Also, the ability of many borrowers to repay their adjustable-rate
debt may decrease in the event of an increase in interest rates.
In
addition, the Bank uses interest sensitivity gap analysis to monitor the
relationship between the maturity and repricing of its interest-earning assets
and interest-bearing liabilities, while maintaining an acceptable interest rate
spread. Interest sensitivity gap is defined as the difference between the amount
of interest-earning assets maturing or repricing within a specific time period
and the amount of interest-bearing liabilities maturing or repricing within that
time period. A gap is considered positive when the amount of interest-sensitive
assets exceeds the amount of interest-sensitive liabilities, and is considered
negative when the amount of interest-sensitive liabilities exceeds the amount of
interest-sensitive assets. Generally, during a period of rising interest rates,
a negative gap would adversely affect net interest income, while a positive gap
would result in an increase in net interest income. Conversely, during a period
of falling interest rates, a negative gap would result in an increase in net
interest income, while a positive gap would negatively affect net interest
income. The Bank's goal is to maintain a reasonable balance between exposure to
interest rate fluctuations and earnings.
Rate/Volume
Analysis. Net interest income can also be analyzed in terms of
the impact of changing interest rates on average interest-earning assets and
average interest-bearing liabilities, and the changing volume or amount of these
assets and liabilities.
Table 3
below represents the extent to which changes in interest rates and changes in
the volume of average interest-earning assets and average interest-bearing
liabilities have affected the Company's interest income and interest expense
during the periods indicated. For each category of average
interest-earning asset and average interest-bearing liability, information is
provided on changes attributable to: (i) changes in volume (changes
in volume multiplied by old rate); (ii) changes in rate (change in rate
multiplied by old volume); (iii) changes in rate-volume (changes in rate
multiplied by the changes in volume); and (iv) net change (total of the previous
columns).
Analysis
of Net Interest Income. Net interest
income primarily represents the difference between income derived from
interest-earning assets and interest expense on interest-bearing
liabilities. Net interest income is affected by both the difference
between the yield on earning assets and the average cost of funds ("interest
rate spread"), and the relative volume of interest-earning assets,
interest-bearing liabilities and noninterest-bearing deposits.
Table 4
below sets forth certain information relating to the Company's Statements of
Financial Condition and Statements of Operations for the years ended December
31, 2009, 2008, and 2007, reflecting the yield on average earning assets and the
average cost of funds for the periods indicated. Average balances are
derived from month end balances. The Company does not believe that
using month end balances rather than average daily balances has caused any
material difference in the information presented.
The
decline in net interest income results primarily from the decline in market
interest rates and the decline in the volume of average earning
assets. The decline in market interest rates has been significantly
influenced by the Federal Reserve’s current policy of holding interest rates at
record low levels in efforts to stimulate current economic
conditions. The decline in the volume of earning assets has been
influenced by a slow down in loan originations due to the current recessionary
economic environment, and the current volume of nonperforming loans and other
real estate owned, as discussed below.
7
Table
3 - Rate/Volume Analysis
|
Year Ended December 31,
|
Year Ended December 31,
|
|||||||||||||||||||||||||||||||
|
2009 vs. 2008
|
2008 vs. 2007
|
|||||||||||||||||||||||||||||||
|
Increase (Decrease) Due to
|
Increase (Decrease) Due to
|
|||||||||||||||||||||||||||||||
|
(In
thousands)
|
||||||||||||||||||||||||||||||||
|
Rate/
|
Rate/
|
|||||||||||||||||||||||||||||||
|
Volume
|
Rate
|
Volume
|
Total
|
Volume
|
Rate
|
Volume
|
Total
|
|||||||||||||||||||||||||
|
Interest
income:
|
||||||||||||||||||||||||||||||||
|
Loans
receivable
|
$ | (3,650 | ) | $ | (6,769 | ) | $ | 448 | $ | (9,971 | ) | $ | (375 | ) | $ | (9,473 | ) | $ | 55 | $ | (9,793 | ) | ||||||||||
|
Investment
securities
|
(1,225 | ) | (239 | ) | 150 | (1,314 | ) | (331 | ) | (71 | ) | 10 | (392 | ) | ||||||||||||||||||
|
Mortgage-backed
securities
|
1,656 | (213 | ) | (189 | ) | 1,254 | (126 | ) | (67 | ) | 4 | (189 | ) | |||||||||||||||||||
|
Other
interest-earning assets
|
320 | (316 | ) | (277 | ) | (273 | ) | (53 | ) | (310 | ) | 23 | (340 | ) | ||||||||||||||||||
|
Total
earning assets
|
(2,899 | ) | (7,537 | ) | 132 | (10,304 | ) | (885 | ) | (9,921 | ) | 92 | (10,714 | ) | ||||||||||||||||||
|
Interest
expense:
|
||||||||||||||||||||||||||||||||
|
Deposits
|
(792 | ) | (6,072 | ) | 228 | (6,636 | ) | (1,353 | ) | (5,313 | ) | 261 | (6,405 | ) | ||||||||||||||||||
|
FHLB
advances
|
(137 | ) | (21 | ) | 2 | (156 | ) | 1,404 | (117 | ) | (357 | ) | 930 | |||||||||||||||||||
|
Other
interest-bearing liabilities
|
(186 | ) | (315 | ) | 70 | (431 | ) | 181 | (432 | ) | (68 | ) | (319 | ) | ||||||||||||||||||
|
Total
interest-bearing liabilities
|
(1,115 | ) | (6,408 | ) | 300 | (7,223 | ) | 232 | (5,862 | ) | (164 | ) | (5,794 | ) | ||||||||||||||||||
|
Change
in net interest income
|
$ | (1,784 | ) | $ | (1,129 | ) | $ | (168 | ) | $ | (3,081 | ) | $ | (1,117 | ) | $ | (4,059 | ) | $ | 256 | $ | (4,920 | ) | |||||||||
|
Year Ended December 31,
|
Year Ended December 31,
|
|||||||||||||||||||||||||||||||
|
2007 vs. 2006
|
2006 vs. 2005
|
|||||||||||||||||||||||||||||||
|
Increase (Decrease) Due to
|
Increase (Decrease) Due to
|
|||||||||||||||||||||||||||||||
|
(In
thousands)
|
||||||||||||||||||||||||||||||||
|
Rate/
|
Rate/
|
|||||||||||||||||||||||||||||||
|
Volume
|
Rate
|
Volume
|
Total
|
Volume
|
Rate
|
Volume
|
Total
|
|||||||||||||||||||||||||
|
Interest
income:
|
||||||||||||||||||||||||||||||||
|
Loans
receivable
|
$ | 609 | $ | 1,157 | $ | 11 | $ | 1,777 | $ | 4,544 | $ | 7,610 | $ | 687 | $ | 12,841 | ||||||||||||||||
|
Investment
securities
|
(51 | ) | (213 | ) | 4 | (260 | ) | 978 | (221 | ) | (111 | ) | 646 | |||||||||||||||||||
|
Mortgage-backed
securities
|
343 | (8 | ) | (2 | ) | 333 | 1,181 | 11 | 25 | 1,217 | ||||||||||||||||||||||
|
Other
interest-earning assets
|
452 | 8 | 16 | 476 | (202 | ) | 170 | (96 | ) | (128 | ) | |||||||||||||||||||||
|
Total
earning assets
|
1,353 | 944 | 29 | 2,326 | 6,501 | 7,570 | 505 | 14,576 | ||||||||||||||||||||||||
|
Interest
expense:
|
||||||||||||||||||||||||||||||||
|
Deposits
|
446 | 3,137 | 58 | 3,641 | 1,657 | 6,877 | 783 | 9,317 | ||||||||||||||||||||||||
|
FHLB
advances
|
(162 | ) | (27 | ) | 7 | (182 | ) | 192 | 127 | 201 | 520 | |||||||||||||||||||||
|
Other
interest-bearing liabilities
|
4 | 41 | 0 | 45 | 28 | 270 | 9 | 307 | ||||||||||||||||||||||||
|
Total
interest-bearing liabilities
|
288 | 3,151 | 65 | 3,504 | 1,877 | 7,274 | 993 | 10,144 | ||||||||||||||||||||||||
|
Change
in net interest income
|
$ | 1,065 | $ | (2,207 | ) | $ | (36 | ) | $ | (1,178 | ) | $ | 4,624 | $ | 296 | $ | (488 | ) | $ | 4,432 | ||||||||||||
8
Table
4 - Yield/Cost Analysis
|
Year
Ended December 31,
|
Year
Ended December 31,
|
Year
Ended December 31,
|
||||||||||||||||||||||||||||||||||
|
2009
|
2008
|
2007
|
||||||||||||||||||||||||||||||||||
|
(Dollars
in thousands)
|
||||||||||||||||||||||||||||||||||||
|
Average
|
Average
|
Average
|
||||||||||||||||||||||||||||||||||
|
Average
|
Yield/
|
Average
|
Yield/
|
Average
|
Yield/
|
|||||||||||||||||||||||||||||||
|
Balance
|
Interest
|
Cost
|
Balance
|
Interest
|
Cost
|
Balance
|
Interest
|
Cost
|
||||||||||||||||||||||||||||
|
Interest
earning assets:
|
||||||||||||||||||||||||||||||||||||
|
Loans
receivable
|
$ | 701,466 | $ | 45,211 | 6.45 | % | $ | 751,151 | $ | 55,182 | 7.35 | % | $ | 755,502 | $ | 64,975 | 8.60 | % | ||||||||||||||||||
|
Investment
securities
|
16,204 | 634 | 3.91 | 43,685 | 1,948 | 4.46 | 50,891 | 2,340 | 4.60 | |||||||||||||||||||||||||||
|
Mortgage-backed
securities
|
65,681 | 3,123 | 4.75 | 34,827 | 1,869 | 5.37 | 37,097 | 2,058 | 5.55 | |||||||||||||||||||||||||||
|
Other
interest-earning assets
|
17,548 | 92 | 0.52 | 9,348 | 365 | 3.90 | 10,102 | 705 | 6.98 | |||||||||||||||||||||||||||
|
Total
earning assets
|
800,899 | 49,060 | 6.13 | 839,011 | 59,364 | 7.08 | 853,592 | 70,078 | 8.21 | |||||||||||||||||||||||||||
|
Nonearning
assets
|
65,605 | 63,657 | 53,741 | |||||||||||||||||||||||||||||||||
|
Total
assets
|
$ | 866,504 | $ | 902,668 | $ | 907,333 | ||||||||||||||||||||||||||||||
|
Interest
bearing liabilities:
|
||||||||||||||||||||||||||||||||||||
|
Time
deposits
|
$ | 465,913 | 14,148 | 3.04 | $ | 479,642 | 19,447 | 4.05 | $ | 505,142 | 24,343 | 4.82 | ||||||||||||||||||||||||
|
Demand
deposits
|
132,226 | 264 | 0.20 | 147,978 | 1,587 | 1.07 | 157,125 | 3,129 | 1.99 | |||||||||||||||||||||||||||
|
Savings
|
24,921 | 47 | 0.19 | 19,734 | 61 | 0.31 | 18,584 | 28 | 0.15 | |||||||||||||||||||||||||||
|
FHLB
advances
|
41,154 | 1,233 | 3.00 | 45,654 | 1,389 | 3.04 | 11,246 | 459 | 4.08 | |||||||||||||||||||||||||||
|
Junior
subordinated debentures
|
10,310 | 390 | 3.78 | 10,310 | 658 | 6.38 | 10,310 | 839 | 8.14 | |||||||||||||||||||||||||||
|
Repurchase
agreements
|
4,775 | 12 | 0.25 | 9,105 | 175 | 1.92 | 6,472 | 313 | 4.84 | |||||||||||||||||||||||||||
|
Total
interest-bearing liabilities
|
679,299 | 16,094 | 2.37 | 712,423 | 23,317 | 3.27 | 708,879 | 29,111 | 4.11 | |||||||||||||||||||||||||||
|
Noninterest
bearing demand deposits
|
90,599 | 0 | 0.00 | 92,227 | 0 | 0.00 | 103,571 | 0 | 0.00 | |||||||||||||||||||||||||||
|
Total
sources of funds
|
769,898 | 16,094 | 2.09 | 804,650 | 23,317 | 2.90 | 812,450 | 29,111 | 3.58 | |||||||||||||||||||||||||||
|
Other
liabilities and stockholders'equity:
|
||||||||||||||||||||||||||||||||||||
|
Other
liabilities
|
8,477 | 10,323 | 11,275 | |||||||||||||||||||||||||||||||||
|
Stockholders'
equity
|
88,129 | 87,695 | 83,608 | |||||||||||||||||||||||||||||||||
|
Total
liabilities and stockholders' equity
|
$ | 866,504 | $ | 902,668 | $ | 907,333 | ||||||||||||||||||||||||||||||
|
Net
interest income
|
$ | 32,966 | $ | 36,047 | $ | 40,967 | ||||||||||||||||||||||||||||||
|
Interest
rate spread (1)
|
4.04 | % | 4.18 | % | 4.63 | % | ||||||||||||||||||||||||||||||
|
Net
yield on earning assets (2)
|
4.12 | % | 4.30 | % | 4.80 | % | ||||||||||||||||||||||||||||||
|
Ratio
of earning assets to interest bearing liabilities
|
117.90 | % | 117.77 | % | 120.41 | % | ||||||||||||||||||||||||||||||
|
(1)
|
Represents
the difference between the yield on earning assets and the average cost of
funds.
|
|
(2)
|
Represents
the net interest income divided by average earning
assets.
|
9
Results of
Operations
Comparison of Financial Condition at
December 31, 2009 and 2008. Total assets declined to
$829.9 million at December 31, 2009, from $875.9 million at December 31,
2008. Average earning assets declined to $800.9 million for the year
ended December 31, 2009, from $839.0 million for the year ended December 31,
2008, reflecting the net change in the volume and mix of loan and leases
receivable and investment securities. Earning assets were 91.8% of
total assets at December 31, 2009, compared to 92.3% at December 31,
2008.
Investment
and mortgage-backed securities increased to $97.6 million at December 31, 2009,
from $69.4 million at December 31, 2008. There were $20.0 million of
maturities of investment securities available for sale during fiscal 2009,
compared to $13.0 million during fiscal 2008. The Bank purchased $5.0
million of investment securities available for sale during fiscal 2009, compared
to no purchases in fiscal 2008. During fiscal 2009, the Bank sold $20.9 million
of investment securities available for sale, compared to none sold during fiscal
2008. Proceeds from investment maturities and sales are used in daily liquidity
management activities including funding borrowing maturities, deposit
withdrawals or are reinvested into new investment securities or short-term
interest bearing overnight funds. During fiscal 2009 the Bank
securitized $75.5 million of mortgage loans held for sale into mortgage-backed
securities, compared to $3.4 million securitized during fiscal 2008. Loan
securitizations help support a more balanced sensitivity to future interest rate
changes and provide additional funds for maintaining adequate liquidity
levels. The Bank sold no mortgage-backed securities available for
sale in fiscal 2009, compared to $4.0 million sold in fiscal 2008.
Loans and
lease receivables, net of allowance for loan and lease losses and deferred loan
fees, declined to $658.7 million at December 31, 2009 from $744.7 million at
December 31, 2008. The Bank originates both secured and unsecured
commercial and consumer loans and adjustable rate mortgage loans to take
advantage of shorter terms to maturity and the ability to better manage exposure
to market and interest rate risk due to changes in interest
rates. The Bank also sells selected mortgage loans in the secondary
mortgage market in order to reduce its exposure to interest rate and credit
risk, while retaining servicing to generate additional fee
income. Loans serviced for others increased to $289.3 million at
December 31, 2009 from $255.5 million serviced at December 31,
2008.
Commercial
loans declined to $521.2 million at December 31, 2009, from $597.0 million at
December 31, 2008, reflecting the current economic slow down and a reduction in
the volume of new loan originations. During 2009, certain commercial loans were
the subject of foreclosure and transferred to other real estate owned, as
discussed below. The Bank has severely restricted originating any new
acquisition and development loans, lot loans or land loans. The Bank
has restricted the origination of speculative construction loans, and has
limited most new construction lending to those with contracts or pre-sales
only. Consumer loans declined to $89.6 million at December 31, 2009
from $101.8 million at December 31, 2008; while lease receivables declined to
$9.8 million at December 31, 2009 from $11.6 million at December 31, 2008.
Commercial loan, consumer loan and lease receivables originations declined to
$99.2 million during fiscal 2009, compared to $280.3 million originated during
fiscal 2008.
Residential
mortgage loans increased to $53.0 million at December 31, 2009 from $47.0
million at December 31, 2008, reflecting the net effect of principal repayments,
originations, sales and securitizations. The Bank originated $133.6
million of held for sale residential mortgage loans during fiscal 2009, compared
to $48.9 million originated during fiscal 2008. The Bank also
originated $31.1 million of residential mortgage loans for investors during both
fiscal 2009 and 2008, respectively. The Bank sold $34.3 million of loans held
for sale during fiscal 2009, compared to $37.7 million sold during fiscal 2008.
Loan sales also helps reduce exposure to future interest rate changes, provides
funds for new loan originations and deposit withdrawals, and supports daily
liquidity management activities.
Nonperforming
loans, including restructured loans, declined to $10.2 million at December 31,
2009, from $15.0 million at December 31, 2008. The current level of
nonperforming and restructured loans, consisting primarily of residential and
commercial real estate loans, is attributable to the current economic
environment. Downward pressure has impacted the market values of housing and
other real estate, significantly impacting property values in the Bank’s market
area and credit quality of certain borrowers. Management believes it has
thoroughly evaluated all nonperforming and restructured loans and they are
either well collateralized or adequately reserved. However, there can be no
assurance in the future that regulators, increased credit risks in the loan
portfolio, further declines in economic conditions and other factors will not
require additional fair value adjustments to the nonperforming loans. As a
result of the volume of nonperforming loans, the Bank’s unrecognized interest
declined to $471,000 at December 31, 2009, from $624,000 at December 31,
2008. The ratio of non-performing loans to total loans was 1.5% at
December 31, 2009, compared to 2.0% at December 31, 2008.
10
Other
real estate owned increased to $10.6 million at December 31, 2009 from $7.7
million at December 31, 2008, reflecting foreclosures of certain real estate
properties, net of sales. Other real estate owned consists of
residential and commercial properties, developed building lots and a developed
residential subdivision. Based on fair value analysis, the Bank
believes the adjusted carrying values of these properties are representative of
their fair market values, although there can be no assurances that the ultimate
sales will be equal to or greater than the carrying values. The
Bank recorded $2.2 million of fair value adjustments to other real estate owned
in fiscal 2009, compared to $772,000 in fiscal 2008.
Goodwill
related to prior period acquisitions was $4.2 million at December 31, 2009 and
2008, respectively, and is not amortized according to provisions of financial
accounting standards. The unamortized balance of the Company’s
goodwill is tested for impairment annually. The Company has performed annual
impairment testing and determined there was no impairment of goodwill as of
December 31, 2009 or December 31, 2008.
Total
deposits declined to $688.5 million at December 31, 2009 from $716.4 million at
December 31, 2008. The Bank continues to compete in its market area
for lower costing core demand deposits. During 2009 and amid intense
competition, demand accounts increased to $224.5 million at December 31, 2009
from $223.4 million at December 31, 2008. Certificates of deposit
declined to $440.9 million at December 31, 2009 from $466.5 million at December
31, 2008. The Bank attempts to manage its cost of deposits by
monitoring the volume and rates paid on maturing certificates of deposits in
relationship to current funding needs and market interest
rates. During fiscal 2009, the Bank did not renew certain maturing
high rate time deposits and began repricing new and maturing time deposits at
lower rates. The Bank has also used lower costing FHLB borrowings as
a funding source, providing an effective means of managing its overall cost of
funds, as discussed below.
Total
borrowings declined to $47.7 million at December 31, 2009 from $62.9 million at
December 31, 2008. FHLB advances declined to $35.0 million at
December 31, 2009 from $45.0 million at December 31, 2008, as the Bank repaid
$10.0 million of fixed rate FHLB advances, which the Bank has used as a
long-term funding source. Junior subordinated debentures were $10.3
million at December 31, 2009 and 2008, respectively. Repurchase
agreements representing funds held in cash management accounts for commercial
banking customers declined to $2.4 million at December 31, 2009 from $7.6
million at December 31, 2008.
Stockholders'
equity declined to $86.2 million at December 31, 2009, from $87.8 million at
December 31, 2008, reflecting the net effect of annual earnings, dividend
payments, changes in accumulated other comprehensive income and a decline in the
volume of total assets. The Company’s equity to assets ratio
increased to 10.4% at December 31, 2009, from 10.0% at December 31,
2008. Accumulated other comprehensive income declined to $322,000 at
December 31, 2009, from $1.2 million at December 31, 2008, reflecting reduced
unrealized gains on available for sale securities, net of deferred income taxes,
primarily due to lower market interest rates.
The
Company declared a $0.20 per share quarterly cash dividend each quarter during
fiscal 2009 and 2008, totaling $0.80 per share per year,
respectively. These cash dividend payments reflect dividend payout
ratios on basic earnings of 111.1% for fiscal 2009 and 70.8% for fiscal
2008. Future quarterly dividends will be determined at the discretion
of the Board of Directors based upon earnings, the capital, liquidity and
financial condition of the Company, and general economic
conditions.
The
Company did not purchase any shares of its common stock during fiscal 2009,
compared to 140,241 shares purchased in fiscal 2008 through open market and
private purchases. Shares purchased are held as treasury stock, at
cost. Treasury shares were 1,511,926 totaling $32.2 million at
December 31, 2009, compared to 1,516,126 shares totaling $32.2 million at
December 31, 2008. Treasury shares are used for general corporate
purposes including the exercise of stock options and funding shares for
potential future stock splits. There were 4,200 shares issued on the
exercise of stock options during fiscal 2009, compared to 90,499 shares issued
during fiscal 2008. No shares were tendered to pay the exercise price
of stock options exercised during fiscal 2009, compared to 20,817 shares
tendered during fiscal 2008 to pay the exercise price and income taxes incident
to stock option exercises.
Comparison
of Operating Results for the Years Ended December 31, 2009 and
2008.
General. Net
income was $7.0 million for the year ended December 31, 2009, compared to $11.0
million for the year ended December 31, 2008. Diluted earnings per
share were $0.72 per share for the year ended December 31, 2009, compared to
$1.12 per share for the year ended December 31, 2008.
11
The
decline in net earnings during the year ended December 31, 2009 results
primarily from a reduction in net interest income which has been significantly
impacted by lower interest rates during the comparative reporting periods;
changes in the volume of earning and non-earning assets between the respective
reporting periods; the volume of provisions for credit losses required to
replenish net charge-offs and strengthen the allowance for credit losses; and
increased FDIC insurance premiums related to increased risk-based assessment
rates and an industry wide mandatory special assessment; while being partially
offset by a decline in the cost of funds and a consistent level of non-interest
income.
The Bank
continues to face challenges resulting from the impact of the current economy on
the housing and real estate markets. The Bank continues to monitor and evaluate
all significant loans in its portfolio, and will continue to manage its credit
risk exposure in anticipation of future stabilization of the real estate market.
Management believes competition and pricing pressures will continue on both
deposits and loans into 2010. The amount and timing of any future Federal
Reserve rate adjustment remain uncertain, and may further impact the Bank if
those adjustments are significant.
Key
performance ratios are return on average assets (ROA), return on average equity
(ROE), and efficiency. ROA was .8% for fiscal 2009, compared to 1.2% for fiscal
2008, and ROE was 8.0% for fiscal 2009, compared to 12.5% for fiscal 2008. The
efficiency ratio (noninterest expenses as a percentage of net interest income
plus noninterest income) was 57.6% for fiscal 2009, compared to 52.3% for fiscal
2008. The efficiency ratio measures the proportion of net operating revenues
that are absorbed by overhead expenses.
Interest Income. Interest
income declined to $49.1 million for fiscal 2009 from $59.4 million for fiscal
2008. The decline in interest income for fiscal 2009 was significantly impacted
by current economic conditions and by lower interest rates during fiscal 2009
and 2008. It was also influenced by the decline in the volume of average earning
assets attributable to a slow down of loan originations during the comparative
periods, and the volume of nonperforming loans and other real estate owned. The
average balance of interest-earning assets declined to $800.9 million for fiscal
2009, from $839.0 million for fiscal 2008. The yield on average interest-earning
assets declined to 6.1% for fiscal 2009 from 7.1% for fiscal 2008.
Interest Expense. Interest
expense declined to $16.1 million for fiscal 2009 from $23.3 million for fiscal
2008. The decline in interest expense reflects the decline in interest rates
previously discussed and a decline in the volume of average interest-bearing
liabilities. The average balance of interest-bearing liabilities declined to
$679.3 million for fiscal 2009, from $712.4 million for fiscal 2008. The average
balance of noninterest-bearing demand deposits declined to $90.6 million for
fiscal 2009 from $92.2 million for fiscal 2008. The average cost of funds,
including noninterest-bearing deposits, declined to 2.1% for fiscal 2009, from
2.9% for fiscal 2008, reflecting the lower interest rate environment during
these reporting periods, combined with management’s efforts to control the
Bank’s funding cost.
Net Interest Income. Net
interest income declined to $33.0 million for fiscal 2009, from $36.0 million
for fiscal 2008. The decline in net interest income during fiscal 2009 is
primarily attributable to lower market interest rates and the decline in earning
assets as previously discussed. The net yield on interest-earning assets (net
interest income divided by average interest-earning assets) was 4.1% for fiscal
2009, compared to 4.3% for fiscal 2008. The Bank's interest rate spread (the
difference between the effective yield on average interest-earning assets and
the effective average cost of funds) was 4.0% for fiscal 2009, compared to 4.2%
for fiscal 2008. See “Table 3 - Rate/Volume Analysis” and “Table 4 - Yield/Cost
Analysis” above for additional information on interest income, interest expense,
net interest income, average balances and yield/cost ratios.
Provision for Credit Losses.
During fiscal 2009, the Bank provided $7.2 million for credit losses, compared
to $4.0 million in fiscal 2008. These provisions were necessary to replenish net
charge-offs of $5.4 million and $2.0 million, respectively, during fiscal 2009
and 2008, and to bring the allowance for credit losses to an appropriate level
in light of the risk inherent in the loan and lease portfolio and provide
support to the current volume of nonperforming loans as previously
discussed.
Allowance for Credit Losses.
The Bank maintains general and specific allowances for loan and lease
losses and unfunded loan commitments (collectively the “allowance for credit
losses”) at levels it believes are appropriate in light of the risk inherent in
the loan and lease portfolio and in unfunded loan commitments. The Bank has
developed policies and procedures for assessing the adequacy of the allowance
for credit losses that reflect the assessment of credit risk and impairment
analysis. This assessment includes an analysis of qualitative and quantitative
trends in the levels of classified loans. In developing this analysis, the Bank
relies on estimates and exercises judgment in assessing credit risk. Future
assessments of credit risk may yield different results, depending on changes in
the qualitative and quantitative trends, which may require increases or
decreases in the allowance for credit losses.
12
The Bank
uses a variety of modeling and estimation tools for measuring credit risk and
performing impairment analysis, which is the basis used in developing the
allowance for credit losses. The Bank’s principal focus is on the adequacy of
the total allowance for credit losses. Based on the overall credit quality of
the loan and lease receivable portfolio, the Bank believes it has established
the allowance for credit losses pursuant to generally accepted accounting
principles, and has taken into account the views of its regulators and the
current economic environment. Management evaluates the information upon which it
bases the allowance for credit losses quarterly and believes their accounting
decisions remain accurate. However, there can be no assurance in the future that
regulators, increased risks in its loans and leases portfolio, changes in
economic conditions and other factors will not require additional adjustments to
the allowance for credit losses.
The
allowance for credit losses was $13.7 million at December 31, 2009, compared to
$12.0 million at December 31, 2008. The ratio of the allowance for credit losses
to total loans and leases was 2.0% at December 31, 2009, compared to 1.6% at
December 31, 2008, which the Bank believes is appropriate. See Note 1 and Note 4
of the “Notes to Consolidated Financial Statements” for additional information
about the allowance for credit losses.
Noninterest Income.
Noninterest income increased to $11.0 million for fiscal 2009, from $10.1
million for fiscal 2008. Other income consists of fees, service charges and
servicing fees earned on loans, service charges and insufficient funds fees
collected on deposit accounts, gains from loan and securities sales and other
miscellaneous income. The Bank continues to maintain a consistent level of other
income across both loan and deposit service offerings. Fees and service charges were
$7.4 million for fiscal 2009, compared to $7.8 million for fiscal 2008. Fees,
service charges earned and insufficient funds fees collected during the
respective periods are attributable to the volume of loan and deposit account
transactions and insufficient funds transactions processed during each period,
and the collection of related fees and service charges.
Gains
from mortgage loan sales increased to $1.2 million for fiscal 2009 from $587,000
for fiscal 2008. Proceeds from the sale of loans held for sale was $34.3 million
for fiscal 2009, compared to $37.7 million sold for fiscal 2008. The Bank sells
certain held for sale mortgage loans to reduce its exposure to interest rate and
credit risk, while retaining certain other held for sale mortgage loans for
future securitization into available for sale mortgage-backed securities. In
addition, the sale of mortgage loans also provides liquidity necessary to
support the Bank’s operating, financing and lending activities.
Servicing
fee income on loans serviced for others increased to $680,000 for fiscal 2009
from $658,000 for fiscal 2008. Loans serviced for others increased to $289.3
million at December 31, 2009 from $255.5 million at December 31, 2008. Gains
from the sale of investment securities held for sale was $918,000 for fiscal
2009, compared to none for fiscal 2008. The Bank sold $20.9 million of
investment securities available for sale during fiscal 2009, compared to none
sold during fiscal 2008. The Bank recorded losses from the sales of other real
estate owned of $201,000 for fiscal 2009, compared to $81,000 for fiscal 2008,
in its best efforts to convert these nonperforming assets into earning assets.
The Bank sold $10.5 million of other real estate owned during fiscal 2009,
compared to $3.9 sold during fiscal 2008.
Noninterest Expenses.
Noninterest expenses increased to $25.3 million for fiscal 2009 from $24.2
million in fiscal 2008. The largest single component of these expenses,
compensation and fringe benefits, increased to $14.1 million for fiscal 2009,
from $13.8 million in fiscal 2008. The Bank’s full-time equivalent employees
increased to 278 at December 31, 2009, from 273 at December 31, 2008. This
increase is due to converting a loan production office into a full service
branch office and the addition of key associates in the credit administration
support function.
FDIC
insurance premiums increased to $1.3 million for fiscal 2009, from $280,000 for
fiscal 2008, reflecting a mandatory $400,000 special assessment and increased
risk based assessment rates. In addition, one-time FDIC insurance assessment
credits received under the Federal Deposit Reform Act of 2005 were exhausted in
the quarter ended June 30, 2008.
Expenses
attributable to other real estate owned were $905,000 for fiscal 2009, compared
to $936,000 for fiscal 2008. Other noninterest expenses including premises and
equipment, advertising, data processing, repairs and maintenance, office
supplies, professional fees, taxes and insurance, etc., have remained relatively
flat during the respective periods.
Income Taxes. Income taxes
declined to $4.4 million for fiscal 2009, from $6.9 million for fiscal 2008. The
decline in income taxes is a direct result of the decline of pretax earnings to
$11.4 million for fiscal 2009 from $17.9 million for fiscal 2008. Changes in the
amount of income tax expense reflect changes in pretax income and expenses, the
application of permanent and temporary differences, and the income tax rates in
effect during each period. The effective income tax rate was 38.3% for fiscal
2009 and 38.7% for fiscal 2008.
13
Comparison
of Operating Results for the Years Ended December 31, 2008 and
2007.
General. Net income was $11.0
million for the year ended December 31, 2008, compared to $17.0 million for the
year ended December 31, 2007. Diluted earnings per share were $1.12 per share
for the year ended December 31, 2008 and $1.70 per share for the year ended
December 31, 2007. Return on average assets and return on average equity for
fiscal 2008 were 1.2% and 12.5%, respectively, compared to 1.9% and 20.3% for
fiscal 2007. The efficiency ratio was 52.3% for fiscal 2008, compared to 45.0%
for fiscal 2007.
Interest Income. Interest
income declined to $59.4 million for fiscal 2008 from $70.1 million for fiscal
2007. The decline in interest income during 2008 was significantly influenced by
the Federal Reserve’s 400 basis point rate cuts since December 2007. It was also
influenced by the decline in the volume of average earning assets attributable
to a slow down of loan originations in the current recessionary economy, and the
increased level of nonperforming loans and other real estate owned. The average
balance of interest-earning assets declined to $839.0 million for fiscal 2008,
from $853.6 million for fiscal 2007. The yield on average interest-earning
assets declined 7.1% for fiscal 2008 from 8.2% for fiscal 2007.
Interest Expense. Interest
expense declined to $23.3 million for fiscal 2008 from $29.1 million for fiscal
2007. The decline in interest expense also reflects the decline in interest
rates discussed above, and a decline in the volume of average interest-bearing
deposits, offset by an increase in the average volume of borrowings. The average
balance of interest-bearing liabilities increased to $712.4 million for fiscal
2008 from $708.9 million for fiscal 2007. The average balance of
noninterest-bearing demand deposits declined to $92.2 million for fiscal 2008
from $103.6 million for fiscal 2007. The average cost of funds, including
noninterest-bearing deposits, declined to 2.9% for 2008, from 3.6% for 2007,
reflecting the declining interest rate environment during fiscal 2008 and
management’s efforts to control the Bank’s funding cost.
Net Interest Income. Net
interest income declined to $36.0 million for fiscal 2008 from $41.0 million for
fiscal 2007. The decline in net interest income during 2008 is primarily
attributable to the decline in market interest rates also influenced by the
Federal Reserve’s 400 basis point rate cuts since December 2007, and the decline
in earning assets as previously discussed. The net yield on interest-earning
assets was 4.3% for fiscal 2008, compared to 4.8% for fiscal 2007. The Bank's
interest rate spread was 4.2% for fiscal 2008, compared to 4.6% for fiscal
2007.
Provision for Credit Losses.
The Bank provided $4.0 million for credit losses during fiscal 2008, compared to
$350,000 in fiscal 2007. These provisions were necessary to replenish net
charge-offs of $2.0 million and $383,000, respectively, during fiscal 2008 and
2007, and to maintain the allowance for credit losses to an appropriate level in
light of the risk inherent in the loan and lease portfolio, to support the
current volume of nonperforming loans as previously discussed and to support the
inherent risks associated with the growth of the commercial and consumer loan
and lease receivable portfolio in recent years.
The Bank
maintains both general and specific allowances for loan and lease losses and
unfunded loan commitments (collectively the “allowance for credit losses”) based
upon management's evaluation of risk in the loan and lease receivable portfolio
and past loss experience. The allowance for credit losses was $12.0 million at
December 31, 2008, compared to $9.9 million at December 31, 2007. The ratio of
the allowance for credit losses to total loans and leases was 1.6% at December
31, 2008, compared to 1.3% at December 31, 2007, which the Bank believes is
appropriate.
Nonperforming
loans were $10.7 million at December 31, 2008, compared to $7.6 million at
December 31, 2007. The increase in nonperforming loans consisted primarily of
residential and commercial real estate credits. Restructured loans were $4.3
million at December 31, 2008, compared to none at December 31, 2007. Due to the
volume of nonperforming loans, the Bank’s unrecognized interest increased to
$624,000 at December 31, 2008, from $506,000 at December 31, 2007. The ratio of
non-performing loans to total loans was 2.0% at December 31, 2008, compared to
1.0% at December 31, 2007.
Noninterest Income.
Noninterest income was $10.1 million for both fiscal 2008 and 2007,
respectively. During fiscal 2008 and 2007, the Bank maintained a consistent
level of noninterest income across loan and deposit service offerings. Fees and service charges
increased to $7.8 million for fiscal 2008 from $7.3 million for fiscal 2007.
Fees and service charges earned and collected during these periods is
attributable to the volume of loan and deposit account transactions processed
during each period, and the ultimate collection of related fees and service
charges. Servicing fee income on loans serviced for others increased to $658,000
for fiscal 2008 from $651,000 for fiscal 2007. Loans serviced for others
increased to $255.5 million at December 31, 2008 from $254.7 million at December
31, 2007.
Gains
from mortgage loan sales increased to $587,000 for fiscal 2008 from $519,000 for
fiscal 2007. Proceeds from the sale of loans held for sale was $37.7 million for
fiscal 2008, compared $35.4 million sold for fiscal 2007. Net proceeds from loan
sales provide additional liquidity necessary to support the Bank’s operating,
financing and lending activities.
14
Noninterest Expenses.
Noninterest expenses increased to $24.2 million for fiscal 2008 from $22.9
million in fiscal 2007. The largest single component of these expenses,
compensation and fringe benefits, declined to $13.8 million for fiscal 2008 from
$14.0 million for fiscal 2007. In managing its compensation expense, the Bank
has reduced its full-time equivalent employees to 273 at December 31, 2008 from
287 at December 31, 2007. Non-interest expense in fiscal 2008 also includes
$772,000 fair value adjustments on other real estate owned and increased FDIC
insurance premiums. One-time FDIC insurance assessment credits available from
the Federal Deposit Reform Act of 2005 were used through June 2008, resulting in
FDIC insurance premiums increasing to $280,000 for fiscal 2008 from $94,000 for
fiscal 2007.
Data
processing expense has grown proportionately with the number of loan and deposit
customer accounts and the volume of transaction activity they generate. Other
noninterest expenses including advertising, premises and equipment, payroll and
other taxes, repairs and maintenance, and office expenses remained relatively
constant during fiscal 2008 and 2007.
Income Taxes. Income taxes
declined to $6.9 million for fiscal 2008 from $10.8 million for fiscal 2007. The
decline in income taxes is a direct result of the decline of pretax earnings to
$17.9 million for fiscal 2008 from $27.8 million for fiscal 2007. Changes in the
amount of income tax expense reflect changes in pretax income and expenses, the
application of permanent and temporary differences, and the income tax rates in
effect during each period. The effective income tax rate was 38.7% for fiscal
2008 and 38.9% for fiscal 2007.
Forward Looking
Statements
This
Annual Report, including the Letter to Stockholders and Management's Discussion
and Analysis of Financial Condition and Results of Operation, contains forward
looking statements that involve risk and uncertainty. The Private Securities
Litigation Reform Act of 1995 states that the disclosure of forward looking
information is desirable for investors and encourages such disclosure by
providing a safe harbor for forward looking statements by corporate
management.
In order
to comply with the terms of the safe harbor, the Company notes that its actual
results and experience may differ materially from anticipated results or other
expectations expressed in the Company's forward looking statements. Words such
as “expects”, “believes”, “estimated”, “adequate”, “scheduled” or similar
expressions are intended to identify forward looking statements. These
statements are not guarantees of future performance and involve certain risks
and uncertainties that may affect the operations, performance, development,
growth projections and results of the Company's business. Therefore, actual
future results and trends may differ materially from what may be forecast in
forward looking statements due to a variety of factors, including, but not
limited to, regional and national economic conditions, changes in levels of
market interest rates, credit and other risks of lending and investing
activities, timely development of technology enhancements for product delivery,
services and pricing, the impact of competition, customer requirements,
regulatory changes and similar matters. The Company cautions readers of this
Annual Report to not place undue reliance on forward looking statements that are
subject to influence by these risk factors and unanticipated events that could
affect the Company’s financial performance and could cause actual results for
future periods to differ materially from those anticipated or
projected.
Impact of Inflation and
Changing Prices
The
consolidated financial statements of the Company and accompanying footnotes have
been prepared in accordance with generally accepted accounting principles. They
require the measurement of financial position and operating results in terms of
historical dollars without considering the change in the relative purchasing
power of money over time and due to inflation. The impact of inflation is
reflected in the increased cost of the Bank's operations. Unlike most industrial
companies, nearly all the assets and liabilities of the Bank are monetary. As a
result, interest rates have a greater impact on the Bank's performance than do
the effects of general levels of inflation. Interest rates do not necessarily
move in the same direction or to the same extent as the price of goods and
services.
Accounting Standards
Codification
In June
2009, the Financial Accounting Standards Board (the “FASB”) issued Statement of
Financial Accounting Standards No. 168 (“SFAS No. 168”), “The FASB Accounting
Standards Codification and the Hierarchy of Generally Accepted Accounting
Principles-a replacement of FASB Statement No. 162.” The FASB Accounting
Standards Codification will become the source of authoritative U.S. GAAP
recognized by the FASB to be applied to nongovernmental entities.
See Note
1 of the “Notes to Consolidated Financial Statements” for additional information
on the Accounting Standards Codification, the respective effective and adoption
dates and impact on the Company’s consolidated financial
statements.
15
Off-Balance Sheet
Arrangements
See Note
14 of the “Notes to Consolidated Financial Statements” for a description of
financial instruments with off-balance sheet risk to which the Bank is a party
in the normal course of business to meet the financing needs of its customers
and to reduce its own exposure to fluctuations in interest rates. These
financial instruments include commitments to extend credit and involve, to
varying degrees, elements of credit and interest rate risk in excess of the
amount recognized in the consolidated balance sheet.
Controls and
Procedures
As of
December 31, 2009, management of the Company performed an evaluation, under the
supervision and with the participation of its chief executive officer and chief
financial officer, of the effectiveness of the Company’s disclosure controls and
procedures. Based on this evaluation, the Company’s chief executive officer and
chief financial officer concluded to the best of their knowledge and belief that
the Company’s disclosure controls and procedures are effective in ensuring that
information required to be disclosed by the Company in reports that it files or
submits under the Securities Exchange Act of 1934, as amended, is recorded,
processed, summarized and reported within the time periods specified in the
Securities and Exchange Commission’s rules and forms. It should be noted that
the design of the Company’s disclosure controls and procedures is based in part
upon certain reasonable assumptions about the likelihood of future events, and
there can be no reasonable assurance that any design of disclosure controls and
procedures will succeed in achieving its stated goals under all potential future
conditions, regardless of how remote, but the Company’s chief executive and
chief financial officer have concluded to the best of their knowledge and belief
that the Company’s disclosure controls and procedures are, in fact, effective at
a reasonable assurance level.
In
addition, there have been no changes in the Company’s internal control over
financial reporting (to the extent that elements of internal control over
financial reporting are subsumed within disclosure controls and procedures)
identified in connection with the evaluation described above that occurred
during the Company’s last fiscal year, that has materially affected, or is
reasonably likely to materially affect, the Company’s internal control over
financial reporting.
16

REPORT OF INDEPENDENT
REGISTERED PUBLIC ACCOUNTING FIRM
To the
Board of Directors and the Stockholders
First
South Bancorp, Inc.
Washington,
North Carolina
We have
audited the accompanying consolidated statements of financial condition of First
South Bancorp, Inc. and Subsidiary as of December 31, 2009 and 2008, and the
related consolidated statements of operations, changes in stockholders' equity,
and cash flows for each of the years in the three-year period ended December 31,
2009. First South Bancorp, Inc. and Subsidiary’s management is responsible for
these consolidated financial statements. Our responsibility is to express an
opinion on these consolidated financial statements based on our
audits.
We
conducted our audits in accordance with the standards of the Public Company
Accounting Oversight Board (United States). Those standards require that we plan
and perform the audit to obtain reasonable assurance about whether the financial
statements are free of material misstatement. An audit includes examining, on a
test basis, evidence supporting the amounts and disclosures in the financial
statements. An audit also includes assessing the accounting principles used and
significant estimates made by management, as well as evaluating the overall
financial statement presentation. We believe that our audits provide a
reasonable basis for our opinion.
In our
opinion, the consolidated financial statements referred to above present fairly,
in all material respects, the financial position of First South Bancorp, Inc.
and Subsidiary at December 31, 2009 and 2008 and the results of their
operations, and their cash flows each of the years in the three-year period
ended December 31, 2009 in conformity with accounting principles generally
accepted in the United States of America.
We also
have audited, in accordance with the standards of the Public Company Accounting
Oversight Board (United States), First South Bancorp, Inc. and Subsidiary's
internal control over financial reporting as of December 31, 2009, based on
criteria established in Internal Control - Integrated
Framework issued by the Committee of Sponsoring Organizations of the
Treadway Commission (COSO), and our report dated March 8, 2010 expressed an
unqualified opinion.
/s/
Turlington and Company, L.L.P.
Lexington,
North Carolina
March 8,
2010
509
East Center Street – Post Office
Box 1697 – Lexington,
North Carolina 27293-1697
Office:
336-249-6856 – Facsimile:
336-248-8697
1338
Westgate Center Drive – Winston-Salem,
North Carolina 27103
Office:
336-765-2410 – Facsimile:
336-765-6241
www.turlingtonandcompany.com
17
FIRST
SOUTH BANCORP, INC. AND SUBSIDIARY
CONSOLIDATED
STATEMENTS OF FINANCIAL CONDITION
December
31, 2009 and 2008
|
2009
|
2008
|
|||||||
|
ASSETS
|
||||||||
|
Cash
and due from banks
|
$ | 17,758,370 | $ | 20,888,676 | ||||
|
Interest-bearing
deposits in financial institutions
|
11,879,794 | 5,831,683 | ||||||
|
Investment
securities - available for sale
|
407,317 | 36,563,646 | ||||||
|
Mortgage-backed
securities - available for sale
|
96,725,468 | 31,995,157 | ||||||
|
Mortgage-backed
securities - held for investment
|
513,882 | 832,221 | ||||||
|
Loans
receivable, net
|
||||||||
|
Held
for sale
|
6,548,980 | 5,566,262 | ||||||
|
Held
for investment
|
652,106,538 | 739,165,035 | ||||||
|
Premises
and equipment, net
|
8,539,759 | 9,049,929 | ||||||
|
Real
estate owned
|
10,561,071 | 7,710,560 | ||||||
|
Federal
Home Loan Bank of Atlanta stock, at cost
|
||||||||
|
which
approximates market
|
3,889,500 | 3,658,600 | ||||||
|
Accrued
interest receivable
|
3,318,141 | 3,786,760 | ||||||
|
Goodwill
|
4,218,576 | 4,218,576 | ||||||
|
Mortgage
servicing rights
|
1,278,688 | 1,005,725 | ||||||
|
Identifiable
intangible assets
|
133,620 | 165,060 | ||||||
|
Income
tax receivable
|
1,831,598 | 1,679,191 | ||||||
|
Prepaid
expenses and other assets
|
10,179,333 | 3,738,040 | ||||||
|
Total
assets
|
$ | 829,890,635 | $ | 875,855,121 | ||||
|
LIABILITIES
AND STOCKHOLDERS' EQUITY
|
||||||||
|
Deposits:
|
||||||||
|
Demand
|
$ | 224,507,362 | $ | 223,365,542 | ||||
|
Savings
|
23,137,391 | 26,555,881 | ||||||
|
Large
denomination certificates of deposit
|
224,198,974 | 207,102,876 | ||||||
|
Other
time
|
216,667,331 | 259,402,497 | ||||||
|
Total
deposits
|
688,511,058 | 716,426,796 | ||||||
|
Borrowed
money
|
37,380,388 | 52,558,492 | ||||||
|
Junior
subordinated debentures
|
10,310,000 | 10,310,000 | ||||||
|
Other
liabilities
|
7,475,085 | 8,738,808 | ||||||
|
Total
liabilities
|
743,676,531 | 788,034,096 | ||||||
|
Commitments
and contingencies (Note 14)
|
||||||||
|
Common
stock, $.01 par value, 25,000,000 shares authorized,
|
||||||||
|
11,254,222
issued; 9,742,296 and 9,738,096
|
||||||||
|
shares
outstanding, respectively
|
97,423 | 97,381 | ||||||
|
Additional
paid-in capital
|
35,841,364 | 35,924,426 | ||||||
|
Retained
earnings, substantially restricted
|
82,111,114 | 82,867,095 | ||||||
|
Treasury
stock at cost
|
(32,158,074 | ) | (32,247,365 | ) | ||||
|
Accumulated
other comprehensive income, net
|
322,277 | 1,179,488 | ||||||
|
Total
stockholders' equity
|
86,214,104 | 87,821,025 | ||||||
|
Total
liabilities and stockholders' equity
|
$ | 829,890,635 | $ | 875,855,121 | ||||
18
FIRST
SOUTH BANCORP, INC. AND SUBSIDIARY
CONSOLIDATED
STATEMENTS OF OPERATIONS
Years
Ended December 31, 2009, 2008 and 2007
|
2009
|
2008
|
2007
|
||||||||||
|
Interest
income
|
||||||||||||
|
Interest
and fees on loans
|
$ | 45,211,260 | $ | 55,182,193 | $ | 64,975,487 | ||||||
|
Interest
and dividends on investments and
deposits
|
3,848,639 | 4,181,602 | 5,102,761 | |||||||||
|
Total
interest income
|
49,059,899 | 59,363,795 | 70,078,248 | |||||||||
|
Interest
expense
|
||||||||||||
|
Interest
on deposits
|
14,459,345 | 21,095,044 | 27,499,996 | |||||||||
|
Interest
on borrowings
|
1,244,664 | 1,563,978 | 771,976 | |||||||||
|
Interest
on junior subordinated debentures
|
389,677 | 657,576 | 839,110 | |||||||||
|
Total
interest expense
|
16,093,686 | 23,316,598 | 29,111,082 | |||||||||
|
Net
interest income before provision for credit losses
|
32,966,213 | 36,047,197 | 40,967,166 | |||||||||
|
Provision
for credit losses
|
7,180,000 | 4,043,600 | 350,000 | |||||||||
|
Net
interest income
|
25,786,213 | 32,003,597 | 40,617,166 | |||||||||
|
Other
income
|
||||||||||||
|
Fees
and service charges
|
7,377,019 | 7,750,195 | 7,341,240 | |||||||||
|
Loan
servicing fees
|
679,673 | 658,073 | 651,358 | |||||||||
|
Gain
(loss) on sale of real estate, net
|
(200,732 | ) | (80,542 | ) | 49,644 | |||||||
|
Gain
on sale of mortgage loans
|
1,197,029 | 586,571 | 519,361 | |||||||||
|
Gain
on sale of mortgage-backed securities
|
- | 97,537 | - | |||||||||
|
Gain
on sale of investment securities
|
917,866 | - | - | |||||||||
|
Other
income
|
988,865 | 1,071,726 | 1,575,171 | |||||||||
|
Total
other income
|
10,959,720 | 10,083,560 | 10,136,774 | |||||||||
|
General
and administrative expenses
|
||||||||||||
|
Compensation
and fringe benefits
|
14,118,842 | 13,750,085 | 13,973,012 | |||||||||
|
Federal
insurance premiums
|
1,253,627 | 280,372 | 94,349 | |||||||||
|
Premises
and equipment
|
1,823,628 | 1,969,006 | 1,938,555 | |||||||||
|
Advertising
|
123,513 | 112,758 | 125,490 | |||||||||
|
Payroll
and other taxes
|
1,327,449 | 1,246,743 | 1,308,248 | |||||||||
|
Data
processing
|
2,452,593 | 2,630,821 | 2,524,983 | |||||||||
|
Amortization
of intangible assets
|
488,602 | 434,260 | 394,508 | |||||||||
|
Other
|
3,756,547 | 3,740,652 | 2,551,831 | |||||||||
|
Total
general and administrative expenses
|
25,344,801 | 24,164,697 | 22,910,976 | |||||||||
|
Income
before income taxes
|
11,401,132 | 17,922,460 | 27,842,964 | |||||||||
|
Income
taxes
|
4,365,296 | 6,934,640 | 10,839,737 | |||||||||
|
NET
INCOME
|
7,035,836 | 10,987,820 | 17,003,227 | |||||||||
|
Other
comprehensive income (loss), net of taxes
|
(857,211 | ) | 802,984 | 955,829 | ||||||||
|
Comprehensive
income
|
$ | 6,178,625 | $ | 11,790,804 | $ | 17,959,056 | ||||||
|
Net
income per common share
|
||||||||||||
|
Basic
|
$ | 0.72 | $ | 1.13 | $ | 1.71 | ||||||
|
Diluted
|
$ | 0.72 | $ | 1.12 | $ | 1.70 | ||||||
The
accompanying notes are an integral part of these consolidated financial
statements.
19
FIRST
SOUTH BANCORP, INC. AND SUBSIDIARY
CONSOLIDATED
STATEMENTS OF CHANGES IN STOCKHOLDERS’ EQUITY
Years
Ended December 31, 2009, 2008 and 2007
|
Common
stock
|
Additional
paid-in
capital
|
Retained
earnings,
substantially
restricted
|
Treasury
stock
|
Accumulated
other
comprehensive
income
(loss), net
|
Total
|
|||||||||||||||||||
|
Balance,
December 31, 2006
|
$ | 97,881 | $ | 38,165,536 | $ | 70,217,380 | $ | (29,104,894 | ) | $ | (579,325 | ) | $ | 78,796,578 | ||||||||||
|
Net
income
|
- | - | 17,003,227 | - | - | 17,003,227 | ||||||||||||||||||
|
Other
comprehensive income, net
|
- | - | - | - | 955,829 | 955,829 | ||||||||||||||||||
|
Exercise
of stock options
|
3,031 | (4,740,120 | ) | - | 6,093,153 | - | 1,356,064 | |||||||||||||||||
|
Tax
benefit, stock options exercised
|
- | 2,430,435 | - | - | - | 2,430,435 | ||||||||||||||||||
|
Shares
traded to exercise options
|
(383 | ) | 822,209 | - | (1,148,545 | ) | - | (326,719 | ) | |||||||||||||||
|
Acquisition
of treasury shares
|
(2,442 | ) | - | - | (6,719,834 | ) | - | (6,722,276 | ) | |||||||||||||||
|
Stock
based compensation
|
- | 83,764 | - | - | - | 83,764 | ||||||||||||||||||
|
Dividends
($.76 per share)
|
- | - | (7,541,580 | ) | - | - | (7,541,580 | ) | ||||||||||||||||
|
Balance,
December 31, 2007
|
98,087 | 36,761,824 | 79,679,027 | (30,880,120 | ) | 376,504 | 86,035,322 | |||||||||||||||||
|
Net
income
|
- | - | 10,987,820 | - | - | 10,987,820 | ||||||||||||||||||
|
Other
comprehensive income, net
|
- | - | - | - | 802,984 | 802,984 | ||||||||||||||||||
|
Exercise
of stock options
|
905 | (1,682,353 | ) | - | 1,926,743 | - | 245,295 | |||||||||||||||||
|
Tax
benefit, stock options exercised
|
- | 452,317 | - | - | - | 452,317 | ||||||||||||||||||
|
Shares
traded to exercise options
|
(208 | ) | 355,505 | - | (449,979 | ) | - | (94,682 | ) | |||||||||||||||
|
Acquisition
of treasury shares
|
(1,403 | ) | - | - | (2,844,009 | ) | - | (2,845,412 | ) | |||||||||||||||
|
Stock
based compensation
|
- | 37,133 | - | - | - | 37,133 | ||||||||||||||||||
|
Dividends
($.80 per share)
|
- | - | (7,799,752 | ) | - | - | (7,799,752 | ) | ||||||||||||||||
|
Balance,
December 31, 2008
|
97,381 | 35,924,426 | 82,867,095 | (32,247,365 | ) | 1,179,488 | 87,821,025 | |||||||||||||||||
|
Net
income
|
- | - | 7,035,836 | - | - | 7,035,836 | ||||||||||||||||||
|
Other
comprehensive loss, net
|
- | - | - | - | (857,211 | ) | (857,211 | ) | ||||||||||||||||
|
Exercise
of stock options
|
42 | (62,804 | ) | - | 89,291 | - | 26,529 | |||||||||||||||||
|
Tax
benefit, stock options exercised
|
- | 4,482 | - | - | - | 4,482 | ||||||||||||||||||
|
Shares
traded to exercise options
|
- | - | - | - | - | - | ||||||||||||||||||
|
Acquisition
of treasury shares
|
- | - | - | - | - | - | ||||||||||||||||||
|
Stock
based compensation
|
- | (24,740 | ) | - | - | - | (24,740 | ) | ||||||||||||||||
|
Dividends
($.80 per share)
|
- | - | (7,791,817 | ) | - | - | (7,791,817 | ) | ||||||||||||||||
|
Balance,
December 31, 2009
|
$ | 97,423 | $ | 35,841,364 | $ | 82,111,114 | $ | (32,158,074 | ) | $ | 322,277 | $ | 86,214,104 | |||||||||||
The
accompanying notes are an integral part of these consolidated financial
statements.
20
FIRST SOUTH BANCORP, INC. AND
SUBSIDIARY
CONSOLIDATED
STATEMENTS OF CASH FLOWS
Years
Ended December 31, 2009, 2008 and 2007
|
2009
|
2008
|
2007
|
||||||||||
|
Net
income
|
$ | 7,035,836 | $ | 10,987,820 | $ | 17,003,227 | ||||||
|
Adjustments
to reconcile net income to net
|
||||||||||||
|
cash
provided by (used in) operating activities
|
||||||||||||
|
Provision
for credit losses
|
7,180,000 | 4,043,600 | 350,000 | |||||||||
|
Depreciation
|
818,398 | 879,832 | 813,510 | |||||||||
|
Amortization
of intangibles
|
488,602 | 434,260 | 394,508 | |||||||||
|
Accretion
of discounts on securities, net
|
(63,241 | ) | 7,383 | (12,849 | ) | |||||||
|
Deferred
income taxes
|
(1,298,149 | ) | (862,742 | ) | (438,860 | ) | ||||||
|
(Gain)
loss on disposal of premises and equipment
|
(5,566 | ) | 1,540 | (157,247 | ) | |||||||
|
(Gain)
loss on sale of other real estate owned
|
200,732 | 80,542 | (49,644 | ) | ||||||||
|
Gain
on loans held for sale and mortgage-
|
||||||||||||
|
backed
securities
|
(1,197,029 | ) | (684,108 | ) | (519,361 | ) | ||||||
|
Gain
on sale of investment securities available for sale
|
(917,866 | ) | - | - | ||||||||
|
Stock
based compensation (income) expense
|
(24,740 | ) | 37,133 | 83,764 | ||||||||
|
Originations
of loans held for sale, net
|
(109,618,929 | ) | (38,549,148 | ) | (23,668,607 | ) | ||||||
|
Proceeds
from sale of loans held for sale
|
34,347,308 | 37,686,012 | 35,374,932 | |||||||||
|
Other
operating activities
|
(4,018,215 | ) | 3,011,045 | (459,284 | ) | |||||||
|
Net
cash provided by (used in) operating activities
|
(67,072,859 | ) | 17,073,169 | 28,714,089 | ||||||||
|
Investing
activities:
|
||||||||||||
|
Proceeds
from maturities of investment securities
|
||||||||||||
|
available
for sale
|
20,000,000 | 13,000,000 | 9,000,000 | |||||||||
|
Proceeds
from sale of investment securities available for sale
|
20,917,866 | - | - | |||||||||
|
Purchases
of investment securities available for sale
|
(5,000,000 | ) | - | (500,000 | ) | |||||||
|
Proceeds
from principal repayments and sales of
|
||||||||||||
|
mortgage-backed
securities available for sale
|
10,558,314 | 10,155,010 | 4,579,831 | |||||||||
|
Proceeds
from principal repayments of
|
||||||||||||
|
mortgage-backed
securities held for investment
|
318,339 | 459,541 | 370,778 | |||||||||
|
Originations
of loans held for investment, net
|
||||||||||||
|
of
principal repayments
|
64,040,224 | 3,476,254 | (23,651,034 | ) | ||||||||
|
Proceeds
from disposal of premises and equipment
|
11,813 | - | 515,843 | |||||||||
|
Proceeds
from disposal of other real estate owned
|
10,543,291 | 3,883,475 | 676,965 | |||||||||
|
Purchases
of FHLB stock
|
(230,900 | ) | (448,500 | ) | (1,276,800 | ) | ||||||
|
Purchases
of premises and equipment
|
(314,475 | ) | (497,902 | ) | (1,707,363 | ) | ||||||
|
Net
cash provided by (used in) investing activities
|
120,844,472 | 30,027,878 | (11,991,780 | ) | ||||||||
|
Financing
activities:
|
||||||||||||
|
Net
decrease in deposit accounts
|
(27,915,738 | ) | (44,942,787 | ) | (38,818,898 | ) | ||||||
|
Net
increase (decrease) in FHLB borrowings
|
(10,000,000 | ) | 10,000,000 | 29,000,000 | ||||||||
|
Purchase
of treasury shares
|
- | (2,845,412 | ) | (6,722,276 | ) | |||||||
|
Proceeds
from exercise of stock options, net of tax benefit
|
31,011 | 602,930 | 3,459,780 | |||||||||
|
Cash
paid for dividends
|
(7,790,977 | ) | (7,715,777 | ) | (7,342,722 | ) | ||||||
|
Net
change in repurchase agreements
|
(5,178,104 | ) | 491,071 | 1,927,474 | ||||||||
|
Net
cash used in financing activities
|
(50,853,808 | ) | (44,409,975 | ) | (18,496,642 | ) | ||||||
|
Increase
(decrease) in cash and cash equivalents
|
2,917,805 | 2,691,072 | (1,774,333 | ) | ||||||||
|
Cash
and cash equivalents, beginning of year
|
26,720,359 | 24,029,287 | 25,803,620 | |||||||||
|
Cash
and cash equivalents, end of year
|
$ | 29,638,164 | $ | 26,720,359 | $ | 24,029,287 | ||||||
The
accompanying notes are an integral part of these consolidated financial
statements.
21
FIRST
SOUTH BANCORP, INC. AND SUBSIDIARY
NOTES
TO CONSOLIDATED FINANCIAL STATEMENTS
As
of And For The Years Ended December 31, 2009, 2008 and 2007
1.
BASIS OF PRESENTATION AND ACCOUNTING POLICIES
ORGANIZATION
AND NATURE OF OPERATIONS
First
South Bancorp, Inc. (the "Company") is a bank holding company incorporated under
the laws of the Commonwealth of Virginia. First South Bank (the "Bank"), the
wholly owned subsidiary of the Company, is organized and incorporated under the
laws of the State of North Carolina. The Federal Reserve Board regulates the
Company and the Federal Deposit Insurance Corporation and the North Carolina
Office of the Commissioner of Banks regulate the Bank.
The
consolidated financial statements include the accounts of the Company, the Bank,
and the Bank's wholly owned subsidiary, First South Leasing, LLC. All
significant intercompany balances and transactions have been eliminated in
consolidation.
The
Company follows accounting principles generally accepted in the United States of
America and general practices within the financial services industry as
summarized below:
USE
OF ESTIMATES
The
preparation of consolidated financial statements in conformity with accounting
principles generally accepted in the United States of America requires
management to make estimates and assumptions that affect the reported amounts of
assets and liabilities and disclosure of contingent assets and liabilities at
the date of the consolidated financial statements and the reported amounts of
revenues and expenses during the reporting period. Actual results could differ
from those estimates.
CASH
AND CASH EQUIVALENTS
Cash and
cash equivalents include highly liquid assets such as cash on hand, non-interest
bearing deposits and amounts in clearing accounts due from correspondent banks
and clearing balances required to be maintained with the Federal
Reserve. At times, the Bank places deposits with high credit quality
financial institutions in amounts which may be in excess of federally insured
limits.
INVESTMENTS
AND MORTGAGE-BACKED SECURITIES
Investments
in certain securities are classified into three categories and accounted for as
follows: (1) debt securities that the entity has the positive intent and the
ability to hold to maturity are classified as held for investment (“HFI”) and
reported at amortized cost; (2) debt and equity securities that are bought and
held principally for the purpose of selling them in the near term are classified
as trading securities and reported at fair value, with unrealized gains and
losses included in earnings; (3) debt and equity securities not classified as
either held for investment securities or trading securities are classified as
available for sale (“AFS”) securities and reported at fair value, with
unrealized gains and losses excluded from earnings and reported as accumulated
other comprehensive income, a separate component of equity.
A decline
in the market value of any AFS or HFI security below cost that is deemed to be
other-than-temporary results in a reduction in carrying amount to fair value.
The impairment is charged to earnings and a new cost basis for the security is
established. To determine whether an impairment is other-than-temporary, the
Company considers whether it has the ability and intent to hold the investment
until a market price recovery and considers whether evidence indicating the cost
of the investment is recoverable outweighs evidence to the contrary. Evidence
considered in this assessment includes the reasons for the impairment, the
severity and duration of the impairment, changes in value subsequent to
year-end, and forecasted performance of the investee.
Premiums
and discounts on debt securities are recognized as adjustments to interest
income using the interest method over the period to maturity. Gains
and losses on the sale of securities are determined using the specific
identification method. Mortgage-backed securities represent participating
interests in pools of long-term first mortgage loans. Premiums and discounts are
amortized using the interest method over the remaining period to contractual
maturity, adjusted for anticipated prepayments.
22
1.
BASIS OF PRESENTATION AND ACCOUNTING POLICIES (Continued)
LOANS
RECEIVABLE AND ALLOWANCE FOR CREDIT LOSSES
Loans
receivable held for investment are stated at the amount of unpaid principal,
reduced by an allowance for probable credit losses and net of deferred
origination fees. Interest on loans is accrued based on the principal amount
outstanding and is recognized using the interest method.
Loan
origination fees, as well as certain direct loan origination costs, are
deferred. Such costs and fees are recognized as an adjustment to yield over the
contractual lives of the related loans.
Commitment
fees to originate or purchase loans are deferred and, if the commitment is
exercised, recognized over the life of the loan as an adjustment of yield. If
the commitment expires unexercised, commitment fees are recognized in income
upon expiration of the commitment. Fees for originating loans for other
financial institutions are recognized as loan fee income.
A loan is
considered impaired, based on current information and events, if it is probable
that the Bank will be unable to collect the scheduled payments of principal or
interest when due according to the contractual terms of the loan agreement.
Uncollateralized loans are measured for impairment based on the present value of
expected future cash flows discounted at the historical effective interest rate,
while all collateral-dependent loans are measured for impairment based on the
fair value of the collateral. The Bank uses several factors in determining if a
loan is impaired. Internal asset classification procedures include a thorough
review of significant loans and lending relationships and include the
accumulation of related data. This data includes loan payment status, borrowers'
financial data and borrowers' operating factors such as cash flows, operating
income or loss, etc.
There
were $23.0 million of loans classified as impaired at December 31, 2009. The
allowance for loan losses included $5.1 million specifically provided for these
impaired loans as of December 31, 2009. Average impaired loans were
$15.6 million for the year ended December 31, 2009. Interest income recognized
on impaired loans for the year ended December 31, 2009 was $804,000. At December
31, 2008, there were $8.2 million of loans individually or in the aggregate,
that were material to the consolidated financial statements which were defined
as impaired.
The
allowance for credit losses is increased by charges to income and decreased by
charge-offs (net of recoveries). Management's periodic evaluation of the
adequacy of the allowance is based on the Bank's past loan loss experience,
known and inherent risks in the portfolio, adverse situations that may affect
the borrower's ability to repay, the estimated value of any underlying
collateral, and current economic conditions. While management believes that it
has established the allowance in accordance with accounting principles generally
accepted in the United States of America and has taken into account the views of
its regulators and the current economic environment, there can be no assurance
that in the future the Bank's regulators or risks in its portfolio will not
require further increases in the allowance.
LOANS
HELD FOR SALE
Loans
originated and intended for sale are carried at the lower of cost or aggregate
estimated market value. Net unrealized losses are recognized as charges to
income. Gains and losses on sales of whole or participating interests in real
estate loans are recognized at the time of sale and are determined by the
difference between net sales proceeds and the Bank's carrying value of the loans
sold, adjusted for the recognition of any servicing assets
retained.
As a part
of its normal business operations, the Bank originates mortgage loans that have
been approved by secondary investors. The Bank issues a rate lock commitment to
a borrower and concurrently “locks-in” with a secondary market investor, under a
best efforts delivery mechanism. The terms of the loan are set by the secondary
investors and are transferred within a short time period of the Bank initially
funding the loan. The Bank receives origination fees from borrowers
and servicing release premiums from investors that are recognized when the loan
is sold on the Statement of Operations in the line item “Gain on sale of
mortgage loans”. Between the initial funding of the loans by the Bank
and subsequent purchase by the investor, the Bank carries the loans on its
Statement of Financial Condition at the lower of cost or fair market
value.
23
1.
BASIS OF PRESENTATION AND ACCOUNTING POLICIES (Continued)
INCOME
RECOGNITION ON IMPAIRED AND NONACCRUAL LOANS
Loans,
including impaired loans, are generally classified as nonaccrual if they are
past due as to maturity or payment of principal or interest for a period of more
than 90 days, unless such loans are well-secured and in the process of
collection. If a loan or a portion of a loan is classified as doubtful or is
partially charged off, the loan is generally classified as nonaccrual. Loans
that are on a current payment status or past due less than 90 days may also be
classified as nonaccrual if repayment in full of principal and/or interest is in
doubt.
Loans may
be returned to accrual status when all principal and interest amounts
contractually due (including arrearages) are reasonably assured of repayment
within an acceptable period of time, and there is a sustained period of
repayment performance (generally a minimum of six months) by the borrower, in
accordance with the contractual terms of interest and principal.
While a
loan is classified as nonaccrual and the future collectibility of the recorded
loan balance is doubtful, collections of interest and principal are generally
applied as a reduction to principal outstanding, except in the case of loans
with scheduled amortization where the payment is generally applied to the oldest
payment due. When the future collectibility of the recorded loan balance is
expected, interest income may be recognized on a cash basis limited to that
which would have been recognized on the recorded loan balance at the contractual
interest rate. Receipts in excess of that amount are recorded as recoveries to
the allowance for credit losses until prior charge-offs have been fully
recovered.
MORTGAGE
SERVICING RIGHTS
When
mortgage loans, or mortgage-backed securities, are sold, the proceeds are
allocated between the related loans and the retained mortgage servicing rights
based on their relative fair values.
Servicing
assets and liabilities are amortized on a straight line basis over the average
period of estimated net servicing income (if servicing revenues exceed servicing
costs) or net servicing loss (if servicing costs exceed servicing revenues). All
servicing assets or liabilities are assessed for impairment or increased
obligation based on their fair value.
The
Company recorded amortization of mortgage servicing rights of $457,162, $402,820
and $363,068 for prepayments during the years ended December 31, 2009, 2008 and
2007, respectively. There were no impairments recognized during the years ended
December 31, 2009, 2008 and 2007.
PREMISES
AND EQUIPMENT
Premises
and equipment are stated at cost less accumulated depreciation or amortization,
if a capital lease. Depreciation and amortization are computed using the
straight-line method based on the estimated service lives of the assets. Useful
lives range from 10 to 40 years for substantially all premises and from 3 to 20
years for equipment and fixtures.
REAL
ESTATE OWNED
Assets
acquired through loan foreclosure are recorded as real estate owned at the lower
of the estimated fair value of the property less estimated costs to sell at the
date of foreclosure or the carrying amount of the loan plus unpaid accrued
interest. The carrying amount is subsequently reduced by additional allowances
which are charged to earnings if the estimated fair value declines below its
initial value plus any capitalized costs. Costs related to the improvement of
the property are capitalized, whereas costs related to holding the property are
expensed. Valuation adjustments recognized during the years ended December 31,
2009, 2008 and 2007 were $2.2 million, $772,000 and $0,
respectively.
INVESTMENT
IN FEDERAL HOME LOAN BANK STOCK
The Bank
is required to invest in Class B capital stock, par value $100, of the Federal
Home Loan Bank of Atlanta (“FHLB”). The FHLB capital stock
requirement is based on the sum of a membership stock component totaling 20% of
the Bank’s total assets plus an activity based stock component of 4.5% of
outstanding FHLB advances. At December 31, 2009 and 2008, the Bank
owned 38,895 and 36,586 shares of the FHLB’s capital stock, respectively. The
Bank carries this investment at cost. Due to the redemption
provisions of the FHLB, the Company estimated that fair value equals cost and
that this investment was not impaired at December 31, 2009.
24
1.
BASIS OF PRESENTATION AND ACCOUNTING POLICIES (Continued)
GOODWILL
AND INTANGIBLE ASSETS
Net
assets of companies acquired in purchase transactions are recorded at fair value
at the date of acquisition and, as such, the historical cost basis of individual
assets and liabilities are adjusted to reflect their fair value. Identified
intangible assets resulting from branch offices acquired in 2004 are amortized
on a straight-line basis over 10 years. Amortization expense of
$31,440 per year was recorded for the years ended December 31, 2009, 2008 and
2007, respectively. Goodwill is not amortized, but is reviewed for potential
impairment on an annual basis at the reporting unit level. The impairment test
is performed in two phases. The first step of the goodwill impairment test, used
to identify potential impairment, compares the fair value of the reporting unit
with its carrying amount, including goodwill. If the fair value of the reporting
unit exceeds its carrying amount, goodwill of the reporting unit is considered
not impaired; however, if the carrying amount of the reporting unit exceeds its
fair value, an additional procedure must be performed. That additional procedure
compares the implied fair value of the reporting unit's goodwill with the
carrying amount of that goodwill. An impairment loss is recorded to the extent
that the carrying amount of goodwill exceeds its implied fair value. Other
intangible assets are evaluated for impairment if events and circumstances
indicate a possible impairment. Such evaluation of other intangible assets is
based on undiscounted cash flow projections.
INCOME
TAXES
As
required under accounting standards for income taxes, the Company adopted the
new standard regarding uncertain income tax positions effective January 1, 2008.
Under this new standard, the impact of an uncertain income tax position on the
income tax returns must be recognized at the largest amount that is
more-likely-than-not to be required to be recognized upon audit by the relevant
taxing authority. The standards also provide guidance on derecognition,
measurement, classification, interest and penalties, accounting for interim
periods, disclosure, and transition issues with respect to tax
positions.
As a
result of adoption of the new standard regarding uncertain income tax positions,
the Company has determined that it has no uncertain income tax positions as of
the adoption date of January 1, 2008. Also, the Company does not anticipate any
increase or decrease in unrecognized tax benefits during the next twelve months
that would result in a material change to its financial position. The Company’s
income tax returns for years ended after December 31, 2007 remain open for
examination.
The
Company includes interest and penalties in the financial statements as a
component of income tax expense. No interest or penalties are included in the
Company’s income tax expense for the years ended December 31, 2009, 2008 and
2007.
ADVERTISING
Advertising
costs are expensed as incurred. For the years ended December 31, 2009, 2008 and
2007, the Company incurred advertising expense totaling $123,513, $112,758 and
$125,490, respectively.
COMPREHENSIVE
INCOME
The
Company's other comprehensive income (loss) relates to unrealized gains (losses)
on available for sale securities. Information concerning the Company's other
comprehensive income (loss) for the years ended December 31, 2009, 2008 and 2007
is as follows:
|
Years
ended December 31,
|
||||||||||||
|
2009
|
2008
|
2007
|
||||||||||
|
Unrealized
gains (losses) on securities available for sale
|
$ | (1,416,877 | ) | $ | 1,327,246 | $ | 1,565,079 | |||||
|
Income
tax benefit (expense)
|
559,666 | (524,262 | ) | (609,250 | ) | |||||||
|
Other
comprehensive income (loss), net
|
$ | (857,211 | ) | $ | 802,984 | $ | 955,829 | |||||
25
1.
BASIS OF PRESENTATION AND ACCOUNTING POLICIES (Continued)
SEGMENT
INFORMATION
The
Company follows financial accounting standards which specify guidelines for
determining its operating segments and the type and level of financial
information to be disclosed. Based on these guidelines, management has
determined that the Bank operates in one business segment, the providing of
general commercial financial services to customers located in its market areas.
The various products are those generally offered by community banks. The
allocation of Bank resources is based on overall performance of the Bank, rather
than individual branches or products.
ACCOUNTING
STANDARDS CODIFICATION
In June
2009, the Financial Accounting Standards Board (the “FASB”) issued Statement of
Financial Accounting Standards No. 168 (“SFAS No. 168”), “The FASB
Accounting Standards Codification and the Hierarchy of Generally Accepted
Accounting Principles—a replacement of FASB Statement No. 162.” The FASB
Accounting Standards Codification will become the source of authoritative U.S.
GAAP recognized by the FASB to be applied to nongovernmental entities. Following
this Statement, the FASB Board will not issue new standards in the form of
Statements, FASB Staff Positions, or Emerging Issues Task Force
Abstracts. Instead, they will issue Accounting Standards Updates. The
Board will not consider Accounting Standards Updates as authoritative in their
own right. Accounting Standards Updates will serve only to update the
Codification, provide background information about the guidance and provide the
basis for conclusions on the change(s) in the Codification.
This
statement replaces SFAS No. 162 and modifies the GAAP hierarchy into two levels:
authoritative and non-authoritative. This statement is effective for financial
statements issued for interim and annual periods ending after September 15,
2009. The Company adopted SFAS No. 168 on September 30, 2009, with no material
impact on its consolidated financial statements. Going forward, as the FASB
issues Accounting Standards Updates, the Company will evaluate the impact that
such updates may have on its consolidated financial statements of the Company
and will also monitor the effective dates of such updates.
2.
INVESTMENT SECURITIES
Investment
securities at December 31, 2009 and 2008 are classified as available for sale
according to management's intent and summarized as follows:
|
Gross
|
Gross
|
Estimated
|
||||||||||||||
|
Amortized
|
unrealized
|
unrealized
|
market
|
|||||||||||||
|
cost
|
gains
|
losses
|
value
|
|||||||||||||
|
December
31, 2009:
|
||||||||||||||||
|
U.S.
Treasury and Agency Notes
|
$ | - | $ | - | $ | - | $ | - | ||||||||
|
Triangle
Capital Corporation
|
505,000 | - | (97,683 | ) | 407,317 | |||||||||||
| $ | 505,000 | $ | - | $ | (97,683 | ) | $ | 407,317 | ||||||||
|
December
31, 2008:
|
||||||||||||||||
|
U.S.
Treasury and Agency Notes
|
$ | 34,936,759 | $ | 1,283,245 | $ | - | $ | 36,220,004 | ||||||||
|
Triangle
Capital Corporation
|
505,000 | - | (161,358 | ) | 343,642 | |||||||||||
| $ | 35,441,759 | $ | 1,283,245 | $ | (161,358 | ) | $ | 36,563,646 | ||||||||
Included
in the Company’s investment securities total are equity securities consisting of
33,333 shares of restrictive common stock of Triangle Capital Corporation
(NASDAQ: TCAP) received on February 21, 2007 upon completion of a public
offering of TCAP. Prior to the public offering, the Company was a limited
partner in the Triangle Mezzanine Fund, LLLP, with an investment of $500,000. In
the public offering, TCAP acquired Triangle Mezzanine Fund, LLLP, and the
limited partners received shares of TCAP restricted common stock in amounts
equivalent to their limited investment in the Triangle Mezzanine Fund, LLLP. At
December 31, 2009, the TCAP equity securities owned by the Company had a market
value of $407,317. Unrealized loss on Triangle Capital Corporation equity
security is considered by management to be temporary.
At year
end 2009 the Bank had no remaining U.S. Treasury and Agency Notes held as
investment securities. U.S. Treasury and Agency Notes with an amortized cost of
approximately $0 and $12.8 million were pledged to secure deposits from public
entities and repurchase agreements at December 31, 2009 and 2008,
respectively.
26
3.
MORTGAGE-BACKED SECURITIES
Mortgage-backed
securities at December 31, 2009 and 2008 are classified as available for sale
according to management's intent and summarized as follows:
|
Gross
|
Gross
|
Estimated
|
||||||||||||||
|
Amortized
|
unrealized
|
unrealized
|
market
|
|||||||||||||
|
cost
|
gains
|
losses
|
value
|
|||||||||||||
|
FHLMC PCs, maturing
from years
2011 to 2040
|
$ | 96,095,095 | $ | 1,147,242 | $ | 516,869 | $ | 96,725,468 | ||||||||
|
December
31, 2008:
|
||||||||||||||||
|
FHLMC
PCs, maturing from years 2009 to 2038
|
$ | 31,167,477 | $ | 827,680 | $ | - | $ | 31,995,157 | ||||||||
Mortgage-backed
securities at December 31, 2009 and 2008 are classified as held for investment
according to management's intent and summarized as follows:
|
Gross
|
Gross
|
Estimated
|
||||||||||||||
|
Amortized
|
unrealized
|
unrealized
|
market
|
|||||||||||||
|
cost
|
gains
|
losses
|
value
|
|||||||||||||
|
December
31, 2009:
|
||||||||||||||||
|
FHLMC
PCs, maturing during 2013
|
$ | 513,882 | $ | 4,574 | $ | - | $ | 518,456 | ||||||||
|
December
31, 2008:
|
||||||||||||||||
|
FHLMC
PCs, maturing during 2013
|
$ | 832,221 | $ | 25,882 | $ | - | $ | 858,103 | ||||||||
The
following table presents mortgage-backed securities unrealized losses and fair
values, aggregated by length of time that individual securities have been in a
continuous unrealized loss position, at December 31, 2009. There were no
mortgage-backed securities in an unrealized loss position at December 31,
2008.
|
2009
|
||||||||||||||||||||||||
|
Less
Than 12 Months
|
12
Months or More
|
Total
|
||||||||||||||||||||||
|
Fair
value
|
Unrealized
losses
|
Fair
value
|
Unrealized
losses
|
Fair
value
|
Unrealized
losses
|
|||||||||||||||||||
|
Securities
available for sale:
|
||||||||||||||||||||||||
|
FHLMC
PCs
|
$ | 49,044,596 | $ | 516,869 | $ | - | $ | - | $ | 49,044,596 | $ | 516,869 | ||||||||||||
Mortgage-backed
securities, classified as available for sale or held for investment, at December
31, 2009 are contractually scheduled to mature as follows:
|
Estimated
|
||||||||
|
Amortized
|
market
|
|||||||
|
cost
|
value
|
|||||||
|
Due
one year or less
|
$ | - | $ | - | ||||
|
Due
after one year through five years
|
1,635,453 | 1,715,601 | ||||||
|
Due
after five years through ten years
|
0 | 0 | ||||||
|
Due
after ten years
|
94,973,524 | 95,528,323 | ||||||
|
Total
|
$ | 96,608,977 | $ | 97,243,924 | ||||
Expected
maturities may differ from contractual maturities because borrowers have the
right to call or prepay obligations with or without call or prepayment
penalties. Mortgage-backed securities with a carrying value of $0, $4,022,495
and $0 were sold during the years ended December 31, 2009, 2008 and 2007,
respectively. Mortgage-backed securities with an amortized cost of $6,182,774
and $318,321 were pledged as collateral for public deposits, repurchase
agreements and treasury tax and loan deposits at December 31, 2009 and 2008,
respectively.
27
4.
LOANS RECEIVABLE
Loans
receivable at December 31, 2009 and 2008 are summarized as follows:
|
2009
|
2008
|
|||||||
|
Mortgage
loans
|
$ | 52,960,619 | $ | 46,990,010 | ||||
|
Consumer
loans
|
89,642,641 | 101,808,252 | ||||||
|
Commercial
loans
|
521,182,385 | 597,012,445 | ||||||
|
Lease
receivables
|
9,817,909 | 11,560,539 | ||||||
|
Total
|
673,603,554 | 757,371,246 | ||||||
|
Less: Allowance
for loan losses
|
(13,503,940 | ) | (11,617,706 | ) | ||||
|
Deferred loan fees, net
|
(1,444,096 | ) | (1,022,243 | ) | ||||
|
Loans
receivable, net
|
$ | 658,655,518 | $ | 744,731,297 | ||||
The Bank
has pledged its eligible real estate loans to collateralize actual or potential
borrowings from the Federal Home Loan Bank of Atlanta (See Note 9).
During
the years ended December 31, 2009, 2008, and 2007 the Bank exchanged loans with
outstanding principal balances of $75,485,932, $3,399,071 and $6,873,490,
respectively, with the Federal Home Loan Mortgage Corporation ("FHLMC") for
mortgage-backed securities of equal value.
The Bank
originates mortgage loans for portfolio investment or sale in the secondary
market. During the period of origination, mortgage loans are designated as
either held for sale or for investment purposes. Transfers of loans held for
sale to the investment portfolio are recorded at the lower of cost or market
value on the transfer date. Loans receivable held for sale at December 31, 2009
and 2008 are fixed rate mortgage loans with an estimated market value of
approximately $6,897,491 and $5,781,287, respectively. Net gains on sales of
loans receivable held for sale amounted to $1,197,029, $586,571 and $519,361 for
the years ended December 31, 2009, 2008 and 2007, respectively.
Activity
in the allowance for credit losses, which includes the allowance for loan and
lease losses and unfunded commitments for the years ended December 31, 2009,
2008 and 2007, is summarized as follows:
|
Allowance for
Loan and Lease
Losses
|
Allowance for
Unfunded
Commitments
|
Allowance for
Credit Losses
|
||||||||||
|
Balance
at December 31, 2006
|
$ | 9,157,597 | $ | 764,940 | $ | 9,922,537 | ||||||
|
Provisions
for credit losses
|
712,297 | (362,297 | ) | 350,000 | ||||||||
|
Loans
charged off
|
(420,717 | ) | - | (420,717 | ) | |||||||
|
Recoveries
|
37,302 | - | 37,302 | |||||||||
|
Balance
at December 31, 2007
|
9,486,479 | 402,643 | 9,889,122 | |||||||||
|
Provisions
for credit losses
|
4,106,248 | (62,648 | ) | 4,043,600 | ||||||||
|
Loans
charged off
|
(2,167,630 | ) | - | (2,167,630 | ) | |||||||
|
Recoveries
|
192,609 | - | 192,609 | |||||||||
|
Balance
at December 31, 2008
|
11,617,706 | 339,995 | 11,957,701 | |||||||||
|
Provisions
for credit losses
|
7,279,713 | (99,713 | ) | 7,180,000 | ||||||||
|
Loans
charged off
|
(5,774,831 | ) | - | (5,774,831 | ) | |||||||
|
Recoveries
|
381,352 | - | 381,352 | |||||||||
|
Balance
at December 31, 2009
|
$ | 13,503,940 | $ | 240,282 | $ | 13,744,222 | ||||||
Following
is a summary of the principal balances of loans on nonaccrual status and loans
past due over ninety days:
|
December
31,
|
||||||||
|
|
2009
|
2008
|
||||||
|
Loans
contractually past due over 90 days and/or on nonaccrual
status:
|
||||||||
|
Mortgage
residential
|
$ | 767,141 | $ | 1,211,334 | ||||
|
Consumer
and commercial
|
11,170,640 | 14,620,731 | ||||||
|
Total
|
$ | 11,937,781 | $ | 15,832,065 | ||||
For the
years ended December 31, 2009, 2008 and 2007, interest income of $470,734,
$624,265 and $505,990, respectively, was not recorded related to loans accounted
for on a nonaccrual basis.
28
5.
PREMISES AND EQUIPMENT
Premises
and equipment consist of the following:
|
December
31,
|
||||||||
|
2009
|
2008
|
|||||||
|
Land
|
$ | 3,102,730 | $ | 3,102,730 | ||||
|
Office
buildings and improvements
|
7,703,338 | 7,699,008 | ||||||
|
Furniture,
fixtures and equipment
|
5,126,100 | 5,020,744 | ||||||
|
Vehicles
|
523,965 | 537,312 | ||||||
|
Construction
in process
|
68,131 | - | ||||||
| 16,524,264 | 16,359,794 | |||||||
|
Less
accumulated depreciation
|
7,984,505 | 7,309,865 | ||||||
|
Total
|
$ | 8,539,759 | $ | 9,049,929 | ||||
The
Company leases certain branch facilities and equipment under separate agreements
that expire at various dates through December 31, 2015. Future rentals under
these leases are as follows:
|
2010
|
$ | 482,353 | ||
|
2011
|
396,849 | |||
|
2012
|
349,602 | |||
|
2013
|
245,344 | |||
|
2014
|
38,400 | |||
|
Thereafter
|
22,400 | |||
|
Total
|
$ | 1,534,948 |
Rental
expense of $597,146, $601,510 and $444,412 during the years ended December 31,
2009, 2008 and 2007, respectively, is included in premises and equipment expense
on the accompanying consolidated statements of operations.
6.
DEPOSITS
At
December 31, 2009, the scheduled maturities of time deposits were as
follows:
|
2010
|
$ | 401,591,256 | ||
|
2011
|
34,562,653 | |||
|
2012
|
3,705,036 | |||
|
2013
|
560,653 | |||
|
2014
|
446,707 | |||
|
Thereafter
|
- | |||
|
Total
time deposits
|
$ | 440,866,305 |
7.
EMPLOYEE BENEFIT PLANS
The
Company participated in a multi-employer defined benefit pension plan which
covered substantially all employees; however, effective January 31, 2002, the
Company's Board of Directors approved a plan to freeze the accrual of future
benefits under the plan. Consequently, no new employees became
eligible to participate in the plan after January 31, 2002. Effective October 1,
2004, the Company withdrew from the plan. Active employees who were
participating in the plan became 100% vested on that date and could select from
a variety of benefit payment options based on their age and benefit payment
amount.
The
Company also participates in a defined contribution plan which covers
substantially all employees. During the years ended December 31, 2009, 2008 and
2007, employees may contribute from 1% to 100% of compensation, subject to an
annual maximum as determined by the Internal Revenue Code. The Company makes
matching contributions of 100% of employees' contributions up to 5% of the
employees' salaries.
29
7.
EMPLOYEE BENEFIT PLANS (Continued)
The plan
provides that employees' contributions are 100% vested at all times and the
Bank's contributions vest 25% for each year of service. The expenses related to
the Company's contributions to this plan for the years ended December 31, 2009,
2008 and 2007 were $296,142, $351,394 and $293,475, respectively. Directors
and certain officers participate in deferred compensation plans. These plans
provide for fixed payments beginning at retirement, and are earned over service
periods of up to ten years, and include provisions for deferral of current
payments. The expense related to these plans during the years ended December 31,
2009, 2008 and 2007 was $373,990, $408,303 and $449,464, respectively. The plans
include provisions for forfeitures of unvested portions of payments, and vesting
in the event of death or disability. The total liability under this plan was
$3,165,471 at December 31, 2009 and is included in other liabilities in the
accompanying consolidated statements of financial condition.
8.
STOCK-BASED COMPENSATION
The
Company had two stock-based compensation plans at December 31,
2009. The shares outstanding are for grants under the Company’s 1997
Stock Option Plan (the “1997 Plan”) and the 2008 Equity Incentive Plan (the
“2008 Plan”) (collectively, the “Plans”). The 1997 Plan matured on April 8, 2008
and no additional options may be granted under that plan. At December
31, 2009, the 1997 Plan had 128,270 granted unexercised shares. On
May 22, 2008, the Shareholders of the Company approved the 2008 Plan for a term
of ten years. At December 31, 2009, the 2008 Plan includes 43,500
granted unexercised shares and 914,500 shares available to be
granted.
Stock
options expire ten years from the date of grant and vest over service periods
ranging from one year to five years. The Plans have a change in
control provision under which all options vest immediately if a change in
control occurs. Options granted under the 2008 Plan are granted at
the closing sales price of the Company’s common stock on the NASDAQ Stock Market
on the date of grant. The Company settles stock option exercises with treasury
shares.
The
average fair value of options granted during the years ended December 31, 2009
and 2008 was $4.18 and $2.36, respectively. The fair value of each
option grant is estimated on the date of grant using the Black-Scholes
option-pricing model with the following weighted-average assumptions used for
grants during the years ended December 31, 2009, 2008 and 2007:
|
December
31,
|
||||||||||||
|
Year Ended:
|
2009
|
2008
|
2007
|
|||||||||
|
Dividend
growth rate
|
5.3 | % | 11.8 | % | 17 | % | ||||||
|
Expected
volatility
|
36.6 | % | 24.0 | % | 22.6 | % | ||||||
|
Average
risk-free interest rates
|
2.78 | % | 3.34 | % | 3.95 | % | ||||||
|
Expected
lives
|
6
years
|
6
years
|
6
years
|
|||||||||
A summary
of option activity under the Plans as of December 31, 2009 and 2008, and
changes during the years then ended is presented below:
|
Options
Available
|
Options
Outstanding
|
Price
|
Aggregate
Intrinsic
Value
|
|||||||||||||
|
Outstanding
at December 31, 2007
|
967,652 | 255,919 | $ | 13.90 | $ | 2,120,393 | ||||||||||
|
Granted
|
(24,000 | ) | 24,000 | 19.85 | ||||||||||||
|
Forfeited
|
4,000 | (17,125 | ) | 24.24 | ||||||||||||
|
Exercised
|
- | (90,499 | ) | 6.64 | ||||||||||||
|
Expired
shares 1997 Plan
|
(958,652 | ) | - | - | ||||||||||||
|
Approved
2008 Plan shares
|
958,000 | - | - | |||||||||||||
|
Outstanding
at December 31, 2008
|
947,000 | 172,295 | $ | 17.52 | $ | (854,558 | ) | |||||||||
|
Granted
|
(35,500 | ) | 35,500 | 11.25 | ||||||||||||
|
Forfeited
|
3,000 | (31,825 | ) | 20.00 | ||||||||||||
|
Exercised
|
- | (4,200 | ) | 6.32 | ||||||||||||
|
Outstanding
at December 31, 2009
|
914,500 | 171,770 | $ | 16.04 | $ | (985,969 | ) | |||||||||
30
8.
STOCK-BASED COMPENSATION (Continued)
The net
compensation benefits credited against expense for the Plans was $24,740 for the
year ended December 31, 2009, compared to net compensation costs of $37,133
charged against income for the year ended December 31, 2008. Total
recapture credits against compensation expense due to forfeited options were
$98,056 for the year ended December 31, 2009, compared to $35,954 for the year
ended December 31, 2008. The total income tax benefits recognized for
stock-based compensation costs were $4,482 and $452,317 for the years ended
December 31, 2009 and 2008, respectively.
Total
unrecognized compensation cost on granted unexercised shares was $172,556 at
December 31, 2009, compared to $115,129 at December 31, 2008. That
cost is expected to be recognized over the next three years.
The total
intrinsic value of options exercised during the years ended December 31, 2009
and 2008 was $21,357 and $1,342,854, respectively.
The
following table summarizes additional information about the Company’s
outstanding options and exercisable options as of December 31, 2009, including
weighted-average remaining contractual term expressed in years ("Life") and
weighted average exercise price (“Price”):
|
Outstanding
|
Exercisable
|
||||||||||||||||||||
|
Range
of Exercise Price
|
Shares
|
Life
|
Price
|
Shares
|
Price
|
||||||||||||||||
|
$
5.50
– 12.95
|
68,583 | 5.25 | $ | 9.75 | 36,083 | $ | 8.36 | ||||||||||||||
|
$
14.97
– 16.49
|
36,562 | 3.04 | 16.10 | 36,562 | 16.10 | ||||||||||||||||
|
$
16.77
– 25.22
|
52,375 | 7.07 | 20.76 | 31,917 | 20.78 | ||||||||||||||||
|
$
26.17
– 33.27
|
14,250 | 6.62 | 28.81 | 9,050 | 28.97 | ||||||||||||||||
| 171,770 | 5.45 | 16.04 | 113,612 | 15.98 | |||||||||||||||||
A summary
of nonvested option shares as of December 31, 2009 and 2008, and changes
during the years ended December 31, 2009 and 2008 is presented
below:
|
Year
Ended:
|
December
31, 2009
|
December
31, 2008
|
||||||||||||||
|
Shares
|
Price
|
Shares
|
Price
|
|||||||||||||
|
Nonvested
at beginning of year
|
43,275 | $ | 22.68 | 53,975 | $ | 24.38 | ||||||||||
|
Granted
|
35,500 | 11.25 | 24,000 | 19.85 | ||||||||||||
|
Forfeited
|
(4,250 | ) | 15.39 | (11,500 | ) | 25.78 | ||||||||||
|
Vested
|
(16,367 | ) | 22.96 | (23,200 | ) | 22.16 | ||||||||||
|
Nonvested
at end of year
|
58,158 | 16.16 | 43,275 | 22.68 | ||||||||||||
The
following table reflects the impact of stock based compensation by increasing or
reducing income before income taxes, net income, basic earnings per share and
diluted earnings per share for the years ended December 31, 2009, 2008 and
2007:
|
Year
Ended December 31,
|
||||||||||||
|
2009
|
2008
|
2007
|
||||||||||
|
Increased
(reduced) net income before income taxes
|
$ | 24,739 | $ | (37,132 | ) | $ | (83,763 | ) | ||||
|
Increased
(reduced) net income
|
11,202 | (36,228 | ) | (76,843 | ) | |||||||
|
Reduced
basic earnings per share
|
.00 | .00 | (.01 | ) | ||||||||
|
Reduced
diluted earnings per share
|
.00 | (.01 | ) | .00 | ||||||||
9.
BORROWED MONEY
Borrowed
money represents advances from the FHLB and repurchase agreements. Outstanding
FHLB advances at December 31, 2009 and 2008 totaled $35.0 million and $45.0
million, respectively, and had a weighted average fixed rate of 3.04% at
December 31, 2009 and 3.01% at December 31, 2008. At December 31,
2009, the FHLB advances consisted of $25.0 million with a scheduled maturity
date of January 29, 2010, and $10.0 million with a scheduled maturity date of
January 31, 2011.
31
9.
BORROWED MONEY (Continued)
At
December 31, 2009 and 2008, repurchase agreements totaled $2,380,388 and
$7,558,492, respectively, and had a weighted average rate of 0.25% at December
31, 2009 and December 31, 2008. At December 31, 2009, repurchase agreements were
collateralized by Federal Home Loan Mortgage Corporation participation
certificates with a principal balance of $2.4 million. The Company
has pledged all of its stock in the FHLB and certain loans secured by one to
four family residential mortgages as collateral for actual or potential
borrowings from the FHLB. At December 31, 2009 and 2008, the Company had
approximately $154.0 million and $125.1 million, respectively, of additional
credit available with the FHLB.
10.
INCOME TAXES
The
components of income tax expense for the years ended December 31, 2009, 2008 and
2007 are as follows:
|
Years Ended December 31,
|
||||||||||||
|
2009
|
2008
|
2007
|
||||||||||
|
Current
|
||||||||||||
|
Federal
|
$ | 4,586,057 | $ | 6,516,536 | $ | 9,804,043 | ||||||
|
State
|
1,077,388 | 1,280,846 | 1,474,554 | |||||||||
| 5,663,445 | 7,797,382 | 11,278,597 | ||||||||||
|
Deferred
|
||||||||||||
|
Federal
|
(1,068,097 | ) | (709,851 | ) | (361,087 | ) | ||||||
|
State
|
(230,052 | ) | (152,891 | ) | (77,773 | ) | ||||||
| (1,298,149 | ) | (862,742 | ) | (438,860 | ) | |||||||
|
Total
|
$ | 4,365,296 | $ | 6,934,640 | $ | 10,839,737 | ||||||
Reconciliations
of the expected income tax expense at statutory tax rates with income tax
expense reported in the statements of operations for the years ended December
31, 2009, 2008 and 2007 are as follows:
|
Years Ended December 31,
|
||||||||||||
|
2009
|
2008
|
2007
|
||||||||||
|
Expected
income tax expense at 35%
|
$ | 3,990,396 | $ | 6,272,861 | $ | 9,745,037 | ||||||
|
State
income taxes, net of federal income tax
|
550,768 | 733,171 | 907,908 | |||||||||
|
Other
expenses and adjustments
|
(175,868 | ) | (71,392 | ) | 186,792 | |||||||
|
Total
|
$ | 4,365,296 | $ | 6,934,640 | $ | 10,839,737 | ||||||
The
components of deferred income tax assets and liabilities are as
follows:
|
Years Ended December 31,
|
||||||||
|
2009
|
2008
|
|||||||
|
Deferred
income tax assets
|
||||||||
|
Deferred
directors' fees
|
$ | 543,015 | $ | 548,723 | ||||
|
Allowance
for credit losses
|
5,330,220 | 4,624,544 | ||||||
|
Employee
benefits
|
707,344 | 705,515 | ||||||
|
Loans
mark-to-market
|
210,126 | 157,399 | ||||||
|
Other
|
205,178 | 265,822 | ||||||
| 6,995,883 | 6,302,003 | |||||||
|
Deferred
income tax liabilities
|
||||||||
|
Depreciation
and amortization
|
2,737,419 | 3,289,429 | ||||||
|
Carrying
value – land
|
395,000 | 395,000 | ||||||
|
Mortgage
servicing rights
|
505,082 | 397,261 | ||||||
|
Deferred
loan origination fees and costs
|
712,349 | 845,136 | ||||||
|
FHLB
stock
|
- | 27,293 | ||||||
|
Unrealized
gain on securities available for sale
|
210,413 | 770,079 | ||||||
| 4,560,263 | 5,724,198 | |||||||
|
Net
deferred income tax asset
|
$ | 2,435,620 | $ | 577,805 | ||||
32
11.
REGULATORY CAPITAL REQUIREMENTS
Dividend
payments made by the Company are subject to regulatory restrictions under
Federal Reserve Board policy as well as to limitations under applicable
provisions of Virginia corporate law. The Federal Reserve Board may prohibit a
bank holding company from paying any dividends if the holding company's bank
subsidiary is classified as "undercapitalized." Under Virginia law, dividends
may be paid out of surplus or, if there is no surplus, out of net profits for
the fiscal year in which the dividend is declared and for the preceding fiscal
year. Furthermore, under FDIC regulations, the Bank is prohibited from making
any capital distributions if, after making the distribution, the Bank would
have: (i) a total risk-based capital ratio of less than 8.0%; (ii) a Tier 1
risk-based capital ratio of less than 4.0%; or (iii) a leverage ratio of less
than 4.0%.
The Bank
is subject to various regulatory capital requirements administered by the
federal and state banking agencies. Failure to meet minimum capital requirements
can initiate certain mandatory and possibly additional
discretionary actions by regulators that, if undertaken, could have a
direct material effect on the Bank's financial statements. Quantitative measures
established by regulation to ensure capital adequacy require the Bank to
maintain minimum amounts and ratios, as set forth in the table below. Management
believes, as of December 31, 2009, that the Bank meets all capital adequacy
requirements to which it is subject. The Company’s most significant asset is its
investment in First South Bank. Consequently, the information concerning capital
ratios is essentially the same for the Company and the Bank.
As of
December 31, 2009, the most recent notification from the FDIC categorized the
Bank as well capitalized under the regulatory framework for prompt corrective
action. To be categorized as well capitalized the Bank must maintain minimum
amounts and ratios, as set forth in the table below. There are no conditions or
events since that notification that management believes have changed the Bank's
category. The Bank's actual regulatory capital amounts and ratios as of December
31, 2009 and 2008 are presented in the table below (dollars in
thousands):
|
Actual
|
Minimum
for Capital
Adequacy Purposes
|
Minimum
to be Well
Capitalized
under
Prompt
Corrective
Action Provisions
|
||||||||||||||||||||||
|
Amount
|
Ratio
|
Amount
|
Ratio
|
Amount
|
Ratio
|
|||||||||||||||||||
|
December
31, 2009:
|
||||||||||||||||||||||||
|
Total
Capital (to Risk Weighted Assets)
|
$ | 88,282 | 13.5 | % | $ | 52,250 | 8.0 | % | $ | 65,312 | 10.0 | % | ||||||||||||
|
Tier
1 Capital (to Risk Weighted Assets)
|
80,049 | 12.3 | % | 26,125 | 4.0 | % | 39,187 | 6.0 | % | |||||||||||||||
|
Tier
1 Capital (to Average Assets)
|
80,049 | 9.6 | % | 33,506 | 4.0 | % | 41,883 | 5.0 | % | |||||||||||||||
|
December
31, 2008:
|
||||||||||||||||||||||||
|
Total
Capital (to Risk Weighted Assets)
|
$ | 90,054 | 12.4 | % | $ | 58,268 | 8.0 | % | $ | 72,835 | 10.0 | % | ||||||||||||
|
Tier
1 Capital (to Risk Weighted Assets)
|
80,914 | 11.1 | % | 29,134 | 4.0 | % | 43,701 | 6.0 | % | |||||||||||||||
|
Tier
1 Capital (to Average Assets)
|
80,914 | 9.2 | % | 35,195 | 4.0 | % | 43,994 | 5.0 | % | |||||||||||||||
12.
EARNINGS PER SHARE
The
following table provides a reconciliation of income available to common
stockholders and the average number of shares outstanding (less unearned
deferred stock awards and treasury shares) for the years ended December 31,
2009, 2008 and 2007. Options to purchase 171,770, 172,295 and 255,919 shares of
common stock were outstanding at December 31, 2009, 2008, and 2007,
respectively.
|
Years Ended December 31,
|
||||||||||||
|
2009
|
2008
|
2007
|
||||||||||
|
Net
income (numerator)
|
$ | 7,035,836 | $ | 10,987,820 | $ | 17,003,227 | ||||||
|
Weighted
average shares outstanding
|
||||||||||||
|
for
basic EPS (denominator)
|
9,738,225 | 9,761,944 | 9,914,929 | |||||||||
|
Dilutive
effect of stock options
|
19 | 19,817 | 112,799 | |||||||||
|
Adjusted
shares for diluted EPS
|
9,738,244 | 9,781,761 | 10,027,728 | |||||||||
For the
years ended December 31, 2009 and 2008, there were 120,687 and 132,012 options,
respectively, that were antidilutive since the exercise price exceeded the
average market price of the Company’s common stock for the years. These options
have been omitted from the calculation of diluted earnings per share for 2009
and 2008.
33
13.
MORTGAGE BANKING ACTIVITIES
Mortgage
loans serviced for others are not included in the accompanying consolidated
statements of financial condition. The unpaid principal balances of mortgage
loans serviced for others were $289,323,578, $255,509,602 and $254,670,534 at
December 31, 2009, 2008, and 2007, respectively. Servicing loans for others
generally consists of collecting mortgage payments, maintaining escrow accounts,
disbursing payment to investors and foreclosure processing. Loan servicing
income is recorded on the accrual basis and includes servicing fees from
investors and certain charges collected from borrowers, such as late payment
fees.
At
December 31, 2009 and 2008, mortgage servicing rights reported in the
consolidated statements of financial condition, net of amortization, were
$1,278,688 and $1,005,725, respectively.
During
the years ended December 31, 2009 and 2008, respectively, the Company recorded
additional servicing assets of $730,125 and $257,930 as a result of sales of
loans or mortgage-backed securities. Amortization of servicing assets during the
years ended December 31, 2009, 2008, and 2007 aggregated $457,162, $402,820, and
$363,068, respectively. The fair value of recognized servicing assets amounted
to approximately $2,457,000 and $2,823,000 as of December 31, 2009 and 2008,
respectively. The Company's significant assumptions used to estimate their fair
value include weighted average life, prepayment speeds, and expected costs to
transfer servicing to a third party.
14.
FINANCIAL INSTRUMENTS WITH OFF-BALANCE SHEET RISK AND SIGNIFICANT
GROUP
CONCENTRATION
OF CREDIT RISK
The
Company is a party to financial instruments with off-balance sheet risk in the
normal course of business to meet the financing needs of its customers and to
reduce its own exposure to fluctuations in interest rates. These financial
instruments include commitments to extend credit and involve, to varying
degrees, elements of credit and interest rate risk in excess of the amount
recognized in the consolidated statements of financial condition.
The
Company's exposure to credit loss in the event of non-performance by the other
party to the financial instruments for commitments to extend credit is
represented by the contractual amount of those instruments. The Company uses the
same credit policies in making commitments and conditional obligations as it
does for on-balance sheet instruments.
Commitments
to extend credit are agreements to lend to a customer as long as there is no
violation of any condition established in the contract. Commitments generally
have fixed expiration dates or other termination clauses and may require payment
of a fee. The Company evaluates each customer's creditworthiness on a
case-by-case basis. The amount of collateral obtained, if deemed necessary by
the Company upon extension of credit, is based on management's credit evaluation
of the borrower.
The
Company's lending is concentrated primarily in central, eastern, northeastern
and southeastern North Carolina. Credit has been extended to certain of the
Company's customers through multiple lending transactions. Since many of the
commitments are expected to expire without being drawn upon, amounts reported do
not necessarily represent future cash requirements. A summary of the
contractual amounts of the Company's exposure to off-balance sheet risk as of
December 31, 2009 and 2008 are as follows:
|
December 31,
|
||||||||
|
2009
|
2008
|
|||||||
|
Commitments
to extend credit
|
$ | 47,338,000 | $ | 66,428,000 | ||||
|
Undrawn
balances on lines of credit and undrawn
|
||||||||
|
balances
on credit reserves (overdraft protection)
|
49,756,000 | 51,504,000 | ||||||
|
Standby
letters of credit
|
1,007,000 | 2,384,000 | ||||||
|
Total
|
$ | 98,101,000 | $ | 120,316,000 | ||||
Included
in the commitments to originate loans as of December 31, 2009 and December 31,
2008, are fixed interest rate loan commitments of approximately $12.2 million
and $14.5 million, respectively. The shorter duration of interest-sensitive
liabilities, to the extent they are used to fund these fixed-rate loans,
indicates that the Company is exposed to interest rate risk because, in a rising
rate environment, liabilities will be repricing faster at higher interest rates,
thereby reducing the market value of fixed-rate long-term assets and net
interest income.
34
15.
PARENT COMPANY FINANCIAL INFORMATION
The
Company's principal asset is its investment in the Bank. Condensed financial
statements of the parent company as of December 31, 2009, 2008 and 2007 are as
follows:
|
Years Ended December 31,
|
||||||||||||
|
2009
|
2008
|
2007
|
||||||||||
|
CONDENSED
BALANCE SHEETS
|
||||||||||||
|
Cash
|
$ | 1,994,259 | $ | 2,003,541 | $ | 1,961,421 | ||||||
|
Investment
in wholly-owned subsidiary
|
84,821,988 | 86,637,727 | 85,509,789 | |||||||||
|
Other
assets
|
11,656,316 | 11,437,376 | 10,737,756 | |||||||||
|
Total
assets
|
$ | 98,472,563 | $ | 100,078,644 | $ | 98,208,966 | ||||||
|
Junior
subordinated debentures
|
$ | 10,310,000 | $ | 10,310,000 | $ | 10,310,000 | ||||||
|
Other
liabilities
|
1,948,459 | 1,947,619 | 1,863,644 | |||||||||
|
Stockholders'
equity
|
86,214,104 | 87,821,025 | 86,035,322 | |||||||||
|
Total
liabilities and stockholders' equity
|
$ | 98,472,563 | $ | 100,078,644 | $ | 98,208,966 | ||||||
|
CONDENSED
STATEMENTS OF INCOME
|
||||||||||||
|
Interest
on junior subordinated debentures
|
$ | 389,677 | $ | 657,576 | $ | 839,110 | ||||||
|
Equity
in earnings of subsidiary
|
7,322,965 | 11,481,054 | 17,660,805 | |||||||||
|
Miscellaneous
income (loss)
|
(676,806 | ) | 164,342 | 181,532 | ||||||||
|
Net
income
|
$ | 7,035,836 | $ | 10,987,820 | $ | 17,003,227 | ||||||
|
CONDENSED
STATEMENTS OF CASH FLOWS
|
||||||||||||
|
Operating
activities:
|
||||||||||||
|
Net
income
|
$ | 7,035,836 | $ | 10,987,820 | $ | 17,003,227 | ||||||
|
Adjustments
to reconcile net income to net cash used in operating
activities:
|
||||||||||||
|
Amortization
of intangibles
|
18,767 | 24,996 | ||||||||||
|
Equity
in undistributed earnings of subsidiary
|
(7,322,965 | ) | (11,481,054 | ) | (17,660,805 | ) | ||||||
|
Other
operating activities
|
(218,940 | ) | (718,390 | ) | (2,674,648 | ) | ||||||
|
Net
cash used in operating activities
|
(506,069 | ) | (1,192,857 | ) | (8,775,498 | ) | ||||||
|
Investing
activities:
|
||||||||||||
|
Payments
for investments in and advances to subsidiary
|
- | - | - | |||||||||
|
Repayments
of advances to subsidiary
|
- | - | - | |||||||||
|
Upstream
dividend received from First South Bank
|
8,281,493 | 11,156,103 | 14,200,140 | |||||||||
|
Net
cash provided by investing activities
|
8,281,493 | 11,156,103 | 14,200,140 | |||||||||
|
Financing
activities:
|
||||||||||||
|
Proceeds
from exercise of stock options
|
6,271 | 640,063 | 3,459,780 | |||||||||
|
Purchase
of treasury shares
|
- | (2,845,412 | ) | (6,722,276 | ) | |||||||
|
Cash
paid for dividends
|
(7,790,977 | ) | (7,715,777 | ) | (7,342,722 | ) | ||||||
|
Net
cash used in financing activities
|
(7,784,706 | ) | (9,921,126 | ) | (10,605,218 | ) | ||||||
|
Net
increase (decrease) in cash
|
(9,282 | ) | 42,120 | 287,692 | ||||||||
|
Cash
at beginning of year
|
2,003,541 | 1,961,421 | 1,673,729 | |||||||||
|
Cash
at end of year
|
$ | 1,994,259 | $ | 2,003,541 | $ | 1,961,421 | ||||||
35
16.
QUARTERLY FINANCIAL DATA (UNAUDITED)
Summarized
unaudited quarterly financial data for the years ended December 31, 2009 and
2008 is as follows (dollars in thousands):
|
Fourth
|
Third
|
Second
|
First
|
|||||||||||||
|
2009:
|
||||||||||||||||
|
Interest
income
|
$ | 11,851 | $ | 12,196 | $ | 12,442 | $ | 12,571 | ||||||||
|
Interest
expense
|
2,997 | 3,922 | 4,546 | 4,629 | ||||||||||||
|
Provision
for credit losses
|
2,700 | 1,260 | 1,700 | 1,520 | ||||||||||||
|
Noninterest
income
|
2,525 | 2,401 | 3,213 | 2,821 | ||||||||||||
|
Noninterest
expense
|
6,299 | 6,530 | 6,514 | 6,002 | ||||||||||||
|
Income
tax expense
|
871 | 1,123 | 1,135 | 1,236 | ||||||||||||
|
Net
income
|
$ | 1,509 | $ | 1,762 | $ | 1,760 | $ | 2,005 | ||||||||
|
Net
income per common share
|
||||||||||||||||
|
Basic
|
$ | .15 | $ | .18 | $ | .18 | $ | .21 | ||||||||
|
Diluted
|
$ | .15 | $ | .18 | $ | .18 | $ | .21 | ||||||||
|
Fourth
|
Third
|
Second
|
First
|
|||||||||||||
|
2008:
|
||||||||||||||||
|
Interest
income
|
$ | 13,372 | $ | 14,389 | $ | 15,219 | $ | 16,383 | ||||||||
|
Interest
expense
|
5,078 | 5,411 | 6,045 | 6,783 | ||||||||||||
|
Provision
for credit losses
|
1,150 | 1,745 | 1,149 | - | ||||||||||||
|
Noninterest
income
|
2,149 | 2,441 | 2,821 | 2,674 | ||||||||||||
|
Noninterest
expense
|
5,987 | 6,322 | 5,896 | 5,960 | ||||||||||||
|
Income
tax expense
|
1,287 | 1,296 | 1,938 | 2,413 | ||||||||||||
|
Net
income
|
$ | 2,019 | $ | 2,056 | $ | 3,012 | $ | 3,901 | ||||||||
|
Net
income per common share
|
||||||||||||||||
|
Basic
|
$ | .21 | $ | .21 | $ | .31 | $ | .40 | ||||||||
|
Diluted
|
$ | .21 | $ | .20 | $ | .31 | $ | .40 | ||||||||
17.
FAIR VALUES OF FINANCIAL INSTRUMENTS
Financial
accounting standards require the disclosure of estimated fair values for
financial instruments. Quoted market prices, if available, are utilized as an
estimate of the fair value of financial instruments. Because no quoted market
prices exist for a significant part of the Company's financial instruments, the
fair value of such instruments has been derived based on management's
assumptions with respect to future economic conditions, the amount and timing of
future cash flows and estimated discount rates with respect to future economic
conditions, the amount and timing of future cash flows and estimated discount
rates. Different assumptions could significantly affect these estimates.
Accordingly, the net realizable value could be materially different from the
estimates presented below. In addition, the estimates are only indicative of
individual financial instruments' values and should not be considered an
indication of the fair value of the Company taken as a whole.
Fair
values have been estimated using data which management considers as the best
available, and estimation methodologies deemed suitable for the pertinent
category of financial instrument. The estimation methodologies,
resulting fair values, and recorded carrying amounts at December 31, 2009 and
2008 were as follows:
Cash and
cash equivalents are by definition short-term and do not present any
unanticipated credit issues. Therefore, the carrying amount is a reasonable
estimate of fair value. The estimated fair values of investment securities and
mortgage-backed securities are provided in Notes 2 and 3 to the financial
statements. These are based on quoted market prices, when available. If a quoted
market price is not available, fair value is estimated using quoted market
prices for similar securities.
The fair
value of the net loan portfolio has been estimated using the present value of
expected cash flows, discounted at an interest rate adjusted for servicing costs
and giving consideration to estimated prepayment risk and credit loss factors,
as follows:
36
17.
FAIR VALUES OF FINANCIAL INSTRUMENTS (Continued)
|
December 31, 2009
|
December 31, 2008
|
|||||||||||||||
|
Estimated
fair value
|
Carrying amount
|
Estimated
fair value
|
Carrying
amount
|
|||||||||||||
|
1 -
4 family mortgages
|
$ | 52,859,820 | $ | 51,820,569 | $ | 47,316,937 | $ | 46,128,989 | ||||||||
|
Consumer
|
89,057,502 | 88,892,520 | 102,289,498 | 101,303,120 | ||||||||||||
|
Non-residential
|
517,942,429 | 517,942,429 | 597,299,188 | 597,299,188 | ||||||||||||
|
Total
|
$ | 659,859,751 | $ | 658,655,518 | $ | 746,905,623 | $ | 744,731,297 | ||||||||
The fair
value of deposit liabilities with no stated maturities has been estimated to
equal the carrying amount (the amount payable on demand), totaling $247,644,753
and $249,921,423 at December 31, 2009 and 2008, respectively. The fair value
estimates for these products do not reflect the benefits that the Bank receives
from the low-cost, long-term funding they provide. These benefits are considered
significant.
The fair
value of certificates of deposit and advances from the FHLB is estimated by
discounting the future cash flows using the current rates offered for similar
deposits and advances with the same remaining maturities. The carrying value and
estimated fair values of certificates of deposit and FHLB advances at December
31, 2009 and 2008 are as follows:
|
2009
|
2008
|
|||||||
|
Certificates
of deposit:
|
||||||||
|
Carrying
amount
|
$ | 440,866,305 | $ | 466,505,373 | ||||
|
Estimated
fair value
|
444,572,051 | 473,896,700 | ||||||
|
Advances
for Federal Home Loan Bank:
|
||||||||
|
Carrying
amount
|
$ | 35,000,000 | $ | 45,000,000 | ||||
|
Estimated
fair value
|
35,550,962 | 45,496,419 | ||||||
The
carrying amount of accrued interest receivable, FHLB stock, notes receivable,
junior subordinated debentures, accrued interest payable, and repurchase
agreements approximates their fair value.
There is
no material difference between the carrying amount and estimated fair value of
off-balance sheet items totaling $98,101,000 and $120,316,000 at December 31,
2009 and 2008, respectively, which are primarily comprised of unfunded loan
commitments.
A fair
value hierarchy prioritizes the inputs of valuation techniques used to measure
fair value of nonfinancial assets and liabilities. The inputs are evaluated and
an overall level for the fair value measurement is determined. This overall
level is an indication of the market observability of the fair value
measurement. Financial accounting standards clarify fair value in terms of the
price in an orderly transaction between market participants to sell an asset or
transfer a liability in the principal (or most advantageous) market for the
asset or liability at the measurement date (an exit price). In order to
determine the fair value or the exit price, the Bank must determine the unit of
account, highest and best use, principal market, and market
participants. These determinations allow the Bank to define the
inputs for fair value and level of hierarchy.
Outlined
below is the application of the fair value hierarchy to the Bank’s financial
assets that are carried at fair value.
Level
1-inputs to the valuation methodology are quoted prices (unadjusted) in active
markets for identical assets or liabilities that the reporting entity has the
ability to access at the measurement date. A quoted price in an active market
provides the most reliable evidence of fair value and shall be used to measure
fair value whenever available. The type of assets carried at Level 1 fair value
generally includes investments such as U. S. Treasury and U. S. government
agency securities.
Level
2-inputs to the valuation methodology include quoted prices for similar assets
or liabilities in active markets and price quotations can vary substantially
either over time or among market makers. The type of assets carried at Level 2
fair value generally includes investment securities such as Government Sponsored
Enterprises (“GSEs”) and the Bank’s investment in other real estate
owned.
37
18.
FAIR VALUE HIERACHY (Continued)
Level
3-inputs to the valuation methodology are unobservable to the extent that
observable inputs are not available. Unobservable inputs are
developed based on the best information available in the circumstances and might
include the Bank’s own assumptions. The Bank shall not ignore
information about market participant assumptions that is reasonably available
without undue cost and effort. The type of assets carried at Level 3 fair value
generally include investments backed by non-traditional mortgage loans or
certain state or local housing agency obligations, of which the Bank
has no such assets or liabilities.
Assets
measured at fair value on a recurring basis at December 31, 2009 and 2008 were
as follows:
|
Quoted Prices
in Active
Markets for
Identical Assets
|
Significant
Other
Observable
Inputs
|
Significant
Unobservable
Inputs
|
||||||||||||||
|
Description
|
12-31-09
|
(Level 1)
|
(Level 2)
|
(Level 3)
|
||||||||||||
|
Available
for sale securities:
|
||||||||||||||||
|
Investment
|
$ | 407,317 | $ | 407,317 | $ | - | $ | - | ||||||||
|
Mortgage-backed
|
96,725,468 | - | 96,725,468 | - | ||||||||||||
|
Other
real estate owned
|
10,561,071 | - | 10,561,071 | - | ||||||||||||
|
Total
December 31, 2009
|
$ | 107,693,856 | $ | 407,317 | $ | 107,286,539 | $ | - | ||||||||
|
Quoted Prices
in Active
Markets for
Identical Assets
|
Significant
Other
Observable
Inputs
|
Significant
Unobservable
Inputs
|
||||||||||||||
|
Description
|
12-31-08
|
(Level 1)
|
(Level 2)
|
(Level 3)
|
||||||||||||
|
Available
for sale securities:
|
||||||||||||||||
|
Investment
|
$ | 36,563,646 | $ | 343,642 | $ | 36,220,004 | $ | - | ||||||||
|
Mortgage-backed
|
31,995,157 | - | 31,995,157 | - | ||||||||||||
|
Other
real estate owned
|
7,710,560 | - | 7,710,560 | - | ||||||||||||
|
Total
December 31, 2008
|
$ | 76,269,363 | $ | 343,642 | $ | 75,925,721 | $ | - | ||||||||
Assets
measured at fair value on a non-recurring basis at December 31, 2009 and 2008
were as follows:
|
Quoted Prices
in Active
Markets for
Identical Assets
|
Significant
Other
Observable
Inputs
|
Significant
Unobservable
Inputs
|
||||||||||||||
|
Description
|
12-31-09
|
(Level 1)
|
(Level 2)
|
(Level 3)
|
||||||||||||
|
Impaired
loans, net of specific allowance
|
$ | 17,850,368 | $ | - | $ | 17,850,368 | $ | - | ||||||||
|
Total
December 31, 2009
|
$ | 17,850,368 | $ | - | $ | 17,850,368 | $ | - | ||||||||
|
Quoted Prices
in Active
Markets for
Identical Assets
|
Significant
Other
Observable
Inputs
|
Significant
Unobservable
Inputs
|
||||||||||||||
|
Description
|
12-31-08
|
(Level 1)
|
(Level 2)
|
(Level 3)
|
||||||||||||
|
Impaired
loans, net of specific allowance
|
$ | 6,595,975 | $ | - | $ | 6,595,975 | $ | - | ||||||||
|
Total
December 31, 2008
|
$ | 6,595,975 | $ | - | $ | 6,595,975 | $ | - | ||||||||
Quoted
market price for similar assets in active markets is the valuation technique for
determining fair value of available for sale securities. Unrealized gains on
available for sale securities are included in the “accumulated other
comprehensive income” component of the Stockholders’ Equity section of the
Consolidated Statements of Financial Condition.
38
18.
FAIR VALUE HIERACHY (Continued)
The
Company does not record loans at fair value on a recurring basis. However, when
a loan is considered impaired, and an allowance for loan losses is established
based on the estimated fair value of the loan. The fair value of impaired loans
is estimated using one of several methods, including collateral value, market
value of similar debt, enterprise value, liquidation value and discounted cash
flows. Those impaired loans not requiring an allowance represent loans for which
the fair value of the expected repayments or collateral exceed the recorded
investments in such loans. Impaired loans where a specific allowance is
established based on the fair value of collateral require classification in the
fair value hierarchy. When the fair value of the collateral is based on an
observable market price or a current appraised value, the Company records the
impaired loan as nonrecurring Level 2. When an appraised value is not available
or management determines the fair value of the collateral is further impaired
below the appraised value and there is no observable market price, the Company
classifies the impaired loan as nonrecurring Level 3.
Other
real estate owned acquired through loan foreclosure is recorded at fair value
upon transfer of the loans to foreclosed assets, based on the appraised market
value of the property. Subsequently, foreclosed assets are carried at the lower
of carrying value or fair value. Fair value is based upon independent market
prices, appraised values of the collateral or management’s estimation of the
value of the collateral. When the fair value of the collateral is based on an
observable market price or a current appraised value, the Company records the
foreclosed asset as nonrecurring Level 2. When an appraised value is not
available or management determines the fair value of the collateral is further
impaired below the appraised value and there is no observable market price, the
Company classifies the foreclosed asset as nonrecurring Level 3. Fair value
adjustments of $2.2 million and $772,000 were made to other real estate owned
during the years ended December 31, 2009 and 2008, respectively. Loss
on sale of other real estate owned realized and included in earnings for years
ending December 31, 2009 and 2008 was $200,732 and $80,542,
respectively.
No
liabilities were measured at fair value on a recurring basis during the year
ended December 31, 2009 and 2008.
19.
SUPPLEMENTAL CASH FLOW INFORMATION
Supplemental
cash flow information for the years ended December 31, 2009, 2008 and 2007 is as
follows:
|
Year ended December 31,
|
||||||||||||
|
2009
|
2008
|
2007
|
||||||||||
|
Real
estate acquired in settlement of loans
|
$ | 15,838,273 | $ | 10,882,390 | $ | 1,594,724 | ||||||
|
Exchange
of loans for mortgage-backed securities
|
75,485,932 | 3,399,071 | 6,873,490 | |||||||||
|
Cash
paid for interest
|
16,135,628 | 23,358,551 | 29,053,118 | |||||||||
| 5,712,432 | 7,567,051 | 8,705,060 | ||||||||||
|
Dividends
declared, not paid
|
1,948,459 | 1,947,619 | 1,863,644 | |||||||||
20.
JUNIOR SUBORDINATED DEBENTURES
The
Company has sponsored a trust, First South Preferred Trust I (the Trust), of
which 100% of the common equity is owned by the Company. The Trust was formed
for the purpose of issuing company-obligated preferred trust securities (the
Preferred Trust Securities) to third-party investors and investing the proceeds
from the sale of such Preferred Trust Securities solely in junior subordinated
debt securities of the Company (the Debentures). The Debentures held by the
Trust are the sole assets of the Trust. Distributions on the Preferred Trust
Securities issued by the Trust are payable quarterly at a rate equal to the
interest rate being earned by the Trust on the Debentures held by that Trust.
The Preferred Trust Securities are subject to mandatory redemption, in whole or
in part, upon repayment of the Debentures. The Company has entered into an
agreement, which fully and unconditionally guarantees the Preferred Trust
Securities subject to the terms of the guarantee. The Debentures held by the
Trust are first redeemable, in whole or in part, by the Company on or after
September 30, 2008.
In the
fourth quarter of 2003, as a result of applying the provisions of GAAP,
governing when an equity interest should be consolidated, the Company was
required to deconsolidate the subsidiary Trust from its financial statements.
The deconsolidation of the net assets and results of operations of the Trust had
virtually no impact on the Company's financial statements or liquidity position
since the Company continues to be obligated to repay the Debentures held by the
Trust and guarantees repayment of the Preferred Trust Securities issued by the
Trust. The consolidated debt obligation related to the Trust increased from $10
million to $10.3 million upon deconsolidation with the difference representing
the Company's common ownership interest in the Trust. Subject to certain
limitations, the Junior Subordinated Debentures qualify as Tier 1 capital for
the Company under Federal Reserve Board guidelines.
39
20.
JUNIOR SUBORDINATED DEBENTURES (Continued)
Consolidated
debt obligations as of December 31, 2009 related to a subsidiary Trust holding
solely Debentures of the Company follows:
|
LIBOR
+ 2.95% junior subordinated debentures owed to First South Preferred Trust
I due September 26, 2033
|
$ | 10,000,000 | ||
|
LIBOR
+ 2.95% junior subordinated debentures owed to First South Preferred Trust
I due September 26, 2033
|
310,000 | |||
|
Total
junior subordinated debentures owed to unconsolidated subsidiary
trust
|
$ | 10,310,000 |
21.
RELATED PARTY TRANSACTIONS
The
Company had loans outstanding to executive officers, directors and their
affiliated companies. Management believes that these loans are made and
processed on the same basis as loans to non-related parties. An analysis of the
activity with respect to such aggregate extensions of credit to related parties
is as follows:
|
Extensions
of credit at December 31, 2008
|
$ | 1,398,782 | ||
|
New
extensions of credit made during the year
|
- | |||
|
Repayments
during the year
|
(320,933 | ) | ||
|
Extensions
of credit at December 31, 2009
|
$ | 1,077,849 |
22.
SUBSEQUENT EVENTS
The
Company has evaluated all subsequent events through March 8, 2010, the date the
consolidated statements of financial condition of the Company as of December 31,
2009 and the related consolidated statements of operations, changes in
stockholders' equity, and cash flows for each of the year then ended were
available to be issued. No events have occurred subsequent to December 31, 2009
and through March 8, 2010 that would require adjustment to or disclosure in the
financial information referred to in these financial
statements.
40
|
BOARD
OF DIRECTORS
|
||||||
|
Frederick
N. Holscher
|
Marshall
T. Singleton
|
Linley
H. Gibbs, Jr.
|
Frederick
H. Howdy
|
|||
|
Chairman
|
Vice
Chairman
|
Retired
|
President
|
|||
|
Partner
Rodman,
Holscher,
|
Co-Owner
B.
E. Singleton & Sons
|
Washington,
NC
|
Drs.
Freshwater & Howdy,
P.A.
|
|||
|
Francisco,
& Peck, P.A.
|
Washington,
NC
|
Washington,
NC
|
||||
|
Washington,
NC
|
||||||
|
Charles
E. Parker, Jr.
|
H.
D. Reaves, Jr.
|
Thomas
A. Vann
|
||||
|
Senior
Vice President
|
Former
President and
|
President
and
|
||||
|
Robinson
& Stith Insurance
|
Chief
Executive Officer
|
Chief
Executive Officer
|
||||
|
New
Bern, NC
|
Home
Federal Savings & Loan
|
First
South Bank
|
||||
|
Fayetteville,
NC
|
Washington,
NC
|
|||||
|
EXECUTIVE
OFFICERS
|
||||||
|
Thomas
A. Vann
|
J.
Randy Woodson
|
William
L. Wall
|
John
F. Nicholson, Jr.
|
|||
|
President
and
|
Executive
Vice President
|
Executive
Vice President
|
Executive
Vice President
|
|||
|
Chief
Executive Officer
|
Chief
Operating Officer
|
Chief
Financial Officer and
|
Chief
Credit Officer
|
|||
|
Secretary
|
||||||
|
Paul
S. Jaber
|
Sherry
L. Correll
|
Mary
R. Boyd
|
Kristie
W. Hawkins
|
|||
|
Executive
Vice President
|
Executive
Vice President
|
Executive
Vice President
|
Treasurer
and
|
|||
|
Mortgage
Lending
|
Bank
Operations
|
Loan
Servicing
|
Controller
|
|||
|
AREA
EXECUTIVES
|
||||||
|
Otto
C. Burrell, Jr.
|
Robert
M. Hertenstein
|
Kenneth
K. Howard, Jr.
|
Dennis
A. Nichols
|
|||
|
Senior
Vice President
|
Senior
Vice President
|
Senior
Vice President
|
Senior
Vice President
|
|||
|
Area
Executive
|
Area
Executive
|
Area
Executive
|
Area
Executive
|
|||
|
Coastal
Region
|
Cape
Fear Region
|
Tar
Region
|
Neuse/Pamlico
Region
|
|||
|
CITY
AND SUBSIDIARY EXECUTIVES
|
||||||
|
Eric
S. Clark
|
Jerry
G. Hannah
|
Joseph
M. Johnson
|
Thomas
S. Lewis
|
|||
|
Vice
President
|
Vice
President
|
Senior
Vice President
|
Vice
President
|
|||
|
City
Executive
|
City
Executive
|
City
Executive
|
City
Executive
|
|||
|
Greenville,
NC
|
Kinston,
NC
|
Durham,
NC
|
Rocky
Mount, NC
|
|||
|
Kenneth
W. Marshall, Jr.
|
Rhonda
B. McLeod
|
Robert
C. Pfeiffer
|
William
P. Stone
|
|||
|
Vice
President
|
Vice
President
|
Senior
Vice President
|
Vice
President
|
|||
|
City
Executive
|
City
Executive
|
City
Executive
|
City
Executive
|
|||
|
Outer
Banks, NC
|
Hope
Mills, NC
|
Elizabeth
City, NC
|
Lumberton,
NC
|
|||
|
Michael
M. Wooles
|
Donnie
L. G. Bunn
|
|||||
|
Senior
Vice President
|
President
|
|||||
|
City
Executive
|
First
South Leasing, LLC
|
|||||
|
Washington,
NC
|
Greenville,
NC
|
|||||
41
FIRST
SOUTH BANK OFFICE LOCATIONS
|
Buxton
|
Hope
Mills
|
Raleigh
|
||
|
47560
NC Highway 12
|
3103
North Main Street
|
4800
Six Forks Road
|
||
|
Buxton,
NC 27920
|
Hope
Mills, NC 28348
|
Suite
115
|
||
|
(252)
995-3250
|
(910)
423-0952
|
Raleigh,
NC 27609
|
||
|
(919)
783-5222
|
||||
|
Chocowinity
|
Kinston
|
|||
|
2999
Highway 17 South
|
2430
Herritage Street
|
Tarboro
|
||
|
Chocowinity,
NC 27817
|
Kinston,
NC 28504
|
100
East Hope Lodge Street
|
||
|
(252)
940-4970
|
(252)
523-9449
|
Tarboro,
NC 27886
|
||
|
(252)
823-0157
|
||||
|
Dunn
|
Lumberton
|
|||
|
904-A
West Broad Street
|
600
North Chestnut Street
|
Washington
|
||
|
Dunn,
NC 28334
|
Lumberton,
NC 28358
|
1311
Carolina Avenue
|
||
|
(910)
892-2861
|
(910)
739-3274
|
Washington,
NC 27889
|
||
|
(252)
946-4178
|
||||
|
Durham
|
3000
North Elm Street
|
|||
|
4215-01
University Drive
|
Lumberton,
NC 28359
|
300
North Market Street
|
||
|
Durham,
NC 27707
|
(910)
608-5031
|
Washington,
NC 27889
|
||
|
(919)
403-1000
|
(252)
940-4945
|
|||
|
Nags
Head
|
||||
|
Elizabeth
City
|
2236
South Croatan Highway
|
1328
John Small Avenue
|
||
|
604
East Ehringhaus Street
|
Suite
6
|
Washington,
NC 27889
|
||
|
Elizabeth
City, NC 27909
|
Nags
Head, NC 27959
|
(252)
940-5000
|
||
|
(252)
335-0848
|
(252)
441-9935
|
|||
|
Wilmington
|
||||
|
Fayetteville
|
New
Bern
|
2601
Irongate Drive
|
||
|
241
Green Street
|
202
Craven Street
|
Suite
102
|
||
|
Fayetteville,
NC 28301
|
New
Bern, NC 28560
|
Wilmington,
NC 28412
|
||
|
(910)
483-3681
|
(252)
636-2997
|
(910)-798-6102
|
||
|
705
Executive Place
|
1725
Glenburnie Road
|
|||
|
Fayetteville,
NC 28305
|
New
Bern, NC 28562
|
Loan
Production Office
|
||
|
(910)
484-2116
|
(252)
636-3569
|
3210
North Croatan Highway
|
||
|
Kill
Devil Hills, NC 27948
|
||||
|
Grantsboro
|
Rocky
Mount
|
(252)
441-9834
|
||
|
11560
NC Highway 55
|
300
Sunset Avenue
|
|||
|
Suite
11
|
Rocky
Mount, NC 27804
|
|||
|
Grantsboro,
NC 28529
|
(252)
972-9661
|
First
South Leasing
|
||
|
(252)
745-5001
|
1035
Director Court, Unit C
|
|||
|
2901
Sunset Avenue
|
Greenville,
NC 27858
|
|||
|
Greenville
|
Rocky
Mount, NC 27804
|
(252)
355-4536
|
||
|
301
East Arlington Blvd
|
(252)
451-1259
|
|||
|
Greenville,
NC 27858
|
||||
|
(252)
321-2600
|
1378
Benvenue Road
|
Operations
Center and
|
||
|
Rocky
Mount, NC 27804
|
Credit
Administration
|
|||
|
907
East Firetower Road
|
(252)
442-8375
|
220
Creekside Drive
|
||
|
Greenville,
NC 27835
|
Washington,
NC 27889
|
|||
|
(252)
355-4644
|
3635
North Halifax Road
|
(252)
946-4178
|
||
|
Rocky
Mount, NC 27804
|
||||
|
1707
SE Greenville Blvd
|
(252)
451-8700
|
|||
|
Greenville,
NC 27858
|
||||
|
(252)752-2770
|
|
Member
FDIC
|
 |
42
STOCKHOLDER
INFORMATION
|
Corporate
Headquarters
|
|
|
First
South Bancorp, Inc.
|
Telephone: 252-946-4178
|
|
1311
Carolina Avenue
|
Fax: 252-946-3873
|
|
Washington,
NC 27889
|
E-mail: info@firstsouthnc.com
|
|
Website: www.firstsouthnc.com
|
Stock
Listing Information
The
Company's common stock is listed and trades on the NASDAQ Global Select Market
under the symbol FSBK. There were 779 registered stockholders of record as of
March 8, 2010.
Stock
Price Information
The
following table presents the high and low trading price information and
dividends declared per share for the periods indicated.
|
Quarter Ended
|
High
|
Low
|
Dividends
|
|||||||||
|
March
31, 2009
|
$ | 13.58 | $ | 5.80 | $ | .20 | ||||||
|
June
30, 2009
|
12.69 | 9.00 | .20 | |||||||||
|
September
30, 2009
|
13.90 | 11.00 | .20 | |||||||||
|
December
31, 2009
|
11.95 | 9.88 | .20 | |||||||||
|
March
31, 2008
|
$ | 23.49 | $ | 18.17 | $ | .20 | ||||||
|
June
30, 2008
|
23.48 | 12.88 | .20 | |||||||||
|
September
30, 2008
|
20.00 | 12.77 | .20 | |||||||||
|
December
31, 2008
|
17.50 | 9.50 | .20 | |||||||||
Registrar
and Transfer Agent
Inquiries
regarding stock transfer, registration, lost certificates or changes in name and
address should be directed to the Company’s stock registrar and transfer agent:
Registrar and Transfer Company, 10 Commerce Drive, Cranford, New Jersey 07016;
via the Internet at www.rtco.com; or toll-free at
800-866-1340.
Form
10-K
The
Annual Report on Form 10-K of the Company as filed with the Securities and
Exchange Commission is available via the Internet on the Company’s website at
www.firstsouthnc.com under the headings
“About Us – Newsroom - SEC Filings: EDGAR-Online”. Shareholders will
be provided a copy without charge by writing to the Corporate Secretary, William
L. Wall, First South Bancorp, Inc., P. O. Box 2047, Washington, NC
27889.
Investor
Information
Shareholders,
investors, and analysts interested in additional information may contact William
L. Wall, Chief Financial Officer, First South Bancorp, Inc., P. O. Box 2047,
Washington, NC 27889; or via email to bill.wall@firstsouthnc.com.
Annual
Meeting
The
Annual Meeting of Stockholders of First South Bancorp, Inc. will be held
Thursday, May 20, 2010 at 11:00 a.m. eastern time, at the main office of First
South Bank, 1311 Carolina Avenue, Washington, North Carolina.
|
General
Counsel
|
Special
Counsel
|
Independent
Accountants
|
|
Rodman,
Holscher, Francisco & Peck, P.A.
|
Gaeta
& Eveson, P.A.
|
Turlington
and Company, L.L.P.
|
|
320
North Market Street
|
700
Spring Forest Road, Suite 335
|
509
East Center Street
|
|
Washington,
NC 27889
|
Raleigh,
NC 27609
|
Lexington,
NC 27292
|
43
COMPARATIVE
STOCK PERFORMANCE GRAPH
The graph
and table which follow show the cumulative total return on the Common Stock for
the period from December 31, 2004 through December 31, 2009 with (1) the total
cumulative return of all companies whose equity securities are traded on the
NASDAQ Stock Market and (2) the total cumulative return of banking companies
traded on the NASDAQ Stock Market. The comparison assumes $100 was invested on
December 31, 2004 in the Company’s Common Stock and in each of the foregoing
indices and assumes reinvestment of dividends. The stockholder
returns shown on the performance graph are not necessarily indicative of the
future performance of the Common Stock or of any particular index.
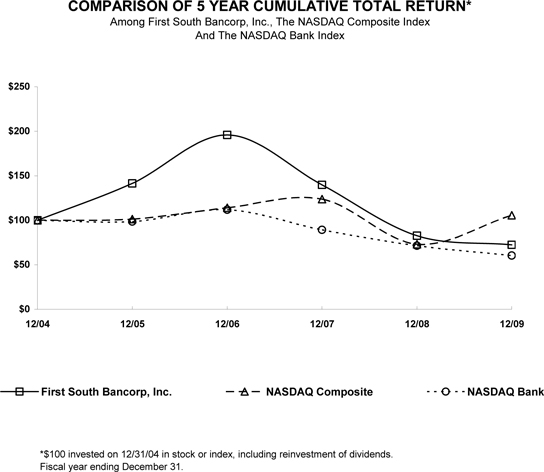
|
12/31/04
|
12/31/05
|
12/31/06
|
12/31/07
|
12/31/08
|
12/31/09
|
|||||||||||||||||||
|
First
South Bancorp Inc.
|
$ | 100.00 | $ | 141.37 | $ | 195.82 | $ | 139.71 | $ | 82.65 | $ | 72.50 | ||||||||||||
|
NASDAQ
|
$ | 100.00 | $ | 101.33 | $ | 114.01 | $ | 123.71 | $ | 73.11 | $ | 105.61 | ||||||||||||
|
NASDAQ
Bank
|
$ | 100.00 | $ | 98.57 | $ | 111.92 | $ | 89.33 | $ | 71.39 | $ | 60.47 | ||||||||||||
44
First
South Bancorp
1311
Carolina Avenue
P.O. Box
2047
Washington,
North Carolina 27889
(252)
946-4178 • Fax (252) 946-3873
www.firstsouthnc.com