Attached files
| file | filename |
|---|---|
| 10-K - 10-K - INTERNATIONAL BANCSHARES CORP | a2196658z10-k.htm |
| EX-23 - EX-23 - INTERNATIONAL BANCSHARES CORP | a2196658zex-23.htm |
| EX-21 - EX-21 - INTERNATIONAL BANCSHARES CORP | a2196658zex-21.htm |
| EX-31.B - EX-31.B - INTERNATIONAL BANCSHARES CORP | a2196658zex-31_b.htm |
| EX-99.B - EX-99.B - INTERNATIONAL BANCSHARES CORP | a2196658zex-99_b.htm |
| EX-31.A - EX-31.A - INTERNATIONAL BANCSHARES CORP | a2196658zex-31_a.htm |
| EX-32.B - EX-32.B - INTERNATIONAL BANCSHARES CORP | a2196658zex-32_b.htm |
| EX-99.A - EX-99.A - INTERNATIONAL BANCSHARES CORP | a2196658zex-99_a.htm |
| EX-32.A - EX-32.A - INTERNATIONAL BANCSHARES CORP | a2196658zex-32_a.htm |
QuickLinks -- Click here to rapidly navigate through this document
INTERNATIONAL BANCSHARES CORPORATION AND SUBSIDIARIES
(Consolidated)
The following consolidated selected financial data is derived from the Corporation's audited financial statements as of and for the five years ended December 31, 2009. The following consolidated financial data should be read in conjunction with Management's Discussion and Analysis of Financial Condition and Results of Operations and the Consolidated Financial Statements and related notes in this report.
| |
AS OF OR FOR THE YEARS ENDED DECEMBER 31, | |||||||||||||||||
|---|---|---|---|---|---|---|---|---|---|---|---|---|---|---|---|---|---|---|
| |
2009 | 2008 | 2007 | 2006 | 2005 | |||||||||||||
| |
(Dollars in Thousands, Except Per Share Data) |
|||||||||||||||||
STATEMENT OF CONDITION |
||||||||||||||||||
Assets |
$ | 11,762,543 | $ | 12,439,341 | $ | 11,167,161 | $ | 10,911,454 | $ | 10,391,853 | ||||||||
Net loans |
5,571,869 | 5,799,372 | 5,474,902 | 4,970,273 | 4,547,896 | |||||||||||||
Deposits |
7,178,007 | 6,858,784 | 7,157,606 | 6,989,918 | 6,656,426 | |||||||||||||
Other borrowed funds |
1,347,625 | 2,522,986 | 1,456,936 | 2,095,576 | 1,870,075 | |||||||||||||
Junior subordinated deferrable interest debentures |
201,082 | 201,048 | 200,929 | 210,908 | 236,391 | |||||||||||||
Shareholders' equity |
1,407,470 | 1,257,297 | 935,905 | 842,056 | 792,867 | |||||||||||||
INCOME STATEMENT |
||||||||||||||||||
Interest income |
$ | 527,377 | $ | 564,603 | $ | 643,573 | $ | 609,073 | $ | 508,705 | ||||||||
Interest expense |
139,796 | 231,731 | 333,340 | 319,588 | 206,830 | |||||||||||||
Net interest income |
387,581 | 332,872 | 310,233 | 289,485 | 301,875 | |||||||||||||
Provision (credit) for probable loan losses |
58,833 | 19,813 | (1,762 | ) | 3,849 | 960 | ||||||||||||
Non-interest income |
201,013 | 189,809 | 165,363 | 176,971 | 167,222 | |||||||||||||
Non-interest expense |
309,031 | 301,226 | 300,282 | 288,717 | 255,988 | |||||||||||||
Income before income taxes |
220,730 | 201,642 | 177,076 | 173,890 | 212,149 | |||||||||||||
Income taxes |
77,988 |
69,530 |
55,764 |
56,889 |
71,370 |
|||||||||||||
Net income |
142,742 | 132,112 | 121,312 | 117,001 | 140,779 | |||||||||||||
Preferred stock dividends |
12,984 | — | — | — | — | |||||||||||||
Net income available to common shareholders |
$ | 129,758 | $ | 132,112 | $ | 121,312 | $ | 117,001 | $ | 140,779 | ||||||||
Per common share (Note 1): |
||||||||||||||||||
Basic |
$ | 1.90 | $ | 1.93 | $ | 1.76 | $ | 1.68 | $ | 2.01 | ||||||||
Diluted |
$ | 1.90 | $ | 1.92 | $ | 1.75 | $ | 1.67 | $ | 1.98 | ||||||||
Note 1: Per share information has been re-stated giving retroactive effect to stock dividends distributed.
1
MANAGEMENT'S DISCUSSION AND ANALYSIS OF
FINANCIAL CONDITION AND RESULTS OF OPERATIONS
Management's discussion and analysis represents an explanation of significant changes in the financial position and results of operations of International Bancshares Corporation and subsidiaries (the "Company" or the "Corporation") on a consolidated basis for the three-year period ended December 31, 2009. The following discussion should be read in conjunction with the Company's Annual Report on Form 10-K for the year ended December 31, 2009, and the Selected Financial Data and Consolidated Financial Statements included elsewhere herein.
Special Cautionary Notice Regarding Forward Looking Information
Certain matters discussed in this report, excluding historical information, include forward-looking statements, within the meaning of Section 27A of the Securities Act of 1933, as amended, and Section 21E of the Securities Exchange Act of 1934, as amended, and are subject to the safe harbor created by these sections. Although the Company believes such forward-looking statements are based on reasonable assumptions, no assurance can be given that every objective will be reached. The words "estimate," "expect," "intend," "believe" and "project," as well as other words or expressions of a similar meaning are intended to identify forward-looking statements. Readers are cautioned not to place undue reliance on forward-looking statements, which speak only as of the date of this report. Such statements are based on current expectations, are inherently uncertain, are subject to risks and should be viewed with caution. Actual results and experience may differ materially from the forward-looking statements as a result of many factors.
Risk factors that could cause actual results to differ materially from any results that are projected, forecasted, estimated or budgeted by the Company in forward-looking statements include, among others, the following possibilities:
- •
- Local, regional, national and international economic business conditions and the impact they may have on the Company, the
Company's customers, and such customers' ability to transact profitable business with the Company, including the ability of its borrowers to repay their loans according to their terms or a change in
the value of the related collateral.
- •
- Volatility and disruption in national and international financial markets.
- •
- Government intervention in the U.S. financial system.
- •
- Changes in consumer spending, borrowings and savings habits.
- •
- Changes in interest rates and market prices, which could reduce the Company's net interest margins, asset valuations and
expense expectations.
- •
- Changes in the capital markets utilized by the Company and its subsidiaries, including changes in the interest rate
environment that may reduce margins.
- •
- Changes in state and/or federal laws and regulations to which the Company and its subsidiaries, as well as their
customers, competitors and potential competitors, are subject, including, without limitation, changes in the accounting, tax and regulatory treatment of trust preferred securities, as well as changes
in banking, tax, securities, insurance and employment laws and regulations.
- •
- Changes in U.S.—Mexico trade, including, without limitation, reductions in border crossings and commerce
resulting from the Homeland Security Programs called "US-VISIT," which is derived from Section 110 of the Illegal Immigration Reform and Immigrant Responsibility Act of 1996.
- •
- The loss of senior management or operating personnel.
- •
- Increased competition from both within and outside the banking industry.
2
- •
- The timing, impact and other uncertainties of the Company's potential future acquisitions including the Company's ability
to identify suitable potential future acquisition candidates, the success or failure in the integration of their operations and the Company's ability to maintain its current branch network and to
enter new markets successfully and capitalize on growth opportunities.
- •
- Changes in the Company's ability to pay dividends on its Preferred Stock or Common Stock.
- •
- The effects of the proceedings pending with the Internal Revenue Service regarding the Company's lease financing
transactions.
- •
- Additions to the Company's loan loss allowance as a result of changes in local, national or international conditions which
adversely affect the Company's customers.
- •
- Greater than expected costs or difficulties related to the development and integration of new products and lines of
business.
- •
- Changes in the soundness of other financial institutions with which the Company interacts.
- •
- Political instability in the United States and Mexico.
- •
- Technological changes.
- •
- Acts of war or terrorism.
- •
- Natural disasters.
- •
- Reduced earnings resulting from the write down of the carrying value of securities held in our securities
available-for-sale portfolio following a determination that the securities are other-than-temporarily impaired.
- •
- The effect of changes in accounting policies and practices as may be adopted by the regulatory agencies, as well as the
Public Company Accounting Oversight Board, the Financial Accounting Standards Board and other accounting standards setters.
- •
- The costs and effects of regulatory developments, including the resolution of regulatory or other governmental inquiries
and the results of regulatory examinations or reviews.
- •
- The effect of final rules amending Regulation E that prohibit financial institutions from charging consumer fees for
paying overdrafts on ATM and on-time debit card transactions, unless the consumer consents or ops-in to the overdraft service for those types of transactions.
- •
- The Company's success at managing the risks involved in the foregoing items.
Forward-looking statements speak only as of the date on which such statements are made. It is not possible to foresee or identify all such factors. The Company makes no commitment to update any forward-looking statement, or to disclose any facts, events or circumstances after the date hereof that may affect the accuracy of any forward-looking statement, unless required by law.
Recent Developments
On December 23, 2008, as part of the TARP Capital Purchase Program, the Company entered into a Letter Agreement incorporating an attached Securities Purchase Agreement Standard Terms (collectively the "Securities Purchase Agreement") with the Treasury. The closing of the transactions contemplated in the Securities Purchase Agreement occurred on December 23, 2008.
Under the Securities Purchase Agreement, the Company sold 216,000 shares of the Company's fixed-rate cumulative perpetual preferred stock, Series A, par value $.01 per share (the "Senior Preferred Stock"), having a liquidation preference of $1,000 per share, for a total price of $216,000,000. The Senior Preferred Stock will pay dividends at the rate of 5% per year for the first five years and 9% per year
3
thereafter. The Senior Preferred Stock has no maturity date and ranks senior to the Company's common stock with respect to the payment of dividends and distributions and amounts payable upon liquidation, dissolution and winding up of the Company. The Senior Preferred Stock generally is non-voting except for class voting rights on matters that would adversely affect the rights of the holders of the Senior Preferred Stock. To date, the Company has not redeemed any of the Senior Preferred Stock.
Overview
The Company, which is headquartered in Laredo, Texas, with 280 facilities and more than 435 ATMs, provides banking services for commercial, consumer and international customers of South, Central and Southeast Texas and the State of Oklahoma. The Company is one of the largest independent commercial bank holding companies headquartered in Texas. The Company, through its bank subsidiaries, is in the business of gathering funds from various sources and investing those funds in order to earn a return. The Company either directly or through a bank subsidiary owns two insurance agencies, a liquidating subsidiary, a broker/dealer and a fifty percent interest in an investment banking unit that owns a broker/dealer. The Company's primary earnings come from the spread between the interest earned on interest-bearing assets and the interest paid on interest-bearing liabilities. In addition, the Company generates income from fees on products offered to commercial, consumer and international customers.
A primary goal of the Company is to grow net interest income and non-interest income while adequately managing credit risk, interest rate risk and expenses. Effective management of capital is a critical objective of the Company. A key measure of the performance of a banking institution is the return on average common equity ("ROE"). The Company's ROE for the year ended December 31, 2009 was 11.10% as compared to 13.34% for the year ended December 31, 2008.
The Company is very active in facilitating trade along the United States border with Mexico. The Company does a large amount of business with customers domiciled in Mexico. Deposits from persons and entities domiciled in Mexico comprise a large and stable portion of the deposit base of the Company's bank subsidiaries. The Company also serves the growing Hispanic population through the Company's facilities located throughout South, Central and Southeast Texas and the State of Oklahoma.
Expense control is an essential element in the Company's long-term profitability. As a result, the Company monitors the efficiency ratio, which is a measure of non-interest expense to net interest income plus non-interest income closely. The Company's efficiency ratio has been negatively impacted over the last few years because of the Company's aggressive branch expansion which has added a total of 34 branches during 2008 and 2009. During rapid expansion periods, the Company's efficiency ratio will suffer but the long-term benefits of the expansion should be realized in future periods and the benefits should positively impact the efficiency ratio in future periods. The Company monitors this ratio over time to assess the Company's efficiency relative to its peers taking into account the Company's branch expansion. The Company uses this measure as one factor in determining if the Company is accomplishing its long-term goals of providing superior returns to the Company's shareholders.
4
Results of Operations
Summary
Consolidated Statements of Condition Information
| |
December 31, 2009 | December 31, 2008 | Percent Increase (Decrease) |
|||||||
|---|---|---|---|---|---|---|---|---|---|---|
| |
(Dollars in Thousands) |
|||||||||
Assets |
$ | 11,762,543 | $ | 12,439,341 | (5.4 | )% | ||||
Net loans |
5,571,869 | 5,799,372 | (3.9 | ) | ||||||
Deposits |
7,178,007 | 6,858,784 | 4.7 | |||||||
Other borrowed funds |
1,347,625 | 2,522,986 | (46.6 | ) | ||||||
Junior subordinated deferrable interest debentures |
201,082 | 201,048 | — | |||||||
Shareholders' equity |
1,407,470 | 1,257,297 | 11.9 | |||||||
Consolidated Statements of Income Information
| |
Year Ended December 31, 2009 |
Year Ended December 31, 2008 |
Percent Increase (Decrease) 2009 vs. 2008 |
Year Ended December 31, 2007 |
Percent Increase (Decrease) 2008 vs. 2007 |
||||||||||||
|---|---|---|---|---|---|---|---|---|---|---|---|---|---|---|---|---|---|
| |
(Dollars in Thousands) |
||||||||||||||||
Interest income |
$ | 527,377 | $ | 564,603 | (6.6 | )% | $ | 643,573 | (12.3 | )% | |||||||
Interest expense |
139,796 | 231,731 | (39.7 | ) | 333,340 | (30.5 | ) | ||||||||||
Net interest income |
387,581 | 332,872 | 16.4 | 310,233 | 7.3 | ||||||||||||
Provision (credit) for probable loan losses |
58,833 | 19,813 | 196.9 | (1,762 | ) | (1,224.5 | ) | ||||||||||
Non-interest income |
201,013 | 189,809 | 5.9 | 165,363 | 14.8 | ||||||||||||
Non-interest expense |
309,031 | 301,226 | 2.6 | 300,282 | .3 | ||||||||||||
Net income |
142,742 | 132,112 | 8.0 | 121,312 | 8.9 | ||||||||||||
Net income available to common shareholders |
129,758 | 132,112 | (1.8 | ) | 121,312 | 8.9 | |||||||||||
Per common share: |
|||||||||||||||||
Basic |
$ | 1.90 | $ | 1.93 | (1.6 | )% | $ | 1.76 | 9.7 | % | |||||||
Diluted |
1.90 | 1.92 | (1.0 | ) | 1.75 | 9.7 | |||||||||||
Net Income
Net income for the year ended December 31, 2009 increased by 8.0% compared to the same period in 2008 despite the $25.4 million, after tax, increase in the provision for probable loan losses charged to expense during 2009. Additionally, an industry-wide FDIC special assessment negatively impacted the Company's earnings by $3.3 million, after tax in the second quarter. The increase in the provision was prompted by management's analysis of the general weakness in the economy and the impact of that weakness on the Company's loan portfolio and the related allowance for probable loan losses. Additionally, net income for 2009 was positively affected by the increasing net interest margin of the Company. While the Texas and Oklahoma economies are performing better than other parts of the country, Texas and Oklahoma are not immune to the problems associated with the U.S. economy. The substantial increase in the provision for probable loan losses is not necessarily an indicator that more credits will worsen to the point that the Company will have to continue to record provisions for probable loan losses at these levels in future periods.
Net income for the year ended December 31, 2008 was also negatively impacted by increases in the provision for probable loan losses charged to expense. Net income for the year ended December 31, 2007
5
was positively affected by the credit for probable loan losses recorded in 2007. Net income for the year ended December 31, 2007 was negatively impacted by an impairment charge of $13.1 million, after tax, on certain investments. A significant portion of the impairment charge was the result of the Company's strategic sale of certain investment securities in the second quarter of 2007 with the proceeds from the sales used to reduce Federal Home Loan Bank ("FHLB") borrowings. Net income for the same period was positively affected by the sale of the securities, which generated gains of $1.5 million, after tax. The investments sold were certain hybrid mortgage-backed securities with a coupon re-set date that exceeded 30 months and a weighted average yield to coupon re-set that was approximately 100 basis points less than the FHLB certificate of indebtedness short-term rate. The sale of the securities facilitated a re-positioning of the balance sheet to a more neutral position in terms of interest rate risk and also improved operating ratios.
Net Interest Income
Net interest income is the spread between income on interest-earning assets, such as loans and securities, and the interest expense on liabilities used to fund those assets, such as deposits, repurchase agreements and funds borrowed. Net interest income is the Company's largest source of revenue. Net interest income is affected by both changes in the level of interest rates and changes in the amount and composition of interest-earning assets and interest-bearing liabilities.
| |
For the years ended December 31, | ||||||||||||
|---|---|---|---|---|---|---|---|---|---|---|---|---|---|
| |
2009 Average Rate/Cost |
2008 Average Rate/Cost |
2007 Average Rate/Cost |
||||||||||
Assets |
|||||||||||||
Interest earning assets: |
|||||||||||||
Loan, net of unearned discounts: |
|||||||||||||
Domestic |
5.88 | % | 6.60 | % | 8.58 | % | |||||||
Foreign |
4.96 | 6.03 | 7.43 | ||||||||||
Investment securities: |
|||||||||||||
Taxable |
4.34 | 4.59 | 4.69 | ||||||||||
Tax-exempt |
4.87 | 4.87 | 4.89 | ||||||||||
Federal funds sold |
— | 1.75 | 4.96 | ||||||||||
Other |
.87 | 4.99 | 5.81 | ||||||||||
Total interest-earning assets |
5.17 | % | 5.70 | % | 6.82 | % | |||||||
Liabilities |
|||||||||||||
Interest bearing liabilities: |
|||||||||||||
Savings and interest bearing demand deposits |
.51 | % | 1.17 | % | 2.31 | % | |||||||
Time deposits: |
|||||||||||||
Domestic |
1.96 | 3.25 | 4.32 | ||||||||||
Foreign |
1.78 | 3.11 | 4.28 | ||||||||||
Securities sold under repurchase agreements |
3.06 | 3.51 | 4.46 | ||||||||||
Other borrowings |
.57 | 2.44 | 5.15 | ||||||||||
Junior subordinated deferrable interest debentures |
6.23 | 7.03 | 8.06 | ||||||||||
Total interest bearing liabilities |
1.59 | % | 2.67 | % | 4.01 | % | |||||||
6
For the three years ended December 31, 2009, as short term interest rates have fluctuated, the Company has monitored and adjusted interest rates on loans and deposits accordingly. The level of interest rates and the volume and mix of earning assets and interest-bearing liabilities impact net income and net interest margin. The yield on average interest-earning assets decreased 9.3% from 5.70% in 2008 to 5.17% in 2009, and the rates paid on average interest-bearing liabilities decreased 40.4% from 2.67% in 2008 to 1.59% in 2009. The yield on average interest-earning assets decreased 16.4% from 6.82% in 2007 to 5.70% in 2008, and the rates paid on average interest-bearing liabilities decreased 33.4% from 4.01% in 2007 to 2.67% in 2008. The majority of the Company's taxable investment securities are invested in mortgage backed securities and during rapid increases or reduction in interest rates, the yield on these securities do not re-price as quickly as the loans.
The following table analyzes the changes in net interest income during 2009 and 2008 and the relative effect of changes in interest rates and volumes for each major classification of interest-earning assets and interest-bearing liabilities. Non-accrual loans have been included in assets for the purpose of this analysis, which reduces the resulting yields:
| |
2009 compared to 2008 Net increase (decrease) due to |
2008 compared to 2007 Net increase (decrease) due to |
|||||||||||||||||||
|---|---|---|---|---|---|---|---|---|---|---|---|---|---|---|---|---|---|---|---|---|---|
| |
Volume(1) | Rate(1) | Total | Volume(1) | Rate(1) | Total | |||||||||||||||
| |
(Dollars in Thousands) |
(Dollars in Thousands) |
|||||||||||||||||||
Interest earned on: |
|||||||||||||||||||||
Loans, net of unearned discounts: |
|||||||||||||||||||||
Domestic |
$ | 7,524 | $ | (39,016 | ) | $ | (31,492 | ) | $ | 37,681 | $ | (106,085 | ) | $ | (68,404 | ) | |||||
Foreign |
(531 | ) | (2,926 | ) | (3,457 | ) | (463 | ) | (3,979 | ) | (4,442 | ) | |||||||||
Investment securities: |
|||||||||||||||||||||
Taxable |
7,389 | (10,386 | ) | (2,997 | ) | 3,026 | (4,469 | ) | (1,443 | ) | |||||||||||
Tax-exempt |
1,560 | (4 | ) | 1,556 | (740 | ) | (16 | ) | (756 | ) | |||||||||||
Federal funds sold |
(927 | ) | — | (927 | ) | (80 | ) | (1,705 | ) | (1,785 | ) | ||||||||||
Other |
3,132 | (3,041 | ) | 91 | (2,075 | ) | (65 | ) | (2,140 | ) | |||||||||||
Total interest income |
$ | 18,147 | $ | (55,373 | ) | $ | (37,226 | ) | $ | 37,349 | $ | (116,319 | ) | $ | (78,970 | ) | |||||
Interest incurred on: |
|||||||||||||||||||||
Savings and interest bearing demand deposits |
$ | (1,759 | ) | $ | (14,060 | ) | $ | (15,819 | ) | $ | (972 | ) | $ | (26,155 | ) | $ | (27,127 | ) | |||
Time deposits: |
|||||||||||||||||||||
Domestic |
526 | (22,122 | ) | (21,596 | ) | (100 | ) | (18,206 | ) | (18,306 | ) | ||||||||||
Foreign |
(1,169 | ) | (21,459 | ) | (22,628 | ) | 907 | (19,142 | ) | (18,235 | ) | ||||||||||
Securities sold under repurchase agreements |
900 | (6,577 | ) | (5,677 | ) | 20,226 | (13,663 | ) | 6,563 | ||||||||||||
Other borrowings |
6,508 | (31,033 | ) | (24,525 | ) | (3,465 | ) | (37,876 | ) | (41,341 | ) | ||||||||||
Junior subordinated deferrable interest debentures |
2 | (1,604 | ) | (1,602 | ) | (973 | ) | (2,068 | ) | (3,041 | ) | ||||||||||
Other |
(88 | ) | — | (88 | ) | (122 | ) | — | (122 | ) | |||||||||||
Total interest expense |
$ | 4,920 | $ | (96,855 | ) | $ | (91,935 | ) | $ | 15,501 | $ | (117,110 | ) | $ | (101,609 | ) | |||||
Net interest income |
$ | 13,227 | $ | 41,482 | $ | 54,709 | $ | 21,848 | $ | 791 | $ | 22,639 | |||||||||
(Note 1) The change in interest due to both rate and volume has been allocated to volume and rate changes in proportion to the relationship of the absolute dollar amounts of the change in each.
As part of the strategy to manage interest rate risk, the Company strives to manage both assets and liabilities so that interest sensitivities match. One method of calculating interest rate sensitivity is through
7
gap analysis. A gap is the difference between the amount of interest rate sensitive assets and interest rate sensitive liabilities that re-price or mature in a given time period. Positive gaps occur when interest rate sensitive assets exceed interest rate sensitive liabilities, and negative gaps occur when interest rate sensitive liabilities exceed interest rate sensitive assets. A positive gap position in a period of rising interest rates should have a positive effect on net interest income as assets will re-price faster than liabilities. Conversely, net interest income should contract somewhat in a period of falling interest rates. Management can quickly change the Company's interest rate position at any given point in time as market conditions dictate. Additionally, interest rate changes do not affect all categories of assets and liabilities equally or at the same time. Analytical techniques employed by the Company to supplement gap analysis include simulation analysis to quantify interest rate risk exposure. The gap analysis prepared by management is reviewed by the Investment Committee of the Company twice a year. The Investment Committee is comprised of certain senior managers of the various Company bank subsidiaries along with consultants. Management currently believes that the Company is properly positioned for interest rate changes; however, if management determines at any time that the Company is not properly positioned, it will strive to adjust the interest rate sensitive assets and liabilities in order to manage the effect of interest rate changes.
At December 31, 2009, based on these simulations, a rate shift of 300 basis points in interest rates up will vary net interest income by 1.89%, while a rate shift of 100 basis points down will not vary net interest income by more than .18% of projected 2010 net interest income. The basis point shift in interest rates is a hypothetical rate scenario used to calibrate risk, and does not necessarily represent management's current view of future market developments. The Company believes that it is properly positioned for a potential interest rate increase or decrease.
Allowance for Probable Loan Loss
The following table presents information concerning the aggregate amount of non-accrual, past due and restructured domestic loans; certain loans may be classified in one or more categories:
| |
December 31, | |||||||||||||||
|---|---|---|---|---|---|---|---|---|---|---|---|---|---|---|---|---|
| |
2009 | 2008 | 2007 | 2006 | 2005 | |||||||||||
| |
(Dollars in Thousands) |
|||||||||||||||
Loans accounted for on a non-accrual basis |
$ | 68,314 | $ | 163,700 | $ | 32,900 | $ | 13,490 | $ | 17,129 | ||||||
Accruing loans contractually past due ninety days or more as to interest or principal payments |
11,986 | 6,208 | 21,330 | 9,201 | 5,478 | |||||||||||
Loans accounted for as "troubled debt restructuring" |
— | — | — | — | — | |||||||||||
The allowance for probable loan losses increased 29.9% to $95,393,000 at December 31, 2009 from $73,461,000 at December 31, 2008. The provision for probable loan losses charged to expense increased $39,020,000 to $58,833,000 for the year ended December 31, 2009 from $19,813,000 for the same period in 2008. The Company's provision for probable loan losses increased for the years ended December 31, 2009 and 2008, prompted by the analysis of management regarding the weakness in the overall economy and the impact of that weakness on the Company's loan portfolio and the related allowance for probable loan losses. While the Texas and Oklahoma economies are performing better than other parts of the country, Texas and Oklahoma are not immune to the problems associated with the U.S. economy. The decrease in the allowance for probable loan losses for the year ended December 31, 2007, can be partially attributed to the charge off of loans acquired as part of the LFIN acquisition. The allowance for probable loan losses was 1.68% of total loans, net of unearned income at December 31, 2009 and 1.25% at December 31, 2008.
8
The following table presents information concerning the aggregate amount of non-accrual and past due foreign loans extended to persons or entities in foreign countries. Certain loans may be classified in one or more category:
| |
December 31, | |||||||||||||||
|---|---|---|---|---|---|---|---|---|---|---|---|---|---|---|---|---|
| |
2009 | 2008 | 2007 | 2006 | 2005 | |||||||||||
| |
(Dollars in Thousands) |
|||||||||||||||
Loans accounted for on a non-accrual basis |
$ | 24 | $ | 530 | $ | 722 | $ | 4,298 | $ | 12,946 | ||||||
Accruing loans contractually past due ninety days or more as to interest or principal payments |
103 | 66 | 510 | 199 | 608 | |||||||||||
The gross income that would have been recorded during 2009 and 2008 on non-accrual and restructured loans in accordance with their original contract terms was $4,008,000 and $6,148,000 on domestic loans and $3,000 and $94,000 on foreign loans, respectively. The amount of interest income on such loans that was recognized in 2009 and 2008 was $547,000 and $193,000 on domestic loans and $0 and $0 for foreign loans, respectively.
Generally, loans are placed on non-accrual status if principal or interest payments become 90 days past due and/or management deem the collectability of the principal and/or interest to be in question, as well as when required by applicable regulatory guidelines. Interest income on non-accrual loans is recognized only to the extent payments are received or when, in management's opinion, the creditor's financial condition warrants reestablishment of interest accruals. Under special circumstances, a loan may be more than 90 days delinquent as to interest or principal and not be placed on non-accrual status. This situation generally results when a bank subsidiary has a borrower who is experiencing financial difficulties, but not to the extent that requires a restructuring of indebtedness. The majority of this category is composed of loans that are considered to be adequately secured and/or for which there has been a recent history of payments. When a loan is placed on non-accrual status, any interest accrued, not paid is reversed and charged to operations against interest income.
Loan commitments, consisting of unused commitments to lend, letters of credit, credit card lines and other approved loans, that have not been funded, were $1,349,516,000 and $1,914,733,000 at December 31, 2009 and 2008, respectively. See Note 20 to the Consolidated Financial Statements.
9
The following table summarizes loan balances at the end of each year and average loans outstanding during the year; changes in the allowance for probable loan losses arising from loans charged-off and recoveries on loans previously charged-off by loan category; and additions to the allowance which have been charged to expense:
| |
2009 | 2008 | 2007 | 2006 | 2005 | |||||||||||||
|---|---|---|---|---|---|---|---|---|---|---|---|---|---|---|---|---|---|---|
| |
(Dollars in Thousands) |
|||||||||||||||||
Loans, net of unearned discounts, outstanding at December 31 |
$ | 5,667,262 | $ | 5,872,833 | $ | 5,536,628 | $ | 5,034,810 | $ | 4,625,692 | ||||||||
Average loans outstanding during the year (Note 1) |
$ | 5,748,789 | $ | 5,683,130 | $ | 5,215,435 | $ | 4,796,489 | $ | 4,830,881 | ||||||||
Balance of allowance at January 1 |
$ | 73,461 | $ | 61,726 | $ | 64,537 | $ | 77,796 | $ | 81,351 | ||||||||
Provision (credit) charged to expense |
58,833 | 19,813 | (1,762 | ) | 3,849 | 960 | ||||||||||||
Loans charged off: |
||||||||||||||||||
Domestic: |
||||||||||||||||||
Commercial, financial and agricultural |
(14,565 | ) | (5,754 | ) | (3,606 | ) | (7,302 | ) | (2,703 | ) | ||||||||
Real estate—mortgage |
(2,500 | ) | (1,400 | ) | (800 | ) | (554 | ) | (806 | ) | ||||||||
Real estate—construction |
(17,953 | ) | (202 | ) | (202 | ) | (99 | ) | (41 | ) | ||||||||
Consumer |
(2,690 | ) | (1,770 | ) | (1,741 | ) | (2,056 | ) | (2,948 | ) | ||||||||
Foreign |
(831 | ) | (8 | ) | (102 | ) | (8,377 | ) | (73 | ) | ||||||||
Total loans charged off: |
(38,539 | ) | (9,134 | ) | (6,451 | ) | (18,388 | ) | (6,571 | ) | ||||||||
Recoveries credited to allowance: |
||||||||||||||||||
Domestic: |
||||||||||||||||||
Commercial, financial and agricultural |
519 | 576 | 810 | 625 | 1,436 | |||||||||||||
Real estate—mortgage |
128 | 94 | 58 | 130 | 69 | |||||||||||||
Real estate—construction |
19 | 21 | 89 | 53 | 24 | |||||||||||||
Consumer |
937 | 361 | 306 | 448 | 511 | |||||||||||||
Foreign |
35 | 4 | 3,085 | 24 | 16 | |||||||||||||
Total recoveries |
1,638 | 1,056 | 4,348 | 1,280 | 2,056 | |||||||||||||
Net loans charged off |
(36,901 | ) | (8,078 | ) | (2,103 | ) | (17,108 | ) | (4,515 | ) | ||||||||
Allowance acquired in purchase transactions |
— | — | 1,054 | — | — | |||||||||||||
Balance of allowance at December 31 |
$ | 95,393 | $ | 73,461 | $ | 61,726 | $ | 64,537 | $ | 77,796 | ||||||||
Ratio of net loans charged-off during the year to average loans outstanding during the year (Note 1) |
.64 | % | .14 | % | .04 | % | .36 | % | .09 | % | ||||||||
Ratio of allowance to loans, net of unearned discounts, outstanding at December 31 |
1.68 | % | 1.25 | % | 1.11 | % | 1.28 | % | 1.68 | % | ||||||||
(Note 1) The average balances for purposes of the above table are calculated on the basis of daily balances for 2009, 2008, 2007 and 2006 and month-end balances for the year ended 2005.
10
The allowance for probable loan losses has been allocated based on the amount management has deemed to be reasonably necessary to provide for the probable losses incurred within the following categories of loans at the dates indicated and the percentage of loans to total loans in each category:
| |
At December 31, | ||||||||||||||||||||||||||||||
|---|---|---|---|---|---|---|---|---|---|---|---|---|---|---|---|---|---|---|---|---|---|---|---|---|---|---|---|---|---|---|---|
| |
2009 | 2008 | 2007 | 2006 | 2005 | ||||||||||||||||||||||||||
| |
Allowance | Percent of total |
Allowance | Percent of total |
Allowance | Percent of total |
Allowance | Percent of total |
Allowance | Percent of total |
|||||||||||||||||||||
| |
(Dollars in Thousands) |
||||||||||||||||||||||||||||||
Commercial, Financial and Agricultural |
$ | 47,676 | 47.8 | % | $ | 33,737 | 43.8 | % | $ | 28,117 | 43.9 | % | $ | 28,158 | 46.5 | % | $ | 34,283 | 51.4 | % | |||||||||||
Real estate—Mortgage |
16,825 | 16.8 | 11,639 | 15.1 | 9,256 | 14.4 | 9,461 | 15.6 | 12,228 | 18.3 | |||||||||||||||||||||
Real estate—Construction |
27,918 | 27.9 | 25,058 | 32.6 | 21,277 | 33.2 | 16,914 | 27.9 | 13,007 | 19.5 | |||||||||||||||||||||
Consumer |
2,581 | 2.6 | 2,223 | 2.9 | 2,212 | 3.4 | 2,392 | 3.9 | 3,154 | 4.7 | |||||||||||||||||||||
Foreign |
393 | 4.9 | 804 | 5.6 | 864 | 5.1 | 7,612 | 6.1 | 15,124 | 6.1 | |||||||||||||||||||||
|
$ | 95,393 | 100.0 | % | $ | 73,461 | 100.0 | % | $ | 61,726 | 100.0 | % | $ | 64,537 | 100.0 | % | $ | 77,796 | 100.0 | % | |||||||||||
The allowance for probable loan losses consists of the aggregate loan loss allowances of the bank subsidiaries. The allowances are established through charges to operations in the form of provisions for probable loan losses.
The bank subsidiaries charge off that portion of any loan which management considers to represent a loss as well as that portion of any other loan which is classified as a "loss" by bank examiners. Commercial, financial and agricultural or real estate loans are generally considered by management to represent a loss, in whole or part, (i) when an exposure beyond any collateral coverage is apparent, (ii) when no further collection of the portion of the loan so exposed is anticipated based on actual results, (iii) when the credit enhancements, if any, are not adequate, and (iv) when the borrower's financial condition would indicate so. Generally, unsecured consumer loans are charged off when 90 days past due.
The allowance for probable loan losses is a reserve established through a provision for probable loan losses charged to expense, which represents management's best estimate of probable loan losses within the existing portfolio of loans. The Company's allowance for probable loan loss methodology is based on guidance provided in Securities and Exchange Commission Staff Accounting Bulletin No. 102, "Selected Loan Loss Allowance Methodology and Documentation Issues" and includes allowance allocations calculated in accordance with ASC 310, "Receivables" and ASC 450, "Contingencies." The reserve allocated to all categories of loans increased approximately $21.9 million from 2008 to 2009 and $11.7 million from 2007 to 2008. The increase in the reserve occurred as the result of the deterioration of economic conditions in 2008 that continue in to occur in 2009. The reserve allocated to Commercial and Real Estate—Construction loans increased from 2007 to 2008 primarily due to increases in impaired loans in which a specified valuation allowance was determined in accordance with ASC 310-10. Please refer to Note 5—Allowance for Probable Loan Losses in the accompanying Notes to the consolidated Financial Statements.
While management of the Company considers that it is generally able to identify borrowers with financial problems reasonably early and to monitor credit extended to such borrowers carefully, there is no precise method of predicting loan losses. The determination that a loan is likely to be uncollectible and that it should be wholly or partially charged off as a loss is an exercise of judgment. Similarly, the determination of the adequacy of the allowance for probable loan losses can be made only on a subjective basis. It is the judgment of the Company's management that the allowance for probable loan losses at December 31, 2009 was adequate to absorb probable losses from loans in the portfolio at that date. See Critical Accounting Policies on page 24. Should any of the factors considered by management in evaluating the adequacy of the allowance for probable loan losses change, the Company's estimate of probable loan losses could also change, which could affect the level of future provisions for probable loan losses.
11
Non-Interest Income
| |
Year Ended December 31, 2009 |
Year Ended December 31, 2008 |
Percent Increase (Decrease) 2009 vs. 2008 |
Year Ended December 31, 2007 |
Percent Increase (Decrease) 2008 vs. 2007 |
||||||||||||
|---|---|---|---|---|---|---|---|---|---|---|---|---|---|---|---|---|---|
| |
(Dollars in Thousands) |
||||||||||||||||
Service charges on deposit accounts |
$ | 99,642 | $ | 98,466 | 1.2 | % | $ | 89,186 | 10.4 | % | |||||||
Other service charges, commissions and fees |
|||||||||||||||||
Banking |
42,861 | 40,543 | 5.7 | 34,897 | 16.2 | ||||||||||||
Non-banking |
12,697 | 7,592 | 67.2 | 18,675 | (59.3 | ) | |||||||||||
Investment securities transactions, net |
11,956 | 6,427 | 86.0 | (15,938 | ) | 140.3 | |||||||||||
Other investments, net |
19,773 | 15,183 | 30.2 | 19,821 | (23.4 | ) | |||||||||||
Other income |
14,084 | 21,598 | (34.8 | ) | 18,722 | 15.4 | |||||||||||
Total non-interest income |
$ | 201,013 | $ | 189,809 | 5.9 | % | $ | 165,363 | 14.8 | % | |||||||
The increase in investment securities transactions for the year ended December 31, 2009 can be attributed to the sale of investment securities resulting in a gain of $12.0 million, before taxes. Non-banking service charges, commissions and fees 2009 was positively impacted by the results of a wholly owned insurance subsidiary of the Company's lead bank. During 2008, the Company sold certain equity securities resulting in a gain of $6.2 million, before taxes. The loss in the investment securities transactions for the year ended December 31, 2007 can be attributed to a $17.0 million impairment charge recorded in connection with certain investment securities identified for sale in the first quarter 2007 and the sale of certain equity investments. The impairment charge in 2007 was the result of the Company's strategic sale of certain investment securities with the proceeds from the sales used to reduce Federal Home Loan Bank ("FHLB") borrowings. The investments identified were certain hybrid mortgage backed securities with a coupon re-set date that exceeded 30 months and a weighted average yield to coupon re-set that was approximately 100 basis points less than the FHLB certificate of indebtedness short-term rate. The sale of the securities facilitated a re-positioning of the balance sheet to a more neutral position in terms of interest rate risk and was done to improve the Company's operating ratios. As a result of this decision, the Company marked the securities to market. The increase in banking service charges, commissions and fees for the year ended December 31, 2009 and 2008 can be attributed to increased surcharge and interchange income from customers using the IBC debit card and automated teller machines (ATM). The increase in service charges on deposit accounts can be attributed partially to the Company's sales programs and the additional accounts created as a result of those programs.
12
Non-Interest Expense
| |
Year Ended December 31, 2009 |
Year Ended December 31, 2008 |
Percent Increase (Decrease) 2009 vs. 2008 |
Year Ended December 31, 2007 |
Percent Increase (Decrease) 2008 vs. 2007 |
||||||||||||
|---|---|---|---|---|---|---|---|---|---|---|---|---|---|---|---|---|---|
| |
(Dollars in Thousands) |
||||||||||||||||
Employee compensation and benefits |
$ | 130,849 | $ | 129,084 | 1.4 | % | $ | 130,385 | (1.0 | )% | |||||||
Occupancy |
35,374 | 38,315 | (7.7 | ) | 33,583 | 14.1 | |||||||||||
Depreciation of bank premises and equipment |
35,879 | 36,700 | (2.2 | ) | 32,069 | 14.4 | |||||||||||
Professional fees |
12,640 | 10,051 | 25.8 | 9,741 | 3.2 | ||||||||||||
Deposit insurance assessments |
10,249 | 1,027 | 898.0 | 872 | 17.8 | ||||||||||||
Stationery and supplies |
4,496 | 6,129 | (26.6 | ) | 6,414 | (4.4 | ) | ||||||||||
Amortization of identified intangible assets |
5,286 | 5,195 | 1.8 | 5,188 | 0.1 | ||||||||||||
Advertising |
9,149 | 13,189 | (30.6 | ) | 11,973 | 10.2 | |||||||||||
Other |
65,109 | 61,536 | 5.8 | 70,057 | (12.2 | ) | |||||||||||
Total non-interest expense |
$ | 309,031 | $ | 301,226 | 2.6 | % | $ | 300,282 | 0.3 | % | |||||||
Non-interest expense was affected by the aggressive de novo branching activity that has added 16 new branches in 2009 and 18 branches in 2008. As a result of the branch expansion, employee compensation increased due to staffing of these branches. Deposit insurance assessment expense for the twelve months ended December 31, 2009 was negatively impacted by the FDIC special assessment. In May 2009, the FDIC issued a final rule which levied a special assessment on all insured depository institutions totaling five basis points of each institution's total assets less Tier 1 capital as of June 30, 2009 that was collected on September 30, 2009. The special assessment is part of the FDIC's efforts to re-build the Deposit Insurance Fund ("DIF"). The Company accrued $5.1 million related to the special assessment. In October 2009, the FDIC issued a final rule that financial institutions prepay their quarterly assessments for the next three years in an effort to shore up the DIF. The rule required banks to prepay their quarterly risk-based assessments for the fourth quarter of 2009, and all of 2010, 2011 and 2012 on December 30, 2009. The Company also paid additional fees related to its participation in the FDIC Temporary Liquidity Guaranty Program, which provides full FDIC deposit insurance coverage for non-interest bearing accounts through June 30, 2010 (extended from December 31, 2009). The fee assessment for such accounts was ten basis points per quarter in 2009 and increased to fifteen basis points per quarter in 2010 on amounts in covered accounts exceeding $250,000.
Effects of Inflation
The principal component of earnings is net interest income, which is affected by changes in the level of interest rates. Changes in rates of inflation affect interest rates. It is difficult to precisely measure the impact of inflation on net interest income because it is not possible to accurately differentiate between increases in net interest income resulting from inflation and increases resulting from increased business activity. Inflation also raises costs of operations, primarily those of employment and services.
13
Investment Securities
The following table sets forth the carrying value of investment securities as of December 31, 2009, 2008 and 2007:
| |
December 31, | |||||||||||
|---|---|---|---|---|---|---|---|---|---|---|---|---|
| |
2009 | 2008 | 2007 | |||||||||
| |
(Dollars in Thousands) |
|||||||||||
U.S. Treasury Securities |
||||||||||||
Available for sale |
$ | 1,327 | $ | 1,319 | $ | 1,308 | ||||||
Residential mortgage-backed securities |
||||||||||||
Available for sale |
4,491,764 | 4,974,317 | 4,066,829 | |||||||||
Obligations of states and political subdivisions |
||||||||||||
Available for sale |
136,866 | 82,214 | 84,633 | |||||||||
Equity securities |
||||||||||||
Available for sale |
14,126 | 14,030 | 13,500 | |||||||||
Other securities |
||||||||||||
Held to maturity |
2,450 | 2,300 | 2,300 | |||||||||
Available for sale |
— | — | 1,618 | |||||||||
Total |
$ | 4,646,533 | $ | 5,074,180 | $ | 4,170,188 | ||||||
The following tables set forth the contractual maturities of investment securities, based on amortized cost, at December 31, 2009 and the average yields of such securities, except for the totals, which reflect the weighted average yields. Actual maturities will differ from contractual maturities because borrowers may have the right to prepay obligations with or without prepayment penalties.
| |
Available for Sale Maturing | |||||||||||||||||||||||||
|---|---|---|---|---|---|---|---|---|---|---|---|---|---|---|---|---|---|---|---|---|---|---|---|---|---|---|
| |
Within one year | After one but within five years |
After five but within ten years |
After ten years | ||||||||||||||||||||||
| |
Adjusted | Adjusted | Adjusted | Adjusted | ||||||||||||||||||||||
| |
Cost | Yield | Cost | Yield | Cost | Yield | Cost | Yield | ||||||||||||||||||
| |
(Dollars in Thousands) |
|||||||||||||||||||||||||
U.S. Treasury and obligations of U.S. Government agencies |
$ | 1,327 | .21 | % | $ | — | — | % | $ | — | — | % | $ | — | — | % | ||||||||||
Residential mortgage-backed securities |
33,773 | 4.60 | 5,973 | 4.87 | 372,322 | 4.85 | 3,981,663 | 4.06 | ||||||||||||||||||
Obligations of states and political subdivisions |
— | — | — | — | 10,224 | 4.80 | 122,744 | 5.21 | ||||||||||||||||||
Equity securities |
325 | — | — | — | — | — | 13,500 | 3.83 | ||||||||||||||||||
Other securities |
— | — | — | — | — | — | — | — | ||||||||||||||||||
Total |
$ | 35,425 | 4.39 | % | $ | 5,973 | 4.87 | % | $ | 382,546 | 4.85 | % | $ | 4,117,907 | 4.10 | % | ||||||||||
14
| |
Held to Maturity Maturing | ||||||||||||||||||||||||
|---|---|---|---|---|---|---|---|---|---|---|---|---|---|---|---|---|---|---|---|---|---|---|---|---|---|
| |
Within one year | After one but within five years |
After five but within ten years |
After ten years | |||||||||||||||||||||
| |
Adjusted | Adjusted | Adjusted | Adjusted | |||||||||||||||||||||
| |
Cost | Yield | Cost | Yield | Cost | Yield | Cost | Yield | |||||||||||||||||
| |
(Dollars in Thousands) |
||||||||||||||||||||||||
Other securities |
$ | 1,825 | 1.45 | % | $ | 625 | 1.41 | % | $ | — | — | % | $ | — | — | % | |||||||||
Total |
$ | 1,825 | 1.45 | % | $ | 625 | 1.41 | % | $ | — | — | % | $ | — | — | % | |||||||||
Mortgage-backed securities are securities primarily issued by the Federal Home Loan Mortgage Corporation ("Freddie Mac"), Federal National Mortgage Association ("Fannie Mae"), and the Government National Mortgage Association ("Ginnie Mae"). Investments in mortgage-backed securities issued by Ginnie Mae are fully guaranteed by the U.S. Government. Investments in mortgage-backed securities issued by Freddie Mac and Fannie Mae are not fully guaranteed by the U.S. Government, but carry an implied AAA rating with limited credit risk, particularly given the placement of Fannie Mae and Freddie Mac into conservatorship by the federal government in early September 2008.
Loans
The amounts of loans outstanding, by classification, at December 31, 2009, 2008, 2007, 2006 and 2005 are shown in the following table:
| |
December 31, | ||||||||||||||||
|---|---|---|---|---|---|---|---|---|---|---|---|---|---|---|---|---|---|
| |
2009 | 2008 | 2007 | 2006 | 2005 | ||||||||||||
| |
(Dollars in Thousands) |
||||||||||||||||
Commercial, financial and agricultural |
$ | 2,703,379 | $ | 2,574,247 | $ | 2,426,064 | $ | 2,337,573 | $ | 2,376,276 | |||||||
Real estate—mortgage |
954,010 | 888,095 | 798,708 | 785,401 | 847,512 | ||||||||||||
Real estate—construction |
1,583,057 | 1,911,954 | 1,835,950 | 1,404,186 | 901,518 | ||||||||||||
Consumer |
146,331 | 169,589 | 190,899 | 198,580 | 218,607 | ||||||||||||
Foreign |
280,485 | 328,948 | 285,008 | 309,144 | 281,947 | ||||||||||||
Total loans |
5,667,262 | 5,872,833 | 5,536,629 | 5,034,884 | 4,625,860 | ||||||||||||
Unearned discount |
— |
— |
(1 |
) |
(74 |
) |
(168 |
) |
|||||||||
Loans, net of unearned discount |
$ | 5,667,262 | $ | 5,872,833 | $ | 5,536,628 | $ | 5,034,810 | $ | 4,625,692 | |||||||
The following table shows the amounts of loans (excluding real estate mortgages and consumer loans) outstanding as of December 31, 2009, which based on remaining scheduled repayments of principal are due in the years indicated. Also, the amounts due after one year are classified according to the sensitivity to changes in interest rates:
| |
Maturing | |||||||||||||
|---|---|---|---|---|---|---|---|---|---|---|---|---|---|---|
| |
Within one year |
After one but within five years |
After five years |
Total | ||||||||||
| |
(Dollars in Thousands) |
|||||||||||||
Commercial, financial and agricultural |
$ | 699,848 | $ | 1,833,943 | $ | 169,588 | $ | 2,703,379 | ||||||
Real estate—construction |
524,266 | 873,499 | 185,292 | 1,583,057 | ||||||||||
Foreign |
186,975 | 88,450 | 5,060 | 280,485 | ||||||||||
Total |
$ | 1,411,089 | $ | 2,795,892 | $ | 359,940 | $ | 4,566,921 | ||||||
15
| |
Interest sensitivity | |||||||
|---|---|---|---|---|---|---|---|---|
| |
Fixed Rate | Variable Rate | ||||||
| |
(Dollars in Thousands) |
|||||||
Due after one but within five years |
$ | 224,953 | $ | 2,570,939 | ||||
Due after five years |
29,079 | 330,861 | ||||||
Total |
$ | 254,032 | $ | 2,901,800 | ||||
International Operations
On December 31, 2009, the Company had $280,485,000 (2.4% of total assets) in loans outstanding to borrowers domiciled in foreign countries, which included primarily borrowers domiciled in Mexico. The loan policies of the Company's bank subsidiaries generally require that loans to borrowers domiciled in foreign countries be primarily secured by assets located in the United States or have credit enhancements, in the form of guarantees, from significant United States corporations. The composition of such loans and the related amounts of allocated allowance for probable loan losses as of December 31, 2009 is presented below.
| |
Amount of Loans | Related Allowance for Probable Losses |
|||||
|---|---|---|---|---|---|---|---|
| |
(Dollars in Thousands) |
||||||
Secured by certificates of deposit in United States banks |
$ | 178,336 | $ | 89 | |||
Secured by United States real estate |
31,481 | 70 | |||||
Secured by other United States collateral (securities, gold, silver, etc.) |
17,955 | 56 | |||||
Direct unsecured Mexican sovereign debt (principally former FICORCA debt) |
1,507 | 4 | |||||
Other (principally Mexico real estate) |
51,206 | 174 | |||||
|
$ | 280,485 | $ | 393 | |||
The transactions for the year ended December 31, 2009, in that portion of the allowance for probable loan losses related to foreign debt were as follows:
| |
(Dollars in Thousands) | ||||
|---|---|---|---|---|---|
Balance at December 31, 2008 |
$ | 604 | |||
Charge-offs |
(691 |
) |
|||
Recoveries |
7 | ||||
Net recoveries |
(684 | ) | |||
Provision charged to expense |
473 | ||||
Balance at December 31, 2009 |
$ | 393 | |||
16
Deposits
| |
2009 Average Balance |
2008 Average Balance |
||||||||
|---|---|---|---|---|---|---|---|---|---|---|
| |
(Dollars in Thousands) |
|||||||||
Deposits: |
||||||||||
Demand—non-interest bearing |
||||||||||
Domestic |
$ | 1,325,682 | $ | 1,324,178 | ||||||
Foreign |
155,312 | 130,879 | ||||||||
Total demand non-interest bearing |
1,480,994 | 1,455,057 | ||||||||
Savings and interest bearing demand |
||||||||||
Domestic |
1,781,663 | 1,924,622 | ||||||||
Foreign |
353,484 | 361,378 | ||||||||
Total savings and interest bearing demand |
2,135,147 | 2,286,000 | ||||||||
Time certificates of deposit |
||||||||||
$100,000 or more: |
||||||||||
Domestic |
947,382 | 874,040 | ||||||||
Foreign |
1,218,579 | 1,249,290 | ||||||||
Less than $100,000: |
||||||||||
Domestic |
771,362 | 828,510 | ||||||||
Foreign |
388,852 | 395,706 | ||||||||
Total time, certificates of deposit |
3,326,175 | 3,347,546 | ||||||||
Total deposits |
$ | 6,942,316 | $ | 7,088,603 | ||||||
| |
2009 | 2008 | 2007 | ||||||||||
|---|---|---|---|---|---|---|---|---|---|---|---|---|---|
| |
(Dollars in Thousands) |
||||||||||||
Interest expense: |
|||||||||||||
Savings and interest bearing demand |
|||||||||||||
Domestic |
$ | 9,267 | $ | 23,197 | $ | 46,878 | |||||||
Foreign |
1,565 | 3,454 | 6,900 | ||||||||||
Total savings and interest bearing demand |
10,832 | 26,651 | 53,778 | ||||||||||
Time, certificates of deposit |
|||||||||||||
$100,000 or more |
|||||||||||||
Domestic |
18,091 | 28,990 | 37,133 | ||||||||||
Foreign |
23,315 | 41,383 | 54,494 | ||||||||||
Less than $100,000 |
|||||||||||||
Domestic |
15,600 | 26,297 | 36,460 | ||||||||||
Foreign |
5,249 | 9,809 | 14,933 | ||||||||||
Total time, certificates of deposit |
62,255 | 106,479 | 143,020 | ||||||||||
Total interest expense on deposits |
$ | 73,087 | $ | 133,130 | $ | 196,798 | |||||||
17
Scheduled maturities of time deposits in amounts of $100,000 or more at December 31, 2009, were as follows:
Due within 3 months or less |
$ | 931,885 | ||
Due after 3 months and within 6 months |
547,820 | |||
Due after 6 months and within 12 months |
590,219 | |||
Due after 12 months |
171,808 | |||
|
$ | 2,241,732 | ||
The Company offers a variety of deposit accounts having a wide range of interest rates and terms. The Company relies primarily on its high quality customer service, sales programs, customer referrals and advertising to attract and retain these deposits. Deposits provide the primary source of funding for the Company's lending and investment activities, and the interest paid for deposits must be managed carefully to control the level of interest expense. Deposits at December 31, 2009 were $7,178,007,000, an increase of 4.7% from $6,858,784,000 at December 31, 2008.
Return on Equity and Assets
Certain key ratios for the Company for the years ended December 31, 2009, 2008 and 2007 follows (Note 1):
| |
Years ended December 31, |
||||||||||
|---|---|---|---|---|---|---|---|---|---|---|---|
| |
2009 | 2008 | 2007 | ||||||||
Percentage of net income to: |
|||||||||||
Average shareholders' equity |
11.10 | % | 13.34 | % | 13.73 | % | |||||
Average total assets |
1.23 | 1.17 | 1.12 | ||||||||
Percentage of average shareholders' equity to average total assets |
11.07 | 8.81 | 8.19 | ||||||||
Percentage of cash dividends per share to net income per share |
17.89 | 34.27 | 38.45 | ||||||||
(Note 1) The average balances for purposes of the above table are calculated on the basis of daily balances.
Liquidity and Capital Resources
Liquidity
The maintenance of adequate liquidity provides the Company's bank subsidiaries with the ability to meet potential depositor withdrawals, provide for customer credit needs, maintain adequate statutory reserve levels and take full advantage of high-yield investment opportunities as they arise. Liquidity is afforded by access to financial markets and by holding appropriate amounts of liquid assets. The Company's bank subsidiaries derive their liquidity largely from deposits of individuals and business entities. Deposits from persons and entities domiciled in Mexico comprise a stable portion of the deposit base of the Company's bank subsidiaries. Historically, the Mexico based deposits of the Company's bank subsidiaries have been a stable source of funding. Such deposits comprised approximately 31%, 30%, and 30% of the Company's bank subsidiaries' total deposits at each of the years ended December 31, 2009, 2008 and 2007, respectively. Other important funding sources for the Company's bank subsidiaries have been borrowings from the Federal Home Loan Bank ("FHLB"), securities sold under repurchase agreements and large certificates of deposit, requiring management to closely monitor its asset/liability mix in terms of both rate sensitivity and maturity distribution. Primary liquidity of the Company and its subsidiaries has been maintained by means of increased investment in shorter-term securities, certificates of deposit and repurchase agreements. As in the past, the Company will continue to monitor the volatility
18
and cost of funds in an attempt to match maturities of rate-sensitive assets and liabilities, and respond accordingly to anticipate fluctuations in interest rates over reasonable periods of time.
Asset/Liability Management
The Company's fund management policy has as its primary focus the measurement and management of the banks' earnings at risk in the face of rising or falling interest rate forecasts. The earliest and most simplistic concept of earnings at risk measurement is the gap report, which is used to generate a rough estimate of the vulnerability of net interest income to changes in market rates as implied by the relative re-pricings of assets and liabilities. The gap report calculates the difference between the amounts of assets and liabilities re-pricing across a series of intervals in time, with emphasis typically placed on the one-year period. This difference, or gap, is usually expressed as a percentage of total assets.
If an excess of liabilities over assets matures or re-prices within the one-year period, the statement of condition is said to be negatively gapped. This condition is sometimes interpreted to suggest that an institution is liability-sensitive, indicating that earnings would suffer from rising rates and benefit from falling rates. If a surplus of assets over liabilities occurs in the one-year time frame, the statement of condition is said to be positively gapped, suggesting a condition of asset sensitivity in which earnings would benefit from rising rates and suffer from falling rates.
The gap report thus consists of an inventory of dollar amounts of assets and liabilities that have the potential to mature or re-price within a particular period. The flaw in drawing conclusions about interest rate risk from the gap report is that it takes no account of the probability that potential maturities or re-pricings of interest-rate-sensitive accounts will occur, or at what relative magnitudes. Because simplicity, rather than utility, is the only virtue of gap analysis, financial institutions increasingly have either abandoned gap analysis or accorded it a distinctly secondary role in managing their interest-rate risk exposure.
The net interest rate sensitivity at December 31, 2009, is illustrated in the following table. This information reflects the balances of assets and liabilities whose rates are subject to change. As indicated in the table on the following page, the Company is liability-sensitive during the early time periods and is asset-sensitive in the longer periods. The table shows the sensitivity of the statement of condition at one point in time and is not necessarily indicative of the position at future dates.
19
INTEREST RATE SENSITIVITY
(Dollars in Thousands)
| |
Rate/Maturity | |||||||||||||||
|---|---|---|---|---|---|---|---|---|---|---|---|---|---|---|---|---|
December 31, 2009
|
3 Months or Less |
Over 3 Months to 1 Year |
Over 1 Year to 5 Years |
Over 5 Years |
Total | |||||||||||
| |
(Dollars in Thousands) |
|||||||||||||||
Rate sensitive assets |
||||||||||||||||
Investment securities |
$ |
499,891 |
$ |
1,747,483 |
$ |
2,399,159 |
$ |
— |
$ |
4,646,533 |
||||||
Loans, net of non-accruals |
4,278,624 | 233,192 | 386,276 | 709,402 | 5,607,494 | |||||||||||
Total earning assets |
$ | 4,778,515 | $ | 1,980,675 | $ | 2,785,435 | $ | 709,402 | $ | 10,254,027 | ||||||
Cumulative earning assets |
$ | 4,778,515 | $ | 6,759,190 | $ | 9,544,625 | $ | 10,254,027 | ||||||||
Rate sensitive liabilities |
||||||||||||||||
Time deposits |
$ |
1,474,301 |
$ |
1,616,955 |
$ |
307,092 |
$ |
308 |
$ |
3,398,656 |
||||||
Other interest bearing deposits |
2,262,552 | — | — | — | 2,262,552 | |||||||||||
Securities sold under repurchase agreements |
331,388 | 109,095 | 1,334 | 1,000,000 | 1,441,817 | |||||||||||
Other borrowed funds |
1,347,625 | — | — | — | 1,347,625 | |||||||||||
Junior subordinated deferrable interest debentures |
61,858 | — | 128,868 | 10,356 | 201,082 | |||||||||||
Total interest bearing liabilities |
$ | 5,477,724 | $ | 1,726,050 | $ | 437,294 | $ | 1,010,664 | $ | 8,651,732 | ||||||
Cumulative sensitive liabilities |
$ | 5,477,724 | $ | 7,203,774 | $ | 7,641,068 | $ | 8,651,732 | ||||||||
Repricing gap |
$ | (699,209 | ) | $ | 254,625 | $ | 2,348,141 | $ | (301,262 | ) | $ | 1,602,295 | ||||
Cumulative repricing gap |
(699,209 | ) | (444,584 | ) | 1,903,557 | 1,602,295 | ||||||||||
Ratio of interest-sensitive assets to liabilities |
.872 | 1.148 | 6.370 | .702 | 1.185 | |||||||||||
Ratio of cumulative, interest- sensitive assets to liabilities |
.872 | .938 | 1.249 | 1.185 | ||||||||||||
The detailed inventory of statement of condition items contained in gap reports is the starting point of income simulation analysis. Income simulation analysis also focuses on the variability of net interest income and net income, but without the limitations of gap analysis. In particular, the fundamental, but often unstated, assumption of the gap approach that every statement of condition item that can re-price will do so to the full extent of any movement in market interest rates is taken into consideration in income simulation analysis.
Accordingly, income simulation analysis captures not only the potential of assets and liabilities to mature or re-price, but also the probability that they will do so. Moreover, income simulation analysis focuses on the relative sensitivities of these balance sheet items and projects their behavior over an extended period of time in a motion picture rather than snapshot fashion. Finally, income simulation analysis permits management to assess the probable effects on balance sheet items not only of changes in market interest rates, but also of proposed strategies for responding to such changes. The Company and many other institutions rely primarily upon income simulation analysis in measuring and managing exposure to interest rate risk.
At December 31, 2009, based on these simulations, a rate shift of 300 basis points in interest rates up will vary projected 2010 net interest income by 1.89%, while a rate shift of 100 basis points down will not vary net interest income by more than .18% of projected 2010 net interest income. The basis point shift in interest rates is a hypothetical rate scenario used to calibrate risk, and does not necessarily represent
20
management's current view of future market developments. The Company believes that it is properly positioned for a potential interest rate increase or decrease.
All the measurements of risk described above are made based upon the Company's business mix and interest rate exposures at the particular point in time. The exposure changes continuously as a result of the Company's ongoing business and its risk management initiatives. While management believes these measures provide a meaningful representation of the Company's interest rate sensitivity, they do not necessarily take into account all business developments that have an effect on net income, such as changes in credit quality or the size and composition of the statement of condition.
Principal sources of liquidity and funding for the Company are dividends from subsidiaries and borrowed funds, with such funds being used to finance the Company's cash flow requirements. The Company closely monitors the dividend restrictions and availability from the bank subsidiaries as disclosed in Note 21 to the Consolidated Financial Statements. At December 31, 2009, the aggregate amount legally available to be distributed to the Company from bank subsidiaries as dividends was approximately $390,000,000, assuming that each bank subsidiary continues to be classified as "well capitalized" under the applicable regulations. The restricted capital (capital and surplus) of the bank subsidiaries was approximately $928,945,000 as of December 31, 2009. The undivided profits of the bank subsidiaries were approximately $727,972,000 as of December 31, 2009. Additionally, as a result of the Company's participation in the TARP Capital Purchase Program, the Company is restricted in the payment of dividends and may not without the Treasury Department's consent, declare or pay any dividend on the Company Common Stock other than a regular semi-annual cash dividend of not more than $.33 per share, as adjusted for any stock dividend or stock split. The restriction ceases to exist only on the earlier to occur of December 23, 2011 or the date on which the Company has redeemed all of the Series A Preferred Stock issued as part of the Capital Purchase Program or the date on which the Treasury has transferred all of the Preferred Stock to third parties affiliated with the Treasury.
At December 31, 2009, the Company has outstanding $1,347,625,000 in other borrowed funds and $201,082,000 in junior subordinated deferrable interest debentures. In addition to borrowed funds and dividends, the Company has a number of other available alternatives to finance the growth of its existing banks as well as future growth and expansion.
Capital
The Company maintains an adequate level of capital as a margin of safety for its depositors and shareholders. At December 31, 2009, shareholders' equity was $1,407,470,000 compared to $1,257,297,000 at December 31, 2008, an increase of $150,173,000, or 11.9%. Shareholders' equity increased primarily due to the retention of earnings offset by the payment of cash dividends to shareholders and the repurchase of common stock under the Company's publicly announced stock purchase program. The accumulated other comprehensive income is not included in the calculation of regulatory capital ratios.
During 1990, the Federal Reserve Board ("FRB") adopted a minimum leverage ratio of 3% for the most highly rated bank holding companies and at least 4% to 5% for all other bank holding companies. The Company's leverage ratio (defined as shareholders' equity plus eligible trust preferred securities issued and outstanding less goodwill and certain other intangibles divided by average quarterly assets) was 10.95% at December 31, 2009 and 9.97% at December 31, 2008. The large increase in the Company's leverage ratio is primarily due to the Company's participation in the Treasury's CPP program. The core deposit intangibles and goodwill of $304,890,000 as of December 31, 2009, are deducted from the sum of core capital elements when determining the capital ratios of the Company.
21
The FRB has adopted risk-based capital guidelines which assign risk weightings to assets and off-balance sheet items. The guidelines also define and set minimum capital requirements (risk-based capital ratios). Under the final 1992 rules, all banks are required to have Tier 1 capital of at least 4.0% of risk-weighted assets and total capital of 8.0% of risk-weighted assets. Tier 1 capital consists principally of shareholders' equity plus trust preferred securities issued and outstanding less goodwill and certain other intangibles, while total capital consists of Tier 1 capital, certain debt instruments and a portion of the reserve for loan losses. In order to be deemed well capitalized pursuant to the regulations, an institution must have a total risk-weighted capital ratio of 10%, a Tier 1 risk-weighted ratio of 6% and a Tier 1 leverage ratio of 5%. The Company had risk-weighted Tier 1 capital ratios of 17.74% and 15.30% and risk weighted total capital ratios of 18.99% and 16.35% as of December 31, 2009 and 2008, respectively, which are well above the minimum regulatory requirements and exceed the well capitalized ratios (see Note 21 to Notes to Consolidated Financial Statements).
During the past few years the Company has expanded its banking facilities. Among the activities and commitments the Company funded during 2009 and 2008 were certain capital expenditures relating to the modernization and improvement of several existing bank facilities and the expansion of the bank branch network.
Junior Subordinated Deferrable Interest Debentures
The Company has formed twelve statutory business trusts under the laws of the State of Delaware, for the purpose of issuing trust preferred securities. As part of the Local Financial Corporation ("LFIN") acquisition, the Company acquired three additional statutory business trusts previously formed by LFIN for the purpose of issuing trust preferred securities. The twelve statutory business trusts formed by the Company and the three business trusts acquired in the LFIN transaction (the "Trusts") have each issued Capital and Common Securities and invested the proceeds thereof in an equivalent amount of junior subordinated debentures (the "Debentures") issued by the Company or LFIN, as appropriate. As of December 31, 2009, the Debentures issued by four of the trusts formed by the Company and the Debentures issued by all three of the trusts formed by LFIN have been redeemed by the Company. As of December 31, 2009, the principal amount of debentures outstanding totaled $201,082,000. As a result of participation in the TARP Capital Purchase Program, the Company may not without the consent of the Treasury Department redeem any of the Debentures until the earlier to occur of December 23, 2011, or the date on which the Company has redeemed all of the Series A Preferred Stock issued under the Capital Purchase Program or the date on which the Treasury has transferred all of the Series A Preferred Stock to third parties not affiliated with the Treasury.
The Debentures are subordinated and junior in right of payment to all present and future senior indebtedness (as defined in the respective indentures) of the Company, and are pari passu with one another. The interest rate payable on, and the payment terms of the Debentures are the same as the distribution rate and payment terms of the respective issues of Capital and Common Securities issued by the Trusts. The Company has fully and unconditionally guaranteed the obligations of each of the Trusts with respect to the Capital and Common Securities. The Company has the right, unless an Event of Default (as defined in the Indentures) has occurred and is continuing, to defer payment of interest on the Debentures for up to ten consecutive semi-annual periods on Trust I and for up to twenty consecutive quarterly periods on Trusts VI, VII, VIII, IX, X, XI and XII. If interest payments on any of the Debentures are deferred, distributions on both the Capital and Common Securities related to that Debenture would also be deferred. The redemption prior to maturity of any of the Debentures may require the prior approval of the Federal Reserve and/or other regulatory bodies.
For financial reporting purposes, the Trusts are treated as investments of the Company and not consolidated in the consolidated financial statements. Although the Capital Securities issued by each of the Trusts are not included as a component of shareholders' equity on the consolidated statement of condition, the Capital Securities are treated as capital for regulatory purposes. Specifically, under applicable
22
regulatory guidelines, the Capital Securities issued by the Trusts qualify as Tier 1 capital up to a maximum of 25% of Tier 1 capital on an aggregate basis. Any amount that exceeds the 25% threshold would qualify as Tier 2 capital. As of December 31, 2009, the total $201,082,000, of the Capital Securities outstanding qualified as Tier 1 capital.
In March 2005, the Federal Reserve Board issued a final rule that allowed the inclusion of trust preferred securities in Tier 1 capital, but placed stricter quantitative limits. Under the final rule, after a transition period ending March 31, 2009, the aggregate amount of trust preferred securities and certain other capital elements would be limited to 25% of Tier 1 capital, net of goodwill, less any associated deferred tax liability. The amount of trust preferred securities and certain other elements in excess of the limit could be included in Tier 2 capital, subject to restrictions. On March 16, 2009, the Federal Reserve Board extended for two years the transition period. The Company believes that all of the current trust preferred securities will be included in Tier 1 capital after the transition period ending on March 31, 2011.
The following table illustrates key information about each of the Debentures and their interest rates at December 31, 2009:
| |
Junior Subordinated Deferrable Interest Debentures |
Repricing Frequency |
Interest Rate | Interest Rate Index |
Maturity Date | Optional Redemption Date |
||||||||
|---|---|---|---|---|---|---|---|---|---|---|---|---|---|---|
| |
(in thousands) |
|
|
|
|
|
||||||||
Trust I |
$ | 10,356 | Fixed | 10.18 | % | Fixed | June 2031 | June 2011 | ||||||
Trust VI |
$ | 25,774 | Quarterly | 3.72 | % | LIBOR + 3.45 | November 2032 | May 2010 | ||||||
Trust VII |
$ | 10,310 | Quarterly | 3.53 | % | LIBOR + 3.25 | April 2033 | April 2010 | ||||||
Trust VIII |
$ | 25,774 | Quarterly | 3.33 | % | LIBOR + 3.05 | October 2033 | April 2010 | ||||||
Trust IX |
$ | 41,238 | Fixed | 7.10 | % | Fixed | October 2036 | October 2011 | ||||||
Trust X |
$ | 34,021 | Fixed | 6.66 | % | Fixed | February 2037 | February 2012 | ||||||
Trust XI |
$ | 32,990 | Fixed | 6.82 | % | Fixed | July 2037 | July 2012 | ||||||
Trust XII |
$ | 20,619 | Fixed | 6.85 | % | Fixed | September 2037 | September 2012 | ||||||
|
$ | 201,082 | ||||||||||||
- (1)
- Trust IX, X, XI and XII accrue interest at a fixed rate for the first five years, then floating at LIBOR + 1.62%, 1.65%, 1.62% and 1.45% thereafter, respectively.
Contractual Obligations and Commercial Commitments
The following table presents contractual cash obligations of the Company (other than deposit liabilities) as of December 31, 2009:
| |
Payments due by Period | |||||||||||||||
|---|---|---|---|---|---|---|---|---|---|---|---|---|---|---|---|---|
| |
(Dollars in Thousands) |
|||||||||||||||
Contractual Cash Obligations
|
Total | Less than One Year |
One to Three Years |
Three to Five Years |
After Five Years |
|||||||||||
Securities sold under repurchase agreements |
$ | 1,441,817 | $ | 440,483 | $ | 1,334 | $ | — | $ | 1,000,000 | ||||||
Federal Home Loan Bank borrowings |
$ | 1,347,625 | 1,347,625 | — | — | — | ||||||||||
Junior subordinated deferrable interest debentures |
$ | 201,082 | — | — | — | 201,082 | ||||||||||
Operating leases |
$ | 38,022 | 10,043 | 13,930 | 6,385 | 7,664 | ||||||||||
Total Contractual Cash Obligations |
$ | 3,028,546 | $ | 1,798,151 | $ | 15,264 | $ | 6,385 | $ | 1,208,746 | ||||||
23
The following table presents contractual commercial commitments of the Company (other than deposit liabilities) as of December 31, 2009:
| |
Amount of Commitment Expiration Per Period | ||||||||||||||||
|---|---|---|---|---|---|---|---|---|---|---|---|---|---|---|---|---|---|
| |
(Dollars in Thousands) |
||||||||||||||||
Commercial Commitments
|
Total | Less than One Year |
One to Three Years |
Three to Five Years |
After Five Years |
||||||||||||
Financial and Performance Standby Letters of Credit |
$ | 132,151 | $ | 127,941 | $ | 4,210 | $ | — | $ | — | |||||||
Commercial Letters of Credit |
$ | 1,356 | 1,356 | — | — | — | |||||||||||
Credit Card Lines |
$ | 48,016 | 48,016 | — | — | — | |||||||||||
Other Commercial Commitments |
$ | 1,167,993 | 705,699 | 328,749 | 62,351 | 71,194 | |||||||||||
Total Commercial Commitments |
$ | 1,349,516 | $ | 883,012 | $ | 332,959 | $ | 62,351 | $ | 71,194 | |||||||
Due to the nature of the Company's commercial commitments, including unfunded loan commitments and lines of credit, the amounts presented above do not necessarily reflect the amounts the Company anticipates funding in the periods presented above.
Critical Accounting Policies
The Company has established various accounting policies which govern the application of accounting principles in the preparation of the Company's consolidated financial statements. The significant accounting policies are described in the Notes to the Consolidated Financial Statements. Certain accounting policies involve significant subjective judgments and assumptions by management which have a material impact on the carrying value of certain assets and liabilities; management considers such accounting policies to be critical accounting policies.
The Company considers its Allowance for Probable Loan Losses as a policy critical to the sound operations of the bank subsidiaries. The allowance for probable loan losses consists of the aggregate loan loss allowances of the bank subsidiaries. The allowances are established through charges to operations in the form of provisions for probable loan losses. Loan losses or recoveries are charged or credited directly to the allowances. The allowance for probable loan losses of each bank subsidiary is maintained at a level considered appropriate by management, based on estimated probable losses in the loan portfolio. The allowance is derived from the following elements: (i) allowances established on specific loans (ii) allowances based on quantitative historical loss experience on the Company's loan portfolio and (iii) allowances based on qualitative data, which includes general economic conditions and other risk factors both internal and external to the Company. See also discussion regarding the allowance for probable loan losses and provision for probable loan losses included in the results of operations and "Provision and Allowance for Probable Loan Losses" included in Notes 1 and 5 of the Notes to Consolidated Financial Statements.
The specific loan loss provision is determined using the following methods. On a weekly basis, loan past due reports are reviewed by the servicing loan officer to determine if a loan has any potential problem and if a loan should be placed on the Company's internal classified report. Additionally, the Company's credit department reviews the majority of the Company's loans regardless of whether they are past due and segregates any loans with potential problems for further review. The credit department will discuss the potential problem loans with the servicing loan officers to determine any relevant issues that were not discovered in the evaluation. Also, any analysis on loans that is provided through examinations by regulatory authorities is considered in the review process. After the above analysis is completed, the Company will determine if a loan should be placed on an internal classified report because of issues related to the analysis of the credit, credit documents, collateral and/or payment history.
24
The Company's internal classified report is segregated into the following categories: (i) "Special Review Credits," (ii) "Watch List—Pass Credits," or (iii) "Watch List—Substandard Credits." The loans placed in the "Special Review Credits" category reflect the Company's opinion that the loans reflect potential weakness which require monitoring on a more frequent basis. The "Special Review Credits" are reviewed and discussed on a regular basis with the credit department and the lending staff to determine if a change in category is warranted. The loans placed in the "Watch List—Pass Credits" category reflect the Company's opinion that the credit contains weaknesses which represent a greater degree of risk, which warrant "extra attention." The "Watch List—Pass Credits" are reviewed and discussed on a regular basis with the credit department and the lending staff to determine if a change in category is warranted. The loans placed in the "Watch List—Substandard Credits" classification are considered to be potentially inadequately protected by the current sound worth and debt service capacity of the borrower or of any pledged collateral. These credit obligations, even if apparently protected by collateral value, have shown defined weaknesses related to adverse financial, managerial, economic, market or political conditions which may jeopardize repayment of principal and interest. Furthermore, there is the possibility that some future loss could be sustained by the bank if such weaknesses are not corrected; provided however, management may evaluate these credits under Statement of Financial Accounting Standards No. 114, "Accounting by Creditors for Impairment of a Loan," now included as part of ASC 310-10, "Receivables," criteria and, if deemed necessary, a specific reserve is allocated to the credit, but management does not necessarily believe there is a loss present in this classified credit category. The specific reserve allocated under ASC 310-10, is based on (1) the present value of expected future cash flows discounted at the loan's effective interest rate; (2) the loan's observable market price; or (3) the fair value of the collateral if the loan is collateral dependent. Substantially all of the Company's loans evaluated under ASC 310-10 are measured using the fair value of collateral method. In limited cases, the Company may use other methods to determine the specific reserve of a loan under SFAS ASC 310-10 if such loan is not collateral dependent.
The allowance based on historical loss experience on the Company's remaining loan portfolio, which includes the "Special Review Credits," "Watch List—Pass Credits," and "Watch List—Substandard Credits" is determined by segregating the remaining loan portfolio into certain categories such as commercial loans, installment loans, international loans, loan concentrations and overdrafts. Installment loans are then further segregated by number of days past due. A historical loss percentage, adjusted for (i) management's evaluation of changes in lending policies and procedures, (ii) current economic conditions in the market area served by the Company, (iii) other risk factors, (iv) the effectiveness of the internal loan review function, (v) changes in loan portfolios, and (vi) the composition and concentration of credit volume is applied to each category. Each category is then added together to determine the allowance allocated under ASC 450-20.
The Company's management continually reviews the allowance for loan loss of the bank subsidiaries using the amounts determined from the allowances established on specific loans, allowance established on quantitative historical percentages, allowance based on qualitative data, and the loans charged off and recoveries to establish an appropriate amount to maintain in the Company's allowance for loan loss. If the basis of the Company's assumptions change, the allowance for loan loss would either decrease or increase and the Company would increase or decrease the provision for loan loss charged to operations accordingly.
Recent Accounting Standards Issued
See Note 1—Summary of Significant Accounting Policies in the accompanying Notes to the Consolidated Financial Statements for details of recently issued and recently adopted accounting standards and their impact on the Company's consolidated financial statements.
Preferred Stock, Common Stock and Dividends
The Company had issued and outstanding 68,103,940 shares of $1.00 par value Common Stock held by approximately 2,485 holders of record at February 24, 2010. The book value of the Common Stock at
25
December 31, 2009 was $18.90 per share compared with $16.25 per share at December 31, 2008. The Company has issued and outstanding 216,000 shares of Fixed Rate Cumulative Perpetual Preferred Stock, Series A, par value $0.01 per share, having a liquidation preference of $1,000 per share, as of February 25, 2009. The book value of the Series A Preferred at December 31, 2008 was $1,000 per share.
The Common Stock is traded on the NASDAQ National Market under the symbol "IBOC." The following table sets forth the approximate high and low bid prices in the Company's Common Stock during 2009 and 2008, as quoted on the NASDAQ National Market for each of the quarters in the two year period ended December 31, 2009. Some of the quotations reflect inter-dealer prices, without retail mark-up, mark-down or commission and may not necessarily represent actual transactions. The closing sales price of the Company's Common Stock was $21.88 per share at February 24, 2010.
| |
|
High | Low | ||||||
|---|---|---|---|---|---|---|---|---|---|
| 2009: | First quarter | $ | 21.68 | $ | 7.36 | ||||
| Second quarter | 14.92 | 7.82 | |||||||
| Third quarter | 16.91 | 9.18 | |||||||
| Fourth quarter | 19.06 | 14.85 | |||||||
| |
|
High | Low | ||||||
|---|---|---|---|---|---|---|---|---|---|
| 2008: | First quarter | $ | 24.61 | $ | 18.25 | ||||
| Second quarter | 26.05 | 21.36 | |||||||
| Third quarter | 35.80 | 19.28 | |||||||
| Fourth quarter | 27.40 | 19.08 | |||||||
The Company paid cash dividends to the common shareholders of $.17 per share on May 11, 2009 and November 2, 2009, to all holders of record on April 27, 2009 and October 19, 2009, respectively, or $23,262,000 in the aggregate during 2009. The Company paid cash dividends to the shareholders in 2008 of $.33 per share on April 18 and October 15, 2008, to all holders of record on March 31, 2008 and September 30, 2008, respectively, or $45,253,000 in the aggregate during 2008.
Additionally, as a result of the Company's participation in the TARP Capital Purchase Program, the Company is restricted in the payment of dividends and may not without the Treasury Department's consent, declare or pay any dividend on the Company Common Stock other than a regular semi-annual cash dividend of not more than $.33 per share, as adjusted for any stock dividend or stock split. The restriction ceases to exist only on the earlier to occur of December 23, 2011 or the date on which the Company has redeemed all of the Series A Preferred Stock issued as part of the Capital Purchase Program or the date on which the Treasury has transferred all of the Preferred Stock to third parties not affiliated with the Treasury. On April 7, 2009, the Company gained consent from the Treasury Department (the "Treasury Consent") to use the regular semi-annual cash dividend funds of not more than $.33 per share, as adjusted for any stock dividend or stock split, to pay quarterly dividends and to repurchase common stock. While the IBC Board is inclined to continue to declare regular semi-annual cash dividends, the Board may decide to pay quarterly cash dividends in the future and the amount of any cash dividends, combined with amounts spent in conjunction with the Company's stock repurchase program, will be limited by the restrictions set forth in the Treasury Consent. There can be no assurance as to future dividends because they are dependent upon the Company's future earnings, capital requirements, financial condition, acquisition opportunities and general business conditions at the time.
26
In addition, the Company has issued common stock dividends during the last five-year period as follows:
Date
|
Stock Dividend | |||
|---|---|---|---|---|
May 2, 2005 |
25 | % | ||
May 2006 |
— | % | ||
May 21, 2007 |
10 | % | ||
May 2008 |
— | % | ||
May 2009 |
— | % | ||
The Company's principal source of funds to pay cash dividends on its Common Stock and Series A Preferred Stock is cash dividends from its bank subsidiaries. For a discussion of the limitations, please see Note 21 of Notes to Consolidated Financial Statements.
Stock Repurchase Program
The Company terminated its stock repurchase program on December 19, 2008, in connection with participating in the TARP Capital Purchase Program, which program prohibited stock repurchases, except for repurchases made in connection with the administration of an employee benefit plan in the ordinary course of business and consistent with past practices. Pursuant to the Treasury Consent received on April 7, 2009, the Company obtained consent from the Treasury to repurchase shares of the Company's common stock; provided, however, that in no event will the aggregate amount of cash dividends and common stock repurchases for a given semi-annual period exceed the aggregate amount that would be used to pay the originally permitted semi-annual cash dividend of $.33 per share. Under the new stock repurchase program, the Company is authorized to repurchase up to $40,000,000 of its common stock within twelve months from the adoption of the repurchase program on April 9, 2009. Stock repurchases may be made from time to time, on the open market or through private transactions. As part of the stock repurchase program, during the third quarter of 2009 and the first quarter of 2010, the Company's Board of Directors adopted a rule 10b5-1 trading plan and intends to adopt additional Rule 10b5-1 trading plans that will allow the Company to purchase its shares of common stock during certain trading blackout periods when the Company would ordinarily not be in the market due to trading restrictions set forth in its internal trading policy. Shares repurchased in the stock repurchase program will be held in treasury for reissue for various corporate purposes, including employee stock option plans. The Company is not obligated to repurchase shares under its stock purchase program or to enter into additional Rule 10b5-1 trading plans. The timing, actual number and value of shares purchased will depend on many factors, including the Company's cash flow and the liquidity and price performance of its shares of common stock. As of February 24, 2010, a total of 6,913,284 shares had been repurchased under all programs at a cost of $222,435,000.
Except for repurchases in connection with the administration of an employee benefit plan in the ordinary course of business and consistent with past practices, common stock repurchases are only conducted under publicly announced repurchase programs approved by the Board of Directors. The
27
following table includes information about common stock share repurchases for the quarter ended December 31, 2009.
| |
Total Number of Shares Purchased |
Average Price Paid Per Share |
Total Number of Shares Purchased as Part of a Publicly- Announced Program |
Approximate Dollar Value of Shares Available for Repurchase(1) |
|||||||||
|---|---|---|---|---|---|---|---|---|---|---|---|---|---|
October 1—October 31, 2009 |
— | — | — | $ | 33,346,000 | ||||||||
November 1—November 30, 2009 |
68,877 | 16.08 | 68,877 | 32,239,000 | |||||||||
December 1—December 31, 2009 |
90,309 | 16.79 | 90,309 | 30,722,000 | |||||||||
Total |
159,186 | $ | 16.48 | 159,186 | |||||||||
- (1)
- The formal stock repurchase program was initiated in 1999 and before it was terminated on December 19, 2008, it had been expanded periodically. The new repurchase program that was adopted on April 9, 2009 allows for the repurchase of up to $40,000,000 of treasury stock through April 9, 2010.
Equity Compensation Plan Information
The following table sets forth information as of December 31, 2009, with respect to the Company's equity compensation plans:
Plan Category
|
(A) Number of securities to be issued upon exercise of outstanding options, warrants and rights |
(B) Weighted average exercise price of outstanding options, warrants and rights |
(C) Number of securities remaining available for future issuance under equity compensation plans (excluding securities reflected in column A) |
||||||||
|---|---|---|---|---|---|---|---|---|---|---|---|
Equity Compensation plans approved by security holders |
823,592 | $ | 20.54 | 142,922 | |||||||
Total |
823,592 | $ | 20.54 | 142,922 | |||||||
28
Stock Performance
COMPARISON OF CUMULATIVE FIVE YEAR TOTAL RETURN
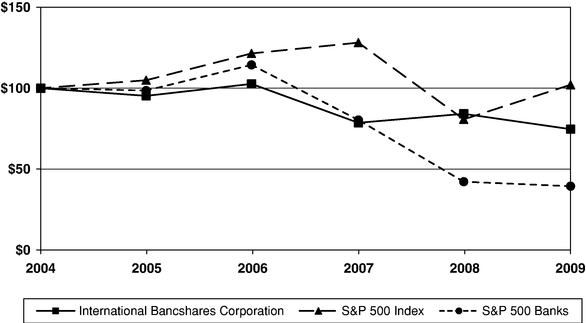
Total Return To Shareholders
(Includes reinvestment of dividends)
| |
|
INDEXED RETURNS December 31, |
|||||||||||||||||
|---|---|---|---|---|---|---|---|---|---|---|---|---|---|---|---|---|---|---|---|
| |
Base Period 2004 |
||||||||||||||||||
Company/Index
|
2005 | 2006 | 2007 | 2008 | 2009 | ||||||||||||||
International Bancshares Corporation |
100 | 95.24 | 102.65 | 78.60 | 84.15 | 74.66 | |||||||||||||
S&P 500 Index |
100 | 104.91 | 121.48 | 128.16 | 80.74 | 102.11 | |||||||||||||
S&P 500 Banks |
100 | 98.54 | 114.41 | 80.33 | 42.18 | 39.40 | |||||||||||||
29
REPORT OF INDEPENDENT REGISTERED PUBLIC ACCOUNTING FIRM
The
Board of Directors and Shareholders
International Bancshares Corporation:
We have audited the accompanying consolidated statements of condition of International Bancshares Corporation and subsidiaries as of December 31, 2009 and 2008, and the related consolidated statements of income, comprehensive income, shareholders' equity, and cash flows for each of the three years in the period ended December 31, 2009. These consolidated financial statements are the responsibility of the Company's management. Our responsibility is to express an opinion on these consolidated financial statements based on our audits.
We conducted our audits in accordance with the standards of the Public Company Accounting Oversight Board (United States). Those standards require that we plan and perform the audit to obtain reasonable assurance about whether the financial statements are free of material misstatement. An audit includes examining, on a test basis, evidence supporting the amounts and disclosures in the financial statements. An audit also includes assessing the accounting principles used and significant estimates made by management, as well as evaluating the overall financial statement presentation. We believe that our audits provide a reasonable basis for our opinion.
In our opinion, the consolidated financial statements referred to above present fairly, in all material respects, the financial position of International Bancshares Corporation and subsidiaries as of December 31, 2009 and 2008, and the results of their operations and their cash flows for each of the three years in the period ended December 31, 2009, in conformity with U.S. generally accepted accounting principles.
As discussed in Note 22 to the consolidated financial statements, effective January 1, 2008, the Company adopted Statement of Financial Accounting Standards No. 157, "Fair Value Measurements".
We have also audited, in accordance with the standards of the Public Company Accounting Oversight Board (United States), International Bancshares Corporation and subsidiaries' internal control over financial reporting as of December 31, 2009, based on criteria established in Internal Control—Integrated Framework issued by the Committee of Sponsoring Organizations of the Treadway Commission, and our report dated March 1, 2010 expressed an unqualified opinion on the effectiveness of International Bancshares Corporation and subsidiaries' internal control over financial reporting.
/s/ McGladrey & Pullen, LLP
Dallas,
Texas
March 1, 2010
30
INTERNATIONAL BANCSHARES CORPORATION AND SUBSIDIARIES
Consolidated Statements of Condition
December 31, 2009 and 2008
(Dollars in
Thousands, Except Per Share Amounts)
| |
2009 | 2008 | |||||||
|---|---|---|---|---|---|---|---|---|---|
Assets |
|||||||||
Cash and due from banks |
$ |
224,638 |
$ |
298,720 |
|||||
Total cash and cash equivalents |
224,638 | 298,720 | |||||||
Time deposits with banks |
— | 396 | |||||||
Investment securities: |
|||||||||
Held to maturity (Market value of $2,450 on December 31, 2009 and $2,300 on December 31, 2008) |
2,450 | 2,300 | |||||||
Available for sale (Amortized cost of $4,541,851 on December 31, 2009 and $5,043,703 on December 31, 2008) |
4,644,083 | 5,071,880 | |||||||
Total investment securities |
4,646,533 | 5,074,180 | |||||||
Loans |
5,667,262 |
5,872,833 |
|||||||
Less allowance for probable loan losses |
(95,393 | ) | (73,461 | ) | |||||
Net loans |
5,571,869 | 5,799,372 | |||||||
Bank premises and equipment, net |
490,375 |
466,371 |
|||||||
Accrued interest receivable |
41,731 | 48,712 | |||||||
Other investments |
359,404 | 388,071 | |||||||
Identified intangible assets, net |
22,358 | 27,385 | |||||||
Goodwill, net |
282,532 | 282,532 | |||||||
Other assets |
123,103 | 53,602 | |||||||
Total assets |
$ | 11,762,543 | $ | 12,439,341 | |||||
See accompanying notes to consolidated financial statements.
31
INTERNATIONAL BANCSHARES CORPORATION AND SUBSIDIARIES
Consolidated Statements of Condition (Continued)
December 31, 2009 and 2008
(Dollars in Thousands, Except Per Share Amounts)
| |
2009 | 2008 | |||||||
|---|---|---|---|---|---|---|---|---|---|
Liabilities and Shareholders' Equity |
|||||||||
Liabilities: |
|||||||||
Deposits: |
|||||||||
Demand—non-interest bearing |
$ | 1,516,799 | $ | 1,459,670 | |||||
Savings and interest bearing demand |
2,262,552 | 2,081,602 | |||||||
Time |
3,398,656 | 3,317,512 | |||||||
Total deposits |
7,178,007 | 6,858,784 | |||||||
Securities sold under repurchase agreements |
1,441,817 |
1,441,131 |
|||||||
Other borrowed funds |
1,347,625 | 2,522,986 | |||||||
Junior subordinated deferrable interest debentures |
201,082 | 201,048 | |||||||
Other liabilities |
186,542 | 158,095 | |||||||
Total liabilities |
10,355,073 | 11,182,044 | |||||||
Commitments, Contingent Liabilities and Other Tax Matters (Note 18) |
|||||||||
Shareholders' equity: |
|||||||||
Series A cumulative perpetual preferred shares, $.01 par value, $1,000 per share liquidation value. Authorized 25,000,000 shares; issued 216,000 shares on December 31, 2009, net of discount of $10,258 and 216,000 shares on December 31, 2008 net of discount of $12,442 |
205,742 |
203,558 |
|||||||
Common shares of $1.00 par value. Authorized 275,000,000 shares; issued 95,711,111 shares on December 31, 2009 and 95,499,399 shares on December 31, 2008 |
95,711 | 95,499 | |||||||
Surplus |
161,258 | 158,110 | |||||||
Retained earnings |
1,122,290 | 1,016,004 | |||||||
Accumulated other comprehensive income |
65,878 | 18,189 | |||||||
|
1,650,879 | 1,491,360 | |||||||
Less cost of shares in treasury, 27,607,171 shares on December 31, 2009 and 26,898,219 shares on December 31, 2008 |
(243,409 |
) |
(234,063 |
) |
|||||
Total shareholders' equity |
1,407,470 | 1,257,297 | |||||||
Total liabilities and shareholders' equity |
$ | 11,762,543 | $ | 12,439,341 | |||||
See accompanying notes to consolidated financial statements.
32
INTERNATIONAL BANCSHARES CORPORATION AND SUBSIDIARIES
Consolidated Statements of Income
Years ended December 31, 2009, 2008 and 2007
(Dollars in Thousands, Except Per Share Amounts)
| |
2009 | 2008 | 2007 | |||||||||
|---|---|---|---|---|---|---|---|---|---|---|---|---|
Interest income: |
||||||||||||
Loans, including fees |
$ | 335,769 | $ | 370,718 | $ | 443,564 | ||||||
Federal funds sold |
— | 927 | 2,712 | |||||||||
Investment securities: |
||||||||||||
Taxable |
185,931 | 188,928 | 190,371 | |||||||||
Tax-exempt |
5,070 | 3,514 | 4,270 | |||||||||
Other interest income |
607 | 516 | 2,656 | |||||||||
Total interest income |
527,377 | 564,603 | 643,573 | |||||||||
Interest expense: |
||||||||||||
Savings and interest bearing demand deposits |
10,832 | 26,651 | 53,778 | |||||||||
Time deposits |
62,255 | 106,479 | 143,020 | |||||||||
Securities sold under repurchase agreements |
44,723 | 50,400 | 43,837 | |||||||||
Other borrowings |
9,451 | 33,976 | 75,317 | |||||||||
Junior subordinated deferrable interest debentures |
12,535 | 14,137 | 17,178 | |||||||||
Other interest expense |
— | 88 | 210 | |||||||||
Total interest expense |
139,796 | 231,731 | 333,340 | |||||||||
Net interest income |
387,581 | 332,872 | 310,233 | |||||||||
Provision (credit) for probable loan losses |
58,833 |
19,813 |
(1,762 |
) |
||||||||
Net interest income after provision (credit) for probable loan losses |
328,748 | 313,059 | 311,995 | |||||||||
Non-interest income: |
||||||||||||
Service charges on deposit accounts |
99,642 | 98,466 | 89,186 | |||||||||
Other service charges, commissions and fees |
||||||||||||
Banking |
42,861 | 40,543 | 34,897 | |||||||||
Non-banking |
12,697 | 7,592 | 18,675 | |||||||||
Investment securities transactions, net |
11,956 | 6,427 | (15,938 | ) | ||||||||
Other investments, net |
19,773 | 15,183 | 19,821 | |||||||||
Other income |
14,084 | 21,598 | 18,722 | |||||||||
Total non-interest income |
201,013 | 189,809 | 165,363 | |||||||||
See accompanying notes to consolidated financial statements.
33
INTERNATIONAL BANCSHARES CORPORATION AND SUBSIDIARIES
Consolidated Statements of Income (Continued)
Years ended December 31, 2009, 2008 and 2007
(Dollars in Thousands, Except Per Share Amounts)
| |
2009 | 2008 | 2007 | |||||||||
|---|---|---|---|---|---|---|---|---|---|---|---|---|
Non-interest expense: |
||||||||||||
Employee compensation and benefits |
$ | 130,849 | $ | 129,084 | $ | 130,385 | ||||||
Occupancy |
35,374 | 38,315 | 33,583 | |||||||||
Depreciation of bank premises and equipment |
35,879 | 36,700 | 32,069 | |||||||||
Professional fees |
12,640 | 10,051 | 9,741 | |||||||||
Deposit insurance assessments |
10,249 | 1,027 | 872 | |||||||||
Stationery and supplies |
4,496 | 6,129 | 6,414 | |||||||||
Amortization of identified intangible assets |
5,286 | 5,195 | 5,188 | |||||||||
Advertising |
9,149 | 13,189 | 11,973 | |||||||||
Other |
65,109 | 61,536 | 70,057 | |||||||||
Total non-interest expense |
309,031 | 301,226 | 300,282 | |||||||||
Income before income taxes |
220,730 | 201,642 | 177,076 | |||||||||
Provision for income taxes |
77,988 |
69,530 |
55,764 |
|||||||||
Net income |
$ | 142,742 | $ | 132,112 | $ | 121,312 | ||||||
Preferred stock dividends and discount accretion |
12,984 | — | — | |||||||||
Net income available to common shareholders |
$ | 129,758 | $ | 132,112 | $ | 121,312 | ||||||
Basic earnings per common share: |
||||||||||||
Weighted average number of shares outstanding |
68,373,732 |
68,576,654 |
69,036,274 |
|||||||||
Net income |
$ |
1.90 |
$ |
1.93 |
$ |
1.76 |
||||||
Fully diluted earnings per common share: |
||||||||||||
Weighted average number of shares outstanding |
68,394,624 |
68,714,390 |
69,370,111 |
|||||||||
Net income |
$ |
1.90 |
$ |
1.92 |
$ |
1.75 |
||||||
See accompanying notes to consolidated financial statements.
34
INTERNATIONAL BANCSHARES CORPORATION AND SUBSIDIARIES
Consolidated Statements of Comprehensive Income
Years ended December 31, 2009, 2008, and 2007
(Dollars in Thousands)
| |
2009 | 2008 | 2007 | ||||||||
|---|---|---|---|---|---|---|---|---|---|---|---|
Net income |
$ | 142,742 | $ | 132,112 | $ | 121,312 | |||||
Other comprehensive income, net of tax: |
|||||||||||
Net unrealized gains on securities available for sale arising during the year (tax effects of $29,863, $11,955, and $16,259) |
55,460 |
22,202 |
30,195 |
||||||||
Reclassification adjustment for (gains) losses on securities available for sale included in net income (tax effects of $(4,185), $(2,249) and $5,578) |
(7,771 | ) | (4,178 | ) | 10,360 | ||||||
Comprehensive income |
$ | 190,431 | $ | 150,136 | $ | 161,867 | |||||
See accompanying notes to consolidated financial statements.
35
INTERNATIONAL BANCSHARES CORPORATION AND SUBSIDIARIES
Consolidated Statements of Shareholders' Equity
Years ended December 31, 2009, 2008 and 2007
(in Thousands)
| |
Number of Shares |
Preferred Stock |
Common Stock |
Surplus | Retained Earnings |
Other Comprehensive Income (Loss) |
Treasury Stock |
Total | |||||||||||||||||||
|---|---|---|---|---|---|---|---|---|---|---|---|---|---|---|---|---|---|---|---|---|---|---|---|---|---|---|---|
Balance at December 31, 2006 |
86,224 | $ | — | $ | 86,224 | $ | 138,247 | $ | 861,251 | $ | (40,390 | ) | $ | (203,276 | ) | $ | 842,056 | ||||||||||
Net Income |
— | — | — | — | 121,312 | — | — | 121,312 | |||||||||||||||||||
Dividends: |
|||||||||||||||||||||||||||
Shares issued |
8,653 | — | 8,653 | — | (8,653 | ) | — | — | — | ||||||||||||||||||
Cash ($.68 per share) |
— | — | — | — | (44,765 | ) | — | — | (44,765 | ) | |||||||||||||||||
Purchase of treasury (1,196,688 shares) |
— | — | — | — | — | — | (29,710 | ) | (29,710 | ) | |||||||||||||||||
Exercise of stock options |
564 | — | 564 | 5,122 | — | — | — | 5,686 | |||||||||||||||||||
Stock compensation expense recognized in earnings |
— | — | — | 771 | — | — | — | 771 | |||||||||||||||||||
Other comprehensive income, net of tax: |
|||||||||||||||||||||||||||
Net change in unrealized gains and losses on available for sale securities, net of reclassification adjustment |
— | — | — | — | — | 40,555 | — | 40,555 | |||||||||||||||||||
Balance at December 31, 2007 |
95,441 | — | 95,441 | 144,140 | 929,145 | 165 | (232,986 | ) | 935,905 | ||||||||||||||||||
Net Income |
— | — | — | — | 132,112 | — | — | 132,112 | |||||||||||||||||||
Dividends: |
|||||||||||||||||||||||||||
Cash ($.66 per share) |
— | — | — | — | (45,253 | ) | — | — | (45,253 | ) | |||||||||||||||||
Issuance of preferred stock(1) |
— | 203,558 | — | 12,442 | — | — | — | 216,000 | |||||||||||||||||||
Purchase of treasury stock (48,339 shares) |
— | — | — | — | — | — | (1,077 | ) | (1,077 | ) | |||||||||||||||||
Exercise of stock options |
58 | — | 58 | 836 | — | — | — | 894 | |||||||||||||||||||
Stock compensation expense recognized in earnings |
— | — | — | 692 | — | — | — | 692 | |||||||||||||||||||
Other comprehensive income, net of tax: |
|||||||||||||||||||||||||||
Net change in unrealized gains and losses on available for sale securities, net of reclassification adjustment |
— | — | — | — | — | 18,024 | — | 18,024 | |||||||||||||||||||
Balance at December 31, 2008 |
95,499 | 203,558 | 95,499 | 158,110 | 1,016,004 | 18,189 | (234,063 | ) | 1,257,297 | ||||||||||||||||||
Net Income |
— | — | — | — | 142,742 | — | — | 142,742 | |||||||||||||||||||
Dividends: |
|||||||||||||||||||||||||||
Cash ($.34 per share) |
— | — | — | — | (23,262 | ) | — | — | (23,262 | ) | |||||||||||||||||
Preferred stock (5%), including discount accretion |
— | 2,184 | — | — | (13,194 | ) | — | — | (11,010 | ) | |||||||||||||||||
Purchase of treasury stock (708,952 shares) |
— | — | — | — | — | — | (9,346 | ) | (9,346 | ) | |||||||||||||||||
Exercise of stock options |
212 | — | 212 | 2,493 | — | — | — | 2,705 | |||||||||||||||||||
Stock compensation expense recognized in earnings |
— | — | — | 655 | — | — | — | 655 | |||||||||||||||||||
Other comprehensive income, net of tax: |
|||||||||||||||||||||||||||
Net change in unrealized gains and losses on available for sale securities, net of reclassification adjustment |
— | — | — | — | — | 47,689 | — | 47,689 | |||||||||||||||||||
Balance at December 31, 2009 |
95,711 | $ | 205,742 | $ | 95,711 | $ | 161,258 | $ | 1,122,290 | $ | 65,878 | $ | (243,409 | ) | $ | 1,407,470 | |||||||||||
See accompanying notes to consolidated financial statements.
36
INTERNATIONAL BANCSHARES CORPORATION AND SUBSIDIARIES
Consolidated Statements of Cash Flows
Years ended December 31, 2009, 2008 and 2007
(Dollars in Thousands)
| |
2009 | 2008 | 2007 | ||||||||||
|---|---|---|---|---|---|---|---|---|---|---|---|---|---|
Operating activities: |
|||||||||||||
Net income: |
$ | 142,742 | $ | 132,112 | $ | 121,312 | |||||||
Adjustments to reconcile net income to net cash provided by operating activities: |
|||||||||||||
Provision (credit) for probable loan losses |
58,833 | 19,813 | (1,762 | ) | |||||||||
Amortization of loan premiums |
— | 134 | 191 | ||||||||||
Accretion of discounts on time deposits with banks |
— | 1 | (60 | ) | |||||||||
Accretion of time deposit discounts |
(14 | ) | (36 | ) | (19 | ) | |||||||
Depreciation of bank premises and equipment |
35,879 | 36,700 | 32,069 | ||||||||||
Loss (gain) on sale of bank premises and equipment |
80 | 282 | (3,434 | ) | |||||||||
Depreciation and amortization of leased assets |
300 | 880 | 2,167 | ||||||||||
Accretion of investment securities discounts |
(1,940 | ) | (1,405 | ) | (546 | ) | |||||||
Amortization of investment securities premiums |
6,911 | 6,017 | 4,528 | ||||||||||
Investment securities transactions, net |
(11,956 | ) | (6,427 | ) | 15,938 | ||||||||
Accretion of junior subordinated debenture discounts |
34 | 119 | 332 | ||||||||||
Amortization of identified intangible assets |
5,286 | 5,195 | 5,188 | ||||||||||
Stock based compensation expense |
655 | 692 | 771 | ||||||||||
Earnings from affiliates and other investments |
(16,891 | ) | (11,324 | ) | (12,298 | ) | |||||||
Deferred tax benefit |
(3,035 | ) | (4,683 | ) | (4,626 | ) | |||||||
Decrease in accrued interest receivable |
6,981 | 5,589 | 3,505 | ||||||||||
Increase in other assets |
(69,845 | ) | (10,677 | ) | (1,976 | ) | |||||||
(Decrease) increase in other liabilities |
(97,022 | ) | (18,878 | ) | 3,482 | ||||||||
Net cash provided by operating activities |
56,998 | 154,104 | 164,762 | ||||||||||
Investing activities: |
|||||||||||||
Proceeds from maturities of securities |
1,637 | 18,124 | 25,903 | ||||||||||
Proceeds from sales and calls of available for sale securities |
579,099 | 8,376 | 841,084 | ||||||||||
Purchases of available for sale securities |
(1,196,157 | ) | (2,002,446 | ) | (1,522,833 | ) | |||||||
Principal collected on mortgage backed securities |
1,224,938 | 1,186,450 | 1,036,364 | ||||||||||
Proceeds from matured time deposits with banks |
396 | 4,457 | 42,155 | ||||||||||
Net decrease (increase) in loans |
168,671 | (344,418 | ) | (470,454 | ) | ||||||||
Purchases of other investments |
(11,430 | ) | (60,567 | ) | (56,460 | ) | |||||||
Distributions from other investments |
56,988 | 7,385 | 93,411 | ||||||||||
Purchases of bank premises and equipment |
(61,015 | ) | (68,537 | ) | (80,614 | ) | |||||||
Proceeds from sales of bank premises and equipment |
1,052 | 838 | 7,973 | ||||||||||
Adjustment to goodwill related tax contingencies |
— | — | 5,885 | ||||||||||
Purchase, adjustment of identified intangible asset (Note 2) |
(259 | ) | (1,074 | ) | — | ||||||||
Cash paid in purchase transaction |
— | — | (23,470 | ) | |||||||||
Cash acquired in purchase transaction |
— | — | 30,772 | ||||||||||
Net cash provided by (used in) investing activities |
763,920 | (1,251,412 | ) | (70,284 | ) | ||||||||
See accompanying notes to consolidated financial statements.
37
INTERNATIONAL BANCSHARES CORPORATION AND SUBSIDIARIES
Consolidated Statements of Cash Flows (Continued)
Years ended December 31, 2009, 2008 and 2007
(Dollars in Thousands)
| |
2009 | 2008 | 2007 | ||||||||||
|---|---|---|---|---|---|---|---|---|---|---|---|---|---|
Financing activities: |
|||||||||||||
Net increase (decrease) in non-interest bearing demand deposits |
$ | 57,129 | $ | (52,957 | ) | $ | 29,813 | ||||||
Net increase (decrease) in savings and interest bearing demand deposits |
180,950 | (210,987 | ) | 31,517 | |||||||||
Net increase (decrease) in time deposits |
81,158 | (34,842 | ) | (11,624 | ) | ||||||||
Net increase in securities sold under repurchase agreements |
686 | 112,148 | 622,648 | ||||||||||
Other borrowed funds, net |
(1,175,361 | ) | 1,066,050 | (638,887 | ) | ||||||||
Principal payments of long-term debt |
— | — | (63,920 | ) | |||||||||
Proceeds from issuance of long-term debt |
— | — | 53,609 | ||||||||||
Purchase of treasury stock |
(9,346 | ) | (1,077 | ) | (29,710 | ) | |||||||
Proceeds from stock transactions |
2,705 | 216,894 | 5,686 | ||||||||||
Payments of cash dividends—common |
(23,261 | ) | (45,253 | ) | (44,738 | ) | |||||||
Payments of cash dividends—preferred |
(9,660 | ) | — | — | |||||||||
Payments of cash dividends in lieu of fractional shares |
— | — | (27 | ) | |||||||||
Net cash (used in) provided by financing activities |
(895,000 | ) | 1,049,976 | (45,633 | ) | ||||||||
(Decrease) increase in cash and cash equivalents |
(74,082 | ) | (47,332 | ) | 48,845 | ||||||||
Cash and cash equivalents at beginning of year |
298,720 | 346,052 | 297,207 | ||||||||||
Cash and cash equivalents at end of year |
$ | 224,638 | $ | 298,720 | $ | 346,052 | |||||||
Supplemental cash flow information: |
|||||||||||||
Interest paid |
$ | 146,778 | $ | 245,509 | $ | 333,907 | |||||||
Income taxes paid |
83,830 | 69,646 | 62,145 | ||||||||||
Purchases of available-for-sale securities not yet settled |
100,829 | 84,768 | — | ||||||||||
Accrued dividends, preferred shares |
1,350 | — | — | ||||||||||
Adjustment to goodwill arising from acquisition |
— | — | 7,960 | ||||||||||
See accompanying notes to consolidated financial statements.
38
INTERNATIONAL BANCSHARES CORPORATION AND SUBSIDIARIES
Notes to Consolidated Financial Statements
(1) Summary of Significant Accounting Policies
The accounting and reporting policies of International Bancshares Corporation ("Corporation") and Subsidiaries (the Corporation and Subsidiaries collectively referred to herein as the "Company") conform to accounting principles generally accepted in the United States of America and to general practices within the banking industry. The following is a description of the more significant of those policies.
Consolidation and Basis of Presentation
The consolidated financial statements include the accounts of the Corporation and its wholly-owned bank subsidiaries, International Bank of Commerce, Laredo ("IBC"), Commerce Bank, International Bank of Commerce, Zapata, International Bank of Commerce, Brownsville, and the Corporation's wholly-owned non-bank subsidiaries, IBC Subsidiary Corporation, IBC Life Insurance Company, IBC Trading Company, Premier Tierra Holdings, Inc. and IBC Capital Corporation. All significant inter-company balances and transactions have been eliminated in consolidation.
The Company, through its subsidiaries, is primarily engaged in the business of banking, including the acceptance of checking and savings deposits and the making of commercial, real estate, personal, home improvement, automobile and other installment and term loans. The primary markets of the Company are South, Central, and Southeast Texas and the state of Oklahoma. Each bank subsidiary is very active in facilitating international trade along the United States border with Mexico and elsewhere. Although the Company's loan portfolio is diversified, the ability of the Company's debtors to honor their contracts is primarily dependent upon the economic conditions in the Company's trade area. In addition, the investment portfolio is directly impacted by fluctuations in market interest rates. The Company and its bank subsidiaries are subject to the regulations of certain Federal agencies as well as the Texas Department of Banking and undergo periodic examinations by those regulatory authorities. Such agencies may require certain standards or impose certain limitations based on their judgments or changes in law and regulations.
The Company owns two insurance-related subsidiaries, IBC Life Insurance Company and IBC Insurance Agency, Inc., a wholly owned subsidiary of IBC, the bank subsidiary. Neither of the insurance-related subsidiaries conducts underwriting activities. The IBC Life Insurance Company is in the business of reinsuring credit life and credit accident and health insurance. The business is assumed from an unaffiliated insurer and the only business written is generated by the bank subsidiaries of the Company. The risk assumed on each of the policies is not significant to the consolidated financial statements.
The preparation of the consolidated financial statements in conformity with accounting principles generally accepted in the United States of America requires management to make estimates and assumptions that affect the reported amounts of assets and liabilities as of the dates of the statement of condition and income and expenses for the periods. Actual results could differ significantly from those estimates. Material estimates that are particularly susceptible to significant changes in the near-term relate to the determination of the allowance for probable loan losses.
On July 1, 2009, the Financial Accounting Standards Board officially launched the "FASB Accounting Standards Codification," ("Codification"), which is now the single official source of authoritative, non-governmental U.S. GAAP, in addition to guidance issued by the Securities and Exchange Commission ("SEC"). The Codification supersedes all prior accounting literature. With the launch of the Codification, U.S. GAAP now consists of two levels—authoritative (Codification) and non-authoritative (anything not in the Codification). The Codification is effective for interim and annual periods ending after September 15, 2009, and is organized into approximately 90 accounting topics. The FASB will no longer be issuing
39
INTERNATIONAL BANCSHARES CORPORATION AND SUBSIDIARIES
Notes to Consolidated Financial Statements (Continued)
(1) Summary of Significant Accounting Policies (Continued)
accounting standards in the form of Statements, Staff Positions or Emerging Issues Task Force Abstracts. The FASB will instead amend the Codification by issuing "Accounting Standards Updates." The adoption of the Codification did not have a significant impact to the Company's consolidated financial statements.
Subsequent Events
Effective June 30, 2009, the Company adopted Statement of Financial Accounting Standards No. 165 ("SFAS No. 165"), "Subsequent Events." SFAS No. 165 is currently included in the Codification under ASC Topic 855, "Subsequent Events" ("ASC 855"). ASC 855 establishes general standards of accounting for and disclosure of events that occur after the balance sheet date but before financial statements are issued or available to be issued. ASC 855 defines (i) the period after the balance sheet date during which a reporting entity's management should evaluate events or transactions that may occur for potential recognition or disclosure in the financial statements (ii) the circumstances under which an entity should recognize events or transactions occurring after the balance sheet date in its financial statements and (iii) the disclosures an entity should make about events or transactions that occurred after the balance sheet date. The adoption of the accounting standard did not have an impact on the Company's consolidated financial statements. The Company has evaluated all events or transactions that occurred after December 31, 2009 through March 1, 2010, the date the Company issued these financial statements. During this period, the Company did not have any material recognizable or non-recognizable subsequent events.
Per Share Data
All share and per share information has been restated giving retroactive effect to stock dividends distributed.
Investment Securities
The Company classifies debt and equity securities into one of these categories: held-to-maturity, available-for-sale, or trading. Such classifications are reassessed for appropriate classification at each reporting date. Securities that are intended and expected to be held until maturity are classified as "held-to-maturity" and are carried at amortized cost for financial statement reporting. Securities that are not positively expected to be held until maturity, but are intended to be held for an indefinite period of time are classified as "available-for-sale" or "trading" and are carried at their fair value. Unrealized holding gains and losses are included in net income for those securities classified as "trading", while unrealized holding gains and losses related to those securities classified as "available-for-sale" are excluded from net income and reported net of tax as other comprehensive income and in shareholders' equity as accumulated other comprehensive income until realized. The Company did not maintain any trading securities during the three year period ended December 31, 2009.
Mortgage-backed securities held at December 31, 2009 and 2008 represent participating interests in pools of long-term first mortgage loans originated and serviced by the issuers of the securities. Mortgage-backed securities are either issued or guaranteed by the U.S. Government or its agencies including the Federal Home Loan Mortgage Corporation ("Freddie Mac"), the Federal National Mortgage Association ("Fannie Mae"), the Government National Mortgage Association ("Ginnie Mae") or other non-government entities. Investments in mortgage-backed securities issued by Ginnie Mae are fully guaranteed by the U. S. Government. Investments in mortgage-backed securities issued by Freddie Mac and Fannie
40
INTERNATIONAL BANCSHARES CORPORATION AND SUBSIDIARIES
Notes to Consolidated Financial Statements (Continued)
(1) Summary of Significant Accounting Policies (Continued)
Mae are not fully guaranteed by the U.S. Government, but carry an implied AAA rating with limited credit risk, particularly given the placement of Fannie Mae and Freddie Mac into conservatorship by the federal government in early September 2008. Market interest rate fluctuations can affect the prepayment speed of principal and the yield on the security.
Premiums and discounts are amortized using the level yield or "interest method" over the terms of the securities. Declines in the fair value of held-to-maturity and available-for sale-securities below their cost that are deemed to be other than temporary are reflected in earnings as realized losses. In determining whether other-than-temporary impairment exists, management considers many factors, including (1) the length of time and the extent to which the fair value has been less than cost, (2) the financial condition and near-term prospects of the issuer, and (3) the intent of the Company to hold and the determination of whether the Company will more likely than not be required to sell the investment prior to a recovery in fair value. Gains and losses on the sale of securities are recorded on the trade date and are determined using the specific identification method.
Provision and Allowance for Probable Loan Losses
The allowance for probable loan losses is maintained at a level considered adequate by management to provide for probable loan losses. The allowance is increased by provisions charged to operating expense and reduced by net charge-offs. The provision for probable loan losses is the amount, which, in the judgment of management, is necessary to establish the allowance for probable loan losses at a level that is adequate to absorb known and inherent risks in the loan portfolio.
Management believes that the allowance for probable loan losses is adequate. While management uses available information to recognize losses on loans, future additions to the allowance may be necessary based on changes in economic conditions. In addition, various regulatory agencies, as an integral part of their examination process, periodically review the Company's bank subsidiaries' allowances for probable loan losses. Such agencies may require the Company's bank subsidiaries to make additions or reductions to their GAAP allowances based on their judgments of information available to them at the time of their examination.
Loans
Loans are reported at the principal balance outstanding, net of unearned discounts. Interest income on loans is reported on an accrual basis. Loan fees and costs associated with originating the loans are amortized over the life of the loan using the interest method. The Company originates mortgage loans that may subsequently be sold to an unaffiliated third party. The loans are not securitized and if sold, are sold without recourse. Loans held for sale are carried at cost and the principal amount outstanding is not significant to the consolidated financial statements.
Impaired Loans
Impaired loans are those loans where it is probable that all amounts due according to contractual terms of the loan agreement will not be collected. Impaired loans are measured based on (1) the present value of expected future cash flows discounted at the loan's effective interest rate; (2) the loan's observable market price; or (3) the fair value of the collateral if the loan is collateral dependent. Substantially all of the Company's impaired loans are measured at the fair value of the collateral. In limited cases the
41
INTERNATIONAL BANCSHARES CORPORATION AND SUBSIDIARIES
Notes to Consolidated Financial Statements (Continued)
(1) Summary of Significant Accounting Policies (Continued)
Company may use other methods to determine the level of impairment of a loan if such loan is not collateral dependent.
Non-Accrual Loans
The non-accrual loan policy of the Company's bank subsidiaries is to discontinue the accrual of interest on loans when management determines that it is probable that future interest accruals will be un-collectible. As it relates to consumer loans, management charges off those loans when the loan is contractually 90 days past due. Under special circumstances, a consumer or non-consumer loan may be more than 90 days delinquent as to interest or principal and not be placed on non-accrual status. This situation generally results when a bank subsidiary has a borrower who is experiencing financial difficulties, but not to the extent that requires a restructuring of indebtedness. The majority of this category is composed of loans that are considered to be adequately secured and/or for which there has been a recent history of payments. When a loan is placed on non-accrual status, any interest accrued, not paid is reversed and charged to operations against interest income. As it relates to non-consumer loans that are not 90 days past due, management will evaluate each of these loans to determine if placing the loan on non-accrual status is warranted. Interest income on non-accrual loans is recognized only to the extent payments are received or when, in management's opinion, the debtor's financial condition warrants reestablishment of interest accruals.
Other Real Estate Owned
Other real estate owned is comprised of real estate acquired by foreclosure and deeds in lieu of foreclosure. Other real estate is carried at the lower of the recorded investment in the property or its fair value less estimated costs to sell such property (as determined by independent appraisal). Prior to foreclosure, the value of the underlying loan is written down to the fair value of the real estate to be acquired by a charge to the allowance for loan probable losses, if necessary. Any subsequent write-downs are charged against other non-interest expense. Operating expenses of such properties and gains and losses on their disposition are included in other non-interest expense. Other real estate owned totaled $35,326,000 and $27,733,000 at December 31, 2009 and 2008, respectively. Other real estate owned is included in other assets.
Bank Premises and Equipment
Bank premises and equipment are stated at cost less accumulated depreciation. Depreciation is computed on straight-line and accelerated methods over the estimated useful lives of the assets. Repairs and maintenance are charged to operations as incurred and expenditures for renewals and betterments are capitalized.
Other Investments
Other investments include equity investments in non-financial companies, bank owned life insurance, as well as equity securities with no readily determinable fair market value. Equity investments are accounted for using the equity method of accounting. Equity securities with no readily determinable fair value are accounted for using the cost method.
42
INTERNATIONAL BANCSHARES CORPORATION AND SUBSIDIARIES
Notes to Consolidated Financial Statements (Continued)
(1) Summary of Significant Accounting Policies (Continued)
Income Taxes
Deferred income tax assets and liabilities are determined using the asset and liability method. Under this method, the net deferred tax asset or liability is determined based on the tax effects of the differences between the book and tax basis of the various balance sheet assets and liabilities and gives current recognition to changes in tax rates and laws. The Company files a consolidated federal income tax return with its subsidiaries.
Recognition of deferred tax assets is based on management's belief that the benefit related to certain temporary differences, tax operating loss carry forwards, and tax credits are more likely than not to be realized. A valuation allowance is recorded for the amount of the deferred tax items for which it is more likely than not that the tax benefits will not be realized.
The Company evaluates uncertain tax positions at the end of each reporting period. The Company may recognize the tax benefit from an uncertain tax position only if it is more likely than not that the tax position will be sustained on examination by the taxing authorities, based on the technical merits of the position. The tax benefit recognized in the financial statements from any such a position is measured based on the largest benefit that has a greater than fifty percent likelihood of being realized upon ultimate settlement. As of December 31, 2009 and 2008, respectively, after evaluating all uncertain tax positions, the Company has recorded no liability for unrecognized tax benefits at the end of the reporting period. The Company would recognize any interest accrued on unrecognized tax benefits as other interest expense and penalties as other non-interest expense. During the years ended December 31, 2009, 2008 and 2007, the Company recognized no interest expense or penalties related to uncertain tax positions.
The Company files consolidated tax returns in the U.S. Federal jurisdiction and various state jurisdictions. The Company is no longer subject to U.S. federal or state income tax examinations by tax authorities for years before 2006.
Stock Options
Compensation expense for stock awards is based on the market price of the stock on the measurement date, which is generally the date of grant, and is recognized ratably over the service period of the award.
The fair value of stock options granted was estimated as the measurement date, which is generally the date of grant, using the Black-Sholes-Merton option-pricing model. This model was developed for use in estimating the fair value of publicly traded options that have no vesting restrictions and are fully transferable. Additionally, the model requires the input of highly subjective assumptions. Because the Company's employee stock options have characteristics significantly different from those of publicly traded options, and because changes in the subjective input assumptions can materially affect the fair value estimate, in management's opinion, the Black-Scholes-Merton option-pricing model does not necessarily provide a reliable single measure of the fair value of the Company's stock options.
43
INTERNATIONAL BANCSHARES CORPORATION AND SUBSIDIARIES
Notes to Consolidated Financial Statements (Continued)
(1) Summary of Significant Accounting Policies (Continued)
Net Income Per Share
Basic Earnings Per Share ("EPS") is calculated by dividing net income by the weighted average number of common shares outstanding. The computation of diluted EPS assumes the issuance of common shares for all dilutive potential common shares outstanding during the reporting period. The dilutive effect of stock options is considered in earnings per share calculations, if dilutive, using the treasury stock method.
Goodwill and Identified Intangible Assets
Goodwill represents the excess of costs over fair value of assets of businesses acquired. Goodwill is tested for impairment at least annually or on an interim basis if an event triggering impairment may have occurred. As of September 30, 2009, after completing goodwill testing, the Company has determined that no goodwill impairment exists.
Identified intangible assets are acquired assets that lack physical substance but can be distinguished from goodwill because of contractual or other legal rights or because the asset is capable of being sold or exchanged either on its own or in combination with a related contract, asset, or liability. The Company's identified intangible assets relate to core deposits and contract rights. As of December 31, 2009, the Company has determined that no impairment of identified intangibles exists. Identified intangible assets with definite useful lives are amortized on an accelerated basis over their estimated life. See Note 7—Goodwill and Other Intangible Assets.
Impairment of Long-Lived Assets
Long-lived assets, such as property, plant and equipment, and purchased intangibles subject to amortization, are reviewed for impairment whenever events or changes in circumstances indicate that the carrying value of an asset may not be recoverable. Recoverability of assets to be held and used is measured by a comparison of the carrying value of the asset to the estimated undiscounted future cash flows expected to be generated by the asset. If the carrying value of an asset exceeds its estimated future cash flows, an impairment charge is recognized by the amount by which the carrying value of the asset exceeds the fair value of the asset. Assets to be disposed of would be separately presented in the statement of condition and reported at the lower of the carrying value or fair value less costs to sell, and are no longer depreciated. The assets and liabilities of a disposed group classified as held for sale would be presented separately in the appropriate asset and liability sections of the statement of condition.
Consolidated Statements of Cash Flows
For purposes of the consolidated statements of cash flows, the Company considers all short-term investments with a maturity at date of purchase of three months or less to be cash equivalents. Also, the Company reports transactions related to deposits and loans to customers on a net basis.
Accounting for Transfers and Servicing of Financial Assets
The Company accounts for transfers and servicing of financial assets and extinguishments of liabilities based on the application of a financial-components approach that focuses on control. After a transfer of financial assets, the Company recognizes the financial and servicing assets it controls and liabilities it has incurred, derecognizes financial assets when control has been surrendered and derecognizes liabilities
44
INTERNATIONAL BANCSHARES CORPORATION AND SUBSIDIARIES
Notes to Consolidated Financial Statements (Continued)
(1) Summary of Significant Accounting Policies (Continued)
when extinguished. The Company has retained mortgage servicing rights in connection with the sale of mortgage loans. Because the Company may not initially identify loans as originated for resale, all loans are initially treated as held for investment. The value of the mortgage servicing rights are reviewed periodically for impairment and are amortized in proportion to, and over the period of estimated net servicing income or net servicing losses. The value of the mortgage servicing rights is not significant to the consolidated statements of condition.
Segments of an Enterprise and Related Information
The Company operates as one segment. The operating information used by the Company's chief executive officer for purposes of assessing performance and making operating decisions about the Company is the consolidated financial statements presented in this report. The Company has four active operating subsidiaries, namely, the bank subsidiaries, otherwise known as International Bank of Commerce, Laredo, Commerce Bank, International Bank of Commerce, Zapata and International Bank of Commerce, Brownsville.
Comprehensive Income
Comprehensive income consists of net income and other comprehensive income. Other comprehensive income includes unrealized gains and losses on securities available for sale.
Advertising
Advertising costs are expensed as incurred.
Reclassifications
Certain amounts in the prior year's presentations have been reclassified to conform to the current presentation. These reclassifications had no effect on previously reported net income or total assets.
New Accounting Standards
In September 2006, the Financial Accounting Standards Board issued Statement of Financial Accounting Standards No. 157 ("SFAS No. 157"), "Fair Value Measurements," now included in ASC 820-10. ASC 820-10 defines fair value, establishes a framework for measuring fair value in generally accepted accounting principles, and expands disclosures about fair value measurements. The Company adopted ASC 820-10 on January 1, 2008. The impact of the adoption of the new accounting standard was not significant.
In February 2007, the Financial Accounting Standards Board issued Statement of Financial Accounting Standards No. 159 ("SFAS No. 159"), "The Fair Value Option for Financial Assets and Financial Liabilities—Including an amendment of FASB Statement No. 115," now included in ASC 825-10. ASC 825-10 permits entities to choose to measure eligible items at fair value at certain specified review dates. Changes in unrealized gains/losses for items elected to be measured using the fair value option are reported in earnings at each subsequent reporting date. The fair value option (i) may be applied instrument by instrument, with certain exceptions, (ii) is irrevocable (unless a new election date occurs) and (iii) is applied only to entire instruments and not to portions of instruments. The Company adopted
45
INTERNATIONAL BANCSHARES CORPORATION AND SUBSIDIARIES
Notes to Consolidated Financial Statements (Continued)
(1) Summary of Significant Accounting Policies (Continued)
ASC 825-10 on January 1, 2008. The adoption of the new accounting standard did not have an impact on the Company's financial statements.
In December 2007, the Financial Accounting Standards Board issued Statement of Financial Accounting Standards No. 141R ("SFAS No. 141R"), "Business Combinations (Revised 2007)," now included in ASC 805-10 through ASC 805-50. The accounting standard, replaces SFAS No. 141, "Business Combinations," and applies to all transactions and other events in which one entity obtains control over one or more other entities. The accounting standard requires an acquirer, upon initially obtaining control of another entity, to recognize the assets, liabilities, and any non-controlling interest in the acquiree at fair value as of the acquisition date. Contingent consideration is required to be recognized and measured at fair value on the date of acquisition rather than at a later date when the amount of that consideration may be determinable beyond a reasonable doubt. This fair value approach replaces the cost-allocation process required under SFAS No. 141, whereby the cost of an acquisition was allocated to the individual assets acquired and liabilities assumed based on their estimated fair value. It requires the acquiring entity to expense acquisition-related costs as incurred rather than allocating such costs to the assets acquired and liabilities assumed, as was previously the case under SFAS No. 141. Under ASC 805-10 through ASC 805-50, the requirements of SFAS No. 146, "Accounting for Costs Associated with Exit or Disposal Activities," or ASC420-10, would have to be met in order to accrue for a restructuring plan in purchase accounting. Pre-acquisition contingencies are to be recognized at fair value, unless it is a non-contractual contingency that is not likely to materialize, in which case, nothing should be recognized in purchase accounting and, instead, that contingency would be subject to the probable and estimateable criteria of SFAS No. 5, "Accounting for Contingencies," or ASC 450. The new accounting standard applies prospectively to business combinations for which the acquisition date is on or after the beginning of the first annual reporting period beginning on or after December 15, 2008. An entity may not adopt this standard early. The new accounting standard will affect the accounting for any future business combinations the Company enters into.
In December 2007, the Financial Accounting Standards Board issued Statement of Financial Accounting Standards No. 160 ("SFAS No. 160"), "Noncontrolling Interests in Consolidated Financial Statements, an amendment of ARB Statement No. 51," now included in ASC 810-10. ASC 810-10 amends Accounting Research Bulleting (ARB) No. 51. "Consolidated Financial Statements," to establish accounting and reporting standards for the non-controlling interest in a subsidiary and for the deconsolidation of a subsidiary. SFAS ASC 810-10 clarifies that a non-controlling interest in a subsidiary, which is sometimes referred to as minority interest, is an ownership interest in the consolidated entity that should be reported as a component of equity in the consolidated financial statements. Among other requirements, ASC 810-10 requires consolidated net income to be reported at amounts that include the amounts attributable to both the parent and the non-controlling interest. It also requires disclosure, on the face of the consolidated financial statements, of the amounts of consolidated net income attributable to the parent and to the non-controlling interest. ASC 810-10 is effective for fiscal year, and interim periods within those fiscal years, beginning on or after December 15, 2008, or January 1, 2009 for entities with a calendar year end. The Company adopted ASC 810-10 on January 1, 2009. The adoption of the new accounting standard did not have an impact on the Company's financial statements.
In March 2008, the Financial Accounting Standards Board issued Statement of Financial Accounting Standards No. 161 ("SFAS No. 161"), "Disclosures about Derivative Instruments and Hedging Activities, an amendment of FASB Statement No. 133," now included in ASC 815-10. ASC 815-10 amends and expands the disclosure requirements of SFAS No. 133 to provide greater transparency about how and why
46
INTERNATIONAL BANCSHARES CORPORATION AND SUBSIDIARIES
Notes to Consolidated Financial Statements (Continued)
(1) Summary of Significant Accounting Policies (Continued)
and entity uses derivative instruments, how derivative instruments and related hedge items are accounted for under SFAS No. 133 and its related interpretations and how derivative instruments and related hedged items affect an entity's financial position, results of operations and cash flows. ASC 815-10 requires qualitative disclosures about objectives and strategies for using derivatives, quantitative disclosures about fair value amounts of gains and losses on derivative instruments and disclosures about credit-risk-related contingent features in derivative agreements. ASC 815-10 is effective for fiscal years and interim periods beginning after November 15, 2008. The adoption of the new standard did not have a significant impact on the Company's consolidated financial statements.
On April 9, 2009, the Financial Accounting Standards Board issued FASB Staff Position No. 157-4, "Determining Fair Value When the Volume and Level of Activity for the Asset or Liability Have Significantly Decreased and Identifying Transactions That Are Not Orderly" ("FSP No. 157-4"), included in ASC 820-10. ASC 820-10 provides additional guidance for estimating fair value in accordance with FASB ASC 820-10, "Fair Value Measurements," when the volume and level of activity for the asset or liability have significantly decreased. Additionally, the staff position also provides guidance on identifying circumstances that indicate a transaction is not orderly. The staff position stresses that even though there has been a significant decrease in the volume and level of activity for the asset or liability and regardless of the valuation techniques used to measure the fair value of the asset or liability, the main objective of fair value accounting measurements remains the same. As defined by the FSP, fair value is the price that would be received to sell an asset or paid to transfer a liability in an orderly transaction between market participants as of the measurement date under current market conditions. Additionally, the staff position amends the fair value disclosures as originally required by ASC 820-10. The staff position is effective for interim and annual reporting periods ending after June 15, 2009, although early adoption is permitted for periods ending after March 15, 2009. The adoption of the staff position did not have a significant impact on the Company's consolidated financial statements.
On April 9, 2009, the Financial Accounting Standards Board issued FASB Staff Position No. 107-1 and APB 28-1, "Interim Disclosures about Fair Value of Financial Instruments" ("FSP No. 107-1 and APB 28-1"), included in ASC 825-10. The staff position amends FASB Statement No. 107, "Disclosures about Fair Value of Financial Instruments," also in ASC 825-10, to require disclosures about fair value of financial instruments for interim reporting periods of publicly traded companies as well as in annual financial statements. The FSP also amends Accounting Principles Board Opinion No. 28, "Interim Financial Reporting" to require those disclosures in summarized financial information at interim reporting periods. The new standard is effective for interim reporting periods ending after June 15, 2009, with early adoption permitted for periods ending after March 15, 2009. The adoption of the staff accounting position did not have a significant impact on the Company's consolidated financial statements.
On April 9, 2009, the Financial Accounting Standards Board issued FASB Staff Position No. 115-2 and 124-2, "Recognition and Presentation of Other-Than-Temporary Impairments" (FSP No. 115-2 and 124-2"), included in ASC 320-10 and amends the other-than-temporary guidance in U.S. GAAP for debt securities to make the guidance more operational and to improve the presentation and disclosure of other-than-temporary impairments in debt and equity securities in the financial statements. The staff position does not amend existing recognition and measurement guidance related to other-than-temporary impairment. The staff position requires that unless there is an intent or requirement to sell a debt security, only the amount of the estimated credit loss is recorded through earnings, while the remaining mark-to-market loss is recognized as a component of equity through other comprehensive income. Additionally, it enhances required disclosures of existing guidelines. The staff position is effective for interim and annual
47
INTERNATIONAL BANCSHARES CORPORATION AND SUBSIDIARIES
Notes to Consolidated Financial Statements (Continued)
(1) Summary of Significant Accounting Policies (Continued)
reporting periods ending after June 15, 2009, with early adoption permitted for periods ending after March 15, 2009, and will be applied to all existing and new investments in debt securities. The adoption of the accounting standard did not have a significant impact on the Company's consolidated financial statements.
In August 2009, the Financial Accounting Standards Board issued Accounting Standards Update No. 2009-05, to ASC 820, "Fair Value Measurements and Disclosures." The Update provides amendments for the fair value measurement of liabilities. The Update clarifies which techniques should be used to measure fair value in the event that there are no quoted prices in active markets for an identical liability. The amendment also clarifies that when estimating the fair value of a liability, entities are not required to factor in any existing requirements that would affect the transferability of the asset. The Update is effective for the first interim and annual reporting period ending after issuance. The adoption of the update to existing accounting standards did not have a significant impact on the Company's consolidated financial statements.
In September 2009, the Financial Accounting Standards Board issued Accounting Standards Update No. 2009-06, to update ASC 740, "Income Taxes." The Update addresses the need for additional implementation guidance in accounting for uncertainty in income taxes. The key provisions of the Update illustrate by example what should be done in the case where a decision needs to be made regarding whether the income tax is paid by the entity is attributable to the entity or its owners, what constitutes a tax position for a pass-through or tax exempt not-for-profit entity, and how the accounting for uncertainty in income taxes is impacted when a combined group include both taxable and non-taxable entities. The Update is effective for interim and annual reporting periods ending after September 15, 2009 for entities that are currently applying the standards for accounting for uncertainty in income taxes. The adoption of the update to existing accounting standards did not have a significant impact on the Company's consolidated financial statements.
In December 2009, the Financial Accounting Standards Board issued Accounting Standards Update No. 2009-16, to ASC 860, "Transfers and Servicing." The Update amends prior accounting guidance to enhance reporting about transfers of financial assets, including securitizations, and where companies have continued exposure to the risks related to the transferred financial assets. The Update eliminates the concept of a "qualifying special-purpose entity" and changes the requirements for derecognizing financial assets. The Update also requires additional disclosures about all continuing involvement by the entity in transferred financial assets including information about gains and losses resulting from transfers during the reporting period. The Update is effective for fiscal periods ending after January 1, 2010. The adoption of the update to existing accounting standards is not expected to have a significant impact on the Company's consolidated financial statements.
(2) Acquisitions
On December 4, 2008, the Company completed its acquisition of certain rights to InsCorp, Inc. insurance contracts for $1,074,000. InsCorp, Inc. is a multiline independently owned insurance agency, which insures oil operators, merchants and industrial businesses.
48
INTERNATIONAL BANCSHARES CORPORATION AND SUBSIDIARIES
Notes to Consolidated Financial Statements (Continued)
(3) Investment Securities
The amortized cost and estimated fair value by type of investment security at December 31, 2009 are as follows:
| |
Held to Maturity | |||||||||||||||
|---|---|---|---|---|---|---|---|---|---|---|---|---|---|---|---|---|
| |
Amortized cost |
Gross unrealized gains |
Gross unrealized losses |
Estimated fair value |
Carrying value |
|||||||||||
| |
(Dollars in Thousands) |
|||||||||||||||
Other securities |
$ | 2,450 | $ | — | $ | — | $ | 2,450 | $ | 2,450 | ||||||
Total investment securities |
$ | 2,450 | $ | — | $ | — | $ | 2,450 | $ | 2,450 | ||||||
| |
Available for Sale | |||||||||||||||
|---|---|---|---|---|---|---|---|---|---|---|---|---|---|---|---|---|
| |
Amortized cost |
Gross unrealized gains |
Gross unrealized losses |
Estimated fair value |
Carrying value(1) |
|||||||||||
| |
(Dollars in Thousands) |
|||||||||||||||
U.S. Treasury securities |
$ | 1,327 | $ | — | $ | — | $ | 1,327 | $ | 1,327 | ||||||
Residential mortgage-backed securities |
4,393,731 | 113,138 | (15,105 | ) | 4,491,764 | 4,491,764 | ||||||||||
Obligations of states and political subdivisions |
132,968 | 4,102 | (204 | ) | 136,866 | 136,866 | ||||||||||
Equity securities |
13,825 | 343 | (42 | ) | 14,126 | 14,126 | ||||||||||
Total investment securities |
$ | 4,541,851 | $ | 117,583 | $ | (15,351 | ) | $ | 4,644,083 | $ | 4,644,083 | |||||
- (1)
- Included in the carrying value of residential mortgage-backed securities are $1,898,905 of mortgage-backed securities issued by Ginnie Mae, $2,533,290 of mortgage-backed securities issued by Fannie Mae and Freddie Mac and $59,569 issued by non-government entities.
The amortized cost and estimated fair value of investment securities at December 31, 2009, by contractual maturity, are shown below. Expected maturities will differ from contractual maturities because borrowers may have the right to prepay obligations with or without prepayment penalties.
| |
Held to Maturity | Available for Sale | |||||||||||
|---|---|---|---|---|---|---|---|---|---|---|---|---|---|
| |
Amortized Cost |
Estimated fair value |
Amortized Cost |
Estimated fair value |
|||||||||
| |
(Dollars in Thousands) |
||||||||||||
Due in one year or less |
$ | 1,825 | $ | 1,825 | $ | 1,327 | $ | 1,327 | |||||
Due after one year through five years |
625 | 625 | — | — | |||||||||
Due after five years through ten years |
— | — | 10,224 | 10,326 | |||||||||
Due after ten years |
— | — | 122,744 | 126,540 | |||||||||
Residential mortgage-backed securities |
— | — | 4,393,731 | 4,491,764 | |||||||||
Equity securities |
— | — | 13,825 | 14,126 | |||||||||
Total investment securities |
$ | 2,450 | $ | 2,450 | $ | 4,541,851 | $ | 4,644,083 | |||||
49
INTERNATIONAL BANCSHARES CORPORATION AND SUBSIDIARIES
Notes to Consolidated Financial Statements (Continued)
(3) Investment Securities (Continued)
The amortized cost and estimated fair value by type of investment security at December 31, 2008 are as follows:
| |
Held to Maturity | |||||||||||||||
|---|---|---|---|---|---|---|---|---|---|---|---|---|---|---|---|---|
| |
Amortized cost |
Gross unrealized gains |
Gross unrealized losses |
Estimated fair value |
Carrying value |
|||||||||||
| |
(Dollars in Thousands) |
|||||||||||||||
Other securities |
$ | 2,300 | $ | — | $ | — | $ | 2,300 | $ | 2,300 | ||||||
Total investment securities |
$ | 2,300 | $ | — | $ | — | $ | 2,300 | $ | 2,300 | ||||||
| |
Available for Sale | |||||||||||||||
|---|---|---|---|---|---|---|---|---|---|---|---|---|---|---|---|---|
| |
Amortized cost |
Gross unrealized gains |
Gross unrealized losses |
Estimated fair value |
Carrying value(1) |
|||||||||||
| |
(Dollars in Thousands) |
|||||||||||||||
U.S. Treasury securities |
$ | 1,319 | $ | — | $ | — | $ | 1,319 | $ | 1,319 | ||||||
Residential mortgage-backed securities |
4,947,351 | 59,915 | (32,949 | ) | 4,974,317 | 4,974,317 | ||||||||||
Obligations of states and political subdivisions |
81,208 | 1,346 | (340 | ) | 82,214 | 82,214 | ||||||||||
Equity securities |
13,825 | 205 | — | 14,030 | 14,030 | |||||||||||
Total investment securities |
$ | 5,043,703 | $ | 61,466 | $ | (33,289 | ) | $ | 5,071,880 | $ | 5,071,880 | |||||
- (1)
- Included in the carrying value of residential mortgage-backed securities are $1,820,988 of mortgage-backed securities issued by Ginnie Mae, $3,087,038 of mortgage-backed securities issued by Fannie Mae and Freddie Mac and $66,291 issued by non-government entities.
Mortgage-backed securities are securities issued by the Freddie Mac, Fannie Mae, Ginnie Mae or non-government entities. Investments in mortgage-backed securities issued by Ginnie Mae are fully guaranteed by the U.S. Government. Investments in mortgage-backed securities issued by Freddie Mac and Fannie Mae are not fully guaranteed by the U.S. Government, but carry an implied AAA rating with limited credit risk, particularly given the placement of Fannie Mae and Freddie Mac into conservatorship by the federal government in early September 2008.
The amortized cost and fair value of available for sale investment securities pledged to qualify for fiduciary powers, to secure public monies as required by law, repurchase agreements and short-term fixed borrowings was $2,747,873,000 and $2,829,519,000, respectively, at December 31, 2009.
Proceeds from the sale and call of securities available-for-sale were $579,099,000, $8,376,000 and $841,084,000 during 2009, 2008 and 2007, respectively, which amounts included $544,305,000, $0 and $838,561,000 of mortgage-backed securities. In 2007, the Company sold approximately $833,160,000 of mortgage-backed securities that were in a loss position. The securities identified for sale had unique attributes that distinguished them from the rest of the portfolio and caused them to not meet the interest rate risk profile of the Company at the time. The first sale occurred in the first quarter. The securities sold were certain hybrid mortgage-backed securities with a coupon re-set date that exceeded 30 months and a weighted average yield to coupon re-set that was approximately 100 basis points less than the FHLB certificate of indebtedness short-term rate. The second sale occurred in the third quarter. The securities
50
INTERNATIONAL BANCSHARES CORPORATION AND SUBSIDIARIES
Notes to Consolidated Financial Statements (Continued)
(3) Investment Securities (Continued)
sold were certain hybrid mortgage-backed securities with a coupon re-set date that was 15 - 30 months and a weighted average yield coupon re-set that was approximately 60 basis points below the FHLB short-term advance rate. In both quarters, the proceeds from the sales of the securities were used to pay down FHLB borrowings. The sales of the securities facilitated a re-positioning of the balance sheet to a more neutral position in terms of interest rate risk and are expected to improve operating ratios in the short term. Gross gains of $11,980,000, $6,427,000 and $2,431,000 and gross losses of $24,000, $0 and $18,369,000 were realized on the sales in 2009, 2008 and 2007, respectively.
Gross unrealized losses on investment securities and the fair value of the related securities, aggregated by investment category and length of time that individual securities have been in a continuous unrealized loss position, at December 31, 2009 were as follows:
| |
Less than 12 months | 12 months or more | Total | |||||||||||||||||
|---|---|---|---|---|---|---|---|---|---|---|---|---|---|---|---|---|---|---|---|---|
| |
Fair Value | Unrealized Losses |
Fair Value | Unrealized Losses |
Fair Value | Unrealized Losses |
||||||||||||||
| |
(Dollars in Thousands) |
|||||||||||||||||||
Available for sale: |
||||||||||||||||||||
Residential mortgage-backed securities |
$ |
16,581 |
$ |
(37 |
) |
$ |
59,879 |
$ |
(15,068 |
) |
$ |
76,460 |
$ |
(15,105 |
) |
|||||
Obligations of states and political subdivisions |
14,910 | (201 | ) | 275 | (3 | ) | 15,185 | (204 | ) | |||||||||||
Equity securities |
— | — | 33 | (42 | ) | 33 | (42 | ) | ||||||||||||
|
$ | 31,491 | $ | (238 | ) | $ | 60,187 | $ | (15,113 | ) | $ | 91,678 | $ | (15,351 | ) | |||||
Gross unrealized losses on investment securities and the fair value of the related securities, aggregated by investment category and length of time that individual securities have been in a continuous loss position, at December 31, 2008 were as follows:
| |
Less than 12 months | 12 months or more | Total | |||||||||||||||||
|---|---|---|---|---|---|---|---|---|---|---|---|---|---|---|---|---|---|---|---|---|
| |
Fair Value | Unrealized Losses |
Fair Value | Unrealized Losses |
Fair Value | Unrealized Losses |
||||||||||||||
| |
(Dollars in Thousands) |
|||||||||||||||||||
Available for sale: |
||||||||||||||||||||
Residential mortgage-backed securities |
$ |
893,067 |
$ |
(32,335 |
) |
$ |
96,734 |
$ |
(614 |
) |
$ |
989,801 |
$ |
(32,949 |
) |
|||||
Obligations of states and political subdivisions |
8,262 | (274 | ) | 1,299 | (66 | ) | 9,561 | (340 | ) | |||||||||||
|
$ | 901,329 | $ | (32,609 | ) | $ | 98,033 | $ | (680 | ) | $ | 999,362 | $ | (33,289 | ) | |||||
The unrealized losses on investments in mortgage-backed securities are primarily caused by changes in market interest rates. Mortgage-backed securities are primarily securities issued by the Freddie Mac, Fannie Mae and Ginnie Mae. The contractual cash obligations of the securities issued by Ginnie Mae are fully guaranteed by the U.S. Government. The contractual cash obligations of the securities issued by Freddie Mac and Fannie Mae are not fully guaranteed by the U.S. Government; however, the securities carry an implied AAA rating with limited credit risk, particularly given the placement of Fannie Mae and
51
INTERNATIONAL BANCSHARES CORPORATION AND SUBSIDIARIES
Notes to Consolidated Financial Statements (Continued)
(3) Investment Securities (Continued)
Freddie Mac into conservatorship by the federal government in early September 2008. The decrease in fair value on mortgage-backed securities issued by Freddie Mac, Fannie Mae and Ginnie Mae is due to market interest rates. The Company has no intent to sell and will not more than likely than not be required to sell before a market price recovery or maturity of the securities; therefore, it is the conclusion of the Company that the investments in mortgage-backed securities issued by Freddie Mac, Fannie Mae and Ginnie Mae are not considered other-than-temporarily impaired. In addition, the Company has a small investment in non-agency mortgage-backed securities that have strong credit backgrounds and include additional credit enhancements to protect the Company from losses arising from high foreclosure rates. These securities have additional market volatility beyond economically induced interest rate events. The Company has received principal and interest payments in line with expected cash flows at the time of purchase. The Company has no intent to sell and will not more likely than not be required to sell before recovery of amortized cost, the non-agency mortgage-backed securities until a market price recovery or maturity and has continued to receive cash as expected. It is the conclusion of the Company that the investments in non-agency mortgage-backed securities are other-than-temporarily impaired, but primarily due to other than credit issues.
The unrealized losses on investments in other securities are caused by fluctuations in market interest rates. The underlying cash obligations of the securities are guaranteed by the entity underwriting the debt instrument. It is the belief of the Company that the entity issuing the debt will honor its interest payment schedule, as well as the full debt at maturity. The securities are purchased by the Company for their economic value. The decrease in fair value is primarily due to market interest rates and not other factors, and because the Company has no intent to sell and will not more likely than not be required to sell before a market price recovery or maturity of the securities, it is the conclusion of the Company that the investments are not considered other-than-temporarily impaired.
(4) Loans
A summary of net loans, by loan type at December 31, 2009 and 2008 is as follows:
| |
December 31, | |||||||
|---|---|---|---|---|---|---|---|---|
| |
2009 | 2008 | ||||||
| |
(Dollars in thousands) |
|||||||
Commercial, financial and agricultural |
$ | 2,703,379 | $ | 2,574,247 | ||||
Real estate—mortgage |
954,010 | 888,095 | ||||||
Real estate—construction |
1,583,057 | 1,911,954 | ||||||
Consumer |
146,331 | 169,589 | ||||||
Foreign |
280,485 | 328,948 | ||||||
Total loans |
$ | 5,667,262 | $ | 5,872,833 | ||||
52
INTERNATIONAL BANCSHARES CORPORATION AND SUBSIDIARIES
Notes to Consolidated Financial Statements (Continued)
(5) Allowance for Probable Loan Losses
A summary of the transactions in the allowance for probable loan losses for the years ended December 31, 2009, 2008 and 2007 is as follows:
| |
2009 | 2008 | 2007 | ||||||||
|---|---|---|---|---|---|---|---|---|---|---|---|
| |
(Dollars in Thousands) |
||||||||||
Balance at January 1, |
$ | 73,461 | $ | 61,726 | $ | 64,537 | |||||
Losses charged to allowance |
(38,539 | ) | (9,134 | ) | (6,451 | ) | |||||
Recoveries credited to allowance |
1,638 | 1,056 | 4,348 | ||||||||
Net losses charged to allowance |
(36,901 | ) | (8,078 | ) | (2,103 | ) | |||||
Provision (credit) charged to operations |
58,833 | 19,813 | (1,762 | ) | |||||||
Acquired in purchase transactions |
— | — | 1,054 | ||||||||
Balance at December 31, |
$ | 95,393 | $ | 73,461 | $ | 61,726 | |||||
Loans accounted for on a non-accrual basis at December 31, 2009, 2008 and 2007 amounted to $68,338,000, $164,230,000 and $33,622,000, respectively. The effect of such non-accrual loans reduced interest income by $4,011,000, $6,242,000 and $1,378,000 for the years ended December 31, 2009, 2008 and 2007, respectively. Amounts received on non-accruals are applied, for financial accounting purposes, first to principal and then to interest after all principal has been collected. Accruing loans contractually past due 90 days or more as to principal or interest payments at December 31, 2009, 2008 and 2007 amounted to $12,089,000, $6,274,000 and $21,840,000, respectively.
Impaired loans are those loans where it is probable that all amounts due according to contractual terms of the loan agreement will not be collected. The Company has identified these loans through its normal loan review procedures. Impaired loans are measured based on (1) the present value of expected future cash flows discounted at the loan's effective interest rate; (2) the loan's observable market price; or (3) the fair value of the collateral if the loan is collateral dependent. Substantially all of the Company's impaired loans are measured at the fair value of the collateral. In limited cases the Company may use other methods to determine the level of impairment of a loan if such loan is not collateral dependent.
The following table details key information regarding the Company's impaired loans:
| |
2009 | 2008 | 2007 | ||||||||
|---|---|---|---|---|---|---|---|---|---|---|---|
| |
(Dollars in Thousands) |
||||||||||
Balance of impaired loans where there is a related allowance for loan loss |
$ | 106,780 | $ | 137,153 | $ | 39,618 | |||||
Balance of impaired loans where there is no related allowance for loan loss |
11,494 | 27,786 | — | ||||||||
Total impaired loans |
$ | 118,274 | $ | 164,939 | $ | 39,618 | |||||
Allowance allocated to impaired loans |
$ | 30,555 | $ | 20,671 | $ | 4,903 | |||||
The impaired loans included in the table above were primarily comprised of collateral dependent commercial loans, which have not been fully charged off. The average recorded investment in impaired loans was $149,528,000, $93,654,000, and $22,590,000 for the years ended December 31, 2009, 2008 and 2007, respectively. Interest income recorded on impaired loans was $547,000, $236,000 and $1,989,000 for the years ended December 31, 2009, 2008 and 2007. The increase in the balance of impaired loans over
53
INTERNATIONAL BANCSHARES CORPORATION AND SUBSIDIARIES
Notes to Consolidated Financial Statements (Continued)
(5) Allowance for Probable Loan Losses (Continued)
historical levels can be partially attributed to certain loans that filed for bankruptcy protection and a few loan relationships that deteriorated during 2009 and 2008. A portion of the impaired loans have adequate collateral and credit enhancements not requiring a related allowance for loan loss. The level of impaired loans is reflective of the economic weakness that has been created by the financial crisis and the subsequent economic downturn. While impaired loans have increased compared to historical levels, they have decreased for the period ended December 31, 2009, compared to the period ending December 31, 2008. The decrease in impaired loans from 2008 to 2009 can be attributed to improving economic conditions in certain industry sectors and market areas and collateral enhancements or other factors that improve the quality of the credits. Management is confident the Company's loss exposure regarding these credits will be significantly reduced due to the Company's long-standing practices that emphasize secured lending with strong collateral positions and guarantor support. Management is likewise confident the reserve for probable loan losses is adequate. The Company has no direct exposure to sub-prime loans in its loan portfolio, but the sub-prime crisis has affected the credit markets on a national level, and as a result, the Company has experienced an increasing amount of impaired loans; however, management's decision to place loans in this category does not necessarily mean that the Company will experience significant losses from these loans or significant increases in impaired loans from these levels.
Management of the Company recognizes the risks associated with these impaired loans. However, management's decision to place loans in this category does not necessarily mean that losses will occur. In the current environment, troubled loan management can be protracted because of the legal and process problems that delay the collection of an otherwise collectable loan. Additionally, management believes that the collateral related to these impaired loans and/or the secondary support from guarantors mitigates the potential for losses from impaired loans. It is also important to note that even though the economic conditions in Texas and Oklahoma are weakened, we believe these markets are improving and better positioned to recover than many other areas of the country.
The bank subsidiaries charge off that portion of any loan which management considers to represent a loss as well as that portion of any other loan which is classified as a "loss" by bank examiners. Commercial and industrial or real estate loans are generally considered by management to represent a loss, in whole or part, when an exposure beyond any collateral coverage is apparent and when no further collection of the loss portion is anticipated based on the borrower's financial condition and general economic conditions in the borrower's industry. Generally, unsecured consumer loans are charged-off when 90 days past due.
54
INTERNATIONAL BANCSHARES CORPORATION AND SUBSIDIARIES
Notes to Consolidated Financial Statements (Continued)
(6) Bank Premises and Equipment
A summary of bank premises and equipment, by asset classification, at December 31, 2009 and 2008 were as follows:
| |
Estimated useful lives | 2009 | 2008 | ||||||||
|---|---|---|---|---|---|---|---|---|---|---|---|
| |
|
(Dollars in Thousands) |
|||||||||
Bank buildings and improvements |
5 – 40 years | $ | 384,760 | $ | 351,766 | ||||||
Furniture, equipment and vehicles |
1 – 20 years | 265,425 | 252,290 | ||||||||
Land |
124,012 | 109,214 | |||||||||
Real estate held for future expansion: |
|||||||||||
Land, building, furniture, fixture and equipment |
7 – 27 years | 715 | 766 | ||||||||
Less: accumulated depreciation |
(284,537 | ) | (247,665 | ) | |||||||
Bank premises and equipment, net |
$ | 490,375 | $ | 466,371 | |||||||
(7) Goodwill and Other Intangible Assets
The majority of the Company's identified intangibles are in the form of amortizable core deposit premium. In 2008, the Company purchased $1,074,000 in identified intangibles in the acquisition of the rights to InsCorp, Inc. insurance agency insurance contracts, which will be amortized over a 7 year period. Information on the Company's identified intangible assets follows:
| |
Carrying Amount |
Accumulated Amortization |
Net | ||||||||
|---|---|---|---|---|---|---|---|---|---|---|---|
| |
(Dollars in Thousands) |
||||||||||
December 31, 2009: |
|||||||||||
Core deposit premium |
$ |
58,675 |
$ |
37,496 |
$ |
21,179 |
|||||
Identified intangible (contract rights) |
1,333 | 154 | 1,179 | ||||||||
Total identified intangibles |
$ | 60,008 | $ | 37,650 | $ | 22,358 | |||||
December 31, 2008: |
|||||||||||
Core deposit premium |
$ |
58,675 |
$ |
32,364 |
$ |
26,311 |
|||||
Identified intangible (contract rights) |
1,074 | — | 1,074 | ||||||||
Total identified intangibles |
$ | 59,749 | $ | 32,364 | $ | 27,385 | |||||
55
INTERNATIONAL BANCSHARES CORPORATION AND SUBSIDIARIES
Notes to Consolidated Financial Statements (Continued)
(7) Goodwill and Other Intangible Assets (Continued)