Attached files
Table of Contents
UNITED STATES
SECURITIES AND EXCHANGE COMMISSION
Washington, D.C. 20549
FORM 10-K
| x | ANNUAL REPORT PURSUANT TO SECTION 13 OR 15(d) OF THE SECURITIES EXCHANGE ACT OF 1934 |
For the fiscal year ended December 31, 2009
OR
| ¨ | TRANSITION REPORT PURSUANT TO SECTION 13 OR 15(d) OF THE SECURITIES EXCHANGE ACT OF 1934 |
Commission File Number: 000-51996
CHICOPEE BANCORP, INC.
(Exact name of registrant as specified in its charter)
| Massachusetts | 20-4840562 | |
| (State or other jurisdiction of incorporation or organization) |
(I.R.S. Employer Identification No.) |
| 70 Center Street, Chicopee, Massachusetts | 01013 | |
| (Address of principal executive offices) | (Zip Code) |
Registrant’s telephone number: (413) 594-6692
Securities registered pursuant to Section 12(b) of the Act:
| Title of each class |
Name of each exchange on which registered | |
| Common Stock, no par value | Nasdaq Global Market |
Securities registered pursuant to Section 12(g) of the Act:
None
Indicate by check mark whether the registrant is a well known seasoned issuer, as defined in Rule 405 of the Securities Act. YES ¨ NO x
Indicate by check mark whether the registrant is not required to file reports pursuant to Section 13 or Section 15(d) of the Act. YES ¨ NO x
Indicate by check mark whether the registrant (1) has filed all reports required to be filed by Section 13 or 15(d) of the Securities Exchange Act of 1934 during the preceding 12 months (or for such shorter period that the registrant was required to file such reports), and (2) has been subject to such filing requirements for the past 90 days. YES x NO ¨
Indicate by check mark whether the registrant has submitted electronically and posted on its corporate Web site, if any, every Interactive Data File required to be submitted and posted pursuant to Rule 405 of Regulation S-T (§ 232.405 of this chapter) during the preceding 12 months (or for such shorter period that the registrant was required to submit and post such files.) YES ¨ NO ¨
Indicate by check mark if disclosure of delinquent filers pursuant to Item 405 of Regulation S-K is not contained herein, and will not be contained, to the best of registrant’s knowledge, in definitive proxy or information statements incorporated by reference in Part III of this Form 10-K or any amendment to this Form 10-K. ¨
Indicate by check mark whether the registrant is a large accelerated filer, an accelerated filer, a non-accelerated filer, or a smaller reporting company. See the definitions of “accelerated filer,” “large accelerated filer” and “smaller reporting company” in Rule 12b-2 of the Exchange Act.
| Large accelerated filer | ¨ | Accelerated filer | x | |||
| Non-accelerated filer | ¨ (Do not check if a smaller reporting company) | Smaller reporting company | ¨ | |||
Indicate by check mark whether the registrant is a shell company (as defined in Rule 12(b)-2 of the Exchange Act). YES ¨ NO x
On June 30, 2009, the aggregate market value of the voting and non-voting common equity held by non-affiliates was $83,063,252.
The number of shares of Common Stock outstanding as of March 16, 2010 is 6,379,030.
DOCUMENTS INCORPORATED BY REFERENCE
Portions of the Proxy Statement for our Annual Meeting of Stockholders, to be held on May 26, 2010, are incorporated by reference in Part III of this Annual Report on Form 10-K.
Table of Contents
Table of Contents
PART I
General
Chicopee Bancorp, Inc. (the “Company” or “Chicopee Bancorp”), a Massachusetts corporation, was formed on March 14, 2006 by Chicopee Savings Bank (the “Bank” or “Chicopee Savings Bank”) to become the holding company for the Bank upon completion of the Bank’s conversion from a mutual savings bank to a stock savings bank and the Company’s initial public offering. The conversion and the offering were completed on July 19, 2006.
The Bank, a Massachusetts stock savings bank, was organized in 1845 under the name Cabot Savings Bank and adopted its present name in 1854. The Bank is a full-service, community oriented financial institution offering products and services to individuals and businesses through nine offices located in western Massachusetts. The Bank’s deposits are insured by the Federal Deposit Insurance Corporation (“FDIC”) and Depositor’s Insurance Fund (“DIF”) of Massachusetts. The Bank is also a member of the Federal Home Loan Bank of Boston (“FHLB”). The Bank’s principal business consists of the acceptance of retail deposits from the general public and the investment of those deposits, together with funds generated from borrowings, retail operations, investment management and insurance services, into a broad line of lending products including one- to four-family, multi-family, commercial real estate, commercial business, construction and development and consumer loans, including home equity lines of credit and automobile loans. The Bank also sells one- to four-family residential loans to the secondary market to reduce interest rate risk. The Bank’s revenues are derived from the generation of interest and fees on loans, interest and dividends on investment securities and fees from its retail banking operation, and investment management. The Bank’s primary sources of funds are deposits, principal and interest payments on loans and investments, advances from the FHLB and proceeds from loan sales. The Bank also provides access to insurance and investment products through its Financial Services Division.
Available Information
The Company’s website is www.chicopeesavings.com. The Company makes available free of charge, on or through its website, its annual reports on Form 10-K, quarterly reports on Form 10-Q, current reports on Form 8-K and any amendments to those reports filed or furnished pursuant to Section 13(a) or 15(d) of the Securities Exchange Act of 1934, as amended, as soon as reasonably practicable after the Company electronically files such material with, or furnishes it to, the Securities and Exchange Commission. Information on the Company’s website shall not be considered part of this Form 10-K.
Market Area
The Company is headquartered in Chicopee, Massachusetts. The Company’s primary lending and deposit market areas include Hampden and Hampshire Counties in western Massachusetts. The city of Chicopee is a largely urban city and is located in the Pioneer Valley near the intersection of U.S. Interstates 90 (the Massachusetts Turnpike) and 91. Interstate 90 is the major east-west highway that crosses Massachusetts. Interstate 91 is the major north-south highway that runs directly through the heart of New England. Chicopee is located approximately 90 miles west of Boston, Massachusetts, 80 miles southeast of Albany, New York and 30 miles north of Hartford,
1
Table of Contents
Connecticut. Located in the region known as New England’s knowledge corridor, the Bank benefits from a concentration of more than 120,000 students at 32 higher education institutions. Additional economic support is gained from the presence of large employers such as Westover Air Reserve Base, Bay State Health Systems, the University of Massachusetts at Amherst, Big Y Supermarkets, MassMutual Financial Group, Top-Flite Golf Company, and Dow Jones & Co. Other economic activity is provided by the social service agencies and significant tourist attractions such as the Basketball Hall of Fame and Six Flags New England.
Competition
We face significant competition in attracting deposits and loans. Our most direct competition for deposits has historically come from the several financial institutions and credit unions operating in our market area and, to a lesser extent, from other financial service companies such as brokerage firms and insurance companies. We also face competition for depositors’ funds from money market funds, mutual funds and other corporate and government securities. At June 30, 2009, which is the most recent date for which data is available from the FDIC, we held approximately 4.75% of the deposits in Hampden County, which was the 10th largest market share out of the 21 banks and thrifts with offices in Hampden County. This data does not include deposits held by one of our primary competitors, credit unions, which, as tax-exempt organizations, are able to offer higher rates on deposits than banks. There are also 18 credit unions headquartered in Hampden County, some of the larger of which are headquartered in Chicopee, Massachusetts. In addition, banks owned by large super-regional bank holding companies such as Bank of America Corporation, Sovereign Bancorp, Inc., Citizens Financial Group, NewAlliance Bancshares, Inc., and TD Bank, Inc. also operate in our market area. These institutions are significantly larger than us and, therefore, have greater resources.
Our competition for loans comes primarily from financial institutions in our market areas, and, to a lesser extent, from other financial service providers such as mortgage companies and mortgage brokers. Competition for loans also comes from the increasing number of non-depository financial service companies entering the mortgage market such as insurance companies, securities companies and specialty finance companies.
We expect competition to increase in the future as a result of legislative, regulatory and technological changes and the continuing trend of consolidation in the financial services industry. Technological advances, for example, have lowered the barriers to market entry, allowed banks and other lenders to expand their geographic reach by providing services over the Internet and made it possible for non-depository institutions to offer products and services that traditionally have been provided by banks. Changes in federal laws permit affiliation among banks, securities firms and insurance companies, which promotes a competitive environment in the financial services industry. Competition for deposits and the origination of loans could limit our future growth.
Lending Activities
General. The Company’s loan portfolio totaled $427.8 million at December 31, 2009, representing 78.6% of total assets. In its lending activity, the Company originates residential real estate loans secured by one-to-four family residences, commercial real estate loans, residential and commercial construction loans, commercial and industrial loans, home equity lines-of-credit, fixed rate home equity loans and other consumer loans. The Company does not make “subprime loans” (loans that generally target borrowers with weakened credit histories typically characterized by payment delinquencies, previous charge-offs, judgments, bankruptcies, or borrowers with questionable repayment capacity as evidenced by low credit scores or high debt-burden ratios). While the Company makes loans throughout Massachusetts, most of its lending activities are concentrated in Hampden and Hampshire counties. Loans originated totaled $147 million in fiscal year 2009 and $139 million in 2008, including loans sold to the secondary market. Residential mortgages loans sold into the secondary market totaled $37 million during 2009 and $2.2 million in 2008. Servicing rights are retained on all loans originated and sold into the secondary market.
One- to Four-Family Loans. At December 31, 2009, the residential real estate loan portfolio totaled $150.3 million, or 35.1%, of the total loan portfolio with an average yield of 5.60%. Residential real estate loans
2
Table of Contents
originated totaled $56.6 million in 2009 and $38.4 million in 2008. Of the residential real estate loans outstanding at December 31, 2009, $124.1 million were adjustable rate loans, or 82.6% of the total residential real estate loan portfolio. Total loans serviced for others as of December 31, 2009 is $71.4 million. Residential real estate loans enable borrowers to purchase or refinance existing homes, most of which serve as the primary residence of the owner. We offer fixed-rate and adjustable-rate loans with terms up to 30 years. Borrower demand for adjustable-rate loans versus fixed-rate loans is a function of the level of interest rates, the expectations of changes in the level of interest rates, and the difference between the interest rates and loan fees offered for fixed-rate mortgage loans and the initial period interest rates and loan fees for adjustable-rate loans. The relative amount of fixed-rate mortgage loans and adjustable-rate mortgage loans that can be originated at any time is largely determined by the demand for each in a competitive environment. The loan fees, interest rates and other provisions of mortgage loans are determined by the demand for each in a competitive environment.
We offer fixed-rate one- to four-family loans with terms between 10 and 30 years. Management establishes the loan interest rates based on market conditions. Interest rates and payments on our adjustable-rate mortgage loans generally adjust annually after an initial fixed period that ranges from one to 10 years. Interest rates and payments on our adjustable-rate loans generally are adjusted to a rate typically equal to 2.75 percentage points above the one-year constant maturity Treasury index. The maximum amount by which the interest rate on our adjustable-rate mortgage loans may be increased or decreased is generally 2 percentage points per adjustment period and the lifetime interest rate cap is generally 6 percentage points over the initial interest rate of the loan. We also offer adjustable-rate mortgage loans that adjust every three years after an initial three-year fixed period and adjustable-rate mortgage loans that adjust every five years after an initial six-year fixed period. Interest rates and payments on these adjustable-rate loans generally are adjusted to a rate typically equal to 2.75% and 2.50% above the three- and five-year constant maturity Treasury index, respectively.
The largest owner-occupied residential real estate loan was $1.7 million and was performing according to its original terms as of December 31, 2009.
All adjustable-rate mortgage loans are underwritten taking the indexed rate into consideration at each adjustment period until the full cap is reached. A Mass Attorney General Important Disclosure (MA Chapter 93A-Determining Affordability of ARM Loans) is completed for each adjustable rate mortgage request, which calculates the overall debt to income based on the initial principal and interest payment along with real estate taxes, insurance, and other monthly payments due from the borrower and also includes the repricing of these payments at each adjustment up to the maximum caps allowed under the note. This process minimizes the risk of qualification at the time the loan reaches the maximum rate for that product.
Adjustable rate mortgage loans help decrease the risk associated with changes in market interest rates by periodically repricing. However, upward adjustment of interest rates is limited by the maximum periodic and lifetime interest rate adjustments permitted by our loan documents. In addition, adjustable rate mortgage loans may increase credit risk because, as interest rates increase, interest payments on adjustable rate loans increase, which increases the potential for defaults by our borrowers. See “Loan Underwriting Risks” below.
While one- to four-family residential real estate loans are normally originated with up to 30-year terms, such loans typically remain outstanding for substantially shorter periods because borrowers often prepay their loans in full upon sale of the property pledged as security or upon refinancing the original loan. Therefore, average loan maturity is a function of, among other factors, the level of purchase and sale activity in the real estate market, prevailing interest rates and the interest rates payable on outstanding loans.
We generally do not make conventional loans with loan-to-value ratios exceeding 95% at the time the loan is originated. Conventional loans with loan-to-value ratios in excess of 80% generally require private mortgage insurance or additional collateral. We require all properties securing mortgage loans to be appraised by a board-approved independent appraiser. We generally require title insurance on all first mortgage loans. Borrowers must obtain hazard insurance, and flood insurance for loans on properties located in a flood zone, before closing the loan.
In an effort to provide financing for first-time buyers, we offer 30-year fixed-rate residential mortgage loans through the Massachusetts Housing Finance Agency (MHFA) First Time Home Buyer Program. In addition, we offer adjustable-rate mortgage loans to municipal employees through the Massachusetts Housing Finance Agency Municipal Employee Mortgage Program. We offer mortgage loans through these programs to qualified individuals and originate the loans using underwriting guidelines as set forth by MHFA.
3
Table of Contents
Commercial Real Estate and Multi-Family Loans. At December 31, 2009, the commercial real estate and multi-family loans totaled $136.9 million, or 32.0%, of the total loan portfolio with an average yield of 6.10%. Our commercial real estate and multi-family loans are generally secured by apartment buildings and properties used for business purposes such as office buildings, industrial facilities and retail facilities. In addition to originating these loans, we also participate in loans with other financial institutions located primarily in Massachusetts.
We originate a variety of fixed- and adjustable-rate commercial real estate and multi-family loans for terms up to 20 years. Interest rates and payments on our adjustable-rate loans adjust every one to ten years and generally are adjusted to a rate equal to 2.0% to 3.0% above the corresponding U.S. Treasury rate or FHLB rate. Most of our adjustable-rate commercial real estate and multi-family loans adjust every five years. There are no adjustment period or lifetime interest rate caps. Loan amounts generally do not exceed 80% of the property’s appraised value at the time the loan is originated.
At December 31, 2009, our largest multi-family real estate loan was $1.2 million and was secured by an apartment building located in Chicopee, Massachusetts. At December 31, 2009, our largest commercial real estate loan was $4.9 million and was secured by a Walgreens in Worcester, Massachusetts. These loans were both performing according to their original terms at December 31, 2009.
At December 31, 2009, our exposure to commercial real estate and commercial business loan participations purchased and sold totaled $19.5 million and $12.8 million, respectively. The properties securing these loans are located primarily in Massachusetts.
We also originate land loans primarily to local contractors and developers for making improvements on approved building lots. Such loans are generally written with a maximum 75% loan-to-value ratio based upon the appraised value or purchase price, whichever is less, for a term of up to three years. Interest rates on our land loans are fixed for three years. At December 31, 2009, we had 14 land loans totaling $1.9 million.
Construction Loans. At December 31, 2009, the Company had $38.3 million of construction loans outstanding, representing 9.0% of the total loan portfolio. We originate fixed-rate and adjustable-rate loans to individuals and builders to finance the construction of residential dwellings. We also make construction loans for commercial development projects, including apartment buildings, small industrial buildings and retail and office buildings. Our construction loans generally provide for the payment of interest only during the construction phase, which is usually 12 months. At the end of the construction phase, the loan generally converts to a permanent mortgage loan. Loans generally can be made with a maximum loan to value ratio of 80% at the time the loan is originated. Before making a commitment to fund a construction loan, we require an appraisal of the property by an independent licensed appraiser. We also will require an inspection of the property before disbursement of funds during the term of the construction loan.
At December 31, 2009, our largest outstanding residential construction loan was $594,000, of which $589,000 was outstanding. At December 31, 2009, our largest outstanding commercial construction loan was a $5.0 million, of which $4.5 million was outstanding. This loan is for the development of an assisted-care facility. These loans were performing in accordance with their original terms at December 31, 2009.
Commercial and Industrial Loans. The Company originated $54.1 million and $38.9 million in commercial loans in 2009 and 2008, respectively. As of December 31, 2009, the Company had $68.5 million in commercial loans, representing 16.0% of the total loan portfolio, with an average yield of 4.70%. We make commercial business loans primarily in our market area to a variety of professionals, sole proprietorships and small businesses. Commercial lending products include term loans, revolving lines of credit and letters of credit loans. Commercial loans and lines of credit are made with either variable or fixed rates of interest. Variable rates are based on the prime rate as published in The Wall Street Journal, plus a margin. Fixed-rate business loans are generally indexed to a corresponding U.S. Treasury rate, plus margin, or FHLB, plus margin. The Company generally does not make unsecured commercial loans.
4
Table of Contents
When making commercial loans, we consider the financial statements of the borrower, our lending history with the borrower, the debt service capabilities of the borrower, the projected cash flows of the business and the value of the collateral, primarily accounts receivable, inventory and equipment, and are supported by personal guarantees. Depending on the collateral used to secure the loans, commercial loans are made in amounts of up to 80% of the value of the collateral securing the loan. The collateral securing commercial loans may depreciate over time, may be difficult to appraise and may fluctuate in value. See “Loan Underwriting Risks” below.
At December 31, 2009, our largest commercial term loan was a $2.8 million loan secured by real estate in West Springfield, Massachusetts. Our largest commercial relationship at December 31, 2009 was $13.3 million. This relationship included a commercial line of credit loan for $10.0 million, of which $5.5 million was outstanding at December 31, 2009. All of these loans are secured by assets of the borrower and were performing according to their original terms at December 31, 2009.
Consumer Loans. The Company originated $14.8 million and $16.1 million of consumer loans, including home equity loans, respectively in 2009 and 2008. Consumer loans outstanding at December 31, 2009 totaled $33.7 million, or 7.9%, of the total loan portfolio, with an average yield of 5.15%. We offer a variety of consumer loans, primarily home equity loans and lines of credit, and, to a much lesser extent, loans secured by automobiles and recreational vehicles and pools and spas and home improvement loans.
The procedures for underwriting consumer loans include an assessment of the applicant’s payment history on other debts and ability to meet existing obligations and payments on the proposed loan. Although the applicant’s creditworthiness is a primary consideration, the underwriting process also includes a comparison of the value of the collateral, if any, to the proposed loan amount.
We generally offer home equity loans with a maximum combined loan to value ratio of 80% and home equity lines of credit with a maximum combined loan to value ratio of 80%. Home equity lines of credit have adjustable rates of interest that are indexed to the prime rate as reported in The Wall Street Journal. Home equity loans have fixed interest rates and terms that range from five to 15 years.
We offer automobile and recreational vehicle loans secured by new and used vehicles. These loans have fixed interest rates and generally have terms up to six years for new automobiles, five years for used automobiles and four years for recreational vehicles. We also offer fixed-rate pool and spa loans up to $10,000 for terms up to five years.
We offer home improvement loans in amounts up to $5,000. These loans have fixed interest rates and terms up to five years.
Loan Underwriting Risks
Adjustable-Rate Loans. While we anticipate adjustable-rate loans will better offset the potential adverse effects of an increase in interest rates as compared to fixed-rate mortgages, the increased mortgage payments required of adjustable-rate loan borrowers in a rising interest rate environment could cause an increase in delinquencies and defaults. The marketability of the underlying property also may be adversely affected in a high interest rate environment. In addition, although adjustable-rate mortgage loans help make our loan portfolio more responsive to changes in interest rates, the extent of this interest sensitivity is limited by the annual and lifetime interest rate adjustment limits.
Commercial Real Estate and Multi-Family Loans. Loans secured by commercial real estate and multi-family real estate generally have larger balances and involve a greater degree of risk than one- to four-family residential mortgage loans. Of primary concern in commercial real estate and multi-family lending is the borrower’s creditworthiness and the feasibility and cash flow potential of the project. Payments on loans secured by income properties often depend on successful operation and management of the properties. As a result, repayment of such loans may be subject to a greater extent than residential real estate loans to adverse conditions in the real estate market or the economy. To monitor cash flows on income properties, we generally require borrowers and loan guarantors, if any, to provide annual financial statements and/or tax returns on commercial real estate and multi-family loans. In reaching a decision on whether to make a commercial real estate and multi-family loan, we consider the net operating income of the property, the borrower’s expertise, credit history and profitability and the value of the underlying property. We have generally required that the properties securing these real estate loans have debt
5
Table of Contents
service coverage ratios (the ratio of earnings before debt service to debt service) of at least 1.20x; however, this ratio can be lower depending on the amount and type of collateral. Environmental surveys and inspections are obtained when circumstances suggest the possibility of the presence of hazardous materials.
We underwrite all loan participations to our own underwriting standards. In addition, we also consider the financial strength and reputation of the lead lender. To monitor cash flows on loan participations, we require the lead lender to provide annual financial statements for the borrower. Generally, we also conduct an annual internal loan review for loan participations.
Construction Loans. Construction financing is generally considered to involve a higher degree of risk of loss than long-term financing on improved, occupied real estate. Risk of loss on a construction loan depends largely upon the accuracy of the initial estimate of the property’s value at completion of construction and the estimated cost (including interest) of construction. During the construction phase, a number of factors could result in delays and cost overruns. If the estimate of construction costs proves to be inaccurate, we may be required to advance funds beyond the amount originally committed to permit completion of the building. If the estimate of value proves to be inaccurate, we may be confronted, at or before the maturity of the loan, with a building having a value which is insufficient to assure full repayment. If we are forced to foreclose on a building before or at completion due to a default, there can be no assurance that we will be able to recover all of the unpaid balance of, and accrued interest on, the loan as well as related foreclosure and holding costs.
Commercial Loans. Unlike residential mortgage loans, which generally are made on the basis of the borrower’s ability to make repayment from his or her employment or other income, and which are secured by real property the value of which tends to be more easily ascertainable, commercial loans are of higher risk and typically are made on the basis of the borrower’s ability to make repayment from the cash flow of the borrower’s business. As a result, the availability of funds for the repayment of commercial loans may depend substantially on the success of the business itself. Further, any collateral securing such loans may depreciate over time, may be difficult to appraise and may fluctuate in value.
Consumer Loans. Consumer loans may entail greater risk than do residential mortgage loans, particularly in the case of consumer loans that are unsecured or secured by assets that depreciate rapidly. In such cases, repossessed collateral for a defaulted consumer loan may not provide an adequate source of repayment for the outstanding loan and the remaining deficiency often does not warrant further substantial collection efforts against the borrower. In addition, consumer loan collections depend on the borrower’s continuing financial stability, and therefore are more likely to be adversely affected by job loss, divorce, illness or personal bankruptcy. Furthermore, the application of various federal and state laws, including bankruptcy and insolvency laws, may limit the amount that can be recovered on such loans.
Loan Originations, Purchases, and Sales. Loan originations come from a number of sources. The primary sources of loan originations are existing customers, walk-in traffic, advertising and referrals from customers. We advertise on television, on the radio and in newspapers that are widely circulated in Hampden and Hampshire Counties, both in Massachusetts. Accordingly, because our rates are competitive, we attract loans from throughout Hampden and Hampshire Counties. We occasionally purchase participation interests in loans to supplement our origination efforts.
We generally originate loans for our portfolio; however, we generally sell, prior to funding, to the secondary market all newly originated conforming fixed-rate, 10- to 30-year one- to four-family residential real estate loans. Our decision to sell loans is based on prevailing market interest rate conditions and interest rate risk management. Generally, loans are sold to the Massachusetts Housing Finance Agency and Freddie Mac with loan servicing retained. In addition, we sell participation interests in commercial real estate loans to local financial institutions, primarily on the portion of loans that exceed our borrowing limits.
Loan Approval Procedures and Authority. Our lending activities follow written, non-discriminatory, underwriting standards and loan origination procedures established by our board of directors and management. Our Board of Directors has granted loan approval authority to certain officers up to prescribed limits, depending on the
6
Table of Contents
officer’s experience, the type of loan and whether the loan is secured or unsecured. Loans in excess of the Senior Lending Officer limits ($500,000 for real estate loans, secured consumer loans, and secured and unsecured commercial loans; and $100,000 for unsecured consumer loans.) must be authorized by the President and the Senior Lending Officer up to 1.5 times the Senior Lending Officer lending limits. All other extensions of credit exceeding such limitations require the approval of the executive committee, a committee of the Board of Directors of the Bank.
Loans to One Borrower. The maximum amount that we may lend to one borrower and the borrower’s related entities generally is limited, by statute, to 20% of our stated capital and reserves. At December 31, 2009, our general regulatory limit on loans to one borrower was $17.0 million. At December 31, 2009, our internal lending limit to one borrower was $8.0 million, unless approved in excess of this amount by the executive committee of the Board of Directors. On December 31, 2009, our largest lending relationship, as approved by the executive committee, was a $14.6 million commercial real estate loan relationship, secured by assets of the borrower. The loans that comprise this relationship were performing in accordance with their original terms at December 31, 2009.
Loan Commitments. We issue commitments for fixed- and adjustable-rate mortgage loans conditioned upon the occurrence of certain events. Commitments to originate mortgage loans are legally binding agreements to lend to our customers. Generally, our mortgage loan commitments expire after 30 days.
Investment Activities
We have legal authority to invest in various types of liquid assets, including U.S. Treasury obligations, securities of various government sponsored enterprises and municipal governments, deposits at the FHLB and certificates of deposit of federally insured institutions. We also are required to maintain an investment in FHLB stock. While we have the authority under applicable law to invest in derivative securities, our investment policy does not permit us to do so and we had no investments in derivative securities at December 31, 2009.
At December 31, 2009, our investment portfolio consisted primarily of short-term U.S Treasury securities and U.S. Government and government sponsored enterprise securities, investment-grade corporate and industrial revenue bonds, collateralized mortgage obligations, and investment-grade marketable equity securities.
Our investment objectives are to provide and maintain liquidity, to establish an acceptable level of interest rate and credit risk, to provide an alternate source of low-risk investments when demand for loans is weak and to generate a favorable return. The Board of Directors of the Bank has the overall responsibility for approval of our investment policy. The Treasurer is responsible for the implementation of the investment policy. Individual investment transactions are reviewed and approved by our executive committee monthly while portfolio composition and performance are reviewed at least annually by the Board of Directors of the Bank.
Our Chief Financial Officer and Treasurer and Senior Vice President of Finance are responsible for ensuring that the investment policy is followed and that all securities are considered prudent for investment. They are authorized to execute transactions up to $3.0 million. All transactions exceeding $3.0 million, and up to $4.0 million maximum, must also be approved by the President and Chief Executive Officer.
Deposit Activities and Other Sources of Funds
General. Deposits, borrowings and loan repayments are the major sources of our funds for lending and other investment purposes. Loan repayments are a relatively stable source of funds, while deposit inflows and outflows and loan prepayments are significantly influenced by general interest rates and money market conditions.
Deposits. Substantially all of our depositors are residents of the Commonwealth of Massachusetts. Deposits are attracted, by advertising and through our website, from within our market areas through the offering of a broad selection of deposit instruments, including non-interest-bearing demand accounts (such as checking accounts), interest-bearing accounts (such as NOW and money market deposit accounts), regular savings accounts (such as passbook accounts) and certificates of deposit. At December 31, 2009, $32.2 million, or 8.8% of our total deposits, were municipal deposits. At December 31, 2009, we did not utilize brokered deposits. Deposit account terms vary according to the minimum balance required, the time periods the funds must remain on deposit and the interest rate, among other factors. In determining the terms of our deposit accounts, we consider the rates offered by
7
Table of Contents
our competition, our liquidity needs, profitability to us, matching deposit and loan products and customer preferences and concerns. We generally review our deposit mix and pricing weekly. Our current strategy is to offer competitive rates and to be at the middle end of the market for rates on all types of deposit products depending on our needs for funds and rates on borrowings. The Bank chose not to participate in the FDIC’s Transaction Account Guarantee Program. Customers of the Bank with non interest-bearing transaction accounts will continue to be insured through December 31, 2013 for up to $250,000 under the FDIC’s general deposit insurance rules. In addition, all of the Bank’s deposits above the FDIC limit are insured in full by the Depositors Insurance Fund (“DIF”). The combination of the FDIC and DIF insurance provides customers of Massachusetts-chartered savings banks with full deposit insurance on all their deposit accounts. No depositor has ever lost a penny in a bank insured by both FDIC and DIF.
Borrowed Funds. We may utilize advances from the FHLB to supplement our supply of investable funds. The FHLB functions as a central reserve bank providing credit for its member financial institutions. As a member, we are required to own capital stock in the FHLB and are authorized to apply for advances on the security of such stock and certain of our whole first mortgage loans and other assets (principally securities which are obligations of, or guaranteed by, the United States), provided certain standards related to creditworthiness have been met. Advances are made under several different programs, each having its own interest rate and range of maturities. Depending on the program, limitations on the amount of advances are based either on a fixed percentage of an institution’s net worth or on the FHLB’s assessment of the institution’s creditworthiness.
Securities sold under agreements to repurchase are customer deposits that are invested overnight in U.S. Treasury securities. The customers, predominantly commercial customers, set a predetermined balance and deposits in excess of that amount are transferred into the repurchase account from each customer’s checking account. The next banking day, the funds are recredited to their individual money market account along with interest earned at market rates. These types of accounts are often referred to as sweep accounts.
Financial Services
We have a partnership with a third-party registered broker-dealer, Linsco/Private Ledger. Through Linsco/Private Ledger, we offer customers a range of non-deposit investment products, including mutual funds, debt, equity and government securities, retirement accounts, insurance products and fixed and variable annuities. We receive a portion of the commissions generated by Linsco/Private Ledger from sales to customers. For the years ended December 31, 2009, 2008 and 2007, we received fees of $142,000, $396,000 and $356,000, respectively, through our relationship with Linsco/Private Ledger.
Subsidiary Activities
Chicopee Bancorp, Inc. has two wholly-owned subsidiaries: Chicopee Savings Bank and Chicopee Funding Corporation.
Chicopee Funding Corporation. Chicopee Funding Corporation was incorporated in Massachusetts in 2006. Chicopee Funding Corporation was formed to lend funds of $5.95 million to the Chicopee Savings Bank Employee Stock Ownership Plan Trust, which was used to purchase 8%, or 595,149 shares, of the common stock issued in the Company’s initial public offering.
The following are descriptions of Chicopee Savings Bank’s wholly-owned subsidiaries:
CSB Colts, Inc. CSB Colts, Inc. was formed in 2003 as a Massachusetts corporation to engage in buying, selling and holding securities on its own behalf. At December 31, 2009, CSB Colts had total assets of $13.1 million consisting primarily of industrial revenue bonds. CSB Colts’ net income for the year ended December 31, 2009 was $263,000. As a Massachusetts securities corporation, the income earned on CSB Colts’ investment securities is subject to a lower state tax rate than that assessed on income earned on investment securities maintained at Chicopee Savings Bank.
CSB Investment Corp. CSB Investment Corp. was formed in 2003 as a Massachusetts corporation to engage in buying, selling and holding securities on its own behalf. At December 31, 2009, CSB Investment had total
8
Table of Contents
assets of $20.5 million consisting primarily of U.S. Treasury securities and U.S. Government and government sponsored enterprise securities, collateralized mortgage obligations, and marketable equity securities. CSB Investment’s net loss for the year ended December 31, 2009 was $978,000. As a Massachusetts securities corporation, the income earned on CSB Investment’s investment securities is subject to a lower state tax rate than that assessed on income earned on investment securities maintained at Chicopee Savings Bank.
Cabot Realty L.L.C. Cabot Realty L.L.C. was formed as a Massachusetts limited liability company to hold other real estate owned. Cabot Realty is currently active and at December 31, 2009, had total assets of $495,000 consisting of cash and cash equivalents of $376,000 and other real estate owned of $80,000. Cabot Realty’s net loss for the year ended December 31, 2009 was $43,000. Cabot Management Corporation, a wholly owned subsidiary of Chicopee Savings Bank, has a 1% membership interest in, and Chicopee Savings Bank has a 99% membership interest in, Cabot Realty.
Cabot Management Corporation. Cabot Management Corporation was formed in 1979 as a Massachusetts corporation to acquire and manage interests in real property and to acquire, construct, rehabilitate, lease, finance and dispose of housing facilities. Cabot Management is currently inactive and at December 31, 2009 had total assets of $17,000.
Personnel
As of December 31, 2009, we had approximately 136 full-time employees and 18 part-time employees, none of whom is represented by a collective bargaining unit. We believe we have a good relationship with our employees.
Regulation and Supervision
General
Chicopee Savings Bank is a Massachusetts-chartered stock savings bank and is the wholly-owned subsidiary of Chicopee Bancorp, a Massachusetts corporation and registered bank holding company. Chicopee Savings Bank’s deposits are insured up to applicable limits by the FDIC and by the DIF of Massachusetts for amounts in excess of the FDIC insurance limits. Chicopee Savings Bank is subject to extensive regulation by the Massachusetts Commissioner of Banks, as its chartering agency, and by the FDIC, as its primary federal regulator and deposit insurer. Chicopee Savings Bank is required to file reports with, and is periodically examined by, the FDIC and the Massachusetts Commissioner of Banks concerning its activities and financial condition and must obtain regulatory approvals prior to entering into certain transactions, including, but not limited to, mergers with or acquisitions of other financial institutions. As a registered bank holding company, Chicopee Bancorp is regulated by the Federal Reserve Board. This regulation and supervision establishes a comprehensive framework of activities in which an institution can engage and is intended primarily for the protection of depositors and the deposit insurance funds, rather than for the protection of stockholders and creditors. The regulatory structure also gives the regulatory authorities extensive discretion in connection with their supervisory and enforcement activities and examination policies, including policies with respect to the establishment of deposit insurance assessment fees, the classification of assets and the establishment of adequate loan loss reserves for regulatory purposes. Any change in such regulatory requirements and policies, whether by the Massachusetts legislature, the Massachusetts Commission of Banks, the FDIC, the Federal Reserve Board or Congress, could have a material adverse impact on the financial condition and results of operations of Chicopee Bancorp and Chicopee Savings Bank.
Set forth below is a brief description of certain regulatory requirements applicable to Chicopee Bancorp and Chicopee Savings Bank. The description below is limited to certain material aspects of the statutes and regulations addressed, and is not intended to be a complete description of such statutes and regulations and their effects on Chicopee Bancorp and Chicopee Savings Bank.
Massachusetts Banking Laws and Supervision
General. As a Massachusetts-chartered stock savings bank, Chicopee Savings Bank is subject to supervision, regulation and examination by the Massachusetts Commissioner of Banks and to various Massachusetts
9
Table of Contents
statutes and regulations which govern, among other things, investment powers, lending and deposit-taking activities, borrowings, maintenance of surplus and reserve accounts, distribution of earnings and payment of dividends. In addition, Chicopee Savings Bank is subject to Massachusetts consumer protection and civil rights laws and regulations. The approval of the Massachusetts Commissioner of Banks or the Board of Bank Incorporation is required for a Massachusetts-chartered bank to establish or close branches, merge with other financial institutions, organize a holding company, issue stock and undertake certain other activities.
Massachusetts regulations generally allow Massachusetts banks to engage in activities permissible for federally chartered banks or banks chartered by another state. The Commissioner also has adopted procedures reducing regulatory burdens and expense and expediting branching by well-capitalized and well-managed banks.
Dividends. A Massachusetts stock bank may declare from net profits cash dividends not more frequently than quarterly and non-cash dividends at any time. No dividends may be declared, credited or paid if the bank’s capital stock is impaired. The approval of the Massachusetts Commissioner of Banks is required if the total of all dividends declared in any calendar year exceeds the total of its net profits for that year combined with its retained net profits of the preceding two years. Dividends from Chicopee Bancorp, Inc. may depend, in part, upon receipt of dividends from the Bank. The payment of dividends from the Bank to the Company may be additionally restricted if the payment of such dividends resulted in the Bank failing to meet regulatory capital requirements. At December 31, 2009, the Bank’s levels of capitalization were comfortably above the standards to be rated “well-capitalized” by regulatory authorities. A total of $500,000 in dividends was declared in 2009 from the Bank to the Company. The Bank paid the dividend in January 2010.
Loans to One Borrower Limitations. Massachusetts banking law grants broad lending authority. However, with certain limited exceptions, total obligations to one borrower may not exceed 20 percent of the total of the bank’s capital and reserves.
Loans to a Bank’s Insiders. The Massachusetts banking laws prohibit any executive officer, director or trustee of a bank from borrowing or guaranteeing extensions of credit by such bank except for any of the following loans or extensions of credit with the approval of a majority of the Board of Directors: (i) loans or extension of credit, secured or unsecured, to an officer of the bank in an amount not exceeding $100,000; (ii) loans or extensions of credit intended or secured for educational purposes to an officer of the bank in an amount not exceeding $200,000; (iii) loans or extensions of credit secured by a mortgage on residential real estate to be occupied in whole or in part by the officer to whom the loan or extension of credit is made, in an amount not exceeding $750,000; and (iv) loans or extensions of credit to a director or trustee of the bank who is not also an officer of the bank in an amount permissible under the bank’s loan to one borrower limit. No such loan or extension of credit may be granted with an interest rate or other terms that are preferential in comparison to loans granted to persons not affiliated with the savings bank.
Investment Activities. In general, Massachusetts-chartered savings banks may invest in preferred and common stock of any corporation organized under the laws of the United States or any state provided such investments do not involve control of any corporation and do not, in the aggregate, exceed 4.0% of the bank’s deposits. Federal law imposes additional restrictions on Chicopee Savings Bank’s investment activities. See “—Federal Regulations—Investment Activities”.
Regulatory Enforcement Authority. Any Massachusetts bank that does not operate in accordance with the regulations, policies and directives of the Massachusetts Commissioner of Banks may be subject to sanctions for non-compliance, including revocation of its charter. The Massachusetts Commissioner of Banks may under certain circumstances suspend or remove officers or directors who have violated the law, conducted the bank’s business in a manner which is unsafe, unsound or contrary to the depositors interests or been negligent in the performance of their duties. Upon finding that a bank has engaged in an unfair or deceptive act or practice, the Massachusetts Commissioner of Banks may issue an order to cease and desist and impose a fine on the bank concerned. In addition, Massachusetts consumer protection and civil rights statutes applicable to Chicopee Savings Bank permit private individual and class action law suits and provide for the rescission of consumer transactions, including loans, and the recovery of statutory and punitive damage and attorney’s fees in the case of certain violations of those statutes.
10
Table of Contents
Depositors Insurance Fund. All Massachusetts-chartered savings banks are required to be members of the DIF, a corporation that insures savings bank deposits in excess of federal deposit insurance coverage. The DIF is authorized to charge savings banks an annual assessment fee on deposit balances in excess of amounts insured by the FDIC. Assessment rates are based on the institution’s risk category, similar to the method used to determine assessments by the FDIC discussed below under “—Federal Regulations—Insurance of Deposit Accounts.”
Protection of Personal Information. Massachusetts has adopted regulatory requirements intended to protect personal information. The requirements, which become effective March 1, 2010, are similar to existing federal laws such as the Gramm-Leach-Bliley Act, discussed below under “—Federal Regulations—Privacy Regulations”, that require organizations to establish written information security programs to prevent identity theft. However, unlike federal regulations, the Massachusetts regulation also contains technology system requirements, especially for the encryption of personal information sent over wireless or public networks or stored on portable devices.
Massachusetts has other statutes or regulations that are similar to the federal provisions discussed below.
Federal Regulations
Capital Requirements. Under the FDIC’s regulations, federally insured state-chartered banks that are not members of the Federal Reserve System (“state non-member banks”), such as Chicopee Savings Bank, are required to comply with minimum leverage capital requirements. For an institution determined by the FDIC to not be anticipating or experiencing significant growth and to be, in general, a strong banking organization rated composite 1 under Uniform Financial Institutions Ranking System established by the Federal Financial Institutions Examination Council, the minimum capital leverage requirement is a ratio of Tier 1 capital to total assets of 3.0%. For all other institutions, the minimum leverage capital ratio is not less than 4.0%. Tier 1 capital is the sum of common stockholder’s equity, noncumulative perpetual preferred stock (including any related surplus) and minority investments in certain subsidiaries, less intangible assets (except for certain servicing rights and credit card relationships) and certain other specified items.
In addition, FDIC regulations require state non-member banks to maintain certain ratios of regulatory capital to regulatory risk-weighted assets, or “risk-based capital ratios.” Risk-based capital ratios are determined by allocating assets and specified off-balance sheet items to four risk-weighted categories ranging from 0.0% to 100.0%. State non-member banks must maintain a minimum ratio of total capital to risk-weighted assets of at least 8.0%, of which at least one-half must be Tier 1 capital. Total capital consists of Tier 1 capital plus Tier 2 or supplementary capital items, which include allowances for loan losses in an amount of up to 1.25% of risk-weighted assets, cumulative preferred stock and certain other capital instruments, and a portion of the net unrealized gain on equity securities. The includable amount of Tier 2 capital cannot exceed the amount of the institution’s Tier 1 capital.
U.S. Treasury’s TARP Capital Purchase Program. In October 2008, the U.S. Treasury created the Capital Purchase Program (“CPP”) under which Treasury purchased securities from qualified financial institutions in an effort to stabilize the financial system. Institutions electing to participate in the CPP became subject to a number of restrictions, including limits on executive compensation, stock redemptions and dividends. Chicopee Savings Bank elected not to participate in the CPP.
Standards for Safety and Soundness As required by statute, the federal banking agencies adopted final regulations and Interagency Guidelines Establishing Standards for Safety and Soundness to implement safety and soundness standards. The guidelines set forth the safety and soundness standards that the federal banking agencies use to identify and address problems at insured depository institutions before capital becomes impaired. The guidelines address internal controls and information systems, internal audit system, credit underwriting, loan documentation, interest rate exposure, asset growth, asset quality, earnings and compensation, fees and benefits. Most recently, the agencies have established standards for safeguarding customer information. If the appropriate federal banking agency determines that an institution fails to meet any standard prescribed by the guidelines, the agency may require the institution to submit to the agency an acceptable plan to achieve compliance with the standard.
11
Table of Contents
Investment Activities. Since the enactment of Federal Deposit Insurance Corporation Improvement Act, all state-chartered FDIC-insured banks, including savings banks, have generally been limited in their investment activities to principal and equity investments of the type and in the amount authorized for national banks, notwithstanding state law. The Federal Deposit Insurance Corporation Improvement Act and the FDIC regulations permit exceptions to these limitations. For example, state chartered banks may, with FDIC approval, continue to exercise state authority to invest in common or preferred stocks listed on a national securities exchange or the Nasdaq Global Market and in the shares of an investment company registered under the Investment Company Act of 1940, as amended. The maximum permissible investment is 100.0% of Tier 1 Capital, as specified by the FDIC’s regulations, or the maximum amount permitted by Massachusetts law, whichever is less. Chicopee Savings Bank received approval from the FDIC to retain and acquire such equity instruments equal to the lesser of 100% of Chicopee Savings Banks’ Tier 1 capital or the maximum permissible amount specified by Massachusetts law. Any such grandfathered authority may be terminated upon the FDIC’s determination that such investments pose a safety and soundness risk or upon the occurrence of certain events such as the savings bank’s conversion to a different charter. In addition, the FDIC is authorized to permit such institutions to engage in state authorized activities or investments not permissible for national banks (other than non-subsidiary equity investments) if they meet all applicable capital requirements and it is determined that such activities or investments do not pose a significant risk to the Bank Insurance Fund. The FDIC has adopted regulations governing the procedures for institutions seeking approval to engage in such activities or investments. The Gramm-Leach-Bliley Act of 1999 specifies that a non-member bank may control a subsidiary that engages in activities as principal that would only be permitted for a national bank to conduct in a “financial subsidiary” if a bank meets specified conditions and deducts its investment in the subsidiary for regulatory capital purposes.
Prompt Corrective Regulatory Action. Federal law requires, among other things, that federal bank regulatory authorities take “prompt corrective action” with respect to banks that do not meet minimum capital requirements. For these purposes, the law establishes five capital categories: well capitalized, adequately capitalized, undercapitalized, significantly undercapitalized and critically undercapitalized.
The FDIC has adopted regulations to implement the prompt corrective action legislation. An institution is deemed to be “well capitalized” if it has a total risk-based capital ratio of 10.0% or greater, a Tier 1 risk-based capital ratio of 6.0% or greater and a leverage ratio of 5.0% or greater. An institution is “adequately capitalized” if it has a total risk-based capital ratio of 8.0% or greater, a Tier 1 risk-based capital ratio of 4.0% or greater, and generally a leverage ratio of 4.0% or greater. An institution is “undercapitalized” if it has a total risk-based capital ratio of less than 8.0%, a Tier 1 risk-based capital ratio of less than 4.0%, or generally a leverage ratio of less than 4.0%. An institution is deemed to be “significantly undercapitalized” if it has a total risk-based capital ratio of less than 6.0%, a Tier 1 risk-based capital ratio of less than 3.0%, or a leverage ratio of less than 3.0%. An institution is considered to be “critically undercapitalized” if it has a ratio of tangible equity (as defined in the regulations) to total assets that is equal to or less than 2.0%.
“Undercapitalized” banks must adhere to growth, capital distribution (including dividend) and other limitations and are required to submit a capital restoration plan. A bank’s compliance with such a plan is required to be guaranteed by any company that controls the undercapitalized institution in an amount equal to the lesser of 5.0% of the institution’s total assets when deemed undercapitalized or the amount necessary to achieve the status of adequately capitalized. If an “undercapitalized” bank fails to submit an acceptable plan, it is treated as if it is “significantly undercapitalized.” “Significantly undercapitalized” banks must comply with one or more of a number of additional restrictions, including but not limited to an order by the FDIC to sell sufficient voting stock to become adequately capitalized, requirements to reduce total assets, cease receipt of deposits from correspondent banks or dismiss directors or officers, and restrictions on interest rates paid on deposits, compensation of executive officers and capital distributions by the parent holding company. “Critically undercapitalized” institutions are subject to additional measures including, subject to a narrow exception, the appointment of a receiver or conservator within 270 days after it obtains such status.
Transactions with Affiliates. Transactions between banks and their related parties or affiliates are limited by Sections 23A and 23B of the Federal Reserve Act. An affiliate of a bank is any company or entity that controls, is controlled by or is under common control with the bank. In a holding company context, the parent bank holding company and any companies which are controlled by such parent holding company are affiliates of the bank.
12
Table of Contents
Generally, Sections 23A and 23B of the Federal Reserve Act and Regulation W (i) limit the extent to which the bank or its subsidiaries may engage in “covered transactions” with any one affiliate to an amount equal to 10.0% of such institution’s capital stock and surplus, and contain an aggregate limit on all such transactions with all affiliates to an amount equal to 20.0% of such institution’s capital stock and surplus and (ii) require that all such transactions be on terms substantially the same, or at least as favorable, to the institution or subsidiary as those provided to non-affiliates. The term “covered transaction” includes the making of loans, purchase of assets, issuance of a guarantee and other similar transactions. In addition, loans or other extensions of credit by the financial institution to the affiliate are required to be collateralized in accordance with the requirements set forth in Section 23A of the Federal Reserve Act. The Sarbanes-Oxley Act of 2002 generally prohibits loans by a company to its executive officers and directors. However, the law contains a specific exception for loans by a depository institution to its executive officers and directors in compliance with federal banking laws assuming such loans are also permitted under the law of the institution’s chartering state. Under such laws, the Bank’s authority to extend credit to executive officers, directors and 10% shareholders (“insiders”), as well as entities such person’s control, is limited. The law limits both the individual and aggregate amount of loans the Bank may make to insiders based, in part, on the Bank’s capital position and requires certain board approval procedures to be followed. Such loans are required to be made on terms substantially the same as those offered to unaffiliated individuals and not involve more than the normal risk of repayment. There is an exception for loans made pursuant to a benefit or compensation program that is widely available to all employees of the institution and does not give preference to insiders over other employees. Loans to executive officers are further limited by specific categories.
Enforcement. The FDIC has extensive enforcement authority over insured state savings banks, including Chicopee Savings Bank. This enforcement authority includes, among other things, the ability to assess civil money penalties, issue cease and desist orders and remove directors and officers. In general, these enforcement actions may be initiated in response to violations of laws and regulations and unsafe or unsound practices. The FDIC has authority under federal law to appoint a conservator or receiver for an insured bank under limited circumstances. The FDIC is required, with certain exceptions, to appoint a receiver or conservator for an insured state non-member bank if that bank was “critically undercapitalized” on average during the calendar quarter beginning 270 days after the date on which the institution became “critically undercapitalized.” The FDIC may also appoint itself as conservator or receiver for an insured state non-member institution under specific circumstances on the basis of the institution’s financial condition or upon the occurrence of other events, including: (1) insolvency; (2) substantial dissipation of assets or earnings through violations of law or unsafe or unsound practices; (3) existence of an unsafe or unsound condition to transact business; and (4) insufficient capital, or the incurring of losses that will deplete substantially all of the institution’s capital with no reasonable prospect of replenishment without federal assistance.
Insurance of Deposit Accounts. In October 2008, in response to the global financial crisis, deposit insurance by the FDIC was increased to a maximum of $250,000 per depositor. On January 1, 2014, the maximum insurance amount will return to $100,000 per depositor for all deposit accounts except certain retirement accounts, which will remain at $250,000 per depositor. In addition, as a Massachusetts-chartered stock savings bank, Chicopee Savings Bank is required to be a member of the Massachusetts Depositors Insurance Fund, a corporation that insures savings bank deposits in excess of federal deposit insurance coverage.
Pursuant to the Federal Deposit Insurance Reform Act of 2005 (the “Reform Act”), the FDIC is authorized to set the reserve ratio for the Deposit Insurance Fund annually at between 1.15% and 1.5% of estimated insured deposits. As of June 30, 2008, the reserve ratio had decreased to 1.01% as a result of bank failures. As part of a plan to restore the reserve ratio to 1.15%, the FDIC imposed a special assessment equal to five basis points of assets less Tier 1 capital as of June 30, 2009, which was payable on September 30, 2009. In addition, the FDIC has increased its quarterly assessment rates and amended the method by which rates are calculated. Beginning in the second quarter of 2009, institutions are assigned an initial base assessment rate ranging from 12 to 45 basis points of deposits depending on risk category. The initial base assessment is then adjusted based upon the level of unsecured debt, secured liabilities, and brokered deposits to establish a total base assessment rate ranging from seven to 77.5 basis points.
On November 12, 2009, the FDIC approved a final rule requiring insured depository institutions to prepay on December 30, 2009, their estimated quarterly risk-based assessments for the fourth quarter of 2009, and for all of 2010, 2011, and 2012. Estimated assessments for the fourth quarter of 2009 and for all of 2010 are based upon the
13
Table of Contents
assessment rate in effect on September 30, 2009, with 3 basis points added for the 2011 and 2012 assessment rates. In addition, a 5% annual growth in the assessment base is assumed. Prepaid assessments are to be applied against the actual quarterly assessments until exhausted, and may not be applied to any special assessments that may occur in the future. Any unused prepayments will be returned to the institution on June 30, 2013. On December 30, 2009, Chicopee Savings Bank prepaid $1.9 million in estimated assessment fees for the fourth quarter of 2009 through 2012. Because the prepaid assessments represent the prepayment of future expense, they do not affect Chicopee Savings Bank’s capital (the prepaid asset will have a risk-weighting of 0%) or tax obligations.
In addition to the FDIC assessments, the Financing Corporation (“FICO”) is authorized to impose and collect, with the approval of the FDIC, assessments for anticipated payments, issuance costs and custodial fees on bonds issued by the FICO in the 1980s to recapitalize the former Federal Savings and Loan Insurance Corporation. The bonds issued by the FICO are due to mature in 2017 through 2019. During the year ended December 31, 2009, Chicopee Savings Bank paid $38,000 in fees related to the FICO.
Insurance of deposits may be terminated by the FDIC upon a finding that an institution has engaged in unsafe or unsound practices, is in an unsafe or unsound condition to continue operations or has violated any applicable law, regulation, rule, order or condition imposed by the FDIC. We do not know of any practice, condition or violation that might lead to termination of Chicopee Savings Bank’s deposit insurance.
Privacy Regulations. Pursuant to the Gramm-Leach-Bliley Act, the FDIC has published final regulations implementing the privacy protection provisions of the Gramm-Leach-Bliley Act. The regulations generally require that Chicopee Savings Bank disclose its privacy policy, including identifying with whom it shares a customer’s “non-public personal information,” to customers at the time of establishing the customer relationship and annually thereafter. In addition, Chicopee Savings Bank is required to provide its customers with the ability to “opt-out” of having their personal information shared with unaffiliated third parties and not to disclose account numbers or access codes to non-affiliated third parties for marketing purposes. Chicopee Savings Bank currently has a privacy protection policy in place and believes that such policy is in compliance with the regulations.
Community Reinvestment Act. Under the Community Reinvestment Act, or CRA, as amended and as implemented by FDIC regulations, a bank has a continuing and affirmative obligation, consistent with its safe and sound operation, to help meet the credit needs of its entire community, including low and moderate income neighborhoods. The CRA does not establish specific lending requirements or programs for financial institutions nor does it limit an institution’s discretion to develop the types of products and services that it believes are best suited to its particular community, consistent with the CRA. The CRA does require the FDIC, in connection with its examination of a bank, to assess the institution’s record of meeting the credit needs of its community and to take such record into account in its evaluation of certain applications by such institution, including applications to acquire branches and other financial institutions. The CRA requires the FDIC to provide a written evaluation of an institution’s CRA performance utilizing a four-tiered descriptive rating system. Chicopee Savings Bank’s latest FDIC CRA rating was “Satisfactory.”
Massachusetts has its own statutory counterpart to the CRA which is also applicable to Chicopee Savings Bank. The Massachusetts version is generally similar to the CRA but utilizes a five-tiered descriptive rating system. Massachusetts law requires the Massachusetts Commissioner of Banks to consider, but not be limited to, a bank’s record of performance under Massachusetts law in considering any application by the bank to establish a branch or other deposit-taking facility, to relocate an office or to merge or consolidate with or acquire the assets and assume the liabilities of any other banking institution. Chicopee Savings Bank’s most recent rating under Massachusetts law was “Satisfactory.”
Federal Reserve System. The Federal Reserve Board regulations require savings institutions to maintain non-interest earning reserves against their transaction accounts (primarily Negotiable Order of Withdrawal (NOW) and regular checking accounts). The regulations generally provide that reserves be maintained against aggregate transaction accounts as follows: a 3% reserve ratio is assessed on net transaction accounts up to and including $44.4 million; a 10% reserve ratio is applied above $44.4 million. The first $10.3 million of otherwise reservable balances are exempted from the reserve requirements. The amounts are adjusted annually. Chicopee Savings Bank complies with the foregoing requirements.
14
Table of Contents
Federal Home Loan Bank System. Chicopee Savings Bank is a member of the FHLB System, which consists of 12 regional Federal Home Loan Banks. The FHLB system provides a central credit facility primarily for member institutions. The Bank, as a member of the FHLB-Boston, is required to acquire and hold shares of capital stock in that FHLB. The Bank was in compliance with this requirement with an investment in FHLB-Boston stock at December 31, 2009 of $4.3 million.
The FHLBs are required to provide funds for the resolution of insolvent thrifts in the late 1980s and to contribute funds for affordable housing programs. These requirements could reduce the amount of dividends that the FHLBs pay to their members and could also result in the FHLBs imposing a higher rate of interest on advances to their members. If dividends were reduced, or interest on future FHLB-Boston advances increased, the Bank’s net interest income would likely also be reduced. On February 26, 2009, the FHLB-Boston’s board of directors (i) announced that they were suspending dividends for the remainder of 2009 and (ii) issued a moratorium of the redemption of FHLB-Boston stock. Further, there can be no assurance that the impact of recent or future legislation on the FHLBs also will not cause a decrease in the value of the FHLB-Boston stock held by the Bank.
Holding Company Regulation
Chicopee Bancorp is subject to examination, regulation, and periodic reporting under the Bank Holding Company Act of 1956, as amended, as administered by the Federal Reserve Board. Chicopee Bancorp is required to obtain the prior approval of the Federal Reserve Board to acquire all, or substantially all, of the assets of any bank or bank holding company. Prior Federal Reserve Board approval would be required for Chicopee Bancorp to acquire direct or indirect ownership or control of any voting securities of any bank or bank holding company if, after such acquisition, it would, directly or indirectly, own or control more than 5% of any class of voting shares of the bank or bank holding company. In addition to the approval of the Federal Reserve Board, before any bank acquisition can be completed, prior approval may also be required to be obtained from other agencies having supervisory jurisdiction over the bank to be acquired.
A bank holding company is generally prohibited from engaging in, or acquiring, direct or indirect control of more than 5% of the voting securities of any company engaged in non-banking activities. One of the principal exceptions to this prohibition is for activities found by the Federal Reserve Board to be so closely related to banking or managing or controlling banks as to be a proper incident thereto. Some of the principal activities that the Federal Reserve Board has determined by regulation to be so closely related to banking are: (i) making or servicing loans; (ii) performing certain data processing services; (iii) providing discount brokerage services; (iv) acting as fiduciary, investment or financial advisor; (v) leasing personal or real property; (vi) making investments in corporations or projects designed primarily to promote community welfare; and (vii) acquiring a savings and loan association.
The Gramm-Leach-Bliley Act of 1999 authorizes a bank holding company that meets specified conditions, including being “well capitalized” and “well managed,” to opt to become a “financial holding company” and thereby engage in a broader array of financial activities than previously permitted. Such activities can include insurance underwriting and investment banking.
Chicopee Bancorp is subject to the Federal Reserve Board’s capital adequacy guidelines for bank holding companies (on a consolidated basis) substantially similar to those of the FDIC for Chicopee Savings Bank.
A bank holding company is generally required to give the Federal Reserve Board prior written notice of any purchase or redemption of then outstanding equity securities if the gross consideration for the purchase or redemption, when combined with the net consideration paid for all such purchases or redemptions during the preceding 12 months, is equal to 10% or more of the company’s consolidated net worth. The Federal Reserve Board may disapprove such a purchase or redemption if it determines that the proposal would constitute an unsafe and unsound practice, or would violate any law, regulation, Federal Reserve Board order or directive, or any condition imposed by, or written agreement with, the Federal Reserve Board. The Federal Reserve Board has adopted an exception to this approval requirement for well-capitalized bank holding companies that meet certain other conditions.
The Federal Reserve Board has issued a policy statement regarding the payment of dividends by bank holding companies. In general, the Federal Reserve Board’s policies provide that dividends should be paid only out
15
Table of Contents
of current earnings and only if the prospective rate of earnings retention by the bank holding company appears consistent with the organization’s capital needs, asset quality and overall financial condition. The Federal Reserve Board’s policies also require that a bank holding company serve as a source of financial strength to its subsidiary banks by standing ready to use available resources to provide adequate capital funds to those banks during periods of financial stress or adversity and by maintaining the financial flexibility and capital-raising capacity to obtain additional resources for assisting its subsidiary banks where necessary. Under the prompt corrective action laws, the ability of a bank holding company to pay dividends may be restricted if a subsidiary bank becomes undercapitalized. These regulatory policies could affect the ability of Chicopee Bancorp to pay dividends or otherwise engage in capital distributions.
Under the Federal Deposit Insurance Act, depository institutions are liable to the FDIC for losses suffered or anticipated by the FDIC in connection with the default of a commonly controlled depository institution or any assistance provided by the FDIC to such an institution in danger of default. This law would have potential applicability if Chicopee Bancorp ever held as a separate subsidiary a depository institution in addition to Chicopee Savings Bank.
Chicopee Bancorp and Chicopee Savings Bank will be affected by the monetary and fiscal policies of various agencies of the United States Government, including the Federal Reserve System. In view of changing conditions in the national economy and in the money markets, it is impossible for management to accurately predict future changes in monetary policy or the effect of such changes on the business or financial condition of Chicopee Bancorp or Chicopee Savings Bank.
The status of Chicopee Bancorp as a registered bank holding company under the Bank Holding Company Act will not exempt it from certain federal and state laws and regulations applicable to corporations generally, including, without limitation, certain provisions of the federal securities laws.
Massachusetts Holding Company Regulation. Under the Massachusetts banking laws, a company owning or controlling two or more banking institutions, including a savings bank, is regulated as a bank holding company. The term “company” is defined by the Massachusetts banking laws similarly to the definition of “company” under the Bank Holding Company Act. Each Massachusetts bank holding company: (i) must obtain the approval of the Massachusetts Board of Bank Incorporation before engaging in certain transactions, such as the acquisition of more than 5% of the voting stock of another banking institution; (ii) must register, and file reports, with the Division; and (iii) is subject to examination by the Division. Chicopee Bancorp would become a Massachusetts bank holding company if it acquires a second banking institution and holds and operates it separately from Chicopee Savings Bank.
Federal Securities Laws. Our common stock is registered with the Securities and Exchange Commission under Section 12(b) of the Securities Exchange Act of 1934, as amended. We are subject to information, proxy solicitation, insider trading restrictions, and other requirements under the Exchange Act.
Executive Officers of the Registrant
| Name | Principal Position | |
| William J. Wagner | President and Chief Executive Officer of Chicopee Bancorp and Chicopee Savings Bank | |
| W. Guy Ormsby | Executive Vice President, Chief Financial Officer and Treasurer of Chicopee Bancorp and Executive Vice President and Treasurer of Chicopee Savings Bank | |
| Maria J.C. Aigner | Senior Vice President of Chicopee Bancorp and Senior Vice President, Human Resources, of Chicopee Savings Bank | |
| Alzira C. Costa | Senior Vice President of Chicopee Bancorp and Senior Vice President, Operations and Security, of Chicopee Savings Bank | |
| Russell J. Omer | Executive Vice President of Chicopee Bancorp and Executive Vice President, Lending, of Chicopee Savings Bank | |
16
Table of Contents
Below is information regarding our executive officers who are not also directors. Unless otherwise stated, each executive officer has held his or her position for at least the last five years. Ages presented are as of December 31, 2009.
Maria J.C. Aigner has served as Senior Vice President of Chicopee Bancorp since 2006 and Senior Vice President, Human Resources, of Chicopee Savings Bank since December 2004. Previously, Ms. Aigner served as Vice President, Human Resources. Ms. Aigner is the cousin of Alzira C. Costa, Senior Vice President, Operations and Security, of Chicopee Savings Bank. Age 54.
Alzira C. Costa has served as Senior Vice President of Chicopee Bancorp since 2006 and Senior Vice President, Operations and Security, of Chicopee Savings Bank since 1987. Ms. Costa is the cousin of Maria J.C. Aigner, Senior Vice President, Human Resources. Age 62.
Russell J. Omer has served as Executive Vice President of Chicopee Bancorp since December 2008, and Executive Vice President of Chicopee Bancorp since 2006, and Senior Vice President, Lending, since 1998. Age 59.
Our increased emphasis on commercial real estate and commercial business lending may expose us to increased lending risks. At December 31, 2009, our loan portfolio consisted of $126.1 million, or 29.5%, of commercial real estate loans and $68.5 million, or 16.0%, of commercial business loans. We have grown these loan portfolios in recent years and intend to continue to grow commercial real estate and commercial loans. These types of loans generally expose a lender to greater risk of non-payment and loss than one- to four-family residential mortgage loans because repayment of the loans often depends on the successful operation of the property and the income stream of the borrowers. Such loans typically involve larger loan balances to single borrowers or groups of related borrowers compared to one- to four-family residential mortgage loans. Commercial business loans expose us to additional risks since they typically are made on the basis of the borrower’s ability to make repayments from the cash flow of the borrower’s business and are secured by non-real estate collateral that may depreciate over time. In addition, since such loans generally entail greater risk than one- to four-family residential mortgage loans, we may need to increase our allowance for loan losses in the future to account for the likely increase in probable credit losses associated with the growth of such loans. Also, many of our commercial borrowers have more than one loan outstanding with us. Consequently, an adverse development with respect to one loan or one credit relationship can expose us to a significantly greater risk of loss compared to an adverse development with respect to a one- to four-family residential mortgage loan.
The United States economy remains weak and unemployment levels are high. The prolonged economic downturn will adversely affect our business and financial results. The United States experienced a severe economic recession in 2008 and 2009. While economic growth has resumed recently, the rate of growth has been slow and unemployment remains at very high levels and is not expected to improve in the near future. Loan portfolio quality has deteriorated at many financial institutions reflecting, in part, the weak U.S. economy and high unemployment. In addition, the values of real estate collateral supporting many commercial loans and home mortgages have declined and may continue to decline. The continuing real estate downturn also has resulted in reduced demand for the construction of new housing and increased delinquencies in construction, residential and commercial mortgage loans. Bank and bank holding company stock prices have declined substantially, and it is significantly more difficult for banks and bank holding companies to raise capital or borrow in the debt markets.
Continued negative developments in the financial services industry and the domestic and international credit markets may significantly affect the markets in which we do business, the market for and value of our loans and investments, and our ongoing operations, costs and profitability. Moreover, continued declines in the stock market in general, or stock values of financial institutions and their holding companies specifically, could adversely affect our stock performance.
A continued downturn in the local economy or a decline in real estate values could decrease our profits. Nearly all of our real estate loans are secured by real estate in Hampden County. As a result of this concentration, a continued downturn in the local economy could cause significant increases in non-performing loans, which would decrease our profits. Additionally, a decrease in asset quality could require additions to our allowance for loan losses through increased provisions for loan losses, which would hurt our profits. A continued decline in real estate values could cause some of our mortgage loans to become inadequately collateralized, which would expose us to a greater
17
Table of Contents
risk of loss. In addition, because we have a significant amount of commercial real estate loans, decreases in tenant occupancy may also have a negative effect on the ability of many of our borrowers to make timely repayments on their loans, which would have an adverse impact on our earnings.
The building of market share through our branching strategy could cause our expenses to increase faster than revenues. We intend to continue to build market share in Hampden County, Massachusetts through our branching strategy. In December 2008, we opened a new branch in South Hadley, Massachusetts, and in February 2009 we opened a new branch in Ware, Massachusetts. There are considerable costs involved in opening branches and new branches generally require a period of time to generate the necessary revenues to offset their costs, especially in areas in which we do not have an established presence. Accordingly, any new branch can be expected to negatively impact our earnings for some period of time until the branch reaches certain economies of scale. Our expenses could be further increased if we encounter delays in the opening of any of our new branches. Finally, we have no assurance our new branches will be successful even after they have been established.
Changes in interest rates could adversely affect our results of operations and financial condition. Our results of operations and financial condition are significantly affected by changes in interest rates. Our results of operations depend substantially on our net interest income, which is the difference between the interest income we earn on our interest-earning assets, such as loans and securities, and the interest expense we pay on our interest-bearing liabilities, such as deposits and borrowings. Because our interest-earning assets generally reprice or mature more quickly than our interest-bearing liabilities, an increase in interest rates generally would tend to result in an increase in net interest income.
Changes in interest rates may also affect the average life of loans and mortgage-related securities. Decreases in interest rates can result in increased prepayments of loans and mortgage-related securities, as borrowers refinance to reduce their borrowing costs. Under these circumstances, we are subject to reinvestment risk to the extent that we are unable to reinvest the cash received from such prepayments at rates that are comparable to the rates on existing loans and securities. Additionally, increases in interest rates may decrease loan demand and make it more difficult for borrowers to repay adjustable rate loans. Also, increases in interest rates may extend the life of fixed-rate assets, which would restrict our ability to reinvest in higher yielding alternatives, and may result in customers withdrawing certificates of deposit early so long as the early withdrawal penalty is less than the interest they could receive as a result of the higher interest rates.
Changes in interest rates also affect the current fair value of our interest-earning securities portfolio. Generally, the value of securities moves inversely with changes in interest rates.
Additionally, a majority of our single-family mortgage loans held for investment are adjustable-rate loans. Any rise in market interest rates may result in increased payments for borrowers who have adjustable rate mortgage loans, increasing the possibility of default.
For further discussion of how changes in interest rates could impact us, see “Management’s Discussion and Analysis of Financial Condition and Results of Operations—Risk Management—Interest Rate Risk Management.”
Future legislative or regulatory actions responding to perceived financial and market problems could impair our rights against borrowers. There have been proposals made by members of Congress and others that would reduce the amount distressed borrowers are otherwise contractually obligated to pay under their mortgage loans and limit an institution’s ability to foreclose on mortgage collateral. Were proposals such as these or other proposals limiting our rights as a creditor to be implemented, we could experience increased credit losses or increased expense in pursuing our remedies as a creditor.
If our allowance for loan losses is not sufficient to cover actual loan losses, our earnings will decrease. We make various assumptions and judgments about the collectability of our loan portfolio, including the creditworthiness of our borrowers and the value of the real estate and other assets serving as collateral for the repayment of many of our loans. In determining the amount of the allowance for loan losses, we review our loans and our loss and delinquency experience, and we evaluate economic conditions. If our assumptions are incorrect, our allowance for loan losses may not be sufficient to cover probable losses in our loan portfolio, resulting in additions to our allowance. While our allowance for loan losses was 0.95% of total loans at December 31, 2009, material additions to our allowance could materially decrease our net income. In addition, bank regulators periodically review our allowance for loan losses and may require us to increase our provision for loan losses or recognize further loan charge-offs. Any increase in our allowance for loan losses or loan charge-offs as required by these regulatory authorities might have a material adverse effect on our financial condition and results of operations.
18
Table of Contents
Any future FDIC insurance premium increases or special assessments will adversely affect our earnings. The FDIC has adopted a rule that will require us to prepay insurance premiums. As part of a plan to restore the reserve ratio of the Deposit Insurance Fund, the FDIC imposed a special assessment equal to five basis points of assets less Tier 1 capital as of June 30, 2009, which was payable on September 30, 2009. We recorded an expense of $229,000 during the quarter ended June 30, 2009, to reflect the special assessment. The FDIC has also increased its maximum quarterly assessment rates and amended the method by which rates are calculated. Quarterly assessments paid by Chicopee Savings Bank for 2009 equaled $539,000, compared to $47,000 for 2008. Any further special assessments or increases to quarterly assessment rates will adversely affect our earnings.
In addition, in November 2009 the FDIC adopted a rule requiring insured depository institutions to prepay, on December 30, 2009, their estimated quarterly risk-based assessments for the fourth quarter of 2009, and for all of 2010, 2011, and 2012. On December 30, 2009, Chicopee Savings Bank prepaid approximately $1.9 million in estimated quarterly assessment fees for the fourth quarter of 2009 through the fourth quarter of 2012. Because the prepaid assessments represent the prepayment of future expense, they do not affect Chicopee Savings Bank’s capital or tax obligations. For further discussion of how changes in interest rates could impact us, see “—Federal Regulations—Insurance of Deposit Accounts.”
Strong competition within our market area could hurt our profits and slow growth. We face intense competition both in making loans and attracting deposits. This competition has made it more difficult for us to make new loans and attract deposits. Price competition for loans and deposits might result in us earning less on our loans and paying more on our deposits, which reduces net interest income. As of June 30, 2009, we held 4.75% of the deposits in Hampden County, which was the 10th largest market share of deposits out of the 21 financial institutions in the county. This data does not include deposits held by one of our primary competitors, credit unions, which, as tax-exempt organizations, are able to offer higher rates on retail deposits than banks. There are 18 credit unions headquartered in Hampden County, some of the larger of which are headquartered in Chicopee, Massachusetts. Some of the institutions with which we compete have substantially greater resources and lending limits than we have and may offer services that we do not provide. We expect competition to increase in the future as a result of legislative, regulatory and technological changes and the continuing trend of consolidation in the financial services industry. Our profitability depends upon our continued ability to compete successfully in our market area.
Our low return on equity may negatively affect our stock price. Net income divided by average equity, known as “return on equity,” is a ratio many investors use to compare the performance of a financial institution to its peers. Our return on equity was reduced due to the large amount of capital that we raised in our 2006 stock offering and to expenses we will incur in pursuing our growth strategies, the costs of being a public company and added expenses associated with our employee stock ownership plan and equity incentive plan. Until we can increase our net interest income and non-interest income, we expect our return on equity to be below that of our peers, which may negatively affect the value of our common stock. For the twelve months ended December 31, 2009, our return on equity was -1.69%.
If dividends paid on our investment in the Federal Home Loan Bank of Boston continue to be suspended our earnings could decrease. We own common stock of the Federal Home Loan Bank of Boston (“FHLB-Boston”) to qualify for membership in the Federal Home Loan Bank System and to be eligible to borrow funds under the FHLB-Boston’s advance program. There is no market for our FHLB-Boston common stock, and the FHLB-Boston announced a moratorium on redemptions of such stock in the first quarter of 2009.
As a result of losses, the FHLB-Boston has not paid a dividend since the fourth quarter of 2008, which has decreased our earnings. In addition, future dividend levels paid by the FHLB-Boston, if paid at all, may be different from past levels, and a reduction or elimination of this dividend would reduce our earnings.
Our contribution to Chicopee Savings Charitable Foundation may not be fully tax deductible, which could decrease our profits. We made a contribution to the Chicopee Savings Charitable Foundation (“the Foundation”); valued at $5.5 million, pre-tax, at the time of our initial public offering. The Internal Revenue Service has granted tax-exempt status to the Foundation. The amount of the tax deduction related to the Foundation is limited to 10% of taxable income each year, but can be carried forward until 2011. We may not have sufficient income to be able to fully deduct the contribution. As a result of our analysis of whether it is “more likely than not” we will be unable to fully deduct the contribution; we have established a valuation allowance of $1.7 million. At December 31, 2009, our contribution carryforward, net of the related allowance is $96,000.
19
Table of Contents
Item 1B. Unresolved Staff Comments.
Not applicable.
We conduct our business through our main office in Chicopee, Massachusetts, eight full service branch offices and our lending and operation center. Of our nine locations, we own six and lease three of the buildings. We also own the land for the five of the six buildings we own. For one of our branches we own the building and lease the land. The net book value of our land, buildings, and improvements was $9.2 million at December 31, 2009. The following table sets forth ownership and lease information for the Company’s offices as of December 31, 2009:
| Location |
Year Opened | Lease Expires | ||||||
| Owned | ||||||||
| Main Office: | ||||||||
| 70 Center Street Chicopee, MA 01013 |
1973 | |||||||
| Branch Offices: | ||||||||
| 39 Morgan Road West Springfield, MA 01089 |
2005 | |||||||
| 569 East Street Chicopee, MA 01020 |
1976 | |||||||
| 435 Burnett Road Chicopee, MA 01020 |
1990 | |||||||
| 219/229 Exchange Street Chicopee, MA 01013 |
2009/1998 | |||||||
| Leased | ||||||||
| 599 Memorial Drive Chicopee, MA 01020 |
1977 | 2012 (1) | ||||||
| 477A Center Street Ludlow, MA 01056 |
2002 | 2022 | ||||||
| 350 Palmer Road Ware, MA 01082 |
2009 | 2027 | ||||||
| 32 Williamansett Street South Hadley, MA 01075 |
2008 | 2027 (2) | ||||||
| (1) | Chicopee Savings Bank has an option to renew for five years. |
| (2) | The lease is for the land only, the building is owned by Chicopee Savings Bank. |
20
Table of Contents
Periodically, we are involved in routine litigation incidental to our business, such as claims to enforce liens and contracts, condemnation proceedings on properties in which we hold security interests, claims involving the making and servicing of real property loans and other issues incident to our business. We are not a party to any pending legal proceedings that we believe would have a material adverse effect on our financial condition, results of operations or cash flows.
PART II
Item 5. Market for the Registrant’s Common Equity, Related Stockholder Matters and Issuer Purchases of Equity Securities.
On July 20, 2006, Chicopee Bancorp, Inc. common stock commenced trading on the Nasdaq Global Market (“Nasdaq”). Our common stock is listed on the Nasdaq under the symbol “CBNK.” The following table sets forth the high and low closing prices of the common stock for the years ended December 31, 2009 and 2008, as reported by NASDAQ. The Company did not pay any dividend to shareholders during the years ended December 31, 2009 and 2008.
21
Table of Contents
| High | Low | High | Low | |||||||||||
| 2009 |
2008 |
|||||||||||||
| First Quarter |
$ | 11.90 | $ | 10.16 | First Quarter | $ | 13.21 | $ | 13.21 | |||||
| Second Quarter |
13.53 | 11.75 | Second Quarter | 12.85 | 12.75 | |||||||||
| Third Quarter |
13.67 | 12.74 | Third Quarter | 13.49 | 13.11 | |||||||||
| Fourth Quarter |
13.57 | 12.11 | Fourth Quarter | 11.95 | 11.65 | |||||||||
Chicopee Bancorp’s ability to pay dividends is dependent on dividends received from Chicopee Savings Bank. For a discussion of restrictions on the payment of cash dividends by Chicopee Savings Bank, see “Business—Regulation and Supervision—Massachusetts Banking Laws and Supervision—Dividends” in this Annual Report on Form 10-K.
Stock Performance Graph
The following graph compares the cumulative total shareholder return on Chicopee Bancorp common stock with the cumulative total return on the Nasdaq Index (U.S. Companies) and with the SNL Thrift <$500M Index. The graph assumes $100 was invested at the close of business on July 20, 2006.
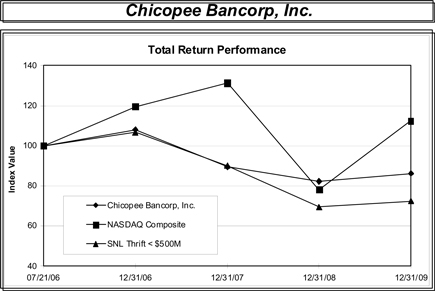
| Period Ending | ||||||||||
| Index |
07/21/06 | 12/31/06 | 12/31/07 | 12/31/08 | 12/31/09 | |||||
| Chicopee Bancorp, Inc. |
100.00 | 108.08 | 89.43 | 82.18 | 86.19 | |||||
| NASDAQ Composite |
100.00 | 119.55 | 131.28 | 78.06 | 112.31 | |||||
| SNL Thrift < $500M |
100.00 | 106.65 | 90.08 | 69.42 | 72.31 | |||||
| (a) | As of March 3, 2010, the Company had approximately 749 registered holders of record of the Company’s common stock. |
22
Table of Contents
The following table provides information regarding the Company’s purchase of its equity securities during the three months ended December 31, 2009.
| Period |
(a) Total Number of Shares (or Units) Purchased |
(b) Average Price Paid Per Share (or Unit) |
(c) Total Number of Shares (or Units) Purchased as Part of Publicly Announced Plans or Programs (1) |
(d) Maximum Number (or Approximate Dollar Value) of Shares (or Units) that May Yet Be Purchased Under the Plans or Programs | |||||
| October 1 -31, 2009 |
— | $ | — | 324,780 | 10,220 | ||||
| November 1-30, 2009 |
10,220 | 13.00 | 335,000 | — | |||||
| December 1 -31, 2009 |
— | — | 335,000 | — | |||||
| Total |
10,220 | $ | 13.00 | 335,000 | |||||
| (1) | On August 8, 2008 the Company announced that its Board of Directors authorized a stock repurchase program (the “Stock Repurchase Program”) for the purchase of up to 335,000 shares of the Company’s common stock or approximately 5% of its outstanding common stock. On November 25, 2009, the Company completed the stock repurchase program. |
23
Table of Contents
Item 6. Selected Financial Data.
We have derived the following selected consolidated financial and other data of the Company in part from our consolidated financial statements and notes appearing elsewhere in this Form 10-K.
| At December 31 | |||||||||||||||||
| 2009 | 2008 | 2007 | 2006 | 2005 | |||||||||||||
| (In Thousands) | |||||||||||||||||
| Selected Financial Data: |
|||||||||||||||||
| Total assets |
$ | 544,150 | $ | 527,699 | $ | 463,456 | $ | 450,045 | $ | 391,349 | |||||||
| Cash and cash equivalents |
20,075 | 23,100 | 23,521 | 11,528 | 17,586 | ||||||||||||
| Loans, net |
424,655 | 416,076 | 379,868 | 368,968 | 315,649 | ||||||||||||
| Securities available-for-sale |
503 | 5,268 | 7,864 | 7,861 | 4,934 | ||||||||||||
| Securities held-to-maturity |
62,983 | 49,662 | 27,324 | 37,411 | 29,472 | ||||||||||||
| Deposits |
365,498 | 334,767 | 324,971 | 311,571 | 295,023 | ||||||||||||
| Advances from the Federal Home Loan Bank |
63,675 | 76,567 | 17,774 | 15,256 | 29,417 | ||||||||||||
| Total stockholders’ equity |
94,172 | 94,017 | 104,299 | 108,446 | 43,441 | ||||||||||||
| Nonperforming assets |
4,924 | 3,185 | 1,014 | 1,711 | 736 | ||||||||||||
|
For the Years Ended December 31, | |||||||||||||||||
| 2009 | 2008 | 2007 | 2006 | 2005 | |||||||||||||
| (In Thousands) | |||||||||||||||||
| Selected Operating Data: |
|||||||||||||||||
| Interest and dividend income |
$ | 24,488 | $ | 25,783 | $ | 26,305 | $ | 22,759 | $ | 18,832 | |||||||
| Interest expense |
9,107 | 11,189 | 11,783 | 9,207 | 6,930 | ||||||||||||
| Net interest and dividend income |
15,381 | 14,594 | 14,522 | 13,552 | 11,902 | ||||||||||||
| Provision for loan losses |
897 | 315 | 223 | 440 | 120 | ||||||||||||
| Net interest income after provision for loan losses |
14,484 | 14,279 | 14,299 | 13,112 | 11,782 | ||||||||||||
| Non-interest income |
2,715 | 2,001 | 2,521 | 1,631 | 1,492 | ||||||||||||
| Non-interest expense |
19,422 | 15,882 | 14,202 | 17,854 | 11,087 | ||||||||||||
| Income (loss) before provision for income taxes |
(2,223 | ) | 398 | 2,618 | (3,111 | ) | 2,187 | ||||||||||
| Income tax (benefit) expense |
(627 | ) | 376 | 1,018 | (577 | ) | 771 | ||||||||||
| Net income (loss) |
$ | (1,596 | ) | $ | 22 | $ | 1,600 | $ | (2,534 | ) | $ | 1,416 | |||||
| Earnings (loss) per share |
$ | (0.28 | ) | $ | 0.00 | $ | 0.24 | $ | (0.37 | ) | n/a | ||||||
24
Table of Contents
| At or For the Years Ended December 31, | |||||||||||||||
| 2009 | 2008 | 2007 | 2006 | 2005 | |||||||||||
| Selected Operating Ratios and Other Data: |
|||||||||||||||
| Performance Ratios: |
|||||||||||||||
| Average yield on interest-earning assets (1) |
5.03 | % | 5.53 | % | 6.13 | % | 5.85 | % | 5.47 | % | |||||
| Average rate paid on interest-bearing liabilities |
2.26 | % | 3.02 | % | 3.63 | % | 2.96 | % | 2.29 | % | |||||
| Average interest rate spread (2) |
2.77 | % | 2.51 | % | 2.50 | % | 2.89 | % | 3.18 | % | |||||
| Net interest margin (3) |
3.17 | % | 3.15 | % | 3.40 | % | 3.49 | % | 3.47 | % | |||||
| Ratio of interest-earning assets to interest-bearing liabilities |
121.58 | % | 126.71 | % | 132.66 | % | 125.29 | % | 113.98 | % | |||||
| Non-interest expenses as a percent of average assets |
3.65 | % | 3.20 | % | 3.10 | % | 4.28 | % | 2.99 | % | |||||
| Return on average assets |
(0.30 | )% | 0.00 | % | 0.35 | % | (0.61 | )% | 0.38 | % | |||||
| Return on average equity |
(1.69 | )% | 0.02 | % | 1.48 | % | (3.57 | )% | 3.30 | % | |||||
| Ratio of average equity to average assets |
17.76 | % | 19.85 | % | 23.57 | % | 17.02 | % | 11.58 | % | |||||
| Efficiency ratio (4) |
110.74 | % | 94.42 | % | 87.01 | % | 117.18 | % | 82.43 | % | |||||
| Regulatory Capital Ratios: |
|||||||||||||||
| Total capital to risk-weighted assets |
23.40 | % | 23.60 | % | 28.60 | % | 28.70 | % | 13.83 | % | |||||
| Tier 1 capital to risk-weighted assets |
22.40 | % | 22.80 | % | 27.70 | % | 27.83 | % | 13.03 | % | |||||
| Tier 1 capital to average assets |
17.40 | % | 18.40 | % | 22.70 | % | 24.35 | % | 11.27 | % | |||||
| Asset Quality Ratios: |
|||||||||||||||
| Nonperforming loans as a percent of total loans |
1.13 | % | 0.69 | % | 0.27 | % | 0.46 | % | 0.23 | % | |||||
| Nonperforming assets as a percent of total assets |
0.90 | % | 0.60 | % | 0.22 | % | 0.38 | % | 0.19 | % | |||||
| Allowance for loan losses as a percent of total loans |
0.95 | % | 0.79 | % | 0.80 | % | 0.78 | % | 0.82 | % | |||||
| Allowance for loan losses as a percent of nonperforming loans and troubled debt restructurings |
84.17 | % | 114.30 | % | 303.35 | % | 169.96 | % | 353.94 | % | |||||
| Net loans charged-off to average interest-earning loans |
0.04 | % | 0.01 | % | 0.01 | % | 0.04 | % | 0.01 | % | |||||
| Other Data: |
|||||||||||||||
| Banking offices at end of period |
9 | 8 | 7 | 7 | 7 | ||||||||||
| (1) | Municipal securities income and net interest income are presented on a tax equivalent basis using a tax rate of 41%. The tax equivalent adjustment is deducted from the tax equivalent net interest income to agree to the amount reported on the income statement. |
| (2) | Tax equivalent net interest rate spread represents the difference between the weighted average yield on interest-earning assets and the weighted average cost of interest-bearing liabilities. |
| (3) | Tax equivalent net interest margin represents tax equivalent net interest income divided by total average interest-earning assets. |
| (4) | The efficiency ratio represents the ratio of non-interest expenses divided by the sum of tax equivalent net interest income and non-interest income. This ratio excludes gains (losses) on sales of investment securities, property, loans and other, net. At December 31, 2009 the ratio is calculated as follows (in thousands): |
| Non-interest expenses |
$ | 19,422 | ||
| Tax equivalent net interest income |
$ | 15,565 | ||
| Non-interest income |
2,715 | |||
| Add back: |
||||
| Loan sales and servicing, net |
(629 | ) | ||
| Net (loss) gain on sales of securities available-for-sale |
(141 | ) | ||
| Loss on sale of Other real estate owned |
28 | |||
| Total income included in calculation |
$ | 17,538 | ||
| Non-interest expenses divided by Total income |
110.74 | % | ||
25
Table of Contents
Item 7. Management’s Discussion and Analysis of Financial Condition and Results of Operations.
The following discussion should be read in conjunction with the “Selected Financial Data” and the Company’s Consolidated Financial Statements and notes thereto, each appearing elsewhere in this Annual Report on Form 10-K.
Forward-Looking Statements
This Annual Report on Form 10-K contains certain forward-looking statements within the meaning of Section 27A of the Securities Act of 1933, as amended, and Section 21E of the Securities Exchange Act of 1934, as amended. The Company intends such forward-looking statements to be covered by the safe harbor provisions for forward-looking statements contained in the Private Securities Litigation Reform Act of 1995, and is including this statement for purposes of these safe harbor provisions. Forward-looking statements, which are based on certain assumptions and describe future plans, strategies and expectations of the Company, are generally identified by use of the words “believe,” “expect,” “intend,” “anticipate,” “estimate,” “project,” or similar expressions. The Company’s ability to predict results or the actual effect of future plans or strategies is inherently uncertain.
By identifying these forward-looking statements for you in this manner, we are alerting you to the possibility that our actual results and financial condition may differ, possibly materially, from the anticipated results and financial condition indicated in these forward-looking statements. Important factors that could cause our actual results and financial condition to differ from those indicated in the forward-looking statements include, among others, those discussed under “Risk Factors” in Part I, Item 1A of this Annual Report on Form 10-K. In addition to these risk factors, there are other factors that may impact any public company, including ours, which could have a material adverse effect on the operations and future prospects of the Company and its subsidiaries. These additional factors include, but are not limited to: (1) changes in consumer spending, borrowing and savings habits; (2) the financial health of certain entities, including government sponsored enterprises, the securities of which are owned or acquired by the Company; (3) adverse changes in the securities market; and (4) the costs, effects and outcomes of existing of future litigation. These risks and uncertainties should be considered in evaluating forward-looking statements and undue reliance should not be placed on such statements.
Overview
Income. Our primary source of pre-tax income is net interest income. Net interest income is the difference between interest income, which is the income that we earn on our loans and securities, and interest expense, which is the interest that we pay on our deposits and borrowings. Other significant sources of pre-tax income are service charges fees and commissions, which include service charges on deposit accounts, brokerage fee income and other loan fees (including loan brokerage fees and late charges), income from bank-owned life insurance and income from loan sales and servicing. In addition, we recognize income or losses from the sale of securities available for sale in years that we have such sales.
Allowance for Loan Losses. The allowance for loan losses is a valuation allowance to cover the inherent probable losses in the loan portfolio. Loan losses are charged against the allowance when management believes the uncollectibility of a loan balance is confirmed. Subsequent recoveries, if any, are credited to the allowance. Management estimates the allowance balance required using past loan loss experience, information about specific borrower situations, estimated collateral values, economic conditions, and other factors. Allocation of the allowance may be made for specific loans, but the entire allowance is available for any loan that, in management’s judgment, should be charged off.
Expenses. The non-interest expenses we incur in operating our business consist of salaries and employee benefits expenses, occupancy expenses, furniture and equipment expenses, data processing expenses and various other miscellaneous expenses.
26
Table of Contents
Critical Accounting Policies
We consider accounting policies involving significant judgments and assumptions by management that have, or could have, a material impact on the carrying value of certain assets or on income to be critical accounting policies. We consider the following to be our critical accounting policies:
Allowance for Loan Losses. The allowance for loan losses is the amount estimated by management as necessary to cover probable credit losses inherent in the loan portfolio at the balance sheet date. The allowance is established through the provision for loan losses, which is charged to income. Determining the amount of the allowance for loan losses necessarily involves a high degree of judgment. Among the material estimates required to establish the allowance are: loss exposure at default; the amount and timing of future cash flows on impaired loans; value of collateral; and determination of loss factors to be applied to the various elements of the portfolio. All of these estimates are susceptible to significant change. Management reviews the level of the allowance on a monthly basis and establishes the provision for loan losses based upon an evaluation of the portfolio, past loss experience, current economic conditions and other factors related to the collectability of the loan portfolio. A loan is considered impaired when, based on current information and events, it is probable that we will be unable to collect the scheduled payments of principal or interest when due according to the contractual terms of the loan agreement. Factors considered by management in determining impairment include payment status, collateral value, and the probability of collecting scheduled principal and interest payments when due. Loans that experience insignificant payment delays and payment shortfalls generally are not classified as impaired. Management determines the significance of payment delays and payment shortfalls on a case-by-case basis, taking into consideration all of the circumstances surrounding the loans and the borrower, including the length of the delay, the reasons for the delay, the borrower’s prior payment record, and the amount of the shortfall in relation to the principal and interest owed. Impairment is measured on a loan-by-loan basis for commercial loans by either the present value of expected future cash flows discounted at the loan’s effective interest rate, the loan’s obtainable market price, or the fair value of the collateral if the loan is collateral dependent.
Large groups of smaller balance homogeneous loans are collectively evaluated for impairment. Accordingly, we do not separately identify individual consumer and residential loans for impairment evaluation.
Although we believe that we use the best information available to establish the allowance for loan losses, future adjustments to the allowance may be necessary if economic conditions differ substantially from the assumptions used in making the evaluation. In addition, our banking regulators, as an integral part of their examination process, periodically review our allowance for loan losses. Such agencies may require us to recognize adjustments to the allowance based on its judgments about information available to it at the time of its examination. A large loss could deplete the allowance and require increased provisions to replenish the allowance, which would negatively affect earnings.
Deferred Income Taxes. We use the asset and liability method of accounting for income taxes as prescribed in “Accounting for Income Taxes”. Under this method, deferred tax assets and liabilities are recognized for the future tax consequences attributable to differences between the financial statement carrying amounts of existing assets and liabilities and their respective tax bases. If current available information raises doubt as to the realization of the deferred tax assets, a valuation allowance is established. Deferred tax assets and liabilities are measured using enacted tax rates expected to apply to taxable income in the years in which those temporary differences are expected to be recovered or settled. We exercise significant judgment in evaluating the amount and timing of recognition of the resulting tax liabilities and assets. These judgments require us to make projections of future taxable income. The judgments and estimates we make in determining our deferred tax assets, which are inherently subjective, are reviewed on a continual basis as regulatory and business factors change. Any reduction in estimated future taxable income may require us to record a valuation allowance against our deferred tax assets. A valuation allowance would result in additional income tax expense in the period, which would negatively affect earnings.
Mortgage Servicing Rights. Mortgage servicing rights associated with loans originated and sold, where servicing is retained, are capitalized and included in other assets in the consolidated balance sheet. Mortgage servicing rights are amortized into non-interest income in proportion to, and over the period of, estimated future net servicing income of the underlying financial assets. Mortgage servicing rights are evaluated for impairment based upon the fair value of the rights as compared to amortized cost. The value of the capitalized servicing rights represents the present value of the future servicing fees arising from the right to service loans in the portfolio. Critical accounting policies for mortgage servicing rights relate to the initial valuation and subsequent impairment tests. The methodology used to determine the valuation of mortgage servicing rights requires the development and use of a number of estimates, including anticipated principal amortization and prepayments of that principal balance. Events that may significantly affect the estimates used are changes in interest rates, mortgage loan prepayment
27
Table of Contents
speeds and the payment performance of the underlying loans. The carrying value of the mortgage servicing rights is periodically reviewed for impairment based on a determination of fair value. Impairment, if any, is recognized through a valuation allowance and is recorded as a component of non-interest expense.
Other-Than-Temporary Impairment. “Accounting for Certain Investments in Debt and Equity Securities,” “The Meaning of Other-Than-Temporary Impairment and Its Application to Certain Benefits,” and “Noncurrent Marketable Equity Securities,” require companies to perform periodic reviews of individual securities in their investment portfolios to determine whether decline in the value of a security is other than temporary. A review of other-than-temporary impairment requires companies to make certain judgments regarding the materiality of the decline, its effect on the financial statements and the probability, extent and timing of a valuation recovery and the company’s intent and ability to hold the security. Pursuant to these requirements, we assess valuation declines to determine the extent to which such changes are attributable to (1) fundamental factors specific to the issuer, such as financial condition, business prospects or other factors or (2) market-related factors, such as interest rates or equity market declines. Declines in the fair value of securities below their costs that are deemed to be other than temporary are recorded in earnings as realized losses. For declines in the fair value of individual debt securities available-for-sale below their cost that are deemed to be other-than-temporary, where the Company does not intend to sell the security and it is more likely than not that the Company will not be required to sell the security before recovery of its amortized cost basis, the other-than-temporary decline in the fair value of the debt security related to 1) credit loss is recognized in earnings and 2) other factors is recognized in other comprehensive income or loss. Credit loss is determined to exist if the present value of expected future cash flows using the effective rate at acquisition is less than the amortized cost basis of the debt security. For individual debt securities where the Company intends to sell the security or more likely than not will be required to sell the security before recovery of its amortized cost, the other-than-temporary impairment is recognized in earnings equal to the difference between the security’s cost basis and its fair value at the balance sheet date. Gains and losses on the sale of securities are recorded on the trade date and are determined using the specific identification method.
Operating Strategy
Our mission is to operate and grow a profitable community-oriented financial institution serving primarily retail customers and businesses in our market areas. We plan to continue our strategy of:
| • | expanding our branch network and market area and upgrading our existing branches; |
| • | continuing to increase our commercial and construction relationships in our expanding market area; |
| • | increasing our deposit market share in our expanding market area; |
| • | continuing to increase our sale of non-deposit investment products; |
| • | improving operating efficiency and cost control; and |
| • | applying disciplined underwriting practices to maintain the high quality of our loan portfolio. |
Expanding our branch network and market area and upgrading our existing branches as earnings permit. From our formation in 1845 until 2002, we operated solely out of our offices located in Chicopee, Massachusetts and focused our lending in Chicopee and the surrounding area. Recently, our management began to implement a growth strategy that expanded our presence into additional communities contiguous to Chicopee. In 2002, we opened a branch to the east of Chicopee in Ludlow, and in 2005 we opened a branch to the west of Chicopee in West Springfield. As a result of our efforts to expand our presence, at December 31, 2009, most of our loan portfolio was secured by property within Chicopee and its contiguous communities.
We intend to continue our geographic expansion outside of Chicopee by opening branches in communities contiguous to those currently served by Chicopee Savings Bank if market conditions are favorable. In December 2008, we opened a full-service branch in South Hadley, Massachusetts, and in February 2009, we opened a full-service branch in Ware, Massachusetts.
28
Table of Contents
Continuing to increase our commercial relationships in our expanding market area. Since 1999 we have worked to increase our commercial relationships by diversifying our loan portfolio beyond residential mortgage loans and offering business deposit and checking products. In particular, since December 31, 2007, our commercial real estate and commercial business portfolio has increased $45.8 million, or 30.7%, and at December 31, 2009 was 45.5% of our total loan portfolio. During this period, we have taken advantage of the significant growth in both residential and commercial real estate development in our market area. In addition, since December 31, 2007, our securities sold under agreements to repurchase, which are sweep accounts primarily for commercial customers, increased $6.2 million, or 44.0%, and at December 31, 2009 and were 3.7% of total assets. Business deposit and checking accounts increased from $27.0 million at December 31, 2007 to $43.4 million at December 31, 2009, an increase of 60.9%. Finally, since 2007, we have also increased the number of our commercial lenders and commercial lending support staff.
Increasing our deposit market share in our expanding market area. Retail deposits are our primary source of funds for investing and lending. By offering a variety of deposit products, special and tiered pricing, and superior customer service, we will seek to retain and expand existing customer relationships as well as attract new deposit customers. Personalized service and flexibility with regard to customer needs will continue to be augmented with a full array of delivery channels to maximize customer convenience. These include drive-up banking, ATMs, internet banking, automated bill payment, remote capture, and telephone banking. Through our continued focus on these deposit-gathering efforts in existing branch locations, couple with our plans for geographic expansion, we expect to increase the overall level of deposits and our market share in the markets we serve.
In addition, historically, one of our primary competitors for retail deposits in the Chicopee market area has been credit unions. Credit unions are formidable competitors since, as tax-exempt organizations, they are able to offer higher rates on retail deposits than banks. By expanding our market area beyond the immediate Chicopee market area, and beyond the market areas of our larger credit union competitors, we intend to increase our overall deposit market share of Hampden County.
Continuing to increase our sale of non-deposit investment products. Our profits rely heavily on the spread between the interest earned on loans and securities and interest paid on deposits and borrowings. In order to decrease our reliance on interest rate spread income we have pursued initiatives to increase non-interest income. We offer non-deposit investment products, including mutual funds, annuities, pension plans, life insurance, long-term care and 529 college savings plans through a third party registered broker-dealer, Linsco/Private Ledger. This initiative generated $142,000, $396,000 and $356,000 of non-interest income during the years ended December 31, 2009, 2008 and 2007, respectively. In connection with our expanding branch network, we intend to continue to increase our sale of non-deposit investment products by engaging one additional retail investment employee to serve customers of our anticipated branch expansion.
Improving operating efficiency. Our ratio of non-interest expense to average total assets increased to 3.65% in 2009 from 3.20% 2008. The increase in expenses in 2009 was largely impacted by an other-than-temporary impairment charge of $1.4 million and increase in FDIC insurance premium fees of $492,000, which includes the FDIC special assessment of $229,000 paid in the second quarter of 2009. We recognize that our growth strategies have required greater investments in personnel, marketing, premises and equipment, and these investments have had a negative impact on our expense ratios over the short term. In addition, we have had an increase in operating expenses as a result of our public company status, including costs associated with the internal control requirements under Section 404 of the Sarbanes-Oxley Act of 2002, which have required us to perform a more in-depth review of our internal control procedures. Increased operating expenses due to our Equity Incentive Plan, initiated in 2007, have also had a significant impact on our expense ratios. We also have had higher costs for auditing, accounting, legal and other miscellaneous holding company expenses as a result of being a public company. We will continue our efforts to monitor costs throughout the organization, and over the long term, as our assets grow, we will attempt to lower our ratio of non-interest expense to total average assets.
Applying disciplined underwriting practices to maintain the high quality of our loan portfolio. We believe that high asset quality is a key to long-term financial success. We have sought to grow and diversify the loan portfolio, while maintaining a high level of asset quality and moderate credit risk, using underwriting standards that we believe are conservative and diligent monitoring and collection efforts. At December 31, 2009, our nonperforming loans (loans which are 90 or more days delinquent) were 1.13% of our total loan portfolio. Although we intend to continue our efforts to originate commercial real estate, commercial business and construction loans, we intend to continue our philosophy of managing large loan exposures through our conservative approach to lending.
29
Table of Contents
Balance Sheet Analysis
Comparison of Financial Condition at December 31, 2009 and December 31, 2008
Total assets increased $16.5 million, or 3.1%, to $544.2 million at December 31, 2009, from $527.7 million at December 31, 2008. The growth in assets was primarily attributable to an increase in net loans of $8.6 million and held-to-maturity securities of $8.6 million. Net loans increased to $424.7 million at December 31, 2009, from $416.1 million at December 31, 2008, primarily reflecting origination volume totaling $147.0 million in 2009. The Company’s level of loan originations was largely due to the decreasing interest rate environment. These factors were somewhat offset by normal amortization totaling approximately $21.4 million and the sale of $37.0 million of loans to FHLMC in the secondary market to reduce interest rate risk. Loan payoffs and construction advances and line of credit pay downs also offset 2009 loan originations. The Company will continue to evaluate the sale of fixed rate low coupon real estate loans in 2010.
Asset growth was funded primarily through increased deposit balances of $30.7 million. Total deposits grew to $365.5 million at December 31, 2009 compared to $334.8 million at December 31, 2008, reflecting increases in money market accounts of $7.7 million, or 16.2%, and demand and NOW accounts of $15.6 million, or 34.2%. The growth in deposits was mainly attributable to the increase in commercial relationships.
Total stockholders’ equity increased $155,000, or 0.2%, to $94.2 million at December 31, 2009 from $94.0 million at December 31, 2008. The increase was mainly due to the decrease in unearned compensation and additional paid-in-capital of $1.7 million, and decrease in unrealized losses associated with equities of $1.5 million offset by the purchase of 117,723 shares in 2009 of the Company’s common stock through the Company’s stock repurchase program, at a cost of $1.5 million for the year, and a net loss of $1.6 million for the period. The Company’s book value per share increased 2.0% to $14.76 at December 31, 2009 compared to $14.47 at December 31, 2008.
Loans. Our primary lending activity is the origination of loans secured by real estate. We originate one- to four-family residential loans, commercial real estate loans and commercial business loans. To a lesser extent, we originate multi-family, construction and consumer loans.
The size of our one- to four-family residential loan portfolio has decreased during 2009, from $164.8 million to $150.3 million, primarily due to prepayments and refinancing activity attributed to the decline in interest rates to historically low levels. In accordance with the Company’s asset/liability management strategy and in an effort to reduce interest rate risk, the Company sold $37.0 million fixed rate, low coupon residential real estate loans originated in 2009 to the secondary market. Servicing rights will continue to be retained on all loans written and sold in the secondary market.
Our commercial real estate and multi-family portfolio increased during 2009, from $126.4 million to $136.9 million as a result of new commercial loan relationships established in 2009.
Commercial business loans increased during 2009, from $54.3 million to $68.5 million as a result of new commercial relationships, due to increased marketing efforts and offering a wider variety of services for commercial borrowers, including cash management products.
Our construction loan portfolio decreased during 2009, from $41.6 million to $38.3 million. Commercial construction decreased by $4.1 million from $33.2 million to $29.1 million as projects were completed and sold, offset by an increase in residential construction.
Growth in the consumer and home equity loan portfolio of $2.5 million, from $31.2 million to $33.7 million is primarily attributable to increased marketing activities and competitive pricing on our home equity products.
30
Table of Contents
Loan Portfolio Composition. The following table sets forth the composition of the Company’s loan portfolio in dollar amounts and as a percentage of the respective portfolio at the dates indicated.
| At December 31, | |||||||||||||||||||||||||||||||||||
| 2009 | 2008 | 2007 | 2006 | 2005 | |||||||||||||||||||||||||||||||
| Amount | Percent of Total |
Amount | Percent of Total |
Amount | Percent of Total |
Amount | Percent of Total |
Amount | Percent of Total |
||||||||||||||||||||||||||
| (Dollars In Thousands) | |||||||||||||||||||||||||||||||||||
| Real estate loans: |
|||||||||||||||||||||||||||||||||||
| One- to four-family |
$ | 150,311 | 35.14 | % | $ | 164,781 | 39.38 | % | $ | 154,170 | 40.35 | % | $ | 143,818 | 38.77 | % | $ | 132,417 | 41.75 | % | |||||||||||||||
| Multi-family |
10,790 | 2.52 | % | 11,459 | 2.74 | % | 11,674 | 3.06 | % | 11,447 | 3.09 | % | 11,142 | 3.51 | % | ||||||||||||||||||||
| Commercial |
126,090 | 29.48 | % | 114,981 | 27.49 | % | 103,180 | 27.01 | % | 102,965 | 27.75 | % | 94,118 | 29.67 | % | ||||||||||||||||||||
| Home equity lines of credit |
29,320 | 6.85 | % | 27,184 | 6.50 | % | 22,704 | 5.94 | % | 21,152 | 5.70 | % | 15,106 | 4.76 | % | ||||||||||||||||||||
| Total real estate loans |
316,511 | 73.99 | % | 318,405 | 76.11 | % | 291,728 | 76.36 | % | 279,382 | 75.31 | % | 252,783 | 79.69 | % | ||||||||||||||||||||
| Construction loans: |
|||||||||||||||||||||||||||||||||||
| Residential |
9,193 | 2.15 | % | 8,431 | 2.02 | % | 11,827 | 3.10 | % | 14,970 | 4.04 | % | 9,790 | 3.09 | % | ||||||||||||||||||||
| Commercial |
29,122 | 6.81 | % | 33,198 | 7.93 | % | 28,567 | 7.47 | % | 26,743 | 7.20 | % | 13,032 | 4.10 | % | ||||||||||||||||||||
| Total construction loans |
38,315 | 8.96 | % | 41,629 | 9.95 | % | 40,394 | 10.57 | % | 41,713 | 11.24 | % | 22,822 | 7.19 | % | ||||||||||||||||||||
| Total real estate and construction loans |
$ | 354,826 | 82.95 | % | $ | 360,034 | 86.06 | % | $ | 332,122 | 86.93 | % | $ | 321,095 | 86.55 | % | 275,605 | 86.88 | % | ||||||||||||||||
| Consumer loans |
4,390 | 1.03 | % | 4,045 | 0.97 | % | 4,111 | 1.08 | % | 3,555 | 0.96 | % | 3,000 | 0.95 | % | ||||||||||||||||||||
| Commercial loans |
68,541 | 16.02 | % | 54,255 | 12.97 | % | 45,815 | 11.99 | % | 46,348 | 12.49 | % | 38,596 | 12.17 | % | ||||||||||||||||||||
| Total loans |
427,757 | 100.00 | % | 418,334 | 100.00 | % | 382,048 | 100.00 | % | 370,998 | 100.00 | % | 317,201 | 100.00 | % | ||||||||||||||||||||
| Undisbursed portion of loans in process |
10 | 72 | — | 21 | — | ||||||||||||||||||||||||||||||
| Net deferred loan origination costs |
965 | 1,003 | 896 | 857 | 811 | ||||||||||||||||||||||||||||||
| Allowance for loan losses |
(4,077 | ) | (3,333 | ) | (3,076 | ) | (2,908 | ) | (2,605 | ) | |||||||||||||||||||||||||
| Loans, net |
$ | 424,655 | $ | 416,076 | $ | 379,868 | $ | 368,968 | $ | 315,407 | |||||||||||||||||||||||||
Loan Maturity. The following table sets forth certain information at December 31, 2009 regarding the dollar amount of loan principal repayments becoming due during the periods indicated. The table does not include any estimate of prepayments which significantly shorten the average life of all loans and may cause our actual repayment experience to differ from that shown. Demand loans having no stated schedule of repayments and no stated maturity are reported as due in one year or less.
| Real Estate Mortgage |
Construction | Commercial | Consumer | Total Loans | |||||||||||
| (In Thousands) | |||||||||||||||
| Amounts due: |
|||||||||||||||
| One year or less |
$ | 2,845 | $ | 31,257 | $ | 38,752 | $ | 366 | $ | 73,220 | |||||
| More than one year to five years |
8,481 | 7,058 | 17,678 | 5,401 | 38,618 | ||||||||||
| More than five years |
275,866 | — | 12,111 | 27,943 | 315,920 | ||||||||||
| Total amount due |
$ | 287,192 | $ | 38,315 | $ | 68,541 | $ | 33,710 | $ | 427,758 | |||||
The following table sets forth the dollar amount of all loans at December 31, 2009 that are due after December 31, 2010 that have either fixed interest rates or adjustable interest rates. The amounts shown below exclude unearned interest on consumer loans and deferred loan origination costs.
| Fixed | Adjustable | Total | |||||||
| (In Thousands) | |||||||||
| Real estate loans |
$ | 30,513 | $ | 253,834 | $ | 284,347 | |||
| Construction |
5,463 | 5,844 | 11,307 | ||||||
| Commercial |
18,502 | 11,275 | 29,777 | ||||||
| Consumer |
19,362 | 13,982 | 33,344 | ||||||
| Total loans |
$ | 73,840 | $ | 284,935 | $ | 358,775 | |||
31
Table of Contents
Securities. Our securities portfolio consists primarily of U.S. Treasury securities. Total securities increased $8.6 million, or 15.6%, in the year ended December 31, 2009. The increase in 2009 is due to purchases of U.S. Treasury securities and an $8.3 million bond, offset by the maturities of U.S. government sponsored enterprises and the sale of most of the equity portfolio. See Note 3 for detail on the sale of the equity portfolio. Total securities increased $19.9 million, or 56.9%, in the year ended December 31, 2008, primarily due to the purchase of held-to-maturity securities. All of our collateralized mortgage obligations were issued by Fannie Mae or Freddie Mac.
The following table sets forth at the dates indicated information regarding the amortized cost and market values of the Company’s investment securities.
| At December 31, | ||||||||||||||||||
| 2009 | 2008 | 2007 | ||||||||||||||||
| Amortized Cost |
Fair Value |
Amortized Cost |
Fair Value |
Amortized Cost |
Fair Value | |||||||||||||
| (In Thousands) | ||||||||||||||||||
| Available-for-sale securities |
||||||||||||||||||
| Marketable equity securities |
$ | 402 | $ | 503 | $ | 7,449 | $ | 5,268 | $ | 7,321 | $ | 7,681 | ||||||
| Total available-for-sale securities |
$ | 402 | $ | 503 | $ | 7,449 | $ | 5,268 | $ | 7,321 | $ | 7,681 | ||||||
| Held-to-maturity securities |
||||||||||||||||||
| Debt securities of U.S. Government sponsored enterprises |
$ | 1,999 | $ | 1,999 | $ | 27,164 | $ | 27,189 | $ | 16,496 | $ | 16,500 | ||||||
| U.S. Treasury securities |
43,118 | 43,117 | 11,997 | 12,000 | — | — | ||||||||||||
| Corporate and industrial revenue bonds |
12,109 | 12,109 | 4,060 | 4,060 | 4,303 | 4,303 | ||||||||||||
| Collateralized mortgage obligations |
5,757 | 5,905 | 6,441 | 6,424 | 6,525 | 6,266 | ||||||||||||
| Total held-to-maturity securities |
$ | 62,983 | $ | 63,130 | $ | 49,662 | $ | 49,673 | $ | 27,324 | $ | 27,069 | ||||||
| Total securities |
$ | 63,385 | $ | 63,633 | $ | 57,111 | $ | 54,941 | $ | 34,645 | $ | 34,750 | ||||||
| (1) | Does not include investments in FHLB-Boston stock or Banker’s Bank stock totaling $4.3 million and $183,000 at December 31, 2009 and 2008, and $1.6 million and $183,000 at December 31, 2007. |
The Company sold $5.9 million of its equity securities during the fourth quarter of 2009. As a result, the Company had a remaining equity portfolio of $503,000 at December 31, 2009. The sales of equity securities during the fourth quarter reflect management’s determination to revise its investment strategy and reduce its overall level of investment in equity securities and overall risk in the equities markets. As part of this revised strategy, it was determined to sell most of the equity securities in the portfolio. The Company expects to continue to hold the remaining equity securities. The Company’s equity securities portfolio was primarily designed to assist the Company in managing its liquidity and interest rate risk on a long-term basis. However, due to the unprecedented decline in the stock market over the past two years, the value of such portfolio has been significantly reduced which resulted in management’s reevaluation of the investment strategy and reliance on its equity portfolio for liquidity.
At December 31, 2009, management determined that 5 of the equities sold in the fourth quarter in the financial industry had other-than-temporary impairment for which a loss on sale of OTTI securities was recorded in the amount of $62,000. For the year ended December 31, 2009, the Company sold OTTI securities at a loss of $241,000. These securities were sold due to company specific information that suggested the cost of the shares were not likely to recover.
32
Table of Contents
At December 31, 2009, our marketable equity securities had gross unrealized losses of approximately $15,000. These investments are in highly traded stocks. During the year ended December 31, 2009, the Company experienced a total other-than-temporary impairment write-down of $1.4 million, representing 30 companies, or 56 individual issues. Management evaluated these securities according to the Company’s OTTI policy and determined the decline in value to be other-than-temporary. The following table reflects the fair value and OTTI loss of securities that were written-down before the sale of the equity portfolio for the year ended December 31, 2009 due to other-than-temporary impairment by industry (in thousands):
| Industry |
Fair Value on Date of Write-Down |
OTTI Loss | # of securities | # of companies | % of fair value | % of loss | Impairment severity | ||||||||||||
| Energy |
$ | 645 | $ | 334 | 13 | 7 | 26 | % | 24 | % | 52 | % | |||||||
| Materials |
366 | 246 | 7 | 4 | 15 | % | 18 | % | 67 | % | |||||||||
| Industrial |
293 | 176 | 9 | 3 | 12 | % | 13 | % | 60 | % | |||||||||
| Financial |
398 | 282 | 11 | 5 | 16 | % | 20 | % | 71 | % | |||||||||
| Consumer discretionary |
149 | 95 | 2 | 2 | 6 | % | 7 | % | 64 | % | |||||||||
| Utilities |
230 | 92 | 4 | 3 | 9 | % | 7 | % | 40 | % | |||||||||
| Health Care |
176 | 86 | 4 | 2 | 7 | % | 6 | % | 49 | % | |||||||||
| Telecommunciation |
85 | 42 | 2 | 1 | 3 | % | 3 | % | 49 | % | |||||||||
| Consumer staples |
110 | 32 | 3 | 2 | 4 | % | 2 | % | 29 | % | |||||||||
| Information technology |
23 | 18 | 1 | 1 | 1 | % | 1 | % | 78 | % | |||||||||
| $ | 2,475 | $ | 1,403 | 56 | 30 | 100 | % | 100 | % | ||||||||||
At December 31, 2009, we had no investments in a single company or entity that had an aggregate book value in excess of 10% of our equity at December 31, 2009.
The table below sets forth the stated maturities and weighted average yields of debt securities at December 31, 2009. Weighted average yields on tax-exempt securities are not presented on a tax equivalent basis because the impact would be insignificant.
| Less than One Year | More than One Year to Five Years |
More than Five Years to Ten Years |
More than Ten Years |
Total | ||||||||||||||||||||||||||
| Carrying Value |
Weighted Average Yield |
Carrying Value |
Weighted Average Yield |
Carrying Value |
Weighted Average Yield |
Carrying Value |
Weighted Average Yield |
Carrying Value |
Weighted Average Yield |
|||||||||||||||||||||
| (Dollars in Thousands) | ||||||||||||||||||||||||||||||
| Held-to-maturity securities |
||||||||||||||||||||||||||||||
| U.S. Government sponsored enterprise obligations |
$ | 1,999 | 0.12 | % | $ | — | — | $ | — | — | $ | — | — | $ | 1,999 | 0.12 | % | |||||||||||||
| U.S. treasury securities |
43,118 | 0.12 | % | — | — | — | — | — | — | 43,118 | 0.12 | % | ||||||||||||||||||
| Corporate and industrial revenue bonds |
— | — | 3,809 | 5.16 | % | 8,300 | 4.47 | % | — | — | 12,109 | 4.69 | % | |||||||||||||||||
| Collateralized mortgage obligations |
— | — | — | — | 4,561 | 4.61 | % | 1,196 | 4.49 | % | 5,757 | 4.59 | % | |||||||||||||||||
| Total held-to-maturity securities |
$ | 45,117 | 0.12 | % | $ | 3,809 | 5.16 | % | $ | 12,861 | 4.52 | % | $ | 1,196 | 4.49 | % | $ | 62,983 | 1.41 | % | ||||||||||
As of December 31, 2009, the Company also held $4.3 million in FHLB-Boston stock. The Company periodically evaluates its investment in FHLB-Boston stock for impairment based on, among other factors, the capital adequacy of the FHLB-Boston and its overall financial condition. No impairment losses have been recorded through December 31, 2009. The Company will continue to monitor its investment in FHLB-Boston stock. For additional information regarding our FHLB-Boston stock, see Note 3 to the notes to the consolidated financial statements.
Deposits. Our primary source of funds is our deposit accounts, which are comprised of certificates of deposit, money market deposit accounts, demand deposits, passbook accounts, and NOW accounts. These deposits are provided primarily by individuals and businesses within our market areas. At December 31, 2009, we did not use brokered deposits as a source of funding. Deposits increased $30.7 million, or 9.2%, for the year ended December 31, 2009. The increase in deposits in 2009 is mostly due to the increase in demand accounts of $12.6 million, or 40.9%, money market accounts of $7.7 million, or 16.2%, and certificates of deposit of $5.4 million, or 2.7%. The increase in demand and money market accounts was directly related to the increase in commercial relationships. Deposits increased $8.0 million, or 2.5%, for the year ended December 31, 2008. The increase in deposits consisted primarily of an increase in money market and demand deposits, partially offset by the decrease in certificates of deposits. The increase in money market and demand deposits was due primarily to the increase in commercial relationships.
33
Table of Contents
The following table sets forth the distribution of the Company’s deposit accounts for the periods indicated.
| December 31, | |||||||||
| 2009 | 2008 | 2007 | |||||||
| (In Thousands) | |||||||||
| Demand |
$ | 43,398 | $ | 30,811 | $ | 26,970 | |||
| Savings |
42,875 | 40,780 | 40,463 | ||||||
| Money market |
55,293 | 47,608 | 36,650 | ||||||
| NOW |
17,697 | 14,702 | 14,649 | ||||||
| Certificates of deposit |
206,235 | 200,866 | 208,004 | ||||||
| Total deposits |
$ | 365,498 | $ | 334,767 | $ | 326,736 | |||
The following table indicates the amount of jumbo certificates of deposit by time remaining until maturity as of December 31, 2009. Jumbo certificates of deposit require minimum deposits of $100,000.
| Maturity Period |
Amount | Weighted Average Rate |
||||
| (Dollars in Thousands) | ||||||
| Three months or less |
$ | 9,344 | 1.83 | % | ||
| Over three through six months |
23,656 | 2.27 | % | |||
| Over six through 12 months |
10,955 | 2.24 | % | |||
| Over 12 months |
55,535 | 3.73 | % | |||
| Total |
$ | 99,490 | 3.04 | % | ||
Borrowings. The Company utilizes borrowings from a variety of sources to supplement our supply of funds for loans and investments.
| Years Ended December 31, | ||||||||||||
| 2009 | 2008 | 2007 | ||||||||||
| (Dollars in Thousands) | ||||||||||||
| Maximum amount of advances outstanding at any month-end during the year: |
||||||||||||
| FHLB Advances |
$ | 71,258 | $ | 76,567 | $ | 17,774 | ||||||
| Securities sold under agreements to repurchase |
27,334 | 38,557 | 17,937 | |||||||||
| Other borrowings |
— | 50 | 100 | |||||||||
| Average advances outstanding during the year: |
||||||||||||
| FHLB Advances |
$ | 58,278 | $ | 45,872 | $ | 14,515 | ||||||
| Securities sold under agreements to repurchase |
21,339 | 23,191 | 13,240 | |||||||||
| Other borrowings |
— | 25 | 77 | |||||||||
| Weighted average interest rate during the year: |
||||||||||||
| FHLB Advances |
2.90 | % | 3.16 | % | 3.90 | % | ||||||
| Securities sold under agreements to repurchase |
0.98 | % | 1.50 | % | 2.60 | % | ||||||
| Other borrowings |
— | 7.00 | % | 7.00 | % | |||||||
| Balance outstanding at end of year: |
||||||||||||
| FHLB Advances |
$ | 63,675 | $ | 76,567 | $ | 17,774 | ||||||
| Securities sold under agreements to repurchase |
20,422 | 21,956 | 14,179 | |||||||||
| Other borrowings |
— | — | 54 | |||||||||
| Weighted average interest rate at end of year: |
||||||||||||
| FHLB Advances |
3.04 | % | 2.24 | % | 4.03 | % | ||||||
| Securities sold under agreements to repurchase |
0.50 | % | 1.25 | % | 2.50 | % | ||||||
| Other borrowings |
— | — | 7.00 | % | ||||||||
34
Table of Contents
FHLB advances decreased $12.9 million, or 16.8%, for the year ended December 31, 2009. The decrease was due to maturities and principal pay downs of $40.8 million, offset by new advances of $27.9 million. The Company relied mostly on the increase in deposits of $30.7 million in 2009 to fund loan growth. FHLB advances increased $58.8 million, or 330.8%, for the year ended December 31, 2008. The increase in FHLB advances during the period was used to fund loan growth. These advances mature in 2010 through 2018. FHLB advances increased $2.5 million, or 16.5%, for the year ended December 31, 2007, due to loan growth.
Securities sold under agreements to repurchase remained relatively consistent with the prior year at $20.4 million as of December 31, 2009 compared to $22.0 million at December 31, 2008. Securities sold under agreements to repurchase increased $7.8 million, or 54.8%, during the year ended December 31, 2008 compared with the year ended December 31, 2007, due to the increase in commercial relationships. Securities sold under agreements to repurchase increased $1.5 million, or 11.5%, during the year ended December 31, 2007, due to our marketing of commercial cash management products.
In addition, at December 31, 2009, 2008 and 2007, we had the ability to borrow a total of $3.0 million from a correspondent bank, none of which was borrowed at such date. As of December 31, 2009 our line of credit with the FHLB increased to $10.0 million from $4.9 million and the Company had an option to purchase Fed Funds of up to $3.0 million. The Company did not utilize any of these contingency funding options as of December 31, 2009.
Analysis of Net Interest Income
Net interest income represents the difference between income on interest-earning assets and expense on interest-bearing liabilities. Net interest income depends on the relative amounts of interest-earning assets and interest-bearing liabilities and the interest rate earned or paid on them.
Average Balance Sheet. The following table sets forth information relating to the Company for the years ended December 31, 2009, 2008 and 2007. The average yields and costs are derived by dividing interest income or interest expense by the average balance of interest-earning assets or interest-bearing liabilities, respectively, for the periods shown. Average balances are derived from average daily balances. The yields include fees which are considered adjustments to yields. Loan interest and yield data does not include any accrued interest from non-accruing loans.
35
Table of Contents
| For the Years Ended December 31, | ||||||||||||||||||||||||||||||
| 2009 | 2008 | 2007 | ||||||||||||||||||||||||||||
| Average Balance |
Interest | Average Yield/ Rate |
Average Balance |
Interest | Average Yield/ Rate |
Average Balance |
Interest | Average Yield/ Rate |
||||||||||||||||||||||
| (Dollars in Thousands) | ||||||||||||||||||||||||||||||
| Interest-earning assets: |
||||||||||||||||||||||||||||||
| Investments (1) |
$ | 49,136 | $ | 967 | 1.97 | % | $ | 49,530 | $ | 1,410 | 2.85 | % | $ | 41,609 | $ | 1,914 | 4.60 | % | ||||||||||||
| Loans: |
||||||||||||||||||||||||||||||
| Residential real estate loans |
169,213 | 9,472 | 5.60 | % | 173,566 | 9,927 | 5.72 | % | 163,325 | 9,087 | 5.56 | % | ||||||||||||||||||
| Commercial real estate loans |
159,449 | 9,726 | 6.10 | % | 149,300 | 9,549 | 6.40 | % | 141,355 | 9,511 | 6.73 | % | ||||||||||||||||||
| Consumer loans |
32,029 | 1,648 | 5.15 | % | 29,135 | 1,757 | 6.03 | % | 26,051 | 1,777 | 6.82 | % | ||||||||||||||||||
| Commercial loans |
60,263 | 2,830 | 4.70 | % | 50,349 | 2,892 | 5.74 | % | 44,602 | 3,318 | 7.44 | % | ||||||||||||||||||
| Loans, net (2) |
420,954 | 23,676 | 5.62 | % | 402,350 | 24,125 | 6.00 | % | 375,333 | 23,693 | 6.31 | % | ||||||||||||||||||
| Other |
20,459 | 29 | 0.14 | % | 16,983 | 404 | 2.38 | % | 13,640 | 806 | 5.91 | % | ||||||||||||||||||
| Total interest-earning assets |
490,549 | 24,672 | 5.03 | % | 468,863 | 25,939 | 5.53 | % | 430,582 | 26,413 | 6.13 | % | ||||||||||||||||||
| Noninterest-earning assets |
41,669 | 29,494 | 27,632 | |||||||||||||||||||||||||||
| Total assets |
$ | 532,218 | $ | 498,357 | $ | 458,214 | ||||||||||||||||||||||||
| Interest-bearing liabilities: |
||||||||||||||||||||||||||||||
| Deposits: |
||||||||||||||||||||||||||||||
| Money market accounts |
$ | 60,292 | $ | 559 | 0.93 | % | $ | 45,340 | $ | 916 | 2.02 | % | $ | 39,094 | $ | 1,037 | 2.65 | % | ||||||||||||
| Savings accounts (3) |
41,783 | 148 | 0.35 | % | 39,864 | 266 | 0.67 | % | 44,053 | 460 | 1.04 | % | ||||||||||||||||||
| NOW accounts |
16,445 | 47 | 0.29 | % | 14,712 | 61 | 0.41 | % | 15,584 | 61 | 0.39 | % | ||||||||||||||||||
| Certificates of deposit |
205,354 | 6,451 | 3.14 | % | 201,026 | 8,148 | 4.05 | % | 198,019 | 9,309 | 4.70 | % | ||||||||||||||||||
| Total interest-bearing deposits |
323,874 | 7,205 | 2.22 | % | 300,942 | 9,391 | 3.12 | % | 296,750 | 10,867 | 3.66 | % | ||||||||||||||||||
| FHLB advances |
58,278 | 1,692 | 2.90 | % | 45,872 | 1,448 | 3.16 | % | 14,515 | 566 | 3.90 | % | ||||||||||||||||||
| Securities sold under agreement to repurchase |
21,339 | 210 | 0.98 | % | 23,191 | 348 | 1.50 | % | 13,240 | 345 | 2.61 | % | ||||||||||||||||||
| Other borrowings |
— | — | 7.00 | % | 25 | 2 | 8.00 | % | 77 | 5 | 6.49 | % | ||||||||||||||||||
| Total interest-bearing borrowings |
79,617 | 1,902 | 2.39 | % | 69,088 | 1,798 | 2.60 | % | 27,832 | 916 | 3.29 | % | ||||||||||||||||||
| Total interest-bearing liabilities |
403,491 | 9,107 | 2.26 | % | 370,030 | 11,189 | 3.02 | % | 324,582 | 11,783 | 3.63 | % | ||||||||||||||||||
| Demand deposits |
33,908 | 29,228 | 25,408 | |||||||||||||||||||||||||||
| Other noninterest-bearing liabilities |
285 | 197 | 213 | |||||||||||||||||||||||||||
| Total liabilities |
437,684 | 399,455 | 350,203 | |||||||||||||||||||||||||||
| Total stockholders’ equity |
94,534 | 98,902 | 108,011 | |||||||||||||||||||||||||||
| Total liabilities and stockholders' equity |
$ | 532,218 | $ | 498,357 | $ | 458,214 | ||||||||||||||||||||||||
| Net interest-earning assets |
$ | 87,058 | $ | 98,833 | $ | 107,225 | ||||||||||||||||||||||||
| Tax equivalent net interest income/interest rate spread (4) |
15,565 | 2.77 | % | 14,750 | 2.51 | % | 14,630 | 2.50 | % | |||||||||||||||||||||
| Tax equivalent net interest margin (net interest income as a percentage of interest-earning assets) |
3.17 | % | 3.15 | % | 3.40 | % | ||||||||||||||||||||||||
| Ratio of interest-earning assets to interest-bearing liabilities |
121.58 | % | 126.71 | % | 132.66 | % | ||||||||||||||||||||||||
| Less: tax equivalent adjustment (1) |
(184 | ) | (156 | ) | (108 | ) | ||||||||||||||||||||||||
| Net interest income as reported on income statement |
$ | 15,381 | $ | 14,594 | $ | 14,522 | ||||||||||||||||||||||||
| (1) | Municipal securities income and net interest income are presented on a tax equivalent basis using a tax rate of 41%. The tax equivalent adjustment is deducted from the tax equivalent net interest income to agree to the amount reported on the statement of operations. See ‘Explanation of Use of Non GAAP Financial Measurements’. |
| (2) | Loans, net excludes loans held for sale. |
| (3) | Savings accounts include mortgagors’ escrow deposits. |
| (4) | Tax equivalent interest rate spread represents the difference between the weighted average yield on interest-earning assets and the weighted average cost of interest-bearing liabilities. |
36
Table of Contents
Rate/Volume Analysis. The following table presents the extent to which changes in interest rates and changes in the volume of interest-earning assets and interest-bearing liabilities have affected the Company’s tax equivalent interest income and interest expense during the periods indicated. Information is provided in each category with respect to: (i) changes attributable to changes in volume (changes in volume multiplied by prior rate); (ii) changes attributable to changes in rate (changes in rate multiplied by prior volume); and (iii) the net change. The changes attributable to the combined impact of volume and rate have been allocated proportionately to the changes due to volume and the changes due to rate.
| Year Ended December 31, 2009 Compared to December 31, 2008) |
Year Ended December 31, 2008 Compared to December 31, 2007 |
|||||||||||||||||||||||
| Increase (Decrease Due to |
Increase (Decrease) Due to |
|||||||||||||||||||||||
| Volume | Rate | Net | Volume | Rate | Net | |||||||||||||||||||
| (Dollars in Thousands) | ||||||||||||||||||||||||
| Interest-earning assets: |
||||||||||||||||||||||||
| Investment securities |
$ | (11 | ) | $ | (432 | ) | $ | (443 | ) | $ | 318 | $ | (822 | ) | $ | (504 | ) | |||||||
| Loans: |
||||||||||||||||||||||||
| Residential real estate loans |
(246 | ) | (209 | ) | (455 | ) | 581 | 259 | 840 | |||||||||||||||
| Commercial real estate loans |
631 | (454 | ) | 177 | 521 | (483 | ) | 38 | ||||||||||||||||
| Consumer loans |
164 | (273 | ) | (109 | ) | 198 | (218 | ) | (20 | ) | ||||||||||||||
| Commercial loans |
523 | (585 | ) | (62 | ) | 400 | (826 | ) | (426 | ) | ||||||||||||||
| Total loans |
1,072 | (1,521 | ) | (449 | ) | 1,700 | (1,268 | ) | 432 | |||||||||||||||
| Other |
71 | (446 | ) | (375 | ) | 167 | (569 | ) | (402 | ) | ||||||||||||||
| Total interest-earning assets |
$ | 1,132 | $ | (2,399 | ) | $ | (1,267 | ) | $ | 2,185 | $ | (2,659 | ) | $ | (474 | ) | ||||||||
| Interest-bearing liabilities: |
||||||||||||||||||||||||
| Deposits: |
||||||||||||||||||||||||
| Money market accounts |
$ | 240 | $ | (597 | ) | $ | (357 | ) | $ | 150 | $ | (271 | ) | $ | (121 | ) | ||||||||
| Savings accounts (1) |
12 | (130 | ) | (118 | ) | (41 | ) | (153 | ) | (194 | ) | |||||||||||||
| NOW accounts |
6 | (20 | ) | (14 | ) | (3 | ) | 3 | — | |||||||||||||||
| Certificates of deposit |
172 | (1,869 | ) | (1,697 | ) | 139 | (1,300 | ) | (1,161 | ) | ||||||||||||||
| Total interest-bearing deposits |
430 | (2,616 | ) | (2,186 | ) | 245 | (1,721 | ) | (1,476 | ) | ||||||||||||||
| FHLB advances |
370 | (126 | ) | 244 | 1,011 | (129 | ) | 882 | ||||||||||||||||
| Securities sold under agreement to repurchase |
(26 | ) | (112 | ) | (138 | ) | 191 | (188 | ) | 3 | ||||||||||||||
| Other borrowings |
(2 | ) | — | (2 | ) | (4 | ) | 1 | (3 | ) | ||||||||||||||
| Total interest-bearing borrowings |
342 | (238 | ) | 104 | 1,198 | (316 | ) | 882 | ||||||||||||||||
| Total interest-bearing liabilities |
772 | (2,854 | ) | (2,082 | ) | 1,443 | (2,037 | ) | (594 | ) | ||||||||||||||
| Increase (decrease) in net interest income |
$ | 360 | $ | 455 | $ | 815 | $ | 742 | $ | (622 | ) | $ | 120 | |||||||||||
| (1) | Includes interest on mortgagors’ escrow deposits. |
37
Table of Contents
Results of Operations.
Comparison of Operating Results for the Years Ended December 31, 2009 and December 31, 2008
General. For the year ended December 31, 2009, the Company reported a net loss of $1.6 million compared to net income of $22,000 for the year ended December 31, 2008.
Net Interest Income. Net interest income, on a tax equivalent basis, totaled $15.6 million for the year ended December 31, 2009, an increase of $815,000, or 5.5%, from $14.7 million for the same period in 2008. The increase reflects the Company’s ability to decrease the cost of interest-bearing liabilities by $2.1 million, offset by a decrease in income from interest-earning assets of $1.3 million. Net interest margin, on a tax equivalent basis, increased 2 basis points to 3.17% for the year ended December 31, 2009 from 3.15% for the same period in 2008, primarily attributable to the Company’s ability to adapt to the decreasing interest rate environment by decreasing the cost of interest bearing liabilities more than the economic decrease to earning assets.
Interest and Dividend Income. Interest and dividend income, on a tax equivalent basis, decreased $1.3 million, or 4.9%, to $24.7 million for the year ended December 31, 2009 from $25.9 million in 2008, largely reflecting the decreasing interest rate environment. Average interest-earning assets totaled $490.5 million for the year ended December 31, 2009 compared to $468.9 million for the same period last year, representing an increase of $21.7 million, or 4.6%. Average loans increased $18.6 million, or 4.6%, primarily due to strong originations partially offset by the sale of low-coupon fixed rate residential real estate loans originated in 2009 to the secondary market. Average investment securities decreased $394,000, or 0.8%. The tax equivalent yield on interest-earning assets decreased 50 basis points to 5.03% for the year ended December 31, 2009 from 5.53% for the year ended December 31, 2008, largely attributable to lower market rates of interest for 2009.
Interest Expense. Total interest expense decreased $2.1 million, or 18.6%, to $9.1 million for the year ended December 31, 2009 from $11.2 million in 2008, resulting primarily from decreased FHLB interest rates and the Company’s ability to decrease deposit rates. Average interest-bearing liabilities totaled $403.5 million for the year ended December 31, 2009, representing an increase of $33.5 million, or 9.0%, from $370.0 million for the same period in 2008, mainly due to an increase in average deposit balances of $22.9 million, or 7.6%. Average money market accounts increased $15.0 million, or 33.0%, to $60.3 million for the year ended December 31, 2009, due to the increase in commercial relationships. Average certificate of deposit balances increased $4.3 million, or 2.2%, to $205.4 million for the year ended December 31, 2009. Average FHLB advances increased $12.4 million, or 27.0%, to $58.3 million for the year ended December 31, 2008, mainly due to the increase in bonds of $8.0 million. The rate paid on interest-bearing liabilities decreased 76 basis points to 2.26% for the year ended December 31, 2009 from 3.02% in 2008, reflecting the lower interest rate environment.
Provision for Loan Losses. The Company’s provision for loan losses increased by $582,000 to $897,000 for the year ended December 31, 2009 from $315,000 for the same period in 2008. Factors contributing to the increase in the loan loss provision include the growth in the commercial portfolio, which carries higher risk and requires higher reserves, as well as the continued weakening of the local and national economy. While the Company has not recorded a significant loan loss during these challenging times, economic conditions dictate that we continue making prudent additions to the loan loss provision.
The allowance for loan losses was $4.1 million, or 0.95% of total loans, as of December 31, 2009, as compared to $3.3 million, or 0.79% of total loans, as of December 31, 2008. An analysis of the changes in the allowance for loan losses is presented under “Risk Management – Analysis and Determination of the Allowance for Loan Losses.”
Non-interest Income. Total non-interest income increased $714,000, or 35.7%, to $2.7 million for the year ended December 31, 2009 compared to $2.0 million for the same period in 2008. The increase was primarily due to a $642,000 increase in loan sales and servicing and a $198,000 increase in gains on sales of securities available for sale. In addition, income from customer service charges and fees, excluding income from investment services, increased by $159,000, or 13.2%, to $1.4 million. These increases were partially offset by the decrease in income from investment services of $254,000.
Non-interest Expenses. Non-interest expenses increased $3.5 million, or 22.3%, to $19.4 million for the year ended December 31, 2009 from $15.9 million for the same period in 2008. The increase was directly related to a charge of $1.4 million for OTTI securities recognized in the third quarter. In addition, FDIC insurance premium
38
Table of Contents
expenses increased $492,000 to $539,000 as of December 31, 2009 from $47,000 as of December 31, 2008, including the FDIC special assessment of $229,000 recognized in the second quarter of 2009. Also contributing to the increase was an increase in expenses directly related to the establishment of two new branches in 2009.
Income Taxes. The Company’s income tax expense decreased $1.0 million to a tax benefit of $627,000 for the year ended December 31, 2009 compared to a tax expense of $376,000 in 2008 mainly attributable to the decrease in income before income taxes of $2.6 million. As of December 31, 2009, a valuation allowance of $1.7 million has been established against deferred tax assets related to the uncertain utilization of the charitable contribution carry forward created primarily by the donation to the Foundation as part of the conversion. Of the $1.7 million valuation allowance, $411,000 was applied in the second half of 2009. The judgment applied by management considers the likelihood that sufficient taxable income will be realized within the carry forward period in light of our tax planning strategies and changes in market conditions.
Comparison of Operating Results for the Years Ended December 31, 2008 and December 31, 2007
General. For the year ended December 31, 2008, the Company reported net income of $22,000 compared to a net income of $1.6 million for the year ended December 31, 2007.
Net Interest Income. Net interest income, on a tax equivalent basis, totaled $14.7 million for the year ended December 31, 2008, an increase of $120,000, or 0.8%, from $14.6 million for the same period in 2007, reflecting an almost even balance in the decline in income from earning assets as compared to the cost of liabilities. Net interest margin, on a tax equivalent basis, decreased 25 basis points to 3.15% for the year ended December 31, 2008 from 3.40% for the same period in 2007, primarily attributable to the increase in earning assets of $38.3 and decline in interest income of $475,000 due to the decreasing interest rate environment.
Interest and Dividend Income. Interest and dividend income, on a tax equivalent basis, decreased $474,000 million, or 1.8%, to $25.9 million for the year ended December 31, 2008 from $26.4 million in 2007, largely reflecting growth in average interest-earning assets, which are earning lower rates than in the prior year. Average interest-earning assets totaled $468.9 million for the year ended December 31, 2008 compared to $430.6 million for the same period last year, representing an increase of $38.3 million, or 8.9%. Average loans increased $27.0 million, or 7.2%, primarily due to strong origination partially mitigated by amortization. Average investment securities increase $7.9 million, or 19.0%, mainly attributable to additional purchases of held-to-maturity securities. The tax equivalent yield on interest-earning assets decreased 60 basis points to 5.53% for the year ended December 31, 2008, largely attributable to the decreasing interest environment.
Interest Expense. Total interest expense decreased $594,000, or 5.0%, to $11.2 million for the year ended December 31, 2008 from $11.8 million in 2007 resulting primarily from decreased rates paid on deposits and FHLB advances. Average interest-bearing liabilities totaled $370.0 million for the year ended December 31, 2008, representing an increase of $45.4 million, or 14.0%, from $324.6 million for the same period in 2007 due to an increase in average FHLB advances of $31.4 million, or 216.0%. Average interest-bearing deposits grew $4.2 million, or 1.4%, to $300.9 million for the year ended December 31, 2008, primarily attributable to increased balances in average money market accounts. Average money markets increased $6.2 million, or 16.0%, to $45.3 million for the year ended December 31, 2008, due to the increase in commercial relationships. Average certificate of deposit balances increased $3.0 million, or 1.5%, to $201.0 million for the year ended December 31, 2008. The rate paid on interest-bearing liabilities decreased 61 basis points to 3.02% for the year ended December 31, 2008 from 3.63% in 2006, reflecting the decreasing interest rate environment.
Provision for Loan Losses. The Company’s provision for loan losses increased by $92,000 to $315,000 for the year ended December 31, 2008 from $223,000 for the same period in 2007. The increase was primarily due to the increase in loan balances, in particular the increase in commercial real estate loans, and the increase in non-accrual loans.
The allowance for loan losses was $3.3 million or 0.79% of total loans as of December 31, 2008, as compared to $3.1 million or 0.80% of total loans as of December 31, 2007. An analysis of the changes in the allowance for loan losses is presented under “Risk Management – Analysis and Determination of the Allowance for Loan Losses.”
Non-interest Income. Total non-interest income decreased $520,000, or 20.6%, to $2.0 million for the year ended December 31, 2008 compared to $2.5 million for the same period in 2007. The 2008 results included net
39
Table of Contents
losses from the sales of available-for-sale securities of $57,000, compared to net gains of $835,000 in 2007, a decrease in income of $892,000 or 106.8%. Fee income increased $384,000, or 31.5%, to $1.6 million for the year ended December 31, 2008 from $1.2 million for the comparable period in 2007 reflecting expansion in deposit balances and transaction volume.
Non-interest Expenses. Non-interest expenses increased $1.7 million, or 11.8%, to $15.9 million for the year ended December 31, 2008 from $14.2 million for the same period in 2007 largely attributable to the increase in Equity Incentive Plan expenses of $630,000, the result of recording a full year of expense in 2008 compared to only a half a year in 2007. In addition, the increase in non-interest expense for the year is associated with the costs of temporarily outsourcing the Company’s IT and Sarbanes Oxley internal audit functions, which was the primary reason for the increase in audit expenses of $194,000, and expenses associated with the development of two new branches, including additional salaries and employee benefits expense of $478,000.
Income Taxes. The Company’s income tax expense decreased $642,000 to a tax expense of $376,000 for the year ended December 31, 2008 compared to $1.0 million in 2007 mainly attributable to the decrease in income before income taxes of $2.2 million. As of December 30, 2008, a valuation allowance of $1.3 million has been established against deferred tax assets related to the uncertain utilization of the charitable contribution carry forward created primarily by the donation to the Foundation as part of the conversion. Of the $1.3 million valuation allowance, $300,000 was applied in the second half of 2008. The judgment applied by management considers the likelihood that sufficient taxable income will be realized within the carry forward period in light of our tax planning strategies and changes in the market conditions.
Explanation of Use of Non-GAAP Financial Measurements. We believe that it is common practice in the banking industry to present interest income and related yield information on tax exempt securities on a tax-equivalent basis and that such information is useful to investors because it facilitates comparisons among financial institutions. However, the adjustment of interest income and yields on tax exempt securities to a tax-equivalent amount may be considered to include non-GAAP financial information. A reconciliation to GAAP is provided below.
| For the Years Ended December 31, | ||||||||||||||||||
| 2009 | 2008 | 2007 | ||||||||||||||||
| (Dollars in Thousands) | ||||||||||||||||||
| Interest | Average Yield |
Interest | Average Yield |
Interest | Average Yield |
|||||||||||||
| Investment securities (non-tax adjustment) |
$ | 783 | 1.59 | % | $ | 1,254 | 2.53 | % | $ | 1,806 | 4.34 | % | ||||||
| Tax equivalent adjustment (1) |
184 | 156 | 108 | |||||||||||||||
| Investment securities (tax equivalent basis) |
$ | 967 | 1.97 | % | $ | 1,410 | 2.85 | % | $ | 1,914 | 4.60 | % | ||||||
| Net interest income (non-tax adjustment) |
$ | 15,381 | $ | 14,594 | $ | 14,522 | ||||||||||||
| Tax equivalent adjustment (1) |
184 | 156 | 108 | |||||||||||||||
| Net interest income (tax equivalent basis) |
$ | 15,565 | $ | 14,750 | $ | 14,630 | ||||||||||||
| Interest rate spread (no tax adjustment) |
2.73 | % | 2.48 | % | 2.48 | % | ||||||||||||
| Net interest margin (no tax adjustment) |
3.14 | % | 3.11 | % | 3.37 | % | ||||||||||||
| (1) | The tax equivalent adjustment is based on a tax rate of 41% for all periods presented. |
Risk Management
Overview. Managing risk is an essential part of successfully managing a financial institution. Our most prominent risk exposures are credit risk, interest rate risk and market risk. Credit risk is the risk of not collecting the interest and/or the principal balance of a loan or investment when it is due. Interest rate risk is the potential reduction of net interest income as a result of changes in interest rates. Market risk arises from fluctuations in interest rates that may result in changes in the values of financial instruments, such as available-for-sale securities, that are accounted
40
Table of Contents
for on a mark-to-market basis. Other risks that we face are operational risks, liquidity risks and reputation risk. Operational risks include risks related to fraud, regulatory compliance, processing errors, and technology and disaster recovery. Liquidity risk is the possible inability to fund obligations to depositors, lenders or borrowers. Reputation risk is the risk that negative publicity or press, whether true or not, could cause a decline in our customer base or revenue.
Credit Risk Management. Our strategy for credit risk management focuses on having well-defined credit policies and uniform underwriting criteria and providing prompt attention to potential problem loans.
Management performs a monthly review of all delinquent loans. The actions taken with respect to delinquency vary depending upon the nature of the delinquent loans and the period of delinquency. A late charge is normally assessed on loans where the scheduled payment remains unpaid after a 15 day grace period. After mailing delinquency notices, the Company’s collection department calls the borrower to determine the reason for the delinquency and the repayment status. Through continued heightened account monitoring, collection, and workout efforts, the Company attempts to work out a payment schedule with the borrower in order to avoid foreclosure. If these actions do not result in a satisfactory resolution, the Company refers the loan to legal counsel and counsel initiates foreclosure proceedings. The Company is committed to assist the homeowners to remain in their homes.
Management reports to the executive committee monthly regarding the amount of loans delinquent. All loans that are delinquent greater than 90 days, loans that are in foreclosure, and all foreclosed and repossessed property that we own are reported in greater detail to the executive committee monthly.
Analysis of Nonperforming and Classified Assets. We consider repossessed assets, loans that are 90 days or more past due, and other loans which have been identified by the Company as presenting uncertainty with respect to the collectability of interest or principal to be nonperforming assets. Loans are placed on non-accrual status when they become 90 days delinquent, at which time the accrual of interest ceases and the allowance for any uncollectible accrued interest is established and charged against operations. Typically, payments received on a non-accrual loan are applied to the outstanding principal and interest as determined at the time of collection of the loan.
Real estate that we acquire as a result of foreclosure or by deed-in-lieu of foreclosure is classified as other real estate owned (“OREO”) until it is sold. When property is acquired and placed into OREO, it is recorded at the lower of its cost, or market price, less estimated selling expenses. Holding costs and declines in fair value after acquisition of the property result in charges against income. As of December 31, 2009, the Company had $80,000 classified as OREO.
The following table provides information with respect to our nonperforming assets at the dates indicated. We did not have any troubled debt restructurings or any accruing loans past due 90 days or more at the dates presented.
| At December 31, | ||||||||||||||||||||
| 2009 | 2008 | 2007 | 2006 | 2005 | ||||||||||||||||
| (Dollars in Thousands) | ||||||||||||||||||||
| Non-accrual loans: |
||||||||||||||||||||
| Real estate |
$ | 3,722 | $ | 2,595 | $ | 779 | $ | 1,460 | $ | 545 | ||||||||||
| Construction |
184 | 97 | 167 | — | — | |||||||||||||||
| Commercial |
664 | 139 | 63 | 243 | 183 | |||||||||||||||
| Consumer (1) |
274 | 85 | 5 | 8 | 8 | |||||||||||||||
| Total |
$ | 4,844 | $ | 2,916 | $ | 1,014 | $ | 1,711 | $ | 736 | ||||||||||
| Real estate owned |
80 | 269 | — | — | — | |||||||||||||||
| Total nonperforming assets |
$ | 4,924 | $ | 3,185 | $ | 1,014 | $ | 1,711 | $ | 736 | ||||||||||
| Total nonperforming loans as a percentage of total loans (2) |
1.13 | % | 0.69 | % | 0.27 | % | 0.46 | % | 0.23 | % | ||||||||||
| Total nonperforming assets as a percentage of total assets (3) |
0.90 | % | 0.60 | % | 0.22 | % | 0.38 | % | 0.19 | % | ||||||||||
| (1) | Consumer loans include home equity loans. |
| (2) | Total loans equals net loans plus the allowance for loan losses. |
| (3) | Nonperforming assets consist of nonperforming loans and real estate owned. Nonperforming loans consist of all loans 90 days or more past due and other loans which have been identified by the Company as presenting uncertainty with respect to the collectability of interest or principal. |
41
Table of Contents
There were 21 residential real estate loans, with total principal balances of $2.7 million and total collateral values of $3.6 million, and five commercial real estate loans, with total principal balances of $982,000 and total collateral values of $2.0 million that were not accruing interest as of December 31, 2009. There was one residential construction loan with a principal balance of $184,000 not accruing interest as of December 31, 2009, with a collateral value of $250,000. There were no commercial construction loans that were not accruing interest as of December 31, 2009. There were 11 commercial loans not accruing interest as of December 31, 2009, with a combined collateral value of $1.2 million. Of the 11 commercial loans, six loans were applied specific reserves of $53,000 to compensate for 100% of the collateral shortfalls. Only one commercial loan has exposure to loss of $9,000 due to a collateral shortfall. The remaining four commercial loans are adequately collateralized. There were 26 consumer and home equity loans not accruing interest as of December 31, 2009. Home equity loans not accruing interest as of December 31, 2009 with total principal balances of $182,000 are comprised of six individual loans with a combined collateral value of $776,000. Collateral values were sufficient to cover the loan balances of non-accrual loans. At December 31, 2009, the Company’s total nonperforming loans as a percentage of total loans of 1.13% was below the peer average of 1.91%.
There were 20 residential real estate loans and two commercial real estate loans that were not accruing interest as of December 31, 2008, with a combined collateral value of $4.6 million. There was one residential construction loan not accruing interest as of December 31, 2008, with a collateral value of $145,000. There were four commercial loans not accruing interest as of December 31, 2008, with a combined collateral value of $682,000. There were four consumer loans not accruing interest as of December 31, 2008. Collateral values were sufficient to cover the loan balances of non-accrual loans.
Interest income that would have been recorded for the year ended December 31, 2009 had nonperforming loans been current according to their original terms amounted to $399,000. Interest income recognized on impaired loans for the year ended December 31, 2009 was $375,000.
Regulators have adopted various regulations and practices regarding problem assets of financial institutions. Under such regulations, federal and state examiners have authority to identify problem assets during examinations and, if appropriate, require them to be classified. We perform an internal analysis of our loan portfolio and assets to classify such loans and assets similar to the manner in which such loans and assets are classified by the federal banking regulators. In addition, we regularly analyze the probable losses inherent in our loan portfolio and our nonperforming loans to determine the appropriate level of the allowance for loan losses. There are four classifications for problem assets: special mention, substandard, doubtful, and loss. Assets that do not currently expose the insured institution to sufficient risk to warrant classification in one of the aforementioned categories but possess weaknesses are designated “special mention”. “Substandard” assets have one or more defined weaknesses and are characterized by the distinct possibility that the insured institution will sustain some loss if the deficiencies are not corrected. Non-accruing loans are normally classified as substandard. “Doubtful” assets have the weaknesses of substandard assets with the additional characteristic that the weaknesses make collection or liquidation in full on the basis of currently existing facts, conditions and values questionable, and there is a high possibility of loss. An asset classified as “loss” is normally fully charged-off.
The following table shows the aggregate amounts of our classified loans at the dates indicated.
| December 31, | |||||||||
| 2009 | 2008 | 2007 | |||||||
| (Dollars in Thousands) | |||||||||
| Special mention loans |
$ | 17,342 | $ | 12,109 | $ | 8,015 | |||
| Substandard loans |
7,939 | 4,439 | 3,761 | ||||||
| Doubtful loans |
502 | 37 | — | ||||||
| Loss loans |
17 | — | — | ||||||
| Total classified loans |
$ | 25,800 | $ | 16,585 | $ | 11,776 | |||
42
Table of Contents
At December 31, 2009, special mention loans consist of $9.5 million in commercial real estate loans, $6.6 million in commercial construction loans, and $1.2 million in commercial business loans; substandard loans consist of $4.0 million in commercial business loans and $2.5 million in commercial construction loans, and $1.4 million in commercial real estate loans; doubtful loans consist of $369,000 in commercial business loans and $133,000 in commercial real estate loans; and loss loans consist of $17,000 in commercial business loans. The increase in classified loans was due to general deterioration of economic conditions that have led to the inability of some businesses to properly service their debt. At December 31, 2009, 95.8% of our classified loans were current with payments. Other than disclosed in the above tables, there are no other loans at December 31, 2009 that management has serious doubts about the ability of the borrowers to comply with the present loan repayment terms.
Analysis and Determination of the Allowance for Loan Losses. The allowance for loan losses is a valuation allowance for probable credit losses inherent in the loan portfolio. We evaluate the need to establish allowances against losses on loans on a monthly basis. When additional allowances are necessary, a provision for loan losses is charged to earnings.
Our methodology for assessing the appropriateness of the allowance for loan losses consists of: (1) a specific allowance on identified problem loans; and (2) a general valuation allowance on the remainder of the loan portfolio. Although we determine the amount of each element of the allowance separately, the entire allowance for loan losses is available for the entire portfolio.
Specific Allowance Required for Identified Problem Loans. We establish an allowance on certain identified problem loans based on such factors as: (1) the strength of the customer’s personal or business cash flows; (2) the availability of other sources of repayment; (3) the amount due or past due; (4) the type and value of collateral; (5) the strength of our collateral position; (6) the estimated cost to sell the collateral; and (7) the borrower’s effort to cure the delinquency.
General Valuation Allowance on the Remainder of the Loan Portfolio. We establish a general allowance for loans that are not delinquent to recognize the probable losses associated with lending activities. This general valuation allowance is determined by segregating the loans by loan category and assigning percentages to each category. The percentages are adjusted for significant factors that, in management’s judgment, affect the collectability of the portfolio as of the evaluation date. These significant factors include: levels and historical trends in delinquencies, impaired loans, non-accrual loans, charge-offs, recoveries, and classified assets; trends in the volume and terms of loans; effects of any change in underwriting, policies, procedures, and practices; experience, ability, and depth of management and staff; national and local economic trends and conditions; trends and conditions in the industries in which borrowers operate; effects of changes in credit concentrations. The applied loss factors are reevaluated quarterly to ensure their relevance in the current economic environment.
We identify loans that may need to be charged off as a loss by reviewing all delinquent loans, classified loans and other loans that management may have concerns about collectability. For individually reviewed loans, the borrower’s inability to make payments under the terms of the loan or a shortfall in collateral value would result in our allocating a portion of the allowance to the loan that was impaired.
At December 31, 2009, our allowance for loan losses represented 0.95% of total loans and 84.17% of nonperforming loans. The allowance for loan losses increased slightly from $3.3 million at December 31, 2008 to $4.1 million at December 31, 2009, due to a provision for loan losses of $897,000, partially offset by net charge-offs of $153,000. The provision for loan losses in the year ended December 31, 2009 reflects management’s assessment of several factors. In particular, non-accrual loans increased $1.9 million to $4.8 million at December 31, 2009 from $2.9 million at December 31, 2008. Also, net charge-offs increased $95,000 from December 31, 2008. In addition, management assessed the continued growth of the loan portfolio, particularly the increases in commercial real estate loans, construction loans and commercial business loans, as well as the weakening of the local and national economy.
At December 31, 2008, our allowance for loan losses represented 0.79% of total loans and 114.30% of nonperforming loans. The allowance for loan losses increased slightly from $3.1 million at December 31, 2007 to $3.3 million at December 31, 2008, due to a provision for loan losses of $315,000, partially offset by net charge-offs of $58,000. The provision for loan losses in the year ended December 31, 2008 reflects management’s assessment of several factors. In particular, non-accrual loans increased to $2.9 million at December 31, 2008 from $1.0 million at December 31, 2007. Also, net charge-offs increased $3,000 from December 31, 2007. In addition, management assessed the continued growth of the loan portfolio, particularly the increases in commercial real estate loans, construction loans and commercial business loans.
43
Table of Contents
At December 31, 2007, our allowance for loan losses represented 0.80% of total loans and 303.4% of nonperforming loans. The allowance for loan losses increased slightly from $2.9 million at December 31, 2006 to $3.1 million at December 31, 2007, due to a provision for loan losses of $223,000, partially offset by net charge-offs of $55,000. The provision for loan losses in the year ended December 31, 2007 reflects management’s assessment of several factors. In particular, non-accrual loans decreased slightly to $1.0 million at December 31, 2007 from $1.7 million at December 31, 2006. We also had net charge-offs of $55,000 for the year ended December 31, 2007, as compared to $137,000 for the year ended December 31, 2006. In addition, management assessed the continued growth of the loan portfolio, particularly the increases in commercial real estate loans, construction loans and commercial business loans.
The following table sets forth the Company’s percent of allowance for loan losses to total allowances and the percent of loans to total loans in each of the categories listed at the dates indicated.
| For Years Ended December 31, | |||||||||||||||||||||||||||
| 2009 | 2008 | 2007 | |||||||||||||||||||||||||
| Amount | % of Allowance in each Category to Total Allowance |
Percent of Loans in each Category to Total Loans |
Amount | % of Allowance in each Category to Total Allowance |
Percent of Loans in each Category to Total Loans |
Amount | % of Allowance in each Category to Total Allowance |
Percent of Loans in each Category to Total Loans |
|||||||||||||||||||
| (Dollars in Thousands) | |||||||||||||||||||||||||||
| Real estate-mortgage |
$ | 1,959 | 48.05 | % | 67.14 | % | $ | 1,675 | 50.26 | % | 69.61 | % | $ | 1,542 | 50.13 | % | 70.42 | % | |||||||||
| Construction |
811 | 19.89 | % | 8.96 | % | 624 | 18.72 | % | 9.95 | % | 603 | 19.60 | % | 10.57 | % | ||||||||||||
| Commercial |
1,124 | 27.57 | % | 16.02 | % | 895 | 26.85 | % | 12.97 | % | 778 | 25.30 | % | 11.99 | % | ||||||||||||
| Consumer |
183 | 4.49 | % | 7.88 | % | 139 | 4.17 | % | 7.47 | % | 125 | 4.06 | % | 7.02 | % | ||||||||||||
| Unallocated |
— | — | — | — | — | — | 28 | 0.91 | % | — | |||||||||||||||||
| Total allowance for loan losses |
$ | 4,077 | 100.00 | % | 100.00 | % | $ | 3,333 | 100.00 | % | 100.00 | % | $ | 3,076 | 100.00 | % | 100.00 | % | |||||||||
|
For Years Ended December 31, |
|||||||||||||||||||||||||||
| 2006 | 2005 | ||||||||||||||||||||||||||
| Amount | % of Allowance in each Category to Total Allowance |
Percent of Loans in each Category to Total Loans |
Amount | % of Allowance in each Category to Total Allowance |
Percent of Loans in each Category to Total Loans |
||||||||||||||||||||||
| (Dollars in Thousands) | |||||||||||||||||||||||||||
| Real estate-mortgage |
$ | 1,467 | 50.44 | % | 69.61 | % | $ | 1,754 | 67.33 | % | 74.93 | % | |||||||||||||||
| Construction |
626 | 21.53 | % | 11.24 | % | — | — | 7.19 | % | ||||||||||||||||||
| Commercial |
724 | 24.90 | % | 12.49 | % | 580 | 22.26 | % | 12.17 | % | |||||||||||||||||
| Consumer |
91 | 3.13 | % | 6.66 | % | 271 | 10.41 | % | 5.71 | % | |||||||||||||||||
| Unallocated |
— | — | — | — | — | — | |||||||||||||||||||||
| Total allowance for loan losses |
$ | 2,908 | 100.00 | % | 100.00 | % | $ | 2,605 | 100.00 | % | 100.00 | % | |||||||||||||||
Although we believe that we use the best information available to establish the allowance for loan losses, future adjustments to the allowance for loan losses may be necessary and our results of operations could be adversely affected if circumstances differ substantially from the assumptions used in making the determinations.
44
Table of Contents
Furthermore, while we believe we have established our allowance for loan losses in conformity with U.S. generally accepted accounting principles, there can be no assurance that our banking regulators, in reviewing our loan portfolio, will not request us to increase our allowance for loan losses. Our banking regulators may require us to increase our allowance for loan losses based on judgments different from ours. In addition, because future events affecting borrowers and collateral cannot be predicted with certainty, there can be no assurance that increases will not be necessary should the quality of any loans deteriorate as a result of the factors discussed above. Any material increase in the allowance for loan losses may adversely affect our financial condition and results of operations.
Analysis of Loan Loss Experience. The following table sets forth an analysis of the allowance for loan losses for the periods indicated.
| At or for the Years Ended December 31, | ||||||||||||||||||||
| 2009 | 2008 | 2007 | 2006 | 2005 | ||||||||||||||||
| (Dollars in Thousands) | ||||||||||||||||||||
| Allowance for loan losses, beginning of period |
$ | 3,333 | $ | 3,076 | $ | 2,908 | $ | 2,605 | $ | 2,512 | ||||||||||
| Charged-off loans: |
||||||||||||||||||||
| Real estate-mortgage |
93 | — | 25 | 47 | — | |||||||||||||||
| Construction |
— | — | — | — | — | |||||||||||||||
| Commercial |
9 | — | 3 | 88 | 17 | |||||||||||||||
| Consumer |
69 | 71 | 37 | 4 | 14 | |||||||||||||||
| Total charged-off loans |
171 | 71 | 65 | 139 | 31 | |||||||||||||||
| Recoveries on loans previously charged-off: |
||||||||||||||||||||
| Real estate |
— | — | — | — | — | |||||||||||||||
| Construction |
— | — | — | — | — | |||||||||||||||
| Commercial |
— | — | (10 | ) | (2 | ) | (1 | ) | ||||||||||||
| Consumer |
(18 | ) | (13 | ) | — | — | (3 | ) | ||||||||||||
| Total recoveries |
(18 | ) | (13 | ) | (10 | ) | (2 | ) | (4 | ) | ||||||||||
| Net loans charged-off |
153 | 58 | 55 | 137 | 27 | |||||||||||||||
| Provision for loan losses |
897 | 315 | 223 | 440 | 120 | |||||||||||||||
| Allowance for loan losses, end of period |
$ | 4,077 | $ | 3,333 | $ | 3,076 | $ | 2,908 | $ | 2,605 | ||||||||||
| Net loans charged-off to average loans, net |
0.04 | % | 0.01 | % | 0.01 | % | 0.04 | % | 0.01 | % | ||||||||||
| Allowance for loan losses to total loans (1) |
0.95 | % | 0.79 | % | 0.80 | % | 0.78 | % | 0.82 | % | ||||||||||
| Allowance for loan losses to nonperforming loans (2) |
84.17 | % | 114.30 | % | 303.35 | % | 169.96 | % | 353.94 | % | ||||||||||
| Net loans charged-off to allowance for loan losses |
3.75 | % | 1.74 | % | 1.79 | % | 4.71 | % | 1.04 | % | ||||||||||
| Recoveries to charge-offs |
-10.53 | % | -18.31 | % | -15.38 | % | 1.44 | % | 12.90 | % | ||||||||||
| (1) | Total loans equals net loans plus the allowance for loan losses. |
| (2) | Nonperforming loans consist of all loans 90 days or more past due and other loans which have been identified by the Company as presenting uncertainty with respect to the collectability of interest or principal. |
Interest Rate Risk Management. We manage the interest rate sensitivity of our interest-bearing liabilities and interest-earning assets in an effort to minimize the adverse effects of changes in the interest rate environment. Deposit accounts typically react more quickly to changes in market interest rates than mortgage loans because of the shorter maturities of deposits. As a result, sharp increases in interest rates may adversely affect our earnings while decreases in interest rates may beneficially affect our earnings. To reduce the potential volatility of our earnings, we have sought to improve the match between asset and liability maturities and rates, while maintaining an acceptable interest rate spread. Our strategy for managing interest rate risk emphasizes: adjusting the maturities of borrowings;
45
Table of Contents
adjusting the investment portfolio mix and duration; increasing our focus on shorter-term, adjustable-rate commercial and multi-family lending; selling fixed-rate mortgage loans; and periodically selling available-for-sale securities. We currently do not participate in hedging programs, interest rate swaps or other activities involving the use of derivative financial instruments.
We have an Asset/Liability Committee, which includes members of management and one member of the Board of Directors, to communicate, coordinate and control all aspects involving asset/liability management. The committee reports to the Board of Directors of the Bank quarterly and establishes and monitors the volume, maturities, pricing and mix of assets and funding sources with the objective of managing assets and funding sources to provide results that are consistent with liquidity, growth, risk limits and profitability goals.
Net Interest Income Simulation Analysis. We analyze our interest rate sensitivity to manage the risk associated with interest rate movements through the use of interest income simulation. The matching of assets and liabilities may be analyzed by examining the extent to which such assets and liabilities are “interest sensitive.” An asset or liability is said to be interest rate sensitive within a specific time period if it will mature or reprice within that time period.
Our goal is to manage asset and liability positions to moderate the effects of interest rate fluctuations on net interest income. Interest income simulations are completed monthly and presented to the Asset/Liability Committee and Board of Directors of the Bank. The simulations provide an estimate of the impact of changes in interest rates on net interest income under a range of assumptions. The numerous assumptions used in the simulation process are reviewed by the Asset/Liability Committee and the Board of Directors of the Bank on a quarterly basis. Changes to these assumptions can significantly affect the results of the simulation. The simulation incorporates assumptions regarding the potential timing in the repricing of certain assets and liabilities when market rates change and the changes in spreads between different market rates. The simulation analysis incorporates management’s current assessment of the risk that pricing margins will change adversely over time due to competition or other factors.
Simulation analysis is only an estimate of our interest rate risk exposure at a particular point in time. We continually review the potential effect changes in interest rates could have on the repayment of rate sensitive assets and funding requirements of rate sensitive liabilities.
The table below sets forth an approximation of our exposure as a percentage of estimated net interest income for the next 12 month period using interest income simulation. The simulation uses projected repricing of assets and liabilities at December 31, 2009 on the basis of contractual maturities, anticipated repayments and scheduled rate adjustments. Prepayment rates can have a significant impact on interest income simulation. Because of the large percentage of loans we hold, rising or falling interest rates have a significant impact on the prepayment speeds of our earning assets that in turn affect the rate sensitivity position. When interest rates rise, prepayments tend to slow. When interest rates fall, prepayments tend to rise. Our asset sensitivity would be reduced if prepayments slow and vice versa. While we believe such assumptions to be reasonable, there can be no assurance that assumed prepayment rates will approximate future mortgage-backed security and loan repayment activity.
The following table reflects changes in estimated net interest income for the Bank at December 31, 2009 through December 31, 2010.
| Increase (Decrease) |
Net Interest Income | ||||||||||
| $ Amount | $ Change | % Change | |||||||||
| (Dollars In Thousands) | |||||||||||
| 500 | bp | $ | 17,294 | $ | 980 | 6.0 | % | ||||
| 400 | $ | 17,077 | $ | 763 | 4.7 | % | |||||
| 300 | $ | 16,866 | $ | 552 | 3.4 | % | |||||
| 200 | $ | 16,835 | $ | 521 | 3.2 | % | |||||
| 100 | $ | 16,651 | $ | 337 | 2.1 | % | |||||
| — | $ | 16,314 | — | — | |||||||
| (100) | $ | 15,156 | $ | (1,158 | ) | -7.1 | % | ||||
| (200) | $ | 13,933 | $ | (2,381 | ) | -14.6 | % | ||||
The basis points changes in rates in the above table are assumed to occur evenly over the following 12 months.
46
Table of Contents
Liquidity Management. Liquidity is the ability to meet current and future financial obligations of a short-term nature. Our primary sources of funds consist of deposit inflows, loan repayments, maturities and sales of securities, borrowings from the FHLB-Boston and securities sold under agreements to repurchase. While maturities and scheduled amortization of loans and securities are predictable sources of funds, deposit flows and loan prepayments are greatly influenced by general interest rates, economic conditions and competition. Prepayment rates can have a significant impact on interest income. Because of the large percentage of loans we hold, rising or falling interest rates have a significant impact on the prepayment speeds of our earning assets that in turn affect the rate sensitivity position. When interest rates rise, prepayments tend to slow. When interest rates fall, prepayments tend to rise. Our asset sensitivity would be reduced if prepayments slow and vice versa. While we believe these assumptions to be reasonable, there can be no assurance that assumed prepayment rates will approximate actual loan repayment activity. Our short-term investments primarily consist of U.S. Treasury and government agencies, which we use primarily for the collateral purposes for sweep accounts maintained by commercial customers. The balance of these investments fluctuate as the aggregate balance of our sweep accounts fluctuate.
We regularly adjust our investments in liquid assets based upon our assessment of: (1) expected loan demands; (2) expected deposit flows; (3) yields available on interest-earning deposits and securities; and (4) the objectives of our asset/liability management policy.
Our most liquid assets are cash and cash equivalents. The levels of these assets depend on our operating, financing, lending and investing activities during any given period. At December 31, 2009, cash and cash equivalents totaled $20.0 million, net of reserve requirements. Securities classified as available-for-sale whose market value exceeds our cost, which provide additional sources of liquidity, totaled $191,000 at December 31, 2009. Total securities classified as available for sale were $503,000 at December 31, 2009. Other liquid assets as of December 31, 2009 include: U.S. Treasury and government agency securities, net of pledged securities of $14.6 million, and collateralized mortgage obligations of $5.9 million. At December 31, 2009, we had the ability to borrow a total of approximately $102.4 million from the FHLB. In addition, at December 31, 2009 we had the following contingency funding sources available: a $10.0 million available line of credit with the FHLB; an unsecured line of credit of $3.0 million with Bankers Bank, N.E; and the ability to purchase up to $3.0 million in fed funds. During the year ended December 31, 2009, we did not utilize any of the three contingency funding sources. On December 31, 2009, we had $63.7 million of borrowings outstanding. Future growth of our loan portfolio resulting from our expansion efforts may require us to borrow additional funds.
At December 31, 2009, we had $87.2 million in loan commitments outstanding, which consisted of $11.6 million in commercial loan commitments, $5.4 million of mortgage loan commitments, and $515,000 in home equity and consumer commitments; $8.2 million in unadvanced construction loan commitments; $59.2 million in unused lines of credit; and $2.3 million in standby letters of credit. Certificates of deposit due within one year of December 31, 2009 totaled $112.9 million, or 54.7% of certificates of deposit. If these maturing deposits do not remain with us, we will be required to seek other sources of funds, including other certificates of deposit and borrowings. Depending on market conditions, we may be required to pay higher rates on such deposits or other borrowings than we currently pay on the certificates of deposit due on or before December 31, 2010. We believe, however, based on past experience, that a significant portion of our certificates of deposit will remain with us. We have the ability to attract and retain deposits by adjusting the interest rates offered.
The following table sets forth information relating to the Company’s payments due under contractual obligations at December 31, 2009 (in thousands):
| Payments due by period | |||||||||||||||
| Total | Less Than One Year |
One to Three Years |
Three to Five Years |
More Then Five Years | |||||||||||
| Long-term debt |
$ | 63,675 | $ | 5,000 | $ | 20,503 | $ | 28,172 | $ | 10,000 | |||||
| Operating lease obligations |
6,563 | 408 | 763 | 750 | 4,642 | ||||||||||
| Other long-term liabilities reflected on the Company’s balance sheet under GAAP |
— | — | — | — | — | ||||||||||
| Total |
$ | 70,238 | $ | 5,408 | $ | 21,266 | $ | 28,922 | $ | 14,642 | |||||
Our primary investing activities are the origination and purchase of loans and the purchase of securities. Our primary financing activities consist of activity in deposit accounts and FHLB advances. Deposit flows are
47
Table of Contents
affected by the overall level of interest rates, the interest rates and products offered by us and our local competitors and other factors. We generally manage the pricing of our deposits to be competitive and to increase core deposit relationships. Occasionally, we offer promotional rates on certain deposit products to attract deposits.
Capital Management. We are subject to various regulatory capital requirements administered by the FDIC, including a risk-based capital measure. The risk-based capital guidelines include both a definition of capital and a framework for calculating risk-weighted assets by assigning balance sheet assets and off-balance sheet items to broad risk categories. At December 31, 2009, we exceeded all of our regulatory capital requirements. We are considered “well capitalized” under regulatory guidelines.
Total stockholders’ equity increased $155,000, or 0.2%, to $94.2 million at December 31, 2009 from $94.0 million at December 31, 2008. The increase was mainly due to the decrease in unearned compensation and additional paid-in-capital of $1.7 million, and decrease in unrealized losses associated with equities of $1.5 million offset by the purchase of 117,723 shares in 2009 of the Company’s common stock through the Company’s stock repurchase program, at a cost of $1.5 million for the year, and a net loss of $1.6 million for the period. The Company’s book value per share increased 2.0% to $14.76 at December 31, 2009 compared to $14.47 at December 31, 2008. During 2007, 2008 and 2009 we repurchased approximately $2.1 million, or 155,000 shares, $10.4 million, or 787,615 shares and $1.5 million, or 117,723 shares, of our stock respectively. In the future, we may also use other capital management tools such as cash dividends.
Off-Balance Sheet Arrangements. In the normal course of operations, we engage in a variety of financial transactions that, in accordance with U.S. generally accepted accounting principles, are not recorded in our financial statements. These transactions involve, to varying degrees, elements of credit, interest rate and liquidity risk. Such transactions are used primarily to manage customers’ requests for funding and take the form of loan commitments, letters of credit and lines of credit. For information about our loan commitments and unused lines of credit, see note 11 of the notes to the consolidated financial statements. We currently have no plans to engage in hedging activities in the future.
For the years ended December 31, 2009 and December 31, 2008, we engaged in no off-balance sheet transactions reasonably likely to have a material effect on our financial condition, results of operations or cash flows.
Impact of Inflation and Changing Prices.
The financial statements and related financial data presented in this Form 10-K have been prepared in accordance with U.S. generally accepted accounting principles, which require the measurement of financial position and operating results in terms of historical dollars without considering the change in the relative purchasing power of money over time due to inflation. The primary impact of inflation on our operations is reflected in increased operating costs. Unlike most industrial companies, virtually all the assets and liabilities of a financial institution are monetary in nature. As a result, interest rates generally have a more significant impact on a financial institution’s performance than do general levels of inflation. Interest rates do not necessarily move in the same direction or to the same extent as the prices of goods and services.
Application of Critical Accounting Policies.
Our financial statements reflect the selection and application of accounting policies that require management to make significant estimates and judgments. The information pertaining to the Company’s significant accounting policies is incorporated herein by reference to Note 1 “Summary of Significant Accounting Policies” in the Notes to the Consolidated Financial Statements and in the discussion under “Critical Accounting Policies” contained in this Form 10-K.
Item 7A. Quantitative and Qualitative Disclosures about Market Risk.
The information required by this item is incorporated herein by reference to the Section captioned “Management’s Discussion and Analysis of Financial Condition and Results of Operations” in this Annual Report on Form 10-K.
48
Table of Contents
Item 8. Financial Statements and Supplementary Data.
Information required by this item is included herein beginning on page F-1.
Item 9. Changes in and Disagreements with Accountants on Accounting and Financial Disclosure.
None.
Item 9A. Controls and Procedures.
(a) Disclosure Controls and Procedures
The Company’s management, including the Company’s principal executive officer and principal financial officer, have evaluated the effectiveness of the Company’s “disclosure controls and procedures,” as such term is defined in Rule 13a-15(e) promulgated under the Securities Exchange Act of 1934, as amended, (the “Exchange Act”). Based upon their evaluation, the principal executive officer and principal financial officer concluded that, as of the end of the period covered by this report, the Company’s disclosure controls and procedures were effective for the purpose of ensuring that the information required to be disclosed in the reports that the Company files or submits under the Exchange Act with the Securities and Exchange Commission (the “SEC”) (1) is recorded, processed, summarized and reported within the time periods specified in the SEC’s rules and forms, and (2) is accumulated and communicated to the Company’s management, including its principal executive and principal financial officers, as appropriate to allow timely decisions regarding required disclosure.
(b) Internal Controls Over Financial Reporting
Management’s annual report on internal control over financial reporting is incorporated herein by reference to the Company’s audited Consolidated Financial Statements in this 2009 Annual Report on Form 10-K.
(c) Changes to Internal Control Over Financial Reporting
There has been no change in the Company’s internal control over financial reporting identified in connection with the evaluation required by Rule 13a-15 that occurred during the Company’s last fiscal quarter that has materially affected or is reasonably likely to materially affect, the Company’s internal control over financial reporting.
Not applicable.
49
Table of Contents
PART III
Item 10. Directors, Executive Officers and Corporate Governance.
Directors
For information relating to the directors of Chicopee Bancorp, the section captioned “Proposal 1 – Election of Directors” in Chicopee Bancorp’s Proxy Statement for the 2010 Annual Meeting of Stockholders is incorporated by reference.
Executive Officers
For information relating to officers of Chicopee Bancorp, the information contained under “Proposal 1 – Election of Directors” in Chicopee Bancorp’s Proxy Statement for the 2010 Annual Meeting of Stockholders and under Part I, Item 1, “Business — Executive Officers of the Registrant” of this Annual Report on Form 10-K is incorporated by reference.
Compliance with Section 16(a) of the Exchange Act
For information regarding compliance with Section 16(a) of the Exchange Act, the section captioned “Section 16(a) Beneficial Ownership Compliance” in Chicopee Bancorp’s Proxy Statement for the 2010 Annual Meeting of Stockholders is incorporated by reference.
Disclosure of Code of Ethics
A copy of the Code of Ethics and Business Conduct is available to stockholders on the Governance Documents portion of the Investors Relations section on Chicopee Bancorp’s website at www.chicopeesavings.com.
Corporate Governance
For information regarding the audit committee and its composition and the audit committee financial expert, the section captioned “Corporate Governance – Committees of the Board of Directors – Audit Committee” in Chicopee Bancorp’s Proxy Statement for the 2010 Annual Meeting of Stockholders is incorporated by reference.
Item 11. Executive Compensation.
Executive Compensation
For information regarding executive compensation, the sections captioned “Compensation Disclosure and Analysis,” “Executive Compensation” and “Director Compensation” in Chicopee Bancorp’s Proxy Statement for the 2010 Annual Meeting of Stockholders is incorporated by reference.
Corporate Governance
For information regarding the compensation committee report, the section captioned “Compensation Committee Report” in Chicopee Bancorp’s Proxy Statement for the 2010 Annual Meeting of Stockholders is incorporated by reference.
Item 12. Security Ownership of Certain Beneficial Owners and Management and Related Stockholders Matters.
| (a) | Security Ownership of Certain Beneficial Owners Information required by this item is incorporated herein by reference to the section captioned “Stock Ownership” in Chicopee Bancorp’s Proxy Statement for the 2010 Annual Meeting of Stockholders. |
50
Table of Contents
| (b) | Security Ownership of Management Information required by this item is incorporated herein by reference to the section captioned “Stock Ownership” in Chicopee Bancorp’s Proxy Statement for the 2010 Annual Meeting of Stockholders. |
| (c) | Changes in Control |
Management of Chicopee Bancorp knows of no arrangements, including any pledge by any person of securities of Chicopee Bancorp, the operation of which may at a subsequent date result in a change in control of the registrant.
| (d) | Equity Compensation Plan Information |
The following table sets forth information as of December 31, 2009 about Company common stock that may be issued under the Chicopee Bancorp, Inc. 2007 Equity Incentive Plan. The plan was approved by the Company’s stockholders.
| Plan Category |
Number of Securities to be Issued Upon the Exercise of Outstanding Options Warrants and Rights |
Weighted-Average Exercise Price of Outstanding Options Warrants and Rights |
Number of Securities Remaining Available for Future Issuance Under Equity Compensation Plans (Excluding Securities Reflected in the First Column) | ||||
| Equity compensation plans approved by security holders |
864,237 | $ | 14.23 | 59,905 | |||
| Equity compensation plans not approved by security holders |
n/a | n/a | n/a | ||||
| Total |
864,237 | $ | 14.23 | 59,905 | |||
Item 13. Certain Relationships and Related Transactions, and Director Independence.
Certain Relationships and Related Transactions
For information regarding certain relationships and related transactions, the section captioned “Other Information Relating to Directors and Executive Officers Transactions with Related Parties” and “Policies and Procedures for Approval of Related Person Transactions” in Chicopee Bancorp’s Proxy Statement for the 2010 Annual Meeting of Stockholders is incorporated by reference.
Director Independence
For information regarding director independence, the section captioned “Corporate Governance – Director Independence” in Chicopee Bancorp’s Proxy Statement for the 2010 Annual Meeting of Stockholders is incorporated by reference.
Item 14. Principal Accountant Fees and Services.
For information regarding the principal accountant fees and expenses, the section captioned “Proposal 2 – Ratification of Independent Registered Public Accounting Firm” in Chicopee Bancorp’s Proxy Statement for the 2010 Annual Meeting of Stockholders is incorporated by reference.
51
Table of Contents
PART IV
Item 15. Exhibits and Financial Statements Schedules.
1. Financial Statements
The following consolidated financial statements of the Company and its subsidiaries are filed as part of this document under Item 8:
| • | Report of Independent Registered Public Accounting Firm |
| • | Consolidated Balance Sheets at December 31, 2009 and 2008 |
| • | Consolidated Statements of Operations for the Years Ended December 31, 2009, 2008 and 2007 |
| • | Consolidated Statements of Changes in Stockholders’ Equity for the Years Ended December 31, 2009, 2008 and 2007 |
| • | Consolidated Statements of Cash Flows for the Years Ended December 31, 2009, 2008 and 2007 |
| • | Notes to Consolidated Financial Statements |
2. Financial Statement Schedules
Financial Statement Schedules have been omitted because they are not applicable or the required information is shown in the Consolidated Financial Statements or notes thereto.
3. Exhibits
| No. |
Description | |
| 3.1 | Certificate of Incorporation of Chicopee Bancorp, Inc. (1) | |
| 3.2 | Bylaws of Chicopee Bancorp, Inc. (2) | |
| 4.1 | Stock Certificate of Chicopee Bancorp, Inc. (1) | |
| 10.1* | Amended and Restated Employment Agreement between William J. Wagner and Chicopee Bancorp, Inc. (3) | |
| 10.2* | Amended and Restated Employment Agreement between William J. Wagner and Chicopee Savings Bank (3) | |
| 10.3* | Amended and Restated Employment Agreement between W. Guy Ormsby and Chicopee Bancorp, Inc. (3) | |
| 10.4* | Amended and Restated Employment Agreement between W. Guy Ormsby and Chicopee Savings Bank (3) | |
| 10.5* | Amended and Restated Change in Control Agreement between Russell J. Omer and Chicopee Savings Bank (3) | |
| 10.6* | Amended and Restated Change in Control Agreement between Alzira C. Costa and Chicopee Savings Bank (3) | |
| 10.7* | Amended and Restated Change in Control Agreement between Maria J.C. Aigner and Chicopee Savings (3) | |
| 10.8* | Form of Chicopee Savings Bank Employee Stock Ownership Plan (1) | |
| 10.9* | Form of Trust Agreement between Chicopee Savings Bank and the Trustee for Chicopee Savings Bank Employee Stock Ownership Plan Trust (1) | |
| 10.10* | Form of Loan Agreement (1) | |
| 10.11* | Amended and Restated Chicopee Savings Bank Employee Severance Compensation Plan (3) | |
| 10.12* | Amended and Restated Chicopee Savings Bank Supplemental Executive Retirement Plan (3) | |
| 10.13* | Form of Executive Supplemental Retirement Income Agreement between Chicopee Savings Bank and Alzira C. Costa, Russell J. Omer, W. Guy Ormsby and William J. Wagner (1) | |
| 10.14 | Form of First Amendment to the Executive Supplemental Retirement Income Agreement between Chicopee Savings Bank and Alzira C. Costa, Russell J. Omer, W. Guy Ormsby and William J. Wagner (3) | |
| 10.15* | First Amendment to Amended and Restated Employment Agreement between William J. Wagner and Chicopee Bancorp, Inc. (3) | |
| 10.16* | First Amendment to Amended and Restated Employment Agreement between William J. Wagner and Chicopee Savings Bank (3) | |
| 10.17* | First Amendment to Amended and Restated Employment Agreement between W. Guy Ormsby and Chicopee Bancorp, Inc. (3) | |
52
Table of Contents
| 10.18* | First Amendment to Amended and Restated Employment Agreement between W. Guy Ormsby and Chicopee Savings Bank. (3) | |
| 21.0 | List of Subsidiaries | |
| 23.0 | Consent of Berry, Dunn, McNeil & Parker | |
| 31.1 | Rule 13a-14(a)/15d-14(a) Certification of Chief Executive Officer | |
| 31.2 | Rule 13a-14(a)/15d-14(a) Certification of Chief Financial Officer | |
| 32.0 | Section 1350 Certification of Chief Executive Officer and Chief Financial Officer | |
| * | Management contract or compensatory plan, contract or agreement. |
| (1) | Incorporated by reference in this document to the exhibits to the Company’s Registration Statement on Form S-1 (File No. 333-132512) and any amendments thereto, initially filed with the Securities and Exchange Commission on March 17, 2006. |
| (2) | Incorporated by reference in this document to the Company’s Current Report on Form 8-K filed on August 1, 2007 (File No. 000-51996). |
| (3) | Incorporated by reference in this document to the Company’s Annual Report on Form 10-K for the year ended December 31, 2009, filed on March 13, 2009 (File No. 000-51996). |
53
Table of Contents
Pursuant to the requirements of Section 13 or 15(d) of the Securities Exchange Act of 1934, the registrant has duly caused this report to be signed on its behalf by the undersigned, thereunto duly authorized.
| Chicopee Bancorp, Inc. | ||||||
| By: | /s/ William J. Wagner |
March 15, 2010 | ||||
| William J. Wagner | ||||||
| Chairman of the Board, President and Chief Executive Officer | ||||||
Pursuant to the requirements of the Securities Exchange Act of 1934, this report has been signed below by the following persons on behalf of the registrant in the capacities and on the dates indicated.
| Name |
Title |
Date | ||||||
| /s/ William J. Wagner William J. Wagner |
Chairman of the Board, President and Chief Executive Officer (principal executive officer) |
March 15, 2010 | ||||||
| /s/ W. Guy Ormsby W. Guy Ormsby |
Executive Vice President, Chief Financial Officer and Treasurer (principal financial and chief accounting officer) |
March 15, 2010 | ||||||
| /s/ James P. Lynch |
Director | March 15, 2010 | ||||||
| James P. Lynch | ||||||||
| /s/ William D. Masse |
Director | March 15, 2010 | ||||||
| William D. Masse | ||||||||
| /s/ Arthur F. DuBois |
Director | March 15, 2010 | ||||||
| Arthur F. DuBois | ||||||||
| /s/ William J. Giokas |
Director | March 15, 2010 | ||||||
| William J. Giokas | ||||||||
| /s/ Francine Jasinski Hayward |
Director | March 15, 2010 | ||||||
| Francine Jasinski Hayward | ||||||||
| /s/ John P. Moylan |
Director | March 15, 2010 | ||||||
| John P. Moylan | ||||||||
| /s/ Gregg F. Orlen |
Director | March 15, 2010 | ||||||
| Gregg F. Orlen | ||||||||
| /s/ Judith T. Tremble |
Director | March 15, 2010 | ||||||
| Judith T. Tremble | ||||||||
| /s/ Thomas J. Bardon |
Director | March 15, 2010 | ||||||
| Thomas J. Bardon | ||||||||
| /s/ James H. Bugbee |
Director | March 15, 2010 | ||||||
| James H. Bugbee | ||||||||
| /s/ Louis E. Dupuis |
Director | March 15, 2010 | ||||||
| Louis E. Dupuis | ||||||||
54
Table of Contents
| /s/ Douglas K. Engebretson |
Director | March 15, 2010 | ||||||
| Douglas K. Engebretson | ||||||||
| /s/ Gary G. Fitzgerald |
Director | March 15, 2010 | ||||||
| Gary G. Fitzgerald | ||||||||
| /s/ Paul C. Picknelly |
Director | March 15, 2010 | ||||||
| Paul C. Picknelly | ||||||||
55
Table of Contents
Management’s Annual Report on Internal Control over Financial Reporting
The management of Chicopee Bancorp, Inc. and Subsidiaries (collectively the “Company”) is responsible for establishing and maintaining adequate internal control over financial reporting. The Company’s internal control system is a process designed to provide reasonable assurance to the management and board of directors regarding the preparation and fair presentation of published consolidated financial statements.
The Company’s internal control over financial reporting includes policies and procedures that pertain to the maintenance of records that, in reasonable detail, accurately and fairly reflect transactions and dispositions of assets; provide reasonable assurances that transactions are recorded as necessary to permit preparation of consolidated financial statements in accordance with U.S. generally accepted accounting principles (“GAAP”), and that receipts and expenditures are being made only in accordance with authorizations of management and the directors of the Company; and provide reasonable assurance regarding prevention or timely detection of unauthorized acquisition, use or disposition of the Company’s assets that could have a material effect on our consolidated financial statements.
All internal control systems, no matter how well designed, have inherent limitations. Therefore, even those systems determined to be effective can provide only reasonable assurance with respect to consolidated financial statement preparation and presentation. Also, projections of any evaluation of effectiveness to future periods are subject to the risk that controls may become inadequate because of changes in conditions, or that the degree of compliance with the policies or procedures may deteriorate.
The Company’s management assessed the effectiveness of internal control over financial reporting as of December 31, 2009. In making this assessment, management used the criteria set forth by the Committee of Sponsoring Organizations of the Treadway Commission in Internal Control-Integrated Framework. Based on its assessment, management believes that, as of December 31, 2009, the Company’s internal control over financial reporting is effective based on those criteria.
The Company’s independent registered public accounting firm that audited the consolidated financial statements has issued an audit report on our assessment of, and the effective operation of, the Company’s internal control over financial reporting as of December 31, 2009, a copy of which is included in this annual report.
F-1
Table of Contents
REPORT OF INDEPENDENT REGISTERED PUBLIC ACCOUNTING FIRM
The Stockholders and Board of Directors
Chicopee Bancorp, Inc.
We have audited the accompanying consolidated balance sheets of Chicopee Bancorp, Inc. and Subsidiaries as of December 31, 2009 and 2008, and the related consolidated statements of operations, changes in stockholders’ equity, and cash flows for each of the three years in the period ended December 31, 2009. We have also audited Chicopee Bancorp, Inc.’s internal control over financial reporting as of December 31, 2009, based on criteria established in Internal Control — Integrated Framework issued by the Committee of Sponsoring Organizations of the Treadway Commission (COSO). Chicopee Bancorp, Inc.’s management is responsible for these financial statements, for maintaining effective internal control over financial reporting, and for its assessment of the effectiveness of internal control over financial reporting, included in the accompanying Management’s Annual Report on Internal Control Over Financial Reporting. Our responsibility is to express an opinion on these financial statements and an opinion on the Company’s internal control over financial reporting based on our audits.
We conducted our audits in accordance with the standards of the Public Company Accounting Oversight Board (United States). Those standards require that we plan and perform the audits to obtain reasonable assurance about whether the financial statements are free of material misstatement and whether effective internal control over financial reporting was maintained in all material respects. Our audits of the financial statements included examining, on a test basis, evidence supporting the amounts and disclosures in the financial statements, assessing the accounting principles used and significant estimates made by management, and evaluating the overall financial statement presentation. Our audit of internal control over financial reporting included obtaining an understanding of internal control over financial reporting, assessing the risk that a material weakness exists, and testing and evaluating the design and operating effectiveness of internal control based on the assessed risk. Our audits also included performing such other procedures as we considered necessary in the circumstances. We believe that our audits provide a reasonable basis for our opinions.
A company’s internal control over financial reporting is a process designed to provide reasonable assurance regarding the reliability of financial reporting and the preparation of financial statements for external purposes in accordance with GAAP. A company’s internal control over financial reporting includes those policies and procedures that (1) pertain to the maintenance of records that, in reasonable detail, accurately and fairly reflect the transactions and dispositions of the assets of the company; (2) provide reasonable assurance that transactions are recorded as necessary to permit preparation of financial statements in accordance with GAAP, and that receipts and expenditures of the company are being made only in accordance with authorizations of management and directors of the company; and (3) provide reasonable assurance regarding prevention or timely detection of unauthorized acquisition, use, or disposition of the company’s assets that could have a material effect on the financial statements.
Because of its inherent limitations, internal control over financial reporting may not prevent or detect misstatements. Also, projections of any evaluation of effectiveness to future periods are subject to the risk that controls may become inadequate because of changes in conditions, or that the degree of compliance with the policies or procedures may deteriorate.
F-2
Table of Contents
The Stockholders and Board of Directors
Chicopee Bancorp, Inc.
In our opinion, the financial statements referred to above present fairly, in all material respects, the consolidated financial position of Chicopee Bancorp, Inc. and Subsidiaries as of December 31, 2009 and 2008, and the consolidated results of their operations and their consolidated cash flows for each of the three years in the period ended December 31, 2009, in conformity with accounting principles generally accepted in the United States of America. Also, in our opinion, Chicopee Bancorp, Inc. maintained, in all material respects, effective internal control over financial reporting as of December 31, 2009, based on criteria established in Internal Control — Integrated Framework issued by the Committee of Sponsoring Organizations of the Treadway Commission (COSO).

Portland, Maine
March 16, 2010
F-3
Table of Contents
CHICOPEE BANCORP, INC. AND SUBSIDIARIES
CONSOLIDATED BALANCE SHEETS
| December 31, | ||||||||
| 2009 | 2008 | |||||||
| (In thousands, except share data) | ||||||||
| ASSETS |
||||||||
| Cash and due from banks |
$ | 9,757 | $ | 21,758 | ||||
| Short-term investments |
16 | 342 | ||||||
| Federal funds sold |
10,302 | 1,000 | ||||||
| Cash and cash equivalents |
20,075 | 23,100 | ||||||
| Securities available-for-sale, at fair value |
503 | 5,268 | ||||||
| Securities held-to-maturity, at cost (fair value $63,130 and $49,673 at December 31, 2009 and 2008, respectively) |
62,983 | 49,662 | ||||||
| Federal Home Loan Bank stock, at cost |
4,306 | 4,306 | ||||||
| Loans receivable, net of allowance for loan losses ($4,077 at December 31, 2009 and $3,333 at December 31, 2008) |
424,655 | 416,076 | ||||||
| Loans held for sale |
534 | 185 | ||||||
| Other real estate owned |
80 | 269 | ||||||
| Mortgage servicing rights |
297 | 75 | ||||||
| Bank owned life insurance |
12,610 | 12,144 | ||||||
| Premises and equipment, net |
10,652 | 10,677 | ||||||
| Accrued interest receivable |
1,629 | 1,577 | ||||||
| Deferred income tax asset |
2,112 | 2,434 | ||||||
| Other assets |
3,714 | 1,926 | ||||||
| Total assets |
$ | 544,150 | $ | 527,699 | ||||
| LIABILITIES AND STOCKHOLDERS’ EQUITY |
||||||||
| Deposits |
||||||||
| Noninterest-bearing |
$ | 43,398 | $ | 30,811 | ||||
| Interest-bearing |
322,100 | 303,956 | ||||||
| Total deposits |
365,498 | 334,767 | ||||||
| Securities sold under agreements to repurchase |
20,422 | 21,956 | ||||||
| Advances from Federal Home Loan Bank |
63,675 | 76,567 | ||||||
| Accrued expenses and other liabilities |
383 | 392 | ||||||
| Total liabilities |
449,978 | 433,682 | ||||||
| Stockholders’ equity |
||||||||
| Common stock (no par value, 20,000,000 shares authorized, 7,439,368 shares issued at December 31, 2009 and December 31, 2008) |
72,479 | 72,479 | ||||||
| Treasury stock, at cost (1,060,338 shares at December 31, 2009 and 942,615 shares at December 31, 2008) |
(13,951 | ) | (12,483 | ) | ||||
| Additional paid-in capital |
1,765 | 1,168 | ||||||
| Unearned compensation (restricted stock awards) |
(2,269 | ) | (3,107 | ) | ||||
| Unearned compensation (Employee Stock Ownership Plan) |
(4,761 | ) | (5,059 | ) | ||||
| Retained earnings |
40,843 | 42,439 | ||||||
| Accumulated other comprehensive income (loss) |
66 | (1,420 | ) | |||||
| Total stockholders’ equity |
94,172 | 94,017 | ||||||
| Total liabilities and stockholders’ equity |
$ | 544,150 | $ | 527,699 | ||||
The accompanying notes are an integral part of these consolidated financial statements.
F-4
Table of Contents
CHICOPEE BANCORP, INC. AND SUBSIDIARIES
CONSOLIDATED STATEMENTS OF OPERATIONS
| Years Ended December 31, | ||||||||||||
| 2009 | 2008 | 2007 | ||||||||||
| (In thousands, except share data) | ||||||||||||
| Interest and dividend income: |
||||||||||||
| Loans, including fees |
$ | 23,676 | $ | 24,125 | $ | 23,693 | ||||||
| Interest and dividends on securities |
783 | 1,254 | 1,806 | |||||||||
| Other interest-earning assets |
29 | 404 | 806 | |||||||||
| Total interest and dividend income |
24,488 | 25,783 | 26,305 | |||||||||
| Interest expense: |
||||||||||||
| Deposits |
7,205 | 9,391 | 10,867 | |||||||||
| Securities sold under agreements to repurchase |
210 | 348 | 345 | |||||||||
| Other borrowed funds |
1,692 | 1,450 | 571 | |||||||||
| Total interest expense |
9,107 | 11,189 | 11,783 | |||||||||
| Net interest income |
15,381 | 14,594 | 14,522 | |||||||||
| Provision for loan losses |
897 | 315 | 223 | |||||||||
| Net interest income, after provision for loan losses |
14,484 | 14,279 | 14,299 | |||||||||
| Non-interest income: |
||||||||||||
| Service charges, fee and commissions |
1,507 | 1,602 | 1,218 | |||||||||
| Loan sales and servicing, net |
629 | (13 | ) | (7 | ) | |||||||
| Net (loss) gain on sales of securities available-for-sale |
382 | (47 | ) | 835 | ||||||||
| Loss on sales of other than temporarily impaired securities |
(241 | ) | (10 | ) | — | |||||||
| Loss on sale of other real estate owned |
(28 | ) | — | — | ||||||||
| Income from bank owned life insurance |
466 | 469 | 475 | |||||||||
| Total non-interest income |
2,715 | 2,001 | 2,521 | |||||||||
| Non-interest expenses: |
||||||||||||
| Salaries and employee benefits |
10,258 | 9,496 | 8,388 | |||||||||
| Occupancy expenses |
1,607 | 1,152 | 1,015 | |||||||||
| Furniture and equipment |
1,139 | 974 | 976 | |||||||||
| FDIC insurance assessment |
539 | 47 | 40 | |||||||||
| Data processing |
1,089 | 907 | 746 | |||||||||
| Professional fees |
578 | 753 | 597 | |||||||||
| Advertising |
514 | 488 | 468 | |||||||||
| Other than temporary impairment charge |
1,403 | — | — | |||||||||
| Stationery, supplies and postage |
383 | 351 | 333 | |||||||||
| Other non-interest expense |
1,912 | 1,714 | 1,639 | |||||||||
| Total non-interest expenses |
19,422 | 15,882 | 14,202 | |||||||||
| Income (loss) before income taxes |
(2,223 | ) | 398 | 2,618 | ||||||||
| Income tax expense (benefit) |
(627 | ) | 376 | 1,018 | ||||||||
| Net income (loss) |
$ | (1,596 | ) | $ | 22 | $ | 1,600 | |||||
| Earnings (loss) per share: |
||||||||||||
| Basic |
$ | (0.28 | ) | $ | — | $ | 0.24 | |||||
| Diluted |
$ | (0.28 | ) | $ | — | $ | 0.24 | |||||
| Adjusted weighted average common shares outstanding |
||||||||||||
| Basic |
5,715,618 | 5,986,141 | 6,722,067 | |||||||||
| Diluted |
5,715,618 | 5,986,427 | 6,737,720 | |||||||||
The accompanying notes are an integral part of these consolidated financial statements.
F-5
Table of Contents
CHICOPEE BANCORP, INC. AND SUBSIDIARIES
CONSOLIDATED STATEMENTS OF CHANGES IN STOCKHOLDERS’ EQUITY
Years Ended December 31, 2009, 2008 and 2007
| Common Stock |
Treasury Stock |
Additional Paid-in Capital |
Unearned Compensation (restricted stock awards) |
Unearned Compensation (ESOP) |
Retained Earnings |
Accumulated Other Comprehensive Income (Loss) |
Total | |||||||||||||||||||||||
| (In thousands, except number of shares) | ||||||||||||||||||||||||||||||
| Balance at December 31, 2006 |
$ | 72,479 | $ | — | $ | 144 | $ | — | $ | (5,654 | ) | $ | 40,817 | $ | 660 | $ | 108,446 | |||||||||||||
| Comprehensive income: |
||||||||||||||||||||||||||||||
| Net income |
— | — | — | — | — | 1,600 | — | 1,600 | ||||||||||||||||||||||
| Change in net unrealized gain on securities available-for-sale (net of deferred income taxes of $228) |
— | — | — | — | — | — | (426 | ) | (426 | ) | ||||||||||||||||||||
| Total comprehensive income |
1,174 | |||||||||||||||||||||||||||||
| Purchase of common stock for funding of restricted stock awards (297,574 shares) |
— | — | — | (4,365 | ) | — | — | — | (4,365 | ) | ||||||||||||||||||||
| Treasury stock purchased (155,000 shares) |
— | (2,108 | ) | — | — | — | — | — | (2,108 | ) | ||||||||||||||||||||
| Change in unearned compensation: |
||||||||||||||||||||||||||||||
| Stock option expense |
— | — | 292 | — | — | — | — | 292 | ||||||||||||||||||||||
| Restricted stock award expense |
— | — | — | 425 | — | — | — | 425 | ||||||||||||||||||||||
| Common stock held by ESOP committed to be released |
— | — | 137 | — | 298 | — | — | 435 | ||||||||||||||||||||||
| Balance at December 31, 2007 |
72,479 | (2,108 | ) | 573 | (3,940 | ) | (5,356 | ) | 42,417 | 234 | 104,299 | |||||||||||||||||||
| Comprehensive loss: |
||||||||||||||||||||||||||||||
| Net income |
— | — | — | — | — | 22 | — | 22 | ||||||||||||||||||||||
| Change in net unrealized gain on securities available-for-sale (net of deferred income taxes of $886) |
— | — | — | — | — | — | (1,654 | ) | (1,654 | ) | ||||||||||||||||||||
| Total comprehensive loss |
(1,632 | ) | ||||||||||||||||||||||||||||
| Treasury stock purchased (787,615 shares) |
— | (10,375 | ) | — | — | — | — | — | (10,375 | ) | ||||||||||||||||||||
| Change in unearned compensation: |
||||||||||||||||||||||||||||||
| Stock option expense |
— | — | 514 | — | — | — | — | 514 | ||||||||||||||||||||||
| Restricted stock award expense |
— | — | — | 833 | — | — | — | 833 | ||||||||||||||||||||||
| Common stock held by ESOP committed to be released |
— | — | 81 | — | 297 | — | — | 378 | ||||||||||||||||||||||
| Balance at December 31, 2008 |
72,479 | (12,483 | ) | 1,168 | (3,107 | ) | (5,059 | ) | 42,439 | (1,420 | ) | 94,017 | ||||||||||||||||||
| Comprehensive loss: |
||||||||||||||||||||||||||||||
| Net loss |
— | — | — | — | — | (1,596 | ) | — | (1,596 | ) | ||||||||||||||||||||
| Change in net unrealized loss on securities available-for-sale (net of deferred income taxes of $795) |
— | — | — | — | — | — | 1,486 | 1,486 | ||||||||||||||||||||||
| Total comprehensive loss |
(110 | ) | ||||||||||||||||||||||||||||
| Treasury stock purchased (117,723 shares) |
— | (1,468 | ) | — | — | — | — | — | (1,468 | ) | ||||||||||||||||||||
| Change in unearned compensation: |
||||||||||||||||||||||||||||||
| Stock option expense |
— | — | 524 | — | — | — | — | 524 | ||||||||||||||||||||||
| Restricted stock award expense |
— | — | — | 838 | — | — | — | 838 | ||||||||||||||||||||||
| Common stock held by ESOP committed to be released |
— | — | 73 | — | 298 | — | — | 371 | ||||||||||||||||||||||
| Balance at December 31, 2009 |
$ | 72,479 | $ | (13,951 | ) | $ | 1,765 | $ | (2,269 | ) | $ | (4,761 | ) | $ | 40,843 | $ | 66 | $ | 94,172 | |||||||||||
The accompanying notes are an integral part of these consolidated financial statements.
F-6
Table of Contents
CHICOPEE BANCORP, INC. AND SUBSIDIARIES
CONSOLIDATED STATEMENTS OF CASH FLOWS
| Years Ended December 31, | ||||||||||||
| 2009 | 2008 | 2007 | ||||||||||
| (In thousands) | ||||||||||||
| Cash flows from operating activities: |
||||||||||||
| Net income (loss) |
$ | (1,596 | ) | $ | 22 | $ | 1,600 | |||||
| Adjustments to reconcile net income (loss) to net cash provided by operating activities: |
||||||||||||
| Depreciation and amortization |
1,145 | 1,095 | 757 | |||||||||
| Provision for loan losses |
897 | 315 | 223 | |||||||||
| Increase in cash surrender value of life insurance |
(466 | ) | (469 | ) | (475 | ) | ||||||
| Realized losses (gains) on investment securities, net |
(382 | ) | 47 | (835 | ) | |||||||
| Realized losses on other than temporarily impaired securities |
241 | 10 | — | |||||||||
| Other than temporary impairment charge |
1,403 | — | — | |||||||||
| Realized losses on disposal of property and equipment |
— | 1 | 4 | |||||||||
| Realized gains on sales of mortgages |
(352 | ) | (22 | ) | (3 | ) | ||||||
| Net loss on sales of loans and other real estate owned |
28 | — | — | |||||||||
| Net change in loans originated for resale |
(349 | ) | (185 | ) | — | |||||||
| Paydowns on other real estate owned |
187 | — | — | |||||||||
| Deferred income tax expense (benefit) |
(473 | ) | 363 | (145 | ) | |||||||
| Decrease (increase) in other assets |
(1,788 | ) | (1,045 | ) | 142 | |||||||
| Decrease (increase) in accrued interest receivable |
(52 | ) | 175 | 148 | ||||||||
| Increase (decrease) in other liabilities |
(9 | ) | (740 | ) | 67 | |||||||
| Change in unearned compensation |
1,733 | 1,725 | 1,152 | |||||||||
| Net cash provided by operating activities |
167 | 1,292 | 2,635 | |||||||||
| Cash flows from investing activities: |
||||||||||||
| Additions to premises and equipment |
(1,012 | ) | (4,469 | ) | (796 | ) | ||||||
| Loan originations and principal collections, net |
(9,754 | ) | (36,792 | ) | (11,123 | ) | ||||||
| Proceeds from sale of other real estate owned |
252 | — | — | |||||||||
| Proceeds from sales of securities available-for-sale |
8,086 | 2,595 | 5,117 | |||||||||
| Proceeds from calls of securities held-to-maturity |
5,000 | — | — | |||||||||
| Purchases of securities available-for-sale |
(2,301 | ) | (2,780 | ) | (4,947 | ) | ||||||
| Purchases of securities held-to-maturity |
(132,035 | ) | (327,157 | ) | (106,788 | ) | ||||||
| Maturities of securities held-to-maturity |
112,800 | 304,724 | 116,879 | |||||||||
| Proceeds from principal paydowns of securities held-to-maturity |
935 | — | — | |||||||||
| Net purchase of FHLB stock |
— | (2,723 | ) | — | ||||||||
| Net cash used in investing activities |
(18,029 | ) | (66,602 | ) | (1,658 | ) | ||||||
| Cash flows from financing activities: |
||||||||||||
| Net increase in deposits |
30,731 | 8,694 | 13,505 | |||||||||
| Net increase (decrease) in securities sold under agreements to repurchase |
(1,534 | ) | 7,777 | 1,467 | ||||||||
| Proceeds from long-term FHLB advances |
29,000 | 52,000 | — | |||||||||
| Payments on long-term FHLB advances |
(31,892 | ) | (3,207 | ) | (2,483 | ) | ||||||
| Net increase (decrease) in short-term advances |
(10,000 | ) | 10,000 | 5,000 | ||||||||
| Stock purchased for treasury |
(1,468 | ) | (10,375 | ) | (2,108 | ) | ||||||
| Stock purchased for restricted stock awards |
— | — | (4,365 | ) | ||||||||
| Net cash provided by financing activities |
14,837 | 64,889 | 11,016 | |||||||||
| Net increase (decrease) in cash and cash equivalents |
(3,025 | ) | (421 | ) | 11,993 | |||||||
| Cash and cash equivalents at beginning of year |
23,100 | 23,521 | 11,528 | |||||||||
| Cash and cash equivalents at end of year |
$ | 20,075 | $ | 23,100 | $ | 23,521 | ||||||
| Supplemental cash flow information: |
||||||||||||
| Interest paid on deposits |
$ | 7,205 | $ | 9,391 | $ | 10,867 | ||||||
| Interest paid on borrowings |
1,865 | 1,701 | 904 | |||||||||
| Income taxes paid |
63 | 822 | 1,057 | |||||||||
| Transfers from loans to other real estate owned |
277 | 269 | — | |||||||||
The accompanying notes are an integral part of these consolidated financial statements.
F-7
Table of Contents
CHICOPEE BANCORP, INC. AND SUBSIDIARIES
NOTES TO CONSOLIDATED FINANCIAL STATEMENTS
Years Ended December 31, 2009, 2008 and 2007
(Dollars in Thousands, Except Per Share Amounts)
Nature of Business
Chicopee Bancorp, Inc. (the “Company”), a Massachusetts corporation, was formed on March 14, 2006 by Chicopee Savings Bank (the “Bank”) to become the holding company for the Bank upon completion of the Bank’s conversion from a mutual savings bank to a stock savings bank. The conversion of the Bank was completed on July 19, 2006.
The Company provides a variety of financial services to individuals and businesses through its bank subsidiary Chicopee Savings Bank. The Bank is a Massachusetts state-chartered savings bank operating seven branches in Western Massachusetts. The Bank’s primary source of revenue is earned by providing loans to small and middle-market businesses and to residential property homeowners. Its primary deposit products are savings and term certificate accounts.
| 1. | SUMMARY OF SIGNIFICANT ACCOUNTING POLICIES |
Basis of presentation and consolidation
The consolidated financial statements include the accounts of Chicopee Bancorp, Inc. and its wholly-owned subsidiaries, Chicopee Savings Bank and Chicopee Funding Corporation. The accounts of the Bank include all of its wholly-owned subsidiaries, Cabot Management Corporation, Cabot Realty, LLC, CSB Colts, Inc., and CSB Investment Corporation.
All significant intercompany balances and transactions have been eliminated in consolidation.
Use of estimates
In preparing consolidated financial statements in conformity with GAAP, management is required to make estimates and assumptions that affect the reported amounts of assets and liabilities as of the date of the balance sheet and reported amounts of revenues and expenses during the reporting period. Actual results could differ from those estimates.
Material estimates that are particularly susceptible to significant change in the near term relate to the determination of the allowance for loan losses, the valuation of servicing assets, the valuation of other real estate owned, the determination of other-than-temporary impairment of investment securities (“OTTI”), and the deferred tax valuation allowance. In connection with the determination of the allowance for loan losses and the carrying value of other real estate owned, management obtains independent appraisals for significant properties. While management uses available information to recognize losses on loans and other real estate owned, future additions to the allowance for loan losses or future write-downs of other real estate owned may be necessary based upon changes in economic and market conditions.
In addition, various regulatory agencies, as an integral part of their examination process, periodically review the Company’s allowance for loan losses and the valuation of its other real estate owned. Such agencies may require the Company to recognize additions to the allowance for loan losses or write-down of other real estate owned based upon their judgment about information available to them at the time of their examination.
F-8
Table of Contents
CHICOPEE BANCORP, INC. AND SUBSIDIARIES
NOTES TO CONSOLIDATED FINANCIAL STATEMENTS (Continued)
(Dollars in Thousands, Except Per Share Amounts)
SUMMARY OF SIGNIFICANT ACCOUNTING POLICIES (continued)
Significant group concentrations of credit risk
The Company does not have any significant concentrations to any one industry or customer. Although the Company has a diversified loan portfolio, most of the Company’s activities are with customers located in Western Massachusetts. As a result, the Company and its borrowers may be especially vulnerable to the consequences of changes in the local economy.
Cash and cash equivalents
For purposes of the consolidated statements of cash flows, cash and cash equivalents include cash, due from banks, short-term investments with original maturities of ninety days or less and federal funds sold.
The Company’s due from bank accounts, at times, may exceed federally insured limits. The Company has not experienced any losses in such accounts. The Company believes it is not exposed to any significant risk on cash and cash equivalents.
Securities
Debt securities that management has the positive intent and ability to hold to maturity are classified as “held-to-maturity” and recorded at amortized cost. Securities not classified as held-to-maturity, including equity securities with readily determinable fair values, are classified as “available-for-sale” and recorded at fair value, with unrealized gains and temporary unrealized losses excluded from earnings and reported in other comprehensive income (loss). Non-marketable equity securities are carried at cost and evaluated for impairment.
Purchase premiums and discounts are recognized in interest income over the period to call or maturity using a method which yields results that do not differ materially from those which would be recognized by use of the effective-yield method. For declines in the fair value of individual debt securities available-for-sale below their cost that are deemed to be other-than-temporary, where the Company does not intend to sell the security and it is more likely than not that the Company will not be required to sell the security before recovery of its amortized cost basis, the other-than-temporary decline in the fair value of the debt security related to 1) credit loss is recognized in earnings and 2) other factors is recognized in other comprehensive income or loss. Credit loss is determined to exist if the present value of expected future cash flows using the effective rate at acquisition is less than the amortized cost basis of the debt security. For individual debt securities where the Company intends to sell the security or more likely than not will be required to sell the security before recovery of its amortized cost, the other-than-temporary impairment is recognized in earnings equal to the difference between the security’s cost basis and its fair value at the balance sheet date. Gains and losses on the sale of securities are recorded on the trade date and are determined using the specific identification method.
Other-Than-Temporary Impairment of Investment Securities
One of the significant estimates related to investment securities is the evaluation of other-than-temporary impairment. The evaluation of securities for other-than-temporary impairment is a quantitative and qualitative process, which is subject to risks and uncertainties and is intended to determine whether declines in the fair value of investments should be recognized in current period earnings. The risks and uncertainties include changes in general economic conditions, the issuer’s financial condition and/or future prospects, the effects of changes in interest rates or credit spreads and the expected recovery period of unrealized losses. Securities that are in an unrealized loss position are reviewed at least quarterly to determine if other-than-temporary
F-9
Table of Contents
CHICOPEE BANCORP, INC. AND SUBSIDIARIES
NOTES TO CONSOLIDATED FINANCIAL STATEMENTS (Continued)
(Dollars in Thousands, Except Per Share Amounts)
SUMMARY OF SIGNIFICANT ACCOUNTING POLICIES (continued)
impairment is present based on certain quantitative and qualitative factors and measures. The primary factors considered in evaluating whether a decline in value of securities is other-than-temporary include: (a) the length of time and extent to which the fair value has been less than cost or amortized cost and the expected recovery period of the security, (b) the financial condition, credit rating and future prospects of the issuer, (c) whether the debtor is current on contractually obligated interest and principal payments, (d) the volatility of the securities market price, (e) the intent and ability of the Company to retain the investment for a period of time sufficient to allow for recovery, which may be at maturity and (f) any other information and observable data considered relevant in determining whether other-than-temporary impairment has occurred, including the expectation of receipt of all principal and interest due.
Loans held for sale
Loans originated and intended for sale in the secondary market are carried at the lower of cost or estimated fair value, as determined by current investor yield requirements, in the aggregate. Net unrealized losses, if any, are recognized through a valuation allowance by charges to income.
Loans
The Company grants mortgage, commercial and consumer loans to customers. Loans that management has the intent and ability to hold for the foreseeable future or until maturity or pay-off generally are reported at their outstanding unpaid principal balances adjusted for charge-offs, the allowance for loan losses, and any deferred fees or costs on originated loans. Interest income is accrued on the unpaid principal balance. Loan origination fees, net of certain direct origination costs, are deferred and recognized as an adjustment of the related loan yield using the interest method.
Loans past due 30 days or more are considered delinquent. The accrual of interest on loans is discontinued when, in the judgment of management, the collectability of the principal or interest becomes doubtful. It is the policy of the Company to discontinue the accrual of interest when principal or interest payments are delinquent ninety days or more. The accrual of interest is also discontinued for impaired loans that are delinquent ninety days or more or at management’s discretion.
All interest accrued, but not collected, for loans that are placed on nonaccrual or charged off is reversed against interest income. Interest recognized on these loans is limited to interest payments received until qualifying for return to accrual. Loans are returned to accrual status when all the principal and interest amounts contractually due are brought current and future payments are reasonably assured.
Allowance for loan losses
The allowance for loan losses is established as losses are estimated to have occurred through a provision for loan losses charged to earnings. Loan losses are charged against the allowance when management believes the uncollectibility of a loan balance is confirmed. Subsequent recoveries, if any, are credited to the allowance.
F-10
Table of Contents
CHICOPEE BANCORP, INC. AND SUBSIDIARIES
NOTES TO CONSOLIDATED FINANCIAL STATEMENTS (Continued)
(Dollars in Thousands, Except Per Share Amounts)
SUMMARY OF SIGNIFICANT ACCOUNTING POLICIES (continued)
Allowance for loan losses (continued)
Management believes the allowance for loan losses requires the most significant estimates and assumptions used in the preparation of the consolidated financial statements. The allowance for loan losses is based on management’s evaluation of the level of the allowance required in relation to the probable loss exposure in the loan portfolio. The allowance for loan losses is evaluated on a regular basis by management. Factors considered in evaluating the adequacy of the allowance include previous loss experience, the character and size of the loan portfolio, current economic conditions and their effect on borrowers and the performance of individual loans in relation to contract terms, and management’s estimation of probable losses. This evaluation is inherently subjective as it requires estimates that are susceptible to significant revision as more information becomes available.
The allowance consists of specific, general and unallocated components. The specific component relates to loans that are classified as either; doubtful, substandard, or special mention. For such loans that are also classified as impaired, an allowance is established when the discounted cash flows (or collateral value or observable market price) of the impaired loan is lower than the carrying value of that loan. The general component covers non-classified loans and is based on historical loss experience adjusted for qualitative factors. An unallocated component is maintained to cover uncertainties that could affect management’s estimate of probable losses. The unallocated component of the allowance reflects the margin of imprecision inherent in the underlying assumptions used in the methodologies for estimating specific and general losses in the portfolio.
A loan is considered impaired when, based on current information and events, it is probable that the Company will be unable to collect the scheduled payments of principal or interest when due according to the contractual terms of the loan agreement. Factors considered by management in determining impairment include payment status, collateral value, and the probability of collecting scheduled principal and interest payments when due. Loans that experience insignificant payment delays and payment shortfalls generally are not classified as impaired. Management determines the significance of payment delays and payment shortfalls on a case-by-case basis, taking into consideration all of the circumstances surrounding the loan and the borrower, including the length of the delay, the reasons for the delay, the borrower’s prior payment record, and the amount of the shortfall in relation to the principal and interest owed. Impairment is measured on a loan-by-loan basis for commercial loans by either the present value of expected future cash flows discounted at the loan’s effective interest rate, the loan’s obtainable market price, or the fair value of the collateral if the loan is collateral dependent.
Large groups of smaller balance homogeneous loans are collectively evaluated for impairment. Accordingly, the Company does not separately identify individual consumer and residential loans for impairment evaluation.
F-11
Table of Contents
CHICOPEE BANCORP, INC. AND SUBSIDIARIES
NOTES TO CONSOLIDATED FINANCIAL STATEMENTS (Continued)
(Dollars in Thousands, Except Per Share Amounts)
SUMMARY OF SIGNIFICANT ACCOUNTING POLICIES (continued)
Loan servicing
The valuation of mortgage servicing rights is a critical accounting policy, which requires significant estimates and assumptions. The Bank often sells mortgage loans it originates and retains the ongoing servicing of such loans, receiving a fee for these services, generally 1% of the outstanding balance of the loan per annum. Servicing assets are recognized at fair value as separate assets when servicing rights are acquired through the sale of loans. Capitalized servicing rights are reported in other assets and are amortized against non-interest income in proportion to, and over the period of, the estimated future net servicing income of the underlying financial assets. Management uses an independent firm which specializes in the valuation of mortgage servicing rights to determine fair value. The most important assumption is the anticipated loan prepayment rate, and increases in prepayment speed results in lower valuations of mortgage servicing rights. Servicing assets are evaluated for impairment based upon the fair value of the rights as compared to amortized cost. Impairment is determined by stratifying rights by predominant characteristics, such as interest rate in increments of 50 basis points and term primarily of 15 and 30 years. Fair value is based upon discounted cash flows using market-based assumptions. Projected prepayments on the portfolio are estimated using the Public Securities Association Standard Prepayment Model. Impairment is recognized through a valuation allowance for an individual stratum, to the extent that fair value is less than the capitalized amount for the stratum. The use of different assumptions could produce a different valuation. All of the assumptions are based on standards the Company believes would be utilized by market participants in valuing mortgage servicing rights and are consistently derived and/or benchmarked against independent public sources.
Credit related financial instruments
In the ordinary course of business, the Company has entered into commitments to extend credit, including commercial letters of credit and standby letters of credit. Such financial instruments are recorded when they are funded.
Other real estate owned
Periodically, the Company acquires property in connection with foreclosures or in satisfaction of debt previously contracted. The valuation of this property is accounted for individually based on its net realizable value on the date of acquisition. At the acquisition date, if the net realizable value of the property is less than the book value of the loan, a charge or reduction in the allowance for loan losses is recorded. If the value of the property becomes permanently impaired, as determined by an appraisal or an evaluation in accordance with the Company’s appraisal policy, the Company will record the decline by charging against current earnings. Upon acquisition of a property, a current appraisal or broker’s opinion must substantiate market value for the property.
Premises and equipment
Land is carried at cost. Buildings, leasehold improvements and equipment are stated at cost, less accumulated depreciation and amortization, computed on the straight-line method over the shorter of the estimated useful lives of the assets or the lease term.
F-12
Table of Contents
CHICOPEE BANCORP, INC. AND SUBSIDIARIES
NOTES TO CONSOLIDATED FINANCIAL STATEMENTS (Continued)
(Dollars in Thousands, Except Per Share Amounts)
SUMMARY OF SIGNIFICANT ACCOUNTING POLICIES (continued)
Income taxes
Deferred income tax assets and liabilities are determined using the liability (or balance sheet) method. Under this method, the net deferred tax asset or liability is determined based on the tax effects of the temporary differences between the book and tax bases of the various balance sheet assets and liabilities and gives current recognition to changes in tax rates and laws.
Employee stock ownership plan (“ESOP”)
Compensation expense is recognized as ESOP shares are committed to be released and is calculated based upon the average market price for the current year. Allocated and committed-to-be-released ESOP shares are considered outstanding for earnings (loss) per share calculations based on debt service payments. Other ESOP shares are excluded from earnings (loss) per share calculations. Dividends declared on allocated ESOP shares are charged to retained earnings. Dividends declared on unallocated ESOP shares are used to satisfy debt service. The value of unearned shares to be allocated to ESOP participants for future services not yet performed is reflected as a reduction of stockholders’ equity.
Equity Incentive Plan
The Company expenses compensation cost associated with share-based payment transactions, such as options and restricted stock awards, in the financial statements over the requisite service (vesting) period.
Advertising
Advertising costs are expensed as incurred.
Earnings (loss) per common share
Basic earnings (loss) per share represents income available to common stockholders divided by the weighted-average number of common shares outstanding during the period. The adjusted outstanding common shares equals the gross number of common shares issued less treasury shares, unallocated shares of the Chicopee Savings Bank ESOP, and dilutive restricted stock awards under the 2007 Equity Incentive Plan. Diluted earnings (loss) per share reflects additional common shares that would have been outstanding if dilutive potential common shares had been issued. Potential common shares that may be issued by the Company relate to outstanding stock options and certain stock awards and are determined using the treasury stock method.
Unvested share-based payment awards that contain non-forfeitable rights to dividends or dividend equivalents are participating securities and, therefore, are included in computing earnings per share pursuant to the two-class method. The two-class method determines earnings per share for each class of common stock and participating securities according to dividends or dividend equivalents and their respective participation rights in undistributed earnings. The Company’s stock options and stock awards receive non-forfeitable dividends at the same rate as common stock. The following table sets forth the computation of basic and diluted earnings per share under the two-class method:
F-13
Table of Contents
CHICOPEE BANCORP, INC. AND SUBSIDIARIES
NOTES TO CONSOLIDATED FINANCIAL STATEMENTS (Continued)
(Dollars in Thousands, Except Per Share Amounts)
SUMMARY OF SIGNIFICANT ACCOUNTING POLICIES (continued)
| Years Ended December 31, | ||||||||||||
| 2009 | 2008 | 2007 | ||||||||||
| Net income (loss) (in thousands) |
$ | (1,596 | ) | $ | 22 | $ | 1,600 | |||||
| Weighted average number of common shares issued |
7,439,368 | 7,439,368 | 7,439,368 | |||||||||
| Less: average number of treasury shares |
(1,008,680 | ) | (649,241 | ) | (23,096 | ) | ||||||
| Less: average number of unallocated ESOP shares |
(505,878 | ) | (535,635 | ) | (565,392 | ) | ||||||
| Less: average number of nonvested restricted stock awards |
(209,192 | ) | (268,351 | ) | (128,813 | ) | ||||||
| Adjusted weighted average number of common shares outstanding |
5,715,618 | 5,986,141 | 6,722,067 | |||||||||
| Plus: dilutive nonvested restricted stock awards |
— | 286 | 15,653 | |||||||||
| Weighted average number of diluted shares outstanding |
5,715,618 | 5,986,427 | 6,737,720 | |||||||||
| Net income (loss) per share: |
||||||||||||
| Basic- common stock |
$ | (0.28 | ) | $ | — | $ | 0.24 | |||||
| Basic- unvested share-based payment awards |
$ | (0.28 | ) | $ | — | $ | 0.24 | |||||
| Diluted- common stock |
$ | (0.28 | ) | $ | — | $ | 0.24 | |||||
| Diluted- unvested share-based payment awards |
$ | (0.28 | ) | $ | — | $ | 0.24 | |||||
There were 688,167, 671,667, and 693,267 stock options for the years ended December 31, 2009, 2008 and 2007, which were excluded from the diluted earnings per share because their effect is anti-dilutive.
Comprehensive income (loss)
Accounting principles generally require that recognized revenue, expenses, gains and losses be included in net income or loss. Although certain changes in assets and liabilities, such as unrealized gains and losses on available-for-sale securities, are reported as a separate component of the stockholders’ equity section of the balance sheet, such items, along with net income or loss, are components of comprehensive income or loss.
The components of other comprehensive income (loss) and related tax effects are as follows:
| Years Ended December 31, | ||||||||||||
| 2009 | 2008 | 2007 | ||||||||||
| Unrealized holding gains (losses) on available-for-sale securities arising during the year |
$ | 1,019 | $ | (2,597 | ) | $ | 181 | |||||
| Other than temporary impairment charge realized in income |
1,403 | — | — | |||||||||
| Reclassification adjustment for (gains) losses realized in income |
(141 | ) | 57 | (835 | ) | |||||||
| Net unrealized holding gains (losses) |
2,281 | (2,540 | ) | (654 | ) | |||||||
| Tax effect |
(795 | ) | 886 | 228 | ||||||||
| Other comprehensive income (loss) |
$ | 1,486 | $ | (1,654 | ) | $ | (426 | ) | ||||
F-14
Table of Contents
CHICOPEE BANCORP, INC. AND SUBSIDIARIES
NOTES TO CONSOLIDATED FINANCIAL STATEMENTS (Continued)
(Dollars in Thousands, Except Per Share Amounts)
SUMMARY OF SIGNIFICANT ACCOUNTING POLICIES (continued)
The components of accumulated other comprehensive income (loss), included in stockholders’ equity, are as follows:
| December 31, | ||||||||
| 2009 | 2008 | |||||||
| Net unrealized gain (loss) on securities available-for-sale |
$ | 101 | $ | (2,180 | ) | |||
| Tax effect |
(35 | ) | 760 | |||||
| Net-of-tax amount |
$ | 66 | $ | (1,420 | ) | |||
Segment reporting
The Company’s operations are solely in the financial services industry and consist of providing traditional banking services to its customers. Management makes operating decisions and assesses performance based on an ongoing review of the Company’s consolidated financial results. Therefore, the Company has a single operating segment for financial reporting purposes.
Recent accounting pronouncements
In April 2009, the FASB issued a change to Accounting Standards Codification (“ASC”) Topic 820, “Fair Value Measurements and Disclosures”, related to determining fair values when there is no active market or where the price inputs being used represent distressed sales. The update provides guidance in determining when and how to use modeled values, as opposed to broker price quotes. The update should result in a greater use of models for estimating fair value, as well as more consistent approaches in modeling. This change was effective for interim and annual reporting periods ending after June 15, 2009. This guidance does not require any new fair value measurements. Management has adopted this guidance and there was no material impact on the financial statements of the Company.
In April 2009, the FASB issued a change to ASC Topic 820, “Fair Value Measurements and Disclosures”, intended to bring greater consistency to the timing of impairment recognition, and provide greater clarity to investors about credit and noncredit components of impaired debt securities that are not expected to be sold. Under the guidance, for many securities with other-than-temporary impairment, only the amount of the estimated credit loss is recorded through earnings, while the remaining mark-to-market loss is recognized through other comprehensive income or loss. The change is retroactive, meaning entities will reclassify amounts back into retained earnings related to non-credit-related market losses on certain investments held at the beginning of the period of adoption. This guidance was effective for interim and annual reporting periods ending after June 15, 2009. Management has adopted this guidance and there was no material impact on the financial statements of the Company.
In May 2009, the FASB issued a change to ASC Topic 855, “Subsequent Events.” ASC Topic 855 establishes general standards for the evaluation, recognition and disclosure of events and transactions that occur after the balance sheet date. Although there is new terminology, the standard is based on the same principles as those that currently exist in the auditing standards. The standard, which includes a new required disclosure of the date through which an entity has evaluated subsequent events, is effective for periods ending after June 15, 2009. The adoption of ASC Topic 855 did not have a material effect on the Company’s consolidated financial statements.
F-15
Table of Contents
CHICOPEE BANCORP, INC. AND SUBSIDIARIES
NOTES TO CONSOLIDATED FINANCIAL STATEMENTS (Continued)
(Dollars in Thousands, Except Per Share Amounts)
SUMMARY OF SIGNIFICANT ACCOUNTING POLICIES (continued)
In June 2009, the FASB issued a change to ASC Topic 860, “Transfers and Servicing”, to improve the reporting for the transfer of financial assets resulting from 1) practices that have developed since the issuance of a previous FASB statement that are not consistent with the original intent and key requirements of that statement and 2) concerns of financial statement users that many of the financial assets (and related obligations) that have been derecognized should continue to be reported in the financial statements of transferors. This ASC must be applied as of the beginning of each reporting entity’s first annual reporting period that begins after November 15, 2009. Earlier application is prohibited. The Company does not expect that the adoption of this Statement will have a material impact on the Company’s consolidated financial statements.
In June 2009, the FASB issued a change to ASC Topic 810, “Consolidation”, to amend certain requirements of consolidation of variable interest entities, to improve financial reporting by enterprises involved with variable interest entities and to provide more relevant and reliable information to users of financial statements. The ASC is effective as of the beginning of each reporting entity’s first annual reporting period that begins after November 15, 2009, and for annual reporting periods thereafter. Earlier application is prohibited. The Company will review the requirements of ASC Topic 810 and comply with its requirements. The Company does not expect that the adoption of this Statement will have a material impact on the Company’s consolidated financial statements.
In June 2009, the FASB issued ASC Topic 105, “Generally Accepted Accounting Principles.” Under the ASC, the Codification became the source of authoritative GAAP recognized by the FASB to be applied by nongovernmental entities. On the effective date of this ASC, the Codification superseded all then-existing accounting and reporting standards, other than those issued by the Securities and Exchange Commission (SEC). All other non-grandfathered non-SEC accounting literature not included in the Codification became non-authoritative. This ASC is effective for financial statements issued for annual periods ending after September 15, 2009. In the FASB’s view, the issuance of this ASC and the Codification will not change GAAP, except for those nonpublic nongovernmental entities that must now apply the American Institute of Certified Public Accountants Technical Inquiry Service Section 5100, “Revenue Recognition,” paragraphs 38–76, now part of ASC Topic 985. Management adopted ASC Topic 105 in 2009 and there was no material impact on the consolidated financial statements of the Company.
In August 2009, the FASB issued Accounting Standards Update (ASU) 2009-05, “Fair Value Measurements and Disclosures (Topic 820) – Measuring Liabilities at Fair Value,” which updates ASC Topic 820. The update provides clarification that in circumstances in which a quoted price in an active market for the identical liability is not available, a reporting entity is required to measure fair value using one or more of the following techniques:
| 1. | A valuation technique that uses a) the quoted price of an identical liability when traded as an asset, or b) quoted prices for similar liabilities or similar liabilities when traded as assets. |
| 2. | Another valuation technique that is consistent with the principles of ASC Topic 820, examples include an income approach, such as a present value technique, or a market approach, such as a technique that is based on the amount at measurement date that the reporting entity would pay to transfer the identical liability or would receive to enter into the identical liability. |
This standard is effective for financial statements issued for the first reporting period beginning after August 2009. The adoption is not expected to have a material impact on the Company’s consolidated financial statements.
F-16
Table of Contents
CHICOPEE BANCORP, INC. AND SUBSIDIARIES
NOTES TO CONSOLIDATED FINANCIAL STATEMENTS (Continued)
(Dollars in Thousands, Except Per Share Amounts)
SUMMARY OF SIGNIFICANT ACCOUNTING POLICIES (concluded)
In January 2010, the FASB issued ASU 2010-6, “Fair Value Measurements and Disclosures (Topic 820)—Improving Disclosures about Fair Value Measurements,” to amend the disclosure requirements related to recurring and nonrecurring fair value measurements. The guidance requires new disclosures on the transfers of assets and liabilities between Level 1 (quoted prices in active market for identical assets or liabilities) and Level 2 (significant other observable inputs) of the fair value measurement hierarchy, including the reasons and the timing of the transfers. Additionally, the guidance requires a roll forward of activities on purchases, sales, issuance, and settlements of the assets and liabilities measured using significant unobservable inputs (Level 3 fair value measurements). The guidance will become effective with the reporting period beginning January 1, 2010, except for the disclosure on the roll forward activities for any Level 3 fair value measurements, which will become effective with the reporting period beginning January 1, 2011. Other than requiring additional disclosures, adoption of this new guidance will not have a material impact on the financial statements.
Reclassifications
Certain amounts in the 2008 and 2007 financial statements have been reclassified to conform to the 2009 presentation.
| 2. | RESTRICTIONS ON CASH AND AMOUNTS DUE FROM BANKS |
The Company is required to maintain certain reserves of cash on hand or deposits with the Federal Reserve Bank. At December 31, 2009 and 2008, these reserve balances amounted to $1,106 and $309, respectively, and are included in cash and due from banks.
| 3. | SECURITIES |
The amortized cost and estimated fair value of securities, with gross unrealized gains and losses, follow:
| December 31, 2009 | |||||||||||||
| Amortized Cost |
Gross Unrealized Gains |
Gross Unrealized Losses |
Fair Value | ||||||||||
| Securities available-for-sale |
|||||||||||||
| Marketable equity securities¹ |
$ | 402 | $ | 116 | $ | (15 | ) | $ | 503 | ||||
| Total securities available-for-sale |
$ | 402 | $ | 116 | $ | (15 | ) | $ | 503 | ||||
| Securities held-to-maturity |
|||||||||||||
| Debt securities of U.S. Government sponsored enterprises |
$ | 1,999 | $ | — | $ | — | $ | 1,999 | |||||
| U.S. Treasury securities |
43,118 | 3 | (4 | ) | 43,117 | ||||||||
| Corporate and industrial revenue bonds |
12,109 | — | — | 12,109 | |||||||||
| Collateralized mortgage obligations |
5,757 | 153 | (5 | ) | 5,905 | ||||||||
| Total securities held-to-maturity |
$ | 62,983 | $ | 156 | $ | (9 | ) | $ | 63,130 | ||||
F-17
Table of Contents
CHICOPEE BANCORP, INC. AND SUBSIDIARIES
NOTES TO CONSOLIDATED FINANCIAL STATEMENTS (Continued)
(Dollars in Thousands, Except Per Share Amounts)
SECURITIES (continued)
| December 31, 2008 | |||||||||||||
| Amortized Cost |
Gross Unrealized Gains |
Gross Unrealized Losses |
Fair Value | ||||||||||
| Securities available-for-sale |
|||||||||||||
| Marketable equity securities¹ |
$ | 7,449 | $ | 189 | $ | (2,370 | ) | $ | 5,268 | ||||
| Total securities available-for-sale |
$ | 7,449 | $ | 189 | $ | (2,370 | ) | $ | 5,268 | ||||
| Securities held-to-maturity |
|||||||||||||
| Debt securities of U.S. Government sponsored enterprises |
$ | 27,164 | $ | 25 | $ | — | $ | 27,189 | |||||
| U.S. Treasury securities |
11,997 | 3 | — | 12,000 | |||||||||
| Corporate and industrial revenue bonds |
4,060 | — | — | 4,060 | |||||||||
| Collateralized mortgage obligations |
6,441 | 12 | (29 | ) | 6,424 | ||||||||
| Total securities held-to-maturity |
$ | 49,662 | $ | 40 | $ | (29 | ) | $ | 49,673 | ||||
| ¹ | Marketable equity securities does not include FHLB-Boston and Banker’s Bank stock totaling $4.3 million and $183,000, respectively, at December 31, 2009 and 2008. |
The fair value of securities available-for-sale decreased $4.8 million, or 90.0%, to $503 at December 31, 2009 from December 31, 2008, primarily due to the sale of the Company’s equity portfolio. As of December 31, 2009, the Company sold 115 individual issues, or 66 companies, with a total cost of $5.7 million and total fair value of $5.9 million. The net gain on the sale of equities of $129 consisted of $284 of realized gains and $155 of realized losses. On the date of sale, 5 of the 115 issues failed the Company’s OTTI test, which resulted in a loss of $62. The Company’s available-for-sale securities portfolio is comprised of 5 individual issues, or 3 companies.
The amortized cost of held-to-maturity securities increased $13.3 million, or 26.8%, to $63.0 million due to purchases of U.S. Treasury securities, partially offset by maturities of debt securities of U.S. Government sponsored enterprises. The Company also acquired an $8.3 million bond during the last quarter of 2009.
At December 31, 2009 and 2008, securities with a carrying value of $30.4 million and $35.4 million, respectively, were pledged as collateral to support securities sold under agreements to repurchase.
The amortized cost and estimated fair value of debt securities by contractual maturity at December 31, 2009 are shown below. Expected maturities will differ from contractual maturities because borrowers may have the right to call or prepay obligations with or without prepayment penalties. The collateralized mortgage obligations are allocated to maturity categories according to final maturity date.
F-18
Table of Contents
CHICOPEE BANCORP, INC. AND SUBSIDIARIES
NOTES TO CONSOLIDATED FINANCIAL STATEMENTS (Continued)
(Dollars in Thousands, Except Per Share Amounts)
SECURITIES (continued)
| Held-to-Maturity | ||||||
| Amortized Cost |
Fair Value | |||||
| Within 1 year |
$ | 45,117 | $ | 45,115 | ||
| From 1 to 5 years |
3,809 | 3,810 | ||||
| From 5 to 10 years |
12,861 | 12,968 | ||||
| Over 10 years |
1,196 | 1,237 | ||||
| $ | 62,983 | $ | 63,130 | |||
Proceeds from sales of securities available for sale during the years ended December 31, 2009, 2008 and 2007 amounted to $8,086, $2,595, and $5,117, respectively. Gross realized gains of $510, $534, and $1,067, and gross realized losses of $369, $591, and $232, were realized during the years ended December 31, 2009, 2008 and 2007, respectively. Of the $369 and $591 realized losses in 2009 and 2008, respectively, $241 and $10 were due to securities that failed the Company’s OTTI test in 2009 and 2008, respectively. The tax provision applicable to these net realized gains and losses in 2009, 2008, and 2007 amounted to $48, $19, and $291, respectively.
Unrealized Losses on Investment Securities
Management conducts, at least on a monthly basis, a review of its investment portfolio including available-for-sale (“AFS”) and held-to-maturity (“HTM”) securities to determine if the value of any security has declined below its cost or amortized cost and whether such decline is OTTI. Securities are evaluated individually based on guidelines established by FASB, and include but are not limited to: (1) intent and ability of the Company to retain the investment for a period of time sufficient to allow for the anticipated recovery in market value; (2) percentage and length of time which an issue is below book value; (3) financial condition and near-term prospects of the issuer. The Company amended its OTTI policy during the third quarter of 2009 to include more objective evidence to determine when an OTTI write-down is required. The amended policy for the year ended December 31, 2009, provides for the following: once a security is identified as impaired, the Company will test for OTTI; if the security fails the Company’s OTTI test, the security will be written-down to the fair value as of the balance sheet date; an impaired security that passes the OTTI test will be reviewed by Management, to determine if a write-down is warranted, for other objective indicators such as: credit rating downgrades, reduced dividend payouts, inverse current ratios, and other adverse financial information. The amended policy resulted in OTTI write-downs of $1.4 million for the year ended December 31, 2009, representing 30 companies or 56 individual issues. These securities were deemed to be other-than-temporarily impaired. Management evaluated these securities according to the Company’s OTTI policy and determined the decline in value to be other-than-temporary. The Company does not expect the amended OTTI policy will result in future significant write-downs.
F-19
Table of Contents
CHICOPEE BANCORP, INC. AND SUBSIDIARIES
NOTES TO CONSOLIDATED FINANCIAL STATEMENTS (Continued)
(Dollars in Thousands, Except Per Share Amounts)
SECURITIES (continued)
The following table represents the fair value of investments with continuous unrealized losses for less than 12 months and those that have been in a continuous unrealized loss position for more than 12 months as of December 31, 2009 and 2008:
| December 31, 2009 | ||||||||||||||||||
| Less Than Twelve Months | Twelve Months and Over | Total | ||||||||||||||||
| Fair Value |
Gross Unrealized Losses |
Fair Value |
Gross Unrealized Losses |
Fair Value |
Gross Unrealized Losses | |||||||||||||
| Marketable equity securities |
$ | — | $ | — | $ | 311 | $ | 15 | $ | 311 | $ | 15 | ||||||
| U.S. Treasury securities |
19,436 | 4 | — | — | 19,436 | 4 | ||||||||||||
| Collateralized mortgage obligations |
190 | 5 | — | — | 190 | 5 | ||||||||||||
| Total temporarily impaired securities |
$ | 19,626 | $ | 9 | $ | 311 | $ | 15 | $ | 19,937 | $ | 24 | ||||||
| December 31, 2008 | ||||||||||||||||||
| Less Than Twelve Months | Twelve Months and Over | Total | ||||||||||||||||
| Fair Value |
Gross Unrealized Losses |
Fair Value |
Gross Unrealized Losses |
Fair Value |
Gross Unrealized Losses | |||||||||||||
| Marketable equity securities |
$ | 3,204 | $ | 1,486 | $ | 1,391 | $ | 884 | $ | 4,595 | $ | 2,370 | ||||||
| Collateralized mortgage obligations |
— | — | 3,501 | 29 | 3,501 | 29 | ||||||||||||
| Total temporarily impaired securities |
$ | 3,204 | $ | 1,486 | $ | 4,892 | $ | 913 | $ | 8,096 | $ | 2,399 | ||||||
U.S. Treasury Securities.
Unrealized losses within the U.S. Treasury securities category at December 31, 2009, relate to 12 U.S. Treasury securities of which all had losses for less than 12 months. The losses totaled approximately $4. Management deems the losses in this category to be immaterial.
Collateralized Mortgage Obligations.
Unrealized losses within the collateralized mortgage obligations (“CMO”) category at December 31, 2009, relate to 2 securities, both with continuous losses for less than 12 months. The losses totaled approximately $5. Management deems the losses in this category to be immaterial. Unrealized losses within the CMO category at December 31, 2008, relate to 15 securities of which all had continuous losses for more than 12 months.
Management reviews these securities on a regular basis for OTTI and considers if the issuer is an agency sponsored by the U.S. Government and whether downgrades by rating agencies have occurred. The Company reviews its CMO portfolio for OTTI similar to its OTTI analysis for its other securities, whereby it considers the length of time and the extent to which the fair value has been less than cost, the financial condition and near-term prospects of the issuer, and its intent and ability to retain its investment in the issuer for a period of time sufficient to allow for any anticipated recovery in fair value or until maturity. The Company has the ability and intent to hold these securities until maturity.
As of December 31, 2009, the Company has 19 CMO bonds, or 25 individual issues, with an aggregate book value of $5.8 million, which includes 5 bonds, or 6 individual issues, with a FICO score of less than 650. This risk is mitigated by loan to value ratios of less than 75%. The total exposure of these 5 bonds to the Company is approximately $23. Since the purchase of these bonds, interest payments have been current.
F-20
Table of Contents
CHICOPEE BANCORP, INC. AND SUBSIDIARIES
NOTES TO CONSOLIDATED FINANCIAL STATEMENTS (Continued)
(Dollars in Thousands, Except Per Share Amounts)
SECURITIES (continued)
The Company’s remaining 14 CMO bonds are all investment grade and classified as HTM. All of these securities were issued by government sponsored agencies and are all collateralized primarily by triple AAA rated Federal Home Loan Mortgage Corporation (“FHLMC”) and Federal National Mortgage Association (“FNMA”) mortgage loans and, to the best of the Company’s knowledge, are not collateralized by sub-prime and Alt-A loans. FHLMC and FNMA guarantees the contractual cash flows of the CMOs. The loans collateralizing such CMOs consist of fixed-rate, 15-year loans, originated in early 2003 and 2004, with average FICO scores between 700 and 775, and average LTV of 60%.
These CMO securities have been substantially paid down with an average current factor of 28%, and are backed by well seasoned loans of an earlier vintage, which have not been significantly affected by high delinquency levels or vulnerable to lower collateral coverage as seen in later issued pools. All such CMOs are paying according to their contractual terms and are expected to continue to pay their contractual cash flows.
Based on management’s analysis, which included the above indicators, the Company has determined that no OTTI exists within the CMO portfolio as of December 31, 2009.
Marketable Equity Securities.
Unrealized losses within the marketable equity securities category at December 31, 2009 relate to 4 securities, or 2 companies in the financial industry, of which all had continuous losses for more than 12 months. Unrealized loss as a percent of cost was 0.05%. Management deems the losses to be immaterial and the securities do not meet the write-down criteria of the Company’s OTTI policy.
Unrealized losses within the marketable equity securities category at December 31, 2008 relate to 111 securities, or 65 companies, of which 37 securities, or 21 companies, had continuous losses for more than one year. Unrealized loss as a percent of cost was 34.0%.
Federal Home Loan Bank stock and Federal Reserve Bank stock have also been evaluated for impairment. The Bank is a member of the Federal Home Loan Bank (“FHLB”) of Boston. The FHLB is a cooperatively owned wholesale bank for housing and finance in the six New England States. Its mission is to support the residential mortgage and community-development lending activities of its members, which include over 450 financial institutions across New England. As a requirement of membership in the FHLB, the Bank must own a minimum required amount of FHLB stock, calculated periodically based primarily on the Bank’s level of borrowings from the FHLB. The Company uses the FHLB for much of its wholesale funding needs. As of December 31, 2009 and 2008, the Company’s investment in FHLB stock totaled $4.3 million.
FHLB stock is a non-marketable equity security and therefore is reported at cost, which equals par value. Shares held in excess of the minimum required amount are generally redeemable at par value. However, in the first quarter of 2009 the FHLB announced a moratorium on such redemptions in order to preserve its capital in response to current market conditions and declining retained earnings. The minimum required shares are redeemable, subject to certain limitations, five years following termination of FHLB membership. The Bank has no intention of terminating its FHLB membership. The Company had no dividend income on its FHLB stock in 2009.
The FHLB recorded a net loss of $186.8 million for the year ending December 31, 2009. Losses due to the other-than-temporary impairment of investments in private-label mortgage-backed securities resulted in a credit loss of $444.1 million for the year. The associated non-credit loss on these securities in 2009 was $885.4 million, which is recorded in capital rather than through earnings, and contributed largely to an accumulated other comprehensive loss of $1.0 billion at December 31, 2009. Retained earnings increased to $142.6 million at December 31, 2009, up from an accumulated deficit of $19.7 million at December 31, 2008.
F-21
Table of Contents
CHICOPEE BANCORP, INC. AND SUBSIDIARIES
NOTES TO CONSOLIDATED FINANCIAL STATEMENTS (Continued)
(Dollars in Thousands, Except Per Share Amounts)
SECURITIES (concluded)
This increase was mainly due to reclassifying $349.1 million from accumulated deficit to accumulated other comprehensive loss. The FHLB remained in compliance with all regulatory capital ratios as of December 31, 2009, and, in the most recent information available, was classified “adequately capitalized” by its regulator, the Federal Housing Finance Agency, as of September 30, 2009.
Notwithstanding continued significant credit losses in our investment portfolio, the FHLB reported modest profitability for the fourth quarter. Net income for the fourth quarter of 2009 was $6.3 million. The FHLB’s net interest income continues to be strong, and totaled $311.7 million for the year ending December 31, 2009 and $88.0 million for the fourth quarter of 2009. The FHLB expects to see volatility in its earnings in the next several quarters as it works through continued challenges. In particular, high and prolonged unemployment rates, high delinquency and foreclosure rates, and declining housing prices may result in additional credit losses from the FHLB’s private-label mortgage-backed securities investments. The FHLB will continue to monitor this situation closely in 2010.
The FHLB remains focused on returning the FHLB to stable profitability and enhancing the FHLB’s capital base by building retained earnings. The FHLB’s board of directors is unlikely to declare any dividends until a consistent pattern of positive net income is demonstrated, allowing growth in retained earnings, which will likely preclude a declaration of dividends for at least the first two quarters of 2010. The opportunity to pay a dividend after that, and the amount of any such dividend, will be a function of the success that the FHLB has in stabilizing earnings and building retained earnings, which will be driven in large part by the performance of its private-label mortgage-backed securities portfolio. The FHLB’s current retained earnings target is estimated at $925 million, a target adopted in connection with the FHLB’s Revised Operating Plan to preserve capital in light of the various challenges to the FHLB. The FHLB’s retained earnings target could be superseded by Finance Agency mandates, either in the form of an order specific to the FHLB or by promulgation of new regulations requiring a level of retained earnings that is different from the FHLB’s currently targeted level. Moreover, management and the board of directors of the FHLB may, at any time, change the FHLB’s methodology or assumptions for modeling the FHLB’s retained earnings requirement. Either of these could result in the FHLB further increasing its retained earnings target or reducing or eliminating the dividend payout, as necessary.
The Company periodically evaluates its investment in FHLB stock for impairment based on, among other factors, the capital adequacy of the FHLB and its overall financial condition. No impairment losses have been recorded through December 31, 2009. The Bank will continue to monitor its investment in FHLB stock.
F-22
Table of Contents
CHICOPEE BANCORP, INC. AND SUBSIDIARIES
NOTES TO CONSOLIDATED FINANCIAL STATEMENTS (Continued)
(Dollars in Thousands, Except Per Share Amounts)
| 4. | LOANS |
At December 31, 2009, the Company’s loan portfolio, net, was $424.7 million, or 78.0% of total assets, compared to $416.1 million, or 78.8% of total assets, at December 31, 2008. The following table sets forth the composition of the Company’s loan portfolio in dollar amounts and as a percentage of the respective portfolio at the dates indicated.
| December 31, 2009 | December 31, 2008 | |||||||||||||
| Amount | Percent of Total |
Amount | Percent of Total |
|||||||||||
| (Dollars In Thousands) | ||||||||||||||
| Real estate loans: |
||||||||||||||
| One- to four-family¹ |
$ | 150,311 | 35.1 | % | $ | 164,781 | 39.3 | % | ||||||
| Multi-family |
10,790 | 2.5 | % | 11,459 | 2.7 | % | ||||||||
| Home equity |
29,320 | 6.9 | % | 27,184 | 6.5 | % | ||||||||
| Commercial |
126,090 | 29.5 | % | 114,981 | 27.5 | % | ||||||||
| Total |
316,511 | 74.0 | % | 318,405 | 76.0 | % | ||||||||
| Construction-residential |
9,193 | 2.2 | % | 8,431 | 2.1 | % | ||||||||
| Construction-commercial |
29,122 | 6.8 | % | 33,198 | 7.9 | % | ||||||||
| Total construction |
38,315 | 9.0 | % | 41,629 | 10.0 | % | ||||||||
| Total real estate loans |
354,826 | 83.0 | % | 360,034 | 86.0 | % | ||||||||
| Consumer loans |
4,390 | 1.0 | % | 4,045 | 1.0 | % | ||||||||
| Commercial loans |
68,541 | 16.0 | % | 54,255 | 13.0 | % | ||||||||
| Total loans |
427,757 | 100.0 | % | 418,334 | 100.0 | % | ||||||||
| Undisbursed portion of loans in process |
10 | 72 | ||||||||||||
| Net deferred loan origination costs |
965 | 1,003 | ||||||||||||
| Allowance for loan losses |
(4,077 | ) | (3,333 | ) | ||||||||||
| Loans, net |
$ | 424,655 | $ | 416,076 | ||||||||||
| ¹ | Excludes loans held for sale of $534 and $185 at December 31, 2009 and 2008, respectively. |
F-23
Table of Contents
CHICOPEE BANCORP, INC. AND SUBSIDIARIES
NOTES TO CONSOLIDATED FINANCIAL STATEMENTS (Continued)
(Dollars in Thousands, Except Per Share Amounts)
LOANS (concluded)
An analysis of the allowance for loan losses follows:
| Years Ended December 31, | ||||||||||||
| 2009 | 2008 | 2007 | ||||||||||
| Balance at beginning of year |
$ | 3,333 | $ | 3,076 | $ | 2,908 | ||||||
| Provision for loan losses |
897 | 315 | 223 | |||||||||
| Recoveries |
18 | 13 | 10 | |||||||||
| Loans charged-off |
(171 | ) | (71 | ) | (65 | ) | ||||||
| Balance at end of year |
$ | 4,077 | $ | 3,333 | $ | 3,076 | ||||||
The following is a summary of information pertaining to impaired loans:
| December 31, | ||||||
| 2009 | 2008 | |||||
| Impaired loans without a valuation allowance |
$ | 8,384 | $ | 6,763 | ||
| Impaired loans with a valuation allowance |
1,956 | 216 | ||||
| Total impaired loans |
$ | 10,340 | $ | 6,979 | ||
| Valuation allowance related to impaired loans |
$ | 501 | $ | 110 | ||
| Years Ended December 31, | |||||||||
| 2009 | 2008 | 2007 | |||||||
| Average recorded investment in impaired loans |
$ | 9,372 | $ | 4,812 | $ | 5,437 | |||
Interest income recognized on impaired loans was $375, $169, and $192 for the years ended December 31, 2009, 2008, and 2007. No additional funds are committed to be advanced in connection with impaired loans.
Nonaccrual loans, or all loans delinquent greater than 90 days, were $4,844 and $2,916 at December 31, 2009 and 2008, respectively. Interest foregone was $210, $126, and $43 for the years ended December 31, 2009, 2008, and 2007, respectively. There were no loans greater than ninety days past due and still accruing at December 31, 2009 and 2008.
F-24
Table of Contents
CHICOPEE BANCORP, INC. AND SUBSIDIARIES
NOTES TO CONSOLIDATED FINANCIAL STATEMENTS (Continued)
(Dollars in Thousands, Except Per Share Amounts)
| 5. | LOAN SERVICING |
Loans serviced for others are not included in the consolidated balance sheets. The unpaid principal balances of mortgage and other loans serviced for others were $71,390 and $45,330 at December 31, 2009 and 2008, respectively. The Company recorded net gain on sale of loans of $352, $22 and $3 for the years ended December 31, 2009, 2008 and 2007, respectively.
The Company capitalizes servicing rights quarterly based on a third party valuation. The balance of capitalized servicing rights included in other assets at December 31, 2009 and 2008 was $297 and $75, respectively. The significant assumptions used by a third party to estimate the fair value of capitalized servicing rights at December 31, 2009, include weighted average prepayment speed for the portfolio using the Public Securities Association Standard Prepayment Model (203 PSA), weighted average discount rate (8.28%), weighted average servicing fee (25.26 basis points), and net cost to service loans ($43.50 per loan). The fair value of the Company’s servicing rights was $582 and $188 at December 31, 2009 and 2008, respectively. There was no valuation allowance at December 31, 2009 and 2008 as the estimated fair value exceeded the carrying value on the balance sheet. The estimated fair value of capitalized servicing rights may vary significantly in subsequent periods primarily due to changing market interest rates, and their effect on prepayment speeds and discount rates.
A summary of the activity in the balances of mortgage servicing rights follows:
| Years Ended December 31, | ||||||||||||
| 2009 | 2008 | 2007 | ||||||||||
| Balance at beginning of year |
$ | 75 | $ | 228 | $ | 370 | ||||||
| Capitalized mortgage servicing rights |
352 | 22 | 3 | |||||||||
| Amortization |
(130 | ) | (175 | ) | (145 | ) | ||||||
| Balance at end of year |
$ | 297 | $ | 75 | $ | 228 | ||||||
F-25
Table of Contents
CHICOPEE BANCORP, INC. AND SUBSIDIARIES
NOTES TO CONSOLIDATED FINANCIAL STATEMENTS (Continued)
(Dollars in Thousands, Except Per Share Amounts)
| 6. | PREMISES AND EQUIPMENT |
A summary of the cost and accumulated depreciation and amortization of premises and equipment and their estimated useful lives follows:
| December 31, | ||||||||
| 2009 | 2008 | |||||||
| Banking premises: |
||||||||
| Land and improvements |
$ | 1,529 | $ | 1,529 | ||||
| Building |
9,372 | 8,983 | ||||||
| Furniture and equipment |
5,080 | 4,743 | ||||||
| Leasehold improvements |
1,432 | 1,429 | ||||||
| Computer software and equipment |
1,443 | 1,316 | ||||||
| 18,856 | 18,000 | |||||||
| Less accumulated depreciation and amortization |
(8,204 | ) | (7,323 | ) | ||||
| $ | 10,652 | $ | 10,677 | |||||
Depreciation and amortization expense for the years ended December 31, 2009, 2008, and 2007 amounted to $1,037, $824 and $762, respectively.
| 7. | DEPOSITS |
A summary of deposit balances, by type, is as follows:
| December 31, | ||||||
| 2009 | 2008 | |||||
| Non-interest-bearing demand |
$ | 43,398 | $ | 30,811 | ||
| NOW |
17,697 | 14,702 | ||||
| Money market |
55,293 | 47,608 | ||||
| Regular savings |
42,875 | 40,780 | ||||
| Total non-certificate accounts |
159,263 | 133,901 | ||||
| Certificate accounts less than $100,000 |
106,745 | 117,764 | ||||
| Certificate accounts of $100,000 or more |
99,490 | 83,102 | ||||
| Total certificate accounts |
206,235 | 200,866 | ||||
| $ | 365,498 | $ | 334,767 | |||
F-26
Table of Contents
CHICOPEE BANCORP, INC. AND SUBSIDIARIES
NOTES TO CONSOLIDATED FINANCIAL STATEMENTS (Continued)
(Dollars in Thousands, Except Per Share Amounts)
DEPOSITS (concluded)
A summary of certificate accounts, by maturity, is as follows:
| December 31, 2009 | December 31, 2008 | |||||||||||
| Amount | Weighted Average Rate |
Amount | Weighted Average Rate |
|||||||||
| 2009 |
— | — | $ | 129,144 | 3.12 | % | ||||||
| 2010 |
112,867 | 2.01 | % | 20,770 | 3.90 | % | ||||||
| 2011 |
32,315 | 4.48 | % | 26,582 | 4.96 | % | ||||||
| 2012 |
11,895 | 3.50 | % | 6,763 | 4.29 | % | ||||||
| 2013 |
18,295 | 3.74 | % | 17,607 | 3.84 | % | ||||||
| 2014 |
30,863 | 2.90 | % | — | — | |||||||
| $ | 206,235 | 2.77 | % | $ | 200,866 | 3.54 | % | |||||
| 8. | REPURCHASE AGREEMENTS |
Securities sold under agreements to repurchase are summarized as follows:
| Years Ended December 31, | ||||||
| 2009 | 2008 | |||||
| Balance at year-end |
$ | 20,422 | $ | 21,956 | ||
| Average amount outstanding during the year |
21,339 | 23,191 | ||||
| Interest expense incurred during the year |
210 | 348 | ||||
| Maximum amount outstanding at any month-end |
27,334 | 38,557 | ||||
| Weighted average interest rate during the year |
0.98% | 1.50% | ||||
| Weighted average interest rate on year-end balances |
0.50% | 1.25% | ||||
Securities sold under agreements to repurchase, which are classified as secured borrowings, generally mature within one to four days from the transaction date. Securities sold under agreements to repurchase are reflected at the amount of cash received in connection with the transaction. The Company may be required to provide additional collateral based on the fair value of the underlying securities. The carrying value of the securities used as collateral for the repurchase agreements was $30.4 million at December 31, 2009.
F-27
Table of Contents
CHICOPEE BANCORP, INC. AND SUBSIDIARIES
NOTES TO CONSOLIDATED FINANCIAL STATEMENTS (Continued)
(Dollars in Thousands, Except Per Share Amounts)
| 9. | ADVANCES FROM FEDERAL HOME LOAN BANK |
Advances from the Federal Home Loan Bank of Boston (FHLB) consist of the following:
| December 31, 2009 | December 31, 2008 | |||||||||||
| Amount | Weighted Average Rate |
Amount | Weighted Average Rate |
|||||||||
| Fixed-rate FHLB advances maturing: |
||||||||||||
| 2009 |
$ | — | — | $ | 37,000 | 0.78 | % | |||||
| 2010 |
5,000 | 2.50 | % | 5,000 | 2.50 | % | ||||||
| 2011 (a) |
16,450 | 3.74 | % | 17,500 | 3.69 | % | ||||||
| 2012 (a) |
4,053 | 4.34 | % | 5,503 | 4.34 | % | ||||||
| 2013 (a) |
3,588 | 3.55 | % | 4,537 | 3.55 | % | ||||||
| 2014 (a) |
24,584 | 2.35 | % | 2,027 | 3.65 | % | ||||||
| 2016 |
5,000 | 2.55 | % | — | — | |||||||
| 2018 (b) |
5,000 | 3.69 | % | 5,000 | 3.69 | % | ||||||
| Total FHLB advances |
$ | 63,675 | 3.04 | % | $ | 76,567 | 2.24 | % | ||||
| (a) | Includes amortizing advances requiring monthly principal and interest payments. |
| (b) | One time put option- The FHLB may, at its option and its sole discretion, require the Member to repay this advance on June 30, 2011 provided that the FHLB has given the Member at least four days written notice of its intention to exercise its option. |
Pursuant to collateral agreements with the FHLB of Boston, advances are collateralized by all stock in the FHLB and qualifying first mortgages.
As a member of the FHLB, the Company, through its bank subsidiary, is eligible to borrow amounts up to the level of qualified collateral maintained. As of December 31, 2009, the Company was eligible to borrow up to $102.4 million. As of December 31, 2009, the Company has $4.3 million of FHLB stock and can borrow up to $13.1 million of additional advances from the FHLB without purchasing additional stock.
The Company has a $10.0 million available line of credit with the FHLB at December 31, 2009, and an unsecured line of credit with Bankers Bank, N.E. that allows the Company to borrow up to $3.0 million. There were no borrowings against either line of credit at December 31, 2009. The Company can also purchase up to $3.0 million in Fed Funds from Bankers Bank, N.E. As of December 31, 2009, the Company has not purchased any Fed Funds.
F-28
Table of Contents
CHICOPEE BANCORP, INC. AND SUBSIDIARIES
NOTES TO CONSOLIDATED FINANCIAL STATEMENTS (Continued)
(Dollars in Thousands, Except Per Share Amounts)
| 10. | INCOME TAXES |
In connection with its initial public offering, the Company donated common stock in the amount of $5.5 million to the Chicopee Savings Bank Charitable Foundation, which resulted in a tax benefit of $1,900. As of December 31, 2009, 2008 and 2007 a valuation reserve of $1,711, $1,300 and $1,000, respectively, has been established against deferred tax assets related to the uncertain utilization of the charitable contribution carryforward created primarily by the donation to the Chicopee Savings Bank Charitable Foundation. The judgment applied by management considers the likelihood that sufficient taxable income will be realized within the carryforward period in light of its tax planning strategies and changes in the market conditions. The charitable contribution carryforward of $5,128 at December 31, 2009 expires in 2011. The charitable contribution carryfoward, net of the related allowance is $96.
Allocation of federal and state income taxes between current and deferred portions is as follows:
| Years Ended December 31, | ||||||||||||
| 2009 | 2008 | 2007 | ||||||||||
| Current tax (benefit) expense: |
||||||||||||
| Federal |
$ | (163 | ) | $ | (14 | ) | $ | 968 | ||||
| State |
9 | 27 | 195 | |||||||||
| (154 | ) | 13 | 1,163 | |||||||||
| Deferred tax (benefit) expense: |
||||||||||||
| Federal |
(761 | ) | (15 | ) | (239 | ) | ||||||
| State |
(123 | ) | 78 | (106 | ) | |||||||
| (884 | ) | 63 | (345 | ) | ||||||||
| Change in valuation reserve |
411 | 300 | 200 | |||||||||
| (473 | ) | 363 | (145 | ) | ||||||||
| Income tax expense (benefit) |
$ | (627 | ) | $ | 376 | $ | 1,018 | |||||
F-29
Table of Contents
CHICOPEE BANCORP, INC. AND SUBSIDIARIES
NOTES TO CONSOLIDATED FINANCIAL STATEMENTS (Continued)
(Dollars in Thousands, Except Per Share Amounts)
INCOME TAXES (continued)
The reasons for the differences between the statutory federal income tax rate and the effective tax rates are summarized as follows:
| Years Ended December 31, | |||||||||
| 2009 | 2008 | 2007 | |||||||
| Statutory rate |
34.0 | % | 34.0 | % | 34.0 | % | |||
| Increase (decrease) resulting from: |
|||||||||
| State taxes, net of federal tax benefit |
3.4 | % | 16.5 | % | 2.2 | % | |||
| Dividends received deduction |
1.6 | % | -9.6 | % | -1.3 | % | |||
| Change in valuation allowance |
-18.5 | % | 71.3 | % | 7.6 | % | |||
| Tax-exempt interest |
4.0 | % | -18.1 | % | -2.0 | % | |||
| Bank owned life insurance |
7.1 | % | -37.9 | % | -5.7 | % | |||
| Stock-based compensation |
-5.4 | % | 17.3 | % | 2.7 | % | |||
| Other, net |
2.0 | % | 21.0 | % | 1.4 | % | |||
| Effective tax rates |
28.2 | % | 94.5 | % | 38.9 | % | |||
The components of the net deferred tax asset are as follows:
| December 31, | ||||||||
| 2009 | 2008 | |||||||
| Deferred tax assets: |
||||||||
| Federal |
$ | 3,849 | $ | 3,971 | ||||
| State |
512 | 427 | ||||||
| 4,361 | 4,398 | |||||||
| Valuation reserve on asset |
(1,711 | ) | (1,300 | ) | ||||
| 2,650 | 3,098 | |||||||
| Deferred tax liabilities: |
||||||||
| Federal |
(424 | ) | (513 | ) | ||||
| State |
(114 | ) | (151 | ) | ||||
| (538 | ) | (664 | ) | |||||
| Net deferred tax asset |
$ | 2,112 | $ | 2,434 | ||||
F-30
Table of Contents
CHICOPEE BANCORP, INC. AND SUBSIDIARIES
NOTES TO CONSOLIDATED FINANCIAL STATEMENTS (Continued)
(Dollars in Thousands, Except Per Share Amounts)
INCOME TAXES (continued)
The tax effects of each type of income and expense item that gave rise to deferred taxes are as follows:
| December 31, | ||||||||
| 2009 | 2008 | |||||||
| Net unrealized loss (gain) on securities available-for-sale |
$ | (35 | ) | $ | 760 | |||
| Charitable contribution and capital loss carryforward |
1,925 | 1,763 | ||||||
| Depreciation |
(69 | ) | (120 | ) | ||||
| Deferred income |
193 | 11 | ||||||
| Allowance for loan losses |
1,628 | 1,331 | ||||||
| Other |
181 | (11 | ) | |||||
| 3,823 | 3,734 | |||||||
| Valuation reserve |
(1,711 | ) | (1,300 | ) | ||||
| Net deferred tax asset |
$ | 2,112 | $ | 2,434 | ||||
| December 31, | ||||||||
| 2009 | 2008 | |||||||
| Gross deferred tax assets |
||||||||
| Charitable contribution carryfoward |
$ | 1,780 | $ | 1,763 | ||||
| Capital loss carryforward |
145 | — | ||||||
| Allowance for loan losses |
1,628 | 1,331 | ||||||
| Unrealized loss on securities available for sale |
— | 760 | ||||||
| Employee benefit and stock-based compensation plans |
627 | 424 | ||||||
| Other |
201 | — | ||||||
| Gross deferred tax assets |
4,381 | 4,278 | ||||||
| Gross deferred tax liabilities |
||||||||
| Deferred loan costs |
(315 | ) | (383 | ) | ||||
| Mortgage servicing rights |
(119 | ) | (30 | ) | ||||
| Depreciation |
(69 | ) | (120 | ) | ||||
| Unrealized gain on securities available for sale |
(35 | ) | — | |||||
| Other |
(20 | ) | (11 | ) | ||||
| Gross deferred tax liabilities |
(558 | ) | (544 | ) | ||||
| Net deferred tax asset |
3,823 | 3,734 | ||||||
| Valuation allowance |
(1,711 | ) | (1,300 | ) | ||||
| Net deferred tax asset |
$ | 2,112 | $ | 2,434 | ||||
F-31
Table of Contents
CHICOPEE BANCORP, INC. AND SUBSIDIARIES
NOTES TO CONSOLIDATED FINANCIAL STATEMENTS (Continued)
(Dollars in Thousands, Except Per Share Amounts)
INCOME TAXES (concluded)
A summary of the change in the net deferred tax asset is as follows:
| Years Ended December 31, | ||||||||||||
| 2009 | 2008 | 2007 | ||||||||||
| Balance at beginning of year |
$ | 2,434 | $ | 1,911 | $ | 1,538 | ||||||
| Deferred tax (expense) benefit |
884 | (63 | ) | 345 | ||||||||
| Deferred tax effects of net unrealized (gain) loss on securities available-for-sale |
(795 | ) | 886 | 228 | ||||||||
| Change in valuation reserve |
(411 | ) | (300 | ) | (200 | ) | ||||||
| Balance at end of year |
$ | 2,112 | $ | 2,434 | $ | 1,911 | ||||||
| The change in the valuation reserve applicable to the net deferred tax asset is as follows: | ||||||||||||
| Years Ended December 31, | ||||||||||||
| 2009 | 2008 | 2007 | ||||||||||
| Balance at beginning of year |
$ | 1,300 | $ | 1,000 | $ | 800 | ||||||
| Change generated by current year’s operations |
411 | 300 | 200 | |||||||||
| Balance at end of year |
$ | 1,711 | $ | 1,300 | $ | 1,000 | ||||||
The adequacy of this allowance to fully utilize the charitable contribution carry-forward was determined by using the Company’s projected pre-tax earning for the years of 2010 and 2011. The federal income tax reserve for loan losses at the Bank’s base year is $3,609. If any portion of the reserve is used for purposes other than to absorb loan losses, approximately 150% of the amount actually used, limited to the amount of the reserve, would be subject to taxation in the fiscal year in which used. As the Bank intends to use the reserve solely to absorb loan losses, a deferred tax liability of approximately $1,444 has not been provided.
The Company’s income tax returns for the years ended December 31, 2006, 2007 and 2008 are open to audit under the statute of limitations by the Internal Revenue Service. The Company’s policy is to record interest and penalties related to uncertain tax positions as part of its income tax expense. The Company has no penalties and interest recorded for the years ended December 31, 2009 and 2008.
F-32
Table of Contents
CHICOPEE BANCORP, INC. AND SUBSIDIARIES
NOTES TO CONSOLIDATED FINANCIAL STATEMENTS (Continued)
(Dollars in Thousands, Except Per Share Amounts)
| 11. | OFF-BALANCE SHEET ACTIVITIES |
Credit-related financial instruments
The Company is a party to credit related financial instruments with off-balance-sheet risk in the normal course of business to meet the financing needs of its customers. These financial instruments include commitments to extend credit, standby letters of credit, and various financial instruments with off-balance-sheet risk. Such commitments involve, to varying degrees, elements of credit and interest rate risk in excess of the amount recognized in the consolidated balance sheets.
The Company’s exposure to credit loss is represented by the contractual amount of these commitments. The Company follows the same credit policies in making commitments as it does for on-balance-sheet instruments.
Credit-related financial instruments
The following financial instruments were outstanding whose contract amounts represent credit risk:
| December 31, | ||||||
| 2009 | 2008 | |||||
| Commitments to grant loans |
$ | 17,429 | $ | 17,301 | ||
| Unfunded commitments for construction loans |
8,203 | 12,837 | ||||
| Unfunded commitments under lines of credit |
59,189 | 44,610 | ||||
| Standby letters of credit |
2,334 | 2,456 | ||||
Commitments to extend credit are agreements to lend to a customer as long as there is no violation of any condition established in the contract. Commitments generally have fixed expiration dates or other termination clauses and may require payment of a fee. The commitments for equity lines of credit may expire without being drawn upon. Therefore, the total commitment amounts do not necessarily represent future cash requirements. The amount of collateral obtained, if it is deemed necessary by the Company, is based on management’s credit evaluation of the customer. Collateral held varies but may include cash, securities, accounts receivable, inventory, property, plant and equipment, and real estate.
Unfunded commitments under commercial lines of credit, revolving credit lines and overdraft protection agreements are commitments for possible future extensions of credit to existing customers. These lines of credit are uncollateralized, usually do not contain a specified maturity date, and may not be drawn upon to the total extent to which the Company is committed.
F-33
Table of Contents
CHICOPEE BANCORP, INC. AND SUBSIDIARIES
NOTES TO CONSOLIDATED FINANCIAL STATEMENTS (Continued)
(Dollars in Thousands, Except Per Share Amounts)
OFF-BALANCE SHEET ACTIVITIES (concluded)
Guarantor’s Accounting and Disclosure Requirements for Guarantees, Including Indirect Guarantees of Indebtedness of Others; an Interpretation of FASB Statements, requires certain disclosures and liability recognition for the fair value at issuance of guarantees that fall within its scope. The Company does not issue any guarantees that would require liability recognition or disclosure, other than its standby letters of credit. The Company has issued conditional commitments in the form of standby letters of credit to guarantee payment on behalf of a customer and guarantee the performance of a customer to a third party. Standby letters of credit generally arise in connection with lending relationships. The credit risk involved in issuing these instruments is essentially the same as that involved in extending loans to customers. Contingent obligations under standby letters of credit totaled $2,334 and $2,456 at December 31, 2009 and 2008, respectively, and represent the maximum potential future payments the Company could be required to make. Typically, these instruments have terms of 12 months or less and expire unused; therefore, the total amounts do not necessarily represent future cash requirements. Each customer is evaluated individually for creditworthiness under the same underwriting standards used for commitments to extend credit and on-balance sheet instruments. The Company’s policies governing loan collateral apply to standby letters of credit at the time of credit extension. Loan-to-value ratios are generally consistent with loan-to-value requirements for other commercial loans secured by similar types of collateral. The fair value of the Company’s standby letters of credit at December 31, 2009 and 2008 was insignificant.
Lease commitments
Pursuant to the terms of non-cancelable lease agreements in effect at December 31, 2009, future minimum operating lease commitments pertaining to banking premises are as follows:
| 2010 |
$ | 408 | |
| 2011 |
405 | ||
| 2012 |
358 | ||
| 2013 |
376 | ||
| 2014 |
374 | ||
| Thereafter |
4,642 | ||
| $ | 6,563 | ||
The leases contain options to extend for periods from one to five years. Total rent expense for the years ended December 31, 2009, 2008, and 2007 approximated $490, $300, and $260, respectively.
F-34
Table of Contents
CHICOPEE BANCORP, INC. AND SUBSIDIARIES
NOTES TO CONSOLIDATED FINANCIAL STATEMENTS (Continued)
(Dollars in Thousands, Except Per Share Amounts)
| 12. | OTHER COMMITMENTS AND CONTINGENCIES |
Employment and change in control agreements
Chicopee Bancorp, Inc. has three-year employment agreements with its President and Chief Executive Officer and its Executive Vice President and Chief Financial Officer and three-year change of control agreements with certain other executives. These agreements generally provide for a base salary and the continuation of certain benefits currently received. The Chicopee Bancorp, Inc. employment agreements renew on a daily and annual basis, respectively. Under certain specified circumstances, the employment agreements require certain payments to be made for certain reasons other than cause, including a “change in control” as defined in the agreement. However, such employment may be terminated for cause, as defined, without incurring any continuing obligations.
Legal claims
Various legal claims arise from time to time in the ordinary course of business. In the opinion of management, the claims that existed at December 31, 2009 will have no material effect on the Company’s consolidated financial statements.
| 13. | MINIMUM REGULATORY CAPITAL REQUIREMENTS |
The Company and its bank subsidiary are subject to various regulatory capital requirements administered by the federal banking agencies. Failure to meet minimum capital requirements can initiate certain mandatory and possible additional discretionary actions by regulators that, if undertaken, could have a direct material effect on the Company’s consolidated financial statements. Under capital adequacy guidelines and the regulatory framework for prompt corrective action, the Bank must meet specific capital guidelines that involve quantitative measures of its assets, liabilities, and certain off-balance-sheet items as calculated under regulatory accounting practices. The capital amounts and classification are also subject to qualitative judgments by the regulators about components, risk weightings, and other factors.
Quantitative measures established by regulation to ensure capital adequacy require the Company to maintain minimum amounts and ratios (set forth in the following table) of total and Tier 1 capital (as defined in the regulations) to risk-weighted assets (as defined) and of Tier 1 capital (as defined) to average assets (as defined). Management believes, as of December 31, 2009 and 2008, that the Company and its bank subsidiary met all capital adequacy requirements to which they are subject.
As of December 31, 2009, the most recent notification from the Federal Deposit Insurance Corporation categorized the Bank as well capitalized under the regulatory framework for prompt corrective action. To be categorized as well capitalized, an institution must maintain minimum total risk-based, Tier 1 risk-based and Tier 1 leverage ratios as set forth in the following tables. There are no conditions or events since the notification that management believes have changed the Bank’s category. Prompt corrective action provisions are not applicable to the Company.
F-35
Table of Contents
CHICOPEE BANCORP, INC. AND SUBSIDIARIES
NOTES TO CONSOLIDATED FINANCIAL STATEMENTS (Continued)
(Dollars in Thousands, Except Per Share Amounts)
MINIMUM REGULATORY CAPITAL REQUIREMENTS (continued)
The Company’s and Bank’s actual capital amounts and ratios as of December 31, 2009 and 2008 are also presented in the table.
| Actual | Minimum for Capital Adequacy Purposes |
Minimum to be Well Capitalized Under Prompt Corrective Action Provisions |
||||||||||||||||
| Amount | Ratio | Amount | Ratio | Amount | Ratio | |||||||||||||
| As of December 31, 2009: |
||||||||||||||||||
| Total Capital to Risk Weighted Assets |
||||||||||||||||||
| Company |
$ | 97,878 | 23.4 | % | $ | 33,418 | 8.0 | % | N/A | N/A | ||||||||
| Bank |
$ | 84,779 | 20.4 | % | $ | 33,303 | 8.0 | % | $ | 41,628 | 10.0 | % | ||||||
| Tier 1 Capital to Risk Weighted Assets |
||||||||||||||||||
| Company |
$ | 93,756 | 22.4 | % | $ | 16,709 | 4.0 | % | N/A | N/A | ||||||||
| Bank |
$ | 80,657 | 19.4 | % | $ | 16,651 | 4.0 | % | $ | 24,977 | 6.0 | % | ||||||
| Tier 1 Capital to Average Assets |
||||||||||||||||||
| Company |
$ | 93,756 | 17.4 | % | $ | 21,498 | 4.0 | % | N/A | N/A | ||||||||
| Bank |
$ | 80,657 | 15.1 | % | $ | 21,435 | 4.0 | % | $ | 26,794 | 5.0 | % | ||||||
| As of December 31, 2008: |
||||||||||||||||||
| Total Capital to Risk Weighted Assets |
||||||||||||||||||
| Company |
$ | 98,762 | 23.6 | % | $ | 33,539 | 8.0 | % | N/A | N/A | ||||||||
| Bank |
$ | 82,546 | 19.8 | % | $ | 33,340 | 8.0 | % | $ | 41,675 | 10.0 | % | ||||||
| Tier 1 Capital to Risk Weighted Assets |
||||||||||||||||||
| Company |
$ | 95,429 | 22.8 | % | $ | 16,769 | 4.0 | % | N/A | N/A | ||||||||
| Bank |
$ | 79,213 | 19.0 | % | $ | 16,670 | 4.0 | % | $ | 25,005 | 6.0 | % | ||||||
| Tier 1 Capital to Average Assets |
||||||||||||||||||
| Company |
$ | 95,429 | 18.4 | % | $ | 20,791 | 4.0 | % | N/A | N/A | ||||||||
| Bank |
$ | 79,213 | 15.3 | % | $ | 20,733 | 4.0 | % | $ | 25,916 | 5.0 | % | ||||||
F-36
Table of Contents
CHICOPEE BANCORP, INC. AND SUBSIDIARIES
NOTES TO CONSOLIDATED FINANCIAL STATEMENTS (Continued)
(Dollars in Thousands, Except Per Share Amounts)
MINIMUM REGULATORY CAPITAL REQUIREMENTS (concluded)
The following is a reconciliation of the Company’s equity as disclosed in the balance sheet under GAAP to regulatory capital as disclosed in the table above.
| December 31, | ||||||||
| 2009 | 2008 | |||||||
| Total equity determined under generally accepted accounting principles |
$ | 94,172 | $ | 94,017 | ||||
| Net unrealized loss (gain) on securities available-for-sale, net of tax |
(66 | ) | 1,420 | |||||
| Disallowed mortgage servicing rights |
(30 | ) | (8 | ) | ||||
| Disallowed deferred tax assets |
(320 | ) | — | |||||
| Tier 1 Capital |
93,756 | 95,429 | ||||||
| Allowable allowance for loan losses |
4,077 | 3,333 | ||||||
| Unrealized gain on available-for-sale equity securities, net of tax |
45 | — | ||||||
| Total regulatory capital |
$ | 97,878 | $ | 98,762 | ||||
| 14. | COMMON STOCK REPURCHASE PROGRAM |
In 2007 and 2008, the Board of Directors authorized three stock repurchase programs (the “Stock Repurchase Programs”) for the purchase of up to approximately 5% of its outstanding common stock. The first repurchase of 371,968 shares was completed in March 2008 at a total cost of approximately $4.9 million or $13.21 per share. The second repurchase of 353,370 shares was completed in August 2008 at a total cost of approximately $4.7 million or $13.26 per share. The third repurchase was approved in August 2008 for 335,000 shares. As of December 31, 2009, the Company has repurchased all of the 335,000 shares from the third buyback at a total cost of approximately $4.3 million or $12.98 per share. As of December 31, 2009, the Company repurchased a total of 1,060,338 shares of common stock at a total cost of $14.0 million or $13.16 per share during 2007, 2008, and 2009 for all three buybacks. Any purchase of common stock under the Stock Repurchase Programs will be made through open market purchase transactions from time to time or privately negotiated transactions. The amount and exact timing of any repurchases will depend on market conditions and other factors, at the discretion of management of the Company. Repurchased shares will be held in treasury.
| 15. | EMPLOYEE BENEFIT PLANS |
The Company has a 401(k) Plan whereby substantially all employees participate in the Plan. Employees may contribute a portion of their compensation subject to certain limits based on federal tax laws. The Company makes matching contributions equal to 0.50 (cents) per dollar of the participant’s contribution up to 2%. In addition to the employer match, there is a 3% safe harbor contribution for all eligible employees. For the years ended December 31, 2009, 2008, and 2007, expenses attributable to the Plan amounted to $235, $233, and $196, respectively.
F-37
Table of Contents
CHICOPEE BANCORP, INC. AND SUBSIDIARIES
NOTES TO CONSOLIDATED FINANCIAL STATEMENTS (Continued)
(Dollars in Thousands, Except Per Share Amounts)
EMPLOYEE BENEFIT PLANS (continued)
Prior to January 31, 2007, the Company sponsored a noncontributory defined benefit pension plan (the “Pension Plan”) through its membership in the Savings Bank Employees Retirement Association (“SBERA”).
At January 31, 2007, the Company terminated the Pension Plan. As of December 31, 2008, the Bank had no accrued liability. All funds from the Plan were distributed on July 16, 2008 to all eligible employees who were active when the Plan terminated. The Plan had no activity during the year-ended December 31, 2009.
Pension cost for the Plan is calculated using the projected unit credit method. The measurement date used to determine pension benefits is October 31. The following table sets forth information regarding the Pension Plan.
| Plan Year Ended October 31, 2008 |
||||
| Change in plan assets: |
||||
| Fair value of plan assets at beginning of year |
$ | 5,638 | ||
| Actual return on plan assets |
157 | |||
| Contributions |
781 | |||
| Benefits paid |
(6,576 | ) | ||
| Fair value of plan assets at end of year |
— | |||
| Change in benefit obligation: |
||||
| Benefit obligation at beginning of year |
6,419 | |||
| Service cost |
— | |||
| Interest cost |
157 | |||
| Actuarial gain |
— | |||
| Benefits paid |
(6,576 | ) | ||
| Benefit obligation at end of year |
— | |||
| Funded status and accrued benefit cost recognized in the balance sheet at October 31 |
$ | — | ||
| Accumulated benefit obligation |
$ | — | ||
F-38
Table of Contents
CHICOPEE BANCORP, INC. AND SUBSIDIARIES
NOTES TO CONSOLIDATED FINANCIAL STATEMENTS (Continued)
(Dollars in Thousands, Except Per Share Amounts)
EMPLOYEE BENEFIT PLANS (continued)
Components of net periodic benefit cost follow:
| Plan Years Ended October 31, | ||||||||
| 2008 | 2007 | |||||||
| Service cost |
$ | — | $ | — | ||||
| Interest cost |
157 | 389 | ||||||
| Expected return on plan assets |
(157 | ) | (389 | ) | ||||
| Recognized net actuarial loss |
— | — | ||||||
| Amortization of unrecognized transition obligation |
— | — | ||||||
| Net periodic benefit cost |
$ | — | $ | — | ||||
| 2008 | 2007 | |||||||
| Weighted average assumptions used to determine benefit cost were as follows: |
||||||||
| Discount rate on benefit cost |
4.79 | % | 4.85 | % | ||||
| Rate of increase in compensation levels |
N/A | N/A | ||||||
| Expected long-term rate of return on plan assets |
4.79 | % | 4.85 | % | ||||
| Weighted average assumptions used to determine the benefit obligation were as follows: |
||||||||
| Discount rate on benefit obligations |
N/A | 4.85 | % | |||||
| Rate of increase in compensation levels |
N/A | N/A | ||||||
N/A = not applicable
F-39
Table of Contents
CHICOPEE BANCORP, INC. AND SUBSIDIARIES
NOTES TO CONSOLIDATED FINANCIAL STATEMENTS (Continued)
(Dollars in Thousands, Except Per Share Amounts)
EMPLOYEE BENEFIT PLANS (concluded)
The composition of the Company’s Pension Plan assets at October 31, 2007, by asset category, were 100% fixed income.
SBERA offers a common and collective trust as the underlying investment structure for pension plans participating in SBERA. Historically, the target allocation mix for the common and collective trust portfolio calls for an equity-based investment deployment range from 55% to 75% of total portfolio assets. The remainder of the portfolio is allocated to fixed income. Upon the Company’s decision to terminate the Plan, the funds were transferred to fixed income securities.
The rate of return for 2008 and 2007 is based on money market rates expected to be earned until distribution. In 2006, the Company’s assumption with respect to long-term rate of return was based on prevailing yields on high quality fixed income investments increased by a premium of 3% to 5% for equity investments.
The Company provides supplemental life insurance benefits to its key officers. Amounts charged to expense for these benefits were $354, $328 and $304 for the years ended December 31, 2009, 2008, and 2007, respectively.
F-40
Table of Contents
CHICOPEE BANCORP, INC. AND SUBSIDIARIES
NOTES TO CONSOLIDATED FINANCIAL STATEMENTS (Continued)
(Dollars in Thousands, Except Per Share Amounts)
| 16. | EMPLOYEE STOCK OWNERSHIP PLAN |
The Bank has established an Employee Stock Ownership Plan (the “ESOP”) for the benefit of each employee that has reached the age of 21 and has completed at least 1,000 hours of service in the previous twelve-month period. As part of the Bank’s conversion from mutual to stock ownership, Chicopee Bancorp, Inc. invested in a subsidiary, Chicopee Funding Corporation. Chicopee Funding Corporation used the proceeds from the investment to fund a loan to the Chicopee Savings Bank Employee Stock Ownership Plan Trust (the “Trust”), which used the proceeds from the loan to purchase 8%, or 595,149 shares, of the Company’s outstanding stock as part of the conversion from mutual to stock. The loan bears interest equal to 8.25% and provides for annual payments of principal and interest. Under the ESOP’s change in control provision, the Trust would be instructed to use proceeds from the sale of stock to pay off the outstanding ESOP loan balance and to distribute the remaining plan assets to current participants.
At December 31, 2009, the remaining principal balance is payable as follows:
| Years Ending December 31, |
|||
| 2010 |
$ | 166 | |
| 2011 |
180 | ||
| 2012 |
195 | ||
| 2013 |
211 | ||
| 2014 |
229 | ||
| Thereafter |
4,174 | ||
| $ | 5,155 | ||
The Bank has committed to make contributions to the ESOP sufficient to support the debt service of the loan. The loan is secured by the shares purchased by First Bankers Trust Company (“Trustee”), which are held in a suspense account for allocation among the participants as the loan is paid. Total compensation expense applicable to the ESOP amounted to $371, $378, and $435 for the years ended December 31, 2009, 2008, and 2007, respectively.
Shares held by the ESOP include the following:
| December 31, | ||||||
| 2009 | 2008 | 2007 | ||||
| Allocated |
114,789 | 88,017 | 59,514 | |||
| Unallocated |
476,120 | 505,878 | 535,635 | |||
| 590,909 | 593,895 | 595,149 | ||||
The fair value of unallocated shares at December 31, 2009 was $5,942.
F-41
Table of Contents
CHICOPEE BANCORP, INC. AND SUBSIDIARIES
NOTES TO CONSOLIDATED FINANCIAL STATEMENTS (Continued)
(Dollars in Thousands, Except Per Share Amounts)
| 17. | EQUITY INCENTIVE PLAN |
Stock Options
Under the Company’s 2007 Equity Incentive Plan, approved by the Company’s stockholders at the annual meeting of the Company stockholders on May 30, 2007, the Company may grant options to directors, officers and employees for up to 743,936 shares of common stock. Both incentive stock options and non-qualified stock options may be granted under the Plan. The exercise price for each option is equal to the market price of the Company’s stock on the date of grant and the maximum term of each option is ten years. The stock options vest over five years in five equal installments on each anniversary of the date of grant.
The Company recognizes compensation expense over the vesting period, based on the grant-date fair value of the options granted. The fair value of each option grant is estimated on the date of grant using the Black-Scholes option-pricing model with the following weighted average assumptions for options granted during the years ended December 31, 2009 and 2008:
| Years Ended December 31, | ||||
| 2009 | 2008 | |||
| Expected dividend yield |
2.00% | 2.00% | ||
| Expected term |
6.5 years | 6.5 years | ||
| Expected volatility |
25.89% | 24.52% | ||
| Risk-free interest rate |
2.95% | 1.99% | ||
F-42
Table of Contents
CHICOPEE BANCORP, INC. AND SUBSIDIARIES
NOTES TO CONSOLIDATED FINANCIAL STATEMENTS (Continued)
(Dollars in Thousands, Except Per Share Amounts)
EQUITY INCENTIVE PLAN (continued)
The expected volatility is based on historical volatility of the Company’s stock and other factors. The risk-free interest rate for the periods within the contractual life of the options is based on the U.S. Treasury yield curve in effect at the time of grant. The expected life of 6.5 years is based on the simplified method calculations allowed for “plain-vanilla” share options granted. The dividend yield assumption is based on the Company’s expectation of dividend payouts. A summary of options under the Plan as of December 31, 2009, and changes during the year then ended is as follows:
| Shares | Weighted Average Exercise Price |
Weighted Average Remaining Contractual Term (in years) |
Aggregate Intrinsic Value (000’s) | |||||||
| Outstanding at December 31, 2007 |
693,267 | $ | 14.29 | 9.50 | ||||||
| Outstanding at December 31, 2008 |
671,667 | 14.27 | 8.43 | |||||||
| Granted |
16,500 | 12.41 | — | |||||||
| Exercised |
— | — | — | |||||||
| Forfeited or expired |
— | — | — | |||||||
| Outstanding at December 31, 2009 |
688,167 | $ | 14.22 | 7.50 | $ | 9,787 | ||||
| Excercisable at December 31, 2009 |
267,665 | $ | 14.28 | 7.43 | $ | 3,822 | ||||
| Exercisable at December 31, 2008 |
133,331 | $ | 14.29 | 8.42 | $ | 1,905 | ||||
| Exercisable at December 31, 2007 |
— | $ | — | — | $ | — | ||||
The Company granted an additional 16,500 stock options in the year ended December 31, 2009 with a fair value of $3.07. The weighted average grant date fair value of options granted during 2009, 2008 and 2007 was $3.07, $2.37 and $3.92, respectively. For the year ended December 31, 2009, share based compensation expense applicable to the plan was $524 and the related tax benefit was $105. For the year ended December 31, 2008, share based compensation expense applicable to the plan was $514 and the related tax benefit was $104. For the year ended December 31, 2007, share based compensation expense applicable to the plan was $292 and the related tax benefit was $34. No options were exercised during the years ended December 31, 2009, 2008 and 2007. As of December 31, 2009, unrecognized stock-based compensation expense related to non-vested options amounted to $1.4 million. This amount is expected to be recognized over a period of 2.66 years.
Stock Awards
Under the Company’s 2007 Equity Incentive Plan, the Company may grant stock awards to its directors, officers and employees for up to 297,574 shares of common stock. The stock awards vest 20% per year beginning on the first anniversary of the date of grant. The fair market value of the stock awards, based on the market price at the date of grant, is recorded as unearned compensation. Unearned compensation is amortized over the applicable vesting period. The weighted-average grant-date fair value of stock awards as of December 31, 2009 is $14.29. The Company recorded compensation cost related to stock awards of approximately $838 and $285 of related tax benefit in the year ended December 31, 2009. The Company recorded compensation cost related to stock awards of approximately $833 and $283 of related tax benefit in the year ended December 31, 2008. The Company recorded compensation cost related to stock awards of approximately $425 and $148 of related tax benefit in the year ended December 31, 2007. No stock awards were granted prior to July 1, 2007. Stock awards with a fair value of $777 and $765 have vested during the years ended December 31, 2009 and 2008, respectively. No stock awards vested in 2007. As of December 31, 2009, unrecognized stock-based compensation expense related to non-vested restricted stock awards of $2.2 million is expected to be recognized over a period of 2.57 years.
F-43
Table of Contents
CHICOPEE BANCORP, INC. AND SUBSIDIARIES
NOTES TO CONSOLIDATED FINANCIAL STATEMENTS (Continued)
(Dollars in Thousands, Except Per Share Amounts)
EQUITY INCENTIVE PLAN (concluded)
A summary of the status of the Company’s stock awards as of December 31, 2009, and changes during the year then ended is as follows:
| Nonvested Shares |
Shares | Weighted Average Grant-Date Fair Value | |||
| Outstanding at December 31, 2007 |
297,574 | $ | 14.29 | ||
| Outstanding at December 31, 2008 |
234,755 | 14.29 | |||
| Granted |
— | — | |||
| Vested |
58,685 | 14.29 | |||
| Forfeited or expired |
— | — | |||
| Outstanding at December 31, 2009 |
176,070 | $ | 14.29 | ||
| 18. | RELATED PARTY TRANSACTIONS |
In the ordinary course of business, the Company has granted loans to officers, directors and their affiliates amounting to approximately $2,758 and $3,142 at December 31, 2009 and 2008, respectively.
An analysis of the activity of these loans is as follows:
| Years Ended December 31, |
||||||||
| 2009 | 2008 | |||||||
| Balance at beginning of year |
$ | 3,142 | $ | 5,371 | ||||
| Additions |
724 | 595 | ||||||
| Repayments |
(1,078 | ) | (398 | ) | ||||
| Change in related party status |
(30 | ) | (2,426 | ) | ||||
| Balance at end of year |
$ | 2,758 | $ | 3,142 | ||||
Deposits from related parties held by the Bank at December 31, 2009 and 2008 amounted to $5,388 and $5,832, respectively.
F-44
Table of Contents
CHICOPEE BANCORP, INC. AND SUBSIDIARIES
NOTES TO CONSOLIDATED FINANCIAL STATEMENTS (Continued)
(Dollars in Thousands, Except Per Share Amounts)
RESTRICTIONS ON DIVIDENDS
Chicopee Bancorp, Inc. is subject to Massachusetts law, which prohibits distributions to stockholders if, after giving effect to the distribution, the corporation would not be able to pay its debts as they become due in the usual course of business or the corporation’s total assets would be less than the sum of its total liabilities plus the amount that would be needed, if the corporation were to be dissolved at the time of the distribution, to satisfy the preferential rights upon dissolution of stockholders whose preferential rights are superior to those receiving the distribution. Dividends from Chicopee Bancorp, Inc. may depend, in part, upon receipt of dividends from the Bank. The subsidiary may pay dividends to its parent out of so much of its net income as the Bank’s directors deem appropriate, subject to the limitation that the total of all dividends declared by the Bank in any calendar year may not exceed the total of its net income of that year combined with its retained net income of the preceding two years and subject to minimum regulatory capital requirements. The approval of the Massachusetts Commissioner of Banks is required if the total of all dividends declared in any calendar year exceeds the total of its net profits for that year combined with its retained net profits of the preceding two years. Net profits for this purpose means the remainder of all earnings from current operations plus actual recoveries on loans and investments and other assets after deducting from the total thereof all current operating expenses, actual losses, accrued dividends on preferred stock, if any and all federal and state taxes. The payment of dividends from the Bank to the Company may be additionally restricted if the payment of such dividends resulted in the Bank failing to meet regulatory capital requirements.
Capital at December 31, 2009 was sufficient to meet the requirements of regulatory authorities. To be rated “well-capitalized”, regulatory requirements call for a minimum leverage capital ratio of 5.0%, tier-one risk-based capital of 6.0%, and total risk-based capital of 10.0%. At December 31, 2009, the Company had leverage capital of 17.4%, tier-one risk-based capital of 22.4% and total risk-based capital of 23.4%, versus 18.4%, 22.8% and 23.6%, respectively, at December 31, 2008. The Company’s actual levels of capitalization were comfortably above the standards to be rated “well-capitalized” by regulatory authorities.
A total of $500 in dividends was declared in 2009 from the Bank to the Company. The Bank paid the dividend in January 2010.
F-45
Table of Contents
CHICOPEE BANCORP, INC. AND SUBSIDIARIES
NOTES TO CONSOLIDATED FINANCIAL STATEMENTS (Continued)
(Dollars in Thousands, Except Per Share Amounts)
| 19. | FAIR VALUE OF FINANCIAL INSTRUMENTS |
Effective January 1, 2008, the Company adopted “Fair Value Measurements”, which provides a framework for measuring fair value under GAAP. The Company did not adopt “The Fair Value Option for Financial Assets and Financial Liabilities”.
The Company groups its financial assets and financial liabilities measured at fair value in three levels, based on the markets in which the assets and liabilities are traded and the observability of the assumptions used to determine fair value:
Level 1- Valuations for assets traded in active exchange markets, such as the New York Stock Exchange. Level 1 also includes U.S. Treasury securities and U.S. government and agency mortgage-backed securities that are traded by dealers or brokers in active markets. Valuations are obtained from readily available pricing sources for market transactions involving identical assets or liabilities.
Level 2- Valuations for assets and liabilities with inputs that are observable either directly or indirectly for substantially the full term or valuations obtained from third party pricing services based on quoted market prices for comparable assets or liabilities. Level 2 also included assets and liabilities traded in inactive markets.
Level 3- Valuations for assets and liabilities with inputs that are unobservable, which are derived from other valuation methodologies, including option pricing models, discounted cash flow models and similar techniques, and are not based on market exchange, dealer, or broker traded transactions. Level 3 valuations incorporate certain assumptions and projections in determining the fair value assigned to such assets and liabilities.
Assets measured at fair value on a recurring basis are summarized below:
F-46
Table of Contents
CHICOPEE BANCORP, INC. AND SUBSIDIARIES
NOTES TO CONSOLIDATED FINANCIAL STATEMENTS (Continued)
(Dollars in Thousands, Except Per Share Amounts)
FAIR VALUE OF FINANCIAL INSTRUMENTS (continued)
| Fair Value Measurements Using | ||||||||||||
| December 31, 2009 | Quoted Prices in Active Markets for Identical Assets (Level 1) |
Significant Other Observable Inputs (Level 2) |
Significant Unobservable Inputs (Level 3) | |||||||||
| (Dollars in Thousands) | ||||||||||||
| Securities available-for-sale |
||||||||||||
| Financial |
$ | 503 | $ | 503 | $ | — | $ | — | ||||
| Total equity securities |
$ | 503 | $ | 503 | $ | — | $ | — | ||||
| Fair Value Measurements Using | ||||||||||||
| December 31, 2008 | Quoted Prices in Active Markets for Identical Assets (Level 1) |
Significant Other Observable Inputs (Level 2) |
Significant Unobservable Inputs (Level 3) | |||||||||
| (Dollars In Thousands) | ||||||||||||
| Securities available-for-sale |
||||||||||||
| Health care |
$ | 833 | $ | 833 | $ | — | $ | — | ||||
| Financial |
1,047 | 1,047 | — | — | ||||||||
| Consumer staples |
791 | 791 | — | — | ||||||||
| Energy |
669 | 669 | — | — | ||||||||
| Industrial |
453 | 453 | — | — | ||||||||
| Technology |
268 | 268 | — | — | ||||||||
| Materials |
252 | 252 | — | — | ||||||||
| Consumer discretion |
221 | 221 | — | — | ||||||||
| Utilities |
234 | 234 | — | — | ||||||||
| Mining |
314 | 314 | — | — | ||||||||
| Miscellaneous |
96 | 96 | — | — | ||||||||
| Telecommunications |
90 | 90 | — | — | ||||||||
| Total equity securities |
$ | 5,268 | $ | 5,268 | $ | — | $ | — | ||||
The valuation approach used to value the securities available-for-sale was the market approach.
F-47
Table of Contents
CHICOPEE BANCORP, INC. AND SUBSIDIARIES
NOTES TO CONSOLIDATED FINANCIAL STATEMENTS (Continued)
(Dollars in Thousands, Except Per Share Amounts)
FAIR VALUE OF FINANCIAL INSTRUMENTS (continued)
Also, the Company may be required, from time to time, to measure certain other financial assets on a nonrecurring basis in accordance with GAAP. These adjustments to fair value usually result from application of lower-of-cost-or-market accounting or write-downs of individual assets. The following table summarizes the fair value hierarchy used to determine each adjustment and the carrying value of the related individual assets.
| Fair Value Measurements Using | ||||||||||||
| December 31, 2009 | Quoted Prices in Active Markets for Identical Assets (Level 1) |
Significant Other Observable Inputs (Level 2) |
Significant Unobservable Inputs (Level 3) | |||||||||
| (Dollars In Thousands) | ||||||||||||
| Assets: |
||||||||||||
| Impaired loans |
$ | 9,839 | $ | — | $ | 9,839 | $ | — | ||||
| Mortgage servicing rights |
582 | — | 582 | — | ||||||||
| Other real estate owned |
80 | — | 80 | — | ||||||||
| Loans held for sale |
534 | 534 | ||||||||||
| Total Assets |
$ | 11,035 | $ | — | $ | 11,035 | $ | — | ||||
| Fair Value Measurements Using | ||||||||||||
| December 31, 2008 | Quoted Prices in Active Markets for Identical Assets (Level 1) |
Significant Other Observable Inputs (Level 2) |
Significant Unobservable Inputs (Level 3) | |||||||||
| (Dollars In Thousands) | ||||||||||||
| Assets: |
||||||||||||
| Impaired loans |
$ | 6,869 | $ | — | $ | 6,869 | $ | — | ||||
| Mortgage servicing rights |
188 | — | 188 | — | ||||||||
| Other real estate owned |
269 | — | 269 | — | ||||||||
| Loans held for sale |
185 | — | 185 | — | ||||||||
| Total Assets |
$ | 7,511 | $ | — | $ | 7,511 | $ | — | ||||
A valuation reserve, for the above impaired loans, of $501 and $110 as of December 31, 2009 and 2008, respectively, was included in the allowance for loan losses. The amount of impaired loans represents the carrying value, net of the related allowance for loan losses on impaired loans for which adjustments are based on the appraised value of the collateral, which is based on the market approach of valuation.
Mortgage servicing rights represent the value associated with servicing residential mortgage loans. Servicing assets and servicing liabilities are reported using the amortization method or the fair value measurement method. In evaluating the carrying values of mortgage servicing rights, the Company obtains third party valuations based on loan level data including note rate, type and term of the underlying loans. As such, the Company classifies mortgage servicing rights as nonrecurring Level 2.
F-48
Table of Contents
CHICOPEE BANCORP, INC. AND SUBSIDIARIES
NOTES TO CONSOLIDATED FINANCIAL STATEMENTS (Continued)
(Dollars in Thousands, Except Per Share Amounts)
FAIR VALUE OF FINANCIAL INSTRUMENTS (continued)
Mortgage loans held for sale are recorded at the lower of carrying value or market value. The fair value of mortgage loans held for sale is based on what secondary markets are currently offering for portfolios with similar characteristics. As such, the Company classifies mortgage loans held for sale as nonrecurring Level 2.
Real estate acquired through foreclosure is recorded at market value. The fair value of other real estate owned is based on property appraisals and an analysis of similar properties currently available. As such, the Company records other real estate owned as nonrecurring Level 2.
Fair Value Measurements and Disclosures requires disclosures of fair value information about financial instruments, whether or not recognized in the balance sheet, if the fair value can be reasonably determined. Fair value is best determined based upon quoted market prices. However, in many instances, there are no quoted market prices for the Company’s various financial instruments. In cases where quoted market prices are not available, fair values are based on estimates using present value or other valuation techniques using observable inputs when available. Those techniques are significantly affected by the assumptions used, including the discount rate and estimates of future cash flows. Accordingly, the fair value estimates may not be realized in an immediate settlement of the instrument. FASB ASC Topic 820 excludes certain financial instruments and all nonfinancial instruments from its disclosure requirements. Accordingly, the aggregate fair value amounts presented may not necessarily represent the underlying fair value of the Company.
The following methods and assumptions were used by the Company in estimating fair value disclosures for financial instruments:
Cash and cash equivalents: The carrying amounts of cash and short-term instruments approximate fair values.
Securities: Fair values for securities, excluding Federal Home Loan Bank stock, are based on quoted market prices. The carrying value of Federal Home Loan Bank stock approximates fair value based on the redemption provisions of the Federal Home Loan Bank.
Loans receivable: For variable-rate loans that reprice frequently and with no significant change in credit risk, fair values are based on carrying values. Fair values for other loans are estimated using discounted cash flow analyses, using interest rates currently being offered for loans with similar terms to borrowers of similar credit quality. Fair values for nonperforming loans are estimated using discounted cash flow analyses or underlying collateral values, where applicable.
Deposit liabilities and mortgagors’ escrow accounts: The fair values disclosed for demand deposits (e.g., interest and non-interest checking, passbook savings, and certain types of money market accounts) are, by definition, equal to the amount payable on demand at the reporting date (i.e., their carrying amounts). The carrying amounts of variable-rate, fixed-term money market accounts and certificates of deposit approximate their fair values at the reporting date. Fair values for fixed-rate certificates of deposit are estimated using a discounted cash flow calculation that applies interest rates currently being offered on certificates to a schedule of aggregate expected monthly maturities on time deposits.
Securities sold under agreements to repurchase: The carrying amounts of borrowings under repurchase agreements maturing within ninety days approximate their fair values.
F-49
Table of Contents
CHICOPEE BANCORP, INC. AND SUBSIDIARIES
NOTES TO CONSOLIDATED FINANCIAL STATEMENTS (Continued)
(Dollars in Thousands, Except Per Share Amounts)
FAIR VALUE OF FINANCIAL INSTRUMENTS (concluded)
Advances from Federal Home Loan Bank: The fair values of these borrowings are estimated using discounted cash flow analyses based on the Company’s current incremental borrowing rates for similar types of borrowing arrangements.
Accrued interest and dividends: The carrying amounts of accrued interest and dividends approximate fair value.
Off-balance-sheet instruments: The Company’s off-balance-sheet instruments consist of loan commitments. Fair values for loan commitments have not been presented as the future revenue derived from such financial instruments is not significant.
The carrying amounts and estimated fair values of the Company’s financial instruments are as follows:
| December 31, | ||||||||||||
| 2009 | 2008 | |||||||||||
| Carrying Amount |
Fair Value |
Carrying Amount |
Fair Value | |||||||||
| Financial assets: |
||||||||||||
| Cash and cash equivalents |
$ | 20,075 | $ | 20,075 | $ | 23,100 | $ | 23,100 | ||||
| Securities available-for-sale |
503 | 503 | 5,268 | 5,268 | ||||||||
| Securities held-to-maturity |
62,983 | 63,130 | 49,662 | 49,673 | ||||||||
| Federal Home Loan Bank stock |
4,306 | 4,306 | 4,306 | 4,306 | ||||||||
| Loans, net |
424,655 | 421,155 | 416,076 | 423,171 | ||||||||
| Loans held for sale |
534 | 534 | 185 | 185 | ||||||||
| Accrued interest receivable |
1,629 | 1,629 | 1,577 | 1,577 | ||||||||
| Financial liabilities: |
||||||||||||
| Deposits |
365,498 | 361,114 | 334,767 | 338,914 | ||||||||
| Repurchase agreements |
20,422 | 20,422 | 21,956 | 21,956 | ||||||||
| Advances from Federal Home Loan Bank |
63,675 | 64,002 | 76,567 | 78,297 | ||||||||
| Accrued interest payable |
175 | 175 | 138 | 138 | ||||||||
F-50
Table of Contents
CHICOPEE BANCORP, INC. AND SUBSIDIARIES
NOTES TO CONSOLIDATED FINANCIAL STATEMENTS (continued)
(Dollars in Thousands, Except Per Share Amounts)
| 20. | QUARTERLY CONSOLIDATED FINANCIAL INFORMATION (UNAUDITED) |
Following is the quarterly financial information of the Company for 2009 and 2008:
| 2009 | 2008 | ||||||||||||||||||||||||||||
| First Quarter |
Second Quarter |
Third Quarter |
Fourth Quarter |
First Quarter |
Second Quarter |
Third Quarter |
Fourth Quarter |
||||||||||||||||||||||
| Interest and dividend income |
$ | 6,078 | $ | 6,132 | $ | 6,083 | $ | 6,195 | $ | 6,389 | $ | 6,353 | $ | 6,606 | $ | 6,435 | |||||||||||||
| Interest expense |
2,344 | 2,278 | 2,335 | 2,150 | 2,896 | 2,652 | 2,912 | 2,729 | |||||||||||||||||||||
| Net interest and dividend income |
3,734 | 3,854 | 3,748 | 4,045 | 3,493 | 3,701 | 3,694 | 3,706 | |||||||||||||||||||||
| Provision for loan losses |
94 | 71 | 385 | 347 | 10 | 262 | 34 | 9 | |||||||||||||||||||||
| Net (loss) gain on sales of securities available-for-sale |
36 | (9 | ) | (25 | ) | 139 | 15 | 100 | (148 | ) | (24 | ) | |||||||||||||||||
| Fees and other non-interest income |
651 | 705 | 613 | 605 | 471 | 520 | 536 | 531 | |||||||||||||||||||||
| Non-interest expenses |
4,212 | 4,697 | 4,547 | 4,563 | 3,697 | 3,883 | 3,986 | 4,316 | |||||||||||||||||||||
| Other than temporary impairment charge |
— | 106 | 1,297 | — | — | — | — | — | |||||||||||||||||||||
| Income tax provision |
1 | (150 | ) | (492 | ) | 14 | 84 | 48 | 218 | 26 | |||||||||||||||||||
| Net income (loss) |
$ | 114 | $ | (174 | ) | $ | (1,401 | ) | $ | (135 | ) | $ | 188 | $ | 128 | $ | (156 | ) | $ | (138 | ) | ||||||||
| Earnings (loss) per share: |
|||||||||||||||||||||||||||||
| Basic |
$ | 0.02 | $ | (0.03 | ) | $ | (0.25 | ) | $ | (0.02 | ) | $ | 0.03 | $ | 0.02 | $ | (0.03 | ) | $ | (0.02 | ) | ||||||||
| Diluted |
$ | 0.02 | $ | (0.03 | ) | $ | (0.25 | ) | $ | (0.02 | ) | $ | 0.03 | $ | 0.02 | $ | (0.03 | ) | $ | (0.02 | ) | ||||||||
F-51
Table of Contents
CHICOPEE BANCORP, INC. AND SUBSIDIARIES
NOTES TO CONSOLIDATED FINANCIAL STATEMENTS (continued)
(Dollars in Thousands, Except Per Share Amounts)
| 21. | CONDENSED FINANCIAL STATEMENTS OF PARENT COMPANY |
Financial information pertaining to Chicopee Bancorp, Inc. is as follows:
| December 31, | ||||||
| BALANCE SHEETS |
2009 | 2008 | ||||
| Assets |
||||||
| Cash and cash equivalents |
$ | 3,714 | $ | 5,740 | ||
| Investment in common stock of Chicopee Savings Bank |
81,073 | 79,982 | ||||
| Investment in common stock of Chicopee Funding Corporation |
7,415 | 6,969 | ||||
| Other assets |
1,982 | 1,483 | ||||
| Total assets |
$ | 94,184 | $ | 94,174 | ||
| Liabilities and Stockholders’ Equity |
||||||
| Total liabilities |
$ | 12 | $ | 157 | ||
| Stockholders’ equity |
94,172 | 94,017 | ||||
| Total liabilities and stockholders’ equity |
$ | 94,184 | $ | 94,174 | ||
| Years Ended December 31, | ||||||||||||
| STATEMENTS OF OPERATIONS |
2009 | 2008 | 2007 | |||||||||
| Interest income |
$ | 64 | $ | 261 | $ | 885 | ||||||
| Non-interest income |
— | 2 | — | |||||||||
| Operating expenses |
713 | 1,068 | 1,153 | |||||||||
| Loss before income taxes and equity in undistributed net income of subsidiaries |
(649 | ) | (805 | ) | (268 | ) | ||||||
| Applicable income tax expense (benefit) |
(233 | ) | 81 | 230 | ||||||||
| Loss before equity in undistributed net income of subsidiaries |
(416 | ) | (886 | ) | (498 | ) | ||||||
| Equity in undistributed net (loss) income of Chicopee Savings Bank |
(1,627 | ) | 501 | 1,686 | ||||||||
| Equity in undistributed net income of Chicopee Funding Corporation |
447 | 407 | 412 | |||||||||
| Net income (loss) |
$ | (1,596 | ) | $ | 22 | $ | 1,600 | |||||
F-52
Table of Contents
CHICOPEE BANCORP, INC. AND SUBSIDIARIES
NOTES TO CONSOLIDATED FINANCIAL STATEMENTS (continued)
(Dollars in Thousands, Except Per Share Amounts)
CONDENSED FINANCIAL STATEMENTS OF PARENT COMPANY (concluded)
| Years Ended December 31, | ||||||||||||
| STATEMENTS OF CASH FLOWS |
2009 | 2008 | 2007 | |||||||||
| Cash flows from operating activities: |
||||||||||||
| Net income (loss) |
$ | (1,596 | ) | $ | 22 | $ | 1,600 | |||||
| Adjustments to reconcile net income (loss) to net cash provided by operating activities: |
||||||||||||
| Equity in undistributed net loss (income) of Chicopee Savings Bank |
1,627 | (501 | ) | (1,686 | ) | |||||||
| Equity in undistributed net income of Chicopee Funding Corporation |
(447 | ) | (407 | ) | (412 | ) | ||||||
| Deferred income tax expense (benefit) |
300 | 300 | (145 | ) | ||||||||
| Decrease (increase) in accrued interest receivable |
(500 | ) | 1 | 69 | ||||||||
| Decrease (increase) in other assets |
(412 | ) | (350 | ) | 345 | |||||||
| Increase (decrease) in other liabilities |
(145 | ) | 100 | 58 | ||||||||
| Change in unearned compensation |
1,733 | 1,725 | 1,152 | |||||||||
| Net cash provided by operating activities |
560 | 890 | 981 | |||||||||
| Cash flows from investing activities: |
||||||||||||
| Investment in Chicopee Savings Bank |
(1,233 | ) | (1,725 | ) | (7,653 | ) | ||||||
| Purchases of securities held-to-maturity |
(230 | ) | (731 | ) | (5,983 | ) | ||||||
| Maturities of securities held-to-maturity |
345 | 636 | 10,983 | |||||||||
| Net cash used in investing activities |
(1,118 | ) | (1,820 | ) | (2,653 | ) | ||||||
| Cash flows from financing activities |
||||||||||||
| Stock purchased for treasury |
(1,468 | ) | (10,375 | ) | (2,108 | ) | ||||||
| Stock purchased for restricted stock awards |
— | — | (4,365 | ) | ||||||||
| Net cash used in financing activities |
(1,468 | ) | (10,375 | ) | (6,473 | ) | ||||||
| Net decrease in cash and cash equivalents |
(2,026 | ) | (11,305 | ) | (8,145 | ) | ||||||
| Cash and cash equivalents at beginning of year |
5,740 | 17,045 | 25,190 | |||||||||
| Cash and cash equivalents at end of year |
$ | 3,714 | $ | 5,740 | $ | 17,045 | ||||||
F-53
Table of Contents
CHICOPEE BANCORP, INC. AND SUBSIDIARIES
NOTES TO CONSOLIDATED FINANCIAL STATEMENTS (continued)
(Dollars in Thousands, Except Per Share Amounts)
| 22. | SUBSEQUENT EVENTS |
Subsequent Events represent events or transactions occurring after the balance sheet date but before the financial statements are issued or are available to be issued. Financial statements are considered “issued” when they are widely distributed to shareholders and others for general use and reliance in a form and format that complies with GAAP. Financial statements are considered “available to be issued” when they are complete in form and format that complies with GAAP and all approvals necessary for their issuance have been obtained.
Specifically, there are two types of subsequent events:
| • | Those comprising events or transactions providing additional evidence about conditions that existed at the balance sheet date, including estimates inherent in the financial statement preparation process (referred to as recognized subsequent events). |
| • | Those comprising events that provide evidence about conditions not existing at the balance sheet date but, rather, that arose after such date (referred to as non-recognized subsequent events). |
The Company is an SEC filer and management has evaluated subsequent events through the date that the financial statements were issued. The following subsequent event has been noted:
| • | On February 26, 2010, the Company announced that they are commencing a fourth stock repurchase program to acquire 318,952 shares, or approximately 5%, of the Company’s outstanding common stock. |
F-54