Attached files
| file | filename |
|---|---|
| 8-K - CURRENT REPORT OF MATERIAL EVENTS OR CORPORATE CHANGES - CUBIC ENERGY INC | a10-4223_18k.htm |
Exhibit 99.1
|
|
Corporate Presentation February 2010 NYSE Amex: QBC www.CubicEnergyInc.com The Horizontal Haynesville Shale drilling of the Red Oak Timber 6 No. 1 with the Trinidad Triple 132 operated by EXCO Operating Company LP |
|
|
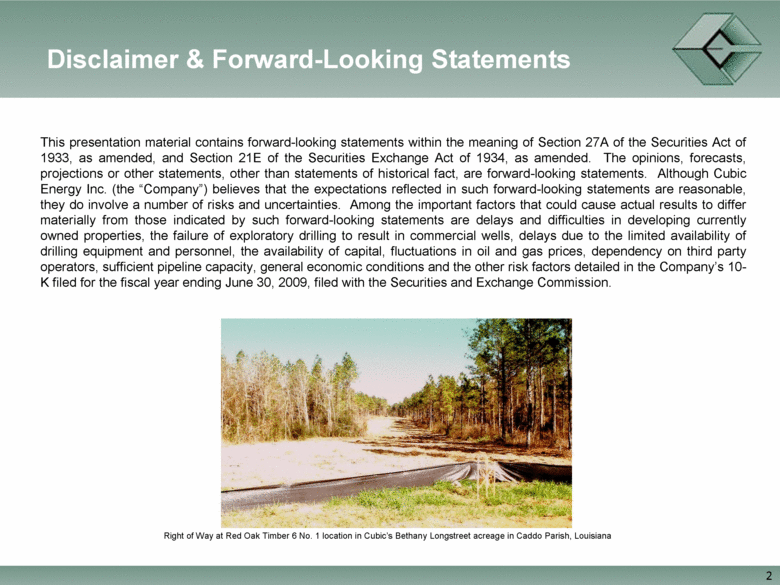
2 This presentation material contains forward-looking statements within the meaning of Section 27A of the Securities Act of 1933, as amended, and Section 21E of the Securities Exchange Act of 1934, as amended. The opinions, forecasts, projections or other statements, other than statements of historical fact, are forward-looking statements. Although Cubic Energy Inc. (the “Company”) believes that the expectations reflected in such forward-looking statements are reasonable, they do involve a number of risks and uncertainties. Among the important factors that could cause actual results to differ materially from those indicated by such forward-looking statements are delays and difficulties in developing currently owned properties, the failure of exploratory drilling to result in commercial wells, delays due to the limited availability of drilling equipment and personnel, the availability of capital, fluctuations in oil and gas prices, dependency on third party operators, sufficient pipeline capacity, general economic conditions and the other risk factors detailed in the Company’s 10-K filed for the fiscal year ending June 30, 2009, filed with the Securities and Exchange Commission. Disclaimer & Forward-Looking Statements Right of Way at Red Oak Timber 6 No. 1 location in Cubic’s Bethany Longstreet acreage in Caddo Parish, Louisiana |
|
|
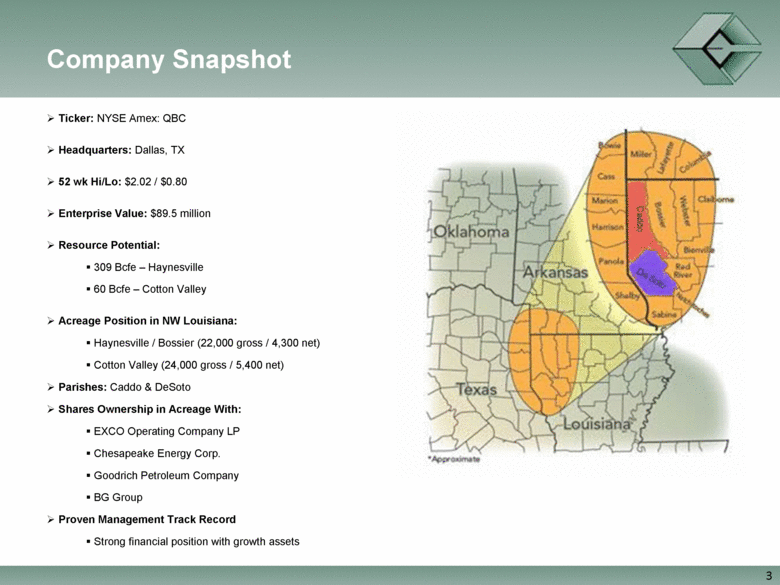
Company Snapshot Ticker: NYSE Amex: QBC Headquarters: Dallas, TX 52 wk Hi/Lo: $2.02 / $0.80 Enterprise Value: $89.5 million Resource Potential: 309 Bcfe – Haynesville 60 Bcfe – Cotton Valley Acreage Position in NW Louisiana: Haynesville / Bossier (22,000 gross / 4,300 net) Cotton Valley (24,000 gross / 5,400 net) Parishes: Caddo & DeSoto Shares Ownership in Acreage With: EXCO Operating Company LP Chesapeake Energy Corp. Goodrich Petroleum Company BG Group Proven Management Track Record Strong financial position with growth assets 3 |
|
|
Company Overview 1999- Company Founded 2006-2008- Cubic Assembled 24,000 Gross Acres In Caddo/DeSoto Parishes 100% of its acreage is held by production (HBP) Strategically held acreage to allow other operators to establish optimal drilling and completion techniques in the Haynesville Shale 2009- Cubic Entered Into Strategic Transaction Swapped QBC Stock and Preferred with an affiliate to allow for the acquisition of $30.9 million of Drilling Credits from EXCO Operating Company LP (actual issuance of QBC stock & preferred pending NYSE Amex approval) Eliminates the need to staff up to drill Haynesville Shale Transfers operatorship to one of the most active and experienced Haynesville operators 2010- Company Positioned For Haynesville-Driven Growth $33 million of liquidity immediately available for drilling 6 Gross Haynesville Shale wells now on-stream producing 18,500 Mcfepd 6 Gross Haynesville Shale wells Waiting On Completion and/or State Potential 1 rig currently operating on Cubic acreage 4 |
|
|
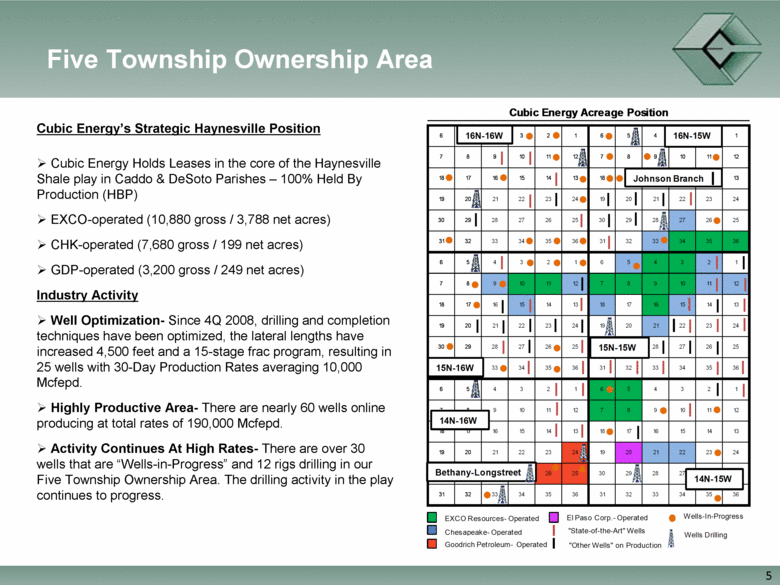
Five Township Ownership Area Cubic Energy’s Strategic Haynesville Position Cubic Energy Holds Leases in the core of the Haynesville Shale play in Caddo & DeSoto Parishes – 100% Held By Production (HBP) EXCO-operated (10,880 gross / 3,788 net acres) CHK-operated (7,680 gross / 199 net acres) GDP-operated (3,200 gross / 249 net acres) Industry Activity Well Optimization- Since 4Q 2008, drilling and completion techniques have been optimized, the lateral lengths have increased 4,500 feet and a 15-stage frac program, resulting in 25 wells with 30-Day Production Rates averaging 10,000 Mcfepd. Highly Productive Area- There are nearly 60 wells online producing at total rates of 190,000 Mcfepd. Activity Continues At High Rates- There are over 30 wells that are “Wells-in-Progress” and 12 rigs drilling in our Five Township Ownership Area. The drilling activity in the play continues to progress. 5 |
|
|
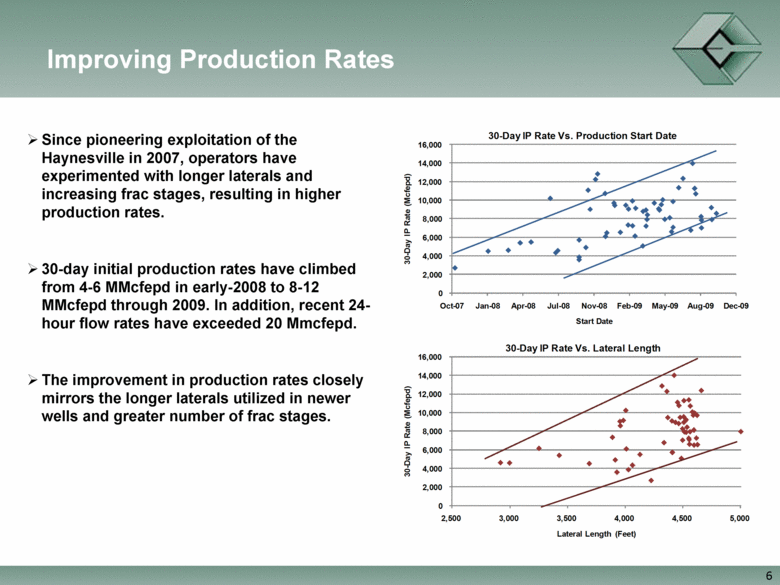
Improving Production Rates Since pioneering exploitation of the Haynesville in 2007, operators have experimented with longer laterals and increasing frac stages, resulting in higher production rates. 30-day initial production rates have climbed from 4-6 MMcfepd in early-2008 to 8-12 MMcfepd through 2009. In addition, recent 24-hour flow rates have exceeded 20 Mmcfepd. The improvement in production rates closely mirrors the longer laterals utilized in newer wells and greater number of frac stages. 6 |
|
|
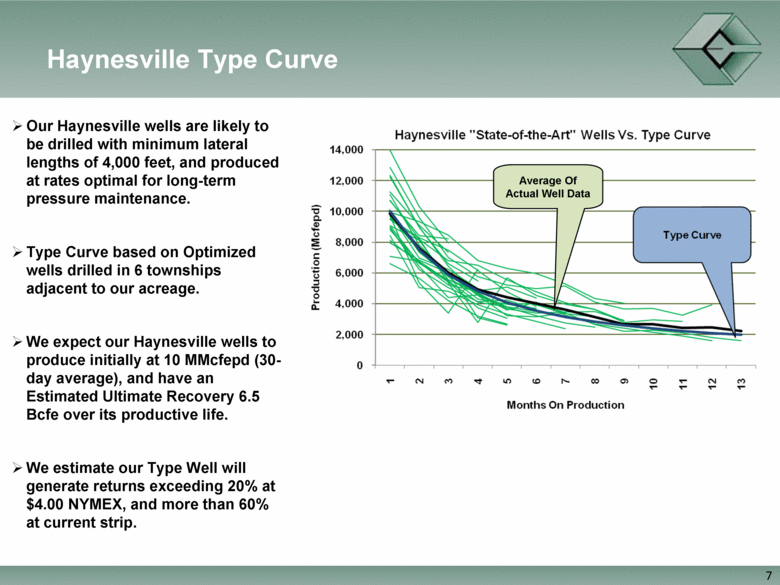
Haynesville Type Curve Our Haynesville wells are likely to be drilled with minimum lateral lengths of 4,000 feet, and produced at rates optimal for long-term pressure maintenance. Type Curve based on Optimized wells drilled in 6 townships adjacent to our acreage. We expect our Haynesville wells to produce initially at 10 MMcfepd (30-day average), and have an Estimated Ultimate Recovery 6.5 Bcfe over its productive life. We estimate our Type Well will generate returns exceeding 20% at $4.00 NYMEX, and more than 60% at current strip. Average Of Actual Well Data 7 |
|
|
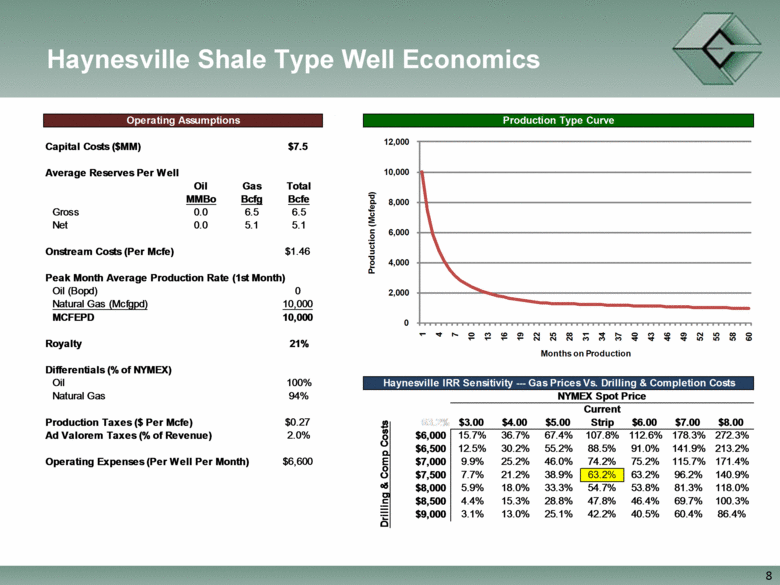
Haynesville Shale Type Well Economics Capital Costs ($MM) $7.5 Average Reserves Per Well Oil Gas Total MMBo Bcfg Bcfe Gross 0.0 6.5 6.5 Net 0.0 5.1 5.1 Onstream Costs (Per Mcfe) $1.46 Peak Month Average Production Rate (1st Month) Oil (Bopd) 0 Natural Gas (Mcfgpd) 10,000 MCFEPD 10,000 Royalty 21% Differentials (% of NYMEX) Oil 100% Natural Gas 94% Current Production Taxes ($ Per Mcfe) $0.27 63.2% $3.00 $4.00 $5.00 Strip $6.00 $7.00 $8.00 Ad Valorem Taxes (% of Revenue) 2.0% $6,000 15.7% 36.7% 67.4% 107.8% 112.6% 178.3% 272.3% $6,500 12.5% 30.2% 55.2% 88.5% 91.0% 141.9% 213.2% Operating Expenses (Per Well Per Month) $6,600 $7,000 9.9% 25.2% 46.0% 74.2% 75.2% 115.7% 171.4% $7,500 7.7% 21.2% 38.9% 63.2% 63.2% 96.2% 140.9% $8,000 5.9% 18.0% 33.3% 54.7% 53.8% 81.3% 118.0% $8,500 4.4% 15.3% 28.8% 47.8% 46.4% 69.7% 100.3% $9,000 3.1% 13.0% 25.1% 42.2% 40.5% 60.4% 86.4% Drilling & Comp Costs Production Type Curve Haynesville IRR Sensitivity --- Gas Prices Vs. Drilling & Completion Costs NYMEX Spot Price Operating Assumptions 0 2000 4000 6000 8000 10000 12000 6 11 16 21 26 31 36 41 46 51 56 61 66 71 76 81 86 91 96 101 106 111 116 Production (Mcfepd) Months on Production 2,000 4,000 6,000 8,000 10,000 12,000 1 4 7 10 13 16 19 22 25 28 31 34 37 40 43 46 49 52 55 58 60 Production (Mcfepd) Months on Production 8 |
|
|
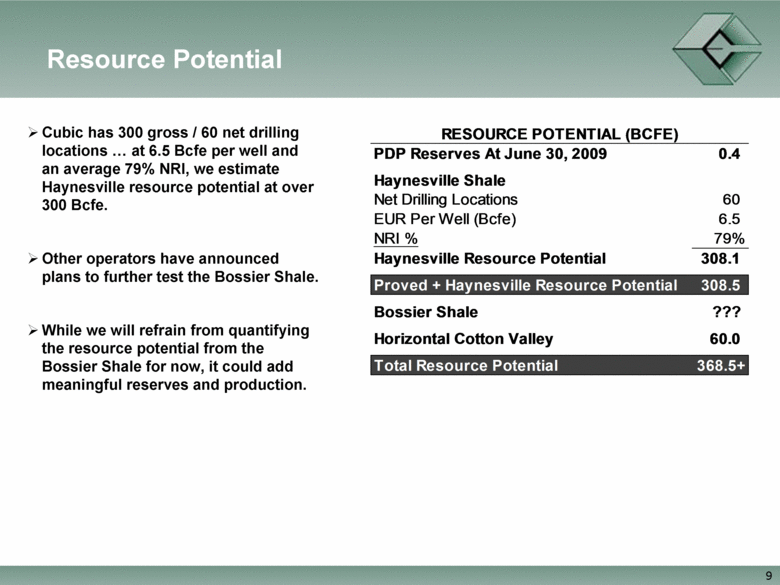
Resource Potential Cubic has 300 gross / 60 net drilling locations at 6.5 Bcfe per well and an average 79% NRI, we estimate Haynesville resource potential at over 300 Bcfe. Other operators have announced plans to further test the Bossier Shale. While we will refrain from quantifying the resource potential from the Bossier Shale for now, it could add meaningful reserves and production. PDP Reserves At June 30, 2009 0.4 Haynesville Shale Net Drilling Locations 60 EUR Per Well (Bcfe) 6.5 NRI % 79% Haynesville Resource Potential 308.1 Proved + Haynesville Resource Potential 308.5 Bossier Shale ??? Horizontal Cotton Valley 60.0 Total Resource Potential 368.5+ RESOURCE POTENTIAL (BCFE) 9 |
|
|
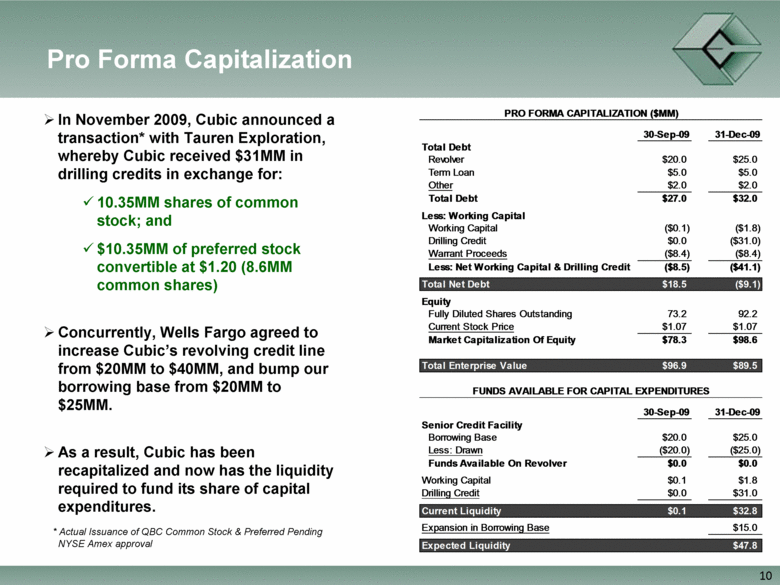
Pro Forma Capitalization In November 2009, Cubic announced a transaction* with Tauren Exploration, whereby Cubic received $31MM in drilling credits in exchange for: 10.35MM shares of common stock; and $10.35MM of preferred stock convertible at $1.20 (8.6MM common shares) Concurrently, Wells Fargo agreed to increase Cubic’s revolving credit line from $20MM to $40MM, and bump our borrowing base from $20MM to $25MM. As a result, Cubic has been recapitalized and now has the liquidity required to fund its share of capital expenditures. * Actual Issuance of QBC Common Stock & Preferred Pending NYSE Amex approval 30-Sep-09 31-Dec-09 Total Debt Revolver $20.0 $25.0 Term Loan $5.0 $5.0 Other $2.0 $2.0 Total Debt $27.0 $32.0 Less: Working Capital Working Capital ($0.1) ($1.8) Drilling Credit $0.0 ($31.0) Warrant Proceeds ($8.4) ($8.4) Less: Net Working Capital & Drilling Credit ($8.5) ($41.1) Total Net Debt $18.5 ($9.1) Equity Fully Diluted Shares Outstanding 73.2 92.2 Current Stock Price $1.07 $1.07 Market Capitalization Of Equity $78.3 $98.6 Total Enterprise Value $96.9 $89.5 30-Sep-09 31-Dec-09 Senior Credit Facility Borrowing Base $20.0 $25.0 Less: Drawn ($20.0) ($25.0) Funds Available On Revolver $0.0 $0.0 Working Capital $0.1 $1.8 Drilling Credit $0.0 $31.0 Current Liquidity $0.1 $32.8 Expansion in Borrowing Base $15.0 Expected Liquidity $47.8 PRO FORMA CAPITALIZATION ($MM) FUNDS AVAILABLE FOR CAPITAL EXPENDITURES 10 |
|
|
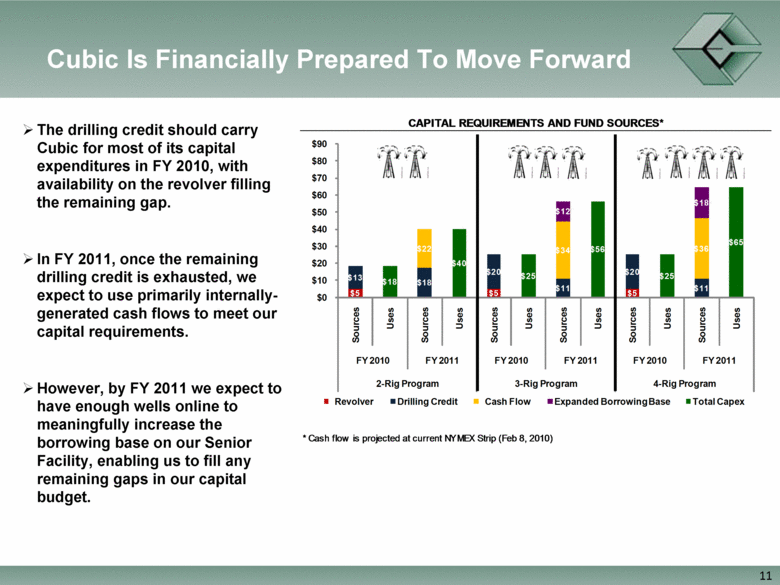
Cubic Is Financially Prepared To Move Forward The drilling credit should carry Cubic for most of its capital expenditures in FY 2010, with availability on the revolver filling the remaining gap. In FY 2011, once the remaining drilling credit is exhausted, we expect to use primarily internally-generated cash flows to meet our capital requirements. However, by FY 2011 we expect to have enough wells online to meaningfully increase the borrowing base on our Senior Facility, enabling us to fill any remaining gaps in our capital budget. 11 |
|
|
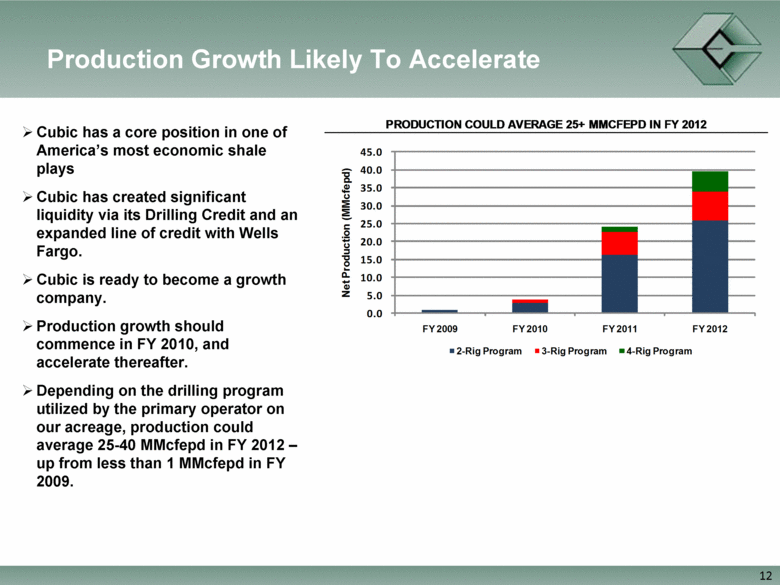
Production Growth Likely To Accelerate Cubic has a core position in one of America’s most economic shale plays Cubic has created significant liquidity via its Drilling Credit and an expanded line of credit with Wells Fargo. Cubic is ready to become a growth company. Production growth should commence in FY 2010, and accelerate thereafter. Depending on the drilling program utilized by the primary operator on our acreage, production could average 25-40 MMcfepd in FY 2012 – up from less than 1 MMcfepd in FY 2009. 12 |
|
|
NYSE Amex: QBC www.CubicEnergyInc.com 13 |

