Attached files
| file | filename |
|---|---|
| EXCEL - IDEA: XBRL DOCUMENT - CUBIC ENERGY INC | Financial_Report.xls |
| EX-31.1 - EX-31.1 - CUBIC ENERGY INC | a14-15242_1ex31d1.htm |
| EX-99.2 - EX-99.2 - CUBIC ENERGY INC | a14-15242_1ex99d2.htm |
| EX-23.2 - EX-23.2 - CUBIC ENERGY INC | a14-15242_1ex23d2.htm |
| EX-32.2 - EX-32.2 - CUBIC ENERGY INC | a14-15242_1ex32d2.htm |
| EX-31.2 - EX-31.2 - CUBIC ENERGY INC | a14-15242_1ex31d2.htm |
| EX-23.3 - EX-23.3 - CUBIC ENERGY INC | a14-15242_1ex23d3.htm |
| EX-23.1 - EX-23.1 - CUBIC ENERGY INC | a14-15242_1ex23d1.htm |
| EX-99.1 - EX-99.1 - CUBIC ENERGY INC | a14-15242_1ex99d1.htm |
| EX-23.4 - EX-23.4 - CUBIC ENERGY INC | a14-15242_1ex23d4.htm |
| EX-32.1 - EX-32.1 - CUBIC ENERGY INC | a14-15242_1ex32d1.htm |
UNITED STATES
SECURITIES AND EXCHANGE COMMISSION
WASHINGTON, D.C. 20549
FORM 10-K
ANNUAL REPORT
PURSUANT TO SECTION 13 OR 15(d) OF THE SECURITIES EXCHANGE ACT OF 1934
FOR THE FISCAL YEAR ENDED JUNE 30, 2014
COMMISSION FILE NUMBER 001-34144
CUBIC ENERGY, INC.
(Exact Name of Registrant as Specified in its Charter)
|
TEXAS |
|
87-0352095 |
|
(State of Incorporation) |
|
(I.R.S. Employer Identification No.) |
9870 PLANO ROAD, DALLAS, TEXAS 75238
(Address of Principal Executive Offices)
972-686-0369
(Registrant’s Telephone Number)
Securities registered pursuant to Section 12(b) of the Act:
|
Title of Class |
|
Name of Exchange on Which Registered |
|
None |
|
Not Applicable |
Securities registered under Section 12(g) of the Act: Common Stock, $0.05 par value
Indicate by check mark if registrant is a well-known seasoned issuer, as defined in Rule 405 of the Securities Act. Yes o No x
Indicate by check mark if registrant is not required to file reports pursuant to Section 13 or Section 15(d) of the Act. Yes o No x
Indicate by check mark whether the registrant (1) has filed all reports required to be filed by Section 13 or 15(d) of the Securities Exchange Act of 1934 during the preceding 12 months (or for such shorter period that the registrant was required to file such reports), and (2) has been subject to such filing requirements for the past 90 days. Yes x No o
Indicate by check mark whether the registrant has submitted electronically and posted on its corporate Web site, if any, every Interactive Data File required to be submitted and posted pursuant to Rule 405 of Regulation S-T during the preceding 12 months (or for such shorter period that the registrant was required to submit and post such files). Yes x No o
Indicate by check mark if disclosure of delinquent filers pursuant to Item 405 of Regulation S-K is not contained herein, and will not be contained, to the best of registrant’s knowledge, in definitive proxy or information statements incorporated by reference in Part III of this Form 10-K or any amendment to this Form 10-K. o
Indicate by check mark whether the registrant is a large accelerated filer, an accelerated filer, a non-accelerated filer, or a smaller reporting company. See definitions of “large accelerated filer”, “accelerated filer” and “smaller reporting company” in Rule 12b-2 of the Exchange Act.
|
Large accelerated filer o |
Accelerated filer o |
|
Non-accelerated filer o |
Smaller reporting company x |
Indicate by check mark whether the registrant is a shell company (as defined in Rule 12b-2 of the Act). Yes o No x
State the aggregate market value of the common stock, par value $0.05 per share, held by non-affiliates computed by reference to the price at which the common stock was last sold, as of the last business day of the registrant’s most recently completed second fiscal quarter: As of December 31, 2013 the aggregate market value held by non-affiliates was $10,638,367.
Indicate the number of shares outstanding of each of the registrant’s classes of common stock, as of the latest practicable date: As of November 4, 2014, there were 77,505,908 shares of common stock outstanding.
DOCUMENTS INCORPORATED BY REFERENCE: None.
Special note regarding forward-looking statements
This annual report on Form 10-K contains forward-looking statements. All statements, other than statements of historical facts, are forward-looking statements. These forward-looking statements relate to, among other things, the following: our future financial and operating performance and results; our business strategy; market prices; and our plans and forecasts.
Forward-looking statements are identified by use of terms and phrases such as “may,” “expect,” “estimate,” “project,” “plan,” “believe,” “intend,” “achievable,” “anticipate,” “will,” “continue,” “potential,” “should,” “could” and similar words and phrases. Although we believe that the expectations reflected in these forward-looking statements are reasonable, they do involve certain assumptions, risks and uncertainties. Our actual results could differ materially from those anticipated in these forward-looking statements. You should consider carefully the statements in the “Risk Factors” section of this report and other sections of this report, which describe factors that could cause our actual results to differ from those set forth in the forward-looking statements, including, but not limited to, the following factors:
· our ability to generate sufficient cash flow from operations, borrowings or other sources to enable us to continue operations, service our debt and fully develop our undeveloped acreage positions;
· our ability to integrate our recently consummated acquisitions;
· the volatility in commodity prices for oil and natural gas;
· the possibility that the industry may be subject to future regulatory or legislative actions (including additional taxes);
· the presence or recoverability of estimated oil and natural gas reserves and the actual future production rates and associated costs;
· the ability to replace oil and natural gas reserves;
· lease or title issues or defects to our oil and gas properties;
· environmental risks;
· drilling and operating risks;
· exploration and development risks;
· competition, including competition for acreage in oil and natural gas producing areas;
· management’s ability to execute our plans to meet our goals;
· our ability to retain key members of senior management;
· our ability to obtain goods and services, such as drilling rigs and other oilfield equipment, and access to adequate gathering systems and pipeline take-away capacity, to execute our drilling program;
· general economic conditions, whether internationally, nationally or in the regional and local market areas in which we do business, may be less favorable than expected, including that the United States economic slow-down might continue to negatively affect the demand for natural gas, oil and natural gas liquids;
· continued hostilities in the Middle East and other sustained military campaigns or acts of terrorism or sabotage; and
· other economic, competitive, governmental, legislative, regulatory, geopolitical and technological factors that may negatively impact our business, operations or pricing.
All forward-looking statements are expressly qualified in their entirety by the cautionary statements in this paragraph and elsewhere in this document. Other than as required under the securities laws, we do not assume a duty to update these forward-looking statements, whether as a result of new information, subsequent events or circumstances, changes in expectations or otherwise.
CUBIC ENERGY, INC.
GENERAL
Cubic Energy, Inc. (referred to as “Cubic”, “we”, “our”, “us” or the “Company”) is the parent company of two wholly owned direct subsidiaries (Cubic Asset Holding, LLC, a Delaware limited liability company (“Cubic Asset Holding”), and Cubic Louisiana Holding, LLC, a Delaware limited liability company (“Cubic Louisiana Holding”)), and two wholly owned indirect subsidiaries (Cubic Asset LLC, a Delaware limited liability company and a direct subsidiary of Cubic Asset Holding (“Cubic Asset”), and Cubic Louisiana, LLC, a Delaware limited liability company and a direct subsidiary of Cubic Louisiana Holding (“Cubic Louisiana”)). Unless the context otherwise requires, references to the Company herein refer to the Company and its subsidiaries, on a consolidated basis.
The Company is an independent energy company engaged in the development and production of, and exploration for, crude oil, natural gas and natural gas liquids. Our oil and gas assets are concentrated in Texas and Louisiana. At June 30, 2014, our total proved reserves were 135,071,173 Mcfe.
RECENT DEVELOPMENTS
On July 14, 2014, we entered into an Amendment, Forbearance and Waiver Agreement (the “Amendment”) with the holders of the Notes due October 2016 (the “Notes”), which were issued pursuant to a Note Purchase Agreement dated October 2, 2013, (the “Note Purchase Agreement”), and certain other parties thereto. The Company initially issued as aggregate of $66,000,000 of the Notes. The Notes originally bore interest at the rate of 15.5% per annum, in cash, payable quarterly; provided, however, that interest for the first six months following the closing was paid 7.0% per annum in cash and 8.5% per annum in additional Notes.
Pursuant to the Amendment, the holders of the Notes waived various defaults specified in the Amendment, and the parties agreed to modify certain covenants in the Note Purchase Agreement. The holders of the Notes also waived their right to receive Default Interest and Registration Default Interest (as such terms are defined in the Note Purchase Agreement). In addition, the Amendment provides that after March 31, 2014, the interest rate applicable to the Notes is increased from 15.5% per annum to 20.5% per annum; provided that after such date interest shall not be payable in cash but shall accrue and compound on a quarterly basis.
The Amendment includes an additional covenant requiring the Company, among other things, by no later than October 17, 2014, to enter into a definitive agreement with respect to a Strategic Transaction (as defined below) that is reasonably expected to be consummated no later than December 31, 2014. A Strategic Transaction includes a transaction resulting in the complete repayment of the Notes, or another transaction acceptable to the holders of the Notes. We continue to explore alternatives with respect to a Strategic Transaction, although we did not enter into a definitive agreement by October 17, 2014. We are in discussions with the holders of the Notes with respect to available alternatives. Unless the requirement regarding a Strategic Transaction is waived, or we obtain an extension of time, the holders of the Notes could declare a default under the Note Purchase Agreement, accelerate the indebtedness represented by the Notes and exercise all other remedies available to them, including foreclosing on our assets.
The accompanying financial statements have been prepared assuming that the Company will continue as a going concern. As discussed in Note A to the financial statements, the Company has suffered recurring losses from operations and has a net working capital deficiency that raise substantial doubt about its ability to continue as a going concern. The financial statements do not include any adjustments that might result from the outcome of this uncertainty.
ASSETS
Legacy Louisiana Acreage
Our corporate strategy with respect to our asset acquisition and development efforts was to position the Company in low risk opportunities while building mainstream high yield reserves. The acquisition of our acreage in DeSoto and Caddo Parishes, Louisiana, puts us in reservoir rich environments in the Hosston, Cotton Valley and Bossier/Haynesville Shale formations, with additional shallow formations to exploit as well. We have had success on our acreage with wells completed in the Hosston, Cotton Valley and Bossier/Haynesville Shale formations. We also own interests in the rights-of-way, infrastructure and pipelines for our Caddo and DeSoto Parish, Louisiana acreage.
We share our Cotton Valley and Bossier/Haynesville formation acreage with Goodrich Petroleum Corporation (“Goodrich”), Chesapeake Energy Corporation (“Chesapeake”), BHP Billiton Limited (“BHP Billiton”), EP Energy E&P Company, L.L.P. (“EP Energy”), BG US Production Company, LLC (“BG”), EXCO Operating Company, LP (“EXCO”) and Indigo Minerals, LLC (“Indigo Minerals”), and all of these companies are third-party operators actively working on some of our shared acreage. Two new wells that came on line in the second half of fiscal 2014 helped boost production from our legacy Louisiana properties.
Legacy Texas Acreage
Prior to our acquisition of properties in Leon and Robertson Counties, Texas, described below, our Texas properties were situated in Eastland and Callahan Counties. These Texas properties consist primarily of wells acquired in several transactions between 1991 and 2002 and through overriding royalty interests reserved in farm-out agreements in 1998 and 1999. These wells produce limited amounts of natural gas and oil condensate.
Other Texas Acreage and Louisiana Working Interests
In October 2013, we acquired proven reserves, oil & natural gas production and undeveloped leasehold interests in Leon and Robertson Counties, Texas, that puts us in the additional reservoir rich environments in the Eagle Ford, Woodbine, Austin Chalk, Buda, Glen Rose and Georgetown formations, with additional shallow formations to exploit as well. We also acquired additional rights in our leasehold interests in DeSoto and Caddo Parishes, Louisiana. The acquisitions are summarized as follows:
· The Company consummated the transactions contemplated by the Purchase and Sale Agreement dated as of April 19, 2013 (the “Gastar Agreement”) with Gastar Exploration Texas, LP (“Gastar”) and Gastar Exploration USA, Inc. Pursuant to the Gastar Agreement, the Company acquired proven reserves, oil & natural gas production and undeveloped leasehold interests in Leon and Robertson Counties, Texas. The acquired properties include approximately 17,400 net acres of leasehold interests. The acquisition price paid by the Company at closing was $39,188,300, following various adjustments set forth in the Gastar Agreement, and net of the various deposits paid prior to the closing date. For purposes of allocating revenues and expenses and capital costs between Gastar and us, such amounts were netted effective January 1, 2013 and have been recorded as an adjustment to the purchase price.
· The Company also consummated the transactions contemplated by the Purchase and Sale Agreement dated as of September 27, 2013 (the “Navasota Agreement”) with Navasota Resources Ltd., LLP (“Navasota”). Pursuant to the Navasota Agreement, the Company acquired proven reserves, oil & natural gas production and undeveloped leasehold interests in Leon and Robertson Counties, Texas. The leasehold interests acquired consists of additional fractional interests in the properties acquired pursuant to the Gastar Agreement, comprising approximately 6,400 net acres. The acquisition price paid by the Company was $19,400,000, prior to certain post-closing adjustments.
· In addition, the Company entered into and consummated the transactions contemplated by a Purchase and Sale Agreement dated as of October 2, 2013 (the “Tauren Agreement”) with Tauren Exploration, Inc. (“Tauren”), an entity controlled by Calvin A. Wallen, III, our Chairman of the Board, President and Chief Executive Officer (“Mr. Wallen”). Pursuant to the Tauren Agreement, the Company acquired well bores, proven reserves, oil & natural gas production and undeveloped leasehold interests in the Cotton Valley formation in DeSoto and Caddo Parishes, Louisiana. The acquired leasehold interests consist of additional percentage interests in the same leaseholds as our legacy Louisiana properties. The acquisition price paid by the Company was $4,000,000 in cash and 2,000 shares of the Company’s Series B Convertible Preferred Stock with an aggregate stated value of $2,000,000 and a fair value of $368,000. The Tauren Agreement was unanimously approved by the Company’s board of directors, excluding Mr. Wallen.
We have seen success on our acquired Texas acreage and Louisiana acreage with two wells drilled by EXCO achieving production from the Haynesville shale formation in Louisiana during fiscal 2014.
The Texas legacy acreage, some of the Cotton Valley and Hosston formations in our legacy Louisiana acreage, and the Leon and Robertson Counties, Texas, acreage are operated by Fossil Operating, Inc. (“Fossil”), an entity controlled by Mr. Wallen.
HISTORY
Our predecessor was incorporated in October 1978. Cubic was incorporated in 1999 in the State of Texas. Our principal executive office is located at 9870 Plano Road, Dallas, Texas 75238, and our telephone number is (972) 686-0369.
On March 5, 2007, Cubic entered into a Credit Agreement with Wells Fargo Energy Capital, Inc. (“WFEC”) providing for a revolving credit facility of $20,000,000 and a convertible term loan of $5,000,000 (the “Credit Facility”). In connection with entering into the Credit Facility, the Company issued to WFEC warrants, with five-year expirations, for the purchase of up to 2,500,000 shares of Company Common Stock at an original exercise price of $1.00 per share. On December 18, 2009, the Company entered into a Second Amendment to Credit Agreement with WFEC, providing for a revolving credit facility of up to $40,000,000 subject to borrowing base limits and a convertible term loan of $5,000,000 (the “Amended Credit Agreement”). In connection with entering into the Amended Credit Agreement, the Company issued to WFEC additional warrants, expiring on December 1, 2014, for the purchase of up to 5,000,000 shares of Company Common Stock at an exercise price of $1.00 per share, and extended the expiration date of the warrants to purchase 2,500,000 shares of Company Common Stock that were previously issued to WFEC to December 1, 2017. In connection with the amendment, warrants held by WFEC, which are convertible into 8.5 million shares of the Company’s Common Stock, were modified to provide for an exercise price of $0.20 per share and a termination date of December 1, 2017.
On November 24, 2009, the Company entered into transactions with Tauren and Langtry Mineral & Development, LLC (“Langtry”), both of which are entities controlled by Mr. Wallen, under which the Company acquired $30,952,810 in pre-paid drilling credits (the “Drilling Credits”) applicable towards the development of its Haynesville Shale rights in Northwest Louisiana. As consideration for the Drilling Credits, the Company (a) conveyed to Tauren a net overriding royalty interest of approximately 2% in its leasehold rights below the Taylor Sand formation of the Cotton Valley and (b) issued to Langtry 10,350,000 Company common shares and Series A Convertible Preferred Stock in the amount of $10,350,000, which was convertible at any time prior to the fifth anniversary of issuance into Company common shares at $1.20 per common share. The preferred stock was entitled to cumulative dividends equal to 8% per annum, payable quarterly.
On December 18, 2009, the Company issued a subordinated promissory note payable to Mr. Wallen, in the principal amount of $2,000,000 (the “Wallen Note”). This note provided for interest at the prime rate plus one percent (1%). The proceeds of the Wallen Note were used to repay a previously outstanding promissory note.
As of June 30, 2012, the Company used the Drilling Credits to fund $21,435,551 of its share of the drilling and completion costs for those horizontal Haynesville Shale wells drilled in sections previously operated by Fossil which are now operated by third parties. As of June 30, 2012 a total of $9,517,258 of the Drilling Credits remained. The counterparties (EXCO and BG) on the Drilling Credits asserted certain offsets against their obligations under the Drilling Credits. On September 12, 2012, we received a final judgment with respect to an arbitration award of approximately $12,800,000 from EXCO and BG.
On October 2, 2012, the Company entered into a Settlement Agreement and Mutual Release with Tauren, EXCO and BG. This agreement provides that EXCO and BG shall (a) apply the Drilling Credits as provided in the agreement and place the Company in consent status on specified wells in which the Company gets paid for production and (b) pay to the Company $12,179,853 in cash. The agreement also provides for mutual releases among the parties. Pursuant to the Fourth Amendment to Credit Agreement between the Company and WFEC, $9,134,890 of such amount was paid to WFEC when received from EXCO and BG in order to reduce the borrowings under the Company’s revolving credit facility with the balance of the cash received by the Company.
On October 2, 2013, the Company entered into the Note Purchase Agreement, pursuant to which the Company issued an aggregate of $66,000,000 of Notes to certain purchasers. The Notes originally bore interest at the rate of 15.5% per annum, in cash, payable quarterly; provided, however, that interest for the first six months following the closing was paid 7.0% per annum in cash and 8.5% per annum in additional Notes. As described under “Recent Developments”, certain terms of the Note Purchase Agreement, including the interest rate, were modified as of March 31, 2014. The indebtedness under the Note Purchase Agreement is secured by substantially all of the assets of the Company, including a first priority lien over all of the assets of the Company, Cubic Asset and Cubic Asset Holding and a second priority lien over all of the assets of Cubic Louisiana and Cubic Louisiana Holding.
On October 2, 2013, the Company, through its subsidiary Cubic Asset, entered into a Call Option Structured Derivative arrangement with a third party that resulted in the receipt of an upfront payment at closing of approximately $35,000,000, through the sale of calls, which upfront payment approximated fair value of the calls sold at inception. As a result, the Call Option Structured Derivative arrangement was initially recognized and measured at the amount of its upfront payment. Under the terms of the Call Option Structured Derivative arrangement, Cubic Asset sold calls to the third party covering (i) approximately 556,000 barrels of oil at a strike price set between $80 per barrel and $90 per barrel, and (ii) approximately 51.3 million MMBtu’s of gas at a strike price set between $3.45 per MMBtu and $3.90 per MMBtu. The scheduled volumes subject to the calls sold relate to production months from November 2013 through December 2018. The Company is subject to the price risks associated with product price changes that are in excess of the specified call prices.
On October 2, 2013, the Company, through its subsidiary Cubic Asset, entered into a Fixed Price Swap arrangement. Under the terms of the Fixed Price Swap arrangement, Cubic Asset will receive a fixed amount on approximately 18,000 barrels of oil at a price of $92 per barrel. The scheduled volumes subject to the swaps relate to production months from November 2013 through October 2016. Cubic Asset is subject to the price risks associated with product price increases above the specified fixed prices. The counterparties to this arrangement have a junior lien position on both of the assets of Cubic Asset and Cubic Louisiana.
In connection with the issuance and sale of the Notes under the Note Purchase Agreement, the Company issued certain warrants and shares of Series C Redeemable Voting Preferred Stock, par value $0.01 per share (the “Series C Redeemable Voting Preferred Stock”), to certain purchasers of the Notes and their affiliates (the “Investors”). The Company issued warrants exercisable for (a) an aggregate of 65,834,549 shares of Common Stock, at an exercise price of $0.01 per share (the “Class A Warrants”), and (b) an aggregate of 32,917,275 shares of Common Stock, at an exercise price of $0.50 per share (the “Class B Warrants” and together with the Class A Warrants, the “Warrants”).
The Company also issued an aggregate of 98,751.824 shares of Series C Redeemable Voting Preferred Stock to the Investors. The holders of the Series C Redeemable Voting Preferred Stock are entitled to vote, together with holders of Common Stock, as a single class with respect to all matters presented to holders of Common Stock of the Company. The holders of Series C Redeemable Voting Preferred Stock are entitled, in the aggregate, to a number of votes equal to the number of shares of Common Stock that would be issuable upon the exercise of all outstanding Warrants on a Full Physical Settlement basis (as defined in the Warrant and Preferred Stock Agreement). The holders of Series C Redeemable Voting Preferred Stock are not entitled to receive any dividends from the Company. Shares of the Series C Redeemable Voting Preferred Stock have a stated value of $0.01 per share and may be redeemed at the option of the holders thereof at any time.
In connection with entering into the Note Purchase Agreement and the Warrant and Preferred Stock Agreement, the Company entered into an Investment Agreement, dated as of October 2, 2013, with the Investors, pursuant to which the Investors have the right to designate three members (subject to adjustment for changes in board size) for election or appointment to the Company’s board of directors and certain information rights, veto rights, pre-emptive rights and sale rights, among others.
The Investors and Mr. Wallen also entered into a Voting Agreement, dated as of October 2, 2013 (the “Voting Agreement”), pursuant to which Mr. Wallen has agreed to vote shares of voting securities of the Company beneficially owned by him in favor of the Investors’ designees to the board of directors of the Company and with the Investors in connection with certain other matters. Mr. Wallen has also agreed not to transfer shares of voting securities of the Company beneficially owned by him unless certain conditions specified in the Voting Agreement are satisfied.
In connection with entering into the Note Purchase Agreement and the Warrant and Preferred Stock Agreement, the Company entered into a Registration Rights Agreement, dated as of October 2, 2013, with the Investors, providing for, among other things, the registration of shares of Common Stock issuable upon exercise of the Warrants with the Securities and Exchange Commission.
The Company entered into and consummated the transactions contemplated by a Conversion and Preferred Stock Purchase Agreement dated October 2, 2013 (the “Conversion Agreement”) with Mr. Wallen and Langtry. Pursuant to the terms of the Conversion Agreement, (a) Langtry was issued 12,047 shares of Series B Convertible Preferred Stock, with an aggregate stated value of $12,047,000, in exchange for the cancellation of all of the issued and outstanding shares of Series A Convertible Preferred Stock held by Langtry and (b) Mr. Wallen was issued 2,115 shares of Series B Convertible Preferred Stock, with an aggregate stated value of $2,115,000, in exchange for the cancellation of a promissory note payable to Mr. Wallen in the principal amount of $2,000,000, plus $114,986 of accrued and unpaid interest.
The Series B Convertible Preferred Stock is entitled to dividends at a rate of 9.5% per annum and, subject to certain limitations, is convertible into Common Stock at an initial conversion price of $0.50 per share of Common Stock. The holders of the Series B Convertible Preferred Stock are entitled to vote (on an as-converted basis), together with holders of Common Stock, as a single class with respect to all matters presented to holders of Common Stock.
Cubic Louisiana and WFEC entered into an Amended and Restated Credit Agreement dated October 2, 2013 (the “Credit Agreement”). In conjunction with entering into the Credit Agreement, the Company assigned all of its previously held oil and gas interests that it held in Northwest Louisiana to Cubic Louisiana. Pursuant to the terms of the Credit Agreement, the Company repaid the $5 million term loan payable to WFEC, and Cubic Louisiana assumed the remaining unpaid debt to WFEC, which amount was $20,865,110 as of that date. That debt is reflected in a term loan bearing interest at the Wells Fargo Bank prime rate, plus 2%, per annum. In the event that Cubic Louisiana does not have available cash to pay interest on the Credit Facility, accrued and unpaid interest may be paid in kind via additional promissory notes. Accrued and unpaid interest as of June 30, 2014 was paid in kind. As part of the Credit Agreement, WFEC is providing a revolving credit facility in the amount of up to $10,000,000, bearing interest at the same rate, with all advances under that revolving credit facility to be made in the sole discretion of WFEC. The indebtedness to WFEC
pursuant to the Credit Agreement is secured by a first priority lien over all of the assets of Cubic Louisiana and Cubic Louisiana Holdings. The other oil and gas properties of Cubic and its other subsidiaries, including the assets acquired from Gastar, Navasota and Tauren, as described above, do not secure the indebtedness under the Credit Agreement. During fiscal 2014, Cubic Louisiana borrowed $4,015,826 against the WFEC revolving credit facility to finance participation in two new horizontal Haynesville wells drilled and completed by EXCO in our legacy Louisiana acreage. These borrowings leave a balance of $5,894,174 available to the Company under its revolving credit facility, subject to the approval of WFEC, and total debt outstanding of $24,880,936 with WFEC.
STRATEGY
As of June 30, 2014, our strategy with respect to our domestic exploration program seeks to maintain a balanced portfolio of drilling opportunities that range from lower risk, field extension wells to the smaller scale pursuit of Company appropriate higher risk, high reserve potential prospects.
Our East Texas assets are at the core of our current strategy, which we believe provide lower risk development opportunities and high yield opportunities. The Company is exploring acquiring additional properties with this same development profile.
Additionally, our focus is on exploration opportunities that can benefit from advanced technologies, including 3-D seismic, designed to reduce risks and increase success rates. We develop prospects in-house with an affiliate and through strategic alliances with exploration companies that have expertise in specific target areas. In addition, we evaluate externally generated prospects and look to participate in certain of these opportunities to enhance our portfolio.
We are currently focusing our domestic exploration activities to develop and re-enter existing well bores, and re-complete existing well bores with respect to our recently acquired East Texas Basin assets; as well as developing our recently augmented leasehold interests in Louisiana. East Texas Basin prospects have been developed from the top of the Cretaceous formation all the way to the bottom of the Deep Bossier Shale. The various Cretaceous zones all have strong oil and liquids component that we believe will help the Company achieve its transition away from dry natural gas. The high production of dry natural gas from the various Bossier sands have the opportunity to provide the Company an increase in short term cash flow, with reasonable out-of-pocket expenditures, even at current commodity prices, through the re-recompletion and work over of existing wells. Prospects in our Louisiana leaseholds are focused on the Cotton Valley and the Haynesville Shale, but also include the Hosston; Gloyd; Pettet; Glen Rose and Paluxy.
The Company’s future results of operations and growth are substantially dependent upon (i) its ability to acquire or find new oil and gas properties, or successfully develop existing oil and gas properties, (ii) the prevailing prices for oil and gas, and (iii) our ability to refinance the Notes and remain a going concern. Numerous locations have been identified by third-party operators for additional drilling. If we are unable to economically complete additional producing wells, the Company’s oil and gas production, and its revenues, would likely decline rapidly as its reserves are depleted. In addition, oil and gas prices are dependent upon numerous factors beyond the Company’s control, such as economic, political, governmental, environmental and regulatory developments, as well as competition from other sources of energy. The oil and gas markets have historically been very volatile, and any further significant or extended decline in the price of gas would have a material adverse effect on the Company’s financial condition and results of operations, and could result in a further reduction in the carrying value of the Company’s proved reserves and adversely affect its access to capital.
PRINCIPAL OIL AND GAS PROPERTIES
The following table summarizes certain information with respect to our principal areas of operation at June 30, 2014:
|
|
|
|
|
Natural Gas |
|
|
|
Total Gas |
|
|
|
After |
| ||
|
|
|
Oil |
|
Liquids |
|
Natural Gas |
|
Equivalent |
|
Estimated Future |
|
10% |
| ||
|
Category |
|
(Bbls) |
|
(Bbls) |
|
(Mcf) |
|
(Mcfe) (a) |
|
Net Cash Flows |
|
Discount |
| ||
|
|
|
|
|
|
|
|
|
|
|
|
|
|
| ||
|
Proved Producing |
|
|
|
|
|
|
|
|
|
|
|
|
| ||
|
Louisiana |
|
1,592 |
|
9,117 |
|
5,484,637 |
|
5,548,891 |
|
$ |
13,929,700 |
|
$ |
9,889,700 |
|
|
Texas |
|
51,491 |
|
0 |
|
33,307,899 |
|
33,616,845 |
|
90,894,378 |
|
54,202,350 |
| ||
|
Total Proved Producing |
|
53,083 |
|
9,117 |
|
38,792,536 |
|
39,165,736 |
|
104,824,078 |
|
64,092,050 |
| ||
|
Proved Non-Producing |
|
|
|
|
|
|
|
|
|
|
|
|
| ||
|
Louisiana |
|
— |
|
— |
|
— |
|
— |
|
— |
|
— |
| ||
|
Texas |
|
1,678 |
|
— |
|
51,549,622 |
|
51,559,690 |
|
147,595,900 |
|
71,891,200 |
| ||
|
Total Proved Non-Producing |
|
1,678 |
|
— |
|
51,549,622 |
|
51,559,690 |
|
147,595,900 |
|
71,891,200 |
| ||
|
Proved Developed Reserves |
|
|
|
|
|
|
|
|
|
|
|
|
| ||
|
Louisiana |
|
1,592 |
|
9,117 |
|
5,484,637 |
|
5,548,891 |
|
13,929,700 |
|
9,889,700 |
| ||
|
Texas |
|
53,169 |
|
— |
|
84,857,521 |
|
85,176,535 |
|
238,490,278 |
|
126,093,550 |
| ||
|
Total Proved Developed |
|
54,761 |
|
9,117 |
|
90,342,158 |
|
90,725,426 |
|
$ |
252,419,978 |
|
$ |
135,983,250 |
|
|
Proved Undeveloped |
|
|
|
|
|
|
|
|
|
|
|
|
| ||
|
Louisiana |
|
466,926 |
|
893,884 |
|
32,535,438 |
|
40,700,298 |
|
30,925,300 |
|
318,300 |
| ||
|
Texas |
|
— |
|
— |
|
3,645,449 |
|
3,645,449 |
|
2,390,600 |
|
291,300 |
| ||
|
Total Proved Undeveloped |
|
466,926 |
|
893,884 |
|
36,180,887 |
|
44,345,747 |
|
$ |
33,315,900 |
|
$ |
609,600 |
|
|
|
|
|
|
|
|
|
|
|
|
|
|
|
| ||
|
Total Proved Reserves |
|
|
|
|
|
|
|
|
|
|
|
|
| ||
|
Louisiana |
|
468,518 |
|
903,001 |
|
38,020,075 |
|
46,249,189 |
|
$ |
44,855,000 |
|
$ |
10,208,000 |
|
|
Texas |
|
53,169 |
|
— |
|
88,502,970 |
|
88,821,984 |
|
240,880,878 |
|
126,384,850 |
| ||
|
Total Proved Reserves |
|
521,687 |
|
903,001 |
|
126,523,045 |
|
135,071,173 |
|
$ |
285,735,878 |
|
$ |
136,592,850 |
|
(a) Mcfe is defined as 6 Bbls of oil to 1 Mcf of natural gas.
As of June 30, 2014, our West Texas properties are situated in Eastland and Callahan Counties and represented an immaterial amount of reserves and are excluded from our SEC reserve report. Our East Texas properties are situated in Leon and Robertson Counties and contained approximately 66% of our total proved reserves, while our Louisiana properties that are situated in Caddo Parish and in DeSoto Parish contained approximately 34% of our total proved reserves. The West Texas properties owned as of June 30, 2014, consisted primarily of wells acquired by the Company in several transactions between 1991 and 2002 and through overriding royalty interests reserved in farm-out agreements in 1998 and 1999. The East Texas properties were acquired in October 2013. The vast majority of the legacy Louisiana acreage was acquired on or about October 1, 2004, January 11, 2005 and February 6, 2006.
Our net production for the fiscal year ended June 30, 2014 for all of the Company’s wells averaged approximately 11,080 Mcf of natural gas per day, 28 barrels of oil per day and 7 barrels of natural gas liquids per day as compared to approximately 3,127 Mcf of natural gas per day, 2 barrels of oil per day and 7 barrels of natural gas liquids per day in the fiscal year ended June 30, 2013.
GAS GATHERING
Cubic has developed its infrastructure in Johnson Branch with approximately 16 miles of gathering lines and pipeline constructed for its currently producing wells and any further completions. In addition, a Johnson Branch tap, common point and compression facility were completed in November 2007 and are currently operational. The Company has also developed its infrastructure with approximately 7.8 miles of gathering lines and owns three taps in its Bethany Longstreet acreage.
In addition, for our East Texas properties, we have a midstream contract with Hilltop Resort GS, LLC that runs through October 31, 2024. This contract with Hilltop Resort GS, LLC has a penalty provision expiring on October 31, 2014, if, for the previous quarter, an average of 50,000 Mcf/day is not sent through the pipelines. Since the acquisitions on October 2, 2013, the Company has had to pay a quarterly penalty due to insufficient production. As of June 30, 2014, the Company accrued an obligation of $976,494 related to this contract.
MARKETING OF PRODUCTION
Crude Oil and Natural Gas
During fiscal 2014, our production consisted mainly of natural gas. During fiscal 2014, we marketed our production of natural gas that was produced from wells operated by our affiliate, Fossil Operating (“Fossil”), an entity controlled by Mr. Wallen, to four purchasers: (i) in Texas, BP Energy Company (“BP Energy”), Peninsula Pipelines (“Peninsula”) and Regency Energy Partners (“Regency”), and (ii) in Louisiana, Atmos Energy Marketing, LLC (“Atmos Energy”). We sell our affiliate-operated crude oil and natural gas liquids (“NGL”) production at or near the well-site; although in some cases it is gathered by us or others and delivered to a central point of sale. Our crude oil and condensate production is transported by truck or by pipeline and is marketed by BP Products North America (“BP Products”), Transoil Marketing, Inc. (“Transoil”), Eastex Crude Company (“Eastex”), and Martin Gas Sales (“Martin”). During fiscal 2014, all of our production was operated by Fossil and six third-party operators: BG, Chesapeake, EXCO, EP Energy, Goodrich and Indigo Minerals. Pursuant to the terms of our operating agreements, these third-party operators have the right to market our production from wells operated by them. Purchases by BP Energy through Fossil totaled 81% of our total revenues for fiscal 2014. A significant portion of our production and our revenue is now generated by wells drilled and operated by non-affiliated third-party operators.
With respect to our production from Louisiana, we did not have any gas marketing agreements, commitments or contracts; we sell our crude oil, NGL and natural gas at the prevailing market prices.
As for our East Texas production, our hedging agreements with BP dictate that BP purchases all of our oil and natural gas through the calendar year 2016 for oil and through the calendar year 2018 for natural gas. We receive from BP a fixed price for the respective commodity up to certain volumes pursuant to the derivative contracts. We then receive a floating market price for volumes in excess of such amounts bound by the derivative contracts.
We believe we would be able to locate alternate purchasers in the event of the loss of any of these purchasers, and that any such loss would not have a material adverse effect on our financial condition or results of operations. Revenue totaled $15,849,482 for fiscal 2014 primarily from the sale of natural gas. Natural gas totaled $14,750,152 and represented 93%, oil totaled $977,880 and represented 6% and NGLs totaled $121,550 and represented 1% of our total oil and gas revenues, respectively for fiscal 2014.
Price Considerations
Natural gas and NGL prices in the geographical areas in which we operate are closely tied to established price indices which are heavily influenced by national and regional supply and demand factors and the futures price per MMbtu for natural gas delivered at Henry Hub, Louisiana established on the NYMEX (“NYMEX-Henry Hub”). At times, these indices correlate closely with the NYMEX-Henry Hub price, but often there are significant variances between the NYMEX-Henry Hub price and the indices used to price our
natural gas. Except with respect to fixed pricing established pursuant to our derivative contracts, average natural gas prices received by us in each of our operating areas generally fluctuate with changes in these established indices. The average natural gas price per Mcf received by us in fiscal 2014 was $3.65 as compared to $3.21 in fiscal 2013. The average NGL price per barrel received by us in fiscal 2014 was $45.78 compared to $41.16 in fiscal 2013. Crude oil prices are established in a highly liquid, international market, with average crude oil prices that we receive generally fluctuating with changes in the futures price established on the NYMEX for West Texas Intermediate Crude Oil (“NYMEX-WTI”). The average crude oil price per barrel received by us in fiscal 2014 was $95.58 as compared to $90.00 in fiscal 2013.
OIL AND GAS RESERVES
The following tables set forth our proved developed and proved undeveloped reserves at June 30, 2014, the estimated future net cash flows from such proved reserves and the Standardized Measure of Discounted Future Net Cash Flows attributable to our proved reserves at June 30, 2014, 2013 and 2012:
|
|
|
At June 30, |
| |||||||
|
|
|
2014 |
|
2013 |
|
2012 |
| |||
|
Proved Developed Reserves: |
|
|
|
|
|
|
| |||
|
Oil (Bbls) |
|
54,761 |
|
1,835 |
|
443 |
| |||
|
Natural Gas Liquids (Bbls) |
|
9,117 |
|
11,205 |
|
35 |
| |||
|
Gas (Mcf) |
|
90,342,158 |
|
4,899,388 |
|
3,982,265 |
| |||
|
Mcfe |
|
90,725,426 |
|
4,977,628 |
|
3,985,203 |
| |||
|
Estimated future net cash flows (before income tax) |
|
$ |
252,419,978 |
|
$ |
8,852,800 |
|
$ |
6,827,246 |
|
|
Standardized Measure of Discounted Future Net Cash Flows (1) |
|
$ |
135,983,250 |
|
$ |
6,075,300 |
|
$ |
5,504,209 |
|
|
|
|
|
|
|
|
|
| |||
|
Proved Undeveloped Reserves: |
|
|
|
|
|
|
| |||
|
Oil (Bbls) |
|
466,926 |
|
393,673 |
|
427,190 |
| |||
|
Natural Gas Liquids (Bbls) |
|
893,884 |
|
1,624,269 |
|
1,313,531 |
| |||
|
Gas (Mcf) |
|
36,180,887 |
|
28,092,172 |
|
19,357,720 |
| |||
|
Mcfe |
|
44,345,747 |
|
40,199,824 |
|
29,802,000 |
| |||
|
Estimated future net cash flows (before income tax) |
|
$ |
33,315,900 |
|
$ |
79,982,200 |
|
$ |
62,895,890 |
|
|
Standardized Measure of Discounted Future Net Cash Flows (1) |
|
$ |
609,600 |
|
$ |
32,972,500 |
|
$ |
24,472,000 |
|
|
|
|
|
|
|
|
|
| |||
|
Total Proved Reserves: |
|
|
|
|
|
|
| |||
|
Oil (Bbls) |
|
521,687 |
|
395,508 |
|
427,633 |
| |||
|
Natural Gas Liquids (Bbls) |
|
903,001 |
|
1,635,474 |
|
1,313,566 |
| |||
|
Gas (Mcf) |
|
126,523,045 |
|
32,991,560 |
|
23,339,985 |
| |||
|
Mcfe |
|
135,071,173 |
|
45,177,452 |
|
33,787,203 |
| |||
|
Estimated future net cash flows (before income tax) |
|
$ |
285,735,878 |
|
$ |
88,835,000 |
|
$ |
69,723,136 |
|
|
Standardized Measure of Discounted Future Net Cash Flows (1) |
|
$ |
136,592,850 |
|
$ |
39,047,800 |
|
$ |
29,976,209 |
|
|
|
|
|
|
|
|
|
| |||
|
Average price used to calculate reserves: |
|
|
|
|
|
|
| |||
|
Oil (Bbl) |
|
$ |
97.51 |
|
$ |
85.13 |
|
$ |
96.59 |
|
|
Natural Gas Liquids (Bbls) |
|
$ |
47.66 |
|
$ |
54.99 |
|
$ |
47.46 |
|
|
Gas (Mcf) |
|
$ |
4.01 |
|
$ |
3.62 |
|
$ |
3.25 |
|
(1) The Standardized Measure of Discounted Future Net Cash Flows prepared by the Company represents the present value (using an annual discount rate of 10%) of estimated future net cash flows from the production of proved reserves, without giving effect to the future income tax expense. In accordance with guidelines of the SEC, prices used in this report are based on the 12-month unweighted arithmetic average of the first-day-of-the-month price for each month in the fiscal year. See “Note M - Oil and gas reserves information (unaudited)” in the Notes to the Financial Statements of the Company included elsewhere in this Report for additional information regarding the disclosure of the Standardized Measure information in accordance with the provisions of Financial Accounting Standards Board (“FASB”) Accounting Standards Codification (“ASC”) 932, Extractive Activities — Oil and Gas.
As of June 30, 2014, we had a net increase in proved undeveloped reserves of 4,145,923 Mcfe. This net increase includes (i) an increase of 4,706,416 Mcfe due to an “Extensions & Discoveries” gained through overall field development and activity and longer range Company planning, plus (ii) an increase of 24,280,352 Mcfe gained through the acquisition of the Tauren Louisiana Cotton Valley acreage and the existing East Texas proved undeveloped locations acquired from Gastar and Navasota partially offset by (iii) a downward “Revision of Previous Estimates” of 21,911,480 Mcfe due to wells not being drilled and dropping off of our drilling schedule and (iv) a downward revision of 2,929,365 Mcfe in estimated production from continuing proved undeveloped locations.
None of our reserves were converted from proved undeveloped reserves to proved developed reserves during the fiscal year ended June 30, 2014. EXCO drilled and completed two new Haynesville Shale wells in fiscal 2014; however, neither of these drilling locations were proved undeveloped locations at June 30, 2013. The Company did not have any Haynesville Shale proved undeveloped locations at June 30, 2013. These two EXCO wells are now proved producing reserves.
In compliance with Rule 4-10(a)(31)(ii) of Regulation S-X, the Company’s development plan for all reserves listed as proved undeveloped reserves includes only planned development and drilling within sixty months of initial disclosure of such reserves. All of these wells are expected to be operated by an affiliate of the Company.
The information set forth in this Annual Report relating to our proved reserves, estimated future net cash flows and present values is taken from reports prepared by Netherland, Sewell & Associates, Inc. (“NSAI”) for the fiscal years 2014 and 2013. The report for fiscal 2012 was prepared by NPC Engineering Group, Inc. (“NPC-ENG”), an independent petroleum engineering firm. The reservoir engineers at NSAI and NPC-ENG who oversaw the preparation of the reserve estimates for NSAI and NPC-ENG had Master’s of Science Degrees and are licensed as Professional Engineers in the State of Texas. The estimates of the independent petroleum engineering firms were based upon review of production histories and other geological, economic, ownership and engineering data provided by the Company. Information with respect to our reserves in legacy Texas properties as of June 30, 2014, 2013 and 2012 was prepared in-house, was not reviewed by an independent engineering firm, and due to the immaterial size was not reported in our reserve report for the periods ended June 30, 2014, 2013 and 2012. Our internal geologist has a Master’s of Science Degree in Geology, is an American Association of Petroleum Geologists’ Certified Petroleum Geologist and has twenty-nine years of experience in the upstream oil and gas industry. In accordance with guidelines of the SEC, prices used in this report are based on the 12-month unweighted arithmetic average of the first-day-of-the-month price for each month in the fiscal year. For oil volumes, the average West Texas Intermediate posted price of $96.75 per barrel is adjusted by field for quality, transportation fees, and a regional price differential. For gas volumes, the average Henry Hub spot price of $4.10 per MMbtu is adjusted by field for energy content, transportation fees, and a regional price differential. All prices are held constant throughout the lives of the properties. For the proved reserves, the average adjusted product prices for fiscal 2014 weighted by production over the remaining lives of the properties are $97.51 per barrel of oil, $47.66 per barrel of NGL, and $4.01 per Mcf of gas, but such costs do not include debt service or general and administrative expenses.
There are numerous uncertainties inherent in estimating oil and gas reserves and their values, including many factors beyond our control. The reserve data set forth in this Annual Report represents estimates only. Reservoir engineering is a subjective process of estimating the sizes of underground accumulations of oil and gas that cannot be measured in an exact manner. The accuracy of any reserve estimate is a function of the quality of available data, engineering and geological interpretation, and judgment. As a result, estimates of different engineers, including those used by us, may vary. In addition, estimates of reserves are subject to revision based upon actual production, results of future development, exploitation and exploration activities, prevailing oil and gas prices, operating costs and other factors, which revisions may be material. Accordingly, reserve estimates are often different from the quantities of oil and gas that are ultimately recovered and are highly dependent upon the accuracy of the assumptions upon which they are based. There can be no assurance that these estimates are accurate predictions of our oil and gas reserves or their values. Estimates with respect to proved reserves that may be developed and produced in the future are often based upon volumetric calculations and upon analogy to similar types of reserves rather than actual production history. Estimates based on these methods are generally less reliable than those based on actual production
history. Subsequent evaluation of the same reserves based upon production history will result in variations, which may be substantial, in the estimated reserves.
All reports were in accordance with generally accepted petroleum engineering and evaluation principles and definitions and guidelines established by the SEC. The technical persons responsible for preparing the reserve estimates presented herein meet the requirements regarding qualifications, independence, objectivity and confidentiality set forth in the Standards Pertaining to the Estimating and Auditing of Oil and Gas Reserves Information promulgated by the Society of Petroleum Engineers.
Our policies and practices regarding internal control over the estimating of reserves are structured to objectively and accurately estimate our oil and natural gas reserves quantities and present values in compliance with the SEC’s regulations and U.S. Generally Accepted Accounting Principles. We maintain an internal staff of petroleum engineers and geosciences professionals who work closely with our independent petroleum consultant to ensure the integrity, accuracy and timeliness of data furnished to our independent petroleum consultant in its reserves estimation process. Inputs to our reserves estimation process are based on historical results for production history, oil and natural gas prices, lease operating expenses, development costs, ownership interest and other required data. Our technical team meets regularly with representatives of our independent petroleum consultants to review properties and discuss methods and assumptions used in our independent petroleum consultant’s preparation of the year-end reserves estimates. While we have no formal committee specifically designated to review reserves reporting and the reserves estimation process, our senior management reviews and approves our independent petroleum engineer’s reserve report and any internally estimated significant changes to our proved reserves on a timely basis.
Costs Incurred
The following table shows certain information regarding the costs incurred by us in our property acquisition, development and exploratory activities during the periods indicated.
|
|
|
Year Ended June 30, |
| |||||||
|
|
|
2014 |
|
2013 |
|
2012 |
| |||
|
Property acquisition costs |
|
|
|
|
|
|
| |||
|
Louisiana |
|
$ |
26,946,000 |
|
$ |
178,685 |
|
$ |
109,076 |
|
|
Texas |
|
62,578,148 |
|
— |
|
— |
| |||
|
Exploratory costs |
|
|
|
|
|
|
| |||
|
Louisiana |
|
— |
|
— |
|
— |
| |||
|
Texas |
|
— |
|
— |
|
— |
| |||
|
Development costs |
|
|
|
|
|
|
| |||
|
Louisiana |
|
6,537,062 |
|
(290,569 |
) |
8,224,013 |
| |||
|
Texas |
|
2,860,692 |
|
— |
|
— |
| |||
|
Total by State |
|
|
|
|
|
|
| |||
|
Louisiana |
|
33,483,062 |
|
(111,884 |
) |
8,333,089 |
| |||
|
Texas |
|
65,438,840 |
|
— |
|
— |
| |||
|
Total |
|
$ |
98,921,902 |
|
$ |
(111,884 |
) |
$ |
8,333,089 |
|
The Company received several credits from EXCO during fiscal 2013 thus creating negative total costs incurred for the year ended June 30, 2013.
FISCAL 2014 DRILLING
During fiscal 2014, EXCO drilled and completed two wells, both of which are in the Haynesville Shale formation, in which the Company has interests.
We drilled or participated in the drilling of wells as set out in the table below for the periods indicated. The table was completed based upon the date drilling was completed. Other than the East Texas properties in Leon and Robertson Counties (the “Hilltop”), we did not acquire any wells during these periods. You should not consider the results of prior drilling activities as necessarily indicative of future performance, nor should you assume that there is necessarily any correlation between the number of productive wells drilled and the oil and natural gas reserves generated by those wells.
|
|
|
Year Ended June 30, |
| ||||||||||
|
|
|
2014 |
|
2013 |
|
2012 |
| ||||||
|
|
|
Gross |
|
Net |
|
Gross |
|
Net |
|
Gross |
|
Net |
|
|
Development wells: |
|
|
|
|
|
|
|
|
|
|
|
|
|
|
Louisiana |
|
2 |
|
0.25 |
|
3 |
|
0.04 |
|
1 |
|
— |
|
|
Texas |
|
— |
|
— |
|
— |
|
— |
|
|
|
|
|
|
Productive |
|
2 |
|
0.25 |
|
3 |
|
0.04 |
|
1 |
|
— |
|
|
Louisiana |
|
— |
|
— |
|
— |
|
— |
|
— |
|
— |
|
|
Texas |
|
— |
|
— |
|
— |
|
— |
|
— |
|
— |
|
|
Dry |
|
— |
|
— |
|
— |
|
— |
|
— |
|
— |
|
|
Total development |
|
2 |
|
0.25 |
|
3 |
|
0.04 |
|
1 |
|
— |
|
|
Exploratory wells: |
|
|
|
|
|
|
|
|
|
|
|
|
|
|
Louisiana |
|
— |
|
— |
|
— |
|
— |
|
— |
|
— |
|
|
Texas |
|
— |
|
— |
|
— |
|
— |
|
|
|
|
|
|
Productive |
|
— |
|
— |
|
— |
|
— |
|
— |
|
— |
|
|
Louisiana |
|
— |
|
— |
|
— |
|
— |
|
— |
|
— |
|
|
Texas |
|
— |
|
— |
|
— |
|
— |
|
— |
|
— |
|
|
Dry |
|
— |
|
— |
|
— |
|
— |
|
— |
|
— |
|
|
Total exploratory |
|
— |
|
— |
|
— |
|
— |
|
— |
|
— |
|
|
Total wells: |
|
|
|
|
|
|
|
|
|
|
|
|
|
|
Louisiana |
|
2 |
|
0.25 |
|
3 |
|
0.04 |
|
1 |
|
— |
|
|
Texas |
|
— |
|
— |
|
— |
|
— |
|
|
|
|
|
|
Productive |
|
2 |
|
0.25 |
|
3 |
|
0.04 |
|
1 |
|
— |
|
|
Louisiana |
|
— |
|
— |
|
— |
|
— |
|
— |
|
— |
|
|
Texas |
|
— |
|
— |
|
— |
|
— |
|
— |
|
— |
|
|
Dry |
|
— |
|
0 |
|
— |
|
— |
|
— |
|
— |
|
|
Total wells |
|
2 |
|
0.25 |
|
3 |
|
0.04 |
|
1 |
|
— |
|
NET PRODUCTION, SALES PRICES AND COSTS
The following table presents certain information with respect to production, prices and costs attributable to all oil and gas property interests owned by us for the fiscal years ended June 30, 2014, 2013 and 2012:
|
|
|
Year Ended June 30, |
| |||||||
|
|
|
2014 |
|
2013 |
|
2012 |
| |||
|
Production Volumes: |
|
|
|
|
|
|
| |||
|
Oil (Bbl) |
|
10,231 |
|
863 |
|
1,100 |
| |||
|
Natural gas liquids (Bbls) |
|
2,658 |
|
2,525 |
|
1,277 |
| |||
|
Natural gas (Mcf) |
|
4,044,085 |
|
1,141,474 |
|
2,244,315 |
| |||
|
Total oil, natural gas liquids, and natural gas (Mcfe) |
|
4,121,417 |
|
1,161,802 |
|
2,258,577 |
| |||
|
|
|
|
|
|
|
|
| |||
|
Weighted Average Sales Prices: |
|
|
|
|
|
|
| |||
|
Oil (per Bbl) |
|
$ |
95.58 |
|
$ |
90.00 |
|
$ |
93.25 |
|
|
Natural gas liquids (per Bbl) |
|
$ |
45.78 |
|
$ |
41.16 |
|
$ |
66.78 |
|
|
Natural gas (per Mcf) |
|
$ |
3.65 |
|
$ |
3.21 |
|
$ |
3.01 |
|
|
|
|
|
|
|
|
|
| |||
|
Selected Expenses per Mcfe: |
|
|
|
|
|
|
| |||
|
Production costs |
|
$ |
0.71 |
|
$ |
0.65 |
|
$ |
0.43 |
|
|
Workover expenses (non-recurring) |
|
$ |
0.18 |
|
$ |
0.04 |
|
$ |
0.07 |
|
|
Severance taxes |
|
$ |
(0.00 |
) |
$ |
0.16 |
|
$ |
(0.06 |
) |
|
Other revenue deductions |
|
$ |
1.30 |
|
$ |
0.76 |
|
$ |
0.43 |
|
|
Total lease operating expenses |
|
$ |
2.19 |
|
$ |
1.61 |
|
$ |
0.87 |
|
|
General and administrative expenses |
|
$ |
1.30 |
|
$ |
2.01 |
|
$ |
1.58 |
|
|
Depreciation, depletion and amortization |
|
$ |
1.89 |
|
$ |
2.80 |
|
$ |
2.70 |
|
We had two fields that exceeded 15% of our total Proved Reserves as of June 30, 2014 and one field that exceeded 15% as of June 30, 2013. Our Johnson Branch field represented approximately 31%, 57% and 95% of our total Proved Reserves as of June 30, 2014, 2013 and 2012, respectively. Our Hilltop field represented 66% of our total Proved Reserves as of June 30, 2014.
The following table provides additional information related to production from each field in which we had proved reserves:
|
|
|
Year Ended June 30, |
| |||||||
|
Johnson Branch field - Louisiana |
|
2014 |
|
2013 |
|
2012 |
| |||
|
Oil (Bbl) |
|
374 |
|
223 |
|
629 |
| |||
|
Average price (per Bbl) |
|
$ |
100.27 |
|
$ |
88.47 |
|
$ |
96.64 |
|
|
|
|
|
|
|
|
|
| |||
|
Natural gas production sold (Mcf) |
|
410,562 |
|
649,132 |
|
1,271,948 |
| |||
|
Average price (per Mcf) |
|
$ |
4.16 |
|
$ |
3.20 |
|
$ |
2.91 |
|
|
|
|
|
|
|
|
|
| |||
|
NGL’s (per Bbl) |
|
1,373 |
|
1,048 |
|
1,277 |
| |||
|
Average price (per Mcf) |
|
$ |
33.65 |
|
$ |
55.77 |
|
$ |
66.78 |
|
|
Average production cost (per Mcfe) |
|
|
|
|
|
|
| |||
|
(excluding severance and ad valorem taxes) |
|
$ |
1.55 |
|
$ |
1.58 |
|
$ |
0.69 |
|
|
|
|
Year Ended June 30, |
| |||||||
|
Caspiana field - Louisiana |
|
2014 |
|
2013 |
|
2012 |
| |||
|
Oil (Bbl) |
|
— |
|
— |
|
— |
| |||
|
Average price (per Bbl) |
|
$ |
— |
|
$ |
— |
|
$ |
— |
|
|
|
|
|
|
|
|
|
| |||
|
Natural gas production sold (Mcf) |
|
— |
|
— |
|
— |
| |||
|
Average price (per Mcf) |
|
$ |
— |
|
$ |
— |
|
$ |
— |
|
|
|
|
|
|
|
|
|
| |||
|
NGL’s (Bbl) |
|
1,285 |
|
— |
|
— |
| |||
|
Average price (per Mcf) |
|
$ |
45.31 |
|
$ |
— |
|
$ |
— |
|
|
Average production cost (per Mcfe) |
|
|
|
|
|
|
| |||
|
(excluding severance and ad valorem taxes) |
|
$ |
2.24 |
|
$ |
— |
|
$ |
— |
|
|
|
|
Year Ended June 30, |
| |||||||
|
Bethany Longstreet field - Louisiana |
|
2014 |
|
2013 |
|
2012 |
| |||
|
Oil (Bbl) |
|
— |
|
— |
|
— |
| |||
|
Average price (per Bbl) |
|
$ |
— |
|
$ |
— |
|
$ |
— |
|
|
|
|
|
|
|
|
|
| |||
|
Natural gas production sold (Mcf) |
|
742,494 |
|
— |
|
— |
| |||
|
Average price (per Mcf) |
|
$ |
4.27 |
|
$ |
— |
|
$ |
— |
|
|
|
|
|
|
|
|
|
| |||
|
NGL’s (Bbl) |
|
— |
|
— |
|
— |
| |||
|
Average price (per Mcf) |
|
$ |
— |
|
$ |
— |
|
$ |
— |
|
|
Average production cost (per Mcfe) |
|
|
|
|
|
|
| |||
|
(excluding severance and ad valorem taxes) |
|
$ |
1.14 |
|
$ |
— |
|
$ |
— |
|
|
|
|
Year Ended June 30, |
| |||||||
|
Hilltop - Texas |
|
2014 |
|
2013 |
|
2012 |
| |||
|
Oil (Bbl) |
|
9,347 |
|
— |
|
— |
| |||
|
Average price (per Bbl) |
|
$ |
95.47 |
|
$ |
— |
|
$ |
— |
|
|
|
|
|
|
|
|
|
| |||
|
Natural gas production sold (Mcf) |
|
2,824,826 |
|
— |
|
— |
| |||
|
Average price (per Mcf) |
|
$ |
3.42 |
|
$ |
— |
|
$ |
— |
|
|
|
|
|
|
|
|
|
| |||
|
NGL’s (Bbl) |
|
|
|
|
|
— |
| |||
|
Average price (per Mcf) |
|
$ |
— |
|
$ |
— |
|
$ |
— |
|
|
Average production cost (per Mcfe) |
|
|
|
|
|
|
| |||
|
(excluding severance and ad valorem taxes) |
|
$ |
2.53 |
|
$ |
— |
|
$ |
— |
|
PRODUCTIVE WELLS AND ACREAGE
Productive Wells
The following table sets forth our productive wells at June 30, 2014:
|
|
|
Oil |
|
Gas |
|
Total |
| ||||||
|
State |
|
Gross |
|
Net |
|
Gross |
|
Net |
|
Gross |
|
Net |
|
|
Louisiana |
|
— |
|
— |
|
52.00 |
|
19.78 |
|
52.00 |
|
19.78 |
|
|
Texas |
|
10.00 |
|
9.75 |
|
35.00 |
|
23.72 |
|
45.00 |
|
33.47 |
|
|
Total Wells |
|
10.00 |
|
9.75 |
|
87.00 |
|
43.50 |
|
97.00 |
|
53.25 |
|
The East Texas properties had 18 wells producing oil during fiscal 2014. Eight of those wells were determined to be non-economical and probably will be scheduled for shut-in, leaving the Company 10 wells
producing oil in economic quantities, at June 30, 2014. The Company had two new natural gas wells drilled and completed on our Louisiana acreage during fiscal 2014.
Acreage
The following table sets forth our undeveloped and developed gross and net leasehold acreage at June 30, 2014. The Louisiana undeveloped leasehold acreage is made up of alternate unit well sites that are part of our future drilling plan and currently have at least one well drilled and completed, so all of our acreage is held-by-production. Our East Texas acreage is approximately 40% held-by-production. Undeveloped acreage includes leased acres on which wells have not been drilled or completed to a point that would permit the production of commercial quantities of oil and gas, regardless of whether or not such acreage contains proved reserves.
|
|
|
Undeveloped |
|
Developed |
|
Total |
| ||||||
|
State |
|
Gross |
|
Net |
|
Gross |
|
Net |
|
Gross |
|
Net |
|
|
Louisiana |
|
17,846 |
|
7,284 |
|
6,296 |
|
2,570 |
|
24,142 |
|
9,854 |
|
|
East Texas |
|
18,132 |
|
11,454 |
|
10,951 |
|
10,384 |
|
29,083 |
|
21,838 |
|
|
Total Acres |
|
35,978 |
|
18,738 |
|
17,247 |
|
12,954 |
|
53,225 |
|
31,692 |
|
As is customary in the industry, we generally acquire oil and gas acreage without any warranty of title except as to claims made by, through or under the transferor. Although we have title to developed acreage examined prior to acquisition in those cases in which the economic significance of the acreage justifies the cost, there can be no assurance that losses will not result from title defects or from defects in the assignment of leasehold rights.
The Company engaged in the Cotton Valley vertical drilling program on its Northwest Louisiana acreage during 2005 through 2009. In the last 24 months, it has been shown that a more economical way to exploit the Cotton Valley in and around our Northwest Louisiana acreage is to drill and complete well bores directed horizontally. Generally, each square mile unit, or section, is economically capable of eight horizontally developed Cotton Valley well bores. Based on current development in and around our acreage, we take a more conservative approach and project four horizontally developed Cotton Valley wells in each section. Horizontal development of the Cotton Valley has achieved significantly higher ultimate recoveries of dry gas plus a good recovery of oil, while vertical development provides only a modest recovery of dry gas. Therefore, our strategy with respect to development of our acreage in the Cotton Valley is through horizontal exploitation.
Substantially all of the Company’s acreage is prospective for horizontal Haynesville Shale development. Generally, each section is economically capable of eight horizontally developed Haynesville Shale wells. Unlike the Cotton Valley formation, which provides a good recovery of oil when exploited horizontally, the Hayesville Shale in our area produces dry gas. If natural gas prices increase, we expect horizontal Haynesville Shale development to increase.
There is one vertical Cotton Valley or Haynesville Shale well bore in each section. Therefore, each section in which we hold an interest contains acreage that we expect to further develop. Ultimately, the Company expects that there will be several Cotton Valley well bores drilled and completed horizontally in each of these sections. However, the development of different formations in each of these sections, drilling multiple wells in certain formations in each section and employing horizontal completion techniques will allow for much greater future production from each of these sections than has been seen to-date.
On October 2, 2013, the Company purchased East Texas assets, well bores and infrastructure from Gastar and Navasota. The East Texas assets provide drilling opportunities in the Cretaceous oily zones, the Cotton Valley Knowles, the middle Bossier and the Deep Bossier Reagan sands. As of June 30, 2014, the Company only lightly engaged in re-completion activity in the middle Bossier zones in existing well bores. Recent
activity and recently completed 3-D seismic analysis has afforded the Company greater clarity as to the most advantageous opportunities to exploit the East Texas properties. It is anticipated that in the upcoming fiscal year, the Company will exploit the oily Cretaceous zones, both through existing well bores and through new drilling, and exploit the deep Bossier formation and/or the Cotton Valley Knowles through new drilling. This new drilling is expected to convert undeveloped acreage into developed acreage.
Lease Expirations
Our Louisiana acreage is all held-by-production. While our East Texas undeveloped lease acreage, excluding optioned acreage, will expire during the next four years, unless the leases are converted into producing units or extended prior to lease expiration. The following table sets forth the lease expirations as of June 30, 2014.
|
Fiscal Year |
|
Net Acres |
|
|
|
|
|
|
|
2014 |
|
2,882 |
|
|
2015 |
|
7,150 |
|
|
2016 |
|
1,306 |
|
|
2017 |
|
1,934 |
|
OPERATIONS
Oil and gas properties are customarily operated under the terms of a joint operating agreement, which provides for reimbursement of the operator’s direct expenses and monthly per well supervision fees. Per well supervision fees vary widely depending on the geographic location and producing formation of the well, whether the well produces oil or gas and other factors. As of June 30, 2014 approximately 18% of our oil and gas production, none of which totals 10% individually, were from wells operated by non-affiliated third-party operators and the balance of our production was operated by Fossil, an entity wholly owned by Mr. Wallen.
We have contract relationships with petroleum engineers, geologists and other operations and production specialists who believe the production rates and reserves will increase, which would lower the cost per Mcfe of operating our affiliated and non-affiliated third-party oil and gas properties.
EMPLOYEES
At November 4, 2014, the Company had twelve (12) full-time employees. We regularly use independent consultants and contractors to perform various professional services, including well-site supervision, design, construction, permitting and environmental assessment. We use independent contractors to perform field and on-site production operation services.
FACILITIES
The Company’s principal executive and administrative offices are located at 9870 Plano Road, Dallas, Texas, and are owned by an affiliate controlled by Mr. Wallen. Effective January 1, 2011, the Company signed a 2-year lease that charges the Company a monthly fee of $8,000 per month, which lease is currently on a month-to-month basis. The Company believes that there is other appropriate space available in the event the Company should terminate its current leasing arrangement, though the Company believes the monthly rental fee would likely exceed $8,000 per month.
COMPETITION
The oil and gas business is a highly competitive industry. Being a smaller player in our core positions, we are always susceptible to the influence of the larger companies operating in our primary areas of operations. As of June 30, 2014, our acreage was being operated by affiliated and non-affiliated third-party operators. Approximately 40% of our acreage in Leon and Robertson Counties, Texas is held by production, with the balance of this acreage expected to be renewed or drilled to hold. Additionally, there is open acreage in and around our Leon and Robertson County acreage position. We are experiencing some competition in Leon and Robertson Counties with both renewing our current acreage position not held by production as well as entering into new leases; however, this has not had a material impact in our operations or our plans for development.
We have approximately 10,000 Cotton Valley acres and 4,000 Haynesville acres in Caddo and DeSoto Parishes in Northwest Louisiana. Through an affiliate, we control operations on the vast majority of our Cotton Valley acreage in Northwest Louisiana. In DeSoto and Caddo Parishes, Louisiana, our Bossier/Haynesville acreage is operated by BHP Billiton, EXCO, BG, Goodrich, Chesapeake, Indigo Minerals, and EP Energy. This acreage is held by production, and we are not looking to expand our position in Northwest Louisiana.
In Eastland and Callahan Counties, Texas, we both operate through an affiliate and have farmout arrangements on properties that produce limited amounts of natural gas and oil condensate. This is not a material asset for the Company.
REGULATION
Exploration and Production. The exploration, production and sale of oil and natural gas are subject to various types of local, state and federal laws and regulations. These laws and regulations govern a wide range of matters, including the drilling and spacing of wells, allowable rates of production, restoration of surface areas, plugging and abandonment of wells and requirements for the operation of wells. Our operations are also subject to various conservation requirements. These include the regulation of the size and shape of drilling and spacing units or proration units, the density of wells that may be drilled and the unitization or pooling of oil and natural gas properties. In this regard, Louisiana and Texas allow forced pooling or integration of tracts to facilitate exploration, while other states rely on voluntary pooling of lands and leases. In addition, state conservation laws establish maximum rates of production from oil and natural gas wells, generally prohibit the venting or flaring of natural gas and impose certain requirements regarding the ratability of production. All of these regulations may adversely affect the rate at which wells produce oil and natural gas and the number of wells we may drill. All statements in this report about the number of locations or wells reflect current laws and regulations.
Laws and regulations relating to our business frequently change, and future laws and regulations, including changes to existing laws and regulations, could adversely affect our business.
Environmental Matters. The discharge of oil, gas or other pollutants into the air, soil or water may give rise to liabilities to the government and third parties and may require us to incur costs to remedy or control such discharges. Natural gas, oil or other pollutants, including salt water brine, may be discharged in many ways, including from a well or drilling equipment at a drill site, leakage from pipelines or other gathering and transportation facilities, leakage from storage tanks and sudden discharges from damage or explosion at natural gas facilities or oil and natural gas wells. Discharged hydrocarbons may migrate through soil to water supplies or adjoining property, giving rise to additional liabilities.
A variety of federal and state laws and regulations govern the environmental aspects of natural gas and oil production, transportation and processing and may, in addition to other laws, impose liability in the event of discharges, whether or not accidental, failure to notify the proper authorities of a discharge, and other noncompliance with those laws. Compliance with such laws and regulations may increase the cost of oil and natural gas exploration, development and production; although we do not anticipate that compliance will
have a material adverse effect on our capital expenditures or earnings. Failure to comply with the requirements of the applicable laws and regulations, by us or our third-party operators could subject us to substantial civil and/or criminal penalties and to the temporary or permanent curtailment or cessation of all or a portion of our operations.
The Comprehensive Environmental Response, Compensation and Liability Act (“CERCLA”), also known as the “superfund law,” imposes liability, regardless of fault or the legality of the original conduct, on some classes of persons that are considered to have contributed to the release of a “hazardous substance” into the environment. These persons include the owner or operator of a disposal site or sites where the release occurred and companies that dispose or arrange for disposal of the hazardous substances found at the time. Persons who are or were responsible for releases of hazardous substances under CERCLA may be subject to joint and several liability for the costs of cleaning up the hazardous substances that have been released into the environment and for damages to natural resources, and it is not uncommon for neighboring landowners and other third parties to file claims for personal injury and property damage allegedly caused by the hazardous substances released into the environment. We could be subject to liability under CERCLA because our drilling and production activities generate relatively small amounts of liquid and solid waste, which could be subject to classification as hazardous substances under CERCLA.
The Resource Conservation and Recovery Act of 1976, as amended (“RCRA”), is the principal federal statute governing the treatment, storage and disposal of hazardous wastes. RCRA imposes stringent operating requirements, and liability for failure to meet such requirements, on a person who is either a “generator” or “transporter” of hazardous waste or an “owner” or “operator” of a hazardous waste treatment, storage or disposal facility. At various times in the past, proposals have been made to amend RCRA to rescind the exemption that excludes oil and natural gas exploration and production wastes from regulation as hazardous waste. Repeal or modification of the exemption by administrative, legislative or judicial process, or modification of similar exemptions in applicable state statutes, would increase the volume of hazardous waste we are required to manage and dispose of and would cause us to incur increased operating expenses.
The federal Water Pollution Control Act of 1972, as amended (“Clean Water Act”), and analogous state laws, impose restrictions and strict controls regarding the discharge of pollutants into certain water bodies. Pursuant to the Clean Water Act and analogous state laws, permits must be obtained to discharge pollutants into waters of the United States or, under state law, state surface or subsurface waters. Any such discharge of pollutants into regulated waters must be performed in accordance with the terms of a permit issued by the EPA or the analogous state agency. Spill prevention, control and countermeasure requirements under federal law require appropriate operating protocols including containment berms and similar structures to help prevent the contamination of regulated waters in the event of a petroleum hydrocarbon tank spill, rupture or leak. In addition, the Clean Water Act and analogous state laws require individual permits or coverage under general permits for discharges of storm water runoff from certain types of facilities or during construction activities.
Our third-party operators employ hydraulic fracturing techniques to stimulate natural gas production from unconventional geological formations, which entails the injection of pressurized fracturing fluids (consisting of water, sand and certain chemicals) into a well bore. The federal Energy Policy Act of 2005 amended the Underground Injection Control (“UIC”) provisions of the federal Safe Drinking Water Act (“SDWA”) to exclude hydraulic fracturing from the definition of “underground injection” under certain circumstances. However, the repeal of this exclusion has been advocated by certain advocacy organizations and others in the public. Legislation to amend the SDWA to repeal this exemption and require federal permitting and regulatory control of hydraulic fracturing, as well as legislative proposals to require disclosure of the chemical constituents of the fluids used in the fracturing process, were proposed in recent sessions of Congress. Similar legislation could be introduced in the current session of Congress. Scrutiny of hydraulic fracturing activities continues in other ways, with the EPA having commenced a study of the potential environmental impacts of hydraulic fracturing. In December 2012, the EPA issued a progress report on its hydraulic fracturing study with final results now expected in 2016, after a two-year delay was announced by the EPA in June 2013. The agency also announced that one of its enforcement initiatives for 2014 to 2016 would be to focus on environmental compliance by the energy extraction sector. This study and enforcement
initiative could result in additional regulatory scrutiny or further legislative or regulatory action regarding hydraulic fracturing or similar production operations that could make it difficult to perform hydraulic fracturing and increase our costs of compliance or significantly impact our business, results of operations, cash flows, financial position and future growth.
In addition, some states and localities have adopted, and others are considering adopting, regulations or ordinances that could restrict hydraulic fracturing in certain circumstances, or that would impose higher taxes, fees or royalties on natural gas production. Our operations are concentrated in Louisiana and Texas. We now have significant operations in Texas as well. We do not currently have operations on federal lands or in the states where the most stringent proposals have been advanced. However, if new federal or state laws or regulations that significantly restrict hydraulic fracturing are adopted, or if we acquire oil and gas properties in areas subject to those regulations, such legal requirements could result in delays, eliminate certain drilling and injection activities, make it more difficult or costly for us to perform fracturing and increase our costs of compliance and doing business. It is also possible that our drilling and injection operations could adversely affect the environment, which could result in a requirement to perform investigations or clean-ups or in the incurrence of other unexpected material costs or liabilities.
The Oil Pollution Act of 1990, as amended (“OPA”), which amends the Clean Water Act, establishes strict liability for owners and operators of facilities that are the site of a release of oil into waters of the United States. The OPA and its associated regulations impose a variety of requirements on responsible parties related to the prevention of oil spills and liability for damages resulting from such spills. A “responsible party” under the OPA includes owners and operators of certain onshore facilities from which a release may affect regulated waters.
The federal Clean Air Act, as amended (“Clean Air Act”), and state air pollution permitting laws, restrict the emission of air pollutants from many sources, including processing plants and compressor stations and potentially from our drilling and production operations, and as a result affects oil and natural gas operations. We may be required to incur compliance costs or capital expenditures for existing or new facilities to remain in compliance. In addition, more stringent regulations governing emissions of air pollutants, including greenhouse gases such as methane (a component of natural gas) and carbon dioxide are being developed by the federal government, and may increase the costs of compliance for some facilities or the cost of transportation or processing of produced oil and gas which may affect our operating costs. Obtaining permits has the potential to delay the development of oil and natural gas projects. While we may be required to incur certain capital expenditures in the next few years for air pollution control equipment or other air emissions-related issues, we do not believe, based on current law, that such requirements will have a material adverse effect on our operations.
In response to findings that emissions of carbon dioxide, methane and other greenhouse gases (“GHG”), from industrial and energy sources contribute to increases of carbon dioxide levels in the earth’s atmosphere and oceans, effects on climate, and other environmental effects and therefore present an endangerment to public health and the environment, the EPA has adopted various regulations under the Clean Air Act, addressing emissions of greenhouse gases that may affect the oil and gas industry. On November 8, 2010, the EPA finalized rules expanding its Mandatory Greenhouse Gas Reporting Rule, originally promulgated in October 2009, to be applicable to the oil and natural gas industry, including certain onshore oil and natural gas production activities, which may affect certain of our existing or future operations and require the inventory and reporting of emissions. In addition, the EPA has taken the position that existing Clean Air Act provisions require an assessment of greenhouse gas emissions within the permitting process for certain large new or modified stationary sources under the EPA’s Prevention of Significant Deterioration and Title V permit programs, effective as of 2011. On April 17, 2012, the EPA issued final rules to subject oil and natural gas operations to regulation under the New Source Performance Standards (“NSPS”) and National Emission Standards for Hazardous Air Pollutants (“NESHAPS”) programs under the Clean Air Act, and to impose new and amended requirements under both programs. The EPA rules include NSPS standards for completions of hydraulically fractured natural gas wells. Before January 1, 2015, these standards require owners/operators to reduce volatile organic compound (“VOC”) emissions from natural gas not sent to the gathering line during well completion either by flaring using a completion combustion device or by capturing
the natural gas using green completions with a completion combustion device. Beginning January 1, 2015, operators must capture the natural gas and make it available for use or sale, which can be done through the use of green completions. The standards are applicable to new hydraulically fractured wells and also existing wells that are refractured. Further, the finalized regulations also establish specific new requirements, which became effective in 2012, for emissions from compressors, controllers, dehydrators, storage tanks, natural gas processing plants and certain other equipment. These rules may require changes to our operations, including the installation of new equipment to control emissions. We are currently evaluating the effect these rules will have on our business.
We are unable to assure that more stringent laws and regulations protecting the environment will not be adopted and that we will not incur material expenses in complying with them in the future. For example, although federal legislation regarding the control of emissions of GHG for the present, appears unlikely, the EPA has been implementing regulatory measures under existing Clean Air Act authority and some of those regulations may affect our operations. These GHG regulations could require us to incur increased operating costs and could have an adverse effect on demand for the oil and natural gas we produce.
Although this rule does not limit the amount of GHGs that can be emitted, it requires the operator of the wells to incur costs to monitor, record keep and report GHG emissions associated with our operations. In addition, some states have considered, and notably California has adopted, a state specific GHG regulatory program that may limit GHG emissions or may require costs in association with the control of GHG emissions.
The federal Endangered Species Act, as amended (“ESA”), and comparable state laws, may restrict activities that affect endangered and threatened species or their habitats. Some of our facilities may be located in areas that are designated as habitat for endangered or threatened species. The designation of previously unidentified endangered or threatened species could cause us to incur additional costs or become subject to operating restrictions or bans in the affected areas.
We are subject to a number of federal and state laws and regulations, including the federal Occupational Safety and Health Act, as amended (“OSHA”), and comparable state laws, whose purpose is to protect the health and safety of workers. In addition, the OSHA hazard communication standard, the EPA community right-to-know regulations under Title III of the federal Superfund Amendment and Reauthorization Act and comparable state statutes require that information be maintained concerning hazardous materials used or produced in our operations and that this information be provided to employees, state and local government authorities and citizens. These laws and provisions of CERCLA require reporting of spills and releases of hazardous chemicals in certain situations.
We do not believe that our environmental, health and safety risks will be materially different from those of comparable U.S. companies in the oil and natural gas industry. Nevertheless, there can be no assurance that such environmental, health and safety laws and regulations will not result in a curtailment of production or material increase in the cost of production, development or exploration or otherwise adversely affect our capital expenditures, financial condition and results of operations.
In addition, because we have acquired and may acquire interests in properties that have been operated in the past by others, we may be liable for environmental damage, including historical contamination, caused by such former operators. Additional liabilities could also arise from continuing violations or contamination not discovered during our assessment of the acquired properties.
Natural Gas Marketing and Transportation. Our sales of natural gas are affected by the availability, terms and cost of transportation. The price and terms for access to pipeline transportation are subject to extensive federal and state regulation. From 1985 to the present, several major regulatory changes have been implemented by Congress and the Federal Energy Regulatory Commission (“FERC”). The FERC regulates interstate natural gas transportation rates, and terms and conditions of service, which affects the marketing of natural gas that we produce, as well as the revenues we receive for sales of our natural gas. Since 1985, the FERC has endeavored to make natural gas transportation more accessible to natural gas buyers and sellers on
an open and non-discriminatory basis. Beginning in 1992, the FERC issued a series of orders, beginning with Order No. 636, to implement its open access policies. As a result, the interstate pipelines’ traditional role of providing the sale and transportation of natural gas as a single service has been eliminated and replaced by a structure under which pipelines provide transportation and storage service on an open access basis to others who buy and sell natural gas. Although the FERC’s orders do not directly regulate natural gas producers, they are intended to foster increased competition within all phases of the natural gas industry.
In addition, the FERC is continually proposing and implementing new rules affecting segments of the natural gas industry, most notably interstate natural gas transmission companies that remain subject to FERC’s jurisdiction. These initiatives may also affect the intrastate transportation of gas under certain circumstances. The stated purpose of many of these regulatory changes is to promote competition among the various sectors of the natural gas industry and these initiatives generally reflect more light-handed regulation.
The natural gas industry historically has been very heavily regulated. Therefore, we cannot provide any assurance that the less stringent regulatory approach established by the FERC under Order No. 637 will continue. However, we do not believe that any action taken will affect us in a way that materially differs from the way it affects other natural gas producers, gatherers and marketers with which we compete.
The price at which we sell natural gas is not currently subject to federal rate regulation and, for the most part, is not subject to state regulation. However, with regard to our physical sales of these energy commodities, we are required to observe anti-market manipulation laws and related regulations enforced by the FERC, the Commodity Futures Trading Commission (“CFTC”) and/or the Federal Trade Commission. Should we violate the anti-market manipulation laws and regulations, we could also be subject to related third party damage claims by, among others, sellers, royalty owners and taxing authorities.
Crude Oil Marketing and Transportation. Our sales of crude oil and condensate are currently not regulated and are made at market prices. Nevertheless, Congress could reenact price controls in the future.
Intrastate oil pipeline transportation rates are subject to regulation by state regulatory commissions. The basis for intrastate oil pipeline regulation, and the degree of regulatory oversight and scrutiny given to intrastate oil pipeline rates, varies from state to state. Insofar as effective interstate and intrastate rates are equally applicable to all comparable shippers, we believe that the regulation of oil transportation rates will not affect our operations in any way that is materially different from those of our competitors who are similarly situated.
Further, intrastate common carrier oil pipelines must provide service on a non-discriminatory basis. Under this open access standard, common carriers must offer service to all similarly situated shippers requesting service on the same terms and under the same rates. Accordingly, we believe that access to oil pipeline transportation services generally will be available to us to the same extent as to our similarly situated competitors.
GLOSSARY OF CERTAIN OIL AND GAS TERMS
The following are abbreviations and definitions of terms commonly used in the oil and gas industry, many of which are used in this Report.
“Bbl” means a barrel of 42 U.S. gallons, used herein in reference to oil or other liquid hydrocarbons.
“Bcf” means one billion cubic feet.
“Bcfe” means Bcf of natural gas equivalent; determined using the ratio of one Bbl of oil or condensate to six Mcf of natural gas.
“Btu” means British thermal unit, which means the quantity of heat required to raise the temperature of one pound of water by one degree Fahrenheit.
“Casing” means a type of pipe that is used for encasing a smaller diameter carrier pipe for installation in a well. Casing is used to send off fluids from the hole or keep a hole from caving in.
“Completion” means the installation of permanent equipment for the production of oil or gas.
“Compressor Station” means a facility in which the pressure of natural gas is raised to facilitate its transmission through pipelines.
“Condensate” means hydrocarbons naturally occurring in the gaseous phase in a reservoir that condense to become a liquid at the surface due to the change in pressure and temperature.
“Cubic Foot” means the volume of gas that fills one cubic foot of space under standard temperature and pressure conditions. Standard pressure is 14.73 psi and standard temperature is 60 degrees Fahrenheit.
“Developed Acreage” means the number of acres that are allocated or assignable to producing wells or wells capable of production.
“Development Drilling” or “Development Well” means a well drilled within the proved area of an oil or gas reservoir to the depth of a stratigraphic horizon known to be productive.
“Dry Hole” or “Dry Well” means a well found to be incapable of producing hydrocarbons in sufficient quantities to justify completion as an oil and gas well.
“Estimated Future Net Cash Flows” means estimated future gross cash flows to be generated from the production of proved reserves, net of estimated production, future development costs, and future abandonment costs, using prices and costs in effect as of the date of the report or estimate, without giving effect to non-property related expenses such as general and administrative expenses, debt service and future income tax expense or to depreciation, depletion and amortization.
“Exploration” is the act of searching for potential sub-surface reservoirs of gas or oil. Methods include the use of magnetometers, gravity meters, seismic exploration, surface mapping, and the drilling of exploratory test wells (known as “wildcats”).
“Exploratory Drilling” or “Exploratory Well” means a well drilled to find and produce oil or gas reserves not classified as proved, to find a new production reservoir in a field previously found to be productive of oil or gas in another reservoir or to extend a known reservoir.
“Fracture Stimulation” means a stimulation treatment routinely performed involving the injection of water, sand and chemicals under pressure to stimulate hydrocarbon production in low-permeability reservoirs.
“Farm-In” or “Farm-Out” means an agreement pursuant to which the owner of a working interest in an oil and gas lease assigns the working interest or a portion thereof to another party who desires to drill on the leased acreage. Generally, the assignee is required to drill one or more wells in order to earn its interest in the acreage. The assignor usually retains a royalty or reversionary interest in the lease. The interest received by an assignee is a “farm-in” and the assignor issues a “farm-out.”
“Finding and Development Costs” means the total costs incurred for exploration and development activities (excluding exploratory drilling in progress and drilling inventories), divided by total proved reserve additions. To the extent any portion of the proved reserve additions consist of proved undeveloped reserves; additional costs would have to be incurred in order for such proved undeveloped reserves to be produced. This measure may differ from the measure used by other oil and natural gas companies.
“Gas” means natural gas.
“Full Cost Pool” The full cost pool consists of all costs associated with property acquisition, exploration, and development activities for a company using the full cost method of accounting. Additionally, any internal costs that can be directly identified with acquisition, exploration and development activities are included. Any costs related to production, general corporate overhead or similar activities are not included.
“Gathering System” means a system of pipelines, compressor stations and any other related facilities that gathers natural gas from a supply region and transports it to the major transmission systems.
“Gross” when used with respect to acres or wells, means the total acres or wells in which we have a working interest.
“Held-by-production” A provision in an oil, gas and mineral lease that perpetuates a company’s right to operate a property or concession as long as the property or concession produces a minimum paying quantity of oil or gas.
“Horizontal Drilling” means drilling a well that deviates from the vertical and travels horizontally through a prospective reservoir.
“Horizontal Wells” Wells which are drilled at angles greater than 70 degrees from vertical.
“Hydrocarbons” means an organic chemical compound of hydrogen and carbon. Hydrocarbons are a large class of liquid, solid or gaseous organic compounds, which are the basis of almost all petroleum products.
“Infill drilling” means drilling of a well between known producing wells to better exploit the reservoir.
“Initial production rate” means generally, the maximum 24 hour production volume from a well.
“Lease” means a formal agreement between two or more parties where the owner of the land grants another party the right to drill and produce hydrocarbons in exchange for payment.
“Mcf” means one thousand cubic feet.
“Mmcf/d” means one million cubic feet of natural gas per day.
“Mcfe” means Mcf of natural gas equivalent; determined using the ratio of one Bbl of oil or condensate to six Mcf of natural gas.
“MMbtu” means one million Btus.
“MMcf” means one million cubic feet.
“MMcfe” means MMcf of natural gas equivalent, determined using the ratio of one Bbl of oil or condensate to six Mcf of natural gas.
“Natural Gas Liquids” or “NGLs” means liquid hydrocarbons which have been extracted from natural gas (e.g., ethane, propane, butane and natural gasoline).
“Net” when used with respect to acres or wells, refers to gross acres or wells multiplied, in each case, by the percentage working interest owned by the Company.
“Net Production” means production that is owned by the Company less royalties and production due others.
“NYMEX” means the New York Mercantile Exchange.
“Overriding royalty interest” means an interest in an oil and/or natural gas property entitling the owner to a share of oil and natural gas production free of costs of production.
“Operator” means the individual or company responsible for the exploration, development and production of an oil or gas well or lease.
“Play” means a portion of the exploration and production cycle following the identification by geologists and geophysicists of areas with potential oil and gas reserves.
“Pipeline” means all parts of a physical facility through which gas is transported, including pipe, valves and other appendages attached to the pipe, compressor units, metering stations, regulator stations, delivery stations, holders, and fabricated assemblies.
“Present Value”, “PV-10” or “Standardized Measure” when used with respect to oil and gas reserves, is the pre-tax present value, discounted at an annual rate of 10%, of the estimated future gross revenues to be generated from the production of proved reserves calculated in accordance with the guidelines of the SEC, net of estimated production and future development costs, using prices and costs as of the date of estimation without future escalation (except to the extent a contract specifically provides otherwise), without giving effect to non-property related expenses such as general and administrative expenses, debt service, future income tax expense and depreciation, depletion and amortization.
“Productive Wells” or “Producing Wells” consist of producing wells and wells capable of production, including natural gas wells waiting on pipeline connections.
“Proved Reserves” means those quantities of oil and gas, which, by analysis of geoscience and engineering data, can be estimated with reasonable certainty to be economically producible, from a given date forward, from known reservoirs, and under existing economic conditions, operating methods, and government regulations, prior to the time at which contracts providing the right to operate expire, unless evidence indicates that renewal is reasonably certain, regardless of whether deterministic or probabilistic methods are used for the estimation. The project to extract the hydrocarbons must have commenced or the operator must be reasonably certain that it will commence the project within a reasonable time.
“Recompletion” means an operation within an existing well bore to make the well produce oil and/or gas from a different, separately producible zone other than the zone from which the well had been producing.
“Reserves” means proved reserves.
“Reservoir” means a porous and permeable underground formation containing a natural accumulation of producible oil and/or gas that is confined by impermeable rock or water barriers and is individual and separate from other reservoirs.
“Royalty” means an interest in an oil and gas lease that gives the owner of the interest the right to receive a portion of the production from the leased acreage (or of the proceeds of the sale thereof), but generally does not require the owner to pay any portion of the costs of drilling or operating the wells on the leased acreage. Royalties may be either landowner’s royalties, which are reserved by the owner of the leased acreage at the time the lease is granted, or overriding royalties, which are usually reserved by an owner of the leasehold in connection with a transfer to a subsequent owner.
“Sandstone” means rock composed mainly of sand-sized particles or fragments of the mineral quartz, which, because these grains are rigid, will withstand tremendous pressures without being compacted.
“Shale” means a type of rock composed of common clay or mud. When clay is compacted under great pressure and temperature deep in the earth, water contained in the clay is expelled, and clay turns into shale.
“2-D Seismic” means an advanced technology method by which a cross-section of the earth’s subsurface is created through the interpretation of reflecting seismic data collected along a single source profile.
“3-D Seismic” means an advanced technology method by which a three dimensional image of the earth’s subsurface is created through the interpretation of reflection seismic data collected over a surface grid. 3-D seismic surveys allow for a more detailed understanding of the subsurface than do conventional surveys and contribute significantly to field appraisal, development and production.
“Undeveloped Acreage” means lease acreage on which wells have not been drilled or completed to a point that would permit the production of commercial quantities of oil and natural gas regardless of whether such acreage contains proved reserves.
“Undeveloped Reserves” means reserves of any category that are expected to be recovered from new wells on undrilled acreage, or from existing wells where a relatively major expenditure is required for recompletion.
“Working Interest” means an interest in an oil and gas lease that gives the owner of the interest the right to drill for and produce oil and gas on the leased acreage and requires the owner to pay a share of the costs of drilling and production operations. The share of production to which a working interest owner is entitled will always be smaller than the share of costs that the working interest owner is required to bear, with the balance of the production accruing to the owners of royalties.
“Workovers” means operations on a producing well to restore or increase production.
AVAILABILITY OF INFORMATION
We file annual, quarterly and current reports and proxy statements with the Securities and Exchange Commission (the “SEC”). The public may read and copy any materials we file with the SEC at the SEC’s Public Reference Room at 100 F Street N.E., Washington, D.C. 20549. The public may obtain information about the operation of the Public Reference Room by calling the SEC at 1-800-SEC-0330. We file our reports with the SEC electronically. The SEC maintains a website at www.sec.gov that contains reports, proxy and information statements, and other information regarding Cubic Energy, Inc. and other companies that file electronically with the SEC.
Our website address is www.cubicenergyinc.com. We make available on our website free of charge copies of our annual report on Form 10-K, quarterly reports on Form 10-Q, current reports on Form 8-K and amendments to those reports filed or furnished pursuant to Section 13(a) of the Exchange Act as soon as reasonably practicable after we electronically file such material with, or furnish it to, the SEC.
You should carefully consider the following risk factors, in addition to the other information set forth in this Report, in connection with any investment decision regarding shares of our Common Stock. Each of these risk factors could adversely affect our business, operating results and financial condition, as well as adversely affect the value of an investment in our Common Stock. Some information in this Report may contain “forward-looking” statements that discuss future expectations of our financial condition and results of operation. The risk factors noted in this section and other factors could cause our actual results to differ materially from those contained in any forward-looking statements.
Our ability to continue operations is dependent on our ability to work with our lenders and identify an acceptable Strategic Transaction.
As of June 30, 2014, we had cash in the amount of $6,857,970 and total liabilities in the amount of $126,654,909. We also had a working capital deficit of $72,997,802 and an accumulated deficit of $78,052,931. Additionally, we are currently subject to a forbearance agreement in relation to the Note Purchase Agreement which requires us to, among others, enter into a definitive agreement with respect to a Strategic Transaction by October 17, 2014. The holders of the Notes have the ability to require the terms of the Strategic Transaction to permit us to repay all amounts owing to the holders of the Notes. We continue to explore alternatives with respect to a Strategic Transaction, although we did not enter into a definitive agreement by October 17, 2014. We are in discussions with the holders of the Notes with respect to available alternatives. Unless the requirement regarding a Strategic Transaction is waived, or we obtain an extension of time, the holders of the Notes could declare a default under the Note Purchase Agreement, accelerate the indebtedness represented by the Notes and exercise all other remedies available to them, including foreclosing on our assets.
We believe we have complied with the other terms of the forbearance agreement; however, there can be no assurance that we will be successful in consummating a Strategic Transaction within the mandated time period.
Servicing our debt requires a significant amount of cash.
On October 2, 2013, we entered into the Note Purchase Agreement, pursuant to which we initially issued an aggregate of $66,000,000 of Notes. In addition, our prior debt of approximately $21,000,000 to WFEC was renegotiated and assumed by one of our subsidiaries. As of June 30, 2014, after giving effect to the issuance of additional debt to pay interest thereon, there is an aggregate principal amount of approximately $68,834,798 of Notes, and the aggregate indebtedness to WFEC is approximately $24,880,936. As a result of the Amendment to the Note Purchase Agreement, we are required to enter into a definitive agreement with respect to a Strategic Transaction by October 17, 2014, which we have not done. In addition, the Amendment provides that the interest rate applicable to the Notes is increased to 20.5%.
Our ability to make scheduled payments of the principal of, to pay interest on or to refinance our indebtedness depends on our ability to develop our Leon and Robertson Counties, Texas assets and our Louisiana assets, generate cash flows from those assets and collect amounts owed to us by our third-party operators. We continue to explore alternatives with respect to a Strategic Transaction, although we did not enter into a definitive agreement by October 17, 2014. No assurances can be given that we will be able to complete a Strategic Transaction within the time period required by the Amendment, or at all.
Our acquisition of assets from Gastar, Navasota and Tauren presents certain risks to our business and operations.
In October 2013, we consummated the acquisition of certain assets from Gastar, Navasota and Tauren. The acquisitions present numerous risks, including the following:
· The possibility that the expected benefits of such transaction may not materialize in the timeframe expected, or at all, or may be more costly to achieve than anticipated;
· The increase in our indebtedness that has resulted from entering into financing for the acquisitions;
· That the acquired assets may not produce as expected;
· That we are unable to successfully develop the assets;
· Risks associated with the ownership and operation of the acquired assets, which differ from those that we previously held, in that the acquired assets in East Texas are primarily oil producing, while our legacy assets are primarily gas producing;
· The integration of these transactions may require diversion of the attention of our management and other key employees from ongoing business activities, including the pursuit of other opportunities that could be beneficial to us; and
· That we have incurred substantial costs in connection with these transactions.
One or more of these factors could negatively affect our business, financial condition or results of operations.
Our common stockholders may experience dilution due to the exercise of warrants to purchase Common Stock.
As part of the transactions consummated in October 2013, we issued warrants exercisable into an aggregate of 65,834,549 shares of Common Stock at an exercise price of $0.01 per share, and warrants exercisable into an aggregate of 32,917,274 shares of Common Stock at an exercise price of $0.50 per share. As a result of the issuance of these warrants, the exercise price of warrants held by WFEC, which are exercisable into an aggregate of 8,500,000 shares of Common Stock, was adjusted to $0.1753 per share. The issuance of additional shares of Common Stock upon exercise of any of these warrants would result in dilution to existing holders of Common Stock. In addition, the issuance of additional warrants or other securities convertible into Common Stock could result in the dilution of existing stockholder’s equity interests. The issuance of additional shares of Common Stock or warrants or other securities convertible into Common Stock could also trigger additional anti-dilution adjustments in the exercise price of outstanding warrants and other securities convertible into Common Stock.
Fluctuations in oil and natural gas prices, which have been volatile at times, may adversely affect our revenues as well as our ability to maintain or increase our borrowing capacity, repay current or future indebtedness and obtain additional capital.
Our future financial condition, access to capital, cash flows and results of operations depend upon the prices we receive for our oil and natural gas. Historically, we have been particularly dependent on prices for natural gas, but as a result of the acquisition of our properties in Leon and Robertson Counties, Texas, we have become increasingly dependent on prices for oil. Historically, oil and natural gas prices have been volatile and are subject to fluctuations in response to changes in supply and demand, market uncertainty and a variety of additional factors that are beyond our control. Factors that affect the prices we receive for our oil and natural gas include:
· The level of domestic production;
· The availability of imported oil and natural gas;
· Political and economic conditions and events in foreign oil and natural gas producing nations, including embargoes, continued hostilities in the Middle East and other sustained military campaigns, and acts of terrorism or sabotage;
· The ability of members of OPEC to agree to and maintain oil price and production controls;
· The cost and availability of transportation and pipeline systems with adequate capacity;
· The cost and availability of other competitive fuels;
· Fluctuating and seasonal demand for oil, natural gas and refined products;
· Concerns about global warming or other conservation initiatives and the extent of governmental price controls and regulation of production;
· Weather;
· Foreign and domestic government relations; and
· Overall economic conditions, particularly the recent worldwide economic slowdown which has put downward pressure on oil and natural gas prices and demand.
In the past, prices of oil and natural gas have been extremely volatile, and we expect this volatility to continue. During fiscal 2014, the Henry Hub spot price for natural gas fluctuated from a high of $7.90 per Mcf to a low of $3.27 per Mcf, while the NYMEX West Texas Intermediate crude oil price ranged from a high of $110.62 per Bbl to a low of $91.36 per Bbl.
Our revenues, cash flow and profitability and our ability to maintain or increase our borrowing capacity, to repay current or future indebtedness and to obtain additional capital depend substantially upon oil and natural gas prices.
We face significant competition, and many of our competitors have resources in excess of our available resources.
The oil and gas industry is highly competitive. We encounter competition from other oil and gas companies in all areas of our operations, including the acquisition of producing properties and exploratory prospects and sale of crude oil, natural gas and NGL. Our competitors include major integrated oil and gas companies and numerous independent oil and gas companies, individuals and drilling and income programs. Many of our competitors are large, well established companies with substantially larger operating staffs and greater capital resources than us. Such companies may be able to pay more for productive oil and gas properties and exploratory prospects and to define, evaluate, bid for and purchase a greater number of properties and prospects than our financial or human resources permit. Our ability to acquire additional properties and to discover reserves in the future will depend upon our ability to evaluate and select suitable properties and to consummate transactions in this highly competitive environment.
Exploratory drilling is a speculative activity that may not result in commercially productive reserves and may require expenditures in excess of budgeted amounts.
Drilling activities are subject to many risks, including the risk that no commercially productive oil or gas reservoirs will be encountered. There can be no assurance that new wells drilled by us or in which we have an interest will be productive or that we will recover all or any portion of our investment. Drilling for oil and gas may involve unprofitable efforts, not only from dry wells, but also from wells that are productive but do not produce sufficient net revenues to return a profit after drilling, operating and other costs. The cost of drilling, completing and operating wells is often uncertain. Our drilling operations may be curtailed, delayed or canceled as a result of a variety of factors, many of which are beyond our control, including economic conditions, mechanical problems, pressure or irregularities in formations, title problems, weather conditions, compliance with governmental requirements and shortages in or delays in the delivery of equipment and services. Such equipment shortages and delays sometimes involve drilling rigs where inclement weather prohibits the movement of land rigs causing a high demand for rigs by a large number of companies during a
relatively short period of time. Our future drilling activities may not be successful. Lack of drilling success could have a material adverse effect on our financial condition and results of operations.
Our operations are also subject to all of the hazards and risks normally incident to the development, exploitation, production and transportation of, and the exploration for, oil and gas, including unusual or unexpected geologic formations, pressures, down hole fires, mechanical failures, blowouts, explosions, uncontrollable flows of oil, gas or well fluids and pollution and other environmental risks. These hazards could result in substantial losses to us due to injury and loss of life, severe damage to and destruction of property and equipment, pollution and other environmental damage and suspension of operations. We participate in insurance coverage maintained by the operators of our wells, although there can be no assurances that such coverage will be sufficient to prevent a material adverse effect to us if any of the foregoing events occur.
Acquisition prospects are difficult to assess and may pose additional risks to our operations.
Where appropriate, we may evaluate and pursue acquisition opportunities on terms our management considers favorable. The successful acquisition of natural gas and oil properties requires an assessment of:
· Recoverable reserves;
· Exploration potential;
· Future natural gas and oil prices;
· Operating costs;
· Potential environmental and other liabilities; and
· Permitting and other environmental authorizations required for our operations.
In connection with such an assessment, we would expect to perform a review of the subject properties that we believe to be generally consistent with industry practices. Nonetheless, the resulting conclusions are inexact and their accuracy inherently uncertain and such an assessment may not reveal all existing or potential problems, nor will it necessarily permit a buyer to become sufficiently familiar with the properties to fully assess their merits and deficiencies. Inspections may not always be performed on every facility or well, and structural and environmental problems are not necessarily observable even when an inspection is undertaken. Future acquisitions could pose additional risks to our operations and financial results, including:
· Problems integrating the purchased operations, personnel or technologies;
· Unanticipated costs;
· Diversion of resources and management attention from our exploration business;
· Entry into regions or markets in which we have limited or no prior experience; and
· Potential loss of key employees, particularly those of the acquired organization.
We have a history of losses from operations and may not achieve profitable operations. If we are not able to achieve and maintain profitable operations in the future, we might not be able to access funds through debt or equity financings.
We had losses from operations of $7,527,465 for fiscal 2014 and $3,609,972 for fiscal 2013. Our accumulated deficit as of June 30, 2014 was $78,052,931.
Historically, we have funded our operating losses, acquisitions and drilling costs primarily through a combination of private offerings of convertible debt, senior secured debt, and equity securities. We must repay or refinance all amounts payable under the Note Purchase Agreement and to WFEC. Our success in obtaining the necessary capital resources to fund the repayment under the Note Purchase Agreement, the Credit Agreement with WFEC as well as future costs associated with our operations and drilling plans is dependent upon our ability to: (i) increase revenues through acquisitions and recovery of our proved producing and proved developed non-producing oil and gas reserves; (ii) maintain effective cost controls at the corporate administrative office and in field operations; and (iii) obtain additional financing. However, even if we achieve some success with our plans, there can be no assurance that we will be able to generate sufficient revenues to achieve significant profitable operations or to fund our drilling plans.
We have substantial capital requirements necessary for undeveloped properties for which we may not be able to obtain adequate financing.
At June 30, 2014, a significant portion of our proved oil and gas reserves were undeveloped. At June 30, 2014, we had total proved undeveloped reserves of 44,346 MMcfe, which represented approximately 34% of our total proved reserves of 135,071 MMcfe. Recovery of our future undeveloped reserves will require significant capital expenditures to further develop these reserves for the foreseeable future. In addition to our results of operations, our derivative sales contracts can potentially affect cash flow negatively, if prices for natural gas or oil exceed their respective strike prices. Pursuant to the derivative sales contracts, we are required to pay to the counterparty the difference between the strike price and actual sales price for volumes subject to the respective contract, to the extent the actual sales price exceeds the strike price. If our capital resources are utilized for that purpose, we would have fewer capital resources available for development of our undeveloped properties.
No assurance can be given that our financing sources will be sufficient to fund our costs for third-party operators’ development activities or that development activities will be either successful or in accordance with our schedule. Additionally, if natural gas prices do not increase or if our costs of development significantly increase, we could experience a significant reduction in the number of gas wells drilled and/or reworked. No assurance can be given that any wells will produce oil or gas in commercially profitable quantities. Development of our properties could require capital resources in addition to amounts available to us. There can be no assurance that sufficient cash on hand or additional financing (on either favorable or unfavorable terms) will be available, when required, to fund the development. In the event of product price increases resulting in payments by us under the derivative sales contracts, no assurances can be given that we will have increases in oil and/or gas production in excess of the notional amounts of oil and/or gas specified in our derivative sales contracts. Any inability to obtain additional financing could have a material adverse effect on us, including requiring us to cease our oil and gas development plans or not being able to maintain our working interest due to failure to pay our share of expenses. Any additional financing may involve substantial dilution to the interests of our stockholders at that time.
Our natural gas and oil sales and our related hedging activities expose us to potential regulatory risks.
The Federal Trade Commission, the Federal Energy Regulatory Commission (“FERC”), and the U.S. Commodity Futures Trading Commission (“CFTC”) hold statutory authority to monitor certain segments of the physical and futures energy commodities markets. These agencies have imposed broad regulations prohibiting fraud and manipulation of such markets. With regard to our physical sales of natural gas and oil and any related hedging activities that we undertake, we are required to observe the market-related regulations enforced by these agencies, which hold substantial enforcement authority. Our sales may also be subject to certain reporting and other requirements. Failure to comply with such regulations, as interpreted and enforced, could have a material adverse effect on our business, results of operations and financial condition.
To the extent that we enter into transportation contracts with natural gas pipelines that are subject to FERC regulation, we are subject to FERC requirements related to use of such capacity. Any failure on our part to
comply with the FERC’s regulations and policies, or with an interstate pipeline’s tariff, could result in the imposition of civil and criminal penalties.
We could incur significant costs and liabilities in responding to contamination that occurs as a result of our operations.
There is inherent risk of incurring significant environmental costs and liabilities in the performance of our operations or in operations in which we own a working interest as a result of the handling of petroleum hydrocarbons and wastes, because of air emissions and wastewater discharges related to operations, and due to historical industry operations and waste disposal practices. Under certain environmental laws and regulations, we could be subject to strict, joint and several liabilities for the removal or remediation of previously released materials or property contamination. Private parties, including the owners of properties upon which our wells or the wells in which we own a working interest are drilled and facilities where our petroleum hydrocarbons or wastes are taken for reclamation or disposal, also may have the right to pursue legal actions to enforce compliance as well as to seek damages for non-compliance with environmental laws and regulations or for personal injury or property or natural resource damages. Changes in environmental laws and regulations occur frequently, and any changes that result in more stringent or costly well drilling, construction, completion or water management activities, or waste handling, storage, transport, disposal or cleanup requirements could require us to make significant expenditures to attain and maintain compliance and may otherwise have a material adverse effect on our own results of operations, competitive position or financial condition.
Technological changes could affect our operations.
The natural gas and oil industry is characterized by rapid and significant technological advancements and introductions of new products and services utilizing new technologies. As others use or develop new technologies, we may be placed at a competitive disadvantage, and competitive pressures may force us to implement such new technologies at substantial costs. In addition, many other natural gas and oil companies have greater financial, technical and personnel resources that may allow them to enjoy technological advantages and may in the future allow them to implement new technologies before we can. We may be unable to respond to such competitive pressures and implement such technologies on a timely basis or at an acceptable cost. If one or more of the technologies that we currently use or may implement in the future were to become obsolete or if we are unable to use the most advanced commercially available technology, it could have a material adverse effect on our financial condition, future cash flows and the results of operations.
We are subject to uncertainties in reserve estimates and future net cash flows.
This report contains estimates of our oil and gas reserves as of June 30, 2014 and the expected future net cash flows from those reserves, most of which have been prepared by an independent petroleum consultant. There are numerous uncertainties inherent in estimating quantities of reserves of oil and gas and in projecting future rates of production and the timing of development expenditures, including many factors beyond our control. The reserve estimates in this report are based on various assumptions, including, for example, constant oil and gas prices, operating expenses, capital expenditures and the availability of funds, and, therefore, are inherently imprecise indications of future net cash flows. Actual future production, cash flows, taxes, operating expenses, development expenditures and quantities of recoverable oil and gas reserves may vary substantially from those assumed in the estimates. Any significant variance in these assumptions could materially affect the estimated quantity and value of reserves set forth in this report. Additionally, our reserves may be subject to downward or upward revision based upon actual production performance, results of future development and exploration, prevailing oil and gas prices and other factors, many of which are beyond our control.
The present value of future net reserves discounted at 10% (the “PV-10”) of proved reserves referred to in this report should not be construed as the current market value of the estimated proved reserves of oil and gas attributable to our properties. In accordance with applicable requirements of the SEC, the estimated discounted future net cash flows from proved reserves are based on an average price as of the first day of
each month during the applicable 12 months. For oil volumes, the average West Texas Intermediate posted price of $96.75 per barrel is adjusted by field for quality, transportation fees, and a regional price differential. For gas volumes, the average Henry Hub spot price of $4.10 per MMBTU is adjusted by field for energy content, transportation fees, and a regional price differential. All prices are held constant throughout the lives of the properties. For the proved reserves, the average adjusted product prices weighted by production over the remaining lives of the properties are $97.51 per barrel of oil, $47.66 per barrel of NGL, and $4.01 per Mcf of gas. Actual future net cash flows also will be affected by: (i) the timing of both production and related expenses; (ii) changes in consumption levels; and (iii) governmental regulations or taxation. In addition, the calculation of the present value of the future net cash flows using a 10% discount as required by the SEC is not necessarily the most appropriate discount factor based on interest rates in effect from time to time and risks associated with our reserves or the oil and gas industry in general.
Derivatives contracts on our production may result in losses or prevent us from benefiting to the fullest extent possible from increases in prices for natural gas and oil.
In October 2013, we entered into New York Mercantile Exchange (“NYMEX”) futures contracts as derivatives on natural gas production and crude oil production, in the form of a Call Option Structured Derivative with a third party. This derivative limits our ability to benefit from increases in the prices of natural gas and oil.
If the counterparties to the derivative instruments we use to mitigate our business risks default or fail to perform, we may be exposed to risks we had sought to mitigate, which could materially adversely affect our financial condition and results of operations.
In October 2013, we began to use derivatives to mitigate our natural gas and oil price risk with counterparties. This is a more pronounced risk to us in view of the recent stresses suffered by financial institutions. We cannot provide assurance that our counterparties will honor their obligations now or in the future.
The enactment of the Dodd-Frank Act could have an adverse impact on our ability to hedge risks associated with our business.
Comprehensive financial reform legislation, known as the Dodd-Frank Wall Street Reform and Consumer Protection Act (the “Dodd-Frank Act”), was enacted that establishes federal oversight and regulation of the over-the-counter derivatives market and entities, including us, that participate in that market. The Dodd-Frank Act requires the CFTC, the SEC and other regulators to promulgate rules and regulations implementing the new legislation. In its rulemaking under the Dodd-Frank Act the CFTC has issued final regulations to set position limits for certain futures and option contracts in the major energy markets and for swaps that are their economic equivalents. Certain bona fide hedging transactions would be exempt from these position limits. The position limits rule was vacated by the United States District Court for the District of Colombia in September 2012. In response, the CFTC adopted rules and dismissed its appeal of the District Court’s decision. The CFTC also has finalized other regulations, including critical rulemakings on the definition of “swap”, “security-based swap”, “swap dealer” and “major swap participant”. The Dodd-Frank Act and CFTC rules also may require us in connection with certain derivatives activities to comply with clearing and trade-execution requirements (or take steps to qualify for an exemption to such requirements). In addition, new regulations may require us to comply with margin requirements although these regulations are not finalized and their application to us is uncertain at this time. Other regulations also remain to be finalized, and the CFTC recently has delayed the compliance dates for various regulations already finalized. As a result, it is not possible at this time to predict with certainty the full effects of the Dodd-Frank Act and CFTC rules on us and the timing of such effects. The Dodd-Frank Act also may require the counterparties to our derivative instruments to spin off some of their derivatives activities to a separate entity, which may not be as creditworthy as the current counterparty.
The Dodd-Frank Act and any new regulations could significantly increase the cost of derivatives contracts (including from swap recordkeeping and reporting requirements and through requirements to post collateral
which could adversely affect our available liquidity), materially alter the terms of derivatives contracts, reduce the availability of derivatives to protect against risks we encounter, reduce our ability to monetize or restructure our existing derivatives contracts, and increase our exposure to less creditworthy counterparties. If we reduce our use of derivatives as a result of the Dodd-Frank Act and regulations, our results of operations may become more volatile and our cash flows may be less predictable, which could adversely affect our ability to plan for and fund capital expenditures. Finally, the Dodd-Frank Act was intended, in part, to reduce the volatility of oil and natural gas prices, which some legislators attributed to speculative trading in derivatives and commodity instruments related to oil and natural gas. Our revenues could therefore be adversely affected if a consequence of the Dodd-Frank Act and regulations is to lower commodity prices. Any of these consequences could have a material adverse effect on us, our financial condition, and our results of operations.
We are subject to various operating and other casualty risks that could result in liability exposure or the loss of production and revenues.
Our oil and gas business involves a variety of operating risks, including, but not limited to, unexpected formations or pressures, uncontrollable flows of oil, gas, brine or well fluids into the environment (including groundwater contamination), blowouts, fires, explosions, pollution and other risks, any of which could result in personal injuries, loss of life, damage to properties and substantial losses. Although we carry insurance at levels that we believe are reasonable, we are not fully insured against all risks. We do not carry business interruption insurance. Losses and liabilities arising from uninsured or under-insured events could have a material adverse effect on our financial condition and operations.
From time to time, due primarily to contract terms, pipeline interruptions or weather conditions, the producing wells in which we own an interest have been subject to production curtailments. The curtailments range from production being partially restricted to wells being completely shut-in. The duration of curtailments varies from a few days to several months. In most cases, we are provided only limited notice as to when production will be curtailed and the duration of such curtailments.
We cannot control the development of the properties we own but do not operate, which may adversely affect our production, revenues and results of operations.
As of June 30, 2014, non-affiliated third parties operated wells that represented approximately 34% of our total proved reserves as of that date. As a result, the success and timing of our drilling and development activities on those properties depend upon a number of factors outside of our control, including:
· the timing and amount of capital expenditures;
· the operators’ expertise and financial resources;
· the approval of other participants in drilling wells; and
· the selection of suitable technology.
If drilling and development activities are not conducted on our properties or are not conducted on a timely basis, we may be unable to increase our production or offset normal production declines, which may adversely affect our production, revenues and results of operations.
Our business may suffer if we lose key personnel.
We depend to a large extent on the services of Calvin A. Wallen, III, our President, Chairman of the Board, and Chief Executive Officer. The loss of the services of Mr. Wallen would have a material adverse effect on our operations.
Certain of our affiliates control a majority of the voting power of our securities, which may affect other stockholders’ ability to influence matters submitted to a vote of stockholders.
As of November 4, 2014, Mr. Wallen and the Investors, collectively, control over 70% of the voting power with respect to matters submitted to the holders of the Common Stock. As a result, they have the ability to control much of our business affairs, including the ability to control the election of directors and results of voting on all matters requiring stockholder approval. The Investors and Mr. Wallen can effectively prevent a change of control of the Company and determine the outcome of all matters submitted to the Company’s shareholders.
Certain of our affiliates have engaged in business transactions with us, which may result in conflicts of interest.
Certain officers, directors and related parties, including entities controlled by Mr. Wallen, have engaged in business transactions with us which were not the result of arm’s length negotiations between independent parties. Our management believes that the terms of these transactions were as favorable to us as those that could have been obtained from unaffiliated parties under similar circumstances. All future transactions between us and our affiliates will be on terms no less favorable than could be obtained from unaffiliated third parties and will be approved by a majority of the independent members of our Board of Directors.
The liquidity, market price and volume of our stock are volatile.
The trading price of our Common Stock could be subject to wide fluctuations in response to quarter-to-quarter variations in our operating results, announcements of our drilling results and other events or factors. In addition, the U.S. stock markets have from time to time experienced extreme price and volume fluctuations that have affected the market price for many companies and which often have been unrelated to the operating performance of these companies. These broad market fluctuations may adversely affect the market price of our securities. Currently, our Common Stock is traded on the OTCQB, the mid-tier on the OTC Markets, which is not a nationally recognized exchange.
We may experience adverse consequences because of required indemnification of officers and directors.
Provisions of our Certificate of Formation and Bylaws provide that we will indemnify any director and officer as to liabilities incurred in their capacity as a director or officer and on those terms and conditions set forth therein to the fullest extent of Texas law. Further, we may purchase and maintain insurance on behalf of any such persons whether or not we would have the power to indemnify such person against the liability insured against. The foregoing could result in substantial expenditures by us and prevent any recovery from our officers, directors, agents and employees for losses incurred by us as a result of their actions.
Certain anti-takeover provisions may discourage a change in control.
Provisions of Texas law and our Certificate of Formation and Bylaws may have the effect of delaying or preventing a change in control or acquisition of the Company. Our Certificate of Formation and Bylaws include “blank check” preferred stock (the terms of which may be fixed by our Board of Directors without stockholder approval), and certain procedural requirements governing stockholder meetings. These provisions could have the effect of delaying or preventing a change in control of the Company. As a result of the Voting Agreement, the Investors and Mr. Wallen control all votes of shareholders, and can effectively prevent a change of control.
We do not intend to declare cash dividends on our Common Stock in the foreseeable future.
Our Board of Directors presently intends to retain all of our earnings, if any, for the repayment of debt, the payment of dividends on our preferred stock and the expansion of our business. We therefore do not anticipate the distribution of cash dividends on our Common Stock in the foreseeable future. Any future
decision of our Board of Directors to pay cash dividends on our Common Stock will depend, among other factors, upon our earnings, financial position and cash requirements.
Our internal controls over financial reporting were deemed not effective, which could have a significant and adverse effect on our business.
Section 404 of the Sarbanes-Oxley Act of 2002 and the related rules and regulations of the SEC, which we collectively refer to as “Section 404,” require us to evaluate our internal controls over financial reporting to allow management to report on those internal controls as of the end of each year. Effective internal controls are necessary for us to produce reliable financial reports and are important in our effort to prevent financial fraud. In the course of our Section 404 evaluations, we may identify conditions that may result in significant deficiencies or material weaknesses and we may conclude that enhancements, modifications or changes to our internal controls are necessary or desirable. Implementing any such matters would divert the attention of our management, could involve significant costs, and may negatively impact our results of operations.
In September and October 2014, we identified material weaknesses in our internal controls over financial reporting in connection with our (i) financial reporting and disclosure process (ii) accounting for asset retirement obligations and (iii) accounting for certain complex accounting transactions. The first material weakness, our financial reporting and disclosure process, resulted in additional disclosures and amendments to our quarterly reports for the quarterly periods ended September 30, 2013, December 31, 2013 and March 31, 2014 necessary to present the financial statements in accordance with accounting principles generally accepted in the United States. The second material weakness, accounting for asset retirement obligations (ARO), resulted in our inappropriate estimation of the ARO related to the properties acquired in our acquisitions in fiscal 2014. Our third material weakness, our accounting for certain complex accounting transactions, resulted in an incorrect accounting treatment related to the warrants that were issued together with the Notes. The warrants contained ‘full-ratchet’ anti-dilution adjustment provisions that were not properly accounted for. Additionally, certain warrants that were re-priced in 2013 and 2014 also contained certain anti-dilution provisions that were not accounted for correctly since their issuance date. Finally, we did not apply the proper accounting for the exchanges of certain related party debt and equity instruments in transactions that were deemed equity contributions. As a result of these material weaknesses, the Company will amend its September 30, 2013, December 31, 2013 and March 31, 2014 Forms 10-Q.
We note that there are inherent limitations on the effectiveness of internal controls, as they cannot prevent collusion, management override or failure of human judgment. If we fail to remediate the foregoing material weaknesses or otherwise fail to maintain an effective system of internal controls or if management or our independent registered public accounting firm were to discover additional material weaknesses in our internal controls, we may be unable to produce reliable financial reports or prevent fraud, and it could harm our financial condition and results of operations, result in a loss of investor confidence and negatively impact our share price.
We may not have satisfactory title or rights to all of our current or future properties.
Prior to acquiring undeveloped properties, our contract land professionals review title records or other title review materials relating to substantially all of such properties. The title investigation performed by us prior to acquiring undeveloped properties is thorough, but less rigorous than that conducted prior to drilling, consistent with industry standards. Prior to drilling, we obtain a title opinion on the drill site. However, a title opinion does not necessarily ensure satisfactory title. We believe we have satisfactory title to our producing properties in accordance with standards generally accepted in the oil and gas industry. Our properties are subject to customary royalty interests, liens incident to operating agreements, liens for current taxes and other burdens, which we believe do not materially interfere with the use of or affect the value of such properties. In the normal course of our business, title defects and lease issues of varying degrees arise, and, if practicable, reasonable efforts are made to cure such defects and issues.
At June 30, 2014, we believe that our leaseholds for all of our net acreage in Louisiana were being kept in force by virtue of production in paying quantities, and 40% of our leaseholds in Leon and Robertson Counties, Texas are in force by virtue of production in paying quantities. The legal climate in Northwest Louisiana and Texas has become increasingly hostile and litigious towards oil and gas companies. Many mineral owners are seeking opportunities to make additional money from their minerals rights, including pursuit of claims of lease expiration by asserting that production does not exist in paying quantities. We are a defendant in a lawsuit brought by a mineral owner in Northwest Louisiana alleging, among other things, that
all or part of our mineral lease lapsed. If the outcome of this lawsuit were to be determined entirely in favor of the mineral owner, our total acreage position, as of June 30, 2014, could decrease by a maximum of 4%. We are vigorously defending our position in this lawsuit.
Governmental regulations could adversely affect our business.
Our business is subject to certain federal, state and local laws and regulations on taxation, the exploration for and development, production and marketing of oil and natural gas, and environmental and safety matters. Many laws and regulations require drilling permits and govern the spacing of wells, rates of production, prevention of waste and other matters. These laws and regulations have increased the costs of our operations. In addition, these laws and regulations, and any others that are passed by the jurisdictions where we have production, could limit the total number of wells drilled or the allowable production from successful wells, which could limit our revenues. Laws and regulations relating to our business frequently change, and future laws and regulations, including changes to existing laws and regulations, could adversely affect our business.
In particular and without limiting the foregoing, various tax proposals currently under consideration could result in an increase and acceleration of the payment of federal income taxes assessed against independent oil and natural gas producers, for example by eliminating the ability to expense intangible drilling costs, removing the percentage depletion allowance and increasing the amortization period for geological and geophysical expenses. Any of these changes would increase our tax burden.
The States of Texas and Louisiana and many other states require permits for drilling operations, drilling bonds and reports concerning operations and impose other requirements relating to the exploration for and production of oil and gas. Such states also have statutes or regulations addressing conservation matters, including provisions for the unitization or pooling of oil and gas properties, the establishment of maximum rates of production from wells and the regulation of spacing, plugging and abandonment of such wells. The statutes and regulations of these states limit the rate at which oil and gas can be produced from our properties. However, we do not believe we will be affected materially differently by these statutes and regulations than any other similarly situated oil and gas company.
Environmental liabilities could adversely affect our business.
In the event of a release of oil, natural gas or other pollutants from our operations into the environment, we could incur liability for any and all consequences of such release, including personal injuries, property damage, cleanup costs and governmental fines. We could potentially discharge these materials into the environment in several ways, including:
· from a well or drilling equipment at a drill site;
· leakage from gathering systems, pipelines, transportation facilities and storage tanks;
· damage to oil and natural gas wells resulting from accidents during normal operations; and
· blowouts, cratering and explosions.
In addition, because we may acquire interests in properties that have been operated in the past by others, we may be liable for environmental damage, including historical contamination, caused by such former operators. Additional liabilities could also arise from continuing violations or contamination that we have not yet discovered relating to the acquired properties or any of our other properties.
To the extent we incur any environmental liabilities, it could adversely affect our results of operations or financial condition.
Our operations are subject to environmental and occupational health and safety laws and regulations that may expose us to significant costs and liabilities.
Our oil and natural gas exploration and production operations are subject to stringent and complex federal, regional, state and local laws and regulations governing the discharge of materials into the environment, health and safety aspects of our operations, or otherwise relating to environmental protection. These laws and regulations may impose numerous obligations applicable to our operations including the acquisition of permits, including drilling permits, before conducting regulated activities; the restriction of types, quantities and concentration of materials that can be released into the environment; limit or prohibit drilling activities on certain lands lying within wilderness, wetlands and other protected areas, the application of specific health and safety criteria addressing worker protection; and the imposition of substantial liabilities for pollution resulting from our operations. Failure to comply with these laws and regulations may result in the assessment of sanctions, including administrative, civil or criminal penalties, the imposition of investigatory or remedial obligations, and the issuance of orders limiting or prohibiting some or all of our operations.
There is inherent risk of incurring significant environmental costs and liabilities in the performance of our operations as a result of our handling of petroleum hydrocarbons and wastes, because of air emissions and wastewater discharges related to our operations, and as a result of historical industry operations and waste disposal practices. Under certain environmental laws and regulations, we could be subject to strict, joint and several liabilities for the removal or remediation of previously released materials or property contamination. Private parties, including the owners of properties upon which our wells are drilled and facilities where our petroleum hydrocarbons or wastes are taken for reclamation or disposal, also may have the right to pursue legal actions to enforce compliance as well as to seek damages for non-compliance with environmental laws and regulations or for personal injury or property or natural resource damages. Changes in environmental laws and regulations occur frequently; for example, a number of state and regional legal initiatives have emerged in recent years that seek to reduce GHG emissions and the EPA, based on its findings that emissions of GHGs present a danger to public health and the environment, has adopted regulations under existing provisions of the federal Clean Air Act that, among other things, restrict emissions of GHGs and require the monitoring and reporting of GHG emissions from specified onshore and offshore production sources in the United States on an annual basis, which includes certain of our operations. Any changes in legal requirements that restrict emissions or releases of GHGs or other pollutants or result in more stringent or costly well drilling, construction, completion or water management activities, or waste control, handling, storage, transport, disposal or cleanup requirements could require us to make significant expenditures to attain and maintain compliance, may reduce demand for the oil and gas we produce and may otherwise have a material adverse effect on our own results of operations, competitive position or financial condition. We may not be able to recover some or any of these costs from insurance.
Horizontal drilling activities could be subject to increased regulation and could expose us to environmental risks that could adversely affect us.
Legislation relating to horizontal drilling activities that could impose new permitting disclosure or other environmental restrictions or obligations on our operations is currently being considered at the federal level, and may in the future be considered at the state or local level. In particular, the U.S. Congress recently signaled a renewed interest in certain downhole injection activities, some of which we utilize in our operations. The focus may lead to new legislation or regulations that could affect our operations. Any additional requirements or restrictions on our operations could result in delays, increased operating costs or a requirement to change or eliminate certain drilling and injection activities in a manner that may materially adversely affect us. In addition, because horizontal drilling involves fracture stimulation through the injection of water, sand and chemicals under pressure into rock formations to stimulate natural gas production, it is also possible that our drilling and the fracturing process could adversely affect the environment, which could result in a requirement to perform investigations or clean-ups or in the incurrence of other unexpected material costs or liabilities.
We may be responsible for additional costs in connection with abandonment of properties.
We are responsible for payment of plugging and abandonment costs on our oil and gas properties pro rata to our working interest. Based on our experience, we anticipate that the ultimate aggregate salvage value of lease and well equipment located on our properties will exceed the costs of abandoning such properties. There can be no assurance, however, that we will be successful in avoiding additional expenses in connection with the abandonment of any of our properties. In addition, abandonment costs and their timing may change due to many factors, including actual production results, inflation rates and changes in environmental laws and regulations.
Our stock is categorized as a penny stock. Trading of our stock may be restricted by the SEC’s penny stock regulations which may limit a stockholder’s ability to buy and sell our stock.
Our stock is categorized as a “penny stock”. The SEC has adopted Rule 15g-9 which generally defines “penny stock” to be any equity security that has a market price (as defined) less than $5.00 per share or an exercise price of less than $5.00 per share, subject to certain exceptions. Our securities are covered by the penny stock rules, which impose additional sales practice requirements on broker-dealers who sell to persons other than established customers and accredited investors. The penny stock rules require a broker-dealer, prior to a transaction in a penny stock not otherwise exempt from the rules, to deliver a standardized risk disclosure document in a form prepared by the SEC which provides information about penny stocks and the nature and level of risks in the penny stock market. The broker-dealer also must provide the customer with current bid and offer quotations for the penny stock, the compensation of the broker-dealer and its salesperson in the transaction and monthly account statements showing the market value of each penny stock held in the customer’s account. The bid and offer quotations, and the broker-dealer and salesperson compensation information, must be given to the customer orally or in writing prior to effecting the transaction and must be given to the customer in writing before or with the customer’s confirmation. In addition, the penny stock rules require that prior to a transaction in a penny stock not otherwise exempt from these rules, the broker-dealer must make a special written determination that the penny stock is a suitable investment for the purchaser and receive the purchaser’s written agreement to the transaction. These disclosure requirements may have the effect of reducing the level of trading activity in the secondary market for the stock that is subject to these penny stock rules. Consequently, these penny stock rules may affect the ability of broker-dealers to trade our securities. We believe that the penny stock rules discourage investor interest in and limit the marketability of our Common Stock.
FINRA sales practice requirements may also limit a stockholder’s ability to buy and sell our stock.
In addition to the “penny stock” rules described above, the Financial Industry Regulatory Authority (“FINRA”) has adopted rules that require that in recommending an investment to a customer, a broker-dealer must have reasonable grounds for believing that the investment is suitable for that customer. Prior to recommending speculative low priced securities to their non-institutional customers, broker-dealers must make reasonable efforts to obtain information about the customer’s financial status, tax status, investment objectives and other information. Under interpretations of these rules, FINRA believes that there is a high probability that speculative low priced securities will not be suitable for at least some customers. The FINRA requirements make it more difficult for broker-dealers to recommend that their customers buy our Common Stock, which may limit your ability to buy and sell our stock and have an adverse effect on the market for our shares.
Item 1B. Unresolved Staff Comments.
None.
A description of our properties as of June 30, 2014 is included in “Part I. Item 1. Business” and is incorporated herein by reference.
We are party to lawsuits arising in the normal course of business. We intend to defend these actions vigorously and believe, based on currently available information, that adverse results or judgments from such actions, if any, will not be material to our financial position or results of operations. The legal climate in Northwest Louisiana is hostile and litigious towards oil and gas companies; and the legal environment in East Texas is becoming increasingly competitive and hostile. Mineral owners are seeking opportunities to make additional money from their mineral rights, including pursuit of claims of lease expiration by asserting that production does not exist in paying quantities. In the normal course of our business, title defects and lease issues of varying degrees will arise, and, if practicable, reasonable efforts will be made to cure any such defects and issues.
A lawsuit was filed on or about June 15, 2010, styled, “Gloria’s Ranch, LLC v. Tauren Exploration, Inc., Cubic Energy, Inc., Wells Fargo Energy Capital, Inc. (“WFEC”) & EXCO USA Asset, LLC”, filed in the 1st Judicial District Court, Caddo Parish, Louisiana, Cause No. 541-768, A. This lawsuit alleges that all or part of the Gloria’s Ranch mineral lease has lapsed, and seeks a finding that the mineral lease has lapsed, damages, attorney fees, and other equitable relief. This lawsuit would have a material effect, with the lost acreage component having an estimated value of up to $9,100,000, if ultimately adjudicated entirely in favor of the mineral owner. The Company intends to vigorously defend its position and believes it will prevail regarding some, if not all, of the acreage at issue in this lawsuit.
Item 4. Mine Safety Disclosures.
None
Item 5. Market for Registrant’s Common Equity, Related Stockholder Matters and Issuer Purchases of Equity Securities
Common Stock and Market
During fiscal 2013, the Common Stock of the Company traded on the NYSE-MKT under the trading symbol “QBC”. On July 17, 2013, after the beginning of fiscal 2014, the Company’s Common Stock began being quoted on the OTCQB under the symbol “CBNR”. At November 4, 2014, there were 77,505,908 shares of Common Stock outstanding held by approximately 770 stockholders of record.
Under its Amended and Restated Certificate of Formation, the Company is authorized to issue one class of up to 400,000,000 common shares, par value $0.05 per share, and one class of up to 10,000,000 preferred shares, par value $0.01 per share. As of June 30, 2014 there were 16,928.047 shares of Series B Convertible Preferred Stock issued and outstanding and 98,751.823 shares of Series C Redeemable Voting Preferred Stock issued and outstanding. No shares of the Company’s Series A Preferred Stock remained outstanding, and such series was cancelled in February 2014.
Common Stock Price Range
The following table shows, for the periods indicated, the range of high and low sales price information for our Common Stock on the NYSE-MKT during fiscal 2013 and quoted on the OTCQB beginning in July 2014. Any market for our Common Stock should be considered sporadic, illiquid and highly volatile. Our Common Stock’s trading range during the periods indicated was as follows:
|
Fiscal Year 2013 |
|
High |
|
Low |
| ||
|
1st Quarter |
|
$ |
0.40 |
|
$ |
0.19 |
|
|
2nd Quarter |
|
$ |
0.39 |
|
$ |
0.14 |
|
|
3rd Quarter |
|
$ |
0.33 |
|
$ |
0.16 |
|
|
4th Quarter |
|
$ |
0.34 |
|
$ |
0.22 |
|
|
Fiscal Year 2014 |
|
High |
|
Low |
| ||
|
1st Quarter |
|
$ |
0.34 |
|
$ |
0.20 |
|
|
2nd Quarter |
|
$ |
0.44 |
|
$ |
0.27 |
|
|
3rd Quarter |
|
$ |
0.28 |
|
$ |
0.19 |
|
|
4th Quarter |
|
$ |
0.25 |
|
$ |
0.17 |
|
Changes in Securities, Use of Proceeds and Issuer Purchases of Equity Securities
During fiscal 2014, the Company did not sell any of its equity securities that were not registered under the Securities Act of 1933, other than the Notes, the Class A Warrants, the Class B Warrants, the Series B Convertible Preferred Stock and the Series C Convertible Preferred Stock. See “Item 1. Business — History.”
We did not purchase any of our equity securities during the fourth quarter of fiscal 2014.
Stockholder Return Performance Graph
The following graph compares the cumulative total stockholder return on our Common Stock during the five years ended June 30, 2014 with the cumulative total stockholder return of the Russell 2000 Index and a peer group of 14 oil and gas exploration and production companies comprised of us and Abraxas Petroleum Corporation, Magnum Hunter Resources Corporation, Chesapeake Energy Corporation, Goodrich Petroleum Corporation, Northern Oil & Gas Inc., Comstock Resources Inc., EXCO Resources Inc., Penn Virginia Corporation, Quicksilver Resources Inc., Range Resources Corporation, Southwestern Energy Company, Royale Energy, Inc., and SM Energy Company (collectively referred to as the “Peer Group Index”). The comparison assumes an investment of $100 on June 30, 2009 in each of our Common Stock, the Russell 2000 Index and the Peer Group Index.
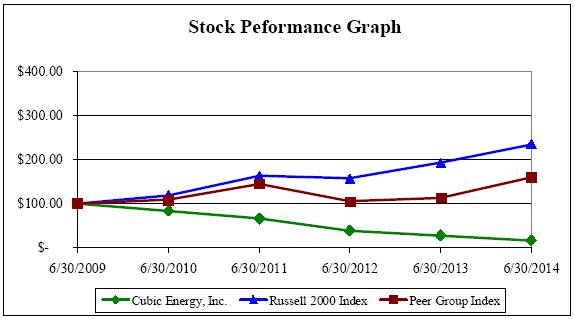
|
|
|
6/30/2009 |
|
6/30/2010 |
|
6/30/2011 |
|
6/30/2012 |
|
6/30/2013 |
|
6/30/2014 |
| ||||||
|
Cubic Energy, Inc. |
|
$ |
100.00 |
|
$ |
83.33 |
|
$ |
65.74 |
|
$ |
38.89 |
|
$ |
27.78 |
|
$ |
16.67 |
|
|
Russell 2000 Index |
|
$ |
100.00 |
|
$ |
118.93 |
|
$ |
162.79 |
|
$ |
157.10 |
|
$ |
192.31 |
|
$ |
234.71 |
|
|
Peer Group Index |
|
$ |
100.00 |
|
$ |
108.66 |
|
$ |
144.93 |
|
$ |
104.84 |
|
$ |
113.50 |
|
$ |
159.83 |
|
Dividend Policy
We have neither declared nor paid any dividends on our Common Stock since our inception. Presently, we intend to retain our earnings, if any, to provide funds for expansion of our business. Therefore, we do not anticipate declaring or paying cash dividends on our Common Stock in the foreseeable future. Any future dividends on our Common Stock will be subject to the discretion of our Board of Directors and will depend upon, among other things, future earnings, our operating and financial condition, our capital requirements, debt obligation agreements, general business conditions and other pertinent factors. Moreover, the terms of the Note Purchase Agreement prohibit the payment of dividends on our Common Stock.
Securities Authorized for Issuance under Equity Compensation Plans
The following table provides information as of June 30, 2014 with respect to compensation plans (including individual compensation arrangements) under which equity securities of the registrant are authorized for issuance:
|
|
|
Number of |
|
Weighted |
|
|
| |
|
|
|
securities to be |
|
average |
|
Number of shares |
| |
|
|
|
issued upon |
|
exercise price |
|
of common stock |
| |
|
|
|
exercise of |
|
of outstanding |
|
remaining available |
| |
|
|
|
outstanding |
|
options, |
|
for future issuance |
| |
|
|
|
options, warrants |
|
warrants and |
|
under equity |
| |
|
|
|
and rights |
|
rights |
|
compensation plans |
| |
|
2005 Stock Option Plan approved by shareholders |
|
288,667 |
|
$ |
1.20 |
|
1,290,805 |
|
|
Total |
|
288,667 |
|
|
|
1,290,805 |
| |
Item 6. Selected Financial Data.
Not applicable
Item 7. Management’s Discussion and Analysis of Financial Condition and Results of Operations.
The following discussion and analysis of our financial condition and results of operations should be read in conjunction with our financial statements and the related notes to those statements included elsewhere in this Annual Report on Form 10-K. In addition to historical financial information, the following discussion and analysis contains forward-looking statements that involve risks, uncertainties and assumptions. Our results and the timing of selected events may differ materially from those anticipated in these forward-looking statements as a result of many factors, including those discussed under “risk factors” and elsewhere in this Annual Report on Form 10-K.
Overview and Going Concern
Cubic Energy, Inc. is an independent upstream energy company engaged in the development and production of, and exploration for, crude oil and natural gas. Our oil and gas assets and activities are concentrated exclusively in Louisiana and Texas.
Our corporate strategy with respect to our asset acquisition and development efforts was to position the Company in a low risk opportunity while building main stream high yield reserves. The acquisition of our Cotton Valley acreage in DeSoto and Caddo Parishes, Louisiana, put us in a reservoir rich environment both in the Cotton Valley and Bossier/Haynesville Shale formations, and gives us the potential to discover additional commercial horizons that can add value to the bottom line. We have had success on our acreage with wells drilled by achieving production from not only the Cotton Valley and Bossier/Haynesville Shale formations, but also the Hosston formation.
We believe that our East Texas assets, along with our Louisiana assets, provide lower risk development and high yield opportunities.
As of June 30, 2014, we had cash in the amount of $6,857,970 and total liabilities in the amount of $126,654,909. We also had a working capital deficit of $72,997,802 and an accumulated deficit of $78,052,931. Additionally, we are currently subject to a forbearance agreement in relation to the Note Purchase Agreement which requires us to, among others, enter into a definitive agreement with respect to a Strategic Transaction by October 17, 2014. The holders of the Notes have the ability to require the terms of the Strategic Transaction to permit us to repay all amounts owing to the holders of the Notes. We continue to explore alternatives with respect to a Strategic Transaction, although we did not enter into a definitive agreement by October 17, 2014. We are in discussions with the holders of the Notes with respect to available alternatives. Unless the requirement regarding a Strategic Transaction is waived, or we obtain an extension of time, the holders of the Notes could declare a default under the Note Purchase Agreement, accelerate the indebtedness represented by the Notes and exercise all other remedies available to them, including foreclosing on our assets.
We believe we have complied with the other terms of the forbearance agreement; however, there can be no assurance that we will be successful in consummating a Strategic Transaction within the mandated time period.
STRATEGY
As of June 30, 2014, our strategy with respect to our domestic exploration program seeks to maintain a balanced portfolio of drilling opportunities that range from lower risk, field extension wells to the smaller scale pursuit of Company appropriate higher risk, high reserve potential prospects.
Our recent acquisition of East Texas Basin assets is at the core of our current strategy, which we believe provides lower risk development opportunities and high yield opportunities. The Company is exploring acquiring additional properties with this same development profile.
Additionally, our focus is on exploration opportunities that can benefit from advanced technologies, including 3-D seismic, designed to reduce risks and increase success rates. We develop prospects in-house with an affiliate and through strategic alliances with exploration companies that have expertise in specific target areas. In addition, we evaluate externally generated prospects and look to participate in certain of these opportunities to enhance our portfolio.
We are currently focusing our domestic exploration activities to develop and re-enter existing well bores, and re-complete existing well bores with respect to our recently acquired East Texas Basin assets; as well as developing our recently augmented leasehold interests in Louisiana. East Texas Basin prospects have been developed from the top of the Cretaceous formation all the way to the bottom of the Deep Bossier Shale. The various Cretaceous zones all have strong oil and liquids component that we believe will help the Company achieve its transition away from dry natural gas. The high production of dry natural gas from the various Bossier sands have the opportunity to provide the Company an increase in short term cash flow, with reasonable out-of-pocket expenditures, even at current commodity prices, through the re-recompletion and work over of existing wells. Prospects in our Louisiana leaseholds are focused on the Cotton Valley and the Haynesville Shale, but also include the Hosston; Gloyd; Pettet; Glen Rose and Paluxy.
The Company’s future results of operations and growth are substantially dependent upon (i) its ability to work with the holders of the Notes in order to obtain additional time within which to consummate a Strategic Transaction, (ii) its ability to acquire or find new oil and gas properties, or successfully develop existing oil and gas properties, and (iii) the prevailing prices for oil and gas. Numerous locations have been identified by third-party operators for additional drilling. If we are unable to economically complete additional producing wells, the Company’s oil and gas production, and its revenues, would likely decline rapidly as its reserves are depleted. In addition, oil and gas prices are dependent upon numerous factors beyond the Company’s control, such as economic, political, governmental, environmental and regulatory developments, as well as competition from other sources of energy. The oil and gas markets have historically been very volatile, and any further significant or extended decline in the price of gas would have a material adverse effect on the Company’s financial condition and results of operations, and could result in a further reduction in the carrying value of the Company’s proved reserves and adversely affect its access to capital.
Summary Operating, Reserve and Other Data
The following table presents an unaudited summary of certain operating and oil and natural gas reserve data, and non-GAAP financial data for the periods indicated:
|
|
|
Year ended June 30, |
| |||||||
|
|
|
2014 |
|
2013 |
|
2012 |
| |||
|
Operating Data: |
|
|
|
|
|
|
| |||
|
Proved Reserves (Bcfe) |
|
135.1 |
|
45.2 |
|
33.8 |
| |||
|
Production (Mcfe) |
|
4,121,417 |
|
1,161,802 |
|
2,258,577 |
| |||
|
Producing wells at end of period, gross |
|
97 |
|
64 |
|
60 |
| |||
|
Producing wells at end of period, net |
|
53.25 |
|
31.41 |
|
13.52 |
| |||
|
Acreage, gross |
|
53,225 |
|
13,123 |
|
13,123 |
| |||
|
Acreage, net |
|
31,692 |
|
5,100 |
|
5,100 |
| |||
|
|
|
|
|
|
|
|
| |||
|
Production: |
|
|
|
|
|
|
| |||
|
Oil (Bbl) |
|
10,231 |
|
863 |
|
1,100 |
| |||
|
Natural gas (Mcf) |
|
4,044,085 |
|
1,141,474 |
|
2,244,315 |
| |||
|
Natural gas liquids (Bbl) |
|
2,658 |
|
2,525 |
|
1,277 |
| |||
|
Total oil, gas and liquids (Mcfe) |
|
4,121,418 |
|
1,161,802 |
|
2,258,577 |
| |||
|
Average daily (Mcfe) |
|
11,292 |
|
3,183 |
|
6,188 |
| |||
|
|
|
|
|
|
|
|
| |||
|
Weighted Average Sales Prices: |
|
|
|
|
|
|
| |||
|
Oil (per Bbl) |
|
$ |
95.58 |
|
$ |
90.00 |
|
$ |
93.25 |
|
|
Natural gas (per Mcf) |
|
$ |
3.65 |
|
$ |
3.21 |
|
$ |
3.01 |
|
|
Natural gas liquids (per Bbl) |
|
$ |
45.78 |
|
$ |
41.16 |
|
$ |
66.78 |
|
|
Natural gas equivalent (per Mcfe) |
|
$ |
0.93 |
|
$ |
3.31 |
|
$ |
3.07 |
|
|
|
|
|
|
|
|
|
| |||
|
Selected Expenses per Mcfe: |
|
|
|
|
|
|
| |||
|
Production costs |
|
$ |
0.71 |
|
$ |
0.65 |
|
$ |
0.43 |
|
|
Workover expenses (non-recurring) |
|
$ |
0.18 |
|
$ |
0.04 |
|
$ |
0.07 |
|
|
Severance taxes |
|
$ |
— |
|
$ |
0.16 |
|
$ |
(0.06 |
) |
|
Other revenue deductions |
|
$ |
1.30 |
|
$ |
0.76 |
|
$ |
0.43 |
|
|
Total lease operating expenses |
|
$ |
2.19 |
|
$ |
1.61 |
|
$ |
0.87 |
|
|
General and administrative expenses: |
|
|
|
|
|
|
| |||
|
Non-cash stock-based compensation |
|
$ |
0.05 |
|
$ |
0.05 |
|
$ |
0.10 |
|
|
Other general and administrative |
|
$ |
1.96 |
|
$ |
1.96 |
|
$ |
1.48 |
|
|
Total general and administrative |
|
$ |
2.01 |
|
$ |
2.01 |
|
$ |
1.58 |
|
|
Depreciation, depletion and amortization |
|
$ |
1.89 |
|
$ |
2.80 |
|
$ |
2.70 |
|
RESULTS OF OPERATIONS
Comparison of Fiscal 2014 to Fiscal 2013
Revenues
Oil and Gas Sales increased 312% to $15,849,482 for fiscal 2014 from $3,843,420 for fiscal 2013 primarily due to the increased number of producing oil and natural gas wells that were part of the acquisition of East Texas properties during fiscal 2014. Our total annual production increased 255% from 1,161,802 Mcfe to 4,121,417 Mcfe for the year ended June 30, 2014. The average price of oil was $95.58 per barrel and natural gas was $3.65 per Mcfe for fiscal 2014, as compared to $90.00 per barrel of oil and $3.21 per Mcfe of natural gas for fiscal 2013.
Costs and Expenses
Oil and Natural Gas Production and Operating Costs (also referred to as “Lease Operating Expenses” elsewhere herein) increased 381% to $9,002,020 (57% of oil and gas sales) for fiscal 2014 from $1,872,186 (49% of oil and gas sales) for fiscal 2013. This increase was primarily due to the increased number of producing oil and natural gas wells. Lease operating expenses increased by $7,335,763. This increase was partially offset by a decrease of $205,929 in production taxes, due to abatements in place at the time of our acquisitions for fiscal 2014 versus fiscal 2013.
Asset Retirement Obligation (“ARO”) increased by $339,954 due to the accretion of ARO on the acquired properties in fiscal 2014.
General and Administrative Expenses (“G&A”) increased 168% to $6,244,861 for fiscal 2014 from $2,332,946 for fiscal 2013. This increase of $3,911,915 was primarily due to an increase of $1,085,562 in salaries and benefits due largely to additional new hires and salary increases, an increase of $870,496 in legal fees, an increase of $259,656 in contracted professional services and an increase of $363,458 in consulting and management fees. The majority of the increases were directly related to the acquisitions during fiscal 2014.
Depreciation, Depletion And Amortization (“DD&A”) increased 140% to $7,790,112 in fiscal 2014 from $3,248,260 in fiscal 2013, primarily due to the new production from the acquired East Texas properties. Also contributing to that increase was a slight increase in the depletion percentage rate for fiscal 2014 of 2.96% versus 2.51% for fiscal 2013, which was primarily the result of an approximate 31.6 million Mcf increase to our reserves. The increase in depletion rate is a result of a revision in beginning reserves, full cost pool to deplete, accumulated depletion and annual production.
Derivatives Loss was $3,056,053 for the year ended June 30, 2014. There was no derivative gain or loss for the year ended June 30, 2013, as we had not engaged in any derivative transactions prior to fiscal 2014. The net derivative loss in fiscal 2014 was due to contract prices of $92 per barrel of oil and $3.90 per Mcf for natural gas generally being lower than the settlement prices.
Gain on Acquisition of $22,578,000 was recognized as a bargain purchase gain, as a result of incorporating the valuation information into the purchase price allocation. The Company’s assessment of the fair value of the properties acquired from Tauren, along with consideration of data prepared by a third party, resulted in a fair market valuation of $26,946,000. The acquisition price paid by the Company was $4,000,000 in cash and 2,000 shares of the Company’s Series B Convertible Preferred Stock with an aggregate stated value of $2,000,000 and a fair value of $368,000.
Interest Expense, Including Amortization Of Loan Discount increased 682% to $19,313,106 in fiscal 2014 from $2,470,516 in fiscal 2013. Our debt increased as a result of the financing for our acquisitions during fiscal 2014. We had total outstanding debt of $67,971,274 (net of discounts) at the end of fiscal 2014 and $29,865,110 at the end of fiscal 2013. As part of the refinancing of the Credit Facility with WFEC, the $5,000,000 convertible senior note was paid in full leaving a balance on the revolver of $20,865,110, the
discount for which was fully amortized at closing in October 2013. During fiscal 2014, the Company borrowed $4,015,826 for drilling and completion, which increased our debt outstanding with WFEC to $24,880,936 at the end of fiscal 2014. Also as part of the refinancing we borrowed $66,000,000 through the issuance of the Notes. The aggregate face amount of the Notes increased by $2,834,798, as a result of making certain interest payments through issuing additional notes, which create a total outstanding to the Lenders of $68,834,798 (before discounts).The discounts on the additional $4,015,826 and the $68,834,798 aggregate amount of the Notes are being amortized over the three-year term of the debt as additional interest expense. We reported $432,346 in the capitalization of interest expense to the full cost pool for oil and gas properties during fiscal 2014. There was no increase in the capitalization of interest expense during fiscal 2013.
Change in fair value of warrants liabilities of $17,120,692 was recognized for the year ended June 30, 2014. The fair value of warrants liability associated with the Company’s Class A and B warrants, which were issued in connection with the issuance of the Notes issued on October 2, 2013, decreased as of June 30, 2014, resulting in a gain of $18,102,734 for the year ended June 30, 2014. This gain was slightly offset by the out-of-period charge of $1,805,898 to record the fair value of warrants held by WFEC as of July 1, 2013, offset by a gain resulting from the warrants’ decrease in value during 2014, resulting in a net charge to income of $982,042 for the year ended June 30, 2014.
Net Income Attributable to Common Shareholders for the year ended June 30, 2014 was $7,704,135, compared to a net loss of $6,851,518 for the year ended June 30, 2013. The increase in our net income was primarily due to the gain on acquisition of assets and the change in fair value of warrants liability.
Financial condition, Liquidity and Capital Resources
Financial Condition
At June 30, 2014, we had a working capital deficit of $72,997,802, an increase from our working capital deficit of $30,191,399 as of June 30, 2013. The increase in our working capital deficit is primarily attributable to an increase in our borrowings which are classified as current due to our financial condition.
Additionally, we are currently subject to a forbearance agreement in relation to the Note Purchase Agreement which requires us to, among others, enter into a definitive agreement with respect to a Strategic Transaction by October 17, 2014. The holders of the Notes have the ability to require the terms of the Strategic Transaction to permit us to repay all amounts owing to the holders of the Notes. We continue to explore alternatives with respect to a Strategic Transaction, although we did not enter into a definitive agreement by October 17, 2014. We are in discussions with the holders of the Notes with respect to available alternatives. Unless the requirement regarding a Strategic Transaction is waived, or we obtain an extension of time, the holders of the Notes could declare a default under the Note Purchase Agreement, accelerate the indebtedness represented by the Notes and exercise all other remedies available to them, including foreclosing on our assets.
We believe we have complied with the other terms of the forbearance agreement; however, there can be no assurance that we will be successful in consummating a Strategic Transaction within the mandated time period.
Overview
Our primary resource is our oil and gas reserves. Our strategy with respect to our domestic exploration program seeks to maintain a balanced portfolio of drilling opportunities that range from lower risk, field extension wells to the smaller scale pursuit of Company appropriate higher risk, high reserve potential prospects.
Our recent acquisition of East Texas Basin assets is at the core of our current strategy, providing the lower risk development opportunities and high yield opportunities within the same property. We are exploring acquiring additional properties with this similar development profile.
Additionally, our focus is on exploration opportunities that can benefit from advanced technologies, including 3-D seismic, designed to reduce risks and increase success rates. We develop prospects in-house with an affiliate and through strategic alliances with exploration companies that have expertise in specific target areas. In addition, we evaluate externally generated prospects and look to participate in certain of these opportunities to enhance our portfolio.
We are currently focusing our domestic exploration activities to develop, re-enter, and re-complete existing well bores with respect to our recently acquired East Texas Basin assets, as well as developing our recently augmented leasehold interests in Louisiana. Our East Texas Basin prospects have been developed from the top of the Cretaceous formations all the way to the bottom of the Deep Bossier Shale. The various Cretaceous zones all have a strong oil and liquids component, which are helping us transition away from dry natural gas. The high production of dry natural gas from the various Bossier sands has provided us an increase in short term cash flow without substantial out-of-pocket expenditures, even at current commodity prices, through the re-recompletion and work over of existing wells. Prospects in our Louisiana leaseholds are focused on the Cotton Valley and the Haynesville Shale, but also include the Hosston; Gloyd; Pettet; Glen Rose and Paluxy.
Product prices, over which we have no control, have a significant impact on revenues from production and the value of such reserves and thereby on our borrowing capacity. Within the confines of product pricing, we seek to find and develop or acquire oil and gas reserves in a cost-effective manner in order to generate sufficient financial resources through internal means to finance our capital expenditure program.
Financing Transactions
In October 2013, we entered into the Note Purchase Agreement, pursuant to which we issued an aggregate of $66,000,000 of Notes due October 2, 2016, to certain purchasers. The aggregate face amount of the Notes increased by $2,834,798, as a result of making certain interest payments through issuing additional notes, which create a total outstanding to the Lenders of $68,834,798 (before discounts) at June 30, 2014. As part of the refinancing of the Credit Facility with WFEC, the $5,000,000 convertible senior note was paid in full leaving a balance on the revolver of $20,865,110, the discount for which was fully amortized at closing in October 2013. That debt is reflected in a term loan bearing interest at the Wells Fargo Bank prime rate, plus 2%, per annum. As part of the Credit Agreement, WFEC is providing a revolving credit facility in the amount of up to $10,000,000, bearing interest at the same rate, with all advances under that revolving credit facility to be made in the sole discretion of WFEC. During fiscal 2014, the Company borrowed $4,015,826 for drilling and completion, which increased our debt outstanding with WFEC to $24,880,936 at the end of fiscal 2014. In the event that Cubic Louisiana does not have available cash to pay interest on the Credit Facility, accrued and unpaid interest will be paid in kind via an additional promissory note. We are currently paying cash quarterly interest payments on the Credit Facility, at the Wells Fargo Bank prime rate, plus 2%.
We also entered into an arrangement with a third party that resulted in the receipt of an upfront payment at closing of approximately $35,000,000, through the sale of calls, which upfront payment approximated fair value of the calls sold at inception. As a result, the Call Option Structured Derivative arrangement was initially recognized and measured at the amount of its upfront payment. Under the terms of the Call Option Structured Derivative arrangement, Cubic Asset sold calls to the third party covering (i) approximately 556,000 barrels of oil at a strike price set between $80 per barrel and $90 per barrel, and (ii) approximately 51.3 million MMBtu’s of gas at a strike price set between $3.45 per MMBtu and $3.90 per MMBtu. The scheduled volumes subject to the calls sold relate to production months from November 2013 through December 2018. The Company is subject to the price risks associated with product price changes that are in excess of the specified call prices. If the market price during the applicable production month is above the applicable strike price, Cubic Asset would be required to pay the third party the difference between the market price and strike price for the amount of production subject to the call. This arrangement does not hedge the Company’s risk associated with product price decreases. This together with the proceeds from the original issuance of the Notes, resulted in total proceeds to the Company of approximately $101,000,000.
The Company, through its subsidiary Cubic Asset, entered into a Fixed Price Swap arrangement. Under the terms of the Fixed Price Swap arrangement, Cubic Asset will receive a fixed amount on approximately 18,000 barrels of oil at a price of $92 per barrel. The scheduled volumes subject to the swap related to production months from November 2013 through October 2016. Cubic Asset is subject to the price risks associated with product price increases above the specified fixed prices. Cubic Asset is using swaps to hedge some of its natural gas production. Cubic Asset receives the fixed price and pays the third party the floating market price during the applicable production month for the amount of production subject to the call.
Working Capital and Cash Flow
At June 30, 2014, we had a working capital deficit of $72,997,802, an increase from our working capital deficit of $30,191,399 as of June 30, 2013. The increase in our working capital deficit is primarily attributable to an increase in our borrowings which are classified as current due to our financial condition.
Operating activities - During the twelve months ended June 30, 2014, the Company used $4,515,080 of cash for operating activities compared to generating cash flows from operating activities of $54,204 in fiscal 2013. Cash flow from operations is dependent on our ability to increase production through our development and exploratory activities and the price received for oil and natural gas.
Investing activities - During the twelve months ended June 30, 2014, the Company used cash in the amount of $73,675,882 in investing activities as compared to cash flows generated from investing activities of $7,325,735 in fiscal 2013. Cash used by investing activities for 2014 consisted primarily of amounts used to make acquisitions in October 2013.
Financing activities - During the twelve months ended June 30, 2014 the Company provided cash flows from financing activities of $84,788,356 as compared to using cash flows in financing activities of $7,394,890 in fiscal 2013. Cash provided by financing activities for 2014 consisted of borrowings from new lenders, the WFEC credit facility and proceeds from the revolver, warrants, and derivatives offset by $5,000,000 of restricted cash, $5,000,000 paid to WFEC, $1,767,979 repayment of cash advances from affiliates and $2,840,819 of loan costs paid. Cash used by financing activities for 2013 consisted primarily of payments on the credit facility and loan costs incurred, partially offset by additional borrowings on a note payable to an affiliate.
Capital Expenditures
A significant portion of our oil and gas reserves are undeveloped. As such, recovery of our future undeveloped proved reserves will require significant capital expenditures. A portion of the proceeds from the issuance of the Notes and the Call Option Structured Derivative were used to consummate the acquisition of our East Texas Basin assets and additional working interests in our Louisiana properties. Management estimates that aggregate capital expenditures ranging from a minimum of approximately $5,000,000 and a maximum of approximately $25,000,000 will need to be made to further develop these reserves and provide for closing fees, debt repayment and general operating fees during fiscal 2015. The Company may increase its planned activities for fiscal 2015, if the Company acquires additional oil or natural gas properties. The Company has little or no control with respect to the timing of any third party operators drilling wells on acreage in which the Company has a working interest or the timing of drilling expenses incurred. Additional capital expenditures will be required for exploratory drilling on our undeveloped acreage.
No assurance can be given that all or any of these anticipated or possible capital expenditures will be completed as currently anticipated. Any acquisition of additional leaseholds would require that we obtain additional capital resources.
Capital Resources
We plan to fund our development and exploratory activities through cash on hand, cash provided from operations, and from the remaining funds secured in the financing transactions completed in October 2013, a possible disposition of assets, if needed, or other transactions.
As future cash flows, the availability of borrowings, and the ability to consummate any of the aforementioned potential transactions are subject to a number of variables, such as prevailing prices of oil and gas, actual production from existing and newly-completed wells, our success in developing and producing new reserves, the uncertainty of financial markets and joint venture and merger and acquisition activity, and the uncertainty with respect to the amount of funds which may ultimately be required to finance our development and exploration program, there can be no assurance that our capital resources will be sufficient to sustain our development and exploratory activities. With future strategies to obtain additional financing, funds generated through existing wells and cash on hand, we expect to be able to continue to pay our expenses as they come due.
If we are unable to obtain sufficient capital resources on a timely basis, we may need to curtail our planned development and exploratory activities. If a well is proposed by a third-party operator and we do not have the capital resources to participate in that well, we might not receive any revenue generated by that well, while still being required to fulfill the relevant royalty payment obligations to the mineral owner and other royalty holders. Additionally, because future cash flows and the availability of borrowings are subject to a number of variables, there can be no assurance that our capital resources will be sufficient to sustain our development and exploration activities.
Critical Accounting Policies
In response to the SEC’s Release No. 33-8040, “Cautionary Advice Regarding Disclosure About Critical Accounting Policies,” we have identified the most critical accounting policies used in the preparation of our consolidated financial statements. We determined the critical policies by considering accounting policies that involve our most complex or subjective decisions or assessments. We identified our most critical accounting policies to be those related to our proved reserves, accounts receivables, share-based payments, our choice of
accounting method for oil and natural gas properties, goodwill, asset retirement obligations and income taxes.
We prepared our consolidated financial statements for inclusion in this report in accordance with accounting principles generally accepted in the United States (“GAAP”). GAAP represents a comprehensive set of accounting and disclosure rules and requirements, and applying these rules and requirements requires management judgments and estimates including, in certain circumstances, choices between acceptable GAAP alternatives. The following is a discussion of our most critical accounting policies, judgments and uncertainties that are inherent in our application of GAAP.
Estimates of Proved Oil and Gas Reserves
The proved reserves data included in this Annual Report on Form 10-K was prepared in accordance with SEC guidelines. The accuracy of a reserve estimate is a function of:
· the quality and quantity of available data;
· the interpretation of that data;
· the accuracy of various mandated economic assumptions; and
· the technical qualifications, experience and judgment of the persons preparing the estimates.
Because these estimates depend on many assumptions, all of which may substantially differ from actual results, reserve estimates may be different from the quantities of oil and natural gas that are ultimately recovered. In addition, results of drilling, testing and production after the date of an estimate may justify material revisions to the estimate. The assumptions used for our East Texas, Bossier/Haynesville, Cotton Valley and Hosston well and reservoir characteristics and performance are subject to further refinement as more production history is accumulated.
You should not assume that the present value of future net cash flows represents the current market value of our estimated proved reserves. In accordance with SEC requirements, we based the estimated discounted future net cash flows from proved reserves according to the requirements in the SEC’s Release No. 33-8995 “Modernization of Oil and Gas Reporting,” or Release No. 33-8995. Actual future prices and costs may be materially higher or lower than the prices and costs used in the preparation of the estimate. Further, the mandated discount rate of 10% may not be an accurate assumption of future interest rates.
Proved reserves quantities directly and materially impact depletion expense. If the proved reserves decline, then the rate at which we record depletion expense increases, reducing net income. A decline in the estimate of proved reserves may result from lower market prices, making it uneconomical to drill or produce if the costs to drill or produce are expected to exceed such market prices. In addition, a decline in proved reserves may impact the outcome of our assessment of our oil and natural gas properties and require an impairment of the carrying value of our oil and natural gas properties.
Proved reserves are defined as those quantities of oil and gas which, by analysis of geoscience and engineering data, can be estimated with reasonable certainty to be economically producible from a given date forward, from known reservoirs, and under existing economic conditions, operating methods, and government regulations before the time at which contracts providing the right to operate expire, unless evidence indicates that renewal is reasonably certain, regardless of whether the estimates are deterministic estimates or probabilistic estimates. To be classified as proved reserves, the project to extract the hydrocarbons must have commenced, or the operator must be reasonably certain that it will commence the project, within a reasonable time.
The area of the reservoir considered as proved includes both the area identified by drilling, but limited by fluid contacts, if any, and adjacent undrilled portions of the reservoir that can, with reasonable certainty, be judged to be continuous with it and to contain economically producible oil and gas on the basis of available geoscience and engineering data. In the absence of data on fluid contacts, proved quantities in a reservoir are limited by the deepest known hydrocarbons as seen in a well penetration unless geoscience, engineering, or performance data and reliable technology establish the deepest contact with reasonable certainty.
Where direct observation from well penetrations has defined a highest known oil elevation and the potential exists for an associated gas cap, proved oil reserves may be assigned in the structurally higher portions of the
reservoir only if geoscience, engineering, or performance data and reliable technology establish the higher contact with reasonable certainty.
Reserves that can be produced economically through application of improved recovery techniques (including, but not limited to, fluid injection) are included in the proved classification when successful testing by a pilot project in an area of the reservoir with properties no more favorable than in the reservoir as a whole, the operation of an installed program in the reservoir or an analogous reservoir, or other evidence using reliable technology establishes the reasonable certainty of the engineering analysis on which the project or program was based, and the project has been approved for development by all necessary parties and entities, including governmental entities.
Undrilled locations can be classified as having undeveloped reserves only if a development plan has been adopted indicating that they are scheduled to be drilled within five years, unless the specific circumstances justify a longer time.
Existing economic conditions include prices and costs at which economic producibility from a reservoir is to be determined. The price shall be the average price during the 12-month period before the ending date of the period covered by the report, determined as an unweighted arithmetic average of the first-day-of-the-month price for each month within such period, unless prices are defined by contractual arrangements, excluding escalations based upon future conditions.
Accounting for oil and natural gas properties
We follow the full cost method of accounting, which involves capitalizing all acquisition, exploration, exploitation and development costs of oil and natural gas properties. Once we incur costs, they are recorded in the depletable pool of proved properties or in unproved properties, collectively, the “full cost pool.” Unproved property costs are not subject to depletion. We review our unproved oil and natural gas property costs on a quarterly basis to assess possible impairment or the need to transfer unproved costs to proved properties as a result of extension or discoveries from drilling operations. We expect these costs to be evaluated in one to seven years and transferred to the depletable portion of the full cost pool during that time. The full cost pool is comprised of intangible drilling costs, lease and well equipment and exploration and development costs incurred plus costs of acquired proved and unproved leaseholds.
During April 2004 we initiated leasing projects to acquire shale drilling rights in both the Johnson Branch and Bethany Longstreet fields in our Northeast Louisiana operating areas. In accordance with our policy and FASB ASC Subtopic 835-20 for Capitalization of Interest, we began capitalizing interest on unproved properties.
We calculate depletion using the unit-of-production method. Under this method, the sum of the full cost pool and all estimated future development costs are divided by the total quantity of proved reserves. This rate is applied to our total production for the period, and the appropriate expense is recorded.
Under the full cost method of accounting, sales, dispositions and other oil and natural gas property retirements are generally accounted for as adjustments to the full cost pool, with no recognition of gain or loss unless the disposition would significantly alter the relationship between capitalized costs and proved reserves. Gain or loss recognition on divestiture or abandonment of oil and natural gas properties where disposition would result in a significant alteration of the depletion rate requires allocation of a portion of the amortizable full cost pool based on the relative estimated fair value of the disposed oil and natural gas properties to the estimated fair value of total proved reserves. As discussed under “Estimates of Proved Reserves,” estimating oil and natural gas reserves involves numerous assumptions.
The quarterly calculation of the ceiling test is based upon estimates of proved reserves. There are numerous uncertainties inherent in estimating quantities of proved reserves, in projecting the future rates of production and in the timing of development activities. The accuracy of any reserve estimate is a function of the quality of available data and of engineering and geological interpretation and judgment. Results of drilling, testing and production subsequent to the date of the estimate may justify revision of such estimate. Accordingly, reserve estimates are often different from the quantities of oil and natural gas that are ultimately recovered.
Use of estimates
The preparation of financial statements in conformity with generally accepted accounting principles requires management to make estimates and assumptions that affect the amounts reported in the financial statements and accompanying notes. Actual results could differ from those estimates.
Certain significant estimates
Management’s estimates of oil and gas reserves are based on various assumptions, including constant oil and gas prices. It is reasonably possible that a future event in the near term could cause the estimates to change and such changes could have a severe impact. Actual future production, cash flows, taxes, operating expenses, development expenditures and quantities of recoverable oil and gas reserves may vary substantially from those assumed in the estimates. The accuracy of any reserve estimate is a function of the quality of available data, engineering and geological interpretation, and judgment. Subsequent evaluation of the same reserves based upon production history will result in variations, which may be substantial, in the estimated reserves. While it is at least reasonably possible that the estimates above will change materially in the near term, no estimate can be made of the range of possible changes that might occur.
Asset retirement obligations
We follow FASB ASC Subtopic 410-20 for Asset Retirement Obligations to account for legal obligations associated with the retirement of long-lived assets. ASC 410-20 requires these obligations be recognized at their estimated fair value at the time that the obligations are incurred. Upon initial recognition of a liability, that cost should be capitalized as part of the full cost pool and allocated to expense over the useful life of the asset. The costs of plugging and abandoning oil and natural gas properties fluctuate with costs associated with the industry. We periodically assess the estimated costs of our asset retirement obligations and adjust the liability according to these estimates.
Derivative financial instruments
We use derivative financial instruments to as part of the financing of our acquisitions. We use mark-to-market valuation as estimate of fair value. We do not designate our derivative financial instruments as hedging instruments and, as a result, we recognize the change in the derivative’s fair value as a component of current earnings.
Accounting for income taxes
Income taxes are accounted for using the liability method of accounting in accordance with FASB ASC Topic 740 for Income Taxes. We must make certain estimates related to the reversal of temporary differences, and actual results could vary from those estimates. Deferred taxes are recorded to reflect the tax benefits and consequences of future years’ differences between the tax basis of assets and liabilities and their financial reporting basis. We record a valuation allowance to reduce deferred tax assets if it is more likely than not that some portion or all of the deferred tax assets will not be realized.
Stock-based compensation
We account for share-based payments to employees using the methodology prescribed in FASB ASC Topic 718 for Stock Compensation. ASC Topic 718 requires share-based compensation to be recorded with cost classifications consistent with cash compensation.
Subsequent Events
The FASB issued new authoritative guidance for subsequent events. Such authoritative guidance establishes general standards of accounting for, and disclosure of, events that occur after the balance sheet date but before financial statements are issued or are available to be issued. In particular, this guidance sets forth:
(1) the period after the balance sheet date during which management of a reporting entity should evaluate events or transactions that may occur for potential recognition or disclosure in the financial statements, (2) the circumstances under which an entity should recognize events or transactions occurring after the balance sheet date in its financial statements and (3) the disclosures that an entity should make about events or transactions that occurred after the balance sheet date. Adoption of this authoritative position did not have a material impact on the Company’s condensed consolidated financial statements.
Other Accounting Policies and Recent Accounting Pronouncements
Please see “Notes to Financial Statements — Note B — Significant accounting policies” elsewhere herein.
Related Party Transactions
A description of our related party transactions is included in “Note F — Related party transactions” in the Notes to the Financial Statements of the Company included elsewhere in this Report, and is incorporated herein by reference.
Off-Balance Sheet Arrangements
We do not currently use any off-balance sheet arrangements to enhance our liquidity and capital resource positions, or for any other purpose.
Item 7A. Quantitative and Qualitative Disclosures About Market Risk.
Not Applicable
Item 8. Financial Statements and Supplementary Data.
The Report of Independent Accountants, Financial Statements and any supplementary financial data required by this Item are set forth beginning on page F-1, and are incorporated herein by reference.
Item 9. Changes in and Disagreements with Accountants on Accounting and Financial Disclosure.
On July 14, 2014, following a competitive process undertaken by the Audit Committee, the Audit Committee approved the selection of BDO USA, LLP (“BDO”) to serve as our independent registered public accounting firm for the fiscal year ended June 30, 2014. Vogel CPAs, PC (formerly Philip Vogel & Co. PC) (“Vogel”) was notified on July 15, 2014 that it will not be retained as our independent registered public accounting firm for the fiscal year ended June 30, 2014.
The audit reports of Vogel on our consolidated financial statements as of and for the fiscal years ended June 30, 2013 and 2012 did not contain an adverse opinion or disclaimer of opinion, nor were such reports qualified or modified as to uncertainty, audit scope or accounting principles, except that as to its audit report for the fiscal year ended June 30, 2012, Vogel’s report included a qualification as to its substantial doubt regarding our ability to continue as a going concern.
During our two most recent fiscal years and the subsequent interim period prior to the engagement of BDO, we did not consult with BDO regarding (a) the application of accounting principles to a specified transaction, either completed or proposed; (b) the type of audit opinion that might be rendered on our financial statements; or (c) any matter that was the subject of a disagreement or reportable event as defined in Items 304(a)(1)(iv) and (v), respectively, of Regulation S-K with Vogel.
There are no disagreements with our accounting and financial disclosure.
Item 9A. Controls and Procedures.
Conclusion Regarding the Effectiveness of Disclosure Controls and Procedures
Under the supervision and with the participation of our management, including our principal executive officer and principal financial officer, we conducted an evaluation of our disclosure controls and procedures, as such term is defined in Rules 13a-15(e) and 15d-15(e) under the Exchange Act, as of the end of the period covered by this report. Based on this evaluation, our principal executive officer and our principal financial officer concluded that our disclosure controls and procedures were not effective to provide reasonable assurance that information required to be disclosed by us in reports we file or submit under the Exchange Act is recorded, processed, summarized and reported within the time periods specified in the SEC’s rules and forms, and is accumulated and communicated to our management, including our principal executive officer and principal financial officer, as appropriate to allow timely decisions regarding required disclosures.
In September and October 2014, we identified material weaknesses in our internal controls over financial reporting in connection with our (i) financial reporting and disclosure process (ii) accounting for asset retirement obligations and (iii) accounting for certain complex accounting transactions. The first material weakness, our financial reporting and disclosure process, resulted in additional disclosures and amendments to our quarterly reports for the quarterly periods ended September 30, 2013, December 31, 2013 and March 31, 2014 necessary to present the financial statements in accordance with accounting principles generally accepted in the United States. The second material weakness, our accounting for asset retirement obligations (ARO), resulted in our inappropriate estimation of the ARO related to the properties acquired in our acquisitions in Fiscal 2014. Our third material weakness, our accounting for certain complex accounting transactions, resulted in an incorrect accounting treatment related to the warrants that were issued together with the Notes. The warrants contained ‘full-ratchet’ anti-dilution adjustment provisions that were not properly accounted for. Additionally, certain warrants that were re-priced in 2013 and 2014 also contained certain anti-dilution provisions that were not accounted for correctly since their issuance date. Finally, we did not apply the proper accounting for the exchanges of certain related party debt and equity instruments in transactions that were deemed equity contributions. As a result, of these material weaknesses, the Company will amend its September 30, 2013, December 31, 2013 and March 31, 2014 Forms 10-Q.
We note that there are inherent limitations on the effectiveness of internal controls, as they cannot prevent collusion, management override or failure of human judgment. If we fail to maintain an effective system of internal controls or if management or our independent registered public accounting firm were to discover material weaknesses in our internal controls, we may be unable to produce reliable financial reports or prevent fraud, and it could harm our financial condition and results of operations, result in a loss of investor confidence and negatively impact our share price.
Management’s Report on Internal Control Over Financial Reporting
Our management is responsible for establishing and maintaining adequate internal control over financial reporting, as such term is defined in Rules 13a—15(f) and 15d—15(f) of the Securities Exchange Act of 1934, as amended. Under the supervision and with the participation of our management, including our principal executive officer and principal financial officer, we conducted an assessment, including testing, of the effectiveness of our internal control over financial reporting as of June 30, 2014 based on the criteria set forth in Internal Control—Integrated Framework (1992) issued by the Committee of Sponsoring Organizations of the Treadway Commission. Our system of internal control over financial reporting is designed to provide reasonable assurance regarding the reliability of financial reporting and the preparation of financial statements for external purposes in accordance with generally accepted accounting principles. Our internal control over financial reporting includes those policies and procedures that (i) pertain to the maintenance of records that, in reasonable detail, accurately and fairly reflect the transactions and dispositions of our assets; (ii) provide reasonable assurance that transactions are recorded as necessary to permit preparation of financial statements in accordance with generally accepted accounting principles, and that our receipts and expenditures are being made only in accordance with authorizations of our management and directors; and (iii) provide reasonable assurance regarding prevention or timely detection of unauthorized acquisition, use, or disposition of our assets that could have a material effect on the financial statements.
Based on our evaluation under the criteria set forth in Internal Control—Integrated Framework, our management concluded that our internal control over financial reporting was not effective as of June 30,
2014. Management found the following material weaknesses: (i) financial reporting and disclosure process, (ii) accounting for asset retirement obligation and (iii) accounting for certain complex transactions. This Annual Report does not include an attestation report of our independent registered public accounting firm regarding internal control over financial reporting. We were not required to have, nor have we engaged our independent registered public accounting firm to perform, an audit on our internal control over financial reporting pursuant to the rules of the Securities and Exchange Commission that permit us to provide only management’s report in this Annual Report.
Changes in Internal Control Over Financial Reporting
We maintain a system of internal control over financial reporting. There were material weaknesses in our internal control over financial reporting during the fourth quarter of fiscal 2014 that have materially affected, or are reasonably likely to materially affect, our internal control over financial reporting. The Company needs to hire qualified experts to review complex transactions like those consummated, in October 2013, to ensure all items are receiving proper accounting treatment.
Inherent Limitations on Internal Control
A control system, no matter how well conceived and operated, can provide only reasonable, not absolute, assurance that the objectives of the control system are met. Further, the benefits of controls must be considered relative to their costs. Because of the inherent limitations in all control systems, no evaluation of controls can provide absolute assurance that all control issues and instances of fraud, if any, have been detected. These inherent limitations include the realities that judgments in decision making can be faulty, and that breakdowns can occur because of simple errors. Additionally, controls can be circumvented by the individual acts of some persons, by collusion of two or more people, or by management override of the control. The design of any system of controls is also based in part upon certain assumptions about the likelihood of future events, and there can be no assurance that any design will succeed in achieving its stated goals under all potential future conditions. Because of the inherent limitations in a cost-effective control system, misstatements due to error or fraud may occur and not be detected.
None.
Item 10. Directors, Executive Officers and Corporate Governance.
Directors
The following table provides information concerning each of our directors as of November 4, 2014:
|
|
|
|
|
|
|
Director |
|
Name |
|
Age |
|
Position(s) Held with Cubic |
|
Since |
|
Calvin A. Wallen, III |
|
59 |
|
Chairman of the Board, President and Chief Executive Officer |
|
1997 |
|
|
|
|
|
|
|
|
|
Jon S. Ross |
|
50 |
|
Executive Vice President, Corporate Secretary and Director |
|
1998 |
|
|
|
|
|
|
|
|
|
Gene C. Howard |
|
88 |
|
Director |
|
1991 |
|
|
|
|
|
|
|
|
|
Bob L. Clements |
|
72 |
|
Director |
|
2004 |
|
|
|
|
|
|
|
|
|
David B. Brown |
|
52 |
|
Director |
|
2010 |
|
|
|
|
|
|
|
|
|
Paul R. Ferretti |
|
67 |
|
Director |
|
2010 |
CALVIN A. WALLEN, III has served as the President and Chief Executive Officer of the Company since 1997 and as Chairman of the Board of Directors since June 1999. Mr. Wallen has over 30 years of experience in the oil and gas industry working as a drilling and petroleum engineer. He was employed by Superior Oil and various other drilling contractors including Resource, Tom Brown and Rowan International. Mr. Wallen has considerable experience in drilling vertical, high-angle directional and horizontal wells in North and South American oil and gas fields and in the North Sea and Gulf of Mexico. Mr. Wallen is an active member of the Dallas Geological Society, the American Association of Petroleum Geologists, the American Association of Drilling Engineers, and the Society of Petroleum Engineers. In 1982, Mr. Wallen began acquiring and developing oil and gas properties, forming a production company that has evolved into Tauren Exploration, Inc. Mr. Wallen did his undergraduate engineering studies at Texas A&M University.
JON S. ROSS has served as the Secretary and as a director of the Company since April 1998. Mr. Ross is a practicing attorney in Dallas, Texas representing over fifty business entities within the past nine years. He has served on several community and non-profit committees and boards and has been asked to speak to corporate and civic leaders on a variety of corporate law topics. Mr. Ross is a director of Oryon Technologies, Inc., a publicly traded company focused on products utilizing electroluminescent lamp technology. Mr. Ross graduated from St. Mark’s School of Texas with honors in 1982 and graduated from the University of Texas at Austin in 1986 with a B.B.A. in Accounting. He then graduated from the University of Texas School of Law in 1989 attaining a Juris Doctorate degree.
GENE C. HOWARD is the Senior Partner of Bonham & Howard, P.L.L.C. and has served on numerous boards including six banks, was Chair of the Oklahoma State & Education Group Insurance Board for eight years, was a Trustee of the Oklahoma College Savings Plan for four years, and was Chair of the Philadelphia Mortgage Trust (a REIT) for ten years. He served 22 years in the Oklahoma Legislature, with six years as the President Pro Tem of the Senate. Mr. Howard is also a veteran of the U.S. Air Force, obtaining the rank of Lieutenant Colonel.
BOB L. CLEMENTS joined the Company’s board in February 2004. Mr. Clements is the owner of both Leon’s Texas Cuisine, the largest independent producer of corn dogs and stuffed jalapenos for the retail and food service industry, and Shoreline Restaurant Corporation, which operates two upscale dining locations in Rockwall, Texas. He has been in the restaurant and wholesale food business for more than 30 years. Mr.
Clements received his education from Rutherford Business College. He also graduated in 1985 from Harvard Business School’s highly selective OPM Program.
DAVID B. BROWN currently performs financial consulting services for privately owned and publicly traded companies including filling interim Chief Financial Officer roles, leveraged debt refinancing and addressing material internal control and reporting deficiencies. He was the Senior Vice President & Chief Accounting Officer for MoneyGram International (NYSE: MGI), a provider of financial services, from January 2012 through May 2013. From 2007 until 2011, Mr. Brown was Chief Financial Officer for Dresser, Inc., a $2 billion subsidiary of General Electric that manufactured energy equipment serving the upstream, midstream and downstream oil, gas and power markets. Mr. Brown led the integration of Dresser into various business units of GE’s Energy division and previously served Dresser as Chief Accounting Officer and Controller. From 2003 until 2007, Mr. Brown was divisional Vice President, Controller and Chief Audit Executive for the Brink’s Company, a global security services company with operations in more than 130 countries. Prior to joining Brink’s, Mr. Brown spent 8 years with LSG Sky Chefs, a $3 billion airline catering company owned by Lufthansa, in leadership roles with progressive responsibility including three years in Sao Paulo, Brazil as Vice President Finance - Latin America. Prior to that time, Mr. Brown spent 10 years with Price Waterhouse, where he advised multi-national clients primarily in the energy industry, while living in Moscow, London and the United States. He has also served in a variety of board of director capacities for several Dallas-based arts and humanities nonprofit organizations and is an active member of the Dallas Committee for Foreign Relations and the Boy Scouts of America. Mr. Brown has a Bachelor of Business Administration degree from The University of Texas — Austin and is a Certified Public Accountant.
PAUL R. FERRETTI served as Managing Director — Head of Energy Investment Banking with Wunderlich Securities Inc., an investment banking firm, from 2008 through 2010. From 2005 until joining Wunderlich Securities, Mr. Ferretti served as Senior Vice President — Head of Energy Investment Banking at Ferris, Baker, Watts Inc., an investment banking firm. At Ferris, Baker, Watts, Mr. Ferretti established and lead a comprehensive energy team, including both equity research and investment banking. From 2004 until joining Ferris, Baker, Watts, Mr. Ferretti served as Managing Director of Ladenburg Thalmann & Company, an investment banking firm. Prior to 2004, Mr. Ferretti served with various companies as Sr. Vice President and as Senior Equity Analyst. During his equity research career, Mr. Ferretti was a member of the New York Society of Security Analysts. Mr. Ferretti was recently elected to the Board of Directors of NGAS Resources, Inc., an independent exploration and production company. Mr. Ferretti holds a Bachelor of Science degree in Economics from Brooklyn College and served in the United States Army, which included a one year tour of duty in Vietnam.
There are no family relationships among any of the directors or executive officers of the Company. See “Certain Relationships and Related Transactions” for a description of transactions between the Company and its directors, executive officers or their affiliates.
Executive Officers
|
Name |
|
Age |
|
Position(s) Held with Cubic |
|
Since |
|
Calvin A. Wallen, III* |
|
59 |
|
Chairman of the Board, President and Chief Executive Officer |
|
1997 |
|
|
|
|
|
|
|
|
|
Jon S. Ross* |
|
50 |
|
Executive Vice President, Corporate Secretary and Director |
|
1998 |
|
|
|
|
|
|
|
|
|
Larry G. Badgley |
|
58 |
|
Chief Financial Officer |
|
2008 |
See Mr. Wallen’s and Mr. Ross’s biographies above.
LARRY G. BADGLEY joined the Company in August 2008, as a consultant, and was appointed Chief Financial Officer in October 2008. He served in that capacity until March 2014, when he served as the Company’s Vice President — Finance and Compliance. In August 2014, Mr. Badgley was re-appointed as the Company’s Chief Financial Officer. Prior to joining the Company, from October 2005 through September 2006, Mr. Badgley served as Managing Director of BridgePoint Consulting, a provider of CFO services to venture capital-backed and early stage companies. In that capacity, Mr. Badgley was primarily responsible for strategic planning for growth companies. From July 1998 through October 2005, Mr. Badgley served as Director of Accounting and Finance for Jefferson Wells International, an international professional services firm. Prior to that time, Mr. Badgley served as Chief Operating Officer and Chief Financial Officer of a privately held national sign manufacturer until its sale in July 1998. Mr. Badgley received a BBA in Finance from Hardin-Simmons University and is a Certified Public Accountant.
Audit Committee; Financial Expert
The Audit Committee is comprised of Messrs. Brown (Chairman), Howard and Clements. All of the members of the Audit Committee are “independent” under the rules of the SEC. The Board of Directors, after reviewing all of the relevant facts, circumstances and attributes, has determined that Messrs. Howard and Brown satisfy the requirements of an “audit committee financial expert” on the Audit Committee as that term is defined in Item 407(d)(5)(ii) of Regulation S-K promulgated under the Exchange Act by the SEC.
Section 16(a) Beneficial Ownership Reporting Compliance
Section 16(a) of the Exchange Act requires the Company’s directors, executive officers, and holders of more than 10% of the Common Stock to file with the SEC reports of ownership and changes in ownership of Common Stock. SEC regulations require those directors, executive officers, and greater than 10% stockholders to furnish the Company with copies of all Section 16(a) forms they file. Based on the Company’s review of such reports, Messrs. Howard, Clements, Ferretti and Brown each filed one Form 4 late. Each such filing reported as a single transaction. The Company believes that all other filings were on time during fiscal 2014.
Director Independence
As of June 30, 2014, our Board had two members from management, Calvin A. Wallen, III, our Chairman, President and Chief Executive Officer and Jon S. Ross, our Executive Vice President and Secretary, and four non-management directors, Gene C. Howard, Bob L. Clements, David B. Brown and Paul R. Ferretti. The Board has determined that each of its non-management members meets the criteria for independence. Because of their management roles, Mr. Wallen and Mr. Ross are not considered independent directors and do not sit on any committees of the Board.
Code Of Business Conduct And Ethics
The Company has adopted a Code of Business Conduct and Ethics that applies to its directors, officers and employees. A copy of the Code of Business Conduct and Ethics is available in the “Governance” section on the Company’s website at www.CubicEnergyInc.com.
Item 11. Executive Compensation.
Compensation Discussion and Analysis
General. Our Board of Directors has established a Compensation Committee, comprised entirely of independent non-employee directors, with authority to set all forms of compensation of our executive officers. Messrs. Brown, Ferretti and Howard comprise the Compensation Committee, currently. The Compensation Committee has overall responsibility for our executive compensation policies as provided in a written charter adopted by the Board of Directors. The Compensation Committee is empowered to review
and approve the annual compensation and compensation procedures for our executives: the President and Chief Executive Officer, the Chief Financial Officer, and the Executive Vice President and Secretary.
When establishing base salaries, cash bonuses and equity grants for each of the executives, the Compensation Committee considers the recommendations of the President and Chief Executive Officer and the Executive Vice President and Secretary, the executive’s role and contribution to the management team, responsibilities and performance during the past year and future anticipated contributions, corporate performance, and the amount of total compensation paid to executives in similar positions, and performing similar functions, at other companies for which data was available, as provided by third party compensation studies. The Compensation Committee engaged the compensation consulting practice of a national accounting firm to provide an Executive Compensation Study Proxy Benchmarking Analysis that included compensation for Chief Executive Officer, Chief Financial Officer, Chief Operating Officer, Executive Vice President, General Counsel and other management positions. This study, published in December 2013, was built on compensation data from a peer group of 14 companies in the oil and gas industry. It included data from the following companies: Matador Resources Company, Goodrich Petroleum Corporation, Mid-Con Energy Partners, L.P., LRR Energy, L.P., Isramco Incorporated, Abraxas Petroleum Corporation, Gastar Exploration Incorporated, Callon Petroleum Company, Panhandle Oil and Gas Incorporated, Warren Resources Incorporated, PrimeEnergy Corporation, Saratoga Resources Incorporated, Constellation Energy Partners LLC, and PostRock Energy Corporation. The Compensation Committee in setting compensation for Cubic’s management team used this information. The Compensation Committee also relied on other outside resources available to them, as well as their general industry experience, in evaluating management compensation.
The Compensation Committee relies upon its judgment in making compensation decisions, after reviewing the Company’s performance and evaluating each executive’s performance during the year. The Committee generally does not adhere to formulas or necessarily react to short-term changes in business performance in determining the amount and mix of compensation elements. We incorporate flexibility into our compensation programs and in the assessment process to respond to and adjust for the evolving business environment.
Compensation Philosophy. The Compensation Committee’s compensation philosophy is to reward executive officers for the achievement of short and long-term corporate objectives and for individual performance. The objective of this philosophy is to provide a balance between short-term goals and long-term priorities to achieve immediate objectives while also focusing on increasing stockholder value over the long term. Also, to ensure that we are strategically and competitively positioned for the future, the Compensation Committee has the discretion to attribute significant weight to other factors in determining executive compensation, such as maintaining competitiveness, pursuing growth opportunities and achieving other long-range business and operating objectives. The level of compensation should also allow us to attract, motivate, and retain talented executive officers who contribute to our long-term success. The compensation of our President and Chief Executive Officer and other executive officers is comprised of cash compensation and long-term incentive compensation in the form of base salary, discretionary bonuses and stock awards.
Executive Compensation Components. Our total compensation for the named executive officers consisted of:
· base salary,
· bonuses and
· long-term equity incentives.
The Compensation Committee believes that each of these components is necessary to achieve Cubic’s objective of retaining highly qualified executives and motivating the named executive officers to maximize stockholder return.
In setting fiscal 2014 compensation, the Compensation Committee considered the specific factors discussed below:
Base Salary. In setting the executive officers’ base salaries, the Compensation Committee considers the achievement of corporate objectives as well as individual performance. Because the Compensation Committee believes that executive compensation should be viewed in terms of a balanced combination of cash compensation (i.e., base salaries and bonuses) and long-term incentive (i.e., grants of stock and options), base salaries are targeted to approximate the low end of the range of base salaries paid to executives of similar companies for each position. To ensure that each executive is paid appropriately, the Compensation Committee considers the executive’s level of responsibility, prior experience, overall knowledge, contribution to business results, existing equity holdings, executive pay for similar positions in other companies, and executive pay within our company.
Discretionary Bonuses. Executive bonuses are intended to link executive compensation with the attainment of Company goals. The actual payment of bonuses is primarily dependent upon the extent to which these Company-wide objectives are achieved. Determination of executive bonus amounts is not made in accordance with a strict formula, but rather is based on objective data combined with competitive ranges and internal policies and practices, including an overall review of both individual and corporate performance. Other than Scott M. Pinsonnault’s signing bonus, in April 2014, no bonuses were paid to any other named executive officers during fiscal 2014 or 2013. The President and Chief Executive Officer has the discretion to recommend to the Compensation Committee to increase or decrease bonuses for all other executive officers, but any bonus amounts must be approved by the Compensation Committee.
Long-Term Incentives. On December 29, 2005, the stockholders of the Company approved the 2005 Stock Option Plan (the “Plan”) under which our executive officers may be, among other forms of compensation, compensated through grants of shares of our Common Stock and/or grants of options to purchase shares of Common Stock. The Compensation Committee approves Plan grants that provide additional incentives and align the executives’ long-term interests with those of the stockholders of the Company by tying executive compensation to the long-term performance of the Company’s stock price. Annual equity grants for our executives are typically approved in January, but there have been no equity grants during the last 3 fiscal years.
The Compensation Committee recommends equity to be granted to an executive with respect to shares of Common Stock based on the following principal elements including, but not limited to:
· President and Chief Executive Officer’s and Executive Vice President and Secretary’s recommendations;
· Management role and contribution to the management team;
· Job responsibilities and past performance;
· Future anticipated contributions;
· Corporate performance; and
· Existing equity holdings.
Determination of equity grant amounts is not made in accordance with a formula, but rather is based on objective data combined with competitive ranges, past internal policies and practices and an overall review of both individual and corporate performance. Equity grants may also be made to new executives upon commencement of employment and, on occasion, to executives in connection with a significant change in job responsibility. The Compensation Committee believes annual equity grants more closely align the long-term interests of executives with those of stockholders and assist in the retention of key executives. As such, these grants comprise the Company’s principal long-term incentive to executives.
The following table shows the components of executive compensation for the fiscal years ended June 30, 2014, 2013 and 2012, expressed as percentages of total compensation.
|
|
|
|
|
|
|
Percentage of Total Compensation |
|
|
| ||||
|
Name and |
|
Fiscal |
|
|
|
|
|
Option |
|
All Other |
|
|
|
|
Principal Position |
|
Year |
|
Salary |
|
Bonus |
|
Awards |
|
Compensation |
|
Total |
|
|
Calvin A. Wallen, III Chairman of the Board, President and Chief Executive Officer |
|
2014 |
|
97.6 |
% |
— |
|
— |
|
2.4 |
% |
100.0 |
% |
|
|
2013 |
|
97.0 |
% |
— |
|
— |
|
3.0 |
% |
100.0 |
% | |
|
|
2012 |
|
97.2 |
% |
— |
|
— |
|
2.8 |
% |
100.0 |
% | |
|
|
|
|
|
|
|
|
|
|
|
|
|
| |
|
|
|
|
|
|
|
|
|
|
|
|
|
|
|
|
Larry G. Badgley |
|
2014 |
|
97.2 |
% |
— |
|
— |
|
2.8 |
% |
100.0 |
% |
|
|
2013 |
|
96.3 |
% |
— |
|
— |
|
3.7 |
% |
100.0 |
% | |
|
|
2012 |
|
96.6 |
% |
— |
|
— |
|
3.4 |
% |
100.0 |
% | |
|
|
|
|
|
|
|
|
|
|
|
|
|
|
|
|
Jon S. Ross Executive Vice President, Secretary and Director |
|
2014 |
|
96.3 |
% |
— |
|
— |
|
3.7 |
% |
100.0 |
% |
|
|
2013 |
|
96.0 |
% |
— |
|
— |
|
4.0 |
% |
100.0 |
% | |
|
|
2012 |
|
96.3 |
% |
— |
|
— |
|
3.7 |
% |
100.0 |
% | |
|
|
|
|
|
|
|
|
|
|
|
|
|
|
|
|
Scott M. Pinsonnault Senior Vice President and Chief Financial Officer (former) |
|
2014 |
|
22.4 |
% |
75.8 |
% |
— |
|
1.8 |
% |
100.0 |
% |
|
|
2013 |
|
— |
|
— |
|
— |
|
— |
|
— |
| |
|
|
2012 |
|
— |
|
— |
|
— |
|
— |
|
— |
| |
Other Compensation Policies Affecting the Executive Officers
Stock Ownership Requirements. The Compensation Committee does not maintain a policy relating to stock ownership guidelines or requirements for our executive officers because the Compensation Committee does not feel that it is necessary to impose such a policy on our executive officers. If circumstances change, the Compensation Committee will review whether such a policy is appropriate for executive officers.
Employment Agreements. On February 29, 2008, the Company entered into employment agreements with its President and Chief Executive Officer, Calvin A. Wallen, III, and Executive Vice President and Secretary, Jon S. Ross. The agreement with Mr. Wallen provided for a base salary of $200,000 per year, while the agreement with Mr. Ross provided for a base salary of $150,000 per year. The other terms and conditions of the agreements are substantially consistent.
Both agreements provide for a term of employment of 36 months from the effective date of February 1, 2008, which term shall be automatically extended by one additional month upon the expiration of each month during the term; provided, that the Company may terminate subsequent one-month extensions at any time. Each agreement is subject to early termination by the Company in the event that the employee dies, becomes totally disabled or commits an act constituting “Just Cause” under the agreement. The agreements provide that Just Cause includes, among other things, the conviction of certain crimes, habitual neglect of his duties to the Company or other material breaches by the employee of the agreement. Each agreement also provides that the employee shall be permitted to terminate his employment upon the occurrence of “Good Reason,” as defined in the agreement. The agreements provide that Good Reason includes, among other things, a material diminution in the employee’s authority, duties, responsibilities or salary, or the relocation of the Company’s principal offices by more than 50 miles. If the employee’s employment is terminated by (a) the Company other than due to the employee’s death, disability or Just Cause, or (b) the employee for Good Reason, then the Company is required to pay all remaining salary through the end of the then-current term. The foregoing severance payment is subject to reduction under certain conditions.
On January 14, 2011, the Company entered into an employment agreement with its Chief Financial Officer, Larry G. Badgley. The agreement provided for a base salary of $163,800, on an annual basis, and a term of
employment of twenty-four (24) months from the effective date of October 1, 2010. The agreement expired on September 30, 2012. The agreement also provided for the grant of stock options for the purchase of an aggregate of 288,667 shares of Company Common Stock.
On December 16, 2013, the Company entered into amendments to the employment agreements of Messrs. Wallen and Ross. The amendment with Mr. Wallen provides for a base salary of $400,000 per year, while the amendment with Mr. Ross provides for a base salary of $300,000 per year.
On December 12, 2013, Mr. Badgley’s salary increased to $250,000 per year and a health insurance reimbursement up to $1,500 per month. In June 2014, Mr. Badgley’s salary decreased to $215,000 per year and a health insurance reimbursement up to $1,500 per month. Following the end of fiscal 2014, Mr Badgley’s salary increased to $250,000.
On March 24, 2014, the Company hired Scott M. Pinsonnault as its Chief Financial Officer and Senior Vice President. Concurrently with his hire, the Company entered into an employment agreement with Mr. Pinsonnault. The agreement provided for a base salary of $325,000, on an annual basis, and a term of employment of three years. The agreement also provided for commencement payments in the aggregate amount of $187,500, as well as eligibility for certain bonuses and incentive compensation. The agreement also provided for a monthly medical expense reimbursement of $1,500. On August 12, 2014, Mr. Pinsonnault resigned as the Company’s Chief Financial Officer.
The following table sets forth the estimated amounts that would be payable to each of the named executives upon a termination under the scenarios outlined above, excluding termination for Just Cause or on account of death or disability, assuming that such termination occurred on June 30, 2014. There can be no assurance that these scenarios would produce the same or similar results as those disclosed if a termination occurs in the future.
|
Without Just Cause/ |
|
Severance |
|
|
| ||
|
For Good Reason |
|
Payment |
|
Total |
| ||
|
Calvin A. Wallen, III (1) |
|
$ |
1,200,000 |
|
$ |
1,200,000 |
|
|
|
|
|
|
|
| ||
|
Jon S. Ross (1) |
|
$ |
900,000 |
|
$ |
900,000 |
|
|
|
|
|
|
|
| ||
|
Scott M. Pinsonnault (2) |
|
$ |
893,750 |
|
$ |
893,750 |
|
(1) Represents 36 months of base salary.
(2) Represents base salary for the balance of Mr. Pinsonnault’s employment agreement. Mr. Pinsonnault voluntarily resigned following June 30, 2014, with no severance payment by the Company.
Tax Considerations
Compliance with Section 162(m) of the Internal Revenue Code. Section 162(m) disallows a federal income tax deduction to publicly held companies for certain compensation paid to our Named Executive Officers to the extent that compensation exceeds $1 million per executive officer covered by Section 162(m) in any fiscal year. The limitation applies only to compensation that is not considered “performance based” as defined in the Section 162(m) rules. In designing our compensation programs, the Compensation Committee considers the effect of Section 162(m) together with other factors relevant to our business needs. We have historically taken, and intend to continue taking, appropriate actions, to the extent we believe desirable, to preserve the deductibility of annual incentive and long-term performance awards. However, the Compensation Committee has not adopted a policy that all compensation paid must be tax-deductible and qualified under Section 162(m). We believe that the fiscal 2014 base salary, annual bonus and stock grants paid to the individual executive officers covered by Section 162(m) did not exceed the Section 162(m) limit and will be fully deductible under Section 162(m).
Chief Executive Officer Compensation
Mr. Wallen received $316,667 in base salary during fiscal 2014. During fiscal 2013, Mr. Wallen received an amount of $191,667, slightly less than the base salary provided in his employment agreement, and he received slightly more during fiscal 2012, due to the timing of payroll dates. The excess amount received by Mr. Wallen during fiscal 2012 had the effect of him receiving a reduction in base salary during fiscal 2013 in an equal amount. Mr. Wallen received no Common Stock awards during fiscal 2014, 2013 or 2012.
Chief Financial Officer Compensation
Mr. Badgley served as the Company’s Chief Financial Officer until March 2014, at a salary of $250,000 per year and up to a $1,500 per month health insurance subsidy. In March 2014, Mr. Pinsonnault was retained as the Company’s Chief Financial Officer, at a base salary of $325,000 per year, plus a $1,500 per month health insurance subsidy.
On August 12, 2014, Mr. Pinsonnault, resigned. The Company and Mr. Pinsonnault agreed that his resignation would be effective immediately.
Mr. Badgley was reappointed as the Company’s Chief Financial Officer, contemporaneously with Mr. Pinsonnault’s resignation, in August 2014. In connection with such appointment, Mr. Badgley’s base salary was reestablished at $250,000, on an annual basis.
Summary Compensation Table
The following table shows information regarding the compensation earned during the fiscal years ended June 30, 2014 and 2013 by our Chief Executive Officer, each person who served as our Chief Financial Officer during 2014, and our other most highly compensated executive officer who was employed by us as of June 30, 2014 and whose total compensation exceeded $100,000 during the most recent fiscal year (the “Named Executive Officers”):
|
Name and |
|
Fiscal |
|
|
|
|
|
Option |
|
All Other |
|
|
| |||||
|
Principal Position |
|
Year |
|
Salary |
|
Bonus |
|
Awards |
|
Compensation (1) |
|
Total |
| |||||
|
Calvin A. Wallen, III Chairman of the Board, President and Chief Executive Officer |
|
2014 |
|
$ |
316,667 |
|
$ |
— |
|
$ |
— |
|
$ |
7,706 |
|
$ |
324,373 |
|
|
|
2013 |
|
$ |
191,667 |
|
$ |
— |
|
$ |
— |
|
$ |
6,000 |
|
$ |
197,667 |
| |
|
|
2012 |
|
$ |
208,333 |
|
$ |
— |
|
$ |
— |
|
$ |
6,000 |
|
$ |
214,333 |
| |
|
|
|
|
|
|
|
|
|
|
|
|
|
| ||||||
|
|
|
|
|
|
|
|
|
|
|
|
|
|
| |||||
|
Larry G. Badgley |
|
2014 |
|
$ |
208,659 |
|
$ |
— |
|
$ |
— |
|
$ |
5,946 |
|
$ |
214,605 |
|
|
|
2013 |
|
$ |
156,975 |
|
$ |
— |
|
$ |
— |
|
$ |
6,000 |
|
$ |
162,975 |
| |
|
|
2012 |
|
$ |
170,625 |
|
$ |
— |
|
$ |
— |
|
$ |
6,000 |
|
$ |
176,625 |
| |
|
|
|
|
|
|
|
|
|
|
|
|
|
|
| |||||
|
Jon S. Ross Executive Vice President, Secretary and Director |
|
2014 |
|
$ |
237,500 |
|
$ |
— |
|
$ |
— |
|
$ |
9,238 |
|
$ |
246,738 |
|
|
|
2013 |
|
$ |
143,750 |
|
$ |
— |
|
$ |
— |
|
$ |
6,000 |
|
$ |
149,750 |
| |
|
|
2012 |
|
$ |
156,250 |
|
$ |
— |
|
$ |
— |
|
$ |
6,000 |
|
$ |
162,250 |
| |
|
|
|
|
|
|
|
|
|
|
|
|
|
|
| |||||
|
Scott M. Pinsonnault (2) Senior Vice President and Chief Financial Officer (former) |
|
2014 |
|
$ |
55,500 |
|
$ |
187,500 |
|
$ |
— |
|
$ |
4,500 |
|
$ |
247,500 |
|
|
|
2013 |
|
$ |
— |
|
$ |
— |
|
$ |
— |
|
$ |
— |
|
$ |
— |
| |
|
|
2012 |
|
$ |
— |
|
$ |
— |
|
$ |
— |
|
$ |
— |
|
$ |
— |
| |
(1) All Other Compensation consists solely of a reimbursement towards each officer’s medical insurance premiums in an amount not to exceed $1,500 per month since December 2013 and $500 per month prior to December 2013. The Company does not provide group health insurance coverage to its employees.
(2) Mr. Pinsonnault served as the Company’s Chief Financial Officer from March 2014 until August 2014.
Fiscal 2014 Grants of Plan-Based Awards
No grants of any plan-based awards were made to our executive officers during fiscal 2014.
Stock Grants
On January 24, 2013, the Company paid cash of $13,000 and issued 72,500 shares of Common Stock to four non-employee directors of the Company pursuant to the 2005 Stock Option Plan (the “Plan”). As of such date, the aggregate market value of the Common Stock granted was $15,225 based on the last sale price ($0.21 per share) on January 24, 2013, on the NYSE - MKT of the Company’s Common Stock. Such amount was expensed upon issuance to compensation expense.
On April 4, 2013, the Company paid cash of $13,000 and issued 72,500 shares of Common Stock to four non-employee directors of the Company pursuant to the Plan. As of such date, the aggregate market value of the Common Stock granted was $19,213 based on the last sale price ($0.265 per share) on April 4, 2013, on the NYSE-MKT of the Company’s Common Stock. Such amount was expensed upon issuance to compensation expense.
On July 5, 2013, the Company paid cash of $17,000 and issued 72,500 shares of Common Stock to four non-employee directors of the Company pursuant to the Plan. As of such date, the aggregate market value of the Common Stock granted was $20,300 based on the last sale price ($0.28 per share) on July 5, 2013, on the NYSE - MKT of the Company’s Common Stock. Such amount was expensed upon issuance to compensation expense.
On October 7, 2013, the Company paid cash of $17,000 and issued 72,500 shares of Common Stock to four non-employee directors of the Company pursuant to the Plan. As of such date, the aggregate market value of the Common Stock granted was $30,450 based on the last sale price ($0.42 per share) on October 7, 2013, on the OTC Markets of the Company’s Common Stock. Such amount was expensed upon issuance to compensation expense.
Outstanding Equity Awards at Fiscal Year-End
The following table set forth certain information, as of June 30, 2014, regarding stock option grants by the Company:
|
|
|
Number of Securities |
|
Number of Securities |
|
|
|
|
| |
|
|
|
underlying unexercised options |
|
underlying unexercised options |
|
Option |
|
Option |
| |
|
Name |
|
exercisable |
|
unexercisable |
|
exercise price |
|
expiration date |
| |
|
|
|
|
|
|
|
|
|
|
| |
|
Larry G. Badgley |
|
288,667 |
|
— |
|
$ |
1.20 |
|
October 1, 2015 |
|
Option Exercises and Stock Vesting
No stock options were exercised or stock grants to our executive officers vested at any time during fiscal 2014.
Information Related to Stock-Based Compensation
The Company accounts for its stock-based employee compensation plans pursuant to FASB ASC Topic 718-Stock Compensation. ASC Topic 718 requires all share-based payments to employees, including grants of employee stock options, to be recognized in our consolidated statements of operations based on their estimated fair values. We recognize expense on a straight-line basis over the vesting period of the option.
Pension Benefits and Non-Qualified Defined Contribution Plans
The Company does not sponsor any qualified or non-qualified defined benefit plans or non-qualified defined contribution plans. The Compensation Committee, which is comprised solely of “outside directors” as defined for purposes of Section 162(m) of the Code, may elect to adopt qualified or non-qualified defined benefit or non-qualified defined contribution plans if the Compensation Committee determines that doing so is in our best interests.
Non-Employee Director Compensation for Fiscal 2014
Our philosophy in determining director compensation is to align compensation with the long-term interests of the stockholders, adequately compensate the directors for their time and effort, and establish an overall compensation package that will attract and retain qualified directors. In determining overall director compensation, we seek to strike the right balance between the cash and stock components of director compensation. The Board’s policy is that the directors should hold equity ownership in the Company and that a portion of the director fees should consist of Company equity in the form of stock grants. The policy of the Company is and has always been that only non-management Directors receive compensation for service as a Director.
In June 2014, the Company’s Board of Directors engaged a third party compensation consulting firm to study and review the Board’s compensation practices. This study included a peer group of 17 small-cap oil and gas companies to compare Cubic’s compensation practices and policies. The companies included in the peer group study were: Abraxas Petroleum Corporation, Approach Resources Incorporated, Bonanza Creek Energy Incorporated, BPZ Resources Incorporated, Callon Petroleum Company, Emerald Oil Incorporated, Endeavour International Corporation, Forest Oil Corporation, Gastar Exploration Incorporated, Goodrich Petroleum Corporation, Matador Resources Company, Miller Energy Resources Incorporated, Panhandle Oil and Gas Incorporated, Penn Virginia Corporation, PetroQuest Energy Incorporated, Swift Energy Company and Warren Resources Incorporated. One of the key observations was that Cubic ranked near the bottom of the group in total director compensation. Based on the aforementioned study the Board modified its compensation, effective July 1, 2014. The Compensation Committee amended non-management Director Compensation to include a cash fee of $18,000 to be paid quarterly, at the beginning of each quarter. The Audit Committee Chair receives an additional cash payment of $2,500 to be paid quarterly, at the beginning of each quarter.
Our director compensation during fiscal 2014 was as follows:
· Prior to January 24, 2013, director compensation included: A meeting fee of $1,000 when attending in person and $500 when attending via teleconference [not to exceed a fee of $1,000 in any one day] for each Board or committee meeting attended; and annual stock grants of 40,000 shares of Common Stock for service on the Board of Directors; 20,000 shares of Common Stock for service on the Audit Committee; 10,000 shares of Common Stock for service on the Compensation Committee and/or the Nominating Committee; and an additional 10,000 shares of Common Stock for serving as the financial expert and Chairman of the Audit Committee.
· Beginning January 24, 2013, the Compensation Committee amended non-management Director Compensation to include: A quarterly cash fee of $4,000 cash per quarter (meeting payments discontinued) and the Audit Committee Chair received an additional $1,000 cash per quarter; and quarterly stock grants of 10,000 shares of Common Stock for service on the Board of Directors; 5,000 shares of Common Stock for service on the Audit Committee; 2,500 shares of Common Stock for service on the Compensation Committee and/or the Nominating Committee; and an additional 2,500 shares of Common Stock for serving as the financial expert and Chairman of the Audit Committee.
The following table sets forth the cash and other compensation paid to the non-employee members of our Board of Directors in fiscal 2014.
|
|
|
Fees Earned |
|
|
|
|
| |||
|
|
|
or Paid in |
|
Stock |
|
|
| |||
|
Name |
|
Cash |
|
Awards (1) |
|
Total |
| |||
|
Gene C. Howard |
|
$ |
36,080 |
|
$ |
14,000 |
|
$ |
50,080 |
|
|
Bob L. Clements |
|
33,883 |
|
12,250 |
|
46,133 |
| |||
|
David B. Brown |
|
39,080 |
|
14,000 |
|
53,080 |
| |||
|
Paul R. Ferretti |
|
33,185 |
|
10,500 |
|
43,685 |
| |||
|
Totals |
|
$ |
142,228 |
|
$ |
50,750 |
|
$ |
192,978 |
|
(1) The market value of these stock awards is based on the closing price on the grant date, which was $0.28 on July 3, 2013 and $0.42 on October 7, 2013, respectively.
Item 12. Security Ownership of Certain Beneficial Owners and Management and Related Stockholder Matters.
The following table sets forth the number of shares of the Company’s Common Stock beneficially owned, as of November 4, 2014 by (i) each person known to the Company to beneficially own more than 5% of the Common Stock of the Company (the only class of voting securities now outstanding), (ii) each director and Named Executive Officer, and (iii) all directors and executive officers as a group. Unless otherwise indicated, we consider all shares of Common Stock that can be issued under convertible securities or warrants currently or within 60 days of November 4, 2014 to be outstanding for the purpose of computing the percentage ownership of the person holding those securities, but do not consider those securities to be outstanding for computing the percentage ownership of any other person. Each owner’s percentage is calculated by dividing the number of shares beneficially held by that owner by the sum of 77,505,908, plus the number of shares that owner has the right to acquire within 60 days.
|
|
|
|
|
Approximate |
|
|
|
|
Number |
|
Percent of |
|
|
Name and Address |
|
of Shares |
|
Class (1) |
|
|
5% Stockholders |
|
|
|
|
|
|
|
|
|
|
|
|
|
Funds managed by Anchorage Capital Group, LLC |
|
74,811,987 |
(2) |
49.1 |
% |
|
610 Broadway, 6th Floor, New York, NY 10012 |
|
|
|
|
|
|
|
|
|
|
|
|
|
Funds managed by O-Cap Management, L.P. |
|
23,939,836 |
(2) |
23.6 |
% |
|
600 Madison Ave., 14th Floor, New York, NY 10022 |
|
|
|
|
|
|
|
|
|
|
|
|
|
William L. Bruggeman, Jr. |
|
17,666,471 |
(3) |
22.8 |
% |
|
20 Anemone Circle, North Oaks, MN 55127 |
|
|
|
|
|
|
|
|
|
|
|
|
|
Wells Fargo Energy Capital, Inc. |
|
8,939,154 |
(4) |
10.3 |
% |
|
1000 Louisiana 9th Floor, Houston, TX 77002 |
|
|
|
|
|
|
|
|
|
|
|
|
|
Named Executive Officers and Directors |
|
|
|
|
|
|
|
|
|
|
|
|
|
Calvin A. Wallen, III |
|
51,978,516 |
(5) |
46.8 |
% |
|
9870 Plano Road, Dallas, TX 75238 |
|
|
|
|
|
|
|
|
|
|
|
|
|
Bob L. Clements |
|
1,360,027 |
(6) |
1.8 |
% |
|
9870 Plano Road, Dallas, TX 75238 |
|
|
|
|
|
|
|
|
|
|
|
|
|
Gene C. Howard |
|
1,020,180 |
(7) |
1.3 |
% |
|
2402 East 29th St., Tulsa, OK 74114 |
|
|
|
|
|
|
|
|
|
|
|
|
|
Jon S. Ross |
|
433,000 |
(8) |
* |
|
|
9870 Plano Road, Dallas, TX 75238 |
|
|
|
|
|
|
|
|
|
|
|
|
|
Paul R. Ferretti |
|
183,507 |
|
* |
|
|
8 Edgewood Road, Yardley, PA 19067 |
|
|
|
|
|
|
|
|
|
|
|
|
|
David B. Brown |
|
243,507 |
|
* |
|
|
9870 Plano Road, Dallas, TX 75238 |
|
|
|
|
|
|
|
|
|
|
|
|
|
Larry G. Badgley |
|
288,667 |
(9) |
* |
|
|
9870 Plano Road, Dallas, TX 75238 |
|
|
|
|
|
|
|
|
|
|
|
|
|
Scott M. Pinsonnault |
|
— |
|
* |
|
|
9870 Plano Road, Dallas, TX 75238 |
|
|
|
|
|
|
|
|
|
|
|
|
|
All officers and directors as a group (8 persons) |
|
55,507,404 |
|
49.8 |
% |
* Denotes less than one percent
(1) Based on a total of 77,505,908 shares of Common Stock issued and outstanding on November 4, 2014.
(2) Consists of warrants to purchase shares of Common Stock. The holders of such warrants also hold Series C Redeemable Voting Preferred Stock that gives the holders the right to vote the shares subject to such warrants on an “as-converted” basis. The holders of these securities are parties to a voting agreement with Mr. Wallen pursuant to which they have agreed to vote together on certain matters.
(3) Includes 2,734,000 shares held by Diversified Dynamics Corporation, a company controlled by William Bruggeman; and, 14,932,471 shares owned by Mr. and Mrs. Bruggeman, as joint tenants with rights of survivorship.
(4) Includes warrants to purchase 8,500,000 shares and 439,154 shares issuable upon conversion of the 219.577 shares of Series B Convertible Preferred Stock of the Company. The Series B Convertible Preferred Stock votes with the Common Stock, on an as-converted basis.
(5) Includes: (a) 16,333,548 shares directly held by Mr. Wallen; (b) 500,000 shares held by Mr. Wallen’s spouse, (c) 874,000 shares held by certain children of Mr. Wallen; (d) 700,000 shares held by Tauren Exploration, Inc., a corporation wholly owned by Mr. Wallen; (e) 3,952,368 shares issuable upon conversion of 1,976.184 shares of Series B Convertible Preferred Stock of the Company held by Tauren; (f) 24,974,568 shares issuable upon conversion of 12,487.284 shares of Series B Convertible Preferred Stock of the Company held by Langtry Mineral & Development, LLC, an entity controlled Mr. Wallen; and (g) 4,644,032 shares issuable upon conversion of 2,322.016 shares of Series B Convertible Preferred Stock of the Company directly held by Mr. Wallen. The Series B Convertible Preferred Stock votes with the Common Stock, on an as-converted basis.
(6) Includes 390,287 shares held as joint tenants with rights of survivorship.
(7) Includes 322,245 shares are held by Mr. Howard’s spouse, of which Mr. Howard disclaims beneficial ownership.
(8) Includes 6,000 shares held by minor children.
(9) Includes 288,667 shares subject to a currently exercisable stock option.
Item 13. Certain Relationships and Related Transactions, and Director Independence.
Certain Relationships and Related Transactions
On December 1, 1997, as renewed and revised on January 1, 2002, the Company entered into a contract with Tauren to provide the necessary technical, administrative and management expertise needed to conduct its business. Tauren also paid various organization costs and consulting fees on behalf of the Company. The monthly amount charged to the Company was based on actual costs of materials and labor hours of Tauren that were used pursuant to the terms of the agreement. The agreement was terminated effective January 1, 2006, except as to the office sharing provisions, which were extended to June 30, 2007 and since continue on a month to month basis. The Company now has 12 full-time employees and one part-time employee and its offices are leased from Tauren. Effective, January 1, 2011, the Company signed a 2-year lease that charges the Company a monthly fee of $8,000 per month, with Tauren. Effective January 1, 2013, the Company signed a lease extension through September 30, 2013 and then through March 31, 2014. The Company then agreed to a month-to-month lease that charges the Company $8,000 per month. Charges to the Company under the contract and subsequent arrangements were $96,000 and $96,000 for the fiscal years 2014 and 2013.
Tauren owned a working interest in the wells in which the Company owns a working interest. As of the end of fiscal 2014 Tauren owed $3,333 to the Company, and as of the end of fiscal 2013 the Company owed $6,166 to Tauren for miscellaneous general and administrative expenses and royalties. Tauren owed the Company $2,765 and $38,756 for royalties paid by a third-party operator for fiscal years 2014 and 2013, respectively.
In addition, certain of the Company’s working interests are operated by an affiliated company, Fossil Operating, Inc. (“Fossil”), which is owned 100% by the Company’s President and Chief Executive Officer, Calvin A. Wallen III. At the end of fiscal years 2014 and 2013, the Company owed Fossil $33,533 and $0, respectively, for capital expenditures, the Company owed Fossil $264,705 and $27,949, respectively, for
drilling costs and lease and operating expenses, and was owed by Fossil $65,650 and $28,897, respectively, for oil and gas sales.
In addition, during fiscal 2014 and 2013, certain wells in which the Company owns a working interest were operated by Fossil. In consideration for Fossil serving as operator and to satisfy the Company’s working interest obligations related to drilling costs and lease operating expenses, Cubic paid to Fossil an aggregate of $4,045,580 and $439,874, during fiscal 2014 and 2013, respectively; and Fossil paid Cubic an aggregate of $347,905 and $252,532, during fiscal 2014 and 2013, respectively for oil and gas sales.
From March, 2013 through September 2013, the Company borrowed $4,400,000 from Pandale Holding, Inc. (“Pandale”), an affiliate wholly owned by Calvin Wallen III, President and Chief Executive Officer for the Company, to make payments towards the required deposits towards the purchase the Gastar East Texas assets. In total, the Company paid $4,700,000 in deposits to Gastar. Pandale had to obtain most or all of these $4,400,000 funds loaned to the Company from unrelated third parties. Upon closing of the transactions and borrowings on October 2, 2013, the Company had to re-pay Pandale the $4,400,000 borrowed, $896,667 in interest on the amounts borrowed, $1,000,000 in assessed origination fees and $180,000 in administrative fees charged. Neither, Mr. Wallen or Pandale made any profit from the loan transactions.
On December 18, 2009, the Company issued the Wallen Note, which was subordinated to all WFEC indebtedness. The Wallen Note bore interest at the prime rate plus one percent (1%), and originally provided for interest payable monthly. The proceeds of the Wallen Note were used to repay the previous indebtedness of the Company that was payable to a former director. The Wallen Note was cancelled as part of the overall capital refinancing of the Company following June 30, 2013 (see Note E — Long-Term Debt).
See also Item 1 - Business, for certain other transactions in which Mr. Wallen and his affiliates participated.
Item 14. Principal Accountant Fees and Services.
Our estimated audit fees for services provided by BDO USA, LLP, our independent registered accounting firm, are $255,000 for professional services rendered for the year ended June 30, 2014. There were no fees incurred by BDO USA, LLP for the year ended June 30, 2013.
Audit Committee Pre-Approval Policies and Procedures
In accordance with Company policy, any audit or non-audit services must be approved in advance. All of the professional services provided by Vogel-CPAs, PC (formerly Philip Vogel & Co., PC), our prior independent registered accounting firm, during the years ended June 30, 2014 and June 30, 2013 were pre-approved in accordance with the policies of our Audit Committee.
Item 15. Exhibits and Financial Statement Schedules.
(a) (1) and (2) Financial Statements and Financial Statement Schedules
See “Index to Financial Statements”.
(a) (3) Exhibits
See the Exhibit Index immediately preceding the Exhibits filed with this report.
SIGNATURES
Pursuant to requirements of Section 13 or 15(d) of the Securities Exchange Act of 1934, the registrant has duly caused this report to be signed on its behalf by the undersigned; thereunto duly authorized, on November 10, 2014.
|
|
CUBIC ENERGY, INC. | |
|
|
| |
|
|
By: |
/s/ Calvin A. Wallen, III |
|
|
|
Calvin A. Wallen, III |
|
|
|
President and Chief |
|
|
|
Executive Officer |
|
|
| |
|
|
By: |
/s/ Larry G. Badgley |
|
|
|
Larry G. Badgley |
|
|
|
Chief Financial Officer |
Pursuant to requirements of the Securities Exchange Act of 1934, this report has been signed below by the following persons on behalf of the registrant and in the capacities and on the dates indicated.
|
Signature |
|
Title |
|
Date |
|
|
|
|
|
|
|
/s/ Calvin A. Wallen, III |
|
Chairman, President and Chief Executive Officer (principal executive officer) |
|
November 10, 2014 |
|
Calvin A. Wallen, III |
| |||
|
|
|
|
|
|
|
/s/ Larry G. Badgley |
|
Chief Financial Officer (principal financial and accounting officer) |
|
November 10, 2014 |
|
Larry G. Badgley |
| |||
|
|
|
|
|
|
|
/s/ Jon S. Ross |
|
Executive Vice President, Secretary and Director |
|
November 10, 2014 |
|
Jon S. Ross |
| |||
|
|
|
|
|
|
|
/s/ Gene C. Howard |
|
Director |
|
November 10, 2014 |
|
Gene C. Howard |
| |||
|
|
|
|
|
|
|
/s/ Bob L. Clements |
|
Director |
|
November 10, 2014 |
|
Bob L. Clements |
| |||
|
|
|
|
|
|
|
/s/ David B. Brown |
|
Director |
|
November 10, 2014 |
|
David B. Brown |
| |||
|
|
|
|
|
|
|
/s/Paul R. Ferretti |
|
Director |
|
November 10, 2014 |
|
Paul R. Ferretti |
|
CUBIC ENERGY, INC.
INDEX TO FINANCIAL STATEMENTS
JUNE 30, 2014
|
|
|
Page |
|
|
|
|
|
|
F-1 | |
|
|
|
|
|
Financial Statements: |
|
|
|
|
|
|
|
|
F-3 | |
|
|
|
|
|
|
F-4 | |
|
|
|
|
|
|
F-5 | |
|
|
|
|
|
|
F-6 | |
|
|
|
|
|
|
F-7 |
REPORT OF INDEPENDENT REGISTERED PUBLIC ACCOUNTING FIRM
To the Board of Directors and Stockholders of Cubic Energy, Inc.,
We have audited the accompanying consolidated balance sheet of Cubic Energy, Inc., a Texas corporation, as of June 30, 2014, and the related consolidated statements of operations, of changes in stockholders’ deficit and of cash flows for the year then ended. These financial statements are the responsibility of the Company’s management. Our responsibility is to express an opinion on these financial statements based on our audit.
We conducted our audit in accordance with the standards of the Public Company Accounting Oversight Board (United States). Those standards require that we plan and perform the audit to obtain reasonable assurance about whether the financial statements are free of material misstatement. The Company is not required to have, nor were we engaged to perform, an audit of its internal control over financial reporting. Our audit included consideration of internal control over financial reporting as a basis for designing audit procedures that are appropriate in the circumstances, but not for the purpose of expressing an opinion on the effectiveness of the Company’s internal control over financial reporting. Accordingly, we express no such opinion. An audit includes examining, on a test basis, evidence supporting the amounts and disclosures in the financial statements. An audit also includes assessing the accounting principles used and significant estimates made by management, as well as evaluating the overall financial statement presentation. We believe that our audit provides a reasonable basis for our opinion.
In our opinion, the consolidated financial statements referred to above present fairly, in all material respects, the financial position of Cubic Energy, Inc. as of June 30, 2014, and the results of its operations and its cash flows for the year then ended, in conformity with accounting principles generally accepted in the United States of America.
The accompanying financial statements have been prepared assuming that the Company will continue as a going concern. As discussed in Note A to the consolidated financial statements, the Company has suffered recurring losses from operations, has violated covenants of its debt agreements, has a working capital deficit and has a net capital deficiency that raise substantial doubt about its ability to continue as a going concern. Management’s plans in regard to these matters are also described in Note A. The financial statements do not include any adjustments that might result from the outcome of this uncertainty.
|
|
BDO USA, LLP |
Dallas, Texas
November 10, 2014
REPORT OF INDEPENDENT REGISTERED PUBLIC ACCOUNTING FIRM
To the Board of Directors and Stockholders of Cubic Energy, Inc.,
We have audited the balance sheet of Cubic Energy, Inc., a Texas corporation, as of June 30, 2013, and the related statements of operations, of changes in stockholders’ equity and of cash flows for the year ended June 30, 2013. These financial statements are the responsibility of the Company’s management. Our responsibility is to express an opinion on these financial statements based on our audit.
We conducted our audit in accordance with the standards of the Public Company Accounting Oversight Board (United States). Those standards require that we plan and perform the audit to obtain reasonable assurance about whether the financial statements are free of material misstatement. The Company is not required to have, nor were we engaged to perform, an audit of its internal control over financial reporting. Our audit included consideration of internal control over financial reporting as a basis for designing audit procedures that are appropriate in the circumstances, but not for the purpose of expressing an opinion on the effectiveness of the Company’s internal control over financial reporting. Accordingly, we express no such opinion. An audit includes examining, on a test basis, evidence supporting the amounts and disclosures in the financial statements. An audit also includes assessing the accounting principles used and significant estimates made by management, as well as evaluating the overall financial statement presentation. We believe that our audit provides a reasonable basis for our opinion.
In our opinion, the financial statements referred to above present fairly, in all material respects, the financial position of Cubic Energy, Inc. as of June 30, 2013, and the results of its operations and its cash flows for the year ended June 30, 2013, in conformity with accounting principles generally accepted in the United States of America.
|
|
Vogel-CPAs, PC |
|
|
(Formerly Philip Vogel & Co., PC) |
|
|
|
|
|
Certified Public Accountants |
Dallas, Texas
October 15, 2013
CUBIC ENERGY, INC.
JUNE 30, 2014 AND 2013
|
|
|
2014 |
|
2013 |
| ||
|
Assets |
|
|
|
|
| ||
|
Current assets: |
|
|
|
|
| ||
|
Cash and cash equivalents |
|
$ |
6,857,970 |
|
$ |
260,576 |
|
|
Accounts receivable |
|
2,026,210 |
|
586,174 |
| ||
|
Due from affiliate |
|
— |
|
1,678 |
| ||
|
Prepaid expenses |
|
1,514,302 |
|
156,892 |
| ||
|
Total current assets |
|
10,398,482 |
|
1,005,320 |
| ||
|
Property and equipment: |
|
|
|
|
| ||
|
Oil and natural gas properties, full cost method of accounting: |
|
|
|
|
| ||
|
Proved properties |
|
126,041,447 |
|
33,828,079 |
| ||
|
Unproved properties |
|
8,227,109 |
|
— |
| ||
|
Office and other equipment |
|
78,733 |
|
30,227 |
| ||
|
Oil and gas properties, and equipment |
|
134,347,289 |
|
33,858,306 |
| ||
|
Less accumulated depreciation, depletion and amortization |
|
26,914,972 |
|
19,134,081 |
| ||
|
Oil and gas properties, and equipment, net |
|
107,432,317 |
|
14,724,225 |
| ||
|
Other assets: |
|
|
|
|
| ||
|
Cash restricted under loan agreement |
|
5,000,000 |
|
— |
| ||
|
Deferred loan costs, net |
|
2,140,343 |
|
— |
| ||
|
Acquisition costs - deposits |
|
— |
|
2,300,000 |
| ||
|
Total other assets |
|
7,140,343 |
|
2,300,000 |
| ||
|
|
|
$ |
124,971,142 |
|
$ |
18,029,545 |
|
|
Liabilities and stockholders’ equity (deficit) |
|
|
|
|
| ||
|
Current liabilities: |
|
|
|
|
| ||
|
Notes payable - WFEC - term note |
|
$ |
— |
|
$ |
5,000,000 |
|
|
Notes payable - WFEC |
|
24,880,936 |
|
20,865,110 |
| ||
|
Notes payable to affiliate |
|
— |
|
2,000,000 |
| ||
|
Notes payable, net of discounts - Senior Notes |
|
43,090,338 |
|
— |
| ||
|
Fair value of derivative contracts |
|
8,065,417 |
|
— |
| ||
|
Due to affilliates |
|
232,021 |
|
2,000,000 |
| ||
|
Accounts payable and accrued expenses |
|
7,127,573 |
|
1,331,609 |
| ||
|
Total current liabilities |
|
83,396,284 |
|
31,196,719 |
| ||
|
Long-term liabilities: |
|
|
|
|
| ||
|
Asset retirement obligation |
|
1,916,276 |
|
— |
| ||
|
Warrants liabilities |
|
16,290,341 |
|
— |
| ||
|
Fair value of derivatives |
|
25,052,008 |
|
— |
| ||
|
|
|
|
|
|
| ||
|
Total liabilities |
|
126,654,909 |
|
— |
| ||
|
|
|
|
|
|
| ||
|
Redeemable preferred stock - Series C, authorized 98,751.823 shares; $0.01 stated value, voting, redeemable at $0.01; 98,751.823 shares issued and outstanding at June 30, 2014 and none at June 30, 2013 |
|
988 |
|
— |
| ||
|
Stockholders’ equity (deficit): |
|
|
|
|
| ||
|
Preferred stock - $.01 par value; authorized 10,000,000 shares; |
|
|
|
|
| ||
|
Preferred stock - 8% Series A, authorized 165,000 shares $100 stated value, voting, redeemable at $120, convertible at $1.20 per common share, canceled February 2014 |
|
— |
|
1,181 |
| ||
|
Additional paid-in capital - preferred stock - Series A (see Note C) |
|
— |
|
11,810,119 |
| ||
|
|
|
|
|
|
| ||
|
Preferred stock 9.5% Series B, authorized 35,000 shares $1,000 stated value, voting, convertible at $0.50 per common share; with 16,928.047 shares outstanding at June 30, 2014 and none at June 30, 2013 |
|
3,114,761 |
|
— |
| ||
|
Additional paid-in capital - preferred stock - Series B (see Note C) |
|
12,424,073 |
|
— |
| ||
|
Common stock - $.05 par value; authorized 400,000,000 shares; issued and outstanding 77,505,908 shares at June 30, 2014 and 77,360,908 shares at June 30, 2013 |
|
3,875,297 |
|
3,868,047 |
| ||
|
Additional paid-in capital - common stock |
|
56,954,045 |
|
56,910,545 |
| ||
|
Accumulated deficit |
|
(78,052,931 |
) |
(85,757,066 |
) | ||
|
Total stockholders’ equity (deficit) |
|
(1,684,755 |
) |
(13,167,174 |
) | ||
|
Total liabilities and stockholders’ equity (deficit) |
|
$ |
124,971,142 |
|
$ |
18,029,545 |
|
The accompanying notes are an integral part of these statements.
CUBIC ENERGY, INC.
CONSOLIDATED STATEMENTS OF OPERATIONS
FOR THE YEARS ENDED JUNE 30, 2014 AND 2013
|
|
|
2014 |
|
2013 |
| ||
|
Revenues: |
|
|
|
|
| ||
|
|
|
|
|
|
| ||
|
Oil and gas sales |
|
$ |
15,849,482 |
|
$ |
3,843,420 |
|
|
Total revenues |
|
$ |
15,849,482 |
|
$ |
3,843,420 |
|
|
Operating costs and expenses: |
|
|
|
|
| ||
|
Oil and natural gas production and operating costs |
|
9,002,020 |
|
1,872,186 |
| ||
|
Accretion of asset retirement obligations |
|
339,954 |
|
— |
| ||
|
General and administrative expenses |
|
6,244,861 |
|
2,332,946 |
| ||
|
Depreciation, depletion and amortization |
|
7,790,112 |
|
3,248,260 |
| ||
|
Total operating costs and expenses |
|
23,376,947 |
|
7,453,392 |
| ||
|
Operating loss |
|
(7,527,465 |
) |
(3,609,972 |
) | ||
|
Non-operating income (expense): |
|
|
|
|
| ||
|
Other income |
|
12,530 |
|
666,270 |
| ||
|
Amortization of loan costs |
|
(700,476 |
) |
(520,000 |
) | ||
|
Loss on derivative contracts |
|
(3,056,053 |
) |
— |
| ||
|
Interest expense |
|
(19,313,106) |
|
(2,470,516 |
) | ||
|
Gain on acquisition of assets at fair market value |
|
22,578,000 |
|
— |
| ||
|
Change in fair value of warrant liabilities |
|
17,120,692 |
|
— |
| ||
|
Total non-operating income (expense) |
|
16,641,587 |
|
(2,324,246 |
) | ||
|
Income (loss) before income taxes |
|
9,114,122 |
|
(5,934,218 |
) | ||
|
Provision for income taxes |
|
— |
|
— |
| ||
|
Net income (loss) |
|
$ |
9,114,122 |
|
$ |
(5,934,218 |
) |
|
Dividends on preferred shares |
|
(1,409,987 |
) |
(917,300 |
) | ||
|
Net income (loss) attributable to common shareholders |
|
7,704,135 |
|
(6,851,518 |
) | ||
|
Net income (loss) per common share - basic |
|
$ |
0.10 |
|
$ |
(0.09 |
) |
|
Net income (loss) per common share - diluted |
|
$ |
0.08 |
|
$ |
(0.09 |
) |
|
Weighted average common shares outstanding - basic |
|
77,485,846 |
|
77,263,381 |
| ||
|
Weighted average common shares outstanding - diluted |
|
93,175,857 |
|
— |
| ||
The accompanying notes are an integral part of these statements.
CUBIC ENERGY, INC.
CONSOLIDATED STATEMENTS OF CHANGES IN STOCKHOLDERS’ DEFICIT
FOR THE YEARS ENDED JUNE 30, 2014 AND 2013
|
|
|
Number of Shares |
|
Prefered Stock |
|
Common Stock |
|
|
|
|
| |||||||||||||||||
|
|
|
Series A |
|
Series B |
|
|
|
Series A |
|
Series B |
|
Additional |
|
|
|
Additional |
|
|
|
Total |
| |||||||
|
|
|
Preferred |
|
Preferred |
|
Common |
|
Preferred |
|
Preferred |
|
paid-in |
|
Common |
|
paid-in |
|
Accumulated |
|
stockholders’ |
| |||||||
|
|
|
Stock |
|
Stock |
|
Stock |
|
Stock |
|
Stock |
|
capital |
|
Stock |
|
Common Stock |
|
deficit |
|
equity (deficit) |
| |||||||
|
|
|
|
|
|
|
|
|
|
|
|
|
|
|
|
|
|
|
|
|
|
| |||||||
|
Balance, June 30, 2012 |
|
109,124 |
|
— |
|
77,215,908 |
|
$ |
1,091 |
|
$ |
— |
|
$ |
10,911,309 |
|
$ |
3,860,797 |
|
$ |
55,963,830 |
|
$ |
(78,905,548 |
) |
$ |
(8,168,521 |
) |
|
|
|
|
|
|
|
|
|
|
|
|
|
|
|
|
|
|
|
|
|
|
| |||||||
|
Pref. Stock issued for dividends |
|
8,989 |
|
— |
|
— |
|
90 |
|
— |
|
898,810 |
|
— |
|
— |
|
— |
|
898,900 |
| |||||||
|
Warrant issued for loan costs |
|
— |
|
— |
|
— |
|
— |
|
— |
|
— |
|
— |
|
902,161 |
|
— |
|
902,161 |
| |||||||
|
Stock issued under compensation plan |
|
— |
|
— |
|
145,000 |
|
— |
|
— |
|
— |
|
7,250 |
|
27,188 |
|
— |
|
34,438 |
| |||||||
|
Stock option compensation |
|
— |
|
— |
|
— |
|
— |
|
— |
|
— |
|
— |
|
17,366 |
|
— |
|
17,366 |
| |||||||
|
Preferred Stock Dividends |
|
— |
|
— |
|
— |
|
— |
|
— |
|
— |
|
— |
|
— |
|
(917,300 |
) |
(917,300 |
) | |||||||
|
Net loss, year ended June 30, 2013 |
|
— |
|
— |
|
— |
|
— |
|
— |
|
— |
|
— |
|
— |
|
(5,934,218 |
) |
(5,934,218 |
) | |||||||
|
|
|
|
|
|
|
|
|
|
|
|
|
|
|
|
|
|
|
|
|
|
| |||||||
|
Balance, June 30, 2013 |
|
118,113 |
|
0 |
|
77,360,908 |
|
$ |
1,181 |
|
$ |
— |
|
$ |
11,810,119 |
|
$ |
3,868,047 |
|
$ |
56,910,545 |
|
$ |
(85,757,066 |
) |
$ |
(13,167,174 |
) |
|
|
|
|
|
|
|
|
|
|
|
|
|
|
|
|
|
|
|
|
|
|
| |||||||
|
Preferred Stock Series A dividends |
|
2,355 |
|
— |
|
— |
|
24 |
|
— |
|
235,476 |
|
— |
|
— |
|
— |
|
235,500 |
| |||||||
|
Preferred Stock Series A exchanged/cancelled |
|
(120,468 |
) |
— |
|
— |
|
(1,205 |
) |
— |
|
(12,045,595 |
) |
— |
|
— |
|
— |
|
(12,046,800 |
) | |||||||
|
Preferred Stock Series B exchanged |
|
— |
|
16,162 |
|
— |
|
— |
|
2,973,808 |
|
11,798,978 |
|
— |
|
— |
|
— |
|
14,772,786 |
| |||||||
|
Preferred Stock Series B dividends |
|
— |
|
766 |
|
— |
|
— |
|
140,953 |
|
625,095 |
|
— |
|
— |
|
— |
|
766,048 |
| |||||||
|
Stock issued under compensation plan |
|
— |
|
— |
|
145,000 |
|
— |
|
— |
|
— |
|
7,250 |
|
43,500 |
|
— |
|
50,750 |
| |||||||
|
Preferred Stock Dividends |
|
— |
|
— |
|
— |
|
— |
|
— |
|
— |
|
— |
|
— |
|
(1,409,987 |
) |
(1,409,987 |
) | |||||||
|
|
|
|
|
|
|
|
|
|
|
|
|
|
|
|
|
|
|
|
|
|
| |||||||
|
Net income, year ended June 30, 2014 |
|
— |
|
— |
|
— |
|
— |
|
— |
|
— |
|
— |
|
— |
|
9,114,122 |
|
9,114,122 |
| |||||||
|
|
|
|
|
|
|
|
|
|
|
|
|
|
|
|
|
|
|
|
|
|
| |||||||
|
Balance, June 30, 2014 |
|
— |
|
16,928 |
|
77,505,908 |
|
$ |
— |
|
$ |
3,114,761 |
|
$ |
12,424,073 |
|
$ |
3,875,297 |
|
$ |
56,954,045 |
|
$ |
(78,052,931 |
) |
$ |
(1,684,755 |
) |
CUBIC ENERGY, INC.
CONSOLIDATED STATEMENTS OF CASH FLOWS
FOR THE YEARS ENDED JUNE 30, 2014 AND 2013
|
|
|
2014 |
|
2013 |
| ||
|
Cash flows from operating activities: |
|
|
|
|
| ||
|
Net income (loss) |
|
$ |
9,114,122 |
|
$ |
(5,934,218 |
) |
|
Adjustments to reconcile net (loss) to cash provided (used) by operating activities: |
|
|
|
|
| ||
|
Depreciation, depletion and amortization |
|
7,790,112 |
|
4,410,420 |
| ||
|
Gain on acquisition of assets at fair market value |
|
(22,578,000 |
) |
— |
| ||
|
Accretion of ARO |
|
339,954 |
|
— |
| ||
|
Amortization of loan costs |
|
700,476 |
|
— |
| ||
|
Amortization of debt discount |
|
8,425,137 |
|
— |
| ||
|
Unrealized loss on derivative contracts |
|
3,056,053 |
|
— |
| ||
|
Paid-in-kind interest expense |
|
2,834,800 |
|
— |
| ||
|
Settlement of derivative swaps |
|
(309,555 |
) |
— |
| ||
|
Change in fair value of warrants liabilities |
|
(17,120,692 |
) |
— |
| ||
|
Board of directors non-cash compensation |
|
50,750 |
|
51,805 |
| ||
|
Change in assets and liabilities: |
|
|
|
|
| ||
|
(Increase) decrease in accounts receivable |
|
(1,440,036 |
) |
1,982,075 |
| ||
|
Increase in prepaid expenses |
|
(1,357,410 |
) |
(62,375 |
) | ||
|
Increase (decrease) in accounts payable |
|
|
|
|
| ||
|
and accrued expenses |
|
5,745,510 |
|
(361,252 |
) | ||
|
Increase (decrease) in due to affiliates |
|
233,699 |
|
(32,251 |
) | ||
|
Net cash provided (used) by operating activities |
|
(4,515,080 |
) |
54,204 |
| ||
|
Cash flows from investing activities: |
|
|
|
|
| ||
|
Additions to oil and gas properties |
|
(9,397,734 |
) |
(450,440 |
) | ||
|
Decrease in capital portion of due to affiliates |
|
— |
|
(1,602 |
) | ||
|
Purchase of office equipment |
|
— |
|
(1,806 |
) | ||
|
Deposit on Acquisition |
|
— |
|
(2,300,000 |
) | ||
|
Reimbursement of advances on development costs |
|
— |
|
10,079,583 |
| ||
|
Net cash paid for acquisition of properties |
|
(64,278,148 |
) |
— |
| ||
|
Net cash provided (used) by investing activities |
|
(73,675,882 |
) |
7,325,735 |
| ||
|
Cash flows from financing activities: |
|
|
|
|
| ||
|
Proceeds from long-term debt |
|
31,831,389 |
|
— |
| ||
|
Proceeds from warrant liability |
|
33,411,033 |
|
— |
| ||
|
Proceeds from derivative calls |
|
35,091,536 |
|
— |
| ||
|
Settlement costs paid under derivative calls |
|
(4,720,609 |
) |
— |
| ||
|
Proceeds from revolver |
|
4,015,826 |
|
— |
| ||
|
Increase in restricted cash |
|
(5,000,000 |
) |
— |
| ||
|
Repayment of advances from affiliates |
|
(2,000,000 |
) |
— |
| ||
|
Repayment of long-term debt |
|
(5,000,000 |
) |
(9,134,890 |
) | ||
|
Proceeds from advances from affiliate |
|
— |
|
2,000,000 |
| ||
|
Loan costs incurred and other |
|
(2,840,819 |
) |
(260,000 |
) | ||
|
Net cash provided (used) by financing activities |
|
84,788,356 |
|
(7,394,890 |
) | ||
|
Net increase (decrease) in cash and cash equivalents |
|
$ |
6,597,394 |
|
$ |
(14,951 |
) |
|
Cash and cash equivalents: |
|
|
|
|
| ||
|
Beginning of year |
|
260,576 |
|
275,527 |
| ||
|
End of year |
|
$ |
6,857,970 |
|
$ |
260,576 |
|
|
Other information: |
|
|
|
|
| ||
|
Cash interest paid on debt |
|
$ |
4,464,341 |
|
$ |
1,521,180 |
|
|
Non-cash investing and financing activities: |
|
|
|
|
| ||
|
Issuance of preferred stock in connection with acquisiton of properties |
|
$ |
368,000 |
|
$ |
— |
|
|
Note payable and accrued interest due to affiliate converted to preferred stock |
|
$ |
2,114,986 |
|
$ |
— |
|
|
Increase in prepaid drilling credit from acquisition and development of oil and natural gas properties |
|
$ |
— |
|
$ |
917,300 |
|
|
Fair value of warrants issued in connection with debt |
|
$ |
— |
|
$ |
902,161 |
|
|
Fair value of change in warrant exercise price |
|
$ |
— |
|
$ |
898,900 |
|
|
Dividends paid through issuance of series A and B preferred stock |
|
$ |
1,009,047 |
|
$ |
— |
|
|
Non-cash additions to oil and gas properties through ARO |
|
$ |
1,576,322 |
|
|
— |
|
The accompanying notes are an integral part of these statements.
CUBIC ENERGY, INC.
NOTES TO CONSOLIDATED FINANCIAL STATEMENTS
Note A - Background and general:
The Company is an independent energy company engaged in the development and production of, and exploration for, crude oil, natural gas and natural gas liquids. Our oil and gas assets are concentrated in Texas and Louisiana.
Cubic Energy, Inc. is the parent company of two wholly owned direct subsidiaries, Cubic Asset Holding LLC, a Delaware limited liability company, and Cubic Louisiana Holding LLC, a Delaware limited liability company, and two wholly owned indirect subsidiaries Cubic Asset LLC, a Delaware limited liability company and a direct subsidiary of Cubic Asset Holding LLC, and Cubic Louisiana LLC, a Delaware limited liability company and a direct subsidiary of Cubic Louisiana Holding LLC. Unless the context otherwise requires the Company herein refer to the Company and its subsidiaries, on a consolidated basis.
Going Concern Considerations
The accompanying consolidated financial statements have been prepared assuming the Company will continue as a going concern, which contemplates, among other things, the realization of assets and satisfaction of liabilities in the ordinary course of business.
As of June 30, 2014, the Company had an accumulated deficit of $78,052,931 and recurring losses from operations. The Company also had working capital deficit of approximately $72,997,802. As part of the working capital deficit, the Company has classified its senior notes and WFEC credit facility as current liabilities, due to non-compliance with its debt covenants.
On July 14, 2014, the Company entered into a Forbearance and Waiver Agreement (the “Agreement”) with the holders of the Senior Notes due October 2016 (“Notes”) and certain other parties thereto. The Amendment includes additional covenants including, among others, that by September 30, 2014, the Company will identify a Strategic Transaction, as defined in the Agreement, that will result in the payment in full, in cash, of all amounts owing to the holders of the Notes, or a joint venture, strategic alliance or other transaction satisfactory to the holders of the Notes. We continue to explore alternatives with respect to a Strategic Transaction, although we did not enter into a definitive agreement by October 17, 2014. We are in discussions with the holders of the Notes with respect to available alternatives. Unless the requirement regarding a Strategic Transaction is waived, or we obtain an extension of time, the holders of the Notes could declare a default under the Note Purchase Agreement, accelerate the indebtedness represented by the Notes and exercise all other remedies available to them, including foreclosing on our assets.
We believe we have complied with the other terms of the forbearance agreement; however, there can be no assurance that we will be successful in consummating a Strategic Transaction within the mandated time period.
CUBIC ENERGY, INC.
NOTES TO CONSOLIDATED FINANCIAL STATEMENTS
Acquisitions
In October 2013, we acquired proven reserves, oil & natural gas production and undeveloped leasehold interests in Leon and Robertson Counties, Texas, that puts us in the additional reservoir rich environments in the Eagle Ford, Woodbine, Austin Chalk, Buda, Glen Rose and Georgetown formations, with additional shallow formations to exploit as well. We also acquired additional rights in our leasehold interests in DeSoto and Caddo Parishes, Louisiana. The acquisitions are summarized as follows:
· The Company consummated the transactions contemplated a Purchase and Sale Agreement dated as of April 19, 2013 (the “Gastar Agreement”) with Gastar and Gastar Exploration USA, Inc. Pursuant to the Gastar Agreement, the Company acquired proven reserves, oil & natural gas production and undeveloped leasehold interests in Leon and Robertson Counties, Texas. The acquisition price paid by the Company at closing was $39,188,300, following various adjustments set forth in the Gastar Agreement, and net of the various deposits paid prior to the closing date. For purposes of allocating revenues and expenses and capital costs between Gastar and us, such amounts were netted effective January 1, 2013 and have been recorded as an adjustment to the purchase price.
· The Company also consummated the transactions contemplated by a Purchase and Sale Agreement dated as of September 27, 2013 (the “Navasota Agreement”) with Navasota. Pursuant to the Navasota Agreement, the Company acquired proven reserves, oil & natural gas production and undeveloped leasehold interests in Leon and Robertson Counties, Texas. The leasehold interests acquired consists of additional fractional interests in the properties acquired pursuant to the Gastar Agreement. The acquisition price paid by the Company was $19,400,000, prior to certain post-closing adjustments.
· In addition, the Company entered into and consummated the transactions contemplated by a Purchase and Sale Agreement with Tauren dated as of October 2, 2013 (the “Tauren Agreement”) with Tauren Exploration, Inc. (“Tauren”), an entity controlled by Calvin A. Wallen, III, our Chairman of the Board, President, Chief Executive Officer and significant shareholder (“Mr. Wallen”). Pursuant to the Tauren Agreement, the Company acquired well bores, proven reserves, oil & natural gas production and undeveloped leasehold interests in the Cotton Valley formation in DeSoto and Caddo Parishes, Louisiana. The acquired properties include leasehold interests. The acquisition price paid by the Company was $4,000,000 in cash and 2,000 shares of the Company’s Series B Convertible Preferred Stock with an aggregate stated value of $2,000,000 and a fair value of $368,000. The Tauren Agreement was unanimously approved by the Company’s board of directors, excluding Mr. Wallen.
The following table shows the purchase price allocation for these transactions:
|
|
|
|
|
Gastar Acquired |
|
Navasota Acquired |
|
Tauren Acquired |
| ||||
|
Purchase Price Allocation - ($000’s) |
|
Total |
|
Properties |
|
Properties |
|
Properties |
| ||||
|
Assets acquired: |
|
|
|
|
|
|
|
|
| ||||
|
Unproved oil and natural gas properties |
|
$ |
7,101 |
|
$ |
6,029 |
|
$ |
1,072 |
|
$ |
— |
|
|
Proved developed and undeveloped oil and natural gas properties |
|
89,373 |
|
42,446 |
|
19,981 |
|
26,946 |
| ||||
|
Liabilities assumed: |
|
|
|
|
|
|
|
|
| ||||
|
Asset retirement obligations |
|
1,500 |
|
1,005 |
|
495 |
|
— |
| ||||
|
Net assets acquired |
|
$ |
94,974 |
|
$ |
47,470 |
|
$ |
20,558 |
|
$ |
26,946 |
|
CUBIC ENERGY, INC.
NOTES TO CONSOLIDATED FINANCIAL STATEMENTS
The Gastar and Navasota East Texas assets consisted of working interest in the same properties. Tauren assets consisted of working interest in properties already owned by Cubic. The following table shows the postacquisition revenue and operating income for each separate acquisition:
|
|
|
(Unaudited) Year |
| ||||
|
|
|
Ended June 30, 2014 |
| ||||
|
|
|
Revenue |
|
Operating Income |
| ||
|
|
|
|
|
|
| ||
|
East Texas assets |
|
$ |
10,540,560 |
|
$ |
3,252,144 |
|
|
Tauren assets |
|
$ |
258,631 |
|
$ |
(58,893 |
) |
The following summarizes the pro forma revenue and net income (loss) from the acquired assets for the years ended June 30, 2014 and 2013, as if these transactions had occurred on July 1, 2012:
|
|
|
(Unaudited)Year Ended |
| ||||
|
|
|
June 30, |
| ||||
|
Pro forma Results of Operations |
|
2014 |
|
2013 |
| ||
|
Oil and natural gas revenues |
|
$ |
19,684,324 |
|
$ |
21,255,429 |
|
|
Net income |
|
$ |
10,964,361 |
|
$ |
1,835,050 |
|
|
Basic earnings per share |
|
$ |
0.14 |
|
$ |
0.02 |
|
|
Diluted earnings per share |
|
$ |
0.12 |
|
$ |
0.01 |
|
The Company recognized a gain on acquisition of $22,578,000 in its statement of operations and pro forma results of operations, as a bargain purchase gain, as a result of incorporating the valuation information into the purchase price allocation. The Company’s assessment of the fair value of the properties acquired from Tauren, along with consideration of data prepared by a third party, resulted in a fair market valuation of $26,946,000. The acquisition price paid by the Company was $4,000,000 in cash and 2,000 shares of the Company’s Series B Convertible Preferred Stock with an aggregate stated value of $2,000,000 and a fair value of $368,000.
The necessary inputs (proven property and transportation infrastructure), processes (exploration and production activities) and outputs (production revenues) existed at the purchase date of the properties acquired from Tauren, which permitted the Company to conclude that the properties acquired from Tauren constituted a “business” under ASC 805.
The Company’s assessment of the fair value of the properties acquired from Tauren, along with consideration of a reserve report and a business valuation prepared by third parties, resulted in a valuation of the properties acquired from Tauren of $26,946,000. The Company utilized relevant market assumptions to determine fair value, such as future commodity prices, projections of estimated natural gas and oil reserves, expectations for future development and operating costs, projections of future rates of production, expected recovery rates and market multiples for similar transactions. As a result of the application of the acquisition method under ASC 805, the Company recognized a bargain purchase gain pursuant to paragraph 805-30-25-2 in an amount equal to the excess of the fair value of the acquired properties over the fair value of the aggregate consideration paid.
In connection with these acquisitions, the Company incurred expenses of $1,726,906 which are recognized in general and administrative expenses in the statement of operations.
Note B - Significant accounting policies:
Cash equivalents
For purposes of the statements of cash flows and balance sheets, the Company considers all certificates of deposit and other financial instruments with original maturity dates of three months or less to be cash equivalents.
CUBIC ENERGY, INC.
NOTES TO CONSOLIDATED FINANCIAL STATEMENTS
Accounts Receivable
The Company has receivables from affiliated and non-affiliated third-party operators and oil and gas purchasers that are generally uncollateralized. The Company reviews these parties for creditworthiness and general financial condition. Accounts receivable are generally due within 30 days and accounts outstanding longer than 60 days are considered past due. If necessary, the Company would determine an allowance by considering the length of time past due, previous loss history and the payor’s ability to pay its obligation, among other things. The Company writes off accounts receivable when they are determined to be uncollectible.
The Company establishes provisions for losses on accounts receivable if it determines that it will not collect all or part of the outstanding balance. The Company regularly reviews collectability and establishes or adjusts the allowance as necessary using the specific identification method. There was no allowance for doubtful accounts at June 30, 2014 and 2013.
Office and other equipment
Office and other equipment is stated at cost and depreciated by the straight-line method over estimated useful lives ranging from five to seven years. Depreciation and amortization of office and other equipment amounted to $3,609 and $3,372 for the years ended June 30, 2014 and 2013, respectively.
Impairment of long-lived assets and long-lived assets to be disposed of
The Company follows the provisions of Financial Accounting Standards Board (“FASB”) Accounting Standards Codification (“ASC”) Topic 360-10, Property, Plant and Equipment — Impairment or Disposal of Long-Lived Assets, which provides guidance for the financial accounting and reporting of impairment or disposal of long-lived assets. In addition, the Company is subject to the rules of the Securities and Exchange Commission with respect to impairment of oil and gas properties accounted for under the full cost method of accounting, as described below.
Oil and Gas Properties
The Company follows the full cost method of accounting for oil and gas properties. Management believes the full cost method more accurately reflects management’s exploration objectives and results by including all costs incurred as integral for the acquisition, discovery and development of whatever reserves ultimately result from its efforts as a whole. Under the full cost method of accounting, all costs associated with acquisition, exploration and development of oil and gas reserves, including such costs as leasehold acquisition costs, interest costs related to exploratory and development activities, and directly related overhead costs, are capitalized into the full cost pool.
All capitalized costs of oil and gas properties, including the estimated future costs to develop proved reserves, are amortized on the unit-of-production method using estimates of proved reserves. Investments in unproved properties and major development projects are not amortized until proved reserves associated with the projects can be determined or until impairment occurs. If the results of an assessment indicate that the properties are impaired, the amount of the impairment is added to the capitalized costs to be amortized.
CUBIC ENERGY, INC.
NOTES TO CONSOLIDATED FINANCIAL STATEMENTS
In addition, the capitalized costs are subject to a “full cost ceiling test,” which generally limits such costs to the aggregate of the “estimated present value” (discounted at a ten percent (10%) interest rate) of future net revenues from proved reserves, based on current economic and operating conditions, plus the lower of cost or fair market value of unproved properties. No impairment of oil and gas properties charge was recorded for fiscal 2014 and 2013, respectively.
Sales of proved and unproved properties are accounted for as adjustments of capitalized costs with no gain or loss recognized, unless such adjustments would significantly alter the relationship between capitalized costs and proved reserves of oil and gas, in which case the gain or loss is recognized in income.
Depletion of producing oil and gas properties amounted to $7,786,503 and $3,244,887 for the years ended June 30, 2014 and 2013, respectively.
Asset retirement obligations
We have asset retirement obligations primarily for the future abandonment of oil and gas wells, and we maintain reserve accounts for part of these obligations under our operating agreements with the operators of wells in which we have an interest. We account for these obligations under ASC No. 410-20, Asset Retirement and Environmental Obligations, which requires the fair value of an asset retirement obligation to be recognized in the period when it is incurred if a reasonable estimate of fair value can be made. The present value of the estimated asset retirement cost is capitalized as part of the carrying amount of the underlying long-lived asset. ASC No. 410-20 also requires depreciation of the capitalized asset retirement cost and accretion of the asset retirement obligation over time. The depreciation is generally determined on a units-of-production basis over the life of the asset, while the accretion escalates over the life of the asset, typically as production declines. The amounts recognized are based on numerous estimates and assumptions, including recoverable quantities of oil and gas, future retirement and site reclamation costs, inflation rates and credit-adjusted risk-free interest rates.
Fair value of financial instruments
The Company defines the fair value of a financial instrument as the amount at which the instrument could be exchanged in a current transaction between willing parties. Financial instruments included in the Company’s financial statements include cash and cash equivalents, short-term investments, accounts receivable, other receivables, other assets, accounts payable, notes payable and due to affiliates. Unless otherwise disclosed in the notes to the financial statements, the carrying value of financial instruments is considered to approximate fair value due to the short maturity and characteristics of those instruments. The carrying value of debt approximates fair value as terms approximate those currently available for similar debt instruments.
Estimates of Proved Oil and Gas Reserves
Estimates of our proved reserves included in this report are prepared in accordance with GAAP and SEC guidelines. The accuracy of a reserve estimate is a function of:
· the quality and quantity of available data;
· the interpretation of that data;
· the accuracy of various mandated economic assumptions; and
· the judgment of the persons preparing the estimate.
Our proved reserve information included in this report was based on studies performed by our independent petroleum engineers. Estimates prepared by other third parties may be higher or lower than those included herein. Because these estimates depend on many assumptions, all of which may substantially differ from future actual results, reserve estimates will be different from the quantities of oil and gas that are ultimately recovered. In addition, results of drilling, testing and production after the date of an estimate may cause material revisions to the estimate.
In accordance with SEC requirements, we based the estimated discounted future net cash flows from proved reserves on the average of oil and gas prices based on the average 12 month first-day-of-month pricing for the years ended June 30, 2014 and 2013, and costs as of June 30, 2014 and 2013. Future prices and costs may be materially higher or lower than these prices and costs which would impact the estimated value of our reserves.
CUBIC ENERGY, INC.
NOTES TO CONSOLIDATED FINANCIAL STATEMENTS
The estimates of proved reserves materially impact depreciation, depletion and amortization, or DD&A expense. If the estimates of proved reserves decline, the rate at which we record DD&A expense will increase, reducing future net income. Such a decline may result from lower commodity prices, which may make it uneconomic to drill for and produce higher cost fields.
Income taxes
Income taxes are accounted for under the asset and liability method. Deferred tax assets and liabilities are recognized for the future tax consequences attributable to differences between the financial statement carrying amounts of existing assets and liabilities and their respective tax basis. Deferred tax assets and liabilities are measured using enacted tax rates that will apply in the years in which those temporary differences are expected to be recovered or settled. The effect on deferred tax assets and liabilities of a change in tax rates is recognized in income in the period that includes the enactment date. Deferred tax assets are routinely evaluated to determine the likelihood of realization and the Company must estimate its expected future taxable income to complete this assessment. Numerous assumptions are inherent in the estimation of future taxable income, including assumptions about matters that are dependent on future events such as future operating conditions, particularly related to prevailing oil, condensate, natural gas and NGLs prices, and future financial conditions. The estimates or assumptions used in determining future taxable income are consistent with those used in internal budgets and forecasts. The effect on deferred tax assets and liabilities of a change in tax rates is recognized as income in the period that includes the enactment date. The Company has established a valuation allowance to offset its net deferred tax asset since, on a more likely than not basis, such benefits are not considered recoverable at this time.
ASC 740 also provides guidance for the financial statement recognition, measurement and disclosure of uncertain tax positions in an enterprise’s financial statements and requires an entity to recognize the financial statement impact of a tax position when it is more likely than not that the position will be sustained upon examination. If the tax position meets the more-likely-than-not recognition threshold, the tax effect is recognized at the largest amount of the benefit that is greater than 50% likely of being realized upon ultimate settlement. Interest expense and penalties related to tax liabilities will be recognized in the first period that it would begin to accrue according to the relevant tax law, and will be classified as an operating expense.
The Company is no longer subject to income tax examinations by the Internal Revenue Service for years prior to 2009. For state tax jurisdictions, the Company is no longer subject to income tax examinations for years prior to 2009.
Oil and gas revenues
The Company recognizes oil and gas revenues when oil and gas production is sold to a purchaser at a fixed or determinable price, when delivery has occurred and title has transferred, and if collectability of the revenue is probable. Delivery occurs and title is transferred when production has been delivered to a purchaser’s pipeline or truck. As a result of the numerous requirements necessary to gather information from purchasers or various measurement locations, calculate volumes produced, perform field and wellhead allocations and distribute and disburse funds to various working interest and royalty owners, the collection of revenues from oil and gas production may take up to 60 days following the month of production. Therefore, we make accruals for revenues and accounts receivable based on estimates of our share of production. Since the settlement process may take 30 to 60 days following the month of actual production, our financial results include estimates of
CUBIC ENERGY, INC.
NOTES TO CONSOLIDATED FINANCIAL STATEMENTS
production and revenues for the related time period. We record any differences, which historically have not been significant, between the actual amounts ultimately received and the original estimates in the period they become finalized.
Earnings (loss) per common share
The Company has adopted the provisions of ASC No. 260, Earnings per Share. ASC No. 260 requires the presentation of basic earnings (loss) per share (“EPS”) and diluted EPS. Basic EPS is calculated by dividing net income or loss, less preferred dividends (income or loss attributable to common stockholders), by the weighted average number of common shares outstanding for the period. Diluted EPS is calculated by dividing net income or loss, less preferred dividends (income or loss attributable to common stockholders), by the weighted average number of common shares outstanding plus any dilutive shares (i.e., convertible preferred stock, stock warrants or other convertible debt) during the period, unless the effect of such potentially diluted securities would be anti-dilutive.
Potential dilutive securities (e.g., convertible preferred stock, stock warrants and convertible debt) have been considered for the years ended June 30, 2014 and 2013. For fiscal 2013, potential dilutive securities were disregarded due to the net loss because the effects would have been anti-dilutive. See the table below for a reconciliation of basic and diluted earnings per share:
|
|
|
For the year ended June 30, 2014 |
|
For the year ended June 30, 2013 |
| ||||||||
|
|
|
Income |
|
Shares |
|
Per-Share |
|
Income |
|
Shares |
|
Per-Share |
|
|
|
|
(Numerator) |
|
(Denominator) |
|
Amount |
|
(Numerator) |
|
(Denominator) |
|
Amount |
|
|
Income available to common shareholders - basic earnings per share |
|
7,704,135 |
|
77,285,846 |
|
0.10 |
|
(6,851,518 |
) |
77,263,381 |
|
(0.09 |
) |
|
|
|
|
|
|
|
|
|
|
|
|
|
|
|
|
Effect of dilutive securities |
|
|
|
|
|
|
|
|
|
|
|
|
|
|
Warrants |
|
|
|
15,890,011 |
|
|
|
— |
|
— |
|
|
|
|
Convertible debt |
|
— |
|
— |
|
|
|
— |
|
— |
|
|
|
|
Convertible preferred |
|
— |
|
— |
|
|
|
— |
|
— |
|
|
|
|
Options |
|
— |
|
— |
|
|
|
|
|
|
|
|
|
|
|
|
|
|
|
|
|
|
|
|
|
|
|
|
|
Income available to common shareholders - diluted earnings per share |
|
7,704,135 |
|
93,175,857 |
|
0.08 |
|
(6,851,518 |
) |
77,263,381 |
|
(0.09 |
) |
Concentration of customers and credit risk
Financial instruments which potentially subject the Company to a concentration of credit risk consist primarily of trade accounts receivable with a variety of local, national, and international oil and natural gas companies. Such credit risks are considered by management to be limited due to the financial resources of the oil and natural gas companies.
Our cash accounts at our financial institution, which are only FDIC insured to a total balance of $250,000, had a balance of $6,857,970 in cash and $5,000,000 in restricted cash as of June 30, 2014. Therefore, there is $11,607,970 customer/credit risk to the Company, as the remaining balance was fully insured by FDIC.
Purchases by BP Energy totaled 81% of our total revenues.
As noted earlier, the Company has receivables from non-affiliated operators for oil and gas sales. It also has accounts payable to such operators for its share of development, production, and operating costs. As of June 30, 2014, a single operator owed the Company approximately $390,038, which is included in accounts receivable. As of June 30, 2013, a single operator owed the Company approximately $182,643, which was included in accounts receivable.
Use of estimates
The preparation of consolidated financial statements in conformity with accounting principles generally accepted in the United States of America requires management to make estimates and assumptions that affect the amounts reported in the consolidated financial statements and accompanying notes. Actual results could differ from those estimates.
Certain significant estimates
Management’s estimates of oil and gas reserves are based on various assumptions, including constant oil and gas prices. It is reasonably possible that a future event in the near term could cause the estimates to change and such changes could have a severe impact. Actual future production, cash flows, taxes, operating expenses, development expenditures and quantities of recoverable oil and gas reserves may vary substantially from those
CUBIC ENERGY, INC.
NOTES TO CONSOLIDATED FINANCIAL STATEMENTS
assumed in the estimate. The accuracy of any reserve estimate is a function of the quality of available data, engineering and geological interpretation, and judgment. Subsequent evaluation of the same reserves based upon production history will result in variations, which may be substantial, in the estimated reserves. While it is at least reasonably possible that these estimates will change materially in the near term, no estimate can be made of the range of possible changes that might occur.
Stock-based compensation
The Company accounts for its stock-based employee compensation plans pursuant to ASC No. 718, Stock Compensation. ASC No. 718 requires the Company to recognize compensation costs related to stock-based payment transactions (i.e., the granting of stock options and warrants, and awards of shares of Common Stock) in the financial statements. The amount of compensation is measured based on the grant-date fair value of the equity issued. Compensation cost is recognized over the period that an employee provides services in exchange for the award.
The expected term of the options represents the estimated period of time until exercise and is based on consideration to the contractual terms, vesting schedules and expectations of future employee behavior.
The risk-free interest rate is based on the U.S. Treasury bill rate in effect at the time of grant with an equivalent expected term or life.
Financial instruments with characteristics of both liabilities and equity
The Company has adopted the provisions of ASC No. 480, Distinguishing Liabilities from Equity established standards for how a company classifies and measures certain financial instruments with characteristics of both liabilities and equity. The statement requires that a company classify a financial instrument that is within its scope as a liability (or an asset in some circumstances) if certain criteria are met. Freestanding financial instruments that obligate the issuer to redeem the holder’s shares, or are indexed to such an obligation, or are settled in cash or settled with shares meeting certain conditions would be treated as liabilities. Many of those instruments were previously classified as equity.
Deferred Loan Costs
During the years ended June 30, 2014 and 2013, the Company incurred loan origination and other professional fees that were associated with closing certain loans. These fees are included in prepaid and other assets on the consolidated balance sheet, net of amortization. Such fees have been deferred and are being amortized to loan costs over the life of the loan on a straight line basis, which approximates the effective interest method. Loan costs recorded on these fees was $700,476 and $520,000 for the years ended June 30, 2014 and 2013, respectively, and was reflected in amortization of loan costs on the consolidated statements of operations.
CUBIC ENERGY, INC.
NOTES TO CONSOLIDATED FINANCIAL STATEMENTS
Warrants Liability
The Company’s outstanding warrants issued in connection with the issuance of the Notes issued on October 2, 2013 are classified as liabilities and are adjusted to reflect fair value at the end of each reporting period, with the changes in fair value recognized as a change in fair value of warrant liability in the Company’s consolidated statements of operations. Specifically, the warrants issued in connection with Notes issued on October 2, 2013, grant the warrant holder certain anti-dilution protection which provide exercise price adjustments in the event that any common stock or common stock equivalents are issued at an effective price per share that is less than the then-current exercise price per share. Upon exercise or expiration of the warrant, the fair value of the warrant at that time will be reclassified to equity from a liability. The following table is a summary of the warrant liability activity measured at fair value using Level 3 inputs:
The Company re-priced and extended warrants to purchase 8,500,000 shares of common stock in connection with the amendment of its Credit Agreement with WFEC in December 2012. The previously issued warrants were modified for an exercise price of $.20 per share with the exercise term extended to December 31, 2017. The warrants included certain anti-dilution provisions, which provide exercise price adjustments in the event that any common stock equivalents are issued at an effective price per share that is less than exercise price of the warrants. The warrants were not recorded as a fair value liability for the year ended June 30, 2013 or previous years. The Company, however, recorded the fair value of these warrants as of July 1, 2013 ($1,805,898) as an out of period charge to net income and corresponding liability on July 1, 2013. The subsequent decrease in the warrants’ fair value during the year ended June 30, 2014, which includes the effect of the anti-dilution re-pricing from $0.20 per share to $0.17 per share in connection with the Notes issued on October 2, 2013, has been reflected as a reduction in the warrant liability and a credit to net income, resulting in a net charge to net income of $982,042 in the fiscal year ended June 30, 2014.
The estimated fair value of the warrants issued in connection with the Notes was determined using the Monte Carlo Simulation option pricing model, assuming there will be no dividend, using the applicable exercisable periods, a risk-free rate of return of approximately 0.89% and an expected stock volatility of approximately 80%. The estimated fair value for warrants associated with the WFEC Credit Agreement was determined using the Black-Scholes option pricing model, assuming there will be no dividend, using the applicable exercisable periods, a risk-free rate of return of approximately 0.89% and an expected volatility of 80%.
The following table is a summary of the warrant liabilities activity measured at fair value using Level 3 inputs:
|
|
|
Warrants liability |
| |
|
Balance at June 30, 2013 |
|
$ |
— |
|
|
Granted |
|
|
| |
|
Class A and B warrants |
|
33,411,033 |
| |
|
Change in fair value |
|
|
| |
|
Class A and B warrants |
|
(18,102,734 |
) | |
|
WFEC warrants |
|
982,042 |
| |
|
Balance at June 30,2014 |
|
$ |
16,290,341 |
|
Revenue Recognition
The Company uses the sales method of accounting for the sale of its oil, condensate, natural gas and NGLs and records revenues from the sale of such products when delivery to the customer has occurred and title has transferred. This recording of revenues occurs when oil, condensate, natural gas or NGLs have been delivered to a pipeline or a tank lifting has occurred. The Company’s NGLs are sold as part of the wet gas subject to an incremental NGLs pricing formula based upon a percentage of NGLs extracted from the Company’s wet gas production. The Company’s reported production volumes reflect incremental post-processing NGLs volumes and residual gas volumes with which the Company is credited under its sales contracts. Under the sales method, revenues are recorded based on the Company’s net revenue interest, as delivered. When actual natural gas sales volumes exceed our delivered share of sales volumes, an over-produced imbalance occurs. To the extent an over-produced imbalance exceeds our share of the remaining estimated proved natural gas reserves for a given property, the Company records a liability. The Company had no material gas imbalances at June 30, 2014 and 2013.
The Company records its share of revenues based on production volumes and contracted sales prices. The sales price for oil, condensate, natural gas and NGLs are adjusted for transportation cost and other related deductions. The transportation costs and other deductions are based on contractual or historical data and do not require significant judgment. Subsequently, these deductions and transportation costs are adjusted to reflect actual charges based on third party documents once received by the Company. In addition, oil, condensate, natural gas and NGLs volumes sold are not significantly different from the Company’s share of production.
The Company calculates and pays royalties on oil, condensate, natural gas and NGLs in accordance with the particular contractual provisions of the lease. Royalty liabilities are recorded in conjunction with the cash receipts for oil, condensate, natural gas and NGLs revenues and are included in revenue payable on the Company’s consolidated balance sheet.
CUBIC ENERGY, INC.
NOTES TO CONSOLIDATED FINANCIAL STATEMENTS
Recent accounting pronouncements
In May 2014, the FASB issued ASU No. 2014-09, Revenue from Contracts with Customers (Topic 606) ("ASU 2014-09"). This comprehensive new revenue recognition standard that will supersede nearly all existing revenue recognition guidance under GAAP. The core principle of the guidance is that an entity should recognize revenue to depict the transfer of promised goods or services to customers in an amount that reflects the consideration to which the entity expects to be entitled in exchange for those goods or services. In doing so, companies will need to use more judgment and make more estimates than under currently applicable guidance including identifying performance obligations in the contract, estimating the amount of variable consideration to include in the transaction price and allocating the transaction price to each separate performance obligation. ASU 2014-09 is effective for annual and interim periods beginning after December 15, 2016 and permits the use of either the retrospective or cumulative effect transition method. We are currently assessing the potential impact of ASU 2014-09 on our consolidated financial condition and results of operations.
Note C — Stockholders’ equity:
Stock issuances
In August 2009, the Company entered into Subscription and Registration Rights Agreements with certain investors pursuant to which the Company issued an aggregate of 2,104,001 shares of Common Stock and warrants exercisable into 1,052,000 shares of Common Stock. At June 30, 2014, the remaining August 2009 unexercised warrants were exercisable into 787,294 shares of Common Stock at $0.6747 per share. Such warrants expired on July 31, 2014.
Preferred Stock
The Company’s board has the power, without further vote of shareholders, to authorize the issuance of up to 10,000,000 shares of preferred stock and to fix and determine the terms, limitations and relative rights and preferences of any shares of the preferred stock. This power includes the authority to establish voting, dividend, redemption, conversion, liquidation and other rights of any such shares. The preferred stock may be divided into such number of series as the board determines.
The board of directors has established three series of preferred stock, one of which has been canceled:
Series A Convertible Preferred Stock — The Series A Convertible Preferred Stock had a stated value of $100 per share, was entitled to dividends in the amount of 8% per annum, was convertible into the Common Stock at $1.20 per share of Common Stock and was redeemable by the Company at $120 per share. The Series A convertible preferred stock was canceled in February 2014, after it was exchanged for Series B Convertible Preferred Stock.
Series B Convertible Preferred Stock — The Series B Convertible Preferred Stock has a stated value of $1,000 per share, is entitled to cumulative dividends in the amount of 9.5% per annum and is convertible into our Common Stock at $0.50 per share of Common Stock. The holders of the Series B Convertible Preferred Stock are entitled to vote (on an as-converted basis), together with holders of Common Stock, as a single class with respect to all matters presented to holders of Common Stock. As of June 30, 2014, there were 16,928.047 shares of Series B Convertible Preferred Stock outstanding.
CUBIC ENERGY, INC.
NOTES TO CONSOLIDATED FINANCIAL STATEMENTS
Series C Redeemable Voting Preferred Stock — The Series C Redeemable Voting Preferred Stock has a stated value of $0.01 per share. The holders of Series C Redeemable Voting Preferred Stock are entitled to vote, together with the holders of our Common Stock, as a single class with respect to all matters presented to holders of Common Stock. The holders of Series C Redeemable Voting Preferred Stock are entitled, in the aggregate, to a number of votes equal to the number of shares of Common Stock that would be issuable upon the exercise of all of the outstanding Class A Warrants and Class B Warrants (as defined below) on a Full Physical Settlement basis (as defined in the Warrant and Preferred Stock Agreement). The holders of Series C Redeemable Voting Preferred Stock are not entitled to receive any dividends. The Series C Redeemable Voting Preferred Stock may be redeemed at the option of the holders thereof at any time at the stated value per share. There were 98,751.823 shares of Series C preferred stock issued and outstanding as of June 30, 2014.
Conversion of Wallen Note and Series A Convertible Preferred Stock into Series B Convertible Preferred Stock
The Company entered into and consummated the transactions contemplated by a Conversion and Preferred Stock Purchase Agreement dated as of October 2, 2013 (the “Conversion Agreement”) with Calvin A. Wallen III, the Company’s Chairman, President and Chief Executive Officer, and Langtry Mineral & Development, LLC, an entity controlled by Mr. Wallen (“Langtry”). Pursuant to the terms of the Conversion Agreement, (a) Langtry was issued 12,047 shares of Series B Convertible Preferred Stock, with an aggregate stated value of $12,047,000, in exchange for the cancellation of all of the issued and outstanding shares of Series A Convertible Preferred Stock held by Langtry and (b) Mr. Wallen was issued 2,115 shares of Series B Convertible Preferred Stock, with an aggregate stated value of $2,115,000, in exchange for the cancellation of a promissory note payable to Mr. Wallen in the principal amount of $2,000,000, plus $114,986 of accrued and unpaid interest. In the Langtry and Mr. Wallen exchanges, the carrying amounts of the Series A Convertible Preferred Stock held by Langtry and the promissory note payable to Mr. Wallen exceeded the fair value of the Series B Convertible Preferred Stock the Company issued by $9,830,152 and $1,725,826, respectively. Due to the related party nature of the exchanges, the excess amounts have been recorded as contributions to equity.
Issuance of Warrants and Series C Redeemable Voting Preferred Stock
Pursuant to the terms of a Warrant and Preferred Stock Agreement, dated as of October 2, 2013, and in connection with the issuance and sale of the Notes under the Note Purchase Agreement (see Note D), the Company issued certain warrants that expire on October 2, 2019. The Company issued warrants exercisable for (a) an aggregate of 65,834,549 shares of Common Stock, at an exercise price of $0.01 per share (the “Class A Warrants”), and (b) an aggregate of 32,917,274 shares of Common Stock, at an exercise price of $0.50 per share (the “Class B Warrants”, and together with the Class A Warrants, the “Warrants”). The estimated fair value of the Class A and Class B Warrants was determined to be $23,700,437 and $9,710,596, respectively. The warrants expire on October 2, 2019. The initial value was recorded as a discount to the debt that will be amortized over the three year term of the Notes (see Note D). The exercise prices of the warrants are subject to adjustment for any future issuance of common stock, rights or options to acquire common stock or securities convertible into or exchangeable for common stock or amendment to or change in the exercise price that results in a lower exercise price than the then-current exercise prices of the Warrants.
The Company also issued an aggregate of 98,751.823 shares of Series C Redeemable Voting Preferred Stock to certain purchasers of the Notes and their affiliates (the “Investors”). The holders of the Series C Redeemable Voting Preferred Stock are entitled to vote, together with holders of Common Stock, as a single class with respect to all matters presented to holders of Common Stock of the Company. The holders of Series C Redeemable Voting Preferred Stock are entitled, in the aggregate, to a number of votes equal to the number of shares of Common Stock that would be issuable upon the exercise of all outstanding Warrants on a Full Physical Settlement basis (as defined in the Warrant and Preferred Stock Agreement). The holders of Series C
CUBIC ENERGY, INC.
NOTES TO CONSOLIDATED FINANCIAL STATEMENTS
Redeemable Voting Preferred Stock are not entitled to receive any dividends from the Company. Shares of the Series C Redeemable Voting Preferred Stock have a par value of $0.01 per share and may be redeemed at par value, at the option of the holders thereof at any time, and if not redeemed expire in October 2019.
The Series C Redeemable Voting Preferred has an aggregate stated value of approximately $988.
Stock and option grants
On January 14, 2011, the Company granted stock options, effective October 1, 2010, under the 2005 Stock Option Plan (the “Plan”), for the purchase of an aggregate of 288,667 shares of Company Common Stock to its Chief Financial Officer, Larry G. Badgley. These options have an exercise price of $1.20 per share and expire five years from their issue date. One option, for the purchase of 15,667 shares, was fully vested upon grant. The other option, for the purchase of 273,000 shares vested on October 1, 2012. We estimated the fair value of the options on the date of grant using the Black-Scholes valuation model to be $100,997. The Plan permits the grant of awards that may deliver up to an aggregate of 1,290,805 shares of common stock. There has been no charge to compensation expense for the year ending June 30, 2014, and none since October 2012, at which time the option was fully vested.
The risk-free interest rate is based on the U.S. Treasury bill rate in effect at the time of grant with an equivalent expected term or life. Information regarding activity for stock options under the Plan is as follows:
|
|
|
|
|
Weighted-average |
|
Weighted-average |
|
Aggregate |
| ||
|
|
|
|
|
exercise price per |
|
remaining contractual |
|
intrinsic |
| ||
|
|
|
Number of shares |
|
share |
|
term (years) |
|
value |
| ||
|
|
|
|
|
|
|
|
|
|
| ||
|
Outstanding, June 30, 2013 |
|
288,667 |
|
$ |
1.20 |
|
1.25 |
|
|
| |
|
Options granted |
|
— |
|
— |
|
|
|
|
| ||
|
Options exercised |
|
— |
|
— |
|
|
|
|
| ||
|
Options forfeited/expired |
|
— |
|
— |
|
|
|
|
| ||
|
|
|
|
|
|
|
|
|
|
| ||
|
Outstanding, June 30, 2014 |
|
288,667 |
|
1.20 |
|
1.25 |
|
$ |
— |
| |
|
|
|
|
|
|
|
|
|
|
| ||
|
Exercisable, June 30, 2014 |
|
288,667 |
|
$ |
1.20 |
|
1.25 |
|
$ |
— |
|
Information related to the Plan during fiscal 2014 is as follows:
|
Intrinsic value of options exercised |
|
$ |
— |
|
|
Weighted-average fair value of options granted |
|
$ |
100,997 |
|
CUBIC ENERGY, INC.
NOTES TO CONSOLIDATED FINANCIAL STATEMENTS
On January 24, 2013, the Company paid cash of $13,000 and issued 72,500 shares of Common Stock to four directors of the Company pursuant to the Plan. As of such date, the aggregate market value of the Common Stock granted was $15,225 based on the last sale price ($0.21 per share) on January 24, 2013, on the NYSE-MKT of the Company’s Common Stock. Such amount was expensed upon issuance to compensation expense.
On April 4, 2013, the Company paid cash of $13,000 and issued 72,500 shares of Common Stock to four directors of the Company pursuant to the Plan. As of such date, the aggregate market value of the Common Stock granted was $19,213 based on the last sale price ($0.265 per share) on April 4, 2013, on the NYSE-MKT of the Company’s Common Stock. Such amount was expensed upon issuance to compensation expense.
On July 5, 2013, the Company paid cash of $17,000 and issued 72,500 shares of Common Stock to four non-employee directors of the Company pursuant to the Plan. As of such date, the aggregate market value of the Common Stock granted was $20,300 based on the last sale price ($0.28 per share) on July 5, 2013, on the NYSE - MKT of the Company’s Common Stock. Such amount was expensed upon issuance to compensation expense.
On October 7, 2013, the Company paid cash of $17,000 and issued 72,500 shares of Common Stock to four non-employee directors of the Company pursuant to the Plan. As of such date, the aggregate market value of the Common Stock granted was $30,450 based on the last sale price ($0.42 per share) on October 7, 2013, on the OTC Markets of the Company’s Common Stock. Such amount was expensed upon issuance to compensation expense.
CUBIC ENERGY, INC.
NOTES TO CONSOLIDATED FINANCIAL STATEMENTS
Senior Secured Notes Financing
The Company entered into a Note Purchase Agreement dated October 2, 2013, pursuant to which the Company issued an aggregate of $66,000,000 of notes due October 2, 2016 (the “Notes”) to certain Investors. The Notes originally bore interest at the rate of 15.5% per annum, in cash, payable quarterly; provided, however, that interest for the first six months following the closing was paid 7.0% per annum in cash and 8.5% per annum in additional Notes. The Notes were subject to certain financial and non-financial covenants, which the Company was in violation of as of June 30, 2014. On July 14, 2014, the Company entered into an Amendment, Forbearance and Waiver Agreement (the “Amendment”) with the holders of the Notes and certain other parties thereto. As a result of an amendment to the Note Purchase Agreement, interest on the Notes after March 31, 2014 accrues at the rate of 20.5%, which interest shall accrue, but is not payable in cash. The amendment includes additional covenants including, among others, that by September 30, 2014, the Company will identify a Strategic Transaction, as defined in the Amendment, that will result in the payment in full, in cash, of all amounts owing to the holders of the Notes, or a joint venture, strategic alliance or other transaction satisfactory to the holders of the Notes. We were also required to enter into a definitive agreement with respect to a Strategic Transaction by October 17, 2014. We continue to explore alternatives with respect to a Strategic Transaction, although we did not enter into a definitive agreement by October 17, 2014. We are in discussions with the holders of the Notes with respect to available alternatives. Unless the requirement regarding a Strategic Transaction is waived, or we obtain an extension of time, the holders of the Notes could declare a default under the Note Purchase Agreement, accelerate the indebtedness represented by the Notes and exercise all other remedies available to them, including foreclosing on our assets.
We believe we have complied with the other terms of the forbearance agreement; however, there can be no assurance that we will be successful in consummating a Strategic Transaction within the mandated time period.
The indebtedness under the Note Purchase Agreement is secured by substantially all of the assets of the Company, including a first priority lien over all of the assets of the Company, Cubic Asset and Cubic Asset Holding and a second priority lien over all of the assets of Cubic Louisiana and Cubic Louisiana Holding. Under the Note Purchase Agreement, the Company must maintain a $10,000,000 minimum cash balance from December 31, 2014 through October 2, 2016.
The Company allocated the proceeds from the issuance of the Notes to the Warrants and the Notes, based on the warrants’ fair market values at the date of issuance. The value assigned to the Class A Warrants was $23,700,437 and the value assigned to the Class B Warrants was $9,710,596, both of which were recorded as liabilities. The assignment of a fair value to the Warrants resulted in a loan discount being recorded. The discount will be amortized over the original three-year term of the Notes as additional interest expense. Amortization for fiscal 2014 was $8,238,337.
Cubic incurred loan costs of $2,840,819 on the issuance of the Notes and Warrants. The amount allocable to the debt of $2,840,819 has been capitalized and will be amortized over the original term of the Notes. Amortization for fiscal 2014 was $700,476.
Wells Fargo debt
On March 5, 2007, Cubic entered into a credit agreement with Wells Fargo Energy Capital (“WFEC”) providing for a revolving credit facility of $20,000,000 (the “Revolving Note”) and a convertible term loan of $5,000,000 (the “Term Loan”; and together with the Revolving Note, the “Credit Facility”). Subsequently, the Revolving Note was increased to $40 million. The indebtedness bore interest at a fluctuating rate equal to the sum of the Wells Fargo Bank prime rate plus two percent (2%) per annum, was originally scheduled to mature on March 1, 2010, subsequently extended to October 2, 2013, and was secured by substantially all of the assets of the Company.
The use of additional monies borrowed from WFEC under the Amended And Restarted Credit Agreement is restricted solely to paying for drilling and completion costs for well interests collateralized by a WFEC first lien.
CUBIC ENERGY, INC.
NOTES TO CONSOLIDATED FINANCIAL STATEMENTS
Contemporaneously with entering into the Note Purchase Agreement, the Company repaid the $5 million Term Loan payable to WFEC, and Cubic Louisiana assumed the remaining unpaid debt to WFEC, which amount was $20,865,110 as of that date. That debt is reflected in a term loan bearing interest at the Wells Fargo Bank prime rate, plus 2%, per annum, due October 2, 2016. In the event that Cubic Louisiana does not have available cash to pay interest on the Credit Facility, accrued and unpaid interest will be paid in kind via an additional promissory note. As part of the new credit agreement, WFEC is providing a revolving credit facility in the amount of up to $10,000,000, bearing interest at the same rate, with all advances under that revolving credit facility to be made in the sole discretion of WFEC. The Company is subject to loan covenants that include providing the lender with unaudited interim financial statements and audited year-end financial statements. The Company has not provided audited annual financial statements, as of September 30, 2014.
During fiscal 2014, the Company borrowed $4,015,826 under the revolving credit facility for two new natural gas wells drilled and completed by EXCO Operating Company, LP (“EXCO”), leaving a maximum of $5,984,174 available for future borrowing. Interest expense attributable to the Credit Facility for fiscal 2014 and 2013 was $1,232,771 and $1,143,555, respectively.
December 2009 subordinated debt issue and refinancing
On December 18, 2009, the Company issued a subordinated promissory note (the “Wallen Note”) payable to Mr. Wallen, the Company’s Chairman of the Board and Chief Executive Officer, in the principal amount of $2,000,000 which was subordinated to all WFEC indebtedness. The Wallen Note bore interest at the prime rate plus one percent (1%), and originally provided for interest payable monthly. The proceeds of the Wallen Note were used to repay other indebtedness to the Company. The Wallen Note was extinguished through the issuance of shares of Series B preferred stock on October 2, 2013.
In addition, an entity controlled by Mr. Wallen advanced the Company $2,000,000, as of June 30, 2013 to provide short-term working capital and an additional $2,500,000 during the quarter ended September 30, 2013 to fund additional deposits and fees paid for extensions needed to consummate the acquisitions that were completed on October 2, 2013. The Company’s interest expense associated with these advances of $896,667, is included in interest expense for fiscal 2014. These advances and accrued interest were re-paid on October 2, 2013.
Conversion of Wallen Note and Series A Convertible Preferred Stock into Series B Convertible Preferred Stock
The Company entered into and consummated the transactions contemplated by a Conversion and Preferred Stock Purchase Agreement dated as of October 2, 2013 with Mr. Wallen and Langtry (the “Conversion Agreement”). Pursuant to the terms of the Conversion Agreement, (a) Langtry was issued 12,047 shares of Series B preferred stock, with an aggregate stated value of $12,047,000, in exchange for the cancellation of all of the issued and outstanding shares of Series A preferred stock held by Langtry and (b) Mr. Wallen was issued 2,115 shares of Series B preferred stock, with an aggregate stated value of $2,115,000, in exchange for the cancellation of the Wallen Note and accrued interest.
CUBIC ENERGY, INC.
NOTES TO CONSOLIDATED FINANCIAL STATEMENTS
The following table provides information related to debt outstanding as of June 30, 2014:
|
|
|
as of June 30, |
| |
|
Principal Amount Outstanding |
|
2014 |
| |
|
Total long-term debt (including current portion) |
|
|
| |
|
Senior notes (net of discounts) |
|
$ |
43,090,338 |
|
|
WFEC |
|
24,880,936 |
| |
|
|
|
|
| |
|
Less current portion |
|
(67,971,274 |
) | |
|
|
|
|
| |
|
Total long-term debt |
|
$ |
— |
|
|
|
|
|
| |
|
Maturities of Debt |
|
|
| |
|
|
|
|
| |
|
Fiscal 2015 |
|
$ |
67,971,274 |
|
|
Fiscal 2016 and thereafter |
|
— |
| |
Note E — Related party transactions:
On December 1, 1997, as renewed and revised on January 1, 2002, the Company entered into a contract with Tauren to provide the necessary technical, administrative and management expertise needed to conduct its business. Tauren also paid various organization costs and consulting fees on behalf of the Company. The monthly amount charged to the Company was based on actual costs of materials and labor hours of Tauren that were used pursuant to the terms of the agreement. The agreement was terminated effective January 1, 2006, except as to the office sharing provisions, which were extended to June 30, 2007 and since continued on a month to month basis. The Company now leases office space from Tauren on a month-to-month lease that charges the Company $8,000 per month. Charges to the Company under the contracts and subsequent arrangements were $96,000 and $96,000 for the fiscal years 2014 and 2013.
Prior to October 2013, Tauren owned a working interest in the wells in which the Company owns a working interest. As of the end of fiscal 2014 Tauren owed $3,333 to the Company, and as of the end of fiscal 2013, the Company owed $6,166 to Tauren for miscellaneous general and administrative expenses and royalties. Tauren owed the Company $2,765 and $38,756 for royalties paid by a third-party operator for fiscal years 2014 and 2013, respectively.
In addition, certain of the Company’s working interests are operated by an affiliated company, Fossil Operating, Inc. (“Fossil”), which is owned 100% by the Mr. Wallen. At the end of fiscal years 2014 and 2013, the Company owed Fossil $33,533 and $0, respectively, for capital expenditures. The Company owed Fossil $264,705 and $27,949, respectively, for drilling costs and lease and operating expenses, and was owed by Fossil $65,650 and $28,897, respectively, for oil and gas sales.
From March, 2013 through September 2013, the Company borrowed $4,400,000 from Pandale Holding, Inc. (“Pandale”), an affiliate wholly owned by Mr. Wallen, to make payments towards the required deposits towards the purchase the Gastar East Texas assets. In total, the Company paid $4,700,000 in deposits to Gastar. Pandale had to obtain most or all of these $4,400,000 funds loaned to the Company from unrelated third parties. Upon closing of the transactions and borrowings on October 2, 2013, the Company had to re-pay Pandale the $4,400,000 borrowed, $896,667 in interest on the amounts borrowed, $1,000,000 in assessed origination fees and $180,000 in administrative fees charged. Neither, Mr.Wallen or Pandale made any profit from the loan transactions.
On December 18, 2009, the Company issued the Wallen Note, which is subordinated to all WFEC indebtedness. The Wallen Note bore interest at the prime rate plus one percent (1%), and originally provided for interest payable monthly. The proceeds of the Wallen Note were used to repay the previous indebtedness of the Company that was payable to a former director. The Wallen Note was exchanged for Series B Convertible Preferred Shares as part of the overall capital refinancing of the Company in October 2013.
CUBIC ENERGY, INC.
NOTES TO CONSOLIDATED FINANCIAL STATEMENTS
Deferred tax assets and liabilities are computed by applying the effective U.S. federal income tax rate to the gross amounts of temporary differences and other tax attributes. Deferred tax assets and liabilities relating to state income taxes are not material. In assessing the realizability of deferred tax assets, management considers whether it is more likely than not that some portion or all of the deferred tax assets will not be realized. The ultimate realization of deferred tax assets is dependent upon the generation of future taxable income during the periods in which those temporary differences become deductible. Management considers the scheduled reversal of deferred tax liabilities, projected future taxable income, and tax planning strategies in making this assessment. As of June 30, 2014 and 2013, the Company believed it was more likely than not that future tax benefits from net operating loss carryforwards and other deferred tax assets would not be realizable through generation of future taxable income; therefore, they were fully reserved.
The components of the net deferred federal income tax assets (liabilities) at June 30 were as follows:
|
|
|
2014 |
|
2013 |
| ||
|
Deferred tax assets: |
|
|
|
|
| ||
|
Net operating loss carryforwards |
|
$ |
25,557,786 |
|
$ |
15,154,000 |
|
|
Depreciation basis of assets |
|
657,878 |
|
4,600 |
| ||
|
|
|
$ |
26,215,664 |
|
$ |
15,158,600 |
|
|
Deferred tax liabilities: |
|
|
|
|
| ||
|
Depletion basis of assets and related accounts |
|
$ |
(651,534 |
) |
$ |
(85,800 |
) |
|
|
|
$ |
(651,534 |
) |
$ |
(85,800 |
) |
|
|
|
|
|
|
|
|
|
|
Net deferred tax (liabilities) assets before valuation allowance |
|
$ |
25,564,130 |
|
$ |
15,072,800 |
|
|
Valuation allowance |
|
(25,564,130 |
) |
(15,072,800 |
) | ||
|
Net deferred tax (liabilities) assets |
|
$ |
— |
|
$ |
— |
|
The following table summarizes the difference between the actual tax provision and the amounts obtained by applying the statutory tax rates to the income or loss before income taxes for the years ended June 30, 2014 and 2013:
|
|
|
2014 |
|
2013 |
| ||
|
Tax provision (benefit) calculated at statutory rate |
|
$ |
3,098,801 |
|
$ |
(1,484,000 |
) |
|
Effect of bargain purchase gain |
|
|
(7,677,201 |
) |
|
— |
|
|
Effect of warrant liability |
|
|
(5,821,035 |
) |
|
— |
|
|
Adjustment to valuation allowance |
|
10,399,435 |
|
1,484,000 |
| ||
|
Current federal income tax provision (benefit) |
|
$ |
— |
|
$ |
— |
|
CUBIC ENERGY, INC.
NOTES TO CONSOLIDATED FINANCIAL STATEMENTS
As of June 30, 2014, the Company had net operating loss carryforwards of approximately $75,169,980, which are available to reduce future taxable income. The Company used the 2030 net operating loss carryforwards in 2010. These carryforwards expire as follows:
|
Year |
|
losses |
| |
|
|
|
|
| |
|
2028 |
|
$ |
10,389,100 |
|
|
2029 |
|
11,065,900 |
| |
|
2030 |
|
— |
| |
|
2031 |
|
11,934,200 |
| |
|
2032 |
|
8,923,800 |
| |
|
2033 |
|
2,257,500 |
| |
|
2034 |
|
30,599,480 |
| |
|
|
|
$ |
75,169,980 |
|
Note G — Commitments and contingencies:
Key personnel (unaudited)
The Company depends to a large extent on the services of Calvin A. Wallen III, the Company’s President, Chairman of the Board, and Chief Executive Officer.
On February 29, 2008, the Company entered into employment agreements with Mr. Wallen and its Executive Vice President and Secretary, Jon S. Ross. The agreement with Mr. Wallen provided for a base salary of $200,000 per year, while the agreement with Mr. Ross provided for a base salary of $150,000 per year. The other terms and conditions of the agreements are substantially consistent. On December 16, 2013, the Company entered into amendments to the employment agreements of Messrs. Wallen and Ross. The amendment with Mr. Wallen provides for a base salary of $400,000 per year, while the amendment with Mr. Ross provides for a base salary of $300,000 per year.
Both agreements provide for a term of employment of 36 months from the effective date of February 1, 2008, which term shall be automatically extended by one additional month upon the expiration of each month during the term; provided, that the Company may terminate subsequent one-month extensions at any time. Each agreement is subject to early termination by the Company in the event that the employee dies, becomes totally disabled or commits an act constituting “Just Cause” under the agreement. The agreements provide that Just Cause includes, among other things, the conviction of certain crimes, habitual neglect of his duties to the Company or other material breaches by the employee of the agreement. Each agreement also provides that the employee shall be permitted to terminate his employment upon the occurrence of “Good Reason,” as defined in the agreement. The agreements provide that Good Reason includes, among other things, a material diminution in the employee’s authority, duties, responsibilities or salary, or the relocation of the Company’s principal offices by more than 50 miles. If the employee’s employment is terminated by (a) the Company other than due to the employee’s death, disability or Just Cause, or (b) the employee for Good Reason, then the Company is required to pay all remaining salary through the end of the then-current term. The foregoing severance payment is subject to reduction under certain conditions.
CUBIC ENERGY, INC.
NOTES TO CONSOLIDATED FINANCIAL STATEMENTS
On January 14, 2011, the Company entered into an employment agreement with its Chief Financial Officer, Larry G. Badgley. The agreement provides for the grant of stock options, under the Plan, for the purchase of an aggregate of 288,667 shares of Company Common Stock. These options have an exercise price $1.20 per share and expire five years from their issue date. One option, for the purchase of 15,667 shares, was fully vested upon grant. The other option, for the purchase of 273,000 vested on October 1, 2012. We estimated the fair value of the options on the date of grant using the Black-Scholes valuation model to be $100,997.
On December 12, 2013, Mr. Badgley’s salary increased to $250,000 per year and a health insurance reimbursement up to $1,500 per month. In June of 2014, Mr. Badgley’s salary decreased to $215,000 per year and a health insurance reimbursement up to $1,500 per month. Following the end of fiscal 2014, Mr. Badgley’s salary increased to $250,000.
On March 24, 2014, the Company hired Scott M. Pinsonnault, as its Chief Financial Officer and Senior Vice President. Concurrently with his hire, the Company entered into an employment agreement with Mr. Pinsonnault. The agreement provided for a base salary of $325,000, on an annual basis, and a term of employment of three years. The agreement also provided for commencement payments in the aggregate amount of $187,500, as well as eligibility for certain bonuses and incentive compensation. The agreement also provided for a monthly medical expense reimbursement of $1,500. On August 12, 2014, Mr. Pinsonnault resigned as the Company’s Chief Financial Officer.
Environmental matters
The Company’s operations and properties are subject to extensive and changing federal, state and local laws and regulations relating to environmental protection, including the generation, storage, handling and transportation of oil and gas and the discharge of materials into the environment. The Company generates typical oil and gas field wastes, including hazardous wastes that are subject to the federal Resources Conservation and Recovery Act and comparable state statutes. Furthermore, certain wastes generated by the Company’s oil and gas operations that are currently exempt from regulation as “hazardous wastes” may in the future be designated as “hazardous wastes” and therefore be subject to more rigorous and costly operating and disposal requirements. All of the Company’s properties are operated by third parties over whom the Company has limited control. In addition to the Company’s lack of control over properties operated by others, the failure of previous owners or operators to comply with applicable environmental regulations may, in certain circumstances, adversely impact the Company.
Legal proceedings
A lawsuit was filed on or about June 15, 2010, styled, “Gloria’s Ranch, LLC v. Tauren Exploration, Inc., Cubic Energy, Inc., Wells Fargo Energy Capital, Inc. & EXCO USA Asset, LLC”, filed in the 1st Judicial District Court, Caddo Parish, Louisiana, Cause No. 541-768, A. This lawsuit alleges that all or part of the Gloria’s Ranch mineral lease has lapsed, and seeks a finding that the mineral lease has lapsed, damages, attorney fees, and other equitable relief. This lawsuit would have a material effect, up to an estimated maximum of $9,100,000, if ultimately adjudicated entirely in favor of the mineral owner. The Company intends to vigorously defend its position and believes it will prevail regarding some, if not all, of the acreage at issue in this lawsuit.
CUBIC ENERGY, INC.
NOTES TO CONSOLIDATED FINANCIAL STATEMENTS
On October 2, 2012, the Company entered into a Settlement Agreement and Mutual Release with Tauren, EXCO and BG US Production Company, LLC (“BG”). This agreement provides that EXCO and BG shall (a) apply the Drilling Credits as provided in the agreement and place the Company in consent status on specified wells and (b) pay to the Company $12,179,853 in cash. The agreement also provides for mutual releases among the parties. Pursuant to the Fourth Amendment to Credit Agreement between the Company and WFEC, $9,134,890 of such amount was paid to WFEC when received by EXCO and BG in order to reduce the borrowings under the Company’s revolving credit facility with the balance of the cash received by the Company. The settlement included reimbursement of legal and arbitration expenses in the amount $677,303, which is included as other income for the year ended June 30, 2013.
We are party to lawsuits arising in the normal course of business. We intend to defend these actions vigorously and believe, based on currently available information, that adverse results or judgments from such actions, if any, will not be material to our financial position or results of operations. The legal climate in Northwest Louisiana is hostile and litigious towards oil and gas companies; and the legal environment in East Texas is becoming increasingly competitive and hostile. Mineral owners are seeking opportunities to make additional money from their mineral rights, including pursuit of claims of lease expiration by asserting that production does not exist in paying quantities. In the normal course of our business, title defects and lease issues of varying degrees will arise, and, if practicable, reasonable efforts will be made to cure any such defects and issues.
Note H — Fair Value Measurements:
We value our derivatives and other financial instruments according to FASB ASC Topic 820, Fair Value Measurements and Disclosures, which defines fair value as the exchange price that would be received for an asset or paid to transfer a liability (exit price) in the principal or most advantageous market for the asset or liability in an orderly transaction between market participants on the measurement date.
To estimate fair value, the Company utilizes market data or assumptions that market participants would use in pricing the asset or liability, including assumptions about risk and the risks inherent in the inputs to the valuation technique. These inputs can be readily observable, market corroborated or generally unobservable. The guidance establishes a fair value hierarchy that prioritizes the inputs to valuation techniques used to measure fair value. The hierarchy gives the highest priority to unadjusted quoted market prices in active markets for identical assets or liabilities (“Level 1”) and the lowest priority to unobservable inputs (“Level 3”).
CUBIC ENERGY, INC.
NOTES TO CONSOLIDATED FINANCIAL STATEMENTS
The three levels of the fair value hierarchy are as follows:
· Level 1 inputs are quoted prices (unadjusted) in active markets for identical assets or liabilities.
· Level 2 inputs are quoted prices for similar assets and liabilities in active markets or inputs that are observable for the asset or liability, either directly or indirectly through market corroboration, for substantially the full term of the financial instrument.
· Level 3 inputs are measured based on prices or valuation models that require inputs that are both significant to the fair value measurement and less observable from objective sources. These inputs may be used with internally developed methodologies or third party broker quotes that result in management’s best estimate of fair value. The Company’s valuation models consider various inputs including (a) quoted forward prices for commodities, (b) time value, (c) volatility factors and (d) current market and contractual prices for the underlying instruments. Significant increases or decreases in any of these inputs in isolation would result in a significantly higher or lower fair value measurement.
Level 3 instruments to which the Company is a party are call option contracts and fixed price swaps related to our natural gas and oil production. At each balance sheet date, the Company performs an analysis of all applicable instruments and includes in Level 3 all of those whose fair value is based on significant unobservable inputs. The fair values derived from counterparties and third-party brokers are verified by the Company using publicly available values for relevant NYMEX futures contracts and exchange traded contracts for each derivative settlement location. Although such counterparty and third-party broker quotes are used to assess the fair value of its commodity derivative instruments, the Company does not have access to the specific assumptions used in its counterparties’ valuation models. Consequently, additional disclosures regarding significant Level 3 unobservable inputs were not provided and the Company does not currently have sufficient corroborating market evidence to support classifying these contracts as Level 2 instruments.
As required, financial assets and liabilities are classified in their entirety based on the lowest level of input that is significant to the fair value measurement. The Company’s assessment of the significance of a particular input to the fair value measurement requires judgment and may affect the valuation of fair value assets and liabilities and their placement within the fair value hierarchy levels. The determination of the fair values below incorporates various factors, including the impact of the counterparty’s non-performance risk with respect to the Company’s financial assets and the Company’s non-performance risk with respect to the Company’s financial liabilities. The Company has not elected to offset the fair value amounts recognized for derivative instruments executed with the same counterparty, but reports them gross on its consolidated balance sheets. Transfers between levels are recognized at the end of the reporting period. There were no transfers between levels during the 2013 and 2014 periods.
CUBIC ENERGY, INC.
NOTES TO CONSOLIDATED FINANCIAL STATEMENTS
The following tables set forth by level within the fair value hierarchy the Company’s financial assets and liabilities that were accounted for at fair value on a recurring basis as of June 30, 2014:
|
|
|
Fair value as of June 30, 2014 |
| ||||||||||
|
|
|
Level 1 |
|
Level 2 |
|
Level 3 |
|
Total |
| ||||
|
|
|
|
|
|
|
|
|
|
| ||||
|
Derivative financial instruments -Assets |
|
$ |
— |
|
$ |
— |
|
$ |
— |
|
$ |
— |
|
|
Derivative financial instruments - Liabilities |
|
|
|
|
|
|
|
|
| ||||
|
Oil and natural gas derivative financial instruments |
|
— |
|
— |
|
33,117,425 |
|
33,117,425 |
| ||||
|
Total |
|
$ |
— |
|
$ |
— |
|
$ |
(33,117,425 |
) |
$ |
(33,117,425 |
) |
The fair value guidance, as amended, establishes that every derivative instrument is to be recorded on the balance sheet as either an asset or liability measured at fair value. (See Note J).
|
Derivative contract balance at June 30, 2013 |
|
$ |
— |
|
|
Derivative contract added October 2, 2013 |
|
35,091,536 |
| |
|
Loss on derivative contracts |
|
3,056,053 |
| |
|
Settlements on derivative contracts |
|
(5,030,164 |
) | |
|
Derivative contract as of June 30, 2014 |
|
$ |
33,117,425 |
|
The Company estimates the fair value of our oil and natural gas derivative instruments using the income method. The oil and natural gas forward contracts were estimated using counterparties and third party brokers and are verified by the Company using publicly available values for relevant NYMEX and West Texas Intermediate futures contracts.
Note I — Derivative Instruments and Hedging Activity:
From time to time, we utilize commodity fixed price swaps in which the Company receives a fixed price for the contract and pays a floating market price to the counterparty to attempt to reduce exposure to fluctuations in the price of crude oil and natural gas.
The Company also sells fixed price call options in exchange for a premium. At the time of settlement, if the market price exceeds the fixed price of the call option, the Company pays the counterparty such excess on sold fixed price call options. If the market price settles below the fixed price of the call option, no payment is due from either party. This arrangement does not hedge the Company’s risk associated with product price decreases.
On October 2, 2013, the Company, through its subsidiary Cubic Asset, entered into a Call Option Structured Derivative arrangement with a third party that resulted in the receipt of an upfront payment at closing of approximately $35,000,000, through the sale of calls, which upfront payment approximated fair value of the calls sold at inception. As a result, the Call Option Structured Derivative arrangement was initially recognized and measured at the amount of its upfront payment. Under the terms of the Call Option Structured Derivative arrangement, Cubic Asset sold calls to the third party covering (i) approximately 556,000 barrels of oil at a strike price set between $80 per barrel and $90 per barrel, and (ii) approximately 51.3 million MMBtu’s of gas at a strike price set between $3.45 per MMBtu and $3.90 per MMBtu. The scheduled volumes subject to the calls sold relate to production months from November 2013 through December 2018. The Company is subject to the price risks associated with product price changes that exceed the specified call prices.
CUBIC ENERGY, INC.
NOTES TO CONSOLIDATED FINANCIAL STATEMENTS
On October 2, 2013, the Company, through its subsidiary Cubic Asset, entered into a Fixed Price Swap arrangement covering approximately 18,000 barrels of oil at a price of $92 per barrel. The scheduled volumes subject to the calls sold relate to production months from November 2013 through October 2016. Cubic Asset receives the fixed price and pays the third party the floating market price during the applicable production month for the amount of production subject to the call. This third party has a junior lien position on both of the assets of Cubic Asset and Cubic Louisiana.
All derivative contracts are carried at their fair value on the balance sheet and all unrealized gains and losses as well as realized gains and losses related to contract settlements are presented in the statement of operations as a gain or (loss) on derivatives. For the year ended June 30, 2014, the Company reported a loss of $3,056,053, in the consolidated statement of operations related to its commodity derivative instruments.
As of June 30, 2014, the following natural gas derivative transactions were outstanding with the associated notional volumes and weighted average underlying hedge prices:
|
Settlement Period |
|
Derivative Instrument |
|
Average |
|
Total of |
|
Strike |
| |
|
|
|
|
|
In MMBtu |
|
|
| |||
|
2014 |
|
Call Option |
|
26,449 |
|
4,866,618 |
|
$ |
3.90 |
|
|
2015 |
|
Call Option |
|
29,305 |
|
10,696,392 |
|
$ |
3.70 |
|
|
2016 |
|
Call Option |
|
30,292 |
|
11,056,752 |
|
$ |
3.65 |
|
|
2017 |
|
Call Option |
|
30,643 |
|
11,184,600 |
|
$ |
3.55 |
|
|
2018 |
|
Call Option |
|
22,609 |
|
8,252,340 |
|
$ |
3.45 |
|
As of June 30, 2014, the following crude derivative transactions were outstanding with the associated notional volumes and weighted average underlying hedge prices:
|
Settlement Period |
|
Derivative Instrument |
|
Average |
|
Total of |
|
Strike |
| |
|
|
|
|
|
In Bbls |
|
|
| |||
|
2014 |
|
Fixed Price Swap |
|
23 |
|
4,134 |
|
$ |
92.00 |
|
|
2015 |
|
Fixed Price Swap |
|
15 |
|
5,532 |
|
$ |
92.00 |
|
|
2016 |
|
Fixed Price Swap |
|
8 |
|
2,900 |
|
$ |
92.00 |
|
|
|
|
|
|
|
|
|
|
|
| |
|
2014 |
|
Call Option |
|
287 |
|
52,812 |
|
$ |
90.00 |
|
|
2015 |
|
Call Option |
|
312 |
|
113,952 |
|
$ |
80.00 |
|
|
2016 |
|
Call Option |
|
361 |
|
131,796 |
|
$ |
80.00 |
|
|
2017 |
|
Call Option |
|
328 |
|
119,868 |
|
$ |
80.00 |
|
|
2018 |
|
Call Option |
|
218 |
|
79,452 |
|
$ |
80.00 |
|
CUBIC ENERGY, INC.
NOTES TO CONSOLIDATED FINANCIAL STATEMENTS
Oil derivatives. Our oil derivatives are swap and call option contracts for notional Bbls of oil at interval NYMEX oil index prices. The asset and liability values attributable to our oil derivatives as of the end of the reporting period are based on (i) the contracted notional volumes, (ii) independent active NYMEX future quotes for oil index prices, (iii) the applicable estimated credit-adjusted risk free rate curve, and (iv) the implied rate of volatility inherent in the call option contracts. The implied rates of volatility were determined based on average NYMEX oil index prices.
Natural gas derivatives. Our natural gas derivatives are option contracts for notional MMcf of natural gas at NYMEX penultimate index prices. The asset and liability values attributable to our natural gas derivatives as of the end of the reporting period are based on (i) the contracted notional volumes and (ii) the applicable credit-adjusted risk-free rate curve and (iii) the implied rate of volatility inherent in the call option contracts. The implied rates of volatility were determined based on average NYMEX penultimate index prices.
Additional Disclosures about Derivative Instruments and Hedging Activities
The tables below provide information on the location and amounts of derivative fair values in the condensed consolidated balance sheet and derivative gains and losses in the condensed consolidated statement of operations for derivative instruments that are not designated as hedging instruments:
|
|
|
Fair Values of Derivative Instruments |
| ||||||
|
|
|
Derivative Assets(Liabilities) |
| ||||||
|
|
|
|
|
Fair Value |
| ||||
|
|
|
Balance Sheet Location |
|
June 30, 2014 |
|
June 30, 2014 |
| ||
|
|
|
|
|
|
|
|
| ||
|
Derivatives not designated as hedging instruments |
|
|
|
|
|
|
| ||
|
Commodity derivative contracts |
|
Assets |
|
$ |
— |
|
$ |
— |
|
|
Commodity derivative contracts |
|
Current Liabilities |
|
(8,065,417 |
) |
— |
| ||
|
Commodity derivative contracts |
|
Long-term Liabilities |
|
(25,052,008 |
) |
— |
| ||
|
Total derivatives not designated as hedging instruments |
|
|
|
$ |
(33,117,425 |
) |
$ |
— |
|
|
|
|
Amount of Gain (Loss) Recognized in Income on Derivatives |
| ||||||
|
|
|
|
|
Amount of Gain (Loss) |
| ||||
|
|
|
Location of Gain (Loss) |
|
June 30, 2014 |
|
June 30, 2013 |
| ||
|
|
|
|
|
|
|
|
| ||
|
Derivatives not designated as hedging instruments |
|
|
|
|
|
|
| ||
|
Commodity derivative contracts |
|
Loss on derivatives |
|
$ |
(3,056,053 |
) |
$ |
— |
|
|
Total derivatives not designated as hedging instruments |
|
|
|
$ |
(3,056,053 |
) |
$ |
— |
|
CUBIC ENERGY, INC.
NOTES TO CONSOLIDATED FINANCIAL STATEMENTS
Volumes and Fair Value of Oil and Natural Gas Derivative Financial Instruments
|
|
|
Volume |
|
Fair Value per |
|
Fair value at |
|
Current |
|
Non-Current |
| ||||
|
Natural gas : |
|
|
|
|
|
|
|
|
|
|
| ||||
|
|
|
|
|
|
|
|
|
|
|
|
| ||||
|
Call Options: |
|
|
|
|
|
|
|
|
|
|
| ||||
|
2014 (7/1/2014-12/31/2014) |
|
4,866,618 |
|
$ |
0.60 |
|
$ |
2,917,537 |
|
$ |
2,917,537 |
|
$ |
— |
|
|
2015 |
|
10,696,392 |
|
$ |
0.55 |
|
6,175,384 |
|
3,453,152 |
|
2,722,232 |
| |||
|
2016 |
|
11,056,752 |
|
$ |
0.55 |
|
6,289,449 |
|
— |
|
6,289,449 |
| |||
|
2017 |
|
11,184,600 |
|
$ |
0.60 |
|
6,964,278 |
|
— |
|
6,964,278 |
| |||
|
2018 |
|
8,252,340 |
|
$ |
0.65 |
|
5,432,791 |
|
— |
|
5,432,791 |
| |||
|
Total natural gas |
|
|
|
|
|
$ |
27,779,439 |
|
$ |
6,370,689 |
|
$ |
21,408,750 |
| |
|
|
|
|
|
|
|
|
|
|
|
|
| ||||
|
Oil: |
|
|
|
|
|
|
|
|
|
|
| ||||
|
Swaps: |
|
|
|
|
|
|
|
|
|
|
| ||||
|
2014 (7/1/2014-12/31/2014) |
|
4,134 |
|
$ |
10.14 |
|
$ |
41,910 |
|
$ |
41,910 |
|
$ |
— |
|
|
2015 |
|
5,532 |
|
$ |
3.79 |
|
20,947 |
|
14,801 |
|
6,146 |
| |||
|
2016 |
|
2,900 |
|
$ |
(0.52 |
) |
(1,504 |
) |
— |
|
(1,504 |
) | |||
|
|
|
|
|
|
|
$ |
61,353 |
|
$ |
56,711 |
|
$ |
4,642 |
| |
|
Call Options: |
|
|
|
|
|
|
|
|
|
|
| ||||
|
2014 (7/1/2014-12/31/2014) |
|
52,812 |
|
$ |
12.85 |
|
$ |
678,854 |
|
$ |
678,855 |
|
$ |
— |
|
|
2015 |
|
113,952 |
|
$ |
15.13 |
|
1,724,331 |
|
959,162 |
|
765,168 |
| |||
|
2016 |
|
131,796 |
|
$ |
10.14 |
|
1,336,521 |
|
— |
|
1,336,521 |
| |||
|
2017 |
|
119,868 |
|
$ |
8.32 |
|
987,073 |
|
— |
|
987,073 |
| |||
|
2018 |
|
79,452 |
|
$ |
6.92 |
|
549,854 |
|
— |
|
549,854 |
| |||
|
Total oil |
|
|
|
|
|
$ |
5,276,633 |
|
$ |
1,638,017 |
|
$ |
3,638,616 |
| |
|
Total oil and natural gas derivatives |
|
|
|
|
|
$ |
33,117,425 |
|
$ |
8,065,417 |
|
$ |
25,052,008 |
| |
Note J — Asset Retirement Obligation:
We record an asset retirement obligation (“ARO”) associated with the retirement of our long-lived assets in the period in which they are incurred and become determinable. Under this method, we record a liability for the expected future cash outflows discounted at our credit-adjusted risk-free interest rate for the dismantlement and abandonment costs, excluding salvage values, of each oil and gas property. We also record an asset retirement cost to the oil and gas properties equal to the ARO liability. The fair value of the asset retirement cost and the ARO liability is measured using primarily Level 3 inputs. The significant unobservable inputs to this fair value measurement include estimates of plugging, abandonment and remediation costs, inflation rate and well life. The inputs are calculated based on historical data as well as current estimated costs. Accretion of the liability is recognized each period using the interest method of allocation, and the capitalized cost is depleted over the useful life of the related asset.
CUBIC ENERGY, INC.
NOTES TO CONSOLIDATED FINANCIAL STATEMENTS
The following table reflects the assumed ARO liability from the acquisition of assets on October 2, 2013 for the year ended June 30, 2014:
|
Asset retirement obligations, at June 30, 2013 |
|
$ |
— |
|
|
Activity during the period: |
|
|
| |
|
Liabilities incurred during the period |
|
1,576,322 |
| |
|
Liabilities settled during the period |
|
— |
| |
|
Accretion of discount |
|
339,954 |
| |
|
Asset retirement obligations, at June 30, 2014 |
|
1,916,276 |
| |
|
Less current portion |
|
— |
| |
|
Long-term portion |
|
$ |
1,916,276 |
|
Note K - Cost of oil and gas properties:
Costs incurred
Costs (capitalized and expensed) incurred in oil and gas property acquisition, exploration, and development activities for the years ended June 30, 2014 and 2013 were as follows:
|
|
|
Year Ended June 30, |
| ||||
|
|
|
2014 |
|
2013 |
| ||
|
Property acquisition costs |
|
|
|
|
| ||
|
Louisiana |
|
$ |
26,946,000 |
|
$ |
178,685 |
|
|
Texas |
|
62,578,148 |
|
— |
| ||
|
Exploratory costs |
|
|
|
|
| ||
|
Louisiana |
|
— |
|
— |
| ||
|
Texas |
|
— |
|
— |
| ||
|
Development costs |
|
|
|
|
| ||
|
Louisiana |
|
6,537,062 |
|
(290,569 |
) | ||
|
Texas |
|
2,860,692 |
|
— |
| ||
|
Total by State |
|
|
|
|
| ||
|
Louisiana |
|
33,483,062 |
|
(111,884 |
) | ||
|
Texas |
|
65,438,840 |
|
— |
| ||
|
Total |
|
$ |
98,921,902 |
|
$ |
(111,884 |
) |
The Company received several credits from EXCO during fiscal 2013 thus creating a negative costs incurred total for the year ended June 30, 2013.
CUBIC ENERGY, INC.
NOTES TO CONSOLIDATED FINANCIAL STATEMENTS
Capitalized costs
The aggregate amounts of capitalized costs relating to oil and gas producing activities and the aggregate amounts of the related accumulated depreciation, depletion, and amortization at June 30, 2014 and 2013 were as follows:
|
|
|
2014 |
|
2013 |
| ||
|
Proved properties |
|
$ |
148,223,148 |
|
$ |
56,009,780 |
|
|
Unproved properties |
|
8,227,109 |
|
— |
| ||
|
|
|
156,450,257 |
|
56,009,780 |
| ||
|
Less: accumulated depreciation, depletion and amortization of oil and gas properties |
|
(26,892,148 |
) |
(19,105,645 |
) | ||
|
Total properties |
|
129,558,109 |
|
36,904,135 |
| ||
|
Less: accumulated impairment of oil and gas properties due to full cost ceiling test |
|
(22,181,701 |
) |
(22,181,701 |
) | ||
|
Net properties |
|
$ |
107,376,408 |
|
$ |
14,722,434 |
|
Results of operations
The results of operations from oil and gas producing activities for the years ended June 30, 2014 and 2013 were as follows:
|
|
|
2014 |
|
2013 |
| ||
|
Revenues: |
|
|
|
|
| ||
|
Oil revenues |
|
$ |
977,880 |
|
$ |
77,640 |
|
|
Natural gas revenues |
|
14,750,152 |
|
3,661,677 |
| ||
|
NGL revenues |
|
121,450 |
|
104,103 |
| ||
|
|
|
15,849,482 |
|
3,843,420 |
| ||
|
Expenses (excluding G&A and interest expense): |
|
|
|
|
| ||
|
Production, operating and development costs |
|
|
|
|
| ||
|
Lease operating expense |
|
3,652,096 |
|
799,631 |
| ||
|
Production taxes |
|
(18,848 |
) |
187,081 |
| ||
|
Other O&G deductions |
|
5,368,772 |
|
885,474 |
| ||
|
Depreciation, depletion and amortization |
|
7,790,112 |
|
3,248,260 |
| ||
|
Impairment loss on oil and gas properties |
|
— |
|
— |
| ||
|
|
|
16,792,132 |
|
5,120,446 |
| ||
Note L - Oil and gas reserves information (unaudited):
The estimates of proved oil and gas reserves utilized in the preparation of the financial statements are estimated in accordance with guidelines established by the SEC and the FASB, which require that reserve estimates be prepared under existing economic and operating conditions with no provision for price and cost escalations over prices and costs existing at year-end except by contractual arrangements.
CUBIC ENERGY, INC.
NOTES TO CONSOLIDATED FINANCIAL STATEMENTS
The Company emphasizes that reserve estimates are inherently imprecise. Accordingly, the estimates are expected to change as more current information becomes available. The Company’s policy is to amortize capitalized oil and gas costs on the unit of production method, based upon these reserve estimates. The amortization was $1.89 per Mcfe during the twelve month period ended June 30, 2014, as compared to $2.80 per Mcfe during the same periods in 2013. It is reasonably possible that, because of changes in market conditions or the inherent imprecision of these reserve estimates, that the estimates of future cash inflows, future gross revenues, the amount of oil and gas reserves, the remaining estimated lives of the oil and gas properties, or any combination of the above may be increased or reduced in the near term.
If reduced, the carrying amount of capitalized oil and gas properties may be reduced materially in the near term.
The following unaudited table sets forth proved oil and gas reserves, all within the United States, at June 30, 2014 and 2013 together with the changes therein:
|
|
|
Natural Gas (Mcfe) |
| ||
|
|
|
2014 |
|
2013 |
|
|
|
|
|
|
|
|
|
Proved developed reserves: |
|
|
|
|
|
|
Beginning of year |
|
4,899,388 |
|
3,982,265 |
|
|
Revisions of previous estimates |
|
4,432,322 |
|
2,058,597 |
|
|
Purchases of reserves in place |
|
85,054,533 |
|
— |
|
|
Production |
|
(4,044,085 |
) |
(1,141,474 |
) |
|
|
|
|
|
|
|
|
End of year |
|
90,342,158 |
|
4,899,388 |
|
|
|
|
|
|
|
|
|
Proved developed reserves, end of year |
|
90,342,158 |
|
4,899,388 |
|
|
|
|
|
|
|
|
|
Proved undeveloped reserves: |
|
|
|
|
|
|
Beginning of year |
|
28,092,172 |
|
19,357,720 |
|
|
Revisions of previous estimates |
|
(15,814,343 |
) |
(1,704,875 |
) |
|
Purchases of reserves in place |
|
20,140,796 |
|
— |
|
|
Extensions and discoveries |
|
3,762,262 |
|
10,439,327 |
|
|
|
|
|
|
|
|
|
End of year |
|
36,180,887 |
|
28,092,172 |
|
|
|
|
|
|
|
|
|
Proved undeveloped reserves, end of year |
|
36,180,887 |
|
28,092,172 |
|
CUBIC ENERGY, INC.
NOTES TO CONSOLIDATED FINANCIAL STATEMENTS
|
|
|
Oil, Condensate (Bbls) |
| ||
|
|
|
2014 |
|
2013 |
|
|
|
|
|
|
|
|
|
Proved developed reserves: |
|
|
|
|
|
|
Beginning of year |
|
1,835 |
|
443 |
|
|
Revisions of previous estimates |
|
9,173 |
|
2,255 |
|
|
Purchases of reserves in place |
|
53,984 |
|
— |
|
|
Production |
|
(10,231 |
) |
(863 |
) |
|
|
|
|
|
|
|
|
End of year |
|
54,761 |
|
1,835 |
|
|
|
|
|
|
|
|
|
Proved developed reserves, end of year |
|
54,761 |
|
1,835 |
|
|
|
|
|
|
|
|
|
Proved undeveloped reserves: |
|
|
|
|
|
|
Beginning of year |
|
393,673 |
|
427,190 |
|
|
Revisions of previous estimates |
|
(217,471 |
) |
(179,808 |
) |
|
Purchases of reserves in place |
|
236,730 |
|
— |
|
|
Extensions and discoveries |
|
53,994 |
|
146,291 |
|
|
|
|
|
|
|
|
|
End of year |
|
466,926 |
|
393,673 |
|
|
|
|
|
|
|
|
|
Proved undeveloped reserves, end of year |
|
466,926 |
|
393,673 |
|
|
|
|
NGL (Bbls) |
| ||
|
|
|
2014 |
|
2013 |
|
|
|
|
|
|
|
|
|
Proved developed reserves: |
|
|
|
|
|
|
Beginning of year |
|
11,205 |
|
35 |
|
|
Revisions of previous estimates |
|
(4,101 |
) |
13,695 |
|
|
Purchases of reserves in place |
|
4,671 |
|
— |
|
|
Production |
|
(2,658 |
) |
(2,525 |
) |
|
|
|
|
|
|
|
|
End of year |
|
9,117 |
|
11,205 |
|
|
|
|
|
|
|
|
|
Proved developed reserves, end of year |
|
9,117 |
|
11,205 |
|
|
|
|
|
|
|
|
|
Proved undeveloped reserves: |
|
|
|
|
|
|
Beginning of year |
|
1,624,269 |
|
1,313,531 |
|
|
Revisions of previous estimates |
|
(1,286,946 |
) |
(292,864 |
) |
|
Purchases of reserves in place |
|
453,196 |
|
— |
|
|
Extensions and discoveries |
|
103,365 |
|
603,602 |
|
|
|
|
|
|
|
|
|
End of year |
|
893,884 |
|
1,624,269 |
|
|
|
|
|
|
|
|
|
Proved undeveloped reserves, end of year |
|
893,884 |
|
1,624,269 |
|
CUBIC ENERGY, INC.
NOTES TO CONSOLIDATED FINANCIAL STATEMENTS
|
|
|
Natural Gas (Mcfs) |
| ||
|
|
|
2014 |
|
2013 |
|
|
|
|
|
|
|
|
|
Proved developed reserves: |
|
|
|
|
|
|
Beginning of year |
|
4,899,388 |
|
3,982,265 |
|
|
End of year |
|
90,342,158 |
|
4,899,388 |
|
|
|
|
|
|
|
|
|
Proved undeveloped reserves: |
|
|
|
|
|
|
Beginning of year |
|
28,092,172 |
|
19,357,720 |
|
|
End of year |
|
36,180,887 |
|
28,092,172 |
|
|
|
|
Oil (Bbls) |
| ||
|
|
|
2014 |
|
2013 |
|
|
|
|
|
|
|
|
|
Proved developed reserves: |
|
|
|
|
|
|
Beginning of year |
|
1,835 |
|
443 |
|
|
End of year |
|
54,761 |
|
1,835 |
|
|
|
|
|
|
|
|
|
Proved undeveloped reserves: |
|
|
|
|
|
|
Beginning of year |
|
393,673 |
|
427,190 |
|
|
End of year |
|
466,926 |
|
393,673 |
|
|
|
|
Natural Gas Liquids (Bbls) |
| ||
|
|
|
2014 |
|
2013 |
|
|
|
|
|
|
|
|
|
Proved developed reserves: |
|
|
|
|
|
|
Beginning of year |
|
11,205 |
|
35 |
|
|
End of year |
|
9,117 |
|
11,205 |
|
|
|
|
|
|
|
|
|
Proved undeveloped reserves: |
|
|
|
|
|
|
Beginning of year |
|
1,624,269 |
|
1,313,531 |
|
|
End of year |
|
893,884 |
|
1,624,269 |
|
The Company’s Louisiana acreage lies atop the center of what is known in our industry as the “Haynesville Shale Play” (which we refer to as the “Bossier/Haynesville shale” elsewhere herein), one of the most prolific dry gas recent field discoveries in the United States; and also includes the Cotton Valley sand formation, a formation with gas, NGL and oil. The discovery of the existence of the Bossier/Haynesville shale formations in the Company’s acreage in fiscal 2008, in an environment of strong pricing for dry natural gas, led to a shift in strategy away from concentrating solely on the development of the Cotton Valley and other shallow formations in our Bethany Longstreet and Johnson Branch fields, and to commencement of the development of the Bossier/Haynesville shale acreage. Development slowed in fiscal 2009, due to deteriorated economic conditions, a harsh debt and equity environment, stubbornly high field operation costs, and a collapse in the pricing of natural gas.
The strategic transactions consummated by the Company in the first half of fiscal 2010 repositioned the Company for increased development of the Bossier/Haynesville shale on its acreage. And, development activity did gain some momentum by the second half of fiscal 2010, with increased activity and development undertaken by EXCO as well as other third party operators of the Bossier/Haynesville shale through fiscal 2011, despite a depressed commodity market for natural gas. The continued deterioration of pricing for dry natural gas, which has persisted through fiscal 2013, brought a halt to additional development of the Bossier/Haynesville shale on Company acreage. In fiscal 2014, due to spikes in natural gas pricing, and
CUBIC ENERGY, INC.
NOTES TO CONSOLIDATED FINANCIAL STATEMENTS
greater drilling and completion efficiencies, development of the Haynesville Shale formation re-commenced in fiscal 2014. As in fiscal 2013, in fiscal 2014, dry natural gas pricing on average was so low that the Company could not recognize any Proven Undeveloped locations in the Bossier/Haynesville shale; however, the Bossier/Haynesville shale remains a prolific dry gas field and a significant asset to the Company upon a more permanent correction in commodity pricing. In addition, secondary completion efforts have been performed on some of the earliest drilled and completed Haynesville Shale wells near our acreage, and such secondary completion efforts have been very successful economically at increasing production significantly at low expenditures. In 2014, through its acquisition of the Tauren Louisiana acreage, the Company more than doubled its Cotton Valley and shallower zones working interest in its existing acreage. A variety of horizontal development in the Cotton Valley sand in and around our Northwest Louisiana acreage commenced in fiscal 2013 and continued into fiscal 2014.
On October 2, 2013, we acquired acreage from Gastar and Navasota in Leon and Robertson Counties, Texas. Approximately 40% of this acreage is held by production, with the balance of this acreage to be renewed or drilled to hold. Additionally, there is open acreage in and around our Leon and Robertson County acreage position. We are experiencing significant competition in Leon and Robertson Counties with both renewing our current acreage position not held by production as well as taking new leases; however, this has not yet had a material impact in our operations or our plans for development. These acquisitions afford the Company exploitation opportunities in the reservoir rich environments of the Cotton Valley Knowles and the Middle and Deep Bossier; along with the Bossier, Eagle Ford, Woodbine, Austin Chalk, Buda, Glen Rose and Georgetown formations. The Company has seen success on its acreage with wells drilled by achieving production from the Bossier formations.
Natural gas commodity pricing, though stronger in fiscal 2014 than in the previous few years, still remained somewhat historically depressed. While oil prices remained strong in fiscal 2014, pricing for NGL weakened significantly.
Nearly all of the Company’s reserve value for fiscal 2014 in its June 30, 2014 reserve report are in proved developed producing wells and proved developed non-producing reserves in existing well bores. As acquired in fiscal year 2014, all East Texas proved developed producing reserves and proved developed non-producing reserves are new to the Company’s reserve report, and comprise a substantial portion of the Company’s reserve value. While the Company has material net reserves in its proven undeveloped drilling locations in this reserve report, de minimis value is afforded to them.
The Company has a variety of proven undeveloped locations in the Cotton Valley sand for its June 30, 2014, SEC reserve report. In comparison to the June 30, 2013 reserve report, 19 Cotton Valley proved undeveloped locations and are now not reflected at all in the reserve report due to not being drilled, lack of capital to drill such locations, and the general slow pace of Cotton Valley development over the past fiscal year; however, the Company picked up 6 new Cotton Valley proved undeveloped locations due to overall field development and activity and longer range Company planning. The Company does show some proved undeveloped reserve value for its East Texas acreage.
The “Revisions of previous estimates” were reduced by 21,911,480 Mcfe due to 19 wells (deemed uneconomical) dropping off the drilling schedule as proved undeveloped Cotton Valley locations. This reduction is offset by 4,706,416 Mcfe stemming from 6 new Cotton Valley proved undeveloped locations on the drilling schedule. The reserve estimates attributable to these new proved undeveloped locations are listed under “Extensions and discoveries.”
CUBIC ENERGY, INC.
NOTES TO CONSOLIDATED FINANCIAL STATEMENTS
Standardized measure of discounted future net cash flows relating to proved reserves:
The Standardized Measure of discounted future net cash flows (discounted at 10%) from production of proved reserves was developed as follows:
· An estimate was made of the quantity of proved reserves and the future periods in which they are expected to be produced based on year-end economic conditions.
· In accordance with SEC guidelines, the engineers’ estimates of future net revenues from our proved properties and the present value thereof for fiscal 2014 and 2013 are made using the twelve-month average of the first-day-of-the-month reference prices as adjusted for location and quality differentials. Prior year estimates were not required to be restated and reflect previously disclosed estimates using year-end prices. These prices are held constant throughout the life of the properties. Oil and natural gas prices are adjusted for each lease for quality, contractual agreements, lease use shrinkage and regional price variations.
· The future gross revenue streams were reduced by estimated future operating costs (including production and ad valorem taxes) and future development and abandonment costs, all of which were based on current costs in effect at June 30 of the year presented and held constant throughout the life of the properties.
· Future income taxes were calculated by applying the statutory federal and state income tax rate to pre-tax future net cash flows, net of the tax basis of the properties involved and utilization of available tax carryforwards related to oil and gas operations.
Plugging and abandonment costs of $166,000 during the year ended June 30, 2013 were less than 0.5% of the Standardized Measure shown on our June 30, 2013 reserve report of $39,025,000. Therefore, it was determined that the plugging and abandonment costs were not material for that period, and were excluded from the estimates included in this reserve report.
The resulting future net cash flows were discounted using a rate of 10% per annum (Table 1). The standardized measure of discounted net cash flow amounts contained in the following tabulation does not purport to represent the fair market value of the Company’s oil and gas proved by drilling or production history. There are significant uncertainties inherent in estimating timing and amount of future costs. In addition, the method of valuation utilized is based on current prices and costs and the use of a 10% discount rate, and is not necessarily appropriate for determining fair value (Table 2).
CUBIC ENERGY, INC.
NOTES TO CONSOLIDATED FINANCIAL STATEMENTS
The following is the estimated standardized measure relating to proved oil and gas reserves at June 30, 2014 and 2013:
|
Table 1 |
|
2014 |
|
2013 |
| ||
|
Future cash flows |
|
$ |
601,221,686 |
|
$ |
242,990,435 |
|
|
Future production costs |
|
(131,252,700 |
) |
(29,432,000 |
) | ||
|
Future development costs |
|
(153,595,600 |
) |
(111,455,400 |
) | ||
|
Future severance tax expense |
|
(30,637,508 |
) |
(13,268,035 |
) | ||
|
Future income taxes |
|
— |
|
— |
| ||
|
Future net cash flows |
|
$ |
285,735,878 |
|
$ |
88,835,000 |
|
|
Ten percent annual discount for estimated timing of net cash flows |
|
(149,143,028 |
) |
(49,787,200 |
) | ||
|
Standardized measure of discounted future net cash flows |
|
$ |
136,592,850 |
|
$ |
39,047,800 |
|
The following is an analysis of changes in the estimated standardized measure of proved reserves during the years ended June 30, 2014 and 2013:
|
Table 2 |
|
2014 |
|
2013 |
| ||
|
Changes from: |
|
|
|
|
| ||
|
Sale of oil and gas produced |
|
$ |
(6,847,463 |
) |
$ |
(1,971,234 |
) |
|
Net changes in prices and production costs |
|
(12,935,482 |
) |
(695,805 |
) | ||
|
Extensions and discoveries |
|
(592,800 |
) |
12,195,100 |
| ||
|
Revision of previous quantity estimates |
|
(10,053,209 |
) |
11,285,959 |
| ||
|
Accretion of discounts |
|
3,904,780 |
|
2,997,621 |
| ||
|
Net change in income taxes |
|
— |
|
526,854 |
| ||
|
Purchases of reserves in place |
|
127,429,600 |
|
— |
| ||
|
Disposals of reserves in place |
|
— |
|
— |
| ||
|
Development costs incurred that reduced future development costs |
|
— |
|
— |
| ||
|
Changes in future development costs |
|
(8,397,684 |
) |
48,872,306 |
| ||
|
Changes in timing of production and other |
|
5,037,308 |
|
(64,139,210 |
) | ||
|
Change in standardized measure |
|
$ |
97,545,050 |
|
$ |
9,071,591 |
|
|
Commodity Pricing |
|
2014 |
|
2013 |
| ||
|
Oil - per Bbl |
|
$ |
97.51 |
|
$ |
85.13 |
|
|
Natural Gas - per Mcf |
|
$ |
4.01 |
|
$ |
3.62 |
|
|
Natural Gas Liquids - per Bbl |
|
$ |
47.66 |
|
$ |
54.99 |
|
CUBIC ENERGY, INC.
NOTES TO CONSOLIDATED FINANCIAL STATEMENTS
On July 14, 2014, the Company entered into an Amendment, Forbearance and Waiver Agreement (the “Amendment”) with the holders of its senior secured notes due October 2, 2016 (the “Notes”), and certain other parties thereto. The Amendment amends the Note Purchase Agreement dated October 2, 2013 (the “Note Purchase Agreement”), pursuant to which the Company initially issued an aggregate of $66,000,000 of Notes.
Pursuant to the Amendment, the holders of the Notes waived various defaults specified in the Amendment, and the parties agreed to modify certain covenants in the Note Purchase Agreement. The holders of the Notes also waived their right to receive Default Interest and Registration Default Interest (as such terms are defined in the Note Purchase Agreement). In addition, the Amendment provides that after March 31, 2014, the interest rate applicable to the Notes is increased from 15.5% per annum to 20.5% per annum; provided that after such date interest shall not be payable in cash but shall accrue and compound on a quarterly basis.
EXHIBIT INDEX
|
No. |
|
Description |
|
|
|
|
|
2.1 |
|
Purchase and Sale Agreement, dated as of April 19, 2013, by and among Cubic Energy, Inc., Gastar Exploration Texas, LP and Gastar Exploration USA, Inc. (filed as Exhibit 2.1 to the Registrant’s Form 8-K filed with the SEC on October 3, 2013). |
|
|
|
|
|
2.2 |
|
Purchase and Sale Agreement, dated as of September 27, 2013, by and among Cubic Energy, Inc. and Navasota Resources Ltd., LLP (filed as Exhibit 2.2 to the Registrant’s Form 8-K filed with the SEC on October 3, 2013). |
|
|
|
|
|
2.3 |
|
Purchase and Sale Agreement, dated as of October 2, 2013, by and among Cubic Energy, Inc. and Tauren Exploration, Inc. (filed as Exhibit 2.3 to the Registrant’s Form 8-K filed with the SEC on October 3, 2013). |
|
|
|
|
|
3.1 |
|
Amended and Restated Certificate of Formation (filed as Exhibit 3.1 to the Registrant’s Form 8-K filed with the SEC on March 10, 2010). |
|
|
|
|
|
3.2 |
|
Certificate of Amendment to the Amended and Restated Certificate of Formation (filed as Exhibit 3.2 to Company’s Form 10-K filed with the SEC on September 28, 2012) |
|
|
|
|
|
3.3 |
|
Certificate of Amendment to the Amended and Restated Certificate of Formation (filed as Exhibit 3.3 to Company’s Form S-1/A filed with the SEC on June 26, 2014) |
|
|
|
|
|
3.4 |
|
Certificate of Designations Establishing a Series of Preferred Stock (Series B Convertible Preferred Stock) of Cubic Energy, Inc. filed with the Secretary of State of Texas on October 2, 2013 (filed as Exhibit 3.1 to the Registrant’s Form 8-K filed with the SEC on October 3, 2013). |
|
|
|
|
|
3.5 |
|
Certificate of Designations Establishing a Series of Preferred Stock (Series C Redeemable Voting Preferred Stock) of Cubic Energy, Inc. filed with the Secretary of State of Texas on October 2, 2013 (filed as Exhibit 3.2 to the Registrant’s Form 8-K filed with the SEC on October 3, 2013). |
|
|
|
|
|
3.6 |
|
Bylaws (filed as Exhibit 3.2 of the Company’s Form 10-KSB for the period ended June 30, 2000). |
|
|
|
|
|
10.1 |
|
Amended and Restated Warrant to Purchase Shares of Common Stock of Cubic Energy, Inc., dated December 18, 2009, issued to Wells Fargo Energy Capital, Inc. (filed as Exhibit 10.4 to the Company’s Form 8-K filed December 23, 2009). |
|
|
|
|
|
10.2 |
|
Warrant to Purchase Shares of Common Stock of Cubic Energy, Inc., dated December 18, 2009, issued to Wells Fargo Energy Capital, Inc. (filed as Exhibit 10.5 to the Company’s Form 8-K filed December 23, 2009). |
|
|
|
|
|
10.3 |
|
Warrant to Purchase Shares of Common Stock of Cubic Energy, Inc., dated August 30, 2010, issued to Wells Fargo Energy Capital, Inc. (filed as Exhibit 10.2 to the Company’s Form 8-K filed September 1, 2010). |
|
|
|
|
|
10.4 |
|
Second Amended and Restated Registration Rights Agreement, dated as of August 30, 2010, by and between Cubic Energy, Inc. and Wells Fargo Energy Capital, Inc. (filed as Exhibit 10.3 to the Company’s Form 8-K filed September 1, 2010). |
|
10.5 |
|
Employment Agreement with Calvin A. Wallen, III, dated February 29, 2008 (filed as Exhibit 10.1 to the Company’s Form 8-K on March 5, 2008) +. |
|
|
|
|
|
10.6 |
|
Amendment to Employment Agreement with Calvin A. Wallen, III, dated December 16, 2013 (filed as Exhibit 10.1 to the Company’s Form 8-K filed on December 18, 2014) +. |
|
|
|
|
|
10.7 |
|
Employment Agreement with Jon S. Ross dated February 29, 2008 (filed as Exhibit 10.1 to the Company’s Form 8-K on March 5, 2008) +. |
|
|
|
|
|
10.8 |
|
Amendment to Employment Agreement with Jon S. Ross, dated December 16, 2013 (filed as Exhibit 10.2 to the Company’s Form 8-K filed on December 18, 2014) +. |
|
|
|
|
|
10.9 |
|
Employment Agreement with Scott M. Pinsonnault, dated March 24, 2014 (filed as Exhibit 10.1 to the Company’s Form 8-K on March 28, 2014) +. |
|
|
|
|
|
10.10 |
|
Subordinated Promissory Note, dated as of September 12, 2012, by Cubic Energy, Inc., payable to Calvin A. Wallen, III (filed as Exhibit 10.1 to the Company’s Form 8-K filed September 12, 2012). |
|
|
|
|
|
10.11 |
|
Convertible Promissory Note payable to Wells Fargo Energy Capital, Inc. in the principal amount of $5,000,000 date June 18, 2012 (filed as Exhibit 10.2 to the Company’s Form 8-K filed June 20, 2012). |
|
|
|
|
|
10.12 |
|
Promissory Note payable to Wells Fargo Energy Capital, Inc. in the maximum principal amount of $40,000,000 dated June 18, 2012 (filed in Exhibit 10.3 to the Company’s Form 8-K filed June 20, 2012). |
|
|
|
|
|
10.13 |
|
Settlement Agreement and Mutual Release effective as of October 2, 2012 by and between Cubic Energy, Inc., Tauren Exploration, Inc., EXCO Operating Company, LP and BG US Production Company, LLC (filed as Exhibit 10.1 to the Company’s Form 8-K filed October 9, 2012). |
|
|
|
|
|
10.14 |
|
Cubic Energy, Inc. 2005 Stock Option Plan (filed as Exhibit D to the Company’s Definitive Schedule 14A filed with the SEC on December 12, 2005) +. |
|
|
|
|
|
10.15 |
|
Amendment to Cubic Energy, Inc. 2005 Stock Option Plan effective as of May 7, 2010(filed as Exhibit 10.37 to the Company’s Form 10-K filed September 28, 2010) +. |
|
|
|
|
|
10.16 |
|
Note Purchase Agreement (15.5% Senior Secured First Lien Notes due 2016), dated as of October 2, 2013, among the Company, each guarantor listed on Schedule I thereto, and each other guarantor from time to time party thereto, certain note purchasers, and Wilmington Trust National Association, as Noteholders’ agent, the Company Collateral Agent, the New Asset Collateral Agent and the Old Asset Collateral Agent (each such terms, as defined therein) (filed as Exhibit 10.1 to the Registrant’s Form 8-K filed with the SEC on October 3, 2013). |
|
|
|
|
|
10.17 |
|
Amendment, Forbearance and Waiver Agreement entered into on the 14th day of July 2014, by and among Cubic Energy, Inc., Cubic Asset, LLC, Cubic Asset Holding, LLC, Cubic Louisiana, LLC, Cubic Louisiana Holding, LLC, and the Noteholders and Registration Rights Holders (each as defined therein)(filed as Exhibit 10.1 to the Registrant’s Form 8-K filed with the SEC on July 14, 2014) |
|
|
|
|
|
10.18 |
|
Form of Series A Note (filed as Exhibit 10.2 to the Registrant’s Form 8-K filed with the SEC on October 3, 2013). |
|
10.19 |
|
Form of Series B Note (filed as Exhibit 10.3 to the Registrant’s Form 8-K filed with the SEC on October 3, 2013). |
|
|
|
|
|
10.20 |
|
Amended and Restated Credit Agreement by and between Cubic Louisiana, LLC and Wells Fargo Energy Capital, Inc., dated as of October 2, 2013(filed as Exhibit 10.4 to the Registrant’s Form 8-K filed with the SEC on October 3, 2013). |
|
|
|
|
|
10.21 |
|
Registration Rights Agreement, dated as of October 2, 2013, by and among Cubic Energy, Inc. and the Investors. (filed as Exhibit 10.5 to the Registrant’s Form 8-K filed with the SEC on October 3, 2013). |
|
|
|
|
|
10.22 |
|
Investment Agreement, dated as of October 2, 2013, by and among Cubic Energy, Inc. and the Investors. (filed as Exhibit 10.6 to the Registrant’s Form 8-K filed with the SEC on October 3, 2013). |
|
|
|
|
|
10.23 |
|
Warrant and Preferred Stock Agreement, dated as of October 2, 2013, by and among Cubic Energy, Inc. and the Investors. (filed as Exhibit 10.7 to the Registrant’s Form 8-K filed with the SEC on October 3, 2013). |
|
|
|
|
|
10.24 |
|
Form of Class A Warrant (filed as Exhibit 10.8 to the Registrant’s Form 8-K filed with the SEC on October 3, 2013). |
|
|
|
|
|
10.25 |
|
Form of Class B Warrant (filed as Exhibit 10.9 to the Registrant’s Form 8-K filed with the SEC on October 3, 2013). |
|
|
|
|
|
10.26 |
|
Conversion and Preferred Stock Purchase Agreement, dated as of October 2, 2013, by and among Cubic Energy, Inc., Langtry Mineral & Development, LLC and Calvin A. Wallen, III (filed as Exhibit 10.10 to the Registrant’s Form 8-K filed with the SEC on October 3, 2013). |
|
|
|
|
|
10.27 |
|
Operational Agency Agreement, dated October 2, 2013, by and among Cubic Asset LLC and BP Energy Company (filed as Exhibit 10.11 to the Company’s Form 8-K/A filed with the SEC on March 17, 2014) |
|
|
|
|
|
10.28 |
|
ISDA 2002 Master Agreement, dated October 2, 2013, between BP Energy Company and Cubic Louisiana LLC (filed as Exhibit 10.12 to the Company’s Form 8-K/A filed with the SEC on March 17, 2014) |
|
|
|
|
|
10.29 |
|
Agreement made effective October 2, 2013 between BP Products North America Inc. and Cubic Asset, LLC (filed as Exhibit 10.13 to the Company’s Form 8-K/A filed with the SEC on March 17, 2014) |
|
|
|
|
|
10.30 |
|
ISDA 2002 Master Agreement, dated October 2, 2013, between BP Energy Company and Cubic Louisiana LLC (filed as Exhibit 10.14 to the Company’s Form 8-K/A filed with the SEC on March 17, 2014) |
|
|
|
|
|
10.31 |
|
ISDA 2002 Master Agreement, dated October 2, 2013 between BP Energy Company and Cubic Asset LLC (filed as Exhibit 10.15 to the Company’s Form 8-K/A filed with the SEC on March 17, 2014) |
|
|
|
|
|
16.1 |
|
Letter from Vogel CPAs, PC dated July 16, 2014, regarding change in independent registered public accounting firm (filed as Exhibit 16.1 to the Registrant’s Form 8-K filed with the SEC on July 17, 2014) |
|
|
|
|
|
23.1 |
|
Consent of Vogel CPAs, PC* |
|
23.2 |
|
Consent of BDO USA, LLP* |
|
|
|
|
|
23.3 |
|
Consent of NSAI* |
|
|
|
|
|
23.4 |
|
Consent of NPC Engineering, Inc. |
|
|
|
|
|
31.1 |
|
Rule 13a-14(a)/15d-14(a) Certification of Calvin A. Wallen, III* |
|
|
|
|
|
31.2 |
|
Rule 13a-14(a)/15d-14(a) Certification of Larry G. Badgley* |
|
|
|
|
|
32.1 |
|
Section 1350 Certification of Calvin A. Wallen, III* |
|
|
|
|
|
32.2 |
|
Section 1350 Certification of Larry G. Badgley* |
|
|
|
|
|
99.1 |
|
NSAI Reserve Report summary letter for assets of Cubic Louisiana, LLC* |
|
|
|
|
|
99.2 |
|
NSAI Reserve Report summary letter for assets of Cubic Asset, LLC* |
|
101.INS |
|
XBRL Instance Document.** |
|
|
|
|
|
101.SCH |
|
XBRL Taxonomy Extension Schema Document.** |
|
|
|
|
|
101.CAL |
|
XBRL Taxonomy Calculation Linkbase Document.** |
|
|
|
|
|
101.DEF |
|
XBRL Taxonomy Definition Linkbase Document. ** |
|
|
|
|
|
101.LAB |
|
XBRL Taxonomy Label Linkbase Document.** |
|
|
|
|
|
101.PRE |
|
XBRL Taxonomy Presentation Linkbase Document.** |
* Filed herewith
** Furnished with this report. In accordance with Rule 406T of Regulation S-T, the information in these exhibits shall not be deemed to be “filed” for purposes of Section 18 of the Securities Exchange Act of 1934, as amended, or otherwise subject to liability under that section, and shall not be incorporated by reference into any registration statement or other document filed under the Securities Act of 1933, as amended, except as expressly set forth by specific reference in such filing.
+ These exhibits are management contracts