Attached files
Table of Contents
UNITED STATES
SECURITIES AND EXCHANGE COMMISSION
WASHINGTON, D.C. 20549
FORM 10-K
ANNUAL REPORT PURSUANT TO SECTION 13 OR 15(D) OF THE SECURITIES EXCHANGE ACT OF 1934
For the fiscal year ended December 31, 2009
Commission file number 1-32737
KOPPERS HOLDINGS INC.
(Exact name of registrant as specified in its charter)
| Pennsylvania | 20-1878963 | |
| (State of incorporation) | (IRS Employer Identification No.) | |
| 436 Seventh Avenue Pittsburgh, Pennsylvania 15219 |
(412) 227-2001 | |
| (Address of principal executive offices) | (Registrant’s telephone number, including area code) | |
Securities registered pursuant to Section 12(b) of the Act:
| Common Stock, par value $0.01 per share | New York Stock Exchange | |
| Title of Each Class | Name of Exchange on which registered |
Securities registered pursuant to Section 12(g) of the Act: None
Indicate by check mark if the registrant is a well-known seasoned issuer, as defined in Rule 405 of the Securities Act: Yes ¨ No x
Indicate by check mark if the registrant is not required to file reports pursuant to Section 13 or 15(d) of the Act. Yes ¨ No x
Indicate by check mark whether the registrant (1) has filed all reports required to be filed by Section 13 or 15(d) of the Securities Exchange Act of 1934 during the preceding 12 months (or for such shorter period that the registrant was required to file such reports) and (2) has been subject to such filing requirements for the past 90 days. Yes x No ¨
Indicate by check mark whether the registrant has submitted electronically and posted on its corporate Web site, if any, every Interactive Data File required to be submitted and posted pursuant to Rule 405 of Regulation S-T during the preceding 12 months (or for such shorter period that the registrant was required to submit and post such files). Yes ¨ No ¨
Indicate by check mark if disclosure of delinquent filers pursuant to Item 405 of Regulation S-K is not contained herein, and will not be contained, to the best of registrant’s knowledge, in definitive proxy or information statements incorporated by reference in Part III of this Form 10-K or any amendment to this Form 10-K. ¨
Indicate by check mark whether the registrant is a large accelerated filer, an accelerated filer, a non-accelerated filer or a smaller reporting company. See the definitions of “large accelerated filer”, “accelerated filer” and “smaller reporting company” in Rule 12b-2 of the Exchange Act. (Check one):
Large accelerated filer x Accelerated filer ¨ Non-accelerated filer ¨ Smaller reporting company ¨
Indicate by check mark whether the registrant is a shell company (as defined in Rule 12b-2 of the Exchange Act). Yes ¨ No x
The aggregate market value of Common Stock held by non-affiliates of the registrant, based on the closing sales price of the Common Stock on the New York Stock Exchange on June 30, 2009 was $526.4 million (affiliates, for this purpose, have been deemed to be Directors and executive officers of Koppers Holdings Inc.).
As of January 31, 2010, 20,454,872 shares of Common Stock of the registrant were issued and outstanding.
DOCUMENTS INCORPORATED BY REFERENCE
Portions of the registrant’s Proxy Statement for the 2010 Annual Meeting of Stockholders are incorporated by reference into Part III of this Annual Report on Form 10-K.
1
Table of Contents
| Item | Page | |||
| Part I | ||||
| 1. |
Business | 3 | ||
| 1A. |
Risk Factors | 8 | ||
| 1B. |
Unresolved Staff Comments | 21 | ||
| 2. |
Properties | 21 | ||
| 3. |
Legal Proceedings | 22 | ||
| 4. |
Submission of Matters to a Vote of Security Holders | 22 | ||
| Part II | ||||
| 5. |
24 | |||
| 6. |
Selected Financial Data | 26 | ||
| 7. |
Management’s Discussion and Analysis of Financial Condition and Results of Operations | 28 | ||
| 7A. |
Quantitative and Qualitative Disclosures About Market Risk | 41 | ||
| 8. |
Financial Statements and Supplementary Data | 42 | ||
| 9. |
Changes in and Disagreements with Accountants on Accounting and Financial Disclosure | 90 | ||
| 9A. |
Controls and Procedures | 90 | ||
| Part III | ||||
| 10. |
Directors, Executive Officers and Corporate Governance | 91 | ||
| 11. |
Executive Compensation | 91 | ||
| 12. |
Security Ownership of Certain Beneficial Owners and Management and Related Stockholder Matters | 91 | ||
| 13. |
Certain Relationships and Related Transactions, and Director Independence | 91 | ||
| 14. |
Principal Accountant Fees and Services | 91 | ||
| Part IV | ||||
| 15. |
Exhibits and Financial Statement Schedules | 92 | ||
| Signatures |
||||
| 96 | ||||
2
Table of Contents
Koppers Holdings Inc. 2009 Annual Report
FORWARD-LOOKING INFORMATION
This report and the documents incorporated herein by reference contain “forward-looking statements” within the meaning of the Private Securities Litigation Reform Act of 1995 and may include, but are not limited to, statements about sales levels, restructuring, profitability and anticipated expenses and cash outflows. All forward-looking statements involve risks and uncertainties. All statements contained herein that are not clearly historical in nature are forward-looking, and words such as “believe”, “anticipate”, “expect”, “estimate”, “may”, “will”, “should”, “continue”, “plans”, “intends”, “likely” or other similar words or phrases are generally intended to identify forward-looking statements. Any forward-looking statement contained herein, in press releases, written statements or other documents filed with the SEC, or in our communications with and discussions with investors and analysts in the normal course of business through meetings, phone calls and conference calls are subject to known and unknown risks, uncertainties and contingencies. Many of these risks, uncertainties and contingencies are beyond our control, and may cause actual results, performance or achievements to differ materially from anticipated results, performance or achievements. Factors that might affect such forward-looking statements include, among other things:
| ¡ | general economic and business conditions; |
| ¡ | demand for our goods and services; |
| ¡ | availability of and fluctuations in the prices of key raw materials, including coal tar and timber; |
| ¡ | competitive conditions in the industries in which we operate; |
| ¡ | the ratings on our debt and our ability to repay or refinance our outstanding indebtedness as it matures; |
| ¡ | our ability to operate within the limitations of our debt covenants; |
| ¡ | interest rate fluctuations and other changes in borrowing costs; |
| ¡ | other capital market conditions, including foreign currency rate fluctuations; |
| ¡ | economic and political conditions in international markets, including governmental changes and restrictions on the ability to transfer capital across countries; |
| ¡ | potential impairment of our goodwill and/or long-lived assets; |
| ¡ | parties who are obligated to indemnify us for legal and environmental liabilities fail to perform under their legal obligations; |
| ¡ | changes in laws, including increased tax rates, regulations or accounting standards, third-party relations and approvals, and decisions of courts, regulators and governmental bodies; |
| ¡ | the effects of competition, including locations of competitors and operating and market competition; |
| ¡ | unfavorable resolution of litigation against us; and |
| ¡ | the other factors set forth under “Risk Factors.” |
We caution you that the foregoing list of important factors may not contain all of the material factors that are important to you. In addition, in light of these risks and uncertainties, the matters referred to in the forward looking statements contained in this report and the documents incorporated by reference herein may not in fact occur. We undertake no obligation to publicly update or revise any forward looking statement as a result of new information, future events or otherwise, except as otherwise required by law.
PART I
General
In this report, unless otherwise noted or the context otherwise requires, (i) the term “Koppers”, the “Company”, “we” or “us” refers to Koppers Holdings Inc. and its consolidated subsidiaries, (ii) the term “KH” refers to Koppers Holdings Inc. and not any of its subsidiaries and (iii) the term “KI” refers to Koppers Inc. and not any of its subsidiaries. Koppers Inc. is a wholly-owned subsidiary of Koppers Holdings Inc. Koppers Holdings Inc. has substantially no operations independent of Koppers Inc. and its subsidiaries. The use of these terms is not intended to imply that Koppers Holdings and Koppers Inc. are not separate and distinct legal entities.
3
Table of Contents
We are a leading integrated global provider of carbon compounds and commercial wood treatment products and services. Our products are used in a variety of niche applications in a diverse range of end-markets, including the aluminum, railroad, specialty chemical, utility, rubber, concrete and steel industries. We serve our customers through a comprehensive global manufacturing and distribution network, with manufacturing facilities located in the United States, Australia, China, the United Kingdom and Denmark.
We operate two principal business segments: Carbon Materials & Chemicals and Railroad & Utility Products.
Our operations are, to a substantial extent, vertically integrated. Through our Carbon Materials & Chemicals business, we process coal tar into a variety of products, including carbon pitch, creosote, naphthalene and phthalic anhydride, which are intermediate materials necessary in the production of aluminum, the pressure treatment of wood, the production of high-strength concrete, and the production of plasticizers and specialty chemicals, respectively. Through our Railroad & Utility Products business, we believe that we are the largest supplier of railroad crossties to the North American railroads. Two of our customers, CSX Corporation and Alcoa, Inc., each represent greater than ten percent of our consolidated sales.
Carbon Materials & Chemicals
Carbon pitch, naphthalene, and creosote are produced through the distillation of coal tar, a by-product generated through the processing of coal into coke for use in steel and iron manufacturing. Coal tar distillation involves the conversion of coal tar into a variety of intermediate chemical products in processes beginning with distillation. During the distillation process, heat and vacuum are utilized to separate coal tar into three primary components: carbon pitch (approximately 50 percent), chemical oils (approximately 20 percent) and creosote (approximately 30 percent). The diagram below shows the streams derived from coal tar distillation:
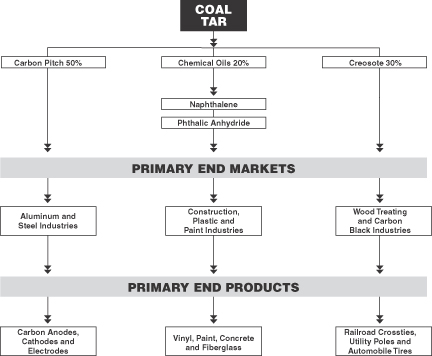
Our Carbon Materials & Chemicals business (“CM&C”) manufactures the following principal products:
| ¡ | carbon pitch, a critical raw material used in the production of aluminum and steel; |
| ¡ | naphthalene, used for the production of phthalic anhydride and as a surfactant in the production of concrete; |
| ¡ | phthalic anhydride, used in the production of plasticizers, polyester resins and alkyd paints; |
4
Table of Contents
Koppers Holdings Inc. 2009 Annual Report
| ¡ | creosote and carbon black feedstock, used in the treatment of wood or as a feedstock in the production of carbon black, respectively; and |
| ¡ | carbon black, used primarily in the manufacture of rubber tires. |
Carbon Pitch
Carbon pitch is a critical raw material used in the production of aluminum and for the production of steel in electric arc furnaces. Approximately one ton of carbon pitch is required for every 10 tons of aluminum produced and there are currently no known viable substitutes for carbon pitch in the aluminum production process. Over 90 percent of our carbon pitch is sold to the aluminum industry, typically under long-term contracts ranging from three to five years. Many of these long-term contracts have provisions for periodic pricing reviews. We have been a leading supplier of carbon pitch to the aluminum industry for over 20 years, and we believe we are the largest producer of carbon pitch for the aluminum industry. Competitive factors in the carbon pitch market include price, quality, service and security of supply. We believe we have a competitive advantage based on our global presence and long-term raw material supply contracts.
Naphthalene & Phthalic Anhydride
Chemical oils are further processed to produce naphthalene which we sell into the industrial sulfonate market for use as dispersants or in the concrete additive and gypsum board markets. Additional end-uses include oil field additives, agricultural emulsifiers, synthetic tanning agents and dyestuffs. In the United States, we also use naphthalene as a feedstock in the manufacture of phthalic anhydride. The primary markets for phthalic anhydride are in the production of plasticizers, unsaturated polyester resins and alkyd resins. We believe our ability to utilize our internally produced naphthalene gives us a more stable supply and generally lower-cost feedstock for the production of phthalic anhydride.
Creosote, Carbon Black & Carbon Black Feedstock
In the United States, creosote is used as a commercial wood treatment chemical to preserve railroad crossties and lumber, utility poles and piling. The majority of our domestically produced creosote is sold to our Railroad & Utility Products business. In Australia, China and Europe, creosote is sold primarily into the carbon black market for use as a feedstock in the production of carbon black. In Australia, the majority of creosote generated at our tar distillation facility is sold to our carbon black facility. In Europe and China creosote is also sold to wood treaters. Globally, approximately one-third of our total creosote production was sold internally in 2009. Our wood treating plants in the United States purchase substantially all of their creosote from our tar distillation plants. We believe we are the only major competitor in these markets that is integrated in this fashion. The remainder of our creosote is sold to railroads and other wood treaters.
Other Products
Other products include the sale of refined tars, benzole and specialty chemicals.
Our CM&C business manufactures its primary products and sells them directly to our global customer base under long-term contracts or through purchase orders negotiated by our regional sales personnel and coordinated through our global marketing group in the United States. We believe we have a strategic advantage over our competitors based on our ability to access coal tar from many global suppliers. Our nine coal tar distillation facilities including joint ventures and six carbon materials terminals give us the ability to offer customers multiple sourcing and a consistent supply of high quality products.
Railroad & Utility Products
Our Railroad & Utility Products business (“R&UP”) sells treated and untreated wood products and services primarily to the railroad and public utility markets in the United States and Australia. We also produce concrete crossties, a complementary product to our wood treatment business, through a joint venture in the United States.
Railroad products include procuring and treating items such as crossties, switch ties and various types of lumber used for railroad bridges and crossings. Utility products include transmission and distribution poles for electric and telephone utilities and piling used in industrial foundations, beach housing, docks and piers. The R&UP business operates 14 wood treating plants, one co-generation facility and 12 pole distribution yards located throughout the United States and Australia. Our network of plants
5
Table of Contents
is strategically located near timber supplies to enable us to access raw materials and service customers effectively. In addition, our crosstie treating plants are typically adjacent to our railroad customers’ track lines, and our pole distribution yards are typically located near our utility customers.
Our R&UP business manufactures its primary products and sells them directly to our customers through long-term contracts and purchase orders negotiated by our regional sales personnel and coordinated through our marketing group at corporate headquarters.
Hardwoods, such as oak and other species, are the major raw materials in wood crossties. Hardwood prices which account for more than 50 percent of a finished crosstie’s cost, fluctuate with the demand from competing hardwood lumber markets, such as oak flooring, pallets and other specialty lumber products. Weather conditions can be a factor in the supply of raw material, as unusually wet or inclement conditions may make it difficult to harvest timber.
In the United States, hardwood lumber is procured by us from hundreds of small sawmills throughout the northeastern, midwestern and southern areas of the country. The crossties are shipped via rail car or trucked directly to one of our crosstie treating plants, all of which are on line with a major railroad. The crossties are either air-stacked for a period of six to twelve months or artificially dried by a process called boultonizing. Once dried, the crossties are pressure treated with creosote, a product of our Carbon Materials & Chemicals business.
We believe we are the largest supplier of railroad crossties in North America. There are several principal regional competitors in this North American market. Competitive factors in the railroad crosstie market include price, quality, service and security of supply. We believe we have a competitive advantage due to our national network of treating plants and direct access to our major customers’ rail lines, which provide for security of supply and logistics advantages for our customers.
Our R&UP business’ largest customer base is the North American Class I railroad market, which buys approximately 80 percent of all crossties produced in the United States and Canada. We also have relationships with many of the approximately 550 short-line and regional rail lines. The railroad crosstie market is a mature market with approximately 21 million replacement crossties (both wood and non-wood) purchased during 2009. We currently supply all seven of the North American Class I railroads and have contracts with six of them.
Demand for railroad crossties may decline during winter months due to inclement weather conditions which make it difficult to install railroad crossties. As a result, operating results may vary from quarter to quarter depending on the severity of weather conditions and other variables affecting our products.
Utility poles are produced mainly from softwoods such as pine in the United States and from hardwoods of the eucalyptus species in Australia. Most of these poles are purchased from large timber owners and individual landowners and shipped to one of our pole-peeling facilities. While crossties are treated exclusively with creosote, we treat poles with a variety of preservatives, including pentachlorophenol, copper chrome arsenates and creosote.
In the United States the market for utility pole products is characterized by a large number of small, highly competitive producers selling into a price-sensitive industry. The utility pole market is highly fragmented domestically, with over 200 investor-owned electric and telephone utilities and 2,900 smaller municipal utilities and rural electric associations. In recent years we have seen our utility pole volumes decrease due to industry deregulation, its impact on maintenance programs, and overcapacity in the pole treating business. We expect demand for utility poles to remain at low levels. In Australia, in addition to utility poles, we market smaller poles to the agricultural, landscape and vineyard markets.
We have a number of principal competitors in the U.S. utility products market. There are few barriers to entry in the utility products market, which consists primarily of regional wood treating companies operating small to medium-size plants and serving local markets.
Equity Investments
KSA Limited Partnership, located in Portsmouth, Ohio, produces concrete crossties, a complementary product to our wood treatment crosstie business. We own 50 percent of KSA, with the other 50 percent owned by subsidiaries of Heidelberg Cement AG. KSA Limited Partnership also provides concrete turnouts for rail traffic switching and used crosstie rehabilitation.
6
Table of Contents
Koppers Holdings Inc. 2009 Annual Report
Tangshan Koppers Kailuan Carbon Chemical Company (“TKK”) is a coal tar distillation facility located in China in the Hebei Province near the Jingtang Port. We hold a 30 percent investment in TKK which commenced production in the second quarter of 2009.
Research and Development
Our research efforts are directed toward new product development regarding alternate uses for coal tar and technical service efforts to promote the use of creosote and vacuum-distilled carbon pitch. Expenditures for research and development were $2.0 million, $2.8 million and $2.8 million, for the years ended December 31, 2009, 2008 and 2007, respectively.
Technology and Licensing
In 1988, we acquired certain assets from Koppers Company, Inc., including the patents, patent applications, trademarks, copyrights, transferable licenses, inventories, trade secrets and proprietary processes used in the businesses acquired. The most important trademark acquired was the name “Koppers.” The association of the name with the chemical, building, wood preservation and coke industries is beneficial to our company, as it represents long-standing, high quality products. As long as we continue to use the name “Koppers” and comply with applicable registration requirements, our right to use the name “Koppers” should continue without expiration. The expiration of other intellectual property rights is not expected to materially affect our business.
Backlog
Generally, Koppers does not manufacture its products against a backlog of orders. Inventory and production levels are typically driven by expectations of future demand based on contractual obligations.
Seasonality
Demand for certain products may decline during winter months due to weather conditions. As a result, operating results may vary from quarter to quarter depending on the severity of weather conditions and other variables affecting our products.
Segment Information
Please see Note 9, “Segment Information,” under Item 8 of this Form 10-K for financial information relating to business segments.
Non-U.S. Operations
Koppers has a significant investment in non-U.S. operations. Therefore, we are subject to certain risks that are inherent to foreign operations, including complying with applicable laws relating to foreign operations, the laws of foreign countries in which we operate, political and economic conditions in international markets and fluctuations in foreign exchange rates.
Environmental Matters
Our operations and properties are subject to extensive federal, state, local and foreign environmental laws and regulations relating to protection of the environment and human health and safety, including those concerning the treatment, storage and disposal of wastes, the investigation and remediation of contaminated soil and groundwater, the discharge of effluents into waterways, the emission of substances into the air, as well as various health and safety matters. Environmental laws and regulations are subject to frequent amendment and have historically become more stringent. We have incurred and could incur in the future significant costs as the result of our failure to comply with, and liabilities under, environmental laws and regulations, including cleanup costs, civil and criminal penalties, injunctive relief and denial or loss of, or imposition of significant restrictions on, environmental permits. In addition, we have been and could in the future be subject to suit by private parties in connection with alleged violations of, or liabilities under, environmental laws and regulations.
We accrue for environmental liabilities when a determination can be made that they are probable and reasonably estimable. Total environmental reserves at December 31, 2009 and 2008 were $10.7 million and $9.4 million, respectively, which include
7
Table of Contents
provisions primarily for environmental fines and remediation. For the last three years, our annual capital expenditures in connection with environmental control facilities averaged approximately $6.7 million and annual operating expenses for environmental matters, excluding depreciation, averaged approximately $12.5 million. Management estimates that capital expenditures in connection with matters relating to environmental control facilities will be approximately $11.5 million for 2010. We believe that we will have continuing significant expenditures associated with compliance with environmental laws and regulations and, to the extent not covered by insurance or available recoveries under third-party indemnification arrangements, for present and future remediation efforts at plant sites and third-party waste sites and other liabilities associated with environmental matters. There can be no assurance that these expenditures will not exceed current estimates and will not have a material adverse effect on our business, financial condition, cash flow and results of operations. See Note 19 of the Notes to Consolidated Financial Statements, “Commitments and Contingent Liabilities.”
Employees and Employee Relations
As of December 31, 2009, we had 552 salaried employees and 1,064 non-salaried employees. Listed below is a breakdown of employees by our businesses, including administration.
| Business | Salaried | Non-Salaried | Total | |||
| Carbon Materials & Chemicals |
265 | 429 | 694 | |||
| Railroad & Utility Products |
213 | 631 | 844 | |||
| Administration |
74 | 4 | 78 | |||
| Total Employees |
552 | 1,064 | 1,616 | |||
Of our employees, approximately 65 percent are represented by approximately 15 different labor unions and are covered under numerous labor agreements. The United Steelworkers of America currently represent more than 300 of our employees at six of our facilities and, therefore, represent the largest number of our unionized employees. The seven labor agreements that expire in 2010 cover approximately 25 percent of our total labor force.
Internet Access
Our Internet address is www.koppers.com. Our recent filings on Form 10-K, 10-Q and 8-K and any amendments to those documents can be accessed without charge on our website under Investor Relations – SEC Filings. The contents of our internet site are not incorporated by reference into this document.
You should carefully consider the risks described below before investing in our publicly traded securities. Our business is subject to the risks that affect many other companies, such as competition, technological obsolescence, labor relations, general economic conditions, geopolitical events and international operations.
Risks Related to Our Business
Conditions in the global economy and global capital markets may adversely affect our results of operations, financial condition and cash flows.
Starting in 2008 and continuing in 2009, the U.S and global economy have undergone a sudden, sharp economic downturn. Global credit and capital markets have experienced unprecedented volatility and disruption, and business credit and liquidity have tightened in much of the world. Consumer confidence and spending are down significantly and the rates of unemployment and underemployment are increasing. As a result of current economic conditions, including turmoil and uncertainty in the capital markets, credit markets have tightened significantly such that the ability to obtain new capital has become more challenging and more expensive. Several large financial institutions have either failed or been dependent on the assistance of the U.S. federal government to continue to operate as a going concern. It is difficult to determine the breadth and duration of the economic and financial market problems and the many ways in which they may affect our suppliers, customers and business in general. Nonetheless, continuation or further worsening of these difficult financial and macroeconomic conditions could have a significant adverse effect on our sales, profitability and results of operations. Our business and
8
Table of Contents
Koppers Holdings Inc. 2009 Annual Report
operating results for 2008 and 2009 were affected by these global economic issues. Many of our customers have experienced (and will likely continue to experience) deterioration of their business. They may experience cash flow shortages and may have difficulty obtaining financing. As a result, our customers may delay or cancel plans to purchase our products and may not be able to fulfill their payment obligations to us in a timely fashion. Our suppliers may be experiencing similar conditions which could impact their ability to supply us with raw materials and otherwise fulfill their obligations to us. If the global economic recession continues for an extended period or deteriorates significantly, there could be a material adverse effect to our results of operations, financial condition and cash flows.
In addition, we rely on our $300.0 million revolving credit agreement with a consortium of banks to provide us with liquidity to meet our working capital needs. At December 31, 2009, we had $164.7 million of available borrowing capacity under this arrangement. Our ability to fund our liquidity needs and working capital requirements could be impacted in the event that disruptions in the credit markets result in the banks being unable to lend to us under our revolving credit agreement.
Global economic issues could prevent us from accurately forecasting demand for our products which could have a material effect on our results of operations and our financial condition.
Adverse global economic issues, market instability and volatile commodity price fluctuations make it increasingly difficult for us, our customers and our suppliers to accurately forecast future product demands, which could cause us to procure raw materials in excess of end-product demand. This could cause a material increase to our inventory carrying costs and result in significant inventory lower of cost or market charges.
We may be required to recognize impairment charges for our long-lived assets.
At December 31, 2009, the net carrying value of long-lived assets (property, plant and equipment, goodwill and other intangible assets) totaled approximately $237 million. In accordance with generally accepted accounting principles, we periodically assess these assets to determine if they are impaired. Significant negative industry or economic trends, disruptions to our business, unexpected significant changes or planned changes in use of the assets, divestitures and market capitalization declines may result in impairments to goodwill and other long-lived assets. Future impairment charges could significantly affect our results of operations in the periods recognized. Impairment charges would also reduce our stockholder’s equity and could affect compliance with the covenants in our debt agreements.
We may not be able to compete successfully in any or all of the industry segments in which we operate.
The markets in which we operate are highly competitive, and this competition could harm our business, results of operations, cash flow and financial condition. If we are unable to respond successfully to changing competitive conditions, the demand for our products could be affected. We believe that the most significant competitive factor for our products is selling price. Some of our competitors have greater financial resources and larger capitalization than we do.
Demand for our products is cyclical and we may experience prolonged depressed market conditions for our products.
Our products are sold primarily in markets which historically have been cyclical, such as the aluminum, specialty chemical and utility industries.
| ¡ | The principal consumers of our carbon pitch are primary aluminum smelters. Although the aluminum industry has experienced growth on a long-term basis, there may be cyclical periods of weak demand which could result in decreased primary aluminum production. Our pitch sales have historically declined during such cyclical periods of weak global demand for aluminum. |
| ¡ | The principal use of our phthalic anhydride is in the manufacture of plasticizers and flexible vinyl, which are used mainly in the housing and automobile industries. Therefore, a decline in remodeling and construction or global automobile production could reduce the demand for phthalic anhydride. |
| ¡ | In addition to deregulation in the utility industry, utility pole demand has declined most recently due to the general downturn in the economy and its impact on utility companies’ operating and capital budgets. |
We have experienced significant volatility linked to global economic issues in the past year that we more fully discuss in this report under Management’s Discussion and Analysis of Financial Condition and Results of Operations.
9
Table of Contents
We are dependent on major customers for a significant portion of our net sales, and the loss of one or more of our major customers could result in a significant reduction in our profitability.
For the year ended December 31, 2009, our top ten customers accounted for approximately 55 percent of our net sales. During this period, our two largest customers each accounted for approximately 11 percent of our total net sales.
One of our largest customers has significantly reduced its purchases of carbon pitch starting in the fourth quarter of 2008 due to, we believe, global economic issues. In addition, this customer disclosed in July 2009 that it is actively evaluating competitive alternatives to increase the availability of coal tar pitch and to reduce the cost of coal tar pitch. The customer has disclosed that these alternatives include expanding the range of product specifications, expanding its global supply base for imported coal tar pitch and backward integration. The permanent loss of, or a significant decrease in the level of purchases by, one or more of our major customers could result in a significant reduction in our profitability if we are unable to sell these volumes to alternate customers at similar prices.
Fluctuations in the price, quality and availability of our primary raw materials could reduce our profitability.
Our operations depend on an adequate supply of quality raw materials being available on a timely basis. The loss of a key source of supply or a delay in shipments could cause a significant increase in our operating expenses. For example, our operations are highly dependent on a relatively small number of freight transportation services. We are also dependent on utilizing specialized ocean-going transport vessels that we lease to deliver raw materials to our facilities and finished goods to our customers. Interruptions in such freight services could impair our ability to receive raw materials and ship finished products in a timely manner. We are also exposed to price and quality risks associated with raw material purchases. Such risks include the following:
| ¡ | The primary raw material used by our Carbon Materials & Chemicals business is coal tar, a by-product of furnace coke production. A shortage in the supply of domestic coal tar or a reduction in the quality of coal tar could require us to increase coal tar and carbon pitch imports, as well as the use of petroleum substitutes to meet future carbon pitch demand. This could cause a significant increase in our operating expenses if we are unable to pass these costs on to our customers. |
| ¡ | In certain circumstances coal tar may also be used as an alternative to fuel. In the past, increases in energy prices have resulted in higher coal tar costs which we have attempted to pass through to our customers. If these increased costs cannot be passed through to our customers, it could result in margin reductions for our coal tar-based products. |
| ¡ | The availability and cost of softwood and hardwood lumber are critical elements in our production of pole products and railroad crossties, respectively. Historically, the supply and cost of hardwood for railroad crossties have been subject to availability and price pressures. We may not be able to obtain wood raw materials at economical prices in the future. |
| ¡ | Our price realizations and profit margins for phthalic anhydride have historically fluctuated with the price of orthoxylene and its relationship to our cost to produce naphthalene; however, during periods of excess supplies of phthalic anhydride, margins may be reduced despite high levels for orthoxylene prices. |
If the costs of raw materials increase significantly and we are unable to offset the increased costs with higher selling prices, our profitability will decline.
Our products may be rendered obsolete or less attractive by changes in regulatory, legislative or industry requirements.
Changes in regulatory, legislative or industry requirements may render certain of our products obsolete or less attractive. Our ability to anticipate changes in these requirements, especially changes in regulatory standards, will be a significant factor in our ability to remain competitive. We may not be able to comply in the future with new regulatory, legislative and/or industrial standards that may be necessary for us to remain competitive and certain of our products may, as a result, become obsolete or less attractive to our customers.
The development of new technologies or changes in our customers’ products could reduce the demand for our products.
Our products are used for a variety of applications by our customers. Changes in our customers’ products or processes may enable our customers to reduce consumption of the products we produce or make our products unnecessary. Customers may
10
Table of Contents
Koppers Holdings Inc. 2009 Annual Report
also find alternative materials or processes that no longer require our products. For example, in 2000 our largest carbon pitch customer announced that it was actively pursuing alternative anode technology that would eliminate the need for carbon pitch as an anode binder. The potential development and implementation of this new technology could seriously impair our ability to profitably market carbon pitch and related co-products. A substantial portion of our carbon pitch is sold to the aluminum industry under long-term contracts typically ranging from three to five years. If a new technology were developed that replaced the need for carbon pitch in the production of carbon anodes, it is possible that these contracts would not be renewed in the future.
Hazards associated with chemical manufacturing may cause suspensions or interruptions of our operations.
Due to the nature of our business, we are exposed to the hazards associated with chemical manufacturing and the related use, storage and transportation of raw materials, products and wastes in our manufacturing facilities and our distribution centers, such as fires, explosions and accidents that could lead to a suspension or interruption of operations. Any disruption could reduce the productivity and profitability of a particular manufacturing facility or of our company as a whole. Other hazards include the following:
| ¡ | piping and storage tank leaks and ruptures; |
| ¡ | mechanical failure; |
| ¡ | exposure to hazardous substances; and |
| ¡ | chemical spills and other discharges or releases of toxic or hazardous wastes, substances or gases. |
These hazards, among others, may cause personal injury and loss of life, damage to property and contamination of the environment, which could lead to government fines or work stoppage injunctions, cleanup costs and lawsuits by injured persons. While we are unable to predict the outcome of such matters, if determined adversely to us, we may not have adequate insurance to cover related costs or liabilities and, if not, we may not have sufficient cash flow to pay for such costs or liabilities. Such outcomes could harm our customer goodwill and reduce our profitability.
We are subject to extensive environmental laws and regulations and may incur significant costs as a result of continued compliance with, violations of or liabilities under environmental laws and regulations.
Like other companies involved in environmentally sensitive businesses, our operations and properties are subject to extensive federal, state, local and foreign environmental laws and regulations, including those concerning the following, among other things:
| ¡ | the treatment, storage and disposal of wastes; |
| ¡ | the investigation and remediation of contaminated soil and groundwater; |
| ¡ | the discharge of effluents into waterways; |
| ¡ | the emission of substances into the air; |
| ¡ | the marketing, sale, use and registration of our chemical products, such as creosote; |
| ¡ | the European Union’s regulation under the Registration Evaluation Authorization and Restriction of Chemicals, which requires manufacturers or importers of substances manufactured or imported into the EU in quantities of one tonne per year or more to register with a central European Chemicals Agency; and |
| ¡ | other matters relating to environmental protection and various health and safety matters. |
We have incurred, and expect to continue to incur, significant costs to comply with environmental laws and regulations and as a result of remedial obligations. We could incur significant costs, including cleanup costs, fines, civil and criminal sanctions and claims by third parties for property damage and personal injury, as a result of violations of or liabilities under environmental laws and regulations. We accrue for environmental liabilities when a determination can be made that they are probable and reasonably estimable. Total environmental reserves at December 31, 2009 and December 31, 2008 were $10.7 million and $9.4 million, respectively, which include provisions primarily for environmental fines and remediation. For the last three fiscal years, our annual capital expenditures in connection with environmental control facilities averaged approximately $6.7 million, and annual operating expenses for environmental matters, excluding depreciation, averaged approximately $12.5 million. Contamination has been identified and is being investigated and remediated at many of our sites by us or other parties.
11
Table of Contents
Actual costs and liabilities to us may exceed forecasted amounts. Moreover, currently unknown environmental issues, such as the discovery of additional contamination or the imposition of additional sampling or cleanup obligations with respect to our sites or third party sites, may result in significant additional costs, and potentially significant expenditures could be required in order to comply with future changes to environmental laws and regulations or the interpretation or enforcement thereof. We also are involved in various litigation and proceedings relating to environmental matters and toxic tort claims.
Future climate change regulation could result in increased operating costs and reduced demand for our products.
Although the United States has not ratified the Kyoto Protocol, a number of federal laws and regulations related to “greenhouse gas,” or “GHG,” emissions are being considered by the U.S. Environmental Protection Agency, or “EPA,” and in Congress. Various state and regional laws, regulations and initiatives have been enacted or are being considered. For example, on September 30, 2009, the EPA released a proposed rule that would impose requirements upon new and modified major stationary sources emitting more than 25,000 tons of GHG emissions per year. On June 26, 2009, the U.S. House of Representatives approved adoption of the “American Clean Energy and Security Act of 2009,” also known as the “Waxman-Markey cap-and-trade legislation” or ACESA. The purpose of ACESA is to control and reduce emissions of GHGs in the United States. GHGs are certain gases, including carbon dioxide and methane, which may be contributing to warming of the Earth’s atmosphere and other climatic changes. ACESA would establish an economy-wide cap on emissions of GHGs in the United States and would require an overall reduction in GHG emissions of 17 percent (from 2005 levels) by 2020, and by over 80 percent by 2050. Under ACESA, most sources of GHG emissions would be required to obtain GHG emission “allowances” corresponding to their annual emissions of GHGs. The number of emission allowances issued each year would decline as necessary to meet ACESA’s S-31 overall emission reduction goals. As the number of GHG emission allowances declines each year, the cost or value of allowances is expected to escalate significantly. The net effect of ACESA would be to impose increasing costs on the combustion of carbon-based fuels such as coal, oil, refined petroleum products and natural gas.
The U.S. Senate has begun work on its own legislation for controlling and reducing emissions of GHGs in the United States. If the Senate adopts GHG legislation that is different from ACESA, the Senate legislation would need to be reconciled with ACESA and both chambers would be required to approve identical legislation before it could become law. President Obama has indicated that he is in support of the adoption of legislation to control and reduce emissions of GHGs through an emission allowance permitting system that results in fewer allowances being issued each year but that allows parties to buy, sell and trade allowances as needed to fulfill their GHG emission obligations. It is not possible at this time to predict whether or when the Senate may act on climate change legislation or how any bill approved by the Senate would be reconciled with ACESA.
In addition, our operations in the United Kingdom and Denmark are subject to binding caps on GHG emissions imposed by Member States of the European Union as a result of the European Commission’s directive implementing the Kyoto Protocol. Under this directive, companies receive from the relevant Member States set limitations on the levels of GHG emissions from their industrial facilities. These allowances are tradable so as to enable companies that manage to reduce their GHG emissions to sell their excess allowances to companies that are not reaching their emissions objectives. Failure to meet the emissions caps is subject to significant monetary penalties. For the years 2008 through 2012, the European Commission significantly reduced the overall availability of allowances.
In 2008, Australia issued guidance outlining the components and rationale for its proposed carbon pollution reduction scheme, as well as associated timing. The plan calls for a cap and trade model with a medium-term target range of between five percent to 15 percent reduction in GHG by 2020. The reduction scheme aims to provide some assistance to emissions-intensive, trade-exposed companies based on the amount and intensity of its direct and indirect GHG emissions. Compliance under Australia’s reduction scheme was expected to begin in 2010, but legislation seeking to implement a reduction scheme was rejected by the Australian Senate in August 2009.
Any laws or regulations that may be adopted to restrict or reduce emissions of GHGs could cause an increase to our raw material costs, could require us to incur increased operating costs and could have an adverse effect on demand for our products.
Beazer East and Beazer Limited may not continue to meet their obligations to indemnify us.
Under the terms of the asset purchase agreement between us and Koppers Company, Inc. (now known as Beazer East, Inc.) upon the formation of KI in 1988, subject to certain limitations, Beazer East and Beazer Limited assumed the liability for and indemnified us against among other things certain clean-up liabilities for contamination occurring prior to the purchase date at
12
Table of Contents
Koppers Holdings Inc. 2009 Annual Report
sites acquired from Beazer East and certain third-party claims arising from such contamination (the “Indemnity”). Beazer East and Beazer Limited (which are indirect subsidiaries of Heidelberg Cement AG) may not continue to meet their obligations. In addition, Beazer East could in the future choose to challenge its obligations under the Indemnity or our satisfaction of the conditions to indemnification imposed on us thereunder. The government and other third parties may have the right under applicable environmental laws to seek relief directly from us for any and all such costs and liabilities. In July 2004, we entered into an agreement with Beazer East to amend the December 29, 1988 asset purchase agreement to provide, among other things, for the continued tender of pre-closing environmental liabilities to Beazer East under the Indemnity through July 2019. As consideration for the agreement, we, among other things, paid Beazer East $7.0 million and agreed to share toxic tort litigation defense costs arising from sites acquired from Beazer East. Qualified expenditures under the Indemnity are not subject to a monetary limit.
The Indemnity provides for the resolution of issues between KI and Beazer East by an arbitrator on an expedited basis upon the request of either party. The arbitrator could be asked, among other things, to make a determination regarding the allocation of environmental responsibilities between KI and Beazer East. Arbitration decisions under the Indemnity are final and binding on the parties. Periodically, issues have arisen between KI and Beazer East and/or other indemnitors that have been resolved without arbitration. From time to time, KI and Beazer East have engaged in discussions that involve, among other things, the allocation of environmental costs related to certain operating and closed facilities.
Without reimbursement under the Indemnity, the obligation to pay the costs and assume the liabilities relating to these matters would have a significant impact on our net income. Furthermore, without reimbursement, we could be required to record a contingent liability on our balance sheet with respect to environmental matters covered by the Indemnity, which could result in our having significant negative net worth. Finally, the Indemnity does not afford us indemnification against environmental costs and liabilities attributable to acts or omissions occurring after the closing of the acquisition of assets from Beazer East under the asset purchase agreement, nor is the Indemnity applicable to liabilities arising in connection with other acquisitions by us after that closing.
The insurance that we maintain may not fully cover all potential exposures.
We maintain property, casualty, general liability and workers’ compensation insurance, but such insurance may not cover all risks associated with the hazards of our business and is subject to limitations, including deductibles and maximum liabilities covered. We may incur losses beyond the limits, or outside the coverage, of our insurance policies, including liabilities for environmental compliance and remediation. In addition, from time to time, various types of insurance for companies in our industry have not been available on commercially acceptable terms or, in some cases, have not been available at all. In the future, we may not be able to obtain coverage at current levels, and our premiums may increase significantly on coverage that we maintain.
Adverse weather conditions may reduce our operating results.
Our quarterly operating results fluctuate due to a variety of factors that are outside our control, including inclement weather conditions, which in the past have caused a decline in our operating results. For example, adverse weather conditions have at times negatively impacted our supply chain as wet conditions impacted logging operations, reducing our ability to procure crossties. In addition, adverse weather conditions have had a negative impact on our customers in the pavement sealer businesses, resulting in a negative impact on our sales of these products. Moreover, demand for many of our products declines during periods of inclement weather.
We are subject to risks inherent in foreign operations, including additional legal regulation, changes in social, political and economic conditions.
We have operations in the United States, Australia, China, the United Kingdom and Denmark, and sell our products in many foreign countries. For the year ended December 31, 2009, net sales from products sold by our foreign subsidiaries accounted for approximately 35 percent of our total net sales.
Doing business on a global basis requires us to comply with the laws and regulations of the U.S. government and various international jurisdictions. These regulations place restrictions on our operations, trade practices and partners and investment decisions. In particular, our international operations are subject to U.S. and foreign anti-corruption laws and regulations, such as
13
Table of Contents
the Foreign Corrupt Practices Act, and economic sanction programs administered by the U.S. Treasury Department’s Office of Foreign Assets Control. Violations of these laws and regulations may result in civil or criminal penalties, including fines.
In addition, as a global business, we are also exposed to market risks relating to fluctuations in interest rates and foreign currency exchange rates. Our international revenues could be reduced by currency fluctuations or devaluations. Changes in currency exchange rates could lower our reported revenues and could require us to reduce our prices to remain competitive in foreign markets, which could also reduce our profitability. We have not historically hedged our financial statement exposure and, as a result, we could incur unanticipated losses. We are also subject to potentially increasing transportation and shipping costs associated with international operations. Furthermore, we are also exposed to risks associated with changes in the laws and policies governing foreign investments in countries where we have operations as well as, to a lesser extent, changes in U.S. laws and regulations relating to foreign trade and investment.
Our strategy to selectively pursue complementary acquisitions may present unforeseen integration obstacles or costs.
Our business strategy includes the potential acquisition of businesses and entering into joint ventures and other business combinations that we expect would complement and expand our existing products and the markets where we sell our products. We may not be able to successfully identify suitable acquisition or joint venture opportunities or complete any particular acquisition, combination, joint venture or other transaction on acceptable terms. We cannot predict the timing and success of our efforts to acquire any particular business and integrate the acquired business into our existing operations. Also, efforts to acquire other businesses or the implementation of other elements of this business strategy may divert managerial resources away from our business operations. In addition, our ability to engage in strategic acquisitions may depend on our ability to raise substantial capital and we may not be able to raise the funds necessary to implement our acquisition strategy on terms satisfactory to us, if at all. Our failure to identify suitable acquisition or joint venture opportunities may restrict our ability to grow our business. In addition, we may not be able to successfully integrate businesses that we acquire in the future, which could lead to increased operating costs, a failure to realize anticipated operating synergies, or both.
Litigation against us could be costly and time-consuming to defend, and due to the nature of our business and products, we may be liable for damages arising out of our acts or omissions, which may have a material adverse affect on us.
We produce chemicals that require appropriate procedures and care to be used in handling them or using them to manufacture other products. As a result of the nature of some of the products we use and produce, we may face product liability, toxic tort and other claims relating to incidents involving the handling, storage and use of and exposure to our products.
For example, we are a defendant in a significant number of lawsuits in which the plaintiffs claim they have suffered a variety of illnesses (including cancer) and/or property damage as a result of exposure to coal tar pitch, benzene, wood treatment chemicals and other chemicals, including certain cases in state and federal court relating to our Grenada, Mississippi and Somerville, Texas facilities. A further description of the material claims against us is included in Note 19 of the consolidated financial statements.
We are indemnified for certain product liability exposures under the Indemnity with Beazer East related to products sold prior to the closing of the acquisition of assets from Beazer East. Beazer East and Beazer Limited may not continue to meet their obligations under the Indemnity. In addition, Beazer East could choose to challenge its obligations under the Indemnity or our satisfaction of the conditions to indemnification imposed on us thereunder.
If for any reason (including disputed coverage or financial incapability) one or more of such parties fail to perform their obligations and we are held liable for or otherwise required to pay all or part of such liabilities without reimbursement, the imposition of such liabilities on us could have a material adverse effect on our business, financial condition, cash flows and results of operations. Furthermore, we could be required to record a contingent liability on our balance sheet with respect to such matters, which could result in us having significant negative net worth.
In addition to the above, we are regularly subject to legal proceedings and claims that arise in the ordinary course of business, such as workers’ compensation claims, governmental investigations, employment disputes, and customer and supplier disputes arising out of the conduct of our business. Litigation could result in substantial costs and may divert management’s attention and resources away from the day-to-day operation of our business.
14
Table of Contents
Koppers Holdings Inc. 2009 Annual Report
Labor disputes could disrupt our operations and divert the attention of our management and may cause a decline in our production and a reduction in our profitability.
Of our employees, approximately 65 percent are represented by approximately 15 different labor unions and are covered under numerous labor agreements. The United Steelworkers of America currently represent more than 300 of our employees at six of our facilities and, therefore, represent the largest number of our unionized employees. In 2010 we will have seven labor agreements expire (including the agreement extended in 2009); these agreements cover approximately 25 percent of our total labor force. We may not be able to reach new agreements without union action or on terms satisfactory to us. Any future labor disputes with any such unions could result in strikes or other labor protests, which could disrupt our operations and divert the attention of our management from operating our business. If we were to experience a strike or work stoppage, it may be difficult for us to find a sufficient number of employees with the necessary skills to replace these employees. Any such labor disputes could cause a decline in our production and a reduction in our profitability.
Our post-retirement obligations are currently underfunded. We expect to make significant cash payments to our pension and other post-retirement plans, which will reduce the cash available for our business.
As of December 31, 2009, our benefit obligation under our defined benefit pension plans exceeded the fair value of plan assets by approximately $69 million. Our pension asset funding to total pension obligation ratio was 66 percent as of December 31, 2009. The underfunding was caused, in large part, by fluctuations in the financial markets that have caused the value of the assets in our defined benefit pension plans to be significantly lower than anticipated. In addition, our obligations for other post-retirement benefit obligations are unfunded and total approximately $14 million at December 31, 2009.
During the years ended December 31, 2009 and December 31, 2008, we contributed $3.4 million and $3.3 million, respectively, to our post-retirement benefit plans. With respect to our U.S. defined benefit pension plan which is our largest plan, we had funding obligations of $0.1 million in 2009. However, we estimate that mandatory funding for this plan will be approximately $4 million in 2010, $12 million in 2011 and $10 million in 2012 unless legislative relief is granted.
Management expects that any future obligations under our post-retirement benefit plans that are not currently funded will be funded from our future cash flow from operations. If our contributions to our post-retirement benefit plans are insufficient to fund the post-retirement benefit plans adequately to cover our future obligations, the performance of the assets in our pension plans does not meet our expectations or other actuarial assumptions or mandatory funding laws are modified, our contributions to our post-retirement benefit plans could be materially higher than we expect, thus reducing the cash available for our business.
We may incur significant charges in the event we close all or part of a manufacturing plant or facility.
We periodically assess our manufacturing operations in order to manufacture and distribute our products in the most efficient manner. Based on our assessments, we may make capital improvements to modernize certain units, move manufacturing or distribution capabilities from one plant or facility to another plant or facility, discontinue manufacturing or distributing certain products or close all or part of a manufacturing plant or facility.
We depend on our senior management team and the loss of any member could adversely affect our operations.
Our success is dependent on the management, experience and leadership skills of our senior management team. Our senior management team has an average of over 20 years of industry experience. The loss of any of these individuals or an inability to attract, retain and maintain additional personnel with similar industry experience could prevent us from implementing our business strategy. We cannot assure you that we will be able to retain our existing senior management personnel or to attract additional qualified personnel when needed.
Risks Relating to Our Common Stock
Our stock price may be extremely volatile.
There has been significant volatility in the market price and trading volume of equity securities, which is unrelated to the financial performance of the companies issuing the securities. These broad market fluctuations may negatively affect the market price of our common stock.
15
Table of Contents
Some specific factors that may have a significant effect on our common stock market price include the following:
| ¡ | actual or anticipated fluctuations in our operating results or future prospects; |
| ¡ | the public’s reaction to our press releases, our other public announcements and our filings with the Securities and Exchange Commission, or the SEC; |
| ¡ | strategic actions by us or our competitors, such as acquisitions or restructurings; |
| ¡ | new laws or regulations or new interpretations of existing laws or regulations applicable to our business; |
| ¡ | changes in accounting standards, policies, guidance, interpretations or principles; |
| ¡ | adverse conditions in the financial markets or general economic conditions, including those resulting from war, incidents of terrorism and responses to such events; |
| ¡ | sales of common stock by us, members of our management team or a significant shareholder; and |
| ¡ | changes in stock market analyst recommendations or earnings estimates regarding our common stock, other comparable companies or the aluminum or railroad industry generally. |
Prior to the initial public offering which closed in February 2006, there was no public market for our common stock. We cannot predict the extent to which investor interest in our company will continue to support an active trading market on the New York Stock Exchange (the “NYSE”) or otherwise or how liquid that market will continue to be. If there does not continue to be an active trading market for our common stock, you may have difficulty selling any of our common stock that you buy.
Future sales, or the perception of future sales, of a substantial amount of our common stock may depress the price of the shares of our common stock.
Future sales, or the perception or the availability for sale in the public market, of substantial amounts of our common stock could adversely affect the prevailing market price of our common stock and could impair our ability to raise capital through future sales of equity securities at a time and price that we deem appropriate.
We may issue shares of our common stock, or other securities, from time to time as consideration for future acquisitions and investments. We may also issue shares of our common stock, or other securities, in connection with employee stock compensation programs and board of directors’ compensation. In addition, we may issue shares of our common stock or other securities in public or private offerings as part of our efforts to raise additional capital. In the event any such acquisition, investment, issuance under stock compensation programs or offering is significant, the number of shares of our common stock or the number or aggregate principal amount, as the case may be, of other securities that we may issue may in turn be significant. We may also grant registration rights covering those shares or other securities in connection with any such acquisitions and investments. Any additional capital raised through the sale of our equity securities may dilute your percentage ownership in us.
You may not receive dividends because our board of directors could, in its discretion, depart from or change our dividend policy at any time, because of restrictions in our debt agreements or because of restrictions imposed by Pennsylvania law.
We are not required to pay dividends, and our shareholders are not guaranteed, and do not have contractual rights, to receive dividends. Our board of directors may decide at any time, in its discretion, to decrease the amount of dividends, otherwise change or revoke the dividend policy or discontinue entirely the payment of dividends. Our board of directors could depart from or change our dividend policy, for example, if it were to determine that we had insufficient cash to take advantage of other opportunities with attractive rates of return or if we failed to reach a sufficient level of profitability. In addition, if we do not pay dividends, for whatever reason, your shares of our common stock could become less liquid and the market price of our common stock could decline.
The ability of Koppers Inc. and its subsidiaries to pay dividends or make other payments or distributions to us will depend on our operating results and may be restricted by, among other things, the covenants in Koppers Inc.’s revolving credit facility. Our ability to pay dividends is also limited by the indentures governing Koppers Inc.’s outstanding notes as well as Pennsylvania law and may in the future be limited by the covenants of any future outstanding indebtedness we or our subsidiaries incur. If a dividend is paid in violation of Pennsylvania law, each director approving the dividend could be liable to the corporation if the
16
Table of Contents
Koppers Holdings Inc. 2009 Annual Report
director did not act with such care as a person of ordinary prudence would use under similar circumstances. Directors are entitled to rely in good faith on information provided by employees of the corporation and experts retained by the corporation. Directors who are held liable would be entitled to contribution from any shareholders who received an unlawful dividend knowing it to be unlawful. Furthermore, we are a holding company with no operations, and unless we receive dividends, distributions, advances, transfers of funds or other payments from our subsidiaries, we will be unable to pay dividends on our common stock.
Provisions of our charter documents may inhibit a takeover, which could negatively affect our stock price.
Provisions of our charter documents and the Business Corporation Law of Pennsylvania, the state in which we are organized, could discourage potential acquisition proposals or make it more difficult for a third party to acquire control of our company, even if doing so might be beneficial to our shareholders. Our Articles of Incorporation and Bylaws provide for various procedural and other requirements that could make it more difficult for shareholders to effect certain corporate actions. For example, our Amended and Restated Articles of Incorporation, or our Articles of Incorporation, authorizes our board of directors to determine the rights, preferences, privileges and restrictions of unissued series of preferred stock without any vote or action by our shareholders. Our board of directors can therefore authorize and issue shares of preferred stock with voting or conversion rights that could adversely affect the voting or other rights of holders of our common stock. The following additional provisions could make it more difficult for shareholders to effect certain corporate actions:
| ¡ | Our board of directors is classified into three classes. Each director will serve a three-year term and will stand for re-election once every three years. |
| ¡ | Our shareholders will be able to remove directors only for cause by the affirmative vote of the holders of a majority of the outstanding shares of our capital stock entitled to vote in the election of directors. Vacancies on our board of directors may be filled only by our board of directors. |
| ¡ | Under Pennsylvania law, cumulative voting rights are available to the holders of our common stock if our Articles of Incorporation have not negated cumulative voting. Our Articles of Incorporation provide that our shareholders do not have the right to cumulative votes in the election of directors. |
| ¡ | Our Articles of Incorporation do not permit shareholder action without a meeting by consent except for the unanimous consent of all holders of our common stock. It also provides that special meetings of our shareholders may be called only by the board of directors or the chairman of the board of directors. |
| ¡ | Our Bylaws provide that shareholders seeking to nominate candidates for election as directors or to bring business before an annual meeting of shareholders must provide timely notice of their proposal in writing to the corporate secretary. |
These provisions may discourage acquisition proposals and may make it more difficult or expensive for a third party to acquire a majority of our outstanding voting stock or may delay, prevent or deter a merger, acquisition, tender offer or proxy contest, which may negatively affect our stock price.
Risks Relating to the Koppers Inc. 7 7/8% Senior Notes Due 2019 (the “Senior Notes”) and Other Indebtedness
Our level of indebtedness could limit cash flow available for our operations and could adversely affect our ability to service our debt or obtain additional financing, if necessary.
We have and will continue to have a significant amount of indebtedness. Our level of indebtedness could restrict our operations and make it more difficult for us to satisfy our obligations under the Senior Notes. Among other things, our substantial indebtedness could:
| ¡ | limit our ability to obtain additional financing for working capital, capital expenditures, acquisitions and general corporate purposes; |
| ¡ | make it more difficult for us to satisfy our financial obligations, including those with respect to the Senior Notes; |
| ¡ | increase our vulnerability to general adverse economic and industry conditions; |
| ¡ | require us to dedicate a substantial portion of our cash flow from operations to payments on our indebtedness, thereby reducing the availability of our cash flow to fund working capital, capital expenditures, research and development efforts and other general corporate purposes; |
17
Table of Contents
| ¡ | limit our flexibility in planning for, or reacting to, changes in our business and the markets in which we compete; and |
| ¡ | place us at a competitive disadvantage compared to our competitors that have less debt. |
In addition, the indentures governing the Senior Notes and Koppers Inc.’s revolving credit facility contain financial and other restrictive covenants that will limit our ability to engage in activities that may be in our long-term best interests. Our failure to comply with those covenants could result in an event of default which, if not cured or waived, could result in the acceleration of the repayment of all of our debts.
Despite current indebtedness levels, we may still be able to incur substantially more debt. This could further exacerbate the risks associated with our substantial leverage.
We may be able to incur substantial additional indebtedness in the future. The terms of the Senior Notes indenture and Koppers Inc.’s revolving credit facility do not fully prohibit us from doing so. Koppers Inc.’s $300.0 million revolving credit facility permits additional borrowing and all of those borrowings would rank senior to the Senior Notes and the guarantees to the extent of the collateral securing such facility. In addition, the indenture relating to the Senior Notes will permit us to incur all of those borrowings under Koppers Inc.’s revolving credit facility and substantial additional indebtedness, including additional secured indebtedness. If new debt is added to our and our subsidiaries’ current debt levels, the related risks that we and they now face could intensify.
To service our indebtedness, we will require a significant amount of cash. Our ability to generate cash depends on many factors beyond our control.
Our ability to make payments on and to refinance our indebtedness, including the Senior Notes, and to fund planned capital expenditures and research and development efforts will depend on our ability to generate cash in the future. Although there can be no assurances, we believe that the cash provided by our operations will be sufficient to provide for our cash requirements for the foreseeable future. However, our ability to satisfy our obligations will depend on our future operating performance and financial results, which will be subject, in part, to factors beyond our control, including interest rates and general economic, financial and business conditions. We cannot assure you, however, that our business will generate sufficient cash flow from operations or that future borrowings will be available to us in an amount sufficient to enable us to pay our indebtedness, including the Senior Notes, or to fund our other liquidity needs. If we are unable to generate sufficient cash flow to service our debt, we may be required to:
| ¡ | refinance all or a portion of our debt, including the Senior Notes; |
| ¡ | obtain additional financing; |
| ¡ | sell some of our assets or operations; |
| ¡ | reduce or delay capital expenditures and acquisitions; or |
| ¡ | revise or delay our strategic plans. |
If we are required to take any of these actions, it could have a material adverse affect on our business, financial condition and results of operations. In addition, we cannot assure you that we would be able to take any of these actions, that these actions would enable us to continue to satisfy our capital requirements or that these actions would be permitted under the terms of our various debt instruments.
The covenants in Koppers Inc.’s revolving credit facility impose restrictions that may limit our ability to take certain actions. Our failure to comply with these covenants could result in the acceleration of our outstanding indebtedness.
Koppers Inc.’s revolving credit facility contains minimum fixed charge coverage and maximum leverage ratios. Additionally, the facility includes covenants limiting liens, mergers, asset sales, dividends and the incurrence of debt. Our ability to borrow under Koppers Inc.’s revolving credit facility will depend upon satisfaction of these covenants. Events beyond our control can affect our ability to meet those covenants.
If we are unable to meet the terms of our financial covenants, or if we break any of these covenants, a default could occur. A default, if not waived, would entitle our lenders to declare all amounts borrowed under it immediately due and payable, which could also cause the acceleration of obligations under certain other agreements. In the event of acceleration of our outstanding
18
Table of Contents
Koppers Holdings Inc. 2009 Annual Report
indebtedness, there can be no assurance that we would be able to repay our debt or obtain new financing to refinance our debt. Even if new financing is made available to us, it may not be on terms acceptable to us.
The Senior Notes are unsecured and are effectively subordinated to our current and future secured indebtedness.
The Senior Notes are unsecured, and are effectively subordinated to all our current secured indebtedness and any future secured indebtedness that we may incur to the extent of the assets securing such indebtedness. At December 31, 2009, we have a $300.0 million secured revolving credit facility. The revolving credit agreement and indenture governing the Senior Notes permit us to incur a substantial amount of additional indebtedness. The Senior Notes do not have the right to any security interests in any collateral.
In the event of our insolvency, bankruptcy, liquidation, reorganization, dissolution or winding up, we may not have sufficient assets to pay amounts due on any or all of the Senior Notes then outstanding. Holders of the Senior Notes will participate ratably with all holders of our unsecured indebtedness that is deemed to be of the same class as the Senior Notes, and potentially with all of our other general creditors, based upon the respective amounts owed to each holder or creditor, in our remaining assets. In any of the foregoing events, we cannot assure you that there will be sufficient assets to pay amounts due on the Senior Notes. As a result, holders of the Senior Notes may receive less, ratably, than holders of our secured indebtedness.
We may not have the ability to raise the funds necessary to finance the change of control offer required by the indenture or may be prohibited from making a repurchase offer required by the indenture.
Upon the occurrence of certain specific kinds of change of control events, we will be required to offer to repurchase all outstanding Senior Notes at 101 percent of the principal amount thereof plus accrued and unpaid interest, if any, to the date of repurchase. The source of funds for that purchase of Senior Notes will be available cash or cash generated from Koppers Inc. or its subsidiaries operations or other potential sources, including borrowings, sales of assets or equity financing. It is possible that we will not have sufficient funds at the time of the change of control to make the required repurchase of Senior Notes or that restrictions in our other indebtedness will not allow such repurchases. In addition, certain important corporate events, such as leveraged recapitalizations that would increase the level of our indebtedness, would not constitute a change of control under the Senior Notes indenture.
Holders of Senior Notes may not be able to determine when a change of control giving rise to their right to have the Senior Notes repurchased by us has occurred following a sale of “substantially all” of our assets.
A change of control, as defined in the indenture governing the Senior Notes, requires us to make an offer to repurchase all outstanding Senior Notes. The definition of change of control includes a phrase relating to the sale, lease or transfer of “all or substantially all” of our assets. There is no precise established definition of the phrase “substantially all” under applicable law. Accordingly, the ability of a holder of Senior Notes to require us to repurchase its Senior Notes as a result of a sale, lease or transfer of less than all of our assets to another individual, group or entity may be uncertain.
The claims of holders of Senior Notes will be structurally subordinated to claims of creditors of any of Koppers Inc’s subsidiaries that do not guarantee the notes.
Only Koppers Holdings and the wholly-owned domestic restricted subsidiaries of Koppers Inc. guarantee the Senior Notes. The Senior Notes are not guaranteed by any of our non-U.S. subsidiaries. Subject to certain limitations, the indenture governing the Senior Notes permits the non-guarantor subsidiaries to acquire additional assets and incur additional indebtedness. Holders of Senior Notes would not have any claim as a creditor against any of the non-guarantor subsidiaries to the assets and earnings of those subsidiaries. The claims of the creditors of those subsidiaries, including their trade creditors, banks and other lenders, will have priority over any of Koppers Inc.’s claims or those of Koppers Inc.’s other subsidiaries as equity holders of the non-guarantor subsidiaries. Consequently, in any insolvency, liquidation, reorganization, dissolution or other winding-up of any of the non-guarantor subsidiaries, creditors of those subsidiaries would be paid before any amounts would be distributed to Koppers Inc. or to any of the other guarantors as equity and thus be available to satisfy the obligations under the Senior Notes and the guarantees. Accordingly, there can be no assurance that any of the assets of the non-guarantor subsidiaries will be available to satisfy the obligations under the Senior Notes and the guarantees. In addition, Koppers Holdings has substantially no operations independent of Koppers Inc. and its subsidiaries, and there can be no assurance that Koppers Holdings will have
19
Table of Contents
any assets available to satisfy the obligations under its guarantee. As of December 31, 2009, the non-guarantor subsidiaries had approximately $85.4 million of liabilities (including trade payables but excluding intercompany indebtedness).
Our subsidiaries that do not guarantee the Senior Notes accounted for approximately $397 million, or 35 percent of our net sales and approximately $47 million, or 50 percent of our operating profit, for the year ended December 31, 2009, and approximately $274 million, or 42 percent of our total assets as of December 31, 2009. Amounts are presented after giving effect to intercompany eliminations.
Federal or state laws allow courts, under specific circumstances, to void debts, including guarantees, and could require holders of Senior Notes to return payments received from guarantors.
The Senior Notes are guaranteed by Koppers Holdings and the wholly-owned domestic restricted subsidiaries of Koppers Inc. If a bankruptcy proceeding or lawsuit were to be initiated by unpaid creditors, the Senior Notes and the guarantees of the Senior Notes could come under review for federal or state fraudulent transfer violations. Under federal bankruptcy law and comparable provisions of state fraudulent transfer laws, obligations under the Senior Notes or a guarantee of the Senior Notes could be voided, or claims in respect of the Senior Notes or a guarantee of the Senior Notes could be subordinated to all other debts of the debtor or that guarantor if, among other things, the debtor or the guarantor, at the time it incurred the debt evidenced by such Senior Notes or guarantee:
| ¡ | received less than reasonably equivalent value or fair consideration for the incurrence of such debt or guarantee; and |
| ¡ | one of the following applies: |
| ¡ | it was insolvent or rendered insolvent by reason of such incurrence; |
| ¡ | it was engaged in a business or transaction for which its remaining assets constituted unreasonably small capital; or |
| ¡ | it intended to incur, or believed that it would incur, debts beyond its ability to pay such debts as they mature. |
In addition, any payment by the debtor or guarantor under the Senior Notes or guarantee of the Senior Notes could be voided and required to be returned to the debtor or guarantor, as the case may be, or deposited in a fund for the benefit of the creditors of the debtor or guarantor.
The measure of insolvency for purposes of these fraudulent transfer laws will vary depending upon the law applied in any proceeding to determine whether a fraudulent transfer has occurred. Generally, however, a debtor or a guarantor would be considered insolvent if:
| ¡ | the sum of its debts, including contingent liabilities, was greater than the fair saleable value of all its assets; |
| ¡ | the present fair saleable value of its assets was less than the amount that would be required to pay its probable liability on its existing debts, including contingent liabilities, as they become absolute and mature; or |
| ¡ | it could not pay its debts as they become due. |
We cannot be sure as to the standards that a court would use to determine whether or not a guarantor was solvent at the relevant time, or, regardless of the standard that the court uses, that the issuance of the guarantees of the Senior Notes would not be voided or subordinated to the guarantor’s other debt. If a guarantee was legally challenged, it could also be subject to the claim that, because it was incurred for our benefit, and only indirectly for the benefit of the guarantor, the obligations of the guarantor were incurred for less than fair consideration. A court could thus void the obligations under a guarantee or subordinate a guarantee to a guarantor’s other debt or take other action detrimental to holders of the Senior Notes.
The trading price of the Senior Notes may be volatile.
After the registration of the Senior Notes, the trading price of the Senior Notes could be subject to significant fluctuations in response to, among other factors, changes in our operating results, interest rates, the market for non-investment grade debt securities, general economic conditions and securities analysts’ recommendations, if any, regarding our securities.
If an active trading market does not develop for the Senior Notes, holders may not be able to resell them.
Prior to the registration of the Senior Notes, there was no public market for the Senior Notes. If no active trading market develops, holders may not be able to resell their Senior Notes at their fair market value or at all. Future trading prices of the Senior Notes will depend on many factors, including, among other things, prevailing interest rates, our operating results and the market for similar securities.
20
Table of Contents
Koppers Holdings Inc. 2009 Annual Report
ITEM 1B. UNRESOLVED STAFF COMMENTS
None.
The following chart sets forth information regarding our production facilities. Generally, our production facilities are suitable and adequate for the purposes for which they are intended and overall have sufficient capacity to conduct business in the upcoming year.
| Primary Product Line | Location | Description of Property Interest | ||
| Carbon Materials & Chemicals |
||||
| Carbon pitch |
Clairton, Pennsylvania | Owned | ||
| Carbon pitch |
Follansbee, West Virginia | Owned | ||
| Carbon pitch(a) |
Hebei Province, China | Leased | ||
| Carbon black |
Kurnell, New South Wales, Australia | Leased | ||
| Carbon pitch |
Longview, Washington | Leased | ||
| Carbon pitch |
Mayfield, New South Wales, Australia | Owned | ||
| Carbon pitch |
Nyborg, Denmark | Owned/Leased | ||
| Carbon pitch |
Port Clarence, United Kingdom | Owned | ||
| Carbon pitch |
Portland, Oregon | Leased | ||
| Carbon pitch |
Scunthorpe, United Kingdom | Owned | ||
| Carbon pitch, phthalic anhydride |
Stickney, Illinois | Owned | ||
| Carbon pitch |
Tangshan, China | Leased | ||
| Railroad & Utility Products |
||||
| Railroad crossties, utility poles |
Bunbury, Western Australia, Australia | Owned/Leased | ||
| Railroad crossties, utility poles |
Denver, Colorado | Owned | ||
| Railroad crossties, utility poles |
Florence, South Carolina | Owned | ||
| Railroad crossties |
Galesburg, Illinois | Leased | ||
| Utility poles |
Grafton, New South Wales, Australia | Owned | ||
| Railroad crossties |
Green Spring, West Virginia | Owned | ||
| Railroad crossties, utility poles |
Grenada, Mississippi | Owned | ||
| Railroad crossties |
Guthrie, Kentucky | Owned | ||
| Utility poles |
Longford, Tasmania, Australia | Owned | ||
| Railroad crossties |
Muncy, Pennsylvania | Owned | ||
| Railroad crossties |
North Little Rock, Arkansas | Owned | ||
| Concrete crossties(b) |
Portsmouth, Ohio | Owned | ||
| Railroad crossties |
Roanoke, Virginia | Owned | ||
| Railroad crossties |
Somerville, Texas | Owned | ||
| Pine products |
Takura, Queensland, Australia | Leased | ||
| (a) | Ownership percentage is 30 percent. |
| (b) | Ownership percentage is 50 percent. |
Our corporate offices are located in approximately 60,000 square feet of leased office space in Pittsburgh, Pennsylvania. The lease term expires on December 31, 2018.
21
Table of Contents
We are involved in litigation and various proceedings relating to environmental laws and regulations, toxic tort, product liability and other matters. An adverse outcome for certain of these cases could result in a material adverse effect on our business, cash flows and results of operations. The information related to legal matters set forth in Note 19 to the Consolidated Financial Statements of Koppers Holdings Inc. is hereby incorporated by reference.
ITEM 4. SUBMISSION OF MATTERS TO A VOTE OF SECURITY HOLDERS
None.
EXECUTIVE OFFICERS OF THE COMPANY
The following table sets forth the names, ages and positions of our and Koppers Inc.’s executive officers as of February 4, 2010. Our executive officers hold their positions until the annual meeting of the board of directors or until their respective successors are elected and qualified.
| Name | Age | Position | ||
| Walter W. Turner |
63 | President and Chief Executive Officer of Koppers Holdings Inc. and Koppers Inc. and Director of Koppers Holdings Inc. and Koppers Inc. | ||
| James T. Dietz |
53 | Vice President, European Operations, Koppers Inc. | ||
| Donald E. Evans |
44 | Vice President, Global Marketing, Sales and Development, Carbon Materials & Chemicals, Koppers Inc. | ||
| Kevin J. Fitzgerald |
57 | Senior Vice President, Global Carbon Materials & Chemicals, Koppers Inc. | ||
| Robert J. Howard |
54 | Vice President, Human Resources, Koppers Inc. | ||
| Leslie S. Hyde |
49 | Vice President, Safety and Environmental Affairs, Koppers Inc. | ||
| Steven R. Lacy |
54 | Senior Vice President, Administration, General Counsel and Secretary, Koppers Holdings Inc. and Koppers Inc. | ||
| Thomas D. Loadman |
55 | Vice President and General Manager, Railroad Products & Services, Koppers Inc. | ||
| Michael J. Mancione |
43 | Vice President, North American Carbon Materials & Chemicals, Koppers Inc. | ||
| Mark R. McCormack |
50 | Vice President, Australian Operations, Koppers Inc. | ||
| Brian H. McCurrie |
49 | Vice President and Chief Financial Officer, Koppers Holdings Inc. and Koppers Inc. | ||
| Louann E. Tronsberg-Deihle |
46 | Treasurer, Koppers Holdings Inc. and Koppers Inc. |
Mr. Turner was elected President and Chief Executive Officer in, and has been our director since, November 2004. He has been President and Chief Executive Officer and director of Koppers Inc. since February 1998.
Mr. Dietz was elected Vice President, European Operations of Koppers Inc., in November 2006 effective January 2007. He joined Koppers in 1995 and has held positions in operations and engineering. Most recently, he was Operations Manager, Carbon Materials & Chemicals of Koppers Inc., beginning in March 1999.
Mr. Evans was elected Vice President, Global Marketing, Sales and Development, Carbon Materials & Chemicals of Koppers Inc. in February 2007. From October 2004 through December 2006, Mr. Evans was Vice President for Advanced Recycling Systems (industrial equipment manufacturing). From July 1998 through September 2004, Mr. Evans had been Manager, Business Development & Strategic Planning, Carbon Materials & Chemicals of Koppers Inc.
Mr. Fitzgerald was elected Senior Vice President, Global Carbon Materials & Chemicals of Koppers Inc. in November 2006. Mr. Fitzgerald was elected Vice President and General Manager, Carbon Materials & Chemicals of Koppers Inc. in March 1998. Mr. Fitzgerald recently announced his expected retirement from Koppers Inc. effective April 30, 2010.
Mr. Howard was elected Vice President, Human Resources of Koppers Inc. in February 2009. In September 2006, Mr. Howard was appointed Vice President, Human Resources. Prior to joining Koppers Inc., Mr. Howard was Vice President, Human Resources and Administration of L.B. Foster Company Inc. (rail and piling supply and precast products) since May 2002.
22
Table of Contents
Koppers Holdings Inc. 2009 Annual Report
Ms. Hyde was elected Vice President, Safety and Environmental Affairs of Koppers Inc. in January 2005. Prior to that date, Ms. Hyde held the position of Manager, Environmental Department of Koppers Inc. since 1999.
Mr. Lacy was elected Senior Vice President, Administration, General Counsel and Secretary in November 2004 and has been Senior Vice President, Administration, General Counsel and Secretary of Koppers Inc. since January 2004. Mr. Lacy had previously been elected Vice President, Law and Human Resources and Secretary of Koppers Inc. in July 2002.
Mr. Loadman was elected Vice President and General Manager, Railroad Products & Services of Koppers Inc. in November 1994.
Mr. Mancione was elected Vice President, Carbon Materials & Chemicals, North America of Koppers Inc. in November 2006. Mr. Mancione was Manager, Marketing and Sales, Carbon Materials & Distillates of Koppers Inc., beginning in November 2004, and prior to that, was Operations Manager, Railroad Products & Services of Koppers Inc. beginning in 2002.
Mr. McCormack was elected Vice President, Australian Operations of Koppers Inc. in November 2006. Mr. McCormack had been elected Vice President, Global Marketing, Sales and Development, Carbon Materials & Chemicals of Koppers Inc. in February 2002.
Mr. McCurrie was elected Vice President and Chief Financial Officer in November 2004 and has been Vice President and Chief Financial Officer of Koppers Inc. since October 2003. Mr. McCurrie is a certified public accountant.
Ms. Tronsberg-Deihle was elected Treasurer of Koppers Holdings Inc. and Koppers Inc. in August 2008. In July 2008, Ms. Tronsberg-Deihle was appointed as our Treasurer. Ms. Tronsberg-Deihle was the Assistant Treasurer and Risk Manager of WESCO Distribution Inc. (global provider of services and procurement solutions) from 1995 to June 2008.
23
Table of Contents
PART II
ITEM 5. MARKET FOR THE REGISTRANT’S COMMON EQUITY, RELATED STOCKHOLDER MATTERS AND ISSUER PURCHASES OF EQUITY SECURITIES
Our common shares are listed and traded on the NYSE under the symbol “KOP”. Prior to our initial public offering in February 2006, there was no established trading market for our common stock.
The number of registered holders of Koppers common shares at January 31, 2010 was 99.
See Note 21 to the consolidated financial statements below for information concerning dividends and high and low market prices of our common shares during the past two years.
Dividend Policy
Our board of directors adopted a dividend policy, which reflects its judgment that our stockholders would be better served if we distributed to them, as quarterly dividends payable at the discretion of our board of directors, a portion of the cash generated by our business in excess of our expected cash needs rather than retaining it or using the cash for other purposes. Our expected cash needs include operating expenses and working capital requirements, interest and principal payments on our indebtedness, capital expenditures, incremental costs associated with being a public company, taxes and certain other costs. On an annual basis we expect to pay dividends with cash flow from operations, but, due to seasonal or other temporary fluctuations in cash flow, we may from time to time use temporary short-term borrowings to pay quarterly dividends.
We are not required to pay dividends, and our shareholders will not be guaranteed, or have contractual or other rights, to receive dividends. Our board of directors may decide, in its discretion, at any time, to decrease the amount of dividends, otherwise modify or repeal the dividend policy or discontinue entirely the payment of dividends.
Our ability to pay dividends is restricted by limitations on Koppers Inc.’s ability to finance such dividends, such limitations being imposed by Koppers Inc.’s credit agreement, the indenture governing Koppers Inc.’s 7 7/8% Senior Notes due 2019 (the “Senior Notes”) and by Pennsylvania law.
Because we are a holding company, substantially all of the assets shown on our consolidated balance sheet are held by our subsidiaries. Accordingly, our earnings and cash flow and our ability to pay dividends are dependent upon the earnings and cash flows of our subsidiaries and the distribution or other payment of such earnings to us in the form of dividends. Koppers Inc., our only direct subsidiary, is a party to a credit agreement that restricts its ability to pay dividends to Koppers Holdings Inc.
Koppers Inc.’s credit agreement prohibits it from making dividend payments to us unless (1) such dividend payments are permitted by the indenture governing Koppers Inc.’s Senior Notes and (2) no event of default or potential default has occurred or is continuing under the credit agreement. The indenture governing Koppers Inc.’s Senior Notes restricts its ability to finance our payment of dividends if (1) a default has occurred or would result from such financing, (2) a restricted subsidiary of Koppers Inc. which is not a guarantor under the indenture is not able to incur additional indebtedness (as defined in the indenture), and (3) the sum of all restricted payments (as defined in the indenture) have exceeded the permitted amount (which we refer to as the “basket”) at such point in time.
The basket is governed by a formula based on the sum of a beginning amount, plus or minus a percentage of Koppers Inc’s consolidated net income (as defined in the indenture), plus the net proceeds of Koppers Inc’s qualified stock issuance or conversions of debt to qualified stock, plus the net proceeds from the sale of or a reduction in an investment (as defined in the indenture) or the value of the assets of an unrestricted subsidiary which is designated a restricted subsidiary. At December 31, 2009 the basket totaled $139.3 million. Notwithstanding such restrictions, the indenture governing Koppers Inc.’s Senior Notes permits an additional aggregate amount of $20.0 million each fiscal year to finance dividends on the capital stock of Koppers Holdings, whether or not there is any basket availability, provided that at the time of such payment, no default in the indenture has occurred or would result from financing the dividends.
Our ability to pay dividends is also restricted by Pennsylvania law. Under Pennsylvania law, a corporation has the power, subject to restrictions in its bylaws, to pay dividends or make other distributions to its shareholders unless, after giving effect thereto, (1) the corporation would not be able to pay its debts as they become due in the usual course of business or (2) the corporation’s assets would be less than the sum of its total liabilities plus (unless otherwise provided in its articles) the amount
24
Table of Contents
Koppers Holdings Inc. 2009 Annual Report
that would be needed upon the dissolution of the corporation to satisfy the preferential rights, if any, of the shareholders having superior preferential rights to the shareholders receiving the distribution. In determining whether a particular level of dividends is permitted under Pennsylvania law, the board of directors may base its conclusion on one or more of the following: the book values of the assets and liabilities of the company as reflected on its books and records; a valuation that takes into consideration unrealized appreciation, depreciation or other changes in value of the assets and liabilities of the company; the current value of the assets and liabilities of the company either valued separately or valued in segments or as an entirety as a going concern; or any other method that is reasonable in the circumstances. Our bylaws and articles contain no restrictions regarding dividends.
25
Table of Contents
ITEM 6. SELECTED FINANCIAL DATA
The following table contains our selected historical consolidated financial data for the five years ended December 31, 2009. The selected historical consolidated financial data for each of the five years ended December 31, 2009, 2008, 2007, 2006 and 2005 have been derived from our audited consolidated financial statements. This selected financial data should be read in conjunction with Koppers’ Consolidated Financial Statements and related notes included elsewhere in this Annual Report on Form 10-K as well as Item 7 Management’s Discussion and Analysis of Financial Condition and Results of Operations.
| Year ended December 31, | ||||||||||||||||||
| 2009 | 2008 | 2007 | 2006 | 2005 | ||||||||||||||
| (Dollars in millions, except share and per share amounts) | ||||||||||||||||||
| Statement of Operations Data: |
||||||||||||||||||
| Net sales |
$ | 1,124.4 | $ | 1,364.8 | $ | 1,255.6 | $ | 1,044.2 | $ | 913.4 | ||||||||
| Depreciation and amortization |
24.8 | 30.0 | 29.5 | 29.6 | 28.4 | |||||||||||||
| Operating profit |
94.9 | 130.2 | 125.1 | 79.0 | 69.0 | |||||||||||||
| Interest expense |
36.3 | 42.6 | 45.9 | 46.9 | 51.7 | |||||||||||||
| Loss (gain) on extinguishment of debt (1) |
22.4 | (1.2 | ) | — | 14.4 | — | ||||||||||||
| Income from continuing operations |
21.7 | 48.4 | 50.5 | 9.0 | 10.6 | |||||||||||||
| Income from discontinued operations(2)(3) |
— | 4.4 | 9.3 | 8.7 | 1.4 | |||||||||||||
| Gain on sale of Koppers Arch(2) |
— | — | 6.7 | — | — | |||||||||||||
| Gain (loss) on sale of Monessen(3) |
(0.3 | ) | 85.9 | — | — | — | ||||||||||||
| Net income(4) |
21.4 | 138.7 | 66.5 | 17.7 | 12.0 | |||||||||||||
| Net income attributable to Koppers(4) |
18.8 | 138.0 | 63.3 | 15.2 | 9.9 | |||||||||||||
| Net income applicable to Koppers common shares |
18.8 | 138.0 | 63.3 | 15.2 | (19.1 | ) | ||||||||||||
| Earnings (Loss) Per Common Share Data:(5)(6) |
||||||||||||||||||
| Basic – continuing operations |
$ | 0.93 | $ | 2.31 | $ | 2.30 | $ | 0.39 | $ | (7.28 | ) | |||||||
| Diluted – continuing operations |
0.92 | 2.30 | 2.29 | 0.36 | (7.28 | ) | ||||||||||||
| Weighted average common shares outstanding (in thousands):(6) |
||||||||||||||||||
| Basic |
20,446 | 20,651 | 20,768 | 19,190 | 2,907 | |||||||||||||
| Diluted |
20,561 | 20,767 | 20,874 | 20,104 | 2,907 | |||||||||||||
| Balance Sheet Data: |
||||||||||||||||||
| Cash and cash equivalents(7) |
$ | 58.4 | $ | 63.1 | $ | 14.4 | $ | 21.3 | $ | 26.1 | ||||||||
| Total assets |
644.4 | 661.1 | 669.3 | 649.4 | 551.8 | |||||||||||||
| Total debt |
335.3 | 374.9 | 440.2 | 475.9 | 517.2 | |||||||||||||
| Other Data: |
||||||||||||||||||
| Capital expenditures:(8) |
$ | 18.0 | $ | 36.7 | $ | 23.2 | $ | 27.5 | $ | 21.1 | ||||||||
| Cash dividends declared per common share(6) |
$ | 0.88 | $ | 0.88 | $ | 0.68 | $ | 1.30 | $ | 3.19 | ||||||||
| Cash dividends declared per preferred share |
— | — | — | — | 12.68 | |||||||||||||
| (1) | Includes loss (gain) on the extinguishment of Senior Discount Notes and Senior Secured Notes in 2009, a portion of the Senior Secured Notes in 2008 and a portion of the Senior Discount Notes in 2006. |
| (2) | In July 2007, we sold our 51 percent interest in Koppers Arch Investments Pty Limited and its subsidiaries (“Koppers Arch”). Koppers Arch’s results of operations have been classified as a discontinued operation for all periods presented. |
| (3) | In October 2008, we sold our 95 percent interest in Koppers Monessen Partners LP (“Monessen”). Monessen’s results of operations have been classified as a discontinued operation for all periods presented. |
| (4) | In connection with our initial public offering in February 2006, costs totaling $17.4 million were incurred for a related call premium on the Senior Secured Notes ($10.1 million), the write-off of deferred financing costs ($3.2 million), the termination of the Saratoga Partners III, L.P. advisory services contract ($3.0 million) and payment of bond consent fees ($1.1 million). |
| (5) | Prior to the conversion of the senior convertible preferred stock into shares of common stock in connection with our initial public offering in February 2006, earnings per share were calculated in accordance with Emerging Issues Task Force No. 03-6, Participating Securities and the Two-Class Method under FASB Statement No. 128, after giving effect to the 3.9799-for-one stock split. |
26
Table of Contents
Koppers Holdings Inc. 2009 Annual Report
| (6) | Cash dividends declared per common share, earnings per common share and weighted average common shares outstanding give effect to a 3.9799-for-one stock split in January 2006. |
| (7) | Includes cash of discontinued operations as of December 31, 2007, 2006 and 2005. |
| (8) | Excludes capital expenditures by Koppers Arch, a discontinued operation, of $— million, $0.1 million, $0.8 million and $0.6 million and by Koppers Monessen, a discontinued operation, of $0.4 million, $1.0 million, $0.2 million and $1.3 million for the years ended December 31, 2008, 2007, 2006 and 2005, respectively. |
27
Table of Contents
ITEM 7. MANAGEMENT’S DISCUSSION AND ANALYSIS OF FINANCIAL CONDITION AND RESULTS OF OPERATIONS
Overview
We are a leading integrated global provider of carbon compounds and commercial wood treatment products and services. Our products are used in a variety of niche applications in a diverse range of end-markets, including the aluminum, railroad, specialty chemical, utility, rubber, concrete and steel industries. We serve our customers through a comprehensive global manufacturing and distribution network, with manufacturing facilities located in the United States, Australia, China, the United Kingdom and Denmark.
We operate two principal businesses: Carbon Materials & Chemicals (“CM&C”) and Railroad & Utility Products (“R&UP”).
Through our CM&C business, we process coal tar into a variety of products, including carbon pitch, creosote, naphthalene and phthalic anhydride, which are intermediate materials necessary in the production of aluminum, the pressure treatment of wood, the production of high-strength concrete, and the production of plasticizers and specialty chemicals, respectively. Through our R&UP business, we believe that we are the largest supplier of railroad crossties to the North American railroads. Our other commercial wood treatment products include the provision of utility poles to the electric and telephone utility industries.
Our CM&C business has entered into a number of strategic transactions during the last three years to expand and focus on its core business related to coal tar distillation and derived products. In December 2009, we announced that we had entered into a letter of intent to acquire Cindu Chemicals B.V., a coal tar distillation company located in the Netherlands. The acquisition may be completed in the first quarter of 2010. For the year ended December 31, 2008 (the last date such information is publicly available), Cindu’s revenues were approximately $70 million.
In May 2009, Tangshan Koppers Kailuan Carbon Chemical Company Limited (“TKK”) commenced the operation of a new tar distillation facility located in China in the Hebei Province near the Jingtang Port with a distillation capacity of 300,000 metric tons. We hold a 30 percent investment in TKK. Finally, in November 2008, we completed a project to expand the capacity of our existing 60-percent owned tar distillation plant in Tangshan, China from 150,000 metric tons to 200,000 metric tons.
On October 1, 2008, we sold our 95 percent interest in Koppers Monessen Partners LP (“Monessen”) to ArcelorMittal S.A. for cash of $160.0 million plus working capital of $10.0 million. Net cash proceeds, after deduction for the limited partner interest, taxes and transaction costs, were approximately $100.0 million. Monessen is a metallurgical furnace coke facility. Effective as of the end of the second quarter of 2008, Monessen was classified as a discontinued operation in the Company’s statement of operations.
In July 2007, we sold our 51 percent interest in Koppers Arch Investments Pty Limited and its subsidiaries (“Koppers Arch”) to Arch Chemicals Inc. for net cash proceeds of $14.3 million and recognized a gain from the sale, net of tax, of $6.7 million. Effective as of this date, Koppers Arch was classified as a discontinued operation in our statement of operations. Koppers Arch is a manufacturer of timber preservation chemicals.
Monessen and Koppers Arch were part of our Carbon Materials & Chemicals business segment.
Outlook
Trend Overview
Our businesses and results of operations are impacted by various competitive and other factors including (i) the impact of global economic conditions on demand for our products both in the United States and overseas; (ii) raw materials pricing and availability, in particular the amount and quality of coal tar available in global markets, which could be negatively impacted by reductions in steel production; (iii) volatility in oil prices, which impacts selling prices and margins for certain of our products including carbon black feedstock and phthalic anhydride; (iv) competitive conditions in global carbon pitch markets; (v) low margins in the utility pole business; and (vi) changes in foreign exchange rates.
Our businesses and results of operations have been impacted by the global recession starting in late 2008 and continuing through 2009. We expect that, although the global economy and our key end markets appear to have stabilized, we will continue to experience these negative trends in 2010 as improvement in our key end markets will emerge slowly over time.
28
Table of Contents
Koppers Holdings Inc. 2009 Annual Report
Certain key end markets have experienced significant global reductions in demand that has negatively impacted our profitability for our products. Starting in late 2008 and continuing into 2009 we have seen significant reductions in global production of aluminum, steel, rubber, concrete, plastics and paints, among others, that represent markets in which our products are consumed. We believe that there will continue to be uncertainty regarding the levels of production going forward.
In addition to reduced demand for our products, many of our customers are aggressively attempting to reduce their manufactured raw material costs. Accordingly, some of our customers are moving toward short-term pricing arrangements as opposed to long-term contracts with periodic pricing reviews.
In the past year we have seen the temporary idling or closure of several aluminum smelters, particularly in North America and Europe, as global production of aluminum declined by approximately six percent over 2008 levels. We expect the trend of closing or reducing production at higher cost smelters to continue as newer, more cost effective smelters come on line in regions with lower cost energy, particularly in the Middle East. As an example we have seen specific closures in North America and Europe that will negatively impact volumes in those geographic areas; at this time we cannot predict if or when these idled smelters will return to production. However, we believe we are well positioned to supply the new Middle Eastern smelters due to our capacity expansions in China.
We produced lower volumes in 2009 as compared to 2008 in many of our products which impacted the capacity utilization at our facilities. We do not expect a dramatic recovery in production volumes during 2010. Lower throughput volumes combined with increasing pressure for price reductions has led us to review our capacity utilization and has resulted in production cutbacks, from time to time, at certain facilities, which will result in lower margins. If these trends continue, we may temporarily idle or permanently close facilities. For example, in December 2009 we announced the sale of our Gainesville utility pole treatment plant. Utility pole markets are expected to continue to remain competitive with resulting low margins. We will continue to review underperforming assets and rationalize capacity as necessary to remain competitive in this market and will reduce market share if warranted.
Several of our products, particularly carbon black feedstock and phthalic anhydride, have end market pricing that is linked to benchmark oil indices. During the past few years we have benefited in terms of revenues and profitability from the higher pricing for these products as the cost of coal tar has not increased proportionally with oil. However, when the price of oil declined in late 2008 we saw significant price and profit declines for these products in 2009.
The availability of a key raw material, coal tar, is linked to levels of metallurgical coke production. As the global steel industry has reduced production of steel and metallurgical coke the volumes of coal tar by-product were also reduced. Our ability to obtain coal tar and the price we are able to negotiate has a significant impact on the level of profitability of our business. Many of our sales contracts include provisions that allow for price increases based on increases in the price of raw materials, which has allowed us to generally maintain profit dollars in our core businesses. However, significant increases in raw material costs will result in margin dilution because only the increased cost of the raw material is passed on to the customer.
The North American railroad market has experienced better stability than our other end markets over the past year; however, continued negative economic trends could impact the demand for crossties from the short line railroads as well as the Class I railroads. Additionally, lumber availability and pricing were negatively impacted in 2009 by depressed markets for furniture and hardwood flooring caused by the dramatic decline in the U.S. housing market. It is likely that housing will remain depressed during 2010 and along with extreme weather conditions experienced in the first quarter of 2010, continued difficulties related to cost and availability of hardwoods for crossties may be experienced.
In 2010, we expect that capital spending in the railroad sector will be moderately lower and will be concentrated on maintenance projects as new construction has been deferred. While Class I railroad crosstie purchases are expected to remain at prior year levels, the commercial railroad market continues to be challenging and competitive due to the current economic climate.
Net sales over the past several years have been significantly impacted by favorable foreign exchange rates in Australia, Great Britain, Europe, Denmark and China. In late 2008 and continuing into 2009 we saw those trends begin to reverse. Exchange rates for currencies in Australia, Great Britain, Europe, Denmark, and to a lesser extent, China, have changed significantly and negatively impacted sales and profits in 2009 compared to 2008. For example, unfavorable changes in exchange rates reduced our sales by approximately $33 million or two percent in 2009 as compared to 2008. In addition, we expect continued volatility in these exchange rates that could impact our ability to accurately predict future levels of sales and profits.
29
Table of Contents
Seasonality and Effects of Weather on Operations
Our quarterly operating results fluctuate due to a variety of factors that are outside of our control, including inclement weather conditions, which in the past have affected operating results. Operations at several facilities have been halted for short periods of time during the winter months. Moreover, demand for some of our products declines during periods of inclement weather. As a result of the foregoing, we anticipate that we may experience material fluctuations in quarterly operating results. Historically, our operating results have been significantly lower in the fourth and first calendar quarters as compared to the second and third calendar quarters. We expect this seasonality trend to continue in future periods.
Due to the concentration of our North American operating facilities in the eastern and mid-western portions of the United States, we have been negatively impacted by heavy snowstorm activity in January and February 2010. This has resulted in higher operating and logistics costs as well as lower production and shipments of our products at these locations. We expect that this will have a negative impact our results for the first quarter of 2010.
Results of Operations – Comparison of Years Ended December 31, 2009 and December 31, 2008
Consolidated Results
Net sales for the years ended December 31, 2009 and 2008 are summarized by segment in the following table:
| Year Ended December 31, |
Net Change |
||||||||
| 2009 | 2008 | ||||||||
| (Dollars in millions) | |||||||||
| Carbon Materials & Chemicals |
$ | 655.2 | $ | 892.0 | -27 | % | |||
| Railroad & Utility Products |
469.2 | 472.8 | -1 | % | |||||
| $ | 1,124.4 | $ | 1,364.8 | -18 | % | ||||
CM&C net sales decreased by $236.8 million or 27 percent due to the following changes in volume, pricing and foreign exchange:
| Price | Volume | Foreign Exchange |
Net Change |
|||||||||
| Carbon Materials(a) |
+2 | % | -11 | % | -1 | % | -10 | % | ||||
| Distillates(b) |
-2 | % | -3 | % | — | % | -5 | % | ||||
| Coal Tar Chemicals(c) |
-3 | % | -2 | % | — | % | -5 | % | ||||
| Other(d) |
-1 | % | -4 | % | -2 | % | -7 | % | ||||
| Total CM&C |
-4 | % | -20 | % | -3 | % | -27 | % | ||||
| (a) | Includes carbon pitch and refined tar. |
| (b) | Includes creosote and carbon black feedstock. |
| (c) | Includes naphthalene and phthalic anhydride. |
| (d) | Includes carbon black, petroleum pitch, benzole, freight and other products. |
Carbon materials’ pricing for carbon pitch increased three percent in the U.S. and Australia as customer prices were increased in response to higher raw material costs. Offsetting this increase were lower sales volumes of carbon pitch in the U.S. of nine percent and Europe of two percent. The volume decreases are due to reduced worldwide demand for aluminum products and the related idling of a number of aluminum smelters to reduce supply.
Distillate pricing for carbon black feedstock decreased two percent in Europe due to lower average worldwide oil prices as compared to the prior year. The decrease in distillate sales volume is due primarily to lower creosote sales in the U.S. totaling two percent.
For coal tar chemicals, decreases in phthalic anhydride prices in the U.S. of two percent and naphthalene prices of one percent in Europe were experienced. Lower volumes of phthalic anhydride of one percent resulted from weakness in the U.S. housing and auto industries. With respect to other products, benzole and carbon black volumes decreased one percent each as compared to the prior year.
30
Table of Contents
Koppers Holdings Inc. 2009 Annual Report
R&UP net sales decreased by $3.6 million or one percent due to the following changes in volume and pricing:
| Price | Volume | Foreign Exchange |
Net Change |
|||||||||
| Railroad Crossties(a) |
+2 | % | –4 | % | — | % | -2 | % | ||||
| TSO Crossties(b) |
+1 | % | +1 | % | — | % | +2 | % | ||||
| Distribution Poles |
— | % | –2 | % | -1 | % | -3 | % | ||||
| Other(c) |
+4 | % | –2 | % | — | % | +2 | % | ||||
| Total R&UP |
+7 | % | -7 | % | -1 | % | -1 | % | ||||
| (a) | Includes treated and untreated railroad crossties. |
| (b) | Includes sales from treatment services only (“TSO”). |
| (c) | Includes creosote, transmission poles, pilings, freight and other treated and untreated lumber products. |
Sales price increases and volume increases for untreated railroad crossties totaled two and three percent, respectively for the year ended December 31, 2009. Offsetting the volume increase in railroad crossties was a decrease of six percent in treated railroad crossties sales, as volume reductions for sales to commercial customers offset volume increases for the Class I railroads. With respect to other products, higher creosote prices of three percent in the U.S. were realized.
Cost of sales as a percentage of net sales was 84 percent for both years ended December 31, 2009 and 2008. Overall, cost of sales decreased by $193.4 million when compared to the prior year period due primarily to lower CM&C production volumes and foreign exchange.
Depreciation and amortization for the year ended December 31, 2009 was $5.2 million lower when compared to the prior year period due to an impairment charge of $3.7 million in 2008 related to our glycerine refining plant in the United Kingdom.
Selling, general and administrative expenses for the year ended December 31, 2009 were $6.5 million lower when compared to the prior year period due primarily to lower salary, incentive, benefit expenses and lower discretionary spending as a result of programs to decrease spending to react to changing global economic conditions.
Interest expense for the year ended December 31, 2009 was $6.3 million lower when compared to the prior year period due primarily to lower average borrowings as compared to the prior period. Lower average borrowings resulted from debt reductions in the fourth quarter of 2008 funded by the net proceeds from the sale of Monessen in October 2008.
Loss on the extinguishment of debt was $22.4 million in 2009 and resulted from the tender offer and call of the Senior Discount Notes and the call of the Senior Secured Notes. The gain on extinguishment of debt of $1.2 million in 2008 resulted from the repurchase of Senior Secured Notes at a discount to principal value.
Income taxes for the year ended December 31, 2009 were $27.8 million lower when compared to the prior year period due primarily to the decrease in pretax income of $54.5 million and estimated taxes on unremitted European earnings for 2008. For the year ended December 31, 2009, European earnings were considered to be permanently reinvested and did not attract U.S. taxation. In 2008, we provided U.S. deferred tax on European earnings of approximately $18 million. Our effective income tax rate for the year ended December 31, 2009 was 38.8 percent as compared to the prior year period of 46.2 percent.
For the year ended December 31, 2009, although we had book income before taxes of $35.5 million, we incurred a U.S. taxable loss, for federal purposes, of $58.4 million due to the refinancing of the Senior Discount Notes. This taxable loss occurred due to the ability to deduct accrued but unpaid interest on the Senior Discount Notes for which we had previously provided deferred tax. As a result we have recorded an income tax receivable of $37.1 million as of December 31, 2009 to reflect the anticipated refunds of federal and state income taxes paid in 2009 and 2008.
Gain on sale of Monessen for the year ended December 31, 2008 represents the gain, net of tax expense, from the sale of our 95 percent interest in Monessen to ArcelorMittal S.A. on October 1, 2008. Effective as of this date, Monessen was classified as a discontinued operation in our statement of operations. The loss on sale of Monessen for 2009 represented sales price adjustments negotiated with the buyer.
31
Table of Contents
Segment Results
Segment operating profit for the years ended December 31, 2009 and 2008 is summarized by segment in the following table:
| Year Ended December 31, |
% Change | ||||||||||
| 2009 | 2008 | ||||||||||
| (Dollars in millions) | |||||||||||
| Operating profit: |
|||||||||||
| Carbon Materials & Chemicals |
$ | 58.5 | $ | 108.2 | -46 | % | |||||
| Railroad & Utility Products |
38.2 | 24.3 | +57 | % | |||||||
| Corporate |
(1.8 | ) | (2.3 | ) | -22 | % | |||||
| $ | 94.9 | $ | 130.2 | -27 | % | ||||||
| Operating profit as a percentage of net sales: |
|||||||||||
| Carbon Materials & Chemicals |
8.9 | % | 12.1 | % | -3.2 | % | |||||
| Railroad & Utility Products |
8.1 | % | 5.1 | % | +3.0 | % | |||||
| 8.4 | % | 9.5 | % | -1.1 | % | ||||||
Carbon Materials & Chemicals net sales and operating profit by geographic region for the years ended December 31, 2009 and 2008 is summarized in the following table:
| Twelve months ended December 31, |
% Change | ||||||||||
| 2009 | 2008 | ||||||||||
| (Dollars in millions) | |||||||||||
| Net sales: |
|||||||||||
| North America |
$ | 270.4 | $ | 398.6 | -32 | % | |||||
| Europe |
179.4 | 259.4 | -31 | % | |||||||
| Australia |
145.7 | 167.4 | -13 | % | |||||||
| China |
78.6 | 77.7 | +1 | % | |||||||
| Intrasegment |
(18.9 | ) | (11.1 | ) | +70 | % | |||||
| $ | 655.2 | $ | 892.0 | -27 | % | ||||||
| Operating profit: |
|||||||||||
| North America |
$ | 18.3 | $ | 56.4 | -68 | % | |||||
| Europe |
19.8 | 25.8 | -23 | % | |||||||
| Australia |
14.5 | 26.1 | -44 | % | |||||||
| China |
5.9 | (0.1 | ) | n/a | % | ||||||
| $ | 58.5 | $ | 108.2 | -46 | % | ||||||
North American CM&C sales decreased by $128.2 million due primarily to lower volumes for carbon pitch, creosote and phthalic anhydride totaling $111.4 million in addition to lower freight of $11.1 million. Higher volumes of refined tar and petroleum pitch of $11.1 million partially offset these decreases. Operating profit as a percentage of net sales decreased to seven percent from 14 percent for the prior period reflecting the impact of significantly lower sales volumes coupled with lower pricing for phthalic anhydride.
European CM&C sales decreased by $80.0 million due primarily to lower prices for carbon black feedstock, benzole and naphthalene totaling $29.9 million and lower volumes for carbon pitch, benzole and creosote totaling $24.0 million. In addition, currency exchange rate changes resulted in a reduction of sales totaling $21.1 million. Operating profit as a percentage of net sales increased to 11 percent from ten percent from the prior period.
32
Table of Contents
Koppers Holdings Inc. 2009 Annual Report
Australian CM&C sales decreased by $21.7 million due primarily to lower volumes for carbon pitch, carbon black feedstock and carbon black totaling $17.5 million. These decreases were partially offset by higher prices for carbon pitch totaling $15.9 million. Currency exchange rate changes resulted in a reduction of sales totaling $10.6 million. Operating profit as a percentage of net sales was ten percent for the period as compared to 16 percent for the prior period reflecting the impact of lower sales volumes during 2009.
Chinese CM&C sales increased by $0.9 million due primarily to higher volumes of carbon black feedstock, carbon pitch and naphthalene totaling $12.4 million, partially offset by lower carbon pitch and carbon black feedstock prices of $12.2 million. Currency exchange rate changes contributed $0.9 million to increased sales. Operating profit as a percentage of net sales was eight percent and compared to breakeven for the prior period. The 2008 operating margin was negatively impacted by lower of cost of market write-downs of inventory.
Railroad & Utility Products sales for the twelve months ended December 31, 2009 decreased by $3.6 million as compared to the prior period primarily as higher sales volumes of treated crossties, untreated crossties and treating services to the Class I railroads of $22.3 million and higher prices for untreated crossties of $8.1 million were more than offset by lower volumes of treated crossties to commercial customers of $35.4 million. Operating profit as a percentage of net sales increased to eight percent from five percent between periods due to product mix, cost reduction initiatives and the impact in 2008 of additional operating costs due to a boiler outage at one of the Company’s wood treatment plants and the unplanned outage of an electricity cogeneration unit at another of the Company’s wood treatment plants.
Results of Operations – Comparison of Years Ended December 31, 2008 and December 31, 2007
Consolidated Results
Net sales for the years ended December 31, 2008 and 2007 are summarized by segment in the following table:
| Year Ended December 31, |
Net Change |
||||||||
| 2008 | 2007 | ||||||||
| (Dollars in millions) | |||||||||
| Carbon Materials & Chemicals |
$ | 892.0 | $ | 776.1 | +15 | % | |||
| Railroad & Utility Products |
472.8 | 479.5 | -1 | % | |||||
| $ | 1,364.8 | $ | 1,255.6 | +9 | % | ||||
CM&C net sales increased by $115.9 million or 15 percent due to the following changes in volume, pricing and foreign exchange:
| Price | Volume | Foreign Exchange |
Net Change |
|||||||||
| Carbon Materials(a) |
+4 | % | +2 | % | +1 | % | +7 | % | ||||
| Distillates(b) |
+3 | % | +1 | % | — | % | +4 | % | ||||
| Coal Tar Chemicals(c) |
+1 | % | -2 | % | — | % | -1 | % | ||||
| Other(d) |
+2 | % | +3 | % | — | % | +5 | % | ||||
| Total CM&C |
+10 | % | +4 | % | +1 | % | +15 | % | ||||
| (a) | Includes carbon pitch and refined tar. |
| (b) | Includes creosote and carbon black feedstock. |
| (c) | Includes naphthalene and phthalic anhydride. |
| (d) | Includes carbon black, benzole, freight and other products. |
Carbon materials’ prices increased in the U.S. and China as customer prices were increased in response to substantially higher raw material costs. An increase in carbon materials sales volume was realized primarily in Australia and Europe totaling three percent and was partially offset by decreases in China of one percent.
Distillate pricing improved due to price increases in carbon black feedstock prices in Europe and creosote prices in the U.S. totaling three percent. The increase in carbon black feedstock pricing is consistent with higher average worldwide oil prices during the year. The increase in distillate sales volume is due primarily to increased creosote sales in the U.S. totaling one percent.
33
Table of Contents
For coal tar chemicals, increases in phthalic anhydride prices of one percent were partially offset by lower naphthalene prices in Europe. The decrease in coal tar chemicals volumes is due primarily to lower phthalic anhydride volumes of one percent. With respect to other products, carbon black volumes, freight, specialty chemicals and other carbon products increased five percent as compared to the prior year and were partially offset by lower commercial roofing sales. Carbon black prices experienced an increase of one percent as compared to the prior year.
R&UP net sales decreased by $6.7 million or one percent due to the following changes in volume and pricing:
| Price | Volume | Net Change |
|||||||
| Railroad Crossties(a) |
+2 | % | -3 | % | -1 | % | |||
| TSO Crossties(b) |
+2 | % | -1 | % | +1 | % | |||
| Distribution Poles |
+1 | % | -1 | % | — | % | |||
| Other(c) |
+3 | % | -4 | % | -1 | % | |||
| Total R&UP |
+8 | % | -9 | % | -1 | % | |||
| (a) | Includes treated and untreated railroad crossties. |
| (b) | Includes sales from treatment services only (“TSO”). |
| (c) | Includes transmission poles, pilings, creosote, freight and other treated and untreated lumber products. |
Sales were negatively impacted by volume decreases of untreated railroad crossties totaling four percent for the year ended December 31, 2008 due to capital purchasing reductions by the Class I railroads and reduced raw material availability due to weather and a weak timber market. Treated railroad crossties pricing increased by one percent for the year ended December 31, 2008 as raw material price increases were passed on to customers. The price increase in other products is due primarily to higher creosote prices and transmission pole prices totaling two percent. The lower volumes in other products is due primarily to lower sales of untreated lumber products.
Cost of sales as a percentage of net sales was 84 percent for the year ended December 31, 2008 as compared to 82 percent for the year ended December 31, 2007. Overall, cost of sales increased by $111.1 million when compared to the prior year period due primarily to higher raw material costs.
Depreciation and amortization for the year ended December 31, 2008 was $0.5 million higher when compared to the prior year period and included an impairment charge of $3.7 million related to our glycerine refining plant in the United Kingdom.
Selling, general and administrative expenses for the year ended December 31, 2008 were $7.5 million lower when compared to the prior year period due primarily to due diligence costs of $6.8 million incurred in 2007 related to a potential acquisition which was not consummated.
Interest expense for the year ended December 31, 2008 was $3.3 million lower when compared to the prior year period due primarily to lower average borrowings on revolving credit facilities and term debt. Lower average borrowings resulted from debt reductions funded by cash flows from operations and the net proceeds from the sale of Monessen in October 2008.
Income taxes for the year ended December 31, 2008 were $12.6 million higher when compared to the prior year period due primarily to the increase in pretax income of $10.5 million and estimated taxes on unremitted European earnings for 2008. For the year ended December 31, 2007, all European earnings were considered to be permanently reinvested and did not attract U.S. taxation. Our effective income tax rate for the year ended December 31, 2008 was 46.2 percent as compared to the prior year period of 36.5 percent. The increase in the effective tax rate is due primarily to the U.S. taxation of European earnings in 2008.
Gain on sale of Monessen for the year ended December 31, 2008 represents the gain, net of tax expense, from the sale of our 95 percent interest in Monessen to ArcelorMittal S.A. on October 1, 2008. Effective as of this date, Monessen was classified as a discontinued operation in our statement of operations.
34
Table of Contents
Koppers Holdings Inc. 2009 Annual Report
Segment Results
Segment operating profit for the years ended December 31, 2008 and 2007 is summarized by segment in the following table:
| Year Ended December 31, |
% Change | ||||||||||
| 2008 | 2007 | ||||||||||
| (Dollars in millions) | |||||||||||
| Operating profit: |
|||||||||||
| Carbon Materials & Chemicals |
$ | 107.9 | $ | 84.3 | +28 | % | |||||
| Railroad & Utility Products |
24.0 | 42.8 | -44 | % | |||||||
| Corporate |
(2.3 | ) | (2.0 | ) | +15 | % | |||||
| $ | 129.6 | $ | 125.1 | +4 | % | ||||||
| Operating profit as a percentage of net sales: |
|||||||||||
| Carbon Materials & Chemicals |
12.1 | % | 10.9 | % | +1.2 | % | |||||
| Railroad & Utility Products |
5.1 | % | 8.9 | % | -3.8 | % | |||||
| 9.5 | % | 10.0 | % | -0.5 | % | ||||||
Carbon Materials & Chemicals net sales and operating profit by geographic region for the years ended December 31, 2008 and 2007 is summarized in the following table:
| Twelve months ended December 31, |
% Change | ||||||||||
| 2008 | 2007 | ||||||||||
| (Dollars in millions) | |||||||||||
| Net sales: |
|||||||||||
| North America |
$ | 398.6 | $ | 357.8 | +11 | % | |||||
| Europe |
259.4 | 226.3 | +15 | % | |||||||
| Australia |
167.4 | 132.6 | +26 | % | |||||||
| China |
77.7 | 70.2 | +11 | % | |||||||
| Intrasegment |
(11.1 | ) | (10.8 | ) | +3 | % | |||||
| $ | 892.0 | $ | 776.1 | +15 | % | ||||||
| Operating profit: |
|||||||||||
| North America |
$ | 56.1 | $ | 43.7 | +28 | % | |||||
| Europe |
25.8 | 15.1 | +71 | % | |||||||
| Australia |
26.1 | 18.8 | +39 | % | |||||||
| China |
(0.1 | ) | 6.7 | -101 | % | ||||||
| $ | 107.9 | $ | 84.3 | +28 | % | ||||||
North American CM&C sales increased by $40.8 million due primarily to higher prices for carbon pitch, creosote and phthalic anhydride totaling $43.0 million and higher volumes of creosote and refined tar totaling $10.4 million. Lower volumes of phthalic anhydride of $10.9 million partially offset these increases. Operating profit as a percentage of net sales increased to 14.1 percent from 12.2 percent for the prior period.
European CM&C sales increased by $33.1 million due primarily to higher volumes of carbon pitch, benzole and specialty chemicals totaling $14.2 million and higher prices for carbon black feedstock and benzole totaling $18.0 million. Operating profit as a percentage of net sales increased to 9.9 percent from 6.7 percent as a result of higher carbon pitch volumes and higher pricing for carbon black feedstock as a result of higher average petroleum prices.
35
Table of Contents
Australian CM&C sales increased by $34.8 million due primarily to higher volumes for carbon pitch and carbon black which totaled $18.2 million. The increase in volume for carbon black is a result of the plant expansion project at the Company’s carbon black plant becoming fully operational. Increases in carbon black prices contributed higher sales of $11.2 million. Operating profit as a percentage of net sales was 15.6 percent for the as compared to 14.2 percent for the prior period.
Chinese CM&C sales increased by $7.5 million due primarily to higher volumes of carbon pitch and other products, principally distillates, totaling $10.9 million, partially offset by lower carbon pitch volumes of $5.5 million. Currency exchange rate changes contributed $6.3 million to increased sales. Operating profit as a percentage of net sales was breakeven as compared to 9.5 percent for the prior period. The decrease in operating margin is due primarily to inventory lower of cost of market writedowns and investment in sales and administrative functions in China.
Railroad & Utility Products operating profit for the twelve months ended December 31, 2008 decreased by $18.8 million as compared to the prior period primarily as a result of lower sales of untreated railroad crossties and TSO crossties and lower operating profit margins. Operating profit as a percentage of net sales decreased to 5.1 percent from 8.9 percent between periods due to lower production and procurement levels for railroad crossties and the increased operating costs due to a boiler outage at one of the Company’s wood treatment plants and the unplanned outage of an electricity cogeneration unit at another of the Company’s wood treatment plants.
Cash Flow
Net cash provided by operating activities was $112.3 million for the year ended December 31, 2009 as compared to net cash provided by operating activities of $51.9 million for the year ended December 31, 2008. Net cash provided by operating activities for 2008 includes income taxes paid in connection with the Monessen transaction of approximately $50 million. Excluding this amount, net cash flow from operating activities increased by approximately $10 million between periods due to reductions in inventories and accounts receivable.
Net cash provided by operating activities was $51.9 million for the year ended December 31, 2008 as compared to net cash provided by operating activities of $66.1 million for the year ended December 31, 2007. Net cash provided by operating activities for 2008 includes income taxes paid in connection with the Monessen transaction of approximately $50 million. Excluding this amount, net cash flow from operating activities increased by approximately $36 million between periods due to improved working capital and lower interest payments.
Net cash used in investing activities was $20.8 million for the year ended December 31, 2009 as compared to net cash provided by investing activities of $120.7 million for the year ended December 31, 2008. Net cash proceeds from divestitures and asset sales in 2008 primarily represent the net cash proceeds from the sale of Monessen. Decreased capital spending in 2009 is primarily related to our plant expansion in China and increased environmental improvement spending at our U.S. wood treating plants during 2008. Acquisition expenditures in 2009 primarily represent an asset acquisition in our US R&UP business and capital contributions to Tangshan Koppers Kailuan Carbon Chemical Company Limited (TKK), our 30 percent-owned coal tar distillation joint venture in China. Acquisition expenditures in 2008 primarily related to capital contributions to TKK.
Net cash provided by investing activities was $120.7 million for the year ended December 31, 2008 as compared to net cash used in investing activities of $16.5 million for the year ended December 31, 2007. Net cash proceeds from divestitures and asset sales primarily represent the net cash proceeds from the sale of Monessen. Increased capital spending in 2008 primarily related to our plant expansion in China and increased environmental improvement spending at our U.S. wood treating plants.
Net cash used in financing activities was $96.9 million for the year ended December 31, 2009 as compared to net cash used in financing activities of $123.1 million for the year ended December 31, 2008. Net repayments of debt totaled $70.8 million in the year ended December 31, 2009 as a result of refinancing the Senior Discount Notes and the Senior Secured Notes with borrowings under the revolving credit agreement, cash and the issuance of $300.0 million principal value Senior Notes.
Net cash used in financing activities was $123.1 million for the year ended December 31, 2008 as compared to net cash used in financing activities of $58.6 million for the year ended December 31, 2007. Net repayments of debt totaled $83.3 million in the year ended December 31, 2008, as a result of higher cash provided from the sale of Monessen and from operating activities (after adjustment for the cash taxes paid on Monessen). Repurchases of common stock under the Company’s common stock repurchase program totaled $20.7 million in 2008.
36
Table of Contents
Koppers Holdings Inc. 2009 Annual Report
Dividends paid were $18.0 million for the year ended December 31, 2009 as compared to dividends paid of $17.2 million for the year ended December 31, 2008. Dividends paid in the year ended December 31, 2009 reflect a quarterly dividend rate of 22 cents per common share.
On February 3, 2010, our board of directors declared a quarterly dividend of 22 cents per common share, payable on April 5, 2010 to shareholders of record as of February 16, 2010.
Liquidity and Capital Resources
Indebtedness as of December 31, 2009
On December 1, 2009, Koppers Inc. completed a private placement offering of $300.0 million aggregate principal amount of 7 7/8% Senior Notes due 2019 (the “Senior Notes”). The Senior Notes are guaranteed by Koppers Holdings Inc., as parent guarantor, and certain subsidiaries of Koppers Inc. as additional guarantors. A portion of the net proceeds of the offering of the Senior Notes was used to finance a cash tender offer for, and a redemption of, Koppers Holdings’ remaining outstanding 9 7/8% Senior Discount Notes due 2014 (the “Senior Discount Notes”), with remaining net proceeds used to repay outstanding debt under Koppers Inc.’s revolving credit facility and for general corporate purposes. In connection with the issuance of the Senior Notes, Koppers Inc. also amended its revolving credit agreement to extend the expiration date of the revolving credit facility to October 31, 2013 and to amend interest pricing and certain covenants.
Restrictions on Dividends to Koppers Holdings
Koppers Holdings depends on the dividends from the earnings of Koppers Inc. and its subsidiaries to generate the funds necessary to meet its financial obligations, including the payment of any declared dividend of Koppers Holdings. In addition, the terms of Koppers Inc.’s revolving credit facility and the terms of the Senior Notes indenture place restrictions on the amount of dividends it may pay to Koppers Holdings. The amount of permitted dividends under the revolving credit facility is generally limited by Koppers Inc.’s fixed charge coverage ratio covenant, among other terms. The amount of permitted dividends under the Senior Note indenture is primarily determined by a derived basket. The basket is based on the sum of a beginning amount, plus or minus a percentage of Koppers Inc.’s consolidated net income (as defined in the indenture), plus the net proceeds of Koppers Inc’s qualified stock issuance or conversions of debt to qualified stock, plus the net proceeds from the sale of or a reduction in an investment (as defined in the indenture) or the value of the assets of an unrestricted subsidiary which is designated a restricted subsidiary.
Notwithstanding the foregoing, the Senior Notes indenture permits an additional aggregate amount of $20.0 million each fiscal year to finance dividends on the capital stock of Koppers Holdings, whether or not there is any basket availability, provided that at the time of such payment, no default in the indenture has occurred or would result from financing the dividends.
Significant reductions in net income, or increases to indebtedness affecting compliance with financial covenants or availability under the revolving credit facility would restrict Koppers Inc.’s ability to pay dividends. As of December 31, 2009, the amount of dividends which may be declared by Koppers Inc. under the terms of the Senior Notes, in addition to the $20.0 million annual allowance, amounted to $139.3 million.
Liquidity
The Koppers Inc. revolving credit facility agreement provides for a revolving credit facility of up to $300.0 million at variable rates. Borrowings under the revolving credit facility are secured by a first priority lien on substantially all of Koppers Inc.’s assets. The revolving credit facility contains certain covenants that limit capital expenditures by Koppers Inc. and restrict its ability to incur additional indebtedness, create liens on its assets, enter into leases, pay dividends and make investments or acquisitions. In addition, such covenants give rise to events of default upon the failure by Koppers Inc. to meet certain financial ratios.
As of December 31, 2009, the Company had $164.7 million of unused revolving credit availability for working capital purposes after restrictions by various debt covenants and certain letter of credit commitments. As of December 31, 2009, $12.3 million of commitments were utilized by outstanding letters of credit.
37
Table of Contents
The following table summarizes our estimated liquidity as of December 31, 2009 (dollars in millions):
| Cash and cash equivalents |
$ | 58.4 | |
| Amount available under revolving credit facility |
164.7 | ||
| Amount available under other credit facilities |
7.1 | ||
| Total estimated liquidity |
$ | 230.2 | |
Our estimated liquidity was $352.7 million at December 31, 2008. The decrease in estimated liquidity from that date is due primarily to a decrease in availability under the revolving credit facility due to an increase in borrowing of $40.0 million under the revolving credit facility and other covenant restrictions.
As of December 31, 2009, we had $325.0 million aggregate amount of common stock, debt securities, preferred stock, depositary shares and warrants (or a combination of these securities) available to be issued under our registration statement on Form S-3 filed in 2009.
Our need for cash in the next twelve months relates primarily to contractual obligations which include debt service, purchase commitments and operating leases, as well as for working capital, capital maintenance programs and mandatory defined benefit plan funding. We may also use cash to pursue potential strategic acquisitions. Capital expenditures in 2010, excluding acquisitions, are expected to total approximately $26 million. We believe that our cash flow from operations and available borrowings under the revolving credit facility will be sufficient to fund our anticipated liquidity requirements for at least the next twelve months. In the event that the foregoing sources are not sufficient to fund our expenditures and service our indebtedness, we would be required to raise additional funds.
Cash Flows from Discontinued Operations
The cash flows related to Monessen and Koppers Arch for the two years ended December 31, 2008 have not been restated in the consolidated statement of cash flows. Excluding cash proceeds from the sales of Monessen and Koppers Arch, the net cash inflows (outflows) of discontinued operations totaled $0.7 million and $(1.9) million for the years ended December 31, 2008 and 2007, respectively.
Schedule of Certain Contractual Obligations
The following table details our projected payments for our significant contractual obligations as of December 31, 2009. The table is based upon available information and certain assumptions we believe to be reasonable.
| Payments Due by Period | |||||||||||||||
| Total | 2010 | 2011-2012 | 2013-2014 | Later years | |||||||||||
| (in millions) | |||||||||||||||
| Long-term debt (including accretion) |
$ | 340.3 | $ | 0.2 | $ | 0.1 | $ | 40.0 | $ | 300.0 | |||||
| Interest on debt |
246.9 | 25.8 | 51.7 | 51.3 | 118.1 | ||||||||||
| Operating leases |
111.0 | 38.8 | 48.2 | 15.8 | 8.2 | ||||||||||
| Purchase commitments(1) |
953.9 | 296.3 | 316.6 | 186.4 | 154.6 | ||||||||||
| Total contractual cash obligations |
$ | 1,652.1 | $ | 361.1 | $ | 416.6 | $ | 293.5 | $ | 580.9 | |||||
| (1) | Consists primarily of raw materials purchase contracts. These are typically not fixed price arrangements; the prices are based on the prevailing market prices. As a result, we generally expect to be able to hedge the purchases with sales at those future prices. |
Pension and other employee benefit plan funding obligations (for defined benefit plans) are not included in the table above. We expect defined benefit plan contributions to total approximately $6 million in 2010. Due to the significant decline in asset values experienced in 2008 and the first quarter of 2009, we estimate that our mandatory funding requirements for our U.S. qualified pension plan, our largest defined benefit plan, will significantly increase in the following years unless legislative relief is granted. We estimate that mandatory funding for this plan will be approximately $12 million in 2011 and $10 million in 2012. Estimated funding obligations are determined by asset performance, workforce and retiree demographics, tax and employment laws and other actuarial assumptions which may change the annual funding obligations. The funded status of our defined benefit plans is disclosed in Note 16 of the Consolidated Financial Statements.
38
Table of Contents
Koppers Holdings Inc. 2009 Annual Report
Schedule of Certain Other Commercial Commitments
The following table details our projected payments for other significant commercial commitments as of December 31, 2009. The table is based upon available information and certain assumptions we believe to be reasonable.
| Payments Due by Period | |||||||||||||||
| Total | 2010 | 2011-2012 | 2013-2014 | Later years | |||||||||||
| (in millions) | |||||||||||||||
| Lines of credit (unused) |
$ | 171.8 | $ | 7.1 | $ | — | $ | 164.7 | $ | — | |||||
| Standby letters of credit |
12.3 | 12.3 | — | — | — | ||||||||||
| Total other commercial commitments |
$ | 174.1 | $ | 19.4 | $ | — | $ | 164.7 | $ | — | |||||
Debt Covenants
The covenants that affect availability of the revolving credit facility and which may restrict the ability of Koppers Inc. to pay dividends include the following financial ratios:
| ¡ | The fixed charge coverage ratio, calculated as of the end of each fiscal quarter for the four fiscal quarters then ended, is not permitted to be less than 1.10. The fixed charge coverage ratio at December 31, 2009 was 2.0. |
| ¡ | The leverage ratio, calculated as of the end of each fiscal quarter for the four fiscal quarters then ended, is not permitted to exceed 4.50. The leverage ratio at December 31, 2009 was 2.65. |
| ¡ | The senior secured leverage ratio, calculated as of the end of each fiscal quarter for the four fiscal quarters then ended, is not permitted to exceed 2.75. The senior secured leverage ratio at December 31, 2009 was 0.07. |
We are currently in compliance with all covenants in the credit agreement governing the revolving credit facility.
At December 31, 2009, Koppers Inc. had $300.0 million principal value outstanding of Senior Notes. The Senior Notes include customary covenants that restrict, among other things, our ability to incur additional debt, pay dividends or make certain other restricted payments, incur liens, merge or sell all or substantially all of the assets or enter into various transactions with affiliates. We are currently in compliance with all covenants in the Senior Notes indenture.
Other Matters
Foreign Operations and Foreign Currency Transactions
We are subject to foreign currency translation fluctuations due to our foreign operations. For the years ended December 31, 2009, 2008 and 2007, exchange rate fluctuations resulted in an increase (decrease) to comprehensive income of $24.0, $(28.5) million and $11.1 million, respectively. Foreign currency transaction gains and losses result from transactions denominated in a currency which is different from the currency used by the entity to prepare its financial statements. Foreign currency transaction gains (losses) were $(1.9) million, $1.8 million and $0.4 million for the years ended December 31, 2009, 2008 and 2007, respectively.
Recently Issued Accounting Guidance
There is no recently issued accounting guidance that is expected to have a material impact on the our financial results.
Critical Accounting Policies
The preparation of financial statements in conformity with generally accepted accounting principles in the United States requires management to use judgment in making estimates and assumptions that affect the reported amounts of revenues and expenses, assets and liabilities, and the disclosure of contingent liabilities. The following accounting policies are based on, among other things, judgments and assumptions made by management that include inherent risks and uncertainties. Our management’s estimates are based on the relevant information available at the end of each period.
Revenue Recognition. We recognize revenue from product sales at the time of shipment or when title passes to the customer. We recognize revenue related to the procurement of certain untreated railroad crossties upon transfer of title, which occurs upon delivery to our plant and acceptance by the customer. Service revenue, consisting primarily of wood treating services, is
39
Table of Contents
recognized at the time the service is provided. Our recognition of revenue with respect to untreated crossties meets all the recognition criteria of the Securities and Exchange Commission’s Staff Accounting Bulletin Topic 13A3, including transfer of title and risk of ownership, the existence of fixed purchase commitments and delivery schedules established by the customer and the completion of all performance obligations by us.
Accounts Receivable. We maintain allowances for doubtful accounts for estimated losses resulting from the inability of our customers to make required payments. In circumstances where we become aware of a specific customer’s inability to meet its financial obligations, a specific reserve for bad debts is recorded against amounts due. If the financial conditions of our customers were to deteriorate, resulting in an impairment of their ability to make payments, additional allowances may be required.
Inventories. In the United States, CM&C and R&UP inventories are valued at the lower of cost, utilizing the last-in, first-out (“LIFO”) basis, or market. Inventories outside the United States are valued at the lower of cost, utilizing the first-in, first-out basis (“FIFO”), or market. Market represents replacement cost for raw materials and net realizable value for work in process and finished goods. LIFO inventories constituted approximately 63 percent of the FIFO inventory value at December 31, 2009 and 2008.
Long-Lived Assets. Our management periodically evaluates the net realizable value of long-lived assets, including property, plant and equipment, based on a number of factors including operating results, projected future cash flows and business plans. We record long-lived assets at the lower of cost or fair value, with fair value based on assumptions concerning the amount and timing of estimated future cash flows. Since judgment is involved in determining the fair value of fixed assets, there is a risk that the carrying value of our long-lived assets may be overstated.
Goodwill. Goodwill is not amortized but is assessed for impairment at least on an annual basis. In making this assessment, management relies on various factors, including operating results, estimated future cash flows, and business plans. There are inherent uncertainties related to these factors and in our management’s judgment in applying them to the analysis of goodwill impairment. Because management’s judgment is involved in performing goodwill impairment analyses, there is risk that the carrying value of goodwill is overstated.
Goodwill valuations are performed using an average of actual and projected operating results of the relevant reporting units. Changes in economic and operating conditions impacting these assumptions could result in goodwill impairments in future periods. Additionally, disruptions to our business such as prolonged recessionary periods or unexpected significant declines in operating results of the relevant reporting units could result in charges for goodwill and other asset impairments in future periods.
Deferred Tax Assets. At December 31, 2009 our balance sheet included $61.4 million of deferred tax assets, net of a $11.2 million valuation allowance. We have determined that this valuation allowance is required for our deferred tax assets based on future earnings projections. To the extent that we encounter unexpected difficulties in market conditions, adverse changes in regulations affecting our businesses and operations, adverse outcomes in legal and environmental matters, or any other unfavorable conditions, the projections for future taxable income may be overstated and we may be required to record an increase in the valuation allowance related to these deferred tax assets which could have a material adverse effect on income in the future.
Accrued Insurance. We are insured for property, casualty and workers’ compensation insurance up to various stop loss amounts after meeting required retention levels. Losses are accrued based upon estimates of the liability for the related retentions for claims incurred using certain actuarial assumptions followed in the insurance industry and based on our experience. In the event we incur a significant number of losses beyond the coverage retention limits, additional expense beyond the actuarial projections would be required.
Asset Retirement Obligations. We measure asset retirement obligations based upon the applicable accounting guidance, using certain assumptions including estimates regarding the recovery of residues in storage tanks. In the event that operational or regulatory issues vary from our estimates, we could incur additional significant charges to income and increases in cash expenditures related to the disposal of those residues.
Pension and Postretirement Benefits. Accounting for pensions and other postretirement benefits involves estimating the cost of benefits to be provided far into the future and allocating that cost over the time period each employee works. This calculation requires extensive use of assumptions regarding inflation, investment returns, mortality, medical costs, employee turnover and discount rates. In determining the expected return on plan assets assumptions, we evaluate long-term actual
40
Table of Contents
Koppers Holdings Inc. 2009 Annual Report
return information, the mix of investments that comprise plan assets and estimates of future investment returns. In selecting rates for current and long-term health care assumptions, we take into consideration a number of factors including our actual health care cost increases, the design of our benefit programs, the characteristics of our active and retiree populations and expectations of inflation rates. Because these items require our management’s judgment, the related liabilities currently recorded by us could be lower or higher than amounts ultimately required to be paid.
Litigation & Contingencies. We record liabilities related to legal matters when an adverse outcome is probable and reasonably estimable. To the extent we anticipate favorable outcomes to these matters which ultimately result in adverse outcomes, we could incur material adverse impacts on earnings and cash flows. Because such matters require significant judgments on the part of management, the recorded liabilities could be lower than what is ultimately required.
Environmental Liabilities. We are subject to federal, state, local and foreign laws and regulations and potential liabilities relating to the protection of the environment and human health and safety, including, among other things, the cleanup of contaminated sites, the treatment, storage and disposal of wastes, the discharge of effluent into waterways, the emission of substances into the air and various health and safety matters. We expect to incur substantial costs for ongoing compliance with such laws and regulations. We may also incur costs as a result of governmental or third-party claims, or otherwise incur costs, relating to cleanup of, or for injuries resulting from, contamination at sites associated with past and present operations. We accrue for environmental liabilities when a determination can be made that they are probable and reasonably estimable.
ITEM 7A. QUANTITATIVE AND QUALITATIVE DISCLOSURES ABOUT MARKET RISK
Like other global companies, we are exposed to market risks relating to fluctuations in interest rates and foreign currency exchange rates. The objective of our financial risk management is to minimize the negative impact of interest rate and foreign exchange rate fluctuations on our earnings, cash flows and equity.
To manage the interest rate risks, we use a combination of fixed and variable rate debt. This reduces the impact of short-term fluctuations in interest rates. To manage foreign currency exchange rate risks, we enter into foreign currency debt instruments that are held by our foreign subsidiaries. This reduces the impact of fluctuating currencies on net income and equity. We also use forward exchange contracts to hedge firm commitments up to twelve months and all such contracts are marked to market with the recognition of a gain or loss at each reporting period.
The following analyses present the sensitivity of the market value, earnings and cash flows of our financial instruments and foreign operations to hypothetical changes in interest and exchange rates as if these changes occurred at December 31, 2009 and 2008. The range of changes chosen for these analyses reflects our view of changes which are reasonably possible over a one-year period. Market values are the present values of projected future cash flows based on the interest rate and exchange rate assumptions. These forward-looking statements are selective in nature and only address the potential impacts from financial instruments and foreign operations. They do not include other potential effects that could impact our business as a result of these changes.
Interest Rate and Debt Sensitivity Analysis. Our exposure to market risk for changes in interest rates relates primarily to our debt obligations. We have both fixed and variable rate debt to manage interest rate risk and to minimize borrowing costs.
At December 31, 2009 we had $295.3 million of fixed rate debt and $40.0 million of variable rate debt, and at December 31, 2008, we had $323.0 million of fixed rate debt and $50.0 million of variable rate debt (for 2008, including the effect of the interest rate swap). Our ratio of variable rate debt to fixed rate debt at December 31, 2009 was approximately 12 percent, reflecting a slight decrease in the ratio from 13 percent in the previous period. For fixed rate debt, interest rate changes affect the fair market value but do not impact earnings or cash flows. For variable rate debt, interest rate changes generally do not affect the fair market value but do impact future earnings and cash flows, assuming other factors are held constant.
Holding other variables constant (such as debt levels and foreign exchange rates), a one percentage point decrease in interest rates at December 31, 2009 and 2008 would have increased the unrealized fair market value of the fixed rate debt by approximately $21.7 million and $19.4 million, respectively. The earnings and cash flows for the next year assuming a one percentage point increase in interest rates would decrease approximately $0.4 million, holding other variables constant.
Exchange Rate Sensitivity Analysis. Our exchange rate exposures result primarily from our investment and ongoing operations in Australia, Denmark, China and the United Kingdom. Holding other variables constant, if there were a ten percent reduction in all relevant exchange rates, the effect on our earnings, based on actual earnings from foreign operations for the years ended December 31, 2009 and 2008, would be reductions of approximately $2.8 million and $3.7 million, respectively.
41
Table of Contents
ITEM 8. FINANCIAL STATEMENTS AND SUPPLEMENTARY DATA
Koppers Holdings Inc.
INDEX TO CONSOLIDATED FINANCIAL STATEMENTS
42
Table of Contents
Koppers Holdings Inc. 2009 Annual Report
MANAGEMENT’S REPORT ON INTERNAL CONTROL OVER FINANCIAL REPORTING
The management of Koppers Holdings Inc. is responsible for establishing and maintaining adequate internal control over financial reporting. Internal control over financial reporting is a process designed to provide reasonable assurance regarding the reliability of financial reporting and the preparation of financial statements for external reporting purposes in accordance with accounting principles generally accepted in the United States of America.
Because of its inherent limitations, internal control over financial reporting may not prevent or detect misstatements. Management has assessed the effectiveness of Koppers Holdings Inc.’s internal control over financial reporting as of December 31, 2009. In making this assessment, management has utilized the criteria set forth by the Committee of Sponsoring Organizations of the Treadway Commission (COSO) in Internal Control – Integrated Framework. Management concluded that based on its assessment, Koppers Holdings Inc.’s internal control over financial reporting was effective as of December 31, 2009.
The effectiveness of Koppers Holdings Inc.’s internal control over financial reporting as of December 31, 2009, has been audited by Ernst & Young LLP, the independent registered public accounting firm that also audited the consolidated financial statements included in this annual report, as stated in their attestation report which appears on page 45.
February 19, 2010
/s/ WALTER W. TURNER
Walter W. Turner
President and Chief Executive Officer
/s/ BRIAN H. MCCURRIE
Brian H. McCurrie
Vice President and Chief Financial Officer
43
Table of Contents
REPORT OF INDEPENDENT REGISTERED PUBLIC ACCOUNTING FIRM
To the Board of Directors and Stockholders of Koppers Holdings Inc.:
We have audited the accompanying consolidated balance sheets of Koppers Holdings Inc. and subsidiaries as of December 31, 2009 and 2008, and the related consolidated statements of operations, comprehensive income, stockholders’ equity (deficit), and cash flows for each of the three years in the period ended December 31, 2009. Our audits also included the financial statement schedule listed in the Index at Item 15(a). These financial statements and schedule are the responsibility of the Company’s management. Our responsibility is to express an opinion on these financial statements and schedule based on our audits.
We conducted our audits in accordance with the standards of the Public Company Accounting Oversight Board (United States). Those standards require that we plan and perform the audit to obtain reasonable assurance about whether the financial statements are free of material misstatement. An audit includes examining, on a test basis, evidence supporting the amounts and disclosures in the financial statements. An audit also includes assessing the accounting principles used and significant estimates made by management, as well as evaluating the overall financial statement presentation. We believe that our audits provide a reasonable basis for our opinion.
In our opinion, the consolidated financial statements referred to above present fairly, in all material respects, the consolidated financial position of Koppers Holdings Inc. and subsidiaries at December 31, 2009 and 2008, and the consolidated results of their operations and their cash flows for each of the three years in the period ended December 31, 2009, in conformity with U.S. generally accepted accounting principles. Also, in our opinion, the related financial statement schedule, when considered in relation to the basic financial statements taken as a whole, presents fairly in all material respects, the information set forth therein.
We have also audited, in accordance with the standards of the Public Company Accounting Oversight Board (United States), Koppers Holdings Inc.’s internal control over financial reporting as of December 31, 2009, based on criteria established in Internal Control – Integrated Framework issued by the Committee of Sponsoring Organizations of the Treadway Commission and our report dated February 19, 2010 expressed an unqualified opinion thereon.
/s/ ERNST & YOUNG LLP
Pittsburgh, Pennsylvania
February 19, 2010
44
Table of Contents
Koppers Holdings Inc. 2009 Annual Report
REPORT OF INDEPENDENT REGISTERED PUBLIC ACCOUNTING FIRM
To the Board of Directors and Stockholders of Koppers Holdings Inc.:
We have audited Koppers Holdings Inc.’s internal control over financial reporting as of December 31, 2009, based on criteria established in Internal Control – Integrated Framework issued by the Committee of Sponsoring Organizations of the Treadway Commission (the COSO criteria). Koppers Holdings Inc.’s management is responsible for maintaining effective internal control over financial reporting and for its assessment of the effectiveness of internal control over financial reporting included in the accompanying “Management’s Report on Internal Control Over Financial Reporting”. Our responsibility is to express an opinion on the effectiveness of the company’s internal control over financial reporting based on our audit.
We conducted our audit in accordance with the standards of the Public Company Accounting Oversight Board (United States). Those standards require that we plan and perform the audit to obtain reasonable assurance about whether effective internal control over financial reporting was maintained in all material respects. Our audit included obtaining an understanding of internal control over financial reporting, assessing the risk that a material weakness exists, testing and evaluating the design and operating effectiveness of internal control based on the assessed risk, and performing such other procedures as we considered necessary in the circumstances. We believe that our audit provides a reasonable basis for our opinion.
A company’s internal control over financial reporting is a process designed to provide reasonable assurance regarding the reliability of financial reporting and the preparation of financial statements for external purposes in accordance with generally accepted accounting principles. A company’s internal control over financial reporting includes those policies and procedures that (1) pertain to the maintenance of records that, in reasonable detail, accurately and fairly reflect the transactions and dispositions of the assets of the company; (2) provide reasonable assurance that transactions are recorded as necessary to permit preparation of financial statements in accordance with generally accepted accounting principles, and that receipts and expenditures of the company are being made only in accordance with authorizations of management and directors of the company; and (3) provide reasonable assurance regarding prevention or timely detection of unauthorized acquisition, use or disposition of the company’s assets that could have a material effect on the financial statements.
Because of its inherent limitations, internal control over financial reporting may not prevent or detect misstatements. Also, projections of any evaluation of effectiveness to future periods are subject to the risk that controls may become inadequate because of changes in conditions, or that the degree of compliance with the policies or procedures may deteriorate.
In our opinion, Koppers Holdings Inc. maintained, in all material respects, effective internal control over financial reporting as of December 31, 2009, based on the COSO criteria.
We also have audited, in accordance with the standards of the Public Company Accounting Oversight Board (United States), the consolidated balance sheets of Koppers Holdings Inc. and subsidiaries as of December 31, 2009 and 2008, and the related consolidated statements of operations, comprehensive income, stockholders’ equity (deficit) and cash flows for each of the three years in the period ended December 31, 2009 of Koppers Holdings Inc. and our report dated February 19, 2010 expressed an unqualified opinion thereon.
/s/ ERNST & YOUNG LLP
Pittsburgh, Pennsylvania
February 19, 2010
45
Table of Contents
CONSOLIDATED STATEMENT OF OPERATIONS
| Year Ended December 31, | |||||||||||
| 2009 | 2008 | 2007 | |||||||||
| (Dollars in millions, except share and per share amounts) | |||||||||||
| Net sales |
$ | 1,124.4 | $ | 1,364.8 | $ | 1,255.6 | |||||
| Cost of sales (excluding items below) |
946.6 | 1,140.0 | 1,028.9 | ||||||||
| Depreciation and amortization |
24.8 | 30.0 | 29.5 | ||||||||
| Selling, general and administrative expenses |
58.1 | 64.6 | 72.1 | ||||||||
| Operating profit |
94.9 | 130.2 | 125.1 | ||||||||
| Other income (loss) |
(0.7 | ) | 1.2 | 0.3 | |||||||
| Interest expense |
36.3 | 42.6 | 45.9 | ||||||||
| Loss (gain) on extinguishment of debt |
22.4 | (1.2 | ) | — | |||||||
| Income before income taxes |
35.5 | 90.0 | 79.5 | ||||||||
| Income taxes |
13.8 | 41.6 | 29.0 | ||||||||
| Income from continuing operations |
21.7 | 48.4 | 50.5 | ||||||||
| Income from discontinued operations, net of tax benefit of $3.0 and $2.8 |
— | 4.4 | 9.3 | ||||||||
| Gain on sale of Koppers Arch, net of tax expense of $4.3 |
— | — | 6.7 | ||||||||
| Gain on sale of Monessen, net of tax (benefit) expense of $(0.2) and $50.4 |
(0.3 | ) | 85.9 | — | |||||||
| Net income |
21.4 | 138.7 | 66.5 | ||||||||
| Net income attributable to noncontrolling interests |
2.6 | 0.7 | 3.2 | ||||||||
| Net income attributable to Koppers |
$ | 18.8 | $ | 138.0 | $ | 63.3 | |||||
| Earnings (loss) per common share: |
|||||||||||
| Basic — |
|||||||||||
| Continuing operations |
$ | 0.93 | $ | 2.31 | $ | 2.30 | |||||
| Discontinued operations |
(0.01 | ) | 4.37 | 0.75 | |||||||
| Earnings per basic common share |
$ | 0.92 | $ | 6.68 | $ | 3.05 | |||||
| Diluted — |
|||||||||||
| Continuing operations |
$ | 0.92 | $ | 2.30 | $ | 2.29 | |||||
| Discontinued operations |
(0.01 | ) | 4.35 | 0.74 | |||||||
| Earnings per diluted common share |
$ | 0.91 | $ | 6.65 | $ | 3.03 | |||||
| Weighted average common shares outstanding (in thousands): |
|||||||||||
| Basic |
20,446 | 20,651 | 20,768 | ||||||||
| Diluted |
20,561 | 20,767 | 20,874 | ||||||||
| Dividends declared per common share |
$ | 0.88 | $ | 0.88 | $ | 0.68 | |||||
CONSOLIDATED STATEMENT OF COMPREHENSIVE INCOME
| Year Ended December 31, | ||||||||||||
| 2009 | 2008 | 2007 | ||||||||||
| (Dollars in millions) | ||||||||||||
| Net income |
$ | 21.4 | $ | 138.7 | $ | 66.5 | ||||||
| Changes in other comprehensive income (loss): |
||||||||||||
| Currency translation adjustment |
24.0 | (28.5 | ) | 11.1 | ||||||||
| Unrecognized pension transition asset, net of tax of $(0.1), $(0.1) and $(0.2) |
(0.2 | ) | (0.3 | ) | (0.5 | ) | ||||||
| Unrecognized pension prior service cost, net of tax of $–, $(0.1) and $(0.5) |
(0.1 | ) | (0.1 | ) | (0.7 | ) | ||||||
| Unrecognized pension net gain (loss), net of tax of $2.5, $(19.4) and $5.7 |
1.9 | (30.5 | ) | 9.3 | ||||||||
| Total comprehensive income |
47.0 | 79.3 | 85.7 | |||||||||
| Comprehensive income attributable to noncontrolling interests |
3.5 | 1.3 | 3.3 | |||||||||
| Comprehensive income attributable to Koppers |
$ | 43.5 | $ | 78.0 | $ | 82.4 | ||||||
The accompanying notes are an integral part of these consolidated financial statements.
46
Table of Contents
Koppers Holdings Inc. 2009 Annual Report
CONSOLIDATED BALANCE SHEET
| December 31, | ||||||||
| 2009 | 2008 | |||||||
| (Dollars in millions, except share and per share amounts) | ||||||||
| Assets |
||||||||
| Cash and cash equivalents |
$ | 58.4 | $ | 63.1 | ||||
| Short-term investments |
4.4 | 1.7 | ||||||
| Restricted cash |
— | 4.2 | ||||||
| Accounts receivable, net of allowance of $0.5 and $0.5 |
102.5 | 112.1 | ||||||
| Income tax receivable |
37.1 | 4.4 | ||||||
| Inventories, net |
152.7 | 171.8 | ||||||
| Deferred tax assets |
8.5 | 2.6 | ||||||
| Other current assets |
17.4 | 12.5 | ||||||
| Total current assets |
381.0 | 372.4 | ||||||
| Equity in non-consolidated investments |
4.7 | 6.0 | ||||||
| Property, plant and equipment, net |
149.3 | 144.8 | ||||||
| Goodwill |
61.6 | 58.4 | ||||||
| Deferred tax assets |
25.9 | 56.0 | ||||||
| Other assets |
21.9 | 23.5 | ||||||
| Total assets |
$ | 644.4 | $ | 661.1 | ||||
| Liabilities |
||||||||
| Accounts payable |
$ | 67.3 | $ | 82.1 | ||||
| Accrued liabilities |
59.8 | 61.8 | ||||||
| Dividends payable |
4.5 | 4.5 | ||||||
| Short-term debt and current portion of long-term debt |
0.2 | 0.2 | ||||||
| Total current liabilities |
131.8 | 148.6 | ||||||
| Long-term debt |
335.1 | 374.7 | ||||||
| Accrued postretirement benefits |
81.9 | 75.7 | ||||||
| Other long-term liabilities |
40.8 | 36.1 | ||||||
| Total liabilities |
589.6 | 635.1 | ||||||
| Commitments and contingent liabilities (Note 19) |
||||||||
| Equity |
||||||||
| Senior Convertible Preferred Stock, $0.01 par value per share; 10,000,000 shares authorized; no shares issued |
— | — | ||||||
| Common Stock, $0.01 par value per share; 40,000,000 shares authorized; 21,124,212 and 21,097,443 shares issued |
0.2 | 0.2 | ||||||
| Additional paid-in capital |
127.2 | 126.6 | ||||||
| Retained deficit |
(37.3 | ) | (37.8 | ) | ||||
| Accumulated other comprehensive income (loss) |
(22.7 | ) | (47.4 | ) | ||||
| Treasury stock, at cost; 669,340 and 668,716 shares |
(23.6 | ) | (23.6 | ) | ||||
| Total Koppers stockholders’ equity |
43.8 | 18.0 | ||||||
| Noncontrolling interests |
11.0 | 8.0 | ||||||
| Total equity |
54.8 | 26.0 | ||||||
| Total liabilities and equity |
$ | 644.4 | $ | 661.1 | ||||
The accompanying notes are an integral part of these consolidated financial statements.
47
Table of Contents
CONSOLIDATED STATEMENT OF CASH FLOWS
| Year Ended December 31, | ||||||||||||
| 2009 | 2008 | 2007 | ||||||||||
| (Dollars in millions) | ||||||||||||
| Cash provided by (used in) operating activities |
||||||||||||
| Net income |
$ | 21.4 | $ | 138.7 | $ | 66.5 | ||||||
| Adjustments to reconcile net cash provided by operating activities: |
||||||||||||
| Depreciation and amortization |
26.6 | 31.7 | 34.7 | |||||||||
| Loss (gain) on extinguishment of debt |
22.4 | (1.2 | ) | — | ||||||||
| Loss (gain) on sale of assets |
0.6 | (139.5 | ) | (11.1 | ) | |||||||
| Deferred income taxes |
22.9 | 13.0 | 3.0 | |||||||||
| Non-cash interest expense |
16.4 | 17.1 | 15.6 | |||||||||
| Equity income of affiliated companies, net of dividends received |
2.0 | 0.8 | 0.3 | |||||||||
| Change in other liabilities |
6.8 | — | (6.9 | ) | ||||||||
| Stock-based compensation |
2.5 | 3.7 | 1.9 | |||||||||
| Other |
0.6 | 1.6 | 0.4 | |||||||||
| (Increase) decrease in working capital: |
||||||||||||
| Accounts receivable |
16.1 | 18.9 | (17.9 | ) | ||||||||
| Inventories |
31.5 | (15.1 | ) | (28.6 | ) | |||||||
| Accounts payable |
(16.8 | ) | (16.8 | ) | 16.2 | |||||||
| Accrued liabilities and other working capital |
(40.7 | ) | (1.0 | ) | (8.0 | ) | ||||||
| Net cash provided by operating activities |
112.3 | 51.9 | 66.1 | |||||||||
| Cash provided by (used in) investing activities |
||||||||||||
| Capital expenditures |
(18.0 | ) | (37.1 | ) | (24.3 | ) | ||||||
| Acquisitions |
(2.2 | ) | (2.9 | ) | (4.1 | ) | ||||||
| Net cash proceeds from divestitures and asset sales |
(0.6 | ) | 160.7 | 11.9 | ||||||||
| Net cash provided by (used in) investing activities |
(20.8 | ) | 120.7 | (16.5 | ) | |||||||
| Cash provided by (used in) financing activities |
||||||||||||
| Borrowings of revolving credit |
190.0 | 203.7 | 318.0 | |||||||||
| Repayments of revolving credit |
(150.0 | ) | (225.0 | ) | (342.0 | ) | ||||||
| Borrowings on long-term debt |
294.9 | — | — | |||||||||
| Repayments on long-term debt |
(405.7 | ) | (62.0 | ) | (20.8 | ) | ||||||
| Issuances of Common Stock |
— | 0.6 | — | |||||||||
| Repurchases of Common Stock |
— | (21.3 | ) | (0.9 | ) | |||||||
| Excess tax benefit from employee stock plans |
— | 0.8 | 1.2 | |||||||||
| Payment of deferred financing costs |
(8.1 | ) | (2.7 | ) | — | |||||||
| Dividends paid |
(18.0 | ) | (17.2 | ) | (14.1 | ) | ||||||
| Net cash used in financing activities |
(96.9 | ) | (123.1 | ) | (58.6 | ) | ||||||
| Effect of exchange rates on cash |
0.7 | (0.8 | ) | 2.1 | ||||||||
| Net increase (decrease) in cash and cash equivalents |
(4.7 | ) | 48.7 | (6.9 | ) | |||||||
| Add: Cash of assets held for sale at beginning of year |
— | 0.6 | 2.5 | |||||||||
| Less: Cash of assets held for sale at end of year |
— | — | (0.6 | ) | ||||||||
| Cash and cash equivalents at beginning of year |
63.1 | 13.8 | 18.8 | |||||||||
| Cash and cash equivalents at end of year |
$ | 58.4 | $ | 63.1 | $ | 13.8 | ||||||
| Supplemental disclosure of cash flows information: |
||||||||||||
| Cash paid during the year for: |
||||||||||||
| Interest |
$ | 19.8 | $ | 24.2 | $ | 29.1 | ||||||
| Income taxes |
26.1 | 74.0 | 25.0 | |||||||||
| Noncash investing and financing activities: |
||||||||||||
| Capital leases |
— | 0.5 | — | |||||||||
The accompanying notes are an integral part of these consolidated financial statements.
48
Table of Contents
Koppers Holdings Inc. 2009 Annual Report
CONSOLIDATED STATEMENT OF STOCKHOLDERS’ EQUITY (DEFICIT)
| Year Ended December 31, | ||||||||||||
| 2009 | 2008 | 2007 | ||||||||||
| (Dollars in millions) | ||||||||||||
| Senior Convertible Preferred Stock |
||||||||||||
| Balance at beginning and end of year |
$ | — | $ | — | $ | — | ||||||
| Common Stock |
||||||||||||
| Balance at beginning and end of year |
$ | 0.2 | $ | 0.2 | $ | 0.2 | ||||||
| Additional paid-in capital |
||||||||||||
| Balance at beginning of year |
$ | 126.6 | $ | 124.4 | $ | 122.4 | ||||||
| Employee stock plans |
0.6 | 2.2 | 2.0 | |||||||||
| Balance at end of year |
$ | 127.2 | $ | 126.6 | $ | 124.4 | ||||||
| Receivable from Director |
||||||||||||
| Balance at beginning of year |
$ | — | $ | (0.6 | ) | $ | (0.6 | ) | ||||
| Repayment |
— | 0.6 | — | |||||||||
| Balance at end of year |
$ | — | $ | — | $ | (0.6 | ) | |||||
| Retained deficit |
||||||||||||
| Balance at beginning of year |
$ | (37.8 | ) | $ | (157.6 | ) | $ | (206.5 | ) | |||
| Net income attributable to Koppers |
18.8 | 138.0 | 63.3 | |||||||||
| Common Stock dividends |
(18.3 | ) | (18.2 | ) | (14.2 | ) | ||||||
| Adoption of accounting standards |
— | — | (0.2 | ) | ||||||||
| Balance at end of year |
$ | (37.3 | ) | $ | (37.8 | ) | $ | (157.6 | ) | |||
| Accumulated other comprehensive loss |
||||||||||||
| Currency translation adjustment: |
||||||||||||
| Balance at beginning of year |
$ | (2.5 | ) | $ | 26.6 | $ | 15.6 | |||||
| Change in currency translation adjustment |
23.1 | (29.1 | ) | 11.0 | ||||||||
| Balance at end of year |
20.6 | (2.5 | ) | 26.6 | ||||||||
| Unrecognized pension transition asset: |
||||||||||||
| Balance at beginning of year |
0.9 | 1.2 | 1.7 | |||||||||
| Change in unrecognized pension asset, net of tax |
(0.2 | ) | (0.3 | ) | (0.5 | ) | ||||||
| Balance at end of year |
0.7 | 0.9 | 1.2 | |||||||||
| Unrecognized pension prior service cost: |
||||||||||||
| Balance at beginning of year |
(0.4 | ) | (0.3 | ) | 0.4 | |||||||
| Change in unrecognized pension prior service cost, net of tax |
(0.1 | ) | (0.1 | ) | (0.7 | ) | ||||||
| Balance at end of year |
(0.5 | ) | (0.4 | ) | (0.3 | ) | ||||||
| Unrecognized pension net loss: |
||||||||||||
| Balance at beginning of year |
(45.4 | ) | (14.9 | ) | (24.2 | ) | ||||||
| Change in unrecognized pension net loss, net of tax |
1.9 | (30.5 | ) | 9.3 | ||||||||
| Balance at end of year |
(43.5 | ) | (45.4 | ) | $ | (14.9 | ) | |||||
| Total balance at end of year |
$ | (22.7 | ) | (47.4 | ) | $ | 12.6 | |||||
| Treasury stock |
||||||||||||
| Balance at beginning of year |
$ | (23.6 | ) | $ | (2.3 | ) | $ | (1.4 | ) | |||
| Purchases |
— | (21.3 | ) | (0.9 | ) | |||||||
| Balance at end of year |
$ | (23.6 | ) | $ | (23.6 | ) | $ | (2.3 | ) | |||
| Total Koppers stockholders’ equity (deficit) – end of year |
$ | 43.8 | $ | 18.0 | $ | (23.3 | ) | |||||
| Noncontrolling interests |
||||||||||||
| Balance at beginning of year |
$ | 8.0 | $ | 9.4 | $ | 12.2 | ||||||
| Net income attributable to noncontrolling interests |
2.6 | 0.7 | 3.2 | |||||||||
| Dividends to noncontrolling interests |
(0.5 | ) | (2.7 | ) | (2.0 | ) | ||||||
| Business disposition |
— | — | (4.1 | ) | ||||||||
| Currency translation adjustment |
0.9 | 0.6 | 0.1 | |||||||||
| Balance at end of year |
$ | 11.0 | $ | 8.0 | $ | 9.4 | ||||||
| Total equity (deficit) – end of year |
$ | 54.8 | $ | 26.0 | $ | (13.9 | ) | |||||
The accompanying notes are an integral part of these consolidated financial statements.
49
Table of Contents
NOTES TO CONSOLIDATED FINANCIAL STATEMENTS
1. Description of Business
Parent company of Koppers Inc. – In these financial statements, unless otherwise indicated or the context requires otherwise, when the terms “Koppers,” the “Company,” “we,” “our” or “us,” are used, they mean Koppers Inc., formerly known as Koppers Industries, Inc., and its subsidiaries on a consolidated basis for periods up until November 18, 2004 and Koppers Holdings Inc. (“Koppers Holdings”) and its subsidiaries on a consolidated basis for periods from and including November 18, 2004, when Koppers Holdings became the parent of Koppers Inc. The use of these terms is not intended to imply that Koppers Holdings and Koppers Inc. are not separate and distinct legal entities. Koppers Holdings has no direct operations and no significant assets other than the stock of Koppers Inc. as of December 31, 2009. It depends on the dividends from the earnings of Koppers Inc. and its subsidiaries to generate the funds necessary to meet its financial obligations. The terms of Koppers Inc.’s revolving credit facility prohibit Koppers Inc. from paying dividends and otherwise transferring assets except for certain limited dividends. Further, the terms of the indenture governing Koppers Inc.’s Senior Notes significantly restrict Koppers Inc. from paying dividends and otherwise transferring assets to Koppers Holdings.
Business description – The Company is a global integrated producer of carbon compounds and treated and untreated wood products and services for use in a variety of markets including the aluminum, railroad, specialty chemical, utility, rubber, concrete and steel industries. The Company’s business is operated through two business segments, Carbon Materials & Chemicals and Railroad & Utility Products.
The Company’s Carbon Materials & Chemicals segment is primarily a supplier of carbon pitch, naphthalene, phthalic anhydride, creosote, carbon black feedstock and carbon black. Carbon pitch is a critical raw material used in the production of aluminum and for the production of steel in electric arc furnaces. Naphthalene is used for the production of phthalic anhydride and as a surfactant in the production of concrete. Phthalic anhydride is used in the production of plasticizers, polyester resins and alkyd paints. Creosote is used in the treatment of wood and carbon black feedstock is used in the production of carbon black. Carbon black is used primarily in the production of rubber tires.
The Company’s Railroad & Utility Products segment sells treated and untreated wood products and services primarily to the railroad and public utility markets. Railroad products include procuring and treating items such as crossties, switch ties and various types of lumber used for railroad bridges and crossings. Utility products include transmission and distribution poles and pilings. The segment also produces concrete crossties through a joint venture.
2. Summary of Significant Accounting Policies
Basis of presentation – The consolidated financial statements include the accounts of the Company and all majority-owned subsidiaries for which the Company is deemed to exercise control over its operations. All significant intercompany transactions have been eliminated. The Company’s investments in 20 percent to 50 percent-owned companies in which it has the ability to exercise significant influence over operating and financial policies are accounted for using the equity method of accounting. Accordingly, the Company’s share of the earnings of these companies is included in the accompanying consolidated statement of operations. The Company has evaluated all subsequent events through February 19, 2010, the date the financial statements were issued.
Use of estimates – Accounting principles generally accepted in the U.S. require management to make estimates and judgments that affect the reported amounts of assets and liabilities and the disclosure of contingencies on the date of the financial statements as well as the reported amounts of revenues and expenses during the reporting period. Estimates have been prepared on the basis of the most current and best available information and actual results could differ materially from these estimates.
Foreign currency translation – For consolidated entities outside of the U.S. that prepare financial statements in currencies other than the U.S. dollar, results of operations and cash flows are translated at average exchange rates during the period, and asset and liabilities are generally translated at end-of-period exchange rates. Cumulative translation adjustments are included as a
50
Table of Contents
Koppers Holdings Inc. 2009 Annual Report
separate component of accumulated other comprehensive income (loss) in stockholders’ equity. Currency translation gains released to income totaled $2.8 million for the year ended December 31, 2007 and related to the sale of Koppers Arch Investments Pty Limited and its subsidiaries.
Foreign currency transaction gains and losses result from transactions denominated in a currency which is different than the currency used by the entity to prepare its financial statements. Foreign currency transaction gains (losses) were $(1.9) million, $1.8 million and $0.4 million for the years ended December 31, 2009, 2008 and 2007, respectively.
Revenue recognition – The Company recognizes revenue when the risks and rewards of ownership and title to the product have transferred to the customer. Revenue recognition generally occurs at the point of shipment; however in certain circumstances as shipping terms dictate, revenue is recognized at the point of destination. Shipping and handling costs are included as a component of cost of sales.
The Company recognizes revenue related to the procurement of certain untreated railroad crossties upon transfer of title to the customer, which occurs upon delivery to the Company’s plant and acceptance by the customer. Service revenue, consisting primarily of wood treating services, is recognized at the time the service is provided. Payment on sales of untreated railroad crossties and wood treating services are generally due within 30 days of the invoice date. The Company’s recognition of revenue with respect to untreated crossties meets all the recognition criteria of SEC Staff Accounting Bulletin Topic 13.A.3., including transfer of title and risk of ownership, the existence of fixed purchase commitments and delivery schedules established by the customer, and the completion of all performance obligations by the Company. Revenue recognized for untreated crosstie sales for the years ended December 31, 2009, 2008 and 2007 amounted to $119.1 million, $98.9 million and $111.1 million, respectively.
Research & development – Research and development costs are expensed as incurred and are included in selling, general and administrative expenses. These costs totaled $2.0 million in 2009, $2.8 million in 2008 and $2.8 million in 2007.
Cash and cash equivalents – Cash and cash equivalents include cash on hand and on deposit and investments in highly liquid investments with an original maturity of 90 days or less.
Restricted cash – Restricted cash includes cash that is required to be held on deposit by a bank and is not available for immediate withdrawal.
Accounts receivable – The Company maintains allowances for doubtful accounts for estimated losses resulting from the inability of its customers to make required payments. In circumstances where the Company becomes aware of a specific customer’s inability to meet its financial obligations to Koppers, a specific reserve for bad debts is recorded against amounts due. If the financial condition of the Company’s customers were to deteriorate, resulting in an inability to make payments, additional allowances may be required. The allowance for doubtful accounts was $0.5 million and $0.5 million as of December 31, 2009 and 2008, respectively.
Inventories – Inventories are carried at lower of cost or market on a worldwide basis. In the U.S., inventory cost (excluding miscellaneous types of inventory) is determined primarily utilizing the last-in, first-out (“LIFO”) basis. Inventory cost outside the U.S. is determined utilizing the first-in, first-out (“FIFO”) basis. Market represents replacement cost for raw materials and net realizable value for work in process and finished goods. LIFO inventories constituted approximately 63 percent of the FIFO inventory value at December 31, 2009 and 2008.
Property, plant & equipment – Property, plant and equipment are recorded at purchased cost and include improvements which significantly increase capacities or extend useful lives of existing plant and equipment. Depreciation expense is calculated by applying the straight-line method over estimated useful lives. Estimated useful lives for buildings generally range from 10 to 20 years and depreciable lives for machinery and equipment generally range from 3 to 10 years. Net gains and losses related to asset disposals are recognized in earnings in the period in which the disposal occurs. Routine repairs, replacements and maintenance are expensed as incurred.
The Company periodically evaluates whether current facts and circumstances indicate that the carrying value of its depreciable long-lived assets may not be recoverable. If an asset, or logical grouping of assets, is determined to be impaired, the asset is written down to its fair value using discounted future cash flows and, if available, quoted market prices.
Goodwill & other intangible assets – Goodwill and other purchased intangible assets are included in the identifiable assets of the business segment to which they have been assigned. The Company performs impairment tests annually for goodwill, and
51
Table of Contents
more often as circumstances require. When it is determined that impairment has occurred, an appropriate charge to earnings is recorded. The Company performed its annual impairment test in the fourth quarters of 2009 and 2008 and determined that the estimated fair values substantially exceeded the carrying values of all the reporting units and accordingly, there was no impairment of goodwill.
Identifiable intangible assets, other than goodwill, are recorded at cost. Identifiable intangible assets that do not have indefinite lives are amortized on a straight-line basis over their estimated useful lives.
Deferred income taxes – Deferred tax assets and liabilities are recognized for future tax consequences attributable to differences between the financial statement carrying amounts of existing assets and liabilities and their respective tax bases. The effect on deferred tax assets and liabilities of a change in tax laws is recognized in earnings in the period the new laws are enacted. A valuation allowance is recorded to reduce the carrying amounts of deferred tax assets unless it is more likely than not that such assets will be realized. Deferred tax liabilities have not been recognized for the undistributed earnings of certain foreign subsidiaries because management intends to permanently reinvest such earnings in foreign operations.
Insurance – The Company is self-insured for property, casualty and workers’ compensation exposures up to various stop-loss coverage amounts. Losses are accrued based upon the Company’s estimates of the liability for the related deductibles of claims incurred. Such estimates utilize actuarial methods based on various assumptions, which include but are not limited to, the Company’s historical loss experience and projected loss development factors. In 2009 and 2008, the Company reversed $1.9 million and $2.0 million, respectively, of insurance loss reserves as a result of favorable loss trends related to self-insured claims. Such reversals increased operating profit in both periods. Insurance loss reserves accrued at December 31, 2009 and 2008 totaled $12.1 million and $11.9 million, respectively.
Derivative financial instruments – The Company uses forward exchange contracts to hedge exposure to currency exchange rate changes on transactions and other commitments denominated in a foreign currency. Contracts are generally written on a short-term basis and are not held for trading or speculative purposes. The Company recognizes the fair value of the forward contracts as an asset or liability at each reporting date. Because the Company has not elected to designate the forward exchange contracts for hedge accounting treatment, changes in the fair value of the forward exchange contracts are recognized immediately in earnings.
During 2004, the Company entered into an interest rate swap agreement to convert the fixed rate on a portion ($50.0 million) of Koppers Inc.’s Senior Secured Notes to a floating rate based on six-month LIBOR rates plus a specified spread. On October 15, 2009 and concurrent with the redemption of the Senior Secured Notes, the swap was terminated which resulted in a gain of $1.6 million. The swap agreement required semiannual cash settlements of interest paid or received. The differential between the interest paid or interest received from semi-annual settlements were recorded as an adjustment to interest expense. The effect of the swap for the year ended December 31, 2009, including the gain on termination, was a decrease in interest expense of approximately $2.3 million. For the year ended December 31, 2008, the effect of the swap decreased interest expense by approximately $0.3 million and for the year ended December 31, 2007, the effect of the swap increased interest expense by approximately $0.5 million.
The swap hedged the Company’s exposure related to changes in interest rates on the fair value of the Company’s fixed rate debt. The swap was accounted for as a fair value hedge and has been determined to have no ineffectiveness as the critical terms of the swap were aligned with the hedged item. Any changes in the fair value of the swap were offset by an equal and opposite change in the fair value of the hedged item, therefore there was no net impact on reported earnings. Accordingly, the principal amount of the Senior Secured Notes subject to the interest rate swap was adjusted to fair value. The fair value of the swap agreement at December 31, 2008 was an asset of $1.9 million which is recorded in other assets in the balance sheet.
Asset retirement obligations – Asset retirement obligations are initially recorded at fair value and are capitalized as part of the cost of the related long-lived asset when sufficient information is available to estimate fair value. The capitalized costs are subsequently charged to depreciation expense over the estimated useful life of the related long-lived asset. The fair value of the obligation is determined by calculating the discounted value of expected future cash flows and accretion expense is recorded each month to ultimately increase this obligation to full value.
The Company recognizes asset retirement obligations for the removal and disposal of residues; dismantling of certain tanks required by governmental authorities; cleaning and dismantling costs for owned rail cars; and cleaning costs for leased rail cars and barges.
52
Table of Contents
Koppers Holdings Inc. 2009 Annual Report
The following table describes changes to the Company’s asset retirement obligation liabilities at December 31, 2009 and 2008:
| 2009 | 2008 | |||||||
| (Dollars in millions) | ||||||||
| Asset retirement obligation at beginning of year |
$ | 16.2 | $ | 20.6 | ||||
| Accretion expense |
1.2 | 1.6 | ||||||
| Revision in estimated cash flows |
0.6 | 0.6 | ||||||
| Cash expenditures |
(1.6 | ) | (6.3 | ) | ||||
| Currency translation |
0.2 | (0.3 | ) | |||||
| Asset retirement obligation at end of year |
$ | 16.6 | $ | 16.2 | ||||
Litigation & contingencies – Amounts associated with litigation and contingencies are accrued when management, after taking into consideration the facts and circumstances of each matter including any settlement offers, has determined that it is probable that a liability has been incurred and the amount of loss can be reasonably estimated.
Environmental liabilities – The Company accrues for remediation costs and penalties when the responsibility to remediate is probable and the amount of related cost is reasonably estimable. If only a range of potential liability can be estimated and no amount within the range is more probable than another, the accrual is recorded at the low end of that range. Remediation liabilities are discounted if the amount and timing of the cash disbursements are readily determinable.
Deferred revenue from extended product warranty liabilities – The Company defers revenues associated with extended product warranty liabilities based on historical loss experience and sales of extended warranties on certain products. The following table describes changes to the Company’s deferred revenue at December 31, 2009 and 2008:
| 2009 | 2008 | |||||||
| (Dollars in millions) | ||||||||
| Deferred revenue at beginning of year |
$ | 7.5 | $ | 8.2 | ||||
| Deferred revenue for sales of extended warranties |
0.3 | 0.5 | ||||||
| Revenue earned |
(1.1 | ) | (1.2 | ) | ||||
| Deferred revenue at end of year |
$ | 6.7 | $ | 7.5 | ||||
Stock-based compensation – The Company records compensation cost over the vesting period for share-based payments to employees at an amount equivalent to the grant date fair value of the stock award. No compensation cost is recognized for any stock awards that are forfeited in the event the recipient fails to meet the vesting requirements.
Reclassifications – Certain amounts in the prior years’ consolidated financial statements have been reclassified to conform to the current year presentation, including the reclassification of commitment fees on the revolving credit facility from selling, general and administrative expenses to interest expense of $0.6 million for the year ended December 31, 2008.
3. Accounting Changes
The Company adopted Statement of Financial Accounting Standard (“SFAS”) No. 141(R), Applying the Acquisition Method effective January 1, 2009. SFAS No. 141(R) is codified in ASC 805, Business Combinations. SFAS No. 141(R) provides guidance for the recognition of the fair values of the assets acquired upon initially obtaining control, including the elimination of the step acquisition model. SFAS No. 141(R) also requires the immediate expensing of acquisition costs in the period they are incurred.
The Company adopted SFAS No. 165, “Subsequent Events” (“SFAS 165”) effective June 30, 2009. SFAS 165 establishes the accounting for and disclosure of events that occur after the balance sheet date but before financial statements are issued or are available to be issued. SFAS 165 is codified in ASC 855, Subsequent Events. It requires the disclosure of the date through which an entity has evaluated subsequent events and the basis for that date, that is, whether that date represents the date the financial statements were issued or were available to be issued. The adoption of the standard did not have a significant impact on the Company’s results of operations, financial condition or liquidity.
53
Table of Contents
4. Potential Acquisition of Cindu Chemicals B.V.
Koppers Inc. signed a letter of intent in December 2009 to acquire 100 percent of the outstanding shares of Cindu Chemicals B.V. (“Cindu”). Cindu is a privately-owned joint venture of Cindu B.V. and Corus Staal B.V. The proposed transaction is subject to the negotiation and execution of a definitive purchase and sale agreement, certain regulatory approvals, consultation with Cindu’s Works Council, and other customary closing conditions. The Company will fund the acquisition primarily with cash upon completion which may occur in the first quarter of 2010.
Cindu operates a 140,000 metric ton tar distillation plant in Uithoorn, Netherlands and its operations are similar to those of other plants within the Carbon Materials and Chemicals segment. Primary products include carbon pitch, naphthalene, carbon black feedstock and certain specialty products and coatings.
5. Business Dispositions
Sale of Koppers Monessen Partners LP
On October 1, 2008, Koppers Inc. and a limited partner sold Koppers Monessen Partners LP (“Monessen”) to ArcelorMittal S.A. for cash of $160.0 million plus working capital of $10.0 million. Net cash proceeds, after deduction for the limited partner interest, taxes and transaction costs, were approximately $100 million. The Company recognized an after-tax gain of $85.9 million in 2008 and an after-tax loss of 0.3 million in 2009, the latter representing purchase price adjustments. Monessen is a metallurgical furnace coke facility that was 95 percent-owned by Koppers Inc. (which served as the general partner) and five percent-owned by a limited partner. Effective as of the end of the second quarter of 2008, Monessen was classified as a discontinued operation in the Company’s statement of operations and earnings per share. Monessen was part of the Carbon Materials & Chemicals business segment.
Sale of Koppers Arch
On July 5, 2007, the Company sold its 51 percent interest in Koppers Arch Investments Pty Limited and its subsidiaries (“Koppers Arch”) to Arch Chemicals Inc. for net cash proceeds of $14.3 million and recognized a gain from the sale, net of tax, of $6.7 million. Effective as of this date, Koppers Arch was classified as a discontinued operation in the Company’s statement of operations and earnings per share. Koppers Arch was part of the Carbon Materials & Chemicals business segment.
Net sales and operating profit from discontinued operations for the two years ended December 31, 2008 consist of the following amounts:
| Year Ended December 31, | ||||||
| 2008 | 2007 | |||||
| Net sales |
$ | 50.2 | $ | 99.4 | ||
| Operating profit |
1.4 | 6.8 | ||||
| Diluted earnings per common share: |
||||||
| Income from discontinued operations |
$ | 0.21 | $ | 0.42 | ||
| Gain on sale of Koppers Arch |
— | 0.32 | ||||
| Gain on sale of Monessen |
4.14 | — | ||||
| Earnings per common share – discontinued operations |
$ | 4.35 | $ | 0.74 | ||
Other Plant Closures and Due Diligence Costs
In December 2009, the Company announced the pending sale of its Gainesville wood treatment plant. This plant was part of the Company’s Railroad & Utility Products business.
In 2009, the Company expensed due diligence costs of $1.7 million related to the proposed acquisition of Cindu Chemicals BV. In 2007, the Company expensed due diligence costs of $6.8 million related to a potential acquisition which was not consummated. Both activities related to the Company’s Carbon Materials & Chemicals business and are charged to selling, general and administrative expenses.
54
Table of Contents
Koppers Holdings Inc. 2009 Annual Report
6. Earnings and Dividends per Common Share
The computation of basic earnings per common share for the periods presented is based upon the weighted average number of common shares outstanding during the periods. The computation of diluted earnings per common share includes the effect of nonvested nonqualified stock options and restricted stock units assuming such options and stock units were outstanding common shares at the beginning of the period. The effect of antidilutive securities is excluded from the computation of diluted earnings per common share. For this reason, nonqualified stock options that were not included in the computation of diluted earnings per share for the years ended December 31, 2009, 2008 and 2007 totaled 103,312 shares, 97,305 shares and 39,196 shares, respectively.
The following table sets forth the computation of basic and diluted earnings per common share:
| Year Ended December 31, | |||||||||
| 2009 | 2008 | 2007 | |||||||
| (Dollars in millions, except share amounts, in thousands, and per share amounts) | |||||||||
| Income from continuing operations |
$ | 21.7 | $ | 48.4 | $ | 50.5 | |||
| Less: Noncontrolling interests in continuing operations |
2.6 | 0.7 | $ | 2.7 | |||||
| Income from continuing operations attributable to Koppers |
$ | 19.1 | $ | 47.7 | $ | 47.8 | |||
| Weighted average common shares outstanding: |
|||||||||
| Basic |
20,446 | 20,651 | 20,768 | ||||||
| Effect of dilutive securities |
115 | 116 | 106 | ||||||
| Diluted |
20,561 | 20,767 | 20,874 | ||||||
| Earnings per common share – continuing operations: |
|||||||||
| Basic earnings per common share |
$ | 0.93 | $ | 2.31 | $ | 2.30 | |||
| Diluted earnings per common share |
0.92 | 2.30 | 2.29 | ||||||
On February 3, 2010, the board of directors declared a quarterly dividend of 22 cents per common share, payable on April 5, 2010 to shareholders of record as of February 16, 2010.
7. Stock-based Compensation
In December 2005, the Company’s board of directors and shareholders adopted the 2005 Long-Term Incentive Plan (the “LTIP”). The LTIP provides for the grant to eligible persons of stock options, stock appreciation rights, restricted stock, restricted stock units, performance shares, performance awards, dividend equivalents and other stock-based awards, which we refer to collectively as the awards.
Under the LTIP, the board of directors granted restricted stock units and performance stock units to certain employee participants (collectively, the “stock units”) in each of the last three years. With respect to the 2007 grant, the restricted stock units will vest ratably each year over a period of three years for most participants, assuming continued employment. With respect to the 2008 and 2009 grants, the restricted stock units will vest on the third anniversary of the grant date, assuming continued employment by the participant. The performance stock units granted in all years will vest upon the attainment of the applicable performance objective at the end of a three-year measurement period. The applicable performance objective is based upon a three-year cumulative value creation calculation commencing on the first day of each grant year. The number of performance stock units granted represents the target award and participants have the ability to earn between zero and 150 percent of the target award based upon actual performance. If minimum performance criteria are not achieved, no performance stock units will vest.
Dividends declared on the Company’s common stock during the restriction period of the stock units are credited at equivalent value as additional stock units and become payable as additional common shares upon vesting. In the event of termination of employment, other than retirement, death or disability, any nonvested stock units are forfeited, including additional stock units credited from dividends. In the event of termination of employment due to retirement, death or disability, pro-rata vesting of the stock units over the service period will result. There are special vesting provisions for the stock units related to a change in control.
55
Table of Contents
Restricted stock units were also granted under a 2004 Restricted Stock Unit Plan which vested ratably over five years. All restricted stock units issued under the 2004 Restricted Stock Unit Plan have vested by December 31, 2008.
Compensation expense for nonvested stock units is recorded over the vesting period based on the fair value at the date of grant. The fair value of stock units is the market price of the underlying common stock on the date of grant.
The following table shows a summary of the performance stock units as of December 31, 2009:
| Performance Period | Minimum Shares |
Target Shares |
Maximum Shares | |||
| 2007 – 2009 |
— | 65,140 | 97,710 | |||
| 2008 – 2010 |
— | 46,774 | 70,161 | |||
| 2009 – 2011 |
— | 141,732 | 212,598 | |||
The following table shows a summary of the status and activity of nonvested stock awards for the year ended December 31, 2009:
| Restricted Stock Units |
Performance Stock Units |
Total Stock Units |
Weighted Average Grant Date Fair Value per Unit | |||||||||
| Nonvested at January 1, 2009 |
48,700 | 112,907 | 161,607 | $ | 31.82 | |||||||
| Granted |
70,527 | 144,327 | 214,854 | $ | 15.26 | |||||||
| Credited from dividends |
659 | 1,499 | 2,158 | $ | 39.21 | |||||||
| Vested |
(5,769 | ) | — | (5,769 | ) | $ | 25.91 | |||||
| Forfeited |
(1,730 | ) | (2,595 | ) | (4,325 | ) | $ | 15.26 | ||||
| Nonvested at December 31, 2009 |
112,387 | 256,138 | 368,525 | $ | 22.50 | |||||||
Also under the LTIP, the Company awarded nonqualified stock options to certain employee participants which vest and become exercisable upon the completion of a three-year service period commencing on the third anniversary of the grant date. The stock options have a term of 10 years. There are special vesting provisions for the stock options related to a change in control.
In accordance with accounting standards, compensation expense for unvested stock options is recorded over the vesting period based on the fair value at the date of grant. The fair value of stock options on the date of grant is calculated using the Black-Scholes-Merton model and the assumptions listed below:
| February 2009 Grant | February 2008 Grant | May 2007 Grant | ||||||||||
| Grant date price per share of option award |
$ | 15.26 | $ | 39.99 | $ | 29.97 | ||||||
| Expected dividend yield per share |
2.50 | % | 2.00 | % | 2.50 | % | ||||||
| Expected life in years |
6.5 | 6.5 | 6.5 | |||||||||
| Expected volatility |
51.00 | % | 40.67 | % | 40.39 | % | ||||||
| Risk-free interest rate |
2.05 | % | 3.28 | % | 4.45 | % | ||||||
| Grant date fair value per share of option awards |
$ | 6.19 | $ | 14.79 | $ | 11.01 | ||||||
The dividend yield is based on the Company’s current and prospective dividend rate which calculates a continuous dividend yield based upon the market price of the underlying common stock. The expected life in years is based on the simplified method permitted under Securities and Exchange Commission Staff Accounting Bulletin No. 107 which calculates the average of the weighted vesting term and the contractual term of the option. This method was selected due to the lack of historical exercise data with respect to the Company. Expected volatility is based on the historical volatility of the Company’s common stock and the historical volatility of certain other similar public companies. The risk-free interest rate is based on U.S. Treasury bill rates for the expected life of the option.
56
Table of Contents
Koppers Holdings Inc. 2009 Annual Report
The following table shows a summary of the status and activity of stock options for the year ended December 31, 2009:
| Options | Weighted Average per Option |
Weighted Average (in years) |
Aggregate Intrinsic Value (in millions) | |||||||
| Outstanding at January 1, 2009 |
103,312 | $ | 34.40 | |||||||
| Granted |
142,704 | $ | 15.26 | |||||||
| Outstanding at December 31, 2009 |
246,016 | $ | 23.30 | 8.53 | $ | 2.2 | ||||
| Exercisable at December 31, 2009 |
— | $ | — | — | $ | — | ||||
Total stock-based compensation expense recognized for the three years ended December 31, 2009 is as follows:
| Year Ended December 31, | |||||||||
| 2009 | 2008 | 2007 | |||||||
| (Dollars in millions) | |||||||||
| Stock-based compensation expense recognized: |
|||||||||
| Selling, general and administrative expenses |
$ | 2.5 | $ | 3.7 | $ | 1.9 | |||
| Less related income tax benefit |
1.0 | 1.5 | 0.7 | ||||||
| Decrease in net income attributable to Koppers |
$ | 1.5 | $ | 2.2 | $ | 1.2 | |||
During 2009, the Company reversed $0.8 million of accrued stock-based compensation related to its performance stock unit awards that had been granted in 2008. Stock-based compensation for 2009, 2008 and 2007 includes 21,000 shares, 19,500 shares and 18,000 shares, respectively, issued under the LTIP to members of the board of directors in relation to annual director compensation. As of December 31, 2009, total future compensation expense related to non-vested stock-based compensation arrangements totaled $3.8 million and the weighted-average period over which this expense is expected to be recognized is approximately 22 months.
8. Income Taxes
Income Tax Provision
Components of the Company’s income tax provision are as follows:
| Years Ended December 31, | ||||||||||||
| 2009 | 2008 | 2007 | ||||||||||
| (Dollars in millions) | ||||||||||||
| Current: |
||||||||||||
| Federal |
$ | (21.1 | ) | $ | 13.2 | $ | 17.2 | |||||
| State |
0.1 | 0.8 | 0.3 | |||||||||
| Foreign |
11.9 | 16.9 | 11.5 | |||||||||
| Total current tax provision (benefit) |
(9.1 | ) | 30.9 | 29.0 | ||||||||
| Deferred: |
||||||||||||
| Federal |
22.7 | 11.8 | (0.1 | ) | ||||||||
| State |
(0.7 | ) | 0.6 | 0.8 | ||||||||
| Foreign |
0.9 | (1.7 | ) | (0.7 | ) | |||||||
| Total deferred tax provision |
22.9 | 10.7 | — | |||||||||
| Total income tax provision |
$ | 13.8 | $ | 41.6 | $ | 29.0 | ||||||
Income before income taxes for 2009, 2008 and 2007 included $42.4 million, $53.3 million and $37.1 million, respectively, from foreign operations.
57
Table of Contents
The provision for income taxes is reconciled with the federal statutory rate as follows:
| Years Ended December 31, | |||||||||
| 2009 | 2008 | 2007 | |||||||
| Federal income tax rate |
35.0 | % | 35.0 | % | 35.0 | % | |||
| State income taxes, net of federal tax benefit |
(1.2 | ) | 1.0 | 1.0 | |||||
| Taxes on foreign income |
5.2 | 10.1 | 1.9 | ||||||
| Domestic production activities deduction |
— | (1.2 | ) | (1.5 | ) | ||||
| Non-deductible fines and penalties |
1.1 | 0.8 | 0.7 | ||||||
| Deferred tax adjustments |
(0.9 | ) | — | (0.5 | ) | ||||
| Change in tax contingency reserves |
0.3 | 1.0 | 0.4 | ||||||
| Other |
(0.7 | ) | (0.5 | ) | (0.5 | ) | |||
| 38.8 | % | 46.2 | % | 36.5 | % | ||||
The Company has not provided any U.S. tax on undistributed earnings of foreign subsidiaries or joint ventures that are reinvested indefinitely. For the year ended December 31, 2008, the Company provided deferred tax on 2008 unremitted earnings of its European subsidiaries. In 2009, deferred taxes were not provided on unremitted European earnings. At December 31, 2009 consolidated retained earnings of the Company included approximately $65 million of undistributed earnings from these investments.
Koppers China Tax Holiday
As a result of being a Foreign Investment Enterprise in the manufacturing sector, the Company’s 60 percent-owned joint venture in China is entitled to an income tax holiday under which it is exempted from corporate income tax for its first two profit making years (after deducting losses incurred in previous years), and is entitled to a 50 percent reduction in the corporate tax for the succeeding three years. The effect of the tax holiday on net income attributable to Koppers for the years ended December 31, 2008 and 2007 was approximately $0.4 million and $0.6 million, respectively. The tax holiday expired on January 1, 2009.
Taxes Excluded from Net Income Attributable to Koppers
The amount of income tax provision (benefit) included in comprehensive income but excluded from net income attributable to Koppers relating to adjustments to reflect the unfunded status of employee post-retirement benefit plans is $2.4 million, $(19.6) million and $5.0 million for the years ended December 31, 2009, 2008 and 2007, respectively.
The amount of income tax benefit included in stockholders’ equity (deficit) but excluded from net income attributable to Koppers relating to the expense for restricted stock and employee stock options recognized differently for financial and tax reporting purposes was $0.8 million and $1.2 million for the years ended December 31, 2008 and 2007, respectively.
58
Table of Contents
Koppers Holdings Inc. 2009 Annual Report
Deferred Tax Assets and Liabilities
Deferred income taxes reflect the net tax effects of temporary differences between the carrying amounts of assets and liabilities for financial reporting purposes and the amounts used for income tax purposes.
Significant components of the Company’s deferred tax assets and liabilities are as follows:
| December 31, | ||||||||
| 2009 | 2008 | |||||||
| (Dollars in millions) | ||||||||
| Deferred tax assets: |
||||||||
| Pension and other postretirement benefits obligations |
$ | 31.0 | $ | 29.9 | ||||
| Reserves, including insurance, environmental and deferred revenue |
11.6 | 14.0 | ||||||
| Net operating loss benefit |
9.7 | 6.5 | ||||||
| Asset retirement obligations |
5.0 | 5.0 | ||||||
| Accrued employee compensation |
4.2 | 3.3 | ||||||
| Book/tax inventory accounting differences |
3.9 | 4.1 | ||||||
| Excess tax basis on Koppers Australia assets |
2.0 | 3.0 | ||||||
| Capital loss benefit |
2.0 | 2.0 | ||||||
| Accrued but unpaid interest |
— | 21.4 | ||||||
| Other |
3.2 | 2.0 | ||||||
| Valuation allowance |
(11.2 | ) | (8.2 | ) | ||||
| Total deferred tax assets |
61.4 | 83.0 | ||||||
| Deferred tax liabilities: |
||||||||
| Tax over book depreciation and amortization |
16.5 | 14.3 | ||||||
| Unremitted earnings of foreign subsidiaries |
6.4 | 6.2 | ||||||
| Other |
4.1 | 3.9 | ||||||
| Total deferred tax liabilities |
27.0 | 24.4 | ||||||
| Net deferred tax assets |
$ | 34.4 | $ | 58.6 | ||||
A valuation allowance is provided when it is more likely than not that some portion or all of the deferred tax assets will not be realized. At December 31, 2009, the Company has recorded a valuation allowance of $9.2 million for certain state net operating loss carryforwards anticipated to produce no tax benefit. Additionally, the Company has recorded a valuation allowance of $2.0 million for certain capital loss carryforwards expected to produce no benefit. The Company has a state net operating loss benefit of $9.7 million, which will expire from 2010 to 2029.
Uncertain Tax Positions
The Company or one of its subsidiaries files income tax returns in U.S. federal jurisdiction, individual U.S. state jurisdictions and non-U.S. jurisdictions. With few exceptions, the Company is no longer subject to U.S. federal, state and local, or non-U.S. income tax examinations by tax authorities for years before 2004.
As of December 31, 2009, the total amount of unrecognized tax benefits that, if recognized, would affect the effective tax rate, was approximately $3.3 million. A reconciliation of the beginning and ending amount of unrecognized tax benefits is as follows:
| December 31, | ||||||||||||
| 2009 | 2008 | 2007 | ||||||||||
| (Dollars in millions) | ||||||||||||
| Balance at beginning of year |
$ | 4.0 | $ | 2.7 | $ | 2.1 | ||||||
| Additions based on tax provisions related to the current year |
0.5 | 0.5 | 0.7 | |||||||||
| Additions for tax provisions of prior years |
— | 1.1 | 0.3 | |||||||||
| Reductions as a result of a lapse of the applicable statute of limitations |
(0.5 | ) | (0.3 | ) | (0.4 | ) | ||||||
| Balance at end of year |
$ | 4.0 | $ | 4.0 | $ | 2.7 | ||||||
59
Table of Contents
The Company recognizes interest expense and any related penalties from uncertain tax positions in income tax expense. For each year ended December 31, 2009, 2008 and 2007, the Company recognized $0.1 million, $0.3 million and $0.1 million, respectively, in interest and penalties. As of December 31, 2009 and 2008, the Company had accrued approximately $0.7 million and $0.7 million, respectively, for interest and penalties.
9. Segment Information
The Company has two reportable segments: Carbon Materials & Chemicals and Railroad & Utility Products. The Company’s reportable segments are business units that offer different products. The reportable segments are each managed separately because they manufacture and distribute distinct products with different production processes. The business units have been aggregated into two reportable segments since management believes the long-term financial performance of these business units is affected by similar economic conditions.
The Company’s Carbon Materials & Chemicals segment is primarily a supplier of carbon pitch, naphthalene, phthalic anhydride, creosote, carbon black feedstock and carbon black. Carbon pitch is a critical raw material used in the production of aluminum and for the production of steel in electric arc furnaces. Naphthalene is used for the production of phthalic anhydride and as a surfactant in the production of concrete. Phthalic anhydride is used in the production of plasticizers, polyester resins and alkyd paints. Creosote is used in the treatment of wood and carbon black feedstock is used in the production of carbon black. Carbon black is used primarily in the production of rubber tires.
The Company’s Railroad & Utility Products segment sells treated and untreated wood products and services primarily to the railroad and public utility markets. Railroad products include procuring and treating items such as crossties, switch ties and various types of lumber used for railroad bridges and crossings. Utility products include transmission and distribution poles and pilings.
The Company evaluates performance and determines resource allocations based on a number of factors, the primary measure being operating profit or loss from operations. Operating profit does not include equity in earnings of affiliates, other income, interest expense or income taxes. Operating profit also excludes the operating costs of Koppers Holdings Inc., the parent company of Koppers Inc. The accounting policies of the reportable segments are the same as those described in the summary of significant accounting policies. Intersegment transactions are eliminated in consolidation.
60
Table of Contents
Koppers Holdings Inc. 2009 Annual Report
Results of Segment Operations
| Year Ended December 31, | ||||||||||||
| 2009 | 2008 | 2007 | ||||||||||
| (Dollars in millions) | ||||||||||||
| Revenues from external customers: |
||||||||||||
| Carbon Materials & Chemicals |
$ | 655.2 | $ | 892.0 | $ | 776.1 | ||||||
| Railroad & Utility Products |
469.2 | 472.8 | 479.5 | |||||||||
| Total |
$ | 1,124.4 | $ | 1,364.8 | $ | 1,255.6 | ||||||
| Intersegment revenues: |
||||||||||||
| Carbon Materials & Chemicals |
$ | 91.5 | $ | 72.4 | $ | 63.3 | ||||||
| Depreciation & amortization: |
||||||||||||
| Carbon Materials & Chemicals |
$ | 17.5 | $ | 22.7 | $ | 22.6 | ||||||
| Railroad & Utility Products |
7.3 | 7.3 | 6.9 | |||||||||
| Corporate |
— | — | — | |||||||||
| Total |
$ | 24.8 | $ | 30.0 | $ | 29.5 | ||||||
| Operating profit: |
||||||||||||
| Carbon Materials & Chemicals |
$ | 58.5 | $ | 108.2 | $ | 84.3 | ||||||
| Railroad & Utility Products |
38.2 | 24.3 | 42.8 | |||||||||
| Corporate(a) |
(1.8 | ) | (2.3 | ) | (2.0 | ) | ||||||
| Total |
$ | 94.9 | $ | 130.2 | $ | 125.1 | ||||||
| Capital expenditures (including acquisitions): |
||||||||||||
| Carbon Materials & Chemicals(b) |
$ | 10.7 | $ | 24.3 | $ | 17.7 | ||||||
| Railroad & Utility Products |
8.5 | 13.8 | 9.2 | |||||||||
| Corporate |
1.0 | 1.5 | 0.4 | |||||||||
| Total |
$ | 20.2 | $ | 39.6 | $ | 27.3 | ||||||
| (a) | Operating loss for Corporate includes general and administrative costs for Koppers Holdings Inc, the parent company of Koppers Inc. |
| (b) | Excludes capital expenditures by Koppers Arch, a discontinued operation, of $0.1 million in 2007 and by Koppers Monessen, a discontinued operation, of $0.4 million and $1.0 million in 2008 and 2007, respectively. |
Assets and Goodwill by Segment
| December 31, | ||||||
| 2009 | 2008 | |||||
| (Dollars in millions) | ||||||
| Assets: |
||||||
| Carbon Materials & Chemicals |
$ | 402.2 | $ | 402.1 | ||
| Railroad & Utility Products |
141.3 | 152.0 | ||||
| Segment assets |
543.5 | 554.1 | ||||
| Cash & cash equivalents |
13.1 | 37.6 | ||||
| Income tax receivable |
37.1 | 4.4 | ||||
| Deferred taxes |
30.1 | 43.0 | ||||
| Deferred financing costs |
10.0 | 9.3 | ||||
| Deferred charges |
4.0 | 4.4 | ||||
| Other |
6.6 | 8.3 | ||||
| Total |
$ | 644.4 | $ | 661.1 | ||
| Goodwill: |
||||||
| Carbon Materials & Chemicals |
$ | 59.4 | $ | 56.6 | ||
| Railroad & Utility Products |
2.2 | 1.8 | ||||
| Total |
$ | 61.6 | $ | 58.4 | ||
61
Table of Contents
Revenues and Long-lived Assets by Geographic Area
| Year | Revenue | Long-lived assets | ||||||
| (Dollars in millions) | ||||||||
| United States |
2009 | $ | 649.1 | $ | 149.1 | |||
| 2008 | 723.6 | 153.6 | ||||||
| 2007 | 712.9 | |||||||
| Australasia |
2009 | $ | 239.4 | $ | 73.4 | |||
| 2008 | 261.8 | 63.9 | ||||||
| 2007 | 217.3 | |||||||
| Europe |
2009 | $ | 144.1 | $ | 14.9 | |||
| 2008 | 223.7 | 15.2 | ||||||
| 2007 | 203.0 | |||||||
| Other countries |
2009 | $ | 91.8 | $ | — | |||
| 2008 | 155.7 | — | ||||||
| 2007 | 122.4 | |||||||
| Total |
2009 | $ | 1,124.4 | $ | 237.4 | |||
| 2008 | 1,364.8 | 232.7 | ||||||
| 2007 | 1,255.6 | |||||||
Revenues by geographic area in the above table are attributed by the destination country of the sale. Revenues from foreign countries totaled $475.3 million in 2009, $641.2 million in 2008 and $542.7 million in 2007. Revenues from one customer of the Carbon Materials & Chemicals segment and one customer from the Railroad & Utility Products segment represented approximately 11 percent each of the Company’s consolidated revenues in 2009.
Segment Revenues for Significant Product Lines
| Year Ended December 31, | |||||||||
| 2009 | 2008 | 2007 | |||||||
| (Dollars in millions) | |||||||||
| Carbon Materials & Chemicals: |
|||||||||
| Carbon pitch |
$ | 302.9 | $ | 401.6 | $ | 360.3 | |||
| Creosote and carbon black feedstock |
76.3 | 119.1 | 87.2 | ||||||
| Phthalic anhydride |
67.3 | 101.6 | 102.2 | ||||||
| Naphthalene |
49.8 | 56.9 | 57.4 | ||||||
| Carbon black |
45.4 | 64.8 | 43.2 | ||||||
| Other products |
113.5 | 148.0 | 125.8 | ||||||
| 655.2 | 892.0 | 776.1 | |||||||
| Railroad & Utility Products: |
|||||||||
| Railroad crossties |
298.1 | 305.7 | 312.7 | ||||||
| Utility poles |
66.8 | 80.2 | 78.8 | ||||||
| Creosote |
60.6 | 42.4 | 45.6 | ||||||
| Other products |
43.7 | 44.5 | 42.4 | ||||||
| 469.2 | 472.8 | 479.5 | |||||||
| Total |
$ | 1,124.4 | $ | 1,364.8 | $ | 1,255.6 | |||
62
Table of Contents
Koppers Holdings Inc. 2009 Annual Report
10. Inventories
Inventories as of December 31, 2009 and 2008 were as follows:
| December 31, | ||||||
| 2009 | 2008 | |||||
| (Dollars in millions) | ||||||
| Raw materials |
$ | 94.3 | $ | 99.6 | ||
| Work in process |
8.3 | 13.6 | ||||
| Finished goods |
94.9 | 101.5 | ||||
| 197.5 | 214.7 | |||||
| Less revaluation to LIFO |
44.8 | 42.9 | ||||
| Net |
$ | 152.7 | $ | 171.8 | ||
For the year ended December 31, 2008 the Company recorded inventory lower of cost or market charges totaling $3.9 million. For the year ended December 31, 2009 and 2008, liquidations of LIFO inventories increased operating profit by $1.2 million and $0.1 million, respectively.
11. Equity Investments
The Company holds two investments in unconsolidated companies. KSA Limited Partnership is a 50 percent owned concrete crosstie operation located in Portsmouth, Ohio. Tangshan Koppers Kailuan Carbon Chemical Company Limited (“TKK”) commenced operation of a new tar distillation facility in the Hebei Province near the Jingtang Port. The Company holds a 30 percent investment in TKK. Equity in earnings (losses) and total dividends received for the three years ended December 31, 2009 were as follows:
| Equity Income (loss) | Dividends Received | ||||||
| (Dollars in millions) | |||||||
| 2009 |
$ | (1.5 | ) | $ | 0.5 | ||
| 2008 |
(0.6 | ) | 0.2 | ||||
| 2007 |
0.3 | 0.6 | |||||
12. Property, Plant and Equipment
Property, plant and equipment as of December 31, 2009 and 2008 were as follows:
| December 31, | ||||||
| 2009 | 2008 | |||||
| (Dollars in millions) | ||||||
| Land |
$ | 7.5 | $ | 6.3 | ||
| Buildings |
29.3 | 21.0 | ||||
| Machinery and equipment |
491.0 | 469.4 | ||||
| 527.8 | 496.7 | |||||
| Less accumulated depreciation |
378.5 | 351.9 | ||||
| Net |
$ | 149.3 | $ | 144.8 | ||
Depreciation expense for the years ended December 31, 2009, 2008 and 2007 amounted to $22.8 million, $29.1 million and $27.9 million, respectively. Included in depreciation expense for 2008 was an impairment charge of $3.7 million related to the CM&C segment’s glycerine refining plant in the United Kingdom. This impairment charge was incurred after the Company received a termination notice from its sole customer.
63
Table of Contents
13. Goodwill and Other Identifiable Intangible Assets
The change in the carrying amount of goodwill attributable to each business segment for the years ended December 31, 2009 and December 31, 2008 was as follows:
| Carbon Materials & Chemicals |
Railroad & Utility Products |
Total | ||||||||||
| (Dollars in millions) | ||||||||||||
| Balance at December 31, 2007 |
$ | 60.3 | $ | 2.2 | $ | 62.5 | ||||||
| Currency translation |
(3.7 | ) | (0.4 | ) | (4.1 | ) | ||||||
| Balance at December 31, 2008 |
56.6 | 1.8 | 58.4 | |||||||||
| Currency translation |
2.8 | 0.4 | 3.2 | |||||||||
| Balance at December 31, 2009 |
$ | 59.4 | $ | 2.2 | $ | 61.6 | ||||||
The Company’s identifiable intangible assets with finite lives are being amortized over their estimated useful lives and are summarized below:
| December 31, | ||||||||||||||||||
| 2009 | 2008 | |||||||||||||||||
| Gross Amount |
Accumulated Amortization |
Net | Gross Carrying Amount |
Accumulated Amortization |
Net | |||||||||||||
| (Dollars in millions) | ||||||||||||||||||
| Customer contracts |
$ | 9.6 | $ | 5.3 | $ | 4.3 | $ | 9.4 | $ | 4.3 | $ | 5.1 | ||||||
| Non-compete agreements |
1.2 | 1.2 | — | 1.1 | 1.1 | — | ||||||||||||
| Total |
$ | 10.8 | $ | 6.5 | $ | 4.3 | $ | 10.5 | $ | 5.4 | $ | 5.1 | ||||||
In 2009 and 2008, the gross carrying value of the Company’s intangible assets increased (decreased) by $0.3 million and $(1.3) million, respectively, due to foreign currency translation. The customer contracts have estimated useful lives of 10 years and the non-compete agreements have estimated useful lives of 3 years. Total amortization expense related to these identifiable intangible assets was $0.8 million, $0.9 million and $1.5 million for the years ended December 31, 2009, 2008 and 2007, respectively. Estimated amortization expense for the proceeding five years is summarized below:
| Estimated annual amortization | |||
| (Dollars in millions) | |||
| 2010 |
$ | 0.7 | |
| 2011 |
0.7 | ||
| 2012 |
0.7 | ||
| 2013 |
0.7 | ||
| 2014 |
0.7 | ||
64
Table of Contents
Koppers Holdings Inc. 2009 Annual Report
14. Debt
Debt at December 31, 2009 and December 31, 2008 was as follows:
| December 31, | |||||||||||
| Weighted Average Interest Rate |
Maturity | 2009 | 2008 | ||||||||
| (Dollars in millions, except interest rates) | |||||||||||
| Revolving Credit Facility |
2.49 | % | 2013 | $ | 40.0 | $ | — | ||||
| Senior Notes |
7 7/8 | % | 2019 | 295.0 | — | ||||||
| Senior Secured Notes |
— | % | — | — | 187.8 | ||||||
| Senior Discount Notes |
— | % | — | — | 186.6 | ||||||
| Other debt, including capital leases |
8 | % | Various | 0.3 | 0.5 | ||||||
| Total debt |
335.3 | 374.9 | |||||||||
| Less short-term debt and current maturities of long-term debt |
0.2 | 0.2 | |||||||||
| Long-term debt (excluding current portion) |
$ | 335.1 | $ | 374.7 | |||||||
Revolving Credit Facility
The Koppers Inc. revolving credit facility agreement provides for a revolving credit facility of up to $300.0 million at variable rates. Borrowings under the revolving credit facility are secured by a first priority lien on substantially all of Koppers Inc.’s assets. The credit facility contains certain covenants that limit capital expenditures by Koppers Inc. and restrict its ability to incur additional indebtedness, create liens on its assets, enter into leases, pay dividends and make investments or acquisitions. In addition, such covenants give rise to events of default upon the failure by Koppers Inc. to meet certain financial ratios. Commitment fees totaled $1.8 million in 2009 and $0.6 million in 2008 and are charged to interest expense.
As of December 31, 2009, the Company had $164.7 million of unused revolving credit availability for working capital purposes after restrictions from certain letter of credit commitments and other covenants. As of December 31, 2009, $12.3 million of commitments were utilized by outstanding letters of credit.
Senior Notes
The Koppers Inc. 7 7/8 percent Senior Notes due 2019 (the “Senior Notes”) were issued on December 1, 2009 at on offering price of 98.311 percent of face value, or $294.9 million and have a principal amount at maturity of $300.0 million. The Senior Notes have an effective interest rate yield of 8 1/8 percent per annum. The Senior Notes are unsecured senior obligations that are fully and unconditionally guaranteed by Koppers Holdings and certain of Koppers Inc.’s wholly-owned domestic subsidiaries. The Senior Notes are structurally subordinated to indebtedness under the revolving credit facility.
Interest on the Senior Notes is payable semiannually on December 1 and June 1 each year, starting on June 1, 2010. On or after December 1, 2014, the Company is entitled to redeem all or a portion of the Senior Notes at a redemption price of 103.938 percent of principal value, declining annually in ratable amounts until the redemption price is equivalent to the principal value on December 1, 2017.
The indenture governing the Senior Notes includes customary covenants that restrict, among other things, the ability of Koppers Inc. and its restricted subsidiaries to incur additional debt, pay dividends or make certain other restricted payments, incur liens, merge or sell all or substantially all of the assets of Koppers Inc. or its subsidiaries or enter into various transactions with affiliates.
Senior Secured Notes
All of the outstanding Koppers Inc. 9 7/8 percent Senior Secured Notes due 2013 (the “Senior Secured Notes”) were redeemed on October 15, 2009. The Senior Secured Notes were guaranteed, jointly and severally, on a senior secured basis by certain of the Company’s subsidiaries. The Senior Secured Notes were redeemed at a premium to principal value and accordingly, the
65
Table of Contents
Company realized a loss on extinguishment of debt totaling $9.2 million consisting of $6.1 million for bond premium and $3.1 million for the write-off of deferred financing costs.
In 2008, the Company repurchased Senior Secured Notes with a face value of $32.5 million. The Senior Secured Notes were repurchased at a discount to face value and accordingly, the Company realized a gain on extinguishment of debt totaling $1.4 million consisting of $2.1 million for bond discount partially offset by $0.7 million for the write-off of deferred financing costs.
The Company had a notional $50.0 million interest rate swap to convert a portion of the Senior Secured Notes from fixed-interest rate debt to floating-interest rate debt. On October 15, 2009 and concurrent with the redemption of the Senior Secured Notes, the swap was terminated which resulted in a gain of $1.6 million which was recorded in interest expense. The Senior Secured Notes subject to the notional amount of the interest rate swap is reflected at fair value at each balance sheet date. At December 31, 2008 the impact of the interest rate swap increased the carrying value of the Senior Secured Notes by $1.9 million.
Senior Discount Notes
All of the outstanding Koppers Holdings’ 9 7/8 percent Senior Discount Notes due 2014 (the “Senior Discount Notes”) were redeemed in December 2009 through a tender offer and call. The Senior Discount Notes had a principal amount $203.0 million. The Senior Discount Notes were redeemed at a premium to principal value and accordingly, the Company realized a loss on extinguishment of debt totaling $13.2 million consisting of $10.0 million for bond premium, $2.6 million for the write-off of deferred financing costs and $0.6 million for bond tender expenses.
Guarantees
The Company’s 60-percent owned subsidiary in China has issued a guarantee of $21.5 million in support of the Company’s 30-percent investment in Tangshan Koppers Kailuan Carbon Chemical Company Limited (“TKK”). The guarantee relates to bank debt incurred by TKK which matures in August 2011.
Debt Maturities and Deferred Financing Costs
At December 31, 2009 the aggregate debt maturities for the next five years are as follows:
| (Dollars in millions) | ||||
| 2010 |
$ | 0.2 | ||
| 2011 |
0.1 | |||
| 2012 |
— | |||
| 2013 |
40.0 | |||
| 2014 |
— | |||
| Thereafter |
300.0 | |||
| Total maturities |
340.3 | |||
| Future accretion on Senior Notes |
(5.0 | ) | ||
| Total debt |
$ | 335.3 | ||
Deferred financing costs associated with the credit facilities, the issuance of the Senior Notes and the other retired debt obligations totaled $10.8 million and $16.7 million at December 31, 2009 and 2008, respectively, and are being amortized over the life of the related debt. Unamortized deferred financing costs (net of accumulated amortization of $0.8 million and $7.4 million at December 31, 2009 and 2008, respectively) were $10.0 million and $9.3 million at December 31, 2009 and 2008, respectively, and are included in other assets.
66
Table of Contents
Koppers Holdings Inc. 2009 Annual Report
15. Leases
Future minimum commitments for operating leases having non-cancelable lease terms in excess of one year are as follows:
| (Dollars in millions) | |||
| 2010 |
$ | 38.8 | |
| 2011 |
27.6 | ||
| 2012 |
20.6 | ||
| 2013 |
11.7 | ||
| 2014 |
4.1 | ||
| Thereafter |
8.2 | ||
| Total |
$ | 111.0 | |
Operating lease expense for 2009, 2008 and 2007 was $41.5 million, $39.0 million and $31.1 million, respectively.
16. Pensions and Post-retirement Benefit Plans
The Company and its subsidiaries maintain a number of defined benefit and defined contribution plans to provide retirement benefits for employees in the U.S., as well as employees outside the U.S. These plans are maintained and contributions are made in accordance with the Employee Retirement Income Security Act of 1974 (“ERISA”), local statutory law or as determined by the board of directors. The defined benefit pension plans generally provide benefits based upon years of service and compensation. Pension plans are funded except for three domestic non-qualified defined benefit pension plans for certain key executives.
All qualified defined benefit pension plans for salaried employees have been closed to new participants. In addition, the Company’s U.S. qualified defined benefit plan for salaried employees and two of the non-qualified defined benefit plans were frozen effective December 31, 2006. Accordingly, the pension plans no longer accrue additional years of service or recognize future increases in compensation for benefit purposes. In addition, the Company has recently negotiated “soft” freezes with respect to a number of hourly defined benefit pension plans. Such negotiated agreements preclude new employees from entering the defined benefit pension plans.
The defined contribution plans generally provide retirement assets to employee participants based upon employer and employee contributions to the participant’s individual investment account. The Company also provides retiree medical insurance coverage to certain U.S. employees and a life insurance benefit to most U.S. employees. For salaried employees, these plans have been closed to new participants.
Expense related to our defined contribution plans totaled $2.5 million, $4.7 million and $3.6 million for the years ended December 31, 2009, 2008 and 2007, respectively.
Net periodic pension costs for 2009, 2008 and 2007 were as follows:
| December 31, | ||||||||||||||||||||||||
| Pension Benefits | Other Benefits | |||||||||||||||||||||||
| 2009 | 2008 | 2007 | 2009 | 2008 | 2007 | |||||||||||||||||||
| (Dollars in millions) | ||||||||||||||||||||||||
| Components of net periodic benefit cost: |
||||||||||||||||||||||||
| Service cost |
$ | 2.8 | $ | 3.1 | $ | 3.7 | $ | 0.2 | $ | 0.2 | $ | 0.2 | ||||||||||||
| Interest cost |
10.8 | 11.7 | 11.5 | 0.8 | 0.8 | 0.8 | ||||||||||||||||||
| Expected return on plan assets |
(8.5 | ) | (13.1 | ) | (13.6 | ) | — | — | — | |||||||||||||||
| Amortization of prior service cost |
0.2 | 0.2 | 0.2 | (0.3 | ) | (0.3 | ) | (0.3 | ) | |||||||||||||||
| Amortization of net loss |
6.3 | 0.8 | 2.0 | — | — | 0.1 | ||||||||||||||||||
| Amortization of transition asset |
(0.3 | ) | (0.4 | ) | (0.4 | ) | — | — | — | |||||||||||||||
| Settlements and curtailments |
— | 0.2 | (0.1 | ) | — | — | — | |||||||||||||||||
| Net periodic benefit cost |
$ | 11.3 | $ | 2.5 | $ | 3.3 | $ | 0.7 | $ | 0.7 | $ | 0.8 | ||||||||||||
67
Table of Contents
Net periodic pension cost (benefit) that is expected to be recognized from the amortization of prior service cost, net loss and transition asset is estimated to total $0.1 million, $4.8 million and $(0.3) million, respectively, for all plans in 2010.
The change in the funded status of the pension and postretirement plans as of December 31, 2009 and December 31, 2008 is as follows:
| December 31, | ||||||||||||||||
| Pension Benefits | Other Benefits | |||||||||||||||
| 2009 | 2008 | 2009 | 2008 | |||||||||||||
| (Dollars in millions) | ||||||||||||||||
| Change in benefit obligation: |
||||||||||||||||
| Benefit obligation at beginning of year |
$ | 176.9 | $ | 195.2 | $ | 13.6 | $ | 14.4 | ||||||||
| Service cost |
2.8 | 3.1 | 0.2 | 0.2 | ||||||||||||
| Interest cost |
10.8 | 11.7 | 0.8 | 0.8 | ||||||||||||
| Plan participants’ contributions |
0.2 | 0.3 | — | — | ||||||||||||
| Actuarial (gains) losses |
14.3 | (1.7 | ) | 0.3 | (0.5 | ) | ||||||||||
| Plan amendments |
— | 0.4 | — | — | ||||||||||||
| Settlements |
— | (3.5 | ) | — | — | |||||||||||
| Curtailments |
— | (3.8 | ) | — | — | |||||||||||
| Currency translation |
6.2 | (15.8 | ) | — | — | |||||||||||
| Benefits paid |
(9.3 | ) | (9.0 | ) | (1.3 | ) | (1.3 | ) | ||||||||
| Benefit obligation at end of year |
201.9 | 176.9 | 13.6 | 13.6 | ||||||||||||
| Change in plan assets: |
||||||||||||||||
| Fair value of plan assets at beginning of year |
113.4 | 182.5 | — | — | ||||||||||||
| Actual return on plan assets |
20.8 | (43.0 | ) | — | — | |||||||||||
| Employer contribution |
2.1 | 2.0 | 1.3 | 1.3 | ||||||||||||
| Plan participants’ contributions |
0.2 | 0.3 | — | — | ||||||||||||
| Settlements |
— | (5.4 | ) | — | — | |||||||||||
| Currency translation |
5.6 | (13.9 | ) | — | — | |||||||||||
| Benefits paid |
(9.3 | ) | (9.1 | ) | (1.3 | ) | (1.3 | ) | ||||||||
| Fair value of plan assets at end of year |
132.8 | 113.4 | — | — | ||||||||||||
| Funded status of the plan |
$ | (69.1 | ) | $ | (63.5 | ) | $ | (13.6 | ) | $ | (13.6 | ) | ||||
| Amounts recognized in the balance sheet consist of: |
||||||||||||||||
| Noncurrent assets |
$ | 0.9 | $ | — | $ | — | $ | — | ||||||||
| Current liabilities |
0.4 | 0.1 | 1.3 | 1.3 | ||||||||||||
| Noncurrent liabilities |
69.6 | 63.4 | 12.3 | 12.3 | ||||||||||||
| Pension plans with benefit obligations in excess of plan assets: |
||||||||||||||||
| Benefit obligation |
$ | 193.3 | $ | 176.9 | ||||||||||||
| Fair value of plan assets |
123.3 | 113.4 | ||||||||||||||
| Pension plans with accumulated benefit obligations in excess of plan assets: |
||||||||||||||||
| Accumulated benefit obligation |
$ | 185.4 | $ | 164.1 | ||||||||||||
| Fair value of plan assets |
123.3 | 107.5 | ||||||||||||||
The measurement date for the U.S., Australian and United Kingdom pension and postretirement assets and obligations is December 31 for each respective year.
The accumulated benefit obligation for all defined benefit pension plans as of December 31, 2009 and 2008 was $193.9 million and $169.7 million, respectively.
68
Table of Contents
Koppers Holdings Inc. 2009 Annual Report
Expected Contributions for the 2010 Fiscal Year
The expected contributions by the Company for 2010 are estimated to be $4.8 million for pension plans and $1.3 million for other benefit plans.
Projected Benefit Payments
Benefit payments for pension benefits, which are primarily funded by the pension plan assets, and other benefits, which are funded by general corporate assets and reflecting future expected service as appropriate, are expected to be paid as follows:
| Pension Benefits | Other Benefits | |||||
| (Dollars in millions) | ||||||
| 2010 |
$ | 17.0 | $ | 1.3 | ||
| 2011 |
16.9 | 1.2 | ||||
| 2012 |
17.5 | 1.2 | ||||
| 2013 |
17.8 | 1.1 | ||||
| 2014 |
19.2 | 1.0 | ||||
| 2015 – 2019 |
106.1 | 5.5 | ||||
Weighted-Average Assumptions as of December 31
| December 31, | ||||||||||||
| Pension Benefits | Other Benefits | |||||||||||
| 2009 | 2008 | 2009 | 2008 | |||||||||
| Discount rate |
5.89 | % | 6.16 | % | 5.74 | % | 6.26 | % | ||||
| Expected return on plan assets |
7.62 | 7.82 | ||||||||||
| Rate of compensation increase |
3.15 | 3.16 | ||||||||||
| Initial medical trend rate |
8.20 | 10.00 | ||||||||||
Basis for the Selection of the Long-Term Rate of Return on Assets
The long-term rate of return on assets assumption was determined by using the plan’s asset allocation as described in the plan’s investment policy and modeling a distribution of compound average returns over a 20-year time horizon. The model uses asset class return, variance, and correlation assumptions to produce the expected return. The return assumptions used forward looking gross returns influenced by the current bond yields, corporate bond spreads and equity risk premiums based on current market conditions.
In general, the long-term rate of return is the sum of the portion of total assets in each asset class multiplied by the expected return for that class, adjusted for expected expenses to be paid from the assets. To develop the expected long-term rate of return on assets assumption, the Company considered the historical returns and the future expectations for returns for each asset class, as well as the target asset allocation of the pension portfolio. This resulted in the selection of the 7.62 percent long-term rate of return on assets assumption.
Investment Strategy
The weighted average asset allocation for the Company’s pension plans at December 31 by asset category is as follows:
| December 31, | ||||||
| 2009 | 2008 | |||||
| Equity securities |
69 | % | 65 | % | ||
| Debt securities |
27 | 32 | ||||
| Other |
4 | 3 | ||||
| 100 | % | 100 | % | |||
69
Table of Contents
The Company’s investment strategy for its pension plans is to maintain an adequate level of diversification, to reduce interest rate and market risk and to provide adequate liquidity to meet immediate and future benefit payment requirements. The Company’s overall investment strategy is to achieve a mix of growth seeking assets, principally U.S. and international public company equity securities and income generating assets, principally debt securities, real estate and cash. Currently, the Company targets an allocation of 50 percent to 75 percent growth seeking assets and 25 percent to 50 percent income generating assets. The Company utilizes investment managers to assist in identifying and monitoring investments that meet these allocation criteria.
The investment valuation policy of the Company is to value investments at fair value. Most of our assets are invested in pooled or commingled investment vehicles. The Company’s interest in these investment vehicles is expressed as a unit of account with a value per unit that is the result of the accumulated values of the underlying investments. Equity securities are typically priced on a daily basis using the closing market price from the exchange the security is traded. Debt securities are typically priced on a daily basis by independent pricing services. The fair value of real estate investments are either priced through a listing on an exchange or are subject to periodic appraisals.
The pension assets are all substantially held in pooled or commingled investment vehicles. The following table sets forth by level, the Company’s pension plan assets at fair value, within the fair value hierarchy, as of December 31, 2009:
| As of December 31, 2009 | ||||||||||||
| Quoted prices (Level 1) |
Significant (Level 2) |
Significant (Level 3) |
Total | |||||||||
| (Dollars in millions) | ||||||||||||
| U.S. equity securities |
$ | — | $ | 64.0 | $ | — | $ | 64.0 | ||||
| International equity securities |
— | 27.4 | — | 27.4 | ||||||||
| U.S. debt securities |
— | 17.8 | — | 17.8 | ||||||||
| International debt securities |
— | 17.7 | — | 17.7 | ||||||||
| Real estate and other investments |
— | 2.1 | — | 2.1 | ||||||||
| Cash and cash equivalents |
— | 3.8 | — | 3.8 | ||||||||
| $ | — | $ | 132.8 | $ | — | $ | 132.8 | |||||
Health Care Cost Trend Rates
The 2009 initial health care cost trend rate is assumed to be ten percent and is assumed to decrease gradually to five percent in 2014 and remain at that level thereafter. The assumed health care cost trend rate has a significant effect on the amounts reported for other postretirement benefit liability. A one-percentage-point change in the assumed health care cost trend rate would have the following effects:
| 1% Increase | 1% Decrease | ||||||
| (Dollars in millions) | |||||||
| Increase (decrease) from change in health care cost trend rates: |
|||||||
| Postretirement benefit expense |
$ | — | $ | — | |||
| Postretirement benefit liability |
0.5 | (0.4 | ) | ||||
Incentive Plan
The Company has short-term management incentive plans that pay cash bonuses if certain Company performance and individual goals are met. The charge to operating expense for these plans was $4.5 million in 2009, $4.7 million in 2008 and $6.7 million in 2007.
70
Table of Contents
Koppers Holdings Inc. 2009 Annual Report
17. Common Stock and Senior Convertible Preferred Stock
Changes in senior convertible preferred stock, common stock and treasury stock for the three years ended December 31, 2009 are as follows:
| Year Ended December 31, | |||||||||
| 2009 | 2008 | 2007 | |||||||
| (Shares in thousands) | |||||||||
| Senior Convertible Preferred Stock: |
|||||||||
| Balance at beginning and end of year |
— | — | — | ||||||
| Common Stock: |
|||||||||
| Balance at beginning of year |
21,097 | 20,971 | 20,850 | ||||||
| Issued for employee stock plans |
27 | 126 | 121 | ||||||
| Balance at end of year |
21,124 | 21,097 | 20,971 | ||||||
| Treasury Stock: |
|||||||||
| Balance at beginning of year |
(669 | ) | (145 | ) | (120 | ) | |||
| Shares repurchased |
— | (524 | ) | (25 | ) | ||||
| Balance at end of year |
(669 | ) | (669 | ) | (145 | ) | |||
Common Stock
In February 2008, the board of directors approved a $75.0 million common stock repurchase program which expires in February 2010. During 2008, the Company repurchased $20.7 million of common stock under the program. There were no repurchases under the program in 2009.
18. Fair Value of Financial Instruments
Carrying amounts and the related estimated fair values of the Company’s financial instruments as of December 31, 2009 and 2008 are as follows:
| December 31, 2009 | December 31, 2008 | |||||||||||
| Fair Value | Carrying Value |
Fair Value | Carrying Value | |||||||||
| (Dollars in millions) | ||||||||||||
| Financial assets: |
||||||||||||
| Cash and cash equivalents, including restricted cash |
$ | 58.4 | $ | 58.4 | $ | 67.3 | $ | 67.3 | ||||
| Short-term investments |
4.4 | 4.4 | 1.7 | 1.7 | ||||||||
| Investments and other assets(a) |
1.3 | 1.3 | 3.2 | 3.2 | ||||||||
| Financial liabilities: |
||||||||||||
| Long-term debt (including current portion) |
$ | 344.8 | $ | 335.3 | $ | 325.4 | $ | 374.9 | ||||
| (a) | Excludes equity method investments. |
Cash and short-term investments – The carrying amount approximates fair value because of the short maturity of those instruments.
Investments and other assets – Represents the broker-quoted cash surrender value on life insurance policies and, in 2008, the interest rate swap fair value adjustment. This interest rate swap is further described in Note 2. The cash surrender value asset is classified as Level 2 in the valuation hierarchy and is measured from values received from the insuring entity.
Long-term debt – For 2009, the fair value of the Company’s long-term debt is estimated based on the market prices for the same or similar issues or on the current rates offered to the Company for debt of the same remaining maturities (Level 2). For 2008, the fair value of long-term debt is estimated based upon quoted market prices (Level 1). The fair values of the revolving credit facility approximate carrying value due to the variable rate nature of these instruments.
71
Table of Contents
19. Commitments and Contingent Liabilities
Koppers Inc. and its subsidiaries are involved in litigation and various proceedings relating to environmental laws and regulations and toxic tort, product liability and other matters. Certain of these matters are discussed below. The ultimate resolution of these contingencies is subject to significant uncertainty and should the company fail to prevail in any of these legal matters or should several of these legal matters be resolved against the Company in the same reporting period, these legal matters could, individually or in the aggregate, be material to the consolidated financial statements.
Legal Proceedings
Coal Tar Pitch Cases. Koppers Inc., along with other defendants, is currently a defendant in lawsuits filed in a variety of states in which the plaintiffs claim they suffered a variety of illnesses (including cancer) as a result of exposure to coal tar pitch sold by the defendants. There are 112 plaintiffs in 62 cases pending as of December 31, 2009 as compared to 99 plaintiffs in 55 cases at December 31, 2008. As of December 31, 2009, there are a total of 56 cases pending in state court in Pennsylvania, one case each pending in state courts in Tennessee, Washington and Illinois, two cases pending in an Indiana state court and one case pending in the United States District Court for the District of Oregon.
The plaintiffs in all 62 pending cases seek to recover compensatory damages, while plaintiffs in 50 cases also seek to recover punitive damages. The plaintiffs in the 56 cases filed in Pennsylvania state court seek unspecified damages in excess of the court’s minimum jurisdictional limit. The plaintiffs in the two cases filed in Indiana state court and the one case filed in Washington state court also seek damages in an unspecified amount. The plaintiff in the Oregon case seeks damages in excess of $1.8 million. The plaintiffs in the Tennessee state court case each seek damages of $15.0 million. The plaintiff in the Illinois state court case seeks compensatory damages in excess of $50,000.
The other defendants in these lawsuits vary from case to case and include companies such as Beazer East, Inc., United States Steel Corporation, Honeywell International Inc., Vertellus Specialties Inc., Dow Chemical Company, Rust-Oleum Corporation, UCAR Carbon Company, Inc., Exxon Mobil Corporation, Chemtura Corporation, SGL Carbon Corporation, Alcoa, Inc., and PPG Industries, Inc. Discovery is proceeding in these cases. The Company has not provided a reserve for these lawsuits because, at this time, the Company cannot reasonably determine the probability of a loss, and the amount of loss, if any, cannot be reasonably estimated. The timing of resolution of these cases cannot be reasonably determined. Although Koppers Inc. is vigorously defending these cases, an unfavorable resolution of these matters may have a material adverse effect on the Company’s business, financial condition, cash flows and results of operations. No trial dates have been set in any of these cases.
Somerville Cases. Koppers Inc. is currently defending five sets of state court cases in Texas (Antu, Baade, Davis, Hensen and Moses) involving approximately 160 plaintiffs who allegedly have worked or resided in Somerville, Texas, where Koppers Inc. has operated a wood treatment plant since 1995. Koppers Inc. has been named, but not served, as a defendant in another Texas state court case (Asselin) involving 11 plaintiffs who allegedly worked or resided in Somerville, Texas. These cases are pending in Burleson County, Texas, and Tarrant County, Texas. In addition to those Texas state court cases, Koppers Inc. is defending one case (Gonzalez) that is pending in the Circuit Court of Cook County, Illinois. The Gonzalez case initially involved 28 plaintiffs who allegedly worked or resided in Somerville, Texas. The court has dismissed 22 of the Gonzalez plaintiffs’ claims, but those plaintiffs have since filed a motion to reconsider that ruling. The court has not yet ruled on plaintiffs’ motion to reconsider. In addition, as a result of the filing of a demand for bill of particulars by Koppers Inc., the court has stricken the complaint of the remaining eight plaintiffs and ordered them to file an amended complaint.
The BNSF Railway Company (“BNSF”) has also been named as a defendant in these cases. The complaints allege that plaintiffs have suffered personal injuries (including death, in some cases) resulting from exposure to wood preservative chemicals used at the Somerville, Texas wood treatment plant. The complaints in the Moses, Davis and Asselin cases additionally allege that plaintiffs have suffered property damage.
The complaints seek to recover various damages for each plaintiff, including compensatory and punitive damages within the jurisdictional limits of the court for, among other things, bodily injuries, pain and mental anguish, emotional distress, medical monitoring, medical expenses, diminished earning capacity, permanent disability, physical impairment and/or disfigurement, loss of companionship and society, loss of consortium, devaluation of property, loss of use and enjoyment of personal property, loss of use and enjoyment of real property, property damage, property remediation costs, funeral and burial expenses and lost wages.
72
Table of Contents
Koppers Holdings Inc. 2009 Annual Report
There are a total of 44 plaintiffs (six of whom have claims pending against only the BNSF) in the Moses cases. There are a total of ten plaintiffs in the Antu case, four of whom have claims pending against only the BNSF. The Hensen case identifies a total of 93 plaintiffs, one of whom has a claim pending against only the BNSF. The Davis case involves one plaintiff. There are a total of 25 plaintiffs in the Baade case.
In addition to the cases pending in state court, Koppers Inc. is currently defending one case that is pending on appeal in the United States Court of Appeals for the Fifth Circuit. That case, Bullard, involves a total of 146 plaintiffs who seek compensatory damages in an unspecified amount in excess of the court’s minimum jurisdictional limit for alleged personal injuries. Of the plaintiffs in the Bullard case, 77 are also plaintiffs in Hensen, and 22 are plaintiffs in Gonzalez whose claims have been dismissed. The BNSF is also a named defendant in the Bullard case, along with three additional defendants. Oral argument before the United States Court of Appeal for the Fifth Circuit occurred in November 2009 and the court has not yet issued its ruling.
The Company has not provided a reserve for these matters because, at this time, it cannot reasonably determine the probability of a loss, and the amount of loss, if any, cannot be reasonably estimated. The timing of resolution of these cases cannot be reasonably determined. Although Koppers Inc. is vigorously defending these cases, an unfavorable resolution of these matters may have a material adverse effect on the Company’s business, financial condition, cash flows and results of operations. No trial dates have been set in any of these cases.
Grenada – All Cases. Koppers Inc., together with various co-defendants (including Beazer East), has been named as a defendant in toxic tort lawsuits in federal court in Mississippi (see “Grenada – Federal Court Cases” below) and in state court in Mississippi (see “Grenada – State Court Cases” below) arising from the operation of the Grenada facility. The complaints allege that plaintiffs were exposed to harmful levels of various toxic chemicals, including creosote, pentachlorophenol, polycyclic aromatic hydrocarbons and dioxin, as a result of soil, surface water and groundwater contamination and air emissions from the Grenada facility and, in some cases, from an adjacent manufacturing facility operated by Heatcraft, Inc. Based on the experience of Koppers Inc. in defending previous toxic tort cases, the Company does not believe that the damages sought by the plaintiffs in the state and federal court cases are supported by the facts of the cases. The Company has not provided a reserve for these lawsuits because, at this time, it cannot reasonably determine the probability of a loss, and the amount of loss, if any, cannot be reasonably estimated. The timing of resolution of these cases cannot be reasonably determined. Although Koppers Inc. is vigorously defending these cases, an unfavorable resolution of these matters may have a material adverse effect on the Company’s business, financial condition, cash flows and results of operations. See “Environmental and Other Liabilities Retained or Assumed by Others” for additional information.
Grenada – Federal Court Cases.
Beck Case – The complaint in this case was originally filed by approximately 110 plaintiffs. Pursuant to an order granting defendants’ motion to sever, the court dismissed the claims of 98 plaintiffs in the Beck case without prejudice to their right to re-file their complaints. In December 2005, 94 of the 98 plaintiffs in the Beck case whose claims were dismissed re-filed their complaints. The plaintiffs in the 94 cases that were re-filed seek compensatory damages from the defendants of at least $5.0 million for each of eight counts and punitive damages of at least $10.0 million for each of three counts (in addition to damages in an unspecified amount for alleged trespass and nuisance). No discovery orders have been issued with respect to the 94 additional cases. The claims of ten of the 12 plaintiffs whose claims were not dismissed are still pending. The ten remaining plaintiffs seek compensatory damages from the defendants in an unspecified amount and punitive damages of $20.0 million for each of four counts.
The first of these trials commenced in April 2006, and the jury returned a verdict against Koppers Inc. for compensatory damages of 20 percent of $785,000 (after reduction by the court) and no liability for punitive damages. Koppers Inc. appealed the judgment entered against it to the United States Court of Appeals for the Fifth Circuit which granted a reversal of the district court’s judgment in June 2008. The second of these twelve cases was scheduled to go to trial on February 1, 2010. On December 11, 2009 and January 20, 2010, the trial court granted summary judgment in favor of Koppers Inc. on all claims for the second trial plaintiff. The trial dates for the remaining ten cases have not yet been scheduled, and the timing of the resolution of these cases is not known at this time. In February 2009, Koppers Inc. filed a petition with the United States Court of Appeals for the Fifth Circuit asking it to transfer the future trials of the Beck federal cases from Greenville, Mississippi to Oxford, Mississippi, where plaintiffs originally filed suit. In April 2009, a three judge panel of the Fifth Circuit granted the
73
Table of Contents
petition to transfer the trials to Oxford. The plaintiff’s motion for a rehearing en banc was denied in October 2009. On January 5, 2010, plaintiffs filed a petition for a writ of certiorari with the United States Supreme Court and on February 8, 2010, Koppers Inc. filed its brief in opposition.
Ellis Case – There are approximately 1,180 plaintiffs in this case. Each plaintiff seeks compensatory damages from the defendants of at least $5.0 million for each of seven counts and punitive damages of at least $10.0 million for each of three counts (in addition to damages for an unspecified amount for trespass and nuisance). The Ellis complaint also requests injunctive relief. These cases have been stayed and no trial dates have been scheduled pending the completion of the trials for the remaining 11 plaintiffs in the Beck case. The timing of the resolution of these cases is not known at this time.
Grenada – State Court Cases. The state court cases were brought on behalf of approximately 200 plaintiffs in five counties in Mississippi. Each plaintiff seeks compensatory damages from the defendants of at least $5.0 million for each of up to eight counts and punitive damages of at least $10.0 million for each of three counts. Certain plaintiffs also seek damages for alleged trespass and private nuisance in unspecified amounts together with injunctive relief. The Mississippi Supreme Court ordered that the claims of the plaintiffs in the pending state court cases filed in counties other than Grenada County (approximately 110 cases) be severed and transferred to Grenada County. Plaintiffs’ counsel attempted to transfer ten such cases to Grenada County but all ten cases were dismissed by the Court in Grenada County. Plaintiffs’ counsel has not attempted to transfer any additional cases to Grenada County and defendants have filed motions to dismiss the remaining plaintiffs in the four non-Grenada County cases, which motions remain pending. No trial dates have been scheduled in these cases. The timing of the resolution of these cases is not known at this time.
With respect to the state court case that was originally filed in Grenada County, the plaintiffs filed 104 individual complaints in Grenada County. Subsequently 46 of the cases were dismissed for various procedural reasons, and summary judgments based on the Mississippi statute of limitations were entered in 40 of the cases. Plaintiffs appealed the summary judgment orders to the Mississippi Supreme Court, which has not yet ruled on the appeals. Oral argument is scheduled before the Mississippi Supreme Court for March 8, 2010. In the remaining 18 cases, on September 1, 2009, the Circuit Court granted the Company’s motions to dismiss or, in the alternative, for summary judgment, and subsequently denied the plaintiffs’ motion for reconsideration on October 5, 2009. Plaintiffs have also filed notices of appeal to the Mississippi Supreme Court in these 18 cases. Oral argument has not yet been scheduled for these cases. One other case, the Harlow case, remains pending in Grenada County. In Harlow, the plaintiff is seeking actual and compensatory damages in excess of $20.0 million and punitive damages in an unspecified amount. Discovery is proceeding in that case. The timing of the resolution of the two appeals and the Harlow case is not known at this time.
Discontinued Operations. The Company sold its 51 percent interest in Koppers Arch Investments Pty Limited and its subsidiaries (“Koppers Arch”) in July 2007 to Arch Chemicals, Inc. and has provided an indemnity to Arch Chemicals for the Company’s share of liabilities, if any, arising from certain types of obligations and claims that arose prior to the Company’s sale of its interest in Koppers Arch. Koppers Inc. has received a notice from Arch Chemicals relating to legal actions that have been filed in the High Court of New Zealand Auckland Registry against a third party and against Arch Wood Protection (NZ) Limited by a competitor of Arch Wood Protection (NZ) Limited. The competitor/plaintiff alleges, among other things, claims of defamation, injurious falsehood, conspiracy and violation of the New Zealand Fair Trading Act. Reserving all rights, Koppers has agreed to participate in the payment of attorneys’ fees and related expenses relating to these matters until further notice. The plaintiff seeks damages of approximately $6 million. The Company has not provided a reserve for these matters because, at this time, it cannot reasonably determine the probability of a loss, and the amount of loss, if any, cannot be reasonably estimated. The timing of resolution of these cases cannot be reasonably determined. An unfavorable resolution of these matters may have a material adverse effect on the Company’s business, financial condition, cash flows and results of operations.
74
Table of Contents
Koppers Holdings Inc. 2009 Annual Report
Legal Reserves Rollforward. The following table reflects changes in the accrued liability for legal proceedings:
| Year Ended December 31, | |||||||
| 2009 | 2008 | ||||||
| (Dollars in millions) | |||||||
| Balance at beginning of year |
$ | — | $ | 0.4 | |||
| Reversal of reserves |
— | (0.3 | ) | ||||
| Cash expenditures |
— | (0.2 | ) | ||||
| Currency translation |
— | 0.1 | |||||
| Balance at end of year |
$ | — | $ | — | |||
Reversal of reserves in 2008 primarily relates to the reversal of the Grenada federal court verdict that was reversed by an appeals court.
Environmental and Other Litigation Matters
The Company and its subsidiaries are subject to federal, state, local and foreign laws and regulations and potential liabilities relating to the protection of the environment and human health and safety including, among other things, the cleanup of contaminated sites, the treatment, storage and disposal of wastes, the discharge of effluent into waterways, the emission of substances into the air and various health and safety matters. The Company’s subsidiaries expect to incur substantial costs for ongoing compliance with such laws and regulations. The Company’s subsidiaries may also face governmental or third-party claims, or otherwise incur costs, relating to cleanup of, or for injuries resulting from, contamination at sites associated with past and present operations. The Company accrues for environmental liabilities when a determination can be made that they are probable and reasonably estimable.
Environmental and Other Liabilities Retained or Assumed by Others. The Company’s subsidiaries have agreements with former owners of certain of their operating locations under which the former owners retained, assumed and/or agreed to indemnify such subsidiaries against certain environmental and other liabilities. The most significant of these agreements was entered into at Koppers Inc.’s formation on December 29, 1988 (the “Acquisition”). Under the related asset purchase agreement between Koppers Inc. and Beazer East, subject to certain limitations, Beazer East retained the responsibility for and agreed to indemnify Koppers Inc. against certain liabilities, damages, losses and costs, including, with certain limited exceptions, liabilities under and costs to comply with environmental laws to the extent attributable to acts or omissions occurring prior to the Acquisition and liabilities related to products sold by Beazer East prior to the Acquisition (the “Indemnity”). Beazer Limited, the parent company of Beazer East, unconditionally guaranteed Beazer East’s performance of the Indemnity pursuant to a guarantee (the “Guarantee”). In 1998, the parent company of Beazer East purchased an insurance policy under which the funding and risk of certain environmental and other liabilities relating to the former Koppers Company, Inc. operations of Beazer East (which includes locations purchased from Beazer East by Koppers Inc.) are underwritten by Centre Solutions (a member of the Zurich Group) and Swiss Re. Beazer East is a wholly-owned indirect subsidiary of Heidelberg Cement AG. The Indemnity provides different mechanisms, subject to certain limitations, by which Beazer East is obligated to indemnify Koppers Inc. with regard to certain environmental, product and other liabilities and imposes certain conditions on Koppers Inc. before receiving such indemnification, including, in some cases, certain limitations regarding the time period as to which claims for indemnification can be brought. In July 2004, Koppers Inc. and Beazer East agreed to amend the environmental indemnification provisions of the December 29, 1988 asset purchase agreement to extend the indemnification period for pre-closing environmental liabilities through July 2019. As consideration for the amendment, Koppers Inc. paid Beazer East a total of $7.0 million and agreed to share toxic tort litigation defense costs arising from any sites acquired from Beazer East. The July 2004 amendment did not change the provisions of the Indemnity with respect to indemnification for non-environmental claims, such as product liability claims, which claims may continue to be asserted after July 2019.
Qualified expenditures under the Indemnity are not subject to a monetary limit. Qualified expenditures under the Indemnity include (i) environmental cleanup liabilities required by third parties, such as investigation, remediation and closure costs, relating to pre-December 29, 1988, or Pre-Closing, acts or omissions of Beazer East or its predecessors; (ii) environmental claims by third parties for personal injuries, property damages and natural resources damages relating to Pre-Closing acts or omissions of Beazer East or its predecessors; (iii) punitive damages for the acts or omissions of Beazer East and its predecessors without
75
Table of Contents
regard to the date of the alleged conduct and (iv) product liability claims for products sold by Beazer East or its predecessors without regard to the date of the alleged conduct. If the third party claims described in sections (i) and (ii) above are not made by July 2019, Beazer East will not be required to pay the costs arising from such claims under the Indemnity. However, with respect to any such claims which are made by July 2019, Beazer East will continue to be responsible for such claims under the Indemnity beyond July 2019. The Indemnity provides for the resolution of issues between Koppers Inc. and Beazer East by an arbitrator on an expedited basis upon the request of either party. The arbitrator could be asked, among other things, to make a determination regarding the allocation of environmental responsibilities between Koppers Inc. and Beazer East. Arbitration decisions under the Indemnity are final and binding on the parties.
Contamination has been identified at most manufacturing and other sites of the Company’s subisidiaries. Three sites currently owned and operated by Koppers Inc. in the United States are listed on the National Priorities List promulgated under the Comprehensive Environmental Response, Compensation, and Liability Act of 1980, as amended (“CERCLA”). Currently, at the properties acquired from Beazer East (which include all of the National Priorities List sites and all but one of the sites permitted under the Resource Conservation and Recovery Act (“RCRA”)), a significant portion of all investigative, cleanup and closure activities are being conducted and paid for by Beazer East pursuant to the terms of the Indemnity. In addition, other of Koppers Inc.’s sites are or have been operated under RCRA and various other environmental permits, and remedial and closure activities are being conducted at some of these sites.
To date, the parties that retained, assumed and/or agreed to indemnify the Company against the liabilities referred to above, including Beazer East, have performed their obligations in all material respects. The Company believes that, for the last three years, amounts paid by Beazer East as a result of its environmental remediation obligations under the Indemnity have averaged in total approximately $11 million per year. Periodically, issues have arisen between Koppers Inc. and Beazer East and/or other indemnitors that have been resolved without arbitration. Koppers Inc. and Beazer East engage in discussions from time to time that involve, among other things, the allocation of environmental costs related to certain operating and closed facilities.
If for any reason (including disputed coverage or financial incapability) one or more of such parties fail to perform their obligations and the Company or its subsidiaries are held liable for or otherwise required to pay all or part of such liabilities without reimbursement, the imposition of such liabilities on the Company or its subsidiaries could have a material adverse effect on its business, financial condition, cash flows and results of operations. Furthermore, the Company could be required to record a contingent liability on its balance sheet with respect to such matters, which could result in a negative adjustment to the Company’s net worth.
Domestic Environmental Matters. Koppers Inc. has been named as a potentially responsible party (a “PRP”) at the Portland Harbor CERCLA site located on the Willamette River in Oregon. Koppers Inc. has replied to an EPA Information request and has executed a PRP agreement which outlines the process to develop an allocation of past and future costs. Koppers Inc. currently operates a coal tar pitch terminal near the site. The current estimate for past costs incurred in the remedial investigation/feasibility study is $100 million. Separate from the EPA activities, a natural resources damages assessment is being conducted by a local trustee group. In September 2009, Koppers Inc. received a general notice letter notifying it that it may be a PRP at the Newark Bay CERCLA site. In January 2010, Koppers Inc. submitted a response to the general notice letter asserting that Koppers Inc. is a de minimus party in this site. The Company has not provided a reserve for these matters because, at this time, it cannot reasonably determine the probability of a loss, and the amount of loss, if any, cannot be reasonably estimated. An unfavorable resolution of these matters may have a material adverse effect on the Company’s business, financial condition, cash flows and results of operations.
The Illinois Environmental Protection Agency (the “IEPA”) has requested that Koppers Inc. conduct a voluntary investigation of soil and groundwater at its Stickney, Illinois carbon materials and chemicals facility. The IEPA advised Koppers Inc. that it made such request as a result of a reported release of oil-like material from Koppers Inc.’s property into an adjacent river canal. Koppers Inc. is conducting such investigation in cooperation with Beazer East. The Company and Beazer East have commenced investigation on this site pursuant to a Plan submitted to the IEPA. The Company has provided a reserve for this matter totaling $1.6 million as of December 31, 2009.
In August 2005, the Pennsylvania Department of Environmental Protection (the “PADEP”) proposed a fine related to alleged water discharge exceedances from a storm water sewer pipe at the tar distillation facility of Koppers Inc. in Clairton, Pennsylvania. In December 2006, Koppers Inc. reached a preliminary settlement of the fine with the PADEP for $0.5 million, subject to the negotiation and execution of a consent order with the PADEP. Negotiations with respect to the consent order are
76
Table of Contents
Koppers Holdings Inc. 2009 Annual Report
continuing and may result in an increase in the amount of the fine payable by Koppers Inc. Accordingly, the Company has reserved the amount of the estimated settlement. Koppers Inc. also proposed to undertake certain engineering and capital improvements to address this matter. In December 2007, Koppers Inc. agreed to contribute the capital improvements, primarily a new sewer line, to the city of Clairton and accordingly, has provided a reserve of $2.3 million related to the new sewer line and PADEP fine as of December 31, 2009. Koppers Inc. expects to begin construction of the new sewer line during 2010.
Australian Environmental Matters. Soil and groundwater contamination has been detected at certain of the Company’s Australian facilities. At the Company’s tar distillation facility in Newcastle, New South Wales, Australia, soil contamination from an abandoned underground coal tar pipeline and other groundwater contamination have been detected at a property adjacent to the facility. In December 2006 the Company and the owner of the adjacent property reached an agreement in principle pursuant to which the Company will contribute $1.7 million and the owner of the adjacent property will contribute $6.0 million toward remediation of the property. Subject to the approval of a remediation action plan by local environmental authorities, the agreement in principle provides that the Company will assume responsibility for the management of the remediation effort and will indemnify the current owner for any remediation costs in excess of its agreed contribution. At the completion of the remediation, the agreement in principle provides that the property will be transferred to the Company. The Company has reserved its expected total remediation costs of $1.7 million at December 31, 2009.
Other Australian environmental matters include soil and groundwater remediation at two former wood products facilities in Australia which are being prepared for future sale. With respect to the first facility in Hume, Australia, contaminated soil has been remediated and groundwater contamination has been detected. With respect to the second facility in Thornton, Australia, a remediation action plan is being developed to address contaminated soil and groundwater. The Company has reserved $3.9 million for remediation costs at these sites which represents its best estimate of groundwater and soil remediation.
Environmental Reserves Rollforward. The following table reflects changes in the accrued liability for environmental matters:
| Year Ended December 31, | ||||||||
| 2009 | 2008 | |||||||
| (Dollars in millions) | ||||||||
| Balance at beginning of year |
$ | 9.4 | $ | 10.0 | ||||
| Expense |
0.5 | 1.6 | ||||||
| Reversal of reserves |
— | (0.1 | ) | |||||
| Cash expenditures |
(0.5 | ) | (1.1 | ) | ||||
| Currency translation |
1.3 | (1.0 | ) | |||||
| Balance at end of year |
$ | 10.7 | $ | 9.4 | ||||
Expense for 2008 consisted primarily of accruals related to the Thornton site.
20. Related Party Transactions
In connection with the issuance of the Senior Notes in December 2009, Walter W. Turner, President and Chief Executive Officer of Koppers Holdings Inc. and Koppers Inc., purchased $500,000 aggregate principal amount of Senior Notes at the offering price of 98.311 percent, or $491,555. The offering price for this purchase represents the same offering price paid by the purchasers for the remaining $295.0 million of Senior Notes.
Schnader Harrison Segal & Lewis LLP provided counsel to the Company during 2008 and 2007. Clayton A. Sweeney, a Director and shareholder of the Company, is also of counsel to Schnader Harrison Segal & Lewis LLP. In both 2008 and 2007, the Company paid a total of $0.1 million in legal fees to this firm.
The Company had entered into a consulting agreement in 1999 with Robert Cizik who was a director of the Company at that time. The consulting agreement included a provision which provided for a $0.6 million interest-free loan from the Company for the purchase of 140,467 shares of restricted common stock. The loan was repaid in May 2008 concurrent with Mr. Cizik’s retirement from the Board of Directors.
77
Table of Contents
21. Selected Quarterly Financial Data (Unaudited)
The following is a summary of the quarterly results of operations for the years ended December 31, 2009 and 2008:
| Year Ended December 31, 2009 | ||||||||||||||||||
| 1st Quarter | 2nd Quarter | 3rd Quarter | 4th Quarter | Fiscal Year | ||||||||||||||
| (Dollars in millions, except per share amounts) | ||||||||||||||||||
| Statement of operations data: |
||||||||||||||||||
| Net sales |
$ | 272.7 | $ | 291.6 | $ | 289.8 | $ | 270.3 | $ | 1,124.4 | ||||||||
| Operating profit |
18.4 | 33.3 | 33.2 | 10.0 | 94.9 | |||||||||||||
| Income (loss) from continuing operations(a) |
4.8 | 12.6 | 17.1 | (12.8 | ) | 21.7 | ||||||||||||
| Net income (loss)(a) |
4.6 | 12.5 | 17.1 | (12.8 | ) | 21.4 | ||||||||||||
| Net income (loss) attributable to Koppers(a) |
4.1 | 11.7 | 16.4 | (13.4 | ) | 18.8 | ||||||||||||
| Common stock data: |
||||||||||||||||||
| Earnings (loss) per common share attributable to Koppers common shareholders: |
||||||||||||||||||
| Basic — |
||||||||||||||||||
| Continuing operations |
$ | 0.21 | $ | 0.57 | $ | 0.80 | $ | (0.66 | ) | $ | 0.93 | |||||||
| Discontinued operations |
(0.01 | ) | — | — | — | (0.01 | ) | |||||||||||
| Earnings (loss) per basic common share |
$ | 0.20 | $ | 0.57 | $ | 0.80 | $ | (0.66 | ) | $ | 0.92 | |||||||
| Diluted — |
||||||||||||||||||
| Continuing operations |
$ | 0.21 | $ | 0.57 | $ | 0.80 | $ | (0.66 | ) | $ | 0.92 | |||||||
| Discontinued operations |
(0.01 | ) | — | — | — | (0.01 | ) | |||||||||||
| Earnings (loss) per diluted common share |
$ | 0.20 | $ | 0.57 | $ | 0.80 | $ | (0.66 | ) | $ | 0.91 | |||||||
| Dividends declared per common share |
$ | 0.22 | $ | 0.22 | $ | 0.22 | $ | 0.22 | $ | 0.88 | ||||||||
| Price range of common stock: |
||||||||||||||||||
| High |
$ | 22.47 | $ | 29.25 | $ | 33.47 | $ | 34.00 | $ | 34.00 | ||||||||
| Low |
9.29 | 14.02 | 21.39 | 24.93 | 9.29 | |||||||||||||
| (a) | In the fourth quarter of 2009, the Company refinanced its Senior Secured Notes and Senior Discount Notes and incurred a loss on extinguishment of debt totaling $22.4 million. |
| Year Ended December 31, 2008 | ||||||||||||||||
| 1st Quarter | 2nd Quarter | 3rd Quarter | 4th Quarter | Fiscal Year | ||||||||||||
| (Dollars in millions, except per share amounts) | ||||||||||||||||
| Statement of operations data: |
||||||||||||||||
| Net sales |
$ | 331.2 | $ | 375.3 | $ | 369.4 | $ | 288.9 | $ | 1,364.8 | ||||||
| Operating profit(a) |
31.8 | 46.1 | 51.7 | 0.6 | 130.2 | |||||||||||
| Income (loss) from continuing operations |
12.8 | 22.7 | 25.2 | (12.3 | ) | 48.4 | ||||||||||
| Net income(b) |
13.8 | 24.7 | 26.1 | 74.1 | 138.7 | |||||||||||
| Net income attributable to Koppers(b) |
13.2 | 24.3 | 25.5 | 75.0 | 138.0 | |||||||||||
| Common stock data: |
||||||||||||||||
| Earnings (loss) per common share: |
||||||||||||||||
| Basic — |
||||||||||||||||
| Continuing operations |
$ | 0.58 | $ | 1.06 | $ | 1.21 | $ | (0.56 | ) | $ | 2.31 | |||||
| Discontinued operations |
0.05 | 0.10 | 0.04 | 4.24 | 4.37 | |||||||||||
| Earnings per basic common share |
$ | 0.63 | $ | 1.16 | $ | 1.25 | $ | 3.68 | $ | 6.68 | ||||||
| Diluted — |
||||||||||||||||
| Continuing operations |
$ | 0.58 | $ | 1.06 | $ | 1.20 | $ | (0.57 | ) | $ | 2.30 | |||||
| Discontinued operations |
0.05 | 0.10 | 0.04 | 4.23 | 4.35 | |||||||||||
| Earnings per diluted common share |
$ | 0.63 | $ | 1.16 | $ | 1.24 | $ | 3.66 | $ | 6.65 | ||||||
| Dividends declared per common share |
$ | 0.22 | $ | 0.22 | $ | 0.22 | $ | 0.22 | $ | 0.88 | ||||||
| Price range of common stock: |
||||||||||||||||
| High |
$ | 45.76 | $ | 51.95 | $ | 48.90 | $ | 37.11 | $ | 51.95 | ||||||
| Low |
31.34 | 39.11 | 33.83 | 12.60 | 12.60 | |||||||||||
| (a) | In the fourth quarter of 2008 the Company incurred inventory lower of cost or market charges totaling $3.9 million, impairment charges for a European glycerine plant totaling $3.7 million and severance costs related to workforce reductions totaling $0.8 million. |
| (b) | In the fourth quarter of 2008, the Company sold its 95 percent interest in Koppers Monessen Partners LP (“Monessen”) and recognized a gain of $85.9 million, net of tax. The gain on the sale and the results of operations for Monessen totaling $4.4 million have been reclassified as a discontinued operation in the Company’s statement of operations and earnings per share for all periods presented. |
78
Table of Contents
Koppers Holdings Inc. 2009 Annual Report
22. Subsidiary Guarantor Information for Koppers Inc. Senior Notes
On December 1, 2009, Koppers Inc. issued $300.0 million principal value of Senior Notes. Koppers Holdings and each of Koppers Inc.’s wholly-owned material domestic subsidiaries other than Koppers Assurance, Inc. fully and unconditionally guarantee the payment of principal and interest on the Senior Notes. The domestic guarantor subsidiaries include World-Wide Ventures Corporation, Koppers Delaware, Inc., Koppers Concrete Products, Inc., Concrete Partners, Inc., and Koppers Asia LLC.
Separate condensed consolidating financial statement information for Koppers Holdings Inc. (the parent), Koppers Inc., domestic guarantor subsidiaries and non-guarantor subsidiaries as of December 31, 2009 and 2008 and for the years ended December 31, 2009, 2008 and 2007 is as follows:
Condensed Consolidating Statement of Operations
For the Year Ended December 31, 2009
| Parent | Koppers Inc. | Domestic Guarantor Subsidiaries |
Non-Guarantor Subsidiaries |
Consolidating Adjustments |
Consolidated | |||||||||||||||||||
| (Dollars in millions) | ||||||||||||||||||||||||
| Net sales |
$ | — | $ | 709.1 | $ | 33.0 | $ | 422.3 | $ | (40.0 | ) | $ | 1,124.4 | |||||||||||
| Cost of sales including depreciation and amortization |
— | 640.9 | (3.7 | ) | 350.4 | (16.2 | ) | 971.4 | ||||||||||||||||
| Selling, general and administrative |
1.8 | 28.8 | 3.0 | 24.5 | — | 58.1 | ||||||||||||||||||
| Operating profit (loss) |
(1.8 | ) | 39.4 | 33.7 | 47.4 | (23.8 | ) | 94.9 | ||||||||||||||||
| Other income (expense) |
40.2 | 0.5 | (0.3 | ) | (0.9 | ) | (40.2 | ) | (0.7 | ) | ||||||||||||||
| Interest expense (income) |
31.1 | 28.5 | — | 4.1 | (5.0 | ) | 58.7 | |||||||||||||||||
| Income taxes |
(11.5 | ) | 2.0 | 11.0 | 12.3 | — | 13.8 | |||||||||||||||||
| Income from continuing operations |
18.8 | 9.4 | 22.4 | 30.1 | (59.0 | ) | 21.7 | |||||||||||||||||
| Discontinued operations |
— | (0.3 | ) | — | — | — | (0.3 | ) | ||||||||||||||||
| Noncontrolling interests |
— | — | — | 2.6 | — | 2.6 | ||||||||||||||||||
| Net income attributable to Koppers |
$ | 18.8 | $ | 9.1 | $ | 22.4 | $ | 27.5 | $ | (59.0 | ) | $ | 18.8 | |||||||||||
Condensed Consolidating Statement of Operations
For the Year Ended December 31, 2008
| Parent | Koppers Inc. | Domestic Guarantor Subsidiaries |
Non-Guarantor Subsidiaries |
Consolidating Adjustments |
Consolidated | ||||||||||||||||
| (Dollars in millions) | |||||||||||||||||||||
| Net sales |
$ | — | $ | 837.7 | $ | 46.1 | $ | 534.5 | $ | (53.5 | ) | $ | 1,364.8 | ||||||||
| Cost of sales including depreciation and amortization |
— | 744.2 | 7.3 | 447.9 | (29.4 | ) | 1,170.0 | ||||||||||||||
| Selling, general and administrative |
2.3 | 33.2 | 1.4 | 27.7 | — | 64.6 | |||||||||||||||
| Operating profit (loss) |
(2.3 | ) | 60.3 | 37.4 | 58.9 | (24.1 | ) | 130.2 | |||||||||||||
| Other income (expense) |
150.9 | 0.6 | (0.4 | ) | 1.0 | (150.9 | ) | 1.2 | |||||||||||||
| Interest expense (income) |
17.5 | 26.9 | — | 6.4 | (9.4 | ) | 41.4 | ||||||||||||||
| Income taxes |
(6.9 | ) | 12.0 | 21.6 | 14.9 | — | 41.6 | ||||||||||||||
| Income from continuing operations |
138.0 | 22.0 | 15.4 | 38.6 | (165.6 | ) | 48.4 | ||||||||||||||
| Discontinued operations |
— | 86.0 | (0.1 | ) | 4.4 | — | 90.3 | ||||||||||||||
| Noncontrolling interests |
— | — | — | 0.7 | — | 0.7 | |||||||||||||||
| Net income attributable to Koppers |
$ | 138.0 | $ | 108.0 | $ | 15.3 | $ | 42.3 | $ | (165.6 | ) | $ | 138.0 | ||||||||
79
Table of Contents
Condensed Consolidating Statement of Operations
For the Year Ended December 31, 2007
| Parent | Koppers Inc. | Domestic Guarantor Subsidiaries |
Non-Guarantor Subsidiaries |
Consolidating Adjustments |
Consolidated | |||||||||||||||||
| (Dollars in millions) | ||||||||||||||||||||||
| Net sales |
$ | — | $ | 803.2 | $ | 16.1 | $ | 461.9 | $ | (25.6 | ) | $ | 1,255.6 | |||||||||
| Cost of sales including depreciation and amortization |
— | 689.4 | (11.2 | ) | 387.9 | (7.7 | ) | 1,058.4 | ||||||||||||||
| Selling, general and administrative |
2.0 | 40.9 | 0.1 | 29.1 | — | 72.1 | ||||||||||||||||
| Operating profit (loss) |
(2.0 | ) | 72.9 | 27.2 | 44.9 | (17.9 | ) | 125.1 | ||||||||||||||
| Other income (expense) |
74.9 | — | 0.5 | (0.1 | ) | (75.0 | ) | 0.3 | ||||||||||||||
| Interest expense (income) |
16.0 | 34.4 | — | 6.4 | (10.9 | ) | 45.9 | |||||||||||||||
| Income taxes |
(6.4 | ) | 8.2 | 13.4 | 13.8 | — | 29.0 | |||||||||||||||
| Income from continuing operations |
63.3 | 30.3 | 14.3 | 24.6 | (82.0 | ) | 50.5 | |||||||||||||||
| Discontinued operations |
— | — | 6.6 | 9.4 | — | 16.0 | ||||||||||||||||
| Noncontrolling interests |
— | — | — | 3.2 | — | 3.2 | ||||||||||||||||
| Net income attributable to Koppers |
$ | 63.3 | $ | 30.3 | $ | 20.9 | $ | 30.8 | $ | (82.0 | ) | $ | 63.3 | |||||||||
Condensed Consolidating Balance Sheet
December 31, 2009
| Parent | Koppers Inc. | Domestic Guarantor Subsidiaries |
Non-Guarantor Subsidiaries |
Consolidating Adjustments |
Consolidated | ||||||||||||||||
| (Dollars in millions) | |||||||||||||||||||||
| ASSETS |
|||||||||||||||||||||
| Cash and cash equivalents |
$ | 0.2 | $ | 12.9 | $ | — | $ | 45.3 | $ | — | $ | 58.4 | |||||||||
| S-T investments & restricted cash |
— | — | — | 4.4 | — | 4.4 | |||||||||||||||
| Accounts receivable, net |
36.1 | 121.3 | 415.8 | 83.1 | (516.7 | ) | 139.6 | ||||||||||||||
| Inventories, net |
— | 78.9 | — | 74.0 | (0.2 | ) | 152.7 | ||||||||||||||
| Deferred tax assets |
— | 10.0 | (1.5 | ) | — | — | 8.5 | ||||||||||||||
| Other current assets |
— | 6.9 | 0.3 | 10.3 | (0.1 | ) | 17.4 | ||||||||||||||
| Total current assets |
36.3 | 230.0 | 414.6 | 217.1 | (517.0 | ) | 381.0 | ||||||||||||||
| Equity investments |
12.7 | 77.2 | 14.8 | 3.4 | (103.4 | ) | 4.7 | ||||||||||||||
| Property, plant and equipment, net |
— | 91.0 | — | 58.3 | — | 149.3 | |||||||||||||||
| Goodwill |
— | 36.9 | — | 24.7 | — | 61.6 | |||||||||||||||
| Deferred tax assets |
— | 68.2 | (47.7 | ) | 5.4 | — | 25.9 | ||||||||||||||
| Other noncurrent assets |
— | 19.6 | — | 2.2 | 0.1 | 21.9 | |||||||||||||||
| Total assets |
$ | 49.0 | $ | 522.9 | $ | 381.7 | $ | 311.1 | $ | (620.3 | ) | $ | 644.4 | ||||||||
| LIABILITIES AND EQUITY |
|||||||||||||||||||||
| Accounts payable |
$ | 0.6 | $ | 473.9 | $ | 10.2 | $ | 99.3 | $ | (516.7 | ) | $ | 67.3 | ||||||||
| Accrued liabilities |
4.6 | 29.4 | (0.1 | ) | 30.4 | — | 64.3 | ||||||||||||||
| Short-term debt and current portion of long-term debt |
— | 0.2 | — | — | — | 0.2 | |||||||||||||||
| Total current liabilities |
5.2 | 503.5 | 10.1 | 129.7 | (516.7 | ) | 131.8 | ||||||||||||||
| Long-term debt |
— | 335.1 | — | — | — | 335.1 | |||||||||||||||
| Other long-term liabilities |
— | 96.3 | — | 26.4 | — | 122.7 | |||||||||||||||
| Total liabilities |
5.2 | 934.9 | 10.1 | 156.1 | (516.7 | ) | 589.6 | ||||||||||||||
| Koppers stockholders’ equity |
43.8 | (412.0 | ) | 371.6 | 144.0 | (103.6 | ) | 43.8 | |||||||||||||
| Noncontrolling interests |
— | — | — | 11.0 | — | 11.0 | |||||||||||||||
| Total liabilities and equity |
$ | 49.0 | $ | 522.9 | $ | 381.7 | $ | 311.1 | $ | (620.3 | ) | $ | 644.4 | ||||||||
80
Table of Contents
Koppers Holdings Inc. 2009 Annual Report
Condensed Consolidating Balance Sheet
December 31, 2008
| Parent | Koppers Inc. | Domestic Guarantor Subsidiaries |
Non-Guarantor Subsidiaries |
Consolidating Adjustments |
Consolidated | ||||||||||||||||
| (Dollars in millions) | |||||||||||||||||||||
| ASSETS |
|||||||||||||||||||||
| Cash and cash equivalents |
$ | — | $ | 37.5 | $ | — | $ | 25.6 | $ | — | $ | 63.1 | |||||||||
| S-T investments & restricted cash |
— | — | — | 5.9 | — | 5.9 | |||||||||||||||
| Accounts receivable, net |
4.6 | 98.8 | 388.0 | 82.8 | (457.7 | ) | 116.5 | ||||||||||||||
| Inventories, net |
— | 100.4 | — | 71.4 | — | 171.8 | |||||||||||||||
| Deferred tax assets |
— | 4.1 | (1.5 | ) | — | — | 2.6 | ||||||||||||||
| Other current assets |
— | 5.7 | — | 6.8 | — | 12.5 | |||||||||||||||
| Total current assets |
4.6 | 246.5 | 386.5 | 192.5 | (457.7 | ) | 372.4 | ||||||||||||||
| Equity investments |
180.2 | 77.0 | 15.6 | 4.0 | (270.8 | ) | 6.0 | ||||||||||||||
| Property, plant and equipment, net |
— | 92.3 | — | 52.5 | — | 144.8 | |||||||||||||||
| Goodwill |
— | 37.0 | — | 21.4 | — | 58.4 | |||||||||||||||
| Deferred tax assets |
21.4 | 74.9 | (45.7 | ) | 5.4 | — | 56.0 | ||||||||||||||
| Other noncurrent assets |
3.0 | 19.1 | — | 1.4 | — | 23.5 | |||||||||||||||
| Total assets |
$ | 209.2 | $ | 546.8 | $ | 356.4 | $ | 277.2 | $ | (728.5 | ) | $ | 661.1 | ||||||||
| LIABILITIES AND EQUITY |
|||||||||||||||||||||
| Accounts payable |
$ | 0.1 | $ | 424.4 | $ | 5.9 | $ | 109.4 | $ | (457.7 | ) | $ | 82.1 | ||||||||
| Accrued liabilities |
4.5 | 8.7 | 14.0 | 39.1 | — | 66.3 | |||||||||||||||
| Short-term debt and current portion of long-term debt |
— | 0.2 | — | — | — | 0.2 | |||||||||||||||
| Total current liabilities |
4.6 | 433.3 | 19.9 | 148.5 | (457.7 | ) | 148.6 | ||||||||||||||
| Long-term debt |
186.6 | 188.1 | — | — | — | 374.7 | |||||||||||||||
| Other long-term liabilities |
— | 72.1 | — | 39.7 | — | 111.8 | |||||||||||||||
| Total liabilities |
191.2 | 693.5 | 19.9 | 188.2 | (457.7 | ) | 635.1 | ||||||||||||||
| Koppers stockholders’ equity |
18.0 | (146.7 | ) | 336.5 | 81.0 | (270.8 | ) | 18.0 | |||||||||||||
| Noncontrolling interests |
— | — | — | 8.0 | — | 8.0 | |||||||||||||||
| Total liabilities and equity |
$ | 209.2 | $ | 546.8 | $ | 356.4 | $ | 277.2 | $ | (728.5 | ) | $ | 661.1 | ||||||||
81
Table of Contents
Condensed Consolidating Statement of Cash Flows
For the Year Ended December 31, 2009
| Parent | Koppers Inc. | Domestic Guarantor Subsidiaries |
Non-Guarantor Subsidiaries |
Consolidating Adjustments |
Consolidated | ||||||||||||||||||
| (Dollars in millions) | |||||||||||||||||||||||
| Cash provided by (used in) operating activities |
$ | 231.8 | $ | 90.7 | $ | — | $ | 22.5 | $ | (232.7 | ) | $ | 112.3 | ||||||||||
| Cash provided by (used in) investing activities: |
|||||||||||||||||||||||
| Capital expenditures and acquisitions |
— | (15.0 | ) | — | (5.2 | ) | — | (20.2 | ) | ||||||||||||||
| Net cash proceeds (payments) from divestitures and asset sales |
— | (0.7 | ) | — | 0.1 | — | (0.6 | ) | |||||||||||||||
| Net cash (used in) investing activities |
— | (15.7 | ) | — | (5.1 | ) | — | (20.8 | ) | ||||||||||||||
| Cash provided by (used in) financing activities: |
|||||||||||||||||||||||
| Borrowings (repayments) of long-term debt |
(213.6 | ) | 142.8 | — | — | — | (70.8 | ) | |||||||||||||||
| Deferred financing costs |
— | (8.1 | ) | — | — | — | (8.1 | ) | |||||||||||||||
| Dividends paid |
(18.0 | ) | (232.7 | ) | — | — | 232.7 | (18.0 | ) | ||||||||||||||
| Net cash provided by (used in) financing activities |
(231.6 | ) | (98.0 | ) | — | — | 232.7 | (96.9 | ) | ||||||||||||||
| Effect of exchange rates on cash |
— | (1.6 | ) | — | 2.3 | — | 0.7 | ||||||||||||||||
| Net increase (decrease) in cash and cash equivalents |
0.2 | (24.6 | ) | — | 19.7 | — | (4.7 | ) | |||||||||||||||
| Cash and cash equivalents at beginning of year |
— | 37.5 | — | 25.6 | — | 63.1 | |||||||||||||||||
| Cash and cash equivalents at end of period |
$ | 0.2 | $ | 12.9 | $ | — | $ | 45.3 | $ | — | $ | 58.4 | |||||||||||
Condensed Consolidating Statement of Cash Flows
For the Year Ended December 31, 2008
| Parent | Koppers Inc. | Domestic Guarantor Subsidiaries |
Non-Guarantor Subsidiaries |
Consolidating Adjustments |
Consolidated | ||||||||||||||||||
| (Dollars in millions) | |||||||||||||||||||||||
| Cash provided by (used in) operating activities |
$ | 38.3 | $ | 14.7 | $ | — | $ | 37.3 | $ | (38.4 | ) | $ | 51.9 | ||||||||||
| Cash provided by (used in) investing activities: |
|||||||||||||||||||||||
| Capital expenditures and acquisitions |
— | (24.8 | ) | — | (15.2 | ) | — | (40.0 | ) | ||||||||||||||
| Net cash proceeds (payments) from divestitures and asset sales |
— | 158.4 | — | 2.3 | — | 160.7 | |||||||||||||||||
| Net cash (used in) investing activities |
— | 133.6 | — | (12.9 | ) | — | 120.7 | ||||||||||||||||
| Cash provided by (used in) financing activities: |
|||||||||||||||||||||||
| Borrowings (repayments) of long-term debt |
— | (74.0 | ) | — | (9.3 | ) | — | (83.3 | ) | ||||||||||||||
| Deferred financing costs |
— | (2.7 | ) | — | — | — | (2.7 | ) | |||||||||||||||
| Dividends paid |
(17.2 | ) | (38.4 | ) | — | — | 38.4 | (17.2 | ) | ||||||||||||||
| Stock issued (repurchased) |
(21.3 | ) | 1.4 | — | — | — | (19.9 | ) | |||||||||||||||
| Net cash provided by (used in) financing activities |
(38.5 | ) | (113.7 | ) | — | (9.3 | ) | 38.4 | (123.1 | ) | |||||||||||||
| Effect of exchange rates on cash |
— | 2.9 | — | (3.7 | ) | — | (0.8 | ) | |||||||||||||||
| Net increase (decrease) in cash and cash equivalents |
(0.2 | ) | 37.5 | — | 11.4 | — | 48.7 | ||||||||||||||||
| Add: Cash of assets held for sale at beginning of year |
— | — | — | 0.6 | — | 0.6 | |||||||||||||||||
| Less: Cash of assets held for sale at end of year |
— | — | — | — | — | — | |||||||||||||||||
| Cash and cash equivalents at beginning of year |
0.2 | — | — | 13.6 | — | 13.8 | |||||||||||||||||
| Cash and cash equivalents at end of period |
$ | — | $ | 37.5 | $ | — | $ | 25.6 | $ | — | $ | 63.1 | |||||||||||
82
Table of Contents
Koppers Holdings Inc. 2009 Annual Report
Condensed Consolidating Statement of Cash Flows
For the Year Ended December 31, 2007
| Parent | Koppers Inc. | Domestic Guarantor Subsidiaries |
Non-Guarantor Subsidiaries |
Consolidating Adjustments |
Consolidated | |||||||||||||||||||
| (Dollars in millions) | ||||||||||||||||||||||||
| Cash provided by (used in) operating activities |
$ | 12.5 | $ | 80.3 | $ | (11.5 | ) | $ | (3.2 | ) | $ | (12.0 | ) | $ | 66.1 | |||||||||
| Cash provided by (used in) investing activities: |
||||||||||||||||||||||||
| Capital expenditures and acquisitions |
— | (15.1 | ) | — | (13.3 | ) | — | (28.4 | ) | |||||||||||||||
| Net cash proceeds (payments) from divestitures and asset sales |
— | 0.1 | 11.5 | 0.3 | — | 11.9 | ||||||||||||||||||
| Net cash (used in) investing activities |
— | (15.0 | ) | 11.5 | (13.0 | ) | — | (16.5 | ) | |||||||||||||||
| Cash provided by (used in) financing activities: |
||||||||||||||||||||||||
| Borrowings (repayments) of long-term debt |
— | (52.9 | ) | — | 8.1 | — | (44.8 | ) | ||||||||||||||||
| Dividends paid |
(11.5 | ) | (14.6 | ) | — | — | 12.0 | (14.1 | ) | |||||||||||||||
| Stock issued (repurchased) |
(0.9 | ) | 1.2 | — | — | — | 0.3 | |||||||||||||||||
| Net cash provided by (used in) financing activities |
(12.4 | ) | (66.3 | ) | — | 8.1 | 12.0 | (58.6 | ) | |||||||||||||||
| Effect of exchange rates on cash |
— | 1.0 | — | 1.1 | — | 2.1 | ||||||||||||||||||
| Net increase (decrease) in cash and cash equivalents |
0.1 | — | — | (7.0 | ) | — | (6.9 | ) | ||||||||||||||||
| Add: Cash of assets held for sale at beginning of year |
— | — | — | 2.5 | — | 2.5 | ||||||||||||||||||
| Less: Cash of assets held for sale at end of year |
— | — | — | (0.6 | ) | — | (0.6 | ) | ||||||||||||||||
| Cash and cash equivalents at beginning of year |
0.1 | — | — | 18.7 | — | 18.8 | ||||||||||||||||||
| Cash and cash equivalents at end of period |
$ | 0.2 | $ | — | $ | — | $ | 13.6 | $ | — | $ | 13.8 | ||||||||||||
23. Subsidiary Guarantor Information for Shelf Registration
Under a registration statement on Form S-3, Koppers Holdings may sell a combination of securities including common stock, debt securities, preferred stock, depository shares and warrants, from time to time in one or more offerings with an aggregate offering price of up to $325 million. In addition, Koppers Inc. may sell debt securities from time to time under the registration statement. Debt securities may be fully and unconditionally guaranteed, on a joint and several basis, by Koppers Holdings, Koppers Inc. and/or other guarantor subsidiaries which will correspond to subsidiaries in the United States, Europe and Australia. The non-guarantor subsidiaries consist of certain subsidiaries in the United States, China and Mauritius. The guarantor subsidiaries that issue guarantees, if any, will be determined when a debt offering actually occurs under the registration statement and accordingly, the condensed consolidated financial information for subsidiary guarantors will be revised to identify the subsidiaries that actually provided guarantees.
83
Table of Contents
Separate condensed consolidating financial statement information for the parent, Koppers Inc., domestic guarantor subsidiaries, foreign guarantor subsidiaries and non-guarantor subsidiaries as of December 31, 2009 and 2008 and for the years ended December 31, 2009, 2008 and 2007 is as follows:
Condensed Consolidating Statement of Operations
For the Year Ended December 31, 2009
| Parent | Koppers Inc. | Domestic Guarantor Subsidiaries |
Foreign Guarantor Subsidiaries |
Non-Guarantor Subsidiaries |
Consolidating Adjustments |
Consolidated | |||||||||||||||||||||
| (Dollars in millions) | |||||||||||||||||||||||||||
| Net sales |
$ | — | $ | 709.1 | $ | 33.0 | $ | 355.6 | $ | 79.3 | $ | (52.6 | ) | $ | 1,124.4 | ||||||||||||
| Cost of sales including depreciation and amortization |
— | 640.9 | (3.7 | ) | 296.0 | 67.0 | (28.8 | ) | 971.4 | ||||||||||||||||||
| Selling, general and administrative |
1.8 | 28.8 | 3.0 | 20.5 | 4.0 | — | 58.1 | ||||||||||||||||||||
| Operating profit (loss) |
(1.8 | ) | 39.4 | 33.7 | 39.1 | 8.3 | (23.8 | ) | 94.9 | ||||||||||||||||||
| Other income (expense) |
40.2 | 0.5 | (0.3 | ) | 0.4 | (1.3 | ) | (40.2 | ) | (0.7 | ) | ||||||||||||||||
| Interest expense (income) |
31.1 | 28.5 | — | 4.2 | (0.1 | ) | (5.0 | ) | 58.7 | ||||||||||||||||||
| Income taxes |
(11.5 | ) | 2.0 | 11.0 | 10.1 | 2.2 | — | 13.8 | |||||||||||||||||||
| Income from continuing operations |
18.8 | 9.4 | 22.4 | 25.2 | 4.9 | (59.0 | ) | 21.7 | |||||||||||||||||||
| Discontinued operations |
— | (0.3 | ) | — | — | — | — | (0.3 | ) | ||||||||||||||||||
| Noncontrolling interests |
— | — | — | — | 2.6 | — | 2.6 | ||||||||||||||||||||
| Net income attributable to Koppers |
$ | 18.8 | $ | 9.1 | $ | 22.4 | $ | 25.2 | $ | 2.3 | $ | (59.0 | ) | $ | 18.8 | ||||||||||||
Condensed Consolidating Statement of Operations
For the Year Ended December 31, 2008
| Parent | Koppers Inc. | Domestic Guarantor Subsidiaries |
Foreign Guarantor Subsidiaries |
Non-Guarantor Subsidiaries |
Consolidating Adjustments |
Consolidated | |||||||||||||||||||
| (Dollars in millions) | |||||||||||||||||||||||||
| Net sales |
$ | — | $ | 837.7 | $ | 46.1 | $ | 478.5 | $ | 83.0 | $ | (80.5 | ) | $ | 1,364.8 | ||||||||||
| Cost of sales including depreciation and amortization |
— | 744.2 | 7.3 | 399.5 | 75.6 | (56.6 | ) | 1,170.0 | |||||||||||||||||
| Selling, general and administrative |
2.3 | 33.2 | 1.4 | 23.0 | 4.7 | — | 64.6 | ||||||||||||||||||
| Operating profit (loss) |
(2.3 | ) | 60.3 | 37.4 | 56.0 | 2.7 | (23.9 | ) | 130.2 | ||||||||||||||||
| Other income (expense) |
150.9 | 0.6 | (0.4 | ) | 1.2 | (0.2 | ) | (150.9 | ) | 1.2 | |||||||||||||||
| Interest expense (income) |
17.5 | 26.9 | — | 6.4 | — | (9.4 | ) | 41.4 | |||||||||||||||||
| Income taxes |
(6.9 | ) | 12.0 | 21.6 | 14.5 | 0.4 | — | 41.6 | |||||||||||||||||
| Income from continuing operations |
138.0 | 22.0 | 15.4 | 36.3 | 2.1 | (165.4 | ) | 48.4 | |||||||||||||||||
| Discontinued operations |
— | 86.0 | (0.1 | ) | — | 4.4 | — | 90.3 | |||||||||||||||||
| Noncontrolling interests |
— | — | — | — | 0.7 | — | 0.7 | ||||||||||||||||||
| Net income attributable to Koppers |
$ | 138.0 | $ | 108.0 | $ | 15.3 | $ | 36.3 | $ | 5.8 | $ | (165.4 | ) | $ | 138.0 | ||||||||||
84
Table of Contents
Koppers Holdings Inc. 2009 Annual Report
Condensed Consolidating Statement of Operations
For the Year Ended December 31, 2007
| Parent | Koppers Inc. | Domestic Guarantor Subsidiaries |
Foreign Guarantor Subsidiaries |
Non-Guarantor Subsidiaries |
Consolidating Adjustments |
Consolidated | |||||||||||||||||||
| (Dollars in millions) | |||||||||||||||||||||||||
| Net sales |
$ | — | $ | 803.2 | $ | 16.1 | $ | 418.2 | $ | 67.1 | $ | (49.0 | ) | $ | 1,255.6 | ||||||||||
| Cost of sales including depreciation and amortization |
— | 689.4 | (11.3 | ) | 356.9 | 54.7 | (31.3 | ) | 1,058.4 | ||||||||||||||||
| Selling, general and administrative |
2.0 | 40.9 | 0.1 | 25.1 | 4.0 | — | 72.1 | ||||||||||||||||||
| Operating profit (loss) |
(2.0 | ) | 72.9 | 27.3 | 36.2 | 8.4 | (17.7 | ) | 125.1 | ||||||||||||||||
| Other income (expense) |
74.9 | — | 0.4 | — | (0.1 | ) | (74.9 | ) | 0.3 | ||||||||||||||||
| Interest expense (income) |
16.0 | 34.4 | — | 6.4 | — | (10.9 | ) | 45.9 | |||||||||||||||||
| Income taxes |
(6.4 | ) | 8.2 | 13.4 | 9.3 | 4.5 | — | 29.0 | |||||||||||||||||
| Income from continuing operations |
63.3 | 30.3 | 14.3 | 20.5 | 3.8 | (81.7 | ) | 50.5 | |||||||||||||||||
| Discontinued operations |
— | — | 6.6 | — | 9.4 | — | 16.0 | ||||||||||||||||||
| Noncontrolling interests |
— | — | — | — | 3.2 | — | 3.2 | ||||||||||||||||||
| Net income attributable to Koppers |
$ | 63.3 | $ | 30.3 | $ | 20.9 | $ | 20.5 | $ | 10.0 | $ | (81.7 | ) | $ | 63.3 | ||||||||||
85
Table of Contents
Condensed Consolidating Balance Sheet
December 31, 2009
| Parent | Koppers Inc. | Domestic Guarantor Subsidiaries |
Foreign Guarantor Subsidiaries |
Non-Guarantor Subsidiaries |
Consolidating Adjustments |
Consolidated | ||||||||||||||||||
| (Dollars in millions) | ||||||||||||||||||||||||
| ASSETS |
||||||||||||||||||||||||
| Cash and cash equivalents |
$ | 0.2 | $ | 12.9 | $ | — | $ | 36.9 | $ | 8.4 | $ | — | $ | 58.4 | ||||||||||
| S-T investments & restricted cash |
— | — | — | — | 4.4 | — | 4.4 | |||||||||||||||||
| Accounts receivable, net |
36.1 | 121.3 | 415.8 | 42.2 | 41.1 | (516.9 | ) | 139.6 | ||||||||||||||||
| Inventories, net |
— | 78.9 | — | 67.0 | 7.0 | (0.2 | ) | 152.7 | ||||||||||||||||
| Deferred tax assets |
— | 10.0 | (1.5 | ) | — | — | — | 8.5 | ||||||||||||||||
| Other current assets |
— | 6.9 | 0.3 | 6.8 | 3.5 | (0.1 | ) | 17.4 | ||||||||||||||||
| Total current assets |
36.3 | 230.0 | 414.6 | 152.9 | 64.4 | (517.2 | ) | 381.0 | ||||||||||||||||
| Equity investments |
12.7 | 77.2 | 14.8 | 17.1 | 3.4 | (120.5 | ) | 4.7 | ||||||||||||||||
| Property, plant and equipment, net |
— | 90.9 | — | 41.8 | 16.6 | — | 149.3 | |||||||||||||||||
| Goodwill |
— | 37.0 | — | 23.3 | 1.3 | — | 61.6 | |||||||||||||||||
| Deferred tax assets |
68.2 | (47.7 | ) | 5.4 | — | — | 25.9 | |||||||||||||||||
| Other noncurrent assets |
19.6 | — | 0.8 | 1.4 | 0.1 | 21.9 | ||||||||||||||||||
| Total assets |
$ | 49.0 | $ | 522.9 | $ | 381.7 | $ | 241.3 | $ | 87.1 | $ | (637.6 | ) | $ | 644.4 | |||||||||
| LIABILITIES AND EQUITY |
||||||||||||||||||||||||
| Accounts payable |
$ | 0.6 | $ | 473.9 | $ | 10.2 | $ | 91.5 | $ | 8.0 | $ | (516.9 | ) | $ | 67.3 | |||||||||
| Accrued liabilities |
4.6 | 29.4 | (0.1 | ) | 20.5 | 9.9 | — | 64.3 | ||||||||||||||||
| Short-term debt and current portion of long-term debt |
— | 0.2 | — | — | — | — | 0.2 | |||||||||||||||||
| Total current liabilities |
5.2 | 503.5 | 10.1 | 112.0 | 17.9 | (516.9 | ) | 131.8 | ||||||||||||||||
| Long-term debt |
— | 335.1 | — | — | — | — | 335.1 | |||||||||||||||||
| Other long-term liabilities |
— | 96.3 | — | 16.0 | 10.4 | — | 122.7 | |||||||||||||||||
| Total liabilities |
5.2 | 934.9 | 10.1 | 128.0 | 28.3 | (516.9 | ) | 589.6 | ||||||||||||||||
| Koppers stockholders’ equity |
43.8 | (412.0 | ) | 371.6 | 113.3 | 47.8 | (120.7 | ) | 43.8 | |||||||||||||||
| Noncontrolling interests |
— | — | — | — | 11.0 | — | 11.0 | |||||||||||||||||
| Total liabilities and equity |
$ | 49.0 | $ | 522.9 | $ | 381.7 | $ | 241.3 | $ | 87.1 | $ | (637.6 | ) | $ | 644.4 | |||||||||
86
Table of Contents
Koppers Holdings Inc. 2009 Annual Report
Condensed Consolidating Balance Sheet
December 31, 2008
| Parent | Koppers Inc. | Domestic Guarantor Subsidiaries |
Foreign Guarantor Subsidiaries |
Non-Guarantor Subsidiaries |
Consolidating Adjustments |
Consolidated | |||||||||||||||||||
| (Dollars in millions) | |||||||||||||||||||||||||
| ASSETS |
|||||||||||||||||||||||||
| Cash and cash equivalents |
$ | — | $ | 37.5 | $ | — | $ | 18.7 | $ | 6.9 | $ | — | $ | 63.1 | |||||||||||
| S-T investments & restricted cash |
— | — | — | (0.1 | ) | 6.0 | — | 5.9 | |||||||||||||||||
| Accounts receivable, net |
4.6 | 98.8 | 388.0 | 42.5 | 40.7 | (458.1 | ) | 116.5 | |||||||||||||||||
| Inventories, net |
— | 100.4 | — | 64.1 | 7.3 | — | 171.8 | ||||||||||||||||||
| Deferred tax assets |
— | 4.1 | (1.5 | ) | — | — | — | 2.6 | |||||||||||||||||
| Other current assets |
— | 5.7 | — | 5.9 | 0.9 | — | 12.5 | ||||||||||||||||||
| Total current assets |
4.6 | 246.5 | 386.5 | 131.1 | 61.8 | (458.1 | ) | 372.4 | |||||||||||||||||
| Equity investments |
180.2 | 77.0 | 15.6 | 13.2 | 4.0 | (284.0 | ) | 6.0 | |||||||||||||||||
| Property, plant and equipment, net |
— | 92.3 | — | 35.2 | 17.3 | — | 144.8 | ||||||||||||||||||
| Goodwill |
— | 37.0 | — | 20.1 | 1.3 | — | 58.4 | ||||||||||||||||||
| Deferred tax assets |
21.4 | 74.9 | (45.7 | ) | 4.4 | 1.0 | — | 56.0 | |||||||||||||||||
| Other noncurrent assets |
3.0 | 19.1 | — | — | 1.4 | — | 23.5 | ||||||||||||||||||
| Total assets |
$ | 209.2 | $ | 546.8 | $ | 356.4 | $ | 204.0 | $ | 86.8 | $ | (742.1 | ) | $ | 661.1 | ||||||||||
| LIABILITIES AND EQUITY |
|||||||||||||||||||||||||
| Accounts payable |
$ | 0.1 | $ | 424.4 | $ | 5.9 | $ | 79.3 | $ | 30.5 | $ | (458.1 | ) | $ | 82.1 | ||||||||||
| Accrued liabilities |
4.5 | 8.7 | 14.0 | 24.0 | 15.1 | — | 66.3 | ||||||||||||||||||
| Short-term debt and current portion of long-term debt |
— | 0.2 | — | — | — | — | 0.2 | ||||||||||||||||||
| Total current liabilities |
4.6 | 433.3 | 19.9 | 103.3 | 45.6 | (458.1 | ) | 148.6 | |||||||||||||||||
| Long-term debt |
186.6 | 188.1 | — | — | — | — | 374.7 | ||||||||||||||||||
| Other long-term liabilities |
— | 72.1 | — | 7.4 | 32.3 | — | 111.8 | ||||||||||||||||||
| Total liabilities |
191.2 | 693.5 | 19.9 | 110.7 | 77.9 | (458.1 | ) | 635.1 | |||||||||||||||||
| Koppers stockholders’ equity |
18.0 | (146.7 | ) | 336.5 | 93.3 | 0.9 | (284.0 | ) | 18.0 | ||||||||||||||||
| Noncontrolling interests |
— | — | — | — | 8.0 | — | 8.0 | ||||||||||||||||||
| Total liabilities and equity |
$ | 209.2 | $ | 546.8 | $ | 356.4 | $ | 204.0 | $ | 86.8 | $ | (742.1 | ) | $ | 661.1 | ||||||||||
87
Table of Contents
Condensed Consolidating Statement of Cash Flows
For the Year Ended December 31, 2009
| Parent | Koppers Inc. | Domestic Guarantor Subsidiaries |
Foreign Guarantor Subsidiaries |
Non-Guarantor Subsidiaries |
Consolidating Adjustments |
Consolidated | |||||||||||||||||||||
| (Dollars in millions) | |||||||||||||||||||||||||||
| Cash provided by (used in) operating activities |
$ | 231.8 | $ | 90.7 | $ | — | $ | 19.5 | $ | 3.0 | $ | (232.7 | ) | $ | 112.3 | ||||||||||||
| Cash provided by (used in) investing activities: |
|||||||||||||||||||||||||||
| Capital expenditures and acquisitions |
— | (15.0 | ) | — | (3.7 | ) | (1.5 | ) | — | (20.2 | ) | ||||||||||||||||
| Net cash proceeds (payments) from divestitures and asset sales |
— | (0.7 | ) | — | 0.1 | — | — | (0.6 | ) | ||||||||||||||||||
| Net cash (used in) investing activities |
— | (15.7 | ) | — | (3.6 | ) | (1.5 | ) | — | (20.8 | ) | ||||||||||||||||
| Cash provided by (used in) financing activities: |
|||||||||||||||||||||||||||
| Borrowings (repayments) of long-term debt |
(213.6 | ) | 142.8 | — | — | — | — | (70.8 | ) | ||||||||||||||||||
| Deferred financing costs |
— | (8.1 | ) | — | — | — | — | (8.1 | ) | ||||||||||||||||||
| Dividends paid |
(18.0 | ) | (232.7 | ) | — | — | — | 232.7 | (18.0 | ) | |||||||||||||||||
| Net cash provided by (used in) financing activities |
(231.6 | ) | (98.0 | ) | — | — | — | 232.7 | (96.9 | ) | |||||||||||||||||
| Effect of exchange rates on cash |
— | (1.6 | ) | — | 2.3 | — | — | 0.7 | |||||||||||||||||||
| Net increase (decrease) in cash and cash equivalents |
0.2 | (24.6 | ) | — | 18.2 | 1.5 | — | (4.7 | ) | ||||||||||||||||||
| Cash and cash equivalents at beginning of year |
— | 37.5 | — | 18.7 | 6.9 | — | 63.1 | ||||||||||||||||||||
| Cash and cash equivalents at end of period |
$ | 0.2 | $ | 12.9 | $ | — | $ | 36.9 | $ | 8.4 | $ | — | $ | 58.4 | |||||||||||||
88
Table of Contents
Koppers Holdings Inc. 2009 Annual Report
Condensed Consolidating Statement of Cash Flows
For the Year Ended December 31, 2008
| Parent | Koppers Inc. | Domestic Guarantor Subsidiaries |
Foreign Guarantor Subsidiaries |
Non-Guarantor Subsidiaries |
Consolidating Adjustments |
Consolidated | |||||||||||||||||||||
| (Dollars in millions) | |||||||||||||||||||||||||||
| Cash provided by (used in) operating activities |
$ | 38.3 | $ | 14.7 | $ | — | $ | 28.2 | $ | 9.1 | $ | (38.4 | ) | $ | 51.9 | ||||||||||||
| Cash provided by (used in) investing activities: |
|||||||||||||||||||||||||||
| Capital expenditures and acquisitions |
— | (24.8 | ) | — | (6.8 | ) | (8.4 | ) | — | (40.0 | ) | ||||||||||||||||
| Net cash proceeds (payments) from divestitures and asset sales |
— | 158.4 | — | 3.2 | (0.9 | ) | — | 160.7 | |||||||||||||||||||
| Net cash (used in) investing activities |
— | 133.6 | — | (3.6 | ) | (9.3 | ) | — | 120.7 | ||||||||||||||||||
| Cash provided by (used in) financing activities: |
|||||||||||||||||||||||||||
| Borrowings (repayments) of long-term debt |
— | (74.0 | ) | — | (9.3 | ) | — | — | (83.3 | ) | |||||||||||||||||
| Deferred financing costs |
— | (2.7 | ) | — | — | — | — | (2.7 | ) | ||||||||||||||||||
| Dividends paid |
(17.2 | ) | (38.4 | ) | — | — | — | 38.4 | (17.2 | ) | |||||||||||||||||
| Stock issued (repurchased) |
(21.3 | ) | 1.4 | — | — | — | — | (19.9 | ) | ||||||||||||||||||
| Net cash provided by (used in) financing activities |
(38.5 | ) | (113.7 | ) | — | (9.3 | ) | — | 38.4 | (123.1 | ) | ||||||||||||||||
| Effect of exchange rates on cash |
— | 2.9 | — | (3.9 | ) | 0.2 | — | (0.8 | ) | ||||||||||||||||||
| Net increase (decrease) in cash and cash equivalents |
(0.2 | ) | 37.5 | — | 11.4 | — | — | 48.7 | |||||||||||||||||||
| Add: Cash of assets held for sale at beginning of year |
— | — | — | — | 0.6 | — | 0.6 | ||||||||||||||||||||
| Less: Cash of assets held for sale at end of year |
— | — | — | — | — | — | — | ||||||||||||||||||||
| Cash and cash equivalents at beginning of year |
0.2 | — | — | 7.3 | 6.3 | — | 13.8 | ||||||||||||||||||||
| Cash and cash equivalents at end of period |
$ | — | $ | 37.5 | $ | — | $ | 18.7 | $ | 6.9 | $ | — | $ | 63.1 | |||||||||||||
89
Table of Contents
Condensed Consolidating Statement of Cash Flows
For the Year Ended December 31, 2007
| Parent | Koppers Inc. | Domestic Guarantor Subsidiaries |
Foreign Guarantor Subsidiaries |
Non-Guarantor Subsidiaries |
Consolidating Adjustments |
Consolidated | ||||||||||||||||||||||
| (Dollars in millions) | ||||||||||||||||||||||||||||
| Cash provided by (used in) operating activities |
$ | 12.5 | $ | 80.3 | $ | (11.5 | ) | $ | (2.9 | ) | $ | (0.3 | ) | $ | (12.0 | ) | $ | 66.1 | ||||||||||
| Cash provided by (used in) investing activities: |
||||||||||||||||||||||||||||
| Capital expenditures and acquisitions |
— | (15.1 | ) | — | (9.9 | ) | (3.4 | ) | — | (28.4 | ) | |||||||||||||||||
| Net cash proceeds (payments) from divestitures and asset sales |
— | 0.1 | 11.5 | 0.3 | — | — | 11.9 | |||||||||||||||||||||
| Net cash (used in) investing activities |
— | (15.0 | ) | 11.5 | (9.6 | ) | (3.4 | ) | — | (16.5 | ) | |||||||||||||||||
| Cash provided by (used in) financing activities: |
||||||||||||||||||||||||||||
| Borrowings (repayments) of long-term debt |
— | (52.9 | ) | — | 8.9 | (0.8 | ) | — | (44.8 | ) | ||||||||||||||||||
| Dividends paid |
(11.5 | ) | (14.6 | ) | — | — | — | 12.0 | (14.1 | ) | ||||||||||||||||||
| Stock issued (repurchased) |
(0.9 | ) | 1.2 | — | — | — | — | 0.3 | ||||||||||||||||||||
| Net cash provided by (used in) financing activities |
(12.4 | ) | (66.3 | ) | — | 8.9 | (0.8 | ) | 12.0 | (58.6 | ) | |||||||||||||||||
| Effect of exchange rates on cash |
— | 1.0 | — | 1.0 | 0.1 | — | 2.1 | |||||||||||||||||||||
| Net increase (decrease) in cash and cash equivalents |
0.1 | — | — | (2.6 | ) | (4.4 | ) | — | (6.9 | ) | ||||||||||||||||||
| Add: Cash of assets held for sale at beginning of year |
— | — | — | — | 2.5 | — | 2.5 | |||||||||||||||||||||
| Less: Cash of assets held for sale at end of year |
— | — | — | — | (0.6 | ) | — | (0.6 | ) | |||||||||||||||||||
| Cash and cash equivalents at beginning of year |
0.1 | — | — | 9.9 | 8.8 | — | 18.8 | |||||||||||||||||||||
| Cash and cash equivalents at end of period |
$ | 0.2 | $ | — | $ | — | $ | 7.3 | $ | 6.3 | $ | — | $ | 13.8 | ||||||||||||||
ITEM 9. CHANGES IN AND DISAGREEMENTS WITH ACCOUNTANTS ON ACCOUNTING AND FINANCIAL DISCLOSURE
None.
ITEM 9A. CONTROLS AND PROCEDURES
(a) Evaluation of Disclosure Controls and Procedures
Our management, with the participation of our chief executive officer and chief financial officer, have evaluated the effectiveness of our disclosure controls and procedures, as defined in Rules 13a-15(e) and 15d-15(e) of the Securities Exchange Act of 1934, as of the end of the period covered by this report. Based on that evaluation, our chief executive officer and chief financial officer have concluded that these controls and procedures were effective as of the end of the period covered by this report.
(b) Changes in Internal Control Over Financial Reporting
There were no changes in our internal control over financial reporting that occurred during our most recent fiscal quarter that have materially affected, or are reasonably likely to materially affect, our internal control over financial reporting.
See Management Report on page 43 for management’s annual report on internal control over financial reporting. See Report of Independent Registered Public Accounting Firm on page 45 for Ernst & Young LLP’s attestation report on internal control over financial reporting.
90
Table of Contents
Koppers Holdings Inc. 2009 Annual Report
PART III
ITEM 10. DIRECTORS, EXECUTIVE OFFICERS AND CORPORATE GOVERNANCE
The information required by Item 401 of Regulation S-K with respect to directors is contained in our definitive Proxy Statement for our 2010 Annual Meeting of Shareholders (the “Proxy Statement”) which we will file with the Securities and Exchange Commission, pursuant to Regulation 14A, not later than 120 days after the end of the Company’s fiscal year under the caption “Proxy Item 1 – Proposal for Election of Directors”, and is incorporated herein by reference.
The information required by this item concerning our executive officers is incorporated by reference herein from Part I of this report under “Executive Officers of the Company”.
The information required by Item 405 of Regulation S-K is included in the Proxy Statement under the caption “Section 16(a) Beneficial Ownership Reporting Compliance” and is incorporated herein by reference.
The information required by Item 407(d)(4) and Item 407(d)(5) of Regulation S-K is included in the Proxy Statement under the caption “Board Meetings and Committees” and is incorporated herein by reference.
The audit committee and our board have approved and adopted a Code of Business Conduct and Ethics for all directors, officers and employees and a Code of Ethics Applicable to Senior Officers, copies of which are available on our website at www.koppers.com and upon written request by our shareholders at no cost. We will describe the date and nature of any amendment to our Code of Business Conduct and Ethics or Code of Ethics Applicable to Senior Officers or any waiver (implicit or explicit) from a provision of our Code of Business Conduct and Ethics or Code of Ethics Applicable to Senior Officers within four business days following the date of the amendment or waiver on our Internet website at www.koppers.com. We do not intend to incorporate the contents of our website into this report.
ITEM 11. EXECUTIVE COMPENSATION
The information required by Item 11 is contained in the Proxy Statement under the caption “Executive Compensation” and “Committee Reports to Shareholders – Management Development and Compensation Committee Report” and is incorporated herein by reference.
ITEM 12. SECURITY OWNERSHIP OF CERTAIN BENEFICIAL OWNERS AND MANAGEMENT AND RELATED STOCKHOLDER MATTERS
The information required by Item 12 is contained in the Proxy Statement under the captions “Common Stock Ownership” and “Equity Compensation Plans” and is incorporated herein by reference.
ITEM 13. CERTAIN RELATIONSHIPS AND RELATED PARTY TRANSACTIONS, AND DIRECTOR INDEPENDENCE
The information required by Item 13 is contained in the Proxy Statement under the caption “Transactions with Related Persons” and “Corporate Governance Matters – Director Independence” and is incorporated herein by reference.
ITEM 14. PRINCIPAL ACCOUNTANT FEES AND SERVICES
The information required by Item 14 is contained in the Proxy Statement under the caption “Auditors” and is incorporated herein by reference.
91
Table of Contents
PART IV
ITEM 15. EXHIBITS AND FINANCIAL STATEMENT SCHEDULES
(a) 1. Financial Statements
Financial statements filed as part of this report are included in “Item 8 – Financial Statements and Supplementary Data” as listed on the index on page 42.
(a) 2. Financial Statement Schedules
“Schedule II – Valuation and Qualifying Accounts and Reserves is included on page 95. All other schedules are omitted because they are not applicable or the required information is contained in the applicable financial statements of notes thereto.
(a) 3. Exhibits
92
Table of Contents
Koppers Holdings Inc. 2009 Annual Report
EXHIBIT INDEX
| Exhibit No. | Exhibit | |
| 3.1 | Amended and Restated Articles of Incorporation of the Company (incorporated by reference to exhibit 3.1 to the Company’s Current Report on Form 8-K filed February 7, 2006). | |
| 3.2 | Amended and Restated Bylaws of the Company (incorporated by reference to exhibit 3.2 to the Company’s Quarterly Report on Form 10-Q filed August 9, 2007). | |
| 4.1*** | Indenture, by and among Koppers Inc., Koppers Holdings Inc., the Subsidiary Guarantors party thereto and Wells Fargo Bank, National Association, dated as of December 1, 2009. | |
| 4.2* *** | Subscription Agreement by and between Koppers Inc. and Mr. Walter Turner dated December 1, 2009. | |
| 4.3*** | Exchange and Registration Rights Agreement by and among Koppers Inc., Koppers Holdings and the other guarantors party hereto, Goldman, Sachs & Co., Banc of America Securities LLC, RBS Securities Inc. and UBS Securities LLC, dated December 1, 2009. | |
| 10.1 | Asset Purchase Agreement by and between Koppers Inc. and Koppers Company, Inc., dated as of December 28, 1988 (incorporated by reference to respective exhibits to the Koppers Inc.’s Prospectus filed February 7, 1994). | |
| 10.2 | Asset Purchase Agreement Guarantee provided by Beazer PLC, dated as of December 28, 1988 (incorporated by reference to respective exhibits to the Koppers Inc.’s Prospectus filed February 7, 1994). | |
| 10.9* | Employment agreement with Steven R. Lacy dated April 5, 2002 (incorporated by reference to Exhibit 10.35 of the Koppers Inc. Form 10-K filed March 5, 2003). | |
| 10.12* | Retirement Plan of Koppers Industries, Inc. and Subsidiaries for Salaried Employees (incorporated by reference to Exhibits to the Koppers Inc. Prospectus filed February 7, 1994 pursuant to Rule 424(b) of the Securities Act of 1933, as amended, in connection with the offering of the 8 1/2 % Senior Notes due 2004). | |
| 10.13* | Koppers Industries, Inc. Non-contributory Long Term Disability Plan for Salaried Employees (incorporated by reference to respective exhibits to the Koppers Inc. Prospectus filed February 7, 1994 pursuant to Rule 424(b) of the Securities Act of 1933, as amended, in connection with the offering of the 8 1/2% Senior Notes due 2004). | |
| 10.14* | Koppers Industries, Inc. Employee Savings Plan (incorporated by reference to respective exhibits to the Koppers Inc. Prospectus filed February 7, 1994 in connection with the offering of the 8 1/2% Senior Notes due 2004). | |
| 10.15* | Koppers Industries, Inc. Survivor Benefit Plan (incorporated by reference to respective exhibits to the Koppers Inc. Prospectus filed February 7, 1994 pursuant to Rule 424(b) of the Securities Act of 1933, as amended, in connection with the offering of the 8 1/2% Senior Notes due 2004). | |
| 10.22* | Employment agreement with Brian H. McCurrie dated October 13, 2003 (incorporated by reference to Exhibit 10.15 to the Koppers Inc. Form 10-K for the year ended December 31, 2003). | |
| 10.24** | Treatment Services Agreement between Koppers Inc. (f/k/a Koppers Industries, Inc.) and CSX Transportation, Inc. dated effective as of January 1, 2002 (incorporated by reference to Exhibit 10.34 to the Koppers Inc. Form 10-Q for the quarter ended September 30, 2002). | |
| 10.29** | Timber Tie Treating Agreement between Koppers Inc. and the Burlington Northern and Santa Fe Railway Company, dated April 28, 2003 (incorporated by reference to Exhibit 10.38 to the Koppers Inc. Form 10-Q for the quarter ended March 31, 2003). | |
| 10.30** | Memorandum of Agreement between Koppers Inc. and Union Pacific Railroad Company, dated August 1, 2003 (incorporated by reference to Exhibit 10.45 to the Koppers Inc. Form 10-Q for the quarter ended September 30, 2003). | |
| 10.32 | Amendment and Restatement to Article VII of the Asset Purchase Agreement by and between Koppers Inc. and Beazer East, Inc., dated July 15, 2004 (incorporated by reference to Exhibit 10.33 to the Koppers Inc. Form 10-Q for the quarter ended June 30, 2004). | |
| 10.33* | 2004 Restricted Stock Unit Plan (incorporated by reference to Exhibit 10.34 to the Koppers Inc. Form 10-Q for the quarter ended September 30, 2004). | |
| 10.34 | Agreement and Plan of Merger dated as of November 18, 2004, by and among Koppers Inc., Merger Sub for KI Inc. and Koppers Holdings Inc. (f/k/a KI Holdings Inc.) (incorporated by reference to Exhibit 10.34 to the Koppers Holdings Inc. (f/k/a KI Holdings Inc.) Registration Statement on Form S-4 filed February 14, 2005). | |
| 10.36* | Form of Change in Control Agreement entered into as of October 20, 2005 between Koppers Holdings Inc. (f/k/a KI Holdings Inc.) and certain executive officers (incorporated by reference to Exhibit 10.1 to the Company’s Current Report on Form 8-K filed on October 25, 2005). | |
| 10.37* | 2005 Long Term Incentive Plan effective as of December 7, 2005 (incorporated by reference to Exhibit 99.1 to the Company’s Current Report on Form 8-K filed on December 13, 2005). | |
| 10.41* | Koppers 2006 Senior Management Corporate Incentive Plan (incorporated by reference to Exhibit 99.1 to the Company’s Current Report on Form 8-K filed on March 2, 2006). |
93
Table of Contents
| Exhibit No. | Exhibit | |
| 10.42 | Asset Purchase Agreement dated April 28, 2006 between Reilly Industries, Inc. and Koppers Inc. (incorporated by reference to Exhibit 99.1 to the Company’s Current Report on Form 8-K filed on April 28, 2006). | |
| 10.44* | Form of Amendment to change in Control Agreement entered into as of May 25, 2006 between the Company and the named Executive (incorporated by reference to the Company’s Current Report on Form 8-K filed on May 26, 2006). | |
| 10.45 | Joint Venture Contract in relation to the establishment of Tangshan Koppers Kailuan Carbon Chemical Co., LTD, among Kailuan Clean Coal Company Limited, Koppers Mauritius, and Tangshan Iron & Steel Co,. Ltd. (incorporated by reference to Exhibit 10.45 to the Koppers Holdings Inc. Annual Report on Form 10-K for the year ended December 31, 2006). | |
| 10.47** | Amendment No. 1 to Treatment Services Agreement between Koppers Inc. and CSX Transportation, Inc. dated effective as of February 1, 2007 (incorporated by reference to Exhibit 10.47 to the Company’s Quarterly Report of Form 10-Q filed on May 3, 2007). | |
| 10.48 | Koppers Holdings Inc. Benefit Restoration Plan (incorporated by reference to Exhibit 10.1 to the Company’s Quarterly Report on Form 10-Q filed on August 9, 2007). | |
| 10.49 | Purchase Agreement dated as of August 3, 2008 by and among Koppers Inc., Carbon Investments, Inc., and ArcelorMittal S.A. (incorporated by reference to Exhibit 10.49 to the Company’s Quarterly Report on Form 10-Q filed on November 6, 2008). | |
| 10.50*** | Amended and Restated Credit Agreement by and among Koppers Inc., the Guarantors party thereto, the Lenders party thereto, PNC Capital Markets LLC and RBS Greenwich Capital as Co-Lead Arrangers; PNC Capital Markets LLC, Banc of America Securities LLC and RBS Greenwich Capital, as Joint Bookrunners; PNC Bank, National Association, as Administrative Agent; Bank of America, N.A., as Documentation Agent; and Citizens Bank of Pennsylvania, First Commonwealth Bank and Wells Fargo Bank, N.A., as Syndication Agents, dated as of October 31, 2008. | |
| 10.51* | Koppers Inc. Supplemental Executive Retirement Plan I. | |
| 10.52* | Koppers Inc. Supplemental Executive Retirement Plan II. | |
| 10.53* | Amendment to Employment Agreement with Steven R. Lacy effective as of January 1, 2009. | |
| 10.54* | Amendment to Employment Agreement with Brian H. McCurrie effective as of January 1, 2009. | |
| 10.55* | Amendment to Koppers Holdings Inc. Benefit Restoration Plan effective as of January 1, 2009. | |
| 10.56* | Amendment to the Employee Savings Plan of Koppers Inc. and Subsidiaries effective as of January 1, 2008. | |
| 10.57* | Amendment to the Retirement Plan for Koppers Inc. effective January 1, 2008. | |
| 10.58*** | Amendment No. 1 to Amended and Restated Credit Agreement by and among Koppers Inc., the Guarantors party thereto, the Lenders party thereto, PNC Capital Markets LLC and RBS Greenwich Capital, as Joint Bookrunners; PNC Bank, National Association, as Administrative Agent; Bank of America, N.A., as Documentation Agent; and Citizens Bank of Pennsylvania, First Commonwealth Bank and Wells Fargo Bank, N.A., as Syndication Agents, dated as of November 18, 2009. | |
| 12.1*** | Computation of ratio of earnings to fixed charges. | |
| 21*** | List of subsidiaries of the Company. | |
| 23.1*** | Consent of Independent Registered Public Accounting Firm. | |
| 31.1*** | Certification of Chief Executive Officer pursuant to Rule 13a-14(a). | |
| 31.2*** | Certification of Chief Financial Officer pursuant to Rule 13a-14(a). | |
| 32.1*** | Certification of Chief Executive Officer and Chief Financial Officer pursuant to Section 1350. | |
| * | Management Contract or Compensatory Plan. |
| ** | Certain portions have been omitted pursuant to a Confidential Treatment Request. The entire document has been filed confidentially with the SEC. |
| *** | Filed herewith. |
94
Table of Contents
Koppers Holdings Inc. 2009 Annual Report
KOPPERS HOLDINGS INC.
SCHEDULE II—VALUATION AND QUALIFYING ACCOUNTS
For the years ended December 31, 2009, 2008 and 2007
| Balance at Beginning of Year |
Increase (Decrease) to Expense |
Net (Write-Offs) Recoveries |
Business Disposition |
Currency Translation |
Balance at End of Year | |||||||||||||||||
| (Dollars in millions) | ||||||||||||||||||||||
| 2009 |
||||||||||||||||||||||
| Allowance for doubtful accounts |
$ | 0.5 | $ | — | $ | (0.1 | ) | $ | — | $ | 0.1 | $ | 0.5 | |||||||||
| Inventory obsolescence reserves |
$ | 1.5 | $ | 2.3 | $ | (0.2 | ) | $ | — | $ | 0.1 | $ | 3.9 | |||||||||
| Deferred tax valuation allowance |
$ | 8.2 | $ | 3.0 | $ | — | $ | — | $ | — | $ | 11.2 | ||||||||||
| 2008 |
||||||||||||||||||||||
| Allowance for doubtful accounts |
$ | 0.2 | $ | 0.5 | $ | (0.1 | ) | $ | — | $ | (0.1 | ) | $ | 0.5 | ||||||||
| Inventory obsolescence reserves |
$ | 1.3 | $ | 0.7 | $ | (0.5 | ) | $ | — | $ | — | $ | 1.5 | |||||||||
| Deferred tax valuation allowance |
$ | 10.0 | $ | (1.8 | ) | $ | — | $ | — | $ | — | $ | 8.2 | |||||||||
| 2007 |
||||||||||||||||||||||
| Allowance for doubtful accounts |
$ | 0.3 | $ | 0.2 | $ | (0.1 | ) | $ | (0.2 | ) | $ | — | $ | 0.2 | ||||||||
| Inventory obsolescence reserves |
$ | 2.3 | $ | (0.4 | ) | $ | (0.3 | ) | $ | (0.4 | ) | $ | 0.1 | $ | 1.3 | |||||||
| Deferred tax valuation allowance |
$ | 8.9 | $ | 1.1 | $ | — | $ | — | $ | — | $ | 10.0 | ||||||||||
95
Table of Contents
Pursuant to the requirements of Section 13 or 15(d) of the Securities Exchange Act of 1934, as amended, Koppers Holdings Inc. has duly caused this annual report on Form 10-K to be signed on its behalf by the undersigned, thereunto duly authorized.
| KOPPERS HOLDINGS INC. | ||
| BY: | /s/ BRIAN H. MCCURRIE | |
| Brian H. McCurrie | ||
| Chief Financial Officer | ||
Pursuant to the requirements of the Securities Exchange Act of 1934, as amended, this annual report on Form 10-K has been signed below by the following persons on behalf of the Registrant and in the capacities and on the date indicated.
| Signature | Capacity | Date | ||
| /S/ DAVID M. HILLENBRAND David M. Hillenbrand |
Director and Non-Executive Chairman of the Board | February 19, 2010 | ||
| /S/ WALTER W. TURNER Walter W. Turner |
Director and Chief Executive Officer | February 19, 2010 | ||
| /S/ BRIAN H. MCCURRIE Brian H. McCurrie |
Chief Financial Officer and Principal Accounting Officer | February 19, 2010 | ||
| /S/ CYNTHIA A. BALDWIN Cynthia A. Baldwin |
Director | February 19, 2010 | ||
| /S/ X. SHARON FENG X. Sharon Feng |
Director | February 19, 2010 | ||
| /S/ ALBERT J. NEUPAVER Albert J. Neupaver |
Director | February 19, 2010 | ||
| /S/ JAMES C. STALDER James C. Stalder |
Director | February 19, 2010 | ||
| /S/ STEPHEN R. TRITCH Stephen R. Tritch |
Director | February 19, 2010 | ||
| /S/ T. MICHAEL YOUNG T. Michael Young |
Director | February 19, 2010 | ||
96