Attached files
| file | filename |
|---|---|
| EX-32.1 - EXHIBIT 32.1 - NATIONAL INSTRUMENTS CORP | ex32_1.htm |
| EX-31.1 - EXHIBIT 31.1 - NATIONAL INSTRUMENTS CORP | ex31_1.htm |
| EX-23.1 - EXHIBIT 23.1 - NATIONAL INSTRUMENTS CORP | ex23_1.htm |
| EX-21.1 - EXHIBIT 21.1 - NATIONAL INSTRUMENTS CORP | ex21_1.htm |
| EX-31.2 - EXHIBIT 31.2 - NATIONAL INSTRUMENTS CORP | ex31_2.htm |
UNITED
STATES
SECURITIES
AND EXCHANGE COMMISSION
Washington,
D.C. 20549
FORM
10-K
T ANNUAL
REPORT PURSUANT TO SECTION 13 OR 15(D) OF THE SECURITIES EXCHANGE ACT OF
1934
For the
fiscal year ended: December 31, 2009 or
£ TRANSITION
REPORT PURSUANT TO SECTION 13 OR 15(D) OF THE SECURITIES EXCHANGE ACT OF
1934
For the
transition period from ________________ to ________________
Commission
file number: 0-25426

NATIONAL
INSTRUMENTS CORPORATION
(Exact
name of registrant as specified in its charter)
|
Delaware
|
74-1871327
|
|
|
(State
or other jurisdiction of incorporation or organization)
|
(I.R.S.
Employer Identification Number)
|
|
|
11500
North MoPac Expressway
Austin,
Texas
|
78759
|
|
|
(address
of principal executive offices)
|
(zip
code)
|
Registrant's
telephone number, including area code: (512) 338-9119
Securities
registered pursuant to Section 12(b) of the Act:
|
Title
of Each Class
|
Name
of Each Exchange on Which Registered
|
|
|
Common
Stock, $0.01 par value
|
The
NASDAQ Stock Market, LLC
|
Securities
registered pursuant to Section 12(g) of the Act:
Preferred
Stock Purchase Rights
Indicate
by check mark if the registrant is a well-known seasoned issuer, as defined in
Rule 405 of the Securities Act. Yes T No £
Indicate
by check mark if the registrant is not required to file reports pursuant to
Section 13 or Section 15(d) of the Act. Yes £ No T
Indicate
by check mark whether the registrant (1) has filed all reports required to be
filed by Section 13 or 15(d) of the Securities Exchange Act of 1934 during the
preceding 12 months (or for such shorter period that the registrant was required
to file such reports), and (2) has been subject to such filing requirements for
the past 90 days. Yes T No £
Indicate
by check mark whether the registrant has submitted electronically and posted on
its corporate Web site, if any, every Interactive Data File required to be
submitted and posted pursuant to Rule 405 of Regulation S-T (§232.405 of this
chapter) during the preceding 12 months (or for such shorter period that the
registrant was required to submit and post such files). Yes £ No £
Indicate
by check mark if disclosure of delinquent filers pursuant to Item 405 of
Regulation S-K (§229.405 of this chapter) is not contained herein, and will not
be contained, to the best of registrant’s knowledge, in definitive proxy or
information statements incorporated by reference in Part III of this Form 10-K
or any amendment to this Form 10-K. T
Indicate
by check mark whether the registrant is a large accelerated filer, an
accelerated filer, a non-accelerated filer or a smaller reporting company. See
the definitions of “large accelerated filer”, “accelerated filer” and “smaller
reporting company” in Rule 12b-2 of the Exchange Act. (Check one):
Large
accelerated filer T Accelerated
filer £ Non-accelerated
filer £ Smaller
reporting company £
Indicate
by check mark whether the registrant is a shell company (as defined in Rule
12b-2 of the Act). Yes £ No T
The
aggregate market value of voting and non-voting common equity held by
non-affiliates of the registrant at the close of business on June 30, 2009, was
$974,659,387 based upon the last sales price reported for such date
on the NASDAQ Stock Market. For purposes of this disclosure, shares of Common
Stock held by persons who hold more than 5% of the outstanding shares of Common
Stock and shares held by officers and directors of the registrant as of June 30,
2009 have been excluded in that such persons may be deemed to be affiliates.
This determination is not necessarily conclusive.
At the
close of business on February 16, 2010 registrant had
outstanding 78,352,719 shares of Common Stock.
DOCUMENTS
INCORPORATED BY REFERENCE
Part III
incorporates certain information by reference from the definitive proxy
statement to be filed by the registrant for its Annual Meeting of Stockholders
to be held on May 11, 2010 (the “Proxy Statement”).
PART
I
This
Form 10-K contains forward-looking statements within the meaning of Section 27A
of the Securities Act of 1933 and Section 21E of the Securities Exchange Act of
1934. Any statements contained herein regarding our future financial performance
or operations (including, without limitation, statements to the effect that we
“believe,” “expect,” “plan,” “may,” “will,” “project,” “continue,” or “estimate”
or other variations thereof or comparable terminology or the negative thereof)
should be considered forward-looking statements. Actual results could differ
materially from those projected in the forward-looking statements as a result of
a number of important factors including those set forth under the heading “Risk Factors” beginning on page 10, and elsewhere in
this Form 10-K. Although we believe that the expectations reflected in the
forward-looking statements are reasonable, we cannot guarantee future results,
levels of activity, performance or achievements. You should not place undue
reliance on these forward-looking statements. We disclaim any obligation to
update information contained in any forward-looking statement.
ITEM
1. BUSINESS
National
Instruments Corporation (“we”, “us” or “our”) is a leading supplier of
measurement and automation products that engineers and scientists use in a wide
range of industries. These industries comprise a large and diverse market for
design, control and test applications. We provide flexible application software
and modular, multifunction hardware that users combine with industry-standard
computers, networks and third-party devices to create measurement, automation
and embedded systems, which we also refer to as “virtual instruments.” Our
approach gives customers the ability to quickly and cost-effectively design,
prototype and deploy unique custom-defined solutions for their design, control
and test application needs.
We are
based in Austin, Texas and were incorporated under the laws of the State of
Texas in May 1976 and were reincorporated in Delaware in June 1994. On March 13,
1995, we completed an initial public offering of our common stock. Our common
stock, $0.01 par value, is quoted on the NASDAQ Stock Market under the trading
symbol NATI.
Our
Internet website address is http://www.ni.com. Our annual report on Form 10-K,
quarterly reports on Form 10-Q, current reports on Form 8-K and amendments to
those reports filed or furnished pursuant to Section 13(a) or 15(d) of the
Securities Exchange Act of 1934 are available upon written request and without
charge through our Internet website as soon as reasonably practicable after we
electronically file such material with, or furnish them to, the SEC. Our
Internet website and the information contained therein or connected thereto are
not intended to be incorporated into this Annual Report on Form
10-K.
Industry
Background
Engineers
and scientists have long used instruments to observe, better understand and
manage the real-world phenomena, events and processes related to their
industries or areas of expertise. Instruments measure and control electrical
signals, such as voltage, current and power, as well as physical phenomena, such
as temperature, pressure, speed, flow, volume, torque and vibration. Common
general-purpose instruments include voltmeters, signal generators,
oscilloscopes, data loggers, spectrum analyzers, cameras, and temperature and
pressure monitors and controllers. Some traditional instruments are also highly
application specific, designed to measure specific signals for particular
vertical industries or applications. Instruments used for industrial automation
applications include data loggers, strip chart recorders, programmable logic
controllers (“PLCs”), and proprietary turn-key devices and/or systems designed
to automate specific vertical applications. Measurement and control
functionality is also used in a variety of embedded and/or real-time
applications, such as machine monitoring, machine control, and embedded design
and prototyping.
Measurement
and automation applications can be generally categorized as either test and
measurement (“T&M”) or industrial/embedded. T&M applications generally
involve testing during the research, design, manufacture and service of a wide
variety of products. Industrial/embedded applications generally involve
designing, prototyping and deploying the machinery and processes used in the
production and distribution of a wide variety of products and
materials.
Instruments
and systems for design, control, and test applications have historically shared
common limitations, including: fixed, vendor-defined functionality, proprietary,
closed architectures that were generally difficult to program and integrate with
other systems; and inflexible operator interfaces that were usually cumbersome
to operate and change. Proprietary instrumentation systems have traditionally
been very expensive, with industrial/embedded system prices ranging as high as
several million dollars and T&M instrumentation system prices often ranging
in the hundreds of thousands of dollars. In addition, the limitations on the
programmability of traditional systems means that adapting these systems to
changing requirements can be both expensive and time consuming, and users are
often required to purchase multiple single-purpose instruments.
Our
Approach to Measurement and Automation
A virtual
instrument is a user-defined measurement and automation system that consists of
an industry standard computer (which may be a mainstream general-purpose
computer, workstation, handheld PDA device, or a version of an industry standard
computer, workstation, or handheld PDA that is specially designed and packaged
for harsh industrial or embedded environments) equipped with our user-friendly
application software, cost-effective hardware and driver software. Virtual
instrumentation represents a fundamental shift from traditional
hardware-centered instrumentation systems to software-centered systems that
exploit the computational, display, productivity and connectivity capabilities
of computers, networks and the Internet. Because virtual instruments exploit
these computation, connectivity, and display capabilities, users can define and
change the functionality of their instruments, rather than being restricted by
fixed-functions imposed by traditional instrument and automation vendors. Our
products empower users to monitor and control traditional instruments, create
innovative computer-based systems that can replace traditional instruments at a
lower cost, and develop systems that integrate measurement functionality
together with industrial and embedded capabilities. We believe that giving users
flexibility to create their own user-defined virtual instruments for an
increasing number of applications in a wide variety of industries, and letting
users leverage the latest technologies from computers, networking and
communications shortens system development time and reduces both the short- and
long-term costs of developing, owning and operating measurement and automation
systems, and improves the efficiency and precision of applications spanning
research, design, production and service.
Compared
with traditional solutions, we believe our products and computer-based, virtual
instrumentation approach provide the following significant customer
benefits:
Performance,
Ease of Use and Efficiency
Our
virtual instrument application software brings the power and ease of use of
computers, PDAs, networks and the Internet to instrumentation. With features
such as graphical programming, automatic code generation capabilities, graphical
tools libraries, ready-to-use example programs, libraries of specific
instrumentation functions, and the ability to deploy their applications on a
range of platforms, users can quickly build a virtual instrument system that
meets their individual application needs. In addition, the continuous
performance improvement of PC and networking technologies, which are the core
platform for our approach, results in direct performance benefits for virtual
instrument users in the form of faster execution for software-based measurement
and automation applications, resulting in shorter test times, faster automation,
and higher manufacturing throughput.
Modularity,
Reusability and Reconfigurability
Our
products include reusable hardware and software modules that offer considerable
flexibility in configuring systems. This ability to reuse and reconfigure
measurement and automation systems allows users to reduce development time and
improve efficiency by eliminating duplicated programming efforts and to quickly
adapt their systems to new and changing needs. In addition, these features help
protect both hardware and software investments against
obsolescence.
Lower
Total Solution Cost
We
believe that our products and solutions offer price/performance and energy
efficiency advantages over traditional solutions. Virtual instrumentation
provides users the ability to utilize industry standard computers and
workstations, portable PDAs and other handheld devices, as well as ruggedized
industrial computers equipped with modular and reusable application software,
cost-effective hardware and driver software that together perform the functions
that would otherwise be performed by costly, proprietary systems. In addition,
virtual instrumentation gives users the flexibility and portability to adapt to
changing needs, whereas traditional closed systems are both expensive and time
consuming to adapt, if adaptable at all.
Products,
Technology and Services
We offer
an extensive line of measurement and automation products that empower engineers
and scientists to more efficiently create automated test, industrial control,
and embedded design applications. Our products consist of off-the-shelf
application software and modular, cost-effective hardware components together
with related driver software. We design our products to work either separately,
as stand-alone products or as an integrated solution; however, customers
generally purchase our software and hardware together. We believe that the
flexibility, functionality and ease of use of our application software promotes
sales of our other software and hardware products.
Application
Software
For more
than 20 years, we have pioneered measurement and automation application software
for virtual instrumentation, which we believe plays an increasingly important
role in the development of computer-based systems for test, control, and design
applications. Our application software products leverage the increasing
capability of computers, networks and the Internet for data analysis,
connectivity and presentation power to bring increasing efficiency and precision
to measurement and automation applications. Our application software products
include LabVIEW, LabVIEW Real-Time, LabVIEW FPGA, Measurement Studio,
LabWindows/CVI, DIAdem,
NI TestStand, NI VeriStand, and Multisim. Our application software products are
integrated with our hardware/driver software.
We offer
a variety of software products for developing test, control, and design
applications to meet our customer’s programming and computer preferences.
LabVIEW, LabWindows/CVI, and Measurement Studio are programming environments
where users can design, prototype, and deploy systems. With these software
products, users can design custom virtual instruments by creating a graphical
user interface (“GUI”) on the computer screen through which they operate the
actual program and control selected hardware. Users can customize front panels
with knobs, buttons, dials and graphs to emulate control panels of instruments
or add custom graphics to visually represent the control and operation of
processes. LabVIEW, LabWindows/CVI and Measurement Studio also have ready-to-use
libraries for controlling thousands of programmable instruments, including our
hardware products, as well as traditional serial, General Purpose Interface Bus
(“GPIB”), VME extensions for instrumentation (“VXI”), PCI, PCI Express, PCI
Extensions for Instrumentation (“PXI”), PXI Express, Ethernet and USB
measurement and automation devices from other vendors.
The
principal difference between LabVIEW, LabWindows/CVI, and Measurement Studio is
in the way users develop programs. With LabVIEW, users program graphically,
developing application programs by connecting icons to create “block diagrams”
which are natural design notations for scientists and engineers. With LabVIEW
Real-Time, the user can easily configure their application program to execute
using a real-time operating system kernel instead of the Windows operating
system, so users can easily build virtual instrument solutions for
mission-critical applications that require highly reliable operation. In
addition, with LabVIEW Real-Time, users can easily configure their programs to
execute remotely on embedded processors inside PXI systems, on embedded
processors inside CompactRIO distributed I/O systems, or on processors embedded
on plug-in PC data acquisition boards. With LabVIEW FPGA, the user can configure
their application to execute directly in silicon via a Field Programmable Gate
Array (“FPGA”) residing on one of our reconfigurable I/O hardware products.
LabVIEW FPGA allows users to easily build their own highly specialized, custom
hardware devices for ultra high-performance requirements or for unique or
proprietary measurement or control protocols.
LabWindows/CVI
users use the conventional, text-based programming language of C for creating
test and control applications. Measurement Studio consists of measurement and
automation add-on libraries and additional tools for programmers that use
Microsoft’s Visual Basic, Visual C++, Visual C#, and Visual Studio.NET
development environments.
We offer
a software product called NI TestStand targeted for T&M applications in a
manufacturing environment. TestStand is a test management environment for
organizing, controlling, and running automated prototype, validation, and
manufacturing test systems. It also generates customized test reports and
integrates product and test data across the customers’ enterprise and across the
Internet. TestStand manages tests that are written in LabVIEW, LabWindows/CVI,
Measurement Studio, C and C++, and Visual Basic, so test engineers can easily
share and re-use test code throughout their organization and from one product to
the next. TestStand is a key element of our strategy to broaden the reach of our
application software products across the corporate enterprise.
NI
Multisim equips engineers, educators, and students with powerful and innovative
circuit design technology. Educators and students can take advantage of
easy-to-use teaching tools to overcome the traditional hurdles in electronics
education. Professional engineers can improve productivity with intuitive
capture tools, interactive simulation, board layout, and design validation.
Multisim was added to our software offering in 2005, when we acquired
Electronics Workbench and its suite of software for electronic design
automation.
NI
DIAdem offers users
configuration-based technical data management, analysis, and report generation
tools to interactively mine and analyze data. DIAdem helps users make informed
decisions and meet the demands of today’s testing environments, which require
quick access to large volumes of scattered data, consistent reporting, and data
visualization.
In 2009
we introduced NI VeriStand, a ready-to-use software environment for configuring
real-time testing applications, including hardware-in-the-loop ("HIL") test
systems. With NI VeriStand, users configure real-time I/O, stimulus
profiles, data logging, alarming, and other tasks; implement control algorithms
or system simulations by importing models from a variety of software
environments; build test system user interfaces quickly; and add custom
functionality using NI LabVIEW, NI TestStand, and other software
environments.
Hardware
Products and Related Driver Software
Using
cutting-edge commercial technology, such as the latest ADCs, FPGSs, and PC
busses, NI hardware delivers modular and easy-to-use solutions for a wide range
of applications – from automated test and data logging to industrial control and
embedded design. Our hardware and related driver software products include data
acquisition ("DAQ"), PXI chassis and controllers, image acquisition, motion
control, distributed I/O, modular instruments and embedded control
hardware/software, industrial communications interfaces, GPIB interfaces, and
VXI Controllers. The high level of integration between our products provides
users with the flexibility to mix and match hardware components when developing
custom virtual instrumentation systems.
DAQ Hardware/Driver
Software. Our DAQ hardware and driver software products are
“instruments on a board” that users can combine with sensors, signal
conditioning hardware and software to acquire analog data and convert it into a
digital format that can be accepted by a computer. Computer-based DAQ products
are typically a lower-cost solution than traditional instrumentation.
Applications suitable for automation with computer-based DAQ products are
widespread throughout many industries, and many systems currently using
traditional instrumentation (either manual or computer-controlled) could be
displaced by computer-based DAQ systems. We offer a range of computer-based DAQ
products, including models for digital, analog and timing input-output, and for
transferring data directly to a computer’s random-access memory. In
2006, we introduced NI CompactDAQ a rugged, portable, USB data acquisition
system designed for high-performance mixed-signal measurement systems. In 2008,
we introduced our first data acquisition devices that leverage wireless
technologies, an extension of PC-based data acquisition for measurement
applications where wiring is difficult or cost-prohibitive.
PXI Modular Instrumentation
Platform. Our PXI modular instrument platform, which was
introduced in 1997, is a standard PC packaged in a small, rugged form factor
with expansion slots and instrumentation extensions. It combines mainstream PC
software and PCI hardware with advanced instrumentation capabilities. In
essence, PXI is an instrumentation PC with several expansion slots ideal for
complete system-level opportunities and delivering a much higher percentage of
the overall system content using our own products. We continue to expand our PXI
product offerings with new modules, which address a wide variety of measurement
and automation applications. The platform is now a testing standard, with 70
companies developing on the platform and investing in its future through the PXI
System Alliance ("PXISA"). In 2006, we introduced our first PXI Express products
which provide backward software compatibility with PXI while providing advanced
capabilities for high-performance instrumentation, such as RF
instrumentation.
Modular
Instruments. We offer a variety of modular instrument devices
used in general purpose test and communication test
applications. These devices include digitizers, digital multimeters,
signal generators, RF analyzers/generators, power supplies, and switch modules
that users can configure through software to meet their specific measurement
tasks. Because these instruments are modular and software-defined, they can
be quickly interchanged and easily repurposed to meet evolving test needs.
Additionally, NI modular instruments provide high-speed test execution by
harnessing the power of industry-standard PC and advanced timing and
synchronization technologies. Options are available for a variety of platforms
including PXI, PXI Express, PCI, PCI Express, and USB.
Machine Vision/Image
Acquisition. Our machine vision platform includes hardware
ranging from plug-in devices for PCI and PXI systems to image processing on the
sensor itself with the NI Smart Camera. Software options include image
acquisition software to acquire images from thousands of cameras, a world-class
image processing library, and a configurable interface for industrial machine
vision applications. In 1996, we introduced our first image acquisition hardware
which provides users with a cost-effective solution to integrate vision into
their measurement and automation applications. Our vision software is designed
to work with many different software environments, including LabVIEW. In 2003,
we introduced our Vision Builder software for automated inspection and our
Compact Vision System, which is a small, ruggedized, industrial vision system
that can connect up to three IEEE-1394 cameras and that is easily programmed
using Vision Builder. In 2007, we introduced our first integrated Smart Cameras
which leverage our LabVIEW software to provide integrated solutions for many
inspection and other industrial/embedded applications.
Motion Control. By
integrating flexible software with high-performance hardware, our motion control
products offer a powerful solution for motion system design. From automating
test equipment and research labs to controlling biomedical, packaging, and
manufacturing machines, engineers use our motion products to meet a diverse set
of application challenges. Our software tools for motion easily integrate with
our other product lines, so users can combine motion control with image
acquisition, test, measurement, data acquisition, and automation to create
robust, flexible solutions. We introduced our first line of motion control
hardware, software and peripheral products in 1997.
Distributed I/O and Embedded Control
Hardware/Software. Our distributed I/O products, including
Compact FieldPoint, and CompactRIO, are designed for remote measurement,
industrial control, and embedded data-logging applications. Compact FieldPoint
is an intelligent, distributed, and modular I/O system that gives industrial
system developers an economical solution for distributed data acquisition,
monitoring and control applications. Suitable for direct connection to
industrial signals, Compact FieldPoint includes a wide array of rugged and
isolated analog and digital I/O modules, terminal base options, and network
modules. With LabVIEW Real-Time users can download their LabVIEW code and easily
create networked systems of intelligent, real-time nodes for embedded
measurement and control. In 2004, we introduced CompactRIO, an advanced embedded
control and acquisition system powered by our reconfigurable I/O ("RIO")
technology. CompactRIO leverages LabVIEW Real-Time and LabVIEW FPGA for
industrial control, process monitoring, and embedded machine applications that
require intelligent I/O products with a small form factor, a wide operating
temperature, and resistance to shock and vibration. In 2008, we
introduced Single-Board RIO, which is a board-only, lower-cost version of
CompactRIO designed for higher volume system deployments.
Industrial Communications
Interfaces. In 1995, we began shipping our first interface
boards for communicating with serial devices, such as data loggers and PLCs
targeted for industrial/embedded applications, and benchtop instruments, such as
oscilloscopes, targeted for test and measurement applications. We offer hardware
and driver software product lines for communication with industrial
devices—Controller Area Network ("CAN"), DeviceNet, Foundation Fieldbus, and
RS-485 and RS-232.
GPIB Interfaces/Driver
Software. We began selling GPIB products in 1977 and are a
leading supplier of GPIB interface boards and driver software to control
traditional GPIB instruments. These traditional instruments are manufactured by
a variety of third-party vendors and are used primarily in T&M applications.
Our diverse portfolio of hardware and software products for GPIB instrument
control is available for a wide range of computers. Our GPIB product line also
includes products for controlling GPIB instruments using the computer’s standard
parallel, USB, IEEE 1394 ("Firewire"), Ethernet, and serial ports.
VXI Controllers//Driver
Software. We are a leading supplier of VXI computer controller
hardware and the accompanying NI-VXI and NI-VISA driver software. We also offer
LabVIEW, LabWindows/CVI, Measurement Studio and TestStand software products for
VXI systems.
Services
Customer Training Courses. We
offer fee-based training classes and self-paced course kits for many of our
software and hardware products. On-site courses are quoted per customer requests
and we include on-line course offerings with live teachers. We also offer
programs to certify programmers and instructors for our products.
Software
Maintenance
Software
maintenance revenue is post contract customer support that provides the customer
with unspecified upgrades/updates and technical support.
Markets
and Applications
Our
products are used across many industries in a variety of applications including
research and development, simulation and modeling, product design and
validation, production testing and industrial control and field and factory
service and repair. We serve the following industries and applications
worldwide: advanced research, automotive, automated test equipment, commercial
aerospace, computers and electronics, continuous process manufacturing,
education, government/defense, medical research/pharmaceutical, power/energy,
semiconductors, telecommunications and others.
Customers
We have a
broad customer base, with no customer accounting for more than 3% of our sales
in 2009, 2008 or 2007.
Marketing
Through
our worldwide marketing efforts, we strive to educate engineers and scientists
about the benefits of our virtual instrumentation philosophy, products and
technology, and to highlight the performance, ease of use and cost advantages of
our products. We also seek to present our position as a technological leader
among producers of instrumentation software and hardware and to help promulgate
industry standards that can benefit users of computer-based
instrumentation.
We reach
our intended audience through our Web site at ni.com as well as through the
distribution of written and electronic materials including demonstration
versions of our software products, participation in tradeshows and technical
conferences and training and user seminars.
We
actively market our products in higher education environments, and we identify
many colleges, universities and trade and technical schools as key accounts. We
offer special academic pricing and products to enable universities to utilize
our products in their classes and laboratories. We believe our prominence in the
higher education area can contribute to our future success because students gain
experience using our products before they enter the work force.
Sales
and Distribution
We sell
our software and hardware products primarily through a direct sales
organization. We also use independent distributors, OEMs, VARs, system
integrators and consultants to market our products. Our Hungarian manufacturing
facility sources a substantial majority of our sales throughout the world. We
have sales offices in the United States and sales offices and distributors in
key international markets. Sales outside of the U.S. accounted for approximately
61%, 61% and 59%, of our revenues in 2009, 2008 and 2007, respectively. We
expect that a significant portion of our total revenues will continue to be
derived from international sales. (See Note 12 – Segment
information of Notes to Consolidated Financial Statements for details concerning
the geographic breakdown of our net sales, operating income, interest income and
identifiable assets.)
We
believe the ability to provide comprehensive service and support to our
customers is an important factor in our business. We permit customers to return
products within 30 days from receipt for a refund of the purchase price less a
restocking charge. Our products are generally warranted against defects in
materials and workmanship for one year from the date we ship the products to our
customers. Historically, warranty costs have not been material.
The
marketplace for our products dictates that many of our products be shipped very
quickly after an order is received. As a result, we are required to maintain
significant inventories. Therefore, inventory obsolescence is a risk for us due
to frequent engineering changes, shifting customer demand, the emergence of new
industry standards and rapid technological advances including the introduction
by us or our competitors of products embodying new technology. We strive to
mitigate this risk by monitoring inventory levels against product demand and
technological changes. There can be no assurance that we will be successful in
these efforts in the future.
Our
foreign operations are subject to certain risks set forth on page 14 under
“We are Subject to Various
Risks Associated with International Operations and Foreign
Economies.”
See
discussion regarding fluctuations in our quarterly results and seasonality in ITEM 1A, Risk Factors, “Our Revenues are Subject to Seasonal
Variations.”
Competition
The
markets in which we operate are characterized by intense competition from
numerous competitors, some of which are divisions of large corporations having
far greater resources than we have, and we may face further competition from new
market entrants in the future. A key competitor is Agilent Technologies Inc.
(“Agilent”). Agilent offers hardware and software products that provide
solutions that directly compete with our virtual instrumentation products.
Agilent is aggressively advertising and marketing products that are competitive
with our products. Because of Agilent's strong position in the instrumentation
business, change in its marketing strategy or product offerings could have a
material adverse effect on our operating results.
We
believe our ability to compete successfully depends on a number of factors both
within and outside our control, including:
|
·
|
new
product introductions by
competitors;
|
|
·
|
product
pricing;
|
|
·
|
the
impact of foreign exchange rates on product
pricing;
|
|
·
|
quality
and performance;
|
|
·
|
success
in developing new products;
|
|
·
|
adequate
manufacturing capacity and supply of components and
materials;
|
|
·
|
efficiency
of manufacturing operations;
|
|
·
|
effectiveness
of sales and marketing resources and
strategies;
|
|
·
|
strategic
relationships with other suppliers;
|
|
·
|
timing
of our new product introductions;
|
|
·
|
protection
of our products by effective use of intellectual property
laws;
|
|
·
|
the
outcome of any material intellectual property
litigation;
|
|
·
|
the
financial strength of our
competitors;
|
|
·
|
barriers
to entry imposed by competitors with significant market power in new
markets;
|
|
·
|
general
market and economic conditions;
and,
|
|
·
|
government
actions throughout the world.
|
There can
be no assurance that we will be able to compete successfully in the
future.
Research
and Development
We
believe that our long-term growth and success depends on delivering high quality
software and hardware products on a timely basis. We intend to focus our
research and development efforts on enhancing existing products and developing
new products that incorporate appropriate features and functionality to be
competitive with respect to technology and price/performance
characteristics.
Our
research and development staff strives to build quality into products at the
design stage in an effort to reduce overall development and manufacturing costs.
Our research and development staff also designs proprietary application specific
integrated circuits (“ASICs”), many of which are designed for use in several of
our products. The goal of our ASIC design program is to further differentiate
our products from competing products, to improve manufacturability and to reduce
costs. We seek to reduce our time to market for new and enhanced products by
sharing our internally developed hardware and software components across
multiple products.
As of
December 31, 2009, we employed 1,457 people in product research and development.
Our research and development expenses were $133 million, $143 million and $127
million for 2009, 2008 and 2007, respectively.
Intellectual
Property
We rely
on a combination of patent, trade secret, copyright and trademark law, contracts
and technical measures to establish and protect our proprietary rights in our
products. As of December 31, 2009, we held 502 United States patents (495
utility patents and 7 design patents) and 20 patents in foreign countries (18
patents registered in Europe in various countries; and 2 patents in Japan), and
had 296 patent applications pending in the United States and foreign countries.
124 of our issued United States patents are software patents related to LabVIEW,
and cover fundamental aspects of the graphical programming approach used in
LabVIEW. Our patents expire from 2011 to 2027. No assurance can be given that
our pending patent applications will result in the issuance of patents. We also
own certain registered trademarks in the United States and abroad. See further
discussion regarding risks associated with our patents in ITEM 1A, Risk Factors, “Our Business Depends on Our
Proprietary Rights and We are Subject to Intellectual Property
Litigation.”
Manufacturing
and Suppliers
We
manufacture a substantial majority of our products at our facility in Debrecen,
Hungary. Additional production primarily of low volume or newly introduced
products is done in Austin, Texas. Our product manufacturing operations can be
divided into four areas: electronic circuit card and module assembly; chassis
and cable assembly; technical manuals and product support documentation; and
software duplication. We manufacture most of the electronic circuit card
assemblies, and modules in-house, although subcontractors are used from time to
time. We currently use subcontractors in Asia to manufacture a significant
portion of our chassis, but we review these arrangements periodically. We
manufacture some of our electronic cable assemblies in-house, but many
assemblies are produced by subcontractors. We primarily subcontract our software
duplication, our technical manuals and product support
documentation.
Our
manufacturing processes use large volumes of high-quality components and
subassemblies supplied by outside sources in the U.S., Europe and Asia. Several
of these components are available through limited sources. Limited source
components purchased include custom ASICs, chassis and other components. Any
disruption of our supply of limited source components, whether resulting from
business demand, quality, production or delivery problems, could adversely
affect our ability to manufacture our products, which could in turn adversely
affect our business and results of operations. See “Our Business is Dependent on Key
Suppliers” at page 14 for additional discussion of the risks
associated with limited source suppliers.
See “Our Manufacturing Operations are
Subject to a Variety of Environmental Regulations and Costs” at
page 15 for discussion of environmental matters as they may affect our
business.
Backlog
Backlog
is a measure of orders that are received but that are not shipped to customers
at the end of the quarter. We typically ship products shortly following the
receipt of an order. Accordingly, our backlog typically represents less than 5
days sales. Backlog should not be viewed as an indicator of our future sales.
During the year ended December 31, 2009, our order backlog increased by
approximately $8 million.
Employees
As of
December 31, 2009, we had 5,120 employees worldwide, including 1,457 in research
and development, 2,338 in sales and marketing and customer support, 755 in
manufacturing and 570 in administration and finance. None of our employees are
represented by a labor union and we have never experienced a work stoppage. We
consider our employee relations to be good. For eleven consecutive years, from
1999 to 2009, we have been named among the 100 Best Companies to Work for in
America according to FORTUNE
magazine.
Continuing
Uncertainty in General Economic Conditions and Fluctuations in the Global Credit
and Equity Markets Have Adversely Affected Our Financial Condition and Results
of Operations. Our business is
sensitive to changes in general economic conditions, both in the U.S. and
globally. Due to the continued concerns regarding the availability of credit,
our current or potential customers may delay or reduce purchases of our products
which may continue to have an adverse effect on our revenues and therefore harm
our business and results of operations. The continuing uncertainty in the credit
markets is likely to continue to have an adverse effect on the U.S. and world
economies, which could continue to negatively impact the spending patterns of
businesses including our current and potential customers. Historically, our
business cycles have corresponded to changes in the global Purchasing Managers
Index (“PMI”). From June 2008 to July 2009, this index indicated a contracting
industrial economy. Starting in August 2009, the index has had
readings above 50 which are indicative of expansion in the industrial global
economy; however, we continue to believe there is still a substantial amount of
uncertainty about the global industrial economy. We are unable to predict
whether the current expansion cycle, as measured by the PMI, will be sustained
throughout 2010. This continuing uncertainty in the global industrial economy is
likely to continue to have an adverse effect on the spending patterns of
businesses including our current and potential customers which could adversely
affect our revenues and therefore harm our business and result of
operations.
Concentrations of
Credit Risk and Negative Conditions in the Global Financial Markets May
Adversely Affect Our Financial Condition and Result of Operations. By virtue of our
holdings of investment securities and foreign currency derivatives, we have
exposure to many different counterparties, and routinely execute transactions
with counterparties in the financial services industry, including commercial
banks and investment banks. Many of these transactions expose us to credit risk
in the event of a default of our counterparties. We have policies relating to
initial credit rating requirements and to exposure limits to counterparties,
which are designed to mitigate credit and liquidity risk. There can be no
assurance, however, that any losses or impairments to the carrying value of our
financial assets as a result of defaults by our counterparties, would not
materially and adversely affect our business, financial position and results of
operations.
Negative
Conditions in the Global Credit Markets Have Impaired the Liquidity of a Portion
of Our Investment Portfolio. Our short-term investments
include auction rate securities backed by education loan revenue bonds. One of
our auction rate securities is from the Vermont Student Assistance Corporation
and has a par value of $2.2 million. The other of our auction rate securities is
from the New Hampshire Health and Education Facilities Authority and has a par
value of $6.4 million. On January 15, 2010, and in prior auction periods
beginning in February 2008, the auction process for these securities failed.
These auction rate securities are classified as available-for-sale. The auction
rate market is not expected to provide liquidity for these securities in the
foreseeable future. Should we need or desire to access the funds invested in
those securities prior to their maturity or prior to our exercise period under
our Rights agreement with UBS, we may be unable to find a buyer in a secondary
market outside the auction process or if a buyer in a secondary market is found,
we would likely realize a loss. See Note 3 – Fair value
measurements in Notes to Consolidated Financial Statements for further
discussion of our auction rate securities.
We Have
Established a Budget and Variations From Our Budget Will Affect Our Financial
Results. During the fourth quarter of 2009, we established an
operating budget for 2010. Our budgets are established based on the estimated
revenue from sales of our products which are based on economic conditions in the
markets in which we do business as well as the timing and volume of our new
products and the expected penetration of both new and existing products in the
marketplace. Historically, our business cycles have corresponded to changes in
the global PMI. From June 2008 to July 2009, this index had indicated a
contracting industrial economy. Starting in August 2009, the index has had
readings above 50 which are indicative of expansion in the industrial global
economy. We believe there is still a substantial amount of uncertainty about the
global industrial economy. We are unable to predict whether the current
expansion cycle, as measured by the PMI, will be sustained throughout 2010. This
uncertainty as well as the uncertainty as to how our business will be impacted
by any future expansion or contraction in the global industrial economy, makes
forecasting our results difficult. This uncertainty is reflected in key
assumptions used to establish our 2010 budget. If demand for our products in
2010 is less than the demand we have anticipated in setting our 2010 budget, our
operating results could be negatively impacted. If we exceed the level of
expenses established in our 2010 operating budget or if we cannot reduce
budgeted expenditures in response to a decreases in revenue, our operating
results could be adversely affected. Our spending could exceed our budgets due
to a number of factors, including:
|
·
|
additional
marketing costs for new product introductions and/or for conferences and
tradeshows;
|
|
·
|
increased
costs from hiring more product development engineers or other
personnel;
|
|
·
|
additional
costs associated with our incremental investment in our field sales
force;
|
|
·
|
additional
costs associated with the expiration of temporary cost cutting measures,
such as salary reductions, implemented in
2009;
|
|
·
|
increased
manufacturing costs resulting from component supply shortages and/or
component price fluctuations;
|
|
·
|
increased
component costs resulting from vendors increasing prices in response to
increased economic activity;
|
|
·
|
additional
expenses related to intellectual property litigation;
and/or
|
|
·
|
additional
costs related to acquisitions, if
any.
|
We are Subject to
Risks Associated with Our Centralization of Inventory and
Distribution. Currently, shipments to our customers worldwide
are primarily sourced from our warehouse facility in Debrecen, Hungary.
Shipments to some of our customers in Asia are currently made either out of
local inventory managed by our branch operations in various Asian countries or
from a centralized distribution point in Singapore. We will continue to devote
resources to centralizing our distribution to a limited number of shipping
points. Our planned centralization of inventory and distribution from a limited
number of shipping points is subject to inherent risks, including:
|
·
|
burdens
of complying with additional and/or more complex VAT and customs
regulations; and,
|
|
·
|
severe
concentration of inventory increasing the risks associated with fire,
natural disasters and logistics disruptions to customer order
fulfillment.
|
No
assurance can be given that our efforts will be successful. Any difficulties
with the centralization of distribution or delays in the implementation of the
systems or processes to support this centralized distribution could result in
interruption of our normal operations, including our ability to process orders
and ship products to our customers. Any failure or delay in distribution from
our facility in Hungary could have a material adverse effect on our operating
results.
A Substantial
Majority of Our Manufacturing Capacity is Located in Hungary. Our Hungarian
manufacturing and warehouse facility sources a substantial majority of our
sales. During the year ended December 31, 2009, we continued to maintain and
enhance the systems and processes that support the direct shipment of product
orders to our customers worldwide from our manufacturing facility in Hungary. In
order to enable timely shipment of products to our customers we also maintain
the vast majority of our inventory at our Hungary warehouse facility. In
addition to being subject to the risks of maintaining such a concentration of
manufacturing capacity and global inventory, this facility and its operation are
also subject to risks associated with doing business internationally,
including:
|
·
|
difficulty
in managing manufacturing operations in a foreign
country;
|
|
·
|
difficulty
in achieving or maintaining product
quality;
|
|
·
|
interruption
to transportation flows for delivery of components to us and finished
goods to our customers;
|
|
·
|
changes
in the country’s political or economic conditions;
and,
|
|
·
|
changes
in the country’s tax laws.
|
No
assurance can be given that our efforts to mitigate these risks will be
successful. Accordingly, a failure to deal with these factors could result in
interruption in the facility’s operation or delays in expanding its capacity,
either of which could have a material adverse effect on our operating
results.
In
response to significant and frequent changes in the corporate tax law, the
unstable political environment, a restrictive labor code, the volatility of the
Hungarian forint relative to the U.S. dollar and increasing labor costs, we have
doubts as to the long term viability of Hungary as a location for our
manufacturing and warehousing operations. As such, we may need to look for an
alternative location for a substantial majority of our manufacturing and
warehousing activities which could have a material adverse effect on our ability
to meet current customer demands, our ability to grow our business as well as
our liquidity, capital resources and results of operations. Our long term
manufacturing and warehousing capacity planning contemplates a third
manufacturing and warehousing facility in Malaysia. Deployment of this facility
could be accelerated in response to an unfavorable change in the corporate
taxation, regulatory or economic environment in Hungary. We can give no
assurance that we would be successful in accelerating the deployment of a new
facility in Malaysia. Our failure to accelerate the deployment of our
manufacturing and warehousing facility in Malaysia in response to unfavorable
changes in the corporate taxation, regulatory or economic environment in
Hungary, could have a material adverse effect on our ability to meet current
customer demands, our ability to grow our business as well as our liquidity,
capital resources and results of operations.
Our Income Tax
Rate is Affected by Tax Benefits in Hungary. As a result of
certain foreign investment incentives available under Hungarian law, the profit
from our Hungarian operation was subject to a reduced income tax rate. This
special tax status terminated on January 1, 2008, with the merger of our
Hungarian manufacturing operations with its Hungarian parent company. The tax
position of our Hungarian operation continued to benefit from assets created by
the restructuring of our operations in Hungary. Realization of these
assets was based on our estimated future earnings in Hungary. Partial release of
the valuation allowance on these assets resulted in income tax benefits of $18.3
million for the year ended December 31, 2007, and $8.7 million for the year
ended December 31, 2008.
For the
year 2009, we expected to recognize an additional tax benefit of $9.7 million
related to these assets. Effective January 1, 2010, a new tax law in Hungary
provides for an enhanced deduction for the qualified research and development
expenses of NI Hungary Software and Hardware Manufacturing Kft. ("NI Hungary").
During the three months ended December 31, 2009, we obtained confirmation of the
application of this new tax law for the qualified research and development
expenses of NI Hungary. Based on the application of this new tax law to the
qualified research and development expense of NI Hungary, we no longer expect to
have sufficient future taxable income in Hungary to realize the benefits of
these tax assets. As such, we recorded an income tax charge of $21.6 million
during the three months ended December 31, 2009, $18.4 million of which was
related to a valuation allowance on the previously recognized assets created by
the restructuring and $3.2 million of which was related to tax benefits from
other assets that we will no longer be able to realize as a result of this
change. We do not expect to realize the tax benefit of the remaining assets
created by the restructuring and therefore we have a full valuation allowance of
$98.2 million against those assets at December 31, 2009.
Changes
in Hungary’s political condition and/or tax laws could eliminate the enhanced
tax deduction in the future. The reduction or elimination of this enhanced tax
deduction in Hungary or future changes in U.S. law pertaining to taxation of
foreign earnings could result in an increase in our future effective income tax
rate which could have a material adverse effect on our operating
results.
We Rely on
Management Information Systems and any Disruptions in Our Systems Would
Adversely Affect Us. We rely on a primary global center for
our management information systems and on multiple systems in branches not
covered by our global center. As with any information system, unforeseen issues
may arise that could affect our ability to receive adequate, accurate and timely
financial information, which in turn could inhibit effective and timely
decisions. Furthermore, it is possible that our global center for information
systems or our branch operations could experience a complete or partial
shutdown. If such a shutdown occurred, it could impact our product shipments and
revenues, as order processing and product distribution are heavily dependent on
our management information systems. Accordingly, our operating results in such
periods would be adversely impacted. We are continually working to maintain
reliable systems to control costs and improve our ability to deliver our
products in our markets worldwide. No assurance can be given that our efforts
will be successful.
During
the year ended December 31, 2009, we continued to devote resources to the
development of our systems for manufacturing, sales, product services and to the
continued development of our web offerings. There can be no assurance that we
will not experience difficulties with our systems. Difficulties with our systems
may interrupt our normal operations, including our ability to provide quotes,
process orders, ship products, provide services and support to our customers,
bill and track our customers, fulfill contractual obligations and otherwise run
our business. Any disruption occurring with these systems may have a material
adverse effect on our operating results. In 2010, we will focus on upgrading our
Americas business application suite to Oracle’s version R12 and will continue to
devote significant resources to the continued development of our web
applications. Any failure to successfully implement these initiatives could have
a material adverse effect on our operating results.
Our Quarterly
Results are Subject to Fluctuations Due to Various
Factors. Our quarterly operating results have fluctuated in
the past and may fluctuate significantly in the future due to a number of
factors, including:
|
·
|
changes
in the economy or credit markets in the U.S. or
globally;
|
|
·
|
changes
in the mix of products sold;
|
|
·
|
the
availability and pricing of components from third parties (especially
limited sources);
|
|
·
|
fluctuations
in foreign currency exchange rates;
|
|
·
|
the
timing, cost or outcome of intellectual property
litigation;
|
|
·
|
the
difficulty in maintaining margins, including the higher margins
traditionally achieved in international sales;
and,
|
|
·
|
changes
in pricing policies by us, our competitors or
suppliers.
|
Our Revenues are
Subject to Seasonal Variations. In previous years, our
revenues have been characterized by seasonality, with revenues typically growing
from the first quarter to the second quarter, being relatively constant from the
second quarter to the third quarter, growing in the fourth quarter compared to
the third quarter and declining in the first quarter of the following from the
fourth quarter of the preceding year. This historical trend has been affected
and may continue to be affected in the future by declines in the global
industrial economy, the economic impact of larger orders as well as the timing
of new product introductions and/or acquisitions, if any. For example, during
the fourth quarter of 2008, we experienced a sequential decline in revenue from
the third quarter of 2008 due to the severe contraction in the global industrial
economy, which is contrary to the typical seasonality described above. In
addition, our first quarter and second quarter of 2009 had sequential revenue
declines from the fourth quarter of 2008 and first quarter of 2009,
respectively, and the magnitude of the decline in the first quarter of 2009 was
greater than what has occurred in the past. We cannot predict when or if we will
return to our typical historical revenue pattern. We believe the historical
pattern of seasonality of our revenue results from the international mix of our
revenue and the variability of the budgeting and purchasing cycles of our
customers throughout each international region. In addition, our total operating
expenses have in the past tended to increase in each successive quarter and have
fluctuated as a percentage of revenue based on the seasonality of our revenue.
During the year ended December 31, 2009, we were able to reduce our operating
costs compared to 2008. Some of the cost cutting measures implemented in 2009,
such as salary reduction, may not be available to us in 2010. We cannot provide
any assurance that the cost cutting measures implemented in 2009 can be
sustained in 2010 as we plan to continue our strategic investments in research
and development and field sales while limiting expense growth
elsewhere.
We Operate in
Intensely Competitive Markets. The markets in which we operate
are characterized by intense competition from numerous competitors, some of
which are divisions of large corporations having far greater resources than we
have, and we may face further competition from new market entrants in the
future. A key competitor is Agilent Technologies Inc. (“Agilent”). Agilent
offers hardware and software products that provide solutions that directly
compete with our virtual instrumentation products. Agilent is aggressively
advertising and marketing products that are competitive with our products.
Because of Agilent’s strong position in the instrumentation business, changes in
its marketing strategy or product offerings could have a material adverse effect
on our operating results.
We
believe our ability to compete successfully depends on a number of factors both
within and outside our control, including:
|
·
|
new
product introductions by
competitors;
|
|
·
|
product
pricing;
|
|
·
|
the
impact of foreign exchange rates on product
pricing;
|
|
·
|
quality
and performance;
|
|
·
|
success
in developing new products;
|
|
·
|
adequate
manufacturing capacity and supply of components and
materials;
|
|
·
|
efficiency
of manufacturing operations;
|
|
·
|
effectiveness
of sales and marketing resources and
strategies;
|
|
·
|
strategic
relationships with other suppliers;
|
|
·
|
timing
of our new product introductions;
|
|
·
|
protection
of our products by effective use of intellectual property
laws;
|
|
·
|
the
outcome of any material intellectual property
litigation;
|
|
·
|
the
financial strength of our
competitors;
|
|
·
|
barriers
to entry imposed by competitors with significant market power in new
markets;
|
|
·
|
general
market and economic conditions;
and,
|
|
·
|
government
actions throughout the
world.
|
There can be no assurance that we will be able to compete successfully in the future.
Our Product
Revenues are Dependent on Certain Industries. Sales of our
products are dependent on customers in certain industries, particularly the
telecommunications, semiconductor, automotive, automated test equipment, defense
and aerospace industries. As we have experienced in the past, and as we may
continue to experience in the future, downturns characterized by diminished
product demand in any one or more of these industries have resulted and may
continue to result in decreased sales, and a material adverse effect on our
operating results.
Our Success
Depends on New Product Introductions and Market Acceptance of Our
Products. The market for our products is characterized by
rapid technological change, evolving industry standards, changes in customer
needs and frequent new product introductions, and is therefore highly dependent
upon timely product innovation. Our success is dependent on our ability to
successfully develop and introduce new and enhanced products on a timely basis
to replace declining revenues from older products, and on increasing penetration
in domestic and international markets. As has occurred in the past and as may be
expected to occur in the future, we have experienced significant delays between
the announcement and the commercial availability of new products. Any
significant delay in releasing new products could have a material adverse effect
on the ultimate success of a product and other related products and could impede
continued sales of predecessor products, any of which could have a material
adverse effect on our operating results. There can be no assurance that we will
be able to introduce new products in accordance with announced release dates,
that new products will achieve market acceptance or that any such acceptance
will be sustained for any significant period. Failure of our new products to
achieve or sustain market acceptance could have a material adverse effect on our
operating results. Moreover, there can be no assurance that our international
sales will continue at existing levels or grow in accordance with our efforts to
increase foreign market penetration.
Our Business is
Dependent on Key Suppliers. Our manufacturing
processes use large volumes of high-quality components and subassemblies
supplied by outside sources. Several of these components are available through
limited sources. Limited source components purchased include custom application
specific integrated circuits (“ASICs”), chassis and other components. We have in
the past experienced delays and quality problems in connection with limited
source components, and there can be no assurance that these problems will not
recur in the future. Accordingly, our failure to receive components from limited
suppliers could result in a material adverse effect on our revenues and
operating results. In the event that any of our limited suppliers experience
significant financial or operational difficulties due to adverse global economic
conditions or otherwise, our business and operating results would likely be
adversely impacted until we are able to secure another source for the required
materials.
We May Experience
Component Shortages. As has occurred in the past and as may be
expected to occur in the future, supply shortages of components used in our
products, including limited source components, can result in significant
additional costs and inefficiencies in manufacturing. If we are unsuccessful in
resolving any such component shortages in a timely manner, we will experience a
significant impact on the timing of revenue, a possible loss of revenue, and/or
an increase in manufacturing costs, any of which would have a material adverse
impact on our operating results.
We are Subject to
Risks Associated with Our Web Site. We devote resources to
maintain our Web site as a key marketing, sales and support tool and expect to
continue to do so in the future. However, there can be no assurance that we will
be successful in our attempt to leverage the Web to increase sales. We host our
Web site internally. Any failure to successfully maintain our Web site or any
significant downtime or outages affecting our Web site could have a material
adverse impact on our operating results.
Our Products are
Complex and May Contain Bugs or Errors. As has occurred in the
past and as may be expected to occur in the future, our new software products or
new operating systems of third parties on which our products are based often
contain bugs or errors that can result in reduced sales and/or cause our support
costs to increase, either of which could have a material adverse impact on our
operating results.
We are Subject to
Various Risks Associated with International Operations and Foreign
Economies. Our international sales are subject to inherent
risks, including:
|
·
|
fluctuations
in local economies;
|
|
·
|
fluctuations
in foreign currencies relative to the U.S.
dollar;
|
|
·
|
difficulties
in staffing and managing foreign
operations;
|
|
·
|
greater
difficulty in accounts receivable
collection;
|
|
·
|
costs
and risks of localizing products for foreign
countries;
|
|
·
|
unexpected
changes in regulatory requirements;
|
|
·
|
tariffs
and other trade barriers;
|
|
·
|
difficulties
in the repatriation of earnings;
and,
|
|
·
|
the
burdens of complying with a wide variety of foreign
laws.
|
In many
foreign countries, particularly in those with developing economies, it is common
to engage in business practices that are prohibited by U.S. regulations
applicable to us such as the Foreign Corrupt Practices Act. Although we have
policies and procedures designed to ensure compliance with these laws, there can
be no assurance that all of our employees, contractors and agents, including
those based in or from countries where practices which violate such U.S. laws
may be customary, will not take actions in violation of our policies. Any
violation of foreign or U.S. laws by our employees, contractors or agents, even
if such violation is prohibited by our policies, could have a material adverse
effect on our business. We must also comply with various import and export
regulations. The application of these various regulations depends on the
classification of our products which can change over time as such regulations
are modified or interpreted. As a result, even if we are currently in compliance
with applicable regulations, there can be no assurance that we will not have to
incur additional costs or take additional compliance actions in the future.
Failure to comply with these regulations could result in fines and/or
termination of import and export privileges, which could have a material adverse
effect on our operating results. Additionally, the regulatory environment in
some countries is very restrictive as their governments try to protect their
local economy and value of their local currency against the U.S.
dollar.
Sales
made by our international direct sales offices are denominated in local
currencies, and accordingly, the U.S. dollar equivalent of these sales is
affected by changes in the foreign currency exchange rates. Net of hedging
results, the change in exchange rates had the effect of decreasing our
consolidated sales by $29 million or 4% for the year ended December 31, 2009,
compared to 2008. If the local currencies in which we sell our products
strengthen against the U.S. dollar, we may need to lower our prices in the local
currency to remain competitive in our international markets which could have a
material adverse effect on our gross and net profit margins. If the local
currencies in which we sell our products weaken against the U.S. dollar and if
the local sales prices cannot be raised due to competitive pressures, we will
experience a deterioration of our gross and net profit margins. Since most of
our international operating expenses are also incurred in local currencies, the
change in exchange rates had the effect of decreasing our operating expenses by
$12 million or 2% for the year ended December 31, 2009, compared to 2008.
Currently, we are experiencing significant volatility in foreign currency
exchange rates in many of the markets in which we do business. This has had a
significant impact on the revaluation of our foreign currency denominated firm
commitments and on our ability to forecast our U.S. dollar equivalent revenues
and expenses. In the past, these dynamics have also adversely affected our
revenue growth in international markets and will likely pose similar challenges
in the future.
Our Business
Depends on Our Proprietary Rights and We are Subject to Intellectual Property
Litigation. Our success
depends on our ability to obtain and maintain patents and other proprietary
rights relative to the technologies used in our principal products. Despite our
efforts to protect our proprietary rights, unauthorized parties may have in the
past infringed or violated certain of our intellectual property rights. We from
time to time engage in litigation to protect our intellectual property rights.
In monitoring and policing our intellectual property rights, we have been and
may be required to spend significant resources. We from time to time may be
notified that we are infringing certain patent or intellectual property rights
of others. There can be no assurance that any existing intellectual property
litigation or any intellectual property litigation initiated in the future, will
not cause significant litigation expense, liability, injunction against the sale
of some of our products, and a diversion of management’s attention, any of which
may have a material adverse effect on our operating results.
Our Reported
Financial Results May be Adversely Affected by Changes in Accounting Principles
Generally Accepted in the United States. We prepare our
financial statements in conformity with accounting principles generally accepted
in the U.S. These accounting principles are subject to interpretation by the
Financial Accounting Standards Board and the Securities and Exchange Commission.
A change in these policies or interpretations could have a significant effect on
our reported financial results, and could affect the reporting of transactions
completed before the announcement of a change.
Compliance With
Sections 302 and 404 of the Sarbanes-Oxley Act of 2002 is Costly and
Challenging. As required by Section 302 of the Sarbanes-Oxley
Act of 2002, this Form 10-K contains our managements’ certification of adequate
disclosure controls and procedures as of December 31, 2009. This report on Form
10-K also contains a report by our management on our internal control over
financial reporting including an assessment of the effectiveness of our internal
control over financial reporting as of December 31, 2009. This Form 10-K also
contains an attestation and report by our external auditors with respect to the
effectiveness of our internal control over financial reporting under Section
404. While these assessments and reports did not reveal any material weaknesses
in our internal control over financial reporting, compliance with Sections 302
and 404 is required for each future fiscal year end. We expect that the ongoing
compliance with Sections 302 and 404 will continue to be both very costly and
very challenging and there can be no assurance that material weaknesses will not
be identified in future periods. Any adverse results from such ongoing
compliance efforts could result in a loss of investor confidence in our
financial reports and have an adverse effect on our stock price.
Our Business
Depends on the Continued Service of Key Management and Technical
Personnel. Our success
depends upon the continued contributions of our key management, sales,
marketing, research and development and operational personnel, including Dr.
Truchard, our Chairman and Chief Executive Officer, and other members of our
senior management and key technical personnel. We have no agreements providing
for the employment of any of our key employees for any fixed term and our key
employees may voluntarily terminate their employment with us at any time. The
loss of the services of one or more of our key employees in the future could
have a material adverse effect on our operating results. We also believe our
future success will depend upon our ability to attract and retain additional
highly skilled management, technical, marketing, research and development, and
operational personnel with experience in managing large and rapidly changing
companies, as well as training, motivating and supervising employees. Our
failure to attract or retain key technical or managerial talent could have an
adverse effect on our operating results. We also recruit and employ foreign
nationals to achieve our hiring goals primarily for engineering and software
positions. There can be no guarantee that we will continue to be able to recruit
foreign nationals at the current rate. There can be no assurance that we will be
successful in retaining our existing key personnel or attracting and retaining
additional key personnel. Failure to attract and retain a sufficient number of
our key personnel could have a material adverse effect on our operating
results.
Our Manufacturing
Operations are Subject to a Variety of Environmental Regulations and
Costs. We must comply
with many different governmental regulations related to the use, storage,
discharge and disposal of toxic, volatile or otherwise hazardous chemicals used
in our manufacturing operations in the U.S. and in Hungary. Although we believe
that our activities conform to presently applicable environmental regulations,
our failure to comply with present or future regulations could result in the
imposition of fines, suspension of production or a cessation of operations. Any
such environmental regulations could require us to acquire costly equipment or
to incur other significant expenses to comply with such regulations. Any failure
by us to control the use of or adequately restrict the discharge of hazardous
substances could subject us to future liabilities.
We Are Subject to
the Risk of Product Liability Claims. Our products are
designed to provide information upon which users may rely. Our products are also
used in “real time” applications requiring extremely rapid and continuous
processing and constant feedback. Such applications give rise to the risk that a
failure or interruption of the system or application could result in economic
damage or bodily harm. We attempt to assure the quality and accuracy of the
processes contained in our products, and to limit our product liability exposure
through contractual limitations on liability, limited warranties, express
disclaimers and warnings as well as disclaimers contained in our “shrink wrap”
license agreements with end-users. If our products contain errors that produce
incorrect results on which users rely or cause failure or interruption of
systems or processes, customer acceptance of our products could be adversely
affected. Further, we could be subject to liability claims that could have a
material adverse effect on our operating results or financial position. Although
we maintain liability insurance for product liability matters, there can be no
assurance that such insurance or the contractual limitations used by us to limit
our liability will be sufficient to cover or limit any claims which may
occur.
Our Acquisitions
are Subject to a Number of Related Costs and Challenges. We have from time
to time acquired, and may in the future acquire, complementary businesses,
products or technologies. Achieving the anticipated benefits of an acquisition
depends upon whether the integration of the acquired business, products or
technology is accomplished efficiently and effectively. In addition, successful
acquisitions generally require, among other things, integration of product
offerings, manufacturing operations and coordination of sales and marketing and
R&D efforts. These difficulties can become more challenging due to the need
to coordinate geographically separated organizations, the complexities of the
technologies being integrated, and the necessities of integrating personnel with
disparate business backgrounds and combining two different corporate cultures.
The integration of operations following an acquisition also requires the
dedication of management resources, which may distract attention from our
day-to-day business and may disrupt key R&D, marketing or sales efforts. The
inability of our management to successfully integrate any future acquisition
could harm our business. Some of the existing products previously sold by some
of the entities we have acquired are of lesser quality than our products and/or
could contain errors that produce incorrect results on which users rely or cause
failure or interruption of systems or processes that could subject us to
liability claims that could have a material adverse effect on our operating
results or financial position. Furthermore, products acquired in connection with
acquisitions may not gain acceptance in our markets, and we may not achieve the
anticipated or desired benefits of such transaction.
Provisions in Our
Charter Documents and Delaware Law and Our Stockholder Rights Plan May Delay or
Prevent an Acquisition of Us. Our certificate of
incorporation and bylaws and Delaware law contain provisions that could make it
more difficult for a third party to acquire us without the consent of our Board
of Directors. These provisions include a classified Board of Directors,
prohibition of stockholder action by written consent, prohibition of
stockholders to call special meetings and the requirement that the holders of at
least 80% of our shares approve any business combination not otherwise approved
by two-thirds of the Board of Directors. Delaware law also imposes some
restrictions on mergers and other business combinations between us and any
holder of 15% or more of our outstanding common stock. In addition, our Board of
Directors has the right to issue preferred stock without stockholder approval,
which could be used to dilute the stock ownership of a potential hostile
acquirer. Our Board of Directors adopted a stockholders rights plan on January
21, 2004, pursuant to which we declared a dividend of one right for each share
of our common stock outstanding as of May 10, 2004. This rights plan replaced a
similar rights plan that had been in effect since our initial public offering in
1995. Unless redeemed by us prior to the time the rights are exercised, upon the
occurrence of certain events, the rights will entitle the holders to receive
upon exercise thereof shares of our preferred stock, or shares of an acquiring
entity, having a value equal to twice the then-current exercise price of the
right. The issuance of the rights could have the effect of delaying or
preventing a change of control of us.
ITEM
1B. UNRESOLVED
STAFF COMMENTS
None.
ITEM
2. PROPERTIES
Our
principal corporate and research and development activities are conducted at
three buildings we own in Austin, Texas. We own approximately 69 acres of land
in north Austin, Texas, on which are a 232,000 square foot office facility, a
140,000 square foot manufacturing and office facility, and a 380,000 square foot
research and development facility. We also own a 136,000 square foot office
building in Austin, Texas which is being leased to third-parties. Our principal
manufacturing and distribution activities are conducted at our 239,000 square
foot manufacturing and distribution facility in Debrecen, Hungary which we own.
Our German subsidiary, National Instruments Engineering GmbH & Co. KG, owns
a 25,500 square foot office building in Aachen, Germany in which a majority of
its activities are conducted. National Instruments Engineering owns another
19,375 square foot office building in Aachen, Germany, which is partially leased
to third-parties. We own approximately 17 acres of land in an industrial park in
Penang, Malaysia.
As of
December 31, 2009, we also leased a number of sales and support offices in the
U. S. and various countries throughout the world. Our facilities are currently
being utilized below maximum capacity to allow for future headcount growth and
design/construction cycles, as needed. We believe our existing facilities are
adequate to meet our current requirements.
ITEM
3. LEGAL
PROCEEDINGS
We filed
a patent infringement action on January 25, 2001, in the U.S. District Court,
Eastern District of Texas (Marshall Division) claiming that The MathWorks, Inc.
(“MathWorks”) infringed certain of our U.S. patents. On January 30, 2003, a jury
found infringement by MathWorks of three of the patents involved and awarded us
specified damages. On September 23, 2003, the District Court entered final
judgment in favor of us and entered an injunction against MathWorks’ sale of its
Simulink and related products and stayed the injunction pending appeal. Upon
appeal, the judgment and the injunction were affirmed by the U.S. Court of
Appeals for the Federal Circuit (September 3, 2004). Subsequently the stay of
injunction was lifted by the District Court. In November 2004, the final
judgment amount of $7.4 million which had been held in escrow pending appeal was
released to us.
An action
was filed by MathWorks against us on September 22, 2004, in the U.S. District
Court, Eastern District of Texas (Marshall Division), claiming that on that day
MathWorks had released modified versions of its Simulink and related products,
and seeking a declaratory judgment that the modified products do not infringe
the three patents adjudged infringed in the District Court's decision of
September 23, 2003 (and affirmed by the Court of Appeals on September 3, 2004).
On November 2, 2004, MathWorks served the complaint on us. We filed an answer to
MathWorks’ declaratory judgment complaint, denying MathWorks’ claims of
non-infringement and alleging our own affirmative defenses. On January 5, 2005,
the Court denied a contempt motion by us to enjoin the modified Simulink
products under the injunction in effect from the first case. On January 7, 2005,
we amended our answer to include counterclaims that MathWorks’ modified products
are infringing three of our patents, and requested unspecified damages and an
injunction. MathWorks filed its reply to our counterclaims on February 7, 2005,
denying the counterclaims and alleging affirmative defenses. On March 2, 2005,
we filed a notice of appeal regarding the Court's denial of the contempt motion.
On March 15, 2005, the Court stayed MathWorks’ declaratory judgment action,
pending a decision on the appeal by the Court of Appeals for the Federal
Circuit. On February 9, 2006, the Court of Appeals for the Federal Circuit
affirmed the District Court’s January 2005 order. On November 22, 2006, the
District Court lifted the stay. The case schedule has yet to be set in this
action. During the fourth quarter of 2004, we accrued $4 million related to our
probable loss from this contingency, which consists entirely of anticipated
patent defense costs that are probable of being incurred. In the
fourth quarter of 2006, we accrued an additional $600,000 related to this
contingency. During the third quarter of 2009, we reduced the accrual by $2
million to reflect a decrease in the estimated costs that are probable of being
incurred in this action. To date, we have charged a cumulative total of $623,000
against this accrual. At December 31, 2009, the remaining accrual was $2
million.
ITEM
4. SUBMISSION
OF MATTERS TO A VOTE OF SECURITY HOLDERS
No matter
was submitted to a vote of our security holders during the fourth quarter of the
fiscal year covered by this report.
PART
II
ITEM
5. MARKET
FOR THE REGISTRANT’S COMMON EQUITY, RELATED STOCKHOLDER MATTERS AND ISSUER
PURCHASES OF EQUITY SECURITIES
Our
common stock, $0.01 par value, began trading on The NASDAQ Stock Market under
the symbol NATI effective March 13, 1995. Prior to that date, there was no
public market for our common stock. The high and low closing prices for our
common stock, as reported by Nasdaq for the two most recent fiscal years, are as
indicated in the following table.
|
High
|
Low
|
|||||||
|
2009
|
||||||||
|
First
Quarter
2009
|
$ | 23.40 | $ | 15.82 | ||||
|
Second
Quarter
2009
|
23.61 | 18.41 | ||||||
|
Third
Quarter
2009
|
28.42 | 21.26 | ||||||
|
Fourth
Quarter
2009
|
29.85 | 26.52 | ||||||
|
2008
|
||||||||
|
First
Quarter
2008
|
$ | 31.95 | $ | 24.19 | ||||
|
Second
Quarter
2008
|
31.85 | 25.59 | ||||||
|
Third
Quarter
2008
|
34.63 | 25.88 | ||||||
|
Fourth
Quarter
2008
|
27.99 | 20.20 | ||||||
At the
close of business on February 15, 2010, there were approximately 473
holders of record of our common stock and approximately 26,500 shareholders
of beneficial interest.
We
believe factors such as quarterly fluctuations in our results of operations,
announcements by us or our competitors, technological innovations, new product
introductions, governmental regulations, litigation, changes in earnings
estimates by analysts or changes in our financial guidance may cause the market
price of our common stock to fluctuate, perhaps substantially. In addition,
stock prices for many technology companies fluctuate widely for reasons that may
be unrelated to their operating results. These broad market and industry
fluctuations may adversely affect the market price of our common
stock.
Our cash
dividend payments for the two most recent fiscal years are indicated in the
following table on a per share basis. The dividends were paid on the dates set
forth below;
|
2009
|
||||
|
March
2,
2009
|
$ | 0.12 | ||
|
June
1,
2009
|
0.12 | |||
|
August
31,
2009
|
0.12 | |||
|
November
30,
2009
|
0.12 | |||
|
2008
|
||||
|
March
3,
2008
|
$ | 0.11 | ||
|
June
2,
2008
|
0.11 | |||
|
September
2,
2008
|
0.11 | |||
|
December
1,
2008
|
0.11 | |||
Our
policy as to future dividends will be based on, among other considerations, our
views on potential future capital requirements related to research and
development, expansion into new market areas, investments and acquisitions,
share dilution management, legal risks, and challenges to our business
model.
See Item
12 for information regarding securities authorized for issuance under our equity
compensation plans.
Performance
Graph
The
following graph compares the cumulative total return to stockholders of NI’s
common stock from December 31, 2004 to December 31, 2009 to the cumulative
return over such period of (i) Nasdaq Composite Index and (ii) Russell 2000
Index. We use the Russell 2000 Index due to the fact that we have not been able
to identify a published industry or line of business index that we believe
appropriately reflects our industry or line of business. We considered that our
primary competitors are divisions of large corporations that have other
significant business operations such that any index comprised of such
competitors would not be reflective of our industry or line of business. We have
also considered using a peer group index but do not believe such index is
appropriate as we have not been able to identify other public companies that we
believe are principally in the same line of business as we are.
The graph
assumes that $100 was invested on December 31, 2004 in NI’s common stock and in
each of the other two indices and the reinvestment of all dividends, if any.
Stockholders are cautioned against drawing any conclusions from the data
contained therein, as past results are not necessarily indicative of future
performance.
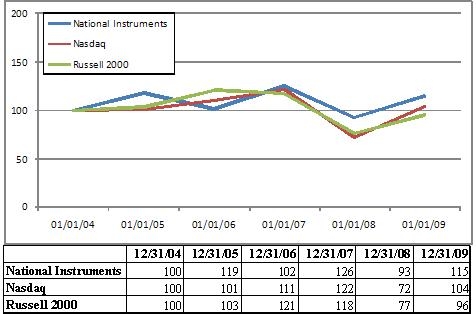
The
information contained in the Performance Graph shall not be deemed to be
“soliciting material” or to be “filed” with the SEC, nor shall such information
be incorporated by reference into any future filing under the Securities Act of
1933, as amended (the “Securities Act”), or the Exchange Act, except to the
extent that NI specifically incorporates it by reference into any such filing.
The graph is presented in accordance with SEC requirements.
ISSUER PURCHASES OF EQUITY
SECURITIES
|
Period
|
Total
number of shares
|
Average
price paid per share
|
Total
number of shares purchased as part of a publicly announced plan or
program
|
Maximum
number of shares that may yet be purchased under the plan or program
(1)
|
||||||||||||
|
October
1, 2009 to October 31, 2009
|
— | — | — | 2,262,168 | ||||||||||||
|
November
1, 2009 to November 30, 2009
|
573,841 | $ | 28.55 | 573,841 | 1,688,327 | |||||||||||
|
December
1, 2009 to December 31, 2009
|
— | — | — | 1,688,327 | ||||||||||||
|
Total
|
573,841 | $ | 28.55 | 573,841 | ||||||||||||
(1) For
the past several years, we have maintained various stock repurchase programs.
This repurchase plan does not have an expiration date.
ITEM
6. SELECTED
CONSOLIDATED FINANCIAL DATA
The
following selected consolidated financial data should be read in conjunction
with our consolidated financial statements, including the Notes to Consolidated
Financial Statements contained in this Form 10-K. The information set forth
below is not necessarily indicative of the results of our future operations. The
information should be read in conjunction with “Management’s Discussion and
Analysis of Financial Condition and Results of Operations.”
|
Years Ended December 31,
|
||||||||||||||||||||
|
2009
|
2008
|
2007
|
2006
|
2005
|
||||||||||||||||
|
(in
thousands, except per share data)
|
||||||||||||||||||||
|
Statements
of Income Data:
|
||||||||||||||||||||
|
Net
sales:
|
||||||||||||||||||||
|
Americas
|
$ | 292,999 | $ | 355,878 | $ | 331,482 | $ | 317,780 | $ | 275,524 | ||||||||||
|
Europe .
|
210,188 | 267,373 | 230,940 | 193,364 | 171,499 | |||||||||||||||
|
Asia
Pacific
|
173,407 | 197,286 | 177,956 | 149,263 | 124,818 | |||||||||||||||
|
Consolidated
net
sales
|
676,594 | 820,537 | 740,378 | 660,407 | 571,841 | |||||||||||||||
|
Cost
of
sales
|
169,884 | 207,109 | 185,267 | 173,348 | 151,939 | |||||||||||||||
|
Gross
profit
|
506,710 | 613,428 | 555,111 | 487,059 | 419,902 | |||||||||||||||
|
Operating
expenses:
|
||||||||||||||||||||
|
Sales
and
marketing
|
269,267 | 307,409 | 264,060 | 232,050 | 208,650 | |||||||||||||||
|
Research
and
development
|
132,974 | 143,140 | 126,515 | 113,095 | 87,841 | |||||||||||||||
|
General
and
administrative
|
57,938 | 67,162 | 62,445 | 54,192 | 45,199 | |||||||||||||||
|
Total
operating
expenses
|
460,179 | 517,711 | 453,020 | 399,337 | 341,690 | |||||||||||||||
|
Operating
income
|
46,531 | 95,717 | 102,091 | 87,722 | 78,212 | |||||||||||||||
|
Other
income (expense):
|
||||||||||||||||||||
|
Interest
income
|
1,629 | 5,996 | 9,822 | 6,847 | 3,758 | |||||||||||||||
|
Net
foreign exchange gain
(loss)
|
734 | (3,737 | ) | 1,672 | 740 | (1,566 | ) | |||||||||||||
|
Other
income (expense),
net
|
1,351 | 161 | (158 | ) | (7 | ) | 276 | |||||||||||||
|
Income
before income
taxes
|
50,245 | 98,137 | 113,427 | 95,302 | 80,680 | |||||||||||||||
|
Provision
for income
taxes
|
33,160 | 13,310 | 6,394 | 22,594 | 19,163 | |||||||||||||||
|
Net
income
|
$ | 17,085 | $ | 84,827 | $ | 107,033 | $ | 72,708 | $ | 61,517 | ||||||||||
|
Basic
earnings per
share
|
$ | 0.22 | $ | 1.08 | $ | 1.35 | $ | 0.91 | $ | 0.78 | ||||||||||
|
Weighted
average shares outstanding - basic
|
77,520 | 78,567 | 79,468 | 79,519 | 78,552 | |||||||||||||||
|
Diluted
earnings per
share
|
$ | 0.22 | $ | 1.07 | $ | 1.32 | $ | 0.89 | $ | 0.76 | ||||||||||
|
Weighted
average shares outstanding - diluted
|
78,026 | 79,515 | 81,043 | 81,519 | 80,910 | |||||||||||||||
|
Cash
dividends declared per common
share
|
$ | 0.48 | $ | 0.44 | $ | 0.34 | $ | 0.24 | $ | 0.20 | ||||||||||
|
December 31,
|
||||||||||||||||||||
|
2009
|
2008
|
2007
|
2006
|
2005
|
||||||||||||||||
|
(in
thousands)
|
||||||||||||||||||||
|
Balance
Sheet Data:
|
||||||||||||||||||||
|
Cash
and cash
equivalents
|
$ | 201,465 | $ | 229,400 | $ | 194,839 | $ | 100,287 | $ | 55,864 | ||||||||||
|
Short-term
investments
|
87,196 | 6,220 | 93,838 | 150,190 | 119,846 | |||||||||||||||
|
Working
capital
|
413,759 | 398,292 | 419,874 | 379,733 | 274,686 | |||||||||||||||
|
Total
assets
|
813,029 | 832,591 | 818,812 | 721,220 | 608,336 | |||||||||||||||
|
Long-term
debt, net of current portion
|
— | — | — | — | — | |||||||||||||||
|
Total
stockholders’
equity
|
654,420 | 664,438 | 661,086 | 596,682 | 503,850 | |||||||||||||||
ITEM
7. MANAGEMENT’S
DISCUSSION AND ANALYSIS OF FINANCIAL CONDITION AND RESULTS OF
OPERATIONS
The
following “Management’s Discussion and Analysis of Financial Condition and
Results of Operations” contains forward-looking statements within the meaning of
Section 27A of the Securities Act of 1933 and Section 21E of the Securities
Exchange Act of 1934. Any statements contained herein regarding our future
financial performance or operations (including, without limitation, statements
to the effect that we “believe,” “expect,” “plan,” “may,” “will,” “project,”
“continue,” or “estimate” or other variations thereof or comparable terminology
or the negative thereof) should be considered forward-looking statements. Actual
results could differ materially from those projected in the forward-looking
statements as a result of a number of important factors including those set
forth under the heading “Risk Factors” beginning on
page 10, and elsewhere in this Form 10-K. Although we believe that the
expectations reflected in the forward-looking statements are reasonable, we
cannot guarantee future results, levels of activity, performance or
achievements. You should not place undue reliance on these forward-looking
statements. We disclaim any obligation to update information contained in any
forward-looking statement.
Overview
National
Instruments Corporation (“we”, “us” or “our”) is a leading supplier of
measurement and automation products that engineers and scientists use in a wide
range of industries. These industries comprise a large and diverse market for
design, control and test applications. We provide flexible application software
and modular, multifunctional hardware that users combine with industry-standard
computers, networks and third party devices to create measurement, automation
and embedded systems, which we also refer to as “virtual instruments”. Our
approach gives customers the ability to quickly and cost-effectively design,
prototype and deploy unique custom-defined solutions for their design, control
and test application needs. We sell to a large number of customers in a wide
variety of industries. No single customer accounted for more than 3% of our
sales in 2009, 2008 or 2007.
The key
strategies that management focuses on in running our business are the
following:
Expanding
our broad customer base
We strive
to increase our already broad customer base by serving a large market on many
computer platforms, through a global marketing and distribution network. We also
seek to acquire new technologies and expertise from time to time in order to
open new opportunities for our existing product portfolio.
Maintaining
a high level of customer satisfaction
To
maintain a high level of customer satisfaction we strive to offer innovative,
modular and integrated products through a global sales and support network. We
strive to maintain a high degree of backwards compatibility across different
platforms in order to preserve the customer’s investment in our products. In
this time of intense global competition, we believe it is crucial that we
continue to offer products with quality and reliability, and that these products
provide cost-effective solutions for our customers.
Leveraging
external and internal technology
Our
product strategy is to provide superior products by leveraging generally
available technology, supporting open architectures on multiple platforms and by
leveraging our core technologies such as custom application specific integrated
circuits (“ASICs”) across multiple products.
We sell
into test and measurement (“T&M”) and industrial/embedded applications in a
broad range of industries and as such are subject to the economic and industry
forces which drive those markets. It has been our experience that the
performance of these industries and our performance is impacted by general
trends in industrial production for the global economy and by the specific
performance of certain vertical markets that are intensive consumers of
measurement technologies. Examples of these markets are semiconductor capital
equipment, telecom, defense, aerospace, automotive and others. In assessing our
business, we consider the trends in the Global Purchasing Managers Index (“PMI”)
published by JP Morgan, global industrial production as well as industry reports
on the specific vertical industries that we target. Starting in August 2009, the
PMI has had readings above 50 which are indicative of expansion in the
industrial global economy. However, we believe there is still a substantial
amount of uncertainty about the global industrial economic conditions. We are
unable to predict whether the current expansion cycle, as measured by the PMI,
will be sustained throughout 2010. This continuing uncertainty in the global
industrial economy is likely to continue to have an adverse effect on the
spending patterns of businesses including our current and potential customers
which could adversely affect our revenues and therefore harm our business and
result of operations.
We
distribute our software and hardware products primarily through a direct sales
organization. We also use independent distributors, OEMs, VARs, system
integrators and consultants to market our products. We have sales offices in the
U.S. and sales offices and distributors in key international markets. Sales
outside of the Americas accounted for approximately 57%, 57% and 55% or our
revenues in 2009, 2008 and 2007, respectively. The vast majority of our foreign
sales are denominated in the customers’ local currency, which exposes us to the
effects of changes in foreign currency exchange rates. We expect that a
significant portion of our total revenues will continue to be derived from
international sales. (See Note 12 – Segment information of
Notes to Consolidated Financial Statements for details concerning the geographic
breakdown of our net sales, operating income, interest income and long-lived
assets).
We
manufacture a substantial majority of our products at our facilities in
Debrecen, Hungary. Additional production primarily of low volume or newly
introduced products is done in Austin, Texas. Our product manufacturing
operations can be divided into four areas: electronic circuit card and module
assembly; chassis and cable assembly; technical manuals and product support
documentation; and software duplication. We manufacture most of the electronic
circuit card assemblies, and modules in-house, although subcontractors are used
from time to time. We currently use subcontractors in Asia to manufacture a
significant portion of our chassis but we review these arrangements
periodically. We manufacture some of our electronic cable assemblies in-house,
but many assemblies are produced by subcontractors. We primarily subcontract our
software duplication, our technical manuals and product support
documentation.
We
believe that our long-term growth and success depends on delivering high quality
software and hardware products on a timely basis. Accordingly, we focus
significant efforts on research and development. We focus our research and
development efforts on enhancing existing products and developing new products
that incorporate appropriate features and functionality to be competitive with
respect to technology, price and performance. Our success also is dependent on
our ability to obtain and maintain patents and other proprietary rights related
to technologies used in our products. We have engaged in litigation and where
necessary, will likely engage in future litigation to protect our intellectual
property rights. In monitoring and policing our intellectual property rights, we
have been and may be required to spend significant resources.
We have
been profitable in every year since 1990. However, there can be no assurance
that our net sales will grow or that we will remain profitable in future
periods. Our operating results fluctuate from period to period due to changes in
global economic conditions and a number of other factors. As a result, we
believe historical results of operations should not be relied upon as
indications of future performance.
Results
of Operations
The
following table sets forth, for the periods indicated, the percentage of net
sales represented by certain items reflected in our Consolidated Statements of
Income:
|
|
Years Ended December 31,
|
|||||||||||
|
2009
|
2008
|
2007
|
||||||||||
|
Net
sales:
|
||||||||||||
|
Americas
|
43.3 | % | 43.4 | % | 44.8 | % | ||||||
|
Europe
|
31.1 | 32.6 | 31.2 | |||||||||
|
Asia
Pacific
|
25.6 | 24.0 | 24.0 | |||||||||
|
Consolidated
net
sales
|
100.0 | 100.0 | 100.0 | |||||||||
|
Cost
of
sales
|
25.1 | 25.2 | 25.0 | |||||||||
|
Gross
profit
|
74.9 | 74.8 | 75.0 | |||||||||
|
Operating
expenses:
|
||||||||||||
|
Sales
and
marketing
|
39.8 | 37.5 | 35.7 | |||||||||
|
Research
and
development
|
19.6 | 17.4 | 17.1 | |||||||||
|
General
and
administrative
|
8.6 | 8.2 | 8.4 | |||||||||
|
Total
operating
expenses
|
68.0 | 63.1 | 61.2 | |||||||||
|
Operating
income
|
6.9 | 11.7 | 13.8 | |||||||||
|
Other
income (expense):
|
||||||||||||
|
Interest
income
|
0.2 | 0.7 | 1.3 | |||||||||
|
Net
foreign exchange gain
(loss)
|
0.1 | (0.5 | ) | 0.2 | ||||||||
|
Other
income (expense),
net
|
0.2 | — | — | |||||||||
|
Income
before income
taxes
|
7.4 | 11.9 | 15.3 | |||||||||
|
Provision
for income
taxes
|
4.9 | 1.6 | 0.8 | |||||||||
|
Net
income
|
2.5 | % | 10.3 | % | 14.5 | % | ||||||
Net
Sales. Consolidated net sales were $677 million, $821 million
and $740 million for the years ended December 31, 2009, 2008 and 2007,
respectively, a decrease of 18% in 2009 compared to 2008 following an increase
of 11% in 2008 compared to 2007. The decrease in 2009 can be attributed to
declines in sales volume across all regions of our business. Instrument control
products which comprised approximately 7% of our revenues for the year ended
December 31, 2009, saw a year-over-year decline of 31%. Products in the areas of
virtual instrumentation and graphical system design which comprised
approximately 93% of our revenues for the year ended December 31, 2009, saw a
year-over-year decline of 16%. Revenues from our instrument control products are
the most sensitive to the cycles of the global industrial economy. For the year
ended December 31, 2009, our order backlog increased by approximately $8
million. Backlog is a measure of orders that were received but that had not
shipped to customers at the end of the quarter. We did not take any significant
action with regard to pricing during the year ended December 31, 2009, and thus,
the decrease in revenues is attributable to a decrease in customer orders. The
increase in net sales in 2008, compared to 2007 can be attributed to volume
growth in the areas of modular instruments, particularly RF test products, PXI,
software and CompactRIO which performed very well in light of the industry
contraction. The increases in these areas were offset by declines in revenue
from instrument control products which are the most sensitive to downturns in
the Global PMI.
Sales in
the Americas were $293 million, $356 million and $331 million for the years
ended December 31, 2009, 2008 and 2007, respectively, a decrease of 18% in 2009
compared to 2008 following an increase in of 8% in 2008 compared to 2007. Sales
outside of the Americas, as a percentage of consolidated sales were 57%, 57% and
55% for the years ended December 31, 2009, 2008 and 2007, respectively. Sales in
Europe were $210 million, $267 million and $231 million for the years ended
December 31, 2009, 2008 and 2007, respectively, a decrease of 21% in 2009
compared to 2008 following an increase of 16% in 2008 compared to 2007. Sales in
Asia were $173 million, $197 million and $178 million for the years ended
December 31, 2009, 2008 and 2007, respectively, a decrease of 12% in 2009
compared to 2008 following an increase of 11% in 2008 compared to 2007. We
expect sales outside of the Americas to continue to represent a significant
portion of our revenue. We intend to continue to expand our international
operations by increasing our presence in existing markets, adding a presence in
some new geographical markets and continuing the use of distributors to sell our
products in some countries.
Almost
all sales made by our direct sales offices in the Americas, outside of the U.S.,
in Europe and in Asia Pacific are denominated in local currencies, and
accordingly, the U.S. dollar equivalent of these sales is affected by changes in
foreign currency exchange rates. For 2009, net of hedging results, the change in
exchange rates had the effect of decreasing our consolidated sales by $29
million or 4%, decreasing America’s sales by $6 million or 2%, decreasing
European sales by $17 million or 6%, and decreasing sales in Asia Pacific by $6
million or 3% compared to 2008. For 2008, net of hedging results, the change in
exchange rates had the effect of increasing our consolidated sales by $34
million or 4%, increasing America’s sales by $1.7 million or 0.5%, increasing
European sales by $28 million or 12%, and increasing sales in Asia Pacific by
$4.3 million or 2% compared to 2007.
Gross
Profit. As a percentage of sales, gross margin was 75% in
2009, 75% in 2008 and 75% in 2007. In 2009, we were successful in
implementing cost reduction strategies throughout our manufacturing cycle which
allowed us to maintain a stable gross margin percentage despite the 18% decrease
in sales volume in 2009. For the years ended December 31, 2009, 2008 and 2007,
charges related to acquisition related intangibles and stock based compensation
were $4.7 million, $4.7 million and $3.6 million, respectively. For
the years ended December 31, 2009 and 2008, the net impact of the change in
foreign currency exchange rates had the effect of decreasing our cost of goods
sold by $3 million or 1%, and increasing our cost of goods sold by $1.1 million
or 4%, respectively.
Sales and
Marketing. Sales and marketing expenses were $269 million,
$307 million and $264 million for the years ended December 31, 2009, 2008 and
2007, respectively, a decrease of 12% in 2009 compared to 2008 following an
increase of 16% in 2008 compared to 2007. As a percentage of net sales, sales
and marketing expenses were 40%, 38% and 36% for 2009, 2008 and 2007,
respectively. For 2009, the increase in sales and marketing expenses as a
percentage of revenue was due to the 18% decrease in revenue. For 2009, the
decrease in sales and marketing expenses in absolute dollars was due to a
decrease in travel, tradeshows and advertising of $15 million, a decrease in
variable compensation of $4.2 million and a decrease caused by the net impact of
changes in foreign currency exchange rates of $9 million. Temporary cost cutting
measures which included a company-wide wage reduction as well as a reduction in
the number of accrued vacation hours that employees are allowed to carry beyond
December 31, 2009, resulted in additional cost savings of $7 million compared to
2008. For 2008, the increase in sales and marketing expense, both in absolute
dollars and as a percentage of sales, was consistent with our plan to make
additional investments in our field sales force during 2008. Approximately 65%
of the increase in 2008 over 2007, can be attributed to the increase in sales
and marketing personnel, increases in stock-based compensation and the increase
in variable compensation from higher sales volume. In addition, during 2008, the
net impact of foreign currency exchange rates had the effect of increasing our
sales and marketing expense by $10 million or 3%. We plan to continue to make
additional investments in our field sales force in 2010. However, due to the
continuing uncertainty in the industrial economy, the extent of our field sales
expansion during 2010 will be dependent on our overall sales volumes in 2010. We
expect sales and marketing expenses in future periods to continue to fluctuate
as a percentage of sales based on recruiting, marketing and advertising campaign
costs associated with major new product releases and entry into new market
areas, investment in web sales and marketing efforts, increasing product
demonstration costs and the timing of domestic and international conferences and
trade shows.
Research and
Development. Research and development expenses were $133
million, $143 million and $127 million for the years ended December 31, 2009,
2008 and 2007, respectively, a decrease of 7% in 2009 compared to 2008 following
an increase of 13% in 2008 compared to 2007. As a percentage of net sales,
research and development expenses were 20%, 17% and 17% for 2009, 2008 and 2007,
respectively. For 2009, the increase in research and development expenses as a
percentage of revenue was due to the 18% decrease in revenue. For 2009, the
decrease in research and development expenses in absolute dollars was due to a
decrease in variable compensation of $2.9 million and a decrease caused by the
net impact of changes in foreign currency exchange rates of $327,000. Temporary
cost cutting measures which included a company-wide wage reduction as well as a
reduction in the number of accrued vacation hours that employees were allowed to
carry beyond December 31, 2009, resulted in additional cost savings of $7
million. These decreases were offset by personnel costs related to a net
headcount increase of 42 people during 2009. For 2008, the increase in research
and development expenses in absolute dollars was primarily due to increases in
personnel costs from the hiring of additional product development engineers as
well as increases related to stock-based compensation and was consistent with
our plan to continue to grow our research and development capacity in line with
the overall revenue growth of the company. During 2008, we had a net headcount
increase of 109 people in our worldwide research and development group. In
addition, during 2008, the net impact of foreign currency exchange rates had the
effect of increasing our research and development expense by $2.7 million or 2%.
We plan to continue to make additional investments in research and development
in 2010. However, due to the continuing uncertainty in the industrial economy,
the extent of our research and development expansion during 2010 will be
dependent on our overall sales volumes in 2010.
We
capitalize software development costs in accordance with the Financial
Accounting Standards Board (FASB) Accounting Standards Codification (ASC)
985, Software (FASB ASC 985).
We amortize such costs over the related product’s estimated economic life,
generally three years, beginning when a product becomes available for general
release. Software amortization expense included in cost of goods sold totaled $9
million, $10 million and $9 million during 2009, 2008 and 2007, respectively.
Internally developed software costs capitalized during 2009, 2008 and 2007 were
$13 million, $10 million and $8 million, respectively. Capitalization of
internally developed software costs varies depending on the timing of when each
project reaches technological feasibility and the length and scope of the
development cycle of each individual project. (See Note 7 -
Intangibles of Notes to Consolidated Financial Statements for a description of
intangibles).
General and
Administrative. General and administrative expenses were $58
million, $67 million and $62 million for the years ended December 31, 2009, 2008
and 2007, respectively, a decrease of 13% in 2009 compared to 2008 following an
increase of 8% in 2008 compared to 2007. As a percentage of net sales, general
and administrative expenses were 9%, 8% and 8% in 2009, 2008 and 2007. For 2009,
the increase in general and administrative expenses as a percentage of revenue
was due to the 18% decrease in revenue. For 2009, the decrease in general and
administrative expenses was due to a decrease caused by the net impact of
changes in foreign currency exchange rates of $2.6 million, a reduction of our
patent litigation accrual which resulted in a non-cash decrease to our
operating expenses of $2 million and a decrease in variable compensation of
$948,000. Temporary cost cutting measures which include a company-wide wage
reduction as well as a reduction in the number of accrued vacation hours that
employees are allowed to carry beyond December 31, 2009, resulted in additional
cost savings of $1.8 million. For 2008, the increase in absolute dollars
compared to 2007 can primarily be attributed to the net impact of foreign
currency exchange rates which had the effect of increasing our general and
administrative expense by $2.4 million or 4%. We expect that general and
administrative expenses in future periods will fluctuate in absolute dollars and
as a percentage of revenue.
Interest
Income. Interest income was
$1.6 million, $6 million and $10 million for the years ended December 31, 2009,
2008 and 2007, respectively, a decrease of 73% in 2009 compared to 2008
following a decrease of 40% in 2008 compared to 2007. For 2009, the decrease is
attributable to significant decreases in investment yields for high grade
treasury, municipal and corporate bonds. For 2008, the decrease is attributable
to a decrease in invested funds as well as to the rapid rate of decrease in
interest rates during the second half of 2008. The primary source of interest
income is from the investment of our cash and short-term
investments.
Net Foreign
Exchange Gain (Loss). Net foreign exchange
gain (loss) was $734,000, $(3.7) million and $1.7 million for the years ended
December 31, 2009, 2008 and 2007, respectively. These results are attributable
to movements in the foreign currency exchange rates between the U.S. dollar and
foreign currencies in countries where our functional currency is not the U.S.
dollar. We recognize the local currency as the functional currency in virtually
all of our international subsidiaries.
We
utilize foreign currency forward contracts to hedge our foreign denominated net
foreign currency balance sheet positions to protect against the change in value
caused by a fluctuation in foreign currency exchange rates. We typically hedge
up to 90% of our outstanding foreign denominated net receivable or payable
positions and typically limit the duration of these foreign currency forward
contracts to approximately 90 days. The gain or loss on these derivatives as
well as the offsetting gain or loss on the hedge item attributable to the hedged
risk is recognized in current earnings under the line item “net foreign exchange
gain (loss)”. Our hedging strategy reduced our foreign exchange gains by $1.7
million in 2009, reduced our foreign exchange losses by $1.2 million in 2008 and
reduced our foreign exchange gains by $1.1 million in 2007.
To
protect against the change in the value caused by a fluctuation in foreign
currency exchange rates of forecasted foreign currency cash flows resulting from
international sales and expenses over the next one to two years, we have
instituted a foreign currency cash flow hedging program. We hedge portions of
our forecasted revenue and forecasted expenses denominated in foreign currencies
with forward and option contracts. For forward contracts, when the dollar
strengthens significantly against the foreign currencies, the change in the
present value of future foreign currency cash flows may be offset by the change
in the fair value of the forward contracts designated as hedges. For purchased
option contracts, when the dollar strengthens significantly against the foreign
currencies, the change in the present value of future foreign currency cash
flows may be offset by the change in the fair value of the option contracts
designated as hedges, net of the premium paid. Our foreign currency purchased
option contracts are purchased “at-the-money” or “out-of-the-money.” We purchase
foreign currency forward and option contracts for up to 100% of our forecasted
exposures in selected currencies (primarily in Euro, Japanese yen, British pound
sterling and Hungarian forint) and limit the duration of these contracts to 40
months or less. As a result, our hedging activities only partially address our
risks from foreign currency transactions, and there can be no assurance that
this strategy will be successful. We do not invest in contracts for speculative
purposes. (See Note 4 - Derivative instruments and hedging
activities of Notes to Consolidated Financial Statements for a description of
our forward and purchased option contracts and hedged positions).
Provision for
Income Taxes. Our provision for income taxes reflected an
effective tax rate of 66%, 14% and 6% for the years ended December 31, 2009,
2008 and 2007, respectively. The increase in our effective tax rate in 2009
compared to 2008 was driven by changes in our valuation allowances, tax charges
related to inter-company profits and an increase in equity compensation expense
as a percentage of pre-tax book income. (See Note 9 –
Income taxes of Notes to Consolidated Financial Statements for further
discussion regarding changes in our effective tax rate and a reconciliation of
income taxes at the U.S. federal statutory income tax rate of 35% to our
effective tax rate).
Liquidity
and Capital Resources
Working Capital,
Cash and Cash Equivalents, Short-term Investments and Long-term
Investments. The following table presents our working capital,
cash and cash equivalents and marketable securities (in thousands):
|
December 31,
2009
|
December 31,
2008
|
Increase/
(Decrease)
|
||||||||||
|
Working
capital
|
$ | 413,759 | $ | 398,292 | $ | 15,467 | ||||||
|
Cash
and cash equivalents (1)
|
201,465 | 229,400 | (27,935 | ) | ||||||||
|
Short-term
investments (1)
|
87,196 | 6,220 | 80,976 | |||||||||
|
Long-term
investments
|
— | 10,500 | (10,500 | ) | ||||||||
|
Total
cash, cash equivalents, short and long-term investments
|
$ | 288,661 | $ | 246,120 | $ | 42,541 | ||||||
(1) Included in working
capital
Our
working capital increased by $15 million during the year ended December 31, 2009
compared to December 31, 2008, due to cash provided by operations offset by
repurchases of shares of our common stock, dividend payments and capital
expenditures.
Our cash
and cash equivalent balances are held in numerous financial institutions
throughout the world, including substantial amounts held outside of the U.S.;
however, the majority of our cash and investments that are located outside of
the U.S. are denominated in the U.S. dollar. Most of the amounts held outside of
the U.S. could be repatriated to the U.S., but under current law, would be
subject to U.S. federal income taxes, less applicable foreign tax credits. In
some countries repatriation of certain foreign balances is restricted by local
laws. We have provided for the U.S. federal tax liability on these amounts for
financial statement purposes, except for foreign earnings that are considered
indefinitely reinvested outside of the U.S. Repatriation could result in
additional U.S. federal income tax payments in future years. We utilize a
variety of tax planning and financing strategies with the objective of having
our worldwide cash available in the locations in which it is
needed.
Cash Provided and
(Used) in 2009 and 2008. Cash and cash
equivalents decreased to $201 million at December 31, 2009 from $229 million at
December 31, 2008. The following table summarizes the proceeds and (uses) of
cash (in thousands):
|
December
31,
|
||||||||
|
2009
|
2008
|
|||||||
|
Cash
provided by operating
activities
|
$ | 135,651 | $ | 121,818 | ||||
|
Cash
(used in)/provided by investing
activities
|
(111,915 | ) | 18,756 | |||||
|
Cash
(used in) financing
activities
|
(51,671 | ) | (106,013 | ) | ||||
|
Net
(decrease)/increase in cash
equivalents
|
(27,935 | ) | 34,561 | |||||
|
Cash
and cash equivalents at beginning of
year
|
229,400 | 194,839 | ||||||
|
Cash
and cash equivalents at end of
year
|
$ | 201,465 | $ | 229,400 | ||||
Our
operating activities provided $136 million and $122 million for the years ended
December 31, 2009 and 2008, respectively, a 11% increase. For 2009, cash
provided by operating activities was the result of $17 million of net income,
$77 million in net non-cash operating expenses which consisted of depreciation
and amortization, stock-based compensation, benefits from deferred income taxes,
and by $41 million in net cash provided by changes in operating assets and
liabilities, principally a $18 million decrease in accounts receivable, a $21
million decrease in inventories and a $13 million decrease in prepaid expenses
and other assets, offset by a decrease of $10 million in accounts payable, taxes
and other liabilities. In 2008, cash provided by operating activities was
primarily the result of $84.8 million in net income and $51.3 million in net
non-cash operating expenses which primarily consisted of depreciation and
amortization, stock-based compensation, and benefits from deferred income taxes,
offset in part by $14.3 million in net cash used by changes in operating assets
and liabilities, principally a $24.6 million increase in inventory.
Accounts
receivable decreased to $104 million at December 31, 2009 from $122 million at
December 31, 2008, as a result of lower sales volumes during 2009. This decrease
in revenue also caused our days sales outstanding to increase to 61 days at
December 31, 2009, compared to 57 days at December 31, 2008. We typically bill
customers on an open account basis subject to our standard net thirty day
payment terms. If, in the longer term, our revenue increases, it is likely that
our accounts receivable balance will also increase. Our accounts receivable
could also increase if customers delay their payments or if we grant extended
payment terms to customers, both of which are more likely to occur during
challenging economic times when our customers may face issues gaining access to
sufficient funding or credit.
Consolidated
inventory balances decreased to $87 million at December 31, 2009 from $107
million at December 31, 2008. Inventory turns decreased to 1.8 per year at
December 31, 2009 compared to 2.1 per year at December 31, 2008. The decrease in
inventory during 2009 was driven by a reduction in our manufacturing activities
in response to the decreased demand for our products. Our inventory levels will
continue to be determined based upon our anticipated demand for products and our
need to keep sufficient inventory on hand to meet our customers’ demands. We
attempt to balance such considerations against the risk of obsolescence or
potentially excess inventory levels. Rapid changes in industrial demand could
have a significant impact on our inventory balances in future
periods.
Investing
activities used cash of $112 million during 2009, which was the result of the
net purchase of short-term investments of $74 million, the purchase
of property and equipment of $21 million, capitalization of internally developed
software of $13 million and the acquisition of other intangibles of $5 million.
For 2008, investing activities provided cash of $19 million which was primarily
the result of the net sale of $77 million of short-term investments, offset by
the purchase of property and equipment of $26 million, a net cash payment of $17
million related to the acquisition of microLEX Systems ApS (see Note 15 - Acquisitions of Notes to Consolidated
Financial Statements), capitalization of internally developed software of $10
million and the acquisition of other intangibles of $3 million.
Financing
activities used $52 million during 2009, which was the result of $35 million
used to repurchase our common stock and $37 million used to pay dividends to our
shareholders, offset by $22 million received as a result of the issuance of our
common stock from the exercise of stock options and sales of our common stock
through our employee stock purchase plan. For 2008, financing activities used
$106 million which was the result of $104 million used to repurchase our common
stock and $35 million used to pay dividends to our shareholders, offset by $31
million received as a result of the issuance of our common stock from the
exercise of stock options and our employee stock purchase plan.
From time
to time our Board of Directors has authorized various programs to repurchase
shares of our common stock depending on market conditions and other factors.
Under such programs, we repurchased a total of 1,443,441, 4,110,042 and
2,730,125 shares of our common stock at weighted average prices of $23.96,
$25.22 and $29.20 per share, in the years ended December 31, 2009, 2008 and
2007, respectively.
On
January 23, 2009, our Board of Directors approved a new share repurchase plan
which increased the aggregate number of shares of common stock that we are
authorized to repurchase from 591,324 to 3.0 million. At December 31, 2009,
there were 1,688,327 shares remaining available for repurchase under this plan.
This repurchase plan does not have an expiration date.
During
2009, we received reduced proceeds from the exercise of stock options compared
to 2008. The timing and number of stock option exercises and the amount of cash
proceeds we receive through those exercises are not within our control, and in
the future we may not generate as much cash from the exercise of stock options
as we have in the past. Moreover, it is now our practice to issue restricted
stock units and not stock options to eligible employees which will reduce the
number of stock options available for exercise in the future. Unlike the
exercise of stock options, the issuance of shares upon vesting of restricted
stock units does not result in any cash proceeds to us.
Contractual Cash
Obligations. The following summarizes our contractual cash
obligations as of December 31, 2009 (in thousands):
|
Payments Due by Period
|
||||||||||||||||||||||||||||
|
Total
|
2010
|
2011
|
2012
|
2013
|
2014
|
Beyond
|
||||||||||||||||||||||
|
Long-term
debt
|
$ | — | $ | — | $ | — | $ | — | $ | — | $ | — | $ | — | ||||||||||||||
|
Capital
lease
obligations
|
— | — | — | — | — | — | — | |||||||||||||||||||||
|
Operating
leases
|
51,701 | 14,415 | 9,898 | 6,982 | 4,611 | 3,665 | 12,130 | |||||||||||||||||||||
|
Total
contractual cash obligations
|
$ | 51,701 | $ | 14,415 | $ | 9,898 | $ | 6,982 | $ | 4,611 | $ | 3,665 | $ | 12,130 | ||||||||||||||
The
following summarizes our other commercial commitments as of December 31, 2009
(in thousands):
|
Total
|
2010
|
2011
|
2012
|
2013
|
2014
|
Beyond
|
||||||||||||||||||||||
|
Guarantees
|
$ | 5,200 | $ | 5,200 | $ | — | $ | — | $ | — | $ | — | $ | — | ||||||||||||||
|
Purchase
obligations
|
6,500 | 6,500 | — | — | — | — | — | |||||||||||||||||||||
|
Total
commercial
commitments
|
$ | 11,700 | $ | 11,700 | $ | — | $ | — | $ | — | $ | — | $ | — | ||||||||||||||
We have
commitments under non-cancelable operating leases primarily for office
facilities throughout the world. Certain leases require us to pay property
taxes, insurance and routine maintenance, and include escalation clauses. As of
December 31, 2009, we have non-cancelable operating lease obligations of
approximately $52 million compared to $50 million at December 31, 2008. Rent
expense under operating leases was $12 million, $12 million and $10 million for
the years ended December 31, 2009, 2008 and 2007, respectively.
Purchase
obligations primarily represent purchase commitments for customized inventory
and inventory components. As of December 31, 2009, we had non-cancelable
purchase commitments with various suppliers of customized inventory and
inventory components totaling approximately $6.5 million over the next twelve
months. At December 31, 2008, we had non-cancelable purchase commitments with
various suppliers of customized inventory and inventory components totaling
approximately $8.4 million.
Guarantees
are related to payments of customs and foreign grants. As of December 31, 2009,
we have outstanding guarantees for payment of customs and foreign grants
totaling approximately $5.2 million. As of December 31, 2008, we have
outstanding guarantees for payment of customs and foreign grants totaling
approximately $2.4 million.
Off-Balance Sheet
Arrangements. We do not have any debt
or off-balance sheet debt. As of December 31, 2009, we did not have any
relationships with any unconsolidated entities or financial partnerships, such
as entities often referred to as structured finance entities, which would have
been established for the purpose of facilitating off-balance sheet arrangements.
As such, we are not exposed to any financing, liquidity, market or credit risk
that could arise if we were engaged in such relationships.
Prospective
Capital Needs. We believe that our existing cash, cash
equivalents and marketable securities, together with cash generated from
operations and from the exercise of employee stock options and the purchase of
common stock through our employee stock purchase plan, will be sufficient to
cover our working capital needs, capital expenditures, investment requirements,
commitments, payment of dividends to our shareholders and repurchases of our
common stock for at least the next 12 months. However, we may choose or be
required to raise additional funds by selling equity or debt securities to the
public or to selected investors, or by borrowing money from financial
institutions. Historically, we have not had to rely on debt, public or private,
to fund our operating, financing or investing activities. We could also choose
or be required to reduce certain expenditures, such as payments of dividends or
repurchases of our common stock. In addition, even though we may not need
additional funds, we may still elect to sell additional equity or debt
securities or obtain credit facilities for other reasons. If we elect to raise
additional funds, we may not be able to obtain such funds on a timely basis on
acceptable terms, if at all. If we raise additional funds by issuing additional
equity or convertible debt securities, the ownership percentages of existing
shareholders would be reduced. In addition, the equity or debt securities that
we issue may have rights, preferences or privileges senior to those of our
common stock.
Although
we believe that we have sufficient capital to fund our activities for at least
the next 12 months, our future capital requirements may vary materially from
those now planned. We anticipate that the amount of capital we will need in the
future will depend on many factors, including:
|
·
|
general
economic and political conditions and specific conditions in the markets
we address, including the continuing volatility in the industrial economy,
current general economic volatility and trends in the industrial economy
in various geographic regions in which we do
business;
|
|
·
|
the
inability of certain of our customers who depend on credit to have access
to their traditional sources of credit to finance the purchase of products
from us, particularly in the current global economic environment, which
may lead them to reduce their level of purchases or to seek credit or
other accommodations from us;
|
|
·
|
the
overall levels of sales of our products and gross profit
margins;
|
|
·
|
our
business, product, capital expenditure and research and development plans,
and product and technology
roadmaps;
|
|
·
|
repurchases
of our common stock;
|
|
·
|
required
levels of research and development and other operating
costs;
|
|
·
|
litigation
expenses, settlements and
judgments;
|
|
·
|
the
levels of inventory and accounts receivable that we
maintain;
|
|
·
|
acquisitions
of other businesses, assets, products or
technologies;
|
|
·
|
capital
improvements for new and existing
facilities;
|
|
·
|
our
relationships with suppliers and customers;
and,
|
|
·
|
the
level of exercises of stock options and stock purchases under our employee
stock purchase plan.
|
Recently
Issued Accounting Pronouncements
In April
2009, the FASB updated FASB ASC 820 providing additional guidance for estimating
fair value when the volume and level of activity for the asset or liability have
significantly decreased. This update also includes guidance on identifying
circumstances that indicate a transaction is not orderly. We adopted the update
on April 1, 2009 as required and concluded it did not have a material impact on
our consolidated financial position or results of operations.
In
September 2009, the FASB updated FASB ASC 105, Generally Accepted Accounting Principles (FASB
ASC 105). The update establishes the FASB Standards Accounting Codification
(“Codification”) as the source of authoritative U.S. generally accepted
accounting principles (“GAAP”) recognized by the FASB to be applied to
nongovernmental entities and rules and interpretive releases of the SEC as
authoritative GAAP for SEC registrants. The Codification supersedes all existing
non-SEC accounting and reporting standards. This update is effective for
financial statements issued for interim and annual periods ending after
September 15, 2009. We adopted the update on July 1, 2009, as required and
concluded it did not have a material impact on our consolidated financial
position or results of operations.
In
October 2009, the FASB updated FASB ASC 605, Revenue Recognition (FASB ASC 605) that
amended the criteria for separating consideration in multiple-deliverable
arrangements. The amendments establish a selling price hierarchy for determining
the selling price of a deliverable. The selling price used for each deliverable
will be based on vendor-specific objective evidence if available, third–party
evidence if vendor-specific objective evidence is not available, or estimated
selling price if neither vendor-specific objective evidence nor third-party
evidence is available. The amendments will change the application of the
residual method of allocation and require that arrangement consideration be
allocated at the inception of the arrangement to all deliverables using the
relative selling price method. The relative selling price method allocates any
discount in the arrangement proportionally to each deliverable on the basis of
each deliverable’s selling price. This update will be effective prospectively
for revenue arrangements entered into or materially modified in fiscal years
beginning on or after June 15, 2010. Early adoption is permitted. We are
currently evaluating the requirements of this update and have not yet determined
the impact on our consolidated financial statements.
In
October 2009, the FASB updated FASB ASC 985, Software (FASB ASC 985) that changes the
accounting model for revenue arrangements that include both tangible products
and software elements. Tangible products containing software components and
non-software components that function together to deliver the tangible product’s
essential functionality are no longer within the scope of the software revenue
guidance in Subtopic 985-605. In addition, the amendments require that hardware
components of a tangible product containing software components always be
excluded from the software revenue guidance. This update will be effective
prospectively for revenue arrangements entered into or materially modified in
fiscal years beginning on or after June 15, 2010. Early adoption is permitted.
We are currently evaluating the requirements of this update and have not yet
determined the impact on our consolidated financial statements.
Critical
Accounting Policies
The
preparation of our financial statements in conformity with generally accepted
accounting principles requires us to make estimates and assumptions that affect
the reported amounts of assets, liabilities, revenues, expenses and related
disclosures of contingent assets and liabilities. We base our estimates on past
experience and other assumptions that we believe are reasonable under the
circumstances, and we evaluate these estimates on an ongoing basis. Our critical
accounting policies are those that affect our financial statements materially
and involve difficult, subjective or complex judgments by management. Although
these estimates are based on management's best knowledge of current events and
actions that may impact the company in the future, actual results may be
materially different from the estimates.
Our
critical accounting policies are as follows:
|
·
|
Revenue
recognition
|
We derive
revenue primarily from the sale/licensing of integrated hardware and software
solutions. Independent sales of application software licenses include post
contract support services. In addition, training services are sold separately.
The products and services are generally sold under standardized licensing and
sales arrangements with payment terms ranging from net 30 days in the U.S. to
net 30 days and up to net 90 days in some international markets. Approximately
83% of our product/license sales include both hardware and software in the
customer arrangement, with a small percentage of sales including other services.
We offer rights of return and standard warranties for product defects related to
our products. The rights of return are generally for a period of up to 30 days
after the delivery date. The standard warranties cover periods ranging from 90
days to three years. We do not generally enter into contracts requiring product
acceptance from the customer.
Revenue
is recognized in accordance with the provisions of FASB ASC
985, when persuasive evidence of an arrangement exists, delivery has occurred,
the fee is fixed or determinable, and collectability is probable. We enter into
certain arrangements where we are obligated to deliver multiple products and/or
services (“multiple elements”). In these transactions, we allocate the total
revenue among the elements based on vendor specific objective evidence (“VSOE”)
of fair value as determined by the sales price of each element when sold
separately.
When VSOE
of fair value is available for the undelivered element of a multiple element
arrangements, sales revenue is generally recognized on the date the product is
shipped, using the residual method under FASB ASC 985, with a portion of revenue
recorded as deferred (unearned) due to applicable undelivered elements.
Undelivered elements for our multiple element arrangements with a customer are
generally restricted to post contract support and training and education. The
amount of revenue allocated to these undelivered elements is based on the VSOE
of fair value for those undelivered elements. Deferred revenue due to
undelivered elements is recognized ratably on a straight-line basis over the
service period or when the service is completed. When VSOE of fair value is not
available for the undelivered element of a multiple element arrangement, sales
revenue is generally recognized ratably, on a straight-line basis over the
service period of the undelivered element, generally 12 months or when the
service is completed in accordance with the subscription method under FASB ASC
985. Deferred revenue at December 31, 2009 and 2008 was $57 million and $46
million, respectively.
The
application of FASB ASC 985, requires judgment, including whether a software
arrangement includes multiple elements, and if so, whether VSOE of fair value
exists for those elements. Changes to the elements in a software arrangement,
the ability to identify VSOE for those elements, the fair value of the
respective elements, and changes to a product’s estimated life cycle could
materially impact the amount of our earned and unearned revenue. Judgment is
also required to assess whether future releases of certain software represent
new products or upgrades and enhancements to existing products.
|
·
|
Estimating
allowances for sales returns
|
The
preparation of financial statements requires that we make estimates and
assumptions of potential future product returns related to current period
product revenue. We analyze historical returns, current economic trends, and
changes in customer demand and acceptance of our products when evaluating the
adequacy of our sales returns allowance. Significant judgments and estimates
must be made and used in connection with establishing the sales returns
allowance in any accounting period. A provision for estimated sales returns is
made by reducing recorded revenue by the amount of the allowance. Accounts
receivable is reported net of the allowance for sales returns. The allowance for
sales returns was $1.9 million and $1.8 million at December 31, 2009 and 2008,
respectively. Material differences may result in the amount and timing of our
revenue for any period if we made different judgments or utilized different
estimates or if actual results varied materially from our
estimates.
|
·
|
Estimating
allowances, specifically the allowance for doubtful accounts and the
adjustment for excess and obsolete
inventories
|
In
addition to estimating an allowance for sales returns, we must also make
estimates about the uncollectability of our accounts receivables. We
specifically analyze accounts receivable and analyze historical bad debts,
customer concentrations, customer credit-worthiness and current economic trends
when evaluating the adequacy of our allowance for doubtful accounts. Our
allowance for doubtful accounts was $2.7 million and $3.9 million at December
31, 2009 and 2008, respectively. We also write down our inventory for estimated
obsolescence or unmarketable inventory equal to the difference between the cost
of inventory and estimated market value based on assumptions of future demand
and market conditions. Our allowance for excess and obsolete inventories was
$4.4 million and $4.4 million at December 31, 2009 and 2008, respectively.
Significant judgments and estimates must be made and used in connection with
establishing these allowances. Material differences may result in the amount and
timing of our bad debt and inventory obsolescence if we made different judgments
or utilized different estimates or if actual results varied materially from our
estimates.
|
·
|
Accounting
for costs of computer software
|
We
capitalize costs related to the development and acquisition of certain software
products. Capitalization of costs begins when technological feasibility has been
established and ends when the product is available for general release to
customers. Technological feasibility for our products is established when the
product is available for beta release. Judgment is required in determining when
technological feasibility of a product is established. Amortization is computed
on an individual product basis for those products available for market and has
been recognized based on the product’s estimated economic life, generally three
years. At each balance sheet date, the unamortized costs are reviewed by
management and reduced to net realized value when necessary. As of December 31,
2009, unamortized capitalized software development costs were $18
million.
|
·
|
Valuation
of long-lived and intangible assets
|
We assess
the impairment of identifiable intangibles, long-lived assets and related
goodwill whenever events or changes in circumstances indicate that the carrying
value may not be recoverable. In accordance with FASB ASC 350, Intangibles – Goodwill and
Other (FASB ASC 350), goodwill is tested for impairment on an annual
basis, and between annual tests if indicators of potential impairment exist,
using a fair-value-based approach based on the market capitalization of the
reporting unit. Our annual impairment test was performed as of February 28,
2009. No impairment of goodwill has been identified during the period presented.
Goodwill is deductible for tax purposes in certain jurisdictions. We have
defined our operating segment based on geographic regions. We sell our products
in three geographic regions. Our sales to these regions share similar economic
characteristics, similar product mix, similar customers, and similar
distribution methods. Accordingly, we have elected to aggregate these three
geographic regions into a single operating segment. As we have one reporting
segment, we allocate goodwill to one reporting unit for goodwill impairment
testing. Factors considered important which could trigger an impairment review
include the following:
|
·
|
significant
underperformance relative to expected historical or projected future
operating results;
|
|
·
|
significant
changes in the manner of our use of the acquired assets or the strategy
for our overall business;
|
|
·
|
significant
negative industry or economic trends;
and,
|
|
·
|
our
market capitalization relative to net book
value.
|
When it
is determined that the carrying value of intangibles, long-lived assets and
related goodwill may not be recoverable based upon the existence of one or more
of the above indicators of impairment, the measurement of any impairment is
determined and the carrying value is reduced as appropriate. As of December 31,
2009, we had net goodwill of approximately $65 million.
|
·
|
Accounting
for income taxes
|
We
account for income taxes under the asset and liability method that requires the
recognition of deferred tax assets and liabilities for the expected future tax
consequences of events that have been recognized in our financial statements or
tax returns. Judgment is required in assessing the future tax consequences of
events that have been recognized in our financial statements or tax returns.
Variations in the actual outcome of these future tax consequences could
materially impact our financial position or our results of operations. In
estimating future tax consequences, all expected future events are considered
other than enactments of changes in tax laws or rates. Valuation allowances are
established when necessary to reduce deferred tax assets to amounts which are
more likely than not to be realized.
As a
result of certain foreign investment incentives available under Hungarian law,
the profit from our Hungarian operation was subject to a reduced income tax
rate. This special tax status terminated on January 1, 2008, with the merger of
our Hungarian manufacturing operations with its Hungarian parent company. The
tax position of our Hungarian operation continued to benefit from assets created
by the restructuring of our operations in Hungary. Realization of these assets
was based on estimated future earnings in Hungary. Partial release of the
valuation allowance on these assets resulted in income tax benefits of $18.3
million for the year ended December 31, 2007, and $8.7 million for the year
ended December 31, 2008.
For the
year 2009, we expected to recognize an additional tax benefit of $9.7 million
related to these assets. Effective January 1, 2010, a new tax law in Hungary
provides for an enhanced deduction for the qualified research and development
expenses of NI Hungary Software and Hardware Manufacturing Kft. ("NI Hungary").
During the three months ended December 31, 2009, we obtained confirmation of the
application of this new tax law for the qualified research and development
expenses of NI Hungary. Based on the application of this new tax law to the
qualified research and development expense of NI Hungary, we no longer expect to
have sufficient future taxable income in Hungary to realize the benefits of
these tax assets. As such, we recorded an income tax charge of $21.6 million
during the three months ended December 31, 2009, $18.4 million of which was
related to a valuation allowance on the previously recognized assets created by
the restructuring and $3.2 million of which was related to tax benefits from
other assets that we will no longer be able to realize as a result of this
change. We do not expect to realize the tax benefit of the remaining assets
created by the restructuring and therefore we have a full valuation allowance of
$98.2 million against those assets at December 31, 2009.
For
additional discussion about our income taxes including components of income
before income taxes, our provision for income taxes charged to operations,
components of our deferred tax assets and liabilities, a reconciliation of
income taxes at the U.S. federal statutory rate of 35% to our effective tax rate
and other tax matters, see Note 9 – Income taxes of Notes
to Consolidated Financial Statements.
|
·
|
Loss
contingencies
|
We accrue
for probable losses from contingencies including legal defense costs, on an
undiscounted basis, in accordance with FASB ASC 450, Contingencies (FASB ASC 450),
when such costs are considered probable of being incurred and are reasonably
estimable. We periodically evaluate available information, both internal and
external, relative to such contingencies and adjust this accrual as necessary.
Disclosure of a contingency is required if there is at least a reasonable
possibility that a loss has been incurred. In determining whether a loss should
be accrued we evaluate, among other factors, the degree of probability of an
unfavorable outcome and the ability to make a reasonable estimate of the amount
of loss. Changes in these factors could materially impact our financial position
or our results of operation.
ITEM
7A. QUANTITATIVE
AND QUALITATIVE DISCLOSURES ABOUT MARKET RISK
Financial
Risk Management
Our
international sales are subject to inherent risks, including fluctuations in
local economies; fluctuations in foreign currencies relative to the U.S. dollar;
difficulties in staffing and managing foreign operations; greater difficulty in
accounts receivable collection; costs and risks of localizing products for
foreign countries; unexpected changes in regulatory requirements, tariffs and
other trade barriers; difficulties in the repatriation of earnings and burdens
of complying with a wide variety of foreign laws. The vast majority of our sales
outside of North America are denominated in local currencies, and accordingly,
the U.S. dollar equivalent of these sales is affected by changes in the foreign
currency exchange rates. Net of hedging results, the change in exchange rates
had the effect of decreasing our consolidated sales by $29 million or 4% for the
year ended December 31, 2009, compared to 2008. If the local currencies in which
we sell our products strengthen against the U.S. dollar, we may need to lower
our prices in the local currency to remain competitive in our international
markets which could have a material adverse effect on our gross and net profit
margins. If the local currencies in which we sell our products weaken against
the U.S. dollar and if the local sales prices cannot be raised due to
competitive pressures, we will experience a deterioration of our gross and net
profit margins. Since most of our international operating expenses are also
incurred in local currencies, the change in exchange rates had the effect of
decreasing our operating expenses by $12 million or 2% for the year ended
December 31, 2009, compared to 2008. Currently, we are experiencing significant
volatility in foreign currency exchange rates in many of the markets in which we
do business. This has had a significant impact on the revaluation of our foreign
currency denominated firm commitments and on our ability to forecast our U.S.
dollar equivalent revenues and expenses. In the past, these dynamics have also
adversely affected our revenue growth in international markets and will likely
pose similar challenges in the future. Our foreign currency hedging program
includes both foreign currency forward and purchased option contracts to reduce
the effect of exchange rate fluctuations. However, our hedging program will not
eliminate all of our foreign exchange risks, particularly when market conditions
experience the recent level of volatility. (See “Net Foreign Exchange Gain
(Loss)” and Note 4 – Derivative
instruments and hedging activities of Notes to Consolidated Financial
Statements).
Inventory
Management
The
marketplace for our products dictates that many of our products be shipped very
quickly after an order is received. As a result, we are required to maintain
significant inventories. Therefore, inventory obsolescence is a risk for us due
to frequent engineering changes, shifting customer demand, the emergence of new
industry standards and rapid technological advances including the introduction
by us or our competitors of products embodying new technology. While we adjust
for excess and obsolete inventories and we monitor the valuation of our
inventories, there can be no assurance that our valuation adjustments will be
sufficient.
Market
Risk
We are
exposed to a variety of risks, including foreign currency fluctuations and
changes in the market value of our investments. In the normal course of
business, we employ established policies and procedures to manage our exposure
to fluctuations in foreign currency values and changes in the market value of
our investments.
Cash,
Cash Equivalents and Short-Term Investments
At
December 31, 2009, we had $289 million in cash, cash equivalents and short-term
investments. We maintain cash and cash equivalents with various financial
institutions located in many countries throughout the world. Approximately $114
million or 39% of these amounts were held in domestic accounts with various
financial institutions and $175 million or 61% was held in accounts outside of
the U.S. with various financial institutions. At December 31, 2009, $85 million
or 42% of our cash and cash equivalents was held in cash in various operating
accounts throughout the world, and $116 million or 58% was held in money market
accounts. The most significant of our operating accounts was our domestic
operating account which held approximately $22 million or 11% of our total cash
and cash equivalents at a bank that carried a A1 rating at December 31, 2009.
Our short-term investment balance is comprised of $35 million held in our
investment accounts in the U.S. and $52 million held in investment accounts of
our foreign subsidiaries.
Short-term
debt securities available-for-sale included auction rate securities backed by
education loan revenue bonds. One of our auction rate securities is from the
Vermont Student Assistance Corporation and has a par value of $2.2 million. The
other of our auction rate securities is from the New Hampshire Health and
Education Facilities Authority and has a par value of $6.4 million. At December
31, 2009, we reported these auction rate securities at their estimated fair
market value of $8.2 million as a component of short-term debt securities
available for sale. We are also a party to a UBS Auction Rate Securities Rights
(the “Rights”) agreement. The Rights agreement is a nontransferable right to
sell our auction rate securities, at par value, back to UBS at any time during
the period June 30, 2010, through July 2, 2012. At December 31, 2009, we
reported the Rights agreement at its estimated fair market value of $423,000 as
a component of short-term debt securities available for sale. See Note 3 – Fair value measurements in Notes to Consolidated
Financial Statements for further discussion of our auction rate securities and
our Rights agreement.
Due to
the fact that our Rights agreement has an initial exercise date that is less
than one year from now, we are now reporting our auction rate securities and the
corresponding Rights agreement as short-term. We continue to have the ability to
hold our auction rate securities to their ultimate maturities which are in
excess of one year and we have not made a determination as to whether we will
exercise our option under the Rights agreement or if we do choose to
exercise our option, at what point during the period June 30, 2010 through July
2, 2012, we would exercise our option. We have recorded the unrealized loss
related to the auction rate securities and the unrealized gain related to the
Rights agreement as a component of other income (expense), in our Consolidated
Statements of Income.
We do not
anticipate that the auction rate market will provide liquidity for these
securities in the foreseeable future. Should we need or desire to access the
funds invested in those securities prior to their maturity or prior to our
exercise period under the Rights agreement discussed above, we may be unable to
find a buyer in a secondary market outside the auction process or if a buyer in
a secondary market is found, we would likely realize a loss.
We
maintain an investment portfolio of various types of security holdings and
maturities. Pursuant to FASB ASC 820, cash equivalents and short-term
investments available-for-sale are valued using a market approach (Level 1)
based on the quoted market prices of identical instruments when available or
other observable inputs such as trading prices of identical instruments in
inactive markets. The estimated fair market value of both the auction rate
securities and the Rights agreement was determined using significant
unobservable inputs (Level 3) as prescribed by FASB ASC 820.
The goal
of our investment policy is to manage our investment portfolio to preserve
principal and liquidity while maximizing the return on our investment portfolio
through the full investment of available funds. We place our cash investments in
instruments that meet credit quality standards, as specified in our corporate
investment policy guidelines. These guidelines also limit the amount of credit
exposure to any one issue, issuer or type of instrument. Other than our auction
rate securities discussed above, at December 31, 2009, our cash equivalents and
short-term investments carried ratings from the major credit rating agencies
that were in accordance with our corporate investment policy. Our investment
policy allows investments in the following; government and federal agency
obligations, repurchase agreements (“Repos”), certificates of deposit and time
deposits, corporate obligations, medium term notes and deposit notes, commercial
paper including asset-backed commercial paper (“ABCP”), puttable bonds, general
obligation and revenue bonds, money market funds, taxable commercial paper,
corporate notes/bonds, municipal notes, municipal obligations, variable rate
demand notes and tax exempt commercial paper. All such instruments must carry
minimum ratings of A1/P1/F1, MIG1/VMIG1/SP1 and A2/A/A, as applicable, all of
which are considered “investment grade”. Our investment policy for marketable
securities requires that all securities mature in three years or less, with a
weighted average maturity of no longer than 18 months with at least 10% maturing
in 90 days or less.
We
account for our investments in debt and equity instruments under FASB ASC 320.
Our investments are classified as available-for-sale and accordingly are
reported at fair value, with unrealized gains and losses reported as other
comprehensive income, a component of shareholders’ equity. Unrealized losses are
charged against income when a decline in fair value is determined to be other
than temporary. Investments with maturities beyond one year are classified as
short-term based on their highly liquid nature and because such marketable
securities represent the investment of cash that is available for current
operations. The fair value of our short-term investments in debt securities at
December 31, 2009 and December 31, 2008 was $87 million and $6 million,
respectively. The increase was due to the net purchase of $74 million of
short-term investments and the transfer of $8.6 related to our auction rate
securities and our rights agreement from long-term investments to short-term
investments during the year ended December 31, 2009. The net purchase of $74
million of short term investments was done to diversify our holdings from money
market accounts to debt securities and to take advantage of higher yields
associated with longer maturity debt securities. We follow the guidance provided
by FASB ASC 320 to assess whether our investments with unrealized loss positions
are other than temporarily impaired. Realized gains and losses and declines in
value judged to be other than temporary are determined based on the specific
identification method and are reported in other income (expense), net, in our
Consolidated Statements of Income.
Long-Term
Investments
At
December 31, 2008, our long-term investments consisted primarily of Aaa/A/AAA
rated investments in auction rate securities that we originally purchased for
$8.6 million. These auction rate securities consist of education loan revenue
bonds. Auction rate securities are variable rate debt instruments whose interest
rates are typically reset approximately every 7 to 35 days. At December 31,
2008, we classified these investments as long-term due to the fact that the
underlying securities have contractual maturities that are greater than one
year. These contractual maturities are also in excess of the guidelines provided
for in our corporate investment policy. The auction rate securities are
classified as available-for-sale. At December 31, 2008, we reported these
long-term investments at their estimated fair market value of $7.0 million. In
November 2008, we accepted the Rights agreement offered by UBS as a liquidity
alternative to the failed auction process. The Rights agreement is a
nontransferable right to sell our auction rate securities, at par value, back to
UBS at any time during the period June 30, 2010, through July 2, 2012. At
December 31, 2008, we reported the Rights agreement at its estimated fair market
value of $1.6 million. At December 31, 2008 he estimated fair market value of
both the auction rate securities and the Rights agreement was determined using
significant unobservable inputs (Level 3) as prescribed by FASB ASC 820. These
auction rate securities and the Rights agreement are now reported as a component
of short-term investments as discussed above.
Interest
Rate Risk
Investments
in both fixed rate and floating rate instruments carry a degree of interest rate
risk. Fixed rate securities may have their market value adversely impacted due
to an increase in interest rates, while floating rate securities may produce
less income than expected if interest rates fall. Due in part to these factors,
our future investment income may fall short of expectations due to changes in
interest rates or if the decline in fair value of our publicly traded debt
investments is judged to be other-than-temporary. We may suffer losses in
principal if we are forced to sell securities that have declined in market value
due to changes in interest rates. However, because any debt securities we hold
are classified as available-for-sale, no gains or losses are realized in the
income statement due to changes in interest rates unless such securities are
sold prior to maturity or unless declines in value are determined to be
other-than-temporary. These securities are reported at fair value with the
related unrealized gains and losses included in accumulated other comprehensive
income (loss), a component of shareholders’ equity, net of tax.
In a
declining interest rate environment, as short-term investments mature,
reinvestment occurs at less favorable market rates. Given the short-term nature
of certain investments, the current interest rate environment of low or
declining rates will likely negatively impact our investment
income.
In order
to assess the interest rate risk associated with our investment portfolio, we
performed a sensitivity analysis to determine the impact a change in interest
rates would have on the value of the investment portfolio assuming a 100 basis
point parallel shift in the yield curve. Based on our investment positions as of
December 31, 2009, a 100 basis point increase or decrease in interest rates
across all maturities would result in a $614,000 increase or decrease in the
fair market value of the portfolio. As of December 31, 2008, a similar 100 basis
point shift in the yield curve would have resulted in a $50,000 increase or
decrease in the fair market value of the portfolio. Such losses would only be
realized if we sold the investments prior to maturity or if there is a other
than temporary impairment.
Actual
future gains and losses associated with our investments may differ from the
sensitivity analyses performed as of December 31, 2009 due to the inherent
limitations associated with predicting the changes in the timing and level of
interest rates and our actual exposures and positions.
Economic
conditions in 2008 and 2009 had negative effects on the financial
markets. In response to these conditions, we shifted a larger
percentage of our portfolio to money market funds, U.S. Treasuries and time
deposits toward the end of 2008. This had a negative impact on our investment
income in 2009. As we noted some stabilization in the financial markets
throughout 2009, we made net purchases of $74 million of short-term investments,
primarily to diversify our holdings from money market accounts to debt
securities and to take advantage of higher yields associated with longer
maturity debt securities. However, yields, even at longer maturities, remained
at or near historic lows throughout 2009. We cannot predict when interest rates
and investment yields will rise. If yields continue to stay at these low levels,
our investment income will continue to be negatively impacted.
Exchange
Rate Risk
Our
objective in managing our exposure to foreign currency exchange rate
fluctuations is to reduce the impact of adverse fluctuations in such exchange
rates on our earnings and cash flow. Accordingly, we utilize purchased foreign
currency option and forward contracts to hedge our exposure on anticipated
transactions and firm commitments. The principal currencies hedged are the Euro,
British pound, Japanese yen and Hungarian forint. We monitor our foreign
exchange exposures regularly to help ensure the overall effectiveness of our
foreign currency hedge positions. There can be no assurance that our foreign
currency hedging activities will substantially offset the impact of fluctuations
in currency exchanges rates on our results of operations and financial position.
Based on the foreign exchange instruments outstanding at December 31, 2009 and
December 31, 2008, an adverse change (defined as 20% in the Asian currencies and
10% in all other currencies) in exchange rates would result in a decline in the
aggregate settlement value of all of our instruments outstanding of
approximately $22 million and $31 million, respectively. However, as we utilize
foreign currency instruments for hedging anticipated and firmly committed
transactions, we believe that a loss in settlement value for those instruments
will be substantially offset by increases in the value of the underlying
exposure. (See Note 4 - Derivative instruments and hedging
activities of Notes to Consolidated Financial Statements for a further
description of our derivative instruments and hedging activities).
ITEM
8. FINANCIAL
STATEMENTS AND SUPPLEMENTARY DATA
The
information required by this item is incorporated by reference to the
Consolidated Financial Statements set forth on pages F-1 through F-31
hereof.
ITEM
9. CHANGES
IN AND DISAGREEMENTS WITH ACCOUNTANTS ON ACCOUNTING AND FINANCIAL
DISCLOSURE
There
were no disagreements with accountants on accounting and financial disclosure
for the year ended December 31, 2009.
ITEM
9A. CONTROLS
AND PROCEDURES
Evaluation
of Disclosure Controls and Procedures
As of the
end of the period covered by this Annual Report on Form 10-K, our Chief
Executive Officer, Dr. James Truchard, and our Chief Financial Officer, Alex
Davern, based on their evaluation of our disclosure controls and procedures (as
defined in Rules 13a-15(e) and 15d-15(e) of the Securities Exchange Act of 1934,
as amended), required by paragraph (b) of Rule 13a – 15 or Rule 15d – 15, have
concluded that our disclosure controls and procedures were effective at the
reasonable assurance level, to ensure the timely collection, evaluation and
disclosure of information relating to us that would potentially be subject to
disclosure under the Securities Exchange Act of 1934, as amended, and the rules
and regulations promulgated there under, and that such information is recorded,
processed, summarized and reported within the time periods specified in the
SEC’s rules and forms. These disclosure controls and procedures include, without
limitation, controls and procedures designed to ensure that information required
to be disclosed by us in the reports we file or submit is accumulated and
communicated to management, including our Chief Executive Officer and Chief
Financial Officer, as appropriate to allow timely decisions regarding required
disclosure. Our assessment of the effectiveness of our internal controls over
financial reporting is expressed at the level of reasonable assurance because a
control system, no matter how well designed and operated, can provide only
reasonable, but not absolute assurance that the control system’s objectives will
be met. We continue to enhance our internal control over financial reporting in
key functional areas with the goal of monitoring our operations at the level of
documentation, segregation of duties, and systems security necessary, as well as
transactional control procedures required under Auditing Standard No. 5 issued
by the Public Company Accounting Oversight Board. We discuss and disclose these
matters to the audit committee of our board of directors and to our
auditors.
Management
Report on Internal Control over Financial Reporting
Our
management is responsible for establishing and maintaining adequate internal
control over financial reporting to provide reasonable assurance regarding the
reliability of our financial reporting and the preparation of financial
statements for external purposes in accordance with generally accepted
accounting principles. Internal control over financial reporting includes those
policies and procedures that (i) pertain to the maintenance of records that in
reasonable detail accurately and fairly reflect the transactions and
dispositions of the assets of the company, (ii) provide reasonable assurance
that transactions are recorded as necessary to permit preparation of financial
statements in accordance with generally accepted accounting principles, and that
receipts and expenditures of the Company are being made only in accordance with
authorizations of management and directors of the Company; and (iii) provide
reasonable assurance regarding prevention or timely detection of unauthorized
acquisition, use or disposition of the Company’s assets that could have a
material effect on the financial statements.
Management
assessed our internal control over financial reporting as of December 31, 2009,
which was the end of our fiscal year. Management based its assessment on
criteria established in Internal Control – Integrated Framework issued by the
Committee of Sponsoring Organizations of the Treadway Commission. Management’s
assessment included evaluation of such elements as the design and operating
effectiveness of key financial reporting controls, process documentation,
accounting policies, and our overall control environment. This assessment is
supported by testing and monitoring performed by our finance
organization.
Based on
our assessment, management has concluded that our internal control over
financial reporting was effective as of the end of the fiscal year to provide
reasonable assurance regarding the reliability of financial reporting and the
preparation of financial statements for external reporting purposes in
accordance with generally accepted accounting principles. We reviewed the
results of management’s assessment with the Audit Committee of our Board of
Directors.
Our
independent registered public accounting firm, Ernst & Young LLP, audited
our consolidated financial statements, and independently assessed the
effectiveness of our internal control over financial reporting. Ernst &
Young LLP has issued their report, which is included in Part II, Item 8 of this
Form 10-K.
Changes
in Internal Control over Financial Reporting
During
the three months ended December 31, 2009, there was no change in our internal
control over financial reporting identified in connection with the evaluation
required by paragraph (d) of Rule 13a-15 or Rule 15d-15 that has materially
affected, or is reasonably likely to materially affect, our internal control
over financial reporting.
ITEM
9B. OTHER
INFORMATION
None.
PART
III
Certain
information required by Part III is omitted from this Report in that we intend
to file a definitive proxy statement pursuant to Regulation 14A with the
Securities and Exchange Commission (the “Proxy Statement”) relating to our
annual meeting of stockholders not later than 120 days after the end of the
fiscal year covered by this Report, and such information is incorporated by
reference herein.
ITEM
10. DIRECTORS,
EXECUTIVE OFFICERS AND CORPORATE GOVERNANCE
The
information concerning our directors required by this Item pursuant to Item 401
of Regulation S-K will appear in our Proxy Statement under the section “Election
of Directors” and such information is incorporated herein by
reference.
The
information concerning our executive officers required by this Item pursuant to
Item 401 of Regulation S-K will appear in our Proxy Statement under the section
“Executive Officers” and such information is incorporated herein by
reference.
The
information required by this Item pursuant to Item 405 of Regulation S-K
regarding compliance with Section 16(a) of the Securities Exchange Act of 1934,
as amended, will appear in our Proxy Statement under the section “Section 16(a)
Beneficial Ownership Reporting Compliance” and such information is incorporated
herein by reference.
The
information concerning our code of ethics that applies to our principal
executive officer, our principal financial officer, our controller or person
performing similar functions required by this Item pursuant to Item 406 of
Regulation S-K will appear in our Proxy Statement under the section “Code of
Ethics” and such information is incorporated herein by reference.
The
information required by this Item pursuant to Item 407(c)(3) of Regulation S-K
regarding material changes, if any, to procedures by which security holders may
recommend nominees to our board of directors will appear in our Proxy Statement
under the section “Deadline for Receipt of Stockholder Proposals” and such
information is incorporated herein by reference.
The
information required by this Item pursuant to Item 407(d)(4) and Item 407(d)(5)
of Regulation S-K regarding our Audit Committee and our audit committee
financial expert(s), respectively, will appear in our Proxy Statement under the
heading “Corporate Governance” and such information is incorporated herein by
reference.
ITEM
11. EXECUTIVE
COMPENSATION
The
information required by this Item pursuant to Item 402 of Regulation S-K
regarding director compensation will appear in our Proxy Statement under the
section “Board Compensation” and such information is incorporated herein by
reference.
The
information required by this Item pursuant to Item 402 of Regulation S-K
regarding executive officer compensation, including our Compensation Discussion
& Analysis, will appear in our Proxy Statement under the section “Executive
Compensation” and such information is incorporated herein by
reference.
The
information required by this Item pursuant to Item 407(e)(4) of Regulation S-K
will appear in our Proxy Statement under the section “Compensation Committee
Interlocks and Insider Participation” and such information is incorporated
herein by reference.
The
information required by this Item pursuant to Item 407(e)(5) will appear in our
Proxy Statement under the section “Compensation Committee Report” and such
information is incorporated herein by reference.
ITEM
12. SECURITY
OWNERSHIP OF CERTAIN BENEFICIAL OWNERS AND MANAGEMENT AND RELATED STOCKHOLDER
MATTERS
From time
to time our directors, executive officers and other insiders may adopt stock
trading plans pursuant to Rule 10b5-1(c) promulgated by the Securities and
Exchange Commission under the Securities Exchange Act of 1934, as amended.
Jeffrey L. Kodosky and James J. Truchard have made periodic sales of our stock
pursuant to such plans.
The
information required by this Item pursuant to Item 403 of Regulation S-K
concerning security ownership of certain beneficial owners and management will
appear in our Proxy Statement under the section “Security Ownership” and such
information is incorporated herein by reference.
The
information required by this Item pursuant to Item 201(d) of Regulation S-K
concerning securities authorized for issuance under equity compensation plans
will appear in our Proxy Statement under the section “Equity Compensation Plans
Information” and such information is incorporated herein by
reference.
ITEM
13. CERTAIN
RELATIONSHIPS AND RELATED TRANSACTIONS AND DIRECTOR INDEPENDENCE
In
addition, the information required by this Item pursuant to Item 404 of
Regulation S-K will appear in our Proxy Statement under the section “Certain
Relationships and Related Transactions” and such information is incorporated
herein by reference.
The
information required by this Item pursuant to Item 407(a) of Regulation S-K
regarding the independence of our directors will appear in our Proxy Statement
under the section “Corporate Governance” and such information is incorporated
herein by reference.
ITEM
14. PRINCIPAL
ACCOUNTING FEES AND SERVICES
The
information concerning principal accountant fees and services required by this
Item is incorporated by reference to our Proxy Statement under the heading
“Independent Public Accountants.”
The
information concerning pre-approval policies for audit and non-audit services
required by this Item is incorporated by reference to our Proxy Statement under
the heading “Audit Committee Pre-Approval of Audit and Permissible Non-Audit
Services of Independent Auditors.”
PART
IV
ITEM
15. EXHIBITS
AND FINANCIAL STATEMENT SCHEDULES
|
(a)
|
Documents
Filed with Report
|
1. Financial
Statements.
2. Financial Statement
Schedules.
None
3. Exhibits.
|
Exhibit
Number
|
Description
|
|
|
3.1(2)
|
Certificate
of Incorporation, as amended, of the Company.
|
|
|
3.2(11)
|
Amended
and Restated Bylaws of the Company.
|
|
|
3.3(4)
|
Certificate
of Designation of Rights, Preferences and Privileges of Series A
Participating Preferred Stock of the Company.
|
|
|
4.1(1)
|
Specimen
of Common Stock certificate of the Company.
|
|
|
4.2(3)
|
Rights
Agreement dated as of January 21, 2004, between the Company and EquiServe
Trust Company, N.A.
|
|
|
10.1(1)
|
Form
of Indemnification Agreement.
|
|
|
10.2(5)
|
1994
Incentive Plan, as amended.*
|
|
|
10.3(9)
|
1994
Employee Stock Purchase Plan.*
|
|
|
10.5(7)
|
2005
Incentive Plan.*
|
|
|
10.6(8)
|
National
Instruments Corporation Annual Incentive Program.*
|
|
|
10.7(6)
|
National
Instruments Corporation Annual Incentive Program, as
amended.*
|
|
|
10.8(10)
|
Form
of Restricted Stock Unit Award Agreement (Non-Employee
Director).*
|
|
|
10.9(10)
|
Form
of Restricted Stock Unit Award Agreement (Performance
Vesting).*
|
|
|
10.10(10)
|
Form
of Restricted Stock Unit Award Agreement (Current
Employee).*
|
|
|
10.11(10)
|
Form
of Restricted Stock Unit Award Agreement (Newly Hired
Employee).*
|
|
|
21.1
|
Subsidiaries
of the Company.
|
|
|
23.1
|
Consent
of Independent Registered Public Accounting Firm.
|
|
|
24.0
|
Power
of Attorney (included on page 41).
|
|
|
31.1
|
Certification
of Chief Executive Officer Pursuant to 18 U.S.C. Section 1350, as Adopted
Pursuant to Section 302 of the Sarbanes-Oxley Act of
2002.
|
|
|
31.2
|
Certification
of Chief Financial Officer Pursuant to 18 U.S.C. Section 1350, as Adopted
Pursuant to Section 302 of the Sarbanes-Oxley Act of
2002.
|
|
|
32.1
|
Certification
of Chief Executive Officer and Chief Financial Officer Pursuant to 18
U.S.C. Section 1350, as Adopted Pursuant to Section 906 of the
Sarbanes-Oxley Act of
2002.
|
|
|
(1)
|
Incorporated by reference to the Company's Registration Statement on Form S-1 (Reg. 33-88386) declared effective March 13, 1995. |
| (2) | Incorporated by reference to the same-numbered exhibit filed with the Company's Annual Report on Form 10-K for the fiscal year ended December 31, 2003. |
| (3) | Incorporated by reference to exhibit 4.1 filed with the Company's Current Report on Form 8-K filed on January 28, 2004. |
| (4) | Incorporated by reference to the same-numbered exhibit filed with the Company's Form 8-K on April 27, 2004. |
| (5) | Incorporated by reference to the same-numbered exhibit filed with the Company's Form 10-Q on August 5, 2004. |
| (6) | Incorporated by reference to exhibit 99.2 filed with the Company's Current Report on Form 8-K filed on October 28, 2008. |
| (7) | Incorporated by reference to exhibit A of the Company's Proxy Statement dated and filed on April 4, 2005. |
| (8) | Incorporated by reference to exhibit 99.2 filed with the Company's Current Report on Form 8-K filed on October 22, 2008. |
| (9) | Incorporated by reference to exhibit 10.3 filed with the Company's Annual Report on Form 10-K for the fiscal year ended December 31, 2006. |
| (10) | Incorporated by reference to the same-numbered exhibit filed with the Company's Form 10-Q on August 2, 2006. |
| (11) | Incorporated by reference to the same-numbered exhibit filed with the Company's Annual Report on Form 10-K for the fiscal year ended December 31, 2007. |
| * | Management Contract or Compensatory Plan or Arrangement. |
|
(b)
|
Exhibits
|
See Item
15(a)(3) above.
|
(c)
|
Financial
Statement Schedules
|
See Item
15(a)(2) above.
SIGNATURES
Pursuant
to the requirements of Section 13 or 15(d) of the Securities Exchange Act of
1934, the registrant has duly caused this report to be signed on its behalf by
the undersigned thereunto duly authorized.
| Registrant | |||
| NATIONAL INSTRUMENTS CORPORATION | |||
|
February
17, 2010
|
By:
|
/s/ Dr. James J. Truchard | |
| Dr. James J. Truchard | |||
| Chairman of the Board and President | |||
POWER
OF ATTORNEY
KNOW ALL
PERSONS BY THESE PRESENTS, that each person whose signature appears below
constitutes and appoints Dr. James J. Truchard and Alexander M. Davern, jointly
and severally, his or her attorneys-in-fact, each with the power of
substitution, for him or her in any and all capacities, to sign any amendments
to this Report on Form 10-K, and to file the same, with exhibits thereto and
other documents in connection therewith, with the Securities and Exchange
Commission, hereby ratifying and confirming all that each of said
attorneys-in-fact, or his substitute or substitutes, may do or cause to be done
by virtue hereof.
Pursuant
to the requirements of the Securities Exchange Act of 1934, this report has been
signed below by the following persons on behalf of the registrant and in the
capacities and on the dates indicated.
|
Signature
|
Capacity
in Which Signed
|
Date
|
||
|
/s/
Dr. James J. Truchard
|
Chairman
of the Board and President
(Principal Executive Officer)
|
February
17, 2010
|
||
|
Dr.
James J. Truchard
|
||||
|
/s/
Alex M. Davern
|
Chief
Financial Officer and Treasurer
(Principal Financial and Accounting
Officer)
|
February
17, 2010
|
||
|
Alex
M. Davern
|
||||
|
/s/
Jeffrey L. Kodosky
|
Director
|
February
17, 2010
|
||
|
Jeffrey
L. Kodosky
|
||||
| /s/ Dr. Donald M. Carlton | Director |
February
17, 2010
|
||
| Dr. Donald M. Carlton | ||||
| /s/ Charles J. Roesslein | Director |
February
17, 2010
|
||
| Charles J. Roesslein | ||||
| /s/ Duy-Loan T. Le | Director |
February
17, 2010
|
||
| Duy-Loan T. Le | ||||
| /s/ John Medica | Director |
February
17, 2010
|
||
| John Medica |
NATIONAL
INSTRUMENTS CORPORATION
INDEX
TO FINANCIAL STATEMENTS
|
Page No.
|
|
|
Financial
Statements:
|
|
| Report of Independent Registered Public Accounting Firm | F-2 |
| Report of Independent Registered Public Accounting Firm | F-3 |
| Consolidated Balance Sheets as of December 31, 2009 and 2008 | F-4 |
| Consolidated Statements of Income for each of the Three Years in the period Ended December 31, 2009 | F-5 |
| Consolidated Statements of Cash Flows for each of the Three Years in the period Ended December 31, 2009 | F-6 |
| Consolidated Statements of Stockholders' Equity for each of the Three Years in the period Ended December 31, 2009 | F-7 |
| Notes to Consolidated Financial Statements | F-8 |
All
schedules are omitted because they are not applicable.
The
Board of Directors and Shareholders of National Instruments
Corporation:
We have
audited the accompanying consolidated balance sheets of National Instruments
Corporation as of December 31, 2009 and 2008, and the related consolidated
statements of income, stockholders' equity, and cash flows for each of the three
fiscal years in the period ended December 31, 2009. These financial statements
are the responsibility of the Company's management. Our responsibility is to
express an opinion on these financial statements based on our
audits.
We
conducted our audits in accordance with the standards of the Public Company
Accounting Oversight Board (United States). Those standards require that we plan
and perform the audit to obtain reasonable assurance about whether the financial
statements are free of material misstatement. An audit includes examining, on a
test basis, evidence supporting the amounts and disclosures in the financial
statements. An audit also includes assessing the accounting principles used and
significant estimates made by management, as well as evaluating the overall
financial statement presentation. We believe that our audits provide a
reasonable basis for our opinion.
In our
opinion, the financial statements referred to above present fairly, in all
material respects, the consolidated financial position of National Instruments
Corporation at December 31, 2009 and 2008, and the consolidated results of their
operations and their cash flows for each of the three fiscal years in the period
ended December 31, 2009, in conformity with U.S. generally accepted accounting
principles.
We also
have audited, in accordance with the standards of the Public Company Accounting
Oversight Board (United States), National Instruments Corporation internal
control over financial reporting as of December 31, 2009, based on criteria
established in Internal Control-Integrated Framework issued by the Committee of
Sponsoring Organizations of the Treadway Commission and our report dated
February 17, 2010 expressed an unqualified opinion thereon.
/s/ Ernst
& Young LLP
Austin,
Texas
February 17, 2010
The
Board of Directors and Shareholders of National Instruments
Corporation:
We have
audited National Instruments Corporation’s internal control over financial
reporting as of December 31, 2009, based on criteria established in Internal
Control—Integrated Framework issued by the Committee of Sponsoring Organizations
of the Treadway Commission (the COSO criteria). National Instruments
Corporation’s management is responsible for maintaining effective internal
control over financial reporting, and for its assessment of the effectiveness of
internal control over financial reporting included in the accompanying
Management Report on Internal Control over Financial Reporting. Our
responsibility is to express an opinion on the company’s internal control over
financial reporting based on our audit.
We
conducted our audit in accordance with the standards of the Public Company
Accounting Oversight Board (United States). Those standards require that we plan
and perform the audit to obtain reasonable assurance about whether effective
internal control over financial reporting was maintained in all material
respects. Our audit included obtaining an understanding of internal control over
financial reporting, assessing the risk that a material weakness exists, testing
and evaluating the design and operating effectiveness of internal control based
on the assessed risk, and performing such other procedures as we considered
necessary in the circumstances. We believe that our audit provides a reasonable
basis for our opinion.
A
company’s internal control over financial reporting is a process designed to
provide reasonable assurance regarding the reliability of financial reporting
and the preparation of financial statements for external purposes in accordance
with generally accepted accounting principles. A company’s internal control over
financial reporting includes those policies and procedures that (1) pertain to
the maintenance of records that, in reasonable detail, accurately and fairly
reflect the transactions and dispositions of the assets of the company; (2)
provide reasonable assurance that transactions are recorded as necessary to
permit preparation of financial statements in accordance with generally accepted
accounting principles, and that receipts and expenditures of the company are
being made only in accordance with authorizations of management and directors of
the company; and (3) provide reasonable assurance regarding prevention or timely
detection of unauthorized acquisition, use or disposition of the company’s
assets that could have a material effect on the financial
statements.
Because
of its inherent limitations, internal control over financial reporting may not
prevent or detect misstatements. Also, projections of any evaluation of
effectiveness to future periods are subject to the risk that controls may become
inadequate because of changes in conditions, or that the degree of compliance
with the policies or procedures may deteriorate.
In our
opinion, National Instruments Corporation maintained, in all material respects,
effective internal control over financial reporting as of December 31, 2009,
based on the COSO criteria.
We also
have audited, in accordance with the standards of the Public Company Accounting
Oversight Board (United States), the consolidated balance sheets of National
Instruments Corporation as of December 31, 2009 and 2008, and the related
consolidated statements of income, stockholders’ equity, and cash flows for each
of the three years in the period ended December 31, 2009 and our report dated
February 17, 2010 expressed an unqualified opinion thereon.
/s/ Ernst
& Young LLP
Austin,
Texas
February
17, 2010
NATIONAL
INSTRUMENTS CORPORATION
(in
thousands, except share data)
|
|
December 31,
|
|||||||
|
2009
|
2008
|
|||||||
|
Assets
|
||||||||
|
Current
assets:
|
||||||||
|
Cash
and cash
equivalents
|
$ | 201,465 | $ | 229,400 | ||||
|
Short-term
investments
|
87,196 | 6,220 | ||||||
|
Accounts
receivable,
net
|
103,957 | 121,548 | ||||||
|
Inventories,
net
|
86,515 | 107,358 | ||||||
|
Prepaid
expenses and other current
assets
|
36,523 | 43,062 | ||||||
|
Deferred
income taxes,
net
|
16,522 | 21,435 | ||||||
|
Total
current
assets
|
532,178 | 529,023 | ||||||
|
Long-term
investments
|
— | 10,500 | ||||||
|
Property
and equipment,
net
|
153,265 | 154,477 | ||||||
|
Goodwill,
net
|
64,779 | 64,561 | ||||||
|
Intangible
assets,
net
|
43,390 | 41,915 | ||||||
|
Other
long-term
assets
|
19,417 | 32,115 | ||||||
|
Total
assets
|
$ | 813,029 | $ | 832,591 | ||||
|
Liabilities
and Stockholders’ Equity
|
||||||||
|
Current
liabilities:
|
||||||||
|
Accounts
payable
|
$ | 23,502 | $ | 30,876 | ||||
|
Accrued
compensation
|
14,934 | 22,012 | ||||||
|
Deferred
revenue
|
57,242 | 45,514 | ||||||
|
Accrued
expenses and other
liabilities
|
8,560 | 18,848 | ||||||
|
Other
taxes
payable
|
14,181 | 13,481 | ||||||
|
Total
current
liabilities
|
118,419 | 130,731 | ||||||
|
Deferred
income
taxes
|
25,012 | 25,157 | ||||||
|
Liability
for uncertain tax
positions
|
11,062 | 9,364 | ||||||
|
Other
long-term
liabilities
|
4,116 | 2,901 | ||||||
|
Total
liabilities
|
158,609 | 168,153 | ||||||
|
Commitments
and contingencies
|
||||||||
|
Stockholders’
equity:
|
||||||||
|
Preferred
stock: par value $0.01; 5,000,000 shares authorized; none issued and
outstanding
|
— | — | ||||||
|
Common
stock: par value $0.01; 180,000,000 shares authorized;
77,367,874
and 77,193,063 shares issued and outstanding,
respectively
|
774 | 772 | ||||||
|
Additional
paid-in
capital
|
336,446 | 300,352 | ||||||
|
Retained
earnings
|
303,655 | 352,831 | ||||||
|
Accumulated
other comprehensive
income
|
13,545 | 10,483 | ||||||
|
Total
stockholders’
equity
|
654,420 | 664,438 | ||||||
|
Total
liabilities and stockholders’
equity
|
$ | 813,029 | $ | 832,591 | ||||
The
accompanying notes are an integral part of these financial
statements.
NATIONAL
INSTRUMENTS CORPORATION
(in
thousands, except per share data)
|
|
For
the Years
Ended December 31,
|
|||||||||||
|
2009
|
2008
|
2007
|
||||||||||
|
Net
sales:
|
||||||||||||
|
Product
|
$ | 623,736 | $ | 765,441 | $ | 701,589 | ||||||
|
Software
maintenance
|
52,858 | 55,096 | 38,789 | |||||||||
|
Total
net
sales
|
676,594 | 820,537 | 740,378 | |||||||||
|
Cost
of sales:
|
||||||||||||
|
Product
|
164,700 | 201,064 | 180,556 | |||||||||
|
Software
maintenance
|
5,184 | 6,045 | 4,711 | |||||||||
|
Total
cost of
sales
|
169,884 | 207,109 | 185,267 | |||||||||
|
Gross
profit
|
506,710 | 613,428 | 555,111 | |||||||||
|
Operating
expenses:
|
||||||||||||
|
Sales
and
marketing
|
269,267 | 307,409 | 264,060 | |||||||||
|
Research
and
development
|
132,974 | 143,140 | 126,515 | |||||||||
|
General
and
administrative
|
57,938 | 67,162 | 62,445 | |||||||||
|
Total
operating
expenses
|
460,179 | 517,711 | 453,020 | |||||||||
|
Operating
income
|
46,531 | 95,717 | 102,091 | |||||||||
|
Other
income (expense):
|
||||||||||||
|
Interest
income
|
1,629 | 5,996 | 9,822 | |||||||||
|
Net
foreign exchange gain
(loss)
|
734 | (3,737 | ) | 1,672 | ||||||||
|
Other
income (expense),
net
|
1,351 | 161 | (158 | ) | ||||||||
|
Income
before income
taxes
|
50,245 | 98,137 | 113,427 | |||||||||
|
Provision
for income
taxes
|
33,160 | 13,310 | 6,394 | |||||||||
|
Net
income
|
$ | 17,085 | $ | 84,827 | $ | 107,033 | ||||||
|
Basic
earnings per
share
|
$ | 0.22 | $ | 1.08 | $ | 1.35 | ||||||
|
Weighted
average shares outstanding -
basic
|
77,520 | 78,567 | 79,468 | |||||||||
|
Diluted
earnings per
share
|
$ | 0.22 | $ | 1.07 | $ | 1.32 | ||||||
|
Weighted
average shares outstanding –
diluted
|
78,026 | 79,515 | 81,043 | |||||||||
|
Dividends
declared per
share
|
$ | 0.48 | $ | 0.44 | $ | 0.34 | ||||||
The
accompanying notes are an integral part of these financial
statements.
NATIONAL
INSTRUMENTS CORPORATION
(in
thousands)
|
|
For the Years Ended December
31,
|
|||||||||||
|
2009
|
2008
|
2007
|
||||||||||
|
Cash
flow from operating activities:
|
||||||||||||
|
Net
income
|
$ | 17,085 | $ | 84,827 | $ | 107,033 | ||||||
|
Adjustments
to reconcile net income to net cash provided by operating
activities:
|
||||||||||||
|
Depreciation
and
amortization
|
38,365 | 37,103 | 36,605 | |||||||||
|
Stock-based
compensation
|
20,299 | 19,854 | 17,754 | |||||||||
|
Tax
expense/(benefit from) deferred income
taxes
|
17,196 | (4,475 | ) | (16,954 | ) | |||||||
|
Tax
expense/(benefit from) stock option
plans
|
1,450 | (1,213 | ) | (2,964 | ) | |||||||
|
Changes
in operating assets and liabilities:
|
||||||||||||
|
Accounts
receivable
|
17,591 | 12,159 | (14,047 | ) | ||||||||
|
Inventories
|
20,843 | (24,578 | ) | (5,537 | ) | |||||||
|
Prepaid
expenses and other
assets
|
12,740 | (10,340 | ) | (12,330 | ) | |||||||
|
Accounts
payable
|
(7,374 | ) | (5,648 | ) | 4,186 | |||||||
|
Deferred
revenue
|
11,728 | 9,423 | 13,883 | |||||||||
|
Taxes
and other
liabilities
|
(14,272 | ) | 4,706 | 19,743 | ||||||||
|
Net
cash provided by operating
activities
|
135,651 | 121,818 | 147,372 | |||||||||
|
Cash
flow from investing activities:
|
||||||||||||
|
Acquisitions,
net of cash
received
|
— | (17,310 | ) | — | ||||||||
|
Capital
expenditures
|
(20,847 | ) | (25,771 | ) | (24,864 | ) | ||||||
|
Capitalization
of internally developed
software
|
(12,583 | ) | (9,487 | ) | (8,263 | ) | ||||||
|
Additions
to other
intangibles
|
(4,602 | ) | (3,010 | ) | (6,447 | ) | ||||||
|
Purchases
of short-term
investments
|
(93,087 | ) | (9,061 | ) | (87,586 | ) | ||||||
|
Sales
and maturities of short-term
investments
|
19,204 | 86,179 | 143,938 | |||||||||
|
Purchases
of foreign currency option
contracts
|
— | (2,784 | ) | (2,242 | ) | |||||||
|
Net
cash provided by (used in) investing
activities
|
(111,915 | ) | 18,756 | 14,536 | ||||||||
|
Cash
flow from financing activities:
|
||||||||||||
|
Proceeds
from issuance of common
stock
|
21,672 | 31,150 | 36,460 | |||||||||
|
Repurchase
of common
stock
|
(34,585 | ) | (103,641 | ) | (79,728 | ) | ||||||
|
Dividends
paid
|
(37,308 | ) | (34,735 | ) | (27,052 | ) | ||||||
|
Tax
(expense)/benefit from stock option
plans
|
(1,450 | ) | 1,213 | 2,964 | ||||||||
|
Net
cash (used in) financing
activities
|
(51,671 | ) | (106,013 | ) | (67,356 | ) | ||||||
|
Net
change in cash and cash
equivalents
|
(27,935 | ) | 34,561 | 94,552 | ||||||||
|
Cash
and cash equivalents at beginning of
period
|
229,400 | 194,839 | 100,287 | |||||||||
|
Cash
and cash equivalents at end of
period
|
$ | 201,465 | $ | 229,400 | $ | 194,839 | ||||||
|
Cash
paid for interest and income taxes:
|
||||||||||||
|
Interest
|
$ | 23 | $ | 116 | $ | 159 | ||||||
|
Income
taxes
|
$ | 14,608 | $ | 17,214 | $ | 21,147 | ||||||
The
accompanying notes are an integral part of these financial
statements.
NATIONAL
INSTRUMENTS CORPORATION
(in
thousands, except share data)
|
|
Common
Stock
Shares
|
Common
Stock
Amount
|
Additional
Paid-In
Capital
|
Deferred
Compensation
|
Retained
Earnings
|
Accumulated
Other
Comprehensive
Income/(Loss)
|
Total
Stockholders’
Equity
|
|||||||||||||||||||||
|
Balance
at December 31, 2006
|
79,883,837 | $ | 799 | $ | 207,808 | $ | — | $ | 385,480 | $ | 2,499 | $ | 596,586 | |||||||||||||||
|
Net
income
|
107,033 | 107,033 | ||||||||||||||||||||||||||
|
Foreign
currency translation adjustment
(net of $286 tax expense)
|
4,483 | 4,483 | ||||||||||||||||||||||||||
|
Unrealized
gain on securities available-for-sale
(net of $13 tax
expense)
|
200 | 200 | ||||||||||||||||||||||||||
|
Unrealized
loss on derivative instruments
(net of $7 tax
benefit)
|
(117 | ) | (117 | ) | ||||||||||||||||||||||||
|
Total comprehensive income
|
111,599 | |||||||||||||||||||||||||||
|
Issuance
of common stock under employee
plans, including
tax benefits
|
2,251,657 | 22 | 36,438 | 36,460 | ||||||||||||||||||||||||
|
Stock-based
compensation
|
17,754 | 17,754 | ||||||||||||||||||||||||||
|
Repurchase
and retirement of common stock
|
(2,730,135 | ) | (27 | ) | (7,102 | ) | (72,599 | ) | (79,728 | ) | ||||||||||||||||||
|
Dividends
paid
|
(27,052 | ) | (27,052 | ) | ||||||||||||||||||||||||
|
Disqualified
dispositions
|
5,467 | 5,467 | ||||||||||||||||||||||||||
|
Balance at December 31, 2007
|
79,405,359 | $ | 794 | $ | 260,365 | $ | — | $ | 392,862 | $ | 7,065 | $ | 661,086 | |||||||||||||||
|
Net
income
|
84,827 | 84,827 | ||||||||||||||||||||||||||
|
Foreign
currency translation adjustment
(net of $681 tax
benefit)
|
(4,188 | ) | (4,188 | ) | ||||||||||||||||||||||||
|
Unrealized
loss on securities available-for-sale
(net of $82 tax
benefit)
|
(502 | ) | (502 | ) | ||||||||||||||||||||||||
|
Unrealized
gain on derivative instruments
(net of $1,320 tax expense)
|
8,108 | 8,108 | ||||||||||||||||||||||||||
|
Total comprehensive income
|
88,245 | |||||||||||||||||||||||||||
|
Issuance
of common stock under employee
plans, including tax benefits
|
1,897,746 | 19 | 31,131 | 31,150 | ||||||||||||||||||||||||
|
Stock-based
compensation
|
19,854 | 19,854 | ||||||||||||||||||||||||||
|
Repurchase
and retirement of common stock
|
(4,110,042 | ) | (41 | ) | (13,477 | ) | (90,123 | ) | (103,641 | ) | ||||||||||||||||||
|
Dividends
paid
|
(34,735 | ) | (34,735 | ) | ||||||||||||||||||||||||
|
Disqualified
dispositions
|
2,479 | 2,479 | ||||||||||||||||||||||||||
|
Balance at December 31, 2008
|
77,193,063 | $ | 772 | $ | 300,352 | $ | — | $ | 352,831 | $ | 10,483 | $ | 664,438 | |||||||||||||||
|
Net
income
|
17,085 | 17,085 | ||||||||||||||||||||||||||
|
Foreign
currency translation adjustment
(net of $1,799 tax expense)
|
927 | 927 | ||||||||||||||||||||||||||
|
Unrealized
gain on securities available-for-sale
(net of $1,093 tax expense)
|
563 | 563 | ||||||||||||||||||||||||||
|
Unrealized
gain on derivative instruments
(net of $3,053 tax expense)
|
1,572 | 1,572 | ||||||||||||||||||||||||||
|
Total comprehensive income
|
20,147 | |||||||||||||||||||||||||||
|
Issuance
of common stock under employee
plans,
including tax benefits
|
1,618,252 | 16 | 21,656 | 21,672 | ||||||||||||||||||||||||
|
Stock-based
compensation
|
20,574 | 20,574 | ||||||||||||||||||||||||||
|
Repurchase
and retirement of common stock
|
(1,443,441 | ) | (14 | ) | (5,618 | ) | (28,953 | ) | (34,585 | ) | ||||||||||||||||||
|
Dividends
paid
|
(37,308 | ) | (37,308 | ) | ||||||||||||||||||||||||
|
Disqualified
dispositions
|
(518 | ) | (518 | ) | ||||||||||||||||||||||||
|
Balance at December 31, 2009
|
77,367,874 | $ | 774 | $ | 336,446 | $ | — | $ | 303,655 | $ | 13,545 | $ | 654,420 | |||||||||||||||
The
accompanying notes are an integral part of these financial
statements.
NATIONAL
INSTRUMENTS CORPORATION
Note
1 – Operations and summary of significant accounting policies
National
Instruments Corporation is a Delaware corporation. We provide flexible
application software and modular, multifunction hardware that users combine with
industry-standard computers, networks and third party devices to create
measurement, automation and embedded systems, which we also refer to as “virtual
instruments.” Our approach gives customers the ability to quickly and
cost-effectively design, prototype and deploy unique custom-defined solutions
for their design, control and test application needs. We offer hundreds of
products used to create virtual instrumentation systems for general, commercial,
industrial and scientific applications. Our products may be used in different
environments, and consequently, specific application of our products is
determined by the customer and generally is not known to us. We approach all
markets with essentially the same products, which are used in a variety of
applications from research and development to production testing, monitoring and
industrial control. The following industries and applications are served by us
worldwide: advanced research, automotive, commercial aerospace, computers and
electronics, continuous process manufacturing, education, government/defense,
medical research/pharmaceutical, power/energy, semiconductors, automated test
equipment, telecommunications and others. These financial statements have been
prepared in accordance with accounting principles generally accepted in the
United States of America.
Principles
of consolidation
The
Consolidated Financial Statements include the accounts of National Instruments
Corporation and its subsidiaries. All significant intercompany accounts and
transactions have been eliminated.
We have
historically recorded the excess of the purchase price over the par or stated
value of retired shares of our common stock as a reduction of additional paid-in
capital. We completed our review of this accounting policy under FASB ASC 505,
Equity (FASB ASC 505). Based on this review,
we have reclassified a portion of the excess of the purchase price over the par
or stated value of retired shares of our common stock from a reduction of
additional paid-in capital to a reduction of retained earnings. This
reclassification did not have any impact on previously reported statements of
income, earning per share amounts, statements of cash flows or total
stockholders’ equity. Certain prior year amounts from our Consolidated
Statements of Stockholders’ Equity have been reclassified to conform to the 2009
presentation as shown in the following table:
|
APIC
|
RE
|
|||||||
|
2006
Beginning Balance
|
||||||||
|
12/31/06
balance as previously
reported
|
$ | 109,851 | $ | 483,437 | ||||
|
Cumulative
reclassification of share
repurchase
|
97,957 | (97,957 | ) | |||||
|
12/31/06
balance as reported in current Form
10-K
|
$ | 207,808 | $ | 385,480 | ||||
|
2007
Activity
|
||||||||
|
Repurchase
and retirement of common stock as previously reported
|
$ | (79,701 | ) | $ | — | |||
|
Reclassification
of 2007
activity
|
72,599 | (72,599 | ) | |||||
|
Repurchase
and retirement of common stock as reported in current Form
10-K
|
$ | (7,102 | ) | $ | (72,599 | ) | ||
|
2007
Ending Balance
|
||||||||
|
12/31/07
balance as previously
reported
|
$ | 89,809 | $ | 563,418 | ||||
|
Cumulative
reclassification of share
repurchase
|
170,556 | (170,556 | ) | |||||
|
12/31/07
balance as reported in current Form
10-K
|
$ | 260,365 | $ | 392,862 | ||||
|
2008
Activity
|
||||||||
|
Repurchase
and retirement of common stock as previously reported
|
$ | (103,600 | ) | $ | — | |||
|
Reclassification
of 2008
activity
|
90,123 | (90,123 | ) | |||||
|
Repurchase
and retirement of common stock as reported in current Form
10-K
|
$ | (13,477 | ) | $ | (90,123 | ) | ||
|
2008
Ending Balance
|
||||||||
|
12/31/08
balance as previously
reported
|
$ | 39,673 | $ | 613,510 | ||||
|
Cumulative
reclassification of share
repurchase
|
260,679 | (260,679 | ) | |||||
|
12/31/08
balance as reported in current Form
10-K
|
$ | 300,352 | $ | 352,831 | ||||
Going
forward, we will account for the retired shares of our common stock by recording
the excess of the purchase price over par value as a reduction of retained
earnings, to the extent that the excess of the purchase price over par value
exceeds the original proceeds received from the issuance of the same shares of
our common stock, as prescribed by FASB ASC 505.
Use
of estimates
The
preparation of our financial statements in conformity with generally accepted
accounting principles requires us to make estimates and assumptions that affect
the reported amounts of assets, liabilities, revenues, expenses and related
disclosures of contingent assets and liabilities. We base our estimates on past
experience and other assumptions that we believe are reasonable under the
circumstances, and we evaluate these estimates on an ongoing basis. Our critical
accounting policies are those that affect our financial statements materially
and involve difficult, subjective or complex judgments by management. Although
these estimates are based on management's best knowledge of current events and
actions that may impact the company in the future, actual results may be
materially different from the estimates.
Cash
and cash equivalents
Cash and
cash equivalents include cash and highly liquid investments with maturities of
three months or less at the date of acquisition.
Short-Term
Investments
We
maintain an investment portfolio of various types of security holdings and
maturities. Pursuant to FASB ASC 820, cash equivalents and short-term
investments available-for-sale are valued using the market approach (Level 1)
based on unadjusted quoted prices in active markets for identical assets at the
measurement date. Our short-term investments also include auction rate
securities that we originally purchased for $8.6 million. These auction rate
securities consist of education loan revenue bonds. Auction rate securities are
variable rate debt instruments whose interest rates are typically reset
approximately every 7 to 35 days. In November 2008, we accepted the UBS Auction
Rate Securities Rights (“the Rights”) agreement offered by UBS as a liquidity
alternative to the failed auction process. The Rights agreement is a
nontransferable right to sell our auction rate securities, at par value, back to
UBS at any time during the period June 30, 2010, through July 2, 2012. The
estimated fair market value of both the auction rate securities and the Rights
agreement was determined using significant unobservable inputs (Level 3) as
prescribed by FASB ASC 820.
We
account for our investments in debt and equity instruments under FASB ASC 320.
Our investments are classified as available-for-sale and accordingly are
reported at fair value, with unrealized gains and losses reported as other
comprehensive income, a component of stockholders’ equity. Unrealized losses are
charged against income when a decline in fair value is determined to be other
than temporary. Investments with maturities beyond one year are classified as
short-term based on their highly liquid nature and because such marketable
securities represent the investment of cash that is available for current
operations. The fair value of our short-term investments in debt securities at
December 31, 2009 and December 31, 2008 was $87 million and $6 million,
respectively. The increase was due to the net purchase of $74 million of
short-term investments and the transfer of $8.6 related to our auction rate
securities and our rights agreement from long-term investments to short-term
investments during the year ended December 31, 2009. The net purchase of $74
million of short term investments was done to diversify our holdings from money
market accounts to debt securities and to take advantage of higher yields
associated with longer maturity debt securities. We follow the guidance provided
by FASB ASC 320 to assess whether our investments with unrealized loss positions
are other than temporarily impaired. Realized gains and losses and declines in
value judged to be other than temporary are determined based on the specific
identification method and are reported in other income (expense), net, in our
Consolidated Statements of Income.
Accounts
Receivable, net
Accounts
receivable are recorded net of allowance for sales returns of $1.9 million and
$1.8 million at December 31, 2009 and 2008, respectively, and net of allowances
for doubtful accounts of $2.7 million and $3.9 million at December 31, 2009 and
2008, respectively. A provision for estimated sales returns is made by reducing
recorded revenue based on historical experience. We analyze historical returns,
current economic trends and changes in customer demand and acceptance of our
products when evaluating the adequacy of our sales returns allowance. Our
allowance for doubtful accounts is based on historical experience. We analyze
historical bad debts, customer concentrations, customer creditworthiness and
current economic trends when evaluating the adequacy of our allowance for
doubtful accounts.
|
Year
|
Description
|
Balance
at
Beginning
of Period
|
Provisions
|
Write-Offs
|
Balance
at
End
of
Period
|
||||||||||||
|
2007
|
Allowance
for doubtful accounts and sales returns
|
$ | 4,360 | $ | 1,940 | $ | 698 | $ | 5,602 | ||||||||
|
2008
|
Allowance
for doubtful accounts and sales returns
|
5,602 | 447 | 367 | 5,682 | ||||||||||||
|
2009
|
Allowance
for doubtful accounts and sales returns
|
5,682 | 337 | 1,400 | 4,619 | ||||||||||||
Inventories
Inventories
are stated at the lower-of-cost or market. Cost is determined using standard
costs, which approximate the first-in first-out (“FIFO”) method. Cost includes
the acquisition cost of purchased components, parts and subassemblies, in-bound
freight costs, labor and overhead. Market is replacement cost with respect to
raw materials and is net realizable value with respect to work in process and
finished goods.
Inventory
is shown net of adjustment for excess and obsolete inventories of $4.4 million
and $4.4 million at December 31, 2009 and 2008, respectively.
Long-Term
Investments
At
December 31, 2008, our long-term investments primarily consisted of auction rate
securities that we originally purchased for $8.6 million as well as our Rights
agreement with UBS. At December 31, 2008, we classified these investments as
long-term due to the fact that the market for these securities was inactive, the
underlying securities generally had contractual maturities that were in excess
of the guidelines provided for in our investment policy, the fact that we had
the ability to hold the debt instruments to their ultimate maturity and the fact
that we had not made a determination as to whether we would exercise our rights
under the Rights agreement. The auction rate securities were classified as
available-for-sale. At December 31, 2008, we reported our auction rate
securities at their estimated fair market value of $7.0 million and our Rights
agreement at its estimated fair market value of $1.6 million. The estimated fair
market value of both the auction rate securities and the Rights agreement was
determined using significant unobservable inputs (Level 3) as prescribed by FASB
ASC 820. These auction rate securities and the Rights agreement are now reported
as a component of short-term investments as discussed above.
Property
and equipment
Property
and equipment are recorded at cost. Depreciation is computed using the
straight-line method over the estimated useful lives of the assets, which range
from twenty to forty years for buildings, three to seven years for purchased
internal use software and for equipment which are each included in furniture and
equipment. Leasehold improvements are depreciated over the shorter of the life
of the lease or the asset.
Intangible
assets
We
capitalize costs related to the development and acquisition of certain software
products. In accordance with FASB ASC 985, capitalization of costs begins when
technological feasibility has been established and ends when the product is
available for general release to customers. Technological feasibility for our
products is established when the product is available for beta release.
Amortization is computed on an individual product basis for those products
available for market and is recognized based on the product’s estimated economic
life, generally three years. Patents are amortized using the straight-line
method over their estimated period of benefit, generally ten to seventeen years.
At each balance sheet date, the unamortized costs for all intangible assets are
reviewed by management and reduced to net realizable value when
necessary.
Goodwill
The
excess purchase price over the fair value of assets acquired is recorded as
goodwill. As we have one operating segment, we allocate goodwill to one
reporting unit for goodwill impairment testing. In accordance with FASB ASC 350,
Intangibles – Goodwill and Other (FASB
ASC 350), goodwill is tested for impairment on an annual basis, and between
annual tests if indicators of potential impairment exist, using a
fair-value-based approach based on the market capitalization of the reporting
unit. Our annual impairment test was performed as of February 28, 2009. No
impairment of goodwill has been identified during the period presented. Goodwill
is deductible for tax purposes in certain jurisdictions.
Concentrations
of credit risk
We
maintain cash and cash equivalents with various financial institutions located
in many countries throughout the world. At December 31, 2009, $85 million or 42%
of our cash and cash equivalents was held in cash in various operating accounts
with financial institutions throughout the world and $116 million or 58% was
held in money market accounts. The most significant of our operating accounts
was our domestic operating account which held approximately $22 million or 11%
of our total cash and cash equivalents at a bank that carried an A1 rating at
December 31, 2009. From a geographic standpoint, approximately $78 million or
39% was held in various domestic accounts with financial institutions and $123
million or 61% was held in various accounts outside of the U. S. with financial
institutions. At December 31, 2009, our short-term investments consist of $35
million or 40% of foreign government bonds, $21 million or 24% of U.S.
treasuries and agencies, $12 million or 14% of municipal bonds, $9 million or
10% of auction rate securities and our auction rate securities put option, $8
million or 9% of corporate bonds and $3 million or 3% in time
deposits.
The goal
of our investment policy is to manage our investment portfolio to preserve
principal and liquidity while maximizing the return on our investment portfolio
through the full investment of available funds. We place our cash investments in
instruments that meet credit quality standards, as specified in our corporate
investment policy guidelines. These guidelines also limit the amount of credit
exposure to any one issue, issuer or type of instrument. With the exception of
our auction rate security from the Vermont Student Assistance Corporation, at
December 31, 2009, our cash equivalents and short-term investments carried
ratings from the major credit rating agencies that were in accordance with our
corporate investment policy. Our investment policy allows investments in the
following; government and federal agency obligations, repurchase agreements
(“Repos”), certificates of deposit and time deposits, corporate obligations,
medium term notes and deposit notes, commercial paper including asset-backed
commercial paper (“ABCP”), puttable bonds, general obligation and revenue bonds,
money market funds, taxable commercial paper, corporate notes/bonds, municipal
notes, municipal obligations, variable rate demand notes and tax exempt
commercial paper. All such instruments must carry minimum ratings of A1/P1/F1,
MIG1/VMIG1/SP1 and A2/A/A, as applicable, all of which are considered
“investment grade”. Our investment policy for marketable securities requires
that all securities mature in three years or less, with a weighted average
maturity of no longer than 18 months with at least 10% maturing in 90 days or
less. We actively monitor our investment portfolio to ensure compliance with our
investment objective to preserve capital, meet liquidity requirements and
maximize return on our investments. We do not require collateral or enter into
master netting arrangements to mitigate our credit risk. (See Note 2 – Cash, cash equivalents, short-term and long-term
investments in Notes to Consolidated Financial Statements for further discussion
and analysis of our investments.).
At
December 31, 2009, we held foreign currency forward and option contracts with an
aggregate notional amount of $148.4 million with various counterparties and with
varying maturity dates. Our counterparties in our foreign currency forward and
option contracts are major financial institutions. We do not anticipate
nonperformance by these counterparties. (See Note 4 –
Derivative instruments and hedging activities in Notes to Consolidated Financial
Statements).
Concentration
of credit risk with respect to trade accounts receivable is limited due to the
large number of customers and their dispersion across many countries and
industries. The amount of sales to any individual customer did not exceed 3% of
revenue for the periods presented. The largest trade account receivable from any
individual customer at December 31, 2009 was approximately $1.9
million.
Key
supplier risk
Our
manufacturing processes use large volumes of high-quality components and
subassemblies supplied by outside sources. Several of these components are
available through sole or limited sources. Supply shortages of or quality
problems in connection with some of these key components could require us to
procure components from replacement suppliers, which would cause significant
delays in fulfillment of orders and likely result in additional costs. In order
to manage this risk, we maintain safety stock of some of these single sourced
components and subassemblies and perform regular assessments of suppliers
performance, grading key suppliers in critical areas such as quality and
“on-time” delivery.
Revenue
recognition
We derive
revenue primarily from the sale/licensing of integrated hardware and software
solutions. Independent sales of application software licenses include post
contract support services. In addition, training services are sold separately.
The products and services are generally sold under standardized licensing and
sales arrangements with payment terms ranging from net 30 days in the United
States to net 30 days and up to net 90 days in some international markets.
Approximately 83% of our product/license sales include both hardware and
software in the customer arrangement, with a small percentage of sales including
other services. We offer rights of return and standard warranties for product
defects related to our products. The rights of return are generally for a period
of up to 30 days after the delivery date. The standard warranties cover periods
ranging from 90 days to three years. We do not generally enter into contracts
requiring product acceptance from the customer.
Revenue
is recognized in accordance with the provisions of FASB ASC 985, when persuasive
evidence of an arrangement exists, delivery has occurred, the fee is fixed or
determinable, and collectability is probable. We enter into certain arrangements
where we are obligated to deliver multiple products and/or services (“multiple
elements”). In these transactions, we allocate the total revenue among the
elements based on vendor specific objective evidence (“VSOE”) of fair value as
determined by the sales price of each element when sold separately.
When VSOE
of fair value is available for the undelivered element of a multiple element
arrangements, sales revenue is generally recognized on the date the product is
shipped, using the residual method under FASB ASC 985, with a portion of revenue
recorded as deferred (unearned) due to applicable undelivered elements.
Undelivered elements for our multiple element arrangements with a customer are
generally restricted to post contract support and training and education. The
amount of revenue allocated to these undelivered elements is based on the VSOE
of fair value for those undelivered elements. Deferred revenue due to
undelivered elements is recognized ratably on a straight-line basis over the
service period or when the service is completed. When VSOE of fair value is not
available for the undelivered element of a multiple element arrangement, sales
revenue is generally recognized ratably, on a straight-line basis over the
service period of the undelivered element, generally 12 months or when the
service is completed in accordance with the subscription method under FASB ASC
985. Deferred revenue at December 31, 2009 and 2008 was $57 million and $46
million, respectively.
The
application of FASB ASC 985 requires judgment, including whether a software
arrangement includes multiple elements, and if so, whether VSOE of fair value
exists for those elements. Changes to the elements in a software arrangement,
the ability to identify VSOE for those elements, the fair value of the
respective elements, and changes to a product’s estimated life cycle could
materially impact the amount of our earned and unearned revenue. Judgment is
also required to assess whether future releases of certain software represent
new products or upgrades and enhancements to existing products.
Product
revenue
Our
product revenue is generated predominantly from the sales of measurement and
automation products. Our products consist of application software and hardware
components together with related driver software.
Software
maintenance revenue
Software
maintenance revenue is post contract customer support that provides the customer
with unspecified upgrades/updates and technical support.
Shipping and handling
costs
Our
shipping and handling costs charged to customers are included in net sales, and
the associated expense is recorded in cost of sales for all periods
presented.
Warranty
reserve
We offer
a one-year limited warranty on most hardware products, with a two or three-year
warranty on a subset of our hardware products, which is included in the sales
price of many of our products. Provision is made for estimated future warranty
costs at the time of the sale pursuant to FASB ASC 450, Contingencies (FASB ASC 450),
for the estimated costs that may be incurred under the basic limited warranty.
Our estimate is based on historical experience and product sales during this
period.
The
warranty reserve for the years ended December 31, 2009 and 2008, respectively,
was as follows (in thousands):
|
2009
|
2008
|
|||||||
|
Balance
at the beginning of the
period
|
$ | 952 | $ | 750 | ||||
|
Accruals
for warranties issued during the
period
|
1,991 | 1,836 | ||||||
|
Settlements
made (in cash or in kind) during the period
|
(2,022 | ) | (1,634 | ) | ||||
|
Balance
at the end of the
period
|
$ | 921 | $ | 952 | ||||
Loss
contingencies
We accrue
for probable losses from contingencies including legal defense costs, on an
undiscounted basis, in accordance with FASB ASC 450, Contingencies (FASB ASC
450), when such costs
are considered probable of being incurred and are reasonably estimable. We
periodically evaluate available information, both internal and external,
relative to such contingencies and adjust this accrual as
necessary.
Advertising
expense
We
expense costs of advertising as incurred. Advertising expense for the years
ended December 31, 2009, 2008 and 2007 was $13.6 million, $19.3 million and
$20.0 million, respectively.
Foreign
currency translation
The
functional currency for our international sales operations is the applicable
local currency. The assets and liabilities of these operations are translated at
the rate of exchange in effect on the balance sheet date and sales and expenses
are translated at average rates. The resulting gains or losses from translation
are included in a separate component of other comprehensive income. Gains and
losses resulting from re-measuring monetary asset and liability accounts that
are denominated in a currency other than a subsidiary’s functional currency are
included in net foreign exchange gain (loss) and are included in net
income.
Foreign
currency hedging instruments
All of
our derivative instruments are recognized on the balance sheet at their fair
value. We currently use foreign currency forward and purchased option contracts
to hedge our exposure to material foreign currency denominated receivables and
forecasted foreign currency cash flows.
On the
date the derivative contract is entered into, we designate the derivative as a
hedge of the variability of foreign currency cash flows to be received or paid
(“cash flow” hedge) or as a hedge of our foreign denominated net receivable
positions (“other derivatives”). Changes in the fair value of derivatives that
are designated and qualify as cash flow hedges under FASB ASC 815, Derivatives and Hedging (FASB
ASC 815) and that are deemed to be highly effective are recorded in other
comprehensive income. These amounts are subsequently reclassified into earnings
in the period during which the hedged transaction is realized. The gain or loss
on the other derivatives as well as the offsetting gain or loss on the hedged
item attributable to the hedged risk is recognized in current earnings under the
line item “Net foreign exchange gain (loss)”. We do not enter into derivative
contracts for speculative purposes.
We
formally document all relationships between hedging instruments and hedged
items, as well as our risk-management objective and strategy for undertaking
various hedge transactions. This process includes linking all derivatives that
are designated as cash flow hedges to specific forecasted transactions. We also
formally assess, both at the hedge’s inception and on an ongoing basis, whether
the hedging instruments are highly effective in offsetting changes in cash flows
of hedged items.
We
prospectively discontinue hedge accounting if (1) it is determined that the
derivative is no longer highly effective in offsetting changes in the fair value
of a hedged item (forecasted transactions); or (2) the derivative is
de-designated as a hedge instrument, because it is unlikely that a forecasted
transaction will occur. When hedge accounting is discontinued, the derivative is
sold and the resulting gains and losses are recognized immediately in
earnings.
Income
taxes
We
account for income taxes under the asset and liability method as set forth in
FASB ASC 740, Income
Taxes (FASB ASC 740). Deferred tax assets and
liabilities are recognized for the expected tax consequences of temporary
differences between the tax bases of assets and liabilities and their reported
amounts. Valuation allowances are established when necessary to reduce deferred
tax assets to amounts which are more likely than not to be
realized.
Earnings
per share
Basic
earnings per share (“EPS”) is computed by dividing net income by the weighted
average number of common shares outstanding during each period. Diluted EPS is
computed by dividing net income by the weighted average number of common shares
and common share equivalents outstanding (if dilutive) during each period. The
number of common share equivalents, which include stock options and restricted
stock units, is computed using the treasury stock method.
The
reconciliation of the denominators used to calculate basic EPS and diluted EPS
for the years ended December 31, 2009, 2008 and 2007, respectively, are as
follows (in thousands):
|
Years Ended December 31,
|
||||||||||||
|
2009
|
2008
|
2007
|
||||||||||
|
Weighted
average shares
outstanding-basic
|
77,520 | 78,567 | 79,468 | |||||||||
|
Plus:
Common share equivalents
|
||||||||||||
|
Stock
options, restricted stock
units
|
506 | 948 | 1,575 | |||||||||
|
Weighted
average shares
outstanding-diluted
|
78,026 | 79,515 | 81,043 | |||||||||
Stock
options to acquire 2,711,976, 2,402,934 and 2,304,078 shares for
the years ended December 31, 2009, 2008 and 2007, respectively, were excluded in
the computations of diluted EPS because the effect of including the stock
options would have been anti-dilutive.
Stock-based
compensation
Effective
January 1, 2006, we adopted FASB ASC 718, Compensation – Stock
Compensation (FASB ASC 718), using the modified-prospective-transition
method. Under this method, prior periods are not restated. Under this transition
method, stock compensation cost recognized beginning January 1, 2006 includes:
(a) compensation cost for all share-based payments granted prior to, but not yet
vested as of January 1, 2006, based on the grant date fair value estimated in
accordance with the original provisions of FASB ASC 718, and (b) compensation
cost for all share-based payments granted on or subsequent to January 1, 2006,
based on the grant-date fair value estimated in accordance with the provisions
of FASB ASC 718.
Comprehensive
income
Our
comprehensive income is comprised of net income, foreign currency translation
and unrealized gains and losses on forward and option contracts and securities
available-for-sale. Comprehensive income for 2009, 2008 and 2007 was $20.1
million, $88.2 million and $111.6 million, respectively.
Recently
Issued Accounting Pronouncements
In April
2009, the FASB updated FASB ASC 820 providing additional guidance for estimating
fair value when the volume and level of activity for the asset or liability have
significantly decreased. This update also includes guidance on identifying
circumstances that indicate a transaction is not orderly. We adopted the update
on April 1, 2009 as required and concluded it did not have a material impact on
our consolidated financial position or results of operations.
In
September 2009, the FASB updated FASB ASC 105, Generally Accepted Accounting
Principles (FASB ASC 105). The update establishes the
FASB Standards Accounting Codification (“Codification”) as the source of
authoritative U.S. generally accepted accounting principles (“GAAP”) recognized
by the FASB to be applied to nongovernmental entities and rules and interpretive
releases of the SEC as authoritative GAAP for SEC registrants. The Codification
supersedes all existing non-SEC accounting and reporting standards. This update
is effective for financial statements issued for interim and annual periods
ending after September 15, 2009. We adopted the update on July 1, 2009, as
required and concluded it did not have a material impact on our consolidated
financial position or results of operations.
In
October 2009, the FASB updated FASB ASC 605, Revenue Recognition (FASB ASC 605) that
amended the criteria for separating consideration in multiple-deliverable
arrangements. The amendments establish a selling price hierarchy for determining
the selling price of a deliverable. The selling price used for each deliverable
will be based on vendor-specific objective evidence if available, third–party
evidence if vendor-specific objective evidence is not available, or estimated
selling price if neither vendor-specific objective evidence nor third-party
evidence is available. The amendments will change the application of the
residual method of allocation and require that arrangement consideration be
allocated at the inception of the arrangement to all deliverables using the
relative selling price method. The relative selling price method allocates any
discount in the arrangement proportionally to each deliverable on the basis of
each deliverable’s selling price. This update will be effective prospectively
for revenue arrangements entered into or materially modified in fiscal years
beginning on or after June 15, 2010. Early adoption is permitted. We are
currently evaluating the requirements of this update and have not yet determined
the impact on our consolidated financial statements.
In
October 2009, the FASB updated FASB ASC 985, Software (FASB ASC 985) that
changes the accounting model for revenue arrangements that include both tangible
products and software elements. Tangible products containing software components
and nonsoftware components that function together to deliver the tangible
product’s essential functionality are no longer within the scope of the software
revenue guidance in Subtopic 985-605. In addition, the amendments require that
hardware components of a tangible product containing software components always
be excluded from the software revenue guidance. This update will be effective
prospectively for revenue arrangements entered into or materially modified in
fiscal years beginning on or after June 15, 2010. Early adoption is permitted.
We are currently evaluating the requirements of this update and have not yet
determined the impact on our consolidated financial statements.
Cash,
cash equivalents, short-term and long-term investments consist of the following
(in thousands):
|
As
of
December
31, 2009
|
As
of
December
31, 2008
|
|||||||
|
Cash
and cash equivalents:
|
||||||||
|
Cash
|
$ | 85,612 | $ | 100,967 | ||||
|
Cash
equivalents:
|
||||||||
|
Time
deposits
|
— | 73,400 | ||||||
|
Money
market
accounts
|
115,853 | 55,033 | ||||||
|
Total
cash and cash
equivalents
|
$ | 201,465 | $ | 229,400 | ||||
|
Short-term
investments:
|
||||||||
|
Municipal
bonds
|
$ | 12,549 | $ | 6,220 | ||||
|
Corporate
bonds
|
7,587 | — | ||||||
|
U.S.
treasuries and
agencies
|
21,033 | — | ||||||
|
Foreign
government
bonds
|
34,674 | — | ||||||
|
Time
deposits
|
2,753 | — | ||||||
|
Auction
rate
securities
|
8,177 | — | ||||||
|
Auction
rate securities put
option
|
423 | — | ||||||
|
Total
short-term
investments
|
87,196 | 6,220 | ||||||
|
Long-term
investments:
|
||||||||
|
Auction
rate
securities
|
— | 6,964 | ||||||
|
Auction
rate securities put
option
|
— | 1,636 | ||||||
|
Other
long-term
investments
|
— | 1,900 | ||||||
|
Total
investments
|
$ | 87,196 | $ | 16,720 | ||||
|
Total
cash, cash equivalents and
investments
|
$ | 288,661 | $ | 246,120 | ||||
The
following table summarizes unrealized gains and losses related to our
investments designated as available-for-sale (in thousands):
|
As
of December 31, 2009
|
||||||||||||||||||||
|
Adjusted Cost
|
Gross
Unrealized Gain
|
Gross
Unrealized Loss
|
Cumulative Translation
Adjustment
|
Fair Value
|
||||||||||||||||
|
Municipal
bonds
|
$ | 12,491 | $ | 58 | $ | — | $ | — | $ | 12,549 | ||||||||||
|
Corporate
bonds
|
7,478 | 110 | (1 | ) | — | 7,587 | ||||||||||||||
|
U.S.
treasuries and agencies
|
21,080 | — | (47 | ) | — | 21,033 | ||||||||||||||
|
Foreign
government bonds
|
36,105 | 76 | — | (1,507 | ) | 34,674 | ||||||||||||||
|
Time
deposits
|
2,753 | — | — | — | 2,753 | |||||||||||||||
|
Auction
rate securities
|
8,600 | — | (423 | ) | — | 8,177 | ||||||||||||||
|
Auction
rate securities put option
|
— | 423 | — | — | 423 | |||||||||||||||
|
Total
investments
|
$ | 88,507 | $ | 667 | $ | (471 | ) | $ | (1,507 | ) | $ | 87,196 | ||||||||
|
As
of December 31, 2008
|
||||||||||||||||
|
Adjusted Cost
|
Gross
Unrealized Gain
|
Gross
Unrealized Loss
|
Fair Value
|
|||||||||||||
|
Municipal
securities
|
$ | 6,199 | $ | 28 | $ | (7 | ) | $ | 6,220 | |||||||
|
Auction
rate
securities
|
8,600 | — | (1,636 | ) | 6,964 | |||||||||||
|
Auction
rate securities put
option
|
— | 1,636 | — | 1,636 | ||||||||||||
|
Other
long-term
investments
|
1,900 | — | — | 1,900 | ||||||||||||
|
Total
investments
|
$ | 16,699 | $ | 1,664 | $ | (1,643 | ) | $ | 16,720 | |||||||
The
following table summarizes the contractual maturities of our investments
designated as available-for-sale (in thousands):
|
As
of December 31, 2009
|
||||||||
|
Adjusted Cost
|
Fair Value
|
|||||||
|
Due
in less than 1 year
|
$ | 44,029 | $ | 43,267 | ||||
|
Due
in 1 to 5 years
|
44,478 | 43,929 | ||||||
|
Total
investments
|
$ | 88,507 | $ | 87,196 | ||||
|
As
of December 31, 2009
|
||||||||
|
Due
in less than 1 year
|
Adjusted Cost
|
Fair Value
|
||||||
|
Municipal
bonds
|
$ | 4,103 | $ | 4,110 | ||||
|
Corporate
bonds
|
5,384 | 5,473 | ||||||
|
U.S.
treasuries and agencies
|
5,065 | 5,057 | ||||||
|
Foreign
government bonds
|
18,124 | 17,274 | ||||||
|
Time
deposits
|
2,753 | 2,753 | ||||||
|
Auction
rate securities
|
8,600 | 8,177 | ||||||
|
Auction
rate securities put option
|
— | 423 | ||||||
|
Total
investments
|
$ | 44,029 | $ | 43,267 | ||||
|
As
of December 31, 2009
|
||||||||
|
Due
in 1 to 5 years
|
Adjusted Cost
|
Fair Value
|
||||||
|
Municipal
bonds
|
$ | 8,388 | $ | 8,439 | ||||
|
Corporate
bonds
|
2,094 | 2,114 | ||||||
|
U.S.
treasuries and agencies
|
16,015 | 15,976 | ||||||
|
Foreign
government bonds
|
17,981 | 17,400 | ||||||
|
Time
deposits
|
— | — | ||||||
|
Auction
rate securities
|
— | — | ||||||
|
Auction
rate securities put option
|
— | — | ||||||
|
Total
investments
|
$ | 44,478 | $ | 43,929 | ||||
Note 3 – Fair value measurements
FASB ASC
820, clarifies the definition of fair value, prescribes methods for measuring
fair value, establishes a fair value hierarchy based on the inputs used to
measure fair value and expands disclosures about the use of fair value
measurements. Effective January 1, 2009, we adopted FASB ASC 820 for our
nonfinancial assets and nonfinancial liabilities, except those items recognized
or disclosed at fair value on an annual or more frequently recurring basis. The
adoption of FASB ASC 820 did not have a material impact on our fair value
measurements as we did not have any items that were measured at fair value on a
nonrecurring basis for the year ended December 31, 2009. In April 2009, FASB ASC
820 was updated to provide additional guidance for estimating fair value
when the volume and level of activity for the asset or liability have
significantly decreased. The update also includes guidance on identifying
circumstances that indicate a transaction is not orderly. We adopted the update
on April 1, 2009 and it did not have a material impact on our fair value
measurements.
The
following tables present our assets and liabilities that are measured at fair
value on a recurring basis and are categorized using the fair value hierarchy.
The fair value hierarchy has three levels based on the reliability of the inputs
used to determine fair value.
|
Fair
Value Measurements at Reporting Date Using
|
||||||||||||||||
|
Description
|
December 31, 2009
|
Quoted Prices in Active Markets for Identical
Assets
(Level 1)
|
Significant Other Observable
Inputs
(Level 2)
|
Significant Unobservable
Inputs
(Level 3)
|
||||||||||||
|
Assets
|
||||||||||||||||
|
Money
Market
Funds
|
$ | 115,853 | $ | 115,853 | $ | — | $ | — | ||||||||
|
Short-term
investments available-for-sale
|
87,196 | 78,596 | — | 8,600 | ||||||||||||
|
Derivatives
|
11,016 | — | 11,016 | — | ||||||||||||
|
Total
Assets
|
$ | 214,065 | $ | 194,449 | $ | 11,016 | $ | 8,600 | ||||||||
|
Liabilities
|
||||||||||||||||
|
Derivatives
|
$ | (318 | ) | $ | — | $ | (318 | ) | $ | — | ||||||
|
Total
Liabilities
|
$ | (318 | ) | $ | — | $ | (318 | ) | $ | — | ||||||
|
Fair Value Measurements Using Significant
Unobservable Inputs
(Level 3)
|
||||
|
Short-term investments
available-for-sale
|
||||
|
Beginning
Balance, January 1,
2008
|
$ | 8,600 | ||
|
Total
gains (realized/unrealized)
|
||||
|
Included
in
earnings
|
423 | |||
|
Included
in other comprehensive
income
|
— | |||
|
Total
losses (realized/unrealized)
|
||||
|
Included
in
earnings
|
(423 | ) | ||
|
Included
in other comprehensive
income
|
— | |||
|
Purchases,
issuances and
settlements
|
— | |||
|
Transfer
in and/or out of Level
3
|
— | |||
|
Ending
Balance, December 31,
2009
|
$ | 8,600 | ||
|
The
amount of total gains or (losses) for the period included in earnings (or
changes in net assets) attributable
to
the change in unrealized gains or losses relating to assets still held at
the reporting date
|
$ | — | ||
Short-term investments
available-for-sale are valued using a market approach (Level 1) based on the
quoted market prices of identical instruments when available or other observable
inputs such as trading prices of identical instruments in inactive markets.
Short-term investments available-for-sale consist of debt securities issued by
states of the U.S. and political subdivisions of the states, corporate debt
securities and debt securities issued by U.S. government corporations and
agencies. All short-term investments available-for-sale have contractual
maturities of less than 24 months.
Derivatives
include foreign currency forward and option contracts. Our foreign currency
forward contracts are valued using an income approach (Level 2) based on the
spot rate less the contract rate multiplied by the notional amount. Our foreign
currency option contracts are valued using a market approach based on the quoted
market prices which are derived from observable inputs including current and
future spot rates, interest rate spreads as well as quoted market prices of
identical instruments.
Short-term
debt securities available-for-sale included in Level 3 are reported at their
fair market value and consist of auction rate securities backed by education
loan revenue bonds. One of our auction rate securities is from the Vermont
Student Assistance Corporation and has a par value of $2.2 million. The other of
our auction rate securities is from the New Hampshire Health and Education
Facilities Authority and has a par value of $6.4 million. The ratings for these
securities at December 31, 2009, were Baa3/A/AAA and Aaa/NR/AAA, respectively.
Historically, we reported the fair market value of these securities at par as
differences between par value and the purchase price or settlement value were
historically comprised of accrued interest. Auction rate securities are variable
rate debt instruments whose interest rates are typically reset approximately
every 7 to 35 days. On January 15, 2010, and in prior auction periods beginning
in February 2008, the auction process for these securities failed. At December
31, 2009, we reported these as short-term investments at their estimated fair
market value of $8.2 million.
In
November 2008, we accepted the UBS Auction Rate Securities Rights (the “Rights”)
agreement offered by UBS as a liquidity alternative to the failed auction
process. This Rights agreement is related to the auction rates securities
discussed above. The Rights agreement is a nontransferable right to sell our
auction rate securities, at par value, back to UBS at any time during the period
June 30, 2010, through July 2, 2012. At December 31, 2009, we reported the
Rights agreement at its estimated fair market value of $423,000 as a component
of short-term debt securities available for sale.
Due to
the fact that our Rights agreement has an initial exercise date that is less
than one year from now, we are now reporting our auction rate securities and the
corresponding Rights agreement as short-term. We continue to have the ability to
hold our auction rate securities to their ultimate maturities which are in
excess of one year and we have not made a determination as to whether we will
exercise our option under the Rights agreement or if we do choose to exercise
our option, at what point during the period June 30, 2010 through July 2, 2012,
we would exercise our option. However, due to the fact that our Rights agreement
has an initial exercise date that is less than one year from now, we are now
reporting our auction rate securities and the corresponding Rights agreement as
short-term. We have recorded the unrealized loss related to the auction rate
securities and the unrealized gain related to the Rights agreement as a
component of other income (expense), in our Consolidated Statements of
Income.
The
estimated fair market value of both the auction rate securities and the Rights
agreement was determined using significant unobservable inputs (Level 3) as
prescribed by FASB ASC 820. We considered many factors in determining the fair
market value of the auction rate securities as well as our corresponding Rights
agreement at December 31, 2009, including the fact that the debt instruments
underlying the auction rate securities have redemption features which call for
redemption at 100% of par value, current credit curves for like securities and
discount factors to account for the illiquidity of the market for these
securities. During the year ended December 31, 2009, we did not make any changes
to our valuation techniques or related inputs.
FASB ASC
815 requires companies to recognize all of their derivative instruments as
either assets or liabilities in the statement of financial position at fair
value. The accounting for changes in the fair value (i.e., gains or losses) of a
derivative instrument depends on whether it has been designated and qualifies as
part of a hedging relationship and further, on the type of hedging relationship.
For those derivative instruments that are designated and qualify as hedging
instruments, a company must designate the hedging instrument, based upon the
exposure being hedged, as a fair value hedge, cash flow hedge, or a hedge of a
net investment in a foreign operation.
We have
operations in over 40 countries. Sales outside of the Americas as a percentage
of consolidated sales were 57% and 57% for the years ended December 31, 2009 and
2008, respectively. Our activities expose us to a variety of market risks,
including the effects of changes in foreign currency exchange rates. These
financial risks are monitored and managed by us as an integral part of our
overall risk management program.
We
maintain a foreign currency risk management strategy that uses derivative
instruments (foreign currency forward and purchased option contracts) to help
protect our earnings and cash flows from fluctuations caused by the volatility
in currency exchange rates. Movements in foreign currency exchange rates pose a
risk to our operations and competitive position, since exchange rate changes may
affect our profitability and cash flow, and the business or pricing strategies
of our non-U.S. based competitors.
The vast
majority of our foreign sales are denominated in the customers’ local currency.
We purchase foreign currency forward and option contracts as hedges of
forecasted sales that are denominated in foreign currencies and as hedges of
foreign currency denominated receivables. These contracts are entered into to
protect against the risk that the eventual dollar-net-cash inflows resulting
from such sales or firm commitments will be adversely affected by changes in
exchange rates. We also purchase foreign currency forward contracts as hedges of
forecasted expenses that are denominated in foreign currencies. These contracts
are entered into to protect against the risk that the eventual dollar-net-cash
outflows resulting from foreign currency operating and cost of revenue expenses
will be adversely affected by changes in exchange rates.
In
accordance with FASB ASC 815, we designate foreign currency forward and
purchased option contracts as cash flow hedges of forecasted revenues or
forecasted expenses. In addition, we hedge our foreign currency denominated
balance sheet exposures using foreign currency forward contracts. These
derivatives are not designated as hedging instruments under FASB ASC 815. None
of our derivative instruments contain a credit-risk-related contingent
feature.
Cash
flow hedges
To
protect against the reduction in value caused by a fluctuation in foreign
currency exchange rates of forecasted foreign currency cash flows resulting from
international sales over the next one to two years, we have instituted a foreign
currency cash flow hedging program. We hedge portions of our forecasted revenue
and forecasted expenses denominated in foreign currencies with forward and
purchased option contracts. For forward contracts, when the dollar strengthens
significantly against the foreign currencies, the change in the present value of
future foreign currency cash flows may be offset by the change in the fair value
of the forward contracts designated as hedges. For option contracts, when the
dollar strengthens significantly against the foreign currencies, the change in
the present value of future foreign currency cash flows may be offset by the
change in the fair value of the option contracts net of the premium paid
designated as hedges. Our foreign currency purchased option contracts are
purchased “at-the-money” or “out-of-the-money”. We purchase foreign currency
forward and option contracts for up to 100% of our forecasted exposures in
selected currencies (primarily in Euro, Japanese yen, British pound sterling,
South Korean won and Hungarian forint) and limit the duration of these contracts
to 40 months or less.
For
derivative instruments that are designated and qualify as a cash flow hedge, the
effective portion of the gain or loss on the derivative is reported as a
component of accumulated other comprehensive income (“OCI”) and reclassified
into earnings in the same line item (net sales, operating expenses, or cost of
sales) associated with the forecasted transaction and in the same period or
periods during which the hedged transaction affects earnings. Gains and losses
on the derivative representing either hedge ineffectiveness or hedge components
excluded from the assessment of effectiveness are recognized in current earnings
or expenses during the current period and are classified as a component of “net
foreign exchange gain (loss)”. Hedge effectiveness of foreign currency forwards
and purchased option contracts designated as cash flow hedges are measured by
comparing the hedging instrument’s cumulative change in fair value from
inception to maturity to the forecasted transaction’s terminal
value.
We held
forward contracts with a notional amount of $28.6 million dollar equivalent of
Euro, $4.0 million dollar equivalent of British pound sterling, $24.4 million
dollar equivalent of Japanese yen, and $17.8 million dollar equivalent of
Hungarian forint at December 31, 2009. These contracts are for terms of up to 24
months. At December 31, 2008, we held forward contracts with a notional amount
of $54.9 million dollar equivalent of Euro, $6.2 million dollar equivalent of
British pound sterling, $18.9 million dollar equivalent of Japanese yen, $4.7
million dollar equivalent of South Korean won and $21.7 million dollar
equivalent of Hungarian forint.
We held
purchased option contracts with a notional amount of $28.4 million dollar
equivalent of Euro at December 31, 2009. These contracts are for terms of up to
12 months. At December 31, 2008, we held purchased option contracts with a
notional amount of $111.3 million dollar equivalent of Euro.
At
December 31, 2009, we expect to reclassify $2.8 million of gains on derivative
instruments from accumulated other comprehensive income to net sales during the
next twelve months when the hedged international sales occur. At December 31,
2009, we expect to reclassify $3.7 million of gains on derivative instruments
from accumulated OCI to cost of sales and $2.0 million of gains on derivative
instruments from accumulated OCI to operating expenses during the next twelve
months when the hedged international expenses occur. Expected amounts are based
on derivative valuations at December 31, 2009. Actual results may vary as a
result of changes in the corresponding exchange rate subsequent to this
date.
During
the year ended December 31, 2009, hedges with a notional amount of $22.8 million
were determined to be ineffective. As a result, we recorded a net gain of $1.2
million related to these hedges as a component of “net foreign exchange gain
(loss)” during the year ended December 31, 2009. We did not record any gains or
losses due to the ineffectiveness of our hedges during the year ended December
31, 2008.
Other
Derivatives
Other
derivatives not designated as hedging instruments under FASB ASC 815 consist
primarily of foreign currency forward contracts that we use to hedge our foreign
denominated net receivable or net payable positions to protect against the
change in value caused by a fluctuation in foreign currency exchange rates. We
typically hedge up to 90% of our outstanding foreign denominated net receivables
or net payables and typically limit the duration of these foreign currency
forward contracts to approximately 90 days. The gain or loss on the derivatives
as well as the offsetting gain or loss on the hedge item attributable to the
hedged risk is recognized in current earnings under the line item “net foreign
exchange gain (loss)”. As of December 31, 2009 and December 31, 2008, we held
foreign currency forward contracts with a notional amount of $45.2 million and
$67.1 million, respectively.
Effective
January 1, 2009, we adopted the updated disclosure requirements of FASB ASC 815.
The following table presents the fair value of derivative instruments on our
Consolidated Balance Sheets and the effect of derivative instruments on our
Consolidated Statements of Income.
Fair
Values of Derivative Instruments (in thousands):
|
In
thousands
|
Asset
Derivatives
|
|||||||||
|
December
31, 2009
|
December
31, 2008
|
|||||||||
|
Balance
Sheet Location
|
Fair
Value
|
Balance
Sheet Location
|
Fair
Value
|
|||||||
|
Derivatives
designated as hedging
instruments
under FASB ASC 815
|
||||||||||
|
Foreign
exchange contracts – ST forwards
|
Prepaid
expenses and other current assets
|
$ | 7,947 |
Prepaid
expenses and other current assets
|
$ | 5,260 | ||||
|
Foreign
exchange contracts – LT forwards
|
Other
long-term assets
|
274 |
Other
long-term assets
|
2,654 | ||||||
|
Foreign
exchange contracts – ST options
|
Prepaid
expenses and other current assets
|
1,821 |
Prepaid
expenses and other current assets
|
5,705 | ||||||
|
Foreign
exchange contracts – LT options
|
Other
long-term assets
|
— |
Other
long-term assets
|
3,838 | ||||||
|
Total
derivatives designated as
hedging
instruments under FASB ASC 815
|
$ | 10,042 | $ | 17,457 | ||||||
|
Derivatives
not designated as
hedging
instruments under FASB ASC 815
|
||||||||||
|
Foreign
exchange contracts – ST forwards
|
Prepaid
expenses and other current assets
|
$ | 974 |
Prepaid
expenses and other current assets
|
$ | 2,745 | ||||
|
Total
derivatives not designated as
hedging
instruments under FASB ASC 815
|
$ | 974 | $ | 2,745 | ||||||
|
Total
derivatives
|
$ | 11,016 | $ | 20,202 | ||||||
|
Liability
Derivatives
|
||||||||||
|
December
31, 2009
|
December
31, 2008
|
|||||||||
|
Balance
Sheet Location
|
Fair
Value
|
Balance
Sheet Location
|
Fair
Value
|
|||||||
|
Derivatives
designated as hedging
instruments
under FASB ASC 815
|
||||||||||
|
Foreign
exchange contracts – ST forwards
|
Accrued
expenses and other liabilities
|
$ | — |
Accrued
expenses and other liabilities
|
$ | (1,803 | ) | |||
|
Foreign
exchange contracts – LT forwards
|
Other
long-term liabilities
|
— |
Other
long-term liabilities
|
— | ||||||
|
Foreign
exchange contracts – ST options
|
Accrued
expenses and other liabilities
|
— |
Accrued
expenses and other liabilities
|
— | ||||||
|
Foreign
exchange contracts – LT options
|
Other
long-term liabilities
|
— |
Other
long-term liabilities
|
— | ||||||
|
Total
derivatives designated as
hedging
instruments under FASB ASC 815
|
$ | — | $ | (1,803 | ) | |||||
|
Derivatives
not designated as
hedging
instruments under FASB ASC 815
|
||||||||||
|
Foreign
exchange contracts – ST forwards
|
Accrued
expenses and other liabilities
|
$ | (318 | ) |
Accrued
expenses and other liabilities
|
$ | (3,280 | ) | ||
|
Total
derivatives not designated as
hedging
instruments under FASB ASC 815
|
$ | (318 | ) | $ | (3,280 | ) | ||||
|
Total
derivatives
|
$ | (318 | ) | $ | (5,083 | ) | ||||
The
following table shows the effect of derivative instruments on our Consolidated
Statements of Income for the year ended December 31, 2009 (in
thousands):
|
Derivatives
in FASB ASC 815
Cash Flow Hedging Relationship
|
Amount
of Gain or (Loss) Recognized in OCI on Derivative (Effective Portion) (in
thousands)
|
Location
of Gain or (Loss) Reclassified from Accumulated OCI into Income (Effective
Portion)
|
Amount
of Gain or (Loss) Reclassified from Accumulated OCI into Income (Effective
Portion) (in thousands)
|
Location
of Gain or (Loss) Recognized in Income on Derivative (Ineffective Portion
and Amount Excluded from Effectiveness Testing)
|
Amount
of Gain or (Loss) Recognized in Income on Derivative (Ineffective Portion
and Amount Excluded from Effectiveness Testing)
|
|||||||||
|
2009
|
2009
|
2009
|
||||||||||||
|
Foreign
exchange contracts – forwards and options
|
$ | (6,304 | ) |
Net
sales
|
$ | 1,399 |
Net
foreign exchange gain (loss)
|
$ | 1,132 | |||||
|
Foreign
exchange contracts – forwards and options
|
2,055 |
Cost
of sales
|
(74 | ) |
Net
foreign exchange gain (loss)
|
(41 | ) | |||||||
|
Foreign
exchange contracts – forwards and options
|
1,427 |
Operating
expenses
|
517 |
Net
foreign exchange gain (loss)
|
81 | |||||||||
|
Total
|
$ | (2,822 | ) | $ | 1,842 | $ | 1,172 | |||||||
|
Derivatives
not Designated as Hedging Instruments under FASB ASC
815
|
Location
of Gain (Loss) Recognized in Income on Derivative
|
Amount
of Gain (Loss) Recognized in Income on Derivative
|
|||
|
2009
|
|||||
|
Foreign
exchange contracts – forwards
|
Net
foreign exchange gain/(loss)
|
$ | (1,669 | ) | |
|
Total
|
$ | (1,669 | ) | ||
Note 5 – Inventories
Inventories,
net consist of the following (in thousands):
|
December 31,
|
||||||||
|
2009
|
2008
|
|||||||
|
Raw
materials
|
$ | 42,121 | $ | 48,004 | ||||
|
Work-in-process
|
2,042 | 4,150 | ||||||
|
Finished
goods
|
42,352 | 55,204 | ||||||
| $ | 86,515 | $ | 107,358 | |||||
Note
6 – Property and equipment
Property
and equipment consist of the following (in thousands):
|
December 31,
|
||||||||
|
2009
|
2008
|
|||||||
|
Land
|
$ | 17,076 | $ | 7,210 | ||||
|
Buildings
|
138,367 | 136,802 | ||||||
|
Furniture
and
equipment
|
154,558 | 144,979 | ||||||
| 310,001 | 288,991 | |||||||
|
Accumulated
depreciation
|
(156,736 | ) | (134,514 | ) | ||||
| $ | 153,265 | $ | 154,477 | |||||
Depreciation
expense for the years ended December 31, 2009, 2008 and 2007, was $22.3 million,
$20.9 million and $22.2 million, respectively.
Intangibles
at December 31, 2009 and 2008 are as follows:
|
2009
|
2008
|
|||||||||||||||||||||||
|
Gross
Carrying Amount
|
Accumulated
Amortization
|
Net
Carrying Amount
|
Gross
Carrying Amount
|
Accumulated
Amortization
|
Net
Carrying Amount
|
|||||||||||||||||||
|
Capitalized
software development costs
|
$ | 38,928 | $ | (20,455 | ) | $ | 18,473 | $ | 25,610 | $ | (11,344 | ) | $ | 14,266 | ||||||||||
|
Acquired
technology
|
28,022 | (20,967 | ) | 7,055 | 27,503 | (16,804 | ) | 10,699 | ||||||||||||||||
|
Patents
|
19,033 | (5,377 | ) | 13,656 | 16,068 | (4,506 | ) | 11,562 | ||||||||||||||||
|
Other
|
12,577 | (8,371 | ) | 4,206 | 11,401 | (6,013 | ) | 5,388 | ||||||||||||||||
| $ | 98,560 | $ | (55,170 | ) | $ | 43,390 | $ | 80,582 | $ | (38,667 | ) | $ | 41,915 | |||||||||||
Software
development costs capitalized during 2009, 2008 and 2007 were $13.3 million,
$9.5 million and $8.3 million, respectively, and related amortization was $9.1
million, $10.3 million and $8.9 million, respectively. Included in these
capitalized costs for the years ended December 31, 2009, 2008, and 2007 were
costs related to stock based compensation of $734,000, $451,000
and $422,000, respectively. Amortization of capitalized software
development costs is computed on an individual product basis for those products
available for market and is recognized based on the product’s estimated economic
life, generally three years. Patents are amortized using the straight-line
method over their estimated period of benefit, generally ten to seventeen years.
Total intangible assets amortization expenses were $16.5 million, $16.2 million
and $14.4 million for the years ended December 31, 2009, 2008 and 2007,
respectively.
Capitalized
software development costs, acquired technology, patents and other have
weighted-average useful lives of 2.2 years, 1.8 years, 5.3 years, and 1.8 years,
respectively, as of December 31, 2009. The estimated future amortization expense
related to intangible assets as of December 31, 2009 is as follows:
|
Amount
(in thousands)
|
||||
|
2010
|
$ | 18,097 | ||
|
2011
|
12,986 | |||
|
2012
|
7,187 | |||
|
2013
|
1,868 | |||
|
2014
|
1,186 | |||
|
Thereafter
|
2,066 | |||
| $ | 43,390 | |||
Acquisition
intangibles are amortized over their useful lives, which range from three to
eight years. Amortization expense for acquisition intangibles was approximately
$3.9 million and $4.2 million for 2009 and 2008, respectively, of which
approximately $3.4 million and $3.6 million was recorded in cost of sales and
approximately $503,000 and $580,000 was recorded in operating expenses for 2009
and 2008, respectively. The estimated amortization expense of acquisition
intangibles in future years will be recorded in our Consolidated Statements of
Income as follows (in thousands):
|
Fiscal Year
|
Cost of Sales
|
Acquisition related costs and amortization,
net
|
Total
|
|||||||||
|
2010
|
$ | 2,701 | $ | 369 | $ | 3,070 | ||||||
|
2011
|
2,160 | 221 | 2,381 | |||||||||
|
2012
|
1,126 | 206 | 1,332 | |||||||||
|
2013
|
87 | 75 | 162 | |||||||||
|
Thereafter
|
— | — | — | |||||||||
|
Total
|
$ | 6,074 | $ | 871 | $ | 6,945 | ||||||
Note
8 – Goodwill
The
carrying amount of goodwill for 2008 and 2009 are as follows:
|
Amount
(in thousands)
|
||||
|
Balance
as of December 31,
2007
|
$ | 54,111 | ||
|
Acquisitions/purchase
accounting
adjustments
|
10,818 | |||
|
Divestitures
|
— | |||
|
Foreign
currency translation
impact
|
(368 | ) | ||
|
Balance
as of December 31,
2008
|
$ | 64,561 | ||
|
Acquisitions/purchase
accounting
adjustments
|
— | |||
|
Divestitures
|
— | |||
|
Foreign
currency translation
impact
|
218 | |||
|
Balance
as of December 31,
2009
|
$ | 64,779 | ||
The
excess purchase price over the fair value of assets acquired is recorded as
goodwill. As we have one operating segment, we allocate goodwill to one
reporting unit for goodwill impairment testing. In accordance with FASB ASC 350,
goodwill is tested for impairment on an annual basis, and between annual tests
if indicators of potential impairment exist, using a fair-value-based approach
based on the market capitalization of the reporting unit. Our annual impairment
test was performed as of February 28, 2009. No impairment of goodwill has been
identified during the period presented. Goodwill is deductible for tax purposes
in certain jurisdictions.
The
components of income before income taxes are as follows (in
thousands):
|
Years Ended December 31,
|
||||||||||||
|
2009
|
2008
|
2007
|
||||||||||
|
Domestic
|
$ | 34,953 | $ | 15,921 | $ | 31,685 | ||||||
|
Foreign
|
15,292 | 82,216 | 81,742 | |||||||||
| $ | 50,245 | $ | 98,137 | $ | 113,427 | |||||||
The
provision for income taxes charged to operations is as follows (in
thousands):
|
Years Ended December 31,
|
||||||||||||
|
2009
|
2008
|
2007
|
||||||||||
|
Current
tax expense:
|
||||||||||||
|
U.S.
federal
|
$ | 3,117 | $ | 14,631 | $ | 15,957 | ||||||
|
State
|
136 | 1,391 | 1,155 | |||||||||
|
Foreign
|
13,760 | 18,910 | 9,925 | |||||||||
|
Total
current
|
17,013 | 34,932 | 27,037 | |||||||||
|
Deferred
tax expense (benefit):
|
||||||||||||
|
U.S.
federal
|
9,920 | (11,008 | ) | 628 | ||||||||
|
State
|
387 | (373 | ) | (156 | ) | |||||||
|
Foreign
|
(2,864 | ) | (1,570 | ) | (2,783 | ) | ||||||
|
Total
deferred
|
7,443 | (12,951 | ) | (2,311 | ) | |||||||
|
Change
in valuation
allowance
|
8,704 | (8,671 | ) | (18,332 | ) | |||||||
|
Total
provision
|
$ | 33,160 | $ | 13,310 | $ | 6,394 | ||||||
Deferred
tax liabilities (assets) at December 31, 2009 and 2008 as follows (in
thousands):
|
December 31,
|
||||||||
|
2009
|
2008
|
|||||||
|
Capitalized
software
|
$ | 5,978 | $ | 4,615 | ||||
|
Depreciation
and
amortization
|
10,577 | 9,536 | ||||||
|
Unrealized
gain on derivative
instruments
|
— | 4,153 | ||||||
|
Undistributed
earnings of foreign
subsidiaries
|
9,278 | 10,075 | ||||||
|
Gross
deferred tax
liabilities
|
25,833 | 28,379 | ||||||
|
Operating
loss
carryforwards
|
(57,422 | ) | (43,360 | ) | ||||
|
Intangible
assets
|
(44,159 | ) | (58,987 | ) | ||||
|
Vacation
and other
accruals
|
(3,700 | ) | (4,890 | ) | ||||
|
Inventory
valuation and warranty
provisions
|
(6,702 | ) | (12,665 | ) | ||||
|
Doubtful
accounts and sales
provisions
|
(1,088 | ) | (1,512 | ) | ||||
|
Unrealized
exchange
loss
|
(917 | ) | (1,345 | ) | ||||
|
Deferred
revenue .
|
(853 | ) | (71 | ) | ||||
|
Accrued
rent
expenses
|
(111 | ) | (117 | ) | ||||
|
Accrued
legal
expenses
|
(710 | ) | (1,466 | ) | ||||
|
Unrealized
loss on derivative
instruments
|
(242 | ) | — | |||||
|
10%
minority stock
investment
|
(900 | ) | (920 | ) | ||||
|
Stock-based
compensation
|
(4,483 | ) | (5,353 | ) | ||||
|
Research
and development tax credit
carryforward
|
(2,054 | ) | — | |||||
|
Foreign
tax credit
carryforward
|
(1,775 | ) | — | |||||
|
Other
|
(657 | ) | (783 | ) | ||||
|
Gross
deferred tax
assets
|
(125,773 | ) | (131,469 | ) | ||||
|
Valuation
allowance
|
99,862 | 85,815 | ||||||
|
Net
deferred tax liability
(asset)
|
$ | (78 | ) | $ | (17,275 | ) | ||
A
reconciliation of income taxes at the U.S. federal statutory income tax rate to
the effective tax rate follows:
|
Years Ended December 31,
|
||||||||||||
|
2009
|
2008
|
2007
|
||||||||||
|
U.S.
federal statutory tax
rate
|
35 | % | 35 | % | 35 | % | ||||||
|
Domestic
production
activities
|
— | — | (1 | ) | ||||||||
|
Foreign
taxes (less) than federal statutory
rate
|
(6 | ) | (9 | ) | (14 | ) | ||||||
|
Change
in valuation
allowance
|
17 | (9 | ) | (16 | ) | |||||||
|
Research
and development tax
credit
|
(4 | ) | (2 | ) | (1 | ) | ||||||
|
Tax
exempt
interest
|
— | (1 | ) | (1 | ) | |||||||
|
State
income taxes, net of federal tax
benefit
|
1 | 1 | 1 | |||||||||
|
Employee
share-based
compensation
|
7 | 2 | 2 | |||||||||
|
Intercompany
profit
|
15 | (5 | ) | — | ||||||||
|
Other
|
1 | 2 | 1 | |||||||||
|
Effective
tax
rate
|
66 | % | 14 | % | 6 | % | ||||||
Certain
prior year amounts in the reconciliation of income taxes at the U.S. federal
statutory income tax rate to the effective tax rate have been reclassified to
conform to the 2009 presentation as shown in the following tables:
|
2008
foreign taxes (less) than federal statutory rate as reported in prior year
Form 10-K
|
(14 | ) | ||
|
Reclassification
(a)
|
5 | |||
|
2008
foreign taxes (less) than federal statutory rate as reported in current
year Form 10-K
|
(9 | ) | ||
|
2008
intercompany profit as reported in prior year Form
10-K
|
— | |||
|
Reclassification
(a)
|
(5 | ) | ||
|
2008
intercompany profit as reported in current year Form
10-K
|
(5 | ) |
(a) These
amounts represent income taxes on intercompany profit previously included in
foreign taxes (less) than the federal statutory rate and reclassified to
intercompany profit for comparability to corresponding amounts reported in 2009.
The reclassification did not have any impact on our total income tax
expense.
For the
year ended December 31, 2009, we generated a federal net operating loss of
approximately $3.3 million and tax credits of approximately
$3.8 million. The federal net operating loss can be carried back two years
and the federal tax credits can be carried back one year.
As of
December 31, 2009, eleven of our subsidiaries have available, for income tax
purposes, foreign net operating loss carryforwards of an aggregate of
approximately $286 million, of which $12.1 million expire during the years 2011
- 2018 and $273.9 million of which may be carried forward indefinitely. Our tax
valuation allowance relates to our ability to realize certain of these foreign
net operating loss carryforwards and benefits of tax deductible goodwill in
excess of book goodwill.
We
maintain a manufacturing facility in Hungary. As a result of certain foreign
investment incentives available under Hungarian law, the profit from our
Hungarian operation was subject to a reduced income tax rate. This special tax
status terminated on January 1, 2008, with the merger of our Hungary
manufacturing operations with its Hungarian parent company. The merger was
effective on January 1, 2008. The aggregate tax benefit of the exemption was
$8.7 million for the year ended December 31, 2007.
In 2003,
we restructured the organization of our manufacturing operation in Hungary. The
tax deductible goodwill in excess of book goodwill created by this restructuring
resulted in our being required to record a gross deferred tax asset of $91.0
million. Because we did not expect to have sufficient taxable income in the
relevant jurisdiction in future periods to realize the benefit of this deferred
tax asset, a full valuation allowance was established. Following the approval of
the merger of our Hungarian manufacturing operation with its Hungarian parent
company in December 2007, we released $8.7 million and $18.3 million in 2008 and
2007, respectively, of the valuation allowance previously established for the
excess tax deductible goodwill to reflect the tax benefit we expected to realize
in future periods.
For the
year 2009, we expected to recognize an additional tax benefit of $9.7 million
related to these assets. Effective January 1, 2010, a new tax law in Hungary
provides for an enhanced deduction for the qualified research and development
expenses of NI Hungary Software and Hardware Manufacturing Kft. ("NI Hungary").
During the three months ended December 31, 2009, we obtained confirmation of the
application of this new tax law for the qualified research and development
expenses of NI Hungary. Based on the application of this new tax law to the
qualified research and development expense of NI Hungary, we no longer expect to
have sufficient future taxable income in Hungary to realize the benefits of
these tax assets. As such, we recorded an income tax charge of $21.6 million
during the three months ended December 31, 2009, $18.4 million of which was
related to a valuation allowance on the previously recognized assets created by
the restructuring and $3.2 million of which was related to tax benefits from
other assets that we will no longer be able to realize as a result of this
change. We do not expect to realize the tax benefit of the remaining assets
created by the restructuring and therefore we have a full valuation allowance of
$98.2 million against those assets at December 31, 2009.
We have
not provided for U.S. federal income and foreign withholding taxes on
approximately $267.5 million of certain non-U.S. subsidiaries’ undistributed
earnings as of December 31, 2009. These earnings would become subject to taxes
of approximately $85.7 million, if they were actually or deemed to be remitted
to the parent company as dividends or if we should sell our stock in these
subsidiaries. We intend to permanently reinvest the undistributed
earnings.
We
adopted the provisions of FASB ASC 740, on January 1, 2007. FASB ASC 740
clarifies the accounting for uncertainty in income taxes recognized in an
entity's financial statements and prescribes a recognition threshold and
measurement attribute for financial statement disclosure of tax positions taken
or expected to be taken on a tax return. We recognized no material adjustment to
the liability for unrecognized income tax benefits. A reconciliation of the
beginning and ending amount of unrecognized tax benefit is as follows (in
thousands):
|
2009
|
2008
|
|||||||
|
Balance
at beginning of period
|
$ | 9,364 | $ | 8,273 | ||||
|
Additions
based on tax positions related to the current year
|
2,060 | 1,946 | ||||||
|
Additions
for tax positions of prior years
|
1,272 | 366 | ||||||
|
Reductions
as a result of the lapse of the applicable statute of
limitations
|
(1,634 | ) | (1,221 | ) | ||||
|
Balance
at end of period
|
$ | 11,062 | $ | 9,364 | ||||
All of
our unrecognized tax benefits at December 31, 2009 would affect our effective
income tax rate if recognized. As of December 31, 2009, it is deemed reasonably
possible that the Company will recognize tax benefits in the amount of $2.3
million in the next twelve months due to the closing of open tax years. The
nature of the uncertainty relates to deductions taken on returns that have not
been examined by the applicable tax authority.
We
recognize interest and penalties related to income tax matters in income tax
expense. During the years ended December 31, 2009 and 2008, we recognized
interest expense related to uncertain tax positions of approximately $506,000
and $365,000, respectively. The tax years 2002 through 2009 remain open to
examination by the major taxing jurisdictions in which we file income tax
returns.
Note
10 – Stockholders’ equity and stock-based compensation
Stock
option plans
Our
stockholders approved the 1994 Incentive Stock Option Plan (the “1994 Plan”) on
May 9, 1994. At the time of approval, 9,112,500 shares of our common stock were
reserved for issuance under this plan. In 1997, an additional 7,087,500 shares
of our common stock were reserved for issuance under this plan, and an
additional 750,000 shares were reserved for issuance under this plan, as
amended, in 2004. The 1994 Plan terminated in May 2005, except with respect to
outstanding awards previously granted thereunder. Awards under the plan were
either incentive stock options within the meaning of Section 422 of the Internal
Revenue Code or nonqualified options. The right to purchase shares vests over a
five to ten-year period, beginning on the date of grant. Vesting of ten year
awards may accelerate based on the Company’s previous year’s earnings and
revenue growth but shares cannot accelerate to vest over a period of less than
five years. Stock options must be exercised within ten years from date of grant.
Stock options were issued at the market price at the grant date. As part of the
requirements of FASB ASC 718, we are required to estimate potential forfeitures
of stock grants and adjust compensation cost recorded accordingly. The estimate
of forfeitures will be adjusted over the requisite service period to the extent
that actual forfeitures differ, or are expected to differ, from such estimates.
Changes in estimated forfeitures will be recognized through a cumulative
catch-up adjustment in the period of change and will also impact the amount of
stock compensation expense to be recognized in future periods.
Transactions
under all stock option plans are summarized as follows:
|
Number
of
shares
under
option
|
Weighted
average
exercise
price
|
|||||||
|
Outstanding
at December 31,
2006
|
6,914,673 | $ | 22.49 | |||||
|
Exercised
|
(1,515,107 | ) | 15.22 | |||||
|
Canceled
|
(104,925 | ) | 27.33 | |||||
|
Granted
|
— | — | ||||||
|
Outstanding
at December 31,
2007
|
5,294,641 | $ | 24.47 | |||||
|
Exercised
|
(925,743 | ) | 17.30 | |||||
|
Canceled
|
(96,331 | ) | 26.98 | |||||
|
Granted
|
— | — | ||||||
|
Outstanding
at December 31,
2008
|
4,272,567 | $ | 25.97 | |||||
|
Exercised
|
(379,630 | ) | 15.40 | |||||
|
Canceled
|
(181,434 | ) | 26.80 | |||||
|
Granted
|
— | — | ||||||
|
Outstanding
at December 31,
2009
|
3,711,503 | $ | 26.93 | |||||
|
Options
exercisable at December 31:
|
||||||||
|
2007
|
4,368,972 | $ | 24.17 | |||||
|
2008
|
3,812,334 | 26.00 | ||||||
|
2009
|
3,493,574 | 26.94 | ||||||
The
aggregate intrinsic value of stock options at exercise, represented in the table
above, was $2.3 million, $11.0 million and $22.3 million for the years ended
December 31, 2009, 2008 and 2007, respectively. Total unrecognized stock-based
compensation expense related to non-vested stock options was approximately $2.5
million as of December 31, 2009, related to approximately 218,000 shares with a
per share weighted average fair value of $17.50. We anticipate this expense to
be recognized over a weighted average period of approximately 4.3
years.
|
Outstanding
and Exercisable by Price Range as of December 31, 2009
|
||||||||||||||||||||||
|
Options Outstanding
|
Options Exercisable
|
|||||||||||||||||||||
|
Range of Exercise prices
|
Number
outstanding as of
12/31/2009
|
Weighted
average remaining contractual
life
|
Weighted
average exercise
price
|
Number
exercisable as of
12/31/2009
|
Weighted
average exercise
price
|
|||||||||||||||||
| $16.08 – $21.95 | 1,238,441 | 1.74 | $ | 20.69 | 1,188,337 | $ | 20.71 | |||||||||||||||
| $22.30 – $29.85 | 1,257,625 | 3.90 | $ | 28.15 | 1,098,218 | $ | 28.08 | |||||||||||||||
| $30.51 – $34.38 | 1,215,437 | 0.41 | $ | 32.02 | 1,207,019 | $ | 32.02 | |||||||||||||||
| $16.08 – $34.38 | 3,711,503 | 2.04 | $ | 26.93 | 3,493,574 | $ | 26.94 | |||||||||||||||
The
weighted average remaining contractual life of options exercisable as of
December 31, 2009 was 1.9 years. The aggregate intrinsic value of options
outstanding as of December 31, 2009 was $9.4 million. The aggregate intrinsic
value of options currently exercisable as of December 31, 2009 was $8.8 million.
No options were granted in the years ended December 31, 2009, 2008 and 2007 as
our incentive option plan terminated in May 2005.
Restricted
stock plan
Our
stockholders approved our 2005 Incentive Plan on May 10, 2005. At the time of
approval, 2,700,000 shares of our common stock were reserved for issuance under
this plan, as well as the number of shares which had been reserved but not
issued under the 1994 Plan (our incentive stock option plan which terminated in
May 2005), and any shares that returned to the 1994 Plan as a result of
termination of options or repurchase of shares issued under such plan. The 2005
Plan, administered by the Compensation Committee of the Board of Directors,
provides for granting of incentive awards in the form of restricted stock and
restricted stock units (“RSUs”) to directors, executive officers and employees
of the Company and its subsidiaries. Awards vest over a three, five or ten-year
period, beginning on the date of grant. Vesting of ten year awards may
accelerate based on the Company’s previous year’s earnings and growth but ten
year awards cannot accelerate to vest over a period of less than five years.
Shares available for grant at December 31, 2009 were 2,089,302. As part of the
requirements of FASB ASC 718, we are required to estimate potential forfeitures
of RSUs and adjust compensation cost recorded accordingly. The estimate of
forfeitures will be adjusted over the requisite service period to the extent
that actual forfeitures differ, or are expected to differ, from such estimates.
Changes in estimated forfeitures will be recognized through a cumulative
catch-up adjustment in the period of change and will also impact the amount of
stock compensation expense to be recognized in future periods.
Transactions
under the 2005 Plan are summarized as follows:
|
RSUs
|
||||||||
|
Number
of RSUs
|
Weighted
Average Grant Price
|
|||||||
|
Balance
at January 1, 2007
|
1,324,933 | $ | 26.77 | |||||
|
Granted
|
801,780 | $ | 27.90 | |||||
|
Earned
|
(209,303 | ) | $ | 27.85 | ||||
|
Canceled
|
(75,776 | ) | $ | 27.64 | ||||
|
Balance
at December 31, 2007
|
1,841,634 | $ | 26.86 | |||||
|
Granted
|
763,182 | $ | 28.51 | |||||
|
Earned
|
(320,251 | ) | $ | 29.42 | ||||
|
Canceled
|
(119,337 | ) | $ | 28.19 | ||||
|
Balance
at December 31, 2008
|
2,165,228 | $ | 26.99 | |||||
|
Granted
|
604,083 | $ | 21.80 | |||||
|
Earned
|
(407,156 | ) | $ | 22.04 | ||||
|
Canceled
|
(57,721 | ) | $ | 27.88 | ||||
|
Balance
at December 31, 2009
|
2,304,434 | $ | 26.48 | |||||
Total
unrecognized stock-based compensation expense related to non-vested RSU’s was
approximately $57.1 million as of December 31, 2009, related to 2,304,434 shares
with a per share weighted average fair value of $26.48. We anticipate this
expense to be recognized over a weighted average period of approximately 7.3
years.
Employee
stock purchase plan
Our
employee stock purchase plan permits substantially all domestic employees and
employees of designated subsidiaries to acquire our common stock at a purchase
price of 85% of the lower of the market price at the beginning or the end of the
purchase period. The plan has quarterly purchase periods beginning on February
1, May 1, and November 1 of each year. At our annual shareholders meeting held
on May 7, 2007, our shareholders approved an additional 3 million shares of
common stock to be reserved for issuance under this plan. Employees may
designate up to 15% of their compensation for the purchase of common stock under
this plan. Common stock reserved for future employee purchases aggregated
1,755,071 shares at December 31, 2009. Shares issued under this plan were
838,536 in the year ended December 31, 2009. The weighted average fair value of
the employees’ purchase rights was $19.05 per share and was estimated using the
Black-Scholes model with the following assumptions:
|
2009
|
2008
|
2007
|
||||||||||
|
Dividend
expense
yield
|
0.5% | 0.3% | 0.3% | |||||||||
|
Expected
life
|
3
months
|
3
months
|
3
months
|
|||||||||
|
Expected
volatility
|
45% | 26% | 23% | |||||||||
|
Risk-free
interest
rate
|
0.8% | 3.8% | 5.0% | |||||||||
Weighted
average, grant date fair value of purchase rights granted under the Employee
Stock Purchase Plan are as follows:
|
Number
of shares
|
Weighted
average
fair value
|
|||||||
|
2007
|
549,719 | $ | 6.19 | |||||
|
2008
|
679,983 | 5.86 | ||||||
|
2009
|
838,536 | 5.75 | ||||||
Stock-based
compensation included in total cost of sales and operating expenses for the
years ended December 31, 2009, 2008 and 2007 are summarized as follows (in
thousands):
|
2009
|
2008
|
2007
|
||||||||||
|
Stock-based
compensation
|
||||||||||||
|
Total
cost of
sales
|
$ | 1,284 | $ | 1,063 | $ | 911 | ||||||
|
Sales
and
marketing
|
8,774 | 8,479 | 7,322 | |||||||||
|
Research
and
development
|
7,236 | 7,121 | 6,435 | |||||||||
|
General
and
administrative
|
3,005 | 3,084 | 2,866 | |||||||||
|
Provision
for income
taxes
|
(3,765 | ) | (4,601 | ) | (3,839 | ) | ||||||
|
Total
|
$ | 16,534 | $ | 15,146 | $ | 13,695 | ||||||
Authorized
Preferred Stock and Preferred Stock Purchase Rights Plan
We have
5,000,000 authorized shares of preferred stock. On January 21, 2004, our Board
of Directors designated 750,000 of these shares as Series A Participating
Preferred Stock in conjunction with its adoption of a Preferred Stock Rights
Agreement (the “Rights Agreement”) and declaration of a dividend of one
preferred share purchase right (a “Right”) for each share of common stock
outstanding held as of May 10, 2004 or issued thereafter. Each Right will
entitle its holder to purchase one one-thousandth of a share of National
Instruments’ Series A Participating Preferred Stock at an exercise price of
$200, subject to adjustment, under certain circumstances. The Rights Agreement
was not adopted in response to any effort to acquire control of National
Instruments.
The
Rights only become exercisable in certain limited circumstances following the
tenth day after a person or group announces acquisitions of or tender offers for
20% or more of our common stock. In addition, if an acquirer (subject to certain
exclusions for certain current stockholders of National Instruments, an
“Acquiring Person”) obtains 20% or more of our common stock, then each Right
(other than the Rights owned by an Acquiring Person or its affiliates) will
entitle the holder to purchase, for the exercise price, shares of our common
stock having a value equal to two times the exercise price. Under certain
circumstances, our Board of Directors may redeem the Rights, in whole, but not
in part, at a purchase price of $0.01 per Right. The Rights have no voting
privileges and are attached to and automatically traded with our common stock
until the occurrence of specified trigger events. The Rights will expire on the
earlier of May 10, 2014 or the exchange or redemption of the
Rights.
Stock
repurchases and retirements
Since
1998, our Board of Directors approved and we maintained various stock repurchase
programs. Pursuant to these plans we had purchased and retired a total of
7,354,966 shares for approximately $184.9 million from 1998 through December 31,
2007. During 2008, we purchased an additional 4,110,042 share for approximately
$103.6 million. At December 31, 2008, there were 723,092 shares available for
repurchase under the plan approved in April 2008. On January 23, 2009, our Board
of Directors approved a new share repurchase plan that increased the aggregate
number of shares of common stock we are authorized to purchase from 591,324 to
3.0 million. During 2009, we purchased an additional 1,443,441 shares for
approximately $34.6 million. At December 31, 2009, there were 1,688,327 shares
available for repurchase under the plan approved in January 2009. Our share
repurchase plan does not have an expiration date.
Note
11 – Employee retirement plan
We have a
defined contribution retirement plan pursuant to Section 401(k) of the Internal
Revenue Code. Substantially all domestic employees with at least 30 days of
continuous service are eligible to participate and may contribute up to 15% of
their compensation. The Board of Directors has elected to make matching
contributions equal to 50% of employee contributions, which may be applied to a
maximum of 6% of each participant’s compensation. Employees are eligible for
matching contributions after one year of continuous service. Company
contributions vest immediately. Our policy prohibits participants from direct
investment in shares of our common stock within the plan. Company contributions
charged to expense were $3.9 million, $3.7 million and $3.3 million in 2009,
2008 and 2007, respectively.
Note 12 – Segment information
In
accordance with FASB ASC 280, Segment Reporting (FASB ASC
280), we determine
operating segments using the management approach. The management approach
designates the internal organization that is used by management for making
operating decisions and assessing performance as the source of our operating
segments. It also requires disclosures about products and services, geographic
areas and major customers.
We have
defined our operating segment based on geographic regions. We sell our products
in three geographic regions. Our sales to these regions share similar economic
characteristics, similar product mix, similar customers, and similar
distribution methods. Accordingly, we have elected to aggregate these three
geographic regions into a single operating segment. Revenue from the sale of our
products which are similar in nature and software maintenance are reflected as
total net sales in our Consolidated Statements of Income.
Total net
sales, operating income, interest income and long-lived assets, classified by
the major geographic areas in which we operate, are as follows (in
thousands):
|
|
Years Ended December 31,
|
|||||||||||
|
2009
|
2008
|
2007
|
||||||||||
|
Net
sales:
|
||||||||||||
|
Americas:
|
||||||||||||
|
Unaffiliated customer
sales
|
$ | 292,999 | $ | 355,878 | $ | 331,482 | ||||||
|
Geographic
transfers
|
86,145 | 132,563 | 115,709 | |||||||||
| 379,144 | 488,441 | 447,191 | ||||||||||
|
Europe:
|
||||||||||||
|
Unaffiliated customer
sales
|
210,188 | 267,373 | 230,940 | |||||||||
|
Geographic
transfers
|
189,076 | 204,282 | 159,992 | |||||||||
| 399,264 | 471,655 | 390,932 | ||||||||||
|
Asia
Pacific:
|
||||||||||||
|
Unaffiliated customer
sales
|
173,407 | 197,286 | 177,956 | |||||||||
|
Eliminations
|
(275,221 | ) | (336,845 | ) | (275,701 | ) | ||||||
| $ | 676,594 | $ | 820,537 | $ | 740,378 | |||||||
|
|
Years Ended December 31,
|
|||||||||||
|
2009
|
2008
|
2007
|
||||||||||
|
Operating
income:
|
||||||||||||
|
Americas
|
$ | 46,816 | $ | 71,467 | $ | 76,292 | ||||||
|
Europe
|
87,250 | 105,748 | 92,469 | |||||||||
|
Asia
Pacific
|
45,439 | 61,642 | 59,845 | |||||||||
|
Unallocated:
|
||||||||||||
|
Research
and development
expenses
|
(132,974 | ) | (143,140 | ) | (126,515 | ) | ||||||
| $ | 46,531 | $ | 95,717 | $ | 102,091 | |||||||
|
Years Ended December 31,
|
||||||||||||
|
2009
|
2008
|
2007
|
||||||||||
|
Interest
income:
|
||||||||||||
|
Americas
|
$ | 803 | $ | 2,603 | $ | 5,138 | ||||||
|
Europe
|
727 | 3,291 | 4,485 | |||||||||
|
Asia
Pacific
|
99 | 102 | 199 | |||||||||
| $ | 1,629 | $ | 5,996 | $ | 9,822 | |||||||
|
December 31,
|
||||||||
|
2009
|
2008
|
|||||||
|
Long-lived
assets:
|
||||||||
|
Americas
|
$ | 100,489 | $ | 107,701 | ||||
|
Europe
|
36,555 | 39,280 | ||||||
|
Asia
Pacific
|
16,221 | 7,496 | ||||||
| $ | 153,265 | $ | 154,477 | |||||
Total
sales outside the United States for 2009, 2008 and 2007 were $412.7 million,
$499.3 million and $437.0 million, respectively.
Note 13 – Commitments, contingencies and
leases
We have
commitments under non-cancelable operating leases primarily for office
facilities throughout the world. Certain leases require us to pay property
taxes, insurance and routine maintenance, and include escalation clauses. Future
minimum lease payments as of December 31, 2009, for each of the next five years
are as follows (in thousands):
|
2010
|
$ | 14,415 | ||
|
2011
|
9,898 | |||
|
2012
|
6,982 | |||
|
2013
|
4,611 | |||
|
2014
|
3,665 | |||
|
Thereafter
|
12,130 | |||
| $ | 51,701 |
Rent
expense under operating leases was approximately $12.3 million, $11.7 million
and $10.2 million for the years ended December 31, 2009, 2008 and 2007,
respectively.
As of
December 31, 2009, we have non-cancelable purchase commitments with various
suppliers of customized inventory and inventory components totaling
approximately $6.5 million over the next twelve months.
As of
December 31, 2009, we have outstanding guarantees for payment of customs and
foreign grants totaling approximately $5.2 million.
Note
14 – Litigation
We filed
a patent infringement action on January 25, 2001, in the U.S. District Court,
Eastern District of Texas (Marshall Division) claiming that The MathWorks, Inc.
(“MathWorks”) infringed certain of our U.S. patents. On January 30, 2003, a jury
found infringement by MathWorks of three of the patents involved and awarded us
specified damages. On September 23, 2003, the District Court entered final
judgment in favor of us and entered an injunction against MathWorks’ sale of its
Simulink and related products and stayed the injunction pending appeal. Upon
appeal, the judgment and the injunction were affirmed by the U.S. Court of
Appeals for the Federal Circuit (September 3, 2004). Subsequently the stay of
injunction was lifted by the District Court. In November 2004, the final
judgment amount of $7.4 million which had been held in escrow pending appeal was
released to us.
An action
was filed by MathWorks against us on September 22, 2004, in the U.S. District
Court, Eastern District of Texas (Marshall Division), claiming that on that day
MathWorks had released modified versions of its Simulink and related products,
and seeking a declaratory judgment that the modified products do not infringe
the three patents adjudged infringed in the District Court's decision of
September 23, 2003 (and affirmed by the Court of Appeals on September 3, 2004).
On November 2, 2004, MathWorks served the complaint on us. We filed an answer to
MathWorks’ declaratory judgment complaint, denying MathWorks’ claims of
non-infringement and alleging our own affirmative defenses. On January 5, 2005,
the Court denied a contempt motion by us to enjoin the modified Simulink
products under the injunction in effect from the first case. On January 7, 2005,
we amended our answer to include counterclaims that MathWorks’ modified products
are infringing three of our patents, and requested unspecified damages and an
injunction. MathWorks filed its reply to our counterclaims on February 7, 2005,
denying the counterclaims and alleging affirmative defenses. On March 2, 2005,
we filed a notice of appeal regarding the Court's denial of the contempt motion.
On March 15, 2005, the Court stayed MathWorks’ declaratory judgment action,
pending a decision on the appeal by the Court of Appeals for the Federal
Circuit. On February 9, 2006, the Court of Appeals for the Federal Circuit
affirmed the District Court’s January 2005 order. On November 22, 2006, the
District Court lifted the stay. The case schedule has yet to be set in this
action. During the fourth quarter of 2004, we accrued $4 million related to our
probable loss from this contingency, which consists entirely of anticipated
patent defense costs that are probable of being incurred. In the fourth quarter
of 2006, we accrued an additional $600,000 related to this contingency. During
the third quarter of 2009, we reduced the accrual by $2 million to reflect a
decrease in the estimated costs that are probable of being incurred in this
action. To date, we have charged a cumulative total of $623,000 against this
accrual. At December 31, 2009, the remaining accrual was $2
million.
On
February 1, 2008, we acquired all of the outstanding shares of microLEX Systems
ApS, (“microLEX”) a premier provider of virtual instrumentation-based video,
audio and mixed-signal test solutions. This acquisition was accounted for as a
business combination. The purchase price of the acquisition, which included
legal and accounting fees, was $17.8 million in cash. The allocation of the
purchase price was determined using the fair value of assets and liabilities
acquired as of February 1, 2008. We funded the purchase price from existing cash
balances. Our consolidated financial statements include the operating results
from the date of acquisition. Pro-forma results or operations have not been
presented because the effects of those operations were not material. The
following table summarizes the allocation of the purchase price of microLEX (in
thousands):
|
Goodwill
|
$ | 10,818 | ||
|
Acquired
core
technology
|
5,201 | |||
|
Non-competition
agreements
|
159 | |||
|
Trademarks
|
119 | |||
|
Customer
relationships
|
354 | |||
|
Current
assets
acquired
|
3,057 | |||
|
Long-term
assets
acquired
|
20 | |||
|
Current
liabilities
assumed
|
(486 | ) | ||
|
Deferred
tax
liabilities
|
(1,458 | ) | ||
|
Total
assets
acquired
|
$ | 17,784 |
Goodwill
is not deductible for tax purposes. Existing technology, non-competition
agreements, trademarks, and customer relationships have useful lives of 5 years,
3 years, 3 years, and 5 years, respectively, from the date of acquisition. These
assets are not deductible for tax purposes.
Note
16 – Quarterly results (unaudited)
The
following quarterly results have been derived from unaudited consolidated
financial statements that, in the opinion of management, reflect all adjustments
(consisting only of normal recurring adjustments) necessary for a fair
presentation of such quarterly information. The operating results for any
quarter are not necessarily indicative of the results to be expected for any
future period. The unaudited quarterly financial data for each of the eight
quarters in the two years ended December 31, 2009 are as follows (in thousands,
except per share data):
|
Three Months Ended
|
||||||||||||||||
|
Mar.
31,
2009
|
Jun.
30,
2009
|
Sep.
30,
2009
|
Dec.
31,
2009
|
|||||||||||||
|
Net
sales
|
$ | 157,799 | $ | 152,163 | $ | 165,035 | $ | 201,597 | ||||||||
|
Gross
profit
|
116,916 | 111,677 | 123,136 | 154,981 | ||||||||||||
|
Operating
income
|
(2,479 | ) | 2,341 | 10,688 | 35,981 | |||||||||||
|
Net
income
|
358 | 4,430 | 9,931 | 2,366 | ||||||||||||
|
Basic
earnings per
share
|
$ | 0.00 | $ | 0.06 | $ | 0.13 | $ | 0.03 | ||||||||
|
Weighted
average shares
outstanding-basic
|
77,277 | 77,556 | 77,653 | 77,589 | ||||||||||||
|
Diluted
earnings per
share
|
$ | 0.00 | $ | 0.06 | $ | 0.13 | $ | 0.03 | ||||||||
|
Weighted
average shares
outstanding-diluted
|
77,436 | 77,824 | 78,103 | 78,325 | ||||||||||||
|
Dividends
declared per
share
|
$ | 0.12 | $ | 0.12 | $ | 0.12 | $ | 0.12 | ||||||||
|
Three Months Ended
|
||||||||||||||||
|
Mar.
31,
2008
|
Jun.
30,
2008
|
Sep.
30,
2008
|
Dec.
31,
2008
|
|||||||||||||
|
Net
sales
|
$ | 192,918 | $ | 210,474 | $ | 215,038 | $ | 202,107 | ||||||||
|
Gross
profit
|
143,849 | 157,034 | 160,531 | 152,014 | ||||||||||||
|
Operating
income
|
18,065 | 27,834 | 27,946 | 21,872 | ||||||||||||
|
Net
income
|
17,616 | 24,734 | 23,159 | 19,318 | ||||||||||||
|
Basic
earnings per
share
|
$ | 0.22 | $ | 0.32 | $ | 0.29 | $ | 0.25 | ||||||||
|
Weighted
average shares
outstanding-basic
|
78,840 | 78,484 | 78,834 | 78,110 | ||||||||||||
|
Diluted
earnings per
share
|
$ | 0.22 | $ | 0.31 | $ | 0.29 | $ | 0.25 | ||||||||
|
Weighted
average shares
outstanding-diluted
|
79,825 | 79,549 | 79,841 | 78,522 | ||||||||||||
|
Dividends
declared per
share
|
$ | 0.11 | $ | 0.11 | $ | 0.11 | $ | 0.11 | ||||||||
Note
17 – Subsequent events
In
accordance with FASB ASC 855, Subsequent Events (FASB ASC
855), we have evaluated subsequent events through February 17, 2010, the date
the financial statements were issued.
On
January 22, 2010, our Board of Directors declared a quarterly cash dividend of
$0.13 per common share, payable March 1, 2010, to shareholders of record on
February 8, 2010.
From January
29, 2010 to February 12, 2010, we have repurchased 683,832 shares of our common
stock at an average price of $29.97 under our share repurchase plan. The maximum
number of shares that may yet be purchased under our plan is 1,004,495. Our
purchase plan does not have an expiration date.