Attached files
| file | filename |
|---|---|
| EX-32.1 - EXHIBIT 32.1 - NATIONAL INSTRUMENTS CORP | nati-20171231x10kexhibit321.htm |
| EX-31.2 - EXHIBIT 31.2 - NATIONAL INSTRUMENTS CORP | nati-20171231x10kexhibit312.htm |
| EX-31.1 - EXHIBIT 31.1 - NATIONAL INSTRUMENTS CORP | nati-20171231x10kexhibit311.htm |
| EX-23.1 - EXHIBIT 23.1 - NATIONAL INSTRUMENTS CORP | nati-20171231x10kexhibit231.htm |
| EX-21.1 - EXHIBIT 21.1 - NATIONAL INSTRUMENTS CORP | nati-20171231x10kexhibit211.htm |
UNITED STATES
SECURITIES AND EXCHANGE COMMISSION
Washington, D.C. 20549
FORM 10-K
[x] ANNUAL REPORT PURSUANT TO SECTION 13 OR 15(D) OF THE SECURITIES EXCHANGE ACT OF 1934
For the fiscal year ended: December 31, 2017 or
[ ] TRANSITION REPORT PURSUANT TO SECTION 13 OR 15(D) OF THE SECURITIES EXCHANGE ACT OF 1934
For the transition period from ________________ to ________________
Commission file number: 0-25426

NATIONAL INSTRUMENTS CORPORATION
(Exact name of registrant as specified in its charter)
Delaware (State or other jurisdiction of incorporation or organization) | 74-1871327 (I.R.S. Employer Identification Number) |
11500 North MoPac Expressway Austin, Texas | 78759 |
(address of principal executive offices) | (zip code) |
Registrant's telephone number, including area code: (512) 683-0100
Securities registered pursuant to Section 12(b) of the Act:
Title of Each Class | Name of Each Exchange on Which Registered |
Common Stock, $0.01 par value | The NASDAQ Stock Market, LLC |
Securities registered pursuant to Section 12(g) of the Act:
Preferred Stock Purchase Rights
Indicate by check mark if the registrant is a well-known seasoned issuer, as defined in Rule 405 of the Securities Act. Yes [x] No ☐
Indicate by check mark if the registrant is not required to file reports pursuant to Section 13 or Section 15(d) of the Act. Yes ☐ No [x]
Indicate by check mark whether the registrant (1) has filed all reports required to be filed by Section 13 or 15(d) of the Securities Exchange Act of 1934 during the preceding 12 months (or for such shorter period that the registrant was required to file such reports), and (2) has been subject to such filing requirements for the past 90 days. Yes [x] No ☐
Indicate by check mark whether the registrant has submitted electronically and posted on its corporate Web site, if any, every Interactive Data File required to be submitted and posted pursuant to Rule 405 of Regulation S-T (§232.405 of this chapter) during the preceding 12 months (or for such shorter period that the registrant was required to submit and post such files). Yes [x] No ☐
Indicate by check mark if disclosure of delinquent filers pursuant to Item 405 of Regulation S-K (§229.405 of this chapter) is not contained herein, and will not be contained, to the best of registrant’s knowledge, in definitive proxy or information statements incorporated by reference in Part III of this Form 10-K or any amendment to this Form 10-K. [x]
Indicate by check mark whether the registrant is a large accelerated filer, an accelerated filer, a non-accelerated filer, a smaller reporting company, or an emerging growth company. See the definitions of “large accelerated filer”, “accelerated filer”, “smaller reporting company”, and “emerging growth company” in Rule 12b-2 of the Exchange Act. (Check one):
Large accelerated filer [x] Accelerated filer [ ] Non-accelerated filer [ ] Smaller reporting company [ ] Emerging growth company [ ]
If an emerging growth company, indicate by check mark if the registrant has elected not to use the extended transition period for complying with any new or revised financial accounting standards provided pursuant to Section 13(a) of the Exchange Act. [ ]
Indicate by check mark whether the registrant is a shell company (as defined in Rule 12b-2 of the Act). Yes [ ] No [x]
The aggregate market value of voting and non-voting common equity held by non-affiliates of the registrant at the close of business on June 30, 2017, was $2,138,334,992 based upon the last sales price reported for such date on the NASDAQ Stock Market. For purposes of this disclosure, shares of Common Stock held by persons who hold more than 5% of the outstanding shares of Common Stock and shares held by officers and directors of the registrant as of June 30, 2017, have been excluded in that such persons may be deemed to be affiliates. This determination is not necessarily conclusive.
At the close of business on February 16, 2018, registrant had outstanding 131,204,795 shares of Common Stock.
DOCUMENTS INCORPORATED BY REFERENCE
Part III incorporates certain information by reference from the definitive proxy statement to be filed by the registrant for its Annual Meeting of Stockholders to be held on May 8, 2018 (the “Proxy Statement”).
1
Form 10-K
For the Fiscal Year Ended December 31, 2017
TABLE OF CONTENTS
| ||
| ||
| ||
2
PART I
This Form 10-K contains forward-looking statements within the meaning of Section 27A of the Securities Act of 1933, as amended, and Section 21E of the Securities Exchange Act of 1934, as amended (the “Exchange Act”). Any statements contained herein regarding our future financial performance, operations, or other matters (including, without limitation, statements to the effect that we “believe,” “expect,” “plan,” “may,” “will,” “intend to”, “project,” “anticipate”, “continue,” or “estimate” or other variations thereof or comparable terminology or the negative thereof) should be considered forward-looking statements. Actual results could differ materially from those projected in the forward-looking statements as a result of a number of important factors including those set forth under Item 1 under the heading “Risk Factors” beginning on page 13, and elsewhere in this Form 10-K. Although we believe that the expectations reflected in the forward-looking statements are reasonable, we cannot guarantee future results, levels of activity, performance or achievements. You should not place undue reliance on these forward-looking statements. We disclaim any obligation to update information contained in any forward-looking statement.
ITEM 1. BUSINESS
National Instruments Corporation (the “Company”, “NI”, “we”, “us” or “our”) designs, manufactures and sells systems to engineers and scientists that accelerate productivity, innovation and discovery. Our software-centric platform provides integrated software and modular hardware that speeds the development of systems needing measurement and control. We believe our long-term vision and focus on technology supports the success of our customers, employees, suppliers and stockholders.
We are based in Austin, Texas, were incorporated under the laws of the State of Texas in May 1976 and were reincorporated in Delaware in June 1994. In March 1995, we completed an initial public offering of our common stock. Our common stock, $0.01 par value, is quoted on the NASDAQ Stock Market under the trading symbol NATI.
Our website is www.ni.com. Our annual reports on Form 10-K, quarterly reports on Form 10-Q, current reports on Form 8-K and amendments to those reports filed or furnished pursuant to Section 13(a) or 15(d) of the Exchange Act and every Interactive Data File required to be submitted and posted pursuant to Rule 405 of Regulation S-T are available through our Internet website as soon as reasonably practicable after we electronically file such materials with, or furnish them to, the SEC, or upon written request without charge. Our website and the information contained therein or connected thereto are not intended to be incorporated into this Annual Report on Form 10-K.
Industry Background
Engineers and scientists use instrumentation to observe, understand, and manage the real-world phenomena, events and processes related to their industries or areas of expertise. Instrumentation systems measure and control electrical signals, such as voltage, current and power, as well as temperature, pressure, speed, flow, volume, torque, and vibration. Common general-purpose instruments include voltmeters, signal generators, oscilloscopes, data loggers, spectrum analyzers, cameras, and temperature and pressure monitors and controllers. Some traditional instruments are also highly application-specific, designed with fixed functionality to measure specific signals for particular vertical industries or applications. Instruments used for industrial automation applications include data loggers, strip chart recorders, programmable logic controllers (“PLCs”), and proprietary turn-key devices or systems designed to automate or control specific vertical applications.
Systems that perform measurement and control can be generally categorized as test, measurement, and embedded systems. Technology is moving at a very fast pace. Engineers and scientists across many industries are experiencing technology convergence, resulting in increased complexity of their systems. This convergence is evidenced in numerous devices such as cars, smartphones, semiconductors and smart factories.
More and more of the functionality of advanced technologies is being defined in software; therefore, system capabilities are rapidly changing. Engineers designing and testing highly complex systems are striving to create monitoring, control, and test systems that can improve at the rapid rate of technologies and take advantage of industry trends in a way that enables them to get their jobs done faster and more efficiently.
NI has been addressing these industry challenges by creating highly productive systems that can access real world phenomena and can be used through the research, design, test, manufacture, and service phases of a wide variety of products and applications. We believe that by making engineers and scientists more productive, our systems can have a great impact on their businesses.
3
Our Approach to Measurement and Automation
NI equips engineers and scientists with systems that accelerate productivity, innovation and discovery. Our customers use our platform to develop test, measurement, control and embedded systems across multiple industries from design to production, for advanced research, and to teach engineering and science.
For more than 40 years, NI has been a catalyst in accelerating engineering innovation to meet industry challenges. NI pioneered a software-based approach to test, measurement, and control that has enabled its customers to build systems to meet the unique requirements of their applications. NI hardware and software leverages commercially available technology whenever possible to deliver performance and cost benefits to our customers. Our mission has been to leverage the advancements in these technologies and deliver them to engineers and scientists in a way that accelerates their development of test, measurement, or control systems. NI provides powerful, flexible technology solutions that accelerate productivity and drive rapid innovation. From daily tasks to grand challenges, NI helps engineers and scientists overcome complexity to exceed expectations. Customers in numerous industries—from healthcare and automotive to consumer electronics and particle physics, from 5G to the Industrial Internet of Things and the connected car—use NI’s integrated hardware and software platform.
NI has been on the leading edge of technologies like graphical software, modular hardware standards, and Field Programmable Gate Arrays (“FPGAs”). For example, NI has been at the leading edge of using user-programmable FPGAs to design high-performance measurement and control systems; this capability has enabled the NI platform to become a solution for prototyping the next generation of communications systems in 5G wireless.
Compared with traditional solutions, we believe our products and our platform-based approach provide the following significant benefits to our customers:
Simpler, Faster Development
Customers face changing requirements and technologies while having to create more intelligent systems with fewer resources. Our software-based approach simplifies the complexity of creating these systems by providing higher level interfaces to access changing technology and a way to easily upgrade through software while other fixed function systems require new hardware. When hardware changes are required, our modular, reconfigurable platforms enable users to easily change only the functions they need while preserving software continuity over time. In this way, our graphical system design platform-based approach can accelerate the development of systems that need measurement and control.
Performance and Efficiency
Our software brings the power of commercial computers, handheld devices, networks and the Internet to instrumentation and embedded devices. With features such as graphical programming, automatic code generation, graphical tools libraries, ready-to-use example programs, libraries of specific instrumentation functions, and the ability to deploy applications on a range of platforms, scientists and engineers can quickly build a system that meets individual application needs. Because the continuous performance improvement of personal computers (“PCs”), FPGAs and networking technologies are the core platforms for our approach, scientists and engineers can quickly realize direct performance benefits, faster execution for measurement and automation applications, shorter test times, faster automation, higher performing embedded systems and higher manufacturing throughput.
Modularity, Reusability and Reconfigurability
Our products include reusable hardware and software modules to provide considerable flexibility in configuring systems. This ability to reconfigure measurement and automation systems allows users to quickly adapt their systems to new and changing needs, eliminate duplicated programming efforts, and ultimately improve their efficiency and productivity. In addition, these features help protect both hardware and software investments against obsolescence.
Lower Total Solution Cost
NI solutions offer price to performance and energy-efficiency advantages over traditional proprietary systems. Graphical system design allows customers to equip powerful industry-standard computers, with reusable system design software and modular cost-effective hardware. In addition, these systems give engineers and scientists the flexibility and portability to adapt to changing needs, while offering a smaller form factor that occupies less space on the manufacturing floor and consumes less energy than traditional instrumentation equipment.
Products, Technology and Services
We offer an extensive line of measurement, automation and control products to work either separately, as stand-alone products or as an integrated system; however, customers generally purchase our software and hardware together. We believe that the flexibility, functionality and ease of use of our system design software promotes sales of our other software and hardware products. We offer volume licensing that helps customers maximize their system investment by reducing total cost of ownership and simplifying their software standardization, budgeting, purchasing and upgrading efforts.
4
System Design Software
For more than 30 years, NI has invested in its flagship software product, LabVIEW, which NI believes is the ultimate system design software for measurement, automation and control. LabVIEW promotes problem-solving, accelerates productivity, and empowers innovation. With LabVIEW, users program graphically and can design custom virtual instruments by connecting graphical icons with software wires to create “block diagrams” which are natural design notations for scientists and engineers. Users can customize front panels with knobs, buttons, dials and graphs to emulate control panels of instruments or add custom graphics to visually represent the control and operation of processes.
LabVIEW is a comprehensive development environment with hardware integration and wide-ranging compatibility that engineers and scientists need to design and deploy measurement, automation and control systems. The LabVIEW programming environment is graphical, with engineering-specific libraries of software engineering functions and hardware interfaces. It also offers data analysis, visualization, and sharing features. Engineers and scientists can bring their vision to life with LabVIEW, and have access to a vast ecosystem of partners and technology alliances, and a global and active user community. When customers use LabVIEW, combined with the modular hardware approach with NI data acquisition, NI CompactRIO and PCI Extensions for Instrumentation (“PXI”) platforms, they are able to quickly integrate system components and do their jobs faster, more efficiently, and at a lower cost.
In 2017, NI introduced the next version of its flagship software product, LabVIEW NXG. This version reduces time to measurement with data acquisition devices and benchtop instruments with engineering workflows for acquiring and visualizing data sets. When needed, customers can transition to a development approach to customize their test and measurement systems.
LabVIEW Real-Time and LabVIEW FPGA are strategic modular software add-ons to LabVIEW. With LabVIEW Real-Time, the user can easily configure their application program to execute using a real-time operating system kernel instead of a general purpose operating system, so users can easily build deterministic solutions. In addition, with LabVIEW Real-Time, users can easily configure their programs to operate remotely on embedded processors in PXI-based systems, on embedded processors inside NI CompactRIO distributed I/O systems, or on processors embedded on plug-in PC data acquisition boards. With LabVIEW FPGA, the user can configure their application to execute directly in silicon via an FPGA residing on one of our reconfigurable I/O hardware products. LabVIEW FPGA allows users to build their own highly specialized, custom hardware devices for ultra high-performance requirements or for unique or proprietary measurement or control protocols.
The LabVIEW Communications System Design Suite is a targeted version of LabVIEW that we built specifically for wireless prototyping. This customized version includes new workflows, specialized IP, and offers a design environment closely integrated with NI software defined radio (“SDR”) hardware for rapidly prototyping communications systems including FPGA-based SDR hardware. LabVIEW Communications simplifies the design process that is complicated by today’s disparate hardware and software tools. Users define and manage the entire prototyping process with a single design tool, and rapidly deploy new algorithms to hardware. LabVIEW Communications also provides a plug-in architecture to offer productive starting points with open application frameworks for LTE, 802.11 and other key standards.
Programming Tools
In addition to LabVIEW, NI offers LabWindows/CVI and Measurement Studio as alternative programming environments. LabWindows/CVI users use the conventional, text-based programming language of C for creating test and control applications. LabWindows/CVI also provides a Real-Time module to allow for C-based development of real-time systems in automated test applications. Measurement Studio consists of measurement and automation add-on libraries and additional tools for programmers who prefer Microsoft’s Visual Studio development environments.
Application Software
NI offers a suite of application software products, including NI TestStand, NI VeriStand, NI DIAdem, NI InsightCM Enterprise and NI Multisim, which are complementary to LabVIEW, LabWindows/CVI, Measurement Studio and certain third-party software.
NI TestStand. NI TestStand is targeted for test and measurement applications in a manufacturing environment. NI TestStand is a test management environment for organizing, controlling, and running automated prototype, validation, and manufacturing test systems. It also generates customized test reports and integrates product and test data across the customers’ enterprise and across the Internet. NI TestStand manages tests that are written in LabVIEW, LabWindows/CVI, Measurement Studio, C and C++, and Microsoft Visual Basic, so test engineers can easily share and re-use test code throughout their organization and from one product to the next. NI TestStand is a key element of our strategy to broaden the reach of our application software products across the corporate enterprise.
5
NI VeriStand. NI VeriStand is a ready-to-use software environment for configuring real-time testing applications, including hardware-in-the-loop (“HIL”) test systems. With NI VeriStand, users configure real-time I/O, stimulus profiles, data logging, alarming, and other tasks; implement control algorithms or system simulations by importing models from a variety of software environments; build test system user interfaces quickly; and add custom functionality using NI LabVIEW, NI TestStand, and other software environments.
NI DIAdem. NI DIAdem offers users configuration-based technical data management, analysis, and report generation tools to interactively mine and analyze data. NI DIAdem helps users make informed decisions and meet the demands of today’s testing environments, which require quick access to large volumes of scattered data, consistent reporting, and data visualization.
NI InsightCM Enterprise. NI InsightCM Enterprise is a software solution with tightly integrated hardware options for monitoring critical and ancillary rotating equipment. With this solution, a user can acquire, analyze, and visualize data from a wide breadth of sensors to interpret the health of the user’s machines with confidence. Companies can use this cost-effective, open, and flexible solution to monitor a larger percentage of their fleet and meet evolving maintenance requirements.
NI Multisim Circuit Design Software. NI Multisim is an advanced simulation environment utilizing the industry-standard Simulation Program with Integrated Circuit Emphasis (“SPICE”) framework. It is the cornerstone of the NI circuits teaching solution to build expertise through practical application in designing, prototyping, and testing electrical circuits.
NI SystemLink. NI SystemLink is a systems management software that enables the mass coordination of connected devices, software deployments, and data communications throughout a distributed system. It provides centralized management capabilities for distributed test, measurement, and control solutions. A web application lets users manage a group of networked systems with functions that include software deployment, device configuration, and diagnostics. SystemLink also provides scalable data services and LabVIEW application programming interfaces.
Modular Hardware Products and Related Driver Software
Using cutting-edge commercial technology, such as the latest microprocessors, Analog to Digital Converters (“ADCs”), FPGAs, and PC busses, our hardware delivers modular and easy-to-use solutions for a wide range of applications – from automated test and data logging to industrial control, and embedded design. Our hardware and related driver software products include data acquisition (“DAQ”), PXI chassis and controllers, modular instruments, image acquisition, motion control, distributed I/O, industrial communications interfaces, General Purpose Interface Bus (“GPIB”) interfaces, embedded control hardware/software and VME Extension for Instrumentation (“VXI”) Controllers. The high level of integration among our products provides users with the flexibility to mix and match hardware components when developing custom virtual instrumentation systems.
Data Acquisition (DAQ) Hardware/Driver Software. Our DAQ hardware and driver software products are “instruments on a board” that users can combine with sensors, signal conditioning hardware and software to acquire analog data and convert it into a digital format that can be accepted by a computer. Computer-based DAQ products are typically a lower-cost solution than traditional instrumentation and exploit the processing power, display, and connectivity capabilities of industry-standard computers. Applications suitable for automation with computer-based DAQ products are widespread throughout many industries, and many systems currently using traditional instrumentation (either manual or computer-controlled) could be displaced by computer-based DAQ systems. We offer a range of computer-based DAQ products with a variety of form factors and degrees of performance. In 2006, we introduced NI CompactDAQ, a rugged, portable, USB data acquisition system designed for high-performance mixed-signal measurement systems. Since its introduction, we have expanded the CompactDAQ platform with wireless and Ethernet technologies that have extended the reach of computer-based DAQ from across the lab to around the world. The platform also offers high-performance stand-alone systems for embedded measurement and logging. NI DAQ products also include X Series DAQ which delivers state-of-the-art measurement, generation, timing and triggering on a single device.
PXI Modular Instrumentation Platform. Our PXI modular instrument platform, which was introduced in 1997, is a standard PC packaged in a small, rugged form factor with expansion slots and instrumentation extensions for timing, triggering and signal sharing. It combines mainstream PC software and PCI hardware with advanced instrumentation capabilities. In essence, PXI is an instrumentation PC with several expansion slots supporting complete system-level opportunities and delivering a high percentage of the overall system content using our products. We continue to expand our PXI product offerings with new modules, which address a wide variety of measurement and automation applications. The PXI platform is now a testing standard, with a wide array of companies developing applications on the platform and investing in its future through the PXI System Alliance (“PXISA”). In 2006, we introduced our first PXI Express products which provide backward software compatibility with PXI while providing advanced capabilities for high-performance instrumentation, such as RF instrumentation and wireless design and wireless test applications. Today, we have an expanding portfolio of PXI Express products that are further expanding the capabilities of this important platform.
6
Modular Instruments. We offer a variety of modular instrument devices used in general purpose test and communication test applications. These devices include digitizers, digital multimeters, signal generators, RF analyzers/generators, power supplies, source measurement units and switch modules that users can configure through software to meet their specific measurement requirements. Because these instruments are modular and software-defined, they can be quickly interchanged and easily repurposed to meet evolving test needs. Additionally, our modular instruments provide high-speed test execution by harnessing the power of industry-standard PCs, FPGAs and advanced timing and synchronization technologies. Options are available for a variety of platforms including PXI, PXI Express, PCI, PCI Express, and USB.
Machine Vision/Image Acquisition. Our machine vision platform includes a range of hardware platform options, from embedded NI Smart Cameras that integrate the sensor and processor in a single package to plug-in boards for PCI and PXI systems. We offer two scalable software options for use across the entire NI vision hardware portfolio. A user can configure a system with NI Vision Builder for Automated Inspection, an easy-to-use, stand-alone package for machine vision, or program it using the NI Vision Development Module, a comprehensive library of imaging functions. With NI Vision hardware, a user can build high-performance, PC based systems using the latest processor techniques with NI Frame Grabbers, save on cost and space by combining an image sensor and real-time embedded processors into one rugged, industrial package with NI Smart Cameras, or harness multicore performance with fanless designs, connectivity to multiple cameras and reconfigurable digital I/O with NI Vision systems.
Motion Control. By integrating flexible software with high-performance hardware, our motion control products offer a powerful solution for motion system design. From automating test equipment and research labs to controlling biomedical, packaging, and manufacturing machines, engineers use our motion products to meet a diverse set of application challenges. Our software tools for motion easily integrate with our other product lines, so users can combine motion control with image acquisition, test, measurement, data acquisition, and automation to create robust, flexible solutions. We introduced our first line of motion control hardware, software and peripheral products in 1997.
NI LabVIEW Reconfigurable I/O (RIO) Architecture. NI reconfigurable I/O (RIO) hardware combined with NI LabVIEW system design software provides a commercial off-the-shelf solution to simplify development and shorten time to market when designing advanced measurement and control systems. All RIO hardware systems, which include CompactRIO, NI Single-Board RIO, NI System on Module, R Series boards and PXI-based FlexRIO products, feature a standard, high-performance architecture that combines a powerful floating-point processor, reconfigurable FPGA, and modular I/O. Engineers can program all RIO hardware components with LabVIEW, including the LabVIEW FPGA Module, to rapidly create custom timing, signal processing and control for I/O without requiring expertise in low-level hardware description languages or board-level design. NI provides a breadth of RIO hardware targets that provide varying degrees of performance, cost, I/O rates, and ruggedness, to meet a wide variety of application needs. NI first released its LabVIEW RIO architecture in 2003 with its first R Series PXI plug-in board along with its first CompactRIO rugged, high-performance embedded system.
Industrial Communications Interfaces. In 1995, we began shipping interface boards for communicating with serial devices, such as data loggers and PLCs targeted for industrial/embedded applications, and benchtop instruments, such as oscilloscopes, targeted for test and measurement applications. We offer hardware and driver software product lines for communication with industrial devices—Controller Area Network (“CAN”), DeviceNet, Foundation Fieldbus, and RS-485 and RS-232.
GPIB Interfaces/Driver Software. We began selling GPIB products in 1977 and are a leading supplier of GPIB interface boards and driver software to control traditional instruments. These traditional instruments are manufactured by a variety of third-party vendors and are used primarily in test and measurement applications. Our diverse portfolio of hardware and software products for GPIB instrument control is available for a wide range of computers. Our GPIB product line also includes products for controlling GPIB instruments using the computer’s standard parallel, USB, Ethernet, and serial ports.
NI Semiconductor Test System. The NI Semiconductor Test System (“STS”) series combines modular instrumentation and system design software for RF and mixed-signal production test. These systems feature fully production-ready test systems that use NI technology in a form factor suitable for a semiconductor production test environment. The STS combines the NI PXI platform, TestStand test management software, and LabVIEW graphical programming inside a fully enclosed test head. Its “tester in a head” design houses all the key components of a production tester. Its compact design eliminates the extra floor space, power, and maintenance required by traditional automated test equipment testers. With the open, modular design, engineers can take advantage of the latest industry-standard PXI modules for more instrumentation and computing power.
NI Education Platform
The NI education platform combines software, hardware and courseware designed to create engaging, authentic learning experiences that prepare students for the next generation of innovation. We have a continuum of products designed for education that allows students to start learning at the primary and secondary school levels using the programming language and platform they will use in engineering classes at the university level, for post-graduate research, and in the industry once they enter the engineering workforce. Our cost-effective, scalable solutions offer academic institutions flexible integration across multiple science and engineering disciplines.
7
Software Products for Teaching
NI Multisim Circuit Design Software. NI Multisim is an advanced simulation environment utilizing the industry-standard SPICE framework. It is the cornerstone of the NI circuits teaching solution to build expertise through practical application in designing, prototyping, and testing electrical circuits. Developed for the educator who needs to teach all aspects of circuits and electronics, Multisim Education Edition provides the ability to seamlessly move students from theory to simulation to the lab. Regardless of the application area, the powerful environment offers students the ability to visualize and interact with circuit theory and equations and focus on course-specific concepts with SPICE simulation.
NI LabVIEW for Education. LabVIEW is a graphical system design environment used on many campuses all over the world to deliver hands-on learning to the classroom, enhance research applications, and foster the next generation of innovation. By teaching with LabVIEW, educators help students accomplish hands-on and system-based learning in a single environment with skills and methods they will use in their careers. With built-in I/O integration and instrument control, thousands of functions for math and signal processing, user interfaces to visualize and explore data, and deployment to multiple hardware targets, students access the power of graphical system design and can go from concept to prototype in one semester.
LabVIEW for LEGO® MINDSTORMS®. This version of LabVIEW is specifically designed to extend the LEGO MINDSTORM set’s teaching power, making it easier, and more fun, to manage robotics projects. This easy-to-learn programming environment provides access to tools exclusive to the NI Education Platform. LabVIEW for LEGO MINDSTORMS helps prepare students for university courses and engineering careers where LabVIEW is already in use.
Hardware Products for Teaching
National Instruments Educational Laboratory Virtual Instrumentation Suite (“NI ELVIS”). The NI ELVIS measurement and prototyping platform delivers hands-on lab experience with an integrated suite of the most commonly used instruments in one compact form factor specifically designed for education. Based on industry-standard NI LabVIEW graphical system design software, NI ELVIS, with powerful data acquisition and USB plug-and-play capabilities, offers users the flexibility of virtual instrumentation and allows for quick and easy measurement acquisition and instrumentation across multiple disciplines.
NI myDAQ Measurement and Instrumentation Device. This powerful, portable device allows students to measure and analyze the world around them. It is engineered to work with LabVIEW right out of the box. A user can start simply, with built-in virtual instruments, or get creative and connect the user’s own sensors and controls. NI myDAQ combines hardware with eight ready-to-run software-defined instruments, including a function generator, oscilloscope, and digital multimeter (“DMM”); these software instruments are also used on the NI ELVIS hardware platform so the lab experience can be extended to experiments anywhere, anytime. With NI LabVIEW graphical system design software, users can extend the instrument functionality into hundreds of custom applications.
NI myRIO. NI myRIO places dual-core real-time processing and FPGA customizable I/O into the hands of students. With its onboard devices, seamless software experience, and library of courseware and tutorials, NI myRIO provides an affordable tool that students can use to do real engineering in one semester. This device gives students the opportunity to learn on the same device that they will later use to build projects. Using industry-standard technology in a portable form factor, students can explore a variety of engineering concepts that scale to real-world projects.
NI roboRIO. NI roboRIO is built for advanced robotics and gives users the ability to quickly connect and change the components they need to build and test advanced systems. With the integration of LabVIEW graphical programming capabilities, NI roboRIO becomes a customizable controller for various applications.
NI Universal Software Radio Peripheral (“USRP”). The NI USRP is an affordable, flexible radio that turns a standard PC into a wireless prototyping platform. The NI USRP platform offers a new approach to RF and communications education, which has traditionally been limited to a focus on mathematical theory. With NI USRP and LabVIEW, students gain hands-on experience exploring a working communications system with live signals to gain a better understanding of the link between theory and practical implementation.
NI Services
NI provides global services and support as part of its commitment to its customers’ success in efficiently building and maintaining high-quality measurement and control systems using graphical system design.
Hardware Services and Maintenance
System Configuration and Deployment. Our NI System Assurance Program provides a fast, easy way to get our customers' new NI systems up and running. Our trained technicians install software and hardware and configure our customers’ PXI, PXI/SCXI combination, and NI CompactRIO system to their specifications.
8
Calibration. To help our customers’ calibration needs, NI provides calibration solutions, including recalibration services, manual calibration procedures, and automated calibration software. In 2011, the American Association for Laboratory Accreditation (A2LA) accredited NI Calibration Services Austin to one of the highest international calibration standards in the industry, ISO/IEC 17025:2005 (“17025”). We now offer 17025 calibration services for OEMs and other organizations seeking to maintain compliance with the strictest governmental, medical, transportation and electronics regulations. The 17025 calibration service offering is designed for companies standardizing their automated test and measurement systems on PXI modular instrumentation, which provides some of the most advanced technology for addressing the latest engineering challenges.
Warranty and Repair. We offer standard and extended warranties to help meet project life-cycle requirements and provide repair services for our products, express repair, and advance replacement services.
Software Maintenance Services
Software Services for End Users: Our Standard Service Program (“SSP”) is designed to help ensure that our end users are successful with our products. This software maintenance contract provides the end user with regular product upgrades and service packs, professional technical support from local engineers, 24-hour a day access to self-paced online product training, and access to older versions of their owned software.
Volume Licensing for Account-Level Services: Our NI Volume License Program (“VLP”) and Enterprise Agreements (“EAs”) are designed to meet the needs of the business in addition to the success of each end user. On top of access to the SSP program for each end user, businesses that invest in the VLP and EA programs receive account-level benefits designed to help effectively manage their software assets and lower their total cost of ownership.
Training and Certification
NI Training Program. NI training helps the customer build the skills to more efficiently develop robust, maintainable applications, and certification confirms the customer’s technical growth and skill using NI software. We offer fee-based training classes and self-paced online training for many of our software and hardware products. On-site courses are quoted per customer requests and we include on-line course offerings with live teachers.
NI Certification Program. We offer programs to certify programmers and instructors for our products.
Markets and Applications
Our products are used across many industries in a variety of applications including research and development, simulation and modeling, product design, prototype and validation, production testing and industrial control and field and factory service and repair. We serve the following industries and applications worldwide: advanced research, automated test equipment, automotive, commercial aerospace, computers and electronics, consumer electronics, continuous process manufacturing, education, government/defense, medical research/pharmaceutical, power/energy, semiconductors, telecommunications and others.
Customers
We have a broad base of over 35,000 customers worldwide, with no customer accounting for more than 3% of our sales in 2017, 2016, and 2015.
Marketing
Through our worldwide marketing efforts, we strive to educate engineers and scientists about the benefits of our platform-based approach, products and technology, and to highlight the performance and cost advantages of our products. We also seek to present our position as a technology leader among producers of instrumentation software and hardware and to help promulgate industry standards that can benefit users of computer-based instrumentation.
We reach our intended audience through our website at ni.com as well as through the distribution of written and electronic materials including demonstration versions of our software, participation in tradeshows and technical conferences and training and user seminars.
We actively market our products in higher education environments, and we identify many colleges, universities and trade and technical schools as key accounts. We offer special academic pricing and products to enable universities to utilize our products in their classes and laboratories. We believe our prominence in the higher education area can contribute to our future success because students gain experience using our products before they enter the work force.
9
Sales and Distribution
We distribute and sell our software and hardware products primarily through a direct sales organization. We also use independent distributors, OEMs, VARs, system integrators and consultants to market and sell our products. We have sales offices in the U.S. and sales offices and distributors in key international markets. Sales outside of the U.S. accounted for approximately 63%, 63% and 62%, of our revenues in 2017, 2016, and 2015, respectively. The vast majority of our foreign sales are denominated in the customers’ local currency, which exposes us to the effects of changes in foreign currency exchange rates. We expect that a significant portion of our total revenues will continue to be derived from international sales. (See Note 13 – Segment and geographic information of Notes to Consolidated Financial Statements for details concerning the geographic breakdown of our net sales and long-lived assets.)
We believe the ability to provide comprehensive service and support to our customers is an important factor in our business. We permit customers to return products within 30 days from receipt for a refund of the purchase price less a restocking charge. Our hardware products are generally warranted against defects in materials and workmanship for one year from the date we ship the products to our customers. Historically, warranty costs and returns have not been material.
The marketplace for our products dictates that many of our products be shipped very quickly after an order is received. As a result, we are required to maintain significant inventories. Therefore, inventory obsolescence is a risk for us due to frequent engineering changes, shifting customer demand, the emergence of new industry standards and rapid technological advances including the introduction by us or our competitors of products embodying new technology. We strive to mitigate this risk by monitoring inventory levels against product demand and technological changes. Additionally, many of our products have interchangeable parts and many have long lives. There can be no assurance that we will be successful in these efforts in the future.
Our foreign operations are subject to certain risks set forth under Item 1A, Risk Factors, “We are Subject to Various Risks Associated with International Operations and Foreign Economies.”
See discussion regarding fluctuations in our quarterly results and seasonality in ITEM 1A, Risk Factors, “Our Revenues are Subject to Seasonal Variations.”
We have one operating segment and one reporting unit. For information regarding revenue, results of operations, and total assets for each of our last three fiscal years, please refer to our financial statements included in this Form 10-K and Management’s Discussion and Analysis of Financial Condition and Results of Operations included in Item 7 of this Form 10-K.
10
Competition
The markets in which we operate are characterized by intense competition from numerous competitors, some of which are divisions of large corporations having far greater resources than we have, and we may face further competition from new market entrants in the future. A key competitor is Keysight Technologies Inc. (“Keysight”) which was formerly part of Agilent. Keysight offers hardware and software products that provide solutions that directly compete with our virtual instrumentation products including its own line of PXI based hardware. Keysight is aggressively advertising and marketing products that are competitive with our products. Because of Keysight’s strong position in the instrumentation business, changes in its marketing strategy or product offerings could have a material adverse effect on our operating results.
We believe our ability to compete successfully depends on a number of factors both within and outside our control, including:
• | general market and economic conditions; |
• | our ability to maintain and grow our business with our very large customers; |
• | our ability to meet the volume and service requirements of our very large customers; |
• | success in developing new products; |
• | industry consolidation, including acquisitions by our competitors; |
• | timing of our new product introductions; |
• | new product introductions by competitors; |
• | the ability of competitors to more fully leverage low cost geographies for manufacturing and/or distribution; |
• | product pricing, including the impact of currency exchange rates; |
• | effectiveness of sales and marketing resources and strategies; |
• | adequate supply of components, subassemblies and materials; |
• | efficiency of manufacturing operations; |
• | strategic relationships with our suppliers; |
• | product quality and performance; |
• | protection of our products by effective use of intellectual property laws; |
• | the financial strength of our competitors; |
• | the outcome of any future litigation or commercial dispute; |
• | barriers to entry imposed by competitors with significant market power in new markets; and, |
• | government actions throughout the world. |
There can be no assurance that we will be able to compete successfully in the future.
Research and Development
We believe that our long-term growth and success depends on delivering high quality hardware and software products on a timely basis. We focus our research and development efforts on enhancing existing products and developing new products that incorporate appropriate features and functionality to be competitive with respect to technology and price/performance characteristics.
Our research and development staff strives to build quality into our products at the design stage in an effort to reduce overall development and manufacturing costs. Our research and development staff also designs proprietary application specific integrated circuits (“ASICs”), many of which are designed for use in several of our different products. The goal of our ASIC design program is to further differentiate our products from competing products, to improve manufacturability and to reduce costs. We seek to reduce our time to market for new and enhanced products by sharing our internally developed hardware and software components across multiple products.
Our research and development expenses were $232 million, $236 million and $225 million in 2017, 2016, and 2015, respectively.
11
Intellectual Property
We rely on a combination of patent, trade secret, copyright and trademark law, contracts and technical measures to establish and protect our proprietary rights in our products. As of December 31, 2017, we held 861 U.S. patents (859 utility patents and 2 design patents) and 72 patents in foreign countries (67 patents registered in Europe, 2 patents in China, 2 patents in Japan, and 1 patent in Mexico), and had 95 patent applications pending in the U.S. and foreign countries. 249 of our issued U.S. patents are software patents related to LabVIEW, and cover fundamental aspects of the graphical programming approach used in LabVIEW. Our patents expire from 2018 to 2036. The expiration of any particular patent in the short term is not expected to have any significant negative impact on our business. No assurance can be given that our pending patent applications will result in the issuance of patents. We also own certain registered trademarks in the United States and abroad. See further discussion regarding risks associated with our patents in ITEM 1A, Risk Factors, “Our Business Depends on Our Proprietary Rights and We Have Been Subject to Intellectual Property Litigation.”
Manufacturing and Suppliers
We manufacture substantially all of our product volume at our facilities in Debrecen, Hungary and Penang, Malaysia. In 2017, our site in Malaysia produced approximately 35% of our global production and our site in Hungary produced approximately 65% of our global production. Our product manufacturing operations can be divided into four areas: electronic circuit card and module assembly; chassis and cable assembly; technical manuals and product support documentation; and software duplication. Most of our electronic circuit card assemblies, modules and chassis are manufactured in house, although contractors are used from time to time. The majority of our electronic cable assemblies are produced by contractors; however, we do manufacture some on an exception basis. Our software duplication, technical manuals and product support documentation are primarily produced by contractors.
Our manufacturing processes use large volumes of high-quality components and subassemblies supplied by outside sources. Several of these components are only available through limited sources. Limited source components purchased include custom ASICs, chassis and other components. We have in the past experienced delays and quality problems in connection with limited source components, and there can be no assurance that these problems will not recur in the future. Accordingly, our failure to receive components from limited suppliers could result in a material adverse effect on our revenues and operating results. See “Our Business is Dependent on Key Suppliers” at page 18 for additional discussion of the risks associated with limited source suppliers.
See Item 1A, Risk Factors, “Our Operations are Subject to a Variety of Environmental Regulations and Costs” at page 20 for discussion of environmental matters as they may affect our business.
Backlog
Backlog is a measure of orders that are received but that are not shipped to customers at the end of a quarter. We typically ship products shortly following the receipt of an order. Accordingly, our backlog typically represents less than 5 days sales. Backlog should not be viewed as an indicator of our future sales.
Employees
As of December 31, 2017, we had 7,412 employees worldwide. None of our employees are represented by a labor union and we have never experienced a work stoppage. We consider our employee relations to be good.
12
ITEM 1A. RISK FACTORS
In addition to the other information set forth in this Form 10-K, you should carefully consider the risk factors discussed below. The risks described below are not the only risks that we face. Additional risks and uncertainties not currently known to us or that we currently deem to be immaterial also may materially adversely affect our business, financial condition, or operating results.
We Make Significant Investments in New Products that May Not Be Successful or Achieve Expected Returns. We plan to continue to make significant investments in research, development, and marketing for new and existing products and technologies. For example, we recently launched LabVIEW NXG, the next version of our flagship software application. We have made and will continue to make significant investments in software development related to the new and enhanced features of this product. These investments involve a number of risks as the commercial success of such efforts depend on many factors, including our ability to anticipate and respond to innovation, achieve the desired technological fit, and be effective with our marketing and distribution efforts. If our existing or potential customers do not perceive our latest product offerings as providing significant new functionality or value, or if we are late to market with a new product or technology, we may not achieve our expected return on our investments or be able recover the costs expended to develop new product offerings, which could have a material adverse effect on our operating results. Even if our new products are profitable, our operating margins for new products may not be as high as the margins we have experienced historically.
Our Success Depends on New Product Introductions and Market Acceptance of Our Products. The market for our products is characterized by rapid technological change, evolving industry standards, changes in customer needs and frequent new product introductions, and is therefore highly dependent upon timely product innovation. Our success is dependent on our ability to successfully develop and introduce new and enhanced products on a timely basis to replace declining revenues from older products, and on increasing penetration in domestic and international markets. As has occurred in the past and as may be expected to occur in the future, we have experienced significant delays between the announcement and the commercial availability of new products. Any significant delay in releasing new products could have a material adverse effect on the ultimate success of a product and other related products and could impede continued sales of predecessor products, any of which could have a material adverse effect on our operating results. There can be no assurance that we will be able to introduce new products in accordance with announced release dates, that our new products will achieve market acceptance or that any such acceptance will be sustained for any significant period. Failure of our new products to achieve or sustain market acceptance could have a material adverse effect on our operating results.
Our Reported Financial Results May be Adversely Affected by Changes in Accounting Principles Generally Accepted in the U.S. We prepare our financial statements in conformity with accounting principles generally accepted in the U.S. These accounting principles are subject to interpretation by the Financial Accounting Standards Board (“FASB”) and the Securities and Exchange Commission. A change in these policies or interpretations could have a significant effect on our reported financial results and our internal controls over financial reporting, may retroactively affect previously reported results, could cause unexpected financial reporting fluctuations, and may require us to make costly changes to our operational processes and accounting systems. For example, in May 2014, the FASB issued ASU 2014-09, Revenue from Contracts with Customers which supersedes nearly all existing U.S. GAAP revenue recognition guidance and which became effective for us for our fiscal year beginning January 1, 2018. (See “Note 1 – Operations and summary of significant accounting policies” for additional discussion of the accounting changes).
We are Subject to Various Risks Associated with International Operations and Foreign Economies. Our international sales are subject to inherent risks, including, but not limited to:
• | fluctuations in foreign currencies relative to the U.S. dollar; |
• | unexpected changes to currency policy or currency restrictions in foreign jurisdictions; |
• | delays in collecting trade receivable balances from customers in developing economies; |
• | unexpected changes in regulatory requirements; |
• | fluctuations in local economies; |
• | disparate and changing employment laws in foreign jurisdictions; |
• | difficulties in staffing and managing foreign operations; |
• | costs and risks of localizing products for foreign countries; |
• | unexpected changes in regulatory requirements; |
• | government actions throughout the world; |
• | tariffs and other trade barriers; and, |
• | the burdens of complying with a wide variety of foreign laws. |
13
Moreover, there can be no assurance that our international sales will continue at existing levels or grow in accordance with our efforts to increase foreign market penetration.
In many foreign countries, particularly in those with developing economies, it is common to engage in business practices that are prohibited by U.S. regulations applicable to us such as the Foreign Corrupt Practices Act. Although we have policies and procedures designed to ensure compliance with these laws, there can be no assurance that all of our employees, contractors and agents, including those based in or from countries where practices which violate such U.S. laws may be customary, will not take actions in violation of our policies. Any violation of foreign or U.S. laws by our employees, contractors or agents, even if such violation is prohibited by our policies, could have a material adverse effect on our business. We must also comply with various import and export regulations. The application of these various regulations depends on the classification of our products which can change over time as such regulations are modified or interpreted. As a result, even if we are currently in compliance with applicable regulations, there can be no assurance that we will not have to incur additional costs or take additional compliance actions in the future. Failure to comply with these regulations could result in fines or termination of import and export privileges, which could have a material adverse effect on our operating results. Additionally, the regulatory environment in some countries is very restrictive as their governments try to protect their local economy and value of their local currency against the U.S. dollar.
Our Manufacturing Capacity, and a Substantial Majority of our Warehousing and Distribution Capacity is Located Outside of the U.S. We manufacture substantially all of our product volume at our facilities in Debrecen, Hungary and Penang, Malaysia. In order to enable timely shipment of products to our customers we maintain the substantial majority of our inventory at our international locations. In addition to being subject to the risks of maintaining such a concentration of manufacturing capacity and global inventory, these facilities and their operations are also subject to risks associated with doing business internationally, including, but not limited to:
• | the volatility of the Hungarian forint and the Malaysian ringgit relative to the U.S. dollar; |
• | changing and potentially unstable political environments; |
• | significant and frequent changes in corporate tax laws; |
• | difficulty in managing manufacturing operations in foreign countries; |
• | challenges in expanding capacity to meet increased demand; |
• | difficulty in achieving or maintaining product quality; |
• | interruption to transportation flows for delivery of components to us and finished goods to our customers; |
• | restrictive labor codes; and, |
• | increasing labor costs. |
No assurance can be given that our efforts to mitigate these risks will be successful. Any failure to effectively deal with the risks above could result in an interruption in the operations of our facilities in Hungary or Malaysia which could have a material adverse effect on our operating results.
Our centralization of inventory and distribution from a limited number of shipping points is subject to inherent risks, including:
• | burdens of complying with additional or more complex VAT and customs regulations; and, |
• | concentration of inventory increasing the risks associated with fire, natural disasters and logistics disruptions to customer order fulfillment. |
Any failure or delay in distribution from our facilities in Hungary and Malaysia could have a material adverse effect on our operating results.
Our Financial Performance is Subject to Risks Associated with Changes in the Value of the U.S. Dollar versus Local Currencies. The vast majority of our sales outside of the U.S. are denominated in local currencies, and accordingly, the U.S. dollar equivalent of these sales is affected by changes in the foreign currency exchange rates. If the local currencies in which we sell our products strengthen against the U.S. dollar, we have in the past, and in the future may need to, lower our prices in the local currency to remain competitive in our international markets. This could have a material adverse effect on our gross and net profit margins. If the local currencies in which we sell our products weaken against the U.S. dollar and if the local sales prices cannot be raised due to competitive pressures, we will experience a deterioration of our gross and net profit margins. In the past, we have noted that significant volatility in foreign currency exchange rates in the markets in which we do business has had a significant impact on the revaluation of our foreign currency denominated firm commitments, on our ability to forecast our U.S. dollar equivalent net sales and expenses and on the effectiveness of our hedging programs. In the past, these dynamics have also adversely affected our net sales growth in international markets and may pose similar challenges in the future. See “Results of Operations” in this Form 10-K for further discussion on the effect that changes in the foreign currency exchange rates have had on our operating results. See “Current business outlook” in this Form 10-K for information regarding recent business conditions.
14
Orders With a Value of Greater than One Million Dollars Expose Us to Significant Additional Business and Legal Risks that Could Have a Material Adverse Impact on our Business, Results of Operations and Financial Condition. We continue to make a concentrated effort to increase our net sales through the pursuit of orders with a value greater than $1.0 million. These types of orders expose us to significant additional business and legal risks compared to smaller orders. Our very large customers frequently require contract terms that vary substantially from our standard terms of sale. At times these orders include terms that impose critical delivery commitments and severe contractual liabilities if we fail to provide the required quantity of products at the required delivery times, impose product acceptance requirements and product performance evaluation requirements which create uncertainty with respect to the timing of our ability to recognize revenue from such orders, allow the customers to cancel or delay orders without liability, require us to develop specific product mitigation plans for product delivery constraints caused by unexpected or catastrophic situations to help assure quick production recovery, and that require most favored customer pricing, significant discounts, extended payment terms and volume rebates. At times these customers require broad indemnity obligations and large direct and consequential damage provisions in the event we breach our contracts with them. At times these contracts have supply constraint requirements which mandate that we allocate large product inventories for a specific contract. These inventory requirements expose us to higher risks of inventory obsolescence and can adversely impact our ability to provide adequate product supply to other customers.
While we attempt to limit the number of contracts that contain the non-standard terms of sale described above and attempt to contractually limit our potential liability under such contracts, we have been and expect to be required to agree to some or all of such provisions to secure orders from these customers and to continue to grow our business. These arrangements expose us to significant additional legal and operational risks which could result in a material adverse impact on our business, results of operations and financial condition. In addition, these larger orders are more volatile, are subject to greater discount variability and may contract at a faster pace during an economic downturn. We attempt to manage these risks but there can be no assurance that we will be successful in our efforts.
Revenue Derived from Large Orders Could Adversely Affect our Gross Margin and Could Lead to Greater Variability in our Quarterly Results. We define our large order business as orders with a value greater than $100,000. These orders have been and may continue to be more sensitive to changes in the global industrial economy, subject to greater discount variability and such orders may be pushed-out or reduced at a faster pace during an economic downturn compared to orders valued at less than $100,000. To the extent that the amount of our net sales derived from large orders increases in future periods, either in absolute dollars or as a percentage of our overall business, our gross margins could decline, and we could experience greater volatility and see a greater negative impact from future downturns in the global industrial economy. This dynamic may also have an impact on the historical seasonal pattern of our net sales and our results of operations. These types of orders also make managing inventory levels more difficult as we have in the past and may have to in the future build large quantities of inventory in anticipation of future demand that may not materialize.
Our Product Revenues are Dependent on Certain Industries and Contractions in these Industries Could Have a Material Adverse Effect on Our Results of Operations. Sales of our products are dependent on customers in certain industries, particularly the telecommunications, semiconductor, consumer electronics, automotive, energy, automated test equipment, defense and aerospace industries. As we have experienced in the past, and as we may continue to experience in the future, downturns characterized by diminished product demand in any one or more of these industries may result in decreased sales and a material adverse effect on our operating results. We cannot predict when and to what degree contractions in these industries may occur; however, any sharp or prolonged contraction in one or more of these industries could have a material adverse effect on our business and results of operations.
Uncertain Global Economic Conditions Could Materially Adversely Affect Our Business and Results of Operations. Our operations and performance are sensitive to fluctuations in general economic conditions, both in the U.S. and globally. Uncertainty about global and regional economic conditions poses a risk to us as businesses may postpone spending in response to tighter credit, higher unemployment, financial market volatility, government austerity programs, negative financial news, geopolitical instability, declines in income or asset values and/or other factors. Negative trends or sentiments in worldwide and regional economic conditions could have a material adverse effect on demand for our products and services. These factors as well as others we may not contemplate could have a material adverse effect on the spending patterns of businesses including our current and potential customers which could have a material adverse effect on our net sales and our results of operations. See “Current business outlook” in this Form 10-K for information regarding recent business conditions.
15
Concentrations of Credit Risk and Uncertain Conditions in the Global Financial Markets May Adversely Affect Our Business and Results of Operations. By virtue of our holdings of cash, investment securities and foreign currency derivatives, we have exposure to many different counterparties, and routinely execute transactions with counterparties in the financial services industry, including commercial banks and investment banks. Many of these transactions expose us to credit risk in the event of a default of our counterparties. We continue to monitor the stability of the financial markets, particularly those in the emerging markets. We can give no assurance that we will not be negatively impacted by any adverse outcomes in those markets. There can be no assurance that any losses or impairments to the carrying value of our financial assets as a result of defaults by our counterparties would not materially and adversely affect our business, financial position and results of operations.
We Have Established a Budget and Variations From Our Budget Will Affect Our Financial Results. We have an operating budget for 2018. Our budget was established based on the estimated revenue from sales of our products which are based on anticipated economic conditions in the markets in which we do business as well as the timing and volume of our new products and the expected penetration of both new and existing products in the marketplace. If demand for our products during 2018 is less than the demand we anticipated in setting our 2018 budget, our operating results could be negatively impacted.
If we exceed our budgeted level of expenses or if we cannot reduce expenditures in response to a decrease in net sales, our operating results could be adversely affected. Our spending could exceed our budget due to a number of factors, including, but not limited to:
• | continued foreign currency fluctuations; |
• | increased manufacturing costs resulting from component supply shortages or component price fluctuations; |
• | additional marketing costs for new product introductions or for conferences and tradeshows; |
• | the timing, cost or outcome of any future intellectual property litigation or commercial disputes; |
• | additional unanticipated costs related to acquisitions we may make; or |
• | increased component costs resulting from vendors increasing their sales prices. |
We Operate in Intensely Competitive Markets. The markets in which we operate are characterized by intense competition from numerous competitors, some of which are divisions of large corporations having far greater resources than we have, and we may face further competition from new market entrants in the future. A key competitor is Keysight Technologies Inc. (“Keysight”) which was part of Agilent until November 2014. Keysight offers hardware and software products that provide solutions that directly compete with our virtual instrumentation products including its own line of PXI based hardware. Keysight is aggressively advertising and marketing products that are competitive with our products. Because of Keysight’s strong position in the instrumentation business, changes in its marketing strategy or product offerings could have a material adverse effect on our operating results.
We believe our ability to compete successfully depends on a number of factors both within and outside our control, including, but not limited to:
• | general market and economic conditions; |
• | our ability to maintain and grow our business with our very large customers; |
• | our ability to meet the volume and service requirements of our large customers; |
• | success in developing and selling new products; |
• | industry consolidation, including acquisitions by us or our competitors; |
• | capacity utilization and the efficiency of manufacturing operations; |
• | timing of our new product introductions; |
• | new product introductions by competitors; |
• | the ability of competitors to more fully leverage low cost geographies for manufacturing or distribution; |
• | product pricing, including the impact of currency exchange rates; |
• | effectiveness of sales and marketing resources and strategies; |
• | adequate manufacturing capacity and supply of components and materials; |
• | strategic relationships with our suppliers; |
• | product quality and performance; |
• | protection of our products by effective use of intellectual property laws; |
• | the financial strength of our competitors; |
• | the outcome of any future litigation or commercial dispute; |
• | barriers to entry imposed by competitors with significant market power in new markets; and, |
• | government actions throughout the world. |
There can be no assurance that we will be able to compete successfully in the future.
16
Our Quarterly Results are Subject to Fluctuations Due to Various Factors that May Adversely Affect Our Business and Result of Operations. Our quarterly operating results have fluctuated in the past and may fluctuate significantly in the future due to a number of factors, including, but not limited to:
• | fluctuations in foreign currency exchange rates; |
• | changes in global economic conditions; |
• | changes in the amount of revenue derived from very large orders (including orders from our very large customers) and the pricing, margins, and other terms of such orders; |
• | changes in the capacity utilization including at our facility in Malaysia; |
• | changes in the mix of products sold; |
• | the availability and pricing of components from third parties (especially limited sources); |
• | the difficulty in maintaining margins, including the higher margins traditionally achieved in international sales; |
• | changes in pricing policies by us, our competitors or suppliers; |
• | the timing, cost or outcome of any future intellectual property litigation or commercial disputes; |
• | delays in product shipments caused by human error or other factors; or, |
• | disruptions in transportation channels. |
Our Revenues are Subject to Seasonal Variations. In previous years, our revenues have been characterized by seasonality, with revenues typically growing from the first quarter to the second quarter, being relatively constant from the second quarter to the third quarter, growing in the fourth quarter compared to the third quarter and declining in the first quarter of the following year from the fourth quarter of the preceding year. This historical trend has been affected and may continue to be affected in the future by broad fluctuations in the global industrial economy as well as the timing of new product introductions or any acquisitions. In addition, revenue derived from very large orders, including those from our largest customer, have had a significant impact on our historical seasonal trends as these orders may be more sensitive to changes in the global industrial economy, may be subject to greater volatility in timing and amount, greater discount variability, lower gross margins, and may contract at a faster pace during economic downturns.
Our Tax Returns and Other Tax Matters are Subject to Examination by the U.S. Internal Revenue Service and Other Tax Authorities and Governmental Bodies and the Results of These Examinations Could Have a Material Adverse Effect on Our Financial Condition. We account for uncertainty in income taxes recognized in our financial statements using prescribed recognition thresholds and measurement attributes for financial statement disclosure of tax positions taken or expected to be taken on our tax returns. These uncertain tax positions are subject to examination by the U.S. Internal Revenue Service and other tax authorities. There can be no assurance as to the outcome of any future examinations. If the ultimate determination of our taxes owed is for an amount in excess of amounts previously accrued, our operating results, cash flows, and financial condition could be materially adversely affected. Our tax years 2008 through 2017 remain open to examination by the major taxing jurisdictions to which we are subject.
Tax Law Changes in Hungary Could Have a Negative Impact on our Effective Tax Rate, Earnings and Results of Operations. The profit from our Hungarian operations benefits from the fact that it is subject to an effective income tax rate that is lower than the U.S. federal statutory tax rate. Our earnings in Hungary are subject to a statutory tax rate of 9%. In addition, effective January 1, 2010, certain qualified research and development expenses in Hungary became eligible for an enhanced tax deduction. These tax benefits may not be available in future years due to changes in political conditions in Hungary or changes in tax laws in Hungary or in the U.S. The reduction or elimination of these benefits in Hungary could result in an increase in our future effective income tax rate which could have a material adverse effect on our operating results. (See “Note 9 – Income taxes” of Notes to Consolidated Financial Statements for additional discussion regarding the impact of these matters on our income taxes).
Our Income Tax Rate could be Adversely Affected by the Expiration of a Tax Holiday in Malaysia. Profits from our manufacturing facility in Penang, Malaysia are free of tax under a 15 year tax holiday effective January 1, 2013. If we fail to satisfy the conditions of the tax holiday, this tax benefit may be terminated early. The expiration of the tax holiday in Malaysia could have a material adverse effect on our operating results. (See “Note 9 – Income taxes” of Notes to Consolidated Financial Statements for additional discussion regarding the impact of this tax holiday on our income taxes).
17
Our Business is Dependent on Key Suppliers and Distributors and Disruptions in these Businesses Could Adversely Affect our Business and Results of Operations. Our manufacturing processes use large volumes of high-quality components and subassemblies supplied by outside sources. Several of these items are only available through limited sources. Limited source items purchased include custom ASICs, chassis and other components. We have in the past experienced delays and quality problems in connection with limited source items, and there can be no assurance that these problems will not recur in the future. Accordingly, our failure to receive items from limited suppliers could result in a material adverse effect on our net sales and operating results. In the event that any of our limited source suppliers experience significant financial or operational difficulties due to adverse global economic conditions or otherwise, our business and operating results would likely be adversely impacted until we are able to secure another source for the required materials.
In some countries, we use distributors to support our sales channels. In the event that any of our distributors experience significant financial or operational difficulties due to adverse global economic conditions or if we experience disruptions in the use of these distributors, our business and operating results would likely be adversely impacted until we are able to secure another distributor or establish direct sales capabilities in the affected market.
We May Experience Component Shortages that May Adversely Affect Our Business and Result of Operations. As has occurred in the past and as may be expected to occur in the future, supply shortages of components used in our products, including limited source components, can result in significant additional costs and inefficiencies in manufacturing. If we are unsuccessful in resolving any such component shortages in a timely manner, we will experience a significant impact on the timing of revenue, a possible loss of revenue, or an increase in manufacturing costs, any of which would have a material adverse impact on our operating results.
We Rely on Management Information Systems and Interruptions in our Information Technology Systems or Cyber-Attacks on our Systems Could Adversely Affect our Business. We rely on the efficient and uninterrupted operation of complex information technology systems and networks to operate our business. We rely on a primary global center for our management information systems and on multiple systems in branches not covered by our global center. As with any information system, unforeseen issues may arise that could affect our ability to receive adequate, accurate and timely financial information, which in turn could inhibit effective and timely decisions. Furthermore, it is possible that our global center for information systems or our branch operations could experience a complete or partial shutdown. A significant system or network disruption could be the result of new system implementations, computer viruses, cyber-attacks, security breaches, facility issues or energy blackouts. Threats to our information technology security can take a variety of forms and individuals or groups of hackers or sophisticated organizations including state-sponsored organizations, may take steps that pose threats to our customers and our infrastructure. If we were to experience a shutdown, disruption or attack, it would adversely impact our product shipments and net sales, as order processing and product distribution are heavily dependent on our management information systems. Such an interruption could also result in a loss of our intellectual property or the release of sensitive competitive information or partner, customer or employee personal data. Any loss of such information could harm our competitive position, result in a loss of customer confidence, and cause us to incur significant costs to remedy the damages caused by the disruptions or security breaches. In addition, changing laws and regulations governing our responsibility to safeguard private data could result in a significant increase in operating or capital expenditures needed to comply with these new laws or regulations. Accordingly, our operating results in such periods would be adversely impacted. From time to time, we have experienced attempts to breach our security and attempts to introduce malicious software into our information technology systems; however, such attacks have not previously resulted in any material damage to us.
We are continually working to maintain reliable systems to control costs and improve our ability to deliver our products in our markets worldwide. Our efforts include, but are not limited to the following: firewalls, antivirus protection, patches, log monitors, routine backups with offsite retention of storage media, system audits, data partitioning and routine password modifications. Our internal information technology systems environment continues to evolve and our business policies and internal security controls may not keep pace as new threats emerge. No assurance can be given that our efforts to continue to enhance our systems will be successful.
We are Subject to Risks Associated with Our Website. We devote significant resources to maintaining our website, ni.com, as a key marketing, sales and support tool and expect to continue to do so in the future. Failure to properly maintain our website may interrupt normal operations, including our ability to provide quotes, process orders, ship products, provide services and support to our customers, bill and track our customers, fulfill contractual obligations and otherwise run our business, which would have a material adverse effect on our results of operations. We host our website internally. Any failure to successfully maintain our website or any significant downtime or outages affecting our website could have a material adverse impact on our operating results.
18
Our Products are Complex and May Contain Bugs or Errors. As has occurred in the past and as may be expected to occur in the future, our software products or third-party operating systems on which our products are based often contain bugs or errors. Our products operate in conjunction with third-party products and components across a broad ecosystem. As has occurred in the past and as may be expected to occur in the future, our products, or products or components in conjunction with which they operate, may contain design flaws. These flaws, or fixes to these flaws, may have a negative impact on the performance of our products, which could result in additional costs, liability claims, reduced revenue, or harm to our reputation or competitive position, any of which could have a material adverse impact on our operating results.
We Are Subject to the Risk of Product Liability Claims. Our products are designed to provide information upon which users may rely. Our products are also used in “real time” applications requiring extremely rapid and continuous processing and constant feedback. Such applications give rise to the risk that a failure or interruption of the system or application could result in economic damage, bodily harm or property damage. We attempt to assure the quality and accuracy of the processes contained in our products, and to limit our product liability exposure through contractual limitations on liability, limited warranties, express disclaimers and warnings as well as disclaimers contained in our “shrink wrap” and electronically displayed license agreements with end-users. If our products contain errors that produce incorrect results on which users rely or cause failure or interruption of systems or processes, customer acceptance of our products could be adversely affected. Further, we could be subject to liability claims that could have a material adverse effect on our operating results or financial position. Although we maintain liability insurance for product liability matters, there can be no assurance that such insurance or the contractual limitations used by us to limit our liability will be sufficient to cover or limit any claims which may occur.
Our Acquisitions are Subject to a Number of Related Costs and Challenges that Could Have a Material Adverse Effect on Our Business and Results of Operations. In recent years, we have completed several acquisitions. Achieving the anticipated benefits of an acquisition depends upon whether the integration of the acquired business, products or technology is accomplished efficiently and effectively. In addition, successful acquisitions generally require, among other things, integration of product offerings, manufacturing operations and coordination of sales and marketing and R&D efforts. These difficulties can become more challenging due to the need to coordinate geographically separated organizations, the complexities of the technologies being integrated, and the necessities of integrating personnel with disparate business backgrounds and combining different corporate cultures. The integration of operations following an acquisition also requires the dedication of management resources, which may distract attention from our day-to-day business and may disrupt key R&D, marketing or sales efforts. Our inability to successfully integrate any of our acquisitions could harm our business. The existing products previously sold by entities we have acquired may be of a lesser quality than our products or could contain errors that produce incorrect results on which users rely or cause failure or interruption of systems or processes that could subject us to liability claims that could have a material adverse effect on our operating results or financial position. Furthermore, products acquired in connection with acquisitions may not gain acceptance in our markets, and we may not achieve the anticipated or desired benefits of such transactions.
Compliance With Sections 302 and 404 of the Sarbanes-Oxley Act of 2002 is Costly and Challenging. As required by Section 302 of the Sarbanes-Oxley Act of 2002, this Form 10-K contains our management’s certification of adequate disclosure controls and procedures as of December 31, 2017. This annual report on Form 10-K also contains a report by our management on our internal control over financial reporting including an assessment of the effectiveness of our internal control over financial reporting as of December 31, 2017 and an attestation and report by our external auditors with respect to the effectiveness of our internal control over financial reporting under Section 404. While these assessments and reports did not reveal any material weaknesses in our internal control over financial reporting, compliance with Sections 302 and 404 is required for each future fiscal year end. We expect that the ongoing compliance with Sections 302 and 404 will continue to be both very costly and very challenging and there can be no assurance that material weaknesses will not be identified in future periods. Any adverse results from such ongoing compliance efforts could result in a loss of investor confidence in our financial reports and have an adverse effect on our stock price.
Our Business Depends on Our Proprietary Rights and We Have Been Subject to Intellectual Property Litigation. Our success depends on our ability to obtain and maintain patents and other proprietary rights relative to the technologies used in our principal products. Despite our efforts to protect our proprietary rights, unauthorized parties may have in the past infringed or violated certain of our intellectual property rights. We from time to time engage in litigation to protect our intellectual property rights. In monitoring and policing our intellectual property rights, we have been and may be required to spend significant resources. We from time to time may be notified that we are infringing certain patent or intellectual property rights of others. There can be no assurance that any future intellectual property dispute or litigation will not result in significant expense, liability, injunction against the sale of some of our products, and a diversion of management’s attention, any of which may have a material adverse effect on our operating results.
19
Our Business Depends on the Continued Service of Our Key Management and Technical Personnel. Our success depends upon the continued contributions of our key management, sales, marketing, research and development and operational personnel including Alex Davern, our President and Chief Executive Officer, and other members of our senior management and key technical personnel. In connection with his promotion to Chief Executive Officer in January 2017, we entered into an employment agreement with Mr. Davern. We have no other agreements providing for the employment of any of our key employees for any fixed term and our key employees may voluntarily terminate their employment with us at any time. The loss of the services of one or more of our key employees in the future could have a material adverse effect on our operating results. We also believe our future success will depend upon our ability to attract and retain additional highly skilled management, technical, marketing, research and development, and operational personnel with experience in managing large and rapidly changing companies, as well as training, motivating and supervising employees. The market for hiring and retaining certain technical personnel, including software engineers, has become more competitive and intense in recent years. Failure to attract and retain a sufficient number of qualified technical personnel, including software engineers or retain our key personnel could have a material adverse effect on our operating results.
Our Operations are Subject to a Variety of Environmental Regulations and Costs that May Have a Material Adverse Effect on our Business and Results of our Operations. We must comply with many different governmental regulations related to the use, storage, discharge and disposal of toxic, volatile or otherwise hazardous chemicals used in our operations in the U.S., Hungary, and Malaysia. Although we believe that our activities conform to presently applicable environmental regulations, our failure to comply with present or future regulations could result in the imposition of fines, suspension of production or a cessation of operations. Any such environmental regulations could require us to acquire costly equipment or to incur other significant expenses to comply with such regulations. Any failure by us to control the use of or adequately restrict the discharge of hazardous substances could subject us to future liabilities.
Provisions in Our Charter Documents and Delaware Law May Delay or Prevent an Acquisition of Us. Our certificate of incorporation and bylaws and Delaware law contain provisions that could make it more difficult for a third party to acquire us without the consent of our Board of Directors. These provisions include a classified Board of Directors, prohibition of stockholder action by written consent, prohibition of stockholders to call special meetings and the requirement that the holders of at least 80% of our shares approve any business combination not otherwise approved by two-thirds of our Board of Directors. Delaware law also imposes some restrictions on mergers and other business combinations between us and any holder of 15% or more of our outstanding common stock. In addition, our Board of Directors has the right to issue preferred stock without stockholder approval, which could be used to dilute the stock ownership of a potential hostile acquirer.
20
ITEM 1B. UNRESOLVED STAFF COMMENTS
None.
ITEM 2. PROPERTIES
We own approximately 145 acres of land in the Austin, Texas area. Our principal corporate and research and development activities are conducted in three buildings we own in Austin, Texas; 232,000 square foot and 140,000 square foot office facilities, and a 380,000 square foot research and development facility. We also own a 136,000 square foot office building in Austin, Texas which is being leased to third parties.
Our principal manufacturing activities are conducted in Debrecen, Hungary and Penang, Malaysia. We own a 306,000 square foot manufacturing, distribution and general and administrative facility in Debrecen, Hungary and a 314,000 square foot manufacturing, research and development, and general and administrative facility in Penang, Malaysia. In total, we hold a 99 year lease on approximately 23 acres of land comprised of two tracts in an industrial park in Penang, Malaysia.
Our German subsidiary, National Instruments Engineering GmbH & Co. KG, owns a 25,500 square foot office building in Aachen, Germany in which a majority of its activities are conducted. National Instruments Engineering owns another 19,375 square foot office building in Aachen, Germany, which is partially leased to third-parties. National Instruments Corporation (UK) Limited, United Kingdom, owns a 29,270 square foot office building in Newbury, UK.
As of December 31, 2017, we also leased a number of sales and support offices in the U.S. and various countries throughout the world. We believe our existing facilities are adequate to meet our current requirements.
ITEM 3. LEGAL PROCEEDINGS
We are not currently a party to any material litigation. However, in the ordinary course of our business, we are involved in a limited number of legal actions, both as plaintiff and defendant, and could incur uninsured liability in any one or more of them. We also periodically receive notifications from various third parties related to alleged infringement of patents or intellectual property rights, commercial disputes or other matters. No assurances can be given with respect to the extent or outcome of any future litigation or dispute.
ITEM 4. MINE SAFETY DISCLOSURES
Not applicable.
21
PART II
ITEM 5. MARKET FOR THE REGISTRANT’S COMMON EQUITY, RELATED STOCKHOLDER MATTERS AND ISSUER PURCHASES OF EQUITY SECURITIES
Our common stock began trading on The NASDAQ Stock Market under the symbol NATI effective March 13, 1995. The high and low closing prices for our common stock, as reported by Nasdaq for the two most recent fiscal years, are as indicated in the following table:
| High | Low | ||||||
2017 | ||||||||
First Quarter 2017 | $ | 32.81 | $ | 30.37 | ||||
Second Quarter 2017 | 40.35 | 31.79 | ||||||
Third Quarter 2017 | 43.50 | 38.87 | ||||||
Fourth Quarter 2017 | 45.88 | 41.53 | ||||||
| ||||||||
2016 | ||||||||
First Quarter 2016 | $ | 30.26 | $ | 26.89 | ||||
Second Quarter 2016 | 30.13 | 25.94 | ||||||
Third Quarter 2016 | 29.46 | 26.92 | ||||||
Fourth Quarter 2016 | 31.08 | 27.20 | ||||||
At the close of business on February 9, 2018, there were approximately 333 holders of record of our common stock and approximately 36,704 beneficial holders of our common stock.
We believe factors such as quarterly fluctuations in our results of operations, announcements by us or our competitors, changes in earnings estimates by analysts or changes in our financial guidance, technological innovations, new product introductions, governmental regulations, actions, or litigation, may cause the market price of our common stock to fluctuate, perhaps substantially. In addition, stock prices for many technology companies fluctuate widely for reasons that may be unrelated to their operating results. These broad market and industry fluctuations may adversely affect the market price of our common stock.
Our cash dividend payments for the two most recent fiscal years, on a per share basis, are indicated in the following table. The dividends were paid on the dates set forth below:
| Dividend Amount | ||
2017 | |||
March 6, 2017 | $ | 0.21 | |
June 5, 2017 | $ | 0.21 | |
September 5, 2017 | $ | 0.21 | |
December 4, 2017 | $ | 0.21 | |
| |||
2016 | |||
March 7, 2016 | $ | 0.20 | |
June 6, 2016 | $ | 0.20 | |
September 6, 2016 | $ | 0.20 | |
December 5, 2016 | $ | 0.20 | |
Our policy as to whether any future dividends will be paid, and if so, the amount, will be based on, among other considerations, our balance of available cash, our ability to obtain external financing through our line of credit, or by selling equity or debt securities to the public or to selected investors, our views on changes in tax rates applied to dividend income, potential future capital requirements related to research and development, expansion into new market areas, strategic investments and business acquisitions, share dilution management, legal risks, and challenges to our business model. Future dividends are subject to approval and declaration by our Board of Directors.
On January 24, 2018, our Board of Directors declared a quarterly cash dividend of $0.23 per common share, payable on March 5, 2018, to stockholders of record on February 12, 2018.
22
See Item 12 for information regarding securities authorized for issuance under our equity compensation plans.
Performance Graph
The following graph compares the cumulative total return to holders of NI’s common stock from December 31, 2012 to December 31, 2017 to the cumulative return over such period of the (i) Nasdaq Composite Index, (ii) Russell 2000 Index, and (iii) Russell 2500 Index. We previously used the Russell 2000 Index in our performance graph due to the fact that we were not been able to identify a published industry or line of business index that we believed appropriately reflected our industry or line of business. Due to the increasing size of our market capitalization, we determined that the Russell 2500 Index is a more appropriate benchmark than the Russell 2000 index as the average market capitalization is the closest in the Russell family of indices to our market capitalization as of December 31, 2017. In accordance with SEC requirements, we are including both indices during this transitional year.
We considered that some of our primary competitors are or were divisions of large corporations that have other significant business operations such that any index comprised of such competitors would not be reflective of our industry or line of business. We have also considered using a peer group index but do not believe such index is appropriate as we have not been able to identify a sufficient number of public companies with multiple years of trading history as a standalone company that we believe are principally in the same line of business as we are.
The graph assumes that $100 was invested on December 31, 2012 in NI’s common stock and in each of the other three indices and the reinvestment of all dividends, if any. Stockholders are cautioned against drawing any conclusions from the data contained therein, as past results are not necessarily indicative of future performance.
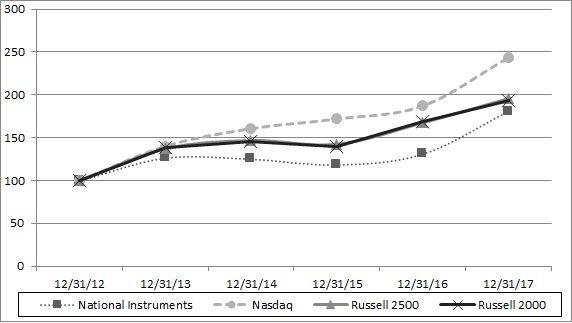
12/31/2012 | 12/31/2013 | 12/31/2014 | 12/31/2015 | 12/31/2016 | 12/31/2017 | |||||||
National Instruments | 100 | 126 | 125 | 119 | 131 | 181 | ||||||
Nasdaq | 100 | 140 | 161 | 172 | 187 | 244 | ||||||
Russell 2500 | 100 | 137 | 147 | 142 | 167 | 195 | ||||||
Russell 2000 | 100 | 139 | 146 | 139 | 169 | 193 | ||||||
23
The information contained in the Performance Graph shall not be deemed to be “soliciting material” or to be “filed” with the SEC, nor shall such information be incorporated by reference into any future filing under the Securities Act of 1933, as amended (the “Securities Act”), or the Exchange Act, except to the extent that NI specifically incorporates it by reference into any such filing. The graph is presented in accordance with SEC requirements.
Issuer Purchase of Equity Securities
Period | Total number of shares purchased | Average price paid per share | Total number of shares purchased as part of publicly announced plans or programs | Maximum number of shares that may yet be purchased under the plans or programs (1) | |||||
October 1, 2017 to October 31, 2017 | - | - | - | 1,134,247 | |||||
November 1, 2017 to November 30, 2017 | - | - | - | 1,134,247 | |||||
December 1, 2017 to December 31, 2017 | - | - | - | 1,134,247 | |||||
Total | - | - | - | 1,134,247 | |||||
(1) For the past several years, we have maintained various stock repurchase programs. At December 31, 2017, there were 1,134,247 shares available for repurchase under the plan approved on April 21, 2010. This repurchase plan does not have an expiration date.
Unregistered Sales of Equity Securities
None.
24
ITEM 6. SELECTED CONSOLIDATED FINANCIAL DATA
The following selected consolidated financial data should be read in conjunction with our consolidated financial statements, including the Notes to Consolidated Financial Statements contained in this Form 10-K. The information set forth below is not necessarily indicative of the results of our future operations. The information should be read in conjunction with “Management’s Discussion and Analysis of Financial Condition and Results of Operations.”
| For the years ended December 31, | |||||||||||||||||||
| (in thousands, except per share data) | |||||||||||||||||||
| 2017 | 2016 | 2015 | 2014 | 2013 | |||||||||||||||
Statements of Income Data: | ||||||||||||||||||||
Net sales: | ||||||||||||||||||||
Americas | $ | 504,626 | $ | 482,039 | $ | 496,746 | $ | 495,951 | $ | 483,603 | ||||||||||
EMEIA | 408,625 | 389,843 | 409,119 | 412,401 | 390,301 | |||||||||||||||
APAC | 376,135 | 356,297 | 319,591 | 335,510 | 298,654 | |||||||||||||||
Consolidated net sales | 1,289,386 | 1,228,179 | 1,225,456 | 1,243,862 | 1,172,558 | |||||||||||||||
Cost of sales: | 328,324 | 313,121 | 316,956 | 318,132 | 305,243 | |||||||||||||||
Gross profit | 961,062 | 915,058 | 908,500 | 925,730 | 867,315 | |||||||||||||||
Operating expenses: | ||||||||||||||||||||
Sales and marketing | 477,921 | 461,236 | 452,262 | 461,845 | 447,800 | |||||||||||||||
Research and development | 231,761 | 235,706 | 225,131 | 227,433 | 234,796 | |||||||||||||||
General and administrative | 105,602 | 98,390 | 93,935 | 91,265 | 87,418 | |||||||||||||||
Acquisition related adjustment | — | — | — | — | (1,316 | ) | ||||||||||||||
Total operating expenses | 815,284 | 795,332 | 771,328 | 780,543 | 768,698 | |||||||||||||||
Operating income | 145,778 | 119,726 | 137,172 | 145,187 | 98,617 | |||||||||||||||
Other income (expense): | ||||||||||||||||||||
Interest income | 2,276 | 1,122 | 1,403 | 1,133 | 679 | |||||||||||||||
Net foreign exchange gain (loss) | 892 | (4,632 | ) | (7,075 | ) | (2,250 | ) | (2,578 | ) | |||||||||||
Other (expense) income, net | (1,566 | ) | (1,581 | ) | (221 | ) | (69 | ) | 450 | |||||||||||
Income before income taxes | 147,380 | 114,635 | 131,279 | 144,001 | 97,168 | |||||||||||||||
Provision for income taxes | 94,969 | 31,901 | 36,017 | 17,668 | 16,655 | |||||||||||||||
Net income | $ | 52,411 | $ | 82,734 | $ | 95,262 | $ | 126,333 | $ | 80,513 | ||||||||||
| ||||||||||||||||||||
Basic earnings per share | $ | 0.40 | $ | 0.64 | $ | 0.74 | $ | 0.99 | $ | 0.65 | ||||||||||
| ||||||||||||||||||||
Weighted average shares outstanding - basic | 130,300 | 128,453 | 127,997 | 127,030 | 124,558 | |||||||||||||||
| ||||||||||||||||||||
Diluted earnings per share | $ | 0.40 | $ | 0.64 | $ | 0.74 | $ | 0.99 | $ | 0.64 | ||||||||||
| ||||||||||||||||||||
Weighted average shares outstanding - diluted | 131,387 | 129,008 | 128,668 | 127,997 | 125,571 | |||||||||||||||
| ||||||||||||||||||||
Cash dividends declared per common share | $ | 0.84 | $ | 0.80 | $ | 0.76 | $ | 0.60 | $ | 0.56 | ||||||||||
25
| December 31, | |||||||||||||||||||
| (in thousands) | |||||||||||||||||||
| 2017 | 2016 | 2015 | 2014 | 2013 | |||||||||||||||
Balance Sheet Data: | ||||||||||||||||||||
Cash and cash equivalents | $ | 290,164 | $ | 285,283 | $ | 251,129 | $ | 274,030 | $ | 230,263 | ||||||||||
Short-term investments | 121,888 | 73,117 | 81,789 | 197,163 | 163,149 | |||||||||||||||
Working capital (1) | 624,835 | 574,572 | 559,525 | 700,163 | 603,240 | |||||||||||||||
Total assets | 1,566,434 | 1,496,564 | 1,453,856 | 1,455,491 | 1,343,551 | |||||||||||||||
Long-term debt, net of current portion | — | 25,000 | 37,000 | — | — | |||||||||||||||
Total stockholders' equity | 1,128,021 | 1,114,219 | 1,081,721 | 1,117,496 | 1,023,084 | |||||||||||||||
| ||||||||||||||||||||
(1) Effective December 31, 2015, our working capital includes the effects of the adoption of ASU No. 2015-17, Balance Sheet Classification of Deferred Taxes, requiring all deferred tax assets and liabilities and any related valuation allowance to be classified as non-current on our Consolidated Balance Sheets. Prior periods were not retrospectively adjusted. | ||||||||||||||||||||
26
ITEM 7. MANAGEMENT’S DISCUSSION AND ANALYSIS OF FINANCIAL CONDITION AND RESULTS OF OPERATIONS
The following “Management’s Discussion and Analysis of Financial Condition and Results of Operations” contains forward-looking statements within the meaning of Section 27A of the Securities Act and Section 21E of the Exchange Act. Any statements contained herein regarding our future financial performance, operations, or other activities (including, without limitation, statements to the effect that we “believe,” “expect,” “plan,”, ''intend to”,“may,” “will,” “project,” “anticipate”, “continue,” or “estimate” or other variations thereof or comparable terminology or the negative thereof) should be considered forward-looking statements. Actual results could differ materially from those projected in the forward-looking statements as a result of a number of important factors including those set forth under the heading “Risk Factors” beginning on page 13, and elsewhere in this Form 10-K. Although we believe that the expectations reflected in the forward-looking statements are reasonable, we cannot guarantee future results, levels of activity, performance or achievements. You should not place undue reliance on these forward-looking statements. We disclaim any obligation to update information contained in any forward-looking statement.
Overview
We design, manufacture and sell tools to engineers and scientists that accelerate productivity, innovation and discovery. Our platform-based approach to engineering provides an integrated software and hardware platform that speeds the development of systems needing measurement and control. We believe our long-term vision and focus on technology supports the success of our customers, employees, partners, suppliers and stockholders. We sell to a large number of customers in a wide variety of industries. We have been profitable in every year since 1990. No single customer accounted for more than 3% of our sales in each of the years ended 2017, 2016, and 2015.
The key strategies that we focus on in running our business are the following:
Expanding our broad customer base
We strive to increase our already broad customer base and to grow our large order business by serving a large market on many computer platforms, through a global marketing and distribution network. We also seek to acquire new technologies and expertise from time to time to open new opportunities for our existing product portfolio.
Maintaining a high level of customer satisfaction
To maintain a high level of customer satisfaction we strive to offer innovative, modular and integrated products through a global sales and support network. We strive to maintain a high degree of backwards compatibility across different platforms to preserve the customer’s investment in our products. In this time of intense global competition, we believe it is crucial that we continue to offer products with high quality and reliability, and that our products provide cost-effective solutions for our customers.
Leveraging external and internal technology
Our product strategy is to provide superior products by leveraging generally available technology, supporting open architectures on multiple platforms and by leveraging our core technologies such as custom ASICs across multiple products.
We sell into test and measurement and industrial/embedded applications in a broad range of industries and are subject to the economic and industry forces that drive those markets. It has been our experience that the performance of these industries and our performance are impacted by general trends in industrial production for the global economy and by the specific performance of certain vertical markets that are intensive consumers of measurement technologies. Examples of these markets are advanced research, automotive, automated test equipment, consumer electronics, commercial aerospace, computers and electronics, continuous process manufacturing, education, government/defense, medical research/pharmaceutical, power/energy, semiconductors, and telecommunications.
Leveraging a worldwide sales, distribution and manufacturing network
We distribute and sell our software and hardware products primarily through a direct sales organization. We also use independent distributors, OEMs, VARs, system integrators and consultants to market and sell our products. We have sales offices in the U.S. and sales offices and distributors in key international markets. Sales outside of the Americas accounted for approximately 61% of our revenues in each of 2017 and 2016 and 59% of our revenues in 2015. The vast majority of our foreign sales are denominated in the customers’ local currency, which exposes us to the effects of changes in foreign currency exchange rates. We expect that a significant portion of our total revenues will continue to be derived from international sales. (See Note 13 – Segment and geographic information of Notes to Consolidated Financial Statements for details concerning the geographic breakdown of our net sales and long-lived assets).
27
We manufacture substantially all of our product volume at our facilities in Debrecen, Hungary and Penang, Malaysia. In 2017, our site in Malaysia produced approximately 35% of our global production and our site in Hungary produced 65% of our global production. Our product manufacturing operations can be divided into four areas: electronic circuit card and module assembly; chassis and cable assembly; technical manuals and product support documentation; and software duplication. Most of our electronic circuit card assemblies, modules and chassis are manufactured in house, although contractors are used from time to time. The majority of our electronic cable assemblies are produced by contractors; however, we do manufacture some on an exception basis. Our software duplication, technical manuals and product support documentation are primarily produced by contractors.
Delivering high quality, reliable products
We believe that our long-term growth and success depend on delivering high quality software and hardware products on a timely basis. Accordingly, we focus significant efforts on research and development. We focus our research and development efforts on enhancing existing products and developing new products that incorporate appropriate features and functionality to be competitive with respect to technology, price and performance. Our success also depends on our ability to obtain and maintain patents and other proprietary rights related to technologies used in our products. We have engaged in litigation and where necessary, will likely engage in future litigation to protect our intellectual property rights. In monitoring and policing our intellectual property rights, we have been and may be required to spend significant resources.
Our operating results fluctuate from period to period due to changes in global economic conditions and a number of other factors. As a result, we believe our historical results of operations should not be relied upon as indications of future performance. There can be no assurance that our net sales will grow or that we will remain profitable in future periods.
Current business outlook
Many of the industries we serve have historically been cyclical and have experienced periodic downturns. In assessing our business, we consider the trends in the Global Purchasing Managers’ Index (“PMI”), global industrial production as well as industry reports on the specific vertical industries that we target. In the three month period ended December 31, 2017, the average of the PMI was 54.0 and the average of the new order element of the PMI was 55.1, both indicating accelerating expansion. For January 2018, the most recent PMI reading was 54.4, slightly above the most recent quarterly average and consistent with the December 2017 reading of 54.5. For January 2018, the new order element of the PMI was 55.4, also above the most recent quarterly average. During the three month period ended December 31, 2017, the PMI in the U.S. and the Eurozone maintained readings above 50. We are unable to predict whether the industrial economy, as measured by the PMI, will remain above the neutral reading of 50, strengthen or contract during 2018.
During 2017, we saw broad based improvement in the industrial economy. We saw revenue growth across most of our product lines and across most geographies where we do business. During 2017, we saw a minor impact on our results of operations from currency fluctuations. During early 2018, we are seeing significant appreciation of the value of the local currency against the U.S. dollar in many of the currency markets where we do business, particularly the Euro and Chinese yuan. In addition, the broad based strength of the overall industrial economy and the PMI are encouraging. We are optimistic about our long-term position in the industry through the sustained differentiation we deliver to our customers through our platform-based approach.
We delivered record revenue for 2017 while improving our operating profitability compared to 2016. During 2017, we took steps to reduce our overall employee headcount by approximately 2% in an effort to improve efficiencies and rebalance our resources on higher return activities. We incurred $12 million in severance and other restructuring-related charges, net of tax.
28
Results of Operations
The following table sets forth, for the periods indicated, the percentage of net sales represented by geographic region and by certain items reflected in our Consolidated Statements of Income:
| Years ended December 31, | ||||||||
| 2017 | 2016 | 2015 | ||||||
Net sales: | |||||||||
Americas | 39.1 | % | 39.2 | % | 40.5 | % | |||
EMEIA | 31.7 | 31.7 | 33.4 | ||||||
APAC | 29.2 | 29.1 | 26.1 | ||||||
Consolidated net sales | 100.0 | 100.0 | 100.0 | ||||||
Cost of sales | 25.5 | 25.5 | 25.9 | ||||||
Gross profit | 74.5 | 74.5 | 74.1 | ||||||
Operating expenses: | |||||||||
Sales and marketing | 37.1 | 37.6 | 36.9 | ||||||
Research and development | 18.0 | 19.2 | 18.4 | ||||||
General and administrative | 8.2 | 8.0 | 7.6 | ||||||
Total operating expenses | 63.3 | 64.8 | 62.9 | ||||||
Operating income | 11.3 | 9.7 | 11.2 | ||||||
Other income (expense): | |||||||||
Interest income | 0.2 | 0.1 | 0.1 | ||||||
Net foreign exchange gain (loss) | 0.1 | (0.4 | ) | (0.6 | ) | ||||
Other expense, net | (0.1 | ) | (0.1 | ) | — | ||||
Income before income taxes | 11.4 | 9.3 | 10.7 | ||||||
Provision for income taxes | 7.4 | 2.6 | 2.9 | ||||||
Net income | 4.1 | % | 6.7 | % | 7.8 | % | |||
Figures may not sum due to rounding.
Results of Operations for the years ended December 31, 2017, 2016, and 2015
Net Sales. The following table sets forth our net sales for the years ended December 31, 2017, 2016, and 2015 along with the changes between the corresponding periods.
| Years ended December 31, | |||||||||||||||
| ||||||||||||||||
($ in millions) | 2017 | Change | 2016 | Change | 2015 | |||||||||||
| ||||||||||||||||
Product sales | $ | 1,173.5 | 5.1% | $ | 1,116.7 | 0.3% | $ | 1,113.6 | ||||||||
Software maintenance sales | 115.9 | 3.9% | 111.5 | (0.4)% | 111.9 | |||||||||||
Total net sales | $ | 1,289.4 | 5.0% | $ | 1,228.2 | 0.2% | $ | 1,225.5 | ||||||||
In 2017, product and software maintenance sales increased compared to 2016. The increase in product sales during 2017 is attributable to increased sales volume, particularly for large orders greater than $20,000, across all geographic regions. The increase in our large orders is discussed in more detail below. The increase in software maintenance sales during 2017 can primarily be attributed to increases in the annual renewal rate for our software maintenance arrangements. In 2016 product and software maintenance sales were relatively flat compared to 2015.
We do not typically maintain a large amount of order backlog as orders typically translate to sales quickly. As such, any weakness in orders typically has a pronounced impact on our net sales in the short term.
29
Large orders, defined as orders with a value greater than $100,000, increased by 15% year over year during 2017 compared to a year over year increase of 7% in 2016. Large orders were 25%, 23%, and 23% of our total orders for the years ended December 31, 2017, 2016, and 2015, respectively. Larger orders are more volatile, are subject to greater discount variability and may contract at a faster pace during an economic downturn. A significant factor in the continued expansion of our large orders in the twelve months ended December 31, 2017, compared to the comparable period in 2016 was strong demand for our automated test products, 5G prototyping solutions and semiconductor test systems.
During 2017, we received new orders totaling $29 million from our largest customer and recognized $28 million in revenue related to orders from this customer. During 2016, we received $32 million in new orders from our largest customer and recognized net revenue of $34 million related to orders from this customer.
The following table sets forth our net sales by geographic region for the years ended December 31, 2017, 2016, and 2015 along with the changes between the corresponding periods and the region’s percentage of total net sales.
| Years ended December 31, | |||||||||||||||
| ||||||||||||||||
($ in millions) | 2017 | Change | 2016 | Change | 2015 | |||||||||||
| ||||||||||||||||
Americas | $ | 504.6 | 4.7% | $ | 482.1 | (3.0)% | $ | 496.8 | ||||||||
Percentage of total net sales | 39 | % | 39 | % | 41 | % | ||||||||||
| ||||||||||||||||
EMEIA | $ | 408.6 | 4.8% | $ | 389.8 | (4.7)% | $ | 409.1 | ||||||||
Percentage of total net sales | 32 | % | 32 | % | 33 | % | ||||||||||
| ||||||||||||||||
APAC | $ | 376.1 | 5.6% | $ | 356.3 | 11.5% | $ | 319.6 | ||||||||
Percentage of total net sales | 29 | % | 29 | % | 26 | % | ||||||||||
We expect sales outside of the Americas to continue to represent a significant portion of our revenue. We intend to continue to expand our international operations by increasing our presence in existing markets, adding a presence in some new geographical markets and continuing the use of distributors to sell our products in some countries.
Almost all of the sales made by our direct sales offices in the Americas (excluding the U.S.), EMEIA, and APAC are denominated in local currencies, and accordingly, the U.S. dollar equivalent of these sales is affected by changes in foreign currency exchange rates. In order to provide a framework for assessing how our underlying business performed excluding the effects of foreign currency fluctuations between periods, we compare the percentage change in our results from period to period using constant currency calculations. To calculate the change in constant currency, current and comparative prior period results for entities reporting in currencies other than U.S. Dollars are converted into U.S. Dollars at constant exchange rates (i.e. the average rates in effect during the years ended December 31, 2016 and 2015, respectively). The following tables present this information, along with the impact of changes in foreign currency exchange rates on sales denominated in local currencies, for the years ended December 31, 2017 and 2016, respectively.
| Year Ended December 31, 2016 | Change in Constant Dollars | Impact of changes in foreign currency exchange rates on net sales | Year Ended December 31, 2017 | ||||||||||||||||
($ In millions) | GAAP Net Sales | Dollars | Percentage | Dollars | Percentage | GAAP Net Sales | ||||||||||||||
| ||||||||||||||||||||
Americas | $ | 482.1 | $ | 22.2 | 4.6% | $ | 0.3 | 0.1% | $ | 504.6 | ||||||||||
EMEIA | 389.8 | 20.0 | 5.1% | (1.2 | ) | (0.3)% | 408.6 | |||||||||||||
APAC | 356.3 | 20.7 | 5.8% | (0.9 | ) | (0.2)% | 376.1 | |||||||||||||
Total net sales | $ | 1,228.2 | $ | 62.9 | 5.1% | $ | (1.8 | ) | (0.1)% | $ | 1,289.4 | |||||||||
Figures may not sum due to rounding.
30
| Year Ended December 31, 2015 | Change in Constant Dollars | Impact of changes in foreign currency exchange rates on net sales | Year Ended December 31, 2016 | ||||||||||||||||
($ In millions) | GAAP Net Sales | Dollars | Percentage | Dollars | Percentage | GAAP Net Sales | ||||||||||||||
| ||||||||||||||||||||
Americas | $ | 496.8 | $ | (11.2 | ) | (2.3)% | $ | (3.5 | ) | (0.7)% | $ | 482.1 | ||||||||
EMEIA | 409.1 | 10.2 | 2.5% | (29.5 | ) | (7.2)% | 389.8 | |||||||||||||
APAC | 319.6 | 44.6 | 14.0% | (7.9 | ) | (2.5)% | 356.3 | |||||||||||||
Total net sales | $ | 1,225.5 | $ | 43.6 | 3.6% | $ | (40.9 | ) | (3.3)% | $ | 1,228.2 | |||||||||
To help protect against changes in the U.S. dollar equivalent value caused by fluctuations in foreign currency exchange rates of forecasted foreign currency cash flows resulting from international sales, we hedge portions of our forecasted revenue denominated in foreign currencies with average rate forward contracts. (See Note 4 - Derivative instruments and hedging activities of Notes to Consolidated Financial Statements for further discussion regarding our cash flow hedging program and its related impact on our consolidated sales for 2017 and 2016).
Gross Profit. The following table sets forth our gross profit and gross profit as a percentage of net sales for the years ended December 31, 2017, 2016, and 2015 along with the percentage changes in gross profit for the corresponding periods. We continue to focus on cost control and cost reduction measures throughout our manufacturing cycle.
| Years Ended December 31, | |||||||||||||||
($ in millions) | 2017 | Change | 2016 | Change | 2015 | |||||||||||
| ||||||||||||||||
Gross Profit | $ | 961.1 | 5.0% | $ | 915.1 | 0.7% | $ | 908.5 | ||||||||
Gross Profit as a percentage of net sales | 74.5 | % | 74.5 | % | 74.1 | % | ||||||||||
During the years ended December 31, 2017 and 2016, the change in exchange rates had the effect of decreasing our cost of sales by $0.8 million and $3.0 million, respectively. To help protect against changes in our cost of sales caused by a fluctuation in foreign currency exchange rates of forecasted foreign currency cash flows, we hedge portions of our forecasted costs of sales denominated in foreign currencies with average rate forward contracts. During the year ended December 31, 2017 and 2016, these hedges had the effect of increasing our cost of sales by $1.2 million and $1.9 million, respectively. (See Note 4 - Derivative instruments and hedging activities of Notes to Consolidated Financial Statements for further discussion regarding our cash flow hedging program and its related impacted on our consolidated sales for 2017 and 2016).
31
Operating Expenses. The following table sets forth our operating expenses for the years ended December 31, 2017, 2016, and 2015 along with the percentage changes between the corresponding periods and the line item as a percentage of total net sales.
| Years Ended December 31, | |||||||||||||||
($ in thousands) | 2017 | Change | 2016 | Change | 2015 | |||||||||||
| ||||||||||||||||
Sales and marketing | $ | 477,921 | 4% | $ | 461,236 | 2% | $ | 452,262 | ||||||||
Percentage of total net sales | 37 | % | 38 | % | 37 | % | ||||||||||
| ||||||||||||||||
Research and development | $ | 231,761 | (2)% | $ | 235,706 | 5% | $ | 225,131 | ||||||||
Percentage of total net sales | 18 | % | 19 | % | 18 | % | ||||||||||
| ||||||||||||||||
General and Administrative | $ | 105,602 | 7% | $ | 98,390 | 5% | $ | 93,935 | ||||||||
Percentage of total net sales | 8 | % | 8 | % | 8 | % | ||||||||||
| ||||||||||||||||
Total operating expenses | $ | 815,284 | 3% | $ | 795,332 | 3% | $ | 771,328 | ||||||||
Percentage of total net sales | 63 | % | 65 | % | 63 | % | ||||||||||
The increase in our operating expenses in 2017 was primarily the result of $34 million in higher personnel-related expenses due to increased variable compensation in regions with strong sales growth, accrual of an expected payment under our annual company profit sharing program, an increase in our employer matching contribution for our defined contribution retirement plan, and $16 million in severance and other related costs associated with our restructuring initiative. Building and equipment costs also increased by $4 million compared to 2016. These increases were partially offset by a decrease in software development costs of $10 million due to an increase in capitalization of software development costs compared to the year ending December 31, 2016 and a $6 million decrease in marketing and outside services. Additionally, the year over year change in exchange rates had the effect of decreasing our operating expenses by $1.4 million.
The increase in our operating expenses in 2016 was due to higher personnel related expenses of $32.5 million due to increased variable compensation in regions with strong local currency growth as well as raises for eligible employees, and increased building and outside services expenses of $4.2 million. This was partially offset by a decrease of $9.2 million due to the net impact of changes in foreign currency exchange rates and a decrease in travel expenses of $2.3 million related to cost-savings initiatives implemented in the second half of 2016.
The increase in our capitalized software is consistent with our focus on new product development to support future growth in our business. We capitalize software development costs when technological feasibility has been established and amortize those costs as a component of cost of sales once the corresponding product is available for general release to customers. (See Note 1 – Operations and summary of significant accounting policies and Note 7 – Intangible assets of Notes to Consolidated Financial Statements for further discussion related to the capitalization and amortization of software development costs.)
We believe that our long-term growth and success depends on developing high quality software and hardware products on a timely basis. We are focused on leveraging recent investments in research and development and in our field sales force and taking actions to help ensure that those resources are focused in areas and initiatives that will contribute to future growth in our business. The increase in sales and marketing expenses in 2017 was primarily driven by $11 million in severance and other costs related to our restructuring initiative as well as an increase in commissions due to higher sales volume compared to 2016.
Operating Income. For the years ended December 31, 2017, 2016, and 2015, operating income was $146 million, $120 million and $137 million, respectively, an increase of 22% in 2017, following a decrease of 13% in 2016. As a percentage of net sales, operating income was 11%, 10% and 11%, respectively, over the three year period. The changes in operating income in absolute dollars and as a percent of sales in 2016 and 2017 are attributable to the factors discussed in Net Sales, Gross Profit and Operating Expenses above.
Interest Income. Interest income was $2.3 million, $1.1 million and $1.4 million for the years ended December 31, 2017, 2016, and 2015, respectively, an increase of 103% in 2017, following a decrease of 20% in 2016. We are seeing improving yields for high quality investment alternatives that comply with our corporate investment policy. We expect yields in these types of investments to increase moderately in 2018.
32
Net Foreign Exchange Gain/(Loss). Net foreign exchange gain/(loss) was $0.9 million, $(4.6) million, and $(7.1) million for the years ended December 31, 2017, 2016, and 2015, respectively. These results are attributable to movements in the foreign currency exchange rates between the U.S. dollar and foreign currencies in subsidiaries for which our functional currency is not the U.S. dollar. During 2017, there was a moderately stronger U.S. dollar during the first nine months of the year and a moderately weaker U.S. dollar during the last three months of the year when compared year over year to 2016, resulting in a modest decrease in our U.S. dollar equivalent revenues and expenses in 2017, when compared year over year to 2016. During 2016 and 2015, there was sharp volatility in the exchange rates between the U.S. dollar and most of the major currencies in the markets in which we do business and such volatility was characterized by a broad and sharp strengthening of the U.S. dollar against most currencies. In 2015 net foreign exchange loss included a $3.1 million loss on Euro cash holdings that were subsequently used to fund our acquisition of M2 and its wholly-owned subsidiary, Micropross. We cannot predict the direction or degree of future volatility in these exchange rates. In the past, we have noted that significant volatility in foreign currency exchange rates in the markets in which we do business has had a significant impact on the revaluation of our foreign currency denominated firm commitments, on our ability to forecast our U.S. dollar equivalent revenues and expenses and on the effectiveness of our hedging programs. In the past, these dynamics have also adversely affected our revenue growth in international markets and may pose similar challenges in the future. We recognize the local currency as the functional currency in virtually all of our international subsidiaries.
We utilize foreign currency forward contracts to hedge our foreign denominated net foreign currency balance sheet positions to help protect against the change in value caused by a fluctuation in foreign currency exchange rates. We typically hedge up to 90% of our outstanding foreign denominated net receivable or payable positions and typically limit the duration of these foreign currency forward contracts to approximately 90 days. The gain or loss on these derivatives as well as the offsetting gain or loss on the hedged item attributable to the hedged risk is recognized in current earnings under the line item “Net foreign exchange loss”. Our hedging strategy decreased our foreign exchange gains by $(5.9) million and decreased our foreign exchange losses by $1.9 million, and $4.3 million in 2017, 2016, and 2015, respectively. (See Note 4 - Derivative instruments and hedging activities of Notes to Consolidated Financial Statements for a further description of our derivative instruments and hedging activities).
33
Provision for Income Taxes. For the years ended December 31, 2017, 2016, and 2015, our provision for income taxes reflected an effective tax rate of 64%, 28% and 27%, respectively. The factors that caused our effective tax rates to change year-over-year are detailed in the table below:
| Years ended December 31, | |
Effective tax rate for 2016 | 28 | % |
Increased profits in foreign jurisdictions with reduced income tax rates | (5 | )% |
Change in enhanced deduction for certain research and development expenses | (1 | )% |
Change in intercompany prepaid tax asset | (3 | )% |
Change in state income taxes, net of federal benefit | (1 | )% |
Change in employee share-based compensation | (1 | )% |
Remeasurement of U.S. deferred tax balance | (10 | )% |
Transition tax on deferred foreign income | 54 | % |
Foreign tax on undistributed earnings | 3 | % |
Effective tax rate for 2017 | 64 | % |
| Years ended December 31, | |
Effective tax rate for 2015 | 27 | % |
Increased profits in foreign jurisdictions with reduced income tax rates | (6 | ) |
Change in valuation allowance | 1 | |
Change in enhanced deduction for certain research and development expenses | 5 | |
Change in intercompany prepaid tax asset | — | |
Change in amortization of intangible assets | 1 | |
Other | — | |
Effective tax rate for 2016 | 28 | % |
The Tax Cuts and Jobs Act was enacted on December 22, 2017. The Act reduces the US federal corporate tax rate from 35% to 21%, requires companies to pay a one-time transition tax on earnings of certain foreign subsidiaries that were previously tax deferred, and creates new taxes on certain foreign sourced earnings. As of December 31, 2017, we have not completed our accounting for the tax effects of enactment of the Act. However, we have made a reasonable estimate of the effects on our existing deferred tax balances and the one-time transition tax. We have recognized a provisional amount of $69.9 million, which is included as a component of income tax expense from continuing operations. Our estimates may be affected as we gain a more thorough understanding of the tax law. We will continue to make and refine our calculations as additional analysis is completed.
For additional discussion about our income taxes including the effect of the Tax Cuts and Jobs Act, components of income before income taxes, our provision for income taxes charged to operations, components of our deferred tax assets and liabilities, a reconciliation of income taxes at the U.S. federal statutory rate to our effective tax rate, and other tax matters, see Note 9 - Income taxes of Notes to Consolidated Financial Statements.
34
Quarterly results of operations
The following quarterly results have been derived from our unaudited consolidated financial statements that, in the opinion of management, reflect all adjustments (consisting only of normal recurring adjustments) necessary for a fair presentation of such quarterly information. The operating results for any quarter are not necessarily indicative of the results to be expected for any future period. You should read the following tables presenting our quarterly results of operations in conjunction with the consolidated financial statements and related notes contained elsewhere in this Annual Report on Form 10-K. The unaudited quarterly financial data for each of the eight quarters in the two years ended December 31, 2017 and December 31, 2016 are as follows:
| Three months ended | |||||||||||||||
| (in thousands, except per share data) | |||||||||||||||
| March 31, 2017 | June 30, 2017 | September 30, 2017 | December 31, 2017 | ||||||||||||
Net sales | $ | 300,106 | $ | 318,609 | $ | 320,921 | $ | 349,751 | ||||||||
Gross profit | 223,582 | 236,149 | 237,170 | 264,160 | ||||||||||||
Operating income | 22,318 | 28,631 | 37,515 | 57,312 | ||||||||||||
Net income (loss) | 18,148 | 25,155 | 33,389 | (24,282 | ) | |||||||||||
Basic earnings per share | $ | 0.14 | $ | 0.19 | $ | 0.26 | $ | (0.19 | ) | |||||||
Weighted average shares outstanding - basic | 129,438 | 130,197 | 130,660 | 130,886 | ||||||||||||
Diluted earnings per share | $ | 0.14 | $ | 0.19 | $ | 0.25 | $ | (0.18 | ) | |||||||
Weighted average shares outstanding - diluted | 130,108 | 131,117 | 131,617 | 132,113 | ||||||||||||
Dividends declared per share | $ | 0.21 | $ | 0.21 | $ | 0.21 | $ | 0.21 | ||||||||
| Three months ended | |||||||||||||||
| (in thousands, except per share data) | |||||||||||||||
| March 31, 2016 | June 30, 2016 | September 30, 2016 | December 31, 2016 | ||||||||||||
Net sales | $ | 287,177 | $ | 306,105 | $ | 306,365 | $ | 328,532 | ||||||||
Gross profit | 211,031 | 228,597 | 229,630 | 245,800 | ||||||||||||
Operating income | 13,844 | 27,267 | 29,364 | 49,251 | ||||||||||||
Net income | 9,298 | 19,800 | 24,487 | 29,149 | ||||||||||||
Basic earnings per share | $ | 0.07 | $ | 0.15 | $ | 0.19 | $ | 0.23 | ||||||||
Weighted average shares outstanding - basic | 127,595 | 128,282 | 128,815 | 129,108 | ||||||||||||
Diluted earnings per share | $ | 0.07 | $ | 0.15 | $ | 0.19 | $ | 0.23 | ||||||||
Weighted average shares outstanding - diluted | 128,103 | 128,746 | 129,047 | 129,503 | ||||||||||||
Dividends declared per share | $ | 0.20 | $ | 0.20 | $ | 0.20 | $ | 0.20 | ||||||||
35
Other operational information
We believe that the following additional unaudited operational metrics assist investors in assessing our operational performance relative to others in our industry and to our historical results. The following tables provide details with respect to the amount of GAAP charges related to stock-based compensation, amortization of acquisition intangibles, acquisition related transaction costs, restructuring charges, foreign exchange loss on acquisitions, taxes levied on the transfer of acquired intellectual property, and acquisition-related fair value adjustments that were recorded in the line items indicated below (in thousands).
| Three Months Ended December 31, | Years Ended December 31, | ||||||||||||||
(In thousands) | 2017 | 2016 | 2017 | 2016 | ||||||||||||
Stock-based compensation | ||||||||||||||||
Cost of sales | $ | 714 | $ | 568 | $ | 2,628 | $ | 2,210 | ||||||||
Sales and marketing | 3,035 | 2,636 | 11,559 | 11,057 | ||||||||||||
Research and development | 2,462 | 2,131 | 9,014 | 8,876 | ||||||||||||
General and administrative | 1,585 | 859 | 5,944 | 3,623 | ||||||||||||
Provision for income taxes | (2,934 | ) | (1,125 | ) | (10,322 | ) | (7,322 | ) | ||||||||
Total | $ | 4,862 | $ | 5,069 | $ | 18,823 | $ | 18,444 | ||||||||
| Three Months Ended December 31, | Years Ended December 31, | ||||||||||||||
(In thousands) | 2017 | 2016 | 2017 | 2016 | ||||||||||||
Amortization of acquisition intangibles | ||||||||||||||||
Cost of sales | $ | 1,444 | $ | 1,725 | $ | 6,092 | $ | 9,346 | ||||||||
Sales and marketing | 529 | 497 | 2,009 | 2,638 | ||||||||||||
Research and development | 204 | 273 | 1,017 | 1,088 | ||||||||||||
Provision for income taxes | (491 | ) | 855 | (2,148 | ) | 2,162 | ||||||||||
Total | $ | 1,686 | $ | 3,350 | $ | 6,970 | $ | 15,234 | ||||||||
| Three Months Ended December 31, | Years Ended December 31, | ||||||||||||||
(In thousands) | 2017 | 2016 | 2017 | 2016 | ||||||||||||
Acquisition transaction costs, restructuring charges, and other | ||||||||||||||||
Cost of sales | $ | 222 | $ | 74 | $ | 1,210 | $ | 327 | ||||||||
Sales and marketing | 2,972 | 42 | 10,990 | 183 | ||||||||||||
Research and development | 1,693 | 170 | 3,509 | 818 | ||||||||||||
General and administrative | 1,097 | 50 | 1,900 | 367 | ||||||||||||
Net foreign exchange gain (loss) | — | — | — | 94 | ||||||||||||
Other expense, net | — | — | — | 2,475 | ||||||||||||
Provision for income taxes | (1,754 | ) | (94 | ) | (5,407 | ) | (1,452 | ) | ||||||||
Total | $ | 4,230 | $ | 242 | $ | 12,202 | $ | 2,812 | ||||||||
(1) Foreign exchange losses on acquisitions were $0 and $94 for the years ended December 31, 2017 and 2016, respectively.
(2) Taxes levied on the transfer of acquired intellectual property were $0 and $2,475 for the years ended December 31, 2017 and 2016, respectively.
36
Liquidity and Capital Resources
Overview
At December 31, 2017, we had $412 million in cash, cash equivalents and short-term investments. Our cash and cash equivalent balances are held in numerous financial institutions throughout the world, including substantial amounts held outside of the U.S., however, the majority of our short-term investments that are located outside of the U.S. are denominated in the U.S. dollar with the exception of $5 million U.S. dollar equivalent of corporate bonds that are denominated in Euro. Our short-term investments do not include any foreign sovereign debt. The following table presents the geographic distribution of our cash, cash equivalents, and short-term investments as of December 31, 2017 (in millions):
Domestic | International | Total | |
Cash and Cash Equivalents | $63 | $227 | $290 |
22% | 78% | ||
Short-term Investments | $— | $122 | $122 |
—% | 100% | ||
Cash, Cash Equivalents and Short-term Investments | $63 | $349 | $412 |
15% | 85% | ||
We utilize a variety of tax planning and financing strategies with the objective of having our worldwide cash available in the locations in which it is needed.
The following table presents our working capital, cash and cash equivalents and short-term investments:
(In thousands) | December 31, 2017 | December 31, 2016 | Increase/ (Decrease) | |||||||||
| ||||||||||||
Working capital | $ | 624,835 | $ | 574,572 | $ | 50,263 | ||||||
Cash and cash equivalents (1) | 290,164 | 285,283 | 4,881 | |||||||||
Short-term investments (1) | 121,888 | 73,117 | 48,771 | |||||||||
Total cash, cash equivalents and short-term investments | $ | 412,052 | $ | 358,400 | $ | 53,652 | ||||||
(1) Included in working capital
Our principal sources of liquidity include cash, cash equivalents, and marketable securities, as well as the cash flows generated from our operations. We also have additional borrowing capacity under our Loan Agreement. Proceeds of loans made under the Loan Agreement may be used for working capital and other general corporate purposes.
The primary drivers of the net increase in working capital between December 31, 2016 and December 31, 2017 were:
• | Cash, cash equivalents, and short-term investments increased by $54 million . Additional analysis of the changes in our cash flows for the year ended December 31, 2017 compared to the year ended December 31, 2016 are discussed below. |
• | Accounts receivable increased by $20 million. Days sales outstanding (“DSO”) remained relatively flat at 68 days at December 31, 2017, compared to 66 days at December 31, 2016. |
• | Inventory decreased by $9 million to $185 million at December 31, 2017, from $194 million at December 31, 2016. Inventory turns were 1.7 at each of December 31, 2017 and December 31, 2016. |
• | Prepaid expenses and other current assets decreased by $5 million which was primarily related to a $6 million decrease in the fair value of our foreign currency forward exchange contracts and the timing of prepaid insurance and maintenance. |
• | Accrued compensation increased by $16 million which can be attributed to severance costs arising from our restructuring initiative and a future payment under our company profit sharing plan. |
• | The current portion of deferred revenue increased by $5 million, primarily due to the effect of foreign currency translation. |
• | Other current liabilities decreased by $9 million which was primarily related to income tax payments. |
• | Other taxes payable decreased by $3 million primarily related to the timing of payments for VAT and other indirect taxes. |
37
Analysis of Cash Flow
The following table summarizes the proceeds and (uses) of cash:
(In thousands) | December 31, | |||||||||||
| 2017 | 2016 | 2015 | |||||||||
Cash provided by operating activities | $ | 224,442 | $ | 200,199 | $ | 169,065 | ||||||
Cash used by investing activities | (122,410 | ) | (70,503 | ) | (78,392 | ) | ||||||
Cash used by financing activities | (106,299 | ) | (91,625 | ) | (108,113 | ) | ||||||
Effect of exchange rate changes on cash | 9,148 | (3,917 | ) | (5,461 | ) | |||||||
Net change in cash equivalents | 4,881 | 34,154 | (22,901 | ) | ||||||||
Cash and cash equivalents at beginning of year | 285,283 | 251,129 | 274,030 | |||||||||
Cash and cash equivalents at end of period | $ | 290,164 | $ | 285,283 | $ | 251,129 | ||||||
Operating Activities Cash provided by operating activities for the year ended December 31, 2017 increased by $24 million compared to the same period in 2016. This increase was primarily due to the $26 million increase in our operating income.
Investing Activities Cash used for investing activities for the year ended December 31, 2017 increased by $52 million compared to the same period in 2016. This was primarily attributable to a net purchase of short-term investments of $48 million compared to a net sale of short-term investments of $9 million during the same period in 2016, to take advantage of favorable increases in the yields offered by short-term investments that comply with our investment policy. Cash outflows related to capitalized software development also increased by $10 million which was offset by a decrease in capital expenditures of $14 million compared to the same period in 2016.
Financing Activities Cash used by financing activities increased by $15 million for the year ended December 31, 2017 compared to the same period in 2016. This was primarily due to a $7 million increase in cash outflows related to the increase in our quarterly dividend and a $13 million increase in cash outflows related to net repayments under our Loan Agreement, offset by $6 million decrease in cash outflows related to 2016 repurchases of our common stock. From time to time, our Board of Directors has authorized various programs for our repurchase of shares of our common stock depending on market conditions and other factors. Under the current program, we did not repurchase any shares during the year ended December 31, 2017. (See “Note 11 – Authorized shares of common and preferred stock and stock-based compensation plans” of Notes to Consolidated Financial Statements for additional discussion about our equity compensation plans and share repurchase program).
Contractual Cash Obligations. The following summarizes our contractual cash obligations as of December 31, 2017:
| Payments due by period | |||||||||||||||||||||||||||
(In thousands) | Total | 2018 | 2019 | 2020 | 2021 | 2022 | Beyond | |||||||||||||||||||||
Long-term debt | $ | — | $ | — | $ | — | $ | — | $ | — | $ | — | $ | — | ||||||||||||||
Tax payable (1) | 88,603 | 7,088 | 7,088 | 7,088 | 7,088 | 7,088 | 53,163 | |||||||||||||||||||||
Capital lease obligations | — | — | — | — | — | — | — | |||||||||||||||||||||
Operating leases | 77,304 | 20,012 | 15,696 | 10,875 | 7,853 | 5,298 | 17,570 | |||||||||||||||||||||
Total contractual obligations | $ | 165,907 | $ | 27,100 | $ | 22,784 | $ | 17,963 | $ | 14,941 | $ | 12,386 | $ | 70,733 | ||||||||||||||
(1) Represents one-time transition tax payable related to known amounts of cash taxes payable in future years as a result of the Tax Act. For further information, refer to Note 9 - Income Taxes of Notes to Consolidated Financial Statements | ||||||||||||||||||||||||||||
The following summarizes our other commercial commitments as of December 31, 2017:
(In thousands) | Total | 2018 | 2019 | 2020 | 2021 | 2022 | Beyond | |||||||||||||||||||||
Guarantees | $ | 2,629 | $ | 2,629 | $ | — | $ | — | $ | — | $ | — | $ | — | ||||||||||||||
Purchase obligations | 9,123 | 9,123 | — | — | — | — | — | |||||||||||||||||||||
Total commercial commitments | $ | 11,752 | $ | 11,752 | $ | — | $ | — | $ | — | $ | — | $ | — | ||||||||||||||
38
We have commitments under non-cancelable operating leases primarily for office facilities throughout the world. Certain leases require us to pay property taxes, insurance and routine maintenance, and include escalation clauses. As of December 31, 2017, we had non-cancelable operating lease obligations of approximately $77 million compared to $55 million at December 31, 2016. Rent expense under operating leases was $20 million for each of the years ended December 31, 2017, 2016, and 2015, respectively.
Purchase obligations primarily represent purchase commitments for customized inventory and inventory components. As of December 31, 2017, we had non-cancelable purchase commitments with various suppliers of customized inventory and inventory components totaling approximately $9.1 million over the next twelve months. At December 31, 2016, we had non-cancelable purchase commitments with various suppliers of customized inventory and inventory components totaling approximately $6.8 million.
At December 31, 2017, we had outstanding guarantees for payment of customs and foreign grants totaling approximately $2.6 million. At December 31, 2016, we had outstanding guarantees for payment of customs, foreign grants and potential customer disputes totaling approximately $3 million.
Loan Agreement. On May 9, 2013, we entered into a Loan Agreement (the “Loan Agreement”) with Wells Fargo Bank (the “Lender”). On October 29, 2015, we entered into a First Amendment to Loan Agreement (the “Amendment”) with the Lender, which amended our Loan Agreement to among other things, (i) increase the unsecured revolving line of credit from $50 million to $125 million, (ii) extend the maturity date of the line of credit from May 9, 2018 to October 29, 2020, and (iii) provide us with an option to request increases to the line of credit of up to an additional $25 million in the aggregate, subject to consent of the Lender and terms and conditions to be mutually agreed between us and the Lender. Proceeds of loans made under the Loan Agreement may be used for working capital and other general corporate purposes. We may prepay the loans under the Loan Agreement in whole or in part at any time without premium or penalty. Certain of our existing and future material domestic subsidiaries are required to guaranty our obligations under the Loan Agreement. We may choose to borrow additional funds against this line of credit in future periods to have sufficient domestic cash to fund continued dividends to our stockholders, to fund potential acquisitions or other domestic general corporate purposes without the need to repatriate foreign earnings. (See Note 14 – Debt of Notes to Consolidated Financial Statements for additional details on our revolving line of credit).
Off-Balance Sheet Arrangements. We do not have any off-balance sheet debt. At December 31, 2017, we did not have any relationships with any unconsolidated entities or financial partnerships, such as entities often referred to as structured finance entities, which would have been established for the purpose of facilitating off-balance sheet arrangements. As such, we are not exposed to any financing, liquidity, market or credit risk that could arise if we were engaged in such relationships.
Prospective Capital Needs. We believe that our existing cash, cash equivalents and short-term investments, together with cash generated from operations as well as from the purchase of common stock through our employee stock purchase plan, and available borrowings under our Loan Agreement will be sufficient to cover our working capital needs, capital expenditures, investment requirements, commitments, payment of dividends to our stockholders and repurchases of our common stock for at least the next 12 months. The enactment of the Tax Cuts and Jobs Act of 2017 will allow us to repatriate a majority of our foreign cash for domestic needs without additional taxation and to meet our capital deployment initiatives. We may also seek to pursue additional financing or to raise additional funds by selling equity or debt to the public or in private transactions from time to time. If we elect to raise additional funds, we may not be able to obtain such funds on a timely basis or on acceptable terms, if at all. If we raise additional funds by issuing additional equity or convertible debt securities, the ownership percentages of our existing stockholders would be reduced. In addition, the equity or debt securities that we issue may have rights, preferences or privileges senior to those of our common stock.
39
Although we believe that we have sufficient capital to fund our operating activities for at least the next 12 months, our future capital requirements may vary materially from those now planned. We anticipate that the amount of capital we will need in the future will depend on many factors, including:
• | payment of dividends to our stockholders; |
• | required levels of research and development and other operating costs; |
• | our business, product, capital expenditure and research and development plans, and product and technology roadmaps; |
• | acquisitions of other businesses, assets, products or technologies; |
• | the overall levels of sales of our products and gross profit margins; |
• | the levels of inventory and accounts receivable that we maintain; |
• | general economic and political uncertainty and specific conditions in the markets we address, including any volatility in the industrial economy in the various geographic regions in which we do business; |
• | the inability of certain of our customers who depend on credit to have access to their traditional sources of credit to finance the purchase of products from us, which may lead them to reduce their level of purchases or to seek credit or other accommodations from us; |
• | capital improvements for facilities; |
• | repurchases of our common stock; |
• | our relationships with suppliers and customers; and |
• | the level of stock purchases under our employee stock purchase plan. |
Recently Issued Accounting Pronouncements
See Note 1 – Operations and summary of significant accounting policies for discussion regarding recently issued accounting pronouncements.
40
Critical Accounting Policies
The preparation of our financial statements in conformity with generally accepted accounting principles requires us to make estimates and assumptions that affect the reported amounts of assets, liabilities, revenues, expenses and related disclosures of contingent assets and liabilities. We base our estimates on past experience and other assumptions that we believe are reasonable under the circumstances, and we evaluate these estimates on an ongoing basis. Our critical accounting policies are those that affect our financial statements materially and involve difficult, subjective or complex judgments by management. Although these estimates are based on management's best knowledge of current events and actions that may impact the company in the future, actual results may be materially different from the estimates.
Our critical accounting policies are as follows:
• | Revenue recognition |
We sell test and measurement solutions that include hardware, software licenses, and related services. Our sales are generally made under standard sales arrangements with payment terms ranging from net 30 days in the U.S. to net 30 days and up to net 180 days in some international markets. We offer rights of return and standard warranties for product defects related to our products. The rights of return are generally for a period of up to 30 days after the delivery date. Our standard warranties cover periods ranging from 90 days to three years. Our standard sales arrangements do not require product acceptance from the customer.
In recent years, we have made a concentrated effort to increase our revenue through the pursuit of orders with a value greater than $1.0 million. These orders often include contract terms that vary substantially from our standard terms of sale including product acceptance requirements and product performance evaluations which create uncertainty with respect to the timing of our ability to recognize revenue from such orders. These orders may also include most-favored customer pricing, significant discounts, extended payment terms and volume rebates, all of which also may create uncertainty with respect to the amount and timing of revenue recognized from such orders.
Sales of application software licenses include post-contract support services. Other services include customer training, customer support, and extended warranties.
We recognize revenue when persuasive evidence of an arrangement exists, delivery has occurred, the price is fixed or determinable, and collectability is reasonably assured. Delivery is considered to have occurred when title and risk of loss have transferred to the customer. For most of our hardware and software sales, title and risk of loss transfer upon shipment. For services, we recognize revenue when the service is provided, except for extended warranties for which revenue is recognized ratably over the warranty period.
We apply the separation guidance under U.S. GAAP for contracts with multiple deliverables. We analyze revenue arrangements with multiple deliverables to determine whether the deliverables should be divided into more than one unit of accounting. For contracts with more than one unit of accounting, we allocate the consideration we receive among the separate units of accounting based on their relative selling prices, which we determine based on prices of the deliverables as sold on a stand-alone basis, or if not sold on a stand-alone basis, the prices we would charge if sold on a stand-alone basis. We recognize revenue for each deliverable based on the revenue recognition policies described below.
For software arrangements that include multiple elements, including perpetual software licenses and undelivered items (e.g., software maintenance; subscriptions/term licenses), we allocate and defer revenue for the undelivered items based on vendor specific objective evidence (“VSOE”) of the fair value of the undelivered elements, and recognize revenue on the perpetual license using the residual method. We base VSOE of each element on the price for which the undelivered element is sold separately. We determine fair value of the undelivered elements based on historical evidence of our stand-alone sales of these elements to third parties or from the stated renewal rate for the undelivered elements. When VSOE does not exist for undelivered items, we recognize the entire arrangement fee ratably over the applicable performance period.
A portion of our revenues are generated from the sale of systems that contain software components that operate together with our hardware platform to provide the essential functionality of the system. When sold in a multiple element arrangement, these systems are considered non-software deliverables, so we can allocate the arrangement fee based upon relative selling price of each element. When applying the relative selling price method, we determine the selling price of each element using best estimate of selling price (“BESP”), because VSOE and third-party evidence ("TPE") are not available.
41
The revenues allocated to the software-related elements are recognized based on software industry specific revenue recognition guidance, as noted above. The revenues allocated to the non-software related elements are recognized based on the nature of the element provided. We estimate BESP by considering internal factors such as historical pricing practices and gross margin objectives, as well as market conditions such as competitor pricing strategies, customer demands and geography, and regularly review these assumptions.
The application of revenue recognition standards requires judgment, including whether a software arrangement includes multiple elements, and if so, whether VSOE of fair value exists for those elements. Changes to the elements in a software arrangement, the ability to identify VSOE for those elements, the fair value of the respective elements, and changes to a product’s estimated life cycle could materially impact the amount of our earned and unearned revenue. Judgment is also required to assess whether future releases of certain software represent new products or upgrades and enhancements to existing products.
Recent Updates to Revenue Recognition
In May 2014, the FASB issued ASU 2014-09, Revenue from Contracts with Customers (Topic 606), which became effective for us beginning January 1, 2018. For additional information on the new revenue recognition guidance and the expected impact of adoption, see Note 1 – Operations and summary of significant accounting policies of Notes to Consolidated Financial Statements.
• | Estimating allowances for sales returns |
The preparation of financial statements requires that we make estimates and assumptions of potential future product returns related to current period product revenue. We analyze historical returns, current economic trends, and changes in customer demand and acceptance of our products when evaluating the adequacy of our sales returns allowance. Significant judgments and estimates must be made and used in connection with establishing the sales returns allowance in any accounting period. A provision for estimated sales returns is made by reducing recorded revenue by the amount of the allowance. Accounts receivable is reported net of the allowance for sales returns. Our allowance for sales returns was $2.1 million and $1.8 million at December 31, 2017 and 2016, respectively. Material differences may result in the amount and timing of our revenue for any period if we made different judgments or utilized different estimates or if our actual results varied materially from our estimates.
• | Estimating allowances, specifically the allowance for doubtful accounts and the adjustment for excess and obsolete inventories |
In addition to estimating an allowance for sales returns, we must also make estimates about the uncollectability of our accounts receivable. We specifically analyze accounts receivable and analyze historical bad debts, customer concentrations, customer credit-worthiness and current economic trends when evaluating the adequacy of our allowance for doubtful accounts. Our allowance for doubtful accounts was $2.9 million and $1.9 million at December 31, 2017 and 2016, respectively. We also write down our inventory for estimated obsolescence or unmarketable inventory equal to the difference between the cost of inventory and estimated net realizable value based on assumptions of future demand and market conditions. Our allowance for excess and obsolete inventories was $16.4 million and $12.6 million at December 31, 2017 and 2016, respectively. Significant judgments and estimates must be made and used in connection with establishing these allowances. Material differences may result in the amount and timing of our bad debt and inventory obsolescence if we made different judgments or utilized different estimates or if actual results varied materially from our estimates.
• | Accounting for costs of computer software |
We capitalize costs related to the development and acquisition of certain software products. Capitalization of costs begins when technological feasibility has been established and ends when the product is available for general release to customers. Technological feasibility for our products is established when the product is available for beta release. Judgment is required in determining when technological feasibility of a product is established. Amortization is computed on an individual product basis for those products available for market and has been recognized based on the product’s estimated economic life, generally three years. At each balance sheet date, the unamortized costs are reviewed by management and reduced to net realized value when necessary. As of December 31, 2017 and 2016, unamortized capitalized software development costs were $86 million and $65 million, respectively.
42
• | Valuation of long-lived and intangible assets |
We assess the impairment of identifiable intangibles, long-lived assets and related goodwill whenever events or changes in circumstances indicate that the carrying value may not be recoverable. In accordance with FASB ASC 350, Intangibles – Goodwill and Other (FASB ASC 350), goodwill is tested for impairment on an annual basis, and between annual tests if indicators of potential impairment exist, using a fair-value-based approach based on the market capitalization of the reporting unit. Our annual impairment test was performed as of November 30, 2017. No impairment of goodwill and long-lived and intangible assets was identified during 2017 and 2016. Goodwill is deductible for tax purposes in certain jurisdictions. We have one operating segment and one reporting unit. Factors considered important which could trigger an impairment review include the following:
•significant underperformance relative to expected historical or projected future operating results;
•significant changes in the manner of our use of the acquired assets or the strategy for our overall business;
•significant negative industry or economic trends; and,
•our market capitalization relative to net book value.
When it is determined that the carrying value of intangibles, long-lived assets and related goodwill may not be recoverable based upon the existence of one or more of the above indicators of impairment, the measurement of any impairment is determined and the carrying value is reduced as appropriate. As of December 31, 2017 and 2016, we had goodwill of approximately $267 million and $253 million, respectively.
• | Accounting for income taxes |
We account for income taxes under the asset and liability method. Deferred tax assets and liabilities are recognized for the expected tax consequences of temporary differences between the tax bases of assets and liabilities and their reported amounts. Valuation allowances are established when necessary to reduce deferred tax assets to amounts which are more likely than not to be realized. We had a valuation allowance of $78 million and $62 million at December 31, 2017 and December 31, 2016, respectively. A majority of the valuation allowance is related to the deferred tax assets of National Instruments Hungary Kft. (“NI Hungary”). The decrease in the valuation allowance from 2015 to 2016 was primarily due to the revaluation of NI Hungary’s gross deferred tax assets following the reduction in the Hungarian corporate income tax rate from 19% to 9%.
Judgment is required in assessing the future tax consequences of events that have been recognized in our financial statements or tax returns. Variations in the actual outcome of these future tax consequences could materially impact our financial position or our results of operations. In estimating future tax consequences, all expected future events are considered other than enactments of changes in tax laws or rates. We account for uncertainty in income taxes recognized in our financial statements using prescribed recognition thresholds and measurement attributes for financial statement disclosure of tax positions taken or expected to be taken on our tax returns. Our continuing policy is to recognize interest and penalties related to income tax matters in income tax expense.
Our earnings in Hungary are subject to a statutory tax rate of 9%. In addition, our research and development activities in Hungary continue to benefit from a tax law in Hungary that provides for an enhanced deduction for qualified research and development expenses. The tax position of our Hungarian operations resulted in income tax benefits of $16.1 million and $4 million for the years ended December 31, 2017 and 2016, respectively. Earnings from our operations in Malaysia are free of tax under a tax holiday effective January 1, 2013. This tax holiday expires in 2027. If we fail to satisfy the conditions of the tax holiday, this tax benefit may be terminated early. The tax holiday resulted in income tax benefits of $5.5 million and $3.3 million for the years ended December 31, 2017 and 2016, respective1y. The impact of the tax holiday on a per share basis for the years ended December 31, 2017 and 2016 was a benefit of $0.04 and $0.03 per share, respectively.
No other taxing jurisdictions had a significant impact on our effective tax rate. We have not entered into any advanced pricing or other agreements with the Internal Revenue Service with regard to any foreign jurisdictions.
Our effective tax rate was lower than the U.S. federal statutory rate during 2015 and 2016 primarily due to earnings taxed at lower rates in foreign jurisdictions. The Tax Cuts and Jobs Act, which was enacted in December 2017, had a substantial impact on our income tax expense for the year ended December 31, 2017. For additional discussion about our income taxes including the effect of the Tax Cuts and Jobs Act, components of income before income taxes, our provision for income taxes charged to operations, components of our deferred tax assets and liabilities, a reconciliation of income taxes at the U.S. federal statutory rate of 35% to our effective tax rate and other tax matters, see Note 9 – Income taxes of Notes to Consolidated Financial Statements.
43
• | Loss contingencies |
We accrue for probable losses from contingencies including legal defense costs, on an undiscounted basis, when such costs are considered probable of being incurred and are reasonably estimable. We periodically evaluate available information, both internal and external, relative to such contingencies and adjust this accrual as necessary. Disclosure of a contingency is required if there is at least a reasonable possibility that a loss has been incurred. In determining whether a loss should be accrued we evaluate, among other factors, the degree of probability of an unfavorable outcome and our ability to make a reasonable estimate of the amount of loss. Changes in these factors could materially impact our financial position or our results of operation.
• | Accounting for costs related to exit or disposal activities |
Costs related to exit or disposal activities incurred as part of our recent restructuring activities may consist of voluntary or involuntary severance-related charges, asset-related charges and other costs related to exit activities. We recognize voluntary termination benefits when the employee accepts the offered benefit arrangement. We recognize involuntary severance-related charges depending on whether the termination benefits are provided under an ongoing benefit arrangement or under a one-time benefit arrangement. If the former, we recognize the charges once they are probable and the amounts are estimable. If the latter, we recognize the charges once the benefits have been communicated to employees.
Restructuring activities associated with assets would be recorded as an adjustment to the basis of the asset, not as a liability. When we commit to a plan to abandon a long-lived asset before the end of its previously estimated useful life, we accelerate the recognition of depreciation to reflect the use of the asset over its shortened useful life.
44
ITEM 7A. QUANTITATIVE AND QUALITATIVE DISCLOSURES ABOUT MARKET RISK
Financial Risk Management
Our international sales are subject to inherent risks, including fluctuations in local economies; fluctuations in foreign currencies relative to the U.S. dollar; difficulties in staffing and managing foreign operations; greater difficulty in accounts receivable collection; costs and risks of localizing products for foreign countries; unexpected changes in regulatory requirements, tariffs and other trade barriers; and burdens of complying with a wide variety of foreign laws.
The vast majority of our sales outside of the U.S. are denominated in local currencies, and accordingly, the U.S. dollar equivalent of these sales is affected by changes in the foreign currency exchange rates. The change in exchange rates had the effect of decreasing our consolidated sales by $1.8 million in the year ended December 31, 2017, and by $41 million in the year ended December 31, 2016. Because most of our international operating expenses are also incurred in local currencies, the change in exchange rates had the effect of decreasing our consolidated operating expenses by $1.4 million in the year ended December 31, 2017, and by $9.2 million in the year ended December 31, 2016.
During 2017, there was a moderately stronger U.S. dollar during the first nine months of the year and a moderately weaker U.S. dollar during the last three months of the year compared year-over-year to 2016, resulting in a modest decrease in our U.S. dollar equivalent revenues and expenses in 2017, when compared year-over-year to 2016. In the past, we have noted that significant volatility in foreign currency exchange rates in the markets in which we do business has had a significant impact on the revaluation of our foreign currency denominated firm commitments, on our ability to forecast our U.S. dollar equivalent revenues and expenses and on the effectiveness of our hedging programs. In recent periods, these dynamics have also adversely affected our revenue growth in international markets and will likely pose similar challenges in the near future. We recognize the local currency as the functional currency in virtually all of our international subsidiaries.
If the local currencies in which we sell our products strengthen against the U.S. dollar, we may need to lower our prices in the local currency to remain competitive in our international markets which could have a material adverse effect on our gross and net profit margins. If the local currencies in which we sell our products weaken against the U.S. dollar and if the local sales prices cannot be raised due to competitive pressures, we will experience a deterioration of our gross and net profit margins. To help protect against the change in the value caused by a fluctuation in foreign currency exchange rates of forecasted foreign currency cash flows resulting from international sales and expenses over the next one to two years, we have a foreign currency cash flow hedging program. We hedge portions of our forecasted revenue, cost of sales and operating expenses denominated in foreign currencies with foreign currency forward contracts. For forward contracts, when the dollar strengthens significantly against the foreign currencies, the change in the present value of future foreign currency cash flows may be offset by the change in the fair value of the forward contracts designated as hedges. We purchase foreign currency forward contracts for up to 100% of our forecasted exposures in selected currencies (primarily in Euro, Japanese yen, Chinese yuan, British pound, Malaysian ringgit and Hungarian forint) and limit the duration of these contracts to 40 months or less. As a result, our hedging activities only partially address our risks from foreign currency transactions, and there can be no assurance that this strategy will be successful. We do not invest in contracts for speculative purposes.
During the year ended December 31, 2017, our hedges had the effect of decreasing our consolidated sales by $0.5 million, increasing our cost of sales by $1.2 million, and increasing our operating expenses by $1.2 million. During the year ended December 31, 2016, our hedges had the effect of increasing our consolidated sales by $1.3 million, increasing our cost of sales by $1.9 million, and increasing our operating expenses by $1.9 million. (See Note 4 - Derivative instruments and hedging activities of Notes to Consolidated Financial Statements for further discussion regarding our cash flow hedging program and its related impacted on our consolidated sales, cost of sales and operating expenses for the years ended December 31, 2017 and 2016).
45
Inventory Management
The markets for our products dictate that many of our products be shipped very quickly after an order is received. As a result, we are required to maintain significant inventories. Therefore, inventory obsolescence is a risk for us due to frequent engineering changes, shifting customer demand, the emergence of new industry standards and rapid technological advances including the introduction by us or our competitors of products embodying new technology. However, our risk of obsolescence may be mitigated as many of our products have interchangeable parts and many have long lives. While we adjust for excess and obsolete inventories and we monitor the valuation of our inventories, there can be no assurance that our valuation adjustments will be sufficient. In recent years, we have made a concentrated effort to increase our revenue through the pursuit of orders with a value greater than $1.0 million. Fulfillment of these contracts can severely challenge our supply chain capabilities at the component acquisition, assembly and delivery stages. These contracts can also require us to develop specific product mitigation plans for product delivery constraints caused by unexpected or catastrophic situations to help assure timely production recovery and to comply with critical delivery commitments where severe contractual liabilities can be imposed on us if we fail to provide the quantity of products at the required delivery times. In order to help mitigate the risks associated with these contractual requirements, we may build inventory levels for certain parts or systems. Because our contracts with such customers may allow the customer to cancel or delay orders without liability, such actions expose our business to increased risk of inventory obsolescence.
Market Risk
We are exposed to a variety of risks, including foreign currency fluctuations and changes in the market value of our investments. In the normal course of business, we employ established policies and procedures to manage our exposure to fluctuations in foreign currency values and changes in the market value of our investments.
Cash, Cash Equivalents and Short-Term Investments
At December 31, 2017, we had $412 million in cash, cash equivalents and short-term investments. See Liquidity and Capital Resources above for further discussion regarding our cash, cash equivalents and short-term investments.
We report our available-for-sale short-term investments at fair value. (See Note 3 – Fair value measurements of Notes to Consolidated Financial Statements for a further description of the fair value measurement of our short term investments).
The goal of our investment policy is to manage our investment portfolio to preserve principal and liquidity while maximizing the return on our investment portfolio through the full investment of available funds. We place our cash investments in instruments that meet credit quality standards, as specified in our corporate investment policy guidelines. These guidelines also limit the amount of credit exposure to any one issue, issuer or type of instrument. Our cash equivalents and short-term investments carried ratings from the major credit rating agencies that were in accordance with our corporate investment policy. Our investment policy allows investments in the following: government and federal agency obligations, repurchase agreements (“Repos”), certificates of deposit and time deposits, corporate obligations, medium term notes and deposit notes, commercial paper including asset-backed commercial paper (“ABCP”), puttable bonds, general obligation and revenue bonds, money market funds, taxable commercial paper, corporate notes/bonds, municipal notes, municipal obligations and tax exempt commercial paper. All such instruments must carry minimum ratings of A1/P1/F1, MIG1/VMIG1/SP1 and A2/A/A, as applicable, all of which are considered “investment grade.” Our investment policy for marketable securities requires that all securities mature in five years or less, with a weighted average maturity of no longer than 24 months with at least 10% maturing in 90 days or less.
We account for our investments in debt and equity instruments under FASB ASC 320 Investments – Debt and Equity Securities (FASB ASC 320). Our investments are classified as available-for-sale and accordingly are reported at fair value, with unrealized gains and losses reported as other comprehensive income, a component of stockholders’ equity. Unrealized losses are charged against income when a decline in fair value is determined to be other-than-temporary. Investments with maturities beyond one year are classified as short-term based on their highly liquid nature and because such marketable securities represent the investment of cash that is available for current operations. The fair value of our short-term investments at December 31, 2017 and 2016 was $122 million and $73 million, respectively. This increase was due to our net purchase of $48 million of short-term investments.
We follow the guidance provided by FASB ASC 320 to assess whether our investments with unrealized loss positions are other than temporarily impaired. Realized gains and losses and declines in value judged to be other-than-temporary are determined based on the specific identification method and are reported in other income (expense), net, in our Consolidated Statements of Income. During the fourth quarter of 2015, we recorded a non-cash charge of $1 million (recorded in other, net) for the impairment of a cost-method investment.
Interest Expense Risk
We are exposed to interest rate fluctuations in the normal course of our business, including through our Loan Agreement. The interest payments on the Loan Agreement consist of a variable-rate of interest.
46
Interest Income Risk
Investments in both fixed rate and floating rate instruments carry a degree of interest rate risk. Fixed rate securities may have their market value adversely impacted due to an increase in interest rates, while floating rate securities may produce less income than expected if interest rates fall. Due to these factors, our future investment income may fall short of expectations due to changes in interest rates or if the decline in the fair value of our publicly traded debt investments is judged to be other-than-temporary. We may suffer losses in principal if we are forced to sell securities that have declined in market value due to changes in interest rates. However, because any debt securities we hold are classified as available-for-sale, no gains or losses are realized in our income statement due to changes in interest rates unless such securities are sold prior to maturity or unless declines in value are determined to be other-than-temporary. These securities are reported at fair value with the related unrealized gains and losses included in accumulated other comprehensive income (loss), a component of stockholders’ equity, net of tax.
In a rising interest rate environment, as short-term investments mature, reinvestment occurs at more favorable market rates. Given the short-term nature of certain of our investments, the current interest rate environment of rising rates may favorably impact our investment income.
In order to assess the interest rate risk associated with our investment portfolio, we performed a sensitivity analysis to determine the impact a change in interest rates would have on the value of our investment portfolio assuming a 100 basis point parallel shift in the yield curve. Based on our investment positions as of December 31, 2017, a 100 basis point increase or decrease in interest rates across all maturities would have resulted in approximately a $2.8 million increase or decrease in the fair market value of our portfolio. As of December 31, 2016, a similar 100 basis point increase or decrease in interest rates across all maturities would result in approximately a $1.3 million increase or decrease in the fair market value of our portfolio. Such losses would only be realized if we sold the investments prior to maturity or if there is an other-than-temporary impairment. Actual future gains and losses associated with our investments may differ from the sensitivity analyses performed as of December 31, 2017, due to the inherent limitations associated with predicting the changes in the timing and level of interest rates and our actual exposures and positions.
We continue to monitor the stability of the financial markets, particularly those in the developing economies and have taken steps to limit our direct and indirect exposure to these markets; however, we can give no assurance that we will not be negatively impacted by any adverse outcomes in those markets. We also continue to weigh the benefit of the higher yields associated with longer maturities against the interest rate risk and credit rating risk, also associated with these longer maturities when making these decisions. We cannot predict when or to what degree interest rates and investment yields will rise. If yields rise modestly, our investment income may be favorably impacted.
Exchange Rate Risk
Our objective in managing our exposure to foreign currency exchange rate fluctuations is to reduce the impact of adverse fluctuations in such exchange rates on our earnings and cash flow. Accordingly, we utilize purchased foreign currency option and forward contracts to hedge our exposure on anticipated transactions and firm commitments. There can be no assurance that our foreign currency hedging activities will substantially offset the impact of fluctuations in currency exchanges rates on our results of operations and financial position. Based on the foreign exchange instruments outstanding at December 31, 2017 and December 31, 2016, an adverse change (defined as 20% in the Asian currencies and 10% in all other currencies) in exchange rates would result in a decline in the aggregate settlement value of all of our instruments outstanding of approximately $25 million and $16 million, respectively. However, as we utilize foreign currency instruments for hedging anticipated and firmly committed transactions, we believe that a loss in settlement value for those instruments will be substantially offset by increases in the value of the underlying exposure. (See Note 4 - Derivative instruments and hedging activities of Notes to Consolidated Financial Statements for a further description of our derivative instruments and hedging activities).
ITEM 8. FINANCIAL STATEMENTS AND SUPPLEMENTARY DATA
The information required by this item is incorporated by reference to the Consolidated Financial Statements and Notes to Consolidated Financial Statements beginning on page F-1 hereof. Also see “Quarterly results of operations” on page 35.
ITEM 9. CHANGES IN AND DISAGREEMENTS WITH ACCOUNTANTS ON ACCOUNTING AND FINANCIAL DISCLOSURE
None.
47
ITEM 9A. CONTROLS AND PROCEDURES
Evaluation of Disclosure Controls and Procedures
Based on an evaluation under the supervision and with the participation of our management, our President and Chief Executive Officer, Alex Davern and our Chief Financial Officer, Karen Rapp, have concluded that our disclosure controls and procedures as defined in Rules 13a-15(e) and 15d-15(e) under the Securities Exchange Act of 1934, as amended (the “Exchange Act”), were effective as of December 31, 2017, to provide reasonable assurance that information required to be disclosed by us in reports that we file or submit under the Exchange Act is (i) recorded, processed, summarized and reported within the time periods specified in the Securities and Exchange Commission rules and forms and (ii) accumulated and communicated to our management, including our Chief Executive Officer and Chief Financial Officer, as appropriate to allow timely decisions regarding required disclosure. Our disclosure controls and procedures include components of our internal control over financial reporting.
Inherent Limitations Over Internal Controls
Our internal control over financial reporting is designed to provide reasonable assurance regarding the reliability of financial reporting and the preparation of financial statements for external purposes in accordance with U.S. generally accepted accounting principles (“GAAP”). Our internal control over financial reporting includes those policies and procedures that:
(i) | pertain to the maintenance of records that, in reasonable detail, accurately and fairly reflect the transactions and dispositions of our assets; |
(ii) | provide reasonable assurance that transactions are recorded as necessary to permit preparation of financial statements in accordance with GAAP, and that our receipts and expenditures are being made only in accordance with authorizations of our management and directors; and |
(iii) | provide reasonable assurance regarding prevention or timely detection of unauthorized acquisition, use, or disposition of our assets that could have a material effect on the financial statements. |
Management, including our Chief Executive Officer and Chief Financial Officer, does not expect that our internal controls will prevent or detect all errors and all fraud. A control system, no matter how well designed and operated, can provide only reasonable, not absolute, assurance that the objectives of the control system are met. Further, the design of a control system must reflect the fact that there are resource constraints, and the benefits of controls must be considered relative to their costs. Because of the inherent limitations in all control systems, no evaluation of internal controls can provide absolute assurance that all control issues and instances of fraud, if any, have been detected. Also, any evaluation of the effectiveness of controls in future periods are subject to the risk that those internal controls may become inadequate because of changes in business conditions, or that the degree of compliance with the policies or procedures may deteriorate.
Management Report on Internal Control over Financial Reporting
Our management is responsible for establishing and maintaining adequate internal control over financial reporting (as defined in Rule 13a-15(f) under the Exchange Act). We conducted an assessment of the effectiveness of our internal control over financial reporting based on the criteria set forth in Internal Control – Integrated Framework issued by the Committee of Sponsoring Organizations of the Treadway Commission (2013 framework). Based on our assessment, we have concluded that our internal control over financial reporting was effective as of December 31, 2017, to provide reasonable assurance regarding the reliability of financial reporting and the preparation of financial statements in accordance with GAAP. Our independent registered public accounting firm, Ernst & Young LLP, has issued an audit report on our internal control over financial reporting, which appears in Part II, Item 8 of this Form 10-K.
Changes in Internal Control over Financial Reporting
There were no changes in our internal control over financial reporting during the three months ended December 31, 2017, which were identified in connection with our evaluation required by paragraph (d) of rules 13a-15 and 15d-15 under the Exchange Act, that have materially affected, or are reasonably likely to materially affect, our internal control over financial reporting.
ITEM 9B. OTHER INFORMATION
From time to time, our directors, executive officers and other insiders may adopt stock trading plans pursuant to Rule 10b5-1(c) promulgated by the Securities and Exchange Commission under the Exchange Act. Jeffrey L. Kodosky and James J. Truchard have made periodic sales of our stock pursuant to such plans. The foregoing is provided for informational purposes and not in response to any particular requirement of Form 10-K.
48
PART III
Certain information required by Part III is omitted from this Report in that we intend to file a definitive proxy statement pursuant to Regulation 14A with the Securities and Exchange Commission (the “Proxy Statement”) relating to our annual meeting of stockholders not later than 120 days after the end of the fiscal year covered by this Report, and such information is incorporated by reference herein as described below.
ITEM 10. DIRECTORS, EXECUTIVE OFFICERS AND CORPORATE GOVERNANCE
The information concerning our directors required by this Item pursuant to Item 401 of Regulation S-K will appear in our Proxy Statement under the section “Election of Directors” and such information is incorporated herein by reference.
The information concerning our executive officers required by this Item pursuant to Item 401 of Regulation S-K will appear in our Proxy Statement under the section “Executive Officers” and such information is incorporated herein by reference.
The information required by this Item pursuant to Item 405 of Regulation S-K regarding compliance with Section 16(a) of the Securities Exchange Act of 1934, as amended, will appear in our Proxy Statement under the section “Section 16(a) Beneficial Ownership Reporting Compliance” and such information is incorporated herein by reference.
The information concerning our code of ethics that applies to our principal executive officer, our principal financial officer, our controller or person performing similar functions required by this Item pursuant to Item 406 of Regulation S-K will appear in our Proxy Statement under the section “Code of Ethics” and such information is incorporated herein by reference.
The information required by this Item pursuant to Item 407(c)(3) of Regulation S-K regarding material changes, if any, to procedures by which security holders may recommend nominees to our board of directors will appear in our Proxy Statement under the section “Deadline for Receipt of Stockholder Proposals” and such information is incorporated herein by reference.
The information required by this Item pursuant to Item 407(d)(4) and Item 407(d)(5) of Regulation S-K regarding our Audit Committee and our audit committee financial expert(s), respectively, will appear in our Proxy Statement under the heading “Corporate Governance” and such information is incorporated herein by reference.
ITEM 11. EXECUTIVE COMPENSATION
The information required by this Item pursuant to Item 402 of Regulation S-K regarding director compensation will appear in our Proxy Statement under the section “Board Compensation” and such information is incorporated herein by reference.
The information required by this Item pursuant to Item 402 of Regulation S-K regarding executive officer compensation, including our Compensation Discussion & Analysis, will appear in our Proxy Statement under the section “Executive Compensation” and such information is incorporated herein by reference.
The information required by this Item pursuant to Item 407(e)(4) of Regulation S-K will appear in our Proxy Statement under the section “Compensation Committee Interlocks and Insider Participation” and such information is incorporated herein by reference.
The information required by this Item pursuant to Item 407(e)(5) will appear in our Proxy Statement under the section “Compensation Committee Report” and such information is incorporated herein by reference.
ITEM 12. SECURITY OWNERSHIP OF CERTAIN BENEFICIAL OWNERS AND MANAGEMENT AND RELATED STOCKHOLDER MATTERS
The information required by this Item pursuant to Item 403 of Regulation S-K concerning security ownership of certain beneficial owners and management will appear in our Proxy Statement under the section “Security Ownership” and such information is incorporated herein by reference.
The information required by this Item pursuant to Item 201(d) of Regulation S-K concerning securities authorized for issuance under equity compensation plans will appear in our Proxy Statement under the section “Equity Compensation Plans Information” and such information is incorporated herein by reference.
ITEM 13. CERTAIN RELATIONSHIPS AND RELATED TRANSACTIONS AND DIRECTOR INDEPENDENCE
The information required by this Item pursuant to Item 404 of Regulation S-K will appear in our Proxy Statement under the section “Certain Relationships and Related Transactions” and such information is incorporated herein by reference.
The information required by this Item pursuant to Item 407(a) of Regulation S-K regarding the independence of our directors will appear in our Proxy Statement under the section “Corporate Governance” and such information is incorporated herein by reference.
49
ITEM 14. PRINCIPAL ACCOUNTING FEES AND SERVICES
The information concerning principal accountant fees and services required by this Item is incorporated by reference to our Proxy Statement under the heading “Ratification of Independent Registered Public Accounting Firm.”
The information concerning pre-approval policies for audit and non-audit services required by this Item is incorporated by reference to our Proxy Statement under the heading “Audit Committee Pre-Approval of Audit and Permissible Non-Audit Services of Independent Auditors.”
50
PART IV
ITEM 15. EXHIBITS AND FINANCIAL STATEMENT SCHEDULES
(a) | Documents Filed with Report |
1. | Financial Statements. |
2. | Financial Statement Schedules. |
All schedules are omitted because the required information is already included in our notes to our consolidated financial statements or because they are not applicable
51
EXHIBITS | |
4.1(4) | Specimen of Common Stock certificate of the Company. |
10.1(4) | Form of Indemnification Agreement. |
52
101.INS | XBRL Instance Document |
101.SCH | XBRL Taxonomy Extension Schema Document |
101.CAL | XBRL Taxonomy Extension Calculation Linkbase Document |
101.DEF | XBRL Taxonomy Extension Definition Linkbase Document |
101.LAB | XBRL Taxonomy Extension Label Linkbase Document |
101.PRE | XBRL Taxonomy Extension Presentation Linkbase Document |
(1) | Incorporated by reference to the same-numbered exhibit filed with the Company’s Form 10-K for the fiscal year ended December 31, 2013. |
(2) | Incorporated by reference to the same-numbered exhibit filed with the Company’s Form 10-K for the fiscal year ended December 31, 2007 (File No. 000-25426). |
(3) | Incorporated by reference to the same-numbered exhibit filed with the Company’s Form 8-A on April 27, 2004 (File No. 000-25426). |
(4) | Incorporated by reference to the Company’s Form S-1 (Reg. No. 33-88386) declared effective March 13, 1995. |
(5) | Incorporated by reference to exhibit B of the Company’s Proxy Statement filed on March 30, 2017. |
(6) | Incorporated by reference to the same-numbered exhibit filed with the Company’s Form 10-K for the fiscal year ended December 31, 2016. |
(7) | Incorporated by reference to exhibit A of the Company’s Proxy Statement filed on April 4, 2005 (File No. 000-25426). |
(8) | Incorporated by reference to exhibit 10.8 filed with the Company’s Form 10-Q on August 2, 2006 (File No. 000-25426). |
(9) | Incorporated by reference to exhibit 10.9 filed with the Company’s Form 10-Q on August 2, 2006 (File No. 000-25426). |
(10) | Incorporated by reference to exhibit 10.10 filed with the Company’s Form 10-Q on August 2, 2006 (File No. 000-25426). |
(11) | Incorporated by reference to exhibit 10.11 filed with the Company’s Form 10-Q on August 2, 2006 (File No. 000-25426). |
(12) | Incorporated by reference to exhibit 10.1 filed with the Company’s Form 8-K filed on May 17, 2010 (File No. 000-25426). |
(13) | Incorporated by reference to exhibit 10.2 filed with the Company’s Form 8-K filed on June 24, 2010 (File No. 000-25426). |
(14) | Incorporated by reference to exhibit 10.3 filed with the Company’s Form 8-K filed on June 24, 2010 (File No. 000-25426). |
(15) | Incorporated by reference to exhibit 10.4 filed with the Company’s Form 8-K filed on June 24, 2010 (File No. 000-25426). |
(16) | Incorporated by reference to exhibit 10.5 filed with the Company’s Form 8-K filed on June 24, 2010 (File No. 000-25426). |
(17) | Incorporated by reference to exhibit 10.1 filed with the Company’s Form 8-K filed on April 25, 2014. |
(18) | Incorporated by reference to exhibit 10.16 filed with the Company’s Form 10-K for the fiscal year ended December 31, 2014. |
(19) | Incorporated by reference to exhibit 10.1 filed with the Company’s Form 8-K filed on May 13, 2013. |
(20) | Incorporated by reference to exhibit B of the Company’s Proxy Statement filed on April 1, 2015. |
(21) | Incorporated by reference to exhibit 10.18 filed with the Company’s Form 10-Q filed on July 31, 2015. |
(22) | Incorporated by reference to exhibit 10.19 filed with the Company’s Form 10-Q filed on July 31, 2015. |
(23) | Incorporated by reference to exhibit 10.20 filed with the Company’s Form 10-Q filed on July 31, 2015. |
(24) | Incorporated by reference to exhibit 10.21 filed with the Company’s Form 10-Q filed on July 31, 2015. |
53
(25) | Incorporated by reference to exhibit 10.22 filed with the Company’s Form 10-Q filed on July 31, 2015. |
(26) | Incorporated by reference to exhibit 10.1 filed with the Company’s Form 8-K filed on December 16, 2016. |
(27) | Incorporated by reference to exhibit C of the Company’s Proxy Statement filed on April 1, 2015. |
(28) | Incorporated by reference to exhibit 10.1 filed with the Company’s Form 8-K filed on October 30, 2015. |
(29) | Incorporated by reference to exhibit 10.25 filed with the Company’s Form 10-Q filed on May 2, 2016. |
(30) | Incorporated by reference to exhibit 10.26 filed with the Company’s Form 10-Q filed on May 2, 2016. |
(31) | Incorporated by reference to exhibit 10.27 filed with the Company’s Form 10-Q filed on October 31, 2016. |
(32) | Incorporated by reference to exhibit 10.29 filed with the Company’s Form 10-Q filed on May 1, 2017. |
* | Management Contract or Compensatory Plan or Arrangement |
† | Confidential treatment has been granted for portions of this exhibit. These portions have been omitted and submitted separately with the Securities and Exchange Commission. |
54
ITEM 16. FORM 10-K SUMMARY
None.
55
SIGNATURES
Pursuant to the requirements of Section 13 or 15(d) of the Securities Exchange Act of 1934, the registrant has duly caused this report to be signed on its behalf by the undersigned thereunto duly authorized.
Registrant | ||
NATIONAL INSTRUMENTS CORPORATION | ||
February 22, 2018 | BY: | /s/ Alex M. Davern |
Alex M. Davern | ||
President and Chief Executive Officer | ||
POWER OF ATTORNEY
KNOW ALL PERSONS BY THESE PRESENTS, that each person whose signature appears below constitutes and appoints Alexander M. Davern and Karen Rapp, jointly and severally, his or her attorneys-in-fact, each with the power of substitution, for him or her in any and all capacities, to sign any amendments to this Report on Form 10‑K, and to file the same, with exhibits thereto and other documents in connection therewith, with the Securities and Exchange Commission, hereby ratifying and confirming all that each of said attorneys-in-fact, or his substitute or substitutes, may do or cause to be done by virtue hereof.
Pursuant to the requirements of the Securities Exchange Act of 1934, this report has been signed below by the following persons on behalf of the registrant and in the capacities and on the dates indicated.
Signature | Capacity in Which Signed | Date | ||
| ||||
/s/ Alex M. Davern | Director, President and Chief Executive Officer (Principal Executive Officer) | February 22, 2018 | ||
Alex M. Davern | ||||
/s/ Karen Rapp | Executive Vice President and Chief Financial Officer (Principal Financial Officer) | February 22, 2018 | ||
Karen Rapp | ||||
| ||||
/s/ John C. Roiko | Vice President and Chief Accounting Officer (Principal Accounting Officer) | February 22, 2018 | ||
John C. Roiko | ||||
/s/ James J. Truchard | Chairman of the Board | February 22, 2018 | ||
Dr. James J. Truchard | ||||
| ||||
/s/ Gerhard P. Fettweis | Director | February 22, 2018 | ||
Dr. Gerhard P. Fettweis | ||||
| ||||
/s/ John M. Berra | Director | February 22, 2018 | ||
John M. Berra | ||||
| ||||
/s/ Jeffrey L. Kodosky | Director | February 22, 2018 | ||
Jeffrey L. Kodosky | ||||
| ||||
/s/ Duy-Loan T. Le | Director | February 22, 2018 | ||
Duy-Loan T. Le | ||||
| ||||
/s/ Michael E. McGrath | Director | February 22, 2018 | ||
Michael E. McGrath | ||||
| ||||
/s/ Charles J. Roesslein | Director | February 22, 2018 | ||
Charles J. Roesslein | ||||
56
NATIONAL INSTRUMENTS CORPORATION
INDEX TO FINANCIAL STATEMENTS
All schedules are omitted because the required information is already included in our notes to our consolidated financial statements or because they are not applicable.
F-1
Report of Independent Registered Public Accounting Firm
The Board of Directors and Stockholders of National Instruments Corporation
Opinion on the Financial Statements
We have audited the accompanying consolidated balance sheets of National Instruments Corporation (the Company) as of December 31, 2017 and 2016, the related consolidated statements of income, comprehensive income, stockholders' equity and cash flows for each of the three years in the period ended December 31, 2017, and the related notes (collectively referred to as the “financial statements”). In our opinion, the financial statements present fairly, in all material respects, the consolidated financial position of the Company at December 31, 2017 and 2016, and the consolidated results of its operations and its cash flows for each of the three years in the period ended December 31, 2017, in conformity with U.S. generally accepted accounting principles.
We also have audited, in accordance with the standards of the Public Company Accounting Oversight Board (United States) (PCAOB), the Company's internal control over financial reporting as of December 31, 2017, based on criteria established in Internal Control-Integrated Framework issued by the Committee of Sponsoring Organizations of the Treadway Commission (2013 framework) and our report dated February 22, 2018 expressed an unqualified opinion thereon.
Basis for Opinion
These financial statements are the responsibility of the Company's management. Our responsibility is to express an opinion on the Company’s financial statements based on our audits. We are a public accounting firm registered with the PCAOB and are required to be independent with respect to the Company in accordance with the U.S. federal securities laws and the applicable rules and regulations of the Securities and Exchange Commission and the PCAOB.
We conducted our audits in accordance with the standards of the PCAOB. Those standards require that we plan and perform the audit to obtain reasonable assurance about whether the financial statements are free of material misstatement, whether due to error or fraud. Our audits included performing procedures to assess the risks of material misstatement of the financial statements, whether due to error or fraud, and performing procedures that respond to those risks. Such procedures included examining, on a test basis, evidence regarding the amounts and disclosures in the financial statements. Our audits also included evaluating the accounting principles used and significant estimates made by management, as well as evaluating the overall presentation of the financial statements. We believe that our audits provide a reasonable basis for our opinion.
/s/ Ernst & Young LLP
We have served as the Company’s auditor since 2005.
Austin, Texas
February 22, 2018
F-2
Report of Independent Registered Public Accounting Firm
The Board of Directors and Stockholders of National Instruments Corporation
Opinion on Internal Control over Financial Reporting
We have audited National Instruments Corporation’s internal control over financial reporting as of December 31, 2017, based on criteria established in Internal Control-Integrated Framework issued by the Committee of Sponsoring Organizations of the Treadway Commission 2013 framework (the COSO criteria). In our opinion, National Instruments Corporation (the Company) maintained, in all material respects, effective internal control over financial reporting as of December 31, 2017, based on COSO criteria.
We also have audited, in accordance with the standards of the Public Company Accounting Oversight Board (United States) (PCAOB), the consolidated balance sheets of the Company as of December 31, 2017 and 2016, the related consolidated statements of income, comprehensive income, stockholders’ equity and cash flows for each of the three years in the period ended December 31, 2017, and the related notes and our report dated February 22, 2018 expressed an unqualified opinion thereon.
Basis for Opinion
The Company’s management is responsible for maintaining effective internal control over financial reporting and for its assessment of the effectiveness of internal control over financial reporting included in the accompanying Management Report on the Effectiveness of Internal Control Over Financial Reporting. Our responsibility is to express an opinion on the Company’s internal control over financial reporting based on our audit. We are a public accounting firm registered with the PCAOB and are required to be independent with respect to the Company in accordance with the U.S. federal securities laws and the applicable rules and regulations of the Securities and Exchange Commission and the PCAOB.
We conducted our audit in accordance with the standards of the PCAOB. Those standards require that we plan and perform the audit to obtain reasonable assurance about whether effective internal control over financial reporting was maintained in all material respects.
Our audit included obtaining an understanding of internal control over financial reporting, assessing the risk that a material weakness exists, testing and evaluating the design and operating effectiveness of internal control based on the assessed risk, and performing such other procedures as we considered necessary in the circumstances. We believe that our audit provides a reasonable basis for our opinion.
Definition and Limitations of Internal Control Over Financial Reporting
A company’s internal control over financial reporting is a process designed to provide reasonable assurance regarding the reliability of financial reporting and the preparation of financial statements for external purposes in accordance with generally accepted accounting principles. A company’s internal control over financial reporting includes those policies and procedures that (1) pertain to the maintenance of records that, in reasonable detail, accurately and fairly reflect the transactions and dispositions of the assets of the company; (2) provide reasonable assurance that transactions are recorded as necessary to permit preparation of financial statements in accordance with generally accepted accounting principles, and that receipts and expenditures of the company are being made only in accordance with authorizations of management and directors of the company; and (3) provide reasonable assurance regarding prevention or timely detection of unauthorized acquisition, use, or disposition of the company’s assets that could have a material effect on the financial statements
Because of its inherent limitations, internal control over financial reporting may not prevent or detect misstatements. Also, projections of any evaluation of effectiveness to future periods are subject to the risk that controls may become inadequate because of changes in conditions, or that the degree of compliance with the policies or procedures may deteriorate.
/s/ Ernst & Young LLP
Austin, Texas
February 22, 2018
F-3
NATIONAL INSTRUMENTS CORPORATION
CONSOLIDATED BALANCE SHEETS
(in thousands, except share and per share data)
| December 31, 2017 | December 31, 2016 | ||||||
Assets | ||||||||
Current assets: | ||||||||
Cash and cash equivalents | $ | 290,164 | $ | 285,283 | ||||
Short-term investments | 121,888 | 73,117 | ||||||
Accounts receivable, net | 248,825 | 228,686 | ||||||
Inventories, net | 184,592 | 193,608 | ||||||
Prepaid expenses and other current assets | 48,621 | 53,953 | ||||||
Total current assets | 894,090 | 834,647 | ||||||
Property and equipment, net | 249,715 | 260,456 | ||||||
Goodwill | 266,783 | 253,197 | ||||||
Intangible assets, net | 123,293 | 108,663 | ||||||
Other long-term assets | 32,553 | 39,601 | ||||||
Total assets | $ | 1,566,434 | $ | 1,496,564 | ||||
Liabilities and stockholders' equity | ||||||||
Current liabilities: | ||||||||
Accounts payable and accrued expenses | $ | 49,733 | $ | 48,800 | ||||
Accrued compensation | 43,309 | 27,743 | ||||||
Deferred revenue - current | 120,638 | 115,577 | ||||||
Other current liabilities | 23,782 | 32,997 | ||||||
Other taxes payable | 31,793 | 34,958 | ||||||
Total current liabilities | 269,255 | 260,075 | ||||||
Long-term debt | — | 25,000 | ||||||
Deferred income taxes | 33,609 | 45,386 | ||||||
Income tax payable - long-term | 81,515 | — | ||||||
Liability for uncertain tax positions | 10,158 | 11,719 | ||||||
Deferred revenue - long-term | 33,742 | 29,752 | ||||||
Other long-term liabilities | 10,134 | 10,413 | ||||||
Total liabilities | 438,413 | 382,345 | ||||||
Commitments and contingencies | ||||||||
Stockholders' equity: | ||||||||
Preferred stock: par value $0.01; 5,000,000 shares authorized; none issued and outstanding | — | — | ||||||
Common stock: par value $0.01; 360,000,000 shares authorized; 130,978,947 and 129,202,979 shares issued and outstanding, respectively | 1,310 | 1,292 | ||||||
Additional paid-in capital | 829,979 | 771,346 | ||||||
Retained earnings | 313,241 | 376,202 | ||||||
Accumulated other comprehensive loss | (16,509 | ) | (34,621 | ) | ||||
Total stockholders’ equity | 1,128,021 | 1,114,219 | ||||||
Total liabilities and stockholders’ equity | $ | 1,566,434 | $ | 1,496,564 | ||||
The accompanying notes are an integral part of the financial statements.
F-4
NATIONAL INSTRUMENTS CORPORATION
CONSOLIDATED STATEMENTS OF INCOME
(in thousands, except per share data)
| For the years ended December 31, | |||||||||||
| 2017 | 2016 | 2015 | |||||||||
| ||||||||||||
Net sales: | ||||||||||||
Product | $ | 1,173,476 | $ | 1,116,703 | $ | 1,113,590 | ||||||
Software maintenance | 115,910 | 111,476 | 111,866 | |||||||||
Total net sales | 1,289,386 | 1,228,179 | 1,225,456 | |||||||||
| ||||||||||||
Cost of sales: | ||||||||||||
Product | 318,863 | 306,730 | 311,226 | |||||||||
Software maintenance | 9,461 | 6,391 | 5,730 | |||||||||
Total cost of sales | 328,324 | 313,121 | 316,956 | |||||||||
| ||||||||||||
Gross profit | 961,062 | 915,058 | 908,500 | |||||||||
| ||||||||||||
Operating expenses: | ||||||||||||
Sales and marketing | 477,921 | 461,236 | 452,262 | |||||||||
Research and development | 231,761 | 235,706 | 225,131 | |||||||||
General and administrative | 105,602 | 98,390 | 93,935 | |||||||||
Total operating expenses | 815,284 | 795,332 | 771,328 | |||||||||
| ||||||||||||
Operating income | 145,778 | 119,726 | 137,172 | |||||||||
| ||||||||||||
Other income (expense): | ||||||||||||
Interest income | 2,276 | 1,122 | 1,403 | |||||||||
Net foreign exchange gain (loss) | 892 | (4,632 | ) | (7,075 | ) | |||||||
Other expense, net | (1,566 | ) | (1,581 | ) | (221 | ) | ||||||
Income before income taxes | 147,380 | 114,635 | 131,279 | |||||||||
Provision for income taxes | 94,969 | 31,901 | 36,017 | |||||||||
| ||||||||||||
Net income | $ | 52,411 | $ | 82,734 | $ | 95,262 | ||||||
| ||||||||||||
Basic earnings per share | $ | 0.40 | $ | 0.64 | $ | 0.74 | ||||||
| ||||||||||||
Weighted average shares outstanding - basic | 130,300 | 128,453 | 127,997 | |||||||||
| ||||||||||||
Diluted earnings per share | $ | 0.40 | $ | 0.64 | $ | 0.74 | ||||||
| ||||||||||||
Weighted average shares outstanding - diluted | 131,387 | 129,008 | 128,668 | |||||||||
| ||||||||||||
Dividends declared per share | $ | 0.84 | $ | 0.80 | $ | 0.76 | ||||||
The accompanying notes are an integral part of these financial statements.
F-5
NATIONAL INSTRUMENTS CORPORATION
CONSOLIDATED STATEMENTS OF COMPREHENSIVE INCOME
(in thousands)
| For the years ended December 31, | |||||||||||
| 2017 | 2016 | 2015 | |||||||||
| ||||||||||||
Net income | $ | 52,411 | $ | 82,734 | $ | 95,262 | ||||||
Other comprehensive income, before tax and net of reclassification adjustments: | ||||||||||||
Foreign currency translation adjustment | 24,470 | (5,697 | ) | (19,240 | ) | |||||||
Unrealized (loss) gain on securities available-for-sale | (120 | ) | 210 | 701 | ||||||||
Unrealized (loss) gain on derivative instruments | (9,488 | ) | 13,166 | (19,012 | ) | |||||||
Other comprehensive income (loss), before tax | 14,862 | 7,679 | (37,551 | ) | ||||||||
Tax (benefit) provision related to items of other comprehensive income | (3,250 | ) | 4,210 | (11,125 | ) | |||||||
Other comprehensive income (loss), net of tax | 18,112 | 3,469 | (26,426 | ) | ||||||||
Comprehensive income | $ | 70,523 | $ | 86,203 | $ | 68,836 | ||||||
The accompanying notes are an integral part of these financial statements.
F-6
NATIONAL INSTRUMENTS CORPORATION
CONSOLIDATED STATEMENTS OF CASH FLOWS
( in thousands)
| For the years ended December 31, | |||||||||||
| 2017 | 2016 | 2015 | |||||||||
Cash flow from operating activities: | ||||||||||||
Net income | $ | 52,411 | $ | 82,734 | $ | 95,262 | ||||||
Adjustments to reconcile net income to net cash provided by operating activities: | ||||||||||||
Depreciation and amortization | 72,695 | 73,390 | 73,329 | |||||||||
Stock-based compensation | 29,145 | 25,832 | 25,489 | |||||||||
Tax (benefit) expense from deferred income taxes | (5,774 | ) | (5,430 | ) | 11,019 | |||||||
Purchase price adjustment | — | 1,585 | — | |||||||||
Changes in operating assets and liabilities (net of effects of acquisitions): | ||||||||||||
Accounts receivable | (15,269 | ) | (14,131 | ) | (10,709 | ) | ||||||
Inventories | 10,154 | (9,205 | ) | (9,342 | ) | |||||||
Prepaid expenses and other assets | 1,971 | 17,421 | (11,111 | ) | ||||||||
Accounts payable and accrued expenses | 1,584 | (2,506 | ) | (9,828 | ) | |||||||
Deferred revenue | 1,791 | 8,864 | 6,493 | |||||||||
Taxes, accrued compensation, and other current liabilities | 75,734 | 21,645 | (1,537 | ) | ||||||||
Net cash provided by operating activities | 224,442 | 200,199 | 169,065 | |||||||||
| ||||||||||||
Cash flow from investing activities: | ||||||||||||
Capital expenditures | (30,256 | ) | (44,425 | ) | (33,987 | ) | ||||||
Capitalization of internally developed software | (41,662 | ) | (31,859 | ) | (31,356 | ) | ||||||
Additions to other intangibles | (2,384 | ) | (2,342 | ) | (2,811 | ) | ||||||
Acquisitions, net of cash received | — | (549 | ) | (125,612 | ) | |||||||
Purchases of short-term investments | (87,735 | ) | (39,097 | ) | (36,063 | ) | ||||||
Sales and maturities of short-term investments | 39,627 | 47,769 | 151,437 | |||||||||
Net cash used in investing activities | (122,410 | ) | (70,503 | ) | (78,392 | ) | ||||||
| ||||||||||||
Cash flow from financing activities: | ||||||||||||
Proceeds from revolving line of credit | — | 15,000 | 54,000 | |||||||||
Principal payments on revolving line of credit | (25,000 | ) | (27,000 | ) | (17,000 | ) | ||||||
Proceeds from issuance of common stock | 29,094 | 28,907 | 27,785 | |||||||||
Repurchase of common stock | — | (5,635 | ) | (75,255 | ) | |||||||
Dividends paid | (109,551 | ) | (102,897 | ) | (97,643 | ) | ||||||
Other | (842 | ) | — | — | ||||||||
Net cash used in financing activities | (106,299 | ) | (91,625 | ) | (108,113 | ) | ||||||
| ||||||||||||
Effect of exchange rate changes on cash | 9,148 | (3,917 | ) | (5,461 | ) | |||||||
Net change in cash and cash equivalents | 4,881 | 34,154 | (22,901 | ) | ||||||||
Cash and cash equivalents at beginning of period | 285,283 | 251,129 | 274,030 | |||||||||
Cash and cash equivalents at end of period | $ | 290,164 | $ | 285,283 | $ | 251,129 | ||||||
Supplemental disclosures: | ||||||||||||
Equity consideration issued in business combinations | $ | — | — | 13,778 | ||||||||
Interest | $ | 478 | $ | 520 | $ | 287 | ||||||
Income taxes paid | $ | 38,033 | $ | 2,902 | $ | 29,038 | ||||||
The accompanying notes are an integral part of these financial statements.
F-7
NATIONAL INSTRUMENTS CORPORATION
CONSOLIDATED STATEMENTS OF STOCKHOLDERS’ EQUITY
(in thousands, except share data)
| |||||||||||||||||||||||
| Common Stock Shares | Common Stock Amount | Additional-Paid in Capital | Retained Earnings | Accumulated Other Comprehensive Income/(Loss) | Total Stockholders' Equity | |||||||||||||||||
Balance at December 31, 2014 | 127,849,271 | 1,278 | 662,889 | 464,993 | (11,664 | ) | 1,117,496 | ||||||||||||||||
Net income | — | — | — | 95,262 | — | 95,262 | |||||||||||||||||
Other comprehensive loss, net of tax | — | — | — | (26,426 | ) | (26,426 | ) | ||||||||||||||||
Issuance of common stock under employee plans, including tax benefits | 1,846,070 | 18 | 27,767 | — | — | 27,785 | |||||||||||||||||
Stock-based compensation | — | — | 25,891 | — | — | 25,891 | |||||||||||||||||
Business acquisition | 367,481 | 4 | 13,774 | 13,778 | |||||||||||||||||||
Repurchase of common stock | (2,591,218 | ) | (25 | ) | (13,449 | ) | (61,781 | ) | (75,255 | ) | |||||||||||||
Dividends paid | — | — | — | (97,643 | ) | — | (97,643 | ) | |||||||||||||||
Disqualified dispositions | — | — | 833 | — | — | 833 | |||||||||||||||||
Balance at December 31, 2015 | 127,471,604 | 1,275 | 717,705 | 400,831 | (38,090 | ) | 1,081,721 | ||||||||||||||||
Net income | — | — | — | 82,734 | — | 82,734 | |||||||||||||||||
Other comprehensive income, net of tax | — | — | — | 3,469 | 3,469 | ||||||||||||||||||
Issuance of common stock under employee plans, including tax benefits | 1,894,151 | 19 | 28,888 | — | — | 28,907 | |||||||||||||||||
Stock-based compensation | — | — | 25,920 | — | — | 25,920 | |||||||||||||||||
Business acquisition | 44,004 | — | — | — | |||||||||||||||||||
Repurchase of common stock | (206,780 | ) | (2 | ) | (1,167 | ) | (4,466 | ) | (5,635 | ) | |||||||||||||
Dividends paid | — | — | — | (102,897 | ) | — | (102,897 | ) | |||||||||||||||
Balance at December 31, 2016 | 129,202,979 | $ | 1,292 | $ | 771,346 | $ | 376,202 | $ | (34,621 | ) | $ | 1,114,219 | |||||||||||
Net income | — | — | — | 52,411 | — | 52,411 | |||||||||||||||||
Other comprehensive income, net of tax | — | — | — | 18,112 | 18,112 | ||||||||||||||||||
Issuance of common stock under employee plans, including tax benefits | 1,775,968 | 18 | 29,076 | — | — | 29,094 | |||||||||||||||||
Stock-based compensation | — | — | 29,557 | — | — | 29,557 | |||||||||||||||||
Adoption of ASU 2016-16 | — | — | (5,821 | ) | (5,821 | ) | |||||||||||||||||
Dividends paid | — | — | — | (109,551 | ) | — | (109,551 | ) | |||||||||||||||
Balance at December 31, 2017 | 130,978,947 | $ | 1,310 | $ | 829,979 | $ | 313,241 | $ | (16,509 | ) | $ | 1,128,021 | |||||||||||
The accompanying notes are an integral part of these financial statements.
F-8
NATIONAL INSTRUMENTS CORPORATION
NOTES TO CONSOLIDATED FINANCIAL STATEMENTS
Note 1 – Operations and summary of significant accounting policies
National Instruments Corporation is a Delaware corporation. We provide flexible application software and modular, multifunction hardware that users combine with industry-standard computers, networks and third party devices to create measurement, automation and embedded systems, which we refer to as “virtual instruments.” Our approach gives customers the ability to quickly and cost-effectively design, prototype and deploy unique custom-defined solutions for their design, control and test application needs. We offer hundreds of products used to create virtual instrumentation systems for general, commercial, industrial and scientific applications. Our products may be used in different environments, and consequently, specific application of our products is determined by the customer and generally is not known to us. We approach all markets with essentially the same products, which are used in a variety of applications from research and development to production testing, monitoring and industrial control. The following industries and applications are served by us worldwide: advanced research, automated test equipment, automotive, commercial aerospace, computers and electronics, consumer electronics, continuous process manufacturing, education, government/defense, medical research/pharmaceutical, power/energy, semiconductors, telecommunications and others. These financial statements have been prepared in accordance with U.S. generally accepted accounting principles.
Principles of consolidation
The Consolidated Financial Statements include the accounts of National Instruments Corporation and its subsidiaries. All significant intercompany accounts and transactions have been eliminated.
Reclassifications
As of December 31, 2017, we revised the presentation of Note 2 - Short-term investments of Notes to Consolidated Financial Statements. Certain amounts appearing in the previous year’s disclosures of short-term investments have been reclassified to conform to the current year’s presentation.
Starting January 1, 2017, we began separately presenting the effect of exchange rate changes on cash and cash equivalents in our consolidated statements of cash flows due to growing operations in foreign currency environments. Amounts in the comparable prior periods have been reclassified to conform to the current period presentation. The reclassifications resulted in the disaggregation of the amount attributable to the “Effect of exchange rate changes on cash” of $(3.9) million and $(5.5) million, with a corresponding increase to “Net cash provided by operating activities”, for the twelve months ended December 31, 2016 and 2015, respectively. We believe the reclassification is immaterial to the consolidated financial statements.
Use of estimates
The preparation of our financial statements in conformity with U.S. generally accepted accounting principles requires us to make estimates and assumptions that affect the reported amounts of assets, liabilities, revenues, expenses and related disclosures of contingent assets and liabilities. We base our estimates on past experience and other assumptions that we believe are reasonable under the circumstances, and we evaluate these estimates on an ongoing basis. Our critical accounting policies are those that affect our financial statements materially and involve difficult, subjective or complex judgments by management. Although these estimates are based on management's best knowledge of current events and actions that may impact the company in the future, actual results may be materially different from the estimates.
Cash and cash equivalents
Cash and cash equivalents include cash and highly liquid investments with maturities of three months or less at the date of acquisition.
Short-Term Investments
We value our available-for-sale short-term investments based on pricing from third party pricing vendors, who may use quoted prices in active markets for identical assets (Level 1 inputs) or inputs other than quoted prices that are observable either directly or indirectly (Level 2 inputs) in determining fair value. We classify all of our fixed income available-for-sale securities as having Level 2 inputs. The valuation techniques used to measure the fair value of our financial instruments having Level 2 inputs were derived from non-binding market consensus prices that are corroborated by observable market data, quoted market prices for similar instruments, or pricing models, such as discounted cash flow techniques. We believe all of these sources reflect the credit risk associated with each of our available-for-sale short-term investments. Short-term investments available-for-sale consist of debt securities issued by states of the U.S. and political subdivisions of the U.S., corporate debt securities and debt securities issued by U.S. government organizations and agencies. All short-term investments available-for-sale have contractual maturities of less than 52 months.
F-9
Our investments are classified as available-for-sale and accordingly are reported at fair value, with unrealized gains and losses reported as other comprehensive income, a component of stockholders’ equity. Unrealized losses are charged against income when a decline in fair value is determined to be other than temporary. Investments with maturities beyond one year are classified as short-term based on their highly liquid nature and because such marketable securities represent the investment of cash that is available for current operations. The fair value of our short-term investments in debt securities at December 31, 2017 and December 31, 2016 was $122 million and $73 million, respectively. The increase was due to the net purchase of $48 million of short-term investments. We had $5.0 million U.S. dollar equivalent of corporate bonds that were denominated in Euro at December 31, 2017.
We follow the guidance provided by FASB ASC 320 to assess whether our investments with unrealized loss positions are other than temporarily impaired. Realized gains and losses and declines in value judged to be other than temporary are determined based on the specific identification method and are reported in other income (expense), net, in our Consolidated Statements of Income. We did not identify or record any other-than-temporary impairments on our available-for-sale securities during 2017, 2016, and 2015.
Accounts Receivable, net
Accounts receivable are recorded net of allowances for sales returns of $2.1 million and $1.8 million at December 31, 2017 and 2016, respectively, and net of allowances for doubtful accounts of $2.9 million and $1.9 million at December 31, 2017 and 2016, respectively. A provision for estimated sales returns is made by reducing recorded revenue based on historical experience. We analyze historical returns, current economic trends and changes in customer demand of our products when evaluating the adequacy of our sales returns allowance. Our allowance for doubtful accounts is based on historical experience. We analyze historical bad debts, customer concentrations, customer creditworthiness and current economic trends when evaluating the adequacy of our allowance for doubtful accounts.
(In thousands) | ||||||||||||||||||
Year | Description | Balance at Beginning of Period | Provisions | Write-Offs | Balance at End of Period | |||||||||||||
2015 | Allowance for doubtful accounts and sales returns | $ | 4,798 | $ | 536 | $ | 968 | $ | 4,366 | |||||||||
2016 | Allowance for doubtful accounts and sales returns | $ | 4,366 | $ | 1,024 | 1,682 | $ | 3,708 | ||||||||||
2017 | Allowance for doubtful accounts and sales returns | $ | 3,708 | $ | 1,642 | 359 | $ | 4,991 | ||||||||||
Inventories, net
Inventories are stated at the lower-of-cost or net realizable value. Cost is determined using standard costs, which approximate the first-in first-out (“FIFO”) method. Cost includes the acquisition cost of purchased components, parts and subassemblies, in-bound freight costs, labor and overhead.
Inventory is shown net of adjustment for excess and obsolete inventories of $16.4 million, $12.6 million and $10.1 million at December 31, 2017, 2016 and 2015, respectively.
(In thousands) | ||||||||||||||||||
Year | Description | Balance at Beginning of Period | Provisions | Write-Offs | Balance at End of Period | |||||||||||||
2015 | Adjustment for excess and obsolete inventories | $ | 9,598 | $ | 3,087 | $ | 2,631 | $ | 10,054 | |||||||||
2016 | Adjustment for excess and obsolete inventories | $ | 10,054 | $ | 5,793 | 3,208 | $ | 12,639 | ||||||||||
2017 | Adjustment for excess and obsolete inventories | $ | 12,639 | $ | 7,130 | 3,322 | $ | 16,447 | ||||||||||
F-10
Property and equipment, net
Property and equipment are recorded at cost. Depreciation is computed using the straight-line method over the estimated useful lives of the assets, which range from twenty to forty years for buildings, and three to seven years for purchased internal use software and for equipment which are each included in furniture and equipment. Leasehold improvements are depreciated over the shorter of the life of the lease or the asset.
Intangible assets, net
We capitalize costs related to the development and acquisition of certain software products. Capitalization of costs begins when technological feasibility has been established and ends when the product is available for general release to customers. Technological feasibility for our products is established when the product is available for beta release. Amortization is computed on an individual product basis for those products available for market and is recognized based on the product’s estimated economic life, generally three to six years.
We use the services of outside counsel to search for, document, and apply for patents. Those costs, along with any filing or application fees, are capitalized. Costs related to patents which are abandoned are written off. Once a patent is granted, the patent costs are amortized ratably over the legal life of the patent, generally ten to seventeen years.
At each balance sheet date, the unamortized costs for all intangible assets are reviewed by management and reduced to net realizable value when necessary.
Goodwill
The excess purchase price over the fair value of net assets acquired is recorded as goodwill. We have one operating segment and one reporting unit. Goodwill is tested for impairment on an annual basis, and between annual tests if indicators of potential impairment exist, using a fair-value-based approach based on the market capitalization of the reporting unit.
We have historically performed our annual goodwill impairment test as of February 28 of each year. For the annual impairment test as of February 28, 2017, we performed a qualitative assessment of whether it was more likely than not that our reporting unit's fair value was less than its carrying amount. After completing the assessment, we determined that it was more likely than not that the estimated fair value of the reporting unit exceeded the carrying amount and that no impairment existed as of the assessment date. If we had concluded otherwise, a quantitative goodwill impairment test would have been required, which would have included a determination of the fair value of the reporting unit and a comparison of the fair value to its carrying value.
Effective for the annual goodwill impairment test for 2018 and for future testing, we will perform the required annual test as of November 30 of each year rather than on February 28. We reperformed our annual goodwill impairment testing as of November 30, 2017 and determined that it was more likely than not that the estimated fair value of the reporting unit exceeded the carrying amount and that no impairment existed as of the assessment date. We do not believe that the change in the date of the annual goodwill impairment test is a material change in the method of applying an accounting principle nor do we expect that it will result in any delay, acceleration or impact to the results of the impairment testing. We believe this date is preferable because it aligns with the timing of our annual planning process which largely occurs during the fourth quarter. Retrospective application to prior periods is impracticable as we are unable to objectively determine, without the use of hindsight, the assumptions that would be used in those earlier periods.
No impairment of goodwill was identified during 2017 and 2016. Goodwill is deductible for tax purposes in certain jurisdictions.
Concentrations of credit risk
We maintain cash and cash equivalents with various financial institutions located in many countries throughout the world. At December 31, 2017, we had $412 million in cash, cash equivalents and short-term investments. Our cash and cash equivalent balances are held in numerous financial institutions throughout the world, including substantial amounts held outside of the U.S., however, the majority of our short-term investments that are located outside of the U.S. are denominated in the U.S. dollar with the exception of $5 million U.S. dollar equivalent of corporate bonds that are denominated in Euro. The most significant of our operating accounts was our Hungarian Citibank operating account which held approximately $17 million or 6% of our total cash and cash equivalents at a bank that carried Baa1/BBB+/A ratings at December 31, 2017.
F-11
The following table presents the geographic distribution of our cash, cash equivalents, and short-term investments as of December 31, 2017 (in millions):
Domestic | International | Total | |
Cash and Cash Equivalents | $63 | $227 | $290 |
22% | 78% | ||
Short-term Investments | $— | $122 | $122 |
—% | 100% | ||
Cash, Cash Equivalents and Short-term Investments | $63 | $349 | $412 |
15% | 85% | ||
The goal of our investment policy is to manage our investment portfolio to preserve principal and liquidity while maximizing the return on our investment portfolio through the full investment of available funds. We place our cash investments in instruments that meet credit quality standards, as specified in our corporate investment policy guidelines. These guidelines also limit the amount of credit exposure to any one issue, issuer or type of instrument. Our cash equivalents and short-term investments carried ratings from the major credit rating agencies that were in accordance with our corporate investment policy. Our investment policy allows investments in the following: government and federal agency obligations, repurchase agreements (“Repos”), certificates of deposit and time deposits, corporate obligations, medium term notes and deposit notes, commercial paper including asset-backed commercial paper (“ABCP”), puttable bonds, general obligation and revenue bonds, money market funds, taxable commercial paper, corporate notes/bonds, municipal notes, municipal obligations and tax exempt commercial paper. All such instruments must carry minimum ratings of A1/P1/F1, MIG1/VMIG1/SP1 and A2/A/A, as applicable, all of which are considered “investment grade”. Our investment policy for marketable securities requires that all securities mature in five years or less, with a weighted average maturity of no longer than 24 months with at least 10% maturing in 90 days or less. (See Note 2 – Cash, cash equivalents, short-term and long-term investments in Notes to Consolidated Financial Statements for further discussion and analysis of our investments).
Concentration of credit risk with respect to trade accounts receivable is limited due to our large number of customers and their dispersion across many countries and industries. No single customer accounted for more than 3%, 3%, or 3% of sales for the years ended December 31, 2017, 2016, and 2015, respectively. The largest trade account receivable from any individual customer at December 31, 2017 was approximately $2.7 million.
Key supplier risk
Our manufacturing processes use large volumes of high-quality components and subassemblies supplied by outside sources. Several of these items are available through sole or limited sources. Supply shortages or quality problems in connection with these key items could require us to procure items from replacement suppliers, which would cause significant delays in fulfillment of orders and likely result in additional costs. In order to manage this risk, we maintain safety stock of some of these single sourced components and subassemblies and perform regular assessments of suppliers performance, grading key suppliers in critical areas such as quality and “on-time” delivery.
Revenue recognition
We sell test and measurement solutions that include hardware, software licenses, and related services. Our sales are generally made under standard sales arrangements with payment terms ranging from net 30 days in the U.S. to net 30 days and up to net 180 days in some international markets. We offer rights of return and standard warranties for product defects related to our products. The rights of return are generally for a period of up to 30 days after the delivery date. Our standard warranties cover periods ranging from 90 days to three years. Our standard sales arrangements do not require product acceptance from the customer.
In recent years, we have made a concentrated effort to increase our revenue through the pursuit of orders with a value greater than $1.0 million. These orders often include contract terms that vary substantially from our standard terms of sale including product acceptance requirements and product performance evaluations which create uncertainty with respect to the timing of our ability to recognize revenue from such orders. These orders may also include most-favored customer pricing, significant discounts, extended payment terms and volume rebates, all of which may create uncertainty with respect to the amount and timing of revenue recognized from such orders.
Sales of application software licenses include post-contract support services. Other services include customer training, customer support, and extended warranties.
F-12
We recognize revenue when persuasive evidence of an arrangement exists, delivery has occurred, the price is fixed or determinable, and collectability is reasonably assured. Delivery is considered to have occurred when title and risk of loss have transferred to the customer. For most of our hardware and software sales, title and risk of loss transfer upon shipment. For services, we recognize revenue when the service is provided, except for extended warranties for which revenue is recognized ratably over the warranty period.
We apply the separation guidance under U.S. GAAP for contracts with multiple deliverables. We analyze revenue arrangements with multiple deliverables to determine whether the deliverables should be divided into more than one unit of accounting. For contracts with more than one unit of accounting, we allocate the consideration we receive among the separate units of accounting based on their relative selling prices, which we determine based on prices of the deliverables as sold on a stand-alone basis, or if not sold on a stand-alone basis, the prices we would charge if sold on a stand-alone basis. We recognize revenue for each deliverable based on the revenue recognition policies described below.
For software arrangements that include multiple elements, including perpetual software licenses and undelivered items (e.g., software maintenance; subscriptions/term licenses), we allocate and defer revenue for the undelivered items based on vendor specific objective evidence (“VSOE”) of the fair value of the undelivered elements, and recognize revenue on the perpetual license using the residual method. We base VSOE of each element on the price for which the undelivered element is sold separately. We determine fair value of the undelivered elements based on historical evidence of our stand-alone sales of these elements to third parties or from the stated renewal rate for the undelivered elements. When VSOE does not exist for undelivered items, we recognize the entire arrangement fee ratably over the applicable performance period.
A portion of our revenues are generated from the sale of systems that contain software components that operate together with our hardware platform to provide the essential functionality of the system. When sold in a multiple element arrangement, these systems are considered non-software deliverables, so we can allocate the arrangement fee based upon relative selling price of each element. When applying the relative selling price method, we determine the selling price of each element using best estimate of selling price (“BESP”), because VSOE and third-party evidence (“TPE”) are not available.
The revenues allocated to the software-related elements are recognized based on software industry specific revenue recognition guidance, as noted above. The revenues allocated to the non-software related elements are recognized based on the nature of the element provided. We estimate BESP by considering internal factors such as historical pricing practices and gross margin objectives, as well as market conditions such as competitor pricing strategies, customer demands and geography, and regularly review these assumptions.
The application of revenue recognition standards requires judgment, including whether a software arrangement includes multiple elements, and if so, whether VSOE of fair value exists for those elements. Changes to the elements in a software arrangement, the ability to identify VSOE for those elements, the fair value of the respective elements, and changes to a product’s estimated life cycle could materially impact the amount of our earned and unearned revenue. Judgment is also required to assess whether future releases of certain software represent new products or upgrades and enhancements to existing products.
Product revenue
Our product revenue is generated predominantly from the sales of measurement and automation products. Our products consist of application software and hardware components together with related driver software.
Software maintenance revenue
Software maintenance revenue is post contract customer support that provides the customer with unspecified upgrades/updates and technical support.
Shipping and handling costs
Our shipping and handling costs charged to customers are included in net sales, and the associated expense is recorded in cost of sales.
F-13
Warranty reserve
We offer a one-year limited warranty on most hardware products which is included in the terms of sale of such products. We also offer optional extended warranties on our hardware products for which the related revenue is recognized ratably over the warranty period. Provision is made for estimated future warranty costs at the time of the sale for the estimated costs that may be incurred under the limited warranty. Our estimate is based on historical experience and product sales during the period.
The warranty reserve for the years ended December 31, 2017, 2016, and 2015 was as follows:
(In thousands) | ||||||||||||
| 2017 | 2016 | 2015 | |||||||||
Balance at the beginning of the period | $ | 2,686 | $ | 1,755 | $ | 1,885 | ||||||
Accruals for warranties issued during the period | 2,644 | 2,454 | 1,834 | |||||||||
Accruals related to pre-existing warranties | 274 | 1,258 | (263 | ) | ||||||||
Settlements made (in cash or in kind) during the period | (2,758 | ) | (2,781 | ) | (1,701 | ) | ||||||
Balance at the end of the period | $ | 2,846 | $ | 2,686 | $ | 1,755 | ||||||
Loss contingencies
We accrue for probable losses from contingencies including legal defense costs, on an undiscounted basis, when such costs are considered probable of being incurred and are reasonably estimable. We periodically evaluate available information, both internal and external, relative to such contingencies and adjust this accrual as necessary.
Advertising expense
We expense costs of advertising as incurred. Advertising expense for the years ended December 31, 2017, 2016, and 2015 was $11 million, $12 million, and $12 million, respectively.
Foreign currency translation
The functional currency for our international sales operations is the applicable local currency. The assets and liabilities of these operations are translated at the rate of exchange in effect on the balance sheet date and sales and expenses are translated at average rates. The resulting gains or losses from translation are included in a separate component of other comprehensive income. Gains and losses resulting from re-measuring monetary asset and liability accounts that are denominated in a currency other than a subsidiary’s functional currency are included in net foreign exchange gain (loss) and are included in net income.
Foreign currency hedging instruments
All of our derivative instruments are recognized on the balance sheet at their fair value. We currently use foreign currency forward contracts to hedge our exposure to material foreign currency denominated receivables and forecasted foreign currency cash flows.
On the date the derivative contract is entered into, we designate the derivative as a hedge of the variability of foreign currency cash flows to be received or paid (“cash flow” hedge) or as a hedge of our foreign denominated net receivable positions (“other derivatives”). Changes in the fair value of derivatives that are designated and qualify as cash flow hedges and that are deemed to be highly effective are recorded in other comprehensive income. These amounts are subsequently reclassified into earnings in the period during which the hedged transaction is realized. The gain or loss on the other derivatives as well as the offsetting gain or loss on the hedged item attributable to the hedged risk is recognized in current earnings under the line item “Net foreign exchange gain (loss)”. We do not enter into derivative contracts for speculative purposes.
We formally document all relationships between hedging instruments and hedged items, as well as our risk-management objective and strategy for undertaking various hedge transactions at the inception of the hedge. This process includes linking all derivatives that are designated as cash flow hedges to specific forecasted transactions. We also formally assess, both at the hedge’s inception and on an ongoing basis, whether the hedging instruments are highly effective in offsetting changes in cash flows of hedged items.
We prospectively discontinue hedge accounting if (1) it is determined that the derivative is no longer highly effective in offsetting changes in the fair value of a hedged item (forecasted transactions); or (2) the derivative is de-designated as a hedge instrument, because it is unlikely that a forecasted transaction will occur. When hedge accounting is discontinued, the derivative is sold and the resulting gains and losses are recognized immediately in earnings.
F-14
Income taxes
We account for income taxes under the asset and liability method. Deferred tax assets and liabilities are recognized for the expected tax consequences of temporary differences between the tax basis of assets and liabilities and their reported amounts. Valuation allowances are established when necessary to reduce deferred tax assets to amounts which are more likely than not to be realized. Judgment is required in assessing the future tax consequences of events that have been recognized in our financial statements or tax returns. Variations in the actual outcome of these future tax consequences could materially impact our financial position or our results of operations. In estimating future tax consequences, all expected future events are considered other than enactments of changes in tax laws or rates. We account for uncertainty in income taxes recognized in our financial statements using prescribed recognition thresholds and measurement attributes for financial statement disclosure of tax positions taken or expected to be taken on our tax returns. Our continuing policy is to recognize interest and penalties related to income tax matters in income tax expense.
Earnings per share
Basic earnings per share (“EPS”) is computed by dividing net income by the weighted average number of common shares outstanding during each period. Diluted EPS is computed by dividing net income by the weighted average number of common shares and common share equivalents outstanding (if dilutive) during each period. The number of common share equivalents, which include stock options and restricted stock units (“RSUs”), is computed using the treasury stock method.
The reconciliation of the denominators used to calculate basic EPS and diluted EPS for years ended December 31, 2017, 2016, and 2015 are as follows:
| Years ended December 31, | ||||||||
(In thousands) | 2017 | 2016 | 2015 | ||||||
Weighted average shares outstanding-basic | 130,300 | 128,453 | 127,997 | ||||||
Plus: Common share equivalents | |||||||||
RSUs | 1,087 | 555 | 671 | ||||||
Weighted average shares outstanding-diluted | 131,387 | 129,008 | 128,668 | ||||||
Stock awards to acquire 32,400 shares, 10,900 shares, and 292,400 shares for the years ended December 31, 2017, 2016, and 2015, respectively, were excluded in the computations of diluted EPS because the effect of including the stock awards would have been anti-dilutive.
Stock-based compensation
We account for stock-based compensation plans, which are more fully described in Note 11 – Authorized shares of common and preferred stock and stock-based compensation plans, using a fair-value method and recognize the expense in our Consolidated Statement of Income.
Comprehensive income
Our comprehensive income is comprised of net income, foreign currency translation and unrealized gains and losses on forward contracts and securities available-for-sale. Comprehensive income in 2017, 2016, and 2015 was $71 million, $86 million and $69 million, respectively.
Recently Adopted Accounting Pronouncements
In October 2016, the Financial Accounting Standards Board (“FASB”) issued Accounting Standards Update (“ASU”) 2016-16, Income Taxes – Intra-Entity Transfers of Assets Other Than Inventory. The standard is intended to address diversity in practice and complexity in financial reporting, particularly for intra-entity transfers of intellectual property. We early adopted ASU 2016-16 effective January 1, 2017. Using the modified retrospective method, the impact of the adoption of the standard was to increase our deferred tax assets by $0.4 million, decrease other assets, net by $6.2 million and decrease retained earnings by $5.8 million. The adoption of the amendments had the effect of increasing our diluted earnings per share by $0.01 and $0.04 for the three and twelve months ended December 31, 2017, respectively.
F-15
In March 2016, the FASB issued ASU 2016- 09, Improvements to Employee Share-Based Payment Accounting , which requires the recognition of the income tax effects of awards in the income statement when the awards vest or are settled, thus eliminating additional paid in capital pools. The guidance also allows for the employer to repurchase a greater number of an employee’s shares for tax withholding purposes without triggering liability accounting. In addition, the guidance allows for a policy election to account for forfeitures as they occur rather than on an estimated basis. We adopted ASU 2016-09 effective January 1, 2017 as follows:
•Our adoption of the amendments related to accounting for excess tax benefits resulted in the recognition of $3.2 million of excess tax benefits within income taxes rather than additional paid in capital for the twelve months ended December 31, 2017.
•We elected to retrospectively apply the changes in presentation to the statements of cash flows and no longer classify excess tax benefits as a financing activity, which increased net cash provided by operating activities and reduced net cash provided by financing activities by an immaterial amount for the twelve months ended December 31, 2017.
•We elected to account for forfeitures as they occur using a modified retrospective transition method. The adoption of this one-time accounting policy election did not have a material impact on our financial statements.In July 2015, the FASB issued ASU 2015-11, Simplifying the Measurement of Inventory(Topic 330). The amendments require that reporting entities measure inventory at the lower of cost and net realizable value. Net realizable value is the estimated selling price in the ordinary course of business, less reasonably predictable costs of completion, disposal, and transportation. The amendments apply to inventory that is measured using the first-in, first-out or average cost basis. We adopted ASU 2015-11 as of January 1, 2017 and the guidance was applied prospectively. We determined there were no changes to disclosure, financial statement presentation, or valuation of inventory as a result of adoption.
Recently Issued Accounting Pronouncements
In May 2014, the FASB issued ASU 2014-09, Revenue from Contracts with Customers (Topic 606). The update is a comprehensive new revenue recognition model that requires a company to recognize revenue to depict the transfer of goods or services to a customer at an amount that reflects the consideration it expects to receive in exchange for those goods or services. ASU 2014-09 also requires additional disclosure about the nature, amount, timing and uncertainty of revenue and cash flows arising from customer contracts, including significant judgments and changes in judgments and assets recognized from costs incurred to obtain or fulfill a contract. We adopted this standard as of January 1, 2018 by applying the modified retrospective transition method.
We have reached conclusions on our key accounting matters related to the new standard and believe adoption of the new standard will generally result in revenue recognition earlier or at the same time as prior US GAAP. The most significant impact of the standard relates to our accounting for certain software arrangements. We primarily license software on a perpetual basis. However, we also license software under enterprise agreements which includes an unlimited quantity of certain software licenses for a fixed-term bundled with software maintenance, technical support, and a specified amount of training and service credits. Currently, we defer revenue for software licensed under our enterprise agreements and certain perpetual arrangements due to a lack of vendor specific objective evidence (“VSOE”) for certain elements in the contract. Under the new standard, we are no longer required to establish VSOE to recognize software license revenue separately from the other elements, and we will be able to recognize software license revenue once the customer obtains control of the license, which will generally occur at the start of each license term. Due to the complexity of our enterprise agreement contracts, the actual revenue recognition treatment required under the new standard will be dependent on contract-specific terms, and may vary in some instances from recognition at the time of billing. Additionally, we expect the new standard will impact the way we allocate the transaction price for arrangements with separately-priced extended warranty offerings.
We adopted the new revenue recognition guidance effective January 1, 2018, by recognizing the cumulative effect of initially applying the new standard as an increase to the opening balance of retained earnings. We expect this adjustment to be less than $10 million, with an immaterial impact to our net income on an ongoing basis.
F-16
In August 2017, the FASB issued ASU 2017-12, Derivatives and Hedging (Topic 815): Targeted Improvements to Accounting for Hedging Activities. The ASU simplifies certain aspects of hedge accounting and improves disclosures of hedging arrangements through the elimination of the requirement to separately measure and report hedge ineffectiveness. The ASU generally requires the entire change in the fair value of a hedging instrument to be presented in the same income statement line as the hedged item in order to align financial reporting of hedge relationships with economic results. Entities must apply the amendments to cash flow and net investment hedge relationships that exist on the date of adoption using a modified retrospective approach. The presentation and disclosure requirements must be applied prospectively. Our effective date for adoption of this guidance is our fiscal year beginning January 1, 2019. We are currently evaluating the effect that this guidance will have on our consolidated financial statements.
In February 2016, the FASB issued ASU 2016-02, Leases (Topic 842), which supersedes ASC 840, Leases. The guidance requires lessees to recognize most lease liabilities on their balance sheets but recognize the expenses on their income statements in a manner similar to current practice. The update states that a lessee would recognize a lease liability for the obligation to make lease payments and a right-to-use asset for the right to use the underlying asset for the lease term. The update is effective for interim and annual periods beginning after December 15, 2018, and early adoption is permitted. We are currently evaluating the effect that the updated standard will have on our consolidated financial statements and related disclosures. Based on our initial assessment, we expect that the adoption of this standard will have a material impact on our balance sheet but that it will not have a material impact on our ongoing results of operations. We do not expect to adopt the new standard prior to the required effective date.
F-17
Note 2 – Short-term investments
The following tables summarize unrealized gains and losses related to our short-term investments designated as available-for-sale:
(In thousands) | As of December 31, 2017 | |||||||||||||||
| Adjusted Cost | Gross Unrealized Gain | Gross Unrealized Loss | Fair Value | ||||||||||||
Corporate bonds | $ | 120,341 | $ | 182 | $ | (395 | ) | $ | 120,128 | |||||||
Time deposits | 1,760 | — | — | 1,760 | ||||||||||||
Short-term investments | $ | 122,101 | $ | 182 | $ | (395 | ) | $ | 121,888 | |||||||
(In thousands) | As of December 31, 2016 | |||||||||||||||
| Adjusted Cost | Gross Unrealized Gain | Gross Unrealized Loss | Fair Value | ||||||||||||
Corporate bonds | $ | 71,450 | $ | 89 | $ | (182 | ) | $ | 71,357 | |||||||
Time deposits | 1,760 | — | — | 1,760 | ||||||||||||
Short-term investments | $ | 73,210 | $ | 89 | $ | (182 | ) | $ | 73,117 | |||||||
The following tables summarize the contractual maturities of our short-term investments designated as available-for-sale:
(In thousands) | As of December 31, 2017 | |||||||
| Adjusted Cost | Fair Value | ||||||
Due in less than 1 year | $ | 17,862 | $ | 17,824 | ||||
Due in 1 to 5 years | 104,239 | 104,064 | ||||||
Total available-for-sale debt securities | $ | 122,101 | $ | 121,888 | ||||
| ||||||||
Due in less than 1 year | Adjusted Cost | Fair Value | ||||||
Corporate bonds | $ | 16,102 | $ | 16,064 | ||||
Time deposits | 1,760 | 1,760 | ||||||
Total available-for-sale debt securities | $ | 17,862 | $ | 17,824 | ||||
| ||||||||
Due in 1 to 5 years | Adjusted Cost | Fair Value | ||||||
Corporate bonds | 104,239 | 104,064 | ||||||
Total available-for-sale debt securities | $ | 104,239 | $ | 104,064 | ||||
Note 3 – Fair value measurements
We define fair value to be the price that would be received to sell an asset or paid to transfer a liability in an orderly transaction between market participants at the measurement date. When determining the fair value measurements for assets and liabilities required or permitted to be recorded at fair value, we consider the principal or most advantageous market that market participants may use when pricing the asset or liability.
We follow a fair value hierarchy that prioritizes the inputs to valuation techniques used to measure fair value. Fair value measurement is determined based on the lowest level input that is significant to the fair value measurement. The three values of the fair value hierarchy are the following:
Level 1 – Quoted prices in active markets for identical assets or liabilities
Level 2 – Inputs other than quoted prices included within Level 1 that are observable for the asset or liability, either directly or indirectly
Level 3 – Inputs that are not based on observable market data
F-18
Assets and liabilities measured at fair value on a recurring basis are summarized below:
(In thousands) | Fair Value Measurements at Reporting Date Using | |||||||||||||||
Description | December 31, 2017 | Quoted Prices in Active Markets for Identical Assets (Level 1) | Significant Other Observable Inputs (Level 2) | Significant Unobservable Inputs (Level 3) | ||||||||||||
Assets | ||||||||||||||||
Cash and cash equivalents available for sale: | ||||||||||||||||
Money Market Funds | $ | 61,423 | $ | 61,423 | $ | — | $ | — | ||||||||
U.S. Treasuries and agencies | 39,461 | — | 39,461 | — | ||||||||||||
Short-term investments available for sale: | ||||||||||||||||
Corporate bonds | 120,128 | — | 120,128 | — | ||||||||||||
Time deposits | 1,760 | 1,760 | — | |||||||||||||
Derivatives | 7,232 | — | 7,232 | — | ||||||||||||
Total Assets | $ | 230,004 | $ | 63,183 | $ | 166,821 | $ | — | ||||||||
| ||||||||||||||||
Liabilities | ||||||||||||||||
Derivatives | $ | (12,743 | ) | — | (12,743 | ) | — | |||||||||
Total Liabilities | $ | (12,743 | ) | $ | — | $ | (12,743 | ) | $ | — | ||||||
(In thousands) | Fair Value Measurements at Reporting Date Using | |||||||||||||||
Description | December 31, 2016 | Quoted Prices in Active Markets for Identical Assets (Level 1) | Significant Other Observable Inputs (Level 2) | Significant Unobservable Inputs (Level 3) | ||||||||||||
Assets | ||||||||||||||||
Cash and cash equivalents available for sale: | ||||||||||||||||
Money Market Funds | $ | 68,577 | $ | 68,577 | $ | — | $ | — | ||||||||
Short-term investments available for sale: | ||||||||||||||||
Corporate bonds | 71,357 | — | 71,357 | — | ||||||||||||
Time deposits | 1,760 | 1,760 | — | — | ||||||||||||
Derivatives | 15,113 | — | 15,113 | — | ||||||||||||
Total Assets | $ | 156,807 | $ | 70,337 | $ | 86,470 | $ | — | ||||||||
| ||||||||||||||||
Liabilities | ||||||||||||||||
Derivatives | $ | (8,199 | ) | $ | — | $ | (8,199 | ) | $ | — | ||||||
Total Liabilities | $ | (8,199 | ) | $ | — | $ | (8,199 | ) | $ | — | ||||||
We value our available-for-sale short-term investments based on pricing from third party pricing vendors, who may use quoted prices in active markets for identical assets (Level 1 inputs) or inputs other than quoted prices that are observable either directly or indirectly (Level 2 inputs) in determining fair value. We classify all of our fixed income available-for-sale securities as having Level 2 inputs. The valuation techniques used to measure the fair value of our financial instruments having Level 2 inputs were derived from non-binding market consensus prices that are corroborated by observable market data, quoted market prices for similar instruments, or pricing models, such as discounted cash flow techniques. We believe all of these sources reflect the credit risk associated with each of our available-for-sale short-term investments. Short-term investments available-for-sale consists of debt securities issued by states of the U.S. and political subdivisions of the U.S., corporate debt securities and debt securities issued by U.S. government organizations and agencies. All short-term investments available-for-sale have contractual maturities of less than 52 months.
F-19
Derivatives include foreign currency forward and option contracts. Our foreign currency forward contracts are valued using an income approach (Level 2) based on the spot rate less the contract rate multiplied by the notional amount. Our foreign currency option contracts are valued using a market approach based on the quoted market prices which are derived from observable inputs including current and future spot rates, interest rate spreads as well as quoted market prices of similar instruments. We consider counterparty credit risk in the valuation of our derivatives. However, counterparty credit risk did not impact the valuation of our derivatives during the year ended December 31, 2017. There were not any transfers in or out of Level 1 or Level 2 during the year ended December 31, 2017.
Our short-term investments do not include any foreign sovereign debt. The majority of our short-term investments that are located outside of the U.S. are denominated in the U.S. dollar with the exception of $5.0 million U.S. dollar equivalent of corporate bonds that are denominated in Euro.
We did not have any items that were measured at fair value on a nonrecurring basis at December 31, 2017 and December 31, 2016.
The carrying value of net accounts receivable, accounts payable, and long-term debt contained in the Consolidated Balance Sheets approximates fair value.
Note 4 – Derivative instruments and hedging activities
We recognize all of our derivative instruments as either assets or liabilities in our statement of financial position at fair value. The accounting for changes in the fair value (i.e., gains or losses) of a derivative instrument depends on whether it has been designated and qualifies as part of a hedging relationship and further, on the type of hedging relationship. For those derivative instruments that are designated and qualify as hedging instruments, we designate the hedging instrument, based upon the exposure being hedged, as a fair value hedge, cash flow hedge, or a hedge of a net investment in a foreign operation.
We have operations in over 50 countries. Sales outside of the Americas accounted for approximately 61%, 61%, and 59% of our revenues during the years ended December 31, 2017, 2016, and 2015, respectively. Our activities expose us to a variety of market risks, including the effects of changes in foreign currency exchange rates. These financial risks are monitored and managed by us as an integral part of our overall risk management program.
We maintain a foreign currency risk management strategy that uses derivative instruments (foreign currency forward contracts) to help protect our earnings and cash flows from fluctuations caused by the volatility in currency exchange rates. Movements in foreign currency exchange rates pose a risk to our operations and competitive position, since exchange rate changes may affect our profitability and cash flow, and the business or pricing strategies of our non-U.S. based competitors.
The vast majority of our foreign sales are denominated in the customers’ local currency. We purchase foreign currency forward contracts as hedges of forecasted sales that are denominated in foreign currencies and as hedges of foreign currency denominated receivables. These contracts are entered into to help protect against the risk that the eventual dollar-net-cash inflows resulting from such sales or firm commitments will be adversely affected by changes in exchange rates. We also purchase foreign currency forward contracts as hedges of forecasted expenses that are denominated in foreign currencies. These contracts are entered into to help protect against the risk that the eventual dollar-net-cash outflows resulting from foreign currency operating and cost of revenue expenses will be adversely affected by changes in exchange rates.
We designate foreign currency forward contracts as cash flow hedges of forecasted revenues or forecasted expenses. In addition, we hedge our foreign currency denominated balance sheet exposures using foreign currency forward contracts that are not designated as hedging instruments. None of our derivative instruments contain a credit-risk-related contingent feature.
Cash flow hedges
To help protect against the reduction in value caused by a fluctuation in foreign currency exchange rates of forecasted foreign currency cash flows resulting from international sales over the next one to three years, we have instituted a foreign currency cash flow hedging program. We hedge portions of our forecasted revenue and forecasted expenses denominated in foreign currencies with forward contracts. For forward contracts, when the dollar strengthens significantly against the foreign currencies, the change in the present value of future foreign currency cash flows may be offset by the change in the fair value of the forward contracts designated as hedges. We purchase foreign currency forward for up to 100% of our forecasted exposures in selected currencies (primarily in Euro, Japanese yen, Malaysian ringgit, British pound, Chinese yuan, and Hungarian forint) and limit the duration of these contracts to 40 months or less.
F-20
For derivative instruments that are designated and qualify as a cash flow hedge, the effective portion of the gain or loss on the derivative is reported as a component of accumulated other comprehensive income (“OCI”) and reclassified into earnings in the same line item (net sales, operating expenses, or cost of sales) associated with the forecasted transaction and in the same period or periods during which the hedged transaction affects earnings. Gains and losses on the derivative representing either hedge ineffectiveness or hedge components excluded from the assessment of effectiveness are recognized in current earnings or expenses during the current period and are classified as a component of “net foreign exchange gain (loss)”. Hedge effectiveness of foreign currency forwards designated as cash flow hedges are measured by comparing the hedging instrument’s cumulative change in fair value from inception to maturity to the forecasted transaction’s terminal value.
We held forward contracts with the following notional amounts:
(In thousands) | U.S. Dollar Equivalent | |||||||
| As of December 31, 2017 | As of December 31, 2016 | ||||||
Chinese yuan | $ | 39,197 | $ | 27,414 | ||||
Euro | 177,406 | 123,522 | ||||||
Japanese yen | 22,857 | 44,982 | ||||||
Hungarian forint | 41,296 | 57,077 | ||||||
British pound | 9,931 | — | ||||||
Malaysian ringgit | 28,287 | 42,510 | ||||||
Total forward contracts notional amount | $ | 318,974 | $ | 295,505 | ||||
The contracts in the foregoing table had contractual maturities of 24 months or less and 36 months or less at December 31, 2017 and December 31, 2016, respectively.
At December 31, 2017, we expect to reclassify $6.0 million of losses on derivative instruments from accumulated OCI to net sales during the next twelve months when the hedged international sales occur, $1.4 million of gains on derivative instruments from accumulated OCI to cost of sales when the cost of sales are incurred and $1.4 million of gains on derivative instruments from accumulated OCI to operating expenses during the next twelve months when the hedged operating expenses occur. Expected amounts are based on derivative valuations at December 31, 2017. Actual results may vary as a result of changes in the corresponding exchange rates subsequent to this date.
The gains and losses recognized in earnings due to hedge ineffectiveness were not material for fiscal years 2017, 2016, and 2015 and are included as a component of net income.
Other Derivatives
Other derivatives not designated as hedging instruments consist primarily of foreign currency forward contracts that we use to hedge our foreign denominated net receivable or net payable positions to protect against the change in value caused by a fluctuation in foreign currency exchange rates. We typically attempt to hedge up to 90% of our outstanding foreign denominated net receivables or net payables and typically limit the duration of these foreign currency forward contracts to approximately 120 days. The gain or loss on the derivatives as well as the offsetting gain or loss on the hedge item attributable to the hedged risk is recognized in current earnings under the line item “net foreign exchange gain (loss).” As of December 31, 2017 and December 31, 2016, we held foreign currency forward contracts with a notional amount of $63 million and $60 million, respectively.
F-21
The following tables present the fair value of derivative instruments on our Consolidated Balance Sheets and the effect of derivative instruments on our Consolidated Statements of Income.
Fair Values of Derivative Instruments:
| Asset Derivatives | |||||||||||
| December 31, 2017 | December 31, 2016 | ||||||||||
(In thousands) | ||||||||||||
| Balance Sheet Location | Fair Value | Balance Sheet Location | Fair Value | ||||||||
Derivatives designated as hedging instruments | ||||||||||||
Foreign exchange contracts - ST forwards | Prepaid expenses and other current assets | $ | 4,707 | Prepaid expenses and other current assets | $ | 9,378 | ||||||
Foreign exchange contracts - LT forwards | Other long-term assets | 2,339 | Other long-term assets | 3,866 | ||||||||
Total derivatives designated as hedging instruments | $ | 7,046 | $ | 13,244 | ||||||||
Derivatives not designated as hedging instruments | ||||||||||||
| ||||||||||||
Foreign exchange contracts - ST forwards | Prepaid expenses and other current assets | $ | 187 | Prepaid expenses and other current assets | $ | 1,869 | ||||||
Total derivatives not designated as hedging instruments | $ | 187 | $ | 1,869 | ||||||||
| ||||||||||||
Total derivatives | $ | 7,233 | $ | 15,113 | ||||||||
| Liability Derivatives | |||||||||||
| December 31, 2017 | December 31, 2016 | ||||||||||
(In thousands) | ||||||||||||
| Balance Sheet Location | Fair Value | Balance Sheet Location | Fair Value | ||||||||
Derivatives designated as hedging instruments | ||||||||||||
Foreign exchange contracts - ST forwards | Other current liabilities | $ | (7,487 | ) | Other current liabilities | $ | (4,672 | ) | ||||
| ||||||||||||
Foreign exchange contracts - LT forwards | Other long-term liabilities | (3,959 | ) | Other long-term liabilities | (3,352 | ) | ||||||
Total derivatives designated as hedging instruments | $ | (11,446 | ) | $ | (8,024 | ) | ||||||
| ||||||||||||
Derivatives not designated as hedging instruments | ||||||||||||
| ||||||||||||
Foreign exchange contracts - ST forwards | Other current liabilities | $ | (1,297 | ) | Other current liabilities | $ | (175 | ) | ||||
Total derivatives not designated as hedging instruments | $ | (1,297 | ) | $ | (175 | ) | ||||||
Total derivatives | $ | (12,743 | ) | $ | (8,199 | ) | ||||||
F-22
The following tables present the effect of derivative instruments on our Consolidated Statements of Income for the years ended December 31, 2017 and 2016, respectively:
December 31, 2017 | ||||||||||||||||
(In thousands) | ||||||||||||||||
Derivatives in Cash Flow Hedging Relationship | Gain or (Loss) Recognized in OCI on Derivative (Effective Portion) | Location of Gain or (Loss) Reclassified from Accumulated OCI into Income (Effective Portion) | Gain or (Loss) Reclassified from Accumulated OCI into Income (Effective Portion) | Location of Gain or (Loss) Recognized in Income on Derivative (Ineffective Portion) | Gain or (Loss) Recognized in Income on Derivative (Ineffective Portion) | |||||||||||
Foreign exchange contracts - forwards | $ | (22,788 | ) | Net sales | $ | (544 | ) | Net foreign exchange gain (loss) | $ | — | ||||||
Foreign exchange contracts - forwards | 6,968 | Cost of sales | (1,165 | ) | Net foreign exchange gain (loss) | — | ||||||||||
Foreign exchange contracts - forwards | 6,332 | Operating expenses | (1,239 | ) | Net foreign exchange gain (loss) | — | ||||||||||
Total | $ | (9,488 | ) | $ | (2,948 | ) | $ | — | ||||||||
December 31, 2016 | ||||||||||||||||
(In thousands) | ||||||||||||||||
Derivatives in Cash Flow Hedging Relationship | Gain or (Loss) Recognized in OCI on Derivative (Effective Portion) | Location of Gain or (Loss) Reclassified from Accumulated OCI into Income (Effective Portion) | Gain or (Loss) Reclassified from Accumulated OCI into Income (Effective Portion) | Location of Gain or (Loss) Recognized in Income on Derivative (Ineffective Portion) | Gain or (Loss) Recognized in Income on Derivative (Ineffective Portion) | |||||||||||
Foreign exchange contracts - forwards | $ | 12,894 | Net sales | $ | 1,280 | Net foreign exchange gain (loss) | $ | — | ||||||||
Foreign exchange contracts - forwards | (128 | ) | Cost of sales | (1,924 | ) | Net foreign exchange gain (loss) | — | |||||||||
Foreign exchange contracts - forwards | 400 | Operating expenses | (1,854 | ) | Net foreign exchange gain (loss) | — | ||||||||||
Total | $ | 13,166 | $ | (2,498 | ) | $ | — | |||||||||
(In thousands) | ||||||||||
Derivatives not Designated as Hedging Instruments | Location of Gain (Loss) Recognized in Income | Amount of Gain (Loss) Recognized in Income | Amount of Gain (Loss) Recognized in Income | |||||||
| December 31, 2017 | December 31, 2016 | ||||||||
Foreign exchange contracts - forwards | Net foreign exchange gain/(loss) | $ | (5,891 | ) | $ | 1,911 | ||||
Total | $ | (5,891 | ) | $ | 1,911 | |||||
Gains or losses recognized in OCI on the effective portion of our derivatives are reported net of gains or losses reclassified from accumulated OCI into income.
F-23
Note 5 – Inventories
Inventories, net at December 31, 2017 and December 31, 2016 consist of the following:
(In thousands) | December 31, 2017 | December 31, 2016 | ||||||
| ||||||||
Raw materials | $ | 91,513 | $ | 92,906 | ||||
Work-in-process | 8,938 | 9,125 | ||||||
Finished goods | 84,141 | 91,577 | ||||||
Total | $ | 184,592 | $ | 193,608 | ||||
Note 6 – Property and equipment
Property and equipment at December 31, 2017 and December 31, 2016, consist of the following:
(In thousands) | December 31, 2017 | December 31, 2016 | ||||||
| ||||||||
Land | $ | 33,016 | $ | 32,928 | ||||
Buildings | 217,533 | 210,188 | ||||||
Furniture and equipment | 368,107 | 353,535 | ||||||
| 618,656 | 596,651 | ||||||
Accumulated depreciation | (368,941 | ) | (336,195 | ) | ||||
Total, net | $ | 249,715 | $ | 260,456 | ||||
Depreciation expense for the years ended December 31, 2017, 2016, and 2015, was $40 million, $40 million and $38 million, respectively.
Note 7 – Intangible assets
Intangible assets at December 31, 2017 and December 31, 2016 are as follows:
(In thousands) | December 31, 2017 | December 31, 2016 | ||||||||||||||||||||||
| Gross Carrying Amount | Accumulated Amortization | Net Carrying Amount | Gross Carrying Amount | Accumulated Amortization | Net Carrying Amount | ||||||||||||||||||
Capitalized software development costs | $ | 116,691 | $ | (30,345 | ) | $ | 86,346 | $ | 103,887 | $ | (39,180 | ) | $ | 64,707 | ||||||||||
Acquired technology | 96,198 | (87,341 | ) | 8,857 | 94,124 | (79,485 | ) | 14,639 | ||||||||||||||||
Patents | 33,163 | (19,931 | ) | 13,232 | 31,513 | (17,573 | ) | 13,940 | ||||||||||||||||
Other | 45,565 | (30,707 | ) | 14,858 | 42,848 | (27,471 | ) | 15,377 | ||||||||||||||||
Total | $ | 291,617 | $ | (168,324 | ) | $ | 123,293 | $ | 272,372 | $ | (163,709 | ) | $ | 108,663 | ||||||||||
Software development costs capitalized in 2017, 2016, and 2015 were $43 million, $33 million, and $33 million, respectively, and related amortization expense was $22 million, $19 million, and $18 million, respectively. Capitalized software development costs for the years ended December 31, 2017, 2016, and 2015 included costs related to stock based compensation of $1.8 million, $1.3 million and $1.3 million, respectively. The related amounts in the table above are net of fully amortized assets.
Amortization of capitalized software development costs is computed on an individual product basis for those products available for market and is recognized based on the product’s estimated economic life, generally three to six years. Acquired technology and other intangible assets are amortized over their useful lives, which range from two to eight years. Patents are amortized using the straight-line method over their estimated period of benefit, generally 10 to 17 years. Total intangible assets amortization expenses were $34 million, $35 million, and $36 million for the years ended December 31, 2017, 2016, and 2015, respectively.
F-24
Capitalized software development costs, acquired technology, patents and other intangible assets had weighted-average useful lives of 3.0 years, 2.0 years, 3.0 years, and 4.4 years, respectively, as of December 31, 2017. The estimated future amortization expense related to intangible assets as of December 31, 2017 was as follows:
| Amount | ||
| (In thousands) | ||
2018 | $ | 30,349 | |
2019 | 26,191 | ||
2020 | 16,198 | ||
2021 | 7,808 | ||
2022 | 4,342 | ||
Thereafter | 38,405 | ||
Total | $ | 123,293 | |
Note 8 – Goodwill
A reconciliation of the beginning and ending carrying amounts of goodwill is as follows:
| Amount | ||
| (In thousands) | ||
Balance as of December 31, 2015 | $ | 257,718 | |
Acquisitions | 419 | ||
Purchase price adjustments | (1,585 | ) | |
Foreign currency translation impact | (3,355 | ) | |
Balance as of December 31, 2016 | $ | 253,197 | |
Acquisitions | — | ||
Purchase price adjustments | — | ||
Foreign currency translation impact | 13,586 | ||
Balance as of December 31, 2017 | $ | 266,783 | |
The excess purchase price over the fair value of assets acquired is recorded as goodwill. We have one operating segment and one reporting unit. Goodwill is tested for impairment on an annual basis, and between annual tests if indicators of potential impairment exist, using a fair-value-based approach based on the market capitalization of the reporting unit. Our annual impairment test was performed as of November 30, 2017. No impairment of goodwill was identified during 2017 and 2016. Goodwill is deductible for tax purposes in certain jurisdictions.
See Note 17 – Acquisitions of Notes to Consolidated Financial Statements for additional discussion related to our acquisitions in 2016.
Note 9 – Income taxes
The components of income before income taxes are as follows:
(In thousands) | Years Ended December 31, | |||||||||||
| 2017 | 2016 | 2015 | |||||||||
Domestic | $ | 46,308 | $ | 43,418 | $ | 50,102 | ||||||
Foreign | 101,072 | 71,217 | 81,177 | |||||||||
Total | $ | 147,380 | $ | 114,635 | $ | 131,279 | ||||||
F-25
The provision for income taxes charged to operations is as follows:
(In thousands) | Years Ended December 31, | |||||||||||
| 2017 | 2016 | 2015 | |||||||||
Current tax expense: | ||||||||||||
U.S. federal | $ | 91,043 | $ | 13,579 | $ | 12,678 | ||||||
State | 348 | 1,251 | 446 | |||||||||
Foreign | 9,352 | 22,631 | 11,874 | |||||||||
Total current | $ | 100,743 | $ | 37,461 | $ | 24,998 | ||||||
Deferred tax expense (benefit): | ||||||||||||
U.S. federal | $ | (4,796 | ) | $ | 2,373 | $ | 14,148 | |||||
State | (151 | ) | 323 | 747 | ||||||||
Foreign | (827 | ) | (8,126 | ) | (3,114 | ) | ||||||
Total deferred | $ | (5,774 | ) | $ | (5,430 | ) | $ | 11,781 | ||||
Change in valuation allowance | — | (130 | ) | (762 | ) | |||||||
Total provision | $ | 94,969 | $ | 31,901 | $ | 36,017 | ||||||
Deferred tax liabilities (assets) at December 31, 2017 and 2016 were as follows:
(In thousands) | December 31, | |||||||
| 2017 | 2016 | ||||||
Capitalized software | $ | 18,361 | $ | 22,694 | ||||
Depreciation and amortization | 12,927 | 15,535 | ||||||
Intangible assets | 11,647 | 15,285 | ||||||
Cumulative translation adjustment on undistributed earnings | 385 | — | ||||||
Unrealized exchange gain | 1,338 | — | ||||||
Unrealized gain on derivative instruments | — | 1,827 | ||||||
Undistributed earnings of foreign subsidiaries | 5,330 | 8,917 | ||||||
Gross deferred tax liabilities | 49,988 | 64,258 | ||||||
Operating loss carryforwards | (81,701 | ) | (65,230 | ) | ||||
Vacation and other accruals | (6,242 | ) | (6,744 | ) | ||||
Inventory valuation and warranty provisions | (2,279 | ) | (1,862 | ) | ||||
Doubtful accounts and sales provisions | (804 | ) | (919 | ) | ||||
Unrealized exchange loss | — | (3,408 | ) | |||||
Deferred revenue | (7,316 | ) | (9,249 | ) | ||||
Accrued expenses | (495 | ) | (533 | ) | ||||
Unrealized loss on derivative instruments | (924 | ) | — | |||||
10% minority stock investment | — | (916 | ) | |||||
Stock-based compensation | (4,540 | ) | (6,043 | ) | ||||
Research and development tax credit carryforward | (297 | ) | (396 | ) | ||||
Capital loss carryforward | (463 | ) | (395 | ) | ||||
Foreign tax credit carryforward | (130 | ) | (203 | ) | ||||
Cumulative translation adjustment on undistributed earnings | — | (393 | ) | |||||
Other | (1,118 | ) | (636 | ) | ||||
Gross deferred tax assets | (106,309 | ) | (96,927 | ) | ||||
Valuation allowance | 77,504 | 61,679 | ||||||
Net deferred tax liability | $ | 21,183 | $ | 29,010 | ||||
F-26
A reconciliation of income taxes at the U.S. federal statutory income tax rate to our effective tax rate follows:
| Years Ended December 31, | ||||||||
| 2017 | 2016 | 2015 | ||||||
U.S. federal statutory rate | 35 | % | 35 | % | 35 | % | |||
Foreign taxes greater (less) than federal statutory rate | (12 | ) | (7 | ) | (1 | ) | |||
Research and development tax credits | (3 | ) | (3 | ) | (3 | ) | |||
Enhanced deduction for certain research and development expenses | (3 | ) | (2 | ) | (7 | ) | |||
State income taxes, net of federal tax benefit | — | 1 | 1 | ||||||
Employee share-based compensation | — | 1 | 1 | ||||||
Change in intercompany prepaid tax asset | (2 | ) | 1 | 1 | |||||
Change in valuation allowance | — | — | (1 | ) | |||||
Amortization of intangible assets | 1 | 1 | — | ||||||
Remeasurement of U.S. deferred tax balance | (10 | ) | — | — | |||||
Transition tax on deferred foreign income | 54 | — | — | ||||||
Foreign tax on undistributed foreign earnings | 3 | — | — | ||||||
Other | 1 | 1 | 1 | ||||||
Effective tax rate | 64 | % | 28 | % | 27 | % | |||
The Tax Cuts and Jobs Act was enacted on December 22, 2017. The Act reduces the US federal corporate tax rate from 35% to 21%, requires companies to pay a one-time transition tax on earnings of certain foreign subsidiaries that were previously tax deferred, and creates new taxes on certain foreign sourced earnings. As of December 31, 2017, we have not completed our accounting for the tax effects of enactment of the Act. However, we have made a reasonable estimate of the effects on our existing deferred tax balances and the one-time transition tax. We have recognized a provisional amount of $69.9 million, which is included as a component of income tax expense from continuing operations. We will continue to make and refine our calculations as additional analysis is completed. Our estimates may also be affected as we gain a more thorough understanding of the tax law.
Provisional Amounts
Deferred tax assets and liabilities: We remeasured certain deferred tax assets and liabilities based on the rates at which they are expected to reverse in the future, which is generally 21%. However, we are still analyzing certain aspects of the Act and refining our calculations, which could potentially affect the measurement of these balances or potentially give rise to new deferred tax amounts. The provisional benefit recorded related to the remeasurement of our deferred tax balance was $15.1 million.
Transition Tax: The one-time transition tax is based on our total post-1986 earnings and profits (“E&P”) that we previously deferred from US income taxes. We recorded a provisional amount for our one-time transition tax liability for our foreign subsidiaries, resulting in an increase in income tax expense of $79.7 million. We have not yet completed our calculation of the total post-1986 E&P for these foreign subsidiaries. Further, the transition tax is based in part on the amount of those earnings held in cash and other specified assets. This amount may change when we finalize the calculation of post-1986 foreign E&P previously deferred from US federal taxation and finalize the amounts held in cash or other specified assets.
As of December 31, 2017, unremitted earnings from our foreign subsidiaries were approximately $867 million and have been included in our computation of the transition tax. We recorded a provisional amount of $5.3 million for foreign withholding and distribution taxes on these earnings as these amounts are not expected to be indefinitely reinvested. We have not provided additional income taxes for any additional outside basis difference inherent in these entities, as these amounts continue to be indefinitely reinvested in foreign operations. Determining the amount of unrecognized deferred tax liability related to any additional outside basis difference in these entities is not practicable.
F-27
As of December 31, 2017, we had a federal net operating loss carryforward of $0.4 million which expires in the years 2034 to 2035, a federal capital loss carryforward of $2.1 million which expires during the years 2018 to 2021, and federal tax credit carryforwards of $0.4 million which expire during the years 2021 to 2034. Certain of these carryforwards are subject to limitations following a change in ownership.
As of December 31, 2017, 13 of our subsidiaries had available, for income tax purposes, foreign net operating loss carryforwards of an aggregate of approximately $884.0 million, of which $875 million expires during the years 2020 to 2026 and $9 million of which may be carried forward indefinitely. Our tax valuation allowance relates primarily to our ability to realize certain of these foreign net operating loss carryforwards.
Effective January 1, 2010, a new tax law in Hungary provided for an enhanced deduction for the qualified research and development expenses of NI Hungary Software and Hardware Manufacturing Kft. (“NI Hungary”). During the three months ended December 31, 2009, we obtained confirmation of the application of this new tax law for the qualified research and development expenses of NI Hungary. Based on the application of this new tax law to the qualified research and development expense of NI Hungary, we do not expect to have sufficient future taxable income in Hungary to realize the benefits of NI Hungary’s deferred tax assets. Therefore, we had a full valuation allowance against those assets at December 31, 2017.
Earnings from our operations in Malaysia are free of tax under a tax holiday effective January 1, 2013. This tax holiday expires in 2027. If we fail to satisfy the conditions of the tax holiday, this tax benefit may be terminated early. The tax holiday resulted in income tax benefits of $5.5 million and $3.3 million for the years ended December 31, 2017 and 2016, respective1y. The impact of the tax holiday on a per share basis for the years ended December 31, 2017 and 2016 was a benefit of $0.04 and $0.03 per share, respectively.
We account for uncertainty in income taxes recognized in our financial statements using prescribed recognition thresholds and measurement attributes for financial statement disclosure of tax positions taken or expected to be taken on our tax returns. A reconciliation of the beginning and ending amount of unrecognized tax benefit is as follows:
(In thousands) | December 31, 2017 | December 31, 2016 | ||||||
Balance at beginning of period | $ | 11,719 | $ | 12,496 | ||||
Additions based on tax positions related to the current year | 1,763 | 2,296 | ||||||
Additions for tax positions of prior years | 399 | 435 | ||||||
Reductions as a result of the closing of open tax periods | (3,723 | ) | (3,508 | ) | ||||
Balance at end of period | $ | 10,158 | $ | 11,719 | ||||
All of our unrecognized tax benefits at December 31, 2017 would affect our effective income tax rate if recognized. As of December 31, 2017, it is reasonably possible that we will recognize tax benefits in the amount of $1.5 million in the next twelve months due to the closing of open tax years. The nature of the uncertainty is related to deductions taken on returns that have not been examined by the applicable tax authority.
We recognize interest and penalties related to income tax matters in income tax expense. During each of the years ended December 31, 2017 and 2016, we recognized interest expense related to uncertain tax positions of approximately $0.4 million.
The tax years 2008 through 2017 remain open to examination by the major taxing jurisdictions to which we are subject. The Internal Revenue Service ("IRS") concluded an examination of our U.S. income tax returns for 2010 and 2011 in the third quarter of 2014.
F-28
Note 10 – Comprehensive income
Our comprehensive income is comprised of net income, foreign currency translation, unrealized gains and losses on forward contracts and securities classified as available-for-sale. The accumulated other comprehensive income, net of tax, for the years ended December 31, 2017 and 2016, consisted of the following:
| December 31, 2017 | |||||||||||||||
(In thousands) | Currency translation adjustment | Investments | Derivative instruments | Accumulated other comprehensive income (loss) | ||||||||||||
Balance as of December 31, 2016 | $ | (37,174 | ) | $ | (669 | ) | $ | 3,222 | $ | (34,621 | ) | |||||
Current-period other comprehensive income (loss) | 24,470 | (120 | ) | (6,540 | ) | 17,810 | ||||||||||
Reclassified from accumulated OCI into income | — | — | (2,948 | ) | (2,948 | ) | ||||||||||
Income tax benefit (expense) | (13 | ) | 7 | 3,256 | 3,250 | |||||||||||
Balance as of December 31, 2017 | $ | (12,717 | ) | $ | (782 | ) | $ | (3,010 | ) | $ | (16,509 | ) | ||||
| December 31, 2016 | |||||||||||||||
(In thousands) | Currency translation adjustment | Investments | Derivative instruments | Accumulated other comprehensive income (loss) | ||||||||||||
Balance as of December 31, 2015 | $ | (31,871 | ) | $ | (857 | ) | $ | (5,362 | ) | $ | (38,090 | ) | ||||
Current-period other comprehensive income (loss) | (5,697 | ) | 210 | 10,668 | 5,181 | |||||||||||
Reclassified from accumulated OCI into income | — | — | 2,498 | 2,498 | ||||||||||||
Income tax benefit (expense) | 394 | (22 | ) | (4,582 | ) | (4,210 | ) | |||||||||
Balance as of December 31, 2016 | $ | (37,174 | ) | $ | (669 | ) | $ | 3,222 | $ | (34,621 | ) | |||||
Note 11 – Authorized shares of common and preferred stock and stock-based compensation plans
Authorized shares of common and preferred stock
Following approval by the Company’s Board of Directors and stockholders, on May 14, 2013, the Company’s certificate of incorporation was amended to increase the authorized shares of common stock by 180,000,000 shares to a total of 360,000,000 shares. As a result of this amendment, the total number of shares which the Company is authorized to issue is 365,000,000 shares, consisting of (i) 5,000,000 shares of preferred stock, par value $0.01 per share, and (ii) 360,000,000 shares of common stock, par value $0.01 per share.
Stock option plans
Our stockholders approved the 1994 Incentive Stock Option Plan (the “1994 Plan”) in May 1994. At the time of approval, 13,668,750 shares of our common stock were reserved for issuance under this plan. In 1997, an additional 10,631,250 shares of our common stock were reserved for issuance under this plan, and an additional 1,125,000 shares were reserved for issuance under this plan in 2004. The 1994 Plan terminated in May 2005, except with respect to outstanding awards previously granted thereunder. There have been no outstanding awards under the 1994 Plan since 2015.
The aggregate intrinsic value of stock options at exercise was $0, $0 and $0.4 million for the years ended December 31, 2017, 2016, and 2015, respectively. There was no unrecognized stock-based compensation expense related to unvested stock options as of December 31, 2017.
F-29
Restricted stock plans
Our stockholders approved our 2005 Incentive Plan (the “2005 Plan”) in May 2005. At the time of approval, 4,050,000 shares of our common stock were reserved for issuance under this plan, as well as the number of shares which had been reserved but not issued under the 1994 Plan (our incentive stock option plan which terminated in May 2005), and any shares that returned to the 1994 Plan as a result of termination of options or repurchase of shares issued under such plan. The 2005 Plan provided for the granting of incentive awards in the form of restricted stock and RSUs to directors, executive officers and employees of the Company and its subsidiaries. Awards vest over a three, five or ten-year period, beginning on the date of grant. Vesting of 10 year awards may accelerate based on the Company’s previous year’s earnings and growth but 10 year awards cannot accelerate to vest over a period of less than 5 years. The 2005 Plan terminated on May 11, 2010, except with respect to outstanding awards previously granted thereunder. There were 3,362,304 shares of common stock that were reserved but not issued under the 1994 Plan and the 2005 Plan as of May 11, 2010.
Our stockholders approved our 2010 Incentive Plan (the “2010 Plan”) on May 11, 2010. At the time of approval, 3,000,000 shares of our common stock were reserved for issuance under this plan, as well as the 3,362,304 shares of common stock that were reserved but not issued under the 1994 Plan and the 2005 Plan as of May 11, 2010, and any shares that are returned to the 1994 Plan and the 2005 Plan as a result of forfeiture or termination of options or RSUs or repurchase of shares issued under these plans. The 2010 Plan provided for the granting of incentive awards in the form of restricted stock and RSUs to employees, directors and consultants of the Company and employees and consultants of any parent or subsidiary of the Company. Awards vest over a three, five or ten-year period, beginning on the date of grant. Vesting of ten year awards may accelerate based on the Company’s previous year’s earnings and growth but ten year awards cannot accelerate to vest over a period of less than five years. There were 2,518,416 shares of common stock that were reserved but not issued under the 2010 Plan as of May 12, 2015.
Our stockholders approved our 2015 Equity Incentive Plan (the “2015 Plan”) on May 12, 2015. At the time of approval, 3,000,000 shares of our common stock were reserved for issuance under this plan, as well as the 2,518,416 shares of common stock that were reserved but not issued under the 2010 Plan, and any shares that were returned to the 1994, 2005, and the 2010 Plans as a result of the forfeiture or termination of options or RSUs or repurchase of shares issued under these plans. The 2015 Plan provides for the granting of incentive awards in the form of restricted stock and RSUs to employees, directors and consultants of the Company and employees and consultants of any parent or subsidiary of the Company. Awards vest over a three, four, five or ten-year period, beginning on the date of grant. Vesting of ten year awards may accelerate based on the Company’s previous year’s earnings and growth but ten year awards cannot accelerate to vest over a period of less than five years. There were 3,840,255 shares available for grant under the 2015 Plan at December 31, 2017.
We adopted ASU 2016-09 Improvements to Employee Share-Based Accounting for the year ended December 31, 2017. In accordance with ASU 2016-09, we elected to adjust compensation expense recorded as forfeitures of RSUs occur. During the year ended December 31, 2017, we did not make any other changes in accounting principles or methods of estimates related to the 2010 and 2015 Plans.
Transactions under our 2010 Plan and 2015 Plan are summarized as follows:
| RSUs | ||||||
| Number of RSUs | Weighted average grant price per share | |||||
Outstanding at December 31, 2014 | 2,845,419 | $ | 26.90 | ||||
Granted | 951,265 | $ | 31.39 | ||||
Earned | (709,724 | ) | $ | 28.60 | |||
Canceled | (200,219 | ) | $ | 28.39 | |||
Outstanding at December 31, 2015 | 2,886,741 | $ | 28.64 | ||||
Granted | 791,932 | $ | 28.02 | ||||
Earned | (676,322 | ) | $ | 27.57 | |||
Canceled | (196,150 | ) | $ | 28.73 | |||
Outstanding at December 31, 2016 | 2,806,201 | $ | 28.76 | ||||
Granted | 1,205,920 | $ | 34.57 | ||||
Earned | (666,786 | ) | $ | 28.05 | |||
Canceled | (192,371 | ) | $ | 29.73 | |||
Outstanding at December 31, 2017 | 3,152,964 | $ | 31.07 | ||||
F-30
Total unrecognized stock-based compensation expense related to non-vested RSUs was approximately $70.6 million as of December 31, 2017, related to 3,152,964 shares with a per share weighted average fair value of $31.07. We anticipate this expense to be recognized over a weighted average period of approximately 4.29 years.
Employee stock purchase plan
Our employee stock purchase plan permits substantially all domestic employees and employees of designated subsidiaries to acquire our common stock at a purchase price of 85% of the lower of the market price at the beginning or the end of the purchase period. The plan has quarterly purchase periods generally beginning on February 1, May 1, August 1 and November 1 of each year. Employees may designate up to 15% of their compensation for the purchase of common stock under this plan. On May 9, 2017, our stockholders approved an additional 3,000,000 shares for issuance under our employee stock purchase plan, and at December 31, 2017, we had 2,867,897 shares of common stock reserved for future issuance under this plan. We issued 1,065,154 shares under this plan in the year ended December 31, 2017. The weighted average purchase price of the shares under this plan was $28.11 per share. The grant date fair value of the purchase rights was estimated using the Black-Scholes model with the following assumptions:
| 2017 | 2016 | 2015 | ||||||
Dividend expense yield | 0.650 | % | 0.700 | % | 0.625 | % | |||
Expected life | 3 months | 3 months | 3 months | ||||||
Expected volatility | 18 | % | 22 | % | 21 | % | |||
Risk-free interest rate | 0.48 | % | 0.15 | % | 0.02 | % | |||
Weighted average, grant date fair value of purchase rights granted under the employee stock purchase plan are as follows:
| Number of Shares | Weighted average fair value per share | |||||
2015 | 1,108,153 | $ | 5.58 | ||||
2016 | 1,217,829 | $ | 5.37 | ||||
2017 | 1,065,154 | $ | 6.80 | ||||
During the year ended December 31, 2017, we did not make any changes in accounting principles or methods of estimates with respect to the employee stock purchase plan.
Authorized Preferred Stock and Preferred Stock Purchase Rights Plan
We have 5,000,000 authorized shares of preferred stock. On January 21, 2004, our Board of Directors designated 750,000 of these shares as Series A Participating Preferred Stock in conjunction with its adoption of a Preferred Stock Rights Agreement which expired on May 10, 2014. There were no shares of preferred stock issued and outstanding as of December 31, 2017.
Stock repurchases and retirements
From time to time, our Board of Directors has authorized a program to repurchase shares of our common stock depending on market conditions and other factors. We did not make any purchases under this program during the twelve months ended December 31, 2017. We repurchased a total of 206,780 shares of our common stock at a weighted average price per share of $27.25 during the twelve months ended December 31, 2016. At December 31, 2017, there were 1,134,247 shares remaining available for repurchase under this program. This repurchase program does not have an expiration date.
At December 31, 2017, there were no options outstanding as all remaining options were either exercised or expired during the twelve month period ended December 31, 2015.
Note 12 – Employee retirement plan
We have a defined contribution retirement plan pursuant to Section 401(k) of the Internal Revenue Code. Substantially all domestic employees with at least 30 days of continuous service are eligible to participate and may contribute up to 15% of their compensation to such plan. The Board of Directors has elected to make matching contributions equal to 50% of employee contributions, which could be applied to up to 8% of each participant’s compensation during 2017 and up to 6% of each participant's compensation during 2016 and 2015. Employees are eligible for matching contributions after one year of continuous service. Company contributions vest immediately. Our policy prohibits participants from direct investment in shares of our common stock within the plan. Company contributions charged to expense were $9.5 million, $7.1 million and $6.8 million in 2017, 2016, and 2015, respectively.
F-31
Note 13 – Segment and geographic information
We operate as one operating segment. Operating segments are defined as components of an enterprise for which separate financial information is evaluated regularly by the chief operating decision maker, who is our chief executive officer, in deciding how to allocate resources and in assessing performance. Our chief operating decision maker evaluates our financial information and resources and assesses the performance of these resources on a consolidated basis. Since we operate in one operating segment, all required financial segment information can be found in the condensed consolidated financial statements and the notes thereto.
Total net sales by the major geographic areas in which we operate, are as follows:
(In thousands) | Years Ended December 31, | |||||||||||
| 2017 | 2016 | 2015 | |||||||||
Net sales: | ||||||||||||
Americas | $ | 504,626 | $ | 482,039 | $ | 496,746 | ||||||
EMEIA | 408,625 | 389,843 | 409,119 | |||||||||
APAC | 376,135 | 356,297 | 319,591 | |||||||||
Total | $ | 1,289,386 | $ | 1,228,179 | $ | 1,225,456 | ||||||
Based on the billing location of the customer, total sales outside the U.S. for years ended December 31, 2017, 2016, and 2015 were $816 million, $773 million, and $762 million, respectively.
Total property and equipment, net, outside the U.S. for the years ended December 31, 2017, 2016, and 2015 were $132 million, $133 million, and $138 million, respectively.
Note 14 - Debt
On May 9, 2013, we entered into a Loan Agreement (the “Loan Agreement”) with Wells Fargo Bank (the “Lender”). The Loan Agreement provided for a $50 million unsecured revolving line of credit with a scheduled maturity date of May 9, 2018 (the “Maturity Date”). On October 29, 2015, we entered into a First Amendment to Loan Agreement (the “Amendment”) with the Lender, which amended our Loan Agreement to among other things, (i) increase the unsecured revolving line of credit from $50.0 million to $125.0 million, (ii) extend the Maturity Date of the line of credit from May 9, 2018 to October 29, 2020, and (iii) provide us with an option to request increases to the line of credit of up to an additional $25.0 million in the aggregate, subject to consent of the Lender and terms and conditions to be mutually agreed between us and the Lender.
The loans bear interest, at our option, at a base rate determined in accordance with the Loan Agreement, plus a spread of 0% to 0.5%, or a LIBOR rate plus a spread of 1.125% to 2.0%, in each case with such spread determined based on a ratio of consolidated indebtedness to EBITDA, determined in accordance with the Loan Agreement. Principal, together with all accrued and unpaid interest, is due and payable on the Maturity Date. We are also obligated to pay a quarterly commitment fee, payable in arrears, based on the available commitments at a rate of 0.175% to 0.300%, with such rate determined based on the ratio described above. The Loan Agreement contains customary affirmative and negative covenants. The affirmative covenants include, among other things, delivery of financial statements, compliance certificates and notices; payment of taxes and other obligations; maintenance of existence; maintenance of properties and insurance; and compliance with applicable laws and regulations. The negative covenants include, among other things, limitations on indebtedness, liens, mergers, consolidations, acquisitions and sales of assets, investments, changes in the nature of the business, affiliate transactions and certain restricted payments. The Loan Agreement also requires us to maintain a ratio of consolidated indebtedness to EBITDA equal to or less than 3.25 to 1.00, and a ratio of consolidated EBITDA to interest expense greater than or equal to 3.00 to 1.00, in each case determined in accordance with the Loan Agreement. As of December 31, 2017, we were in compliance with all covenants in the Loan Agreement.
The Loan Agreement contains customary events of default including, among other things, payment defaults, breaches of covenants or representations and warranties, cross-defaults with certain other indebtedness, bankruptcy and insolvency events, judgment defaults and change in control events, subject to grace periods in certain instances. Upon an event of default, the lender may declare all or a portion of the outstanding obligations payable by us to be immediately due and payable and exercise other rights and remedies provided for under the Loan Agreement. Under certain circumstances, a default interest rate will apply on all obligations during the existence of an event of default under the Loan Agreement at a per annum rate of interest equal to 2.00% above the otherwise applicable interest rate.
Proceeds of loans made under the Loan Agreement may be used for working capital and other general corporate purposes. We may prepay the loans under the Loan Agreement in whole or in part at any time without premium or penalty. Certain of our existing and future material domestic subsidiaries are required to guaranty our obligations under the Loan Agreement.
F-32
As of December 31, 2017, we had outstanding $0 million in borrowings under this revolving line of credit. During the years ended December 31, 2017 and 2016, we incurred interest expense related to our outstanding borrowings of $457,000 and $534,000, respectively. As of December 31, 2017 and 2016, our weighted-average annual interest rate on the line of credit was 2.4% and 1.6%, respectively.
F-33
Note 15 – Commitments and Contingencies
We have commitments under non-cancelable operating leases primarily for office facilities throughout the world. Certain leases require us to pay property taxes, insurance and routine maintenance, and include escalation clauses. Future minimum lease payments as of December 31, 2017, for each of the next five years are as follows:
| Amount | ||
| (In thousands) | ||
2018 | $ | 20,012 | |
2019 | 15,696 | ||
2020 | 10,875 | ||
2021 | 7,853 | ||
2022 | 5,298 | ||
Thereafter | 17,570 | ||
Total | $ | 77,304 | |
Rent expense under operating leases was approximately $20 million for each of the years ended December 31, 2017, 2016, and 2015, respectively.
As of December 31, 2017, we had non-cancelable purchase commitments with various suppliers of customized inventory and inventory components totaling approximately $9.1 million over the next twelve months.
As of December 31, 2017, we had outstanding guarantees for payment of customs and foreign grants totaling approximately $2.6 million, which are generally payable over the next twelve months.
Note 16 – Litigation
We are not currently a party to any material litigation. However, in the ordinary course of our business, we are involved in a limited number of legal actions, both as plaintiff and defendant, and could incur uninsured liability in any one or more of them. We also periodically receive notifications from various third parties related to alleged infringement of patents or intellectual property rights, commercial disputes or other matters. No assurances can be given with respect to the extent or outcome of any future litigation or dispute.
Note 17 – Acquisitions
Micropross
On October 23, 2015, we completed the acquisition of M2, a privately held French holding company and its wholly-owned subsidiary, Micropross, a supplier of software-based test systems for Near Field Communications (NFC), smart cards, and wireless charging test systems, pursuant to an Agreement for the Sale and Purchase of Shares (the “Purchase Agreement”). Under the terms of the Purchase Agreement, the purchase price of the transaction was approximately $99 million, which included $89 million cash consideration paid directly to existing shareholders and $10.4 million of consideration which was paid by issuing an aggregate of 367,481 shares of our common stock. We also assumed and repaid $5 million of existing Micropross borrowings, net of cash received. The results of operations of Micropross are included in our consolidated financial statements from the date of acquisition.
The allocation of the purchase price was determined using the fair value of assets and liabilities acquired as of October 23, 2015.
Other Acquisitions
During the twelve month period ending December 31, 2015, we acquired four additional businesses, all of which were treated as business combinations. The total purchase price for these four acquisitions was approximately $36 million which consisted of $31 million cash, net of $1.5 million in cash received, $1.1 million in cash obligations incurred to former owners, $3.4 million in shares of our common stock, and $0.2 million of a previously-held interest in an equity-method investee. The acquired businesses included a leading designer, manufacturer, and provider of data acquisition solutions for the test and measurement marketplace, a technology innovator and leading supplier of high-performance FPGA prototyping and deployment products for advanced wireless research, wireless infrastructure and military/defense applications and a PXI modular instruments hardware product line. Our consolidated financial statements include the operating results from the dates of acquisition.
The allocation of the purchase price was determined using the fair value of assets and liabilities acquired as of the acquisition dates.
F-34
Pro-forma Results of Operations
Pro-forma results of operations have not been presented because the effects of the acquired operations were not material individually or in the aggregate. We finalized the purchase price allocation for the Micropross acquisition during the fourth quarter of 2016. These measurement period adjustments included $0.9 million related to the write-down to fair value of acquired deferred revenue and $0.7 million related to the step-up to fair value of acquired inventory. The $1.6 million increase in identifiable net assets acquired was offset by a decrease in goodwill. The income statement impact for 2015 related to these fair value adjustments was not significant and the entire $1.6 million adjustment was recognized in earnings during the fourth quarter of 2016 in accordance with ASU 2015-16, Business Combinations: Simplifying the Accounting for Measurement-Period Adjustments.
We allocate the fair value of the purchase consideration of the Company’s acquisitions to the tangible assets, intangible assets, including in-process research and development (“IPR&D”), if any, and liabilities assumed, based on estimated fair values. The excess of the fair value of purchase consideration over the fair values of these identifiable assets and liabilities is recorded as goodwill. IPR&D is initially capitalized at fair value as an intangible asset with an indefinite life and assessed for impairment thereafter. When a project underlying reported IPR&D is completed, the corresponding amount of IPR&D is amortized over the asset’s estimated useful life. Acquisition-related expenses are recognized separately from the business combination and are expensed as incurred in “Selling, General, and Administrative” in the Consolidated Statements of Operations. The following table summarizes the finalized aggregate purchase price allocation of our 2015 acquisitions as of December 31, 2016 (in thousands):
Purchase Price | |||
| |||
Cash consideration paid to former shareholders | $ | 121,944 | |
| |||
Issuance of common stock | 13,778 | ||
Fair value of previously held interest in equity method investee | 214 | ||
Future payment obligations | 1,139 | ||
Non-Cash Consideration | 15,131 | ||
| |||
Total Purchase Price | $ | 137,075 | |
| |||
Net Assets Acquired | |||
| |||
Fair value of debt assumed and cash received | $ | (3,668 | ) |
Fair value of tangible net assets acquired (excluding debt assumed and cash received) | 2,721 | ||
Fair value of identifiable intangible assets acquired | 30,783 | ||
Goodwill | 115,050 | ||
Deferred Tax Assets/(Liabilities) | (7,811 | ) | |
| |||
Total Net Assets Acquired | $ | 137,075 | |
Goodwill is not deductible for tax purposes for two of our five acquisitions. Amortizable intangible assets have useful lives of 2 years to 5 years from the date of acquisition. These assets are not deductible for tax purposes for two of our five acquisitions.
F-35
Note 18 - Restructuring
During 2017, we took steps to reduce our overall employee headcount by approximately 2% as of the end of December 31, 2017, in an effort to minimize job duplication or evaluate where we should shift and centralize activities, improve efficiencies, and rebalance our resources on higher return activities. The timing and scope of any future headcount reductions will vary.
A summary of the charges in the consolidated statement of operations resulting from our restructuring activities is shown below:
(In thousands) | Year Ended | |
2017 | ||
Cost of sales | 1,208 | |
Research and development | 2,990 | |
Sales and marketing | 10,968 | |
General and Administration | 1,898 | |
Total restructuring and other related costs | 17,064 | |
Total restructuring and other one-time charges incurred through December 31, 2017 related to this initiative were $17.1 million, of which $15.6 million related to employee severance and facility exit costs and $1.5 million related to asset impairment and accelerated depreciation.
A summary of balance sheet activity related to the restructuring activity is shown below:
Restructuring Liability | ||
Balance as of December 31, 2016 | — | |
Income statement expense | 17,064 | |
Asset write-downs and accelerated depreciation | (1,479 | ) |
Cash payments | (10,177 | ) |
Balance as of December 31, 2017 | 5,408 | |
The restructuring liability of $5.4 million at December 31, 2017 relating primarily to severance payments associated with the restructuring activity is recorded in the “accrued compensation” line item of the consolidated balance sheet.
Note 19 – Subsequent events
On January 24, 2018, our Board of Directors declared a quarterly cash dividend of $0.23 per common share, payable on March 5, 2018, to stockholders of record on February 12, 2018.
F-36