Attached files
| file | filename |
|---|---|
| 8-K - 8-K - MWI Veterinary Supply, Inc. | a10-3398_18k.htm |
Exhibit 99.1
|
|
2010 ANNUAL STOCKHOLDERS’ MEETING |
|
|
MWI Company Overview and Fiscal Year 2009 Review Jim Cleary Mary Pat Thompson |
|
|
Disclaimer/Forward-Looking Statements This presentation may contain forward-looking statements based on current management expectations. Numerous factors, including those related to market conditions and those detailed in our Annual Report on Form 10-K, may cause results to differ materially from those anticipated in forward-looking statements. Many of the factors that will determine the Company’s future results are beyond the ability of the Company to control or predict. These statements are subject to risks and uncertainties and, therefore, actual results may differ materially. Potential investors should not place undue reliance on forward-looking statements, which reflect management’s views only as of the date hereof. The Company undertakes no obligation to revise or update any forward-looking statements, or to make any other forward-looking statements, whether as a result of new information, future events or otherwise. |
|
|
MWI Mission Statement MWI will be the best resource to the veterinary profession by delivering superior value, efficiency and innovation. |
|
|
MWI Core Values MWI’s culture is driven by our five core values of customer service, integrity, dedication, innovation and quality. With a history of over 30 years in veterinary distribution, we believe we have developed a strong culture and business model for the future. integrity customer service dedication innovation quality |
|
|
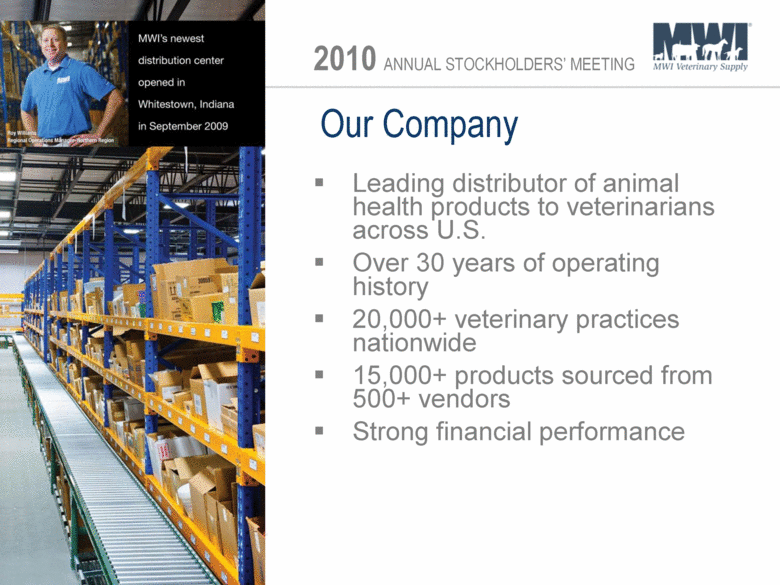
Our Company Leading distributor of animal health products to veterinarians across U.S. Over 30 years of operating history 20,000+ veterinary practices nationwide 15,000+ products sourced from 500+ vendors Strong financial performance |
|
|
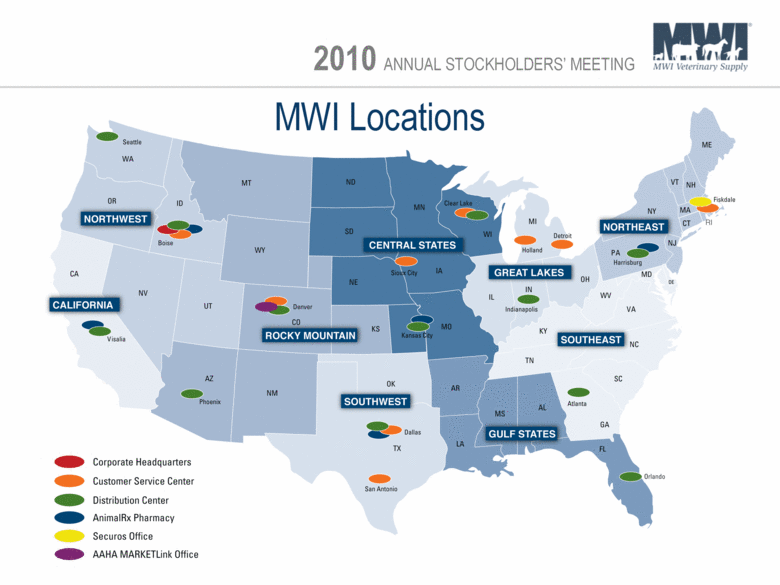
MWI Locations Corporate Headquarters Customer Service Center Distribution Center AnimalRx Pharmacy Securos Office AAHA MARKETLink Office |
|
|
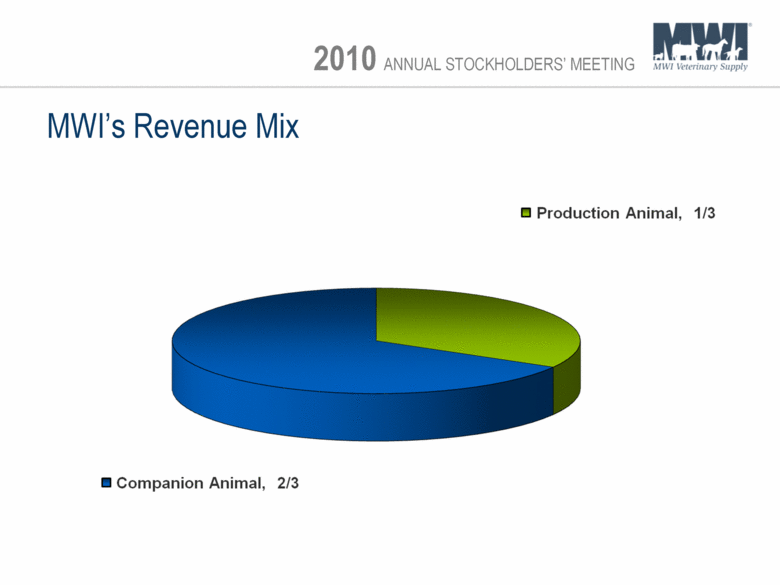
MWI’s Revenue Mix Production Animal, 1/3 Companion Animal, 2/3 |
|
|
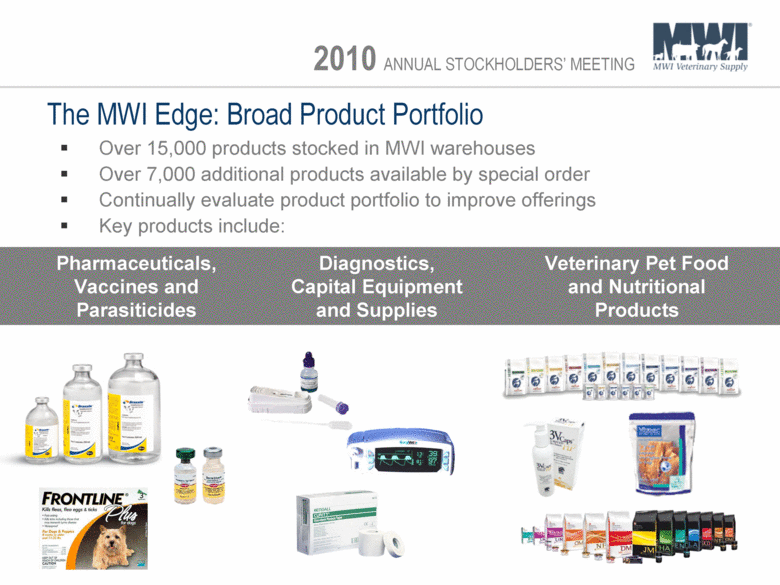
The MWI Edge: Broad Product Portfolio Over 15,000 products stocked in MWI warehouses Over 7,000 additional products available by special order Continually evaluate product portfolio to improve offerings Key products include: Pharmaceuticals, Vaccines and Parasiticides Diagnostics, Capital Equipment and Supplies Veterinary Pet Food and Nutritional Products |
|
|
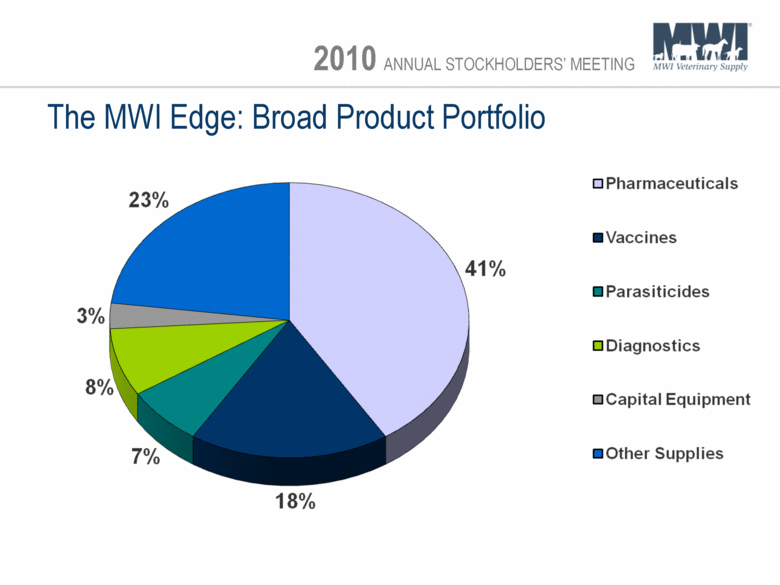
The MWI Edge: Broad Product Portfolio Pharmaceuticals Vaccines Parasiticides Diagnostics Capital Equipment Other Supplies |
|
|
The MWI Edge: Premier Sales and Marketing Franchise Sales Representatives Direct Marketing Dual coverage approach with frequent contact Act as business consultants Continuous training initiatives Performance driven compensation Significant industry experience Over 700,000 pieces of direct marketing material distributed Comprehensive and specialty catalogs, loyalty programs, product/vendor programs, flyers, order stuffers |
|
|
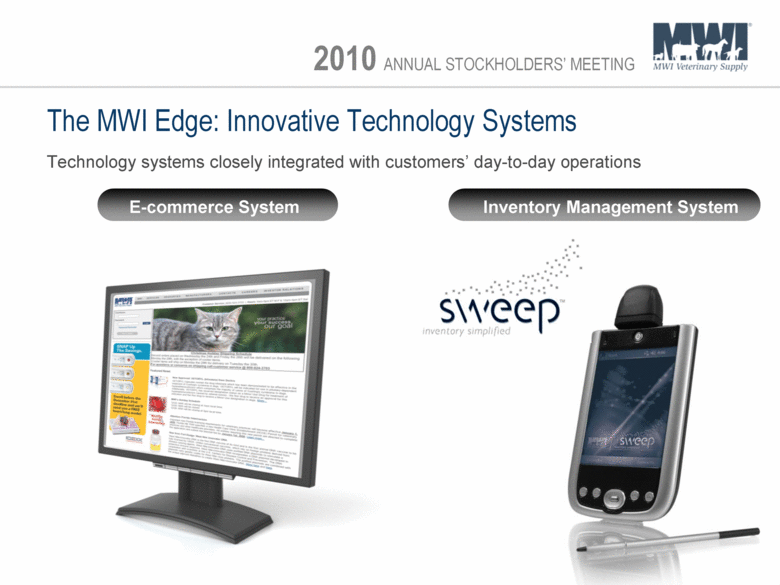
The MWI Edge: Innovative Technology Systems Technology systems closely integrated with customers’ day-to-day operations E-commerce System Inventory Management System |
|
|
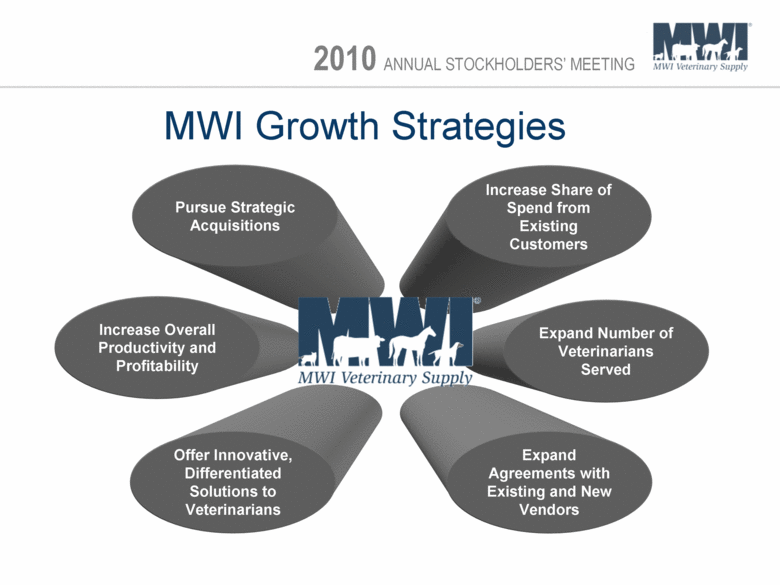
MWI Growth Strategies Expand Number of Veterinarians Served Offer Innovative, Differentiated Solutions to Veterinarians Increase Share of Spend from Existing Customers Pursue Strategic Acquisitions Expand Agreements with Existing and New Vendors Increase Overall Productivity and Profitability |
|
|
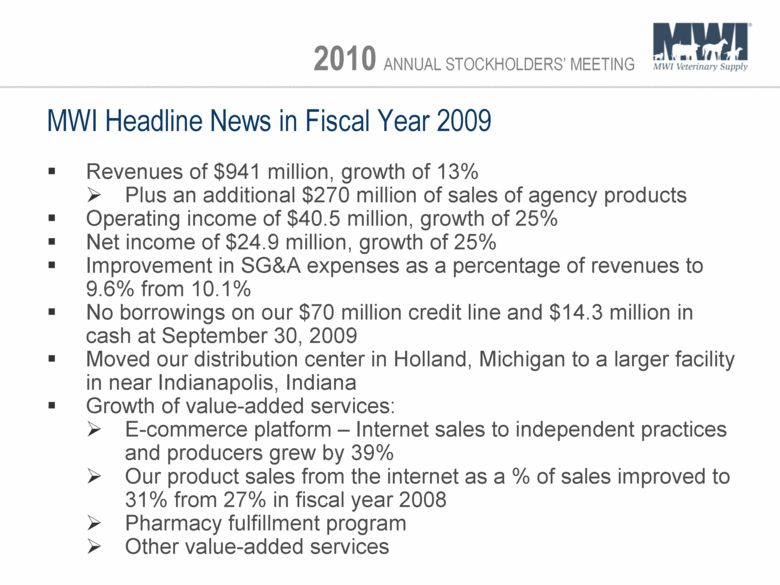
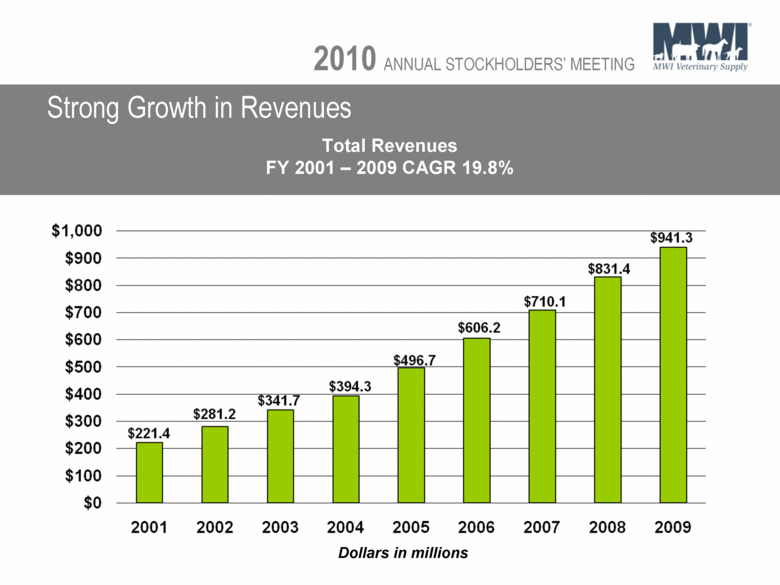
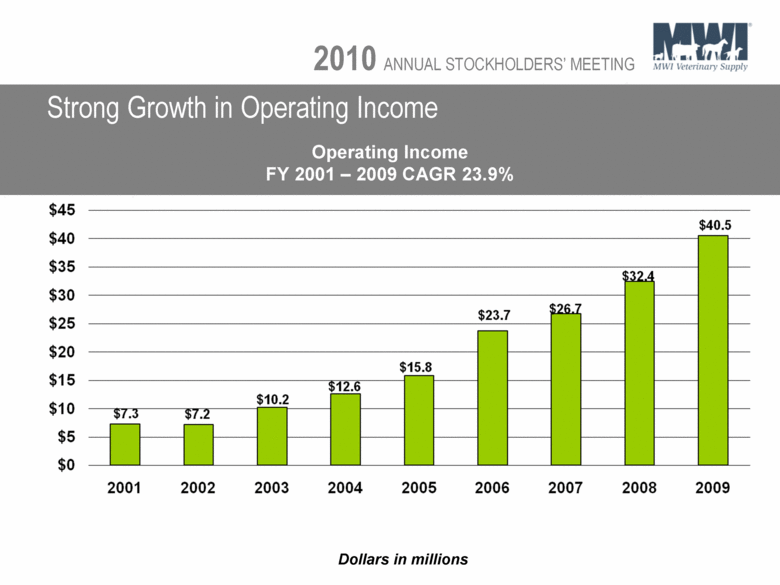
Revenues of $941 million, growth of 13% Plus an additional $270 million of sales of agency products Operating income of $40.5 million, growth of 25% Net income of $24.9 million, growth of 25% Improvement in SG&A expenses as a percentage of revenues to 9.6% from 10.1% No borrowings on our $70 million credit line and $14.3 million in cash at September 30, 2009 Moved our distribution center in Holland, Michigan to a larger facility in near Indianapolis, Indiana Growth of value-added services: E-commerce platform – Internet sales to independent practices and producers grew by 39% Our product sales from the internet as a % of sales improved to 31% from 27% in fiscal year 2008 Pharmacy fulfillment program Other value-added services MWI Headline News in Fiscal Year 2009 |
|
|
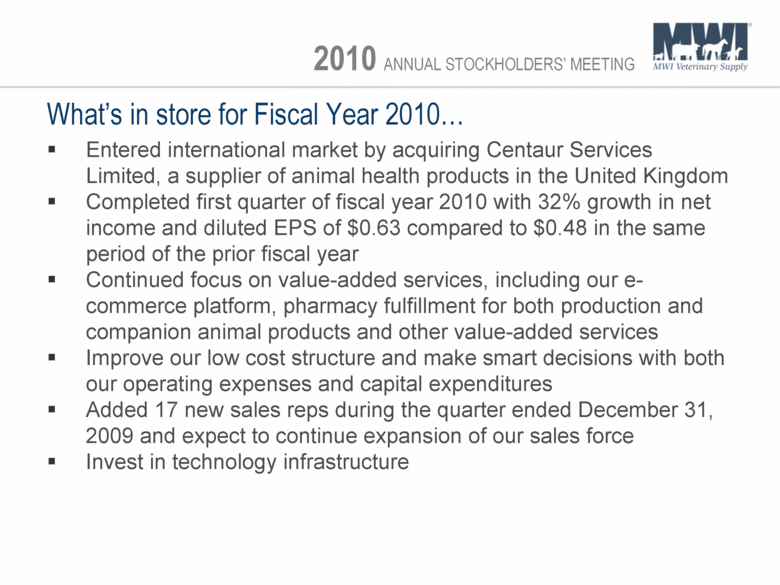
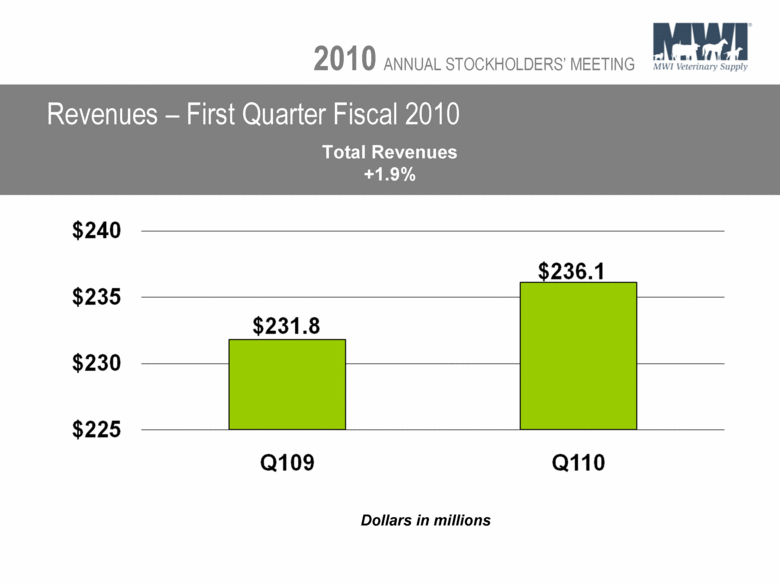
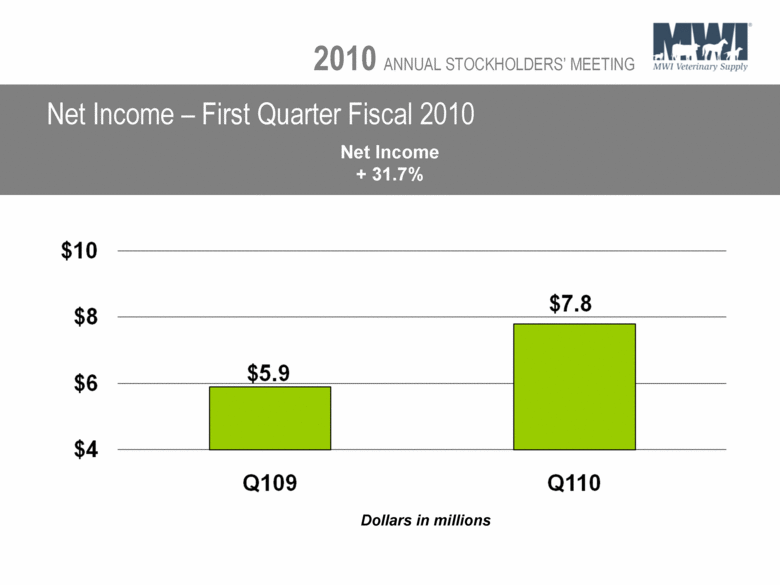
What’s in store for Fiscal Year 2010... Entered international market by acquiring Centaur Services Limited, a supplier of animal health products in the United Kingdom Completed first quarter of fiscal year 2010 with 32% growth in net income and diluted EPS of $0.63 compared to $0.48 in the same period of the prior fiscal year Continued focus on value-added services, including our e-commerce platform, pharmacy fulfillment for both production and companion animal products and other value-added services Improve our low cost structure and make smart decisions with both our operating expenses and capital expenditures Added 17 new sales reps during the quarter ended December 31, 2009 and expect to continue expansion of our sales force Invest in technology infrastructure |
|
|
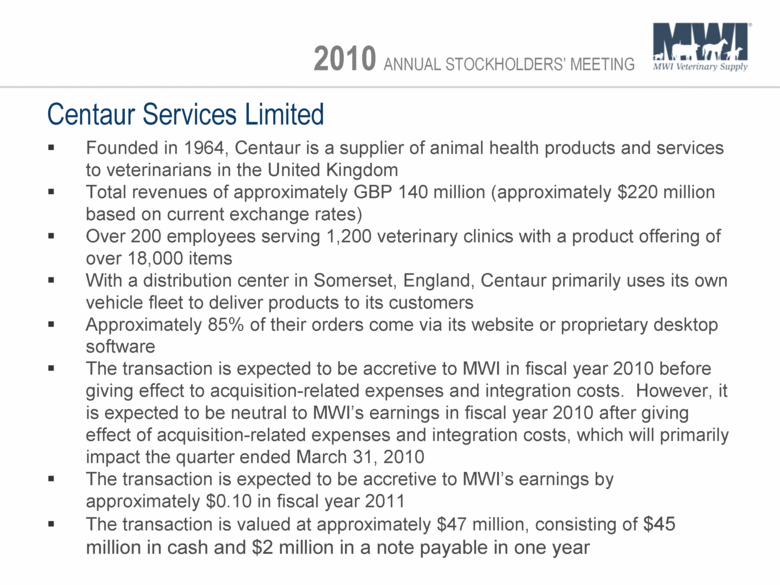
Centaur Services Limited Founded in 1964, Centaur is a supplier of animal health products and services to veterinarians in the United Kingdom Total revenues of approximately GBP 140 million (approximately $220 million based on current exchange rates) Over 200 employees serving 1,200 veterinary clinics with a product offering of over 18,000 items With a distribution center in Somerset, England, Centaur primarily uses its own vehicle fleet to deliver products to its customers Approximately 85% of their orders come via its website or proprietary desktop software The transaction is expected to be accretive to MWI in fiscal year 2010 before giving effect to acquisition-related expenses and integration costs. However, it is expected to be neutral to MWI’s earnings in fiscal year 2010 after giving effect of acquisition-related expenses and integration costs, which will primarily impact the quarter ended March 31, 2010 The transaction is expected to be accretive to MWI’s earnings by approximately $0.10 in fiscal year 2011 The transaction is valued at approximately $47 million, consisting of $45 million in cash and $2 million in a note payable in one year |
|
|
Financial Overview Mary Pat Thompson |
|
|
Total Revenues FY 2001 – 2009 CAGR 19.8% Strong Growth in Revenues Dollars in millions |
|
|
Operating Income FY 2001 – 2009 CAGR 23.9% Strong Growth in Operating Income Dollars in millions |
|
|
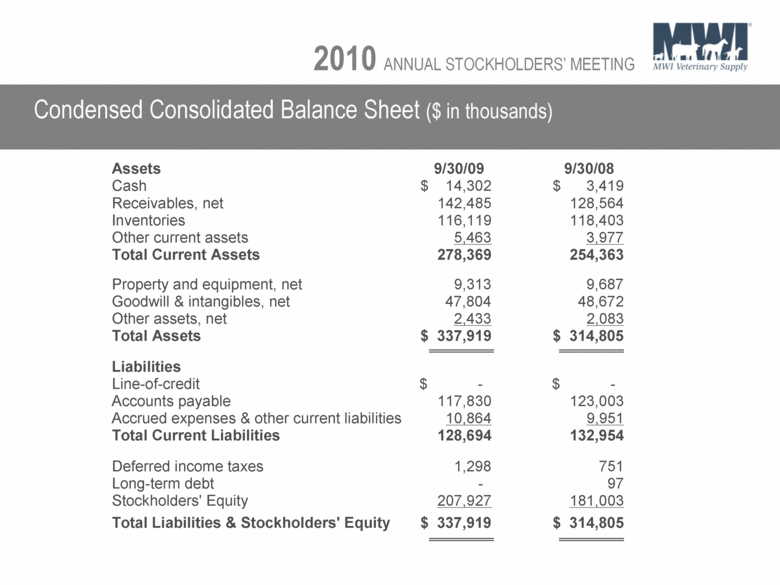
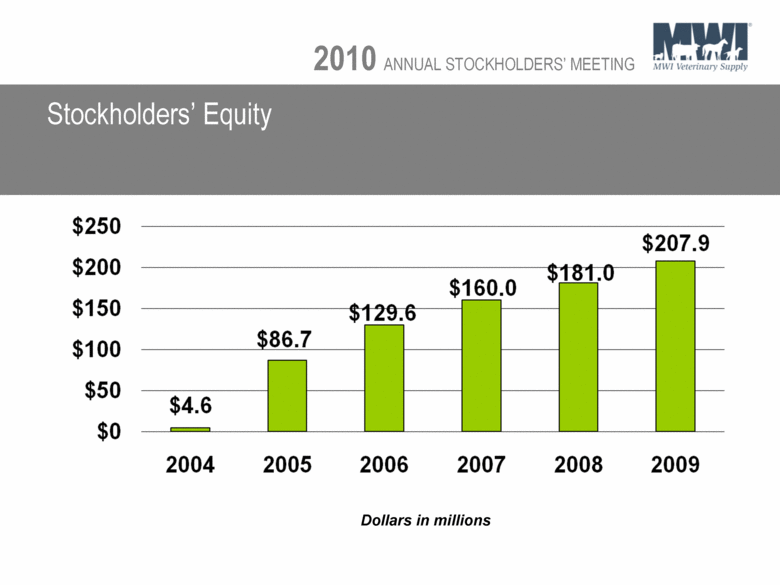
Condensed Consolidated Balance Sheet ($ in thousands) Assets 9/30/09 9/30/08 Cash $ 14,302 $ 3,419 Receivables, net 142,485 128,564 Inventories 116,119 118,403 Other current assets 5,463 3,977 Total Current Assets 278,369 254,363 Property and equipment, net 9,313 9,687 Goodwill & intangibles, net 47,804 48,672 Other assets, net 2,433 2,083 Total Assets $ 337,919 $ 314,805 Liabilities Line-of-credit $ - $ - Accounts payable 117,830 123,003 Accrued expenses & other current liabilities 10,864 9,951 Total Current Liabilities 128,694 132,954 Deferred income taxes 1,298 751 Long-term debt - 97 Stockholders' Equity 207,927 181,003 Total Liabilities & Stockholders' Equity $ 337,919 $ 314,805 |
|
|
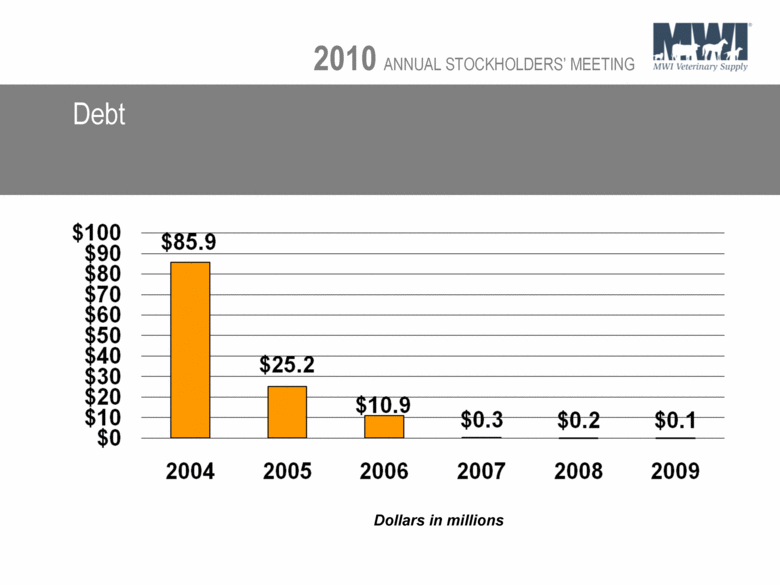
Debt Dollars in millions |
|
|
Stockholders’ Equity Dollars in millions |
|
|
Revenues – First Quarter Fiscal 2010 Dollars in millions Total Revenues +1.9% |
|
|
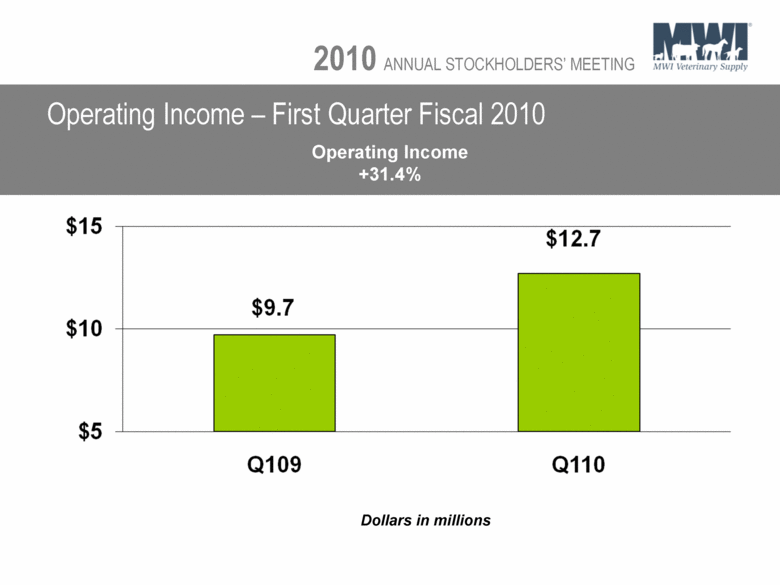
Operating Income – First Quarter Fiscal 2010 Dollars in millions Operating Income +31.4% |
|
|
Net Income – First Quarter Fiscal 2010 Dollars in millions Net Income + 31.7% |
|
|
[LOGO] |

