Attached files
| file | filename |
|---|---|
| 8-K - FORM 8-K - IMPERIAL OIL LTD | d8k.htm |
Exhibit 99.1
|
|
 | |||||||||||||||||
| Q4 news release
FOR THE TWELVE MONTHS ENDED DECEMBER 31, 2009
| ||||||||||||||||||
| Calgary, February 2, 2010 | ||||||||||||||||||
| Imperial Oil announces estimated fourth-quarter financial and operating results | ||||||||||||||||||
| Fourth Quarter | Twelve Months | |||||||||||||||||
| (millions of dollars, unless noted) | 2009 | 2008 | % | 2009 | 2008 | % | ||||||||||||
| Net income (U.S. GAAP) |
534 | 660 | (19) | 1,579 | 3,878 | (59) | ||||||||||||
| Net income per common share - assuming dilution (dollars) |
0.62 | 0.76 | (18) | 1.84 | 4.36 | (58) | ||||||||||||
| Capital and exploration expenditures |
834 | 433 | 93 | 2,438 | 1,363 | 79 | ||||||||||||
| Bruce March, chairman, president and chief executive officer of Imperial Oil, commented:
“Lower oil and natural gas prices and low demand for energy products continued to create challenging business conditions. Despite the ongoing economic downturn, Imperial continued to progress our company growth projects and delivered strong results.
Net income for the fourth quarter was $534 million, down 19 percent from the same period in 2008. While our Upstream earnings in the fourth quarter were up from the same period last year, Downstream earnings in the fourth quarter were significantly impacted by lower overall product demand and margins.
With our strong balance sheet, minimal debt, and long-term disciplined approach, we are well positioned to continue to invest through the business cycle. In the fourth quarter, capital and exploration expenditures increased to $834 million, up 93 percent from the same period last year. For the full year 2009, capital and exploration expenditures were $2,438 million, up 79 percent from 2008.
Our disciplined and long-term focused investment approach will continue to reward our shareholders. In 2009, Imperial distributed a total of $833 million to shareholders through dividends and share repurchases while we increased investments in major growth opportunities that will bring on new supplies of energy and growth for shareholders.”
Imperial Oil is one of Canada’s largest corporations and a leading member of the country’s petroleum industry. The company is a major producer of crude oil and natural gas, Canada’s largest petroleum refiner and a leading marketer with a coast-to-coast supply network that includes about 1,850 retail service stations. | ||||||||||||||||||

1
|
|
| |||||||||||||||||
| Fourth quarter highlights
• Net income was $534 million, versus $660 million for the fourth quarter of 2008.
• Net income per common share was $0.62, versus $0.76 for the fourth quarter of 2008.
• Cash flow from operating activities was $927 million, compared with $912 million in the same period last year.
• Capital and exploration expenditures were $834 million, up 93 percent from the fourth quarter of 2008.
• Gross oil-equivalent barrels of production averaged 297,000 barrels a day, compared with 309,000 barrels a day in the same period last year. Lower production volumes in the fourth quarter were primarily due to well repairs in the northern part of the Cold Lake field. Drilling and steaming activities have since resumed in this area, and production is expected to return to normal levels.
• Achieved record safety performance - Imperial achieved its best-ever safety results for both employees and contractors in 2009. This achievement was an outcome of the significant commitment of the entire organization, and reflects Imperial’s focus on operational excellence.
• Advanced Kearl - infrastructure construction and plant site preparation activities continued at the Kearl oil sands mining project, with a workforce of about 2,500 employees and contractors at year end. The Kearl project has a total estimated recoverable resource of 4.6 billion barrels of bitumen before royalties – in which Imperial holds a 71-percent interest.
• Strengthened position in the oil sands - utilizing its strong balance sheet, Imperial, in a 50-50 joint venture with ExxonMobil Canada, acquired oil sands mining leases from UTS Energy Corporation totaling a combined 16,600 net acres in Alberta’s Athabasca region. The new leases are adjacent to existing undeveloped oil sands acreage held by Imperial in the area.
• Progressed exploration at Horn River - Imperial commenced its second winter season exploration program at Horn River in northeast British Columbia and is expected to drill up to 11 shale gas wells. Imperial, together with ExxonMobil Canada (50-50 interest), now holds 309,000 net acres in the area, industry’s largest land position in the basin.
• Update on Mackenzie natural gas project - the Joint Review Panel released its report on the environmental, social and cultural impacts of the Mackenzie natural gas project, with the final regulatory decision expected in September 2010 from the National Energy Board.
• Investing through the down cycle on major growth projects - completed a $2.4 billion capital and exploration program in 2009, focused on advancing major Upstream projects as well as investments in environmental initiatives. Planned capital and exploration expenditures in 2010 are $3.2 billion.
• Contributed to Canadian communities - Imperial contributed $23 million to Canadian communities in 2009, including $2 million towards math and science education. Special contributions in the fourth quarter included a $1 million commitment to the University of Calgary’s School of Public Policy and an $8 million aircraft to the Southern Alberta Institute of Technology for use in its School of Transportation’s aircraft maintenance, avionics and structures programs. | ||||||||||||||||||
2
|
|
| |||||||||||||||||
| Fourth quarter 2009 vs. fourth quarter 2008
Net income for the fourth quarter of 2009 was $534 million or $0.62 a share on a diluted basis, versus $660 million or $0.76 a share for the same period of 2008.
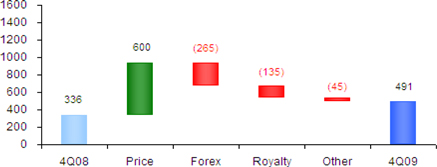
Upstream net income in the fourth quarter was $491 million, $155 million higher than the same period of 2008. Increased earnings were primarily due to higher crude oil commodity prices totaling about $600 million. Improved realizations were partially offset by the negative impacts of a stronger Canadian dollar of about $265 million, higher royalties due to higher commodity prices of about $135 million and lower Cold Lake bitumen production of about $50 million.
The average price of Brent crude oil in U.S. dollars, a common benchmark for world oil markets, strengthened in the fourth quarter, averaging $74.54 a barrel, up about 36 percent from the corresponding period last year. The company’s realizations on sales of Canadian conventional crude oil and synthetic crude oil from Syncrude production mirrored the same trend as world prices. However, the effect of a stronger Canadian dollar limited improvements in the company’s Canadian-dollar realizations for conventional crude oil and synthetic crude oil from Syncrude in the fourth quarter of 2009.
Prices for Canadian heavier crude oil also increased along with the lighter crude oil. The company’s average realizations for Cold Lake bitumen increased about 70 percent in the fourth quarter, compared to the corresponding period last year, reflecting the narrowing price spread between light crude oil and Cold Lake bitumen.
The company’s average realizations for natural gas averaged $4.23 a thousand cubic feet in the fourth quarter, down from $7.31 in the same quarter last year.
Gross production of Cold Lake bitumen averaged 134 thousand barrels a day during the fourth quarter, versus 146 thousand barrels in the same quarter last year. Lower production volumes in the fourth quarter were due to well repairs in the northern part of the field. Drilling and steaming activities have since resumed in this area, and production is expected to return to normal levels.
The company’s share of Syncrude’s gross production in the fourth quarter was 82 thousand barrels a day, versus 77 thousand barrels in the fourth quarter of 2008. Volumes in the fourth quarter were higher than the same period in 2008 due to lower maintenance activities.
In the fourth quarter, gross production of conventional crude oil averaged 24 thousand barrels a day, compared with 27 thousand barrels in the corresponding period in 2008. The natural reservoir decline in the Western Canadian Basin was the main reason for the reduced production.
Gross production of natural gas during the fourth quarter of 2009 was 298 million cubic feet a day, essentially the same as the corresponding period last year.
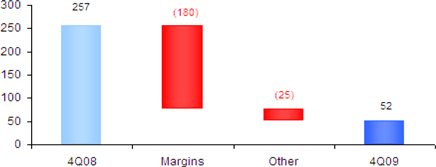
Net income from Downstream was $52 million in the fourth quarter of 2009, compared with $257 million in the same period a year ago. Earnings in the fourth quarter of 2009 were negatively impacted by lower overall margins of about $180 million. Also impacting fourth quarter 2009 earnings was the negative impact of a stronger Canadian dollar.
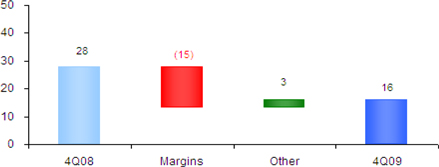
Net income from Chemical was $16 million in the fourth quarter, compared with $28 million in the same quarter last year. Earnings in the fourth quarter were negatively impacted by lower overall margins as a result of the slow economy.
Net income effects from Corporate and other were negative $25 million in the fourth quarter, compared with $39 million in the same period of 2008. The decrease in the fourth quarter was primarily due to changes in share-based compensation charges.
In the fourth quarter of 2009, cash flow of $927 million was generated from operations, and $807 million was used to fund growth projects such as Kearl. The company’s balance of cash was $513 million at December 31, 2009, an increase of $55 million from the end of the third quarter 2009. | ||||||||||||||||||
3
|
|
| |||||||||||||||||
| Full year highlights
• Net income was $1,579 million, down from $3,878 million in 2008.
• Net income per common share decreased to $1.84 compared to $4.36 in 2008.
• Cash flow from operations was $1,591 million, versus $4,263 million in 2008.
• Capital and exploration expenditures were $2,438 million, up 79 percent.
• Gross oil-equivalent barrels of production averaged 293 thousands of barrels per day, compared to 308 thousands of barrels per day in 2008.
• Imperial distributed a total of $833 million cash to shareholders in 2009 through dividends and share repurchases, compared with $2,540 million in 2008.
• Per-share dividends paid in 2009 totaled $0.40, up from $0.37 in 2008.
Full year 2009 vs. full year 2008
Net income for the full year of 2009 was $1,579 million or $1.84 a share on a diluted basis, versus $3,878 million or $4.36 a share for the full year 2008.
Upstream net income for the year was $1,324 million versus $2,923 million in 2008. Lower crude oil and natural gas commodity prices in 2009 reduced revenues, impacting earnings by about $2,400 million as a result of the global economic downturn. Earnings were also negatively impacted by lower Cold Lake bitumen production of about $100 million and lower conventional volumes from expected reservoir decline of about $60 million. These factors were partially offset by lower royalty costs due to lower commodity prices of about $600 million and the impact of a lower Canadian dollar of about $325 million.
The average price of Brent crude oil in U.S. dollars, a common benchmark for world oil markets, at $61.61 a barrel, declined about 36 percent from 2008. The company’s realizations on sales of Canadian conventional crude oil and synthetic crude oil from Syncrude production mirrored the same trend as world prices.
Prices for Canadian heavier crude oil also declined along with the lighter crude oil. The company’s average realizations for Cold Lake bitumen fell about 25 percent for the full year in 2009, compared to 2008, reflecting the narrowing price spread between light crude oil and Cold Lake bitumen.
In 2009, realizations for natural gas averaged $4.11 a thousand cubic feet, down from $8.69 in 2008.
For the full year, gross production of Cold Lake bitumen was 141 thousand barrels a day this year, compared with 147 thousand barrels in 2008. Lower production volumes in 2009 were due to the cyclic nature of production at Cold Lake and well repairs in the northern part of the field. Drilling and steaming activities have since resumed in this area, and production is expected to return to normal levels. | ||||||||||||||||||
4
|
|
| |||||||||||||||||
| Full year 2009 vs. full year 2008 (continued)
During 2009, the company’s share of gross production from Syncrude averaged 70 thousand barrels a day, compared with 72 thousand barrels in 2008. Planned maintenance activities in the first half of 2009, which included design modifications to improve long-term operational performance, contributed to the reduced production for the full year in 2009.
Gross production of conventional crude oil averaged 25 thousand barrels a day in 2009, compared with 27 thousand barrels in 2008. The natural reservoir decline in the Western Canadian Basin was the main reason for the reduced production.
In the year, gross production of natural gas was 295 million cubic feet a day, down from 310 million cubic feet in 2008. The lower production volume was primarily a result of natural reservoir decline.
Net income from Downstream was $278 million in 2009, compared with $796 million in 2008. Earnings in 2008 included a gain of $187 million from the sale of Rainbow Pipe Line Co. Ltd. Also impacting earnings in 2009 were lower overall margins of about $270 million and lower sales volumes of about $70 million due to the slowdown in the economy. These factors were partially offset by the favourable impact of a weaker Canadian dollar of about $40 million.
Net income from Chemical was $46 million, compared with $100 million in 2008. Earnings in 2009 were negatively impacted by lower overall margins as a result of the slow economy.
For the full year, net income effects from Corporate and other were negative $69 million, versus $59 million in 2008. Unfavourable effects in 2009 were primarily due to changes in share-based compensation charges and lower interest income from lower yields on cash balances.
During 2009, share repurchases were reduced to about 12 million shares for $492 million, including shares purchased from ExxonMobil, when compared to about 44 million shares purchased in 2008 for $2,210 million. Imperial did not make any significant share repurchases since the second quarter of 2009, as cash flow from operations was used to fund growth projects such as Kearl. The company will continue to evaluate its share-purchase program in the context of its overall capital activities.
Key financial and operating data follow.
Forward-Looking Statements
Statements in this report relating to future plans, projections, events or conditions are forward-looking statements. Actual future results, including project plans, costs, timing and capacities; financing sources; the resolution of contingencies and uncertain tax positions; the effect of changes in prices and other market conditions; and environmental and capital expenditures could differ materially depending on a number of factors, such as the outcome of commercial negotiations; changes in the supply of and demand for crude oil, natural gas, and petroleum and petrochemical products; political or regulatory events; and other factors discussed in Item 1A of the company’s 2008 Form 10K. | ||||||||||||||||||
5
Attachment I
IMPERIAL OIL LIMITED
FOURTH QUARTER 2009
| Fourth Quarter | Twelve Months | |||||||
| millions of Canadian dollars, unless noted |
2009 | 2008 | 2009 | 2008 | ||||
| Net income (U.S. GAAP) |
||||||||
| Total revenues and other income |
5,864 | 5,942 | 21,398 | 31,579 | ||||
| Total expenses |
5,119 | 5,171 | 19,198 | 26,303 | ||||
| Income before income taxes |
745 | 771 | 2,200 | 5,276 | ||||
| Income taxes |
211 | 111 | 621 | 1,398 | ||||
| Net income |
534 | 660 | 1,579 | 3,878 | ||||
| Net income per common share (dollars) |
0.63 | 0.77 | 1.86 | 4.39 | ||||
| Net income per common share - assuming dilution (dollars) |
0.62 | 0.76 | 1.84 | 4.36 | ||||
| Gain/(loss) on asset sales, after tax |
12 | 5 | 38 | 209 | ||||
| Total assets at December 31 |
17,473 | 17,035 | ||||||
| Total debt at December 31 |
140 | 143 | ||||||
| Interest coverage ratio - earnings basis |
||||||||
| (times covered) |
276.0 | 480.6 | ||||||
| Other long-term obligations at December 31 |
2,839 | 2,254 | ||||||
| Shareholders’ equity at December 31 |
9,439 | 9,065 | ||||||
| Capital employed at December 31 |
9,615 | 9,248 | ||||||
| Return on average capital employed (a) |
||||||||
| (percent) |
16.8 | 44.7 | ||||||
| Dividends on common stock |
||||||||
| Total |
85 | 85 | 340 | 334 | ||||
| Per common share (dollars) |
0.10 | 0.10 | 0.40 | 0.38 | ||||
| Millions of common shares outstanding |
||||||||
| At December 31 |
847.6 | 859.4 | ||||||
| Average - assuming dilution |
854.0 | 871.7 | 856.7 | 889.0 | ||||
| (a) | Return on capital employed is the net income excluding after-tax cost of financing, divided by the average of beginning and ending capital employed. |
6
Attachment II
IMPERIAL OIL LIMITED
FOURTH QUARTER 2009
| Fourth Quarter | Twelve Months | |||||||||||
| millions of Canadian dollars |
2009 | 2008 | 2009 | 2008 | ||||||||
| Total cash and cash equivalents at period end |
513 | 1,974 | 513 | 1,974 | ||||||||
| Net income |
534 | 660 | 1,579 | 3,878 | ||||||||
| Adjustment for non-cash items: |
||||||||||||
| Depreciation and depletion |
197 | 178 | 781 | 728 | ||||||||
| (Gain)/loss on asset sales |
(13 | ) | (5 | ) | (45 | ) | (241 | ) | ||||
| Deferred income taxes and other |
(12 | ) | 492 | (61 | ) | 387 | ||||||
| Changes in operating assets and liabilities |
221 | (a) | (413 | ) | (663 | ) | (489 | ) | ||||
| Cash from (used in) operating activities |
927 | 912 | 1,591 | 4,263 | ||||||||
| Cash from (used in) investing activities |
(785 | ) | (380 | ) | (2,216 | ) | (961 | ) | ||||
| Proceeds from asset sales |
22 | 12 | 67 | 272 | ||||||||
| Cash from (used in) financing activities |
(87 | ) | (491 | ) | (836 | ) | (2,536 | ) | ||||
| (a) | Fourth quarter 2009 cash flow from operating activities was positively impacted by the timing of scheduled income tax payments and lower inventory. |
7
Attachment III
IMPERIAL OIL LIMITED
FOURTH QUARTER 2009
| Fourth Quarter | Twelve Months | |||||||||||
| millions of Canadian dollars |
2009 | 2008 | 2009 | 2008 | ||||||||
| Net income (U.S. GAAP) |
||||||||||||
| Upstream |
491 | 336 | 1,324 | 2,923 | ||||||||
| Downstream |
52 | 257 | 278 | 796 | ||||||||
| Chemical |
16 | 28 | 46 | 100 | ||||||||
| Corporate and other |
(25 | ) | 39 | (69 | ) | 59 | ||||||
| Net income |
534 | 660 | 1,579 | 3,878 | ||||||||
| Total revenues by segment |
||||||||||||
| Upstream |
2,025 | 1,721 | 6,919 | 11,240 | ||||||||
| Downstream |
5,019 | 5,311 | 18,381 | 27,212 | ||||||||
| Chemical |
336 | 331 | 1,236 | 1,833 | ||||||||
| Eliminations/Other |
(1,516 | ) | (1,421 | ) | (5,138 | ) | (8,706 | ) | ||||
| Revenues |
5,864 | 5,942 | 21,398 | 31,579 | ||||||||
| Purchases of crude oil and products by segment |
||||||||||||
| Upstream |
624 | 515 | 2,024 | 3,995 | ||||||||
| Downstream |
4,002 | 4,021 | 14,164 | 22,223 | ||||||||
| Chemical |
248 | 228 | 898 | 1,401 | ||||||||
| Eliminations |
(1,517 | ) | (1,434 | ) | (5,152 | ) | (8,754 | ) | ||||
| Purchases of crude oil and products |
3,357 | 3,330 | 11,934 | 18,865 | ||||||||
| Production and manufacturing expenses |
||||||||||||
| Upstream |
560 | 642 | 2,385 | 2,569 | ||||||||
| Downstream |
323 | 355 | 1,372 | 1,452 | ||||||||
| Chemical |
52 | 49 | 194 | 208 | ||||||||
| Eliminations |
- | (1 | ) | - | (1 | ) | ||||||
| Production and manufacturing expenses |
935 | 1,045 | 3,951 | 4,228 | ||||||||
| Capital and exploration expenditures |
||||||||||||
| Upstream |
745 | 355 | 2,167 | 1,110 | ||||||||
| Downstream |
84 | 70 | 251 | 232 | ||||||||
| Chemical |
3 | 6 | 15 | 13 | ||||||||
| Corporate and other |
2 | 2 | 5 | 8 | ||||||||
| Capital and exploration expenditures |
834 | 433 | 2,438 | 1,363 | ||||||||
| Exploration expenses charged to income included above |
27 | 41 | 153 | 132 | ||||||||
8
Attachment IV
IMPERIAL OIL LIMITED
FOURTH QUARTER 2009
| Operating statistics | Fourth Quarter | Twelve Months | ||||||
| 2009 | 2008 | 2009 | 2008 | |||||
| Gross crude oil and Natural Gas Liquids (NGL) production |
||||||||
| (thousands of barrels a day) |
||||||||
| Cold Lake |
134 | 146 | 141 | 147 | ||||
| Syncrude |
82 | 77 | 70 | 72 | ||||
| Conventional |
24 | 27 | 25 | 27 | ||||
| Total crude oil production |
240 | 250 | 236 | 246 | ||||
| NGLs available for sale |
7 | 9 | 8 | 10 | ||||
| Total crude oil and NGL production |
247 | 259 | 244 | 256 | ||||
| Gross natural gas production (millions of cubic feet a day) |
298 | 297 | 295 | 310 | ||||
| Gross oil-equivalent production (a) |
||||||||
| (thousands of oil-equivalent barrels a day) |
297 | 309 | 293 | 308 | ||||
| Net crude oil and NGL production (thousands of barrels a day) |
||||||||
| Cold Lake |
107 | 129 | 120 | 124 | ||||
| Syncrude |
73 | 68 | 65 | 62 | ||||
| Conventional |
18 | 20 | 20 | 19 | ||||
| Total crude oil production |
198 | 217 | 205 | 205 | ||||
| NGLs available for sale |
6 | 7 | 6 | 8 | ||||
| Total crude oil and NGL production |
204 | 224 | 211 | 213 | ||||
| Net natural gas production (millions of cubic feet a day) |
264 | 239 | 274 | 249 | ||||
| Net oil-equivalent production (a) |
||||||||
| (thousands of oil-equivalent barrels a day) |
248 | 264 | 257 | 255 | ||||
| Cold Lake blend sales (thousands of barrels a day) |
174 | 190 | 184 | 191 | ||||
| NGL Sales (thousands of barrels a day) |
12 | 13 | 10 | 11 | ||||
| Natural gas sales (millions of cubic feet a day) |
277 | 291 | 272 | 288 | ||||
| Average realizations and prices (Canadian dollars) |
||||||||
| Conventional crude oil realizations (a barrel) |
69.92 | 56.75 | 60.32 | 95.76 | ||||
| NGL realizations (a barrel) |
48.15 | 43.61 | 41.19 | 59.35 | ||||
| Natural gas realizations (a thousand cubic feet) |
4.23 | 7.31 | 4.11 | 8.69 | ||||
| Syncrude realizations (a barrel) |
78.64 | 69.21 | 69.69 | 106.61 | ||||
| Western Canada Select heavy oil (a barrel) |
67.68 | 47.73 | 58.67 | 82.96 | ||||
| Refinery throughput (thousands of barrels a day) |
412 | 441 | 413 | 446 | ||||
| Refinery capacity utilization (percent) |
82 | 88 | 82 | 89 | ||||
| Petroleum product sales (thousands of barrels a day) |
||||||||
| Gasolines |
200 | 204 | 200 | 204 | ||||
| Heating, diesel and jet fuels |
142 | 158 | 143 | 157 | ||||
| Heavy fuel oils |
31 | 32 | 27 | 30 | ||||
| Lube oils and other products |
42 | 54 | 39 | 47 | ||||
| Net petroleum products sales |
415 | 448 | 409 | 438 | ||||
| Petrochemical Sales (thousands of tonnes a day) |
2.9 | 2.2 | 2.8 | 2.8 | ||||
| (a) | Gas converted to oil-equivalent at 6 million cubic feet = 1 thousand barrels |
9
Attachment V
IMPERIAL OIL LIMITED
FOURTH QUARTER 2009
| Net income (U.S. GAAP) | Net income per common share | |||
| (millions of Canadian dollars) | (dollars) | |||
| 2005 |
||||
| First Quarter |
393 | 0.38 | ||
| Second Quarter |
539 | 0.52 | ||
| Third Quarter |
652 | 0.64 | ||
| Fourth Quarter |
1,016 | 1.00 | ||
| Year |
2,600 | 2.54 | ||
| 2006 |
||||
| First Quarter |
591 | 0.60 | ||
| Second Quarter |
837 | 0.85 | ||
| Third Quarter |
822 | 0.84 | ||
| Fourth Quarter |
794 | 0.83 | ||
| Year |
3,044 | 3.12 | ||
| 2007 |
||||
| First Quarter |
774 | 0.82 | ||
| Second Quarter |
712 | 0.76 | ||
| Third Quarter |
816 | 0.88 | ||
| Fourth Quarter |
886 | 0.97 | ||
| Year |
3,188 | 3.43 | ||
| 2008 |
||||
| First Quarter |
681 | 0.76 | ||
| Second Quarter |
1,148 | 1.29 | ||
| Third Quarter |
1,389 | 1.57 | ||
| Fourth Quarter |
660 | 0.77 | ||
| Year |
3,878 | 4.39 | ||
| 2009 |
||||
| First Quarter |
289 | 0.34 | ||
| Second Quarter |
209 | 0.25 | ||
| Third Quarter |
547 | 0.64 | ||
| Fourth Quarter |
534 | 0.63 | ||
| Year |
1,579 | 1.86 | ||
10
IMPERIAL OIL LIMITED
FOURTH QUARTER 2009
Factors affecting net income (millions of Canadian dollars)
| Upstream Earnings 4Q09 vs 4Q08 |
|||||||
| 4Q09 | 4Q08 | 4Q09 vs 4Q08 |
|||||
|
|
491 | 336 | 155 | ||||
| Downstream Earnings 4Q09 vs 4Q08 |
|||||||
| 4Q09 | 4Q08 | 4Q09 vs 4Q08 |
|||||
|
|
52 | 257 | (205 | ) | |||
| Chemical Earnings 4Q09 vs 4Q08 |
|||||||
| 4Q09 | 4Q08 | 4Q09 vs 4Q08 |
|||||
|
|
16 | 28 | (12 | ) | |||
11