Attached files
Table of Contents
UNITED STATES
SECURITIES AND EXCHANGE COMMISSION
Washington, D.C. 20549
FORM 10-K
| x | ANNUAL REPORT PURSUANT TO SECTION 13 OR 15(d) OF THE SECURITIES EXCHANGE ACT OF 1934 |
For the fiscal year ended September 30, 2009
| ¨ | TRANSITION REPORT PURSUANT TO SECTION 13 OR 15(d) OF THE SECURITIES EXCHANGE ACT OF 1934 |
For the transition period from to
Commission File Number 001-32833
TransDigm Group Incorporated
(Exact name of registrant as specified in its charter)
Delaware
(State or other jurisdiction of incorporation or organization)
41-2101738
(I.R.S. Employer Identification No.)
| 1301 East 9th Street, Suite 3710, Cleveland, Ohio | 44114 | |
| (Address of principal executive offices) | (Zip Code) |
(216) 706-2960
(Registrants’ telephone number, including area code)
Securities registered pursuant to Section 12(b) of the Act:
| Common Stock | New York Stock Exchange | |
| (Title) | (Name of exchange on which registered) |
Securities registered pursuant to Section 12(g) of the Act:
None
Indicate by check mark if the registrant is a well-known seasoned issuer, as defined in Rule 405 of the Securities Act. Yes x No ¨
Indicate by check mark if the registrant is not required to file reports pursuant to Section 12 or Section 15(d) of the Act. Yes ¨ No x
Indicate by check mark whether the registrant: (1) has filed all reports required to be filed by Section 13 or 15(d) of the Securities Exchange Act of 1934 during the preceding 12 months (or for such shorter period that the registrant was required to file such reports) and (2) has been subject to such filing requirements for the past 90 days. Yes x No ¨
Indicate by check mark whether the registrant has submitted electronically and posted on its corporate website, if any, every Interactive Data File required to be submitted and posted pursuant to Rule 405 of Regulation S-T during the preceding 12 months (or for such shorter period that the registrant was required to submit and post such files). Yes ¨ No ¨
Indicate by check mark if disclosure of delinquent filers pursuant to Item 405 of Regulation S-K is not contained herein, and will not be contained, to the best of registrant’s knowledge, in definitive proxy or information statements incorporated by reference in Part III of this Form 10-K or any amendment to this Form 10-K. x
Indicate by check mark whether the registrant is a large accelerated filer, an accelerated filer, a non-accelerated filer, or smaller reporting company. See the definitions of “large accelerated filer,” “accelerated filer” and “smaller reporting company” in Rule 12b-2 of the Exchange Act. (Check one).
| Large accelerated filer x |
Accelerated filer ¨ | Non-accelerated filer ¨ | Smaller reporting company ¨ |
Indicate by check mark whether the registrant is a shell company (as defined in Rule 12b-2 of the Exchange Act). Yes ¨ No x
The aggregate market value of the voting and non-voting common stock held by non-affiliates of the registrant as of March 28, 2009, based upon the last sale price of such voting and non-voting common stock on that date was $1,363,159,237.
The number of shares outstanding of TransDigm Group Incorporated’s common stock, par value $.01 per share, was 48,977,578 as of October 31, 2009.
Documents incorporated by reference: The registrant incorporates by reference in Part III hereof portions of its definitive Proxy Statement for its 2010 Annual Meeting of Stockholders.
Table of Contents
| Page | ||||
| ITEM 1 |
2 | |||
| ITEM 1A |
8 | |||
| ITEM 1B |
16 | |||
| ITEM 2 |
17 | |||
| ITEM 3 |
17 | |||
| ITEM 4 |
17 | |||
| ITEM 5 |
18 | |||
| ITEM 6 |
20 | |||
| ITEM 7 |
MANAGEMENT’S DISCUSSION AND ANALYSIS OF FINANCIAL CONDITION AND RESULTS OF OPERATIONS |
27 | ||
| ITEM 7A |
42 | |||
| ITEM 8 |
42 | |||
| ITEM 9 |
CHANGES IN AND DISAGREEMENTS WITH ACCOUNTANTS ON ACCOUNTING AND FINANCIAL DISCLOSURE |
42 | ||
| ITEM 9A |
42 | |||
| ITEM 9B |
45 | |||
| ITEM 10 |
45 | |||
| ITEM 11 |
47 | |||
| ITEM 12 |
SECURITY OWNERSHIP OF CERTAIN BENEFICIAL OWNERS AND MANAGEMENT AND RELATED STOCKHOLDER MATTERS |
47 | ||
| ITEM 13 |
48 | |||
| ITEM 14 |
48 | |||
| ITEM 15 |
49 | |||
| 61 | ||||
Table of Contents
Special Note Regarding Forward-Looking Statements
This report on Form 10-K contains forward-looking statements within the meaning of Section 21E of the Securities Exchange Act of 1934, as amended (the “Exchange Act”), and 27A of the Securities Act of 1933, as amended. Discussions containing such forward-looking statements may be found in Items 1,1A, 2, 3, 5 and 7 hereof and elsewhere within this Report generally. In addition, when used in this Report, the words “believes,” “anticipates,” “expects,” “should” and similar words or expressions are intended to identify forward-looking statements. Although the Company (as defined below) believes that its plans, intentions and expectations reflected in or suggested by such forward-looking statements are reasonable, such forward-looking statements are subject to a number of risks and uncertainties that could cause actual results to differ materially from the forward-looking statements made in this Report. The more important of such risks and uncertainties are set forth under the caption “Risk Factors” and elsewhere in this Report. Many such factors are outside the control of the Company. Consequently, such forward-looking statements should be regarded solely as our current plans, estimates and beliefs. We do not undertake, and specifically decline any obligation, to publicly release the results of any revisions to these forward-looking statements that may be made to reflect any future events or circumstances after the date of such statements or to reflect the occurrence of anticipated or unanticipated events. All forward-looking statements attributable to the Company or persons acting on its behalf are expressly qualified in their entirety by these cautionary statements.
In this report, the term “TD Group” refers to TransDigm Group Incorporated, which holds all of the outstanding capital stock of TransDigm Inc. The terms “Company,” “TransDigm,” “we,” “us,” “our” and similar terms refer to TD Group, together with TransDigm Inc. and its direct and indirect subsidiaries. References to “fiscal year” mean the year ending or ended September 30. For example, “fiscal year 2009” or “fiscal 2009” means the period from October 1, 2008 to September 30, 2009.
1
Table of Contents
| ITEM 1. | BUSINESS |
The Company
TransDigm Inc. was formed in July 1993 in connection with the acquisition of certain businesses from IMO Industries Inc. TransDigm Group Incorporated (“TD Group”), was formed in July 2003 at the direction of Warburg Pincus Private Equity VIII, L.P. (“Warburg Pincus”) to facilitate the acquisition of TransDigm Inc. In March 2006, certain stockholders of TD Group and certain members of our management sold shares of TD Group common stock in an underwritten initial public offering. TD Group did not offer any shares of common stock for sale in the initial public offering and TD Group did not receive any of the proceeds from the sale of shares by the selling stockholders. As a result of the initial public offering, TD Group’s common stock is publicly traded on the New York Stock Exchange under the ticker symbol “TDG.”
In May 2007, certain of TD Group’s stockholders, including certain members of our management, sold shares of TD Group’s common stock in an underwritten public offering. As a result of this offering, TD Group was no longer a “controlled company” for the purposes of the NYSE listing requirements. TD Group did not sell any shares in the offering and did not receive any proceeds from the offering.
We believe we are a leading global designer, producer and supplier of highly engineered aircraft components for use on nearly all commercial and military aircraft in service today. Our business is well diversified due to the broad range of products we offer to our customers.
We estimate that over 95% of our net sales for fiscal year 2009 were generated by proprietary products for which we own the design. In addition, for fiscal year 2009, we estimate that we generated approximately 80% of our net sales from products for which we are the sole source provider.
Most of our products generate significant aftermarket revenue. Once our parts are designed into and sold as original equipment on an aircraft, we generate net sales from recurring aftermarket consumption over the life of that aircraft, which is generally estimated to be approximately 30 years. We estimate that approximately 60% of our net sales in fiscal year 2009 were generated from aftermarket sales, the vast majority of which come from the commercial and military aftermarkets. These aftermarket revenues have historically produced a higher gross margin and been more stable than sales to original equipment manufacturers, or OEMs.
Products
We primarily design, produce and supply highly-engineered proprietary aerospace components (and certain systems/subsystems) with significant aftermarket content. We seek to develop highly customized products to solve specific needs for aircraft operators and manufacturers. We attempt to differentiate ourselves based on engineering, service and manufacturing capabilities. We typically choose not to compete for non-proprietary “build to print” business because it frequently offers lower margins than proprietary products. We believe that our products have strong brand names within the industry and that we have a reputation for high quality, reliability and customer support.
Our business is well diversified due to the broad range of products that we offer to our customers. Some of our more significant product offerings, substantially all of which are ultimately provided to end-users in the aerospace industry, include: (1) mechanical /electro-mechanical actuators and controls used in numerous actuation applications; (2) ignition systems and components such as igniters, exciters and spark plugs used to start and spark turbine and reciprocating aircraft engines; (3) gear pumps used primarily in lubrication and fuel applications; (4) specialized valves used in fuel, hydraulic and pneumatic applications; (5) engineered connectors used in fuel, pneumatic and hydraulic applications; (6) power conditioning devices used to modify and control electrical power; (7) specialized fluorescent lighting; (8) specialized AC/DC electric motors and components;
2
Table of Contents
(9) aircraft audio systems; (10) engineered latching and locking devices used in various bin, security and other applications; (11) lavatory hardware and components; (12) rods and locking devices used primarily to hold open cowlings to allow access to engines for maintenance; (13) specialized cockpit displays; (14) elastomers used in various clamping and heating applications; (15) NiCad batteries/chargers used to provide starting and back-up power; and (16) starter generators and related components.
Sales and Marketing
Consistent with our overall strategy, our sales and marketing organization is structured to continually develop technical solutions that meet customer needs. In particular, we attempt to focus on products and programs that will lead to high-margin, repeatable sales in the aftermarket.
We have structured our sales efforts along our major product offerings, assigning a product manager to certain products. Each product manager is expected to grow the sales and profitability of the products for which he or she is responsible and to achieve the targeted annual level of bookings, sales, new business and profitability for such products. The product managers are assisted by account managers and sales engineers who are responsible for covering major OEM and aftermarket accounts. Account managers and sales engineers are expected to be familiar with the personnel, organization and needs of specific customers, to achieve total bookings and new business goals at each account and, together with the product managers, to determine when additional resources are required at customer locations. Most of our sales personnel are compensated, in part, on their bookings and their ability to identify and obtain new business opportunities.
Though typically performed by employees, the account manager function may be performed by independent representatives depending on the specific customer, product and geographic location. We also use a number of distributors to provide logistical support as well as primary customer contact with certain smaller accounts. Our major distributors are Aviall, Inc. (a subsidiary of The Boeing Company) and Satair A/S.
Manufacturing and Engineering
We maintain fifteen principal manufacturing facilities. Each manufacturing facility comprises manufacturing, distribution and engineering as well as administrative functions, including management, sales and finance. We continually strive to improve productivity and reduce costs, including rationalization of operations, developing improved control systems that allow for accurate product profit and loss accounting, investing in equipment, tooling, and information systems and implementing broad-based employee training programs. Management believes that our manufacturing systems and equipment contribute to our ability to compete by permitting us to meet the rigorous tolerances and cost sensitive price structure of aircraft component customers.
We attempt to differentiate ourselves from our competitors by producing uniquely engineered products with high quality and timely delivery. Our engineering costs are recorded in Cost of Sales and in Selling and Administrative captions in our Statements of Income. Total engineering expense represents approximately 9% of our operating units’ aggregate costs, or approximately 5% of our consolidated net sales. Our proprietary products, and particularly our new product initiatives, are designed by our engineering staff and are intended to serve the needs of the aircraft component industry. These proprietary designs must withstand the extraordinary conditions and stresses that will be endured by products during use and meet the rigorous demands of our customers’ tolerance and quality requirements.
We use sophisticated equipment and procedures to attempt to ensure the quality of our products and comply with military specifications and Federal Aviation Administration (the “FAA”) and OEM certification requirements. We perform a variety of testing procedures, including testing under different temperature, humidity and altitude levels, shock and vibration testing and X-ray fluorescent measurement. These procedures, together with other customer approved techniques for document, process and quality control, are used throughout our manufacturing facilities.
3
Table of Contents
Customers
Our customers include: (1) distributors of aerospace components; (2) worldwide commercial airlines, including national and regional airlines; (3) large commercial transport and regional and business aircraft OEMs; (4) various armed forces of the United States and friendly foreign governments; (5) defense OEMs; (6) system suppliers; and (7) various other industrial customers. For the year ended September 30, 2009, Boeing (which includes Aviall, Inc., a distributor of commercial aftermarket parts to airlines throughout the world) accounted for approximately 13% of our net sales, and Honeywell International, Inc. accounted for approximately 9% of our net sales. Products supplied to many of our customers, including the two largest customers, are used on multiple platforms.
Active commercial production programs include the Boeing 737, 747, 767 and 777, the Airbus A300, A319/20/21, A330/A340 and A380, the Bombardier CRJ’s and Challenger, the Embraer RJ’s, the Cessna Citation family, the Raytheon Premier and Hawker and most Gulfstream airframes. Military platforms include aircraft such as the Boeing C-17, F-15 and F-18, the Lockheed Martin C-130J and F-16, the Northrop Grumman E2C (Hawkeye), the Joint Strikefighter and the Blackhawk, Chinook and Apache helicopters. TransDigm has been awarded numerous contracts for the development of engineered products for production on the Boeing 787 and Airbus A350XWB and A400M programs.
We believe that we have strong customer relationships with almost all large commercial transport, regional, general aviation and military OEMs. The demand for our aftermarket parts and services depends on, among other things, the breadth of our installed OEM base, revenue passenger miles, or RPMs, the size and age of the worldwide aircraft fleet and, to a lesser extent, airline profitability. We believe that we are also a leading supplier of components used on U.S. designed military aircraft, including components that are used on a variety of fighter aircraft, military freighters and military helicopters.
Competition
The niche markets within the aerospace industry that we serve are relatively fragmented and we face several competitors for many of the products and services we provide. Due to the global nature of the commercial aircraft industry, competition in these categories comes from both U.S. and foreign companies. Competitors in our product offerings range in size from divisions of large public corporations that have significantly greater financial, technological and marketing resources than we do, to small privately-held entities, with only one or two components in their entire product portfolios.
We compete on the basis of engineering, manufacturing and marketing high quality products which we believe meet or exceed the performance and maintenance requirements of our customers, consistent and timely delivery, and superior customer service and support. The industry’s stringent regulatory, certification and technical requirements, and the investments necessary in the development and certification of products, create barriers to entry for potential new competitors. As long as customers receive products that meet or exceed expectations and performance standards, we believe that they will have a reduced incentive to certify another supplier because of the cost and time of the technical design and testing certification process. In addition, we believe that concerns about safety and flight delays if products are unavailable or undependable are reasons for our customers to continue long-term supplier relationships.
Government Contracts
Companies engaged in supplying defense-related equipment and services to U.S. Government agencies are subject to business risks specific to the defense industry. These risks include the ability of the U.S. Government to unilaterally: (1) suspend us from receiving new contracts pending resolution of alleged violations of procurement laws or regulations; (2) terminate existing contracts; (3) reduce the value of existing contracts; (4) audit our contract-related costs and fees, including allocated indirect costs; and (5) control and potentially prohibit the export of our products.
4
Table of Contents
As described elsewhere in this report, five of our divisions and subsidiaries have been subject to a U.S. Department of Defense (the “DOD”) Office of Inspector General review of our records for the purpose of determining whether the DOD’s various buying offices negotiated “fair and reasonable” prices for spare parts purchased from those five divisions and subsidiaries in fiscal years 2002 through 2004. For additional information regarding the details and status of the pricing review, please refer to “Risk Factors—Certain of our divisions and subsidiaries have been subject to a pricing review by the DOD Office of Inspector General.”
Governmental Regulation
The commercial aircraft component industry is highly regulated by both the FAA in the United States and by the Joint Aviation Authorities in Europe and other agencies throughout the world, while the military aircraft component industry is governed by military quality specifications. We, and the components we manufacture, are required to be certified by one or more of these entities or agencies, and, in many cases, by individual OEMs, in order to engineer and service parts and components used in specific aircraft models.
We must also satisfy the requirements of our customers, including OEMs and airlines that are subject to FAA regulations, and provide these customers with products and services that comply with the government regulations applicable to commercial flight operations. In addition, the FAA requires that various maintenance routines be performed on aircraft components. We believe that we currently satisfy or exceed these maintenance standards in our repair and overhaul services. We also maintain several FAA approved repair stations.
In addition, sales of many of our products that will be used on aircraft owned by non-U.S. entities are subject to compliance with U.S. export control laws.
Our operations are also subject to a variety of worker and community safety laws. The Occupational Safety and Health Act, mandates general requirements for safe workplaces for all employees. In addition, OSHA provides special procedures and measures for the handling of certain hazardous and toxic substances.
Raw Materials
We require the use of various raw materials in our manufacturing processes. We also purchase a variety of manufactured component parts from various suppliers. At times, we concentrate our orders among a few suppliers in order to strengthen our supplier relationships. Raw materials and component parts are generally available from multiple suppliers at competitive prices.
Intellectual Property
We have various trade secrets, proprietary information, trademarks, trade names, patents, copyrights and other intellectual property rights, which we believe, in the aggregate but not individually, are important to our business.
Backlog
As of September 30, 2009, the Company estimated its sales order backlog at $402 million compared to an estimated sales order backlog of $418 million as of September 30, 2008. This decrease in backlog of $16 million is mainly due to lower commercial OEM and aftermarket demand including the impact of order cancellations and pushouts as well as significant reductions in business jet production rates. These declines were partially offset by the impact of the acquisitions of Aircraft Parts Corporation, Acme Aerospace Inc. and a product line of Woodward Governor Company. The majority of the purchase orders outstanding as of September 30, 2009 are scheduled for delivery within the next twelve months. Purchase orders may be subject to cancellation by the customer prior to shipment. The level of unfilled purchase orders at any given date during the year will be materially affected by the timing of the Company’s receipt of purchase orders and the speed with which those orders are filled. Accordingly, the Company’s backlog as of September 30, 2009 may not necessarily represent the actual amount of shipments or sales for any future period.
5
Table of Contents
Foreign Operations
Although we manufacture substantially all of our products in the United States, we manufacture some products in Malaysia through our wholly-owned Malaysian subsidiary. We sell our products in the United States, as well as in foreign countries. Substantially all of our foreign sales are transacted in U.S. dollars and, therefore, we have no material exposure to fluctuations in the rate of exchange between foreign currencies and the U.S. dollar as a result of foreign sales. In addition, the amount of components or other raw materials or supplies that we purchase from foreign suppliers, including our Malaysian manufacturing subsidiary, are not material, with substantially all such transactions being made in U.S. dollars. Accordingly, we have no material exposure to currency fluctuations in the rate of exchange between foreign currencies and the U.S. dollar arising from these transactions.
Our direct sales to foreign customers were approximately $150.4 million, $144.3 million, and $143.0 million for fiscal years 2009, 2008 and 2007, respectively. Sales to foreign customers are subject to numerous additional risks, including the impact of foreign government regulations, political uncertainties and differences in business practices. There can be no assurance that foreign governments will not adopt regulations or take other action that would have a direct or indirect adverse impact on the business or market opportunities of the Company within such governments’ countries. Furthermore, there can be no assurance that the political, cultural and economic climate outside the United States will be favorable to our operations and growth strategy.
Environmental Matters
Our operations and facilities are subject to federal, state and local environmental laws and regulations governing, among other matters, the emission, discharge, generation, management, transportation and disposal of hazardous materials, wastes and pollutants, the investigation and remediation of contaminated sites, and permits required in connection with our operations. Although management believes that our operations and facilities are in material compliance with applicable environmental laws, management cannot provide assurance that future changes in such laws, or the regulations or requirements thereunder, or in the nature of our operations will not require us to make significant additional expenditures to ensure compliance in the future. Further, we could incur substantial costs, including cleanup costs, fines and sanctions, and third party property damage or personal injury claims as a result of violations of or liabilities under environmental laws, relevant common law, or the environmental permits required for our operations.
Under some environmental laws, a current or previous owner or operator of a contaminated site may be held liable for the entire cost of investigation, removal or remediation of hazardous materials at such property, whether or not the owner or operator knew of, or was responsible for, the presence of such hazardous materials. Persons who arrange for disposal or treatment of hazardous materials also may be liable for the costs of investigation, removal or remediation of those substances at a disposal or treatment site, regardless of whether the affected site is owned or operated by them. Because we own and/or operate a number of facilities that have a history of industrial or commercial use and because we arrange for the disposal of hazardous materials at many disposal sites, we may and do incur costs for investigation, removal and remediation. Contaminants have been detected at some of our present and former sites, principally in connection with historical operations, and investigations and/or clean-ups have been undertaken by us or by former owners of the sites. We receive inquiries and notices of potential liability with respect to offsite disposal facilities from time to time. Although we have not incurred any material investigation or cleanup costs to date and investigation and cleanup costs are not expected to be material in the future, the discovery of additional contaminants or the imposition of additional cleanup obligations at these or other sites, or the failure of any other potentially liable party to meet its obligations, could result in significant liability for us.
Employees
As of September 30, 2009, we had approximately 2,000 employees. Approximately 4% of our employees were represented by the United Steelworkers Union, approximately 3% were represented by the United Automobile, Aerospace and Agricultural Implement Workers of America and approximately 4% were
6
Table of Contents
represented by the International Brotherhood of Electrical Workers. Collective bargaining agreements between us and these labor unions expire in April 2011, November 2012 and May 2013, respectively. We consider our relationship with our employees generally to be satisfactory.
Legal Proceedings
We are from time to time subject to, and are presently involved in, litigation or other legal proceedings arising in the ordinary course of business. Based upon information currently known to us, we believe the outcome of such proceedings will not have, individually or in the aggregate, a material adverse effect on our business, our financial condition or results of operations.
Available Information
TD Group’s Annual Report on Form 10-K, Quarterly Reports on Form 10-Q and Current Reports on Form 8-K, including any amendments, will be made available free of charge on the Company’s website, www.transdigm.com, as soon as reasonably practicable, following the filing of the reports with the Securities and Exchange Commission.
7
Table of Contents
| ITEM 1A. | RISK FACTORS |
Set forth below are important risks and uncertainties that could negatively affect our business and financial condition and could cause our actual results to differ materially from those expressed in forward-looking statements contained in this report.
Our business is sensitive to the number of flight hours that our customers’ planes spend aloft, the size and age of the worldwide aircraft fleet and our customers’ profitability. These items are, in turn, affected by general economic conditions.
Our business is directly affected by, among other factors, changes in revenue passenger miles (“RPMs”) the size and age of the worldwide aircraft fleet and, to a lesser extent, changes in the profitability of the commercial airline industry. RPMs and airline profitability have historically been correlated with the general economic environment, although national and international events also play a key role. For example, in recent years, the airline industry has been severely affected by the downturn in the global economy, higher fuel prices, the increased security concerns among airline customers following the events of September 11, 2001, the Severe Acute Respiratory Syndrome, or SARS, epidemic and the conflicts in Afghanistan and Iraq. As a result of the substantial reduction in airline traffic resulting from these events, the airline industry incurred, and some in the industry continue to incur, large losses and financial difficulties. Some carriers have also parked or retired a portion of their fleets and have reduced workforces and flights. During periods of reduced airline profitability, some airlines may delay purchases of spare parts, preferring instead to deplete existing inventories. If demand for new aircraft and spare parts decreases, there would be a decrease in demand for certain of our products.
Future terrorist attacks may have a material adverse impact on our business.
Following the September 11, 2001 terrorist attacks, passenger traffic on commercial flights was significantly lower than prior to the attacks and many commercial airlines reduced their operating schedules. Overall, the terrorist attacks resulted in billions of dollars in losses to the airline industry. Any future acts of terrorism and any military response to such acts could result in further acts of terrorism and additional hostilities, including possible retaliatory attacks on sovereign nations, as well as financial, economic and political instability. While the precise effects of any such terrorist attack, military response or instability on our industry and our business is difficult to determine, it could result in further reductions in the use of commercial aircraft. If demand for new aircraft and spare parts decreases, demand for certain of our products would also decrease.
Our sales to manufacturers of aircraft are cyclical, and a downturn in sales to these manufacturers may adversely affect us.
Our sales to manufacturers of large commercial aircraft, such as The Boeing Company, Airbus S.A.S, related OEM suppliers, as well as manufacturers of business jets, which accounted for approximately 22% of our net sales in fiscal year 2009, have historically experienced periodic downturns. In the past, these sales have been affected by airline profitability, which is impacted by, among other things, fuel and labor costs, price competition, downturns in the global economy and national and international events, such as the events of September 11, 2001. In addition, sales of our products to manufacturers of business jets are impacted by, among other things, downturns in the global economy. Prior downturns have adversely affected our net sales, gross margin and net income.
We rely heavily on certain customers for much of our sales.
Our two largest customers for fiscal year 2009 were Boeing (which includes Aviall, Inc., a distributor of commercial aftermarket parts to airlines throughout the world) and Honeywell International Inc. These two customers accounted for approximately 13% and 9%, respectively, of our net sales in fiscal year 2009. Our top ten customers for fiscal year 2009 accounted for approximately 44% of our net sales. A reduction in purchasing by one of our larger customers for any reason, such as economic downturn, decreased production or strike, could have a material adverse effect on our net sales, gross margin and net income. See “Management’s Discussion and Analysis of Financial Condition and Results of Operations—Overview.”
8
Table of Contents
We generally do not have guaranteed future sales of our products. Further, when we enter into fixed price contracts with some of our customers, we take the risk for cost overruns.
As is customary in our business, we do not generally have long-term contracts with most of our aftermarket customers and, therefore, do not have guaranteed future sales. Although we have long-term contracts with many of our OEM customers, many of those customers may terminate the contracts on short notice and, in most cases, our customers have not committed to buy any minimum quantity of our products. In addition, in certain cases, we must anticipate the future volume of orders based upon the historic purchasing patterns of customers and upon our discussions with customers as to their anticipated future requirements, and this anticipated future volume of orders may not materialize.
We also have entered into multi-year, fixed-price contracts with some of our customers, pursuant to which we have agreed to perform the work for a fixed price and, accordingly, realize all the benefit or detriment resulting from any decreases or increases in the costs of making these products. Sometimes we accept a fixed-price contract for a product that we have not yet produced, and this increases the risk of cost overruns or delays in the completion of the design and manufacturing of the product. Most of our contracts do not permit us to recover increases in raw material prices, taxes or labor costs.
U.S. military spending is dependent upon the U.S. defense budget.
The military and defense market is significantly dependent upon government budget trends, particularly the DOD budget. In addition to normal business risks, our supply of products to the United States Government is subject to unique risks largely beyond our control. Future DOD budgets could be negatively impacted by several factors, including, but not limited to, a change in defense spending policy by the current presidential administration, the U.S. Government’s budget deficits, spending priorities, the cost of sustaining the U.S. military presence in Iraq and Afghanistan and possible political pressure to reduce U.S. Government military spending, each of which could cause the DOD budget to remain unchanged or to decline. A significant decline in U.S. military expenditures in the future could result in a reduction in the amount of our products sold to the various agencies and buying organizations of the U.S. Government.
We intend to pursue future acquisitions. Our business may be adversely affected if we cannot consummate acquisitions on satisfactory terms, or if we cannot effectively integrate acquired operations.
A significant portion of our growth has occurred through acquisitions. Any future growth through acquisitions will be partially dependent upon the continued availability of suitable acquisition candidates at favorable prices and upon advantageous terms and conditions. We intend to pursue acquisitions that we believe will present opportunities consistent with our overall business strategy. However, we may not be able to find suitable acquisition candidates to purchase or may be unable to acquire desired businesses or assets on economically acceptable terms. In addition, we may not be able to raise the capital necessary to fund future acquisitions. In addition, acquisitions involve risks that the businesses acquired will not perform in accordance with expectations and that business judgments concerning the value, strengths and weaknesses of businesses acquired will prove incorrect.
We regularly engage in discussions with respect to potential acquisition and investment opportunities. If we consummate an acquisition, our capitalization and results of operations may change significantly. Future acquisitions could likely result in the incurrence of additional debt and contingent liabilities and an increase in interest and amortization expenses or periodic impairment charges related to goodwill and other intangible assets as well as significant charges relating to integration costs.
In addition, we may not be able to successfully integrate any business we acquire into our existing business. The successful integration of new businesses depends on our ability to manage these new businesses and cut excess costs. The successful integration of future acquisitions may also require substantial attention from our
9
Table of Contents
senior management and the management of the acquired business, which could decrease the time that they have to service and attract customers and develop new products and services. In addition, because we may actively pursue a number of opportunities simultaneously, we may encounter unforeseen expenses, complications and delays, including difficulties in employing sufficient staff and maintaining operational and management oversight.
We are subject to certain unique business risks as a result of supplying equipment and services to the U.S. Government. In addition, government contracts contain unfavorable termination provisions and are subject to modification and audit.
Companies engaged in supplying defense-related equipment and services to U.S. Government agencies are subject to business risks specific to the defense industry. These risks include the ability of the U.S. Government to unilaterally:
| • | suspend us from receiving new contracts pending resolution of alleged violations of procurement laws or regulations; |
| • | terminate existing contracts; |
| • | reduce the value of existing contracts; and |
| • | audit our contract-related costs and fees, including allocated indirect costs. |
Most of our U.S. Government contracts can be terminated by the U.S. Government either for its convenience or if we default by failing to perform under the contract. Termination for convenience provisions provide only for our recovery of costs incurred or committed, settlement expenses and profit on the work completed prior to termination. Termination for default provisions provide for the contractor to be liable for excess costs incurred by the U.S. Government in procuring undelivered items from another source.
On contracts where the price is based on cost, the U.S. Government may review our costs and performance, as well as our accounting and general business practices. Based on the results of such audits, the U.S. Government may adjust our contract-related costs and fees, including allocated indirect costs. In addition, under U.S. Government purchasing regulations, some of our costs, including most financing costs, amortization of intangible assets, portions of research and development costs, and certain marketing expenses may not be subject to reimbursement.
In addition to these U.S. Government contract risks, we are at times required to obtain approval from U.S. Government agencies to export our products. Additionally, we are not permitted to export some of our products. A determination by the U.S. Government that we failed to receive required approvals or licenses could eliminate or restrict our ability to sell our products outside the United States, and the penalties that could be imposed by the U.S. Government for failure to comply with these laws could be significant.
Certain of our divisions and subsidiaries have been subject to a pricing review by the DOD Office of Inspector General.
Five of our divisions and subsidiaries have been the subject of a DOD Office of Inspector General review of our records for the purpose of determining whether the DOD’s various buying offices negotiated “fair and reasonable” prices for spare parts purchased from those divisions and subsidiaries during fiscal years 2002 through 2004. On April 19, 2006, the Inspector General issued its final report dated February 23, 2006 and made public a redacted version of the report. The report recommends (i) that the Defense Logistics Agency request that those five subsidiaries and divisions voluntarily refund, in the aggregate, approximately $2.6 million for allegedly overpriced parts and (ii) that Defense Logistics Agency contracting officers reevaluate their procedures for determining the reasonableness of pricing for sole source spare parts purchased from those divisions and subsidiaries and seek to develop Strategic Supplier Alliances with those divisions and subsidiaries.
10
Table of Contents
Our position has been, and continues to be, that our pricing has been fair and reasonable and that there is no legal basis for the amount suggested as a refund by the Inspector General in its report. In response to the report, we offered reasons why we disagree with the Inspector General’s overall analysis and why computations related to the voluntary refund contained in the report fail to consider key data, such as actual historical sales. If the Defense Logistics Agency requests a voluntary refund from any of our divisions or subsidiaries, we would consider such a request under the circumstances existing at that time.
In February 2006, the Defense Logistics Agency made a request to initiate discussions regarding future pricing and developing an acquisition strategy that would mutually strengthen our business relationship with the Defense Logistics Agency. Around that time, the parties discussed future purchasing but have not engaged in negotiations regarding Strategic Supplier Alliances. Negotiations regarding Strategic Supplier Alliances may occur at a later date. As a result of those negotiations, it is possible that the divisions and subsidiaries subject to the pricing review will enter into Strategic Supplier Alliances with the Defense Logistics Agency. It is likely that in connection with any Strategic Supplier Alliance, the Defense Logistics Agency will seek prices for parts based on cost. It is also possible that the DOD may seek alternative sources of supply for such parts. The entry into Strategic Supplier Alliances or a decision by the DOD to pursue alternative sources of supply for parts we currently provide could reduce the amount of revenue we derive from, and the profitability of certain of our supply arrangements with, certain agencies and buying organizations of the U.S. Government.
Our business may be adversely affected if we would lose our government or industry approvals or if more stringent government regulations are enacted or if industry oversight is increased.
The aerospace industry is highly regulated in the United States and in other countries. In order to sell our components, we and the components we manufacture must be certified by the FAA, the DOD and similar agencies in foreign countries and by individual manufacturers. If new and more stringent government regulations are adopted or if industry oversight increases, we might incur significant expenses to comply with any new regulations or heightened industry oversight. In addition, if material authorizations or approvals were revoked or suspended, our business would be adversely affected.
Our substantial indebtedness could adversely affect our financial health and could harm our ability to react to changes to our business and prevent us from fulfilling our obligations under our indebtedness, including the notes.
We have a significant amount of indebtedness. As of September 30, 2009, our total indebtedness was approximately $1,356.8 million (including premium received, net of amortization, in connection with the issuance of the original notes), which was approximately 62.4% of our total capitalization.
In addition to the foregoing indebtedness outstanding on September 30, 2009, in October 2009, TransDigm Inc. issued $425 million aggregate principal amount of 7 3/4% senior subordinated notes (“New 7 3/4% Senior Subordinated Notes”) at an issue price of 97.125% of the principal amount thereof pursuant to an indenture dated October 6, 2009 (the “New Indenture” and together, with the Indenture referred to below, the “Indentures”). The terms of the New 7 3/4% Senior Subordinated Notes are substantially identical to the terms of the already outstanding 7 3/4% Senior Subordinated Notes that were issued and sold by TransDigm Inc. in June 2006 and February 2007. The proceeds from the issuance of the New 7 3/4% Senior Subordinated Notes, after the original issue discount, were used to make a cash distribution to TD Group, which paid a special cash dividend to its stockholders of approximately $375 million, made dividend equivalent payments to its holders of stock options of approximately $30 million and paid for transaction-related fees and expenses. Our total indebtedness, on a pro forma basis as if the New 7 3/4% Senior Subordinated Notes were issued and the special dividend was paid on September 30, 2009, represents approximately 81% of our capitalization.
In addition, we may be able to incur substantial additional indebtedness in the future. For example, as of September 30, 2009, we had $198.0 million of unused commitments under our revolving loan facility. Although
11
Table of Contents
our senior secured credit facility, the indenture (the “Indenture”) governing the 7 3/4% senior subordinated notes issued in June 2006 and February 2007 (the “7 3/4% Senior Subordinated Notes”) and the New Indenture contain restrictions on the incurrence of additional indebtedness, these restrictions are subject to a number of significant qualifications and exceptions, and the indebtedness incurred in compliance with these qualifications and exceptions could be substantial. If we incur additional debt, the risks associated with our substantial leverage would increase.
Our substantial indebtedness could have important consequences to investors. For example, it could:
| • | increase our vulnerability to general economic downturns and industry conditions; |
| • | require us to dedicate a substantial portion of our cash flow from operations to payments on our indebtedness, thereby reducing the availability of our cash flow to fund working capital, capital expenditures, research and development efforts and other general corporate requirements; |
| • | limit our flexibility in planning for, or reacting to, changes in our business and the industry in which we operate; |
| • | place us at a competitive disadvantage compared to competitors that have less debt; and |
| • | limit, along with the financial and other restrictive covenants contained in the documents governing our indebtedness, among other things, our ability to borrow additional funds, make investments and incur liens. |
In addition, all of our debt under the senior secured credit facility, which includes a $780 million term loan facility and a revolving loan facility of $200 million, bears interest at floating rates. Accordingly, in the event that interest rates increase, our debt service expense will also increase. In order to reduce the floating interest rate risk, as of September 30, 2009, the Company was party to an interest rate swap agreement that fixes the rate of interest on $300 million of debt under the senior secured credit facility.
Our substantial level of indebtedness increases the possibility that we may be unable to generate cash sufficient to pay, when due, the principal of, interest on or other amounts due in respect of our indebtedness, including the 7 3/4% Senior Subordinated Notes and the New 7 3/4% Senior Subordinated Notes. We cannot assure you that our business will generate sufficient cash flow from operations, that currently anticipated cost savings and operating improvements will be realized on schedule or at all, or that future borrowings will be available to us under the senior secured credit facility or otherwise in amounts sufficient to enable us to service our indebtedness. If we cannot service our debt, we will have to take actions such as reducing or delaying capital investments, selling assets, restructuring or refinancing our debt or seeking additional equity capital.
To service our indebtedness, we will require a significant amount of cash. Our ability to generate cash depends on many factors beyond our control and any failure to meet our debt service obligations could harm our business, financial condition and results of operations.
Our ability to make payments on our indebtedness, including the 7 3/4% Senior Subordinated Notes and the New 7 3/4% Senior Subordinated Notes and amounts borrowed under the senior secured credit facility, and to fund our operations, will depend on our ability to generate cash in the future, which, to a certain extent, is subject to general economic, financial, competitive, legislative, regulatory and other factors that are beyond our control.
We cannot assure you, however, that our business will generate sufficient cash flow from operations, that currently anticipated cost savings and operating improvements will be realized on schedule or at all or that future borrowings will be available to us under the senior secured credit facility or otherwise in amounts sufficient to enable us to service our indebtedness, including the amounts borrowed under the senior secured credit facility and the 7 3/4% Senior Subordinated Notes and the New 7 3/4% Senior Subordinated Notes, or to fund our other liquidity needs. If we cannot service our debt, we will have to take actions such as reducing or delaying capital
12
Table of Contents
investments, selling assets, restructuring or refinancing our debt or seeking additional equity capital. We cannot assure you that any of these remedies could, if necessary, be effected on commercially reasonable terms, or at all. Our ability to restructure or refinance our debt will depend on the condition of the capital markets and our financial condition at such time. Any refinancing of our debt could be at higher interest rates and may require us to comply with more onerous covenants, which could further restrict our business operations. The terms of existing or future debt instruments, the Indenture and the senior secured credit facility may restrict us from adopting any of these alternatives. In addition, any failure to make payments of interest and principal on our outstanding indebtedness on a timely basis would likely result in a reduction of our credit rating, which could harm our ability to incur additional indebtedness on acceptable terms and would otherwise adversely affect the 7 3/4% Senior Subordinated Notes and the New 7 3/4% Senior Subordinated Notes.
The terms of the senior secured credit facility and the Indenture may restrict our current and future operations, particularly our ability to respond to changes or to take certain actions.
Our senior secured credit facility and the Indentures contain a number of restrictive covenants that impose significant operating and financial restrictions on TD Group, TransDigm Inc. and its subsidiaries (in the case of the senior secured credit facility) and TransDigm Inc. and its subsidiaries (in the case of the Indentures) and may limit their ability to engage in acts that may be in our long-term best interests. The senior secured credit facility and Indenture include covenants restricting, among other things, the ability of TD Group, TransDigm Inc. and its subsidiaries (in the case of the senior secured credit facility) and TransDigm Inc. and its subsidiaries (in the case of the Indentures) to:
| • | incur or guarantee additional indebtedness or issue preferred stock; |
| • | pay distributions on, redeem or repurchase our capital stock or redeem or repurchase our subordinated debt; |
| • | make investments; |
| • | sell assets; |
| • | enter into agreements that restrict distributions or other payments from our restricted subsidiaries to us; |
| • | incur or allow to exist liens; |
| • | consolidate, merge or transfer all or substantially all of our assets; |
| • | engage in transactions with affiliates; |
| • | create unrestricted subsidiaries; and |
| • | engage in certain business activities. |
A breach of any of these covenants could result in a default under the senior secured credit facility or the Indenture. If any such default occurs, the lenders under the senior secured credit facility and the holders of the 7 3/4 % Senior Subordinated Notes and the holders of the New 7 3/4% Senior Subordinated Notes may elect to declare all outstanding borrowings, together with accrued interest and other amounts payable thereunder, to be immediately due and payable. The lenders under the senior secured credit facility also have the right in these circumstances to terminate any commitments they have to provide further borrowings. In addition, following an event of default under the senior secured credit facility, the lenders under that facility will have the right to proceed against the collateral granted to them to secure the debt, which includes our available cash, and they will also have the right to prevent us from making debt service payments on the 7 3/4% Senior Subordinated Notes and the New 7 3/4% Senior Subordinated Notes. If the debt under the senior secured credit facility or the 7 3/4% Senior Subordinated Notes and/or the New 7 3/4% Senior Subordinated Notes were to be accelerated, we cannot assure you that our assets would be sufficient to repay in full our debt.
13
Table of Contents
We are dependent on our highly trained employees and any work stoppage or difficulty hiring similar employees could adversely affect our business.
Because our products are complicated and highly engineered, we depend on an educated and trained workforce. There is substantial competition for skilled personnel in the aircraft component industry, and we could be adversely affected by a shortage of skilled employees. We may not be able to fill new positions or vacancies created by expansion or turnover or attract and retain qualified personnel.
As of September 30, 2009, we had approximately 2,000 employees. Approximately 4% of our employees were represented by the United Steelworkers Union, approximately 3% were represented by the United Automobile, Aerospace and Agricultural Implement Workers of America and approximately 4% were represented by the International Brotherhood of Electrical Workers. Collective bargaining agreements between us and these labor unions expire in April 2011, November 2012 and May 2013, respectively. Although we believe that our relations with our employees are satisfactory, we cannot assure you that we will be able to negotiate a satisfactory renewal of these collective bargaining agreements or that our employee relations will remain stable. Because we maintain a relatively small inventory of finished goods, any work stoppage could materially and adversely affect our ability to provide products to our customers.
Our business is dependent on the availability of certain components and raw materials from suppliers.
Our business is affected by the price and availability of the raw materials and component parts that we use to manufacture our components. Our business, therefore, could be adversely impacted by factors affecting our suppliers (such as the destruction of our suppliers’ facilities or their distribution infrastructure, a work stoppage or strike by our suppliers’ employees or the failure of our suppliers to provide materials of the requisite quality), or by increased costs of such raw materials or components if we were unable to pass along such price increases to our customers. Because we maintain a relatively small inventory of raw materials and component parts, our business could be adversely affected if we were unable to obtain these raw materials and components from our suppliers in the quantities we require or on favorable terms. Although we believe in most cases that we could identify alternative suppliers, or alternative raw materials or component parts, the lengthy and expensive FAA and OEM certification processes associated with aerospace products could prevent efficient replacement of a supplier, raw material or component part.
We could incur substantial costs as a result of violations of or liabilities under such environmental laws and regulations.
Our operations and facilities are subject to a number of federal, state and local environmental laws and regulations that govern, among other things, discharges of pollutants into the air and water, the handling, storage and disposal of hazardous materials and wastes, and the remediation of contamination. We could incur substantial costs, including clean-up costs, fines and sanctions and/or third party property damage or personal injury claims, as a result of violations of or liabilities under environmental laws, relevant common law or the environmental permits required for our operations.
Pursuant to certain environmental laws, a current or previous owner or operator of a contaminated site may be held liable for the entire cost of investigation, removal or remediation of hazardous materials at such property, whether or not the owner or operator knew of, or was responsible for, the presence of any hazardous materials. Persons who arrange for the disposal or treatment of hazardous materials may also be held liable for such costs related to a disposal or treatment site, regardless of whether the affected site is owned or operated by them. Contaminants have been detected at some of our present and former sites, principally in connection with historical operations, and investigations and/or clean-ups have been undertaken by us or by former owners of the sites. We also receive inquiries and notices of potential liability with respect to offsite disposal facilities from time to time. Although we are not aware of any sites for which material obligations exist, the discovery of additional contaminants, the imposition of additional clean-up obligations or the initiation of suits for personal injury or damages to property or natural resources could result in significant liability.
14
Table of Contents
We have recorded a significant amount of intangible assets, which may never generate the returns we expect.
Mergers and acquisitions have resulted in significant increases in identifiable intangible assets and goodwill. Identifiable intangible assets, which primarily include trademarks, trade names, trade secrets, license agreements and technology, were approximately $372.9 million at September 30, 2009, representing approximately 15% of our total assets. Goodwill recognized in accounting for the mergers and acquisitions was approximately $1,462.3 million at September 30, 2009, representing approximately 60% of our total assets. We may never realize the full value of our identifiable intangible assets and goodwill, and to the extent we were to determine that our identifiable intangible assets or our goodwill were impaired within the meaning of applicable accounting regulations, we would be required to write-off the amount of any impairment.
We face significant competition.
We operate in a highly competitive global industry and compete against a number of companies, including divisions of larger companies, some of which have significantly greater resources than we do, and therefore may be able to adapt more quickly to new or emerging technologies and changes in customer requirements, or devote greater resources to the promotion and sale of their products than we can. Competitors in our product lines are both U.S. and foreign companies and range in size from divisions of large public corporations to small privately held entities. We believe that our ability to compete depends on high product performance, consistent high quality, short lead-time and timely delivery, competitive pricing, superior customer service and support and continued certification under customer quality requirements and assurance programs. We may have to adjust the prices of some of our products to stay competitive.
We could be adversely affected if one of our components causes an aircraft to crash.
Our operations expose us to potential liabilities for personal injury or death as a result of the failure of an aircraft component that we have designed, manufactured or serviced. While we maintain liability insurance to protect us from future products liability claims, in the event of product liability claims our insurers may attempt to deny coverage or any coverage we have may not be adequate. We also may not be able to maintain insurance coverage in the future at an acceptable cost. Any liability not covered by insurance or for which third party indemnification is not available could result in significant liability to us.
In addition, a crash caused by one of our components could damage our reputation for quality products. We believe our customers consider safety and reliability as key criteria in selecting a provider of aircraft components. If a crash were to be caused by one of our components, or if we were to otherwise fail to maintain a satisfactory record of safety and reliability, our ability to retain and attract customers may be materially adversely affected.
Our stock prices may be volatile, and your investment in our common stock could suffer a decline in value.
There has been significant volatility in the market price and trading volume of equity securities, which is unrelated to the financial performance of the companies issuing the securities. These broad market fluctuations may negatively affect the market price of our common stock. You may not be able to resell your shares at or above the purchase price due to fluctuations in the market price of our common stock caused by changes in our operating performance or prospects, including possible changes due to the cyclical nature of the aerospace industry and other factors such as fluctuations in OEM and aftermarket ordering, which could cause short-term swings in profit margins, or unrelated to our operating performance, including market conditions affecting the stock market generally or the stocks of aerospace companies more specifically.
15
Table of Contents
Future sales of our common stock in the public market could lower our share price.
We may sell additional shares of common stock into the public markets or issue convertible debt securities to raise capital in the future. The market price of our common stock could decline as a result of sales of a large number of shares of our common stock in the public markets or the perception that these sales could occur. These sales, or the possibility that these sales may occur, also might make it more difficult for us to sell equity securities to raise capital at a time and price that we deem appropriate.
Our corporate documents and Delaware law contain certain provisions that could discourage, delay or prevent a change in control of our company.
Provisions in our amended and restated certificate of incorporation and bylaws may discourage, delay or prevent a merger or acquisition involving us that our stockholders may consider favorable. For example, our amended and restated certificate of incorporation authorizes our Board of Directors to issue up to 149,600,000 shares of “blank check” preferred stock. Without stockholder approval, the Board of Directors has the authority to attach special rights, including voting and dividend rights, to this preferred stock. With these rights, holders of preferred stock could make it more difficult for a third party to acquire us. In addition, our amended and restated certificate of incorporation provides for a staggered Board of Directors, whereby directors serve for three-year terms, with approximately one-third of the directors coming up for re-election each year. Having a staggered board will make it more difficult for a third party to obtain control of our Board of Directors through a proxy contest, which may be a necessary step in an acquisition of us that is not favored by our Board of Directors. Our amended and restated certificate of incorporation also provides that the affirmative vote of the holders of at least 75% of the voting power of our issued and outstanding capital stock, voting together as a single class, is required for the alteration, amendment or repeal of certain provisions of our amended and restated certificate of incorporation, including the provisions authorizing a staggered board, and certain provisions of our amended and restated bylaws, including the provisions relating to our stockholders’ ability to call special meetings, notice provisions for stockholder business to be conducted at an annual meeting, requests for stockholder lists and corporate records, nomination and removal of directors, and filling of vacancies on our Board of Directors.
We are also subject to the anti-takeover provisions of Section 203 of the Delaware General Corporation Law. Under these provisions, if anyone becomes an “interested stockholder,” we may not enter into a “business combination” with that person for three years without special approval, which could discourage a third party from making a takeover offer and could delay or prevent a change of control. For purposes of Section 203, “interested stockholder” means, generally, someone owning 15% or more of our outstanding voting stock or an affiliate of ours that owned 15% or more of our outstanding voting stock during the past three years, subject to certain exceptions as described in Section 203.
We do not intend to pay regular cash dividends on our stock.
Notwithstanding the special cash dividend paid in October 2009, we do not anticipate declaring or paying regular cash dividends on our common stock or any other equity security in the foreseeable future. The amounts that may be available to us to pay cash dividends are restricted under our debt and other agreements. Any payment of cash dividends on our common stock in the future will be at the discretion of our Board of Directors and will depend on our results of operations, earnings, capital requirements, financial condition, future prospects, contractual restrictions and other factors deemed relevant by our Board of Directors. Therefore, you should not rely on dividend income from shares of our common stock.
| ITEM 1B. | UNRESOLVED STAFF COMMENTS |
None.
16
Table of Contents
| ITEM 2. | PROPERTIES |
TransDigm’s owned properties as of September 30, 2009 are as follows:
| Location |
Square Footage | |
| Liberty, SC |
219,000 | |
| Waco, TX |
218,800 | |
| Los Angeles, CA |
131,000 | |
| Addison, IL |
83,300 | |
| Seattle, WA |
78,000 | |
| Painesville, OH |
63,900 | |
| Cleveland, OH |
50,000 | |
| Avenel, NJ |
48,500 | |
| Deerfield, FL |
20,000 | |
| Holtsville, NY |
48,300 | |
| Malaysia |
24,800 |
The properties listed above, except Deerfield, Holtsville and Malaysia, are subject to mortgage liens under our senior secured credit facility. The Holtsville, NY property is an asset held for sale as of September 30, 2009.
TransDigm’s leased properties as of September 30, 2009 are as follows:
| Location |
Square Footage | |
| Dayton, NV |
144,000 | |
| Fullerton, CA |
100,000 | |
| Collegeville, PA |
90,000 | |
| Camarillo, CA |
70,000 | |
| Tempe, AZ |
40,200 | |
| Gardena, CA |
25,000 | |
| Bellevue, WA |
18,000 | |
| Wichita, KS |
10,000 | |
| Cleveland, OH |
7,100 |
TransDigm also leases certain of its other non-material facilities. Management believes that our machinery, plants and offices are in satisfactory operating condition and that it will have sufficient capacity to meet foreseeable future needs without incurring significant additional capital expenditures.
| ITEM 3. | LEGAL PROCEEDINGS |
During the ordinary course of business, TransDigm is from time to time threatened with, or may become a party to, legal actions and other proceedings related to its businesses, products or operations. While TransDigm is currently involved in some legal proceedings, management believes the results of these proceedings will not have a material effect on its financial condition, results of operations, or cash flows.
| ITEM 4. | SUBMISSION OF MATTERS TO A VOTE OF SECURITY HOLDERS |
None.
17
Table of Contents
| ITEM 5. | MARKET FOR REGISTRANT’S COMMON EQUITY, RELATED STOCKHOLDER MATTERS AND ISSUER PURCHASES OF EQUITY SECURITIES |
Market Information
Our common stock is traded on the New York Stock Exchange, or NYSE, under the ticker symbol “TDG.” The following chart sets forth, for the periods indicated, the high and low sales prices of the common stock on the NYSE.
Quarterly Stock Prices
| High | Low | |||
| Fiscal 2008 |
||||
| For Quarter ended December 29, 2007 |
51.60 | 41.15 | ||
| For Quarter ended March 29, 2008 |
46.51 | 34.73 | ||
| For Quarter ended June 28, 2008 |
44.54 | 33.74 | ||
| For Quarter ended September 30, 2008 |
42.01 | 31.15 | ||
| Fiscal 2009 |
||||
| For Quarter ended December 27, 2008 |
35.60 | 23.00 | ||
| For Quarter ended March 28, 2009 |
40.56 | 29.51 | ||
| For Quarter ended June 27, 2009 |
40.63 | 31.49 | ||
| For Quarter ended September 30, 2009 |
50.93 | 35.15 | ||
Holders
We estimate that there were approximately 3,800 beneficial holders of our common stock as of November 11, 2009.
Dividends
There have been no cash dividends declared on any class of common equity of TD Group for the two most recent fiscal years. In October 2009 TD Group’s Board of Directors declared a special cash dividend of $7.65 on each outstanding share of common stock.
We do not anticipate declaring or paying regular cash dividends on our common stock in the near future. Any payment of cash dividends on our common stock in the future will be at the discretion of our Board of Directors and will depend upon our results of operations, earnings, capital requirements, financial condition, future prospects, contractual restrictions, and other factors deemed relevant by our Board of Directors. TD Group is a holding company and conducts all of its operations through direct and indirect subsidiaries. Unless TD Group receives dividends, distributions, advances, transfers of funds or other payments from our subsidiaries, TD Group will be unable to pay any dividends on our common stock in the future. The ability of any subsidiaries to take any of the foregoing actions is limited by the terms of our debt documents and may be limited by future debt or other agreements that we may enter into.
18
Table of Contents
Performance Graph
Set forth below is a line graph comparing the cumulative total return of a hypothetical investment in the shares of common stock of TD Group with the cumulative total return of a hypothetical investment in each of the S&P SmallCap 600 Index and the S&P SmallCap 600 Aerospace & Defense Index based on the respective market prices of each such investment on the dates shown below, assuming an initial investment of $100 on March 15, 2006.
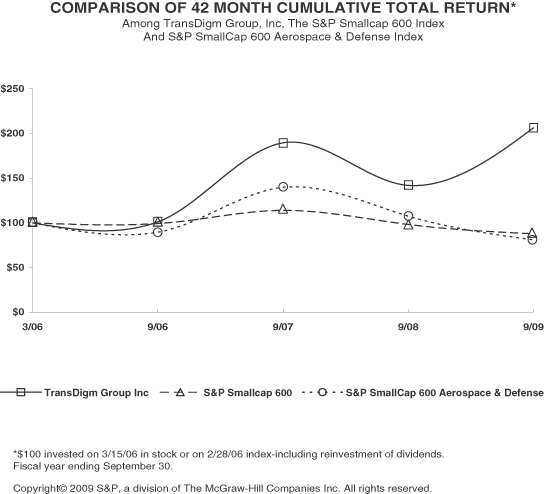
| 3/06 | 9/06 | 9/07 | 9/08 | 9/09 | ||||||
| TransDigm Group, Inc |
100.00 | 101.33 | 189.67 | 142.03 | 206.68 | |||||
| S&P SmallCap 600 |
100.00 | 99.24 | 114.06 | 98.29 | 87.86 | |||||
| S&P SmallCap 600 Aerospace & Defense |
100.00 | 89.68 | 139.70 | 107.76 | 81.20 |
Unregistered Sales of Equity Securities and Use of Proceeds
On October 23, 2008, the Board of Directors authorized a common share repurchase program, which was announced on October 27, 2008. Under the terms of the program, the Company may purchase up to a maximum aggregate value of $50 million of its shares of common stock. At September 30, 2009, the Company had repurchased under this program 494,100 shares of its common stock at a gross cost of approximately $15.2 million at a weighted-average price per share of $30.85. No purchases were made under the program during the quarter.
19
Table of Contents
| ITEM 6. | SELECTED FINANCIAL DATA |
The following table sets forth selected historical consolidated financial and other data of TD Group for the fiscal years ended September 30, 2009 to 2005 which have been derived from TD Group’s audited consolidated financial statements.
Separate historical financial information of TransDigm Inc. is not presented since the 7 3/4% Senior Subordinated Notes are guaranteed by TD Group and all direct and indirect domestic restricted subsidiaries of TransDigm Inc. and since TD Group has no operations or significant assets separate from its investment in TransDigm Inc.
Acquisitions of businesses and product lines completed by TD Group during the last five fiscal years are as follows:
| • | On December 31, 2004, TransDigm Inc. (through Skurka Aerospace Inc. (“Skurka”), a newly formed subsidiary of TransDigm Inc.) acquired certain assets and assumed certain liabilities of Skurka Engineering Company. |
| • | On January 28, 2005, TransDigm Inc. acquired all of the outstanding capital stock of Fluid Regulators Corporation (“Fluid Regulators”), a wholly-owned subsidiary of Esterline Technologies Corporation. |
| • | On June 30, 2005, Skurka acquired an aerospace motor product line from Eaton Corporation. |
| • | On May 1, 2006, Skurka acquired certain assets and assumed certain liabilities of Electra-Motion, Inc. |
| • | On June 12, 2006, TransDigm Inc. acquired all of the outstanding capital stock of Sweeney Engineering Corp. |
| • | On October 3, 2006, TransDigm Inc. acquired all of the outstanding capital stock of CDA InterCorp. |
| • | On February 7, 2007, TransDigm completed the merger with Aviation Technologies, Inc. (“ATI”), resulting in ATI becoming a wholly-owned subsidiary of TransDigm Inc. |
| • | On August 10, 2007, TransDigm (through Bruce Aerospace, Inc., a newly formed subsidiary of TransDigm Inc.) acquired certain assets and assumed certain liabilities of Bruce Industries Inc. |
| • | On May 7, 2008, TransDigm Inc. acquired all of the outstanding capital stock of CEF Industries, Inc. |
| • | On September 26, 2008, Champion Aerospace LLC, a subsidiary of TransDigm Inc., acquired certain product line assets from Unison Industries, LLC, a GE Aviation business. |
| • | On December 16, 2008, TransDigm Inc. acquired all of the outstanding capital stock of Aircraft Parts Corporation. |
| • | On July 24, 2009, TransDigm Inc. acquired all of the outstanding capital stock of Acme Aerospace Inc. |
| • | On August 10, 2009, AeroControlex Group Inc., a subsidiary of TransDigm Inc., acquired certain product line assets of Woodward HRT, Inc., a subsidiary of Woodward Governor Company. |
All of the acquisitions were accounted for as purchases. The results of operations of the acquired businesses and product lines are included in TD Group’s consolidated financial statements from the date of each of the acquisitions.
Non-GAAP Financial Measures
We present below certain financial information based on our EBITDA and EBITDA As Defined. References to “EBITDA” mean earnings before interest, taxes, depreciation and amortization, and references to “EBITDA As Defined” mean EBITDA plus, as applicable for each relevant period, certain adjustments as set forth in the reconciliations of net income to EBITDA and EBITDA As Defined and the reconciliations of net cash provided by operating activities to EBITDA and EBITDA As Defined presented below.
20
Table of Contents
Neither EBITDA nor EBITDA As Defined is a measurement of financial performance under accounting principles generally accepted in the United States of America (“GAAP”). We present EBITDA and EBITDA As Defined because we believe they are useful indicators for evaluating operating performance and liquidity.
Our management believes that EBITDA and EBITDA As Defined are useful as indicators of liquidity because securities analysts, investors, rating agencies and others use EBITDA to evaluate a company’s ability to incur and service debt. In addition, EBITDA As Defined is useful to investors because our revolving credit facility under our senior secured credit facility requires compliance, on a pro forma basis, with a financial covenant that measures the ratio of the amount of our secured indebtedness to the amount of our Consolidated EBITDA defined in the same manner as we define EBITDA As Defined herein. This financial covenant is a material term of our senior secured credit facility as the failure to comply with such financial covenant could result in an event of default in respect of the revolving credit facility (and such an event of default could, in turn, result in an event of default under the indenture governing our 7 3/4% Senior Subordinated Notes and New 7 3/4% Senior Subordinated Notes).
In addition to the above, our management uses EBITDA As Defined to review and assess the performance of the management team in connection with employee incentive programs and to prepare its annual budget and financial projections. Moreover, our management uses EBITDA As Defined to evaluate acquisitions.
Although we use EBITDA and EBITDA As Defined as measures to assess the performance of our business and for the other purposes set forth above, the use of these non-GAAP financial measures as analytical tools has limitations, and you should not consider any of them in isolation, or as a substitute for analysis of our results of operations as reported in accordance with GAAP. Some of these limitations are:
| • | neither EBITDA nor EBITDA As Defined reflects the significant interest expense, or the cash requirements necessary to service interest payments, on our indebtedness; |
| • | although depreciation and amortization are non-cash charges, the assets being depreciated and amortized will often have to be replaced in the future, and neither EBITDA nor EBITDA As Defined reflects any cash requirements for such replacements; |
| • | the omission of the substantial amortization expense associated with our intangible assets further limits the usefulness of EBITDA and EBITDA As Defined; |
| • | neither EBITDA nor EBITDA As Defined includes the payment of taxes, which is a necessary element of our operations; and |
| • | EBITDA As Defined excludes the cash expense we have incurred to integrate acquired businesses into our operations, which is a necessary element of certain of our acquisitions. |
Because of these limitations, EBITDA and EBITDA As Defined should not be considered as measures of discretionary cash available to us to invest in the growth of our business. Management compensates for these limitations by not viewing EBITDA or EBITDA As Defined in isolation and specifically by using other GAAP measures, such as net income, net sales and operating profit, to measure our operating performance. Neither EBITDA nor EBITDA As Defined is a measurement of financial performance under GAAP, and neither should be considered as an alternative to net income or cash flow from operations determined in accordance with GAAP. Our calculation of EBITDA and EBITDA As Defined may not be comparable to the calculation of similarly titled measures reported by other companies.
21
Table of Contents
The information presented below should be read together with “Management’s Discussion and Analysis of Financial Condition and Results of Operations” and the consolidated financial statements and accompanying notes included elsewhere herein.
| Fiscal Years Ended September 30, | |||||||||||||||
| 2009 | 2008 | 2007 | 2006 | 2005 | |||||||||||
| (in thousands, except per share amounts ) | |||||||||||||||
| Statement of Operations Data: |
|||||||||||||||
| Net Sales |
$ | 761,552 | $ | 713,711 | $ | 592,798 | $ | 435,164 | $ | 374,253 | |||||
| Gross profit(1) |
429,346 | 385,931 | 309,032 | 221,290 | 184,270 | ||||||||||
| Operating expenses: |
|||||||||||||||
| Selling and administrative |
80,018 | 74,650 | 62,890 | 48,309 | 38,943 | ||||||||||
| Amortization of intangibles |
13,928 | 12,002 | 12,304 | 6,197 | 7,747 | ||||||||||
| Refinancing costs |
— | — | — | 48,617 | — | ||||||||||
| Operating income(1) |
335,400 | 299,279 | 233,838 | 118,167 | 137,580 | ||||||||||
| Interest expense, net |
84,398 | 92,677 | 91,767 | 76,732 | 80,266 | ||||||||||
| Income before income taxes |
251,002 | 206,602 | 142,071 | 41,435 | 57,314 | ||||||||||
| Income taxe provision |
88,100 | 73,476 | 53,426 | 16,318 | 22,627 | ||||||||||
| Net income |
$ | 162,902 | $ | 133,126 | $ | 88,645 | $ | 25,117 | $ | 34,687 | |||||
| Basic earnings per share computation: |
|||||||||||||||
| Weighted-average common shares outstanding(2) |
48,481 | 47,856 | 45,630 | 44,415 | 44,202 | ||||||||||
| Net income per share(3) |
$ | 3.36 | $ | 2.78 | $ | 1.94 | $ | 0.57 | $ | 0.78 | |||||
| Diluted earnings per share computation: |
|||||||||||||||
| Weighted-average common shares outstanding(2) |
50,459 | 50,202 | 48,542 | 47,181 | 46,544 | ||||||||||
| Net income per share(4) |
$ | 3.23 | $ | 2.65 | $ | 1.83 | $ | 0.53 | $ | 0.75 | |||||
| As of September 30, | |||||||||||||||
| 2009 | 2008 | 2007 | 2006 | 2005 | |||||||||||
| (in thousands) | |||||||||||||||
| Balance Sheet Data: |
|||||||||||||||
| Cash and cash equivalents(5) |
$ | 190,167 | $ | 159,062 | $ | 105,946 | $ | 61,217 | $ | 104,221 | |||||
| Working capital |
395,002 | 334,932 | 298,380 | 190,742 | 118,559 | ||||||||||
| Total assets |
2,454,440 | 2,255,821 | 2,061,053 | 1,416,712 | 1,427,748 | ||||||||||
| Long-term debt, including current portion |
1,356,761 | 1,357,230 | 1,357,854 | 925,000 | 889,846 | ||||||||||
| Stockholders’ equity |
819,162 | 653,900 | 487,551 | 363,041 | 333,107 | ||||||||||
22
Table of Contents
| Fiscal Years Ended September 30, | ||||||||||||||||||||
| 2009 | 2008 | 2007 | 2006 | 2005 | ||||||||||||||||
| (in thousands) | ||||||||||||||||||||
| Other Financial Data: |
||||||||||||||||||||
| Cash flows provided by (used in): |
||||||||||||||||||||
| Operating activities |
$ | 197,112 | $ | 189,635 | $ | 112,436 | $ | 3,058 | $ | 80,695 | ||||||||||
| Investing activities |
(168,388 | ) | (165,044 | ) | (521,665 | ) | (35,323 | ) | (20,530 | ) | ||||||||||
| Financing activities |
2,381 | 28,525 | 453,958 | (10,739 | ) | (4,442 | ) | |||||||||||||
| Depreciation and amortization |
27,521 | 25,254 | 23,952 | 16,111 | 16,956 | |||||||||||||||
| Capital expenditures |
13,155 | 10,884 | 10,258 | 8,350 | 7,960 | |||||||||||||||
| Ratio of earnings to fixed charges(6) |
3.9x | 3.2x | 2.5x | 1.5x | 1.7x | |||||||||||||||
| Other Data: |
||||||||||||||||||||
| EBITDA(7) |
$ | 362,921 | $ | 324,533 | $ | 257,790 | $ | 134,278 | $ | 154,536 | ||||||||||
| EBITDA As Defined(7) |
$ | 374,690 | $ | 333,077 | $ | 274,708 | $ | 194,437 | $ | 164,240 | ||||||||||
| (1) | Gross profit and operating income include the effect of charges relating to purchase accounting adjustments to inventory associated with the acquisition of various businesses and product lines for the fiscal years ended September 30, 2009, 2008, 2007, 2006 and 2005 of $2,264,000, $1,933,000, $6,392,000, $200,000, and $1,493,000, respectively. |
| (2) | The weighted-average common shares outstanding for the periods presented have been adjusted to give effect to the 149.6 for 1.00 stock split that occurred on March 14, 2006 in connection with the initial public offering. |
| (3) | Net income per share is calculated by dividing net income by the basic weighted average common shares outstanding. |
| (4) | Net income per share is calculated by dividing net income by the diluted weighted-average common shares outstanding. However, stock options totaling 0.1 million outstanding at September 30, 2009 and 2008 and September 30, 2006, were excluded from the diluted earnings per share computation for fiscal 2009, 2008 and 2006 due to the anti-dilutive effect of such options. |
| (5) | On November 10, 2005, TransDigm Inc. paid a cash dividend of approximately $98.0 million to its then parent company, TransDigm Holding Company, and made bonus payments of approximately $6.2 million to certain members of our management. TransDigm Holding Company used all of the proceeds received from TransDigm Inc. to pay a cash dividend to TD Group. On November 10, 2005, TD Group entered into a loan facility and used the net proceeds received from the borrowings thereunder of approximately $193.8 million, together with substantially all of the proceeds received from the dividend payment from TransDigm Holding Company, to (i) prepay the entire outstanding principal amount and all accrued and unpaid interest on its 12% senior unsecured promissory notes issued in connection with acquisition of the Company by Warburg Pincus in July 2003, which payments in the aggregate were equal to approximately $262.7 million, and (ii) make certain distributions to members of our management who participated in our deferred compensation plans, which distributions in the aggregate were equal to approximately $26.0 million. |
| (6) | For purposes of computing the ratio of earnings to fixed charges, earnings consist of earnings before income taxes plus fixed charges. Fixed charges consist of interest expense, amortization of debt issuance costs and the portion (approximately 33%) of rental expense that management believes is representative of the interest component of rental expense. |
| (7) | EBITDA represents earnings before interest, taxes, depreciation and amortization. EBITDA As Defined represents EBITDA plus, as applicable for each relevant period, certain adjustments as set forth in the reconciliation of net income to EBITDA and EBITDA As Defined and the reconciliation of net cash provided by operating activities to EBITDA and EBITDA As Defined presented below. See “Non-GAAP Financial Measures” for additional information and limitations regarding these non-GAAP financial measures. |
23
Table of Contents
The following table sets forth a reconciliation of net income to EBITDA and EBITDA As Defined:
| Fiscal Years Ended September 30, | |||||||||||||||
| 2009 | 2008 | 2007 | 2006 | 2005 | |||||||||||
| (in thousands) | |||||||||||||||
| Net income |
$ | 162,902 | $ | 133,126 | $ | 88,645 | $ | 25,117 | $ | 34,687 | |||||
| Add: |
|||||||||||||||
| Depreciation and amortization |
27,521 | 25,254 | 23,952 | 16,111 | 16,956 | ||||||||||
| Interest expense, net |
84,398 | 92,677 | 91,767 | 76,732 | 80,266 | ||||||||||
| Provision for income taxes |
88,100 | 73,476 | 53,426 | 16,318 | 22,627 | ||||||||||
| EBITDA |
362,921 | 324,533 | 257,790 | 134,278 | 154,536 | ||||||||||
| Add: |
|||||||||||||||
| Inventory purchase accounting adjustments(1) |
2,264 | 1,933 | 6,392 | 200 | 1,493 | ||||||||||
| Acquisition integration costs(2) |
3,426 | 393 | 2,037 | 1,032 | 1,363 | ||||||||||
| Non-cash compensation and deferred compensation costs(3) |
6,079 | 6,218 | 5,482 | 988 | 6,698 | ||||||||||
| One-time special bonus payments(4) |
— | — | — | 6,222 | — | ||||||||||
| Acquisition earnout costs(5) |
— | — | 850 | 450 | 150 | ||||||||||
| Refinancing costs(6) |
— | — | — | 48,617 | — | ||||||||||
| Public offering costs(7) |
— | — | 1,691 | 2,650 | — | ||||||||||
| Other(8) |
— | — | 466 | — | — | ||||||||||
| EBITDA As Defined |
$ | 374,690 | $ | 333,077 | $ | 274,708 | $ | 194,437 | $ | 164,240 | |||||
| (1) | Represents purchase accounting adjustments to inventory associated with the acquisitions of various businesses and product lines that were charged to cost of sales when the inventory was sold. |
| (2) | Represents costs incurred to integrate acquired businesses and product lines into TD Group’s operations, facility relocation costs and other acquisition-related costs. |
| (3) | Represents the expenses recognized by us under our stock option plans and our deferred compensation plans. The amount reflected above for the fiscal year ended September 30, 2006 includes (i) a reversal of previously recorded amounts charged to expense of $3.8 million resulting from the termination of two of our deferred compensation plans during such period and (ii) expense recognized by us under a new deferred compensation plan adopted by us during such period. |
| (4) | Represents the aggregate amount of one-time special bonuses paid on November 10, 2005 to members of management. On November 10, 2005, we entered into an amendment to our former senior secured credit facility pursuant to which the lenders thereunder agreed to exclude these one-time special bonus payments from the calculation of EBITDA As Defined. |
| (5) | Represents the amount recognized for an earnout payment pursuant to the terms of the retention agreement entered into in connection with the acquisition of substantially all of the assets of Skurka Engineering Company in December 2004. Pursuant to the November 10, 2005 amendment to our former senior secured credit facility described above, the lenders thereunder agreed to exclude earnout payments and deferred purchase price payments made in connection with certain permitted acquisitions from the calculation of EBITDA As Defined. |
| (6) | Represents costs incurred in connection with the refinancing in June 2006, including the premium paid to redeem our 8 3/8% senior subordinated notes of $25.6 million, the write off of debt issue costs of $22.9 million, and other expenses of $0.1 million. |
| (7) | Represents costs and expenses incurred by TD Group related to the initial public offering in March 2006 or the secondary offering in May 2007. |
| (8) | Represents the write-down of certain property to its fair value that was reclassified as held for sale in fiscal 2007. |
24
Table of Contents
The following table sets forth a reconciliation of net cash provided by operating activities to EBITDA and EBITDA As Defined:
| Fiscal Years Ended September 30, | ||||||||||||||||||||
| 2009 | 2008 | 2007 | 2006 | 2005 | ||||||||||||||||
| (in thousands) | ||||||||||||||||||||
| Net cash provided by operating activities |
$ | 197,112 | $ | 189,635 | $ | 112,436 | $ | 3,058 | $ | 80,695 | ||||||||||
| Adjustments: |
||||||||||||||||||||
| Changes in assets and liabilities, net of effects from acquisitions of businesses |
1,897 | (35,544 | ) | (10,602 | ) | 111,148 | (23,489 | ) | ||||||||||||
| Interest expense, net, excluding amortization of debt issue costs / note premium(1) |
81,147 | 89,580 | 88,620 | 50,011 | 76,458 | |||||||||||||||
| Income tax provision—current |
79,300 | 66,141 | 47,196 | (1,925 | ) | 21,934 | ||||||||||||||
| Non-cash equity compensation(2) |
(5,813 | ) | (4,035 | ) | (3,487 | ) | (2,403 | ) | (1,062 | ) | ||||||||||
| Excess tax benefit from exercise of stock options |
9,278 | 18,756 | 23,627 | — | — | |||||||||||||||
| Loss on repayment of senior subordinated notes(3) |
— | — | — | (25,611 | ) | — | ||||||||||||||
| EBITDA |
362,921 | 324,533 | 257,790 | 134,278 | 154,536 | |||||||||||||||
| Add: |
||||||||||||||||||||
| Inventory purchase accounting adjustments(4) |
2,264 | 1,933 | 6,392 | 200 | 1,493 | |||||||||||||||
| Acquisition integration costs(5) |
3,426 | 393 | 2,037 | 1,032 | 1,363 | |||||||||||||||
| Non-cash compensation and deferred compensation costs(6) |
6,079 | 6,218 | 5,482 | 988 | 6,698 | |||||||||||||||
| One-time special bonus payments(7) |
— | — | — | 6,222 | — | |||||||||||||||
| Acquisition earnout costs(8) |
— | — | 850 | 450 | 150 | |||||||||||||||
| Refinancing costs(9) |
— | — | — | 48,617 | — | |||||||||||||||
| Public offering costs(10) |
— | — | 1,691 | 2,650 | — | |||||||||||||||
| Other(11) |
— | — | 466 | — | — | |||||||||||||||
| EBITDA As Defined |
$ | 374,690 | $ | 333,077 | $ | 274,708 | $ | 194,437 | $ | 164,240 | ||||||||||
| (1) | Represents interest expense excluding the amortization of debt issue costs and note premium. |
| (2) | Represents the compensation expense recognized by TD Group under its stock plans. |
| (3) | Represents costs incurred in connection with the refinancing in June 2006 and the premium paid to redeem our 8 3/8% senior subordinated notes of $25.6 million. |
| (4) | Represents purchase accounting adjustments to inventory associated with the acquisitions of various businesses and product lines that were charged to cost of sales when the inventory was sold. |
| (5) | Represents costs incurred to integrate acquired businesses and product lines into TD Group’s operations, facility relocation costs and other acquisition-related costs. |
| (6) | Represents the expenses recognized by us under our stock option plans and our deferred compensation plans. The amount reflected above for the fiscal year ended September 30, 2006 includes (i) a reversal of previously recorded amounts charged to expense of $3.8 million resulting from the termination of two of our deferred compensation plans during such period and (ii) expense recognized by us under a new deferred compensation plan adopted by us during such period. |
| (7) | Represents the aggregate amount of one-time special bonuses paid on November 10, 2005 to members of management. On November 10, 2005, we entered into an amendment to our former senior secured credit facility pursuant to which the lenders thereunder agreed to exclude these one-time special bonus payments from the calculation of EBITDA As Defined. |
| (8) | Represents the amount recognized for an earnout payment pursuant to the terms of the retention agreement entered into in connection with the acquisition of substantially all of the assets of Skurka Engineering Company in December 2004. Pursuant to the November 10, 2005 amendment to our former senior secured |
25
Table of Contents
| credit facility described above, the lenders thereunder agreed to exclude earnout payments and deferred purchase price payments made in connection with certain permitted acquisitions from the calculation of EBITDA As Defined. |
| (9) | Represents costs incurred in connection with the refinancing in June 2006, including the premium paid to redeem our 8 3/8% senior subordinated notes of $25.6 million, the write off of debt issue costs of $22.9 million, and other expenses of $0.1 million. |
| (10) | Represents costs and expenses incurred by TD Group related to the initial public offering in March 2006 or the secondary offering in May 2007. |
| (11) | Represents the write-down of certain property to its fair value that was reclassified as held for sale in fiscal 2007. |
26
Table of Contents
| ITEM 7. | MANAGEMENT’S DISCUSSION AND ANALYSIS OF FINANCIAL CONDITION AND RESULTS OF OPERATIONS |
The following discussion of our financial condition and results of operations should be read together with “Selected Financial Data” and TD Group’s consolidated financial statements and the related notes included elsewhere in this report. The following discussion may contain predictions, estimates and other forward-looking statements that involve a number of risks and uncertainties, including those discussed under the heading entitled “Risk Factors” included elsewhere in this report. These risks could cause our actual results to differ materially from any future performance suggested below.
Overview
We believe we are a leading global designer, producer and supplier of highly engineered aircraft components for use on nearly all commercial and military aircraft in service today. Our business is well diversified due to the broad range of products we offer to our customers. Some of our more significant product offerings, substantially all of which are ultimately provided to end-users in the aerospace industry, include mechanical/electromechanical actuators and controls, ignition systems and components, gear pumps, specialized valves, engineered connectors, power conditioning devices, specialized fluorescent lighting, specialized AC/DC electric motors, aircraft audio systems, engineered latches and cockpit security devices, lavatory hardware and components, hold open rods and locking devices, specialized cockpit displays, elastomers, NiCad batteries and chargers, starter generators and related components. Each of these product offerings consists of many individual products that are typically customized to meet the needs of a particular aircraft platform or customer.
For fiscal year 2009, we generated net sales of $761.6 million and net income of $162.9 million. In addition, for fiscal year 2009, our EBITDA was $362.9 million, or 47.7% of net sales, our EBITDA As Defined was $374.7 million, or 49.2% of net sales, and our capital expenditures were $13.2 million, or 1.7% of net sales. See “EBITDA and EBITDA As Defined” below for certain information regarding EBITDA and EBITDA As Defined, including a reconciliation of net income to EBITDA and EBITDA As Defined and a reconciliation of net cash provided by operating activities to EBITDA and EBITDA As Defined.
We estimate that over 95% of our net sales for fiscal year 2009 were generated by proprietary products for which we own the design. These products are generally approved and certified by airframe manufacturers (who often certify only one manufacturer’s component design for a specific application on an aircraft), government agencies and/or the FAA and similar entities or agencies. In addition, for fiscal year 2009, we estimate that we generated approximately 80% of our net sales from products for which we are the sole source provider.
Most of our products generate significant aftermarket revenue. Once our parts are designed into and sold as original equipment on an aircraft, we generate net sales from recurring aftermarket consumption over the life of that aircraft. This installed base and our sole source provider position generate a long-term stream of aftermarket revenues over the estimated 30-year life of an individual aircraft. We estimate that approximately 60% of our net sales in fiscal year 2009 were generated from aftermarket sales, the vast majority of which come from the commercial and military aftermarkets. These aftermarket revenues have historically produced a higher gross margin and have been more stable than sales to OEMs.
In fiscal year 2009, our top two customers accounted for approximately 22% of our net sales, and during this same period our top ten customers accounted for approximately 44% of our net sales. However, our components are ultimately used on a large, diverse installed base of aircraft and, therefore, we are not overly dependent on any single airframe produced by any of our customers or other ultimate end-users of our products. In the commercial aerospace sector, which generated approximately 65% of our net sales for fiscal year 2009, we sell to distributors of aftermarket components, as well as directly to commercial airlines, aircraft maintenance facilities, systems suppliers, and aircraft and engine OEMs. In addition, for fiscal year 2009, approximately 32% of our net sales were attributable to the defense aerospace sector. Net sales to the defense sector are generated
27
Table of Contents
primarily through sales to the United States and foreign militaries, brokers, distributors and defense OEMs. The remaining portion of our net sales in fiscal year 2009, or approximately 3% of our net sales during this period, were derived from industries with similar niche engineered product characteristics such as the mining and power generation industries.
Public Offerings
On May 25, 2007, certain of TD Group’s stockholders, including certain members of our management, sold an aggregate of 11.5 million shares of TD Group’s common stock in an underwritten public offering at a public offering price of $35.25 per share. TD Group did not sell any shares in the offering and did not receive any proceeds from the offering.
On March 20, 2006, certain stockholders of TD Group and certain members of our management sold an aggregate of 12.6 million shares of TD Group’s common stock in the Initial Public Offering at a price of $21.00 per share. TD Group did not offer any shares of its common stock for sale in the initial public offering and TD Group did not receive any of the proceeds from the sale of such shares by the selling stockholders. As a result of the initial public offering, TD Group’s common stock is publicly traded on the New York Stock Exchange under the ticker symbol “TDG.”
Certain Acquisitions
Woodward HRT Product Line Acquisition
On August 10, 2009, TransDigm Inc., through its AeroControlex Group Inc. subsidiary, acquired certain product line assets of Woodward HRT, Inc., a subsidiary of Woodward Governor Company (“Woodward HRT product line”) for approximately $48 million in cash, subject to adjustment based on the level of working capital as of the closing date of the acquisition. The product line comprises a range of highly engineered fuel and pneumatic valves and surge suppressors, the majority of which are used on military rotary and fixed wing aircraft, all of which fit well with TransDigm’s overall business direction. Woodward Governor recently acquired this business as part of its acquisition of HR Textron, Inc.
Acme Aerospace Acquisition
On July 24, 2009, TransDigm Inc. acquired all of the outstanding capital stock of Acme Aerospace, Inc. (“Acme”) for approximately $40.7 million in cash, which includes a purchase price adjustment of $0.2 million paid in October 2009. Acme is a designer and manufacturer of proprietary, highly engineered components to the commercial aerospace industry, comprising primarily fibrous nickel cadmium main ship batteries, battery chargers, battery back-up systems and power conversion equipment. These products fit well with TransDigm’s overall business direction.
Aircraft Parts Corporation Acquisition
On December 16, 2008, TransDigm Inc. acquired all of the outstanding capital stock of Aircraft Parts Corporation (“APC”) for approximately $66.9 million in cash, net of a purchase price adjustment of $0.7 million received in November 2009. APC is a designer and manufacturer of starter generators, generator control units and related components for turbine engines, all of which fit well with TransDigm’s overall business direction.
Unison Product Line Acquisition
On September 26, 2008, TransDigm Inc., through its wholly-owned Champion Aerospace, LLC subsidiary, acquired certain assets related to the magneto and harness product line business of Unison Industries, LLC (“Unison”) for approximately $68.3 million in cash, net of a purchase price adjustment of $1.1 million received
28
Table of Contents
in November 2008. The acquired product line includes the highly engineered SLICKTM magnetos, harnesses and components, which are used on substantially all of the world’s general aviation piston aircraft. These products fit well with Champion’s existing product offerings and TransDigm’s overall business direction.
CEF Acquisition
On May 7, 2008, TransDigm Inc. acquired all of the outstanding capital stock of CEF Industries, Inc. (“CEF”) for approximately $84.5 million in cash, net of a purchase price adjustment of $0.5 million received in January 2009. CEF is a designer and manufacturer of specialized and highly engineered actuators, pumps and related components primarily for the military aerospace market, all of which fit well with TransDigm’s overall business direction.
Bruce Acquisition
On August 10, 2007, TransDigm Inc., through a newly formed subsidiary, Bruce Aerospace Inc. (“Bruce”), acquired certain assets and assumed certain liabilities of Bruce Industries for approximately $35.5 million in cash, net of a purchase price adjustment of $0.2 million received in February 2008. Bruce designs and manufactures specialized fluorescent lighting used in the aircraft industry. The proprietary nature, established positions, and aftermarket content fit well with our overall business direction.
ATI Acquisition
On February 7, 2007, TransDigm Inc. acquired all of the outstanding capital stock of Aviation Technologies, Inc. (“ATI”) for approximately $430 million in cash. ATI consists of two primary operating units that service the commercial and military aerospace markets – Avtech Corporation (“Avtech”) and Transicoil LLC (which, together with Transicoil (Malaysia) Sendirian Berhad is referred to as “ADS/Transicoil”). Avtech is a supplier of flight deck and passenger audio systems, cabin lighting, and power control products and related components. ADS/Transicoil is a supplier of displays, clocks, brushless motors and related components and instruments. Through Avtech and ADS/Transicoil, ATI manufactures proprietary products for the aerospace industry with broad platform positions and high aftermarket content, all of which fit well with TransDigm’s overall direction.
The purchase price consideration and costs associated with the acquisition of $430.1 million were funded through additional borrowings under our senior secured credit facility of $125.4 million (net of fees of $4.6 million), the proceeds from the issuance by TransDigm Inc. of additional senior subordinated notes of $296.5 (net of fees of $6.5 million) and the use of $8.2 million of our available cash balances.
Mr. W. Nicholas Howley, Chairman and Chief Executive Officer of TD Group, and Mr. Douglas Peacock, a director of TD Group, each indirectly owned less than one-half of 1% of ATI’s outstanding equity on a fully diluted basis. In addition, prior to the acquisition, Mr. Howley and Mr. Peacock were directors of ATI commencing in 2003, and Mr. Peacock served as ATI’s Chairman from 2003 through February 2007.
29
Table of Contents
EBITDA and EBITDA As Defined
The following table sets forth a reconciliation of net income to EBITDA and EBITDA As Defined:
| Fiscal Years Ended September 30, | ||||||
| 2009 | 2008 | |||||
| (in thousands) | ||||||
| Net income |
$ | 162,902 | $ | 133,126 | ||
| Add: |
||||||
| Depreciation and amortization expense |
27,521 | 25,254 | ||||
| Interest expense, net |
84,398 | 92,677 | ||||
| Income tax provision |
88,100 | 73,476 | ||||
| EBITDA(1) |
362,921 | 324,533 | ||||
| Add: |
||||||
| Inventory purchase accounting adjustments(2) |
2,264 | 1,933 | ||||
| Acquisition integration costs(3) |
3,426 | 393 | ||||
| Non-cash compensation and deferred compensation costs(4) |
6,079 | 6,218 | ||||
| EBITDA As Defined(1) |
$ | 374,690 | $ | 333,077 | ||
| (1) | EBITDA represents earnings before interest, taxes, depreciation and amortization. EBITDA As Defined represents EBITDA plus, as applicable for each relevant period, certain adjustments as set forth in the reconciliation of net income to EBITDA and EBITDA As Defined. See “Non-GAAP Financial Measures” for additional information and limitations regarding these non-GAAP financial measures. |
| (2) | Represents purchase accounting adjustments to inventory associated with the acquisitions of various businesses and product lines that were charged to cost of sales when the inventory was sold. |
| (3) | Represents costs incurred to integrate acquired businesses and product lines into TD Group’s operations, facility relocation costs and other acquisition-related costs. |
| (4) | Represents the expenses recognized by us under our stock option plans and our deferred compensation plans. |
The following table sets forth a reconciliation of net cash provided by operating activities to EBITDA and EBITDA As Defined (in thousands):
| Fiscal Years Ended September 30, |
||||||||
| 2009 | 2008 | |||||||
| (in thousands) | ||||||||
| Net cash provided by operating activities |
$ | 197,112 | $ | 189,635 | ||||
| Adjustments: |
||||||||
| Changes in assets and liabilities, net of effects from acquisitions of businesses |
1,897 | (35,544 | ) | |||||
| Interest expense, net, excluding amortization of debt issue costs / note premium(1) |
81,147 | 89,580 | ||||||
| Income tax provision—current |
79,300 | 66,141 | ||||||
| Non-cash equity compensation(2) |
(5,813 | ) | (4,035 | ) | ||||
| Excess tax benefit from exercise of stock options |
9,278 | 18,756 | ||||||
| EBITDA(3) |
362,921 | 324,533 | ||||||
| Add: |
||||||||
| Inventory purchase accounting adjustments(4) |
2,264 | 1,933 | ||||||
| Acquisition integration costs(5) |
3,426 | 393 | ||||||
| Non-cash compensation and deferred compensation costs(6) |
6,079 | 6,218 | ||||||
| EBITDA As Defined(3) |
$ | 374,690 | $ | 333,077 | ||||
30
Table of Contents
| (1) | Represents interest expense excluding the amortization of debt issue costs and note premium. |
| (2) | Represents the compensation expense recognized by TD Group under its stock plans. |
| (3) | EBITDA represents earnings before interest, taxes, depreciation and amortization. EBITDA As Defined represents EBITDA plus, as applicable for each relevant period, certain adjustments as set forth in the reconciliation of net cash provided by operating activities to EBITDA and EBITDA As Defined. See “Non-GAAP Financial Measures” for additional information and limitations regarding these non-GAAP financial measures. |
| (4) | Represents purchase accounting adjustments to inventory associated with the acquisitions of various businesses and product lines that were charged to cost of sales when the inventory was sold. |
| (5) | Represents costs incurred to integrate acquired businesses and product lines into TD Group’s operations, facility relocation costs and other acquisition-related costs. |
| (6) | Represents the expenses recognized by us under our stock option plans and our deferred compensation plans. |
Trend Information
We predominantly serve customers in the commercial, regional, business jet and general aviation aftermarket, which accounts for approximately 40% of total sales; the commercial aerospace OEM market, comprising large commercial transport manufacturers and regional and business jet manufacturers, which accounts for approximately 25% of total sales; and the defense market, which accounts for approximately 32% of total sales. Non-aerospace sales comprise approximately 3% of our total sales.
The commercial aerospace industry, including the aftermarket and OEM market, is impacted by the health of the global economy and geo-political events around the world. The commercial aerospace industry had shown strength with increases in revenue passenger miles, or RPMs, between 2003 and 2008, as well as increases in OEM production and backlog, however, the global economic downturn, airline capacity reductions and concerns over the financial credit markets have negatively impacted the commercial aerospace industry causing RPMs to decline slightly in 2009. The defense aerospace market is dependent on government budget constraints, the timing of orders and the extent of global conflicts. It is not necessarily affected by general economic conditions that affect the commercial aerospace industry.
Our presence in both the commercial aerospace and military sectors of the aerospace industry may mitigate the impact on our business of any specific industry risk. We service a diversified customer base in the commercial and military aerospace industry, and we provide components to a diverse installed base of aircraft, which mitigates our exposure to any individual airframe platform. At times, declines in sales in one sector have been offset by increased sales in another. However, due to differences between the profitability of our products sold to OEM and aftermarket customers, variation in product mix can cause variation in gross margin.
There are many short-term factors (including inventory corrections, unannounced changes in order patterns, strikes and mergers and acquisitions) that can cause short-term disruptions in our quarterly shipment patterns as compared to previous quarters and the same periods in prior years. To normalize for short-term fluctuations, we tend to look at our performance over several quarters or years of activity rather than discreet short-term periods. As such, it can be difficult to determine longer-term trends in our business based on quarterly comparisons.
There are also fluctuations in OEM and aftermarket ordering and delivery requests from quarter-to-quarter, as well as variations in product mix from quarter-to-quarter, that may cause positive or negative variations in gross profit margins since commercial aftermarket sales have historically produced a higher gross margin than sales to commercial OEMs. Again, in many instances these are timing events between quarters and must be balanced with macro aerospace industry indicators.
31
Table of Contents
Commercial Aftermarket
The key growth factors in the commercial aftermarket include worldwide RPMs and the size and activity level of the worldwide fleet of aircraft. Although RPMs increased annually between 2003 and 2008, industry consensus indicates that 2009 will have had negative growth as a result of expected reductions in air traffic and capacity due to the slowdown in the global economy. Industry reports expect RPMs to stabilize in 2010 and return to positive growth thereafter.
Commercial OEM Market
There is industry consensus that aircraft deliveries in the large commercial transport market sector (aircraft with 100 or more seats) may reach its peak in 2009. However, there are conflicting industry opinions regarding the level of future deliveries, but we believe deliveries may be flat or decrease going forward. Another indicator of future OEM sales in this market is the order backlog at The Boeing Company and Airbus S.A.S. Despite a significant number of airplanes in the backlog, current year orders for new airplanes have decreased from the prior year and the availability of financing is uncertain due to the current state of the credit markets. Furthermore, the business jet OEM market significantly declined in 2009 and is expected to continue to decrease in the near future. This market has also been negatively impacted by the slowdown in economic growth, corporate profits, commodity prices and stock market returns across the world.
Defense
In recent years, defense spending has reached historic highs, due in part to the military engagements in Afghanistan and Iraq and the war on terrorism. Our military business fluctuates from year to year, and is dependent, to a degree, on government budget constraints, the timing of orders and the extent of global conflicts. We anticipate that military related sales of our types of products will be flat in 2010 over the current high levels.
Critical Accounting Policies
Our consolidated financial statements have been prepared in conformity with GAAP, which often requires the judgment of management in the selection and application of certain accounting principles and methods. Management believes that the quality and reasonableness of our most critical policies enable the fair presentation of our financial position and results of operations. However, investors are cautioned that the sensitivity of financial statements to these methods, assumptions and estimates could create materially different results under different conditions or using different assumptions.
We have identified the following as the most critical accounting policies upon which our financial status depends. These critical policies were determined by considering accounting policies that involve the most complex or subjective decisions or assessments. Our most critical accounting policies are as follows:
Revenue Recognition and Related Allowances: Substantially all of our revenues are recognized based upon shipment of products to the customer, at which time title and risk of loss passes to the customer. Substantially all sales are made pursuant to firm, fixed-price purchase orders received from customers. Provisions for returns, uncollectible accounts and the cost of repairs under contract warranty provisions are provided for in the same period as the related revenues are recorded and are principally based on historical results modified, as appropriate, by the most current information available. We have a history of making reasonably dependable estimates of such allowances; however, due to uncertainties inherent in the estimation process, it is possible that actual results may vary from the estimates and the differences could be material.
Management estimates the allowance for doubtful accounts based on the aging of the accounts receivable and customer creditworthiness. The allowance also incorporates a provision for the estimated impact of disputes with customers. Management’s estimate of the allowance amounts that are necessary includes amounts for specifically identified losses and a general amount for estimated losses based on historical information. The
32
Table of Contents
determination of the amount of the allowance for doubtful accounts is subject to significant levels of judgment and estimation by management. If circumstances change or economic conditions deteriorate, management may need to increase the allowance for doubtful accounts.
The Company provides limited warranties in connection with the sale of its products. The warranty period for products sold varies throughout the Company’s operations, ranging from 90 days to six years. In addition, certain contracts with distributors contain right of return provisions. The Company accrues for estimated returns and warranty claims based on knowledge of product performance issues and excess inventories provided by its customers and industry sources. The Company also provides a general amount based on historical results. Historically, actual product returns and warranty claims have not differed materially from the estimates originally established.
Inventories: Inventories are stated at the lower of cost or market. Cost of inventories is determined by the average cost and the first-in, first-out (FIFO) methods for all locations except CEF, which determines the cost of inventories using the last-in, first-out (LIFO) method. Because the Company sells products that are installed on airframes that can be in-service for 30 or more years, it must keep a supply of such products on hand while the airframes are in use. Provision for potentially obsolete or slow-moving inventory is made based on our analysis of inventory levels, past usage and future sales forecasts. Although management believes that the Company’s estimates of obsolete and slow-moving inventory are reasonable, actual results may differ materially from the estimates and additional provisions may be required in the future. In addition, in accordance with industry practice, all inventories are classified as current assets as all inventories are available and necessary to support current sales, even though a portion of the inventories may not be sold within one year.
Intangible Assets: Mergers and acquisitions have resulted in significant amounts of identifiable intangible assets and goodwill. Intangible assets other than goodwill are recognized if the benefit of the intangible asset is obtained through contractual or other legal rights, or if the intangible asset can be sold, transferred, licensed or exchanged, regardless of the Company’s intent to do so. Goodwill and identifiable intangible assets are recorded at fair value on the date of acquisition and are reviewed at least annually for impairment based on cash flow projections and fair value estimates. The determination of undiscounted cash flows is based on the Company’s strategic plans and long-range planning forecasts. The revenue growth rates included in the plans are based on industry and Company specific data. The profit margin assumptions included in the plans are projected based on the current cost structure and anticipated cost changes. If different assumptions were used in these plans, the related undiscounted cash flows used in measuring impairment could be different and the recognition of an impairment loss might be required. Intangible assets, such as goodwill, trademarks and trade names that have an indefinite useful life are not amortized. All other intangible assets are amortized over their estimated useful lives.
GAAP requires that the annual, and any interim, impairment assessment be performed at the reporting unit level. The reporting unit level is the operating subsidiary level for the Company. Substantially all goodwill was determined and recognized for each operating subsidiary pursuant to the accounting for the merger or acquisition as of the date of each transaction, and therefore the allocation of goodwill among reporting units was immaterial for purposes of the impairment assessment. Certain of the acquisitions were or are being integrated into an existing operating subsidiary, and therefore any related goodwill is combined with goodwill of the operating subsidiary.
Stock Options and Deferred Compensation Plans: The Company accounts for the cost of its stock options in accordance with GAAP, which requires the measurement of compensation expense under the stock option plan to be based on the fair value of the awards under the plan on the grant dates and amortizes the expense over the options’ vesting periods. Compensation expense is recorded over the service period using the straight-line method for service-based awards and in the service period corresponding to the performance target for performance-based awards. In addition, the Company accounts for its deferred compensation plans by recording the cost of deferred compensation arrangements over the service period of the related employees in a systematic and rational manner.
33
Table of Contents
Purchase accounting: Our mergers and acquisitions are accounted for using the purchase method. Accordingly, fair value adjustments to the Company’s assets and liabilities are recognized and the results of operations of the acquired business are included in our consolidated financial statements from the effective date of the merger or acquisition. We generally use third-party appraisals to assist us in determining the fair value adjustments.
Results of Operations
The following table sets forth, for the periods indicated, certain operating data of the Company, including presentation of the amounts as a percentage of net sales, (amounts in thousands):
| Fiscal Years Ended | ||||||||||||||||||
| 2009 | 2009 % of Sales |
2008 | 2008 % of Sales |
2007 | 2007 % of Sales |
|||||||||||||
| Net sales |
$ | 761,552 | 100 | % | $ | 713,711 | 100 | % | $ | 592,798 | 100 | % | ||||||
| Cost of sales |
332,206 | 44 | 327,780 | 46 | 283,766 | 48 | ||||||||||||
| Selling and administrative |
80,018 | 10 | 74,650 | 10 | 62,890 | 11 | ||||||||||||
| Amortization of intangibles |
13,928 | 2 | 12,002 | 2 | 12,304 | 2 | ||||||||||||
| Income from operations |
335,400 | 44 | 299,279 | 42 | 233,838 | 39 | ||||||||||||
| Interest expense, net |
84,398 | 11 | 92,677 | 13 | 91,767 | 15 | ||||||||||||
| Income tax provision |
88,100 | 12 | 73,476 | 10 | 53,426 | 9 | ||||||||||||
| Net income |
$ | 162,902 | 21 | % | $ | 133,126 | 19 | % | $ | 88,645 | 15 | % | ||||||
Fiscal year ended September 30, 2009 compared with fiscal year ended September 30, 2008
Net Sales. Net sales increased by $47.8 million, or 6.7%, to $761.5 million for fiscal year 2009 from $713.7 million for fiscal year 2008. Sales of $64.7 million resulted from the acquisitions of CEF and the Unison product line in fiscal 2008 as well as the recent acquisitions of Aircraft Parts Corporation, Acme and the Woodward HRT product line.
Sales declined excluding acquisitions by $16.9 million or 2.4% from the prior year. The organic sales decline was primarily due to: (i) a decrease of $30.4 million of commercial OEM sales resulting primarily from the impact of the significant decline in production rates in the business jet market resulting from the continued impact of global economic conditions negatively impacting the business jet market and a reduction in sales to The Boeing Company due to its employee strike, and (ii) a decrease of $20.1 million in commercial aftermarket sales due to the impact of the global economic downturn resulting in a decline in worldwide airline traffic and business jet activity. Partially offsetting the decline in organic commercial sales was an increase of $37.9 million in defense sales primarily due to increased demand for OEM and aftermarket spare parts and repairs across most of our product lines.
Cost of Sales. Cost of sales increased by $4.4 million, or 1.4%, to $332.2 million for fiscal year 2009 from $327.8 from fiscal year 2008. Cost of sales as a percentage of sales decreased to 43.6% for fiscal year 2009 from 45.9% for fiscal year 2008. The increase in cost of sales was primarily due to increased volume associated with the higher net sales of $47.8 million discussed above and higher acquisition-related costs of $3.4 million. The decrease in cost of sales as a percentage of sales was primarily due the strength of the Company’s proprietary products, productivity improvements from continued cost reduction efforts and favorable product mix partially offset by the dilutive impact from recent acquisitions and higher acquisition-related costs.
Selling and Administrative Expenses. Selling and administrative expenses increased by $5.4 million or 7.2%, to $80.0 million, 10.5% of net sales, for fiscal year 2009 from $74.6 million, or 10.5% of net sales, for fiscal year 2008. This increase was primarily due to the higher sales discussed above.
34
Table of Contents
Amortization of Intangibles. Amortization of intangibles increased by $1.9 million to $13.9 million for fiscal year 2009 from $12.0 million for fiscal year 2008 primarily due to the recent acquisitions discussed above.
Income from Operations. Operating income increased by $36.1 million, or 12.1%, to $335.4 million for fiscal year 2009 from $299.3 million for fiscal year 2008, primarily due to higher sales and other factors described above.
Interest Expense-Net. Interest expense decreased $8.3 million, or 8.9%, to $84.4 million for fiscal year 2009 from $92.7 million for fiscal year 2008 primarily due to lower interest rates partially offset by a reduction in interest income of $4.5 million. The Company’s weighted average level of outstanding borrowings was approximately $1.36 billion during both fiscal 2009 and 2008 year while the average interest rate decreased to approximately 6.0% during fiscal 2009 from 6.9% for the comparable period last year (see “Liquidity and Capital Resources” below).
Income Taxes. Income tax expense as a percentage of income before income taxes was approximately 35.1% for fiscal year 2009 compared to 35.6% for fiscal year 2008. The lower effective tax rate was primarily due to an increase in the research and development tax credit.
Net Income. Net income increased $29.8 million, or 22.4%, to $162.9 million for fiscal year 2009 compared to $133.1 million for fiscal year 2008, primarily as a result of the factors referred to above.
Fiscal year ended September 30, 2008 compared with fiscal year ended September 30, 2007
Net Sales. Net sales increased by $120.9 million, or 20.4%, to $713.7 million for fiscal year 2008 from $592.8 million for fiscal year 2007. Sales growth excluding acquisitions was $51.9 million and represented an 8.8% increase over the prior year. The organic sales growth was primarily due to: (i) an increase of $24.5 million of military sales primarily resulting from increased demand for aftermarket spare parts across most of our product lines; (ii) an increase of $16.5 million of commercial OEM sales primarily resulting from an increase in production rates from The Boeing Company and Airbus S.A.S. and related OEM suppliers; and (iii) an increase of $10.2 million of commercial aftermarket sales despite being negatively impacted by an increase in the replacement time period for certain cockpit security components, as well as, modest system wide inventory fluctuations. The remaining $69.0 million increase in net sales resulted from the acquisition of of CEF in fiscal 2008 and the businesses of ATI and Bruce in fiscal 2007.
Cost of Sales. Cost of sales increased by $44.0 million, or 15.5%, to $327.8 million for fiscal year 2008 from $283.8 from fiscal year 2007. Cost of sales as a percentage of sales decreased to 45.9% for fiscal year 2008 from 47.9% for fiscal year 2007. The increase in cost of sales was primarily due to increased volume associated with the higher net sales of $120.9 million discussed above, partially offset by a $6.1 million decrease, or 1% of net sales, in acquisition-related costs. The decrease in acquisition-related expenses was primarily due to inventory purchase accounting charges and integration costs recorded in the prior year of $8.4 million related to the acquisitions of ATI and CDA partially offset by current year inventory purchase accounting charges and integration costs of $2.3 million primarily related to the acquisitions of Bruce and CEF.
The decrease in cost of sales as a percentage of sales was primarily due a decrease from acquisition-related costs discussed above, the strength of the Company’s proprietary products and continued productivity efforts, partially offset by the impact from the acquisitions of ATI, Bruce and CEF.
Selling and Administrative Expenses. Selling and administrative expenses increased by $11.8 million or 18.7%, to $74.7 million for fiscal year 2008 from $62.9 million for fiscal year 2007. This increase was primarily due to the higher sales discussed above and an increase in research and development expenses of $3.5 million primarily relating to the Boeing 787 program, partially offset by the non-recurring charge of $1.7 million relating to the secondary offering recorded in the prior year.
35
Table of Contents
Amortization of Intangibles. Amortization of intangibles decreased by $0.3 million to $12.0 million for fiscal year 2008 from $12.3 million for fiscal year 2007.
Income from Operations. Operating income increased by $65.4 million, or 28.0%, to $299.2 million for fiscal year 2008 from $233.8 million for fiscal year 2007, primarily due to higher sales and other factors described above.
Interest Expense-Net. Interest expense increased $0.9 million, or 1.0%, to $92.7 million for fiscal year 2008 from $91.8 million for fiscal year 2007 due to an increase in our debt of approximately $430 million from the acquisition ATI in February 2007, partially offset by lower interest rates and higher interest income of $2.3 million. The Company’s weighted average level of outstanding borrowings was approximately $1.36 billion during fiscal 2008 compared to approximately $1.20 billion during the comparable period last year while the average interest rate decreased to approximately 6.9% during fiscal 2008 from 7.6% for the comparable period last year (see “Liquidity and Capital Resources” below).
Income Taxes. Income tax expense as a percentage of income before income taxes was approximately 35.6% for fiscal year 2008 compared to 37.6% for fiscal year 2007. The lower effective tax rate was primarily due to a reduction in state and local taxes, an increase in the domestic manufacturing deduction and the favorable resolution of a prior year IRS audit and state tax refund of $1.2 million partially offset by a lower research and development tax credit.
Net Income. Net income increased $44.5 million, or 50.2%, to $133.1 million for fiscal year 2008 compared to $88.6 million for fiscal year 2007, primarily as a result of the factors referred to above.
Backlog
As of September 30, 2009, the Company estimated its sales order backlog at $402 million compared to an estimated sales order backlog of $418 million as of September 30, 2008. This decrease in backlog of $16 million is mainly due to lower commercial OEM and aftermarket demand including the impact of order cancellations and pushouts as well as significant reductions in business jet production rates. These declines were partially offset by the impact of the acquisitions of Aircraft Parts Corporation, Acme and the Woodward HRT product line. The majority of the purchase orders outstanding as of September 30, 2009 are scheduled for delivery within the next twelve months. Purchase orders may be subject to cancellation by the customer prior to shipment. The level of unfilled purchase orders at any given date during the year will be materially affected by the timing of the Company’s receipt of purchase orders and the speed with which those orders are filled. Accordingly, the Company’s backlog as of September 30, 2009 may not necessarily represent the actual amount of shipments or sales for any future period.
Foreign Operations
Although we manufacture substantially all of our products in the United States, we manufacture some products in Malaysia through our wholly-owned Malaysian subsidiary. We sell our products in the United States, as well as in foreign countries. Substantially all of our foreign sales are transacted in U.S. dollars and, therefore, we have no material exposure to fluctuations in the rate of exchange between foreign currencies and the U.S. dollar as a result of foreign sales. In addition the amount of components or other raw materials or supplies that we purchase from foreign suppliers, including our Malaysian manufacturing subsidiary, are not material, with substantially all such transactions being made in U.S. dollars. Accordingly, we have no material exposure to currency fluctuations in the rate of exchange between foreign currencies and the U.S. dollar arising from these transactions.
Our direct sales to foreign customers were approximately $150.4 million, $144.3 million, and $143.0 million for fiscal years 2009, 2008, and 2007, respectively. Sales to foreign customers are subject to
36
Table of Contents
numerous additional risks, including the impact of foreign government regulations, political uncertainties and differences in business practices. There can be no assurance that foreign governments will not adopt regulations or take other action that would have a direct or indirect adverse impact on the business or market opportunities of the Company within such governments’ countries. Furthermore, there can be no assurance that the political, cultural and economic climate outside the United States will be favorable to our operations and growth strategy.
Inflation
Many of the Company’s raw materials and operating expenses are sensitive to the effects of inflation, which could result in changing operating costs. The effects of inflation on the Company’s businesses during the fiscal years 2009, 2008 and 2007 were not significant.
Liquidity and Capital Resources
Operating Activities. The Company generated $197.1 million of cash from operating activities during fiscal 2009 compared to $189.6 million generated during fiscal 2008. The increase of $7.5 million in fiscal 2009 is primarily due to an increase in net income of $29.8 million partially offset by the payout of the deferred compensation liability of $6.2 and the change in income taxes receivable (including the impact of the excess tax benefit from exercise of stock options) of $12.8 million.
The Company generated $189.6 million of cash from operating activities during fiscal 2008 compared to $112.4 million generated during fiscal 2008. The increase of $77.2 million in fiscal 2008 is primarily due to an increase in net income of $44.5 million and favorable changes in accounts receivable and inventory of approximately $31.0 million.
Investing Activities. Cash used in investing activities was $168.4 million during fiscal 2009 consisting of the acquisitions of the businesses of Aircraft Parts Corporation, Acme and Woodward HRT product lines for a total of $155.2 million and capital expenditures of $13.2 million.
Cash used in investing activities was $165.0 million during fiscal 2008 consisting of the acquisitions of the businesses of CEF and Unison for a total of $154.1 million and capital expenditures of $10.9 million.
Cash used in investing activities was $521.7 million during fiscal 2007 consisting of the acquisitions of the businesses of ATI, CDA, and Bruce for a total of $511.4 million and capital expenditures of $10.3 million.
Financing Activities. Cash provided by financing activities during fiscal 2009 was $2.4 million compared to cash provided by financing activities of $28.5 million in fiscal 2008. The cash provided by financing activities during fiscal 2009 related to the exercise of stock options of $17.6 million partially offset by the purchase of treasury stock for $15.2 million.
Cash provided by financing activities during fiscal 2008 of $28.5 million related to the exercise of stock options.
Cash provided by financing activities during fiscal 2007 of $454.0 million consisted of the proceeds received of $296.5 million, net of fees, from the issuance of additional 7 3/4% Senior Subordinated Notes and additional term loans of $125.4 million, net of fees, to finance the acquisition of ATI and $32.1 million related to the exercise of stock options.
Description of Current Senior Secured Credit Facility and Indenture
In June 2006 TransDigm refinanced its entire debt structure. In connection with the refinancing, TransDigm Inc. obtained a new senior secured credit facility. The senior secured credit facility consisted of a $650 million term loan facility, which was fully drawn at closing, and a $150 million revolving loan facility. In addition, under
37
Table of Contents
the terms of the senior secured credit facility, TransDigm Inc. had the right to request (but no lender was committed to provide) additional term loans of up to $250 million, subject to the satisfaction of customary conditions, including pro forma compliance with the financial covenant contained in the senior secured credit facility after giving effect to any such incremental term loan borrowings.
In connection with the acquisition of ATI in February 2007, TransDigm Inc. entered into an amendment of the senior secured credit facility, which provided for, among other things, (i) an additional term loan of $130 million, (ii) a $50 million increase in the revolving credit facility (bringing the total available revolver to $200 million), and (iii) a $50 million increase in the uncommitted incremental loan facility to $300 million. At September 30, 2009, $198.0 million of the revolving credit facility was available.
The term loan facility will mature in June 2013 and is not subject to interim scheduled amortization, but is subject to certain prepayment requirements. Under the amended terms of the senior secured credit facility, commencing 90 days after the end of fiscal 2008 and each fiscal year thereafter, TransDigm Inc. is required to prepay outstanding term loans in a principal amount equal to 50% of Excess Cash Flow (as defined in the senior secured credit facility); provided that the amount of the prepayment will be reduced to 25% of Excess Cash Flow if the Consolidated Leverage Ratio at the end of the applicable fiscal year is less than 5.00 to 1.00, but greater than 4.50 to 1.00. TransDigm Inc. will not be required to prepay any of the term loans if the Consolidated Leverage Ratio as of the end of the applicable fiscal year is equal to or less than 4.50 to 1.00 or if the term loans achieve certain minimum credit ratings at the end of such fiscal year. “Excess Cash Flow” is a negotiated definition generally designed to capture the cash that was generated by our business in excess of cash used in the business. “Consolidated Leverage Ratio” means the ratio of consolidated total indebtedness to the aggregate amount of EBITDA As Defined, calculated on a pro forma basis. TransDigm’s Consolidated Leverage Ratio was approximately 3.5 to 1.00 at September 30, 2009, thus the Company was not obligated to make a prepayment of the term loans based upon the Excess Cash Flow provision.
In addition, subject to exceptions (including reinvestment in productive assets), TransDigm Inc. is required to offer to prepay the term loans with the net proceeds of certain asset sales. The revolving loan facility will mature and the commitments thereunder will terminate in June 2012.
The senior secured credit facility is guaranteed by TD Group and all of TransDigm Inc.’s current and future domestic restricted subsidiaries, and is secured by a first priority security interest in substantially all of the existing and future property and assets of TransDigm Inc. and all of TransDigm Inc.’s existing and future domestic restricted subsidiaries, and a first priority pledge of the capital stock of TransDigm Inc. and TransDigm Inc.’s domestic subsidiaries.
The interest rates per annum applicable to loans, other than swingline loans, under the senior secured credit facility are, at the Company’s option, equal to either an alternate base rate or an adjusted LIBO rate for one, two, three or six-month (or to the extent available to each lender, nine or twelve month) interest periods chosen by TransDigm Inc., in each case, plus an applicable margin percentage. The alternate base rate is the greater of (1) Credit Suisse’s prime rate or (2) 50 basis points over the weighted average rates on overnight Federal funds as published by the Federal Reserve Bank of New York. The adjusted LIBO rate is determined by reference to settlement rates established for deposits in dollars in the London interbank market for a period equal to the interest period of the loan as adjusted for the maximum reserve percentages established by the Board of Governors of the United States Federal Reserve. The applicable margin percentage is a percentage per annum equal to (1) 1.00% for alternate base rate term loans, (2) 2.00% for adjusted LIBO rate term loans, (3) in the case of alternate base rate revolving loans and adjusted LIBO rate revolving loans, a percentage which varies based on the consolidated leverage ratio of TransDigm Inc. as of the relevant date of determination.
TransDigm Inc. entered into a three year interest rate swap in June 2006 with Credit Suisse for an initial notional amount of $187 million at a fixed rate of 7.63%. The notional amount decreased to $150 million on September 23, 2008, and the swap agreement expired on June 23, 2009. TransDigm Inc. entered into an additional three year interest rate swap in January 2008 with Credit Suisse for the notional amount of $300 million at a fixed rate of 5.0% through March 2011.
38
Table of Contents
In connection with the refinancing, TransDigm Inc. also issued $275 million aggregate principal amount of 7 3/4% Senior Subordinated Notes. As a result of the acquisition of ATI, TransDigm Inc. issued an additional $300 million aggregate principal amount of 7 3/4% Senior Subordinated Notes under the Indenture dated as of June 23, 2006.
Such notes do not require principal payments prior to their maturity in July 2014. The notes are fully and unconditionally guaranteed, jointly and severally and on an unsecured senior subordinated basis, by TD Group and all of our existing domestic subsidiaries.
Upon the closing of the ATI acquisition, the additional term loan of $130 million, together with the net proceeds from the $300 million from the additional 7 3/4% Senior Subordinated Notes and a portion of our cash balances, was drawn to fund the approximately $430 million purchase price of ATI.
New 7 3/4% Senior Subordinated Notes
In October 2009, TransDigm issued $425 million aggregate principal amount of New 7 3/4% Senior Subordinated Notes at an issue price of 97.125% of the principal amount thereof pursuant to the New Indenture dated October 6, 2009. The terms of the New 7 3/4 % Senior Subordinated Notes are substantially identical to the terms of the 7 3/4% Senior Subordinated Notes that were issued and sold by TransDigm in June 2006 and February 2007.
The proceeds from the issuance of the New 7 3/4% Senior Subordinated Notes, after the original issue discount, were used to make a cash distribution to TD Group, which paid a special cash dividend to its stockholders of approximately $375 million, made dividend equivalent payments to its holders of stock options of approximately $30 million and paid for transaction-related fees and expenses.
Certain Restrictive Covenants in Our Debt Documents
Both the senior secured credit facility and the Indentures contain restrictive covenants that, among other things, limit the incurrence of additional indebtedness, the payment of dividends, transactions with affiliates, asset sales, acquisitions, mergers and consolidations, liens and encumbrances, and prepayments of other indebtedness. In addition, the revolving loan facility under the senior secured credit facility requires TransDigm Inc. to comply with a first lien leverage ratio. A breach of any of the covenants or an inability to comply with the required leverage ratio could result in a default under the senior secured credit facility or the Indentures. If any such default occurs, the lenders under the senior secured credit facility and the holders of the 7 3/4% Senior Subordinated Notes or the New 7 3/4% Senior Subordinated Notes may elect to declare all outstanding borrowings, together with accrued interest and other amounts payable thereunder, to be immediately due and payable. The lenders under the senior secured credit facility also have the right in these circumstances to terminate any commitments they have to provide further borrowings In addition, following an event of default under the senior secured credit facility, the lenders thereunder will have the right to proceed against the collateral granted to them to secure the debt, which includes our available cash, and they will also have the right to prevent us from making debt service payments on the 7 3/4% Senior Subordinated Notes and the New 7 3/4% Senior Subordinated Notes.
Stock Repurchase Program
In October 2008 we announced a program permitting us to repurchase a portion of our outstanding shares not to exceed $50 million in the aggregate. During 2009, we repurchased under this program 494,100 shares of at an aggregate cost of approximately $15.2 million.
39
Table of Contents
Contractual Obligations
The following is a summary of contractual cash obligations as of September 30, 2009 (in millions):
| 2010 | 2011 | 2012 | 2013 | 2014 | 2015 and thereafter |
Total | |||||||||||||||
| Senior Secured Credit Facility(1) |
$ | — | $ | — | $ | — | $ | 780.0 | $ | — | $ | — | $ | 780.0 | |||||||
| 7 3/4% Senior Subordinated Notes due 2014 |
— | — | — | — | 575.0 | — | 575.0 | ||||||||||||||
| Scheduled Interest Payments(2) |
85.4 | 85.5 | 85.8 | 74.2 | 44.6 | — | 375.5 | ||||||||||||||
| Operating Leases |
3.7 | 3.3 | 2.9 | 2.0 | 1.7 | 0.5 | 14.1 | ||||||||||||||
| Purchase Obligations |
1.3 | — | — | — | — | — | 1.3 | ||||||||||||||
| Total Contractual Cash Obligations |
$ | 90.4 | $ | 88.8 | $ | 88.7 | $ | 856.2 | $ | 621.3 | $ | 0.5 | $ | 1,745.9 | |||||||
| (1) | The senior secured credit facility will mature on June 23, 2013 and will not be subject to interim scheduled amortization. |
| (2) | Assumes that the variable interest rate on our borrowings under our senior secured credit facility remains constant at 5.2%. |
In addition to the contractual obligations set forth above, the Company issued $425 of New 7 3/4% Senior Subordinated Notes due 2014. The annual scheduled interest payments under the New 7 3/4% Senior Subordinated Notes will be approximately $33 million. Also, the Company incurs capital expenditures for the purpose of maintaining and replacing existing equipment and facilities and, from time to time, for facility expansion. Capital expenditures totaled approximately $13.2 million, $10.9 million, and $10.3 million during fiscal 2009, 2008, and fiscal 2007, respectively. The Company expects its capital expenditures in fiscal 2010 to be between $15 million and $20 million and such expenditures are projected to increase moderately thereafter.
The Company intends to pursue acquisitions that present opportunities consistent with the Company’s business direction. The Company regularly engages in discussions with respect to potential acquisitions and investments. However, there can be no assurance that the Company will be able to consummate an agreement with respect to any future acquisition. The Company’s acquisition strategy may require substantial capital, and no assurance can be given that the Company will be able to raise any necessary funds on acceptable terms or at all. If the Company incurs additional debt to finance acquisitions, total interest expense will increase.
If the Company has excess cash, it may consider methods by which it can provide cash to its debt or equity holders through a dividend, prepayment of indebtedness, repurchase of stock, or other means. In October 2008, the Company announced that its Board of Directors had authorized the repurchase of up to $50 million, in the aggregate, of the Company’s common stock. During fiscal 2009, the Company repurchased a total of 494,100 shares at an aggregate cost of $15.2 million. Whether the Company undertakes additional stock repurchases or other aforementioned activities will depend on prevailing market conditions, the Company’s liquidity requirements, contractual restrictions and other factors. The amounts involved may be material. In addition, the Company may issue additional debt if prevailing market conditions are favorable to doing so.
The Company’s ability to make scheduled interest payments on, or to refinance, the Company’s indebtedness, or to fund non-acquisition related capital expenditures and research and development efforts, will depend on the Company’s ability to generate cash in the future. This is subject to general economic, financial, competitive, legislative, regulatory and other factors that are beyond its control. Based on its current levels of operations and anticipated cost savings and operating improvements and absent any disruptive events, management believes that internally generated funds and borrowings available under our revolving loan facility should provide sufficient resources to finance its operations, non-acquisition related capital expenditures, research and development efforts and long-term indebtedness obligations through at least fiscal 2010. There can be no assurance, however, that the Company’s business will generate sufficient cash flow from operations, that currently anticipated cost savings and operating improvements will be realized on schedule or at all or that future
40
Table of Contents
borrowings will be available to the Company under the senior secured credit facility in an amount sufficient to enable it to pay its indebtedness or to fund its other liquidity needs. The Company may need to refinance all or a portion of its indebtedness on or before maturity. Also, to the extent the Company accelerates its growth plans, consummates acquisitions or has lower than anticipated sales or increases in expenses, the Company may also need to raise additional capital. In particular, increased working capital needs occur whenever the Company consummates acquisitions or experiences strong incremental demand. There can be no assurance that the Company will be able to raise additional capital on commercially reasonable terms or at all.
New Accounting Standards
New Accounting Standards Adopted in Fiscal 2009
In June 2009, the Financial Accounting Standards Board (“FASB”) issued authoritative guidance codifying GAAP. While the guidance was not intended to change GAAP, it did change the way the Company references these accounting principles in the Notes to the Consolidated Financial Statements. This guidance was effective for interim and annual reporting periods ending after September 15, 2009. The Company’s adoption of this authoritative guidance as of September 30, 2009 changed how it references GAAP in its disclosures.
In May 2009, the FASB issued authoritative guidance establishing general standards of accounting and disclosures for events that occur after the balance sheet date, but before financial statements are issued. Application of this authoritative guidance was required for interim or annual financial periods ending after June 15, 2009. The Company’s adoption of this guidance during fiscal 2009 resulted in additional disclosures. See Note 21 to the Consolidated Financial Statements.
In September 2006, the FASB issued authoritative guidance that defines fair value, establishes a framework for measuring fair value in accordance with GAAP, and also expands disclosures about fair value measurements. Fair value is defined as the price that would be received for an asset or paid to transfer a liability (an exit price) in the principal or most advantageous market for the asset or liability in an orderly transaction between market participants on the measurement date. The adoption of this guidance for financial assets and liabilities effective October 1, 2008 did not have a material impact on the Company’s consolidated financial position, results of operations or cash flows. See Note 17 to the Consolidated Financial Statements.
In addition, at various dates the FASB has issued authoritative guidance requiring additional disclosures about the fair value of financial instruments and derivatives and hedging activities that were effective for the Company during fiscal 2009. The Company’s adoption of this guidance resulted in additional disclosures. See Notes 17 and 18 to the Consolidated Financial Statements.
New Accounting Standards Not Yet Adopted
In December 2007, the FASB issued authoritative guidance requiring assets and liabilities acquired in a business combination, contingent consideration, and certain acquired contingencies to be measured at their fair values as of the date of acquisition. This guidance also requires that acquisition-related costs and restructuring costs be recognized separately from the business combination. This authoritative guidance is effective for fiscal years beginning after December 15, 2008 and is therefore applicable to the Company effective October 1, 2009. The implementation of this guidance will affect the Company’s results of operations and financial position after its effective date only to the extent it completes applicable business combinations subsequent to the effective date and, therefore, the impact of this guidance cannot be determined prior to the completion of any applicable business combination transactions.
Additional Disclosure Required by Indenture
Separate financial statements of TransDigm Inc. are not presented since TD Group has no operations or significant assets separate from its investment in TransDigm Inc. and since the 7 3/4% Senior Subordinated Notes and the New 7 3/4% Senior Subordinated Notes are guaranteed by TD Group and all direct and indirect domestic
41
Table of Contents
restricted subsidiaries of TransDigm Inc. As of September 30, 2009, two subsidiaries of TransDigm that are not obligated to guarantee the 7 3/4% Senior Subordinated Notes and the New 7 3/4% Senior Subordinated Notes are wholly-owned, foreign subsidiaries that have inconsequential assets, liabilities and equity.
| ITEM 7A. | QUANTITATIVE AND QUALITATIVE DISCLOSURES ABOUT MARKET RISK |
Our main exposure to market risk relates to interest rates. Our financial instruments that are subject to interest rate risk principally include fixed-rate and floating-rate long-term debt. At September 30, 2009, we had borrowings under our senior secured credit facility of $780 million that were subject to interest rate risk. Borrowings under our senior secured credit facility bear interest, at our option, at a rate equal to either an alternate base rate or an adjusted LIBO rate for a one-, two-, three- or six-month (or to the extent available to each lender, nine- or twelve-month) interest period chosen by us, in each case, plus an applicable margin percentage. Accordingly, the Company’s cash flows and earnings will be exposed to the market risk of interest rate changes resulting from variable rate borrowings under our senior secured credit facility. The effect of a hypothetical one percentage point increase in interest rates would increase the annual interest costs under our senior secured credit facility by approximately $7.8 million based on the amount of outstanding borrowings at September 30, 2009. The weighted average interest rate on the $780 million of borrowings under our senior secured credit facility on September 30, 2009 was 2.3%.
At September 30, 2009, we had an agreement in place to swap variable interest rates on our senior secured credit facility for fixed interest rates through March 23, 2011 for the notional amount of $300 million. The fair value of the interest rate swap agreement is adjusted at each balance sheet date, with a corresponding adjustment to other comprehensive income. At September 30, 2009, the fair value of the interest rate swap agreement was a liability of $7.8 million.
The fair value of the $780 million aggregate principal amount of borrowings under the senior secured credit facility is exposed to the market risk of interest rates. The estimated fair value of such term loan approximated $749 million at September 30, 2009 based upon information provided to the Company from its agent under the credit facility. The fair value of the $575 million aggregate principal amount of our 7 3/4% Senior Subordinated Notes is exposed to the market risk of interest rate changes. The estimated fair value of such notes approximated $571 million at September 30, 2009 based upon quoted market rates.
| ITEM 8. | FINANCIAL STATEMENTS AND SUPPLEMENTARY DATA |
The information required by this Item is contained on pages F-1 through F-35 of this Report.
| ITEM 9. | CHANGES IN AND DISAGREEMENTS WITH ACCOUNTANTS ON ACCOUNTING AND FINANCIAL DISCLOSURE |
None.
| ITEM 9A. | CONTROLS AND PROCEDURES |
Controls and Procedures
As of September 30, 2009, TD Group carried out an evaluation, under the supervision and with the participation of TD Group’s management, including its Chief Executive Officer (Principal Executive Officer) and Chief Financial Officer (Principal Financial Officer), of the effectiveness of the design and operation of TD Group’s disclosure controls and procedures. Based upon that evaluation, the Chief Executive Officer and Chief Financial Officer concluded that TD Group’s disclosure controls and procedures are effective to ensure that information required to be disclosed by TD Group in the reports it files or submits under the Exchange Act is recorded, processed, summarized and reported, within the time periods specified by the Securities and Exchange
42
Table of Contents
Commission’s rules and forms, and that such information is accumulated and communicated to TD Group’s management, including its Chief Executive Officer and Chief Financial Officer, as appropriate, to allow timely decisions regarding required disclosure. In designing and evaluating the disclosure controls and procedures, TD Group’s management recognized that any controls and procedures, no matter how well designed and operated, can provide only reasonable assurance of achieving the desired control objectives, and management necessarily was required to apply its judgment in designing and evaluating the controls and procedures.
Management’s Report on Internal Control Over Financial Reporting
The management of TD Group is responsible for establishing and maintaining adequate internal control over financial reporting as defined in Exchange Act Rule 13a-15(f). Using criteria set forth by the Committee of Sponsoring Organizations of the Treadway Commission (COSO) in Internal Control-Integrated Framework, TransDigm’s management assessed the effectiveness of the Company’s internal control over financial reporting as of September 30, 2009. Based on our assessment, management concluded that the Company’s internal control over financial reporting was effective as of September 30, 2009.
The Company’s independent auditors, Ernst & Young LLP, have issued an audit report on the effectiveness of internal control over financial reporting of the Company as of September 30, 2009. This report is included herein.
Changes in Internal Control Over Financial Reporting
There have been no changes in TD Group’s internal control over financial reporting that occurred during the fourth quarter of the fiscal year ended September 30, 2009 that have materially affected, or are reasonably likely to materially affect, TD Group’s internal control over financial reporting.
43
Table of Contents
Report of Independent Registered Public Accounting Firm
The Board of Directors and Shareholders of
TransDigm Group Incorporated
We have audited TransDigm Group Incorporated’s internal control over financial reporting as of September 30, 2009, based on criteria established in Internal Control—Integrated Framework issued by the Committee of Sponsoring Organizations of the Treadway Commission (the COSO criteria). TransDigm Group Incorporated’s management is responsible for maintaining effective internal control over financial reporting, and for its assessment of the effectiveness of internal control over financial reporting included in the accompanying Management’s Report on Internal Control Over Financial Reporting. Our responsibility is to express an opinion on the company’s internal control over financial reporting based on our audit.
We conducted our audit in accordance with the standards of the Public Company Accounting Oversight Board (United States). Those standards require that we plan and perform the audit to obtain reasonable assurance about whether effective internal control over financial reporting was maintained in all material respects. Our audit included obtaining an understanding of internal control over financial reporting, assessing the risk that a material weakness exists, testing and evaluating the design and operating effectiveness of internal control based on the assessed risk, and performing such other procedures as we considered necessary in the circumstances. We believe that our audit provides a reasonable basis for our opinion.
A company’s internal control over financial reporting is a process designed to provide reasonable assurance regarding the reliability of financial reporting and the preparation of financial statements for external purposes in accordance with generally accepted accounting principles. A company’s internal control over financial reporting includes those policies and procedures that (1) pertain to the maintenance of records that, in reasonable detail, accurately and fairly reflect the transactions and dispositions of the assets of the company; (2) provide reasonable assurance that transactions are recorded as necessary to permit preparation of financial statements in accordance with generally accepted accounting principles, and that receipts and expenditures of the company are being made only in accordance with authorizations of management and directors of the company; and (3) provide reasonable assurance regarding prevention or timely detection of unauthorized acquisition, use, or disposition of the company’s assets that could have a material effect on the financial statements.
Because of its inherent limitations, internal control over financial reporting may not prevent or detect misstatements. Also, projections of any evaluation of effectiveness to future periods are subject to the risk that controls may become inadequate because of changes in conditions, or that the degree of compliance with the policies or procedures may deteriorate.
In our opinion, TransDigm Group Incorporated maintained, in all material respects, effective internal control over financial reporting as of September 30, 2009, based on the COSO criteria.
We also have audited, in accordance with the standards of the Public Company Accounting Oversight Board (United States), the consolidated balance sheets of TransDigm Group Incorporated and subsidiaries as of September 30, 2009 and 2008, and the related consolidated statements of income, shareholders’ equity, and cash flows for each of the three years in the period ended September 30, 2009 and our report dated November 24, 2009 expressed an unqualified opinion thereon.
/s/ Ernst & Young LLP
Cleveland, Ohio
November 24, 2009
44
Table of Contents
| ITEM 9B. | OTHER INFORMATION |
None.
| ITEM 10. | DIRECTORS, EXECUTIVE OFFICERS, AND CORPORATE GOVERNANCE |
Directors and Executive Officers
Information regarding TD Group’s directors is set forth under the caption “Proposal One: Election of Directors” in our Proxy Statement, which is incorporated herein by reference. The following table sets forth certain information concerning TD Group’s executive officers:
| Name |
Age | Position | ||
| W. Nicholas Howley |
57 | Chief Executive Officer and Chairman of the Board of Directors | ||
| Robert S. Henderson |
53 | Executive Vice President of TD Group | ||
| Bernt G. Iversen II |
52 | President, Champion Aerospace LLC, a wholly-owned subsidiary of TransDigm Inc. | ||
| Raymond F. Laubenthal |
48 | President and Chief Operating Officer of TD Group and TransDigm Inc. | ||
| James Riley |
43 | Executive Vice President of TD Group | ||
| John F. Leary |
62 | President, Adams Rite Aerospace, Inc., a wholly-owned subsidiary of TransDigm Inc. | ||
| Roger V. Jones |
50 | President, AeroControlex Group, Inc., a wholly-owned subsidiary of TransDigm Inc. | ||
| Albert J. Rodriguez |
49 | Executive Vice President-Mergers and Acquisitions | ||
| Gregory Rufus |
53 | Executive Vice President, Chief Financial Officer and Secretary |
TD Group historically had no employees and the officers of TD Group were the Chief Executive Officer, Chief Financial Officer and Secretary of TransDigm Inc. In December 2005, in contemplation of the initial public offering, certain officers of TD Group’s subsidiaries were appointed as officers of TD Group, as set forth below.
Mr. Howley was named Chairman of the Board of Directors of TD Group in July 2003. He has served as Chief Executive Officer of TD Group since December 2005 and of TransDigm Inc. since December 2001. Mr. Howley was President of TD Group from July 2003 until December 2005. Mr. Howley served as Chief Operating Officer of TransDigm Inc. from December 1998 through December 2001 and served as President of TransDigm Inc. from December 1998 through September 2005. Mr. Howley is a director of Satair A/S, a Danish public company that is an aerospace distributor, including a distributor of the Company’s products, and Polypore International Inc., a NYSE-listed manufacturer of polymer-based membranes used in separation and filtration processes.
Mr. Henderson was appointed Executive Vice President of TD Group in December 2005 and Executive Vice President of TransDigm Inc. in October 2005. He was President of the AdelWiggins Group, an operating division of TransDigm Inc., from August 1999 to April 2008.
Mr. Iversen was appointed President of Champion Aerospace LLC, a wholly-owned subsidiary of TransDigm Inc., in June 2006. From July 2001 to June 2006, he served as Director of Engineering and Marketing for Champion Aerospace.
Mr. Laubenthal was appointed President and Chief Operating Officer of TD Group in December 2005, President and Chief Operating Officer of TransDigm Inc. in October 2005 and was President of AeroControlex Group, then operated as a division of TransDigm Inc., from November 1998 through September 2005.
45
Table of Contents
Mr. Riley was appointed Executive Vice President of TD Group in October 2009. From October 2005 through September 2009, Mr. Riley was President of AeroControlex Group Inc., a subsidiary of TransDigm Inc. From October 2003 through September 2005, he served as Director of Mergers & Acquisitions for TransDigm Inc. From February 1994 through September 2003, Mr. Riley served AeroControlex Group in various manufacturing, sales and management positions.
Mr. Leary has been President of Adams Rite Aerospace, Inc., a wholly-owned subsidiary of TransDigm Inc., since June 1999.
Mr. Jones was appointed President of AeroControlex Group Inc., a subsidiary of TransDigm Inc., in October 2009. Since September 1994, Mr. Jones has served in a variety of positions at AeroControlex including Project Engineer, Engineering Group Leader, Chief Engineer, Director of Engineering, Director of Quality, and Director of Sales and Marketing.
Mr. Rodriguez was appointed Executive Vice President—Mergers and Acquisitions in June 2006. Mr. Rodriguez served as Executive Vice President of TD Group from December 2005 to June 2006, Executive Vice President of TransDigm Inc. from October 2005 to June 2006 and was the President of MarathonNorco Aerospace, Inc., a wholly-owned subsidiary of TransDigm Inc., from September 1999 through May 2006.
Mr. Rufus was named Executive Vice President, Chief Financial Officer and Secretary of TD Group in December 2005. He served as Vice President and Chief Financial Officer of TD Group from July 2003 until December 2005. Mr. Rufus was appointed Executive Vice President and Chief Financial Officer of TransDigm Inc. on October 1, 2005 and had been Vice President and Chief Financial Officer of TransDigm Inc. since August 2000.
Section 16(a) Beneficial Ownership Reporting Compliance
The information regarding compliance with Section 16 of the Securities Exchange Act of 1934 is set forth under the caption entitled “Section 16(a) Beneficial Ownership Reporting Compliance” in our Proxy Statement, which is incorporated herein by reference.
Code of Ethics
We have adopted a Code of Business Conduct and Ethics, which applies to all of our directors, officers, and employees and a Code of Ethics for Senior Financial Officers which includes additional ethical obligations for our senior financial management (which includes our chief executive officer, chief financial officer, president, division presidents, controllers, treasurer, and chief internal auditor). Please refer to the information set forth under the caption “Corporate Governance—Codes of Ethics” in our Proxy Statement, which is incorporated herein by reference. Our Code of Business Conduct and Ethics and our Code of Ethics for Senior Financial Officers is available on our website at www.transdigm.com. Any person may receive a copy without charge by writing to us at TransDigm Group Incorporated, 1301 East 9th Street, Suite 3710, Cleveland, Ohio 44114. We intend to disclose on our website any amendment to, or waiver from, a provision of our Code of Business Conduct and Ethics that applies to directors and executive officers and that is required to be disclosed pursuant to the rules of the Securities and Exchange Commission.
Nominations of Directors
The procedure by which stockholders may recommend nominees to our Board of Directors is set forth under the caption “Board of Directors—Nominating and Corporate Governance Committee” in our Proxy Statement, which is incorporated herein by reference.
46
Table of Contents
Audit Committee
The information regarding the audit committee of our Board of Directors and audit committee financial experts is set forth under the caption “Board of Directors—Audit Committee” in our Proxy Statement, which is incorporated herein by reference.
| ITEM 11. | EXECUTIVE COMPENSATION |
The information required by this item is set forth under the captions “Executive Compensation” and “Compensation of Directors” in our Proxy Statement, which is incorporated herein by reference.
| ITEM 12. | SECURITY OWNERSHIP OF BENEFICIAL OWNERS AND MANAGEMENT AND RELATED STOCKHOLDER MATTERS |
The information regarding security ownership of certain beneficial owners and management is set forth under the caption “Security Ownership of Beneficial Owners and Management” in our Proxy Statement, which is incorporated herein by reference.
Equity Compensation Plan Information
| Plan category |
Number of Securities to Be Issued upon Exercise of Outstanding Options, Warrants and Rights (a) |
Weighted-Average Exercise Price of Outstanding Options, Warrants and Rights (b) |
Number of Securities Remaining Available for Future Issuance Under Equity Compensation Plans (excluding securities reflected in column (a)) (c) | |||||
| Equity compensation plans approved by security holders(1) |
6,260,781 | (2) | $ | 18.29 | 1,354,128 | |||
| Equity compensation plans not approved by security holders(3) |
108,096 | $ | 6.68 | N/A | ||||
| Total |
6,368,877 | 1,354,128 | ||||||
| (1) | Includes information related to the 2003 stock option plan and the 2006 stock incentive plan, each as described below. |
| (2) | Does not include 1,050 shares of restricted stock, which are subject to forfeiture, as these shares have been reflected in the Company’s total shares outstanding. |
| (3) | Options issued outside of the 2003 stock option plan and the 2006 stock incentive plan. |
2003 Stock Option Plan
In connection with the acquisition of the Company by Warburg Pincus in 2003, TD Group adopted a stock option plan for the benefit of our employees. The stock option plan has been amended and restated on several occasions, most recently effective as of July 18, 2008 and we refer to such stock option plan as it is currently in effect as the 2003 stock option plan.
Upon the closing of the acquisition of the Company by Warburg Pincus, certain employees rolled over certain then-existing options to purchase shares of common stock of TransDigm Holding Company with an aggregate intrinsic value of approximately $35.7 million into a combination of options to purchase shares of common stock of TD Group, or rollover options, and interests in the two deferred compensation plans which have since been terminated. These employees were granted rollover options to purchase an aggregate of 3,870,152 shares of TD Group common stock, which gives effect to the 149.60 for 1.00 stock split that we effected on March 14, 2006 in connection with our initial public offering. All rollover options granted in
47
Table of Contents
connection with the closing of the acquisition were fully vested on the date of grant. As of September 30, 2009, there were rollover options to purchase 174,795 shares of TD Group common stock issued and outstanding (after giving effect to the stock split).
In addition to the shares of TD Group common stock reserved for issuance upon exercise of rollover options, under the terms of the 2003 stock option plan, an aggregate of 5,469,301 shares of TD Group common stock are reserved for issuance upon exercise of new management options (after giving effect to the stock split). As of September 30, 2009, there were new management options to purchase 3,262,586 shares of TD Group common stock issued and outstanding (after giving effect to the stock split). As of September 30, 2009, there were 76,857 shares available for issuance under options not yet granted.
2006 Stock Incentive Plan
Prior to the consummation of the initial public offering, TD Group adopted a new stock incentive plan, which was amended on October 20, 2006 and effective July 29, 2008, designed to assist us in attracting, retaining, motivating and rewarding key employees, directors or consultants, and promoting the creation of long-term value for stockholders of TD Group by closely aligning the interests of these individuals with those of our stockholders. The 2006 stock incentive plan permits TD Group to award our key employees, directors or consultants stock options, restricted stock and other stock-based incentives. The total number of shares of TD Group common stock available for issuance or delivery under the 2006 stock incentive plan is 1,277,271, subject to adjustment in the event of any stock dividend or split, reorganization, recapitalization, merger, share exchange or any other similar corporate transaction or event. As of September 30, 2009, there were 4,067 restricted shares issued and outstanding under the 2006 stock incentive plan. As of September 30, 2009, options to purchase 2,823,400 shares had been issued thereunder.
In connection with the acquisition of the Company by Warburg Pincus, the Company issued 132,096 options to Michael Graff, a director of the Company. Because Mr. Graff was not an employee of the Company and because participation in the 2003 Stock Option Plan was limited to employees, the options were issued outside of the 2003 Stock Option Plan. All of the options awarded to Mr. Graff are vested. As of September 30, 2009, 108,096 options remained outstanding and exercisable.
| ITEM 13. | CERTAIN RELATIONSHIPS AND RELATED TRANSACTIONS |
The information required by this item is set forth under the captions entitled “Certain Relationships and Related Transactions,” “Compensation of Directors,” and “Independence of Directors” in our Proxy Statement, which is incorporated herein by reference.
| ITEM 14. | PRINCIPAL ACCOUNTING FEES AND SERVICES |
The information required by this item is set forth under the caption “Principal Accounting Fees and Services” in our Proxy Statement, which is incorporated herein by reference.
48
Table of Contents
| ITEM 15. | EXHIBITS AND FINANCIAL STATEMENT SCHEDULES. |
(a) Documents Filed with Report
| Page | ||
| F-1 | ||
| Consolidated Balance Sheets as of September 30, 2009 and 2008 |
F-2 | |
| Consolidated Statements of Income for Fiscal Years Ended September 30, 2009, 2008 and 2007. |
F-3 | |
| F-4 | ||
| Consolidated Statements of Cash Flows for Fiscal Years Ended September 30, 2009, 2008 and 2007. |
F-5 | |
| pages F-6 to F-34 | ||
| (a) (2) Financial Statement Schedules |
||
| Valuation and Qualifying Accounts for the Fiscal Years Ended September 30, 2009, 2008 and 2007. |
F-35 | |
(a) (3) Exhibits
| Exhibit No. |
Description |
Filed Herewith or Incorporated by Reference From | ||
| 2.1 | Agreement and Plan of Merger, dated January 9, 2007, among TransDigm Inc., Project Coffee Acquisition Co. and Aviation Technologies, Inc. | Incorporated by reference to TransDigm Group Incorporated’s Form 8-K filed January 10, 2007 (File No. 001-32833) | ||
| 3.1 | Amended and Restated Certificate of Incorporation, filed March 14, 2006, of TransDigm Group Incorporated | Incorporated by reference to Amendment No. 3 to TransDigm Group Incorporated’s Form S-1 filed March 13, 2006 (File No. 333-130483) | ||
| 3.2 | Amended and Restated Bylaws of TransDigm Group Incorporated | Incorporated by reference to Amendment No. 3 to TransDigm Group Incorporated’s Form S-1 filed March 13, 2006 (File No. 333-130483) | ||
| 3.3 | Certificate of Incorporation, filed July 2, 1993, of NovaDigm Acquisition, Inc. (now known as TransDigm Inc.) | Incorporated by reference to TransDigm Inc. and TransDigm Holding Company’s Form S-4 filed January 29, 1999 (File No. 333-71397) | ||
| 3.4 | Certificate of Amendment, filed July 22, 1993, of the Certificate of Incorporation of NovaDigm Acquisition, Inc. (now known as TransDigm Inc.) | Incorporated by reference to TransDigm Inc. and TransDigm Holding Company’s Form S-4 filed January 29, 1999 (File No. 333-71397) | ||
| 3.5 | Bylaws of NovaDigm Acquisition, Inc. (now known as TransDigm Inc.) | Incorporated by reference to TransDigm Inc. and TransDigm Holding Company’s Form S-4 filed January 29, 1999 (File No. 333-71397) | ||
| 3.6 | Certificate of Incorporation, filed March 28, 1994, of MPT Acquisition Corp. (now known as MarathonNorco Aerospace, Inc.) | Incorporated by reference to TransDigm Inc. and TransDigm Holding Company’s Form S-4 filed January 29, 1999 (File No. 333-71397) | ||
49
Table of Contents
| Exhibit No. |
Description |
Filed Herewith or Incorporated by Reference From | ||
| 3.7 | Certificate of Amendment, filed May 18, 1994, of the Certificate of Incorporation of MPT Acquisition Corp. (now known as MarathonNorco Aerospace, Inc.) | Incorporated by reference to TransDigm Inc. and TransDigm Holding Company’s Form S-4 filed January 29, 1999 (File No. 333-71397) | ||
| 3.8 | Certificate of Amendment, filed May 24, 1994, of the Certificate of Incorporation of MPT Acquisition Corp. (now known as MarathonNorco Aerospace, Inc.) | Incorporated by reference to TransDigm Inc. and TransDigm Holding Company’s Form S-4 filed January 29, 1999 (File No. 333-71397) | ||
| 3.9 | Certificate of Amendment, filed August 28, 2003, of the Certificate of Incorporation of Marathon Power Technology Company (now known as MarathonNorco Aerospace, Inc.) | Incorporated by reference to TransDigm Group Incorporated’s Form 10-K filed November 28, 2006 (File No. 001-32833) | ||
| 3.10 | Bylaws of MPT Acquisition Corp. (now known as MarathonNorco Aerospace, Inc.) | Incorporated by reference to TransDigm Inc. and TransDigm Holding Company’s Form S-4 filed January 29, 1999 (File No. 333-71397) | ||
| 3.11 | Articles of Incorporation, filed July 30, 1986, of ARP Acquisition Corporation (now known as Adams Rite Aerospace, Inc.) | Incorporated by reference to TransDigm Inc. and TransDigm Holding Company’s Form S-4 filed January 29, 1999 (File No. 333-71397) | ||
| 3.12 | Certificate of Amendment, filed September 12, 1986, of the Articles of Incorporation of ARP Acquisition Corporation (now known as Adams Rite Aerospace, Inc.) | Incorporated by reference to TransDigm Inc. and TransDigm Holding Company’s Form S-4 filed January 29, 1999 (File No. 333-71397) | ||
| 3.13 | Certificate of Amendment, filed January 27, 1992, of the Articles of Incorporation of Adams Rite Products, Inc. (now known as Adams Rite Aerospace, Inc.) | Incorporated by reference to TransDigm Inc. and TransDigm Holding Company’s Form S-4 filed January 29, 1999 (File No. 333-71397) | ||
| 3.14 | Certificate of Amendment, filed December 31, 1992, of the Articles of Incorporation of Adams Rite Products, Inc. (now known as Adams Rite Aerospace, Inc.) | Incorporated by reference to TransDigm Inc. and TransDigm Holding Company’s Form S-4 filed January 29, 1999 (File No. 333-71397) | ||
| 3.15 | Certificate of Amendment, filed August 11, 1997, of the Articles of Incorporation of Adams Rite Sabre International, Inc. (now known as Adams Rite Aerospace, Inc.) | Incorporated by reference to TransDigm Inc. and TransDigm Holding Company’s Form S-4 filed January 29, 1999 (File No. 333-71397) | ||
| 3.16 | Amended and Restated Bylaws of Adams Rite Aerospace, Inc. | Incorporated by reference to TransDigm Inc. and TransDigm Holding Company’s Form S-4 filed January 29, 1999 (File No. 333-71397) | ||
| 3.17 | Certificate of Formation, effective June 30, 2007, of Champion Aerospace LLC | Incorporated by reference to TransDigm Inc. and TransDigm Group Incorporated’s Form S-4 filed July 6, 2007 (File No. 333-144366) | ||
| 3.18 | Limited Liability Company Agreement of Champion Aerospace LLC | Incorporated by reference to TransDigm Inc. and TransDigm Group Incorporated’s Form S-4 filed July 6, 2007 (File No. 333-144366) | ||
| 3.19 | Certificate of Formation, effective June 29, 2007, of Avionic Instruments LLC | Incorporated by reference to TransDigm Group Incorporated’s Form 10-K filed November 21, 2007 (File No. 001-32833) | ||
50
Table of Contents
| Exhibit No. |
Description |
Filed Herewith or Incorporated by Reference From | ||
| 3.20 | Limited Liability Company Agreement of Avionic Instruments LLC | Incorporated by reference to TransDigm Inc. and TransDigm Group Incorporated’s Form S-4 filed July 6, 2007 (File No.333-144366) | ||
| 3.21 | Certificate of Incorporation, filed December 22, 2004, of Skurka Aerospace Inc. | Incorporated by reference to TransDigm Inc. and TransDigm Group Incorporated’s Form S-4 filed October 11, 2006 (File No. 333-137937) | ||
| 3.22 | Bylaws of Skurka Aerospace Inc. | Incorporated by reference to TransDigm Inc. and TransDigm Group Incorporated’s Form S-4 filed October 11, 2006 (File No. 333-137937) | ||
| 3.23 | Certificate of Conversion, effective June 30, 2007, converting CDA InterCorp into CDA InterCorp LLC. | Incorporated by reference to TransDigm Inc. and TransDigm Group Incorporated’s Form S-4 filed July 6, 2007 (File No. 333-144366) | ||
| 3.24 | Operating Agreement of CDA InterCorp LLC. | Incorporated by reference to TransDigm Inc. and TransDigm Group Incorporated’s Form S-4 filed July 6, 2007 (File No. 333-144366) | ||
| 3.25 | Certificate of Incorporation, filed March 7, 2003, of Wings Holdings, Inc. (now known as Aviation Technologies, Inc.) | Incorporated by reference to TransDigm Inc. and TransDigm Group Incorporated’s Form S-4 filed July 6, 2007 (File No. 333-144366) | ||
| 3.26 | Certificate of Amendment of Certificate of Incorporation, filed May 12, 2003, of Wings Holdings, Inc. (now known as Aviation Technologies, Inc.) | Incorporated by reference to TransDigm Inc. and TransDigm Group Incorporated’s Form S-4 filed July 6, 2007 (File No. 333-144366) | ||
| 3.27 | Certificate of Amendment of Certificate of Incorporation, filed July 17, 2003, of Wings Holdings, Inc. (now known as Aviation Technologies, Inc.) | Incorporated by reference to TransDigm Inc. and TransDigm Group Incorporated’s Form S-4 filed July 6, 2007 (File No. 333-144366) | ||
| 3.28 | Bylaws of Wings Holdings, Inc. (now known as Aviation Technologies, Inc.) | Incorporated by reference to TransDigm Inc. and TransDigm Group Incorporated’s Form S-4 filed July 6, 2007 (File No. 333-144366) | ||
| 3.29 | Articles of Incorporation, filed October 3, 1963, of Avtech Corporation | Incorporated by reference to TransDigm Inc. and TransDigm Group Incorporated’s Form S-4 filed July 6, 2007 (File No. 333-144366) | ||
| 3.30 | Articles of Amendment of Articles of Incorporation, filed March 30, 1984, of Avtech Corporation | Incorporated by reference to TransDigm Inc. and TransDigm Group Incorporated’s Form S-4 filed July 6, 2007 (File No. 333-144366) | ||
| 3.31 | Articles of Amendment of Articles of Incorporation, filed April 17, 1989, of Avtech Corporation | Incorporated by reference to TransDigm Inc. and TransDigm Group Incorporated’s Form S-4 filed July 6, 2007 (File No. 333-144366) | ||
| 3.32 | Articles of Amendment of Articles of Incorporation, filed July 17, 1998, of Avtech Corporation | Incorporated by reference to TransDigm Inc. and TransDigm Group Incorporated’s Form S-4 filed July 6, 2007 (File No. 333-144366) | ||
| 3.33 | Articles of Amendment of Articles of Incorporation, filed May 20, 2003, of Avtech Corporation | Incorporated by reference to TransDigm Inc. and TransDigm Group Incorporated’s Form S-4, filed July 6, 2007 (File No. 333-144366) | ||
51
Table of Contents
| Exhibit No. |
Description |
Filed Herewith or Incorporated by Reference From | ||
| 3.34 | Bylaws of Avtech Corporation | Incorporated by reference to TransDigm Inc. and TransDigm Group Incorporated’s Form S-4 filed July 6, 2007 (File No. 333-144366) | ||
| 3.35 | Certificate of Formation, effective June 30, 2007, of Transicoil LLC | Incorporated by reference to TransDigm Inc. and TransDigm Group Incorporated’s Form S-4 filed July 6, 2007 (File No. 333-144366) | ||
| 3.36 | Limited Liability Company Agreement of Transicoil LLC | Incorporated by reference to TransDigm Inc. and TransDigm Group Incorporated’s Form S-4 filed July 6, 2007 (File No. 333-144366) | ||
| 3.37 | Certificate of Incorporation, filed May 17, 2006, of Bruce Industries Acquisition Corp. (now known as Malaysian Aerospace Services, Inc.) | Incorporated by reference to TransDigm Inc. and TransDigm Group Incorporated’s Form S-4 filed July 6, 2007 (File No. 333-144366) | ||
| 3.38 | Certificate of Amendment of Certificate of Incorporation, filed January 19, 2007, of Bruce Industries Acquisition Corp. (now known as Malaysian Aerospace Services, Inc.) | Incorporated by reference to TransDigm Inc. and TransDigm Group Incorporated’s Form S-4 filed July 6, 2007 (File No. 333-144366) | ||
| 3.39 | Bylaws of Bruce Industries Acquisition Corp. (now known as Malaysian Aerospace Services, Inc.) | Incorporated by reference to TransDigm Inc. and TransDigm Group Incorporated’s Form S-4 filed July 6, 2007 (File No. 333-144366) | ||
| 3.40 | Certificate of Incorporation, filed June 18, 2007, of AeroControlex Group, Inc. | Incorporated by reference to TransDigm Inc. and TransDigm Group Incorporated’s Form S-4 filed July 6, 2007 (File No. 333-144366) | ||
| 3.41 | Bylaws of AeroControlex Group, Inc. | Incorporated by reference to TransDigm Inc. and TransDigm Group Incorporated’s Form S-4 filed July 6, 2007 (File No. 333-144366) | ||
| 3.42 | Certificate of Incorporation filed August 6, 2007, of Bruce Aerospace, Inc. | Incorporated by reference to TransDigm Group Incorporated’s Form 10-K filed November 21, 2007 (File No. 001-32833) | ||
| 3.43 | Bylaws of Bruce Aerospace, Inc. | Incorporated by reference to TransDigm Group Incorporated’s Form 10-K filed November 21, 2007 (File No. 001-32833) | ||
| 3.44 | Articles of Incorporation, filed February 6, 2006 of Bruce Industries, Inc. | Incorporated by reference to TransDigm Group Incorporated’s Form 10-K filed November 21, 2007 (File No. 001-32833) | ||
| 3.45 | Bylaws of Bruce Industries, Inc. | Incorporated by reference to TransDigm Group Incorporated’s Form 10-K filed November 21, 2007 (File No. 001-32833) | ||
| 3.46 | Certificate of Formation, filed September 30, 2009, of CEF Industries, LLC | Filed herewith | ||
| 3.47 | Limited Liability Company Agreement of CEF Industries, LLC | Filed herewith | ||
| 3.48 | Certificate of Incorporation, filed September 20, 1960, of Aircraft Parts Corporation | Incorporated by reference to TransDigm Group Incorporated’s Form 10-Q filed February 4, 2009 (File No. 001-32833) | ||
52
Table of Contents
| Exhibit No. |
Description |
Filed Herewith or Incorporated by Reference From | ||
| 3.49 | Bylaws of Aircraft Parts Corporation | Incorporated by reference to TransDigm Group Incorporated’s Form 10-Q filed February 4, 2009 (File No. 001-32833) | ||
| 3.50 | Certificate of Incorporation, filed July 10, 2009, of Acme Aerospace Inc. | Incorporated by reference to TransDigm Group Incorporated’s Form 10-Q filed August 25, 2009 (File No. 001-32833) | ||
| 3.51 | Bylaws of Acme Aerospace Inc. | Incorporated by reference to TransDigm Group Incorporated’s Form 10-Q filed August 25, 2009 (File No. 001-32833) | ||
| 4.1 | Form of Stock Certificate | Incorporated by reference to Amendment No. 3 to TransDigm Group Incorporated’s Form S-1 filed March 13, 2006 (File No. 333-130483) | ||
| 4.2 | Indenture, dated June 23, 2006, among TransDigm Inc., TransDigm Group Incorporated, the Guarantors named therein and The Bank of New York Trust Company, N.A., as trustee | Incorporated by reference to TransDigm Group Incorporated’s Form 8-K filed June 28, 2006 (File No. 001-32833) | ||
| 4.3 | First Supplemental Indenture, dated November 2, 2006, to Indenture, dated June 23, 2006, among TransDigm Inc., TransDigm Group Incorporated, the Guarantors named therein and The Bank of New York Trust Company, N.A., as trustee | Incorporated by reference to TransDigm Group Incorporated’s Form 8-K filed November 6, 2006 (File No. 001-32833) | ||
| 4.4 | Second Supplemental Indenture, dated February 7, 2007, to Indenture, dated June 23, 2006, among TransDigm Inc., TransDigm Group Incorporated, the Guarantors named therein and The Bank of New York Trust Company, N.A., as trustee | Incorporated by reference to TransDigm Group Incorporated’s Form 8-K filed February 13, 2007 (File No. 333-130483) | ||
| 4.5 | Third Supplemental Indenture, dated June 29, 2007, to Indenture, dated June 23, 2006, among TransDigm Inc., TransDigm Group Incorporated, the Guarantors named therein and The Bank of New York Trust Company, N.A., as trustee | Incorporated by reference to TransDigm Group Incorporated’s Form 8-K filed July 6, 2007 (File No. 001-32833) | ||
| 4.6 | Fourth Supplemental Indenture, dated August 10, 2007, to Indenture, dated June 23, 2006, among TransDigm, Inc., TransDigm Group Incorporated, the Guarantors named therein and The Bank of New York Trust Company, N.A., as trustee | Incorporated by reference to TransDigm Inc. and TransDigm Group Incorporated’s Form 8-K filed August 16, 2007 (File No.001-32833) | ||
| 4.7 | Fifth Supplemental Indenture, dated May 7, 2008, to Indenture, dated June 23, 2006, among TransDigm Inc., TransDigm Group Incorporated, the Guarantors named therein and The Bank of New York Trust Company, N.A., as trustee | Incorporated by reference to TransDigm Group Incorporated’s Form 8-K filed May 9, 2008 (File No. 001-32833) | ||
53
Table of Contents
| Exhibit No. |
Description |
Filed Herewith or Incorporated by Reference From | ||
| 4.8 | Sixth Supplemental Indenture, dated December 16, 2008, to Indenture, dated June 23, 2006, among TransDigm Inc., TransDigm Group Incorporated, the Guarantors named therein and The Bank of New York Trust Company, N.A., as trustee | Incorporated by reference to TransDigm Group Incorporated’s Form 8-K filed December 18, 2008 (File No. 001-32833) | ||
| 4.9 | Seventh Supplemental Indenture, dated July 27, 2009, to Indenture dated June 23, 2006, among TransDigm Inc., TransDigm Group Incorporated, the Guarantors named therein and The Bank of New York Trust Company, N.A., as trustee | Incorporated by reference to TransDigm Group Incorporated’s Form 8-K filed July 29, 2009 (File No. 001-32833) | ||
| 4.10 | Indenture, dated as of October 6, 2009, among TransDigm Inc., TransDigm Group Incorporated, the Guarantors named therein and The Bank of New York Trust Company, N.A., as trustee | Incorporated by reference to TransDigm Group Incorporated’s Form 8-K filed October 6, 2009 (File No. 001-32833) | ||
| 4.11 | Registration Rights Agreement, dated October 6, 2009, among TransDigm Inc., TransDigm Group Incorporated, the subsidiaries of TransDigm Inc. named therein and Credit Suisse Securities (USA) LLC, as representative for the several initial purchasers | Incorporated by reference to TransDigm Inc. and TransDigm Group Incorporated’s Form 8-K filed October 6, 2009 (File No. 001-32833) | ||
| 4.12 | Form 7 3/4% Senior Subordinated Notes due 2014 | Included in Exhibit 4.2 | ||
| 10.1 | Amended and Restated Employment Agreement, dated June 3, 2008, between W. Nicholas Howley and TransDigm Group Incorporated* | Incorporated by reference to TransDigm Group Incorporated’s Form 8-K filed June 6, 2008 (File No. 001-32833) | ||
| 10.2 | Amended and Restated Employment Agreement, dated October 29, 2008, between Raymond Laubenthal and TransDigm Group Incorporated * | Incorporated by reference to TransDigm Group Incorporated’s Form 8-K filed October 30, 2008 (File No. 333-130483) | ||
| 10.3 | Amended and Restated Employment Agreement, dated October 29, 2008, between Gregory Rufus and TransDigm Group Incorporated * | Incorporated by reference to TransDigm Group Incorporated’s Form 8-K filed October 30, 2008 (File No. 333-130483) | ||
| 10.4 | TransDigm Group Incorporated Fourth Amended and Restated 2003 Stock Option Plan * | Incorporated by reference to Amendment No. 1 to TransDigm Inc. and TransDigm Group Incorporated’s Form S-4 filed November 7, 2006 (File No. 333-137937) | ||
| 10.5 | Amendment No. 1 to TransDigm Group Incorporated Fourth Amended and Restated 2003 Stock Option Plan * | Incorporated by reference to TransDigm Group Incorporated’s Form 10-K filed November 21, 2007 (File No. 001-32833) | ||
54
Table of Contents
| Exhibit No. |
Description |
Filed Herewith or Incorporated by Reference From | ||
| 10.6 | Letter, dated February 24, 2006, from David Barr, Member of the Compensation Committee of the Board of Directors of TransDigm Group Incorporated, to W. Nicholas Howley, Chief Executive Officer of TransDigm Group Incorporated * | Incorporated by reference to Amendment No. 2 to TransDigm Group Incorporated’s Form S-1 filed February 27, 2006 (File No. 333-130483) | ||
| 10.7 | Amendment No. 2 to TransDigm Group Incorporated Fourth Amended and Restated Stock Option Plan* | Incorporated by reference to TransDigm Group Incorporated’s Form 10-Q filed August 7, 2008 (File No. 001-32833) | ||
| 10.8 | Amendment No. 3 to TransDigm Group Incorporated Fourth Amended and Restated Stock Option Plan* | Incorporated by reference to TransDigm Group Incorporated’s Form 8-K filed April 28, 2009 (File No. 001-32833) | ||
| 10.9 | TransDigm Group Incorporated 2006 Stock Incentive Plan * | Incorporated by reference to Amendment No. 3 to TransDigm Group Incorporated’s Form S-1 filed March 13, 2006 (File No. 333-130483) | ||
| 10.10 | Amendment No. 1, dated October 20, 2006, to the TransDigm Group Incorporated 2006 Stock Incentive Plan * | Incorporated by reference to Amendment No. 1 to TransDigm Inc. and TransDigm Group Incorporated’s Form S-4 filed November 7, 2006 (File No. 333-137937) | ||
| 10.11 | Second Amendment to TransDigm Group Incorporated 2006 Stock Incentive Plan, dated April 25, 2008* | Incorporated by reference to Schedule 14A filed June 6, 2008 (File No. 001-32833) | ||
| 10.12 | Amended and Restated TD Holding Corporation Dividend Equivalent Plan * | Incorporated by reference to TransDigm Inc. and TransDigm Holding Company’s Form 8-K filed December 22, 2005 (File No. 333-10834006) | ||
| 10.13 | Second Amended and Restated TransDigm Group Incorporated 2003 Stock Option Plan Dividend Equivalent Plan* | Incorporated by reference to TransDigm Group Incorporated’s Form 8-K filed April 28, 2009 (File No. 001-32833) | ||
| 10.14 | Third Amended and Restated TransDigm Group Incorporated 2003 Stock Option Plan Dividend Equivalent Plan* | Incorporated by reference to TransDigm Group Incorporated’s Form 8-K filed October 6, 2009 (File No. 001-32833) | ||
| 10.15 | Amended and Restated TransDigm Inc. Executive Retirement Savings Plan * | Incorporated by reference to TransDigm Inc. and TransDigm Holding Company’s Form 8-K filed December 22, 2005 (File No. 333-10834006) | ||
| 10.16 | TransDigm Group Incorporated 2006 Stock Incentive Plan Dividend Equivalent Plan * | Incorporated by reference to TransDigm Group Incorporated’s Form 8-K filed June 6, 2008 (File No. 333-130483) | ||
| 10.17 | Amended and Restated TransDigm Group Incorporated 2006 Stock Incentive Plan Dividend Equivalent Plan* | Incorporated by reference to TransDigm Group Incorporated’s Form 8-K filed April 28, 2009 (File No. 001-32833) | ||
| 10.18 | Second Amended and Restated TransDigm Group Incorporated 2006 Stock Incentive Plan Dividend Equivalent Plan* | Incorporated by reference to TransDigm Group Incorporated’s Form 8-K filed October 6, 2009 (File No. 001-32833) | ||
55
Table of Contents
| Exhibit No. |
Description |
Filed Herewith or Incorporated by Reference From | ||
| 10.19 | Form of Management Option Agreement, between TD Holding Corporation and the applicable executive regarding the rollover options granted to such executive * | Incorporated by reference to TransDigm Inc. and TransDigm Holding Company’s Form S-4, filed August 29, 2003 (File No. 333-10834006) | ||
| 10.20 | Form of Management Option Agreement, between TD Holding Corporation and the applicable executive regarding the time vested options granted to such executive under the 2003 Stock Option Plan (pre-IPO) * | Incorporated by reference to TransDigm Inc. and TransDigm Holding Company’s Form S-4, filed August 29, 2003 (File No. 333-10834006) | ||
| 10.21 | Form of Management Option Agreement, between TD Holding Corporation and the applicable executive regarding the performance vested options granted to such executive under the 2003 Stock Option Plan (pre-IPO) * | Incorporated by reference to TransDigm Inc. and TransDigm Holding Company’s Form S-4, filed August 29, 2003 (File No. 333-10834006) | ||
| 10.22 | Form of Management Option Agreement, between TransDigm Group Incorporated and the applicable executive regarding the time vested options granted to such executive under the Fourth Amended and Restated 2003 Stock Option Plan (post-IPO) * | Incorporated by reference to TransDigm Group Incorporated’s Form 10-K filed November 28, 2006 (File No. 001-32833) | ||
| 10.23 | Form of Management Option Agreement, between TransDigm Group Incorporated and the applicable executive regarding the performance vested options granted to such executive under the Fourth Amended and Restated 2003 Stock Option Plan (post-IPO) * | Incorporated by reference to TransDigm Group Incorporated’s Form 10-K filed November 28, 2006 (File No. 001-32833) | ||
| 10.24 | Form of Option Agreement under TransDigm Group Incorporated 2006 Stock Incentive Plan * | Incorporated by reference to Amendment No. 3 to TransDigm Group Incorporated’s Form S-1 filed March 13, 2006 (File no. 333-130483) | ||
| 10.25 | Form of Option Agreement under 2008 stock incentive program under TransDigm Group Incorporated 2006 Stock Incentive Plan * | Incorporated by reference to TransDigm Group Incorporated’s Form 8-K filed November 21, 2008 (File No. 333-130483) | ||
| 10.26 | Form of Restricted Stock Award Agreement under TransDigm Group Incorporated 2006 Stock Incentive Plan | Incorporated by reference to TransDigm Group Incorporated’s Form 10-Q filed May 8, 2007 (File No. 001-32833) | ||
| 10.27 | Amended and Restated Stock Option Agreement dated June 2004 between TransDigm Group Incorporated and Michael Graff | Incorporated by reference to TransDigm Group Incorporated’s Form 8-K filed October 6, 2009 (File No. 001-32833) | ||
| 10.28 | First Amendment to Amended and Restated Stock Option Agreement dated October 5, 2009 between TransDigm Group Incorporated and Michael Graff | Filed with Exhibit 10.27 | ||
| 10.29 | Tax Sharing Agreement, dated July 22, 2003, among TD Holding Corporation, TransDigm Holding Company, TransDigm Inc. and such direct and indirect subsidiaries of TD Holding Corporation that are listed on Exhibit A thereto | Incorporated by reference to Amendment No. 1 to TransDigm Inc. and TransDigm Holding Company’s Form S-4 filed October 30, 2003 (File No. 333-10834006) | ||
56
Table of Contents
| Exhibit No. |
Description |
Filed Herewith or Incorporated by Reference From | ||
| 10.30 | Credit Agreement, dated June 23, 2006, among TransDigm Inc., TransDigm Group Incorporated, the subsidiaries of TransDigm Inc. from time to time party thereto, the financial institutions from time to time party thereto, as lenders, Credit Suisse, as administrative agent and collateral agent, Credit Suisse Securities (USA) LLC and Bank of America Securities LLC, as joint lead arrangers and joint bookrunners, Bank of America, N.A., as syndication agent, and Barclays Bank plc, General Electrical Capital Corporation and UBS Securities LLC, as co-documentation agents | Incorporated by reference to TransDigm Group Incorporated’s Form 8-K filed on June 28, 2006 (File No. 001-32833) | ||
| 10.31 | Amendment No. 1. Consent and Agreement, dated January 25, 2007, to the Credit Agreement, dated June 23, 2006, among TransDigm Inc., TransDigm Group Incorporated, the subsidiaries of TransDigm Inc. from time to time party thereto, the financial institutions from time to time party thereto, as lenders, Credit Suisse, as administrative agent and collateral agent, Credit Suisse Securities (USA) LLC and Bank of America Securities LLC, as joint lead arrangers and joint bookrunners, Bank of America, N.A., as syndication agent, and Barclays Bank plc, General Electric Capital Corporation and UBS Securities LLC, as co-documentation agents | Incorporated by reference to TransDigm Inc. and TransDigm Holding Company’s Form 8-K filed February 13, 2007 (File No. 333-130483) | ||
| 10.32 | Guarantee and Collateral Agreement, dated June 23, 2006, among TransDigm Inc., TransDigm Group Incorporated, the subsidiaries of TransDigm Inc. named therein and Credit Suisse, as administrative agent and collateral agent | Incorporated by reference to TransDigm Group Incorporated’s Form 8-K filed June 28, 2006 (File No. 001-32833) | ||
| 10.33 | Supplement No. 1, dated November 2, 2006, to the Guarantee and Collateral Agreement, dated June 23, 2006, among TransDigm Inc., TransDigm Group Incorporated, the subsidiaries of TransDigm Inc. named therein and Credit Suisse, as administrative agent and collateral agent | Incorporated by reference to TransDigm Group Incorporated’s Form 8-K filed November 6, 2006 (File No. 001-32833) | ||
| 10.34 | Supplement No. 2, dated February 7, 2007, to the Guarantee and Collateral Agreement, dated June 23, 2006, among TransDigm Inc., TransDigm Group Incorporated, the subsidiaries of TransDigm Inc. named therein and Credit Suisse as administrative and collateral agent | Incorporated by reference to TransDigm Group Incorporated’s Form 8-K filed February 13, 2007 (File No. 333-130483) | ||
57
Table of Contents
| Exhibit No. |
Description |
Filed Herewith or Incorporated by Reference From | ||
| 10.35 | Supplement No. 3, dated June 29, 2007, to the Guarantee and Collateral Agreement, dated June 23, 2006, among TransDigm Inc., TransDigm Group Incorporated, the subsidiaries of TransDigm Inc. named therein and Credit Suisse as administrative agent | Incorporated by reference to TransDigm Group Incorporated’s Form 8-K filed July 6, 2007 (File No. 001-32833) | ||
| 10.36 | Supplement No. 4, dated September 10, 2007, to the Guarantee and Collateral Agreement, dated June 23, 2006, among TransDigm Inc., TransDigm Group Incorporated, the subsidiaries of TransDigm Inc. named therein and Credit Suisse as administrative agent | Incorporated by reference to TransDigm Group Incorporated’s Form 8-K filed September 11, 2007 (File No. 001-32833) | ||
| 10.37 | Supplement No. 5 dated May 7, 2008, to the Guarantee and Collateral Agreement, dated June 23, 2006, among TransDigm Inc., TransDigm Group Incorporated, the subsidiaries of TransDigm Inc. named therein and Credit Suisse as administrative agent | Incorporated by reference to TransDigm Group Incorporated’s Form 8-K filed May 9, 2008 (File No. 001-32833) | ||
| 10.38 | Supplement No. 6 dated December 16, 2008, to the Guarantee and Collateral Agreement, dated June 23, 2006, among TransDigm Inc., TransDigm Group Incorporated, the subsidiaries of TransDigm Inc. named therein and Credit Suisse as administrative agent | Incorporated by reference to TransDigm Group Incorporated’s Form 8-K filed December 18, 2008 (File No. 001-32833) | ||
| 10.39 | Supplement No. 7 dated July 27, 2009, to the Guarantee and Collateral Agreement, dated June 23, 2006, among TransDigm Inc., TransDigm Group Incorporated, the subsidiaries of TransDigm Inc. named therein and Credit Suisse as administrative agent | Incorporated by reference to TransDigm Group Incorporated’s Form 8-K filed July 29, 2009 (File No. 001-32833) | ||
| 10.40 | Joinder Agreement, dated November 2, 2006, between CDA InterCorp and Credit Suisse, as agent | Incorporated by reference to TransDigm Group Incorporated’s Form 8-K filed November 6, 2006 (File No. 001-32833) | ||
| 10.41 | Joinder Agreement, dated February 7, 2007, among Aviation Technologies, Inc., Avtech Corporation, Transicoil Corp., West Coast Specialties, Inc., Malaysian Aerospace Services, Inc. and Credit Suisse as administrative agent and collateral agent | Incorporated by reference to TransDigm Group Incorporated’s Form 8-K filed February 13, 2007 (File No. 333-130483) | ||
| 10.42 | Joinder Agreement dated June 29, 2007, between AeroControlex Group, Inc. and Credit Suisse, as agent | Incorporated by reference to TransDigm Group Incorporated’s Form 8-K filed July 6, 2007 (File No. 001-32833) | ||
| 10.43 | Joinder Agreement dated September 10, 2007, between Bruce Aerospace Inc. and Bruce Industries, Inc. and Credit Suisse as agent | Incorporated by reference to TransDigm Group Incorporated’s Form 8-K filed September 11, 2007 (File No. 001-32833) | ||
| 10.44 | Joinder Agreement dated May 7, 2008, between CEF Industries, Inc., and Credit Suisse as agent | Incorporated by reference to TransDigm Group Incorporated’s Form 8-K filed May 9, 2008 (File No. 001-32833) | ||
58
Table of Contents
| Exhibit No. |
Description |
Filed Herewith or Incorporated by Reference From | ||
| 10.45 | Joinder Agreement dated December 16, 2008, between Aircraft Parts Corporation and Credit Suisse as agent | Incorporated by reference to TransDigm Group Incorporated’s Form 8-K filed December 18, 2008 (File No. 001-32833) | ||
| 10.46 | Joinder Agreement dated July 27, 2009, between Acme Aerospace, Inc., and Credit Suisse as agent | Incorporated by reference to TransDigm Group Incorporated’s Form 8-K filed July 29, 2009 (File No. 001-32833) | ||
| 12.1 | Statement of Computation of Ratio of Earnings to Fixed Charges | Filed herewith | ||
| 21.1 | Subsidiaries of TransDigm Group Incorporated | Filed herewith | ||
| 23.1 | Consent of Independent Registered Public Accounting Firm | Filed herewith | ||
| 31.1 | Certification by Principal Executive Officer of TransDigm Group Incorporated pursuant to Rule 13a-14(a) or 15d-14(a) of the Securities Exchange Act of 1934, as adopted pursuant to Section 302 of the Sarbanes-Oxley Act of 2002 | Filed herewith | ||
| 31.2 | Certification by Principal Financial Officer of TransDigm Group Incorporated pursuant to Rule 13a-14(a) or 15d-14(a) of the Securities Exchange Act of 1934, as adopted pursuant to Section 302 of the Sarbanes-Oxley Act of 2002 | Filed herewith | ||
| 32.1 | Certification by Principal Executive Officer of TransDigm Group Incorporated pursuant to 18 U.S.C. Section 1350, as adopted pursuant to Section 906 of the Sarbanes-Oxley Act of 2002 | Filed herewith | ||
| 32.2 | Certification by Principal Financial Officer of TransDigm Group Incorporated pursuant to 18 U.S.C. Section 1350, as adopted pursuant to Section 906 of the Sarbanes-Oxley Act of 2002 | Filed herewith | ||
| * | Indicates management contract or compensatory plan contract or arrangement. |
59
Table of Contents
SIGNATURES
Pursuant to the requirements of Section 13 or 15(d) of the Securities Exchange Act of 1934, the registrant has duly caused this Report to be signed on its behalf by the undersigned, thereunto duly authorized, in Cleveland, State of Ohio, on November 24, 2009.
| TRANSDIGM GROUP INCORPORATED | ||
| By: | /s/ GREGORY RUFUS | |
| Name: | Gregory Rufus | |
| Title: | Executive Vice President, Chief Financial Officer and Secretary | |
Pursuant to the requirements of the Securities Exchange Act of 1934, this Report has been signed below by the following persons on behalf of the registrant and in the capacities and as of the dates indicated.
| Signature |
Title |
Date | ||
| /s/ W. NICHOLAS HOWLEY W. Nicholas Howley |
Chairman of Board of Directors and Chief Executive Officer (Principal Executive Officer) |
November 24, 2009 | ||
| /s/ GREGORY RUFUS Gregory Rufus |
Executive Vice President, Chief Financial Officer and Secretary (Principal Financial and Accounting Officer) |
November 24, 2009 | ||
| /s/ SEAN P. HENNESSY Sean P. Hennessy |
Director | November 24, 2009 | ||
| /s/ DAVID BARR David Barr |
Director | November 24, 2009 | ||
| /s/ DOUGLAS PEACOCK Douglas Peacock |
Director | November 24, 2009 | ||
| /s/ MICHAEL GRAFF Michael Graff |
Director | November 24, 2009 | ||
| /s/ DUDLEY SHEFFLER Dudley Sheffler |
Director | November 24, 2009 | ||
| /s/ MERVIN DUNN Mervin Dunn |
Director | November 24, 2009 | ||
60
Table of Contents
TRANSDIGM GROUP INCORPORATED AND SUBSIDIARIES
ANNUAL REPORT ON FORM 10-K:
FISCAL YEAR ENDED SEPTEMBER 30, 2009
ITEM 8 AND ITEM 15(a) (1)
FINANCIAL STATEMENTS AND SUPPLEMENTARY DATA
INDEX
61
Table of Contents
Report of Independent Registered Public Accounting Firm
The Board of Directors and Shareholders of
TransDigm Group Incorporated
We have audited the accompanying consolidated balance sheets of TransDigm Group Incorporated and subsidiaries as of September 30, 2009 and 2008, and the related consolidated statements of income, shareholders’ equity, and cash flows for each of the three years in the period ended September 30, 2009. Our audit also included the financial statement schedule listed in the Index at Item 15(a). These financial statements and schedule are the responsibility of the Company’s management. Our responsibility is to express an opinion on these financial statements and schedule based on our audits.
We conducted our audits in accordance with the standards of the Public Company Accounting Oversight Board (United States). Those standards require that we plan and perform the audit to obtain reasonable assurance about whether the financial statements are free of material misstatement. An audit also includes examining, on a test basis, evidence supporting the amounts and disclosures in the financial statements. An audit also includes assessing the accounting principles used and significant estimates made by management, as well as evaluating the overall financial statement presentation. We believe that our audits provide a reasonable basis for our opinion.
In our opinion, the financial statements referred to above present fairly, in all material respects, the consolidated financial position of TransDigm Group Incorporated and subsidiaries at September 30, 2009 and 2008, and the consolidated results of their operations and their cash flows for each of the three years in the period ended September 30, 2009, in conformity with U.S. generally accepted accounting principles. Also, in our opinion, the related financial statement schedule, when considered in relation to the basic financial statements taken as a whole, presents fairly in all material respects the information set forth therein.
We also have audited, in accordance with the standards of the Public Company Accounting Oversight Board (United States), the effectiveness of TransDigm Group Incorporated’s internal control over financial reporting as of September 30, 2009, based on criteria established in Internal Control-Integrated Framework issued by the Committee of Sponsoring Organizations of the Treadway Commission and our report dated November 24, 2009, expressed an unqualified opinion thereon.
/s/ Ernst & Young LLP
Cleveland, Ohio
November 24, 2009
F-1
Table of Contents
CONSOLIDATED BALANCE SHEETS
AS OF SEPTEMBER 30, 2009 AND 2008
(Amounts in thousands, except share amounts)
| 2009 | 2008 | ||||||
| ASSETS |
|||||||
| CURRENT ASSETS: |
|||||||
| Cash and cash equivalents |
$ | 190,167 | $ | 159,062 | |||
| Trade accounts receivable—Net |
106,446 | 96,196 | |||||
| Inventories |
167,766 | 144,114 | |||||
| Deferred income taxes |
18,700 | 19,902 | |||||
| Prepaid expenses and other |
11,675 | 4,160 | |||||
| Total current assets |
494,754 | 423,434 | |||||
| PROPERTY, PLANT AND EQUIPMENT—Net |
96,751 | 96,241 | |||||
| GOODWILL |
1,462,310 | 1,354,774 | |||||
| TRADEMARKS AND TRADE NAMES |
176,156 | 167,626 | |||||
| OTHER INTANGIBLE ASSETS—Net |
196,765 | 188,568 | |||||
| DEBT ISSUE COSTS—Net |
24,089 | 19,309 | |||||
| OTHER |
3,615 | 5,869 | |||||
| TOTAL ASSETS |
$ | 2,454,440 | $ | 2,255,821 | |||
| LIABILITIES AND STOCKHOLDERS’ EQUITY |
|||||||
| CURRENT LIABILITIES: |
|||||||
| Accounts payable |
$ | 44,680 | $ | 25,140 | |||
| Accrued liabilities |
55,072 | 63,362 | |||||
| Total current liabilities |
99,752 | 88,502 | |||||
| LONG-TERM DEBT |
1,356,761 | 1,357,230 | |||||
| DEFERRED INCOME TAXES |
162,745 | 151,672 | |||||
| OTHER NON-CURRENT LIABILITIES |
16,020 | 4,517 | |||||
| Total liabilities |
1,635,278 | 1,601,921 | |||||
| STOCKHOLDERS’ EQUITY: |
|||||||
| Common stock—$.01 par value; authorized 224,400,000 shares; issued 49,448,028 and 48,600,848 at September 30, 2009 and 2008, respectively |
494 | 486 | |||||
| Additional paid-in capital |
388,772 | 365,224 | |||||
| Retained earnings |
450,647 | 287,745 | |||||
| Accumulated other comprehensive income/(loss) |
(5,509 | ) | 445 | ||||
| Treasury stock, at cost; 494,100 and 0 shares at September 30, 2009 and September 30, 2008, respectively |
(15,242 | ) | — | ||||
| Total stockholders’ equity |
819,162 | 653,900 | |||||
| TOTAL LIABILITIES AND STOCKHOLDERS’ EQUITY |
$ | 2,454,440 | $ | 2,255,821 | |||
See Notes to Consolidated Financial Statements.
F-2
Table of Contents
CONSOLIDATED STATEMENTS OF INCOME
(Amounts in thousands, except per share amounts)
| Fiscal Years Ended | |||||||||
| 2009 | 2008 | 2007 | |||||||
| NET SALES |
$ | 761,552 | $ | 713,711 | $ | 592,798 | |||
| COST OF SALES |
332,206 | 327,780 | 283,766 | ||||||
| GROSS PROFIT |
429,346 | 385,931 | 309,032 | ||||||
| OPERATING EXPENSES: |
|||||||||
| Selling and administrative |
80,018 | 74,650 | 62,890 | ||||||
| Amortization of intangibles |
13,928 | 12,002 | 12,304 | ||||||
| Total operating expenses |
93,946 | 86,652 | 75,194 | ||||||
| INCOME FROM OPERATIONS |
335,400 | 299,279 | 233,838 | ||||||
| INTEREST EXPENSE—Net |
84,398 | 92,677 | 91,767 | ||||||
| INCOME BEFORE INCOME TAXES |
251,002 | 206,602 | 142,071 | ||||||
| INCOME TAX PROVISION |
88,100 | 73,476 | 53,426 | ||||||
| NET INCOME |
$ | 162,902 | $ | 133,126 | $ | 88,645 | |||
| Net earnings per share: |
|||||||||
| Basic |
$ | 3.36 | $ | 2.78 | $ | 1.94 | |||
| Diluted |
$ | 3.23 | $ | 2.65 | $ | 1.83 | |||
| Weighted-average shares outstanding: |
|||||||||
| Basic |
48,481 | 47,856 | 45,630 | ||||||
| Diluted |
50,459 | 50,202 | 48,542 | ||||||
See Notes to Consolidated Financial Statements.
F-3
Table of Contents
CONSOLIDATED STATEMENTS OF CHANGES IN STOCKHOLDERS’ EQUITY
(Amounts in thousands, except share amounts)
| Common Stock | Accumulated Other Comprehensive Income/ (Loss) |
Treasury Stock | |||||||||||||||||||||||||
| Number of Shares |
Common Stock |
Additional Paid-In Capital |
Retained Earnings |
Number of Shares |
Value | Total | |||||||||||||||||||||
| BALANCE—October 1, 2006 |
44,664,020 | $ | 446 | $ | 296,757 | $ | 67,667 | $ | (1,829 | ) | — | $ | — | $ | 363,041 | ||||||||||||
| Compensation expense recognized for employee stock options |
— | — | 3,455 | — | — | — | — | 3,455 | |||||||||||||||||||
| Excess tax benefit from exercise of stock options |
— | — | 23,627 | — | — | — | — | 23,627 | |||||||||||||||||||
| Exercise of employee stock options |
2,369,802 | 24 | 8,450 | — | — | — | — | 8,474 | |||||||||||||||||||
| Restricted stock compensation |
— | — | 32 | — | — | — | — | 32 | |||||||||||||||||||
| Common stock issued |
8,152 | — | 201 | — | — | — | — | 201 | |||||||||||||||||||
| Comprehensive income: |
|||||||||||||||||||||||||||
| Net income |
— | — | — | 88,645 | — | — | — | 88,645 | |||||||||||||||||||
| Interest rate swap |
— | — | — | — | (14 | ) | — | — | (14 | ) | |||||||||||||||||
| Other comprehensive income |
— | — | — | — | 90 | — | — | 90 | |||||||||||||||||||
| Comprehensive income |
88,721 | ||||||||||||||||||||||||||
| BALANCE—September 30, 2007 |
47,041,974 | 470 | 332,522 | 156,312 | (1,753 | ) | — | — | $ | 487,551 | |||||||||||||||||
| Cumulative effect adjustment |
(1,693 | ) | (1,693 | ) | |||||||||||||||||||||||
| Compensation expense recognized for employee stock options |
— | — | 4,002 | — | — | — | — | 4,002 | |||||||||||||||||||
| Excess tax benefit from exercise of stock options |
— | — | 18,756 | — | — | — | — | 18,756 | |||||||||||||||||||
| Exercise of employee stock options |
1,553,509 | 16 | 9,753 | — | — | — | — | 9,769 | |||||||||||||||||||
| Restricted stock compensation |
— | — | 33 | — | — | — | — | 33 | |||||||||||||||||||
| Common stock issued |
5,365 | — | 158 | — | — | — | — | 158 | |||||||||||||||||||
| Comprehensive income: |
|||||||||||||||||||||||||||
| Net income |
— | — | — | 133,126 | — | — | — | 133,126 | |||||||||||||||||||
| Interest rate swap |
— | — | — | — | 2,202 | — | — | 2,202 | |||||||||||||||||||
| Other comprehensive income |
— | — | — | — | (4 | ) | — | — | (4 | ) | |||||||||||||||||
| Comprehensive income |
135,324 | ||||||||||||||||||||||||||
| BALANCE—September 30, 2008 |
48,600,848 | 486 | 365,224 | 287,745 | 445 | — | — | $ | 653,900 | ||||||||||||||||||
| Treasury stock purchased |
— | — | — | — | — | (494,100 | ) | (15,242 | ) | (15,242 | ) | ||||||||||||||||
| Compensation expense recognized for employee stock options |
— | — | 5,782 | — | — | — | — | 5,782 | |||||||||||||||||||
| Excess tax benefit from exercise of stock options |
— | — | 9,278 | — | — | — | — | 9,278 | |||||||||||||||||||
| Exercise of employee stock options |
842,750 | 8 | 8,337 | — | — | — | — | 8,345 | |||||||||||||||||||
| Restricted stock compensation |
— | — | 31 | — | — | — | — | 31 | |||||||||||||||||||
| Common stock issued |
4,430 | — | 120 | — | — | — | — | 120 | |||||||||||||||||||
| Comprehensive income: |
|||||||||||||||||||||||||||
| Net income |
— | — | — | 162,902 | — | — | — | 162,902 | |||||||||||||||||||
| Interest rate swap |
— | — | — | — | (5,306 | ) | — | — | (5,306 | ) | |||||||||||||||||
| Other comprehensive loss |
— | — | — | — | (648 | ) | — | — | (648 | ) | |||||||||||||||||
| Comprehensive income |
156,948 | ||||||||||||||||||||||||||
| BALANCE—September 30, 2009 |
49,448,028 | $ | 494 | $ | 388,772 | $ | 450,647 | $ | (5,509 | ) | (494,100 | ) | $ | (15,242 | ) | $ | 819,162 | ||||||||||
See Notes to Consolidated Financial Statements.
F-4
Table of Contents
CONSOLIDATED STATEMENTS OF CASH FLOWS
(Amounts in thousands)
| Fiscal Years Ended September 30, | ||||||||||||
| 2009 | 2008 | 2007 | ||||||||||
| OPERATING ACTIVITIES: |
||||||||||||
| Net income |
$ | 162,902 | $ | 133,126 | $ | 88,645 | ||||||
| Adjustments to reconcile net income to net cash provided by operating activities: |
||||||||||||
| Depreciation |
13,593 | 13,252 | 11,648 | |||||||||
| Amortization of intangibles |
13,928 | 12,002 | 12,304 | |||||||||
| Amortization/write-off of debt issue costs |
3,251 | 3,097 | 3,147 | |||||||||
| Non-cash equity compensation |
5,813 | 4,035 | 3,487 | |||||||||
| Excess tax benefit from exercise of stock options |
(9,278 | ) | (18,756 | ) | (23,627 | ) | ||||||
| Deferred income taxes |
8,800 | 7,335 | 6,230 | |||||||||
| Changes in assets and liabilities, net of effects from acquisitions of businesses: |
||||||||||||
| Trade accounts receivable |
(346 | ) | 7,103 | (17,401 | ) | |||||||
| Inventories |
(4,518 | ) | 878 | (5,624 | ) | |||||||
| Income taxes receivable |
3,933 | 25,815 | 28,607 | |||||||||
| Other assets |
(2,335 | ) | 431 | (2,564 | ) | |||||||
| Accounts payable |
8,808 | (333 | ) | 1,642 | ||||||||
| Accrued and other liabilities |
(7,439 | ) | 1,650 | 5,942 | ||||||||
| Net cash provided by operating activities |
197,112 | 189,635 | 112,436 | |||||||||
| INVESTING ACTIVITIES: |
||||||||||||
| Capital expenditures |
(13,155 | ) | (10,884 | ) | (10,258 | ) | ||||||
| Acquisition of businesses |
(155,233 | ) | (154,160 | ) | (511,407 | ) | ||||||
| Net cash used in investing activities |
(168,388 | ) | (165,044 | ) | (521,665 | ) | ||||||
| FINANCING ACTIVITIES: |
||||||||||||
| Excess tax benefit from exercise of stock options |
9,278 | 18,756 | 23,627 | |||||||||
| Proceeds from exercise of stock options |
8,345 | 9,769 | 8,450 | |||||||||
| Treasury stock purchased |
(15,242 | ) | — | — | ||||||||
| Borrowings under Senior Secured Credit Facility—net of fees |
— | — | 125,423 | |||||||||
| Proceeds from 7 3/4% Senior Subordinated Notes—net of fees |
— | — | 296,458 | |||||||||
| Net cash provided by (used in) financing activities |
2,381 | 28,525 | 453,958 | |||||||||
| NET INCREASE (DECREASE) IN CASH AND CASH EQUIVALENTS |
31,105 | 53,116 | 44,729 | |||||||||
| CASH AND CASH EQUIVALENTS—Beginning of period |
159,062 | 105,946 | 61,217 | |||||||||
| CASH AND CASH EQUIVALENTS—End of period |
$ | 190,167 | $ | 159,062 | $ | 105,946 | ||||||
| SUPPLEMENTAL DISCLOSURE OF CASH FLOW INFORMATION: |
||||||||||||
| Cash paid during the period for interest |
$ | 82,247 | $ | 95,099 | $ | 90,693 | ||||||
| Net cash paid during the period for income taxes |
$ | 75,306 | $ | 39,918 | $ | 18,592 | ||||||
See Notes to Consolidated Financial Statements.
F-5
Table of Contents
NOTES TO CONSOLIDATED FINANCIAL STATEMENTS
| 1. | DESCRIPTION OF THE BUSINESS |
Description of the Business—TransDigm Group Incorporated (“TD Group”), through its wholly-owned subsidiary, TransDigm Inc., is a leading global designer, producer and supplier of highly engineered aircraft components for use on nearly all commercial and military aircraft in service today. TransDigm Inc. (which includes the Adel Wiggins Group), along with TransDigm Inc.’s direct and indirect wholly-owned operating subsidiaries, AeroControlex Group, Inc., MarathonNorco Aerospace, Inc., Adams Rite Aerospace, Inc., Champion Aerospace LLC, Avionic Instruments LLC, Skurka Aerospace Inc., CDA InterCorp LLC, Avtech Corporation, Transicoil LLC, Transicoil (Malaysia) Sendirian Berhad, Bruce Aerospace, Inc., CEF Industries LLC, Aircraft Parts Corporation and Acme Aerospace, Inc. (collectively, with TD Group, the “Company” or “TransDigm”) offers a broad range of proprietary aerospace components. TD Group has no significant assets or operations other than its 100% ownership of TransDigm Inc. TD Group’s common stock is listed on The New York Stock Exchange, or the NYSE, under the trading symbol “TDG.”
Major product offerings, substantially all of which are ultimately provided to end-users in the aerospace industry, include mechanical/electromechanical actuators and controls, ignition systems and components, gear pumps, specialized valves, engineered connectors, power conditioning devices, specialized fluorescent lighting, specialized AC/DC electric motors, aircraft audio systems, engineered latches and cockpit security devices, lavatory hardware and components, hold open rods and locking devices, specialized cockpit displays, elastomers, NiCad batteries/chargers and starter generators and related components.
Separate Financial Statements—Separate financial statements of TransDigm Inc. are not presented since the 7 3/4% senior subordinated notes (“the 7 3/4% Senior Subordinated Notes”) are fully and unconditionally guaranteed on a senior subordinated basis by TD Group and all existing domestic subsidiaries of TransDigm Inc. and since TD Group has no significant operations or assets separate from its investment in TransDigm Inc.
| 2. | ACQUISITIONS |
Woodward HRT Product Line—On August 10, 2009, TransDigm Inc., through its AeroControlex Group Inc. subsidiary, acquired certain product line assets of Woodward HRT, Inc., a subsidiary of Woodward Governor Company (“Woodward HRT product line”) for approximately $48 million in cash, subject to adjustment based on the level of working capital as of the closing date of the acquisition. The product line comprises a range of highly engineered fuel and pneumatic valves and surge suppressors, the majority of which are used on military rotary and fixed wing aircraft, all of which fit well with TransDigm’s overall business direction. Woodward Governor recently acquired this business as part of its acquisition of HR Textron, Inc. The Company expects that the $25 million of goodwill recognized for the acquisition will be deductible for tax purposes.
Acme Aerospace—On July 24, 2009, TransDigm Inc. acquired all of the outstanding capital stock of Acme Aerospace, Inc. (“Acme”) for approximately $40.7 million in cash, which includes a purchase price adjustment of $0.2 million paid in October 2009. Acme is a designer and manufacturer of proprietary, highly engineered components to the commercial aerospace industry, comprising primarily fibrous nickel cadmium main ship batteries, battery chargers, battery back-up systems and power conversion equipment. These products fit well with TransDigm’s overall business direction. The Company expects that the $31 million of goodwill recognized for the acquisition will not be deductible for tax purposes.
Aircraft Parts Corporation—On December 16, 2008, TransDigm Inc. acquired all of the outstanding capital stock of Aircraft Parts Corporation (“APC”) for approximately $66.9 million in cash, net of a purchase price
F-6
Table of Contents
adjustment of $0.7 million received in November 2009. APC is a designer and manufacturer of starter generators, generator control units and related components for turbine engines, all of which fit well with TransDigm’s overall business direction. The Company expects that the $50 million of goodwill recognized for the acquisition will not be deductible for tax purposes.
Unison Product Line—On September 26, 2008, TransDigm Inc., through its wholly-owned Champion Aerospace, LLC subsidiary, acquired certain assets related to the magneto and harness product line business of Unison Industries, LLC (“Unison product line”) for approximately $68.3 million in cash, net of a purchase price adjustment of $1.1 million received in November 2008. The acquired product line includes the highly engineered SLICKTM magnetos, harnesses and components, which are used on substantially all of the world’s general aviation piston aircraft. These products fit well with Champion’s existing product offerings and TransDigm’s overall business direction. The Company expects that the $60 million of goodwill recognized for the acquisition will be deductible for tax purposes.
CEF—On May 7, 2008, TransDigm Inc. acquired all of the outstanding capital stock of CEF Industries, Inc. (“CEF”) for approximately $84.5 million in cash, net of a purchase price adjustment of $0.5 million received in January 2009. CEF is a designer and manufacturer of specialized and highly engineered actuators, compressors, pumps and related components primarily for the military aerospace market, all of which fit well with TransDigm’s overall business direction. The Company expects that the $52 million of goodwill recognized for the acquisition will not be deductible for tax purposes.
Bruce—On August 10, 2007, TransDigm Inc., through a newly formed subsidiary, Bruce Aerospace Inc. (“Bruce”), acquired certain assets and assumed certain liabilities of Bruce Industries for approximately $35.5 million in cash, net of a purchase price adjustment of $0.2 million received in February 2008. Additionally, in accordance with the purchase agreement, the Company recorded a contingent liability based upon the earnings before income taxes, depreciation and amortization related to the sale of certain part numbers for a period of three years following the closing. Bruce designs and manufactures specialized fluorescent lighting used in the aircraft industry. The proprietary nature, established positions, and aftermarket content fit well with TransDigm’s overall business direction. The Company expects that the $24 million of goodwill recognized for the acquisition will be deductible for tax purposes.
ATI—On February 7, 2007, TransDigm Inc. acquired all of the outstanding capital stock of Aviation Technologies, Inc. (“ATI”) for approximately $430 million in cash. ATI consists of two primary operating units that service the commercial and military aerospace markets—Avtech Corporation (“Avtech”) and Transicoil LLC (which, together with Transicoil (Malaysia) Sendirian Berhad, is referred to as “ADS/Transicoil”). Avtech is a supplier of flight deck and passenger audio systems, cabin lighting, and power control products and related components. ADS/Transicoil is a supplier of displays, clocks, brushless motors and related components and instruments. Through Avtech and ADS/Transicoil, ATI manufactures proprietary products for the aerospace industry with broad platform positions and high aftermarket content, all of which fit well with TransDigm’s overall direction. Substantially all of the goodwill of $308 million recognized in accounting for the acquisition will not be deductible for tax purposes.
Mr. W. Nicholas Howley, Chairman and Chief Executive Officer of TransDigm, and Mr. Douglas Peacock, a director of TransDigm, each indirectly owned less than one-half of 1% of ATI’s outstanding equity on a fully diluted basis. In addition, prior to the acquisition, Mr. Howley and Mr. Peacock were directors of ATI commencing in 2003, and Mr. Peacock served as ATI’s Chairman from 2003 through February 2007.
CDA—On October 3, 2006, TransDigm Inc. acquired all of the outstanding capital stock of CDA InterCorp (“CDA”) for $45.7 million in cash, which includes a purchase price adjustment of $0.3 million paid in March 2007. CDA designs and manufactures specialized controllable drive actuators, motors, transducers, and gearing. The products are consistent with TransDigm’s recent acquisition of similar product lines. Goodwill of $34 million recognized in accounting for the acquisition is not deductible for tax purposes.
F-7
Table of Contents
The Company accounted for the acquisitions of the businesses of the Woodward HRT product line, Acme, APC, the Unison product line, CEF, Bruce, ATI and CDA (collectively, the “Acquisitions”) as purchases and included the results of operations of the Acquisitions in its consolidated financial statements from the effective date of each acquisition. The Company is in the process of obtaining third-party valuations of certain tangible and intangible assets of APC, Acme and the Woodward HRT product line; thus, the values attributed to acquired assets in the consolidated financial statements are subject to adjustment. Pro forma net sales and results of operations for the Acquisitions, had the Acquisitions occurred at the beginning of the applicable fiscal year ended September 30, 2009 or 2008, are not significant and, accordingly, are not provided.
The Acquisitions strengthen and expand the Company’s position to design, produce and supply highly-engineered proprietary aerospace components in niche markets with significant aftermarket content and provide opportunities to create value through the application of our three core value-driven operating strategies. The purchase price paid for each acquisition reflects the current earnings before interest, taxes, depreciation and amortization (EBITDA) and cash flows, as well as, the future EBITDA and cash flows expected to be generated by the business, which are driven in most cases by the recurring aftermarket consumption over the life of a particular aircraft, estimated to be approximately 30 years.
| 3. | SUMMARY OF SIGNIFICANT ACCOUNTING POLICIES |
Basis of Presentation and Consolidation—The accompanying consolidated financial statements were prepared in conformity with generally accepted accounting principles in the United States (“GAAP”) and include the accounts of TD Group and subsidiaries. All significant intercompany balances and transactions have been eliminated.
Revenue Recognition and Related Allowances—The Company recognizes substantially all revenue based upon shipment of products to the customer, at which time title and risk of loss passes to the customer. Substantially all sales are made pursuant to firm, fixed-price purchase orders received from customers. Provisions for estimated returns, uncollectible accounts and the cost of repairs under contract warranty provisions are provided for in the same period as the related revenues are recorded and are principally based on historical results modified, as appropriate, by the most current information available. Due to uncertainties in the estimation process, it is possible that actual results may vary from the estimates.
Shipping and Handling Costs—All shipping and handling costs are included in cost of sales in the Consolidated Statements of Income.
Research and Development Costs—The Company expenses research and development costs as incurred. The expense recognized for research and development costs for the years ended September 30, 2009, 2008 and 2007 was approximately $12.6 million, $13.2 million, and $9.6 million, respectively.
Cash Equivalents—The Company considers all highly liquid investments with a maturity of three months or less when purchased to be cash equivalents.
Allowance for Uncollectible Accounts—The Company reserves for amounts determined to be uncollectible based on specific identification of losses and estimated losses based on historical experience. The allowance also incorporates a provision for the estimated impact of disputes with customers. The determination of the amount of the allowance for doubtful accounts is subject to significant levels of judgment and estimation by management. If circumstances change or economic conditions deteriorate or improve, the allowance for doubtful accounts could increase or decrease.
Inventories—Inventories are stated at the lower of cost or market. Cost of inventories is determined by the average cost and the first-in, first-out (FIFO) methods for all locations except CEF, which determines the cost of inventories using the last-in, first-out (LIFO) method. Approximately 9% of the inventory was valued under the
F-8
Table of Contents
LIFO method at September 30, 2009. Provision for potentially obsolete or slow-moving inventory is made based on management’s analysis of inventory levels and future sales forecasts. In accordance with industry practice, all inventories are classified as current assets even though a portion of the inventories may not be sold within one year.
Property, Plant and Equipment—Property, plant and equipment are stated at cost. Depreciation is computed using the straight-line method over the following estimated useful lives: land improvements from 10 to 20 years, buildings and improvements from 5 to 30 years, machinery and equipment from 2 to 10 years and furniture and fixtures from 3 to 10 years.
The Company assesses the potential impairment of its property by determining whether the carrying value of the property can be recovered through projected, undiscounted cash flows from future operations over the property’s remaining estimated useful life. Any impairment recognized is the amount by which the carrying amount exceeds the fair value of the asset.
Debt Issue Costs, Premiums and Discounts—The cost of obtaining financing as well as premiums and discounts are amortized using the effective interest method over the terms of the respective obligations/securities.
Intangible Assets—Intangible assets consist of identifiable intangibles acquired or recognized in accounting for the acquisitions (trademarks, trade names, technology, order backlog and a license agreement) and goodwill. Goodwill and intangible assets that have indefinite useful lives are subject to annual impairment testing. The Company’s annual impairment test is performed as of its fiscal year end. Management determines fair value using a discounted future cash flow analysis or other accepted valuation techniques.
GAAP requires that the annual, and any interim, impairment assessment be performed at the reporting unit level. The reporting unit level is the operating subsidiary level for the Company. Substantially all goodwill was determined and recognized for each operating subsidiary pursuant to the accounting for the merger or acquisition as of the date of each transaction, and therefore the allocation of goodwill among reporting units was immaterial for purposes of the impairment assessment. Certain of the acquisitions were or are being integrated into an existing operating subsidiary, and therefore any related goodwill is combined with goodwill of the operating subsidiary.
A two-step impairment test is used to identify potential goodwill impairment. The first step of the goodwill impairment test, used to identify potential impairment, compares the fair value of a reporting unit (as defined) with its carrying amount, including goodwill. If the fair value of the reporting unit exceeds its carrying amount, goodwill is not considered impaired, and the second step of the goodwill impairment test is unnecessary. The second step measures the amount of impairment, if any, by comparing the carrying value of the goodwill associated with a reporting unit to the implied fair value of the goodwill derived from the estimated overall fair value of the reporting unit and the individual fair values of the other assets and liabilities of the reporting unit.
The impairment test for indefinite lived intangible assets consists of a comparison between their fair values and carrying values. If the carrying amounts of intangible assets that have indefinite useful lives exceed their fair values, an impairment loss will be recognized in an amount equal to the sum of any such excesses.
The Company assesses the recoverability of its amortizable intangible assets by determining whether the amortization over their remaining lives can be recovered through projected, undiscounted cash flows from future operations.
Stock Option and Deferred Compensation Plans—The Company records stock-based compensation measured using the fair value method of accounting. Compensation expense is recorded over the service period using the straight-line method for service-based awards and in the service period corresponding to the performance target for performance-based awards. Beginning in fiscal 2009, stock-based compensation expense was adjusted for projected forfeitures based on historical experience.
The Company accounts for its deferred compensation plans by recording the cost of deferred compensation arrangements over the service period of the related employees in a systematic and rational manner.
F-9
Table of Contents
Income Taxes—The Company accounts for income taxes using an asset and liability approach. Deferred taxes are recorded for the difference between the book and tax basis of various assets and liabilities. A valuation allowance is provided when it is more likely than not that some or all of a deferred tax asset will not be realized.
On October 1, 2007, the Company adopted authoritative guidance establishing the minimum accounting and disclosure requirements of uncertain tax positions. The Company recognized a cumulative effect adjustment of $1.7 million, increasing its liability for unrecognized tax benefits, interest, and penalties and reducing the October 1, 2007 balance of retained earnings.
Contingencies—During the ordinary course of business, the Company is from time to time threatened with, or may become a party to, legal actions and other proceedings. While the Company is currently involved in certain legal proceedings, it believes the results of these proceedings will not have a material adverse effect on its financial condition, results of operations, or cash flows. The Company believes that its potential exposure to such legal actions is adequately covered by its aviation product and general liability insurance.
Estimates—The preparation of financial statements in conformity with U.S. generally accepted accounting principles requires management to make estimates and assumptions that affect the reported amounts of assets and liabilities and disclosure of contingent assets and liabilities at the date of the financial statements and the reported amounts of revenues and expenses during the reporting period. Actual results could differ from those estimates.
Comprehensive Income (Loss)—The term “comprehensive income (loss)” represents the change in stockholders’ equity from transactions and other events and circumstances resulting from non-stockholder sources. The Company’s accumulated other comprehensive income or loss, consisting principally of its interest rate swaps, is reported separately in the accompanying consolidated statements of changes in stockholders’ equity, net of taxes of $3.4 million, ($0.1) million, and $1.1 million as of September 30, 2009, 2008 and 2007, respectively. See Note 19 to the Consolidated Financial Statements.
Segment Reporting—Management evaluates the Company as one reporting segment in the aerospace industry. The Company is engaged in the design, manufacture and sale of highly engineered aircraft components used in aerospace and defense applications through its wholly-owned subsidiaries. Substantially all of the Company’s operations are located within the United States.
Earnings per Share—Basic earnings per share information is determined using the weighted-average number of common shares outstanding during the period. Diluted earnings per share information includes the additional effect of potentially dilutive securities, which comprise stock options outstanding during the period. The dilutive effect of stock options is calculated using the treasury stock method.
Reclassifications—Certain prior year amounts have been reclassified within current liabilities to conform to the current year presentation. The changes were made for disclosure purposes only and did not have an impact on the Consolidated Financial Statements.
| 4. | RECENT ACCOUNTING PRONOUNCEMENTS |
New Accounting Standards Adopted in Fiscal 2009
In June 2009, the Financial Accounting Standards Board (“FASB”) issued authoritative guidance codifying GAAP. While the guidance was not intended to change GAAP, it did change the way the Company references these accounting principles in the Notes to the Consolidated Financial Statements. This guidance was effective for interim and annual reporting periods ending after September 15, 2009. The Company’s adoption of this authoritative guidance as of September 30, 2009 changed how it references GAAP in its disclosures.
In May 2009, the FASB issued authoritative guidance establishing general standards of accounting and disclosures for events that occur after the balance sheet date, but before financial statements are issued.
F-10
Table of Contents
Application of this authoritative guidance was required for interim or annual financial periods ending after June 15, 2009. The Company’s adoption of this guidance during fiscal 2009 resulted in additional disclosures. See Note 21.
In September 2006, the FASB issued authoritative guidance that defines fair value, establishes a framework for measuring fair value in accordance with GAAP, and also expands disclosures about fair value measurements. Fair value is defined as the price that would be received for an asset or paid to transfer a liability (an exit price) in the principal or most advantageous market for the asset or liability in an orderly transaction between market participants on the measurement date. The adoption of this guidance for financial assets and liabilities effective October 1, 2008 did not have a material impact on the Company’s consolidated financial position, results of operations or cash flows. See Note 17.
In addition, at various dates the FASB has issued authoritative guidance requiring additional disclosures about the fair value of financial instruments and derivatives and hedging activities that were effective for the Company during fiscal 2009. The Company’s adoption of this guidance resulted in additional disclosures. See Notes 17 and 18.
New Accounting Standards Not Yet Adopted
In December 2007, the FASB issued authoritative guidance requiring assets and liabilities acquired in a business combination, contingent consideration, and certain acquired contingencies to be measured at their fair values as of the date of acquisition. This guidance also requires that acquisition-related costs and restructuring costs be recognized separately from the business combination. This authoritative guidance is effective for fiscal years beginning after December 15, 2008 and is therefore applicable to the Company effective October 1, 2009. The implementation of this guidance will affect the Company’s results of operations and financial position after its effective date only to the extent it completes applicable business combinations subsequent to the effective date and, therefore, the impact of this guidance cannot be determined prior to the completion of any applicable business combination transactions.
| 5. | EARNINGS PER SHARE |
The following table sets forth the computation of basic and diluted earnings per share (in thousands, except per share data):
| Fiscal Years Ended September 30, | |||||||||
| 2009 | 2008 | 2007 | |||||||
| Basic Earnings Per Share Computation: |
|||||||||
| Net Income |
$ | 162,902 | $ | 133,126 | $ | 88,645 | |||
| Weighted-average common shares outstanding |
48,481 | 47,856 | 45,630 | ||||||
| Basic earnings per share |
$ | 3.36 | $ | 2.78 | $ | 1.94 | |||
| Diluted Earnings Per Share Computation: |
|||||||||
| Net Income |
$ | 162,902 | $ | 133,126 | $ | 88,645 | |||
| Weighted-average common shares outstanding |
48,481 | 47,856 | 45,630 | ||||||
| Effect of dilutive options outstanding |
1,978 | 2,346 | 2,912 | ||||||
| Total weighted-average shares outstanding |
50,459 | 50,202 | 48,542 | ||||||
| Diluted earnings per share |
$ | 3.23 | $ | 2.65 | $ | 1.83 | |||
There were approximately 0.1 million stock options outstanding at September 30, 2009 and 2008 excluded from the diluted earnings per share computation due to the anti-dilutive effect of such options.
F-11
Table of Contents
| 6. | SALES AND TRADE ACCOUNTS RECEIVABLE |
Sales—The Company’s sales and receivables are concentrated in the aerospace industry. TransDigm’s customers include: distributors of aerospace components; commercial airlines, large commercial transport and regional and business aircraft OEMs; various armed forces of the United States and friendly foreign governments; defense OEMs; system suppliers; and various other industrial customers.
Information concerning the Company’s net sales by its major product offerings is as follows for the periods indicated below (in thousands):
| Years Ended September 30, | |||||||||
| 2009 | 2008 | 2007 | |||||||
| Mechanical/electro-mechanical actuators and controls |
$ | 123,193 | $ | 101,381 | $ | 73,940 | |||
| Ignition systems and components |
96,758 | 82,146 | 78,676 | ||||||
| Gear pumps |
71,645 | 66,065 | 63,275 | ||||||
| Power conditioning devices |
57,957 | 50,734 | 42,048 | ||||||
| Specialized valves |
55,357 | 53,251 | 47,434 | ||||||
| AC/DC electric motors |
52,805 | 40,313 | 34,075 | ||||||
| Engineered connectors |
46,697 | 50,770 | 48,773 | ||||||
| Power, lighting and control |
40,291 | 50,694 | 22,549 | ||||||
| Engineered latching and locking devices |
34,663 | 38,742 | 39,360 | ||||||
| Audio systems |
33,112 | 39,728 | 24,499 | ||||||
| Specialized cockpit displays |
30,861 | 26,885 | 16,841 | ||||||
| Rods and locking devices |
29,328 | 29,414 | 27,924 | ||||||
| Lavatory hardware |
27,825 | 33,638 | 30,626 | ||||||
| NiCad batteries/chargers |
25,337 | 23,444 | 23,660 | ||||||
| Elastomers |
21,944 | 26,506 | 19,118 | ||||||
| Generator controls |
13,779 | — | — | ||||||
| Total |
$ | 761,552 | $ | 713,711 | $ | 592,798 | |||
For the year ended September 30, 2009, two customers accounted for approximately 13% and 9% of the Company’s net sales, respectively. For the year ended September 30, 2008, two customers accounted for approximately 14% and 10% of the Company’s net sales, respectively. For the year ended September 30, 2007, two customers accounted for approximately 16% and 11% of the Company’s net sales, respectively. Export sales to customers, primarily in Western Europe, Canada and Asia, were $150.4 million during fiscal 2009, $144.3 million during fiscal 2008 and $143.0 million during fiscal 2007.
Trade Accounts Receivable—Trade accounts receivable consist of the following at September 30 (in thousands):
| 2009 | 2008 | |||||||
| Trade accounts receivable—gross |
$ | 108,894 | $ | 98,378 | ||||
| Allowance for uncollectible accounts |
(2,448 | ) | (2,182 | ) | ||||
| Trade accounts receivable—net |
$ | 106,446 | $ | 96,196 | ||||
Approximately 23% of the Company’s trade accounts receivable at September 30, 2009 was due from two customers. In addition, approximately 19% of the Company’s trade accounts receivable was due from entities that principally operate outside of the United States. Credit is extended based on an evaluation of each customer’s financial condition and collateral is generally not required.
F-12
Table of Contents
| 7. | INVENTORIES |
Inventories consist of the following at September 30 (in thousands):
| 2009 | 2008 | |||||||
| Work-in-progress and finished goods |
$ | 78,423 | $ | 78,467 | ||||
| Raw materials and purchased component parts |
104,729 | 81,750 | ||||||
| Total |
183,152 | 160,217 | ||||||
| Reserve for excess and obsolete inventory |
(17,018 | ) | (15,862 | ) | ||||
| LIFO reserve |
1,632 | (241 | ) | |||||
| Inventories—net |
$ | 167,766 | $ | 144,114 | ||||
| 8. | PROPERTY, PLANT AND EQUIPMENT |
Property, plant and equipment consist of the following at September 30 (in thousands):
| 2009 | 2008 | |||||||
| Land and improvements |
$ | 28,746 | $ | 28,715 | ||||
| Buildings and improvements |
40,087 | 36,127 | ||||||
| Machinery, equipment and other |
85,197 | 77,091 | ||||||
| Construction in progress |
5,686 | 3,828 | ||||||
| Total |
159,716 | 145,761 | ||||||
| Accumulated depreciation |
(62,965 | ) | (49,520 | ) | ||||
| Property, plant and equipment—net |
$ | 96,751 | $ | 96,241 | ||||
| 9. | INTANGIBLE ASSETS |
Intangibles assets subject to amortization consist of the following at September 30 (in thousands):
| 2009 | 2008 | |||||||||||||||||
| Gross Carrying Amount |
Accumulated Amortization |
Net | Gross Carrying Amount |
Accumulated Amortization |
Net | |||||||||||||
| Technology |
$ | 228,884 | $ | 41,276 | $ | 187,608 | $ | 210,625 | $ | 31,369 | $ | 179,256 | ||||||
| Order backlog |
21,340 | 18,914 | 2,426 | 17,520 | 15,698 | 1,822 | ||||||||||||
| License agreement |
9,373 | 3,272 | 6,101 | 9,373 | 2,741 | 6,632 | ||||||||||||
| Other |
1,600 | 970 | 630 | 1,600 | 742 | 858 | ||||||||||||
| Total |
$ | 261,197 | $ | 64,432 | $ | 196,765 | $ | 239,118 | $ | 50,550 | $ | 188,568 | ||||||
Information regarding the amortization expense of amortizable intangible assets is detailed below (in thousands):
Aggregate Amortization Expense:
| Years ended September 30, |
|||
| 2009 |
$ | 13,928 | |
| 2008 |
12,002 | ||
| 2007 |
12,304 | ||
F-13
Table of Contents
Estimated Amortization Expense:
| Years ending September 30, |
|||
| 2010 |
$ | 13,800 | |
| 2011 |
11,400 | ||
| 2012 |
11,400 | ||
| 2013 |
11,400 | ||
| 2014 |
11,400 | ||
The total carrying amount of identifiable intangible assets not subject to amortization consisted of trademarks and trade names in the amount of $176.2 million and $167.6 million at September 30, 2009 and September 30, 2008, respectively. The Company performed its annual impairment test of goodwill and intangible assets that have indefinite lives as of September 30, 2009 and 2008 and determined that no impairment had occurred.
Intangible assets acquired during the year ended September 30, 2009 were as follows (in thousands):
| Cost | Amortization Period | ||||
| Intangible assets not subject to amortization: |
|||||
| Goodwill |
$ | 106,968 | None | ||
| Trademarks and trade names |
8,530 | None | |||
| Intangible assets subject to amortization: |
|||||
| Technology |
16,320 | 22 years | |||
| Order backlog |
3,820 | 1 year | |||
| 20,140 | 18 years | ||||
| Total |
$ | 135,638 | |||
The changes in the carrying amount of goodwill for the fiscal years ended September 30, 2008 and 2009 were as follows (in thousands):
| Balance at September 30, 2007 |
$ | 1,247,870 | ||
| Goodwill acquired during the year (Note 2) |
108,966 | |||
| Other |
(2,062 | ) | ||
| Balance at September 30, 2008 |
1,354,774 | |||
| Goodwill acquired during the year (Note 2) |
106,968 | |||
| Other |
568 | |||
| Balance at September 30, 2009 |
$ | 1,462,310 | ||
| 10. | ACCRUED LIABILITIES |
Accrued liabilities consist of the following at September 30 (in thousands):
| 2009 | 2008 | |||||
| Compensation and related benefits |
$ | 19,071 | $ | 23,826 | ||
| Interest |
11,103 | 10,266 | ||||
| Product warranties |
9,419 | 6,255 | ||||
| Other |
15,479 | 23,015 | ||||
| Total |
$ | 55,072 | $ | 63,362 | ||
F-14
Table of Contents
Product Warranties—The Company provides limited warranties in connection with the sale of its products. The warranty period for products sold varies among the Company’s operations, ranging from 90 days to six years. A provision for the estimated cost to repair or replace the products is recorded at the time of sale and periodically adjusted to reflect actual experience. The following table presents a reconciliation of changes in the product warranty liability for the periods indicated below (in thousands):
| Years Ended September 30, | ||||||||||||
| 2009 | 2008 | 2007 | ||||||||||
| Liability balance at beginning of period |
$ | 6,255 | $ | 4,624 | $ | 2,472 | ||||||
| Product warranty provision |
3,921 | 2,829 | 1,903 | |||||||||
| Warranty costs incurred |
(3,004 | ) | (2,192 | ) | (1,586 | ) | ||||||
| Acquisitions |
2,247 | 994 | 1,835 | |||||||||
| Liability balance at end of period |
$ | 9,419 | $ | 6,255 | $ | 4,624 | ||||||
| 11. | DEBT |
The Company’s long-term debt consists of the following at September 30 (in thousands):
| 2009 | 2008 | |||||
| Term loans |
$ | 780,000 | $ | 780,000 | ||
| 7 3/4% Senior Subordinated Notes due 2014 |
575,000 | 575,000 | ||||
| Premium on 7 3/4% Senior Subordinated Notes due 2014 |
1,761 | 2,230 | ||||
| Total Debt |
1,356,761 | 1,357,230 | ||||
| Current maturities |
— | — | ||||
| Long-term portion |
$ | 1,356,761 | $ | 1,357,230 | ||
Revolving Credit Facility and Term Loans—TransDigm Inc.’s Senior Secured Credit Facility totals $980 million, which consists of (1) a $200 million revolving credit line maturing in June 2012 and (2) a $780 million term loan facility maturing in June 2013. The interest rate on the term loans at September 30, 2009 was 2.3%. At September 30, 2009, the Company had $2.0 million letters of credit outstanding and $198.0 million of borrowings available under the Senior Secured Credit Facility.
The Company has an interest rate swap agreement for a notional amount of $300 million which effectively converts the variable rate interest on the notional amount of the Senior Secured Credit Facility to a fixed rate of 3.04% plus the 2% margin percentage, over the term of the agreement.
The interest rates per annum applicable to the loans under the Senior Secured Credit Facility are equal to either an alternate base rate or an adjusted LIBO rate for one, two, three, or six-month (or to the extent available to each lender, nine or twelve month) interest periods chosen by TransDigm Inc. in each case, plus an applicable margin percentage. The alternate base rate is the greater of (1) Credit Suisse’s prime rate or (2) 50 basis points over the weighted average of rates on overnight Federal funds as published by the Federal Reserve Bank of New York. The adjusted LIBO rate is determined by reference to settlement rates established for deposits in dollars in the London interbank market for a period equal to the interest period of the loan as adjusted for the maximum reserve percentages established by the Board of Governors of the United States Federal Reserve. The applicable margin percentage is a percentage per annum equal to (1) 1.00% for alternate base rate term loans, (2) 2.00% for adjusted LIBO rate term loans, and (3) in the case of alternate base rate revolving loans and adjusted LIBO rate revolving loans, a percentage which varies based on the consolidated leverage ratio of TransDigm Inc. as of the relevant date of determination.
F-15
Table of Contents
Under the terms of the Senior Secured Credit Facility, the Company is required to pay the administrative agent certain fees. In addition, on the last day of each calendar quarter the Company is required to pay a commitment fee of 0.375% of any unused commitments under the revolving credit line and certain other fees in respect of letters of credit that may be outstanding thereunder from time to time.
The term loan under the Senior Secured Credit Facility is subject to mandatory prepayments of Excess Cash Flow (as defined in the agreement) if the Consolidated Leverage Ratio exceeds 4.50 to 1.00 for the Company’s fiscal year or if the term loans do not achieve certain minimum credit ratings at the end of such fiscal year. “Consolidated Leverage Ratio” means the ratio of consolidated total indebtedness to the aggregate amount of EBITDA As Defined, calculated on a pro forma basis. TransDigm’s Consolidated Leverage Ratio was approximately 3.5 to 1.00 at September 30, 2009, thus the Company was not obligated to make the prepayment of the term loans based upon the excess cash flow provision.
The Senior Secured Credit Facility is guaranteed by TD Group and all of TransDigm Inc.’s current and future domestic restricted subsidiaries, and is secured by a first priority security interest in substantially all of the existing and future property and assets, including inventory, equipment, general intangibles, intellectual property, investment property and other personal property (but excluding leasehold interests, deposit accounts and certain other assets) of TransDigm Inc. and all of TransDigm Inc.’s existing and future domestic restricted subsidiaries, and a first priority pledge of the capital stock of TransDigm Inc. and TransDigm Inc.’s domestic subsidiaries and 65% of the voting capital stock of TransDigm Inc.’s foreign subsidiaries.
The agreement also contains a number of restrictive covenants restricting or limiting the ability of TD Group, TransDigm Inc. and TransDigm Inc.’s direct and indirect restricted subsidiaries to, among other things, incur or guarantee additional indebtedness or issue preferred stock, pay distributions on, redeem or repurchase our capital stock or redeem or repurchase our subordinated debt, make investments, sell assets, enter into agreements that restrict distributions or other payments from our restricted subsidiaries to us, incur liens, consolidate, merge or transfer all or substantially all of our assets, engage in transactions with affiliates, create unrestricted subsidiaries, and engage in certain business activities. Such negative covenants are subject to certain exceptions. The negative covenants are substantially identical to the corresponding negative covenants of the 7 3/4% Senior Subordinated Notes. In addition, the Senior Secured Credit Facility includes a financial maintenance covenant requiring that TransDigm comply, on a pro forma basis, with a consolidated secured debt ratio test. Such covenant, however, inures only to the benefit of the revolving lenders. TransDigm is in compliance with all of the covenants contained in the Senior Secured Credit Facility.
Senior Subordinated Notes—The 7 3/4% Senior Subordinated Notes are due 2014 and represent unsecured obligations of TransDigm Inc. ranking subordinate to TransDigm Inc.’s senior debt, as defined in the indenture governing the 7 3/4% Senior Subordinated Notes. Interest under the 7 3/4% Senior Subordinated Notes is payable semi-annually.
The 7 3/4% Senior Subordinated Notes are redeemable by TransDigm after July 15, 2009, in whole or in part, at specified redemption prices, which decline from 105.813% to 100% over the remaining term of the 7 3/4% Senior Subordinated Notes. Prior to July 15, 2009, TransDigm was permitted to redeem specified percentages of the 7 3/4% Senior Subordinated Notes from the proceeds of equity offerings at a redemption price of 107.75%. If a change in control of the Company occurs, the holders of the 7 3/4% Senior Subordinated Notes will have the right to demand that TransDigm redeem the 7 3/4% Senior Subordinated Notes at a purchase price equal to 101% of the principal amount of the 7 3/4% Senior Subordinated Notes plus accrued and unpaid interest. The 7 3/4% Senior Subordinated Notes contain many of the same restrictive covenants included in the Senior Secured Credit Facility. TransDigm is in compliance with all of the covenants contained in the 7 3/4% Senior Subordinated Notes.
F-16
Table of Contents
| 12. | RETIREMENT PLANS |
Defined Benefit Pension Plans—The Company has two non-contributory defined benefit pension plans, which together cover certain union employees. The plans provide benefits of stated amounts for each year of service. The Company’s funding policy is to contribute actuarially determined amounts allowable under Internal Revenue Service regulations. The Company uses a September 30th measurement date for its defined benefit pension plans.
The plan assets as of September 30, 2009 and 2008 were $6.7 million. The Company’s accumulated benefit obligation for its defined benefit pension plans was $8.0 million as of September 30, 2009 and 2008. The total liability recognized at September 30, 2009 and 2008 was $1.4 million and $0.2 million, respectively. The net period pension cost recognized in the Consolidated Statements of Income as of September 30, 2009, 2008 and 2007 was $0.3 million, $0.3 million and $0.2 million, respectively.
Defined Contribution Plans—The Company sponsors certain defined contribution employee savings plans that cover substantially all of the Company’s non-union employees. Under the plans, the Company contributes a percentage of employee compensation and matches a portion of employee contributions. The cost recognized for such contributions for the years ended September 30, 2009, 2008 and 2007 was approximately $2.4 million, $2.2 million and $1.9 million, respectively.
Deferred Compensation Plans—Prior to 2005 the Company maintained two deferred compensation plans of TD Group for certain management personnel of the Company. In 2005, TD Group adopted the TD Holding Corporation 2005 New Management Deferred Compensation Plan (the “New Management Deferred Compensation Plan”) for the benefit of certain management personnel of the Company who were granted new management options under the TD Group 2003 stock option plan. The New Management Deferred Compensation Plan, along with a deferred compensation arrangement for one employee who was not an executive officer, provide that a participant’s deferred compensation account is fully distributed upon the earlier of: December 31, 2008 or a Change in Control (as defined in the plan). The cost of the plans totaled $0.3 million, $2.2 million and $2.0 million for the years ended September 30, 2009, 2008 and 2007, respectively. The obligations under the New Management Deferred Compensation Plan and the additional employee deferred compensation arrangement represent obligations of TD Group and are not guaranteed by TransDigm Inc. or any of its subsidiaries.
| 13. | INCOME TAXES |
The Company’s income tax provision consists of the following for the periods shown below (in thousands):
| Fiscal Years Ended September 30, | |||||||||
| 2009 | 2008 | 2007 | |||||||
| Current |
|||||||||
| Federal |
$ | 71,700 | $ | 60,190 | $ | 39,624 | |||
| State |
7,600 | 5,951 | 7,572 | ||||||
| 79,300 | 66,141 | 47,196 | |||||||
| Deferred |
8,800 | 7,335 | 6,230 | ||||||
| $ | 88,100 | $ | 73,476 | $ | 53,426 | ||||
F-17
Table of Contents
The differences between the income tax provision at the federal statutory income tax rate and the tax provision shown in the accompanying consolidated statements of income for the periods shown below are as follows (in thousands):
| Fiscal Years Ended September 30, | ||||||||||||
| 2009 | 2008 | 2007 | ||||||||||
| Tax at statutory rate of 35% |
$ | 87,851 | $ | 72,311 | $ | 49,741 | ||||||
| State and local income taxes, net of federal benefit |
5,524 | 4,272 | 4,502 | |||||||||
| Domestic manufacturing deduction |
(4,280 | ) | (2,767 | ) | (546 | ) | ||||||
| Research and development credits |
(1,650 | ) | (255 | ) | (1,395 | ) | ||||||
| Other—net |
655 | (85 | ) | 1,124 | ||||||||
| Income tax provision |
$ | 88,100 | $ | 73,476 | $ | 53,426 | ||||||
The components of the deferred taxes consist of the following at September 30 (in thousands):
| 2009 | 2008 | |||||||
| Deferred tax assets: |
||||||||
| Net operating losses (primarily state income taxes) |
$ | 5,723 | $ | 6,031 | ||||
| Inventory |
4,481 | 6,241 | ||||||
| Product warranties |
3,635 | 2,594 | ||||||
| Employee benefits, compensation and other accrued obligations |
3,563 | 6,252 | ||||||
| Interest rate swap |
2,852 | 1,011 | ||||||
| Other accrued liabilities |
7,939 | 5,180 | ||||||
| Total |
28,193 | 27,309 | ||||||
| Less: Valuation allowance |
(5,696 | ) | (5,981 | ) | ||||
| Total deferred tax assets |
22,497 | 21,328 | ||||||
| Deferred tax liabilities: |
||||||||
| Intangible assets |
151,078 | 138,399 | ||||||
| Property, plant and equipment |
14,385 | 13,576 | ||||||
| Other |
1,079 | 1,123 | ||||||
| Total deferred tax liabilities |
166,542 | 153,098 | ||||||
| Total net deferred tax liabilities |
$ | 144,045 | $ | 131,770 | ||||
At September 30, 2009, the Company had net tax loss carryforwards (primarily state income taxes) of approximately $5.7 million that expire in various years from 2012 to 2029. A valuation allowance has been established equal to the amount of the net operating losses that the Company believes will not be utilized.
The Company and its subsidiaries file income tax returns in the U.S. federal jurisdiction, and various state and local jurisdictions. During the fourth quarter of the Company’s fiscal 2009 year, the Internal Revenue Service informed the Company that they will be conducting an examination of the Company’s 2008 fiscal year. In addition, the Company is subject to state and local income tax examinations for fiscal years 2005 through 2009.
F-18
Table of Contents
A reconciliation of the beginning and ending amount of unrecognized tax benefits is as follows (in thousands):
| 2009 | 2008 | ||||||
| Balance at beginning of period |
$ | 2,784 | $ | 3,166 | |||
| Additions based on tax positions related to the current year |
469 | 474 | |||||
| Reductions for tax positions of prior years |
— | (602 | ) | ||||
| Settlements |
— | (254 | ) | ||||
| Balance at end of period |
$ | 3,253 | $ | 2,784 | |||
Unrecognized tax benefits at September 30, 2009 and 2008, the recognition of which would have an effect on the effective tax rate for each fiscal year, amounted to $2.1 million and $1.9 million, respectively. The Company classifies all income tax related interest and penalties as income tax expense. During the fiscal years ended September 30, 2009 and 2008, the Company recognized $0.3 million and $0.1 million, respectively, in income tax interest and penalties. As of September 30, 2009 and 2008, the Company accrued $1.1 million and $0.9 million, respectively, for the potential payment of interest and penalties. The Company anticipates no significant changes to its total unrecognized tax benefits through fiscal 2010.
| 14. | CAPITAL STOCK |
Capital Stock—Authorized capital stock of TD Group consists of 224,400,000 shares of $.01 par value common stock and 149,600,000 shares of $.01 par value preferred stock. The total number of shares of common stock outstanding at September 30, 2009 and 2008 was 49,448,028 and 48,600,848, respectively. There were no shares of preferred stock outstanding at September 30, 2009 and 2008. The terms of the preferred stock have not been established.
On October 23, 2008, the Board of Directors authorized a common share repurchase program, which was announced on October 27, 2008. Under the terms of the program, the Company may purchase up to a maximum aggregate value of $50 million of its shares of common stock. At September 30, 2009, the Company had repurchased under this program 494,100 shares of its common stock at a gross cost of approximately $15.2 million.
| 15. | STOCK-BASED COMPENSATION |
The Company’s stock compensation plans are designed to assist the Company in attracting, retaining, motivating and rewarding key employees, directors or consultants, and promoting the creation of long-term value for stockholders by closely aligning the interests of these individuals with those of the Company’s stockholders. The Company’s stock compensation plans provide for the granting of stock options, restricted stock and other stock-based incentives.
The following table shows the expense recognized by the Company for stock-based compensation (in thousands):
| Fiscal Years Ended September 30, | |||||||||
| 2009 | 2008 | 2007 | |||||||
| Stock option compensation expense: |
|||||||||
| Time vested stock options |
$ | 87 | $ | 464 | $ | 408 | |||
| Performance vested stock options |
5,695 | 3,538 | 3,047 | ||||||
| Restricted stock award amortization |
31 | 33 | 32 | ||||||
| $ | 5,813 | $ | 4,035 | $ | 3,487 | ||||
F-19
Table of Contents
The weighted-average grant date fair value of options granted during the fiscal years ended September 30, 2009, 2008 and 2007 was $10.45, $13.66 and $10.16, respectively.
As of September 30, 2009, there was $23.9 million of total unrecognized compensation cost related to non-vested awards expected to vest, that will be recognized over a weighted-average period of four years.
The fair value of the Company’s employee stock options was estimated at the date of grant using a Black-Scholes-Merton option-pricing model with the following weighted average assumptions for all options granted during the fiscal years ended:
| Fiscal Years Ended September 30, | ||||||
| 2009 | 2008 | 2007 | ||||
| Risk-free interest rate |
1.82% to 2.68% | 4.13% | 4.41% to 4.86% | |||
| Expected life of options |
6 years | 4 years | 4 years | |||
| Expected dividend yield of stock |
— | — | — | |||
| Expected volatility of stock |
35% | 30% | 30% | |||
The risk-free interest rate is based upon the Treasury bond rates as of the grant date. The average expected life of stock-based awards is based on vesting schedules and contractual terms. Expected volatility of stock was calculated using a rate based upon the historical volatility of publicly traded companies in the Company’s peer group in the aerospace industry. This was used because TD Group’s common stock has only been publicly traded since March 2006. The Company historically has not paid regular cash dividends and does not anticipate paying regular cash dividends in future periods; thus, no dividend rate assumption is used.
The total fair value of shares vested during fiscal years ended September 30, 2009, 2008, and 2007 was $4.9 million, $5.1 million and $2.6 million, respectively.
2006 Stock Incentive Plan
In conjunction with the consummation of the initial public offering, a 2006 stock incentive plan was adopted by TD Group. In July 2008, the plan was amended to increase the number of shares available for issuance thereunder. TD Group has reserved 4,119,668 shares of its common stock for issuance to key employees, directors or consultants under the plan. Awards under the plan may be in the form of options, restricted stock or other stock-based awards. Options granted under the plan will expire no later than the tenth anniversary of the applicable date of grant of the options, and will have an exercise price of not less than the fair market value of our common stock on the date of grant. Restricted stock granted under the plan vests over three years.
During the fiscal year ended September 30, 2009, 3,164 shares of commons stock were issued with a weighted-average grant date fair value of $37.89.
Restricted Stock—The following table summarizes activity for restricted stock awards for the fiscal year ended September 30, 2009:
| Number of Shares |
Weighted-Average Grant Date Fair Value | |||||
| Outstanding at September 30, 2008 |
2,971 | $ | 35.86 | |||
| Granted |
— | — | ||||
| Vested |
(1,266 | ) | 32.87 | |||
| Forfeited |
(655 | ) | 37.97 | |||
| Outstanding at September 30, 2009 |
1,050 | $ | 38.16 | |||
F-20
Table of Contents
Performance Vested Stock Options—All of the options granted through September 30, 2009 under the 2006 stock incentive plan have been pursuant to an equity incentive program adopted by the Company in 2008. Under the 2008 equity incentive program, all of the options granted will vest based on the Company’s achievement of established operating performance goals. The following table summarizes the activity, pricing and other information for the Company’s performance vested stock-based award activity during the fiscal year ended September 30, 2009:
| Number of Options |
Weighted-Average Exercise Price Per Option |
Weighted-Average Remaining Contractual Term |
Aggregate Intrinsic Value | ||||||||
| Outstanding at September 30, 2008 |
— | $ | — | ||||||||
| Granted |
2,951,400 | 27.15 | |||||||||
| Exercised |
— | — | |||||||||
| Forfeited |
(128,000 | ) | 27.08 | ||||||||
| Outstanding at September 30, 2009 |
2,823,400 | $ | 27.15 | 9.1 years | $ | 63,978,244 | |||||
| Expected to vest |
2,823,400 | $ | 27.15 | 9.1 years | $ | 63,978,244 | |||||
| Exercisable at September 30, 2009 |
423,510 | $ | 26.55 | 9.1 years | $ | 9,850,843 | |||||
At September 30, 2009, 1,277,271 remaining shares were available for award under TD Group’s 2006 stock incentive plan.
2003 Stock Option Plan
Certain executives and key employees of the Company were granted stock options under TD Group’s 2003 stock option plan. Upon the closing of the acquisition of the Company by Warburg Pincus in 2003, certain employees rolled over certain then-existing options to purchase shares of common stock of TransDigm Holdings. These employees were granted rollover options to purchase an aggregate of 3,870,152 shares of common stock of TD Group (after giving effect to the 149.60 for 1.00 stock split effected on March 14, 2006). All rollover options granted were fully vested on the date of grant. In addition to shares of common stock reserved for issuance upon the exercise of rollover options, an aggregate of 5,469,301 shares of TD Group’s common stock were reserved for issuance upon the exercise of new management options. In general, approximately 20% of all new management options vested based on employment service or a change in control. These time vested options have a graded vesting schedule of up to four years. Approximately 80% of all new management options vested (i) based upon the satisfaction of specified performance criteria, which is annual and cumulative EBITDA As Defined targets through 2008, or (ii) upon the occurrence of a change in control if the Investor Group (defined as Warburg Pincus and the other initial investors in TD Group) received a minimum specified rate of return. Unless terminated earlier, the options expire ten years from the date of grant. All of the outstanding performance options were vested as of September 30, 2009.
TD Group has reserved a total of 9,339,453 shares of its common stock for issuance to the Company’s employees under the plan, 9,262,596 of which had been issued as of September 30, 2009.
F-21
Table of Contents
Time Vested Stock Options—The following table summarizes activity, pricing and other information for the Company’s time vested stock-based award activity during the fiscal year ended September 30, 2009:
| Number of Options |
Weighted-Average Exercise Price Per Option |
Weighted-Average Remaining Contractual Term |
Aggregate Intrinsic Value | ||||||||
| Outstanding at September 30, 2008 |
829,007 | $ | 10.43 | ||||||||
| Granted |
— | — | |||||||||
| Exercised |
(43,895 | ) | 13.17 | ||||||||
| Forfeited |
— | — | |||||||||
| Outstanding at September 30, 2009 |
785,112 | $ | 10.27 | 4.5 years | $ | 31,043,328 | |||||
| Exercisable at September 30, 2009 |
785,112 | $ | 10.27 | 4.5 years | $ | 31,043,328 | |||||
Performance Vested Stock Options—The following table summarizes the activity, pricing and other information for the Company’s performance vested stock-based award activity during the fiscal year ended September 30, 2009:
| Number of Options |
Weighted-Average Exercise Price Per Option |
Weighted-Average Remaining Contractual Term |
Aggregate Intrinsic Value | ||||||||
| Outstanding at September 30, 2008 |
3,266,924 | $ | 11.42 | ||||||||
| Granted |
— | — | |||||||||
| Exercised |
(680,554 | ) | 10.98 | ||||||||
| Forfeited |
(800 | ) | 33.50 | ||||||||
| Outstanding at September 30, 2009 |
2,585,570 | $ | 11.54 | 4.8 years | $ | 98,949,764 | |||||
| Exercisable at September 30, 2009 |
2,585,570 | $ | 11.54 | 4.8 years | $ | 98,949,764 | |||||
Rollover Option Awards—The following table summarizes the activity, pricing and other information for the Company’s rollover option award activity during the fiscal year ended September 30, 2009:
| Number of Options |
Weighted-Average Exercise Price Per Option |
Weighted-Average Remaining Contractual Term |
Aggregate Intrinsic Value | ||||||||
| Outstanding at September 30, 2008 |
293,096 | $ | 3.30 | ||||||||
| Granted |
— | — | |||||||||
| Exercised |
(118,301 | ) | 2.61 | ||||||||
| Forfeited |
— | — | |||||||||
| Outstanding at September 30, 2009 |
174,795 | $ | 3.76 | 2.4 years | $ | 8,049,310 | |||||
| Exercisable at September 30, 2009 |
174,795 | $ | 3.76 | 2.4 years | $ | 8,049,310 | |||||
The total intrinsic value of time, performance and rollover options exercised during the fiscal years ended September 30, 2009, 2008 and 2007 was $26.4 million, $54.4 million and $73.0 million, respectively.
Options Not Pursuant to a Shareholder Approved Plan
In addition to the stock options issued under the 2003 stock option plan and 2006 stock incentive plan, two members of the Company’s Board of Directors were also been granted stock options of TD Group. Of the 134,040 options issued under these agreements, 108,096 remain outstanding with an exercise price of $6.68. All of such options were vested as of September 30, 2009.
F-22
Table of Contents
Dividend Equivalent Plans
Pursuant to the Third Amended and Restated TransDigm Group Incorporated 2003 Stock Option Plan Dividend Equivalent Plan and the Second Amended and Restated TransDigm Group Incorporated 2006 Stock Incentive Plan Dividend Equivalent Plan, all of the options granted under the 2003 stock option plan and the 2006 stock incentive plan are entitled to certain dividend equivalent payments in the event of the declaration of a dividend by the Company. Options granted outside the plans to directors are also entitled to comparable dividend equivalents. No dividends had been declared prior to September 30, 2009 and so no dividend equivalents had been paid. The Company declared a special dividend of $7.65 per share in October 2009. See Note 21. As a result, holders of outstanding options received dividend equivalents of approximately $30.3 million in the aggregate. In addition, to the extent unvested options outstanding on the dividend declaration date vest, such options will be entitled to receive a dividend equivalent payment in the amount of $7.65 per share at the time of vesting.
| 16. | LEASES |
TransDigm leases certain manufacturing facilities with annual rental payments required through December 2015. One of the facility leases is with a company in which one of our employees is an owner. The term of the lease is through December 2014, although it may be terminated early under certain circumstances. The base rental for the property is $0.6 million per year. TransDigm also leases office space for its corporate headquarters. The office space leases require annual rental payments of approximately $0.1 million per year through fiscal 2011.
TransDigm also has commitments under operating leases for vehicles and equipment. Rental expense during the years ended September 30, 2009, 2008 and 2007 was $3.3 million, $3.2 million and $2.8 million, respectively. Future minimum rental commitments at September 30, 2009 under operating leases having initial or remaining non-cancelable lease terms exceeding one year are $3.7 million in fiscal 2010, $3.3 million in fiscal 2011, $2.9 million in fiscal 2012, $2.0 million in fiscal 2013, $1.7 million in fiscal 2014, and $0.5 million thereafter.
| 17. | FAIR VALUE MEASUREMENTS |
The following tables present our assets and liabilities that are measured at fair value on a recurring basis and are categorized using the fair value hierarchy. The fair value hierarchy has three levels based on the reliability of the inputs used to determine fair value. Level 1 inputs are quoted prices (unadjusted) in active markets for identical assets or liabilities. Level 2 inputs are quoted prices for similar assets and liabilities in active markets, quoted prices for identical or similar assets or liabilities in markets that are not active, and inputs (other than quoted prices) that are observable for the asset or liability, either directly or indirectly. Level 3 inputs are unobservable inputs for the asset or liability. A financial asset or liability’s classification within the hierarchy is determined based on the lowest level input that is significant to the fair value measurement.
The following summarizes the carrying amounts and fair values of financial instruments as of September 30 (in thousands):
| 2009 | 2008 | |||||||||||||
| Level | Carrying Amount |
Fair Value | Carrying Amount |
Fair Value | ||||||||||
| Assets: |
||||||||||||||
| Cash and cash equivalents |
1 | $ | 190,167 | $ | 190,167 | $ | 159,062 | $ | 159,062 | |||||
| Interest rate swap(1) |
2 | — | — | 3,253 | 3,253 | |||||||||
| Liabilities: |
||||||||||||||
| Long-term debt: |
||||||||||||||
| Term loans |
2 | 780,000 | 749,000 | 780,000 | 725,000 | |||||||||
| 7 3/4% Senior Subordinated Notes |
2 | 576,761 | 571,000 | 577,230 | 529,000 | |||||||||
| Interest rate swap(2) |
2 | 7,787 | 7,787 | 2,719 | 2,719 | |||||||||
F-23
Table of Contents
| (1) | Included in Other non-current assets on the Consolidated Balance Sheets. |
| (2) | Included in Other non-current liabilities on the Consolidated Balance Sheets. |
Interest rate swaps are measured at fair value using quoted market prices for the swap interest rate indexes over the term of the swap discounted to present value versus the fixed rate of the contract. The estimated fair value of the Company’s term loans was based on information provided by the agent under the Company’s Senior Secured Credit Facility. The estimated fair value of the Company’s 7 3/4% Senior Subordinated Notes was based upon quoted market prices.
| 18. | DERIVATIVES AND HEDGING ACTIVITIES |
The Company is exposed to, among other things, the impact of changes in interest rates in the normal course of business. The Company’s risk management program is designed to manage the exposure and volatility arising from these risks, and utilizes derivative financial instruments to offset a portion of these risks. The Company uses derivative financial instruments only to the extent necessary to hedge identified business risks, and does not enter into such transactions for trading purposes. The Company generally does not require collateral or other security with counterparties to these financial instruments and is therefore subject to credit risk in the event of nonperformance; however, the Company monitors credit risk and currently does not anticipate nonperformance by other parties.
Interest rate swap agreements are used to manage interest rate risk associated with floating-rate borrowings under the Senior Secured Credit Facility of $780 million. The interest rate swap agreements utilized by the Company effectively modify the Company’s exposure to interest rate risk by converting a portion of the Company’s floating-rate debt to a fixed rate basis through the expiration dates of the agreements, thereby reducing the impact of interest rate changes on future interest expense. These agreements involve the receipt of floating rate amounts in exchange for fixed rate interest payments over the life of the agreements without an exchange of the underlying principal amounts. These derivative instruments qualify as effective cash flow hedges under GAAP. For these hedges, the effective portion of the gain or loss from the financial instrument is initially reported as a component of accumulated other comprehensive income (loss) in stockholders’ equity and subsequently reclassified into earnings in the same line as the hedged item in the same period or periods during which the hedged item affects earnings.
At September 30, 2009, one agreement was in place to swap variable interest rates on the Senior Secured Credit Facility for fixed interest rates for the notional amount of $300 million through March 23, 2011. This interest rate swap agreement effectively converts the variable rate interest on the notional amount of the Senior Secured Credit Facility to a fixed rate of 3.04% plus the 2% margin percentage, over the term of the agreement.
An additional interest rate swap agreement on a notional amount of $150 million expired on June 23, 2009. This interest rate swap agreement effectively converted the variable rate interest on the notional amount of the Senior Secured Credit Facility to a fixed rate of 5.63% plus the 2% margin percentage, over the term of the agreement.
The net after-tax derivative loss included in accumulated other comprehensive income (loss) is expected to be reclassified into interest expense in conjunction with the recognition of interest payments on the notional amounts of the swap contract, with a net $3.6 million of after-tax net loss expected to be recognized in interest expense within the next year.
F-24
Table of Contents
| 19. | ACCUMULATED OTHER COMPREHENSIVE INCOME (LOSS) |
Accumulated other comprehensive income (loss) consists of the following at September 30 (in thousands):
| 2009 | 2008 | |||||||
| Interest rate swap agreements, |
$ | (4,890 | ) | $ | 416 | |||
| Unamortized pension benefits, |
(628 | ) | (7 | ) | ||||
| Other |
9 | 36 | ||||||
| Total |
$ | (5,509 | ) | $ | 445 | |||
| 20. | QUARTERLY FINANCIAL DATA (UNAUDITED) |
| First Quarter Ended December 27, 2008 |
Second Quarter Ended March 28, 2009 |
Third Quarter Ended June 27, 2009 |
Fourth Quarter Ended September 30, 2009 | |||||||||
| (in thousands, except per share amounts) | ||||||||||||
| Year Ended September 30, 2009 |
||||||||||||
| Net sales |
$ | 181,276 | $ | 193,047 | $ | 189,875 | $ | 197,354 | ||||
| Gross profit |
104,288 | 108,811 | 107,851 | 108,396 | ||||||||
| Net income |
39,599 | 40,304 | 41,388 | 41,611 | ||||||||
| Basic earnings per share |
$ | 0.81 | $ | 0.84 | $ | 0.86 | $ | 0.85 | ||||
| Diluted earnings per share |
$ | 0.78 | $ | 0.80 | $ | 0.82 | $ | 0.82 | ||||
| First Quarter Ended December 29, 2007 |
Second Quarter Ended March 29, 2008 |
Third Quarter Ended June 28, 2008 |
Fourth Quarter Ended September 30, 2008 | |||||||||
| (in thousands, except per share amounts) | ||||||||||||
| Year Ended September 30, 2008 |
||||||||||||
| Net sales |
$ | 163,136 | $ | 175,285 | $ | 186,052 | $ | 189,238 | ||||
| Gross profit |
88,092 | 93,919 | 100,482 | 103,438 | ||||||||
| Net income |
26,968 | 32,170 | 35,999 | 37,989 | ||||||||
| Basic earnings per share |
$ | 0.57 | $ | 0.68 | $ | 0.75 | $ | 0.78 | ||||
| Diluted earnings per share |
$ | 0.54 | $ | 0.64 | $ | 0.72 | $ | 0.75 | ||||
| 21. | SUBSEQUENT EVENTS |
In October 2009 TD Group’s wholly owned subsidiary, TransDigm Inc., completed the offering of $425 million of 7 3/4% Senior Subordinated Notes due 2014 at a discount, receiving net proceeds of $412.8 million. TransDigm Inc. used the net proceeds from the offering of the notes to make a cash distribution to TD Group which, in turn, made a special cash dividend to its stockholders of $7.65 per share and cash dividend equivalent payments (“Dividend Equivalent Payments”) to holders of options to purchase its common stock. The special cash dividend amounting to $374.6 million was paid on October 26, 2009 and the Dividend Equivalent Payments amounting to approximately $30.3 million were paid in October and November 2009.
The Company has evaluated the period beginning September 30, 2009 through November 24, 2009, the date the Company’s annual financial statements were issued, and concluded there were no other events or transactions occurring during this period that required recognition or additional disclosure in the financial statements.
F-25
Table of Contents
| 22. | SUPPLEMENTAL GUARANTOR INFORMATION |
TransDigm’s 7 3/4% Senior Subordinated Notes (see Note 11) are jointly and severally guaranteed, on a senior subordinated basis, by TD Group and TransDigm Inc.’s Domestic Restricted Subsidiaries, as defined therein. The following supplemental condensed consolidating financial information presents, in separate columns, the balance sheets of the Company as of September 30, 2009 and 2008 and its statements of income and cash flows for the fiscal years ended September 30, 2009, 2008 and 2007 for (i) TransDigm Group on a parent only basis with its investment in subsidiaries recorded under the equity method, (ii) TransDigm Inc. including its directly owned operations and non-operating entities, (iii) the Subsidiary Guarantors on a combined basis, and (iv) the Company on a consolidated basis.
F-26
Table of Contents
TRANSDIGM GROUP INCORPORATED
CONDENSED CONSOLIDATING BALANCE SHEET
AS OF SEPTEMBER 30, 2009
(Amounts in Thousands)
| TransDigm Group |
TransDigm Inc. |
Subsidiary Guarantors |
Eliminations | Total Consolidated | ||||||||||||
| ASSETS |
||||||||||||||||
| CURRENT ASSETS: |
||||||||||||||||
| Cash and cash equivalents |
$ | 15,388 | $ | 173,630 | $ | 1,149 | $ | — | $ | 190,167 | ||||||
| Trade accounts receivable—Net |
— | 10,519 | 96,498 | (571 | ) | 106,446 | ||||||||||
| Inventories |
— | 19,727 | 148,264 | (225 | ) | 167,766 | ||||||||||
| Deferred income taxes |
— | 18,700 | — | — | 18,700 | |||||||||||
| Prepaid expenses and other |
— | 5,097 | 6,578 | — | 11,675 | |||||||||||
| Total current assets |
15,388 | 227,673 | 252,489 | (796 | ) | 494,754 | ||||||||||
| INVESTMENT IN SUBSIDIARIES AND INTERCOMPANY BALANCES |
803,774 | 2,124,389 | 668,574 | (3,596,737 | ) | — | ||||||||||
| PROPERTY, PLANT AND EQUIPMENT—Net |
— | 15,176 | 81,575 | — | 96,751 | |||||||||||
| GOODWILL |
— | 68,201 | 1,394,109 | — | 1,462,310 | |||||||||||
| TRADEMARKS AND TRADE NAMES |
— | 19,376 | 156,780 | — | 176,156 | |||||||||||
| OTHER INTANGIBLE ASSETS—Net |
— | 9,980 | 186,785 | — | 196,765 | |||||||||||
| DEBT ISSUE COSTS—Net |
— | 24,089 | — | — | 24,089 | |||||||||||
| OTHER |
— | 2,134 | 1,481 | — | 3,615 | |||||||||||
| TOTAL ASSETS |
$ | 819,162 | $ | 2,491,018 | $ | 2,741,793 | $ | (3,597,533 | ) | $ | 2,454,440 | |||||
| LIABILITIES AND STOCKHOLDERS’ EQUITY |
||||||||||||||||
| CURRENT LIABILITIES: |
||||||||||||||||
| Accounts payable |
$ | — | $ | 17,595 | $ | 27,655 | $ | (570 | ) | $ | 44,680 | |||||
| Accrued liabilities |
— | 19,860 | 35,212 | — | 55,072 | |||||||||||
| Total current liabilities |
— | 37,455 | 62,867 | (570 | ) | 99,752 | ||||||||||
| LONG-TERM DEBT—Less current portion |
— | 1,356,761 | — | — | 1,356,761 | |||||||||||
| DEFERRED INCOME TAXES |
— | 162,745 | — | — | 162,745 | |||||||||||
| OTHER NON-CURRENT LIABILITIES |
— | 12,281 | 3,739 | — | 16,020 | |||||||||||
| Total liabilities |
— | 1,569,242 | 66,606 | (570 | ) | 1,635,278 | ||||||||||
| STOCKHOLDERS’ EQUITY |
819,162 | 921,776 | 2,675,187 | (3,596,963 | ) | 819,162 | ||||||||||
| TOTAL LIABILITIES AND STOCKHOLDERS’ EQUITY |
$ | 819,162 | $ | 2,491,018 | $ | 2,741,793 | $ | (3,597,533 | ) | $ | 2,454,440 | |||||
F-27
Table of Contents
TRANSDIGM GROUP INCORPORATED
CONDENSED CONSOLIDATING BALANCE SHEET
AS OF SEPTEMBER 30, 2008
(Amounts in Thousands)
| TransDigm Group |
TransDigm Inc. |
Subsidiary Guarantors |
Eliminations | Total Consolidated | ||||||||||||||
| ASSETS |
||||||||||||||||||
| CURRENT ASSETS: |
||||||||||||||||||
| Cash and cash equivalents |
$ | 1,552 | $ | 160,680 | $ | (3,170 | ) | $ | — | $ | 159,062 | |||||||
| Trade accounts receivable—Net |
— | 11,668 | 84,753 | (225 | ) | 96,196 | ||||||||||||
| Inventories |
— | 19,028 | 125,290 | (204 | ) | 144,114 | ||||||||||||
| Deferred income taxes |
— | 19,902 | — | — | 19,902 | |||||||||||||
| Prepaid expenses and other |
— | 2,680 | 1,480 | — | 4,160 | |||||||||||||
| Total current assets |
1,552 | 213,958 | 208,353 | (429 | ) | 423,434 | ||||||||||||
| INVESTMENT IN SUBSIDIARIES AND INTERCOMPANY BALANCES |
652,681 | 1,993,525 | 430,757 | (3,076,963 | ) | — | ||||||||||||
| PROPERTY, PLANT AND EQUIPMENT—Net |
— | 14,495 | 81,746 | — | 96,241 | |||||||||||||
| GOODWILL |
— | 40,320 | 1,314,454 | — | 1,354,774 | |||||||||||||
| TRADEMARKS AND TRADE NAMES |
— | 19,376 | 148,250 | — | 167,626 | |||||||||||||
| OTHER INTANGIBLE ASSETS—Net |
— | 10,565 | 178,003 | — | 188,568 | |||||||||||||
| DEBT ISSUE COSTS—Net |
— | 19,309 | — | — | 19,309 | |||||||||||||
| OTHER |
— | 5,517 | 352 | — | 5,869 | |||||||||||||
| TOTAL ASSETS |
$ | 654,233 | $ | 2,317,065 | $ | 2,361,915 | $ | (3,077,392 | ) | $ | 2,255,821 | |||||||
| LIABILITIES AND STOCKHOLDERS’ EQUITY |
||||||||||||||||||
| CURRENT LIABILITIES: |
||||||||||||||||||
| Accounts payable |
$ | — | $ | 6,546 | $ | 18,817 | $ | (223 | ) | $ | 25,140 | |||||||
| Accrued liabilities |
5,939 | 22,255 | 35,168 | — | 63,362 | |||||||||||||
| Total current liabilities |
5,939 | 28,801 | 53,985 | (223 | ) | 88,502 | ||||||||||||
| LONG-TERM DEBT—Less current portion |
— | 1,357,230 | — | — | 1,357,230 | |||||||||||||
| DEFERRED INCOME TAXES |
(5,606 | ) | 157,278 | — | — | 151,672 | ||||||||||||
| OTHER NON-CURRENT LIABILITIES |
— | 3,073 | 1,444 | — | 4,517 | |||||||||||||
| Total liabilities |
333 | 1,546,382 | 55,429 | (223 | ) | 1,601,921 | ||||||||||||
| STOCKHOLDERS’ EQUITY |
653,900 | 770,683 | 2,306,486 | (3,077,169 | ) | 653,900 | ||||||||||||
| TOTAL LIABILITIES AND STOCKHOLDERS’ EQUITY |
$ | 654,233 | $ | 2,317,065 | $ | 2,361,915 | $ | (3,077,392 | ) | $ | 2,255,821 | |||||||
F-28
Table of Contents
TRANSDIGM GROUP INCORPORATED
CONDENSED CONSOLIDATING STATEMENT OF INCOME
FOR THE YEAR ENDED SEPTEMBER 30, 2009
(Amounts in Thousands)
| TransDigm Group |
TransDigm Inc. |
Subsidiary Guarantors |
Eliminations | Total Consolidated |
|||||||||||||||
| NET SALES |
$ | — | $ | 68,660 | $ | 694,730 | $ | (1,838 | ) | $ | 761,552 | ||||||||
| COST OF SALES |
— | 38,647 | 295,077 | (1,518 | ) | 332,206 | |||||||||||||
| GROSS PROFIT |
— | 30,013 | 399,653 | (320 | ) | 429,346 | |||||||||||||
| OPERATING EXPENSES: |
|||||||||||||||||||
| Selling and administrative |
— | 27,010 | 53,308 | (300 | ) | 80,018 | |||||||||||||
| Amortization of intangibles |
— | 624 | 13,304 | — | 13,928 | ||||||||||||||
| Total operating expenses |
— | 27,634 | 66,612 | (300 | ) | 93,946 | |||||||||||||
| INCOME FROM OPERATIONS |
— | 2,379 | 333,041 | (20 | ) | 335,400 | |||||||||||||
| OTHER INCOME (EXPENSES) |
|||||||||||||||||||
| Interest expense—Net |
— | (79,880 | ) | (4,518 | ) | — | (84,398 | ) | |||||||||||
| Equity in income of subsidiaries |
162,902 | 213,190 | — | (376,092 | ) | — | |||||||||||||
| INCOME BEFORE INCOME TAXES |
162,902 | 135,689 | 328,523 | (376,112 | ) | 251,002 | |||||||||||||
| INCOME TAX PROVISION (BENEFIT) |
— | (27,213 | ) | 115,313 | — | 88,100 | |||||||||||||
| NET INCOME |
$ | 162,902 | $ | 162,902 | $ | 213,210 | $ | (376,112 | ) | $ | 162,902 | ||||||||
F-29
Table of Contents
TRANSDIGM GROUP INCORPORATED
CONDENSED CONSOLIDATING STATEMENT OF INCOME
FOR THE YEAR ENDED SEPTEMBER 30, 2008
(Amounts in Thousands)
| TransDigm Group |
TransDigm Inc. |
Subsidiary Guarantors |
Eliminations | Total Consolidated |
|||||||||||||||
| NET SALES |
$ | — | $ | 77,319 | $ | 638,256 | $ | (1,864 | ) | $ | 713,711 | ||||||||
| COST OF SALES |
— | 46,140 | 283,298 | (1,658 | ) | 327,780 | |||||||||||||
| GROSS PROFIT |
— | 31,179 | 354,958 | (206 | ) | 385,931 | |||||||||||||
| OPERATING EXPENSES: |
|||||||||||||||||||
| Selling and administrative |
— | 24,005 | 50,645 | — | 74,650 | ||||||||||||||
| Amortization of intangibles |
— | 624 | 11,378 | — | 12,002 | ||||||||||||||
| Total operating expenses |
— | 24,629 | 62,023 | — | 86,652 | ||||||||||||||
| INCOME FROM OPERATIONS |
— | 6,550 | 292,935 | (206 | ) | 299,279 | |||||||||||||
| OTHER INCOME (EXPENSES) |
|||||||||||||||||||
| Interest expense—Net |
— | (86,382 | ) | (6,295 | ) | — | (92,677 | ) | |||||||||||
| Equity in income of subsidiaries |
133,126 | 184,391 | — | (317,517 | ) | — | |||||||||||||
| INCOME BEFORE INCOME TAXES |
133,126 | 104,559 | 286,640 | (317,723 | ) | 206,602 | |||||||||||||
| INCOME TAX PROVISION (BENEFIT) |
— | (28,567 | ) | 102,043 | — | 73,476 | |||||||||||||
| NET INCOME |
$ | 133,126 | $ | 133,126 | $ | 184,597 | $ | (317,723 | ) | $ | 133,126 | ||||||||
F-30
Table of Contents
TRANSDIGM GROUP INCORPORATED
CONDENSED CONSOLIDATING STATEMENT OF INCOME
FOR THE YEAR ENDED SEPTEMBER 30, 2007
(Amounts in Thousands)
| TransDigm Group |
TransDigm Inc. |
Subsidiary Guarantors |
Eliminations | Total Consolidated |
|||||||||||||||
| NET SALES |
$ | — | $ | 67,891 | $ | 524,907 | $ | — | $ | 592,798 | |||||||||
| COST OF SALES |
— | 40,750 | 243,016 | — | 283,766 | ||||||||||||||
| GROSS PROFIT |
— | 27,141 | 281,891 | — | 309,032 | ||||||||||||||
| OPERATING EXPENSES: |
|||||||||||||||||||
| Selling and administrative |
— | 24,256 | 38,634 | — | 62,890 | ||||||||||||||
| Amortization of intangibles |
— | 624 | 11,680 | — | 12,304 | ||||||||||||||
| Total operating expenses |
— | 24,880 | 50,314 | — | 75,194 | ||||||||||||||
| INCOME (LOSS) FROM OPERATIONS |
— | 2,261 | 231,577 | — | 233,838 | ||||||||||||||
| OTHER INCOME (EXPENSES) |
|||||||||||||||||||
| Interest expense—Net |
— | (70,863 | ) | (20,904 | ) | — | (91,767 | ) | |||||||||||
| Equity in income of subsidiaries |
88,645 | 131,460 | — | (220,105 | ) | — | |||||||||||||
| INCOME BEFORE INCOME TAXES |
88,645 | 62,858 | 210,673 | (220,105 | ) | 142,071 | |||||||||||||
| INCOME TAX PROVISION (BENEFIT) |
— | (25,787 | ) | 79,213 | — | 53,426 | |||||||||||||
| NET INCOME |
$ | 88,645 | $ | 88,645 | $ | 131,460 | $ | (220,105 | ) | $ | 88,645 | ||||||||
F-31
Table of Contents
TRANSDIGM GROUP INCORPORATED
CONDENSED CONSOLIDATING STATEMENT OF CASH FLOWS
FOR THE YEAR ENDED SEPTEMBER 30, 2009
(Amounts in Thousands)
| TransDigm Group |
TransDigm Inc. |
Subsidiary Guarantors |
Eliminations | Total Consolidated |
|||||||||||||||
| OPERATING ACTIVITIES |
$ | (6,428 | ) | $ | (22,930 | ) | $ | 226,470 | $ | — | $ | 197,112 | |||||||
| INVESTING ACTIVITIES: |
|||||||||||||||||||
| Capital expenditures |
— | (2,370 | ) | (10,785 | ) | — | (13,155 | ) | |||||||||||
| Acquisitions of businesses |
— | (155,233 | ) | — | — | (155,233 | ) | ||||||||||||
| Net cash used in investing activities |
— | (157,603 | ) | (10,785 | ) | — | (168,388 | ) | |||||||||||
| FINANCING ACTIVITIES: |
|||||||||||||||||||
| Changes in intercompany activities |
17,883 | 193,483 | (211,366 | ) | — | — | |||||||||||||
| Proceeds from exercise of stock options |
8,345 | — | — | — | 8,345 | ||||||||||||||
| Excess tax benefit from exercise of stock options |
9,278 | — | — | — | 9,278 | ||||||||||||||
| Purchase of treasury stock |
(15,242 | ) | (15,242 | ) | |||||||||||||||
| Net cash provided by (used in) financing activities |
20,264 | 193,483 | (211,366 | ) | — | 2,381 | |||||||||||||
| INCREASE (DECREASE) IN CASH AND CASH EQUIVALENTS |
13,836 | 12,950 | 4,319 | — | 31,105 | ||||||||||||||
| CASH AND CASH EQUIVALENTS— |
|||||||||||||||||||
| Beginning of year |
1,552 | 160,680 | (3,170 | ) | — | 159,062 | |||||||||||||
| CASH AND CASH EQUIVALENTS— |
|||||||||||||||||||
| End of year |
$ | 15,388 | $ | 173,630 | $ | 1,149 | $ | — | $ | 190,167 | |||||||||
F-32
Table of Contents
TRANSDIGM GROUP INCORPORATED
CONDENSED CONSOLIDATING STATEMENT OF CASH FLOWS
FOR THE YEAR ENDED SEPTEMBER 30, 2008
(Amounts in Thousands)
| TransDigm Group |
TransDigm Inc. |
Subsidiary Guarantors |
Eliminations | Total Consolidated |
|||||||||||||||
| OPERATING ACTIVITIES |
$ | 2,041 | $ | (35,261 | ) | $ | 222,855 | $ | — | $ | 189,635 | ||||||||
| INVESTING ACTIVITIES: |
|||||||||||||||||||
| Capital expenditures |
— | (1,754 | ) | (9,130 | ) | — | (10,884 | ) | |||||||||||
| Acquisitions of businesses |
— | (154,160 | ) | — | — | (154,160 | ) | ||||||||||||
| Net cash used in investing activities |
— | (155,914 | ) | (9,130 | ) | — | (165,044 | ) | |||||||||||
| FINANCING ACTIVITIES: |
|||||||||||||||||||
| Changes in intercompany activities |
(40,131 | ) | 254,075 | (213,944 | ) | — | — | ||||||||||||
| Proceeds from exercise of stock options |
9,769 | — | — | — | 9,769 | ||||||||||||||
| Excess tax benefit from exercise of stock options |
18,756 | — | — | — | 18,756 | ||||||||||||||
| Net cash provided by (used in) financing activities |
(11,606 | ) | 254,075 | (213,944 | ) | — | 28,525 | ||||||||||||
| INCREASE (DECREASE) IN CASH AND CASH EQUIVALENTS |
(9,565 | ) | 62,900 | (219 | ) | — | 53,116 | ||||||||||||
| CASH AND CASH EQUIVALENTS— |
|||||||||||||||||||
| Beginning of year |
11,117 | 97,780 | (2,951 | ) | — | 105,946 | |||||||||||||
| CASH AND CASH EQUIVALENTS— |
|||||||||||||||||||
| End of year |
$ | 1,552 | $ | 160,680 | $ | (3,170 | ) | $ | — | $ | 159,062 | ||||||||
F-33
Table of Contents
TRANSDIGM GROUP INCORPORATED
CONDENSED CONSOLIDATING STATEMENT OF CASH FLOWS
FOR THE YEAR ENDED SEPTEMBER 30, 2007
(Amounts in Thousands)
| TransDigm Group |
TransDigm Inc. |
Subsidiary Guarantors |
Eliminations | Total Consolidated |
|||||||||||||||
| OPERATING ACTIVITIES |
$ | 1,656 | $ | (6,452 | ) | $ | 117,232 | $ | — | $ | 112,436 | ||||||||
| INVESTING ACTIVITIES: |
|||||||||||||||||||
| Capital expenditures |
— | (2,513 | ) | (7,745 | ) | — | (10,258 | ) | |||||||||||
| Acquisitions of businesses |
— | (511,407 | ) | — | — | (511,407 | ) | ||||||||||||
| Net cash used in investing activities |
— | (513,920 | ) | (7,745 | ) | — | (521,665 | ) | |||||||||||
| FINANCING ACTIVITIES: |
|||||||||||||||||||
| Changes in intercompany activities |
(24,220 | ) | 133,710 | (109,490 | ) | — | — | ||||||||||||
| Proceeds from exercise of stock options |
8,450 | — | — | — | 8,450 | ||||||||||||||
| Excess tax benefit from exercise of stock options |
23,627 | — | — | — | 23,627 | ||||||||||||||
| Borrowings under Senior Secured Credit Facility—net of fees |
— | 125,423 | — | — | 125,423 | ||||||||||||||
| Proceeds from 7 3/4% Senior Subordinated Notes—net of fees |
— | 296,458 | — | — | 296,458 | ||||||||||||||
| Net cash provided by (used in) financing activities |
7,857 | 555,591 | (109,490 | ) | — | 453,958 | |||||||||||||
| INCREASE (DECREASE) IN CASH AND CASH EQUIVALENTS |
9,513 | 35,219 | (3 | ) | — | 44,729 | |||||||||||||
| CASH AND CASH EQUIVALENTS— |
|||||||||||||||||||
| Beginning of year |
1,604 | 62,561 | (2,948 | ) | — | 61,217 | |||||||||||||
| CASH AND CASH EQUIVALENTS— |
|||||||||||||||||||
| End of year |
$ | 11,117 | $ | 97,780 | $ | (2,951 | ) | $ | — | $ | 105,946 | ||||||||
F-34
Table of Contents
VALUATION AND QUALIFYING ACCOUNTS
FOR THE YEARS ENDED SEPTEMBER 30, 2009, 2008, AND 2007
(Amounts in Thousands)
| Column A | Column B | Column C Additions |
Column D | Column E | |||||||||||
| Description |
Balance at Beginning of Period |
Charged to Costs and Expenses |
Acquisitions | Deductions from Reserve(1) |
Balance at End of Period | ||||||||||
| Year Ended September 30, 2009 |
|||||||||||||||
| Allowance for doubtful accounts |
$ | 2,182 | $ | 636 | $ | 295 | $ | 665 | $ | 2,448 | |||||
| Reserve for excess and obsolete inventory |
15,862 | 2,537 | 634 | 2,015 | 17,018 | ||||||||||
| Year Ended September 30, 2008 |
|||||||||||||||
| Allowance for doubtful accounts |
2,223 | 369 | — | 410 | 2,182 | ||||||||||
| Reserve for excess and obsolete inventory |
14,467 | 2,440 | 591 | 1,636 | 15,862 | ||||||||||
| Year Ended September 30, 2007 |
|||||||||||||||
| Allowance for doubtful accounts |
1,160 | 661 | 777 | 375 | 2,223 | ||||||||||
| Reserve for excess and obsolete inventory |
7,894 | 2,997 | 6,197 | 2,621 | 14,467 | ||||||||||
| (1) | The amounts in this column represent charge-offs net of recoveries. |
F-35
Table of Contents
EXHIBIT INDEX
TO FORM 10-K FOR THE YEAR ENDED SEPTEMBER 30, 2009
| EXHIBIT NO. |
DESCRIPTION | |
| 3.46 | Certificate of Formation, filed September 30, 2009, of CEF Industries, LLC | |
| 3.47 | Limited Liability Company Agreement of CEF Industries, LLC | |
| 12.1 | Statement of Computation of Ratio of Earnings to Fixed Charges | |
| 21.1 | Subsidiaries of TransDigm Group Incorporated | |
| 23.1 | Consent of Independent Registered Public Accounting Firm | |
| 31.1 | Certification by Principal Executive Officer of TransDigm Group Incorporated pursuant to Rule 13a-14(a) or 15d-14(a) of the Securities Exchange Act of 1934, as adopted pursuant to Section 302 of the Sarbanes-Oxley Act of 2002. | |
| 31.2 | Certification by Principal Financial Officer of TransDigm Group Incorporated pursuant to Rule 13a-14(a) or 15d-14(a) of the Securities Exchange Act of 1934, as adopted pursuant to Section 302 of the Sarbanes-Oxley Act of 2002. | |
| 32.1 | Certification by Principal Executive Officer of TransDigm Group Incorporated pursuant to 18 U.S.C. Section 1350, as adopted pursuant to Section 906 of the Sarbanes-Oxley Act of 2002. | |
| 32.2 | Certification by Principal Financial Officer of TransDigm Group Incorporated pursuant to 18 U.S.C. Section 1350, as adopted pursuant to Section 906 of the Sarbanes-Oxley Act of 2002. | |