Attached files
| file | filename |
|---|---|
| 8-K - 8-K - ESSENDANT INC | a09-32563_18k.htm |
| EX-99.1 - EX-99.1 - ESSENDANT INC | a09-32563_1ex99d1.htm |
Exhibit 99.2
|
|
1 October 30, 2009 United Stationers Inc. Earnings Presentation Third Quarter 2009 |
|
|
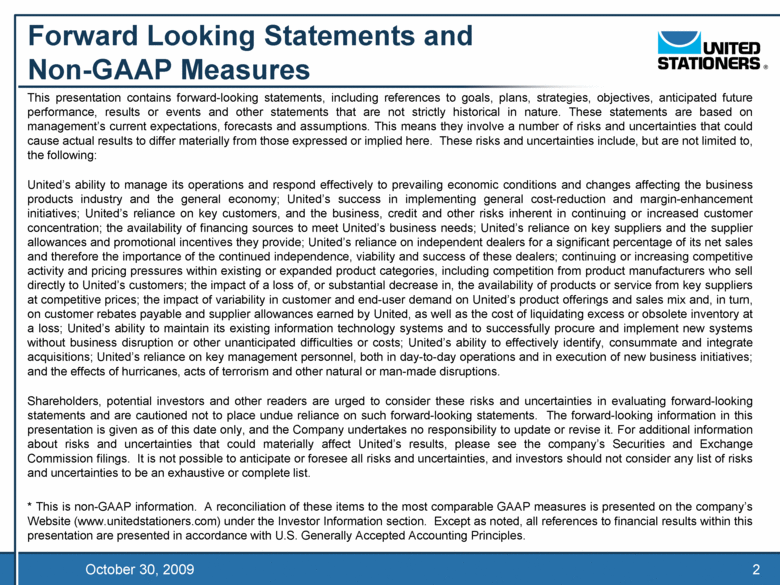
2 October 30, 2009 Forward Looking Statements and Non-GAAP Measures This presentation contains forward-looking statements, including references to goals, plans, strategies, objectives, anticipated future performance, results or events and other statements that are not strictly historical in nature. These statements are based on management’s current expectations, forecasts and assumptions. This means they involve a number of risks and uncertainties that could cause actual results to differ materially from those expressed or implied here. These risks and uncertainties include, but are not limited to, the following: United’s ability to manage its operations and respond effectively to prevailing economic conditions and changes affecting the business products industry and the general economy; United’s success in implementing general cost-reduction and margin-enhancement initiatives; United’s reliance on key customers, and the business, credit and other risks inherent in continuing or increased customer concentration; the availability of financing sources to meet United’s business needs; United’s reliance on key suppliers and the supplier allowances and promotional incentives they provide; United’s reliance on independent dealers for a significant percentage of its net sales and therefore the importance of the continued independence, viability and success of these dealers; continuing or increasing competitive activity and pricing pressures within existing or expanded product categories, including competition from product manufacturers who sell directly to United’s customers; the impact of a loss of, or substantial decrease in, the availability of products or service from key suppliers at competitive prices; the impact of variability in customer and end-user demand on United’s product offerings and sales mix and, in turn, on customer rebates payable and supplier allowances earned by United, as well as the cost of liquidating excess or obsolete inventory at a loss; United’s ability to maintain its existing information technology systems and to successfully procure and implement new systems without business disruption or other unanticipated difficulties or costs; United’s ability to effectively identify, consummate and integrate acquisitions; United’s reliance on key management personnel, both in day-to-day operations and in execution of new business initiatives; and the effects of hurricanes, acts of terrorism and other natural or man-made disruptions. Shareholders, potential investors and other readers are urged to consider these risks and uncertainties in evaluating forward-looking statements and are cautioned not to place undue reliance on such forward-looking statements. The forward-looking information in this presentation is given as of this date only, and the Company undertakes no responsibility to update or revise it. For additional information about risks and uncertainties that could materially affect United’s results, please see the company’s Securities and Exchange Commission filings. It is not possible to anticipate or foresee all risks and uncertainties, and investors should not consider any list of risks and uncertainties to be an exhaustive or complete list. * This is non-GAAP information. A reconciliation of these items to the most comparable GAAP measures is presented on the company’s Website (www.unitedstationers.com) under the Investor Information section. Except as noted, all references to financial results within this presentation are presented in accordance with U.S. Generally Accepted Accounting Principles. |
|
|
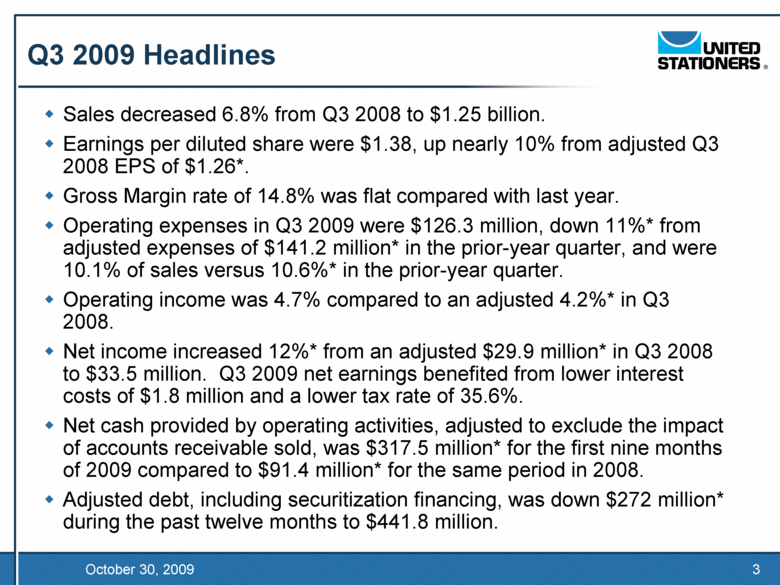
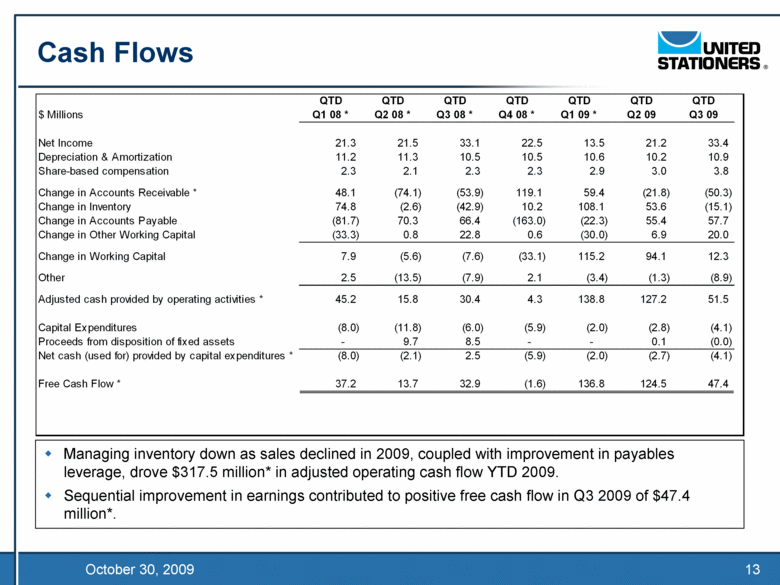
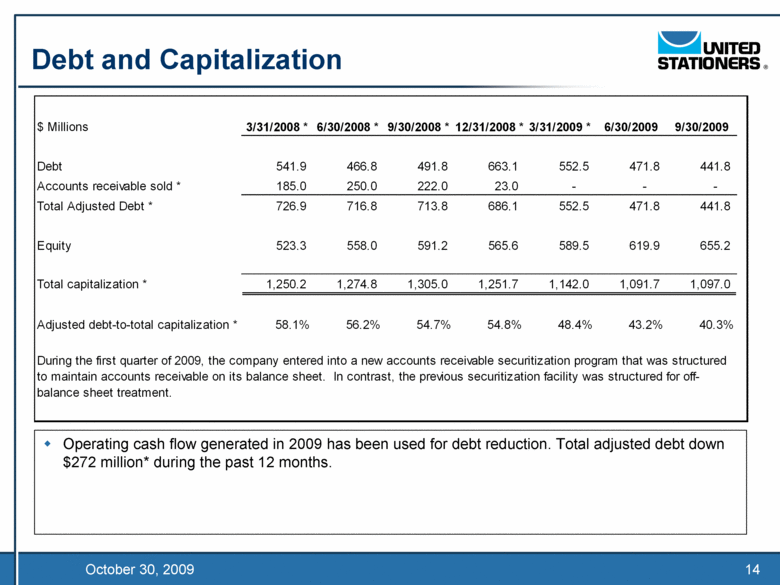
3 October 30, 2009 Q3 2009 Headlines Sales decreased 6.8% from Q3 2008 to $1.25 billion. .. Earnings per diluted share were $1.38, up nearly 10% from adjusted Q3 2008 EPS of $1.26*. .. Gross Margin rate of 14.8% was flat compared with last year. .. Operating expenses in Q3 2009 were $126.3 million, down 11%* from adjusted expenses of $141.2 million* in the prior-year quarter, and were 10.1% of sales versus 10.6%* in the prior-year quarter. .. Operating income was 4.7% compared to an adjusted 4.2%* in Q3 2008. .. Net income increased 12%* from an adjusted $29.9 million* in Q3 2008 to $33.5 million. Q3 2009 net earnings benefited from lower interest costs of $1.8 million and a lower tax rate of 35.6%. .. Net cash provided by operating activities, adjusted to exclude the impact of accounts receivable sold, was $317.5 million* for the first nine months of 2009 compared to $91.4 million* for the same period in 2008. .. Adjusted debt, including securitization financing, was down $272 million* during the past twelve months to $441.8 million. |
|
|
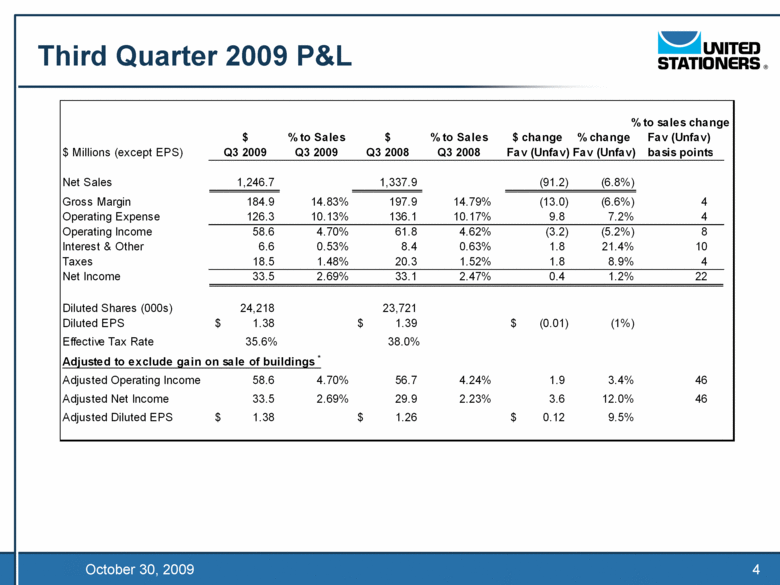
4 October 30, 2009 Third Quarter 2009 P&L % to sales change $ % to Sales $ % to Sales $ change % change Fav (Unfav) $ Millions (except EPS) Q3 2009 Q3 2009 Q3 2008 Q3 2008 Fav (Unfav) Fav (Unfav) basis points Net Sales 1,246.7 1,337.9 (91.2) (6.8%) Gross Margin 184.9 14.83% 197.9 14.79% (13.0) (6.6%) 4 Operating Expense 126.3 10.13% 136.1 10.17% 9.8 7.2% 4 Operating Income 58.6 4.70% 61.8 4.62% (3.2) (5.2%) 8 Interest & Other 6.6 0.53% 8.4 0.63% 1.8 21.4% 10 Taxes 18.5 1.48% 20.3 1.52% 1.8 8.9% 4 Net Income 33.5 2.69% 33.1 2.47% 0.4 1.2% 22 Diluted Shares (000s) 24,218 23,721 Diluted EPS 1.38 $ 1.39 $ (0.01) $ (1%) Effective Tax Rate 35.6% 38.0% Adjusted to exclude gain on sale of buildings * Adjusted Operating Income 58.6 4.70% 56.7 4.24% 1.9 3.4% 46 Adjusted Net Income 33.5 2.69% 29.9 2.23% 3.6 12.0% 46 Adjusted Diluted EPS 1.38 $ 1.26 $ 0.12 $ 9.5% |
|
|
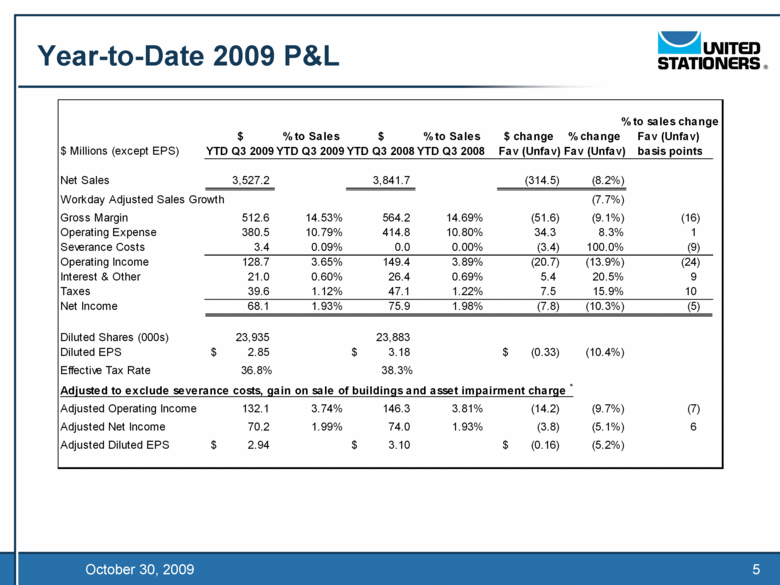
5 October 30, 2009 Year-to-Date 2009 P&L % to sales change $ % to Sales $ % to Sales $ change % change Fav (Unfav) $ Millions (except EPS) YTD Q3 2009 YTD Q3 2009 YTD Q3 2008 YTD Q3 2008 Fav (Unfav) Fav (Unfav) basis points Net Sales 3,527.2 3,841.7 (314.5) (8.2%) Workday Adjusted Sales Growth (7.7%) Gross Margin 512.6 14.53% 564.2 14.69% (51.6) (9.1%) (16) Operating Expense 380.5 10.79% 414.8 10.80% 34.3 8.3% 1 Severance Costs 3.4 0.09% 0.0 0.00% (3.4) 100.0% (9) Operating Income 128.7 3.65% 149.4 3.89% (20.7) (13.9%) (24) Interest & Other 21.0 0.60% 26.4 0.69% 5.4 20.5% 9 Taxes 39.6 1.12% 47.1 1.22% 7.5 15.9% 10 Net Income 68.1 1.93% 75.9 1.98% (7.8) (10.3%) (5) Diluted Shares (000s) 23,935 23,883 Diluted EPS 2.85 $ 3.18 $ (0.33) $ (10.4%) Effective Tax Rate 36.8% 38.3% Adjusted to exclude severance costs, gain on sale of buildings and asset impairment charge * Adjusted Operating Income 132.1 3.74% 146.3 3.81% (14.2) (9.7%) (7) Adjusted Net Income 70.2 1.99% 74.0 1.93% (3.8) (5.1%) 6 Adjusted Diluted EPS 2.94 $ 3.10 $ (0.16) $ (5.2%) |
|
|
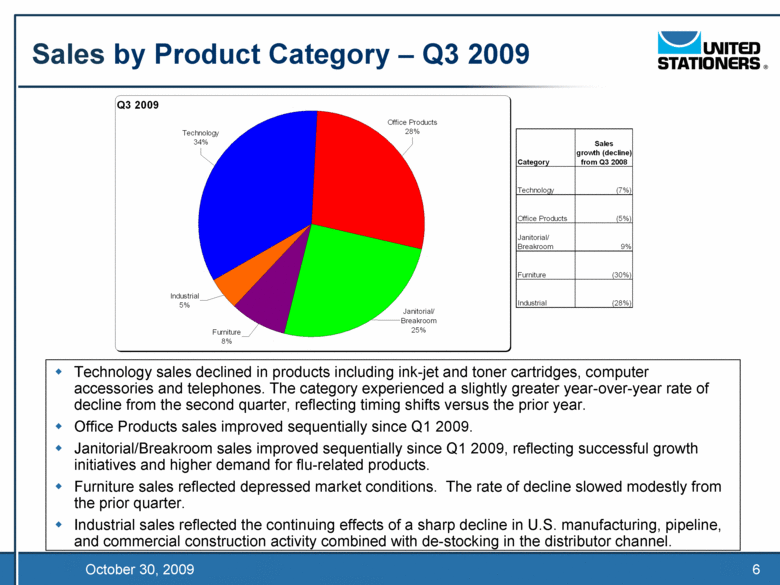
6 October 30, 2009 Sales by Product Category – Q3 2009 .. Technology sales declined in products including ink-jet and toner cartridges, computer accessories and telephones. The category experienced a slightly greater year-over-year rate of decline from the second quarter, reflecting timing shifts versus the prior year. .. Office Products sales improved sequentially since Q1 2009. .. Janitorial/Breakroom sales improved sequentially since Q1 2009, reflecting successful growth initiatives and higher demand for flu-related products. .. Furniture sales reflected depressed market conditions. The rate of decline slowed modestly from the prior quarter. .. Industrial sales reflected the continuing effects of a sharp decline in U.S. manufacturing, pipeline, and commercial construction activity combined with de-stocking in the distributor channel. Sales growth (decline) Category from Q3 2008 Technology (7%) Office Products (5%) Janitorial/ Breakroom 9% Furniture (30%) Industrial (28%) Q3 2009 Industrial 5% Furniture 8% Technology 34% Office Products 28% Janitorial/ Breakroom 25% |
|
|
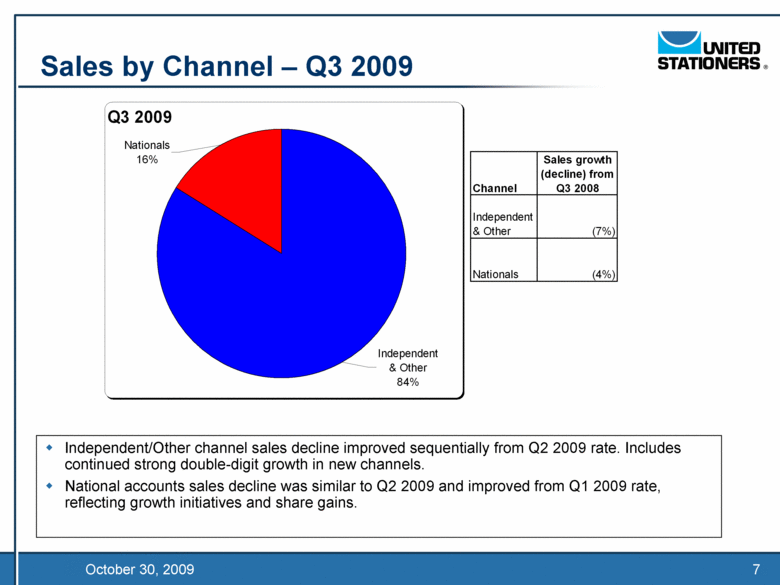
7 October 30, 2009 Sales by Channel – Q3 2009 .. Independent/Other channel sales decline improved sequentially from Q2 2009 rate. Includes continued strong double-digit growth in new channels. .. National accounts sales decline was similar to Q2 2009 and improved from Q1 2009 rate, reflecting growth initiatives and share gains. Sales growth (decline) from Channel Q3 2008 Independent & Other (7%) Nationals (4%) Q3 2009 Nationals 16% Independent & Other 84% |
|
|
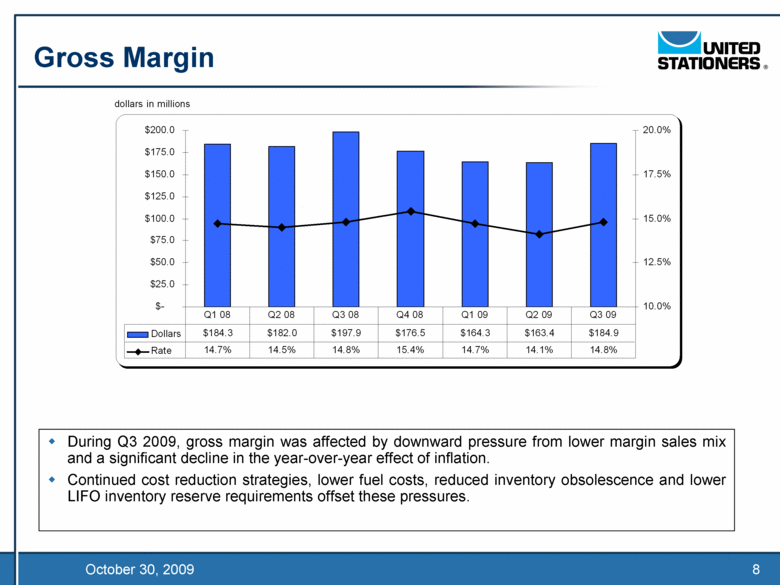
8 October 30, 2009 Gross Margin .. During Q3 2009, gross margin was affected by downward pressure from lower margin sales mix and a significant decline in the year-over-year effect of inflation. .. Continued cost reduction strategies, lower fuel costs, reduced inventory obsolescence and lower LIFO inventory reserve requirements offset these pressures. dollars in millions $- $25.0 $50.0 $75.0 $100.0 $125.0 $150.0 $175.0 $200.0 10.0% 12.5% 15.0% 17.5% 20.0% Dollars $184.3 $182.0 $197.9 $176.5 $164.3 $163.4 $184.9 Rate 14.7% 14.5% 14.8% 15.4% 14.7% 14.1% 14.8% Q1 08 Q2 08 Q3 08 Q4 08 Q1 09 Q2 09 Q3 09 |
|
|
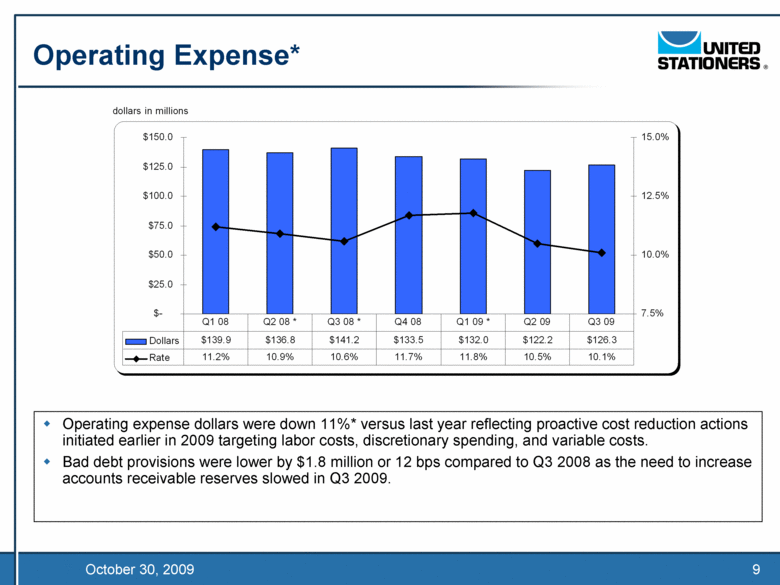
9 October 30, 2009 Operating Expense* .. Operating expense dollars were down 11%* versus last year reflecting proactive cost reduction actions initiated earlier in 2009 targeting labor costs, discretionary spending, and variable costs. .. Bad debt provisions were lower by $1.8 million or 12 bps compared to Q3 2008 as the need to increase accounts receivable reserves slowed in Q3 2009. dollars in millions $- $25.0 $50.0 $75.0 $100.0 $125.0 $150.0 7.5% 10.0% 12.5% 15.0% Dollars $139.9 $136.8 $141.2 $133.5 $132.0 $122.2 $126.3 Rate 11.2% 10.9% 10.6% 11.7% 11.8% 10.5% 10.1% Q1 08 Q2 08 * Q3 08 * Q4 08 Q1 09 * Q2 09 Q3 09 |
|
|
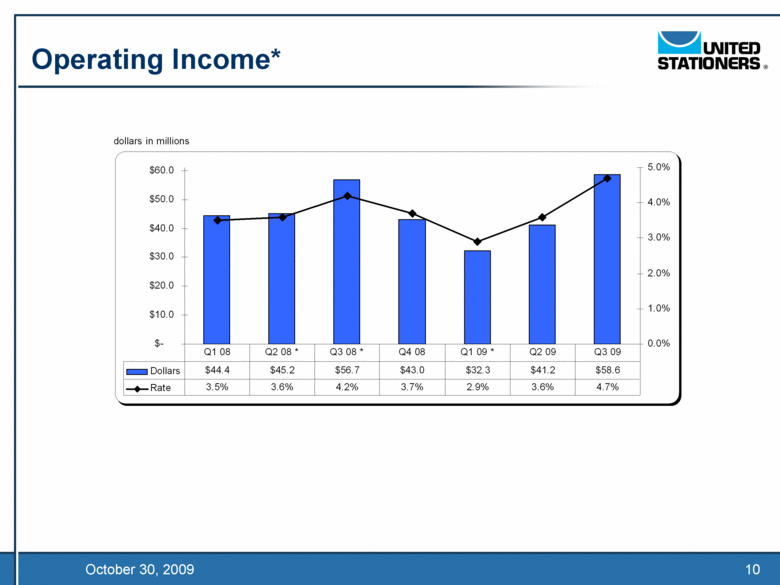
10 October 30, 2009 Operating Income* dollars in millions $- $10.0 $20.0 $30.0 $40.0 $50.0 $60.0 0.0% 1.0% 2.0% 3.0% 4.0% 5.0% Dollars $44.4 $45.2 $56.7 $43.0 $32.3 $41.2 $58.6 Rate 3.5% 3.6% 4.2% 3.7% 2.9% 3.6% 4.7% Q1 08 Q2 08 * Q3 08 * Q4 08 Q1 09 * Q2 09 Q3 09 |
|
|
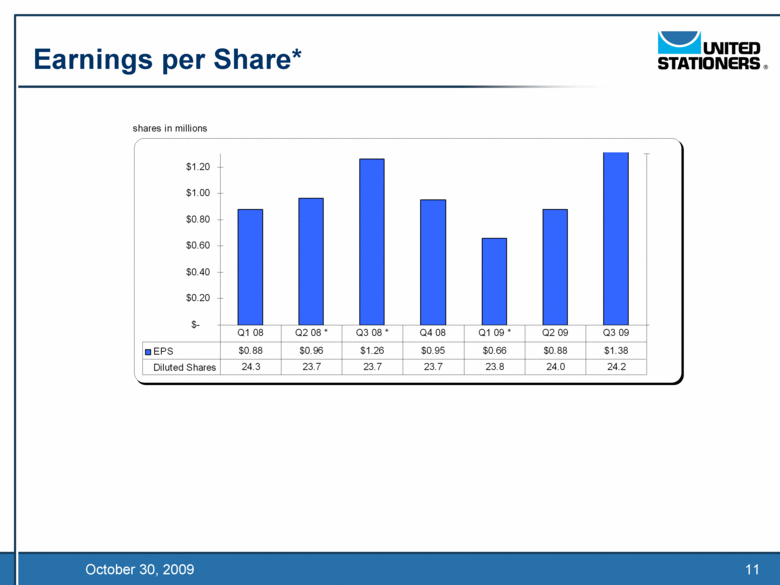
11 October 30, 2009 Earnings per Share* shares in millions $- $0.20 $0.40 $0.60 $0.80 $1.00 $1.20 EPS $0.88 $0.96 $1.26 $0.95 $0.66 $0.88 $1.38 Diluted Shares 24.3 23.7 23.7 23.7 23.8 24.0 24.2 Q1 08 Q2 08 * Q3 08 * Q4 08 Q1 09 * Q2 09 Q3 09 |
|
|
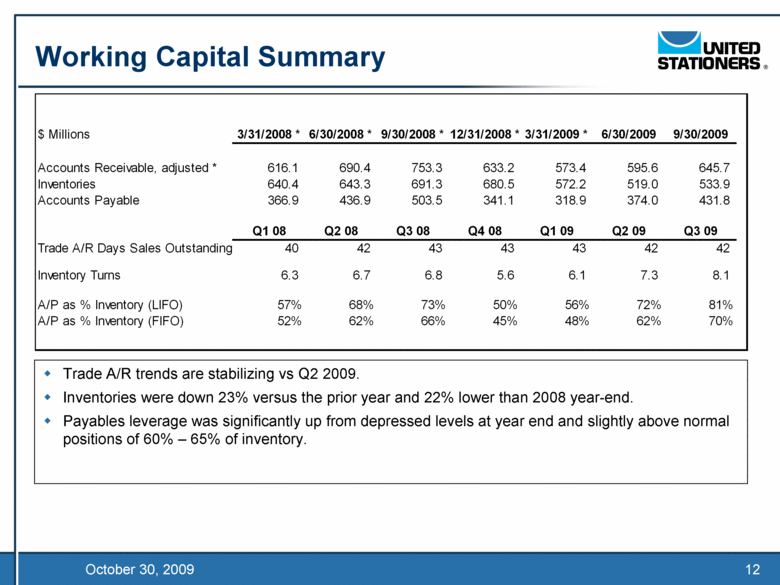
12 October 30, 2009 Working Capital Summary .. Trade A/R trends are stabilizing vs Q2 2009. .. Inventories were down 23% versus the prior year and 22% lower than 2008 year-end. .. Payables leverage was significantly up from depressed levels at year end and slightly above normal positions of 60% – 65% of inventory. $ Millions 3/31/2008 * 6/30/2008 * 9/30/2008 * 12/31/2008 * 3/31/2009 * 6/30/2009 9/30/2009 Accounts Receivable, adjusted * 616.1 690.4 753.3 633.2 573.4 595.6 645.7 Inventories 640.4 643.3 691.3 680.5 572.2 519.0 533.9 Accounts Payable 366.9 436.9 503.5 341.1 318.9 374.0 431.8 Q1 08 Q2 08 Q3 08 Q4 08 Q1 09 Q2 09 Q3 09 Trade A/R Days Sales Outstanding 40 42 43 43 43 42 42 Inventory Turns 6.3 6.7 6.8 5.6 6.1 7.3 8.1 A/P as % Inventory (LIFO) 57% 68% 73% 50% 56% 72% 81% A/P as % Inventory (FIFO) 52% 62% 66% 45% 48% 62% 70% |
|
|
13 October 30, 2009 Cash Flows .. Managing inventory down as sales declined in 2009, coupled with improvement in payables leverage, drove $317.5 million* in adjusted operating cash flow YTD 2009. .. Sequential improvement in earnings contributed to positive free cash flow in Q3 2009 of $47.4 million*. QTD QTD QTD QTD QTD QTD QTD $ Millions Q1 08 * Q2 08 * Q3 08 * Q4 08 * Q1 09 * Q2 09 Q3 09 Net Income 21.3 21.5 33.1 22.5 13.5 21.2 33.4 Depreciation & Amortization 11.2 11.3 10.5 10.5 10.6 10.2 10.9 Share-based compensation 2.3 2.1 2.3 2.3 2.9 3.0 3.8 Change in Accounts Receivable * 48.1 (74.1) (53.9) 119.1 59.4 (21.8) (50.3) Change in Inventory 74.8 (2.6) (42.9) 10.2 108.1 53.6 (15.1) Change in Accounts Payable (81.7) 70.3 66.4 (163.0) (22.3) 55.4 57.7 Change in Other Working Capital (33.3) 0.8 22.8 0.6 (30.0) 6.9 20.0 Change in Working Capital 7.9 (5.6) (7.6) (33.1) 115.2 94.1 12.3 Other 2.5 (13.5) (7.9) 2.1 (3.4) (1.3) (8.9) Adjusted cash provided by operating activities * 45.2 15.8 30.4 4.3 138.8 127.2 51.5 Capital Expenditures (8.0) (11.8) (6.0) (5.9) (2.0) (2.8) (4.1) Proceeds from disposition of fixed assets - 9.7 8.5 - - 0.1 (0.0) Net cash (used for) provided by capital expenditures * (8.0) (2.1) 2.5 (5.9) (2.0) (2.7) (4.1) Free Cash Flow * 37.2 13.7 32.9 (1.6) 136.8 124.5 47.4 |
|
|
14 October 30, 2009 Debt and Capitalization .. Operating cash flow generated in 2009 has been used for debt reduction. Total adjusted debt down $272 million* during the past 12 months. $ Millions 3/31/2008 * 6/30/2008 * 9/30/2008 * 12/31/2008 * 3/31/2009 * 6/30/2009 9/30/2009 Debt 541.9 466.8 491.8 663.1 552.5 471.8 441.8 Accounts receivable sold * 185.0 250.0 222.0 23.0 - - - Total Adjusted Debt * 726.9 716.8 713.8 686.1 552.5 471.8 441.8 Equity 523.3 558.0 591.2 565.6 589.5 619.9 655.2 Total capitalization * 1,250.2 1,274.8 1,305.0 1,251.7 1,142.0 1,091.7 1,097.0 Adjusted debt-to-total capitalization * 58.1% 56.2% 54.7% 54.8% 48.4% 43.2% 40.3% During the first quarter of 2009, the company entered into a new accounts receivable securitization program that was structured to maintain accounts receivable on its balance sheet. In contrast, the previous securitization facility was structured for off-balance sheet treatment. |

