Attached files
| file | filename |
|---|---|
| 8-K - 8-K - HANCOCK WHITNEY CORP | hwc-8k_20210901.htm |
Mid-3Q21 Investor Meetings 9/1/2021 HNCOCK WHITNEY
This presentation contains forward-looking statements within the meaning of section 27A of the Securities Act of 1933, as amended, and section 21E of the Securities Exchange Act of 1934, as amended. Forward-looking statements that we may make include statements regarding our expectations of our performance and financial condition, balance sheet and revenue growth, the provision for credit losses, loan growth expectations, management’s predictions about charge-offs for loans, the impact of the COVID-19 pandemic on the economy and our operations, the adequacy of our enterprise risk management framework, the impact of future business combinations on our performance and financial condition, including our ability to successfully integrate the businesses, success of revenue-generating initiatives, the effectiveness of derivative financial instruments and hedging activities to manage risks, projected tax rates, increased cybersecurity risks, including potential business disruptions or financial losses, the adequacy of our internal controls over financial reporting, the financial impact of regulatory requirements and tax reform legislation, the impact of the change in the referenced rate reform, deposit trends, credit quality trends, the impact of PPP loans and forgiveness on our results, the impact of Hurricane Ida on our operations and results, changes in interest rates, inflation, net interest margin trends, future expense levels (including the impact from the Voluntary Early Retirement Program), future profitability, improvements in expense to revenue (efficiency) ratio, purchase accounting impacts, accretion levels and expected returns. Also, any statement that does not describe historical or current facts is a forward-looking statement. These statements often include the words “believes,” “expects,” “anticipates,” “estimates,” “intends,” “plans,” “forecast,” “goals,” “targets,” “initiatives,” “focus,” “potentially,” “probably,” “projects,” “outlook," or similar expressions or future conditional verbs such as “may,” “will,” “should,” “would,” and “could.” Forward-looking statements are based upon the current beliefs and expectations of management and on information currently available to management. Our statements speak as of the date hereof, and we do not assume any obligation to update these statements or to update the reasons why actual results could differ from those contained in such statements in light of new information or future events. Given the many unknowns and risks being heavily weighted to the downside, our forward-looking statements are subject to the risk that conditions will be substantially different than we are currently expecting. If efforts to contain and inoculate our population against COVID-19 and other variants thereof, are unsuccessful and restrictions on movement are imposed, the economic impact could continue to be substantial. The COVID-19 outbreak and its consequences, including responsive measures to manage it, have had and are likely to continue to have an adverse effect, possibly materially, on our business and financial performance by adversely affecting, possibly materially, the demand and profitability of our products and services, the valuation of assets and our ability to meet the needs of our customers. Forward-looking statements are subject to significant risks and uncertainties. Any forward-looking statement made in this release is subject to the safe harbor protections set forth in the Private Securities Litigation Reform Act of 1995. Investors are cautioned against placing undue reliance on such statements. Actual results may differ materially from those set forth in the forward-looking statements. Additional factors that could cause actual results to differ materially from those described in the forward-looking statements can be found in Part I, “Item 1A. Risk Factors” in our Annual Report on Form 10-K for the year ended December 31, 2020 and in other periodic reports that we file with the SEC. Important cautionary statement about forward-looking statements HNCOCK WHITNEY 2
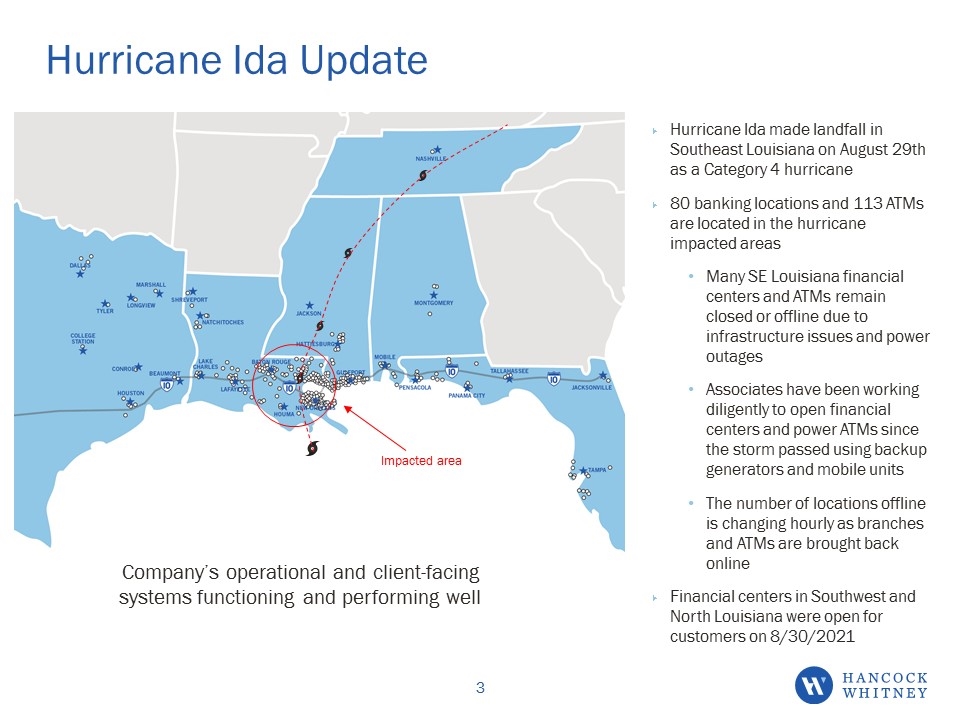
Hurricane Ida Update Hurricane Ida made landfall in Southeast Louisiana on August 29th as a Category 4 hurricane 80 banking locations and 113 ATMs are located in the hurricane impacted areas Many SE Louisiana financial centers and ATMs remain closed or offline due to infrastructure issues and power outages Associates have been working diligently to open financial centers and power ATMs since the storm passed using backup generators and mobile units The number of locations offline is changing hourly as branches and ATMs are brought back online Financial centers in Southwest and North Louisiana were open for customers on 8/30/2021 Impacted area Company’s operational and client-facing systems functioning and performing well
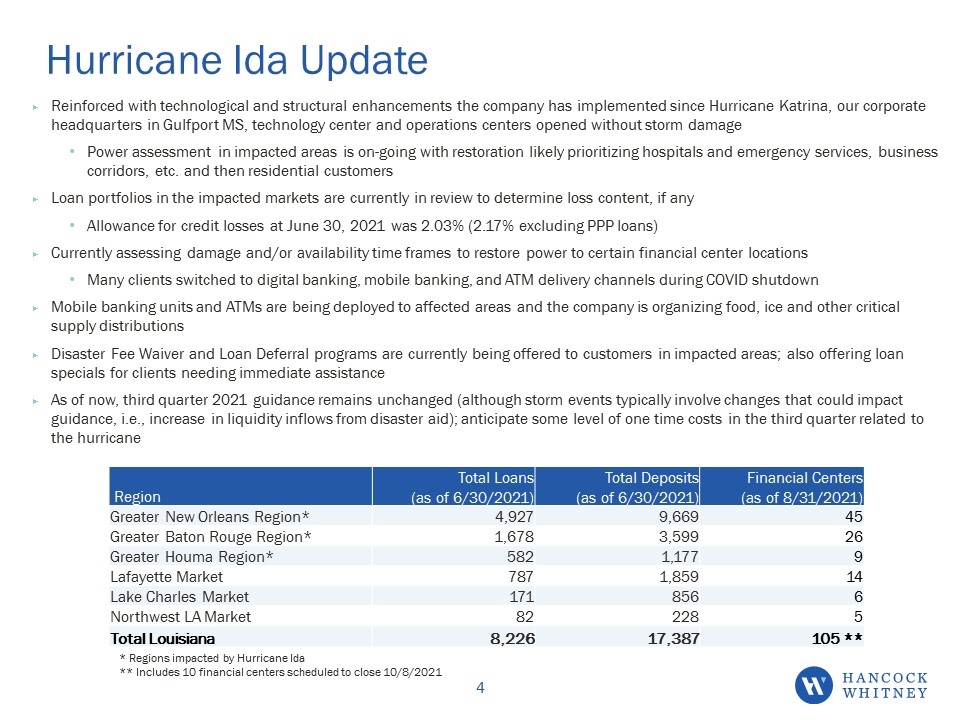
Hurricane Ida Update Reinforced with technological and structural enhancements the company has implemented since Hurricane Katrina, our corporate headquarters in Gulfport MS, technology center and operations centers opened without storm damage Power assessment in impacted areas is on-going with restoration likely prioritizing hospitals and emergency services, business corridors, etc. and then residential customers Loan portfolios in the impacted markets are currently in review to determine loss content, if any Allowance for credit losses at June 30, 2021 was 2.03% (2.17% excluding PPP loans) Currently assessing damage and/or availability time frames to restore power to certain financial center locations Many clients switched to digital banking, mobile banking, and ATM delivery channels during COVID shutdown Mobile banking units and ATMs are being deployed to affected areas and the company is organizing food, ice and other critical supply distributions Disaster Fee Waiver and Loan Deferral programs are currently being offered to customers in impacted areas; also offering loan specials for clients needing immediate assistance As of now, third quarter 2021 guidance remains unchanged (although storm events typically involve changes that could impact guidance, i.e., increase in liquidity inflows from disaster aid); anticipate some level of one time costs in the third quarter related to the hurricane Region Total Loans (as of 6/30/2021) Total Deposits (as of 6/30/2021) Financial Centers (as of 8/31/2021) Greater New Orleans Region* 4,927 9,669 45 Greater Baton Rouge Region* 1,678 3,599 26 Greater Houma Region* 582 1,177 9 Lafayette Market 787 1,859 14 Lake Charles Market 171 856 6 Northwest LA Market 82 228 5 Total Louisiana 8,226 17,387 105 ** * Regions impacted by Hurricane Ida ** Includes 10 financial centers scheduled to close 10/8/2021
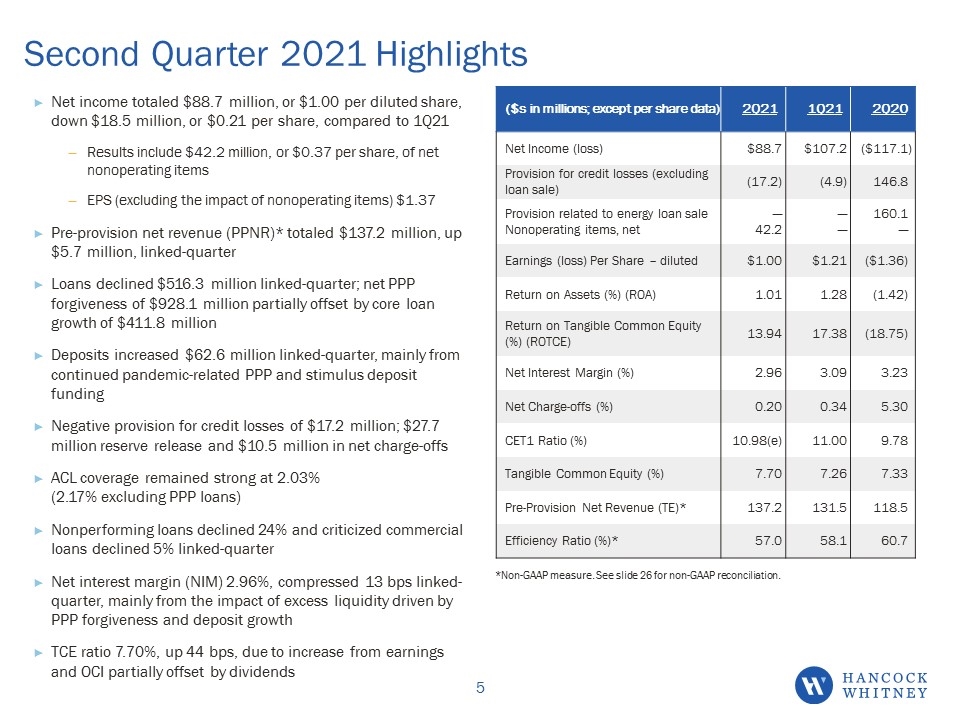
Second Quarter 2021 Highlights Net income totaled $88.7 million, or $1.00 per diluted share, down $18.5 million, or $0.21 per share, compared to 1Q21 Results include $42.2 million, or $0.37 per share, of net nonoperating items EPS (excluding the impact of nonoperating items) $1.37 Pre-provision net revenue (PPNR)* totaled $137.2 million, up $5.7 million, linked-quarter Loans declined $516.3 million linked-quarter; net PPP forgiveness of $928.1 million partially offset by core loan growth of $411.8 million Deposits increased $62.6 million linked-quarter, mainly from continued pandemic-related PPP and stimulus deposit funding Negative provision for credit losses of $17.2 million; $27.7 million reserve release and $10.5 million in net charge-offs ACL coverage remained strong at 2.03% (2.17% excluding PPP loans) Nonperforming loans declined 24% and criticized commercial loans declined 5% linked-quarter Net interest margin (NIM) 2.96%, compressed 13 bps linked-quarter, mainly from the impact of excess liquidity driven by PPP forgiveness and deposit growth TCE ratio 7.70%, up 44 bps, due to increase from earnings and OCI partially offset by dividends ($s in millions; except per share data) 2Q21 1Q21 2Q20 Net Income (loss) $88.7 $107.2 ($117.1) Provision for credit losses (excluding loan sale) (17.2) (4.9) 146.8 Provision related to energy loan sale Nonoperating items, net ─ 42.2 ─ ─ 160.1 ─ Earnings (loss) Per Share – diluted $1.00 $1.21 ($1.36) Return on Assets (%) (ROA) 1.01 1.28 (1.42) Return on Tangible Common Equity (%) (ROTCE) 13.94 17.38 (18.75) Net Interest Margin (%) 2.96 3.09 3.23 Net Charge-offs (%) 0.20 0.34 5.30 CET1 Ratio (%) 10.98(e) 11.00 9.78 Tangible Common Equity (%) 7.70 7.26 7.33 Pre-Provision Net Revenue (TE)* 137.2 131.5 118.5 Efficiency Ratio (%)* 57.0 58.1 60.7 *Non-GAAP measure. See slide 26 for non-GAAP reconciliation. HNCOCK WHITNEY 6
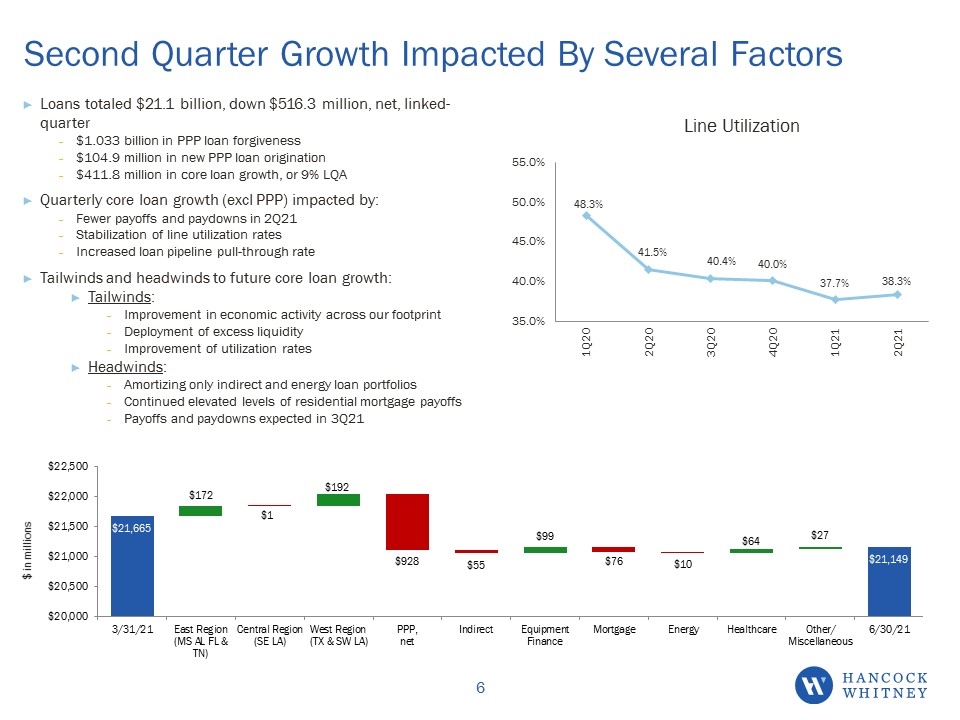
Loans totaled $21.1 billion, down $516.3 million, net, linked-quarter $1.033 billion in PPP loan forgiveness $104.9 million in new PPP loan origination $411.8 million in core loan growth, or 9% LQA Quarterly core loan growth (excl PPP) impacted by: Fewer payoffs and paydowns in 2Q21 Stabilization of line utilization rates Increased loan pipeline pull-through rate Tailwinds and headwinds to future core loan growth: Tailwinds: Improvement in economic activity across our footprint Deployment of excess liquidity Improvement of utilization rates Headwinds: Amortizing only indirect and energy loan portfolios Continued elevated levels of residential mortgage payoffs Payoffs and paydowns expected in 3Q21 Second Quarter Growth Impacted By Several Factors
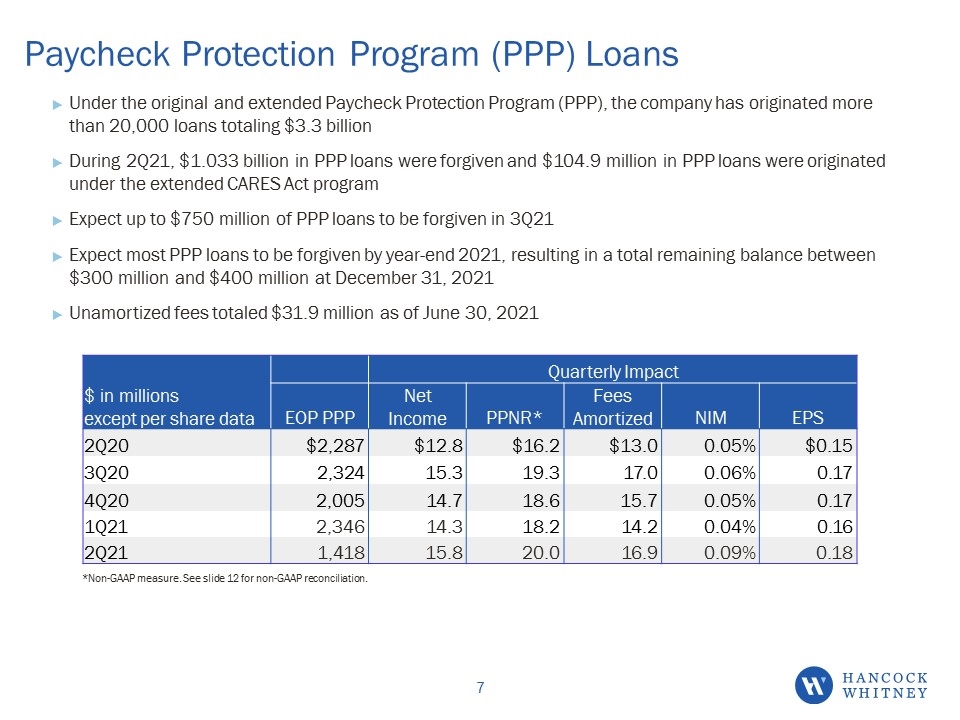
Paycheck Protection Program (PPP) Loans Under the original and extended Paycheck Protection Program (PPP), the company has originated more than 20,000 loans totaling $3.3 billion During 2Q21, $1.033 billion in PPP loans were forgiven and $104.9 million in PPP loans were originated under the extended CARES Act program Expect up to $750 million of PPP loans to be forgiven in 3Q21 Expect most PPP loans to be forgiven by year-end 2021, resulting in a total remaining balance between $300 million and $400 million at December 31, 2021 Unamortized fees totaled $31.9 million as of June 30, 2021 Quarterly Impact $ in millions except per share data EOP PPP Net Income PPNR* Fees Amortized NIM EPS 2Q20 $2,287 $12.8 $16.2 $13.0 0.05% $0.15 3Q20 2,324 15.3 19.3 17.0 0.06% 0.17 4Q20 2,005 14.7 18.6 15.7 0.05% 0.17 1Q21 2,346 14.3 18.2 14.2 0.04% 0.16 2Q21 1,418 15.8 20.0 16.9 0.09% 0.18 West 25% Central 39% East 36% HNCOCK WHITNEY 7 *Non-GAAP measure. See slide 12 for non-GAAP reconciliation.
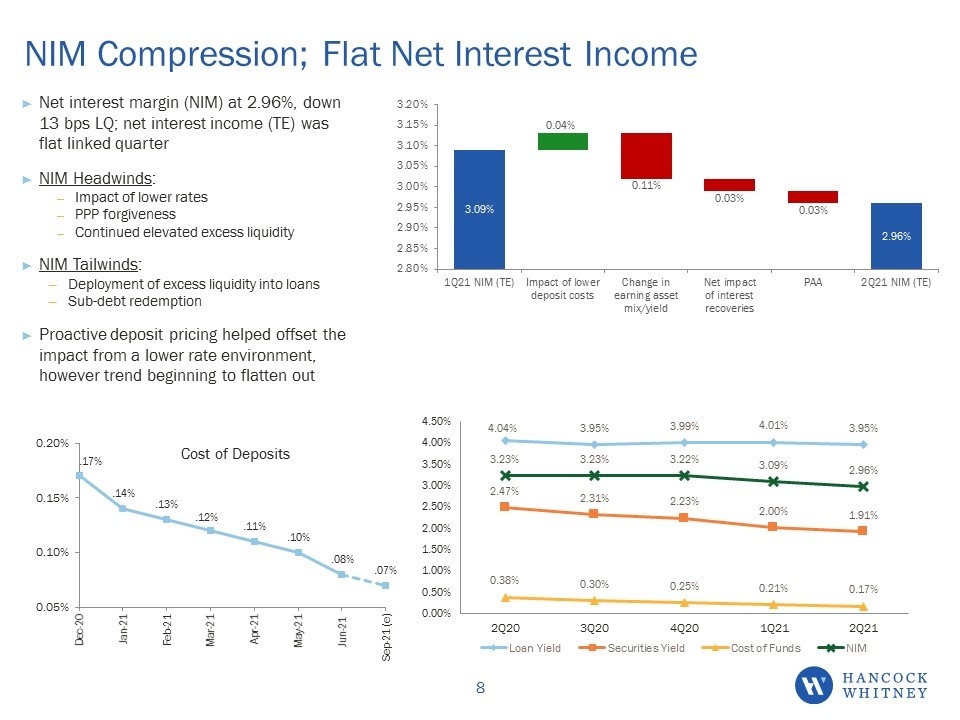
Net interest margin (NIM) at 2.96%, down 13 bps LQ; net interest income (TE) was flat linked quarter NIM Headwinds: Impact of lower rates PPP forgiveness Continued elevated excess liquidity NIM Tailwinds: Deployment of excess liquidity into loans Sub-debt redemption Proactive deposit pricing helped offset the impact from a lower rate environment, however trend beginning to flatten out NIM Compression; Flat Net Interest Income Cost of Deposits 0.60% 0.50% 0.40% 0.30% 0.20% 0.10% Mar-20 Apr-20 May-20 Jun 20 Jul-20 Aug-20 Sep-20 Oct-20 Nov-20 Dec-20 Mar-21e .59% .41% .33% .29% .25% .21% .20% .19% .17% .17% .13% 3.40% 3.30% 3.20% 3.10% 3.00% 2.90% 2.80% 3Q20 NIM (TE) Impact of Securities Portfolio Purchase/Premium amortization Impact of change in earnings asset mix Lower cost of deposits Net impact of interest reversals and recoveries/loan fees accretion 4Q20 NIM (TE) 0.02% 0.06% 0.05% 0.02% 5.00% 4.00% 3.00% 2.00% 1.00% 0.00% 4Q19 1Q20 2Q20 3Q20 4Q20 4.69% 3.43% 2.56% 0.76% 4.56% 3.41% 2.53% 0.67% 4.04% 3.23% 2.47% 0.38% 3.95% 3.23% 2.31% 0.30% 3.99% 3.22% 2.23% 0.25% Loan Yield Securities Yield Cost of Fund NIM HNCOCK WHITNEY 18
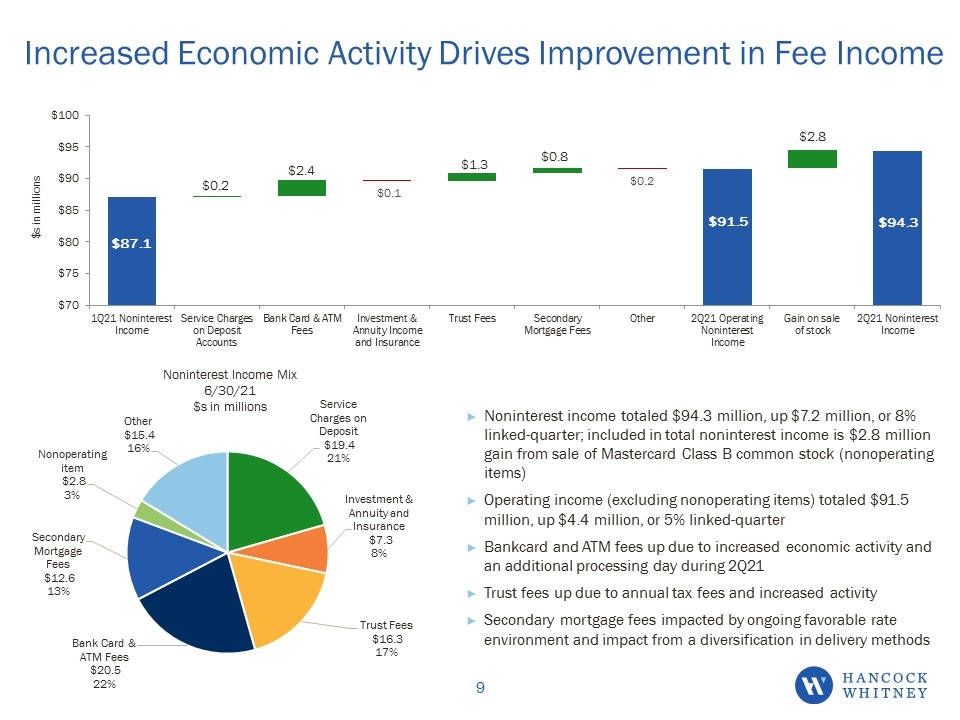
Increased Economic Activity Drives Improvement in Fee Income Noninterest income totaled $94.3 million, up $7.2 million, or 8% linked-quarter; included in total noninterest income is $2.8 million gain from sale of Mastercard Class B common stock (nonoperating items) Operating income (excluding nonoperating items) totaled $91.5 million, up $4.4 million, or 5% linked-quarter Bankcard and ATM fees up due to increased economic activity and an additional processing day during 2Q21 Trust fees up due to annual tax fees and increased activity Secondary mortgage fees impacted by ongoing favorable rate environment and impact from a diversification in delivery methods Lower Mortgage, Specialty Income Partly Offset by Higher Service Fees Noninterest income totaled $82.4 million, down $1.3 million, or 2% linked-quarter Service charges and bank card & ATM fees up primarily due to increased activity, although lower than pre-pandemic levels Secondary mortgage fees continue to be impacted by the favorable rate environment, albeit a lower level of refinance activity compared to previous quarters Other income decrease related to lower levels of specialty income (BOLI) in 4Q20 partially offset by higher derivative income Expect 1Q21 fee income to be down related to anticipated lower levels of specialty income and secondary mortgage fees Secondary Mortgage Fees $11.5 14%Other $12.8 16% Noninterest Income Mix 12/31/20 $s in millions Service Charges on Deposit $19.9 24% Investment & Annuity and Insurance $5.8 7% Trust Fees $14.8 18% Bank Card & ATM Fees $17.6 21% 3Q20 NON INTEREST INCOME SERVICE CHARGES ON DEPOSIT accounts bank card & atm fees investment & annuity income and insurance trust fees secondary mortgage fees other 4q20 Non interest income
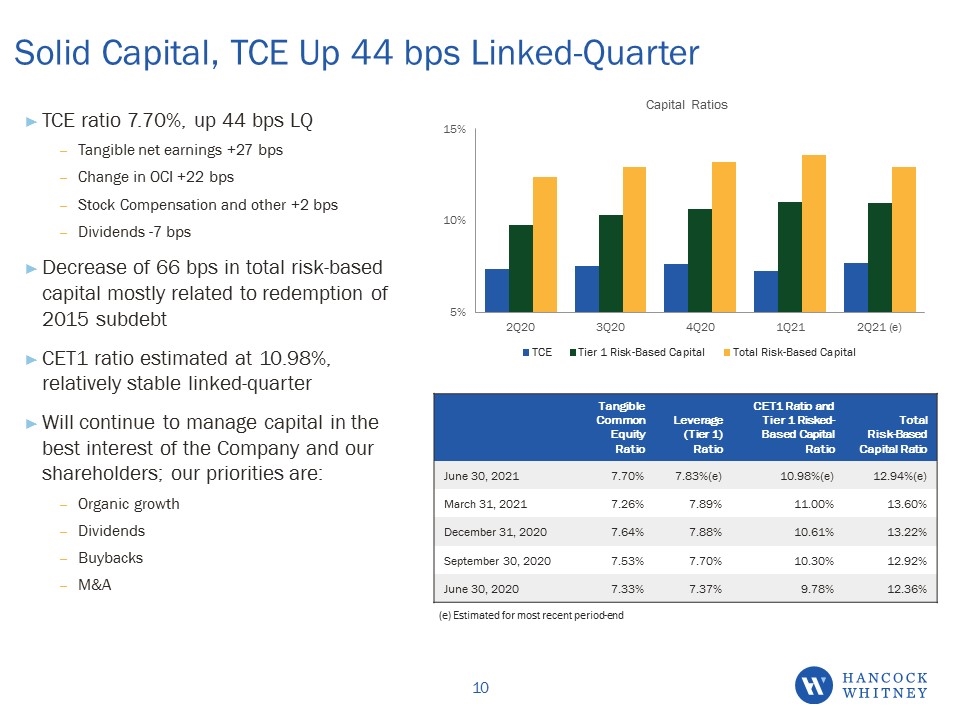
Solid Capital, TCE Up 44 bps Linked-Quarter TCE ratio 7.70%, up 44 bps LQ Tangible net earnings +27 bps Change in OCI +22 bps Stock Compensation and other +2 bps Dividends -7 bps Decrease of 66 bps in total risk-based capital mostly related to redemption of 2015 subdebt CET1 ratio estimated at 10.98%, relatively stable linked-quarter Will continue to manage capital in the best interest of the Company and our shareholders; our priorities are: Organic growth Dividends Buybacks M&A Tangible Common Equity Ratio Leverage (Tier 1) Ratio CET1 Ratio and Tier 1 Risked-Based Capital Ratio Total Risk-Based Capital Ratio June 30, 2021 7.70% 7.83%(e) 10.98%(e) 12.94%(e) March 31, 2021 7.26% 7.89% 11.00% 13.60% December 31, 2020 7.64% 7.88% 10.61% 13.22% September 30, 2020 7.53% 7.70% 10.30% 12.92% June 30, 2020 7.33% 7.37% 9.78% 12.36% (e) Estimated for most recent period-end Capital Rebuild Continues After 1H20 De-Risking Activities TCE ratio 7.64%, up 11 bps LQ (7.99% excluding PPP loans) Tangible net earnings +34 bps Change in tangible assets/additional excess liquidity -10 bps Dividends -7 bps Change in OCI & other -6 bps CET1 ratio 10.70%, up 40 bps linked-quarter Intend to pay quarterly dividend in consultation with examiners; board reviews dividend policy quarterly Buybacks on hold Tangible Common Equity Ratio Leverage (Tier 1) Ratio CET1 Ratio and Tier 1 Risked-Based Capital Ratio Total Risk-Based Capital Ratio December 31, 2020 7.64% 7.87%(e) 10.70%(e) 13.31%(e) September 30, 2020 7.53% 7.70% 10.30% 12.92% June 30, 2020 7.33% 7.37% 9.78% 12.36% March 31, 2020 8.00% 8.40% 10.02% 11.87% December 31, 2019 8.45% 8.76% 10.50% 11.90% (e) Estimated for most recent period-end; effective March 31, 2020 regulatory capital ratios reflect the election to use the five-year CECL transition rules
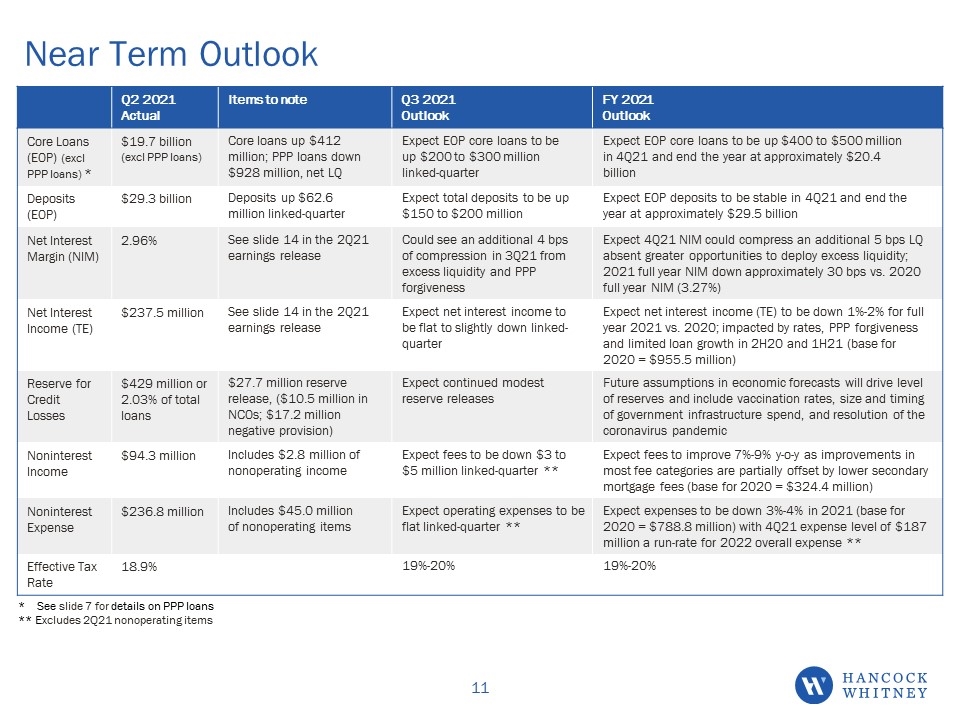
Near Term Outlook Q2 2021 Actual Items to note Q3 2021 Outlook FY 2021 Outlook Core Loans (EOP) (excl PPP loans) * $19.7 billion (excl PPP loans) Core loans up $412 million; PPP loans down $928 million, net LQ Expect EOP core loans to be up $200 to $300 million linked-quarter Expect EOP core loans to be up $400 to $500 million in 4Q21 and end the year at approximately $20.4 billion Deposits (EOP) $29.3 billion Deposits up $62.6 million linked-quarter Expect total deposits to be up $150 to $200 million Expect EOP deposits to be stable in 4Q21 and end the year at approximately $29.5 billion Net Interest Margin (NIM) 2.96% See slide 14 in the 2Q21 earnings release Could see an additional 4 bps of compression in 3Q21 from excess liquidity and PPP forgiveness Expect 4Q21 NIM could compress an additional 5 bps LQ absent greater opportunities to deploy excess liquidity; 2021 full year NIM down approximately 30 bps vs. 2020 full year NIM (3.27%) Net Interest Income (TE) $237.5 million See slide 14 in the 2Q21 earnings release Expect net interest income to be flat to slightly down linked-quarter Expect net interest income (TE) to be down 1%-2% for full year 2021 vs. 2020; impacted by rates, PPP forgiveness and limited loan growth in 2H20 and 1H21 (base for 2020 = $955.5 million) Reserve for Credit Losses $429 million or 2.03% of total loans $27.7 million reserve release, ($10.5 million in NCOs; $17.2 million negative provision) Expect continued modest reserve releases Future assumptions in economic forecasts will drive level of reserves and include vaccination rates, size and timing of government infrastructure spend, and resolution of the coronavirus pandemic Noninterest Income $94.3 million Includes $2.8 million of nonoperating income Expect fees to be down $3 to $5 million linked-quarter ** Expect fees to improve 7%-9% y-o-y as improvements in most fee categories are partially offset by lower secondary mortgage fees (base for 2020 = $324.4 million) Noninterest Expense $236.8 million Includes $45.0 million of nonoperating items Expect operating expenses to be flat linked-quarter ** Expect expenses to be down 3%-4% in 2021 (base for 2020 = $788.8 million) with 4Q21 expense level of $187 million a run-rate for 2022 overall expense ** Effective Tax Rate 18.9% 19%-20% 19%-20% * See slide 7 for details on PPP loans ** Excludes 2Q21 nonoperating items
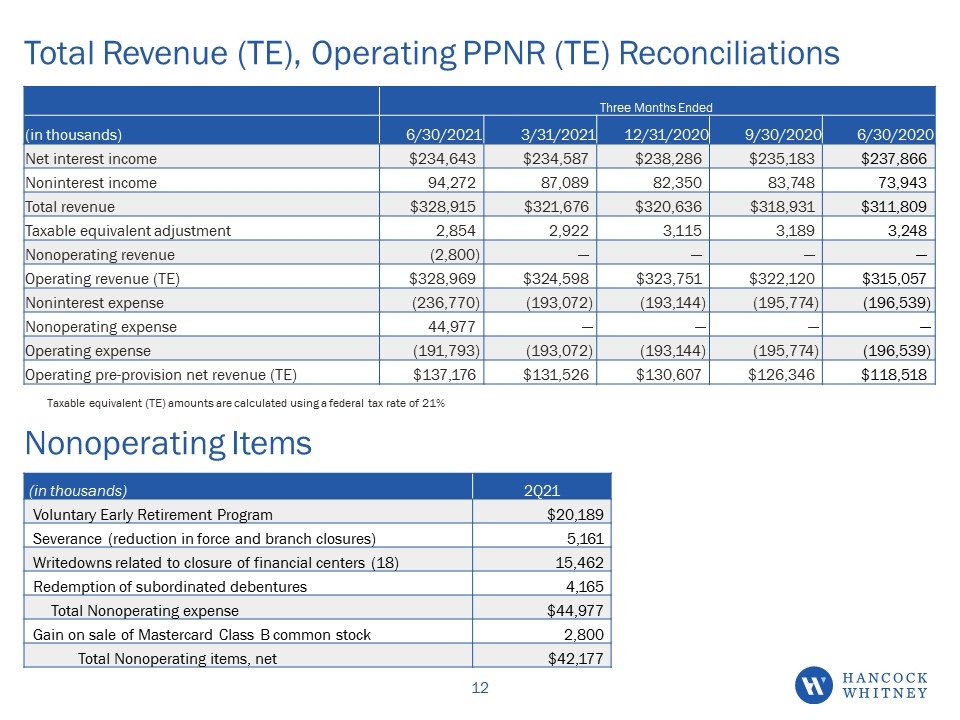
Total Revenue (TE), Operating PPNR (TE) Reconciliations Three Months Ended (in thousands) 6/30/2021 3/31/2021 12/31/2020 9/30/2020 6/30/2020 Net interest income $234,643 $234,587 $238,286 $235,183 $237,866 Noninterest income 94,272 87,089 82,350 83,748 73,943 Total revenue $328,915 $321,676 $320,636 $318,931 $311,809 Taxable equivalent adjustment 2,854 2,922 3,115 3,189 3,248 Nonoperating revenue (2,800) — — — — Operating revenue (TE) $328,969 $324,598 $323,751 $322,120 $315,057 Noninterest expense (236,770) (193,072) (193,144) (195,774) (196,539) Nonoperating expense 44,977 — — — — Operating expense (191,793) (193,072) (193,144) (195,774) (196,539) Operating pre-provision net revenue (TE) $137,176 $131,526 $130,607 $126,346 $118,518 Total Revenue (TE), Operating PPNR (TE) Reconciliations Taxable equivalent (TE) amounts are calculated using a federal income tax rate of 21%. Three Months Ended (in thousands) 12/31/2020 9/30/2020 6/30/2020 3/31/2020 12/31/2019 Net interest income $238,286 $235,183 $237,866 $231,188 $233,156 Noninterest income 82,350 83,748 73,943 84,387 82,924 Total revenue $320,636 $318,931 $311,809 $315,575 $316,080 Taxable equivalent adjustment 3,115 3,189 3,248 3,448 3,580 Total revenue (TE) $323,751 $322,120 $315,057 $319,023 $319,660 Noninterest expense (193,144) (195,774) (196,539) (203,335) (197,856) Nonoperating expense — — — — 3,856 Operating pre-provision net revenue $130,607 $126,346 $118,518 $115,688 $125,660 CHANCOCK WHITNEY 31 Taxable equivalent (TE) amounts are calculated using a federal tax rate of 21% (in thousands) 2Q21 Voluntary Early Retirement Program $20,189 Severance (reduction in force and branch closures) 5,161 Writedowns related to closure of financial centers (18) 15,462 Redemption of subordinated debentures 4,165 Total Nonoperating expense $44,977 Gain on sale of Mastercard Class B common stock 2,800 Total Nonoperating items, net $42,177 Nonoperating Items
Mid-3Q21 Investor Meetings 9/1/2021 HNCOCK WHITNEY
