Attached files
Table of Contents
UNITED STATES
SECURITIES AND EXCHANGE COMMISSION
WASHINGTON, D. C. 20549
FORM 10-K
| x | ANNUAL REPORT PURSUANT TO SECTION 13 OR 15(d) OF THE SECURITIES EXCHANGE ACT OF 1934 |
For the fiscal year ended December 31, 2009.
OR
| ¨ | TRANSITION REPORT PURSUANT TO SECTION 13 OR 15(d) OF THE SECURITIES EXCHANGE ACT OF 1934 |
Commission file number 0-13089
Hancock Holding Company
(Exact name of registrant as specified in its charter)
| Mississippi | 64-0693170 | |
| (State or other jurisdiction of incorporation or organization) |
(I.R.S. Employer Identification Number) |
| One Hancock Plaza, Gulfport, Mississippi | 39501 | (228) 868-4727 | ||
| (Address of principal executive offices) | (Zip Code) | Registrant’s telephone number, including area code |
Securities registered pursuant to Section 12(b) of the Act:
| COMMON STOCK, $3.33 PAR VALUE | The NASDAQ Stock Market, LLC | |
| (Title of Class) | (Name of Exchange on Which Registered) |
Securities registered pursuant to Section 12(g) of the Act: NONE
Indicate by check mark if the registrant is a well-known seasoned issuer, as defined in Rule 405 of the Securities Act. Yes x No ¨
Indicate by check mark if the registrant is not required to file reports pursuant to Section 13 or Section 15(d) of the Act. Yes ¨ No x
Indicate by check mark whether the registrant (1) has filed all reports required to be filed by Section 13 or 15(d) of the Securities Exchange Act of 1934 during the preceding 12 months (or for such shorter period that the registrant was required to file such reports) and (2) has been subject to such filing requirements for the past 90 days. Yes x No ¨
Indicate by check mark whether the registrant has submitted electronically and posted on its corporate Web site, if any, every Interactive Data File required to be submitted and posted pursuant to Rule 405 of Regulation S-T during the preceding 12 months (or for such shorter period that the registrant was required to submit and post such files). Yes ¨ No ¨
Indicate by check mark if disclosure of delinquent filers pursuant to Item 405 of Regulation S-K is not contained herein, and will not be contained, to the best of registrant’s knowledge, in definitive proxy or information statements incorporated by reference in Part III of this Form 10-K or any amendment to this Form 10-K. Yes ¨ No x
Indicate by check mark whether the registrant is a large accelerated filer, an accelerated filer, or a non-accelerated filer. See definition of “accelerated filer and large accelerated filer” in Rule 12b-2 of the Exchange Act. (Check One):
| Large accelerated filer |
x |
Accelerated filer |
¨ | |||
| Non-accelerated filer |
¨ |
Smaller reporting company |
¨ | |||
Indicate by check mark whether the registrant is a shell company (as defined in Rule 12b-2 of the Act). Yes ¨ No x
The aggregate market value of the voting stock held by nonaffiliates of the registrant as of June 30, 2009 was $983,015,361 based upon the closing market price on NASDAQ as of such date. For purposes of this calculation only, shares held by nonaffiliates are deemed to consist of (a) shares held by all shareholders other than directors and executive officers of the registrant plus (b) shares held by directors and officers as to which beneficial ownership has been disclaimed.
On February 1, 2010, the registrant had outstanding 36,851,700 shares of common stock for financial statement purposes.
DOCUMENTS INCORPORATED BY REFERENCE
Portions of the Registrant’s Annual Report to Stockholders for the year ended December 31, 2009 are incorporated by reference into Part I and Part II of this report.
Portions of the definitive Proxy Statement used in connection with the Registrant’s Annual Meeting of Shareholders to be held on March 17, 2010 are incorporated by reference into Part III of this report.
Table of Contents
Form 10-K
Index
| PART I |
||||
| ITEM 1. |
1 | |||
| ITEM 1A. |
12 | |||
| ITEM 1B. |
19 | |||
| ITEM 2. |
19 | |||
| ITEM 3. |
20 | |||
| ITEM 4. |
20 | |||
| PART II |
||||
| ITEM 5. |
20 | |||
| ITEM 6. |
23 | |||
| ITEM 7. |
MANAGEMENT’S DISCUSSION AND ANALYSIS OF FINANCIAL CONDITION AND RESULTS OF OPERATIONS |
26 | ||
| ITEM 7A. |
54 | |||
| ITEM 8. |
55 | |||
| ITEM 9. |
CHANGES IN AND DISAGREEMENTS WITH ACCOUNTANTS ON ACCOUNTING AND FINANCIAL DISCLOSURE |
106 | ||
| ITEM 9A. |
107 | |||
| ITEM 9B. |
107 | |||
| PART III |
||||
| ITEM 10. |
108 | |||
| ITEM 11. |
108 | |||
| ITEM 12. |
SECURITY OWNERSHIP OF CERTAIN BENEFICIAL OWNERS AND MANAGEMENT AND RELATED STOCKHOLDER MATTERS |
108 | ||
| ITEM 13. |
CERTAIN RELATIONSHIPS AND RELATED TRANSACTIONS, AND DIRECTOR INDEPENDENCE |
108 | ||
| ITEM 14. |
108 | |||
| PART IV |
||||
| ITEM 15. |
108 | |||
Table of Contents
PART I
| ITEM 1: | BUSINESS |
ORGANIZATION AND RECENT DEVELOPMENTS
Hancock Holding Company (the Company), organized in 1984 as a bank holding company registered under the Bank Holding Company Act of 1956, as amended, is headquartered in Gulfport, Mississippi. In 2002, the Company qualified as a financial holding company giving it broader powers. The Company operates through four wholly-owned bank subsidiaries, Hancock Bank, Gulfport, Mississippi (Hancock Bank MS), Hancock Bank of Louisiana, Baton Rouge, Louisiana (Hancock Bank LA), Hancock Bank of Florida, Tallahassee, Florida (Hancock Bank FL) and Hancock Bank of Alabama, Mobile, Alabama (Hancock Bank AL). Effective January 1, 2010, Hancock Bank of Florida will be merged into Hancock Bank. Hancock Bank MS, Hancock Bank LA, Hancock Bank FL and Hancock Bank AL are referred to collectively as the “Banks”.
On October 26, 2009, the company closed a very successful common stock offering. In connection with the offering, the company issued 4,945,000 shares of common stock at a price of $35.50. Gross proceeds were $175.5 million with net proceeds of $167.3 million after expenses. The proceeds of the offering are intended to be used for general corporate purposes, which may include financing acquisition opportunities and other expansion efforts.
On December 18, 2009, the Company acquired the assets and assumed the liabilities of Panama City, FL, based Peoples First Community Bank (Peoples First) through a purchase and assumption agreement containing a loss-sharing clause with the Federal Deposit Insurance Corporation (FDIC). The loss-sharing clause lessens the significant credit risk that usually accompanies a more traditional merger or acquisition. As a result of the loss-sharing clause, FDIC will cover all acquired loans with reimbursement of 80 percent of losses up to $385 million and 95 percent of losses beyond $385 million. The Company recorded an FDIC loss share receivable of $325.6 million. Hancock Bank acquired approximately $1.71 billion in assets and assumed $1.69 billion in liabilities. These values are preliminary and subject to refinement for up to one year after the closing date of the acquisition as additional information relative to closing date may become available. Other real estate owned was retained by the FDIC. The acquisition resulted in a pretax bargain purchase gain of $33.6 million and pretax merger related expenses of $3.7 million. Peoples First has 29 branches in the Florida Panhandle and Central Florida.
The Banks are community oriented and focus primarily on offering commercial, consumer and mortgage loans and deposit services to individuals and small to middle market businesses in their respective market areas. The Company’s operating strategy is to provide its customers with the financial sophistication and breadth of products of a regional bank, while successfully retaining the local appeal and level of service of a community bank. At December 31, 2009, the Company had total assets of $8.7 billion and 2,240 employees on a full-time equivalent basis.
Hancock Bank MS was originally chartered as Hancock County Bank in 1899. Since its organization, the strategy of Hancock Bank MS has been to achieve a dominant market share on the Mississippi Gulf Coast. Prior to a series of acquisitions begun in 1985, growth was primarily internal and was accomplished by branch expansions in areas of population growth where no dominant financial institution previously served the market area. Economic expansion on the Mississippi Gulf Coast has resulted primarily from growth of military and government-related facilities, tourism, port facility activities, industrial complexes and the gaming industry. Based on the most current available published data, Hancock Bank MS has the largest deposit market share in each of the following five counties: Harrison, Hancock, Jackson, Lamar and Pearl River. In addition, Hancock Bank MS has a presence in the following counties: Forrest and Jefferson Davis. At December 31, 2009, Hancock Bank MS had total assets of $5.3 billion and 1,583 employees on a full-time equivalent basis.
In August 1990, the Company formed Hancock Bank LA to assume the deposit liabilities and acquire the consumer loan portfolio, corporate credit card portfolio and non-adversely classified securities portfolio of American Bank and Trust, Baton Rouge, Louisiana, (AmBank), from the Federal Deposit Insurance Corporation (FDIC). Economic expansion in East Baton Rouge Parish has resulted from growth in state government and related service industries, educational and medical complexes, petrochemical industries, port facility activities and transportation and related industries. With the purchase of two Dryades Savings Bank, F.S.B. branches in 2003 and the 2007 opening of a new financial center in New Orleans’ Central Business District, Hancock Bank LA established a long-awaited presence in the Greater New Orleans area. At December 31, 2009, Hancock Bank LA had total assets of $2.9 billion and 561 employees on a full-time equivalent basis.
1
Table of Contents
Hancock Bank FL was formed in March 2004 with the acquisition of Tallahassee’s Guaranty National Bank. In addition to the five branches acquired in the Tallahassee area in 2004, Hancock Bank FL has since opened two more branches in the Pensacola market. Effective January 1, 2010, Hancock Bank of Florida will be merged into Hancock Bank. Hancock Bank FL had total assets of $351.7 million and 54 employees on a full-time equivalent basis at December 31, 2009.
In February 2007, Hancock Bank AL was incorporated in Mobile, AL. During 2007 and 2008, five branches have been opened to serve the Mobile area and Alabama’s Eastern Shore. At December 31, 2009, Hancock Bank AL had total assets of $179.7 million and 42 employees on a full-time equivalent basis.
CURRENT OPERATIONS
Loan Production and Credit Review
The Banks’ primary lending focus is to provide commercial, consumer, commercial leasing and real estate loans to consumers and to small and middle market businesses in their respective market areas. The Banks have no significant concentrations of loans to particular borrowers or industries or loans to any foreign entities. Each loan officer has Board approved loan limits on the principal amount of secured and unsecured loans that can be approved for a single borrower without prior approval of one or more Regional Credit Officers. All loans, however, must meet the credit underwriting standards and loan policies of the Banks.
All loans over an individual loan officer’s Board approved lending authority must be approved by one of the Bank’s centralized loan underwriting units, by a senior lender or one or more Regional Credit Officers. Each loan file is reviewed by the Bank’s loan operations quality assurance function, a component of its loan review system, to ensure proper documentation and asset quality.
Loan Review and Asset Quality
Each Bank’s portfolio of loan relationships aggregating $500,000 or more is reviewed every 12 to 18 months by the Bank’s Loan Review staff to identify any deficiencies and report them to management to take corrective actions as necessary. Periodically, selected loan relationships aggregating less than $500,000 are also reviewed. As a result of such reviews, each Bank places on its Watch list loans requiring close or frequent review. All loans over $100,000 classified by a regulatory auditor are also placed on the Watch list. All Watch list and past due loans are reviewed monthly by the Banks’ senior lending officers. All Watch list loans are reviewed monthly by the Bank’s Asset Quality Committee and quarterly by the Banks’ Board of Directors’ Loan Oversight Committee.
In addition, in the approval process, all loans to a particular borrower are considered, regardless of classification, each time such borrower requests a renewal or extension of any loan or requests a new loan. All lines of credit are reviewed before renewal. The Banks currently have mechanisms in place that require borrowers to submit annual financial statements, except borrowers with secured installment and residential mortgage loans.
Consumer loans which become 30 days delinquent are reviewed regularly by management. As a matter of policy, loans are placed on a non-accrual status when (1) payment in full, of principal or interest is not expected or (2) the principal or interest has been in default for a period of 90 days, unless the loan is well secured and in the process of collection.
The Banks follow the standard FDIC loan classification system. This system provides management with (1) a general view of the quality of the overall loan portfolio (each Bank’s loan portfolio and each commercial loan officer’s loan portfolio) and (2) information on specific loans that may need individual attention.
2
Table of Contents
The Bank’s nonperforming assets, consisting of real property, vehicles and other items held for resale, were acquired generally through the process of foreclosure. At December 31, 2009, the book value of those assets held for resale was approximately $14.3 million.
Securities Portfolio
The Banks maintain portfolios of securities consisting primarily of U.S. Treasury securities, U.S. government agency issues, agency mortgage-backed securities, agency CMOs and tax-exempt obligations of states and political subdivisions. The portfolios are designed to provide liquidity to fund loan growth and deposit outflows while maximizing interest income within pre-defined risk parameters. Therefore, the Banks invest only in high quality securities of investment grade quality and with a target effective duration, for the overall portfolio, generally between two to five years.
The Banks’ policies limit investments to securities having a rating of no less than “Baa”, or its equivalent by a Nationally Recognized Statistical Rating Agency, except for certain obligations of Mississippi, Louisiana, Florida or Alabama counties, parishes and municipalities.
Deposits
The Banks have several programs designed to attract depository accounts offered to consumers and to small and middle market businesses at interest rates generally consistent with market conditions. Additionally, the Banks operate more than 160 ATMs at the Company’s banking offices as well as free-standing ATMs at other locations. As members of regional and international ATM networks such as “STAR”, “PLUS” and “CIRRUS”, the Banks offer customers access to their depository accounts from regional, national and international ATM facilities. Deposit flows are controlled by the Banks primarily through pricing, and to a certain extent, through promotional activities. Management believes that the rates it offers, which are posted weekly on deposit accounts, are generally competitive with other financial institutions in the Banks’ respective market areas.
Trust Services
The Banks, through their respective Trust Departments, offer a full range of trust services on a fee basis. The Banks act as executor, administrator or guardian in administering estates. Also provided are investment custodial services for individuals, businesses and charitable and religious organizations. In their trust capacities, the Banks provide investment management services on an agency basis and act as trustee for pension plans, profit sharing plans, corporate and municipal bond issues, living trusts, life insurance trusts and various other types of trusts created by or for individuals, businesses and charitable and religious organizations. As of December 31, 2009, the Trust Departments of the Banks had approximately $7.5 billion of assets under administration compared to $7.7 billion as of December 31, 2008. As of December 31, 2009, $4.3 billion of administered assets were corporate trust accounts and the remaining balances were personal, employee benefit, estate and other trust accounts.
Operating Efficiency Strategy
The primary focus of the Company’s operating strategy is to increase operating income and to reduce operating expense. A Company’s operating efficiency ratio indicates the percentage of each dollar of net revenue that is used to fund operating expenses. Net revenue for a financial institution is the total of net interest income plus non-interest income, excluding securities transactions gains or losses. Operating expenses exclude the amortization of intangibles.
Other Activities
Hancock Bank MS has 6 subsidiaries through which it engages in the following activities: providing consumer financing services; owning, managing and maintaining certain real property; providing general insurance agency services; holding investment securities; marketing credit life insurance; and providing discount investment brokerage services. The income of these subsidiaries generally accounts for less than 10% of the Company’s total net earnings.
3
Table of Contents
During 2001, the Company began servicing mortgage loans for the Federal National Mortgage Association. At that time the loans serviced were originated and closed by the Company’s mortgage subsidiary. The servicing activity was also performed by this same subsidiary. In the middle of 2003, however, the Company modified its strategy and reverted to selling the majority of its conforming loans with servicing released. In December 2004, the Company’s mortgage subsidiary merged with Hancock Bank MS, its parent. Currently all mortgage activity is being reported by Hancock Bank MS, Hancock Bank of Louisiana, Hancock Bank of Florida and Hancock Bank of Alabama.
Hancock Bank MS also owns approximately 3,700 acres of timberland in Hancock County, Mississippi, most of which was acquired through foreclosure in the 1930’s. Timber sales and oil and gas leases on this acreage generate less than 1% of the Company’s annual net income.
Competition
The deregulation of the financial services industry, the elimination of many previous distinctions between commercial banks and other financial institutions as well as legislation enacted in Mississippi, Louisiana and other states allowing state-wide branching, multi-bank holding companies and regional interstate banking have all served to foster a highly competitive environment for commercial banking in our market area. The principal competitive factors in the markets for deposits and loans are interest rates and fee structures associated with the various products offered. We also compete through the efficiency, quality, range of services and products we provide, as well as the convenience provided by an extensive network of customer access channels including local branch offices, ATM’s, online banking, and telebanking centers. Access to the bank’s extensive network of customer access points is further enhanced by convenient hours including Saturday banking at selected branch locations and through the bank’s telebanking service center.
In attracting deposits and in our lending activities, we generally compete with other commercial banks, savings associations, credit unions, mortgage banking firms, consumer finance companies, securities brokerage firms, mutual funds and insurance companies and other financial institutions.
Available Information
We maintain an internet website at www.hancockbank.com. We make available free of charge on the website our annual reports on Form 10-K, quarterly reports on Form 10-Q, current reports on Form 8-K, and amendments to those reports filed with the Securities and Exchange Commission. Our Annual Report to Stockholders is also available on our website. These reports are made available on our website as soon as reasonably practical after the reports are filed with the Commission. Information on our website is not incorporated into this Form 10-K or our other securities filings and is not part of them.
SUPERVISION AND REGULATION
Bank Holding Company Regulation
General
The Company is subject to extensive regulation by the Board of Governors of the Federal Reserve System (the Federal Reserve) pursuant to the Bank Holding Company Act of 1956, as amended (the Bank Holding Company Act). On January 26, 2002 the Company qualified as a financial holding company, giving it broader powers as discussed below. To date, the Company has exercised its powers as a financial holding company to acquire a non-controlling interest in a third party service provider for insurance companies and, in December 2003, acquired Magna Insurance Company. The Company also is required to file certain reports with, and otherwise complies with the rules and regulations of, the Securities and Exchange Commission (the Commission) under federal securities laws.
4
Table of Contents
Federal Regulation
The Bank Holding Company Act generally prohibits a corporation owning a bank from engaging in activities other than banking, managing or controlling banks or other permissible subsidiaries. Acquiring or obtaining control of more than 5% of the voting shares of any company engaged in activities other than those activities determined by the Federal Reserve to be so closely related to banking, managing or controlling banks as to be proper incident thereto is also prohibited. In determining whether a particular activity is permissible, the Federal Reserve considers whether the performance of the activity can reasonably be expected to produce benefits to the public that outweigh possible adverse effects. For example: making, acquiring or servicing loans; leasing personal property; providing certain investment or financial advice; performing certain data processing services; acting as agent or broker in selling credit life insurance, and performing certain insurance underwriting activities have all been determined by regulations of the Federal Reserve to be permissible activities. The Bank Holding Company Act does not place territorial limitations on permissible bank-related activities of bank holding companies. Despite prior approval, however, the Federal Reserve has the power to order a holding company or its subsidiaries to terminate any activity or its control of any subsidiary when it has reasonable cause to believe that continuation of such activity or control of such subsidiary constitutes a serious risk to the financial safety, soundness or stability of any bank subsidiary of that holding company.
The Bank Holding Company Act requires every bank holding company to obtain the prior approval of the Federal Reserve: (1) before it may acquire ownership or control of any voting shares of any bank if, after such acquisition, such bank holding company will own or control more than 5% of the voting shares of such bank, (2) before it or any of its subsidiaries other than a bank may acquire all of the assets of a bank, (3) before it may merge with any other bank holding company, or (4) before it may engage in permissible non-banking activities. In reviewing a proposed acquisition, the Federal Reserve considers financial, managerial and competitive aspects. The future prospects of the companies and banks concerned and the convenience and needs of the community to be served must also be considered. The Federal Reserve also reviews the indebtedness to be incurred by a bank holding company in connection with the proposed acquisition to ensure that the holding company can service such indebtedness without adversely affecting the capital requirements of the holding company or its subsidiaries. The Bank Holding Company Act further requires that consummation of approved bank holding company or bank acquisitions or mergers must be delayed for a period of not less than 15 or more than 30 days following the date of approval. During such 15 to 30-day period, complaining parties may obtain a review of the Federal Reserve’s order granting its approval by filing a petition in the appropriate United States Court of Appeals petitioning that the order be set aside.
On November 12, 1999, President Clinton signed into law the Gramm-Leach-Bliley Act of 1999 (the “Financial Services Modernization Act”). The Financial Services Modernization Act repeals the two affiliation provisions of the Glass-Steagall Act: Section 20, which restricted the affiliation of Federal Reserve Member Banks with firms “engaged principally” in specified securities activities; and Section 32, which restricts officer, director, or employee interlocks between a member bank and any company or person “primarily engaged” in specified securities activities. In addition, the Financial Services Modernization Act also contains provisions that expressly preempt any state law restricting the establishment of financial affiliations, primarily related to insurance. The general effect of the law is to establish a comprehensive framework to permit affiliations among qualified bank holding companies, commercial banks, insurance companies, securities firms, and other financial service providers by revising and expanding the Bank Holding Company Act framework to permit a holding company system to engage in a full range of financial activities through a new entity known as a Financial Holding Company. “Financial activities” is broadly defined to include not only banking, insurance, and securities activities, but also merchant banking and additional activities that the Federal Reserve, in consultation with the Secretary of the Treasury, determines to be financial in nature, incidental to such financial activities, or complementary activities that do not pose a substantial risk to the safety and soundness of depository institutions or the financial system generally.
Generally, the Financial Services Modernization Act:
| • | Repeals historical restrictions on, and eliminates many federal and state law barriers to, affiliations among banks, securities firms, insurance companies, and other financial service providers; |
| • | Provides a uniform framework for the functional regulation of the activities of banks, savings institutions, and their holding companies; |
| • | Broadens the activities that may be conducted by national banks, banking subsidiaries of bank holding companies, and their financial subsidiaries; |
5
Table of Contents
| • | Provides an enhanced framework for protecting the privacy of consumer information; |
| • | Adopts a number of provisions related to the capitalization, membership, corporate governance, and other measures designed to modernize the Federal Home Loan Bank system; |
| • | Modifies the laws governing the implementation of the Community Reinvestment Act (“CRA”); and |
| • | Addresses a variety of other legal and regulatory issues affecting both day-to-day operations and long-term activities of financial institutions. |
The Financial Services Modernization Act requires that each bank subsidiary of a financial holding company be well capitalized and well managed as determined by the subsidiary bank’s principal regulator. To be considered well managed, the bank must have received at least a satisfactory composite rating and a satisfactory management rating at its last examination. To be well capitalized, the bank must have a leverage capital ratio of 5%, a Tier 1 Risk-based capital ratio of 6% and a total risk-based capital ratio of 10%. These ratios are discussed further below. In the event a financial holding company becomes aware that a subsidiary bank ceases to be well capitalized or well managed, it must notify the Federal Reserve and enter into an agreement to cure such condition. The consequences of a failure to cure such condition are that the Federal Reserve Board may order divestiture of the bank. Alternatively, a financial holding company may comply with such order by ceasing to engage in the financial holding company activities that are unrelated to banking or otherwise impermissible for a bank holding company.
The Federal Reserve has adopted capital adequacy guidelines for use in its examination and regulation of bank holding companies and financial holding companies. The regulatory capital of a bank holding company or financial holding company under applicable federal capital adequacy guidelines is particularly important in the Federal Reserve’s evaluation of a holding company and any applications by the bank holding company to the Federal Reserve. If regulatory capital falls below minimum guideline levels, a financial holding company may lose its status as a financial holding company and a bank holding company or bank may be denied approval to acquire or establish additional banks or non-bank businesses or to open additional facilities. In addition, a financial institution’s failure to meet minimum regulatory capital standards can lead to other penalties, including termination of deposit insurance or appointment of a conservator or receiver for the financial institution. There are two measures of regulatory capital presently applicable to bank holding companies: (1) risk-based capital and (2) leverage capital ratios.
The Federal Reserve rates bank holding companies by a component and composite 1-5 rating system. This system is designed to help identify institutions, which require special attention. Financial institutions are assigned ratings based on evaluation and rating of their financial condition and operations. Components reviewed include capital adequacy, asset quality, management capability, the quality and level of earnings, the adequacy of liquidity and sensitivity to interest rate fluctuations.
The leverage ratios adopted by the Federal Reserve require all but the most highly rated bank holding companies to maintain Tier 1 Capital at 4% of total assets. Certain bank holding companies having a composite 1 rating and not experiencing or anticipating significant growth may satisfy the Federal Reserve guidelines by maintaining Tier 1 Capital of at least 3% of total assets. Tier 1 Capital for bank holding companies includes: stockholders’ equity, non-controlling interest in equity accounts of consolidated subsidiaries and qualifying perpetual preferred stock. In addition, Tier 1 Capital excludes goodwill and other disallowed intangibles. The Company’s leverage capital ratio at December 31, 2009 was 10.60% and 8.06% at December 31, 2008.
The risk-based capital guidelines are designed to make regulatory capital requirements more sensitive to differences in risk profiles among banks and bank holding companies, to account for off-balance sheet exposure and to minimize disincentives for holding liquid assets. Under the risk-based capital guidelines, assets are assigned to one of four risk categories: 0%, 20% 50% and 100%. As an example, U.S. Treasury securities are assigned to the 0% risk category while most categories of loans are assigned to the 100% risk category. A two-step process determines the risk weight of off-balance sheet items such as standby letters of credit. First, the amount of the off-balance sheet item is multiplied by a credit conversion factor of either 0%, 20%, 50% or 100%. The result is then assigned to one of the four risk categories. At December 31, 2009, the Company’s off-balance sheet items aggregated $1.1 billion; however, after the credit conversion these items represented $409.7 million of balance sheet equivalents.
6
Table of Contents
The primary component of risk-based capital is Tier 1 Capital, which for the Company is essentially equal to common stockholders’ equity, less goodwill and other intangibles. Tier 2 Capital, which consists primarily of the excess of any perpetual preferred stock, mandatory convertible securities, subordinated debt and general allowances for loan losses, is a secondary component of risk-based capital. The risk-weighted asset base is equal to the sum of the aggregate dollar values of assets and off-balance sheet items in each risk category, multiplied by the weight assigned to that category. A ratio of Tier 1 Capital to risk-weighted assets of at least 4% and a ratio of Total Capital (Tier 1 and Tier 2) to risk-weighted assets of at least 8% must be maintained by bank holding companies. At December 31, 2009, the Company’s Tier 1 and Total Capital ratios were 11.99% and 13.04%, respectively. At December 31, 2008, the Company’s Tier 1 and Total Capital ratios were 10.66% and 11.86%, respectively.
The prior approval of the Federal Reserve must be obtained before the Company may acquire substantially all the assets of any bank, or ownership or control of any voting shares of any bank, if, after such acquisition, it would own or control, directly or indirectly, more than 5% of the voting shares of such bank. In no case, however, may the Federal Reserve approve an acquisition of any bank located outside Mississippi unless such acquisition is specifically authorized by the laws of the state in which the bank to be acquired is located. The banking laws of Mississippi presently permit out-of-state banking organizations to acquire Mississippi banking organizations, provided the Mississippi banking organization has been operating for at least five years. In addition, Mississippi banking organizations were granted similar powers to acquire certain out-of-state financial institutions pursuant to the Interstate Bank Branching Act, which was adopted in 1994.
With the passage of The Interstate Banking and Branching Efficiency Act of 1994, adequately capitalized and managed bank holding companies are permitted to acquire control of banks in any state, subject to federal regulatory approval, without regard to whether such a transaction is prohibited by the laws of any state. Beginning June 1, 1997, federal banking regulators may approve merger transactions involving banks located in different states, without regard to laws of any state prohibiting such transactions; except that, mergers may not be approved with respect to banks located in states that, before June 1, 1997, enacted legislation prohibiting mergers by banks located in such state with out-of-state institutions. Federal banking regulators may permit an out-of-state bank to open new branches in another state if such state has enacted legislation permitting interstate branching. The legislation further provides that a bank holding company may not, following an interstate acquisition, control more than 10% of nationwide insured deposits or 30% of deposits in the relevant state. States have the right to adopt legislation to lower the 30% limit. Additional provisions require that interstate activities conform to the Community Reinvestment Act.
The Company is required to give the Federal Reserve prior written notice of any purchase or redemption of its outstanding equity securities if the gross consideration for the purchase or redemption, when combined with the net consideration paid for all such purchases or redemptions during the preceding 12 months, is equal to 10% or more of the Company’s consolidated net worth. The Federal Reserve may disapprove such a transaction if it determines that the proposal constitutes an unsafe or unsound practice, would violate any law, regulation, Federal Reserve order or directive or any condition imposed by, or written agreement with, the Federal Reserve.
In November 1985, the Federal Reserve adopted its Policy Statement on Cash Dividends Not Fully Covered by Earnings (the Policy Statement). The Policy Statement sets forth various guidelines that the Federal Reserve believes that a bank holding company should follow in establishing its dividend policy. In general, the Federal Reserve stated that bank holding companies should pay dividends only out of current earnings. It also stated that dividends should not be paid unless the prospective rate of earnings retention by the holding company appears consistent with its capital needs, asset quality and overall financial condition.
The Company is a legal entity separate and distinct from the Banks. There are various restrictions that limit the ability of the Banks to finance, pay dividends or otherwise supply funds to the Company or other affiliates. In addition, subsidiary banks of holding companies are subject to certain restrictions on any extension of credit to the bank holding company or any of its subsidiaries, on investments in the stock or other securities thereof and on the taking of such stock or securities as collateral for loans to any borrower. Further, a bank holding company and its subsidiaries are prohibited from engaging in certain tie-in arrangements in connection with extensions of credit, or leases or sales of property or furnishing of services.
7
Table of Contents
Bank Regulation
The operations of the Banks are subject to state and federal statutes applicable to state banks and the regulations of the Federal Reserve and the FDIC. The operation of the Banks may also be subject to applicable OCC regulation, to the extent states banks are granted parity with national banks. Such statutes and regulations relate to, among other things, required reserves, investments, loans, mergers and consolidations, issuance of securities, payment of dividends, establishment of branches and other aspects of the Banks’ operations.
Hancock Bank MS is subject to regulation and periodic examinations by the FDIC and the State of Mississippi Department of Banking and Consumer Finance. Hancock Bank LA is subject to regulation and periodic examinations by the FDIC and the Office of Financial Institutions, State of Louisiana. Hancock Bank FL is subject to regulation and periodic examinations by the FDIC and the Florida Department of Financial Services. Hancock Bank AL is subject to regulation and periodic examinations by the FDIC and the Alabama State Banking Department. These regulatory authorities examine such areas as reserves, loan and investment quality, management policies, procedures and practices and other aspects of operations. These examinations are designed for the protection of the Banks’ depositors, rather than their stockholders. In addition to these regular examinations, the Company and the Banks must furnish periodic reports to their respective regulatory authorities containing a full and accurate statement of their affairs.
As a result of the enactment of the Financial Institutions Reform, Recovery, and Enforcement Act of 1989 (FIRREA), a financial institution insured by the FDIC can be held liable for any losses incurred by, or reasonably expected to be incurred by, the FDIC in connection with (1) the default of a commonly controlled FDIC-insured financial institution or (2) any assistance provided by the FDIC to a commonly controlled financial institution in danger of default.
The Banks are members of the FDIC, and their deposits are insured as provided by law by the Deposit Insurance Fund (DIF). On December 19, 1991, the Federal Deposit Insurance Corporation Improvement Act of 1991 (FDICIA) was enacted. The Federal Deposit Insurance Act, as amended by Section 302 of FDICIA, calls for risk-related deposit insurance assessment rates. The risk classification of an institution will determine its deposit insurance premium. The Federal Deposit Insurance Reform act of 2005 created a new risk differentiation system and established a new base assessment rate schedule, effective January 1, 2007. The final rule consolidates the existing nine risk categories into four and names them Risk Categories I, II, III, and IV. Risk Category I replaces the 1A risk category. The annual rates (in basis points) are now from 7 cents to 77.5 cents per hundred dollars of insured deposits, with category I rates having a range of 7 cents to 24 cents per hundred dollars of insured deposits. In 2007, the Banks received a risk classification of I for assessment purposes. Total FICO assessments paid to the FDIC amounted to $0.6 million in 2009 and $0.6 million in 2008.
FDIC insurance expense totaled $11.3 million in 2009, which included a special assessment on June 30, 2009, of $3.4 million, and the Transaction Account Guarantee Program assessments of $0.2 million. Under the provisions of the Federal Deposit Insurance Reform Act of 2005, Hancock Bank MS and Hancock Bank LA received a one-time FDIC assessment credit of $1.9 million and $1.3 million, respectively, to be used against deposit insurance assessments beginning January 1, 2007. $1.8 million of this credit offset the entire FDIC assessment for 2007 and the remaining $1.4 million offset the 2008 assessment. FDIC insurance expense totaled $1.2 million in 2008.
In December of 2008, the FDIC adopted the proposal to raise the current assessment rates uniformly by 7 basis points for the first quarter of 2009, resulting in annualized assessment rates for Risk Category I institutions ranging from 12 to 14 basis points.
In February of 2009, the FDIC adopted a modification to the risk-based assessment system and set the initial base assessment rates beginning April 1, 2009, at 12 to 45 basis points. The initial assessment rates are subject to adjustments which may increase or decrease the total base assessment rates. These adjustments are as follows: (1) a decrease for long-term unsecured debt, including most senior and subordinated debt and, for small institutions, a portion of Tier 1 capital; (2) an increase for secured liabilities above a threshold amount; and (3) for non-Risk Category I institutions, an increase for brokered deposits above a threshold amount. These adjustments result in a total base assessment rate between 7 and 77.5 basis points.
8
Table of Contents
In May of 2009, the FDIC adopted a final rule imposing a 5 basis point special assessment based on each insured depository institution’s assets minus Tier 1 capital as of June 30, 2009.
In general, FDICIA subjects banks and bank holding companies to significantly increased regulation and supervision. FDICIA increased the borrowing authority of the FDIC in order to recapitalize the DIF, and the future borrowings are to be repaid by increased assessments on FDIC member banks. Other significant provisions of FDICIA require a new regulatory emphasis linking supervision to bank capital levels. Also, federal banking regulators are required to take prompt regulatory action with respect to depository institutions that fall below specified capital levels and to draft non-capital regulatory measures to assure bank safety.
FDICIA contains a “prompt corrective action” section intended to resolve problem institutions at the least possible long-term cost to the deposit insurance funds. Pursuant to this section, the federal banking agencies are required to prescribe a leverage limit and a risk-based capital requirement indicating levels at which institutions will be deemed to be “well capitalized,” “adequately capitalized,” “undercapitalized,” “significantly undercapitalized” and “critically undercapitalized.” In the case of a depository institution that is “critically undercapitalized” (a term defined to include institutions which still have positive net worth); the federal banking regulators are generally required to appoint a conservator or receiver.
FDICIA further requires regulators to perform annual on-site bank examinations, places limits on real estate lending and tightens audit requirements. The new legislation eliminated the “too big to fail” doctrine, which protects uninsured deposits of large banks, and restricts the ability of undercapitalized banks to obtain extended loans from the Federal Reserve Board discount window. FDICIA also imposes new disclosure requirements relating to fees charged and interest paid on checking and deposit accounts. Most of the significant changes brought about by FDICIA required new regulations.
In addition to regulating capital, the FDIC has broad authority to prevent the development or continuance of unsafe or unsound banking practices. Pursuant to this authority, the FDIC has adopted regulations that restrict preferential loans and loan amounts to “affiliates” and “insiders” of banks, require banks to keep information on loans to major stockholders and executive officers and bar certain director and officer interlocks between financial institutions. The FDIC is also authorized to approve mergers, consolidations and assumption of deposit liability transactions between insured banks and between insured banks and uninsured banks or institutions to prevent capital or surplus diminution in such transactions where the resulting, continuing or assumed bank is an insured nonmember state bank, like Hancock Bank (MS), Hancock Bank of LA, Hancock Bank of FL and Hancock Bank of AL.
Although Hancock Bank (MS), Hancock Bank of LA, Hancock Bank of FL and Hancock Bank of AL are not members of the Federal Reserve System, they are subject to Federal Reserve regulations that require the Banks to maintain reserves against transaction accounts (primarily checking accounts). Because reserves generally must be maintained in cash or in noninterest-bearing accounts, the effect of the reserve requirements is to increase the cost of funds for the Banks. The Federal Reserve regulations currently require that reserves be maintained against net transaction accounts in the amount of 3% of the aggregate of such accounts up to $44.5 million, or, if the aggregate of such accounts exceeds $44.5 million, $1.335 million plus 10% of the total in excess of $44.5 million. This regulation is subject to an exemption from reserve requirements on a limited amount of an institution’s transaction accounts.
The Financial Services Modernization Act also permits national banks, and through state parity statutes, state banks, to engage in expanded activities through the formation of financial subsidiaries. A state bank may have a subsidiary engaged in any activity authorized for state banks directly or any financial activity, except for insurance underwriting, insurance investments, real estate investment or development, or merchant banking, which may only be conducted through a subsidiary of a Financial Holding Company. Financial activities include all activities permitted under new sections of the Bank Holding Company Act or permitted by regulation.
A state bank seeking to have a financial subsidiary, and each of its depository institution affiliates, must be “well-capitalized” and “well-managed.” The total assets of all financial subsidiaries may not exceed the lesser of 45% of a bank’s total assets, or $50 billion. A state bank must exclude from its assets and equity all equity investments, including retained earnings, in a financial subsidiary. The assets of the subsidiary may not be consolidated with the bank’s assets. The bank must also have policies and procedures to assess financial subsidiary risk and protect the bank from such risks and potential liabilities.
9
Table of Contents
The Financial Services Modernization Act also includes a new section of the Federal Deposit Insurance Act governing subsidiaries of state banks that engage in “activities as principal that would only be permissible” for a national bank to conduct in a financial subsidiary. It expressly preserves the ability of a state bank to retain all existing subsidiaries. Because Mississippi permits commercial banks chartered by the state to engage in any activity permissible for national banks, the Bank will be permitted to form subsidiaries to engage in the activities authorized by the Financial Services Modernization Act. In order to form a financial subsidiary, a state bank must be well-capitalized, and the state bank would be subject to the same capital deduction, risk management and affiliate transaction rules as applicable to national banks.
In 2001, the Uniting and Strengthening America by Providing Appropriate Tools Required to Intercept and Obstruct Terrorism Act of 2001 (USA Patriot Act) was signed into law. The USA Patriot Act broadened the application of anti-money laundering regulations to apply to additional types of financial institutions, such as broker-dealers, and strengthened the ability of the U.S. Government to detect and prosecute international money laundering and the financing of terrorism. The principal provisions of Title III of the USA Patriot Act require that regulated financial institutions, including state member banks: (i) establish an anti-money laundering program that includes training and audit components; (ii) comply with regulations regarding the verification of the identity of any person seeking to open an account; (iii) take additional required precautions with non-U.S. owned accounts; and (iv) perform certain verification and certification of money laundering risk for their foreign correspondent banking relationships. The USA Patriot Act also expanded the conditions under which funds in a U.S. interbank account may be subject to forfeiture and increased the penalties for violation of anti-money laundering regulations. Failure of a financial institution to comply with the USA Patriot Act’s requirements could have serious legal and reputational consequences for the institution. The Bank has adopted policies, procedures and controls to address compliance with the requirements of the USA Patriot Act under the existing regulations and will continue to revise and update its policies, procedures and controls to reflect changes required by the USA Patriot Act and implementing regulations.
In July 2002, Congress enacted the Sarbanes-Oxley Act of 2002, which addresses, among other issues, corporate governance, auditing and accounting, executive compensation, and enhanced and timely disclosure of corporate information. Section 404 of the Sarbanes-Oxley Act requires the Company to include in its Annual Report, a report stating management’s responsibility to establish and maintain adequate internal control over financial reporting and management’s conclusion on the effectiveness of the internal controls at year end. Additionally, the Company’s independent registered public accounting firm is required to attest to and report on management’s evaluation of internal control over financial reporting.
Recent Developments
The Congress, Treasury Department and the federal banking regulators, including the FDIC, have taken broad action since early September, 2008 to address volatility in the U.S. banking system.
In October 2008, the Emergency Economic Stabilization Act of 2008 (“EESA”) was enacted. The EESA authorized the Treasury Department to purchase from financial institutions and their holding companies up to $700 billion in mortgage loans, mortgage-related securities and certain other financial instruments, including debt and equity securities issued by financial institutions and their holding companies in a troubled asset relief program (“TARP”). The purpose of TARP is to restore confidence and stability to the U.S. banking system and to encourage financial institutions to increase their lending to customers and to each other. The Treasury Department has allocated $250 billion towards the TARP Capital Purchase Program (“CPP”). Under the CPP, Treasury purchases debt or equity securities from participating institutions. The TARP also may include direct purchases or guarantees of troubled assets of financial institutions. Participants in the CPP are subject to executive compensation limits and are encouraged to expand their lending and mortgage loan modifications. On November 13, 2008, following a thorough evaluation and analysis, the Company announced it would decline the Treasury’s invitation to participate in the CPP.
EESA also temporarily increased FDIC deposit insurance on most accounts from $100,000 to $250,000. This increase has been extended until December 31, 2013.
10
Table of Contents
Following a systemic risk determination, the FDIC established a Temporary Liquidity Guarantee Program (“TLGP”) on October 14, 2008. The TLGP includes the Transaction Account Guarantee Program (“TAGP”), which provides unlimited deposit insurance coverage through June 30, 2010 for noninterest-bearing transaction accounts (typically checking accounts) and certain funds swept into noninterest-bearing savings accounts. Institutions participating in the TAGP pay a 10 basis points fee (annualized) on the balance of each covered account in excess of $250,000, while the extra deposit insurance is in place. The Company is participating in the TAGP.
It is not clear at this time what impact the EESA, the TARP Capital Purchase Program, the Temporary Liquidity Guarantee Program, other liquidity and funding initiatives of the Federal Reserve and other agencies that have been previously announced, and any additional programs that may be initiated in the future, will have on the Company or the U.S. and global financial markets.
Summary
The foregoing is a brief summary of certain statutes, rules and regulations affecting the Company and the Banks. It is not intended to be an exhaustive discussion of all the statutes and regulations having an impact on the operations of such entities.
We do not believe that the Financial Services Modernization Act will have a material adverse effect on our operations in the near-term. However, to the extent that it permits holding companies, banks, securities firms, and insurance companies to affiliate, the financial services industry may experience further consolidation. The Financial Services Modernization Act is intended to grant to community banks certain powers as a matter of right that larger institutions have accumulated on an ad hoc basis. Nevertheless, this act may have the result of increasing the amount of competition that the Company and the Banks face from larger institutions and other types of companies offering financial products, some of which may have substantially more financial resources than us.
It is not known whether EESA will have any effect on the Company’s operations.
Finally, additional bills may be introduced in the future in the United States Congress and state legislatures to alter the structure, regulation and competitive relationships of financial institutions. It cannot be predicted whether and what form any of these proposals will be adopted or the extent to which the business of the Company and the Banks may be affected thereby.
Effect of Governmental Policies
The difference between the interest rate paid on deposits and other borrowings and the interest rate received on loans and securities comprise most of a bank’s earnings. In order to mitigate the interest rate risk inherent in the industry, the banking business is becoming increasingly dependent on the generation of fee and service charge revenue.
The earnings and growth of a bank will be affected by both general economic conditions and the monetary and fiscal policy of the United States Government and its agencies, particularly the Federal Reserve. The Federal Reserve sets national monetary policy such as seeking to curb inflation and combat recession. This is accomplished by its open-market operations in United States government securities, adjustments in the amount of reserves that financial institutions are required to maintain and adjustments to the discount rates on borrowings and target rates for federal funds transactions. The actions of the Federal Reserve in these areas influence the growth of bank loans, investments and deposits and also affect interest rates on loans and deposits. The nature and timing of any future changes in monetary policies and their potential impact on the Company cannot be predicted.
Impact of Inflation
Our noninterest income and expenses can be affected by increasing rates of inflation; however, unlike most industrial companies, the assets and liabilities of financial institutions such as the Banks are primarily monetary in nature. Interest rates, therefore, have a more significant impact on the Banks’ performance than the effect of general levels of inflation on the price of goods and services.
11
Table of Contents
| ITEM 1A. | RISK FACTORS |
Making or continuing an investment in securities issued by us, including our common stock, involves certain risks that you should carefully consider. The risks and uncertainties described below are not the only risks that may have a material adverse effect on us. Additional risks and uncertainties also could adversely affect our business and results of operations. If any of the following risks actually occur, our business, financial condition or results of operations could be negatively affected, the market price for your securities could decline, and you could lose all or a part of your investment. Further, to the extent that any of the information contained in this Annual Report on Form 10-K constitutes forward-looking statements, the risk factors set forth below also are cautionary statements identifying important factors that could cause our actual results to differ materially from those expressed in any forward-looking statements made by or on behalf of us.
We may be vulnerable to certain sectors of the economy.
A portion of our loan portfolio is secured by real estate. If the economy deteriorated and depressed real estate values beyond a certain point, that collateral value of the portfolio and the revenue stream from those loans could come under stress and possibly require additional provision to the allowance for loan losses. Our ability to dispose of foreclosed real estate at prices above the respective carrying values could also be impinged, causing additional losses.
Difficult market conditions have adversely affected the industry in which we operate.
The capital and credit markets have been experiencing volatility and disruption for more than twelve months. Dramatic declines in the housing market over the past year, with falling home prices and increasing foreclosures, unemployment and under-employment, have negatively impacted the credit performance of mortgage loans and resulted in significant write-downs of asset values by financial institutions, including government-sponsored entities as well as major commercial and investment banks. These write-downs have caused many financial institutions to seek additional capital, to merge with larger and stronger institutions and, in some cases, to fail. Reflecting concern about the stability of the financial markets generally and the strength of counterparties, many lenders and institutional investors have reduced or ceased providing funding to borrowers, including to other financial institutions. This market turmoil and tightening of credit have led to an increased level of commercial and consumer delinquencies, lack of consumer confidence, increased market volatility and widespread reduction of business activity generally. We do not expect that the difficult conditions in the financial markets are likely to improve in the near future. A worsening of these conditions would likely exacerbate the adverse effects of these difficult market conditions on us and others in the financial institution industry. In particular, we may face the following risks in connection with these events:
| • | We may expect to face increased regulation of our industry, including as a result of the Emergency Economic Stabilization Act of 2008 (EESA). Compliance with such regulation may increase our costs and limit our ability to pursue business opportunities. |
| • | Market developments and the resulting economic pressure on consumers may affect consumer confidence levels and may cause increases in delinquencies and default rates, which, among other effects, could affect our charge-offs and provision for loan losses. |
| • | Competition in the industry could intensify as a result of the increasing consolidation of financial services companies in connection with current market conditions. |
| • | The current market disruptions make valuation even more difficult and subjective, and our ability to measure the fair value of our assets could be adversely affected. If we determine that a significant portion of our assets have values that are significantly below their recorded carrying value, we could recognize a material charge to earnings in the quarter during which such determination was made, our capital ratios would be adversely affected and a rating agency might downgrade our credit rating or put us on credit watch. |
12
Table of Contents
There can be no assurance that the Emergency Economic Stabilization Act of 2008 will help stabilize the U.S. Financial System.
On Oct. 3, 2008, the Emergency Economic Stabilization Act of 2008 (EESA) was signed into law in response to the current crisis in the financial sector. The U.S. Department of the Treasury and banking regulators implemented a number of programs under this legislation to address capital and liquidity issues in the banking system. There can be no assurance, however, as to the actual impact that the EESA will have on the financial markets, including the extreme levels of volatility and limited credit availability currently being experienced. The failure of the EESA to help stabilize the financial markets and a continuation or worsening of current financial market conditions could materially and adversely affect our business, financial condition, results of operations, access to credit or the trading price of our common stock.
We are subject to a risk of rapid and significant changes in market interest rates.
Our assets and liabilities are primarily monetary in nature, and as a result, we are subject to significant risks tied to changes in interest rates. Our ability to operate profitably is largely dependent upon net interest income. In 2009, net interest income made up 59% of our revenue. Unexpected movement in interest rates markedly changing the slope of the current yield curve could cause our net interest margins to decrease, subsequently decreasing net interest income. In addition, such changes could adversely affect the valuation of our assets and liabilities.
At present our one-year interest rate sensitivity position is liability sensitive, such that a gradual increase in interest rates during the next twelve months should have a significant impact on net interest income during that period. However, as with most financial institutions, our results of operations are affected by changes in interest rates and our ability to manage this risk. The difference between interest rates charged on interest-earning assets and interest rates paid on interest-bearing liabilities may be affected by changes in market interest rates, changes in relationships between interest rate indices, and/or changes in the relationships between long-term and short-term market interest rates. A change in this difference might result in an increase in interest expense relative to interest income, or a decrease in our interest rate spread.
Certain changes in interest rates, inflation, deflation, or the financial markets could affect demand for our products and our ability to deliver products efficiently.
Loan originations, and potentially loan revenues, could be adversely impacted by sharply rising interest rates. Conversely, sharply falling rates could increase prepayments within our securities portfolio lowering interest earnings from those investments. An underperforming stock market could reduce brokerage transactions, therefore reducing investment brokerage revenues; in addition, wealth management fees associated with managed securities portfolios could also be adversely affected. An unanticipated increase in inflation could cause our operating costs related to salaries & benefits, technology, and supplies to increase at a faster pace than revenues.
The fair market value of our securities portfolio and the investment income from these securities also fluctuate depending on general economic and market conditions. In addition, actual net investment income and/or cash flows from investments that carry prepayment risk, such as mortgage-backed and other asset-backed securities, may differ from those anticipated at the time of investment as a result of interest rate fluctuations.
Changes in the policies of monetary authorities and other government action could adversely affect our profitability.
The results of operations are affected by credit policies of monetary authorities, particularly the Federal Reserve Board. The instruments of monetary policy employed by the Federal Reserve Board include open market operations in U.S. government securities, changes in the discount rate or the federal funds rate on bank borrowings and changes in reserve requirements against bank deposits. In view of changing conditions in the national economy and in the money markets, particularly in light of the continuing threat of terrorist attacks and the current military operations in the Middle East, we cannot predict possible future changes in interest rates, deposit levels, loan demand or our business and earnings. Furthermore, the actions of the United States government and other governments in responding to such terrorist attacks or the military operations in the Middle East may result in currency fluctuations, exchange controls, market disruption and other adverse effects.
13
Table of Contents
Natural disasters could affect our ability to operate.
Our market areas are susceptible to hurricanes. Natural disasters, such as hurricanes, can disrupt our operations, result in damage to properties and negatively affect the local economies in which we operate.
We cannot predict whether or to what extent damage caused by future hurricanes will affect our operations or the economies in our market areas, but such weather events could cause a decline in loan originations, a decline in the value or destruction of properties securing the loans and an increase in the risk of delinquencies, foreclosures or loan losses.
Insurance.
The insurance market for financial institution coverage was significantly impacted by the economic turmoil of 2008 and 2009. Many financial institutions saw higher than usual premium increases and restrictions in limits and coverage. Because of Hancock Bank’s performance and its solid capital base, the renewal terms and conditions of the Financial Institution Insurance Program were as favorable as in prior years, with only a minimum increase in overall premiums. The long term relationship Hancock Bank has with its insurance carriers provides stability and security and should serve the bank well over the coming years.
Greater loan losses than expected may adversely affect our earnings.
We, as lenders, are exposed to the risk that our customers will be unable to repay their loans in accordance with their terms and that any collateral securing the payment of their loans may not be sufficient to assure repayment. Credit losses are inherent in the business of making loans and could have a material adverse effect on our operating results. Our credit risk with respect to our real estate and construction loan portfolio will relate principally to the creditworthiness of corporations and the value of the real estate serving as security for the repayment of loans. Our credit risk with respect to our commercial and consumer loan portfolio will relate principally to the general creditworthiness of businesses and individuals within our local markets.
We make various assumptions and judgments about the collectibility of our loan portfolio and provide an allowance for estimated loan losses based on a number of factors. We believe that our current allowance for loan losses is adequate. However, if our assumptions or judgments prove to be incorrect, the allowance for loan losses may not be sufficient to cover actual loan losses. We may have to increase our allowance in the future in response to the request of one of our primary banking regulators, to adjust for changing conditions and assumptions, or as a result of any deterioration in the quality of our loan portfolio. The actual amount of future provisions for loan losses cannot be determined at this time and may vary from the amounts of past provisions.
The projected benefit obligations of our pension plan exceed the fair value of the Plan’s assets.
Investments in the portfolio of our pension plan may not provide adequate returns to fully fund benefits as they come due, thus causing higher annual plan expenses and requiring additional contributions by us.
We may need to rely on the financial markets to provide needed capital.
Our stock is listed and traded on the NASDAQ Global Select. Although we anticipate that our capital resources will be adequate for the foreseeable future to meet our capital requirements, at times we may depend on the liquidity of the NASDAQ market to raise equity capital. If the market should fail to operate, or if conditions in the capital markets are adverse, we may be constrained in raising capital. We maintain a consistent analyst following; therefore, downgrades in our prospects by an analyst(s) may cause our stock price to fall and significantly limit our ability to access the markets for additional capital requirements. Should these risks materialize, our ability to further expand our operations through internal growth may be limited.
14
Table of Contents
Sales of a significant number of shares of our Common Stock in the public markets, or the perception of such sales, could depress the market price of our Common Stock.
Sales of a substantial number of shares of our Common Stock in the public markets and the availability of those shares for sale could adversely affect the market price of our Common Stock. In addition, future issuances of equity securities, including pursuant to outstanding options, could dilute the interests of our existing stockholders, including you, and could cause the market price of our Common Stock to decline. We may issue such additional equity or convertible securities to raise additional capital. The issuance of any additional shares of common or preferred stock could be substantially dilutive to shareholders of our Common Stock. Moreover, to the extent that we issue restricted stock units, phantom shares, stock appreciation rights, options or warrants to purchase our Common Stock in the future and those stock appreciation rights, options or warrants are exercised or as the restricted stock units vest, our shareholders may experience further dilution. Holders of our shares of Common Stock have no preemptive rights that entitle holders to purchase their pro rata share of any offering of shares of any class or series and, therefore, such sales or offerings could result in increased dilution to our shareholders. We cannot predict the effect that future sales of our Common Stock would have on the market price of our Common Stock.
We may invest or spend the proceeds in stock offerings in ways with which you may not agree and in ways that may not earn a profit.
We intend to use the proceeds of offerings for general corporate purposes, including for possible acquisition opportunities that may become available or to establish de novo branches as discussed under “Use of Proceeds.” There can be no assurances that suitable acquisition opportunities may become available, or that we will be able to successfully complete any such acquisitions. We may use the proceeds only to focus on sustaining our organic, or internal, growth, or for other purposes. In addition, we may choose to use all or a portion of the proceeds to support our capital. We retain broad discretion over the use of the proceeds from this offering and may use them for purposes other than those contemplated at the time of this offering. You may not agree with the ways we decide to use these proceeds, and our use of the proceeds may not yield any profits.
We engage in acquisitions of other businesses from time to time, including FDIC-assisted acquisitions. These acquisitions may not produce revenue or earnings enhancements or cost savings at levels or within timeframes originally anticipated and may result in unforeseen integration difficulties.
On occasion, we will engage in acquisitions of other businesses. Difficulty in integrating an acquired business or company may cause us not to realize expected revenue increases, cost savings, increases in geographic or product presence, or other anticipated benefits from any acquisition. The integration could result in higher than expected deposit attrition (run-off), loss of key employees, disruption of our business or the business of the acquired company, or otherwise adversely affect our ability to maintain relationships with customers and employees or achieve the anticipated benefits of the acquisition. We are likely to need to make additional investment in equipment and personnel to manage higher asset levels and loan balances as a result of any significant acquisition, which may adversely impact our earnings. Also, the negative effect of any divestitures required by regulatory authorities in acquisitions or business combinations may be greater than expected.
In evaluating potential acquisition opportunities we may seek to acquire failed banks through FDIC-assisted transactions. While the FDIC may, in such transactions, provide assistance to mitigate certain risks, such as sharing in exposure to loan losses, and providing indemnification against certain liabilities, of the failed institution, we may not be able to accurately estimate our potential exposure to loan losses and other potential liabilities, or the difficulty of integration, in acquiring such institution.
Depending on the condition of any institution that we may acquire, any acquisition may, at least in the near term, adversely affect our capital earnings and, if not successfully integrated following the acquisition, may continue to have such effects.
15
Table of Contents
Our growth and financial performance may be negatively impacted if we are unable to successfully execute our growth plans.
There can be no assurances that we will be successful in continuing our organic, or internal, growth, which depends upon economic conditions, our ability to identify appropriate markets for expansion, our ability to recruit and retain qualified personnel, our ability to fund growth at a reasonable cost, sufficient capital to support our growth initiatives, competitive factors, banking laws, and other factors.
We may seek to supplement our internal growth through acquisitions. We cannot predict the number, size or timing of acquisitions, or whether any such acquisition will occur at all. Our acquisition efforts have traditionally focused on targeted banking or insurance entities in markets in which we currently operate and markets in which we believe we can compete effectively. However, as consolidation of the financial services industry continues, the competition for suitable acquisition candidates may increase. We may compete with other financial services companies for acquisition opportunities, and many of these competitors have greater financial resources than we do and may be able to pay more for an acquisition than we are able or willing to pay. We also may need additional debt or equity financing in the future to fund acquisitions. We may not be able to obtain additional financing or, if available, it may not be in amounts and on terms acceptable to us. If we are unable to locate suitable acquisition candidates willing to sell on terms acceptable to us, or we are otherwise unable to obtain additional debt or equity financing necessary for us to continue making acquisitions, we would be required to find other methods to grow our business and we may not grow at the same rate we have in the past, or at all.
We must generally receive federal regulatory approval before we can acquire a bank or bank holding company. In determining whether to approve a proposed bank acquisition, federal bank regulators will consider, among other factors, the effect of the acquisition on the competition, financial condition, and future prospects. The regulators also review current and projected capital ratios and levels, the competence, experience, and integrity of management and its record of compliance with laws and regulations, the convenience and needs of the communities to be served (including the acquiring institution’s record of compliance under the Community Reinvestment Act) and the effectiveness of the acquiring institution in combating money laundering activities. We cannot be certain when or if, or on what terms and conditions, any required regulatory approvals will be granted. We may also be required to sell banks or branches as a condition to receiving regulatory approval, which condition may not be acceptable to us or, if acceptable to us, may reduce the benefit of any acquisition.
In addition to the acquisition of existing financial institutions, as opportunities arise we plan to continue de novo branching as a part of our internal growth strategy and possibly entry into new markets through de novo branching. De novo branching and any acquisition carries with it numerous risks, including the following:
| • | the inability to obtain all required regulatory approvals; |
| • | significant costs and anticipated operating losses associated with establishing a de novo branch or a new bank; |
| • | the inability to secure the services of qualified senior management; |
| • | the local market may not accept the services of a new bank owned and managed by a bank holding company headquartered outside of the market area of the new bank; |
| • | economic downturns in the new market; |
| • | the inability to obtain attractive locations within a new market at a reasonable cost; and |
| • | the additional strain on management resources and internal systems and controls. |
We have experienced to some extent many of these risks with our de novo branching to date.
16
Table of Contents
We are subject to regulation by various Federal and State entities.
We are subject to the regulations of the Securities and Exchange Commission (“SEC”), the Federal Reserve Board, the Federal Deposit Insurance Corporation, the Mississippi Department of Banking and Consumer Finance, the Louisiana Office of Financial Institutions, the Florida Office of Financial Regulation, the Alabama Banking Department and the Mississippi Department of Insurance. New regulations issued by these agencies may adversely affect our ability to carry on our business activities. We are subject to various Federal and State laws and certain changes in these laws and regulations may adversely affect our operations. Noncompliance with certain of these regulations may impact our business plans, including ability to branch, offer certain products, or execute existing or planned business strategies.
We are also subject to the accounting rules and regulations of the SEC and the Financial Accounting Standards Board. Changes in accounting rules could adversely affect the reported financial statements or our results of operations and may also require extraordinary efforts or additional costs to implement. Any of these laws or regulations may be modified or changed from time to time, and we cannot be assured that such modifications or changes will not adversely affect us.
We are subject to industry competition which may have an impact upon our success.
Our profitability depends on our ability to compete successfully. We operate in a highly competitive financial services environment. Certain competitors are larger and may have more resources than we do. We face competition in our regional market areas from other commercial banks, savings and loan associations, credit unions, internet banks, finance companies, mutual funds, insurance companies, brokerage and investment banking firms, and other financial intermediaries that offer similar services. Some of our nonbank competitors are not subject to the same extensive regulations that govern us or the Bank and may have greater flexibility in competing for business.
Another competitive factor is that the financial services market, including banking services, is undergoing rapid changes with frequent introductions of new technology-driven products and services. Our future success may depend, in part, on our ability to use technology competitively to provide products and services that provide convenience to customers and create additional efficiencies in our operations.
The price of our Common Stock is volatile and may decline.
The trading price of our Common Stock may fluctuate widely as a result of a number of factors, many of which are outside our control. In addition, the stock market is subject to fluctuations in the share prices and trading volumes that affect the market prices of the shares of many companies. These broad market fluctuations have adversely affected and may continue to adversely affect the market price of our Common Stock. Among the factors that could affect our stock price are:
| • | actual or anticipated quarterly fluctuations in our operating results and financial condition; |
| • | changes in revenue or earnings estimates or publication of research reports and recommendations by financial analysts or actions taken by rating agencies with respect to our securities or those of other financial institutions; |
| • | failure to meet analysts’ revenue or earnings estimates; |
| • | speculation in the press or investment community; |
| • | strategic actions by us or our competitors, such as acquisitions or restructurings; |
| • | actions by institutional shareholders; |
| • | fluctuations in the stock price and operating results of our competitors; |
17
Table of Contents
| • | general market conditions and, in particular, developments related to market conditions for the financial services industry; |
| • | proposed or adopted regulatory changes or developments; |
| • | anticipated or pending investigations, proceedings or litigation that involve or affect us; or |
| • | domestic and international economic factors unrelated to our performance. |
A significant decline in our stock price could result in substantial losses for individual shareholders and could lead to costly and disruptive securities litigation.
We may issue debt and equity securities or securities convertible into equity securities, any of which may be senior to our Common Stock as to distributions and in liquidation, which could negatively affect the value of our Common Stock.
In the future, we may attempt to increase our capital resources by entering into debt or debt-like financing that is unsecured or secured by all or up to all of our assets, or by issuing additional debt or equity securities, which could include issuances of secured or unsecured commercial paper, medium-term notes, senior notes, subordinated notes, preferred stock or securities convertible into or exchangeable for equity securities. In the event of our liquidation, our lenders and holders of our debt and preferred securities would receive a distribution of our available assets before distributions to the holders of our Common Stock. Because our decision to incur debt and issue securities in our future offerings will depend on market conditions and other factors beyond our control, we cannot predict or estimate the amount, timing or nature of our future offerings and debt financings. Further, market conditions could require us to accept less favorable terms for the issuance of our securities in the future.
Our results of operations depend upon the results of operations of our subsidiaries.
We are a bank holding company that conducts substantially all of our operations through our subsidiary Banks. As a result, our ability to make dividend payments on our Common Stock will depend primarily upon the receipt of dividends and other distributions from our subsidiaries.
The ability of the Banks to pay dividends or make other payments to us is limited by their obligations to maintain sufficient capital and by other general regulatory restrictions on their dividends. If these requirements are not satisfied, we will be unable to pay dividends on our Common Stock.
At June 30, 2009, the aggregate amount of dividends, which legally could be paid without prior approval of various regulatory agencies, totaled approximately $11 million by Hancock Bank MS, and $37.9 million by Hancock Bank LA. No dividends were payable by Hancock Bank AL or Hancock Bank FL.
We and/or the holders of our securities could be adversely affected by unfavorable rating actions from rating agencies.
Our ability to access the capital markets is important to our overall funding profile. This access is affected by the ratings assigned by rating agencies to us, certain of our affiliates and particular classes of securities that we and our affiliates issue. The interest rates that we pay on our securities are also influenced by, among other things, the credit ratings that we, our affiliates and/or our securities receive from recognized rating agencies. A downgrade to us, our affiliates or our securities could create obligations or liabilities to us under the terms of our outstanding securities that could increase our costs or otherwise have a negative effect on our results of operations or financial condition. Additionally, a downgrade of the credit rating of any particular security issued by us or our affiliates could negatively affect the ability of the holders of that security to sell the securities and the prices at which any such securities may be sold.
18
Table of Contents
Anti-takeover provisions in our amended articles of incorporation and bylaws, Mississippi law, and our Shareholder Rights Plan could make a third party acquisition of us difficult and may adversely affect share value.
Our amended articles of incorporation and bylaws contain provisions that make it more difficult for a third party to acquire us (even if doing so might be beneficial to our stockholders) and for holders of our securities to receive any related takeover premium for their securities. In addition, under our Shareholder Rights Plan, “rights” are issued to all Hancock common shareholders which, if activated upon an attempted unfriendly acquisition, would allow our shareholders to buy our common stock at a reduced price, thereby minimizing the risk of any potential hostile takeover.
We are also subject to certain provisions of state and federal law and our articles of incorporation may make it more difficult for someone to acquire control of us. Under federal law, subject to certain exemptions, a person, entity, or group must notify the federal banking agencies before acquiring 10% or more of the outstanding voting stock of a bank holding company, including our shares. Banking agencies review the acquisition to determine if it will result in a change of control. The banking agencies have 60 days to act on the notice, and take into account several factors, including the resources of the acquirer and the antitrust effects of the acquisition. There also are Mississippi statutory provisions and provisions in our articles of incorporation that may be used to delay or block a takeover attempt. As a result, these statutory provisions and provisions in our articles of incorporation could result in our being less attractive to a potential acquirer and limit the price that investors might be willing to pay in the future for shares of our Common Stock.
You may not receive dividends on the Common Stock.
Holders of our Common Stock are only entitled to receive such dividends as our board of directors may declare out of funds legally available for such payments. Although we have historically and routinely declared cash dividends on our Common Stock, we are not required to do so and may reduce or eliminate our Common Stock dividend in the future.
Securities issued by us, including our common stock, are not FDIC insured.
Securities issued by us, including our common stock, are not savings or deposit accounts or other obligations of any bank and are not insured by the FDIC, the Bank Insurance Fund, or any other governmental agency or instrumentality, or any private insurer, and are subject to investment risk, including the possible loss of principal.
| ITEM 1B. | UNRESOLVED STAFF COMMENTS |
None.
| ITEM 2. | PROPERTIES |
Our main office is located at One Hancock Plaza, in Gulfport, Mississippi.
We operate 185 banking and financial services offices and 166 automated teller machines across south Mississippi, Louisiana, south Alabama and Florida. We lease 98 of the 185 locations with the remainder being owned. With the acquisition of Peoples First on December 18, 2009, we leased all locations from the FDIC with the option to continue leasing the 11 locations Peoples First was leasing and the option to purchase the remaining 21 locations. In addition, Hancock Bank MS owns land and other properties acquired through foreclosures of loan collateral. The major item is approximately 3,700 acres of timber land in Hancock County, Mississippi, which Hancock Bank MS acquired by foreclosure in the 1930’s.
19
Table of Contents
| ITEM 3. | LEGAL PROCEEDINGS |
We are party to various legal proceedings arising in the ordinary course of business. In the opinion of management, after consultation with legal counsel, each matter is adequately covered by insurance and indemnification, or, if not so covered, is not expected to have a material adverse effect on our financial statements.
| ITEM 4. | SUBMISSION OF MATTERS TO A VOTE OF SECURITY HOLDERS |
There were no matters submitted to a vote of security holders during the quarter ended December 31, 2009.
PART II
| ITEM 5. | MARKET FOR THE REGISTRANT’S COMMON EQUITY, RELATED STOCKHOLDER MATTERS AND ISSUER PURCHASES OF EQUITY SECURITIES |
Market Information
Our common stock trades on the NASDAQ Stock Market under the symbol “HBHC” and is quoted in publications under “HancHd.” The following table sets forth the high and low sale prices of our common stock as reported on the NASDAQ Stock Market. These prices do not reflect retail mark-ups, mark-downs or commissions.
| High Sale |
Low Sale |
Cash Dividends Paid | |||||||||
| 2009 |
|||||||||||
| 4th quarter |
$ | 44.89 | $ | 35.26 | $ | 0.24 | |||||
| 3rd quarter |
42.38 | 29.90 | 0.24 | ||||||||
| 2nd quarter |
41.19 | 30.12 | 0.24 | ||||||||
| 1st quarter |
45.56 | 22.51 | 0.24 | ||||||||
| 2008 |
|||||||||||
| 4th quarter |
$ | 56.45 | $ | 34.20 | $ | 0.24 | |||||
| 3rd quarter |
68.42 | 33.34 | 0.24 | ||||||||
| 2nd quarter |
45.68 | 38.38 | 0.24 | ||||||||
| 1st quarter |
44.29 | 33.45 | 0.24 | ||||||||
There were 5,837 registered holders and approximately 16,643 unregistered holders of common stock of the Company at February 1, 2010 and 36,851,700 shares issued. On February 1, 2010, the high and low sale prices of the Company’s common stock as reported on the NASDAQ Stock Market were $41.18 and $40.48, respectively. The principal source of funds to the Company to pay cash dividends is the dividends received from Hancock Bank, Gulfport, Mississippi, Hancock Bank of Louisiana, Baton Rouge, Louisiana, Hancock Bank of Alabama, Mobile, Alabama, and Hancock Bank of Florida, Tallahassee, Florida. Consequently, dividends are dependent upon earnings, capital needs, regulatory policies and statutory limitations affecting the banks. Federal and state banking laws and regulations restrict the amount of dividends and loans a bank may make to its parent company. Dividends paid to the Company by Hancock Bank are subject to approval by the Commissioner of Banking and Consumer Finance of the State of Mississippi and those paid by Hancock Bank of Louisiana are subject to approval by the Commissioner for Financial Institutions of the State of Louisiana. Dividends paid by Hancock Bank of Florida are subject to approval by the Florida Department of Financial Services. The Company’s management does not expect regulatory restrictions to affect its policy of paying cash dividends. Although no assurance can be given that Hancock Holding Company will continue to declare and pay regular quarterly cash dividends on its common stock, the Company has paid regular cash dividends since 1937.
20
Table of Contents
Stock Performance Graph
Following is a line graph presentation comparing cumulative, five-year shareholder returns on an indexed basis with a performance indicator of the overall stock market and an index of peer companies selected by us. The broad market index used in the graph is the NASDAQ Market Index. The peer group index is a group of financial institutions in the southeast that are similar in asset size and business strategy; a list of the Companies included in the index follows the graph.
COMPARISON OF 5 YEAR CUMULATIVE TOTAL RETURN
AMONG HANCOCK HOLDING COMPANY,
NASDAQ COMPOSITE INDEX
AND PEER GROUP INDEX
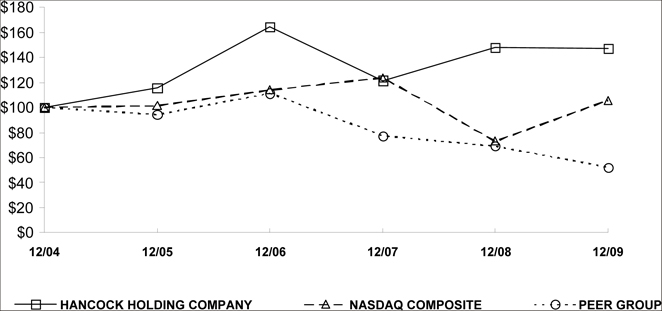
ASSUMES $100 INVESTED ON DEC.31, 2004
ASSUMES REINVESTMENT OF DIVIDENDS
FISCAL YEAR ENDING DEC. 31, 2009
| BANK OF THE OZARKS INC |
IBERIABANK CORP |
STERLING BANCSHARES | ||
| BANKATLANTIC BANCORP |
PINNACLE FINANCIAL PARTNERS |
SUPERIOR BANCORP | ||
| FNB CORPORATION FL |
RENASANT CORP |
TRUSTMARK CORP | ||
| GREEN BANKSHARES INC |
REPUBLIC BANCORP INC CLA |
UNITED COMMUNITY BANKS |
21
Table of Contents
Issuer Purchases of Equity Securities
The following table provides information with respect to purchases made by the issuer or any affiliated purchaser of the issuer’s equity securities.
| (a) | (b) | (c) | (d) | ||||||
| Total number of shares or units purchased |
Average price paid per share |
Total number of shares purchased as a part of publicly announced plans or programs (1) |
Maximum number of shares that may yet be purchased under plans or programs | ||||||
| Oct. 1, 2009 - Oct. 31, 2009 |
— | $ | — | — | 2,982,700 | ||||
| Nov. 1, 2009 - Nov. 30, 2009 |
— | — | — | 2,982,700 | |||||
| Dec.1, 2009 - Dec. 31, 2009 |
— | — | — | 2,982,700 | |||||
| Total |
— | $ | — | — | |||||
| (1) | The Company publicly announced its stock buy-back program on November 13, 2007. |
Equity Compensation Plan Information
| Plan Category |
Number of securities to be issued upon exercise of outstanding options, warrants and rights (a) |
Weighted-average exercise price of outstanding options, warrants and rights (b) |
Number of securities remaining available for future issuance under equity compensation plans (excluding securities reflected in column (a)) (c) | ||||||
| Equity compensation plans approved by security holders |
$ | 1,281,074 | $ | 27.44 | $ |
4,361,722 | |||
| Equity compensation plans not approved by security holders |
— | — | — | ||||||
| Total |
$ | 1,281,074 | $ | 27.44 | $ | 4,361,722 | |||
22
Table of Contents
| ITEM 6. | SELECTED FINANCIAL DATA |
The following tables set forth certain selected historical consolidated financial data and should be read in conjunction with “Item 7. Management’s Discussion and Analysis of Financial Condition and Results of Operations” and the consolidated Financial Statements and Notes thereto included elsewhere herein. The following information may not be deemed indicative of our future operating results.
| At and For the Years Ended December 31, | |||||||||||||||
| 2009 | 2008 | 2007 | 2006 | 2005 | |||||||||||
| (Unaudited, in thousands) | |||||||||||||||
| Period-End Balance Sheet Data: |
|||||||||||||||
| Securities |
$ | 1,612,962 | $ | 1,681,957 | $ | 1,670,208 | $ | 1,895,157 | $ | 1,953,245 | |||||
| Short-term investments |
797,262 | 549,416 | 126,281 | 222,439 | 410,226 | ||||||||||
| Loans held for sale |
36,112 | 22,290 | 18,957 | 16,946 | 24,219 | ||||||||||
| Loans, net of unearned income |
5,114,175 | 4,249,290 | 3,596,557 | 3,249,638 | 2,964,967 | ||||||||||
| Total earning assets |
7,560,511 | 6,502,953 | 5,412,003 | 5,384,180 | 5,352,657 | ||||||||||
| Allowance for loan losses |
66,050 | 61,725 | 47,123 | 46,772 | 74,558 | ||||||||||
| Total assets |
8,697,083 | 7,167,254 | 6,055,979 | 5,964,565 | 5,950,187 | ||||||||||
| Total deposits |
7,195,812 | 5,930,937 | 5,009,534 | 5,030,991 | 4,989,820 | ||||||||||
| Total common stockholders’ equity |
837,663 | 609,499 | 554,187 | 558,410 | 477,415 | ||||||||||
| Average Balance Sheet Data: |
|||||||||||||||
| Securities |
$ | 1,561,140 | $ | 1,743,998 | $ | 1,726,714 | $ | 2,222,114 | $ | 1,426,461 | |||||
| Short-term investments |
497,048 | 175,891 | 117,158 | 211,511 | 137,821 | ||||||||||
| Loans, net of unearned income |
4,310,120 | 3,873,908 | 3,428,009 | 3,062,222 | 2,883,020 | ||||||||||
| Total earning assets |
6,368,308 | 5,793,797 | 5,271,881 | 5,495,847 | 4,447,302 | ||||||||||
| Allowance for loan losses |
63,450 | 53,354 | 46,443 | 64,285 | 50,107 | ||||||||||
| Total assets |
7,099,767 | 6,426,389 | 5,851,889 | 6,031,800 | 4,931,030 | ||||||||||
| Total deposits |
5,697,599 | 5,182,407 | 4,929,176 | 5,069,427 | 4,001,426 | ||||||||||
| Total common stockholders’ equity |
674,375 | 584,805 | 562,383 | 513,656 | 475,701 | ||||||||||
23
Table of Contents
| At and For the Years Ended December 31, | ||||||||||||||||||||
| 2009 | 2008 | 2007 | 2006 | 2005 | ||||||||||||||||
| (Unaudited, in thousands) | ||||||||||||||||||||
| Key Ratios: |
||||||||||||||||||||
| Return on average assets |
1.05 | % | 1.02 | % | 1.26 | % | 1.69 | % | 1.10 | % | ||||||||||
| Return on average common equity |
11.09 | % | 11.18 | % | 13.14 | % | 19.82 | % | 11.36 | % | ||||||||||
| Net interest margin (te)* |
3.78 | % | 3.80 | % | 4.08 | % | 4.23 | % | 4.40 | % | ||||||||||
| Average loans to average deposits |
75.65 | % | 74.75 | % | 69.55 | % | 60.41 | % | 72.05 | % | ||||||||||
| Noninterest income excluding securities transactions, as a percent of total revenue (te) |
39.54 | % | 35.86 | % | 35.89 | % | 31.44 | % | 32.38 | % | ||||||||||
| Noninterest expense as a percent of total revenue (te) before amortization of purchased intangibles and securities transactions |
58.34 | % | 61.84 | % | 64.13 | % | 59.28 | % | 59.08 | % | ||||||||||
| Allowance for loan losses to period-end loans |
1.29 | % | 1.45 | % | 1.31 | % | 1.44 | % | 2.51 | % | ||||||||||
| Non-performing assets to loans plus other real estate |
1.97 | % | 0.83 | % | 0.43 | % | 0.13 | % | 0.42 | % | ||||||||||
| Allowance for loan losses to non-performing loans and accruing loans 90 days past due |
58.69 | % | 133.16 | % | 241.43 | % | 694.67 | % | 195.50 | % | ||||||||||
| Net charge-offs to average loans |
1.17 | % | 0.57 | % | 0.21 | % | 0.23 | % | 0.30 | % | ||||||||||
| FTE employees (period-end) |
2,240 | 1,952 | 1,888 | 1,848 | 1,735 | |||||||||||||||
| Common stockholders’ equity to total assets |
9.63 | % | 8.50 | % | 9.15 | % | 9.36 | % | 8.02 | % | ||||||||||
| Tangible common equity to total assets |
8.81 | % | 7.62 | % | 8.08 | % | 8.24 | % | 6.89 | % | ||||||||||
| Tier 1 leverage |
10.60 | % | 8.06 | % | 8.51 | % | 8.63 | % | 7.85 | % | ||||||||||
| Tier 1 risk-based |
11.99 | % | 10.66 | % | 11.03 | % | 12.46 | % | 11.47 | % | ||||||||||
| Total risk-based |
13.04 | % | 11.86 | % | 12.07 | % | 13.60 | % | 12.73 | % | ||||||||||
| Income Data: |
||||||||||||||||||||
| Interest income |
$ | 323,727 | $ | 335,437 | $ | 345,697 | $ | 344,063 | $ | 263,378 | ||||||||||
| Interest expense |
95,300 | 126,002 | 140,236 | 119,863 | 74,819 | |||||||||||||||
| Net interest income |
228,427 | 209,435 | 205,461 | 224,200 | 188,559 | |||||||||||||||
| Net interest income (te) |
240,487 | 219,889 | 215,000 | 232,463 | 195,936 | |||||||||||||||
| Provision for (reversal of) loan losses |
54,590 | 36,785 | 7,593 | (20,762 | ) | 42,635 | ||||||||||||||
| Noninterest income excluding storm-related insurance gain and securities transactions |
157,258 | 122,953 | 120,378 | 106,585 | 93,840 | |||||||||||||||
| Net storm-related items |
— | — | — | 5,084 | 6,584 | |||||||||||||||
| Gains/(losses) on sales of securities, net |
69 | 4,825 | 308 | (5,169 | ) | (53 | ) | |||||||||||||
| Noninterest expense excluding amortization of intangibles |
232,053 | 212,011 | 215,092 | 200,991 | 171,197 | |||||||||||||||
| Amortization of intangibles |
1,417 | 1,432 | 1,651 | 2,125 | 2,194 | |||||||||||||||
| Net income before income taxes |
97,694 | 86,985 | 101,811 | 148,346 | 72,903 | |||||||||||||||
| Net income |
74,775 | 65,366 | 73,892 | 101,802 | 54,032 | |||||||||||||||
| Net income available to common stockholders |
74,775 | 65,366 | 73,892 | 101,802 | 54,032 | |||||||||||||||
| * | Tax Equivalent (te) amounts are calculated using a marginal federal income tax rate of 35%. |
24
Table of Contents
| At and For the Years Ended December 31, | ||||||||||||||||||||
| 2009 | 2008 | 2007 | 2006 | 2005 | ||||||||||||||||
| Per Common Share Data: |
||||||||||||||||||||
| Basic earnings per share |
$ | 2.28 | $ | 2.07 | $ | 2.30 | $ | 3.12 | $ | 1.67 | ||||||||||
| Diluted earnings per share |
$ | 2.26 | $ | 2.04 | $ | 2.26 | $ | 3.05 | $ | 1.64 | ||||||||||
| Cash dividends paid |
$ | 0.960 | $ | 0.960 | $ | 0.960 | $ | 0.895 | $ | 0.720 | ||||||||||
| Book value |
$ | 22.74 | $ | 19.18 | $ | 17.71 | $ | 17.09 | $ | 14.78 | ||||||||||
| Dividend payout ratio |
42.11 | % | 46.38 | % | 41.74 | % | 28.69 | % | 43.11 | % | ||||||||||
| Weighted average number of shares outstanding |
||||||||||||||||||||
| Basic |
32,747 | 31,491 | 32,000 | 32,534 | 32,365 | |||||||||||||||
| Diluted |
32,934 | 31,883 | 32,545 | 33,304 | 32,966 | |||||||||||||||
| Number of shares outstanding (period end) |
36,840 | 31,877 | 31,295 | 32,666 | 32,301 | |||||||||||||||
| Market data: |
||||||||||||||||||||
| High sales price |
$ | 45.56 | $ | 68.42 | $ | 54.09 | $ | 57.19 | $ | 39.90 | ||||||||||
| Low sales price |
$ | 22.51 | $ | 33.34 | $ | 32.78 | $ | 37.75 | $ | 28.25 | ||||||||||
| Period-end closing price |
$ | 43.81 | $ | 45.46 | $ | 38.20 | $ | 52.84 | $ | 37.81 | ||||||||||
| Trading volume |
66,346 | 73,843 | 48,169 | 27,275 | 22,404 | |||||||||||||||
25
Table of Contents
| ITEM 7. | MANAGEMENT’S DISCUSSION AND ANALYSIS OF FINANCIAL CONDITION AND RESULTS OF OPERATIONS |
The purpose of this discussion and analysis is to focus on significant changes and events in the financial condition and results of operations of Hancock Holding Company and our subsidiaries (Hancock) during 2009 and selected prior periods. This discussion and analysis is intended to highlight and supplement data and information presented elsewhere in this report, including the consolidated financial statements and related notes. Certain information relating to prior years has been reclassified to conform to the current year’s presentation.
FORWARD-LOOKING STATEMENTS
Congress passed the Private Securities Litigation Act of 1995 in an effort to encourage corporations to provide information about a company’s anticipated future financial performance. This act provides a safe harbor for such disclosure, which protects us from unwarranted litigation, if actual results are different from management expectations. This discussion and analysis contains forward-looking statements and reflects management’s current views and estimates of future economic circumstances, industry conditions, company performance and financial results. The words “may,” “should,” “expect,” “anticipate,” “intend,” “plan,” “continue,” “believe,” “seek,” “estimate” and similar expressions are intended to identify forward-looking statements. These forward-looking statements are subject to a number of factors and uncertainties, which could cause our actual results and experience to differ from the anticipated results and expectations, expressed in such forward-looking statements.
EXECUTIVE OVERVIEW
Net income for the year ended December 31, 2009 was $74.8 million, an increase of $9.4 million, or 14.4 percent, from 2008’s net income of $65.4 million. Diluted earnings per share for 2009 were $2.26, an increase of $0.22 from 2008’s diluted earnings per share of $2.04. Our return on average assets for 2009 was 1.05 percent compared to 1.02 percent for 2008. These results include the impact of two significant events that occurred in the fourth quarter: our common stock offering and the acquisition of Peoples First Community Bank which are both more fully described below.
| • | On October 26, 2009, we closed a very successful common stock offering. In connection with the offering, we issued 4,945,000 shares of common stock at a price of $35.50. Gross proceeds were $175.5 million with net proceeds of $167.3 million after expenses. The proceeds of the offering are intended to be used for general corporate purposes, which may include financing acquisition opportunities and other expansion efforts. |
| • | On December 18, 2009, we acquired the assets and assumed the liabilities of Panama City, FL, based Peoples First Community Bank (Peoples First) through a purchase and assumption agreement containing a loss-sharing clause with the Federal Deposit Insurance Corporation (FDIC). There was no consideration paid for the acquisition. The loss-sharing clause lessens the significant credit risk that usually accompanies a more traditional merger or acquisition. As a result of the loss-sharing clause, FDIC will cover all acquired loans with reimbursement of 80 percent of losses up to $385 million and 95 percent of losses beyond $385 million. The Company recorded an FDIC loss share receivable of $325.6 million which represents the fair value of the FDIC’s portion of the losses that are expected to be incurred and reimbursed to the Company. We acquired approximately $1.71 billion in assets and assumed $1.69 billion in liabilities. These values are subject to refinement for up to one year after the closing date of the acquisition as additional information relative to the closing may become available. All of the other real estate owned (including foreclosed real estate) was retained by the FDIC. The acquisition resulted in a pretax acquisition gain of $33.6 million and pretax merger related expenses of $3.7 million. Peoples First had 29 branches in the Florida Panhandle and Central Florida. With this transaction, we increased the company’s total banking and financial services offices to more than 180 locations in Florida, Alabama, Mississippi, and Louisiana. |
Our year-end results were impacted by the continuing national economic recession. Weaknesses in residential development and rising unemployment levels in our market areas which resulted in higher charge-offs and a higher allowance for loan losses in 2009 also impacted earnings. As a result of these difficult national and regional issues, we recorded a provision for loan losses of $54.6 million, which represents an increase of $17.8 million compared to 2008. Net charge-offs for 2009 were $50.3 million, or 1.17% of average loans and were up $28.1 million compared to 2008’s net charge-offs of $22.2 million, or 0.57% of average loans. Of the $50.3 million in net charge-offs in 2008, $24.4 million was related to the commercial/real estate loans due to the ongoing recession. The weak economy also impacted our allowance for loan losses, which increased to $66.1 million at December 31, 2008 from $61.7 recorded at December 31, 2008.
26
Table of Contents
Our balance sheet showed growth during 2009. At year end, our total asset level reached $8.7 billion, an increase of $1.53 billion, or 21.3%, from December 31, 2008. The overall increase in total assets was due to the acquisition of Peoples First discussed above. Period-end loans were up $864.9 million, or 20.4%, from December 31, 2008. Loan growth increased primarily in the loan categories of commercial/ real estate (up $477.7 million), mortgage loans (up $312.2 million), and direct consumer loans (up $146.7 million.) We also experienced strong growth in deposits over the past year. Period-end deposits at December 31, 2009 were $7.2 billion, up $1.3 billion, or 21.3%, from December 31, 2008, primarily due to the acquisition of Peoples First. Deposit growth increased primarily in time deposits (up $869.1 million) and interest bearing transaction deposits (up $443.6 million.) We continue to remain very well capitalized with total equity of $837.7 million at December 31, 2009, up $228.2 million, or 37.43%, from December 31, 2008.
RESULTS OF OPERATIONS
Net Interest Income
Net interest income (te) is the primary component of our earnings and represents the difference, or spread, between revenue generated from interest-earning assets and the interest expense related to funding those assets. For internal analytical purposes, management adjusts net interest income to a “taxable equivalent” basis using a 35% federal tax rate on tax exempt items (primarily interest on municipal securities and loans). Fluctuations in interest rates, as well as volume and mix changes in earning assets and interest-bearing liabilities can materially impact net interest income (te).
Another significant statistic in the analysis of net interest income is the effective interest differential (also referred to as the net interest margin), which is the ratio of net interest income (te) to our average earning assets. The difference between the average yield on earning assets and the effective rate paid for all deposits and borrowed funds, non-interest-bearing as well as interest-bearing is the net interest spread. Since a portion of the Bank’s deposits does not bear interest, such as demand accounts, the rate paid for all funds is lower than the rate on interest-bearing liabilities alone. The net interest margin (te) for the years 2009, 2008, and 2007 was 3.78%, 3.80%, and 4.08%, respectively.
Net interest income (te) of $240.5 million was recorded for the year 2009, an increase of $20.6 million, or 9.4%, from 2008. We experienced an increase of $4.9 million, or 2.3%, from 2008 to 2007. The factors contributing to the changes in net interest income (te) for 2009, 2008 and 2007 are presented in Tables 1 and 2. Table 1 is an analysis of the components of average balance sheets, levels of interest income and expense and the resulting earning asset yields and liability rates. Table 2 details the overall changes in the level of net interest income into rate and volume.
The increase of $20.6 million in net interest income (te) in 2009 from 2008 was caused by an increase in average earnings assets of $574.5 million, or 9.9%. In 2009, our average loan growth increased $436.2 million, or 11.3%, average short-term investments increased $321.2 million, or 182.7%, and average securities decreased $182.9 million, or 10.5% from 2008. With short-term interest rates down significantly from last year, our loan yield fell 68 basis points, pushing the yield on average earnings assets down 70 basis points. However, total funding costs over last year were down 68 basis points.
When comparing 2008 to 2007, the primary driver of the $4.9 million, or 2.3% increase, in net interest income (te) was a $521.9 million, or 9.9%, increase in average earning assets. In 2008, our average loan growth increased $445.9 million, or 13%, from 2007 along with a slight increase in average securities of $17.3 million. There was also an unfavorable change in 2008 in our average funding mix with most new deposits more heavily weighted to mostly time deposits of $304.2 million and lower levels of non-interest bearing transaction deposits of $51 million.
27
Table of Contents
Recognizing the importance of interest differential to total earnings, management places great emphasis on managing interest rate spreads. Although interest differential is affected by national, regional, and area economics our loan and investment policies are designed to maximize interest differential while maintaining sufficient liquidity and availability of funds for purposes of meeting existing commitments and for investment in loans and other investment opportunities that may arise.
The following table is a summary of average balance sheets that reflects average interest earned, average interest paid, average yield and average rate:
TABLE 1. Summary of Average Balance Sheets (w/ Net Interest Income (te) & Interest Rates)
| Years Ended December 31, | |||||||||||||||||||||||||||||||||
| 2009 | 2008 | 2007 | |||||||||||||||||||||||||||||||
| Average Balance |
Interest | Rate | Average Balance |
Interest | Rate | Average Balance |
Interest | Rate | |||||||||||||||||||||||||
| (In thousands) | |||||||||||||||||||||||||||||||||
| Assets |
|||||||||||||||||||||||||||||||||
| Interest-Earnings Assets: |
|||||||||||||||||||||||||||||||||
| Loans* (te) |
$ | 4,310,120 | $ | 253,732 | 5.89 | % | $ | 3,873,908 | $ | 254,347 | 6.57 | % | $ | 3,428,009 | $ | 261,944 | 7.64 | % | |||||||||||||||
| U.S. Treasury securities |
10,986 | 175 | 1.59 | % | 11,366 | 296 | 2.60 | % | 29,095 | 1,379 | 4.74 | % | |||||||||||||||||||||
| U.S. agency securities |
165,725 | 6,778 | 4.09 | % | 349,931 | 16,000 | 4.57 | % | 810,299 | 41,111 | 5.07 | % | |||||||||||||||||||||
| CMOs |
162,811 | 8,251 | 5.07 | % | 150,692 | 7,465 | 4.95 | % | 94,731 | 3,997 | 4.22 | % | |||||||||||||||||||||
| Mortgage-backed securities |
1,029,860 | 51,553 | 5.01 | % | 1,012,274 | 52,564 | 5.19 | % | 534,893 | 27,190 | 5.08 | % | |||||||||||||||||||||
| Obligations of states and political subdivisions: |
|||||||||||||||||||||||||||||||||
| taxable |
56,414 | 2,493 | 4.42 | % | 52,070 | 1,661 | 3.19 | % | 50,944 | 1,189 | 2.33 | % | |||||||||||||||||||||
| nontaxable (te) |
110,517 | 7,008 | 6.34 | % | 120,237 | 7,659 | 6.37 | % | 146,060 | 9,590 | 6.57 | % | |||||||||||||||||||||
| Other corporate securities |
24,827 | 1,323 | 5.33 | % | 47,428 | 2,061 | 4.34 | % | 60,692 | 3,223 | 5.31 | % | |||||||||||||||||||||
| Total investment in securities |
1,561,140 | 77,581 | 4.97 | % | 1,743,998 | 87,706 | 5.03 | % | 1,726,714 | 87,679 | 5.08 | % | |||||||||||||||||||||
| Federal funds sold and short-term investments |
497,048 | 4,475 | 0.90 | % | 175,891 | 3,838 | 2.18 | % | 117,158 | 5,613 | 4.79 | % | |||||||||||||||||||||
| Total interest-earning assets (te) |
6,368,308 | 335,788 | 5.27 | % | 5,793,797 | 345,891 | 5.97 | % | 5,271,881 | 355,236 | 6.74 | % | |||||||||||||||||||||
| Non-earning assets: |
|||||||||||||||||||||||||||||||||
| Other assets |
794,909 | 685,946 | 626,451 | ||||||||||||||||||||||||||||||
| Allowance for loan losses |
(63,450 | ) | (53,354 | ) | (46,443 | ) | |||||||||||||||||||||||||||
| Total assets |
$ | 7,099,767 | $ | 6,426,389 | $ | 5,851,889 | |||||||||||||||||||||||||||
| Liabilities and Stockholder’s Equity |
|||||||||||||||||||||||||||||||||
| Interest-bearing Liabilities: |
|||||||||||||||||||||||||||||||||
| Interest-bearing transaction deposits |
$ | 1,486,438 | 7,264 | 0.49 | % | $ | 1,415,288 | 13,751 | 0.97 | % | $ | 1,419,077 | 18,135 | 1.28 | % | ||||||||||||||||||
| Time deposits |
1,987,059 | 58,252 | 2.93 | % | 1,843,966 | 70,659 | 3.83 | % | 1,778,854 | 81,223 | 4.57 | % | |||||||||||||||||||||
| Public funds |
1,288,117 | 18,797 | 1.46 | % | 1,046,484 | 26,642 | 2.55 | % | 803,589 | 33,561 | 4.18 | % | |||||||||||||||||||||
| Total interest-bearing deposits |
4,761,614 | 84,313 | 1.77 | % | 4,305,738 | 111,052 | 2.58 | % | 4,001,520 | 132,919 | 3.32 | % | |||||||||||||||||||||
| Customer repurchase agreements |
523,351 | 10,802 | 2.06 | % | 524,712 | 14,491 | 2.76 | % | 216,730 | 8,023 | 3.70 | % | |||||||||||||||||||||
| Other interest-bearing liabilities |
90,172 | 206 | 0.23 | % | 30,186 | 536 | 1.78 | % | 11,280 | 289 | 2.56 | % | |||||||||||||||||||||
| Capitalized Interest |
— | (20 | ) | 0.00 | % | — | (77 | ) | 0.00 | % | — | (995 | ) | 0.00 | % | ||||||||||||||||||
| Total interest-bearing liabilities |
5,375,137 | 95,301 | 1.77 | % | 4,860,636 | 126,002 | 2.59 | % | 4,229,530 | 140,236 | 3.32 | % | |||||||||||||||||||||
| Non-interest bearing: |
|||||||||||||||||||||||||||||||||
| Demand deposits |
935,985 | 876,669 | 927,656 | ||||||||||||||||||||||||||||||
| Other liabilities |
114,270 | 104,279 | 132,320 | ||||||||||||||||||||||||||||||
| Stockholders’ equity |
674,375 | 584,805 | 562,383 | ||||||||||||||||||||||||||||||
| Total liabilities & stockholders’ equity |
$ | 7,099,767 | 1.50 | % | $ | 6,426,389 | 2.17 | % | $ | 5,851,889 | 2.66 | % | |||||||||||||||||||||
| Net interest income and margin (te) |
$ | 240,487 | 3.78 | % | $ | 219,889 | 3.80 | % | $ | 215,000 | 4.08 | % | |||||||||||||||||||||
| Net earning assets and spread |
$ | 993,171 | 3.50 | % | $ | 933,161 | 3.38 | % | $ | 1,042,349 | 3.42 | % | |||||||||||||||||||||
| * | Loan interest income includes loan fees of $0.8 million, $0.5 million and $1.3 million for each of the three years ended December 31, 2009, 2008 and 2007. Non-accrual loans in average balances and income on such loans, if recognized, is recorded on a cash basis. Tax equivalent (te) amounts are calculated using a marginal federal income tax rate of 35%. |
28
Table of Contents
The following table presents the change in interest income and the change in interest expense:
TABLE 2. Summary of Changes in Net Interest Income (te)
| 2009 Compared to 2008 | 2008 Compared to 2007 | |||||||||||||||||||||||
| Due to Change in |
Total Increase |
Due to Change in |
Total Increase |
|||||||||||||||||||||
| Volume | Rate | (Decrease) | Volume | Rate | (Decrease) | |||||||||||||||||||
| (In thousands) | ||||||||||||||||||||||||
| Interest Income (te) |
||||||||||||||||||||||||
| Loans |
$ | 23,974 | $ | (24,589 | ) | $ | (615 | ) | $ | 31,558 | $ | (39,155 | ) | $ | (7,597 | ) | ||||||||
| U.S. Treasury securities |
(10 | ) | (111 | ) | (121 | ) | (622 | ) | (461 | ) | (1,083 | ) | ||||||||||||
| U.S. agency securities |
(7,680 | ) | (1,542 | ) | (9,222 | ) | (21,386 | ) | (3,725 | ) | (25,111 | ) | ||||||||||||
| CMOs |
614 | 172 | 786 | 2,678 | 790 | 3,468 | ||||||||||||||||||
| Mortgage-backed securities |
(227 | ) | (784 | ) | (1,011 | ) | 24,777 | 597 | 25,374 | |||||||||||||||
| Obligations of states and political subdivisions: |
||||||||||||||||||||||||
| Taxable |
154 | 678 | 832 | 25 | 447 | 472 | ||||||||||||||||||
| Nontaxable (te) |
(615 | ) | (36 | ) | (651 | ) | (1,365 | ) | (566 | ) | (1,931 | ) | ||||||||||||
| FHLB stock and other corporate securities |
(1,132 | ) | 394 | (738 | ) | (634 | ) | (528 | ) | (1,162 | ) | |||||||||||||
| Total investment in securities |
(8,896 | ) | (1,229 | ) | (10,125 | ) | 3,473 | (3,446 | ) | 27 | ||||||||||||||
| Federal funds and short-term investments |
3,893 | (3,256 | ) | 637 | 2,080 | (3,855 | ) | (1,775 | ) | |||||||||||||||
| Total interest income (te) |
18,971 | (29,074 | ) | (10,103 | ) | 37,111 | (46,456 | ) | (9,345 | ) | ||||||||||||||
| Interest-bearing transaction deposits |
659 | (7,146 | ) | (6,487 | ) | 48 | 4,336 | 4,384 | ||||||||||||||||
| Time deposits |
5,163 | (17,570 | ) | (12,407 | ) | (2,884 | ) | 13,448 | 10,564 | |||||||||||||||
| Public funds |
5,230 | (13,075 | ) | (7,845 | ) | (8,416 | ) | 15,335 | 6,919 | |||||||||||||||
| Total interest-bearing deposits |
11,052 | (37,791 | ) | (26,739 | ) | (11,252 | ) | 33,119 | 21,867 | |||||||||||||||
| Securities sold under repurchase agreements |
(38 | ) | (3,651 | ) | (3,689 | ) | (8,945 | ) | 2,477 | (6,468 | ) | |||||||||||||
| Other interest-bearing liabilities |
4 | (277 | ) | (273 | ) | (22 | ) | (1,143 | ) | (1,165 | ) | |||||||||||||
| Total interest expense |
11,018 | (41,719 | ) | (30,701 | ) | (20,219 | ) | 34,453 | 14,234 | |||||||||||||||
| Change in net interest income (te) |
$ | 7,953 | $ | 12,645 | $ | 20,598 | $ | 16,892 | $ | (12,003 | ) | $ | 4,889 | |||||||||||
Provision for Loan Losses
Continued weakness in residential real estate and commercial real estate, and elevated unemployment levels in our market areas had a significant impact on our net charge-off levels and resulted in a higher allowance for loan losses in 2009 compared to 2008. Net charge-offs were $50.3 million, an increase of $28.1 million, or 126.6%, from 2008 to 2009. The increase was primarily reflected in our construction and land development loan segment. The construction and land development loan segment represents approximately 11.5% of Hancock’s total loan portfolio, or about $585.7 million at December 31, 2009. The provision for loan losses was $54.6 million in 2009, an increase of $17.8 million, or 48.4% from 2008. Major drivers of the overall higher level of the provision for loan losses were continued weakness in the local and national economies, and increases in nonperforming loans and higher past dues. The provision does not include loans acquired in the Peoples First acquisition. Purchased impaired loans are recorded at fair value at the acquisition date. The provision for loan losses reflects management’s assessment of the adequacy of the allowance for loan losses to absorb inherent losses in the loan portfolio. The amount of provision for each period is dependent on many factors, including loan growth, net charge-offs, changes in the composition of the loan portfolio, delinquencies, identified loan impairment, management’s assessment of the loan portfolio quality, the value of collateral, as well as, overall economic factors. Our allowance for loan losses as a percent of period-end loans was 1.29% at December 31, 2009 compared to 1.45% at December 31, 2008.
Net charge-offs were $22.2 million for 2008, an increase of $14.9 million, or 206.3%, from 2007 to 2008. The provision for loan losses in 2008 was $36.8 million. The allowance for loan losses as a percent of period-end loans was 1.45% in 2008, an increase of 14 basis points from 1.31% at December 31, 2007. Reported net charge-offs exclude write-downs on purchased impaired loans because the fair value already considers the estimated credit losses.
29
Table of Contents
Noninterest Income
Table 3 presents a three-year analysis of the components of noninterest income along with the percentage changes between years for each component. Overall, noninterest income of $157.3 million was reported in 2009, as compared to $127.8 million for 2008 and $120.7 million for 2007. This represents an increase of $29.5 million, or 23%, from 2008 to 2009 and an increase of $7.1 million, or 6%, from 2007 to 2008.
TABLE 3. Noninterest Income
| 2009 | % Change | 2008 | % Change | 2007 | |||||||||||||
| (In thousands) | |||||||||||||||||
| Service charges on deposit accounts |
$ | 45,354 | 3 | % | $ | 44,243 | 6 | % | $ | 41,929 | |||||||
| Trust fees |
15,127 | -10 | % | 16,858 | 6 | % | 15,902 | ||||||||||
| Income from insurance operations |
14,355 | -13 | % | 16,554 | -14 | % | 19,229 | ||||||||||
| Investment and annuity fees |
8,220 | -24 | % | 10,807 | 24 | % | 8,746 | ||||||||||
| Debit card and merchant fees |
11,252 | 2 | % | 11,082 | 9 | % | 10,126 | ||||||||||
| ATM fees |
7,374 | 8 | % | 6,856 | 15 | % | 5,983 | ||||||||||
| Secondary mortgage market operations |
5,906 | 98 | % | 2,977 | -20 | % | 3,723 | ||||||||||
| Income from bank owned life insurance |
5,527 | -6 | % | 5,906 | 20 | % | 4,912 | ||||||||||
| Outsourced check income (fees) |
(94 | ) | -133 | % | 285 | -88 | % | 2,287 | |||||||||
| Letter of credit fees |
1,309 | 15 | % | 1,140 | 16 | % | 983 | ||||||||||
| Gain on sale of property and equipment |
1,180 | 96 | % | 602 | -488 | % | (155 | ) | |||||||||
| Acquisition bargain purchase |
33,623 | N/M | * | — | N/M | * | — | ||||||||||
| Other income |
8,125 | 44 | % | 5,643 | -16 | % | 6,713 | ||||||||||
| Securities transactions gains, net |
69 | N/M | * | 4,825 | N/M | * | 308 | ||||||||||
| Total noninterest income |
$ | 157,327 | 23 | % | $ | 127,778 | 6 | % | $ | 120,686 | |||||||
|
* Not meaningful |
| ||||||||||||||||
The primary factor impacting the increase in noninterest income compared to a year ago was the $33.6 million gain on acquisition of Peoples First.
Income from service charges on deposit accounts increased $1.1 million, or 3% in 2009 because of increased overdrafts. When comparing 2008 to 2007, service charges on deposit accounts increased $2.3 million, or 6% due to a $1.3 million increase in overdraft fees as a result of an increase in rate per item, effective January 1, 2008, in addition to the increase in period-end deposits of $921 million in 2008. Service charges include periodic account maintenance fees for both commercial and personal customers, charges for specific transactions or services, such as processing return items or wire transfers, and other revenue associated with deposit accounts, such as commissions on check sales.
Fee income generated by our secondary mortgage market operations increased $2.9 million, or 98% between 2009 and 2008 after decreasing $0.1 million, or 20% between 2008 and 2007. The increase in 2009 was due to a higher volume of secondary market loans. Because of the historically low rate environment, the refinancing of current loans increased during 2009. Other income increased $2.4 million, or 43.9%, between 2009 and 2008 due to gains on sales of land of $1.4 million and a $1.0 million increase in other investment income.
The increases in noninterest income were partially offset by decreases in trust fees, investment and annuity fees, and income from insurance operations. Trust fees decreased $1.7 million, or 10% in 2009 compared to 2008 mainly because of reduced market values of accounts due to poor financial market conditions. In 2008, trust fees increased $1.0 million, or 6%, when compared to 2007 due primarily to an increase in personal trust income.
Investment and annuity fees decreased $2.6 million, or 24%, in 2009 mainly due to difficult financial market conditions. Investment and annuity fees increased $2.1 million, or 24%, from 2007 to 2008 due to an increase in annuity sales to customers from our subsidiary, Hancock Investment Services. Investment and annuity fees include stock brokerage and annuity sales as well as fixed-income securities transactions for correspondent banks and other commercial and personal customers.
30
Table of Contents
Income from insurance operations decreased 2.2 million, or 13% in 2009 primarily due to a decrease in our subsidiary, Magna Insurance Company’s earned premiums. In 2008, insurance commissions and fees decreased $2.7 million or 14%, mainly due Magna’s reduction of the annuity business which was accelerated with the 1035 exchange program promoted in the fourth quarter of 2007.
Noninterest Expense
Table 4 presents an analysis of the components of noninterest expense for the years 2009, 2008 and 2007. The level of operating expenses increased $20.0 million, or 9%, from 2008 to 2009 and decreased $3.3 million, or 2%, from 2007 to 2008.
TABLE 4. Noninterest Expense
| 2009 | % Change | 2008 | % Change | 2007 | ||||||||||||
| (In thousands) | ||||||||||||||||
| Employee compensation |
$ | 95,674 | 8 | % | $ | 88,670 | 5 | % | $ | 84,654 | ||||||
| Employee benefits |
25,775 | 22 | % | 21,103 | -5 | % | 22,305 | |||||||||
| Total personnel expense |
121,449 | 11 | % | 109,773 | 3 | % | 106,959 | |||||||||
| Equipment and data processing expense |
28,892 | -2 | % | 29,424 | 5 | % | 28,050 | |||||||||
| Net occupancy expense |
20,340 | 4 | % | 19,538 | 1 | % | 19,435 | |||||||||
| Postage and communications |
8,474 | -10 | % | 9,454 | -10 | % | 10,453 | |||||||||
| Ad valorem and franchise taxes |
3,621 | 3 | % | 3,532 | 1 | % | 3,514 | |||||||||
| Legal and professional services |
12,321 | -3 | % | 12,718 | -17 | % | 15,234 | |||||||||
| Printing and supplies |
1,911 | 4 | % | 1,833 | -19 | % | 2,252 | |||||||||
| Amortization of intangible assets |
1,417 | -1 | % | 1,432 | -13 | % | 1,651 | |||||||||
| Advertising |
5,597 | -19 | % | 6,917 | -2 | % | 7,032 | |||||||||
| Deposit insurance and regulatory fees |
12,589 | 342 | % | 2,851 | 174 | % | 1,039 | |||||||||
| Training expenses |
432 | -34 | % | 655 | 0 | % | 656 | |||||||||
| Other real estate owned expense, net |
1,357 | 48 | % | 917 | -285 | % | (497 | ) | ||||||||
| Insurance expense |
1,905 | -4 | % | 1,975 | -20 | % | 2,477 | |||||||||
| Other fees |
3,802 | -7 | % | 4,084 | 20 | % | 3,393 | |||||||||
| Non loan carge-offs |
1,494 | 151 | % | 595 | -31 | % | 868 | |||||||||
| Other expense |
7,869 | 2 | % | 7,745 | -46 | % | 14,227 | |||||||||
| Total noninterest expense |
$ | 233,470 | 9 | % | $ | 213,443 | -2 | % | $ | 216,743 | ||||||
Total personnel expense increased $11.7 million, or 11% in 2009 when compared to the prior year and increased $2.8 million, or 3% from 2007 to 2008. Total personnel expense consists of employee compensation and employee benefits. Employee compensation includes base salaries and contract labor costs, compensation earned under sales-based and other employee incentive programs, and compensation expense under management incentive plans. Employee benefits, in addition to payroll taxes, are the cost of providing health benefits for active and retired employees and the cost of providing pension benefits through both the defined-benefit plans and a 401(k) employee savings plan.
Employee compensation increased $7.0 million, or 8%, in 2009, primarily due to lower deferrals of salary loan origination costs, increased bonus expense, and an increase in the average full-time equivalent staff level and accruals due to the Peoples First acquisition. Employee compensation was up $4.0 million, or 5%, from 2007 to 2008 due primarily to increased incentive expense. Employee benefits expense increased $4.7 million, or 22% in 2009 over the prior year primarily due to increased pension expense, and was $1.2 million, or 5% lower in 2008 compared to 2007 due to decreased health insurance expense.
31
Table of Contents
Deposit insurance and regulatory fees increased $9.7 million, or 342% due to a $3.4 million FDIC special assessment in the second quarter of 2009 and increased fees due to insurance on noninterest bearing transaction accounts. Deposit insurance and regulatory fees were up $1.8 million, or 174% in 2008 due to changes in FDIC insurance assessment rates that became effective in 2007, where the 2007 assessment was offset by a one-time credit from the FDIC.
Net occupancy expense increased $1.0 million, or 4%, in 2009, following a 1%, or $0.1 million, increase in 2008 compared to 2007. Higher insurance rates, property taxes and an increase in general service contracts were the main reasons for the increase over 2008.
Advertising expense decreased $1.3 million, or 19% from 2008 to 2009 and was relatively stable from 2007 to 2008. Decreases in direct mailing and newspaper advertising were the main reasons for the drop in advertising expense for 2009.
Income Taxes
Income tax expense was $22.9 million in 2009, $21.6 million in 2008 and $27.9 million in 2007. Our effective income tax rate continues to be less than the statutory rate of 35%, due primarily to tax-exempt interest income and tax credits. The effective tax rates for 2009, 2008 and 2007 were 23%, 25% and 28%, respectively. The 2% decrease in our effective tax rate was due primarily to the increase in the percentage of tax-exempt income as it relates to pre-tax book income and the addition of new market tax credits in 2009.
SEGMENT REPORTING
See Note 17 to our Consolidated Financial Statements included elsewhere in this report.
BALANCE SHEET ANALYSIS
Securities Available for Sale
Our investment in securities was $1.61 billion at December 31, 2009, compared to $1.68 billion at December 31, 2008. At December 31, 2009, 99.90% of the portfolio was comprised of securities classified as available for sale, 0.10% of the securities were classified as trading while none were classified as held to maturity. At December 31, 2008, 99.87% of the portfolio was comprised of securities classified as available for sale, 0.13% of the securities were classified as trading while none were classified as held to maturity. Average investment securities were $1.56 billion for 2009 as compared to $1.74 billion for 2008.
The vast majority of securities in our portfolio are fixed rate and there were no investments in securities of a single issuer, other than U.S. Treasury and U.S. government agency securities and mortgage-backed securities issued or guaranteed by U.S. government agencies that exceeded 10% of stockholders’ equity. We do not invest in subprime or “Alt A” home mortgage loans. We also hold short-term investments that represent U.S. government agency discount notes that all mature in less than 1 year. The investments are classified as available for sale and are carried at fair value. Unrealized holding gains are excluded from net income and are recognized, net of tax, in other comprehensive income and in accumulated other comprehensive income, a separate component of stockholders’ equity, until realized. At December 31, 2009, the average maturity of the portfolio was 4.88 years with an effective duration of 3.17 and an average yield of 4.97%.
Our securities portfolio is an important source of liquidity and earnings for us. A stated objective in managing the securities portfolio is to provide consistent liquidity to support balance sheet growth but also to provide a safe and consistent stream of earnings. To that end, management is open to opportunities that present themselves which enables us to improve the structure and earnings potential of the securities portfolio.
32
Table of Contents
The amortized costs of securities classified as available for sale and trading at December 31, 2009, 2008 and 2007, were as follows (in thousands):
TABLE 5. Securities by Type
| Years Ended December 31, | |||||||||
| Available for sale securities | 2009 | 2008 | 2007 | ||||||
| U.S. Treasury |
$ | 11,869 | $ | 11,250 | $ | 11,353 | |||
| U.S. government agencies |
131,858 | 224,803 | 431,772 | ||||||
| Municipal obligations |
188,656 | 151,706 | 197,596 | ||||||
| Mortgage-backed securities |
1,076,708 | 1,041,805 | 637,578 | ||||||
| CMOs |
140,663 | 195,771 | 143,639 | ||||||
| Other debt securities |
15,578 | 25,117 | 49,653 | ||||||
| Equity securities |
1,071 | 1,047 | 959 | ||||||
| $ | 1,566,403 | $ | 1,651,499 | $ | 1,472,550 | ||||
| Years Ended December 31, | |||||||||
| Trading securities | 2009 | 2008 | 2007 | ||||||
| U.S. government agencies |
$ | — | $ | — | $ | 69,793 | |||
| Mortgage-backed securities |
— | — | 125,387 | ||||||
| Equity securities |
1,635 | 2,201 | 2,245 | ||||||
| $ | 1,635 | $ | 2,201 | $ | 197,425 | ||||
The amortized cost, yield and fair value of debt securities at December 31, 2009, by contractual maturity, were as follows (amounts in thousands):
TABLE 6. Securities Maturities by Type
| Available for sale | One Year or Less |
Over One Year Through Five Years |
Over Five Years Through Ten Years |
Over Ten Years |
Total | Fair Value |
Weighted Average Yield |
|||||||||||||||||||
| U.S. Treasury |
$ | 11,052 | $ | 658 | $ | 159 | $ | — | $ | 11,869 | $ | 11,930 | 0.66 | % | ||||||||||||
| U.S. government agencies |
25,350 | 31,455 | 25,053 | 50,000 | 131,858 | 131,825 | 4.21 | % | ||||||||||||||||||
| Municipal obligations |
17,432 | 44,855 | 85,682 | 40,687 | 188,656 | 191,668 | 5.27 | % | ||||||||||||||||||
| Other debt securities |
1,297 | 9,418 | 3,377 | 1,486 | 15,578 | 16,326 | 5.82 | % | ||||||||||||||||||
| $ | 55,131 | $ | 86,386 | $ | 114,271 | $ | 92,173 | $ | 347,961 | $ | 351,749 | 4.74 | % | |||||||||||||
| Fair Value |
$ | 55,626 | $ | 90,704 | $ | 114,365 | $ | 91,054 | $ | 351,749 | ||||||||||||||||
| Weighted Average Yield |
3.68 | % | 4.34 | % | 5.01 | % | 5.11 | % | 4.74 | % | ||||||||||||||||
| Other Equity Securities |
$ | 1,071 | $ | 1,862 | N/A | |||||||||||||||||||||
| Mortgage-backed securities & CMOs |
1,217,371 | 1,257,716 | 4.89 | % | ||||||||||||||||||||||
| Total available for sale securities |
$ | 1,566,403 | $ | 1,611,327 | 4.86 | % | ||||||||||||||||||||
| Trading securities |
$ | 1,635 | $ | 1,635 | N/A | |||||||||||||||||||||
33
Table of Contents
Federal Funds Sold and Short-term Investments
We held $0.4 million in federal funds sold in 2009, a decrease of $174.8 million from 2008. We held $214.8 million at December 31, 2009 and $362.9 million at December 31, 2008 in U.S. government agency discount notes as securities available for sale at amortized cost. The short-term investments all mature in less than 1 year. As the amortized cost is a reasonable estimate for fair value of these short-term investments, there were no gross unrealized losses to evaluate for impairment in the years ended December 31, 2009 and December 31, 2008. The Company did this primarily for liquidity and to use these investments as collateral for public fund deposit and customer repos.
Loan Portfolio
We experienced an increase in loan growth during 2009 as our efforts to generate loan volume continue. Average loans were $4.3 billion in 2009, an increase of $436.2 million, or 11.3%, over 2008. As indicated by Table 7, commercial and real estate loans increased $332.0 million, or 13.9%, from 2008. Included in this category are commercial real estate loans, which are secured by properties, used in commercial or industrial operations. We originate commercial and real estate loans to a wide variety of customers in many different industries and, as such, no single industry concentrations existed at December 31, 2009.
Mortgage loans of $451.8 million were $33.7 million, or 8.1%, higher than in 2008. We originate both fixed-rate and adjustable-rate mortgage loans. Certain types of mortgage loans are sold in the secondary mortgage market, while Hancock retains other types. We also originate home equity loans. This product offers customers the opportunity to leverage rising home values and equity, when the market allows, to obtain tax-advantaged consumer financing. We do not offer subprime or “Alt A” home mortgage loans.
Direct consumer loans, which include loans and revolving lines of credit made directly to consumers, were up $68.2 million, or 12.6%, from 2008.
We originate indirect consumer loans, which consist primarily of consumer loans originated through third parties such as automobile dealers or other point-of-sale channels. Indirect consumer loans of $411.8 million for 2009 were up $5.8 million, or 1.4%, from 2008.
We own a finance company subsidiary, which originates both direct and indirect consumer loans. Finance company loans decreased $3.6 million, or 3.1%, at December 31, 2009, compared to the subsidiary’s outstanding loans on December 31, 2008.
The acquisition of Peoples First on December 18, 2009, increased period-end loans by $1.0 billion, impacting our loan mix in 2009 and will impact our average loan mix for 2010. The majority of these loans are commercial real estate ($478.0 million) and mortgage loans ($344.0 million)
The following table shows average loan growth for the three-year period ended December 31, 2009:
TABLE 7. Average Loans
| 2009 | 2008 | 2007 | |||||||||||||||||||||||||
| Balance | TE Yield | Mix | Balance | TE Yield | Mix | Balance | TE Yield | Mix | |||||||||||||||||||
| (In thousands) | |||||||||||||||||||||||||||
| Commercial & R.E. Loans |
$ | 2,725,894 | 5.36 | % | 63.2 | % | $ | 2,393,856 | 6.00 | % | 61.8 | % | $ | 2,076,429 | 7.37 | % | 60.6 | % | |||||||||
| Mortgage loans |
451,823 | 5.75 | % | 10.5 | % | 418,133 | 5.93 | % | 10.8 | % | 385,568 | 5.90 | % | 11.2 | % | ||||||||||||
| Direct consumer loans |
609,131 | 5.59 | % | 14.1 | % | 540,885 | 6.73 | % | 13.9 | % | 492,298 | 8.03 | % | 14.4 | % | ||||||||||||
| Indirect consumer loans |
411,772 | 6.65 | % | 9.6 | % | 405,964 | 6.81 | % | 10.5 | % | 369,147 | 6.68 | % | 10.8 | % | ||||||||||||
| Finance company loans |
111,500 | 17.38 | % | 2.6 | % | 115,070 | 18.53 | % | 3.0 | % | 104,567 | 19.89 | % | 3.0 | % | ||||||||||||
| Total average loans (net of unearned) |
$ | 4,310,120 | 5.89 | % | 100.0 | % | $ | 3,873,908 | 6.57 | % | 100.0 | % | $ | 3,428,009 | 7.64 | % | 100.0 | % | |||||||||
34
Table of Contents
The following table sets forth, for the periods indicated, the composition of our loan portfolio:
TABLE 8. Loans Outstanding by Type
| Loan Portfolio Years Ended December 31, | |||||||||||||||
| 2009 | 2008 | 2007 | 2006 | 2005 | |||||||||||
| (In thousands) | |||||||||||||||
| Real estate: |
|||||||||||||||
| Residential mortgages 1-4 family |
$ | 1,099,068 | $ | 771,995 | $ | 705,566 | $ | 702,772 | $ | 685,681 | |||||
| Residential mortgages multifamily |
102,503 | 65,979 | 53,442 | 69,296 | 40,678 | ||||||||||
| Home equity lines/loans |
459,712 | 312,598 | 214,528 | 133,540 | 133,823 | ||||||||||
| Construction and development |
585,714 | 586,830 | 628,037 | 534,460 | 391,194 | ||||||||||
| Nonresidential |
1,423,167 | 943,105 | 731,318 | 666,593 | 609,647 | ||||||||||
| Commercial, industrial and other |
820,246 | 884,102 | 627,015 | 551,484 | 546,635 | ||||||||||
| Consumer |
543,740 | 611,036 | 564,869 | 525,164 | 506,418 | ||||||||||
| Lease financing and depository institutions |
68,451 | 72,571 | 72,717 | 69,487 | 48,007 | ||||||||||
| Credit cards and other revolving credit |
24,738 | 15,933 | 15,391 | 14,262 | 14,316 | ||||||||||
| 5,127,339 | 4,264,149 | 3,612,883 | 3,267,058 | 2,976,399 | |||||||||||
| Less, unearned income |
13,164 | 14,859 | 16,326 | 17,420 | 11,432 | ||||||||||
| Net loans |
$ | 5,114,175 | $ | 4,249,290 | $ | 3,596,557 | $ | 3,249,638 | $ | 2,964,967 | |||||
The following table sets forth, for the periods indicated, the approximate contractual maturity by type of the loan portfolio:
TABLE 9. Loans Maturities by Type
| December 31, 2009 Maturity Range | ||||||||||||
| Within One Year |
After One Through Five Years |
After Five Years |
Total | |||||||||
| (In thousands) | ||||||||||||
| Commercial, industrial and other |
$ | 259,014 | $ | 317,004 | $ | 244,228 | $ | 820,246 | ||||
| Real estate - construction |
157,900 | 379,735 | 48,079 | 585,714 | ||||||||
| All other loans |
135,676 | 1,516,771 | 2,055,768 | 3,708,215 | ||||||||
| Total loans |
$ | 552,590 | $ | 2,213,510 | $ | 2,348,075 | $ | 5,114,175 | ||||
35
Table of Contents
The sensitivity to interest rate changes of that portion of our loan portfolio that matures after one year is shown below:
TABLE 10. Loans Sensitivity to Changes in Interest Rates
| December 31, 2009 | |||
| (In thousands) | |||
| Commercial, industrial, and real estate construction maturing after one year: |
|||
| Fixed rate |
$ | 827,384 | |
| Floating rate |
161,662 | ||
| Other loans maturing after one year: |
|||
| Fixed rate |
2,759,706 | ||
| Floating rate |
812,833 | ||
| Total |
$ | 4,561,585 | |
Non-performing Assets
The following table sets forth non-performing assets by type for the periods indicated, consisting of non-accrual loans, restructured loans and real estate owned. Loans past due 90 days or more and still accruing are also disclosed:
TABLE 11. Non-performing Assets
| December 31, | ||||||||||||||||||||
| 2009 | 2008 | 2007 | 2006 | 2005 | ||||||||||||||||
| (In thousands) | ||||||||||||||||||||
| Loans accounted for on a non-accrual basis |
$ | 86,555 | $ | 29,976 | $ | 13,067 | $ | 3,500 | $ | 10,617 | ||||||||||
| Foreclosed assets |
14,336 | 5,360 | 2,297 | 681 | 1,898 | |||||||||||||||
| Total non-performing assets |
$ | 100,891 | $ | 35,336 | $ | 15,364 | $ | 4,181 | $ | 12,515 | ||||||||||
| Loans 90 days past due still accruing |
$ | 11,647 | $ | 11,005 | $ | 4,154 | $ | 2,552 | $ | 25,622 | ||||||||||
| Ratios |
||||||||||||||||||||
| Non-performing assets to loans plus other real estate |
1.97 | % | 0.83 | % | 0.43 | % | 0.13 | % | 0.42 | % | ||||||||||
| Allowance for loan losses to non-performing loans and accruing loans 90 days past due |
58.69 | % | 133.16 | % | 241.43 | % | 694.67 | % | 195.50 | % | ||||||||||
| Loans 90 days past due still accruing to loans |
0.23 | % | 0.26 | % | 0.11 | % | 0.08 | % | 0.86 | % | ||||||||||
The amount of interest that would have been recorded on non-accrual loans had the loans not been classified as “non-accrual” was $2.0 million, $1.1 million, $0.05 million, $0.8 million and $0.7 million for the years ended December 31, 2009, 2008, 2007, 2006 and 2005, respectively. Interest actually received on non-accrual loans at December 31, 2009 was $0.3 million and for the years ended December 31, 2008, 2007, 2006 and 2005 was not material.
Non-performing assets consist of loans accounted for on a non-accrual basis, restructured loans and foreclosed assets. Table 11 presents information related to non-performing assets for the five years ended December 31, 2009. Total non-performing assets at December 31, 2009 were $100.9 million, an increase of $65.6 million, or 186%, from December 31, 2008. The majority, or $55.6 million, of the total non-performing assets were from the acquisition of Peoples First in December 2009. Loans that are over 90 days past due but still accruing were $11.6 million at December 31, 2009. This compares to $11.0 million at December 31, 2008. The increase in loans past due can be attributed to the effects of the on-going national recession, weakness in residential development, and higher unemployment levels across all of our markets. The loans contributing to the increase have been identified, and appropriate write-downs or allowances have been made based on underlying collateral values and those relationships have been placed in the hands of special asset personnel for handling. Management believes that the loans included in the non-performing assets total are being handled appropriately.
36
Table of Contents
Allowance for Loan and Lease Losses
Management and the Audit Committee are responsible for maintaining an effective loan review system, and internal controls, which include an effective risk rating system that identifies, monitors, and addresses asset quality problems in an accurate and timely manner. The allowance is evaluated for adequacy on at least a quarterly basis.
The Company’s loan loss reserve methodology is established and maintained at an amount sufficient to cover the estimated credit loss associated with the loan and lease portfolios of the Bank as of the date of determination. Credit losses arise not only from credit risk, but also from other risks inherent in the lending process including, but not limited to, collateral risk, operational risk, concentration risk, and economic risk. As such, all related risks of lending are considered when assessing the adequacy of the Allowance for Loan and Lease Losses (ALLL).
The methodology for determining the allowance for loan and lease losses involves significant judgment. Therefore, the Company has established a methodology for measuring the adequacy of the ALLL, which is systematic and consistently applied each quarter. The analysis and methodology include three primary segments: (1) a specific reserve analysis for those loans considered impaired under FASB guidance; (2) a pool analysis of groups of loans within the portfolio that have similar characteristics; and (3) qualitative risk factors and general economic conditions.
The guidance requires that a reserve analysis is to be completed on all loans that have been determined to be impaired by Management. When a loan is determined to be impaired, the amount of that impairment must be measured by either the loan’s observable market price, the fair value of the collateral of the loan, less liquidation costs, if it is collateral dependent, or by calculating the present value of expected future cash flows discounted at the loan’s effective interest rate. If the value of the impaired loan is less than the current balance of the loan, the Company must recognize the impairment by creating a specific reserve allowance for the shortfall.
The second reserve segment, the pool analysis methodology is governed by authoritative guidance regarding accounting for contingencies. A historical loss rate is calculated for each loan type over the 12 prior quarters to determine the 3 year average loss rate. As circumstances dictate, Management will make adjustments to the loss history to reflect significant changes in the Company’s loss history.
The third segment relates to risks not captured elsewhere. Adjustments are made to historical loss rates to cover risks associated with trends in delinquencies, non-accruals, current economic conditions, credit administration/ underwriting practices, and borrower concentrations.
At December 31, 2009, the allowance for loan losses was $66.1 million, or 1.29%, of year-end loans, compared to $61.7 million, or 1.45%, of year-end loans for 2008. Net charge-offs increased significantly to $50.3 million in 2009, as compared to $22.2 million in 2008. Overall, the allowance for loan losses was 58.7% of non-performing loans and accruing loans 90 days past due at year-end 2009 compared to 133.2% at year-end 2008. Not including Peoples First, the allowance for loan losses was 116.8% of non-performing loans and accruing loans 90 days past due at year-end 2009. There was no allowance for loan losses associated with the acquisition of Peoples First. Purchased loans are recorded at fair value at the acquisition date. In addition, reported net charge-offs exclude write-downs on purchased impaired loans as the fair value already considers the estimated credit losses.
We utilize quantitative methodologies and modeling to determine the adequacy of the allowance for loan and lease losses and are of the opinion that the allowance at December 31, 2009 is adequate.
37
Table of Contents
The following table sets forth, for the periods indicated, average net loans outstanding, allowance for loan losses, amounts charged-off and recoveries of loans previously charged-off:
TABLE 12. Summary of Activity in the Allowance for Loan Losses
| At and For The Years Ended December 31, | ||||||||||||||||||||
| 2009 | 2008 | 2007 | 2006 | 2005 | ||||||||||||||||
| (In thousands) | ||||||||||||||||||||
| Net loans outstanding at end of period |
$ | 5,114,175 | $ | 4,249,290 | $ | 3,596,557 | $ | 3,249,638 | $ | 2,964,783 | ||||||||||
| Average net loans outstanding |
$ | 4,310,120 | $ | 3,873,908 | $ | 3,428,009 | $ | 3,062,222 | $ | 2,883,020 | ||||||||||
| Balance of allowance for loan losses at beginning of period |
$ | 61,725 | $ | 47,123 | $ | 46,772 | $ | 74,558 | $ | 40,682 | ||||||||||
| Loans charged-off: |
||||||||||||||||||||
| Real estate |
3,670 | 1,360 | 530 | 758 | 226 | |||||||||||||||
| Commercial |
36,882 | 12,974 | 2,597 | 3,676 | 4,001 | |||||||||||||||
| Consumer, credit cards and other revolving credit |
14,333 | 13,051 | 11,159 | 14,712 | 11,537 | |||||||||||||||
| Lease financing |
30 | 22 | 166 | 369 | 47 | |||||||||||||||
| Total charge-offs |
54,915 | 27,407 | 14,452 | 19,515 | 15,811 | |||||||||||||||
| Recoveries of loans previously charged-off: |
||||||||||||||||||||
| Real estate |
241 | 162 | 188 | 263 | 33 | |||||||||||||||
| Commercial |
766 | 1,036 | 2,774 | 4,729 | 2,757 | |||||||||||||||
| Consumer, credit cards and other revolving credit |
3,642 | 4,026 | 4,205 | 7,489 | 4,258 | |||||||||||||||
| Lease financing |
1 | — | 43 | 10 | 4 | |||||||||||||||
| Total recoveries |
4,650 | 5,224 | 7,210 | 12,491 | 7,052 | |||||||||||||||
| Net charge-offs |
50,265 | 22,183 | 7,242 | 7,024 | 8,759 | |||||||||||||||
| Provision for (reversal of) loan losses |
54,590 | 36,785 | 7,593 | (20,762 | ) | 42,635 | ||||||||||||||
| Balance of allowance for loan losses at end of period |
$ | 66,050 | $ | 61,725 | $ | 47,123 | $ | 46,772 | $ | 74,558 | ||||||||||
| Ratios |
||||||||||||||||||||
| Gross charge-offs to average loans |
1.27 | % | 0.71 | % | 0.42 | % | 0.64 | % | 0.55 | % | ||||||||||
| Recoveries to average loans |
0.11 | % | 0.13 | % | 0.21 | % | 0.41 | % | 0.24 | % | ||||||||||
| Net charge-offs to average loans |
1.17 | % | 0.57 | % | 0.21 | % | 0.23 | % | 0.30 | % | ||||||||||
| Allowance for loan losses to year end loans |
1.29 | % | 1.45 | % | 1.31 | % | 1.44 | % | 2.51 | % | ||||||||||
| Net charge-offs to period-end net loans |
0.98 | % | 0.52 | % | 0.20 | % | 0.22 | % | 0.30 | % | ||||||||||
| Allowance for loan losses to average net loans |
1.53 | % | 1.59 | % | 1.37 | % | 1.53 | % | 2.59 | % | ||||||||||
| Net charge-offs to loan loss allowance |
76.10 | % | 35.94 | % | 15.37 | % | 15.02 | % | 11.75 | % | ||||||||||
38
Table of Contents
An allocation of the loan loss allowance by major loan category is set forth in the following table. There were no relevant variations in loan concentrations, quality or terms, except for an increase in the outstanding loan portfolio balance. The unallocated portion of the allowance represents supportable estimates of probable losses inherent in the loan portfolio but not specifically related to one category of the portfolio. The allocation is not necessarily indicative of the category of incurred losses, and the full allowance at December 31, 2009 is available to absorb losses occurring in category of loans.
TABLE 13. Allocation of Loan Loss by Category
| For Years Ended December 31, | ||||||||||||||||||||||||||
| 2009 | 2008 | 2007 | 2006 | 2005 | ||||||||||||||||||||||
| Allowance for Loan Losses (1) |
% of Loans to Total Loans (2) |
Allowance for Loan Losses (1) |
% of Loans to Total Loans (2) |
Allowance for Loan Losses (1) |
% of Loans to Total Loans (2) |
Allowance for Loan Losses (1) |
% of Loans to Total Loans (2) |
Allowance for Loan Losses (1) |
% of Loans to Total Loans (2) | |||||||||||||||||
| (In thousands) | ||||||||||||||||||||||||||
| Real estate |
$ | 4,782 | 71.76 | $ | 5,315 | 63.08 | $ | 1,998 | 64.85 | $ | 1,697 | 64.84 | $ | 23,042 | 62.86 | |||||||||||
| Commercial, industrial and other |
42,517 | 17.27 | 36,448 | 22.35 | 27,546 | 19.15 | 27,838 | 18.77 | 34,128 | 19.74 | ||||||||||||||||
| Consumer and other revolving credit |
18,784 | 10.97 | 19,063 | 14.57 | 16,111 | 16.00 | 15,363 | 16.39 | 15,812 | 17.40 | ||||||||||||||||
| Unallocated |
(33 | ) | — | 899 | — | 1,468 | — | 1,874 | — | 1,576 | — | |||||||||||||||
| $ | 66,050 | 100.00 | $ | 61,725 | 100.00 | $ | 47,123 | 100.00 | $ | 46,772 | 100.00 | $ | 74,558 | 100.00 | ||||||||||||
| (1) | Loans used in the calculation of “allowance for loan losses” are grouped according to loan purpose. |
| (2) | Loans used in the calculation of “% of loans to total loans” are grouped by collateral type. |
Deposits
Total average deposits increased by $515.2 million, or 9.9%, from $5.2 billion at December 31, 2008 to $5.7 billion at December 31, 2009. The increase occurred primarily in NOW account deposits which grew $420.6 million, or 35.2%, non-interest bearing demand deposits which grew $59.3 million, or 6.8%, and money market deposits which grew $40.1 million, or 6.5%. The acquisition of Peoples First on December 18, 2009, increased period-end deposits by $1.5 billion and will impact our average deposit mix for 2010. The majority of these deposits are time deposits ($1.1 billion), NOW and money market account deposits ($335.5 million), and non-interest bearing deposits ($76.5 million.)
Over the course of 2009, we continued our focus on multiple accounts, core deposit relationships and strategic placement of time deposit campaigns to stimulate overall deposit growth. In addition, we keep as our highest priority, continued customer demand for safety and liquidity of deposit products. The Banks traditionally price their deposits to position themselves competitively with the local market.
Table 14 shows average deposits for a three-year period.
TABLE 14. Average Deposits
| 2009 | 2008 | 2007 | |||||||||||||||||||||||||
| Balance | Rate | Mix | Balance | Rate | Mix | Balance | Rate | Mix | |||||||||||||||||||
| (In thousands) | |||||||||||||||||||||||||||
| Non-interest bearing demand deposits |
$ | 935,985 | 0.00 | % | 16 | % | $ | 876,669 | 0.00 | % | 17 | % | $ | 927,655 | 0.00 | % | 19 | % | |||||||||
| NOW account deposits |
1,616,523 | 1.09 | % | 28 | % | 1,195,900 | 1.65 | % | 23 | % | 1,067,775 | 2.52 | % | 22 | % | ||||||||||||
| Money market deposits |
652,572 | 0.95 | % | 11 | % | 612,510 | 1.91 | % | 12 | % | 529,976 | 2.50 | % | 11 | % | ||||||||||||
| Savings deposits |
372,781 | 0.12 | % | 7 | % | 370,705 | 0.26 | % | 7 | % | 428,599 | 0.61 | % | 8 | % | ||||||||||||
| Time deposits (including Public Funds CDs) |
2,119,738 | 2.84 | % | 38 | % | 2,126,623 | 3.70 | % | 41 | % | 1,975,171 | 4.56 | % | 40 | % | ||||||||||||
| Total average deposits |
$ | 5,697,599 | 100 | % | $ | 5,182,407 | 100 | % | $ | 4,929,176 | 100 | % | |||||||||||||||
39
Table of Contents
Time certificates of deposit of $100,000 and greater at December 31, 2009 had maturities as follows:
TABLE 15. Maturity of Time Deposits greater than or equal to $100,000
| December 31, 2009 | |||
| (In thousands) | |||
| Three months |
$ | 374,502 | |
| Over three through six months |
243,136 | ||
| Over six months through one year |
479,358 | ||
| Over one year |
232,554 | ||
| Total |
$ | 1,329,550 | |
Short-Term Borrowings
The following table sets forth certain information concerning our short-term borrowings, which consist of federal funds purchased and securities sold under agreements to repurchase and other short-term borrowings.
TABLE 16. Short-Term Borrowings
| Years Ended December 31, | ||||||||||||
| 2009 | 2008 | 2007 | ||||||||||
| (In thousands) | ||||||||||||
| Federal funds purchased: |
||||||||||||
| Amount outstanding at period-end |
$ | 250 | $ | — | $ | 4,100 | ||||||
| Weighted average interest at period-end |
0.11 | % | — | 4.02 | % | |||||||
| Maximum amount at any month-end during period |
$ | 4,700 | $ | 33,775 | $ | 4,100 | ||||||
| Average amount outstanding during period |
$ | 3,484 | $ | 16,003 | $ | 4,174 | ||||||
| Weighted average interest rate during period |
0.21 | % | 2.20 | % | 4.99 | % | ||||||
| Securities sold under agreements to repurchase: |
||||||||||||
| Amount outstanding at period-end |
$ | 484,457 | $ | 505,932 | $ | 371,604 | ||||||
| Weighted average interest at period-end |
1.99 | % | 2.10 | % | 3.63 | % | ||||||
| Maximum amount at any month end during-period |
$ | 567,888 | $ | 621,424 | $ | 371,604 | ||||||
| Average amount outstanding during period |
$ | 523,351 | $ | 524,712 | $ | 216,730 | ||||||
| Weighted average interest rate during period |
2.06 | % | 2.76 | % | 3.70 | % | ||||||
| Other short-term borrowings: |
||||||||||||
| Amount outstanding at period-end |
$ | 30,805 | $ | — | $ | — | ||||||
| Weighted average interest at period-end |
0.38 | % | — | — | ||||||||
| Maximum amount at any month end during-period |
$ | 156,000 | $ | — | $ | — | ||||||
| Average amount outstanding during period |
$ | 75,160 | $ | 2,650 | $ | — | ||||||
| Weighted average interest rate during period |
0.17 | % | 2.04 | % | — | |||||||
40
Table of Contents
Return on Equity and Assets
Information regarding performance and equity ratios is as follows:
TABLE 17. Return on Equity and Assets
| Years Ended December 31, | |||||||||
| 2009 | 2008 | 2007 | |||||||
| Return on average assets |
1.05 | % | 1.02 | % | 1.26 | % | |||
| Return on average common equity |
11.09 | % | 11.18 | % | 13.14 | % | |||
| Dividend payout ratio |
42.11 | % | 46.38 | % | 41.74 | % | |||
| Average common equity to average assets ratio |
9.50 | % | 9.10 | % | 9.61 | % | |||
COMMITMENTS AND CONTINGENCIES
Loan Commitments and Letters of Credit
In the normal course of business, we enter into financial instruments, such as commitments to extend credit and letters of credit, to meet the financing needs of our customers. Such instruments are not reflected in the accompanying consolidated financial statements until they are funded and involve, to varying degrees, elements of credit risk not reflected in the consolidated balance sheets. The contract amounts of these instruments reflect our exposure to credit loss in the event of non-performance by the other party on whose behalf the instrument has been issued. We undertake the same credit evaluation in making commitments and conditional obligations as we do for on-balance-sheet instruments and may require collateral or other credit support for off-balance-sheet financial instruments.
At December 31, 2009, we had $983.2 million in unused loan commitments outstanding, of which approximately $679.0 million were at variable rates and the remainder were at fixed rates. A commitment to extend credit is an agreement to lend to a customer as long as the conditions established in the agreement have been satisfied. A commitment to extend credit generally has a fixed expiration date or other termination clauses and may require payment of a fee by the borrower. Since commitments often expire without being fully drawn, the total commitment amounts do not necessarily represent our future cash requirements. We continually evaluate each customer’s credit worthiness on a case-by-case basis. Occasionally, a credit evaluation of a customer requesting a commitment to extend credit results in our obtaining collateral to support the obligation.
Letters of credit are conditional commitments issued by us to guarantee the performance of a customer to a third party. The credit risk involved in issuing a letter of credit is essentially the same as that involved in extending a loan. At December 31, 2009, we had $108.7 million in letters of credit issued and outstanding.
41
Table of Contents
The following table shows the commitments to extend credit and letters of credit at December 31, 2009 and 2008 according to expiration date.
TABLE 18. Commitments and Letters of Credit
| Expiration Date | |||||||||||||||
| Total | Less than 1 year |
1-3 years |
3-5 years |
More than 5 years | |||||||||||
| (In thousands) | |||||||||||||||
| December 31, 2009 |
|||||||||||||||
| Commitments to extend credit |
$ | 983,242 | $ | 637,170 | $ | 54,678 | $ | 64,773 | $ | 226,621 | |||||
| Letters of credit |
108,736 | 53,797 | 19,990 | 34,934 | 15 | ||||||||||
| Total |
$ | 1,091,978 | $ | 690,967 | $ | 74,668 | $ | 99,707 | $ | 226,636 | |||||
| Expiration Date | |||||||||||||||
| Total | Less than 1 year |
1-3 years |
3-5 years |
More than 5 years | |||||||||||
| (In thousands) | |||||||||||||||
| December 31, 2008 |
|||||||||||||||
| Commitments to extend credit |
$ | 885,156 | $ | 527,118 | $ | 43,454 | $ | 66,348 | $ | 248,236 | |||||
| Letters of credit |
113,274 | 51,366 | 11,003 | 50,905 | — | ||||||||||
| Total |
$ | 998,430 | $ | 578,484 | $ | 54,457 | $ | 117,253 | $ | 248,236 | |||||
RISK MANAGEMENT
Credit Risk
The Banks’ primary lending focus is to provide commercial, consumer and real estate loans to consumers and to small and middle market businesses in their respective market areas. Diversification in the loan portfolio is a means of reducing the risks associated with economic fluctuations. The Banks have no significant concentrations of loans to particular borrowers or loans to any foreign entities. Loan portfolio average loan size has leveled off from a peak level in the fourth quarter of 2008 and has trended slightly down to year-end 2009. As of the fourth quarter 2009 our average commercial loan size is $0.1 million and our average commercial real estate loan size is $0.3 million. As of year-end 2009, we do not have any commercial real estate concentrations, as defined by interagency guidelines. We have experienced a decrease in residential construction/development lending from 2008 to 2009. The decrease was across all period-end balances. This segment of the loan portfolio still represents somewhat of a risk considering national housing trends, labor availability, building material availability, price fluctuations along with local market conditions of oversupply as well as general economic conditions. We monitor local trends and have observed a continued lull in home sales and in sales prices in almost all of our markets. We are continuing to limit this segment of the loan portfolio and will continue to see a reduction in 2010.
We are concerned about the decrease in real estate values locally and nationally. There is concern over the commercial investment sector such as hotels; office buildings; mini storage buildings; strip centers etc. since occupancies for those facilities are at an all time low nationally. Our markets have held up but we expect to see weakness as we head into the 2010 year. Based on the uncertainty of the supply and demand feature of the economy coupled with elevated unemployment figures and consumer confidence at a low point, we believe real estate values have not stabilized. Additionally, we have seen evidence that the appraisal community has been challenged to arrive at reliable values in this period when multiple issues are affecting the market.
Our Direct Loan portfolio represents approximately 42% of the bank’s total retail portfolio, including mortgage loans. As of December 31, 2009, approximately 96% of the Direct Loan portfolio was secured while approximately 4% of the portfolio was considered unsecured. The size of our Indirect Portfolio continued to trend down from year end 2008 to year end 2009. At December 31, 2008 we pulled back from our out of market dealers; focused on in market, higher grade credits and implemented approximately 14 initiatives to help reduce loan losses that we were experiencing.
42
Table of Contents
Loans are underwritten on the basis of repayment ability and collateral value. Generally, real estate mortgage loans are made when the borrower produces evidence of repayment ability along with equity in the property to offset historical market devaluations.
Allowance for Loan and Lease Losses
The allowance for loan and lease losses “ALLL” is a valuation account available to absorb losses on loans. The ALLL is established and maintained at an amount sufficient to cover the estimated credit loss associated with the loan and lease portfolios as of the date of the determination. Credit losses arise not only from credit risk, but also from other risks inherent in the lending process including, but not limited to, collateral risk, operational risk, concentration risk, and economic risk. As such, all related risks of lending are considered when assessing the adequacy of the allowance for loan and lease losses. Quarterly, we estimate the probable level of losses to determine whether the allowance is adequate to absorb reasonably foreseeable, anticipated losses in the existing portfolio based on our past loan loss and delinquency experience, known and inherent risks in the portfolio, adverse situations that may affect the borrowers’ ability to repay, and the estimated value of any underlying collateral and current economic conditions. The analysis and methodology include three primary segments. These segments include a pool analysis of various retail loans based upon loss history, a pool analysis of commercial and commercial real estate loans based upon loss history by loan type, and a specific reserve analysis for those loans considered impaired under generally accepted accounting principles. All commercial and commercial real estate loans with an outstanding balance of $100,000 or greater are individually reviewed for impairment; substandard mortgage loans with balances of $100,000 or greater are also included in the analysis. All losses are charged to the allowance for loan and lease losses when the loss actually occurs or when a determination is made that a loss is likely to occur; recoveries are credited to the allowance for loan losses at the time of receipt.
Commercial loans are considered impaired when it is probable (the future event or events are likely to occur) that the bank will be unable to collect all amounts due (including principal and interest) according to the contractual terms of the loan agreement. In order to ensure consideration of all possible impairments, for purposes of the model the Banks consider all loans that are risk rated substandard as impaired. When a loan is determined to be impaired, the amount of that impairment must be measured by either the loan’s observable market price, the fair value of the collateral of the loan (less liquidation costs) if it is collateral dependent, or by calculating the present value of expected future cash flows discounted at the loan’s effective interest rate. If the value of the impaired loan is less than the current balance of the loan, the impairment is recognized by creating a specific reserve allowance for the shortfall. If the value is greater or equal to the loan balance, then no reserve allocation may be made for the loan. In addition, any loans included in the impairment review are not incorporated into the pool analysis to avoid double counting.
Pool analysis is applied for all retail loans. The retail loans are subdivided into three groups, which currently include: mortgage real estate, indirect loans and direct consumer loans. A historical loss rate is calculated for each group over the twelve prior quarters to determine the three year average loss rate. As circumstances dictate, management will make adjustments to the loss history to reflect significant changes in our loss history. Adjustments will also be made to historical loss rates to cover risks associated with trends in delinquencies, non-accruals, current economic conditions and credit administration/ underwriting practices and policies.
We apply pool analysis for commercial and commercial real estate loans where a historical loss ratio is applied to all commercial loans, commercial real estate loans and leases grouped by product type for which exposure is measured as required by generally accepted accounting principles and can best be evaluated collectively due to similar attributes. A historical loss rate is calculated for each group over the twelve prior quarters to determine the three year average loss rate. As circumstances dictate, we will make adjustments to the loss history to reflect significant changes in our loss history. Adjustments will also be made to historical loss rates to cover risks associated with trends in delinquencies, non-accruals, current economic conditions and credit administration/ underwriting practices and policies and borrower concentrations.
43
Table of Contents
Asset/Liability Management
Our asset liability management (ALM) process consists of quantifying, analyzing and controlling interest rate risk (IRR) to maintain stability in net interest income (NII) under varying interest rate environments. The principal objective of ALM is to maximize net interest income while operating within acceptable limits established for interest rate risk and maintaining adequate levels of liquidity. Our net earnings are dependent on our net interest income. Net interest income is susceptible to IRR to the degree that interest-bearing liabilities mature or re-price on a different basis and timing than interest-earning assets. This timing difference represents a potential risk to our future earnings. When interest-bearing liabilities mature or re-price more quickly than interest-earning assets in a given period, a significant increase in market rates of interest and the subsequent impact on customer behavior could adversely affect NII. Similarly, when interest-earning assets mature or re-price more quickly than interest-bearing liabilities, falling interest rates and changes in customer behavior could result in a decrease in NII.
Management and the Asset/Liability Committee (ALCO) direct our IRR management through a Risk Management policy that is designed to produce a stable net interest margin (NIM) in periods of interest rate fluctuation. In adjusting our asset/liability position, the board of directors and management attempt to direct our IRR while enhancing the NIM. At times, depending on the general level of interest rates, the relationship between long-term and short-term interest rates, market conditions and competitive factors, we may determine strategies that could add to the level of IRR in order to increase its NIM. Not withstanding our IRR management activities, the potential for changing interest rates is an uncertainty that can have an adverse effect on net earnings.
To control interest rate risk, we regularly monitor the volume of interest sensitive assets compared with interest sensitive liabilities over specific time intervals. Interest-sensitive assets and liabilities are those that are subject to maturity or repricing within a given time period. We also administer this sensitivity through the development and implementation of investment, lending, funding and pricing strategies designed to achieve NII performance goals while minimizing the potential negative variations in NII under different interest rate scenarios. Investment strategies, including portfolio durations and cash flows, are formulated and continually adjusted during the implementation to assure attainment of objectives in the most effective manner. Loan and deposit pricing are adjusted weekly to reflect current interest rate and competitive market environments, with duration targets on both reviewed monthly.
The Static Gap Report shown in Table 19 measures the net amounts of assets and liabilities that re-price within a given time period over the remaining lives of those instruments. At December 31, 2009, our cumulative re-pricing gap in the one year interval was -7.2%. The liability sensitive position represents a deposit funding mix of significant balances in short term contractual CDs and interest bearing public fund transaction deposits. The earning asset position is strategically managed with a balance in our loan growth (fixed versus floating and duration targets) and securities portfolio cash flows. We believe we are adequately positioned for the current rate environment.
To further control IRR, we structure our loan portfolio to provide appropriate investment opportunities while minimizing potential volatility in earnings from extension risk. Deposit strategies continue to emphasize a mix of non-certificate of deposit core accounts and consumer time deposits. However, the 2009 yield curve environment has created more demand on consumer time deposits with maturities one year or less. By mid-year 2010, $1.3 billion in CD balances will re-price and strategy is to re-price to terms of 12 months and greater. We anticipate mid-year 2010 twelve month Cumulative Re-pricing Gap to be much closer to an even gap position.
The following table sets forth the scheduled re-pricing or maturity of our assets and liabilities at December 31, 2009 and December 31, 2008. The assumed prepayment of investments and loans was based on our assessment of current market conditions on such dates. Estimates have been made for the re-pricing of savings, NOW and money market accounts. Actual prepayments and deposit withdrawals will differ from the following analysis due to variable economic circumstances and consumer behavior. Although assets and liabilities may have similar maturities or re-pricing periods, reactions will vary as to timing and degree of interest rate change.
44
Table of Contents
| TABLE 19. Analysis of Interest Sensitivity | ||||||||||||||||||||||||||
| December 31, 2009 | ||||||||||||||||||||||||||
| Overnight | Within 6 months |
6 months to 1 year |
1 to 3 years |
> 3 years |
Non-Sensitive Balance |
Total | ||||||||||||||||||||
| (In thousands) | ||||||||||||||||||||||||||
| Assets |
||||||||||||||||||||||||||
| Securities |
$ | 1,399 | $ | 214,695 | $ | 153,678 | $ | 483,171 | $ | 757,545 | $ | 2,474 | $ | 1,612,962 | ||||||||||||
| Federal funds sold & short-term investments |
582,491 | 214,771 | — | — | — | — | 797,262 | |||||||||||||||||||
| Loans |
— | 2,419,296 | 344,186 | 1,315,098 | 1,005,657 | — | 5,084,237 | |||||||||||||||||||
| Other assets |
— | — | — | — | — | 1,202,622 | 1,202,622 | |||||||||||||||||||
| Total Assets |
$ | 583,890 | $ | 2,848,762 | $ | 497,864 | $ | 1,798,269 | $ | 1,763,202 | $ | 1,205,096 | $ | 8,697,083 | ||||||||||||
| Liabilities |
||||||||||||||||||||||||||
| Interest bearing transaction deposits |
$ | — | $ | 1,431,228 | $ | 322,818 | $ | 1,070,566 | $ | 225,116 | $ | — | $ | 3,049,728 | ||||||||||||
| Time deposits |
— | 1,180,993 | 1,199,998 | 524,828 | 166,923 | — | 3,072,742 | |||||||||||||||||||
| Non-interest bearing deposits |
— | — | — | 53,667 | 1,019,674 | — | 1,073,341 | |||||||||||||||||||
| Borrowings |
290,551 | 23,573 | 25,039 | 106,805 | 81,264 | — | 527,232 | |||||||||||||||||||
| Other liabilities |
— | — | — | — | — | 136,377 | 136,377 | |||||||||||||||||||
| Stockholders’ equity |
— | — | — | — | — | 837,663 | 837,663 | |||||||||||||||||||
| Total Liabilities & Equity |
$ | 290,551 | $ | 2,635,794 | $ | 1,547,855 | $ | 1,755,866 | $ | 1,492,977 | $ | 974,040 | $ | 8,697,083 | ||||||||||||
| Interest sensitivity gap |
$ | 293,339 | $ | 212,968 | $ | (1,049,991 | ) | $ | 42,403 | $ | 270,225 | $ | 231,056 | |||||||||||||
| Cumulative interest rate sensitivity gap |
$ | 293,339 | $ | 506,307 | $ | (543,684 | ) | $ | (501,281 | ) | $ | (231,056 | ) | — | ||||||||||||
| Cumulative interest rate sensitivity gap as a percentage of total earning assets |
3.9 | % | 6.7 | % | (7.2 | )% | (6.6 | )% | (3.1 | )% | ||||||||||||||||
| TABLE 19. Analysis of Interest Sensitivity (continued) | ||||||||||||||||||||||||||
| December 31, 2008 | ||||||||||||||||||||||||||
| Overnight | Within 6 months |
6 months to 1 year |
1 to 3 years |
> 3 years |
Non-Sensitive Balance |
Total | ||||||||||||||||||||
| (In thousands) | ||||||||||||||||||||||||||
| Assets |
||||||||||||||||||||||||||
| Securities |
$ | 1,666 | $ | 743,616 | $ | 283,566 | $ | 300,332 | $ | 349,755 | $ | 3,022 | $ | 1,681,957 | ||||||||||||
| Federal funds sold & short-term investments |
— | 376,499 | 172,917 | — | — | — | 549,416 | |||||||||||||||||||
| Loans |
— | 1,912,989 | 324,287 | 947,141 | 1,025,438 | — | 4,209,855 | |||||||||||||||||||
| Other assets |
— | — | — | — | — | 726,026 | 726,026 | |||||||||||||||||||
| Total Assets |
$ | 1,666 | $ | 3,033,104 | $ | 780,770 | $ | 1,247,473 | $ | 1,375,193 | $ | 729,048 | $ | 7,167,254 | ||||||||||||
| Liabilities |
||||||||||||||||||||||||||
| Interest bearing transaction deposits |
$ | — | $ | 1,289,545 | $ | 353,995 | $ | 856,040 | $ | 196,735 | $ | — | $ | 2,696,315 | ||||||||||||
| Time deposits |
— | 1,064,269 | 256,781 | 737,807 | 212,879 | — | 2,271,736 | |||||||||||||||||||
| Non-interest bearing deposits |
— | — | — | 48,144 | 914,742 | — | 962,886 | |||||||||||||||||||
| Borrowings |
255,932 | 9,427 | — | 131,978 | 119,920 | — | 517,257 | |||||||||||||||||||
| Other liabilities |
— | — | — | — | — | 109,561 | 109,561 | |||||||||||||||||||
| Stockholders’ equity |
— | — | — | — | — | 609,499 | 609,499 | |||||||||||||||||||
| Total Liabilities & Equity |
$ | 255,932 | $ | 2,363,241 | $ | 610,776 | $ | 1,773,969 | $ | 1,444,276 | $ | 719,060 | $ | 7,167,254 | ||||||||||||
| Interest sensitivity gap |
$ | (254,266 | ) | $ | 669,863 | $ | 169,994 | $ | (526,496 | ) | $ | (69,083 | ) | $ | 9,988 | |||||||||||
| Cumulative interest rate sensitivity gap |
$ | (254,266 | ) | $ | 415,597 | $ | 585,591 | $ | 59,095 | $ | (9,988 | ) | — | |||||||||||||
| Cumulative interest rate sensitivity gap as a percentage of total earning assets |
(3.9 | )% | 6.4 | % | 9.0 | % | 0.9 | % | (0.2 | )% | ||||||||||||||||
Net Interest Income at Risk
NII at risk measures the risk of a decline in earnings due to changes in interest rates. Table 20 presents an analysis of our IRR as measured by the estimated changes in NII resulting from an instantaneous and sustained parallel shift in the yield curve at December 31, 2009. Shifts are measured in 100 basis point increments (+ 300 through—100 basis points) from base case. Base case encompasses key assumptions for asset/liability mix, loan and deposit growth, pricing, prepayment speeds, deposit decay rates, securities portfolio cash flows and reinvestment strategy, and the market value of certain assets under the various interest rate scenarios. The base case scenario assumes that the current interest rate environment is held constant throughout the forecast period; the instantaneous shocks are performed against that yield curve.
45
Table of Contents
TABLE 20. Net Interest Income (te) at Risk
| Change in |
Estimated Increase | |
| (basis points) | ||
| -100 |
-7.1% | |
| Stable |
0.0% | |
| + 100 |
1.8% | |
| + 200 |
2.9% | |
| + 300 |
3.8% | |
| Most Likely |
-1.9% | |
Additionally, we have forecasted a Most Likely NII scenario based on its conservative projection of yield curve changes for the coming 12 month period. This scenario utilizes all base case assumptions, applying those assumptions against a yield curve forecast that incorporates the current interest rate environment and projects certain strategic pricing changes over the forecast period. Table 20 indicates that our level of NII modestly increases under rising rates and declines under falling rates. It should be noted that -100 is only presented as interest rates are at historic lows with Fed Funds target at 0.25% at December 31, 2009. The most likely scenario for interest rates projects a modest -1.9% decrease in net interest income to base case. Our 12 month forward most likely interest rate forecast is very much in line with Bloomberg consensus economic forecast which is a sloping yield curve and the spread between the 10yr yield to 2 year yield narrows to 2.30% by Q4 2010. Actual results will be significantly impacted by management’s ability to execute the CD re-pricing strategy of 18 month and greater term placement within the next 6 months of CD balance re-pricing.
The increasing rate scenarios show modest increase to levels of net interest income while the down 100 scenario shows lower levels of NII. These scenarios are instantaneous shocks that assume balance sheet management will mirror base case. Should the yield curve begin to rise or fall, management has several strategies available to maximize earnings opportunities or offset the negative impact to earnings. For example, in a rising rate environment, deposit pricing strategies could be adjusted to offer more competitive rates on long and medium-term CDs and less competitive rates on short-term CDs. Another opportunity at the start of such a cycle would be reinvesting the securities portfolio cash flows into short-term or floating-rate securities. On the loan side the company can make more floating-rate loans that tie to index that re-price more frequently, such as LIBOR (London interbank offered rate) and make fewer fixed-rate loans. Finally, there are a number of hedge strategies by which management could use derivatives, including swaps and purchased ceilings, to lock in net interest margin protection; to date, we have not entered into any hedge transactions for the purpose of earnings protection.
Even if interest rates change in the designated amounts, there can be no assurance that our assets and liabilities would perform as anticipated. Additionally, a change in the U.S. Treasury rates in the designated amounts accompanied by a change in the shape of the U.S. Treasury yield curve would cause significantly different changes to NII than indicated above. Strategic management of our balance sheet and earnings is fluid and would be adjusted to accommodate these movements. As with any method of measuring IRR, certain shortcomings are inherent in the methods of analysis presented above. For example, although certain assets and liabilities may have similar maturities or periods to re-pricing, they may react in different degrees to changes in market interest rates. Also, the interest rates on certain types of assets and liabilities may fluctuate in advance of changes in market interest rates, while interest rates on other types may lag behind changes in market rates. Certain assets such as adjustable-rate loans have features which restrict changes in interest rates on a short-term basis and over the life of the asset. Also, the ability of many borrowers to service their debt may decrease in the event of an interest rate increase. We consider all of these factors in monitoring its exposure to interest rate risk.
46
Table of Contents
LIQUIDITY
Liquidity Management
Liquidity management encompasses our ability to ensure that funds are available to meet the cash flow requirements of depositors and borrowers, while also ensuring that we have adequate cash flow to meet our various needs, including operating, strategic and capital. Without proper liquidity management, we would not be able to perform the primary function of a financial intermediary and would not be able to meet the needs of the communities in which we have a presence and serve. In addition, the parent holding company’s principal source of liquidity is dividends from its subsidiary banks. Liquidity is required at the parent holding company level for the purpose of paying dividends to stockholders, servicing of any debt we may have, business combinations as well as general corporate expenses.
The asset portion of the balance sheet provides liquidity primarily through loan principal repayments, maturities of investment securities and occasional sales of various assets. Short-term investments such as federal funds sold, securities purchased under agreements to resell and maturing interest-bearing deposits with other banks are additional sources of liquidity funding. As shown in Table 21 below, our liquidity ratios as of December 31, 2009 and 2008 for free securities stood at 20.5% or $365.5 million and 22.5% or $378.4 million, respectively.
TABLE 21. Liquidity Ratios
| 2009 | 2008 | |||||||
| (In thousands) | ||||||||
| Free securities |
20.50 | % | 22.50 | % | ||||
| Free securities-net wholesale funds/core deposits |
5.00 | % | -5.25 | % | ||||
| Wholesale funding diversification |
||||||||
| Certificate of deposits > $100,000 (excluding public funds) |
9.15 | % | 11.57 | % | ||||
| Brokered certificate of deposits |
0.00 | % | 0.00 | % | ||||
| Public fund certificate of deposits |
$ | 100,251 | $ | 168,388 | ||||
| Net wholesale funding maturity concentrations |
||||||||
| Overnight |
0.00 | % | 0.00 | % | ||||
| Up to 3 months |
-1.12 | % | 6.92 | % | ||||
| Up to 6 months |
1.94 | % | 1.64 | % | ||||
| Over 6 months |
7.21 | % | 9.94 | % | ||||
| Net wholesale funds |
$ | 698,456 | $ | 1,325,274 | ||||
| Core deposits |
$ | 5,886,782 | $ | 4,474,625 | ||||
The liability portion of the balance sheet provides liquidity through various customers’ interest-bearing and non-interest-bearing deposit accounts. Purchases of federal funds, securities sold under agreements to repurchase and other short-term borrowings are additional sources of liquidity and represent our incremental borrowing capacity. These sources of liquidity are short-term in nature and are used as necessary to fund asset growth and meet short-term liquidity needs. Our short-term borrowing capacity includes an approved line of credit with the Federal Home Loan Bank of $367 million and borrowing capacity at the Federal Reserve’s Discount Window in excess of $139 million. As of December 31, 2009 and 2008, our core deposits were $5.9 billion and $4.5 billion, respectively, and Net Wholesale Funding stood at $698.5 million and $1.3 billion, respectively.
The Consolidated Statements of Cash Flows provide an analysis of cash from operating, investing, and financing activities for each of the three years in the period ended December 31, 2009. Cash flows from operations are a significant part of liquidity management, contributing significant levels of funds in 2009, 2008 and 2007.
Cash flows from operations decreased to $17.9 in 2009 from $94.4 million in 2008 and from $56.1 million in 2007. Cash flows provided by investing activities were $253.9 million in 2009, primarily from the acquisition of Peoples First, compared to cash flows used in investing activities of $1.11 billion in 2008. Federal funds sold decreased $176.0 million during 2009 and increased $57.4 million during 2008. Cash flows used by financing activities were $266.9 million in 2009, primarily from the decrease in deposits, compared to cash flows provided by financing activities of $1.03 billion in 2008.
47
Table of Contents
Contractual Obligations
We have contractual obligations to make future payments on certain debt and lease agreements. Table 22 summarizes all significant contractual obligations at December 31, 2009, according to payments due by period.
TABLE 22. Contractual Obligations
| Payment due by period | |||||||||||||||
| Total | Less than 1 year |
1-3 years |
3-5 years |
More than 5 years | |||||||||||
| (In thousands) | |||||||||||||||
| Certificates of deposit |
$ | 3,072,742 | $ | 2,380,991 | $ | 524,828 | $ | 166,923 | $ | — | |||||
| Short-term debt obligations |
484,707 | 484,707 | — | — | — | ||||||||||
| Long-term debt obligations |
223 | 13 | 33 | 46 | 131 | ||||||||||
| Capital lease obligations |
448 | 280 | 54 | 65 | 49 | ||||||||||
| Operating lease obligations |
34,553 | 5,810 | 6,895 | 4,533 | 17,315 | ||||||||||
| Total |
$ | 3,592,673 | $ | 2,871,801 | $ | 531,810 | $ | 171,567 | $ | 17,495 | |||||
CAPITAL RESOURCES
A strong capital position, which is vital to continued profitability, also promotes depositor and investor confidence and provides a solid foundation for future growth. Composite ratings by the respective regulatory authorities of the Company and the Banks establish minimum capital levels. Currently, we are required to maintain minimum Tier 1 leverage ratios of at least 3%, subject to an increase up to 5%, depending on the composite rating. At December 31, 2009, our capital balances were in excess of current regulatory minimum requirements. As indicated in Table 23 below, our regulatory capital ratios far exceed the minimum required ratios, and we have been categorized as “well capitalized” in the most recent notice received from their regulators.
We remain very well capitalized. As of December 31, 2009, our Leverage (tier one) Ratio stands at 10.60%, while the Tangible Equity Ratio is 8.81% (see below in Table 23). While we remain very well capitalized, so that we maintain flexibility for future capital needs, including acquisitions, we may consider raising additional capital at some point in the future.
TABLE 23. Risk-Based Capital and Capital Ratios
| 2009 | 2008 | 2007 | 2006 | 2005 | ||||||||||||||||
| (In thousands) | ||||||||||||||||||||
| Tier 1 regulatory capital |
$ | 756,108 | $ | 550,216 | $ | 498,731 | $ | 510,639 | $ | 420,283 | ||||||||||
| Tier 2 regulatory capital |
66,397 | 61,874 | 47,447 | 46,583 | 46,218 | |||||||||||||||
| Total regulatory capital |
$ | 822,505 | $ | 612,090 | $ | 546,178 | $ | 557,222 | $ | 466,501 | ||||||||||
| Risk-weighted assets |
$ | 6,305,707 | $ | 5,162,676 | $ | 4,523,479 | $ | 4,097,400 | $ | 3,665,722 | ||||||||||
| Ratios |
||||||||||||||||||||
| Leverage (Tier 1 capital to average assets) |
10.60 | % | 8.06 | % | 8.51 | % | 8.63 | % | 7.85 | % | ||||||||||
| Tier 1 capital to risk-weighted assets |
11.99 | % | 10.66 | % | 11.03 | % | 12.46 | % | 11.47 | % | ||||||||||
| Total capital to risk-weighted assets |
13.04 | % | 11.86 | % | 12.07 | % | 13.60 | % | 12.73 | % | ||||||||||
| Common stockholders’ equity to total assets |
9.63 | % | 8.50 | % | 9.15 | % | 9.36 | % | 8.02 | % | ||||||||||
| Tangible common equity to total assets |
8.81 | % | 7.62 | % | 8.08 | % | 8.24 | % | 6.89 | % | ||||||||||
48
Table of Contents
We made no stock purchases in 2009. During 2008, we purchased a total of 6,458 shares of common stock at an aggregate price of $260,000, or $40.26 per share. These shares were purchased under the 2007 Stock Repurchase Plan, authorizing the repurchase of 3,000,000 shares, or approximately 10% of our outstanding common stock. Subject to market conditions, repurchases will be conducted solely through a Rule 10b-1 repurchase plan. Shares repurchased under this plan will be held in treasury and used for general corporate purposes as determined by our board of directors.
FOURTH QUARTER RESULTS
Net income for the fourth quarter of 2009 was $31.8 million, an increase of $23.5 million, or 282.0 percent, from the fourth quarter of 2008. Diluted earnings per share for 2009’s fourth quarter were $0.89, compared to $0.26 per diluted share for the same quarter a year ago. Our financial results for the fourth quarter of 2009 and the year as a whole as discussed in the Executive Overview were impacted by two very significant events. The impact of these events is summarized below:
| • | On October 26, 2009, the company closed a very successful common stock offering. In connection with the offering, the company issued 4,945,000 shares of common stock at a price of $35.50. Gross proceeds were $175.5 million with net proceeds of $167.3 million after expenses. The proceeds of the offering are intended to be used for general corporate purposes, which may include financing acquisition opportunities and other expansion efforts. |
| • | On December 18, 2009, we acquired the assets and assumed the liabilities of Panama City, FL, based Peoples First Community Bank (Peoples First) through a purchase and assumption agreement containing a loss-sharing clause with the Federal Deposit Insurance Corporation (FDIC). The loss-sharing clause lessens the significant credit risk that usually accompanies a more traditional merger or acquisition. As a result of the loss-sharing clause, FDIC will cover all acquired loans with reimbursement of 80 percent of losses up to $385 million and 95 percent of losses beyond $385 million. The Company recorded an FDIC loss share receivable of $325.6 million which represents the fair value of the FDIC’s portion of the losses that are expected to be incurred and reimbursed to the Company. Hancock Bank acquired approximately $1.71 billion in assets and assumed $1.69 billion in liabilities. These values are subject to refinement for up to one year after the closing date of the acquisition as additional information relative to the closing may become available. All of the other real estate owned (including foreclosed real estate) was retained by the FDIC. The acquisition resulted in a pretax acquisition gain of $33.6 million and pretax merger related expenses of $3.7 million. Peoples First has 29 branches in the Florida Panhandle and Central Florida. |
For the quarter ended December 31, 2009, Hancock’s average total loans were $4.4 billion, which represented an increase of $187.7 million, or 4.5 percent, from the same quarter a year ago. The increases were in commercial/real estate (up $155.5 million), direct consumer loans (up $54.7 million), and mortgage loans (up $38.4 million) slightly offset by decreases in indirect consumer loans (down $53.6 million) and finance company loans (down $7.2 million.) Period end loans were $5.1 billion at December 31, 2009, an increase of $864.7 million, or 20.3 percent, from December 31, 2008. The increase was mainly due to the acquisition of Peoples First.
Average deposits were up $2.9 million, or 0.1 percent, from the fourth quarter of 2008. Period-end deposits for the fourth quarter were $7.20 billion, up $1.26 billion, or 21.3 percent, from December 31, 2008, primarily due to the acquisition of Peoples First. The increase was primarily in time deposits (up $869.1 million), interest bearing transaction deposits (up $443.6 million) and noninterest bearing deposits (up $110.5 million) slightly offset by a decrease in interest bearing public fund deposits (down $158.3 million.)
Net charge-offs for 2009’s fourth quarter were $13.6 million, or 1.24 percent of average loans compared to $12.6 million in the fourth quarter of 2008, or 1.20 percent of average loans. Non-performing assets as a percent of total loans and foreclosed assets was 1.97 percent at December 31, 2009 compared to 0.83 percent at December 31, 2008. The increase in non-performing assets was due primarily to the acquisition of Peoples First. Hancock recorded a provision for loan losses for the fourth quarter of $15.8 million, a decrease of $1.3 million, from $17.1 million at December 31, 2008. The ratio of the allowance for loan losses as a percent of period-end loans was 1.29 percent at December 31, 2009 compared to 1.45 percent at December 31, 2008.
49
Table of Contents
Net interest income (te) for the fourth quarter increased $8.7 million, or 15.8 percent, while the net interest margin (te) of 3.97 percent was 46 basis points wider than the same quarter a year ago. Growth in average earning assets was strong compared to the same quarter a year ago with an increase of $158.5 million, or 2.5 percent, mostly reflected in higher average loans (up $187.7 million, or 4.5 percent). With short-term interest rates down significantly from the same quarter a year ago, the Company’s loan yield fell 12 basis points, pushing the yield on average earning assets down 28 basis points. However, total funding costs over the same quarter a year ago were down 73 basis points.
Non-interest income, excluding securities transactions, for the fourth quarter was up $32.8 million, or 107.2 percent, compared to the same quarter a year ago. The primary factor impacting the increase in non-interest income compared to the same quarter a year ago was the acquisition gain of $33.6 million. Other factors impacting noninterest income were higher levels of secondary mortgage market operations (up $810 thousand or 128.8 percent), service charges on deposit accounts (up $347 thousand or 3.0 percent), trust fees (up $160 thousand or 4.2 percent), ATM fees (up $148 thousand or 8.8 percent), and debit card and merchant fees (up $91 thousand or 3.2 percent). These increases were partially offset by decreases in investment and annuity fees (down $1.2 million or 41.7 percent) and insurance fees ($807 thousand or 19.5 percent).
Operating expenses for the fourth quarter were up $8.0 million, or 14.4 percent, compared to the same quarter a year ago. One factor contributing to the increase from the prior year quarter was $3.7 million in merger-related expenses related to the acquisition of Peoples First. The increase from the same quarter a year ago was reflected in higher personnel expense (up $4.4 million or 15.5 percent) and other operating expenses (up $3.8 million or 19.6 percent). These increases were slightly offset by a decrease in equipment expense (down $252 thousand or 9.7 percent).
50
Table of Contents
Table 24 summarizes our unaudited quarterly financial results for 2009 and 2008.
TABLE 24. Summary of Quarterly Results
| 2009 | ||||||||||||||||
| First | Second | Third | Fourth | |||||||||||||
| (In thousands, except per share data) | ||||||||||||||||
| Interest income (te) |
$ | 84,392 | $ | 83,054 | $ | 82,757 | $ | 85,585 | ||||||||
| Interest expense |
(28,002 | ) | (23,413 | ) | (22,004 | ) | (21,881 | ) | ||||||||
| Net interest income (te) |
56,390 | 59,641 | 60,753 | 63,704 | ||||||||||||
| Provision for loan losses |
(8,342 | ) | (16,919 | ) | (13,495 | ) | (15,834 | ) | ||||||||
| Noninterest income |
29,055 | 34,504 | 30,408 | 63,360 | ||||||||||||
| Noninterest expense |
(55,838 | ) | (58,226 | ) | (55,749 | ) | (63,657 | ) | ||||||||
| Taxable equivalent adjustment |
(2,944 | ) | (2,949 | ) | (2,999 | ) | (3,169 | ) | ||||||||
| Income before income taxes |
18,321 | 16,051 | 18,918 | 44,404 | ||||||||||||
| Income tax expense |
(4,290 | ) | (2,305 | ) | (3,700 | ) | (12,624 | ) | ||||||||
| Net income |
$ | 14,031 | $ | 13,746 | $ | 15,218 | $ | 31,780 | ||||||||
| Average balance sheet data |
||||||||||||||||
| Total assets |
$ | 7,183,886 | $ | 7,025,612 | $ | 6,977,267 | $ | 7,213,323 | ||||||||
| Earning assets |
6,474,047 | 6,325,667 | 6,266,441 | 6,408,910 | ||||||||||||
| Loans |
4,285,376 | 4,277,351 | 4,301,651 | 4,375,208 | ||||||||||||
| Deposits |
5,909,887 | 5,707,121 | 5,560,812 | 5,617,295 | ||||||||||||
| Stockholders’ equity |
624,239 | 636,086 | 643,573 | 792,093 | ||||||||||||
| Ratios |
||||||||||||||||
| Return on average assets |
0.79 | % | 0.78 | % | 0.87 | % | 1.75 | % | ||||||||
| Return on average common equity |
9.12 | % | 8.67 | % | 9.38 | % | 15.92 | % | ||||||||
| Net interest margin (te) |
3.50 | % | 3.78 | % | 3.86 | % | 3.97 | % | ||||||||
| Earnings per share |
||||||||||||||||
| Basic |
$ | 0.44 | $ | 0.43 | $ | 0.48 | $ | 0.89 | ||||||||
| Diluted |
$ | 0.44 | $ | 0.43 | $ | 0.47 | $ | 0.89 | ||||||||
| Cash dividends per common share |
$ | 0.24 | $ | 0.24 | $ | 0.24 | $ | 0.24 | ||||||||
| Market data: |
||||||||||||||||
| High sales price |
$ | 45.56 | $ | 41.19 | $ | 42.38 | $ | 44.89 | ||||||||
| Low sales price |
22.51 | 30.12 | 29.90 | 35.26 | ||||||||||||
| Period-end closing price |
31.28 | 32.49 | 37.57 | 43.81 | ||||||||||||
| Trading volume |
18,026 | 17,040 | 11,676 | 19,538 | ||||||||||||
51
Table of Contents
TABLE 24. Summary of Quarterly Results (continued)
| 2008 | ||||||||||||||||
| First | Second | Third | Fourth | |||||||||||||
| (In thousands, except per share data) | ||||||||||||||||
| Interest income (te) |
$ | 87,227 | $ | 84,164 | $ | 86,774 | $ | 87,726 | ||||||||
| Interest expense |
(34,345 | ) | (29,573 | ) | (29,357 | ) | (32,727 | ) | ||||||||
| Net interest income (te) |
52,882 | 54,591 | 57,417 | 54,999 | ||||||||||||
| Provision for loan losses |
(8,818 | ) | (2,787 | ) | (8,064 | ) | (17,116 | ) | ||||||||
| Noninterest income |
36,421 | 31,838 | 30,115 | 29,404 | ||||||||||||
| Noninterest expense |
(50,134 | ) | (52,189 | ) | (55,483 | ) | (55,637 | ) | ||||||||
| Taxable equivalent adjustment |
(2,455 | ) | (2,432 | ) | (2,642 | ) | (2,925 | ) | ||||||||
| Income before income taxes |
27,896 | 29,021 | 21,343 | 8,725 | ||||||||||||
| Income tax expense |
(7,839 | ) | (8,037 | ) | (5,338 | ) | (405 | ) | ||||||||
| Net income |
$ | 20,057 | $ | 20,984 | $ | 16,005 | $ | 8,320 | ||||||||
| Average balance sheet data |
||||||||||||||||
| Total assets |
$ | 6,212,129 | $ | 6,223,233 | $ | 6,374,628 | $ | 6,891,029 | ||||||||
| Earning assets |
5,581,299 | 5,608,748 | 5,747,098 | 6,250,441 | ||||||||||||
| Loans |
3,638,608 | 3,712,005 | 3,953,235 | 4,187,468 | ||||||||||||
| Deposits |
5,046,413 | 4,961,305 | 5,103,630 | 5,614,400 | ||||||||||||
| Stockholders’ equity |
570,706 | 581,681 | 584,146 | 602,497 | ||||||||||||
| Ratios |
||||||||||||||||
| Return on average assets |
1.30 | % | 1.36 | % | 1.00 | % | 0.48 | % | ||||||||
| Return on average common equity |
14.13 | % | 14.51 | % | 10.90 | % | 5.49 | % | ||||||||
| Net interest margin (te) |
3.80 | % | 3.91 | % | 3.99 | % | 3.51 | % | ||||||||
| Earnings per share |
||||||||||||||||
| Basic |
$ | 0.64 | $ | 0.67 | $ | 0.51 | $ | 0.26 | ||||||||
| Diluted |
$ | 0.63 | $ | 0.66 | $ | 0.50 | $ | 0.26 | ||||||||
| Cash dividends per common share |
$ | 0.24 | $ | 0.24 | $ | 0.24 | $ | 0.24 | ||||||||
| Market data: |
||||||||||||||||
| High closing price |
$ | 44.29 | $ | 45.68 | $ | 68.42 | $ | 56.45 | ||||||||
| Low closing price |
$ | 33.45 | $ | 38.38 | $ | 33.34 | $ | 34.20 | ||||||||
| Period-end closing price |
$ | 42.02 | $ | 39.29 | $ | 51.00 | $ | 45.46 | ||||||||
| Trading volume |
17,204 | 14,527 | 23,562 | 18,544 | ||||||||||||
Net interest income (te) is the primary component of earnings and represents the difference, or spread, between revenue generated from interest-earning assets and the interest expense related to funding those assets.
CRITICAL ACCOUNTING POLICIES AND ESTIMATES
The accounting principles we follow and the methods for applying these principles conform with accounting principles generally accepted in the United States of America and with general practices followed by the banking industry which requires management to make estimates and assumptions about future events. These estimates and assumptions are based on our best estimates and judgments. We evaluate estimates and assumptions on an ongoing basis using historical experience and other factors, including the current economic environment. We adjust such estimates and assumptions when facts and circumstances dictate. Illiquid credit markets, volatile equity markets, rising unemployment levels and declines in consumer spending have combined to increase the uncertainty inherent in such estimates and assumptions. Certain critical accounting policies affect the more significant judgments and estimates used in the preparation of the consolidated financial statements.
52
Table of Contents
Allowance for Loan Losses
Our most critical accounting policy relates to our allowance for loan losses, which reflects the estimated losses resulting from the inability of our borrowers to make loan payments. If the financial condition of its borrowers were to deteriorate, resulting in an impairment of their ability to make payments, the estimates of the allowance would be updated, and additional provisions for loan losses may be required.
The allowance for loan and lease losses (ALLL) is a valuation account available to absorb losses on loans. The ALLL is established and maintained at an amount sufficient to cover the estimated credit loss associated with the loan and lease portfolios of the Banks as of the date of the determination. Credit losses arise not only from credit risk, but also from other risks inherent in the lending process including, but not limited to, collateral risk, operational risk, concentration risk, and economic risk. As such, all related risks of lending are considered when assessing the adequacy of the allowance for loan and lease losses. Quarterly, management estimates the probable level of losses to determine whether the allowance is adequate to absorb reasonably foreseeable, anticipated losses in the existing portfolio based on our past loan loss and delinquency experience, known and inherent risks in the portfolio, adverse situations that may affect the borrowers’ ability to repay, and the estimated value of any underlying collateral and current economic conditions. The analysis and methodology include three primary segments. These segments include a pool analysis of various retail loans based upon loss history, a pool analysis of commercial and commercial real estate loans based upon loss history by loan type, and a specific reserve analysis for those loans considered impaired under generally accepted accounting principles. All commercial and commercial real estate loans with an outstanding balance of $100,000 or greater are individually reviewed for impairment; substandard mortgage loans with balances of $100,000 or greater are also included in the analysis. All losses are charged to the allowance for loan and lease losses when the loss actually occurs or when a determination is made that a loss is likely to occur; recoveries are credited to the allowance for loan losses at the time of receipt.
Purchased impaired loans are recorded at fair value at the acquisition date and the accretable yield is recognized in interest income over the remaining life of the loan. In addition, net charge-offs exclude write-downs on purchased impaired loans as the fair value already considers the estimated credit losses.
Retirement Employee Benefit Plans
Retirement and employee benefit plan assets, liabilities and pension costs are determined utilizing actuarially determined present value calculations. The valuation of the benefit obligation and net periodic expense is considered critical, as it requires management and its actuaries to make estimates regarding the amount and timing of expected cash outflows including assumptions about mortality, expected service periods, rate of compensation increases and the long-term return on plan assets. Note 10 – Retirement and Employee Benefit Plans, included in the accompanying Notes to the Consolidated Financial Statements, provides further discussion on the accounting for Hancock’s retirement and employee benefit plans and the estimates used in determining the actuarial present value of the benefit obligations and the net periodic benefit expense.
Fair Value Accounting Estimates
Generally accepted accounting principles require the use of fair values in determining the carrying values of certain assets and liabilities, as well as for specific disclosures. The most significant include securities, loans held for sale, mortgage servicing rights and net assets acquired in business combinations. Certain of these assets do not have a readily available market to determine fair value and require an estimate based on specific parameters. When market prices are unavailable, we determine fair values utilizing parameters, which are constantly changing, including interest rates, duration, prepayment speeds and other specific conditions. In most cases, these specific parameters require a significant amount of judgment by management.
53
Table of Contents
The Company adopted the Financial Accounting Standards Board’s (FASB) authoritative guidance regarding fair value measurements on January 1, 2008. The guidance establishes a framework for measuring fair value under generally accepted accounting principles (GAAP), clarifies the definition of fair value within that framework, and expands disclosures about the use of fair value measurements. The guidance defines a fair value hierarchy that prioritizes the inputs to these valuation techniques used to measure fair value giving preference to quoted prices in active markets (level 1) and the lowest priority to unobservable inputs such as a reporting entity’s own data (level 3). Level 2 inputs include quoted prices for similar assets or liabilities in active markets, quoted prices for identical assets or liabilities in markets that are not active, observable inputs other than quoted prices, such as interest rates and yield curves, and inputs that are derived principally from or corroborated by observable market data by correlation or other means. Available for sale securities classified as Level 1 within the valuation hierarchy include U.S. Treasury securities, obligations of U.S. Government-sponsored agencies, and other debt and equity securities. Level 2 classified available for sale securities include mortgage-backed debt securities, collateralized mortgage obligations, and state and municipal bonds.
In October 2008, the FASB issued guidance for determining the fair value of a financial asset in a market that is not active, which clarified previous guidance. Application issues clarified include: how management’s internal assumptions should be considered when measuring fair value when relevant observable data do not exist; how observable market information in a market that is not active should be considered when measuring fair value; and how the use of market quotes should be considered when assessing the relevance of observable and unobservable data available to measure fair value. The guidance was effective immediately and did not have a material impact on the Company’s financial condition or results of operations. The Company adopted authoritative guidance regarding the fair value option for financial assets and financial liabilities, on January 1, 2008. The Company did not elect to fair value any additional items under the guidance.
Income Taxes
We use the asset and liability method of accounting for income taxes. Determination of the deferred and current provision requires analysis by management of certain transactions and the related tax laws and regulations. Management exercises significant judgment in evaluating the amount and timing of recognition of the resulting tax liabilities and assets. Those judgments and estimates are re-evaluated on a continual basis as regulatory and business factors change.
RECENT ACCOUNTING PRONOUNCEMENTS
See Note 1 to our Consolidated Financial Statements included elsewhere in this report.
| ITEM 7A. | QUANTITATIVE AND QUALITATIVE DISCLOSURES ABOUT MARKET RISK |
The information required for this item is included in the section entitled “Asset/Liability Management” in “Management’s Discussion and Analysis of Financial Condition and Results of Operations” that appears in Item 7 of this Form 10-K and is incorporated here by reference.
54
Table of Contents
| ITEM 8. | FINANCIAL STATEMENTS AND SUPPLEMENTARY DATA |
Index to Financial Statements and Financial Statement Schedule
| Page | ||
| Management’s Report on Internal Control Over Financial Reporting |
56 | |
| 57 | ||
| 58 | ||
| Consolidated Balance Sheets as of December 31, 2009 and 2008 |
59 | |
| 60 | ||
| 61 | ||
| 62 | ||
| 64 |
55
Table of Contents
MANAGEMENT’S REPORT ON INTERNAL CONTROL OVER FINANCIAL REPORTING
The management of Hancock Holding Company has prepared the consolidated financial statements and other information in our Annual Report in accordance with accounting principles generally accepted in the United States of America and is responsible for its accuracy. The financial statements necessarily include amounts that are based on management’s best estimates and judgments.
In meeting its responsibility, management relies on internal accounting and related control systems. The internal control systems are designed to ensure that transactions are properly authorized and recorded in the Company’s financial records and to safeguard the Company’s assets from material loss or misuse. Such assurance cannot be absolute because of inherent limitations in any internal control system.
The Company’s management is responsible for establishing and maintaining adequate internal control over financial reporting, as such term is defined in the Exchange Act Rules 13(a) – 15(f). Under the supervision and with the participation of management, including the Company’s principal executive officers and principal financial officer, the Company conducted an evaluation of the effectiveness of internal control over financial reporting based on the framework in Internal Control – Integrated Framework issued by the Committee of Sponsoring Organizations of the Treadway Commission. Management also conducted an assessment of requirements pertaining to Section 112 of the Federal Deposit Insurance Corporation Improvement Act (FDICIA). This section relates to management’s evaluation of internal control over financial reporting, including controls over the preparation of the schedules equivalent to the basic financial statements and compliance with laws and regulations. Our evaluation included a review of the documentation of controls, evaluations of the design of the internal control system and tests of the effectiveness of internal controls.
Based on the Company’s evaluation under the framework in Internal Control – Integrated Framework, management concluded that internal control over financial reporting was effective as of December 31, 2009.
| Carl J. Chaney |
John M. Hairston |
Michael M. Achary | ||
| President & |
Chief Executive Officer & |
Chief Financial Officer | ||
| Chief Executive Officer |
Chief Operating Officer |
February 17, 2010 | ||
| February 17, 2010 |
February 17, 2010 |
56
Table of Contents
Report of Independent Registered Public Accounting Firm
The Board of Directors and Stockholders
Hancock Holding Company:
In our opinion, the accompanying consolidated balance sheet and the related consolidated statements of income, stockholders’ equity and cash flows present fairly, in all material respects, the financial position of Hancock Holding Company (the “Company”) and its subsidiaries at December 31, 2009, and the results of its operations and its cash flows for the year ended December 31, 2009 in conformity with accounting principles generally accepted in the United States of America. Also in our opinion, the Company maintained, in all material respects, effective internal control over financial reporting as of December 31, 2009, based on criteria established in Internal Control - Integrated Framework issued by the Committee of Sponsoring Organizations of the Treadway Commission (COSO). The Company’s management is responsible for these financial statements, for maintaining effective internal control over financial reporting and for its assessment of the effectiveness of internal control over financial reporting, included in the accompanying Management’s Report on Internal Control over Financial Reporting. Our responsibility is to express an opinion on these financial statements and on the Company’s internal control over financial reporting based on our integrated audit. We conducted our audit in accordance with the standards of the Public Company Accounting Oversight Board (United States). Those standards require that we plan and perform the audit to obtain reasonable assurance about whether the financial statements are free of material misstatement and whether effective internal control over financial reporting was maintained in all material respects. Our audit of the financial statements included examining, on a test basis, evidence supporting the amounts and disclosures in the financial statements, assessing the accounting principles used and significant estimates made by management, and evaluating the overall financial statement presentation. Our audit of internal control over financial reporting included obtaining an understanding of internal control over financial reporting, assessing the risk that a material weakness exists, and testing and evaluating the design and operating effectiveness of internal control based on the assessed risk. Our audit also included performing such other procedures as we considered necessary in the circumstances. We believe that our audit provides a reasonable basis for our opinion. The accompanying consolidated financial statements of the Company as of December 31, 2008 and for the two years then ended were audited by other auditors whose report, dated February 27, 2009, expressed an unqualified opinion on those statements.
A company’s internal control over financial reporting is a process designed to provide reasonable assurance regarding the reliability of financial reporting and the preparation of financial statements for external purposes in accordance with generally accepted accounting principles. Management’s assessment and our audit of the Company’s internal control over financial reporting also included controls over the preparation of financial statements in accordance with the instructions to the Consolidated Financial Statements for Bank Holding Companies (Form FR Y-9C) to comply with the reporting requirements of Section 112 of the Federal Deposit Insurance Corporation Improvement Act (FDICIA). A company’s internal control over financial reporting includes those policies and procedures that (i) pertain to the maintenance of records that, in reasonable detail, accurately and fairly reflect the transactions and dispositions of the assets of the company; (ii) provide reasonable assurance that transactions are recorded as necessary to permit preparation of financial statements in accordance with generally accepted accounting principles, and that receipts and expenditures of the company are being made only in accordance with authorizations of management and directors of the company; and (iii) provide reasonable assurance regarding prevention or timely detection of unauthorized acquisition, use, or disposition of the company’s assets that could have a material effect on the financial statements.
Because of its inherent limitations, internal control over financial reporting may not prevent or detect misstatements. Also, projections of any evaluation of effectiveness to future periods are subject to the risk that controls may become inadequate because of changes in conditions, or that the degree of compliance with the policies or procedures may deteriorate.
| /s/ PricewaterhouseCoopers LLP |
| New Orleans, Louisiana |
| February 17, 2010 |
57
Table of Contents
Report of Independent Registered Public Accounting Firm
The Board of Directors and Stockholders
Hancock Holding Company:
We have audited the accompanying consolidated balance sheet of Hancock Holding Company and subsidiaries as of December 31, 2008, and the related consolidated statements of income, stockholders’ equity and cash flows for each of the years in the two-year period ended December 31, 2008. These consolidated financial statements are the responsibility of the Company’s management. Our responsibility is to express an opinion on these consolidated financial statements based on our audits.
We conducted our audits in accordance with the standards of the Public Company Accounting Oversight Board (United States). Those standards require that we plan and perform the audit to obtain reasonable assurance about whether the financial statements are free of material misstatement. An audit includes examining, on a test basis, evidence supporting the amounts and disclosures in the financial statements. An audit also includes assessing the accounting principles used and significant estimates made by management, as well as evaluating the overall financial statement presentation. We believe that our audits provide a reasonable basis for our opinion.
In our opinion, the consolidated financial statements referred to above present fairly, in all material respects, the financial position of Hancock Holding Company and subsidiaries as of December 31, 2008, and the results of their operations and their cash flows for each of the years in the two-year period ended December 31, 2008 in conformity with U.S. generally accepted accounting principles.
| /s/ KPMG LLP |
| Birmingham, Alabama |
| February 27, 2009 |
58
Table of Contents
Hancock Holding Company and Subsidiaries
Consolidated Balance Sheets
| December 31, | ||||||||
| 2009 | 2008 | |||||||
| (In thousands, except share data) | ||||||||
| Assets: |
||||||||
| Cash and due from banks (non-interest bearing) |
$ | 204,714 | $ | 199,775 | ||||
| Interest-bearing time deposits with other banks |
582,081 | 11,355 | ||||||
| Federal funds sold |
410 | 175,166 | ||||||
| Other short-term investments |
214,771 | 362,895 | ||||||
| Trading securities |
1,635 | 2,201 | ||||||
| Securities available for sale, at fair value (amortized cost of $1,566,403 and $1,651,499) |
1,611,327 | 1,679,756 | ||||||
| Loans held for sale |
36,112 | 22,290 | ||||||
| Loans |
5,127,339 | 4,264,149 | ||||||
| Less: Allowance for loan losses |
(66,050 | ) | (61,725 | ) | ||||
| Unearned income |
(13,164 | ) | (14,859 | ) | ||||
| Loans, net |
5,048,125 | 4,187,565 | ||||||
| Property and equipment, net of accumulated depreciation of $113,967 and $101,050 |
203,133 | 205,912 | ||||||
| Other real estate, net |
13,786 | 5,195 | ||||||
| Accrued interest receivable |
35,468 | 33,067 | ||||||
| Goodwill |
62,277 | 62,277 | ||||||
| Other intangible assets, net |
16,546 | 6,363 | ||||||
| Life insurance contracts |
151,355 | 144,959 | ||||||
| Deferred tax asset, net |
— | 5,819 | ||||||
| FDIC loss share receivable |
325,606 | — | ||||||
| Other assets |
189,737 | 62,659 | ||||||
| Total assets |
$ | 8,697,083 | $ | 7,167,254 | ||||
| Liabilities and Stockholders’ Equity: |
||||||||
| Deposits: |
||||||||
| Non-interest bearing demand |
$ | 1,073,341 | $ | 962,886 | ||||
| Interest-bearing savings, NOW, money market and time |
6,122,471 | 4,968,051 | ||||||
| Total deposits |
7,195,812 | 5,930,937 | ||||||
| Federal funds purchased |
250 | — | ||||||
| Securities sold under agreements to repurchase |
484,457 | 505,932 | ||||||
| Other short-term borrowings |
30,805 | — | ||||||
| Long-term notes |
671 | 638 | ||||||
| Deferred tax liability, net |
7,116 | — | ||||||
| Other liabilities |
140,309 | 120,248 | ||||||
| Total liabilities |
7,859,420 | 6,557,755 | ||||||
| Stockholders’ Equity |
||||||||
| Common stock-$3.33 par value per share; 350,000,000 shares authorized, 36,840,453 and 31,769,679 issued and outstanding, respectively |
122,679 | 105,793 | ||||||
| Capital surplus |
257,643 | 101,210 | ||||||
| Retained earnings |
454,343 | 411,579 | ||||||
| Accumulated other comprehensive gain/(loss), net |
2,998 | (9,083 | ) | |||||
| Total stockholders’ equity |
837,663 | 609,499 | ||||||
| Total liabilities and stockholders’ equity |
$ | 8,697,083 | $ | 7,167,254 | ||||
See accompanying notes to consolidated financial statements.
59
Table of Contents
Hancock Holding Company and Subsidiaries
Consolidated Statements of Income
| Years Ended December 31, | ||||||||||||
| 2009 | 2008 | 2007 | ||||||||||
| (In thousands, except per share data) | ||||||||||||
| Interest income: |
||||||||||||
| Loans, including fees |
$ | 244,124 | $ | 246,573 | $ | 255,761 | ||||||
| Securities-taxable |
70,573 | 80,048 | 78,089 | |||||||||
| Securities-tax exempt |
4,555 | 4,978 | 6,234 | |||||||||
| Federal funds sold |
14 | 1,858 | 5,458 | |||||||||
| Other investments |
4,461 | 1,980 | 155 | |||||||||
| Total interest income |
323,727 | 335,437 | 345,697 | |||||||||
| Interest expense: |
||||||||||||
| Deposits |
84,313 | 111,052 | 132,920 | |||||||||
| Federal funds purchased and securities sold under agreements to repurchase |
10,809 | 14,843 | 8,231 | |||||||||
| Long-term notes and other interest expense |
198 | 184 | 80 | |||||||||
| Capitalized interest |
(20 | ) | (77 | ) | (995 | ) | ||||||
| Total interest expense |
95,300 | 126,002 | 140,236 | |||||||||
| Net interest income |
228,427 | 209,435 | 205,461 | |||||||||
| Provision for loan losses |
54,590 | 36,785 | 7,593 | |||||||||
| Net interest income after provision for loan losses |
173,837 | 172,650 | 197,868 | |||||||||
| Noninterest income: |
||||||||||||
| Service charges on deposit accounts |
45,354 | 44,243 | 41,929 | |||||||||
| Trust fees |
15,127 | 16,858 | 15,902 | |||||||||
| Insurance commissions and fees |
14,355 | 16,554 | 19,229 | |||||||||
| Investment and annuity fees |
8,220 | 10,807 | 8,746 | |||||||||
| Debit card and merchant fees |
11,252 | 11,082 | 10,126 | |||||||||
| ATM fees |
7,374 | 6,856 | 5,983 | |||||||||
| Secondary mortgage market operations |
5,906 | 2,977 | 3,723 | |||||||||
| Securities gains (losses), net |
69 | 4,825 | 308 | |||||||||
| Bargain purchase gain on acquisition |
33,623 | — | — | |||||||||
| Other income |
16,047 | 13,576 | 14,740 | |||||||||
| Total noninterest income |
157,327 | 127,778 | 120,686 | |||||||||
| Noninterest expense: |
||||||||||||
| Salaries and employee benefits |
121,449 | 109,773 | 106,959 | |||||||||
| Net occupancy expense |
20,340 | 19,538 | 19,435 | |||||||||
| Equipment rentals, depreciation and maintenance |
9,849 | 10,992 | 10,465 | |||||||||
| Amortization of intangibles |
1,417 | 1,432 | 1,651 | |||||||||
| Other expense |
80,415 | 71,708 | 78,233 | |||||||||
| Total noninterest expense |
233,470 | 213,443 | 216,743 | |||||||||
| Income before income taxes |
97,694 | 86,985 | 101,811 | |||||||||
| Income taxes |
22,919 | 21,619 | 27,919 | |||||||||
| Net income |
$ | 74,775 | $ | 65,366 | $ | 73,892 | ||||||
| Basic earnings per common share |
$ | 2.28 | $ | 2.07 | $ | 2.30 | ||||||
| Diluted earnings per common share |
$ | 2.26 | $ | 2.04 | $ | 2.26 | ||||||
See accompanying notes to consolidated financial statements.
60
Table of Contents
Hancock Holding Company and Subsidiaries
Consolidated Statements of Stockholders’ Equity
| Common Stock | Capital | Retained | Accumulated Other Comprehensive |
Unearned | ||||||||||||||||||||||
| Shares | Amount | Surplus | Earnings | Loss, net | Compensation | Total | ||||||||||||||||||||
| (In thousands, except share and per share data) | ||||||||||||||||||||||||||
| Balance, January 1, 2007 |
32,666,052 | $ | 108,778 | $ | 139,099 | $ | 334,546 | $ | (24,013 | ) | $ | — | $ | 558,410 | ||||||||||||
| Comprehensive income: |
||||||||||||||||||||||||||
| Net income per consolidated statements of income |
— | — | — | 73,892 | — | — | 73,892 | |||||||||||||||||||
| Net change in fair value of securities available for sale, net of tax |
— | — | — | — | 8,846 | — | 8,846 | |||||||||||||||||||
| Net change in unfunded accumulated benefit obligation, net of tax |
— | — | — | — | 540 | — | 540 | |||||||||||||||||||
| Comprehensive income |
83,278 | |||||||||||||||||||||||||
| Cash dividends paid ($0.96 per share) |
— | — | — | (30,957 | ) | — | — | (30,957 | ) | |||||||||||||||||
| Common stock issued, long - term incentive plan, including excess income tax benefit of $345 |
184,775 | 615 | 2,134 | — | — | 2,749 | ||||||||||||||||||||
| Compensation expense, long - term incentive plan |
— | — | 1,155 | — | — | — | 1,155 | |||||||||||||||||||
| Purchase of common stock |
(1,556,220 | ) | (5,182 | ) | (55,266 | ) | — | — | — | (60,448 | ) | |||||||||||||||
| Balance, December 31, 2007 |
31,294,607 | 104,211 | 87,122 | 377,481 | (14,627 | ) | — | 554,187 | ||||||||||||||||||
| Comprehensive income |
||||||||||||||||||||||||||
| Net income per consolidated statements of income |
— | — | — | 65,366 | — | — | 65,366 | |||||||||||||||||||
| Net change in unfunded accumulated benefit obligation, net of tax |
— | — | — | — | (12,095 | ) | — | (12,095 | ) | |||||||||||||||||
| Net change in fair value of securities available for sale, net of tax |
— | — | — | — | 17,639 | — | 17,639 | |||||||||||||||||||
| Comprehensive income |
70,910 | |||||||||||||||||||||||||
| SFAS No. 158, change in measurement date |
— | — | — | (815 | ) | — | — | (815 | ) | |||||||||||||||||
| Cash dividends declared ($0.96 per common share) |
— | — | — | (30,453 | ) | — | — | (30,453 | ) | |||||||||||||||||
| Common stock issued, long-term incentive plan, including excess income tax benefit of $4,512 |
481,530 | 1,604 | 11,520 | — | — | — | 13,124 | |||||||||||||||||||
| Compensation expense, long-term incentive plan |
— | — | 2,806 | — | — | — | 2,806 | |||||||||||||||||||
| Purchase of common stock |
(6,458 | ) | (22 | ) | (238 | ) | — | — | — | (260 | ) | |||||||||||||||
| Balance, December 31, 2008 |
31,769,679 | 105,793 | 101,210 | 411,579 | (9,083 | ) | — | 609,499 | ||||||||||||||||||
| Comprehensive income |
||||||||||||||||||||||||||
| Net income per consolidated statements of income |
— | — | — | 74,775 | — | — | 74,775 | |||||||||||||||||||
| Net change in unfunded accumulated benefit obligation, net of tax |
— | — | — | — | 1,473 | — | 1,473 | |||||||||||||||||||
| Net change in fair value of securities available for sale, net of tax |
— | — | — | — | 10,608 | — | 10,608 | |||||||||||||||||||
| Comprehensive income |
86,856 | |||||||||||||||||||||||||
| Cash dividends declared ($0.96 per common share) |
— | — | — | (32,011 | ) | — | — | (32,011 | ) | |||||||||||||||||
| Common stock issued |
4,945,000 | 16,467 | 150,905 | 167,372 | ||||||||||||||||||||||
| Common stock issued, long-term incentive plan, including excess income tax benefit of $480 |
125,774 | 419 | 2,274 | — | — | — | 2,693 | |||||||||||||||||||
| Compensation expense, long-term incentive plan |
— | — | 3,254 | — | — | — | 3,254 | |||||||||||||||||||
| Balance, December 31, 2009 |
36,840,453 | $ | 122,679 | $ | 257,643 | $ | 454,343 | $ | 2,998 | $ | — | $ | 837,663 | |||||||||||||
See accompanying notes to consolidated financial statements.
61
Table of Contents
Hancock Holding Company and Subsidiaries
Consolidated Statements of Cash Flows
| Years Ended December 31, | ||||||||||||
| 2009 | 2008 | 2007 | ||||||||||
| (In thousands) | ||||||||||||
| Operating Activities: |
||||||||||||
| Net income |
$ | 74,775 | $ | 65,366 | $ | 73,892 | ||||||
| Adjustments to reconcile net income to net cash provided by operating activities: |
||||||||||||
| Depreciation and amortization |
15,549 | 15,761 | 14,041 | |||||||||
| Provision for (reversal of) loan losses, net |
54,590 | 36,785 | 7,593 | |||||||||
| (Gains) losses on other real estate owned |
768 | 230 | (732 | ) | ||||||||
| Deferred tax expense (benefit) |
(6,953 | ) | (5,012 | ) | 7,560 | |||||||
| Increase in cash surrender value of life insurance contracts |
(6,396 | ) | (5,538 | ) | (5,397 | ) | ||||||
| Gain on acquisition |
(20,732 | ) | — | — | ||||||||
| (Gain) loss on sales/paydowns of securities available for sale, net |
(69 | ) | (1,950 | ) | (273 | ) | ||||||
| (Gain) loss on disposal of other assets |
(1,478 | ) | (602 | ) | 193 | |||||||
| Gain on sale of loans held for sale |
(579 | ) | (427 | ) | (583 | ) | ||||||
| (Gain) loss on trading securities |
— | (2,875 | ) | 114 | ||||||||
| Purchase of trading securities, net |
— | — | (10 | ) | ||||||||
| Proceeds from paydowns of securities held for trading |
— | 7,635 | — | |||||||||
| Amortization (accretion) of securities premium/discount, net |
917 | 2,012 | (1,773 | ) | ||||||||
| Amortization of mortgage servicing rights |
175 | 210 | 345 | |||||||||
| Amortization of intangible assets |
1,417 | 1,432 | 1,651 | |||||||||
| Stock-based compensation expense |
3,254 | 2,806 | 1,155 | |||||||||
| (Increase) decrease in accrued interest receivable |
2,779 | 2,050 | (1,417 | ) | ||||||||
| Increase (decrease) in accrued expenses |
8,270 | 2,624 | (12,197 | ) | ||||||||
| Increase in other liabilities |
20,645 | 2,309 | 4,430 | |||||||||
| Increase (decrease) in interest payable |
(3,276 | ) | (2,785 | ) | 883 | |||||||
| Decrease in policy reserves and liabilities |
(8,937 | ) | (12,051 | ) | (35,180 | ) | ||||||
| Decrease in reinsurance receivables |
3,212 | 8,060 | 3,215 | |||||||||
| (Increase) decrease in other assets |
(106,465 | ) | (14,062 | ) | 274 | |||||||
| Proceeds from sale of loans held for sale |
366,885 | 192,838 | 251,684 | |||||||||
| Originations of loans held for sale |
(380,128 | ) | (195,569 | ) | (253,112 | ) | ||||||
| Excess tax benefit from share based payments |
(480 | ) | (4,512 | ) | (345 | ) | ||||||
| Other, net |
399 | (367 | ) | 60 | ||||||||
| Net cash provided by operating activities |
18,142 | 94,368 | 56,071 | |||||||||
See accompanying notes to consolidated financial statements.
62
Table of Contents
Hancock Holding Company and Subsidiaries
Consolidated Statements of Cash Flows (continued)
| Years Ended December 31, | ||||||||||||
| 2009 | 2008 | 2007 | ||||||||||
| (In thousands) | ||||||||||||
| Investing Activities: |
||||||||||||
| Net (increase) decrease in interest-bearing time deposits |
$ | (558,271 | ) | $ | (2,795 | ) | $ | 1,637 | ||||
| Proceeds from sales of securities available for sale |
10,202 | 213,814 | 9,222 | |||||||||
| Proceeds from maturities of securities available for sale |
599,066 | 938,939 | 1,270,294 | |||||||||
| Purchases of securities available for sale |
(509,304 | ) | (1,140,901 | ) | (1,038,175 | ) | ||||||
| Proceeds from maturities of short-term investments |
1,639,998 | — | — | |||||||||
| Purchase of short-term investments |
(1,498,681 | ) | (362,895 | ) | — | |||||||
| Net (increase) decrease in federal funds sold |
176,002 | (57,445 | ) | 94,521 | ||||||||
| Net (increase) decrease in loans |
17,906 | (684,528 | ) | (356,787 | ) | |||||||
| Purchases of property and equipment |
(12,305 | ) | (23,618 | ) | (70,267 | ) | ||||||
| Proceeds from sales of property and equipment |
2,700 | 2,150 | 497 | |||||||||
| Premiums paid on life insurance contracts |
— | — | (20,000 | ) | ||||||||
| Net cash received from acquisition |
378,367 | — | — | |||||||||
| Proceeds from sales of other real estate |
8,015 | 6,184 | 1,753 | |||||||||
| Net cash provided by (used in) investing activities |
253,695 | (1,111,095 | ) | (107,305 | ) | |||||||
| Financing Activities: |
||||||||||||
| Net increase (decrease) in deposits |
(298,062 | ) | 921,403 | (21,457 | ) | |||||||
| Net increase (decrease) in federal funds purchased and securities sold under agreements to repurchase |
(21,225 | ) | 130,228 | 153,313 | ||||||||
| (Proceeds) repayments of long-term notes |
(166 | ) | (155 | ) | 535 | |||||||
| Proceeds from issuance of short-term notes |
1,609,399 | — | — | |||||||||
| Repayments of short-term notes |
(1,694,898 | ) | — | — | ||||||||
| Dividends paid |
(32,011 | ) | (30,453 | ) | (30,957 | ) | ||||||
| Proceeds from exercise of stock options |
2,213 | 8,612 | 2,404 | |||||||||
| Repurchase/retirement of common stock |
— | (260 | ) | (60,448 | ) | |||||||
| Proceeds from stock offering |
167,372 | — | — | |||||||||
| Excess tax benefit from stock option exercises |
480 | 4,512 | 345 | |||||||||
| Net cash provided by (used in) financing activities |
(266,898 | ) | 1,033,887 | 43,735 | ||||||||
| Increase (decrease) in cash and due from banks |
4,939 | 17,160 | (7,499 | ) | ||||||||
| Cash and due from banks at beginning of year |
199,775 | 182,615 | 190,114 | |||||||||
| Cash and due from banks at end of year |
$ | 204,714 | $ | 199,775 | $ | 182,615 | ||||||
| Supplemental Information |
||||||||||||
| Income taxes paid |
$ | 5,810 | $ | 19,413 | $ | 29,209 | ||||||
| Interest paid, including capitalized interest of $20, $77, and $995, respectively |
96,797 | 128,787 | 139,353 | |||||||||
| Restricted stock issued to employees of Hancock |
2,688 | 3,045 | 2,495 | |||||||||
| Supplemental Information for Non-Cash |
||||||||||||
| Investing and Financing Activities |
||||||||||||
| Transfers from loans to other real estate |
$ | 20,023 | $ | 10,671 | $ | 2,694 | ||||||
| Financed sales of foreclosed property |
2,649 | 1,234 | 339 | |||||||||
| Transfers from trading securities to available for sale securities |
— | 190,802 | — | |||||||||
See accompanying notes to consolidated financial statements.
63
Table of Contents
HANCOCK HOLDING COMPANY AND SUBSIDIARIES
NOTES TO CONSOLIDATED FINANCIAL STATEMENTS
Note 1. Summary of Significant Accounting Policies and Recent Accounting Pronouncements
Description of Business
Hancock Holding Company “the Company” or “Hancock” is a financial holding company headquartered in Gulfport, Mississippi operating in the states of Mississippi, Louisiana, Alabama and Florida. Hancock Holding Company, the Parent Company operates through four wholly-owned bank subsidiaries, Hancock Bank, Gulfport, Mississippi, Hancock Bank of Louisiana, Baton Rouge, Louisiana, Hancock Bank of Florida, Tallahassee, Florida and Hancock Bank of Alabama, Mobile, Alabama (“the Banks.”) Effective January 1, 2010, Hancock Bank of Florida will be merged into Hancock Bank. The Banks are community oriented and focus primarily on offering commercial, consumer and mortgage loans and deposit services to individuals and small to middle market businesses in their respective market areas. The Company’s operating strategy is to provide its customers with the financial sophistication and breadth of products of a regional bank, while successfully retaining the local appeal and level of service of a community bank. Hancock Bank subsidiaries include Hancock Investment Services, Hancock Insurance Agency, and Harrison Finance Company.
Consolidation
The consolidated financial statements include the accounts of the Company and all other entities in which the Company has a controlling interest. Significant inter-company transactions and balances have been eliminated in consolidation.
Use of Estimates
The consolidated financial statements have been prepared in conformity with U.S. generally accepted accounting principles. The accounting principles we follow and the methods for applying these principles conform with accounting principles generally accepted in the United States of America and with general practices followed by the banking industry which requires management to make estimates and assumptions about future events. On an ongoing basis, the Company evaluates its estimates, including those related to the allowance for loan losses, intangible assets and goodwill, income taxes, pension and postretirement benefit plans and contingent liabilities. These estimates and assumptions are based on our best estimates and judgments. We evaluate estimates and assumptions on an ongoing basis using historical experience and other factors, including the current economic environment. We adjust such estimates and assumptions when facts and circumstances dictate. Illiquid credit markets, volatile equity markets, rising unemployment levels and declines in consumer spending have combined to increase the uncertainty inherent in such estimates and assumptions. The Company bases its estimates on historical experience and on various other assumptions that are believed to be reasonable under the circumstances, the results of which form the basis for making judgments about the carrying values of assets and liabilities not readily apparent from other sources. Allowance for loan losses, deferred income taxes, and goodwill are potentially subject to material changes in the near term. Actual results could differ significantly from those estimates.
Reclassifications
Certain reclassifications have been made to prior periods to conform to the current year presentation. These reclassifications had no material impact on the consolidated financial statements.
64
Table of Contents
HANCOCK HOLDING COMPANY AND SUBSIDIARIES
NOTES TO CONSOLIDATED FINANCIAL STATEMENTS—(Continued)
Note 1. Summary of Significant Accounting Policies and Recent Accounting Pronouncements (continued)
Fair Value Accounting
Generally accepted accounting principles require the use of fair values in determining the carrying values of certain assets and liabilities, as well as for specific disclosures. The most significant include securities, loans held for sale, mortgage servicing rights and net assets acquired in business combinations. Certain of these assets do not have a readily available market to determine fair value and require an estimate based on specific parameters. When market prices are unavailable, we determine fair values utilizing parameters, which are constantly changing, including interest rates, duration, prepayment speeds and other specific conditions. In most cases, these specific parameters require a significant amount of judgment by management.
The Company adopted the Financial Accounting Standards Board’s (FASB) authoritative guidance regarding fair value measurements on January 1, 2008. The guidance establishes a framework for measuring fair value under generally accepted accounting principles (GAAP), clarifies the definition of fair value within that framework, and expands disclosures about the use of fair value measurements. The guidance defines a fair value hierarchy that prioritizes the inputs to these valuation techniques used to measure fair value giving preference to quoted prices in active markets (level 1) and the lowest priority to unobservable inputs such as a reporting entity’s own data (level 3). Level 2 inputs include quoted prices for similar assets or liabilities in active markets, quoted prices for identical assets or liabilities in markets that are not active, observable inputs other than quoted prices, such as interest rates and yield curves, and inputs that are derived principally from or corroborated by observable market data by correlation or other means. Available for sale securities classified as Level 1 within the valuation hierarchy include U.S. Treasury securities, obligations of U.S. Government-sponsored agencies, and other debt and equity securities. Level 2 classified available for sale securities include mortgage-backed debt securities, collateralized mortgage obligations, and state and municipal bonds. Financial assets and liabilities whose values are based on prices or valuation techniques that require inputs that are both unobservable and are significant to the overall fair value measurement are classified as level 3 under the fair value hierarchy. The Company currently has no level 3 assets or liabilities.
In October 2008, the FASB issued guidance for determining the fair value of a financial asset in a market that is not active, which clarified previous guidance. Application issues clarified include: how management’s internal assumptions should be considered when measuring fair value when relevant observable data do not exist; how observable market information in a market that is not active should be considered when measuring fair value; and how the use of market quotes should be considered when assessing the relevance of observable and unobservable data available to measure fair value. The guidance was effective immediately and did not have a material impact on the Company’s financial condition or results of operations. The Company adopted authoritative guidance regarding the fair value option for financial assets and financial liabilities, on January 1, 2008. The Company did not elect to fair value any additional items under the guidance.
Acquisition Accounting
Acquisitions are accounted for under the purchase method of accounting. Purchased assets and assumed liabilities are recorded at their respective acquisition date fair values, and identifiable intangible assets are recorded at fair value. If the fair value of assets purchased exceeded the fair value of liabilities assumed, it results in a “bargain purchase gain.” If the consideration given exceeds the fair value of the net assets received, goodwill is recognized. Fair values are subject to refinement for up to one year after the closing date of an acquisition as information relative to closing date fair values becomes available.
65
Table of Contents
HANCOCK HOLDING COMPANY AND SUBSIDIARIES
NOTES TO CONSOLIDATED FINANCIAL STATEMENTS—(Continued)
Note 1. Summary of Significant Accounting Policies and Recent Accounting Pronouncements (continued)
Purchased loans acquired in a business combination are recorded at estimated fair value on their purchase date and prohibit the carryover of the related allowance for loan losses. When the loans have evidence of credit deterioration since origination and it is probable at the date of acquisition that the Company will not collect all contractually required principal and interest payments, the difference between contractually required payments at acquisition and the cash flows expected to be collected at acquisition is referred to as the non-accretable difference. The Company must estimate expected cash flows at each reporting date. Subsequent decreases to the expected cash flows will generally result in a provision for loan losses. Subsequent increases in cash flows result in a reversal of the provision for loan losses to the extent of prior charges and adjusted accretable yield which will have a positive impact on interest income. In addition, purchased loans without evidence of credit deterioration are also handled under this method.
All identifiable intangible assets that are acquired in a business combination are recognized at fair value on the acquisition date. Identifiable intangible assets are recognized separately if they arise from contractual or other legal rights or if they are separable (i.e., capable of being sold, transferred, licensed, rented, or exchanged separately from the entity). Deposit liabilities and the related depositor relationship intangible assets may be exchanged in observable exchange transactions. As a result, the depositor relationship intangible asset is considered identifiable, because the separability criterion has been met since the depositor relationship intangible asset can be sold in conjunction with the deposit liability. Accordingly, the Company recorded a core deposit intangible asset associated with the Peoples First acquisition of $11.6 million.
Indemnification assets are recognized when the seller contractually indemnifies, in whole or in part, the buyer for a particular uncertainty. The recognition and measurement of an indemnification asset is based on the related indemnified item. That is, the acquirer should recognize an indemnification asset at the same time that it recognizes the indemnified item, measured on the same basis as the indemnified item, subject to collectibility or contractual limitations on the indemnified amount. Therefore, if the indemnification relates to an asset or a liability that is recognized at the acquisition date and measured at its acquisition-date fair value, the acquirer should recognize the indemnification asset at its acquisition-date fair value on the acquisition date. If an indemnification asset is measured at fair value, a separate valuation allowance is not necessary, because its fair value measurement will reflect any uncertainties in future cash flows. The loans purchased in the Peoples First Community Bank FDIC-assisted acquisition are covered by a loss share agreement between the FDIC and the Company, which affords the Company significant loss protection. The Company recorded an estimated receivable from the FDIC of $325.6 million which represents the fair value of the FDIC’s portion of the losses that are expected to be incurred and reimbursed to the Company.
Securities
Securities have been classified into one of two categories: available for sale or trading. Management determines the appropriate classification of debt securities at the time of purchase and re-evaluates this classification periodically.
Available for sale securities are stated at fair value with unrealized gains and losses, net of income taxes, reported as a separate component of stockholders’ equity until realized. Trading securities are stated at fair value with unrealized gains and losses reported in results of operations.
The amortized cost of debt securities classified as available for sale is adjusted for amortization of premiums and accretion of discounts to maturity or, in the case of mortgage-backed securities, over the estimated life of the security using the constant-yield method. The prepayment speed chosen to determine the estimated life of a mortgage-backed security is the security’s historical 3-month prepayment speed. When prepayment speeds are faster than expected, the average life of the mortgage-backed security is shorter than the original estimate. Amortization, accretion and accrued interest are included in interest income on securities.
66
Table of Contents
HANCOCK HOLDING COMPANY AND SUBSIDIARIES
NOTES TO CONSOLIDATED FINANCIAL STATEMENTS—(Continued)
Note 1. Summary of Significant Accounting Policies and Recent Accounting Pronouncements (continued)
Realized gains and losses, and declines in value judged to be other than temporary, are included in net securities gains and losses. Gains and losses on the sales of securities available for sale are determined using the specific-identification method. Using this basis results in the most accurate reporting of gains and losses realized on these sales, as well as the appropriate adjustment to accumulated other comprehensive income. A decline in the fair value of securities below cost that is deemed to be other than temporary results in a charge to earnings and the establishment of a new cost basis for the security. Gains and losses on the sales of trading securities are also determined using the specific-identification method with the gain or loss reported in the results of operations.
Short-term Investments
Short-term investments represent U.S. government agency discount notes that all mature in less than 1 year. The investments are classified as available for sale and are carried at fair value. Unrealized holding gains are excluded from net income and are recognized, net of tax, in other comprehensive income and in accumulated other comprehensive income, a separate component of stockholders’ equity, until realized.
Loans
Loans are reported at the principal balance outstanding. Non-refundable loan origination fees and certain direct origination costs are recognized as an adjustment to the yield on the related loan. Interest on loans is recorded to income as earned.
The accrual of interest on loans is discontinued when, in management’s opinion, the borrower may be unable to meet payment obligations as they become due, as well as when required by regulatory provisions. When accrual of interest is discontinued, all unpaid accrued interest is reversed and payments subsequently received are applied first to principal. Interest income is recorded after principal has been satisfied and as payments are received. Loans are returned to accrual status when all the principal and interest contractually due are brought current and future amounts are reasonably assured.
Generally, loans of all types which become 90 days delinquent are reviewed relative to collectability. Unless such loans are in the process of terms revision to bring to a current status, collection through repossession or foreclosure, those loans deemed uncollectible are charged off against the allowance account.
Loans held for sale are stated at lower of cost or market on the consolidated balance sheets. These loans are originated on a best-efforts basis, whereby a commitment by a third party to purchase the loan has been received concurrent with the Banks’ commitment to the borrower to originate the loan.
Purchased loans acquired in a business combination are recorded at estimated fair value on their purchase date. See Acquisition Accounting section above for accounting policy regarding loans acquired in a business combination.
67
Table of Contents
HANCOCK HOLDING COMPANY AND SUBSIDIARIES
NOTES TO CONSOLIDATED FINANCIAL STATEMENTS—(Continued)
Note 1. Summary of Significant Accounting Policies and Recent Accounting Pronouncements (continued)
Allowance for Loan Losses
The allowance for loan and lease losses “ALLL” is a valuation account available to absorb losses on loans. The ALLL is established and maintained at an amount sufficient to cover the estimated credit loss associated with the loan and lease portfolios of the Company as of the date of the determination. Credit losses arise not only from credit risk, but also from other risks inherent in the lending process including, but not limited to, collateral risk, operational risk, concentration risk, and economic risk. As such, all related risks of lending are considered when assessing the adequacy of the allowance for loan and lease losses. Quarterly, management estimates the probable level of losses to determine whether the allowance is adequate to absorb reasonably anticipated losses in the existing portfolio based on the Company’s past loan loss and delinquency experience, known and inherent risks in the portfolio, adverse situations that may affect the borrowers’ ability to repay, and the estimated value of any underlying collateral and current economic conditions. The analysis and methodology include three primary segments. These segments include a pool analysis of various retail loans based upon loss history, a pool analysis of commercial and commercial real estate loans based upon loss history by loan type, and a specific reserve analysis for those loans considered impaired under FASB’s authoritative guidance for accounting by creditors for impairment of a loan. All commercial and commercial real estate loans with an outstanding balance of $100,000 or greater are individually reviewed for impairment; substandard mortgage loans with balances of $100,000 or greater are also included in the analysis. All losses are charged to the allowance for loan and lease losses when the loss actually occurs or when a determination is made that a loss is likely to occur; recoveries are credited to the allowance for loan losses at the time of receipt.
The Company considers a loan to be impaired when, based upon current information and events, it believes it is probable that the Company will be unable to collect all amounts due according to the contractual terms of the loan agreement. The Company’s impaired loans include troubled debt restructurings, and performing and non-performing major loans for which full payment of principal or interest is not expected. Categories of non-major homogeneous loans, which are evaluated on an overall basis, generally include all loans under $500,000. The Company determines an allowance required for impaired loans based on the present value of expected future cash flows discounted at the loan’s effective interest rate, the loan’s observable market price or the fair value of its collateral. If the recorded investment in the impaired loan exceeds the measure of fair value, a valuation allowance is required as a component of the allowance for loan losses.
Purchased loans acquired in a business combination are recorded at estimated fair value on their purchase date and prohibit the carryover of the related allowance for loan losses. See Acquisition Accounting section above for accounting policy regarding loans acquired in a business combination.
Property and Equipment
Property and equipment are recorded at cost, less accumulated depreciation and amortization. Depreciation is charged to expense over the estimated useful lives of the assets, which are up to 39 years for buildings and three to seven years for furniture and equipment. Amortization expense for software is charged over 3 years. Leasehold improvements are amortized over the terms of the respective leases or the estimated useful lives of the improvements, whichever is shorter. In cases where the Company has the right to renew the lease for additional periods, the lease term for the purpose of calculating amortization of the capitalized cost of the leasehold improvements is extended when the Company is “reasonably assured” that it will renew the lease. Depreciation and amortization expenses are computed using a straight-line basis for assets acquired after January 1, 2006 and the double declining balance basis for assets acquired prior to January 1, 2006. Gains and losses related to retirement or disposition of fixed assets are recorded in other income under non-interest income on the consolidated statements of income. The Company continually evaluates whether events and circumstances have occurred that indicate that such long-lived assets have been impaired. Measurement of any impairment of such long-lived assets is based on those assets’ fair values. There were no impairment losses on property and equipment recorded during 2009, 2008, or 2007.
68
Table of Contents
HANCOCK HOLDING COMPANY AND SUBSIDIARIES
NOTES TO CONSOLIDATED FINANCIAL STATEMENTS—(Continued)
Note 1. Summary of Significant Accounting Policies and Recent Accounting Pronouncements (continued)
Other Real Estate
Other real estate owned includes assets that have been acquired in satisfaction of debt through foreclosure. Other real estate owned is reported in other assets and is recorded at the lower of cost or estimated fair value less the estimated cost of disposition. Valuation adjustments required at foreclosure are charged to the allowance for loan losses. Subsequent to foreclosure, losses on the periodic revaluation of the property are charged to net income as other expense. Costs of operating and maintaining the properties are included in other noninterest expenses, while gains (losses) on their disposition are charged to other income as incurred. Improvements made to properties are capitalized if the expenditures are expected to be recovered upon the sale of the properties.
Goodwill and Other Intangible Assets
Goodwill, which represents the excess of cost over the fair value of the net assets of an acquired business, is not amortized but tested for impairment on an annual basis, or more often if events or circumstances indicate there may be impairment. Management reviews goodwill for impairment based on the Company’s four primary reporting segments. The last test was conducted as of September 30, 2009. There was no impairment and there have been no trigger events that would cause an impairment since September 30, 2009.
The Company analyzes goodwill using market capitalization to book value comparison. The Company considered using a present value technique to estimate fair value. The cash flow estimates would incorporate assumptions that market participants would use in their estimates of fair value. The assumptions would need to be reasonable and based on supportable data considering all available evidence with weight commensurate with the extent to which the evidence can be verified objectively. The Company considers this alternative method to have subjective assumptions and considers market capitalization to be more objective as the Company’s reporting segments are in the same business, operate with the same policies and procedures, and are under the same executive management team.
Identifiable intangible assets are acquired assets that lack physical substance but can be distinguished from goodwill because of contractual or legal rights or because the assets are capable of being sold or exchanged either on their own on in combination with a related contract, asset, or liability. The Company’s identifiable intangible assets primarily relate to core deposits, insurance customer relationships, non-compete agreements and trade name. These intangibles, which have definite useful lives, are amortized based on the sum-of-the-years-digits method over their estimated useful lives for assets acquired prior to January 1, 2006 and on a straight-line basis for assets acquired subsequent to January 1, 2006. In addition, these intangibles are evaluated annually for impairment or whenever events and changes in circumstances indicate that the carrying amount should be reevaluated. The intangible assets are monitored annually and have had a consistent revenue stream. Also, if the annual goodwill test revealed an impairment, the Company would also evaluate the intangible assets for impairment.
Mortgage Servicing Rights
The authoritative guidance for accounting for servicing of financial assets requires all separately recognized servicing assets and servicing liabilities to be initially measured at fair value, if practicable, and permits an entity to subsequently measure those servicing assets and servicing liabilities at fair value. Under the guidance, the Company decided to continue to use the amortization method instead of adopting the fair value method. Management has determined that it has one class of servicing rights which is based on the type of loan. The risk characteristics of the underlying financial assets used to stratify servicing assets for purposes of measuring impairment are interest rate, type of product (fixed versus variable), duration, and asset quality. The book value of mortgage servicing rights at December 31, 2009 and December 31, 2008 was $0.3 million. The market value of mortgage servicing rights at December 31, 2009 and December 31, 2008 was $1.4 million and $1.0 million, respectively.
69
Table of Contents
HANCOCK HOLDING COMPANY AND SUBSIDIARIES
NOTES TO CONSOLIDATED FINANCIAL STATEMENTS—(Continued)
Note 1. Summary of Significant Accounting Policies and Recent Accounting Pronouncements (continued)
Reinsurance Receivables
Certain premiums and losses are assumed from and ceded to other insurance companies under various reinsurance agreements. Reinsurance premiums, loss reimbursement, and reserves related to reinsurance business are accounted for on a basis consistent with that used in accounting for the original policies issued and the terms of the reinsurance contract. The Company may receive a ceding commission in connection with ceded reinsurance. If so, the ceding commission is earned on a monthly pro rata basis in the same manner as the premium and is recorded as a reduction of other operating expenses.
Derivative Instruments
The Company has certain Interest Rate Lock Commitments “IRLC’s” that are reported on the consolidated balance sheets at fair value with changes in fair value reported in statements of income. The Company also has interest rate swaps which are recognized on the consolidated balance sheets as other assets at fair value as required by authoritative guidance. These interest rate swaps do not qualify for hedge accounting under the guidelines of FASB’s guidance for accounting for derivative instruments and hedging. Gains and losses related to the change in fair value are recognized in earnings during the period of change in fair value as other non-interest income.
Income Taxes
The Company accounts for deferred income taxes using the liability method. Deferred tax assets and liabilities are based on temporary differences between the financial statement carrying amounts and the tax basis of the Company’s assets and liabilities. Deferred tax assets and liabilities are measured using the enacted tax rates expected to apply to taxable income in the years in which those temporary differences are expected to be realized or settled.
Pension Accounting
The Company has accounted for its defined benefit pension plan using the actuarial model required by authoritative guidance for employers’ accounting for pensions. The compensation cost of an employee’s pension benefit is recognized on the projected unit credit method over the employee’s approximate service period. The aggregate cost method is utilized for funding purposes. The Company also sponsors two defined benefit postretirement plans, which provide medical benefits and life insurance benefits. The Company has accounted for these plans using the actuarial computations required by guidance regarding employers accounting for postretirement benefits other than pensions. The cost of the defined benefit postretirement plan has been recognized on the projected unit credit method over the employee’s approximate service period. Effective December 31, 2006, the Company adopted authoritative guidance for employers’ accounting for defined benefit pension and other postretirement plans which required the recognition of the over funded or under funded status of a defined benefit postretirement plan as an asset or liability on the balance sheet. In 2008, the Company changed the measurement date of the funded status of the plan from September 30 to December 31.
Policy Reserves and Liabilities
Unearned premium reserves are based on the assumption that the portion of the original premium applicable to the remaining term and amount of insurance will be adequate to pay future benefits. The reserve is calculated by multiplying the original gross premium times an unearned premium factor. Factors are developed which represent the proportion of the remaining coverage compared to the total coverage provided over the entire term of insurance.
70
Table of Contents
HANCOCK HOLDING COMPANY AND SUBSIDIARIES
NOTES TO CONSOLIDATED FINANCIAL STATEMENTS—(Continued)
Note 1. Summary of Significant Accounting Policies and Recent Accounting Pronouncements (continued)
Policy reserves for future life and health claims not yet incurred are based on assumed mortality and interest rates. For disability, the reserves are based upon unearned premium, which is the portion of the original premium applicable to the remaining term and amount of insurance that will be adequate to pay future benefits. Present value of amounts not yet due is an amount for disability claims already reported and incurred and represents the present value of all the future benefits using actuarial disability tables. IBNR “Incurred But Not Reported” is an estimate of claims incurred but not yet reported, and is based upon historical analysis of claims payments.
Stock-Based Compensation
In recognizing stock-based compensation, the Company follows the provisions of authoritative guidance regarding share-based payments. This guidance establishes fair value as the measurement objective in accounting for stock awards and requires the application of a fair value based measurement method in accounting for compensation cost, which is recognized over the requisite service period.
Revenue Recognition
The largest source of revenue for the Company is interest revenue. Interest revenue is recognized on an accrual basis driven by written contracts, such as loan agreements or securities contracts. Credit-related fees, including letter of credit fees, are recognized in non-interest income when earned. The Company recognizes commission revenue and brokerage, exchange and clearance fees on a trade-date basis. Other types of non-interest revenue such as service charges on deposits and trust revenues, are accrued and recognized into income as services are provided and the amount of fees earned are reasonably determinable.
Earnings Per Share
Basic earnings per common share is computed by dividing income applicable to common shareholders by the weighted-average number of common shares outstanding for the applicable period. Shares outstanding are adjusted for restricted shares issued to employees under the long-term incentive compensation plan and for certain shares that will be issued under the directors’ compensation plan. Diluted earnings per common share is computed using the weighted-average number of common shares outstanding increased by the number of shares in which employees would vest under performance-based restricted stock and stock unit awards based on expected performance factors and by the number of additional shares that would have been issued if potentially dilutive stock options were exercised, each as determined using the treasury stock method.
The Company adopted the FASB’s authoritative guidance regarding the determination of whether instruments granted in share-based payment transactions are participating securities. This guidance provides that unvested share-based payment awards that contain nonforfeitable rights to dividends or dividend equivalents (whether paid or unpaid) are participating securities and should be included in the computation of earnings per share pursuant to the two-class method. This guidance was effective January 1, 2009, and upon adoption the company was required to retrospectively adjust its earnings per share data including any amounts related to interim periods, summaries of earnings and selected financial data.
Statements of Cash Flows
The Company considers only cash on hand, cash items in process of collection and balances due from financial institutions as cash and cash equivalents for purposes of the consolidated statements of cash flows.
71
Table of Contents
HANCOCK HOLDING COMPANY AND SUBSIDIARIES
NOTES TO CONSOLIDATED FINANCIAL STATEMENTS—(Continued)
Note 1. Summary of Significant Accounting Policies and Recent Accounting Pronouncements (continued)
Operating Segment Disclosures
As defined by authoritative guidance, segment disclosures require reporting information about a company’s operating segments using a “management approach.” Reportable segments are identified as those revenue-producing components for which separate financial information is produced internally and which are subject to evaluation by the chief operating decision maker in deciding how to allocate resources to segments. The Company defines reportable segments as the banks.
Other
Assets held by the banks in a fiduciary capacity are not assets of the banks and are not included in the consolidated balance sheets.
Recent Accounting Pronouncements
In January 2010, the Financial Accounting Standards Board (FASB) issued guidance on fair value measurements and disclosures that requires some new disclosures and clarifies some existing disclosure requirements about fair value measurement. The FASB’s objective is to improve these disclosures and, thus, increase the transparency in financial reporting. Specifically, the guidance now requires a reporting entity to disclose separately the amounts of significant transfers in and out of level 1 and level 2 fair value measurements and describe the reasons for the transfers and in the reconciliation for fair value measurements using significant unobservable inputs, a reporting entity should present separately information about purchases, sales, issuances, and settlements. In addition, the guidance clarifies the requirements of reporting fair value measurement for each class of assets and liabilities and clarifies that a reporting entity needs to use judgment in determining the appropriate classes of assets and liabilities based on the nature and risks of the investments. A reporting entity should provide disclosures about the valuation techniques and inputs used to measure fair value for both recurring and nonrecurring fair value measurements. The guidance is effective for interim and annual reporting periods beginning after December 15, 2009, except for the disclosures about purchases, sales, issuances, and settlements in the roll forward of activity in level 3 fair value measurements which is required for annual reporting periods beginning after December 15, 2010, and for interim reporting periods within those years. The adoption of the guidance is not expected to have a material impact on the Company’s financial condition or results of operations.
In September 2009, the Financial Accounting Standards Board (FASB) issued guidance that permits companies to determine the fair value of a liability using the perspective of an investor that holds the related obligation as an asset. In the absence of a quoted market price in an active market for an identical liability, which generally would not be available because liabilities are not exchange-traded as liabilities, companies may apply approaches that use the quoted price of an investment in the identical liability or similar liabilities traded as assets or other valuation techniques consistent with the fair value measurement principles. The new guidance is effective for interim and annual periods beginning after August 26, 2009, and applies to all fair value measurements of liabilities required by generally accepted accounting principles. The adoption of the guidance is not expected to have a material impact on the Company’s financial condition or results of operations.
In June 2009, the FASB issued authoritative guidance for the FASB accounting standards codification (Codification) and the hierarchy of generally accepted accounting principles (U.S. GAAP). The guidance establishes the Codification to become the source of authoritative U.S. GAAP recognized by the FASB to be applied by nongovernmental entities. Rules and interpretive releases of the Securities and Exchange Commission (SEC) under authority of federal securities laws are also sources of authoritative U.S. GAAP for SEC registrants. The guidance and the Codification are effective for financial statements issued for interim and annual periods ending after September 15, 2009. The Company adopted the provisions of the guidance, as required, and determined that the impact to the Company’s financial condition or results of operations was immaterial.
72
Table of Contents
HANCOCK HOLDING COMPANY AND SUBSIDIARIES
NOTES TO CONSOLIDATED FINANCIAL STATEMENTS—(Continued)
Note 1. Summary of Significant Accounting Policies and Recent Accounting Pronouncements (continued)
In May 2009, the FASB issued authoritative guidance establishing general standards of accounting for and disclosure of events that occur after the balance sheet date but before financial statements are issued or are available to be issued. The guidance provides the period after the balance sheet date during which management of a reporting entity should evaluate events or transactions that may occur for potential recognition or disclosure in the financial statements; the circumstances under which an entity should recognize events or transactions occurring after the balance sheet date in its financial statements; and the disclosures that an entity should make about events or transactions that occurred after the balance sheet date. The guidance is effective for interim or annual financial periods ending after June 15, 2009, and shall be applied prospectively. The impact on the Company’s financial condition or results of operations is dependent on the extent of any future subsequent events. The Company performed a review through February 17, 2010, and determined that there were no transactions qualifying as a subsequent event.
In April 2009, the FASB issued guidance determining fair value when the volume and level of activity for the asset or liability have significantly decreased and identifying transactions that are not orderly. This guidance affirms that the objective of fair value when the market for an asset is not active is the price that would be received to sell the asset in an orderly transaction; includes additional factors for determining whether there has been a significant decrease in market activity for an asset when the market is inactive; eliminates the presumption that all transactions are distressed unless proven otherwise requiring an entity to base its conclusion on the weight of evidence; and requires an entity to disclose a change in valuation technique resulting from application of the guidance and to quantify its effects, if practicable. The guidance is effective for interim and annual periods ending after June 15, 2009 with early adoption permitted for periods ending after March 15, 2009. The adoption of the guidance in the second quarter did not have a material impact on the Company’s financial condition or results of operations.
In April 2009, the FASB issued authoritative guidance regarding recognition and presentation of other-than-temporary impairments that changes existing guidance for determining whether an impairment is other than temporary to debt securities; replaces the existing requirement that the entity’s management assert it has both the intent and ability to hold an impaired security until recovery with a requirement that management assert: (a) it does not have the intent to sell the security and (b) it is more likely than not it will not have to sell the security before recovery of its cost basis; requires that an entity recognize noncredit losses on available for sale debt securities in other comprehensive income and amortize the amount over the remaining life of the security in a prospective manner by offsetting the recorded value of the asset unless the security is subsequently sold or there are credit losses; requires an entity to present the total other-than-temporary impairment in the statement of earnings with an offset for the amount recognized in other comprehensive income; and at adoption, requires an entity to record a cumulative-effect adjustment as of the beginning of the period of adoption to reclassify the noncredit component of a previously recognized other-than-temporary impairment from retained earnings to accumulated other comprehensive income if the entity does not intend to sell the security and it is more likely than not that the entity will be required to sell the security before recovery. The authoritative guidance is effective for interim and annual periods ending after June 15, 2009 with early adoption permitted for periods ending after March 15, 2009. The adoption of the guidance in the second quarter did not have a material impact on the Company’s financial condition or results of operations.
In April 2009, the FASB issued guidance for interim disclosures about fair value of financial instruments. Under this guidance, a publicly traded company shall include disclosures about the fair value of its financial instruments whenever it issues summarized financial information for interim reporting periods. In addition, an entity shall disclose in the body or in the accompanying notes of its summarized financial information for interim reporting periods and in its financial statements for annual reporting periods the fair value of all financial instruments for which it is practicable to estimate that value, whether recognized or not recognized in the statement of financial position. The guidance is effective for interim periods ending after June 15, 2009 with early adoption permitted for periods ending after March 15, 2009. The adoption of the guidance in the second quarter did not have a material impact on the Company’s financial condition or results of operations.
73
Table of Contents
HANCOCK HOLDING COMPANY AND SUBSIDIARIES
NOTES TO CONSOLIDATED FINANCIAL STATEMENTS—(Continued)
Note 1. Summary of Significant Accounting Policies and Recent Accounting Pronouncements (continued)
In February 2009, the FASB issued authoritative guidance regarding accounting for assets acquired and liabilities assumed in a business combination that arise from contingencies, that amends provisions related to the initial recognition and measurement, subsequent measurement and disclosure of assets and liabilities arising from contingencies in a business combination. The guidance is effective for all business combinations for which the acquisition date is on or after the beginning of the first annual reporting period beginning on or after December 15, 2008. The impact on the Company’s financial condition or results of operations is dependent on the extent of future business combinations.
In December 2008, the FASB issued authoritative guidance for employer’s disclosures about plan assets of a defined benefit pension or other postretirement plan. The objectives of the disclosures are to provide users of financial statements with an understanding of how investment allocation decisions are made; the major categories of plan assets; the inputs and valuation techniques used to measure fair value of plan assets; the effect of fair value measurements using significant unobservable inputs (Level 3) on changes in plan assets for the period; and significant concentrations on risk within plan assets. The guidance is effective for fiscal years ending after December 15, 2009. The adoption of the guidance did not have a material impact on the Company’s financial condition or results of operations.
In June 2008, the FASB issued authoritative guidance, which provides that unvested share-based payment awards that contain non-forfeitable rights to dividends or dividend equivalents (whether paid or unpaid) are participating securities and should be included in the computation of earnings per share pursuant to the two-class method. The guidance was effective for financial statements issued for fiscal years beginning after December 15, 2008 and interim periods within those years. Upon adoption, a company was required to retrospectively adjust its earnings per share data including any amounts related to interim periods, summaries of earnings and selected financial data. The adoption of the guidance did not have a material impact on the Company’s financial condition or results of operations.
In April 2008, the FASB issued authoritative guidance for determination of the useful life of intangible asset, which amends the factors that should be considered in developing renewal or extension assumptions used to determine the useful life of a recognized intangible asset under previous guidance regarding goodwill and other intangible assets. The intent of the FSP is to improve the consistency between the useful life of a recognized intangible asset under the guidance and the period of expected cash flows used to measure the fair value of the asset under the guidance and other U.S. generally accepted accounting principles. This FSP was effective for financial statements issued for fiscal years beginning after December 15, 2008. The adoption of the guidance did not have a material impact on the Company’s financial condition or results of operations.
Note 2. Acquisition of Peoples First Community Bank
On December 18, 2009, the Company entered into a purchase and assumption agreement with the Federal Deposit Insurance Corporation (FDIC), as receiver for Peoples First Community Bank (Peoples First) based in Panama City, Florida. Earlier that day, the Office of Thrift Supervision issued an order requiring the closure of Peoples First Community Bank and appointing the FDIC as receiver. According to terms of the agreement, the Company acquired substantially all of the assets of Peoples First and all deposits and borrowings. All deposits were assumed with no losses to any depositor. There was no consideration paid for the acquisition. Peoples First operated 29 branches in Florida with assets totaling approximately $1.7 billion and approximately 437 employees.
The loans purchased are covered by a loss share agreement between the FDIC and the Company, which affords the Company significant loss protection. Under the loss share agreement, the FDIC will cover 80% of covered loan losses up to $385 million and 95% of losses in excess of that amount. The term for loss sharing on residential real estate loans is ten years. The term for loss sharing on non-residential real estate loans is five years for other loans. The reimbursable losses from the FDIC are based on the book value of the relevant loan as determined by the FDIC at the date of the transaction.
74
Table of Contents
HANCOCK HOLDING COMPANY AND SUBSIDIARIES
NOTES TO CONSOLIDATED FINANCIAL STATEMENTS—(Continued)
Note 2. Acquisition of Peoples First Community Bank (continued)
New loans made after that date are not covered by the shared-loss agreements. The loss sharing agreements are subject to our compliance with servicing procedures specified in the agreements with the FDIC. The Company recorded an estimated receivable from the FDIC of $325.6 million which represents the fair value of the FDIC’s portion of the losses that are expected to be incurred and reimbursed to the Company.
The acquisition was accounted for under the purchase method of accounting in accordance with generally accepted accounting principles regarding acquisitions. The statement of net assets acquired as of December 18, 2009 and the resulting gain are presented in the following table. The purchased assets and assumed liabilities were recorded at their respective acquisition date fair values. Fair values are preliminary and subject to refinement for up to one year after the closing date of the acquisition as information relative to closing date fair values becomes available. A net acquisition bargain purchase gain of $20.7 million resulted from the acquisition and is included as a component of noninterest income on the statement of income. The amount of the gain is equal to the amount by which the fair value of assets purchased exceeded the fair value of liabilities assumed.
The following table provides the assets purchased and the liabilities assumed and the adjustments to fair value:
| ACQUISITION GAIN CALCULATION | ||||||||||
| As Recorded by Peoples First Community Bank |
Fair Value Adjustments |
As Recorded by Hancock | ||||||||
| (In thousands) | ||||||||||
| Assets |
||||||||||
| Cash |
$ | 98,068 | $ | 302,208 | (a) | $ | 400,276 | |||
| Securities |
16,149 | — | 16,149 | |||||||
| Loans |
1,461,541 | (511,111 | ) (b) | 950,430 | ||||||
| Land, building, and FF&E |
8 | — | 8 | |||||||
| Core deposit intangible |
— | 11,610 | (c) | 11,610 | ||||||
| FIDC loss share receivable |
— | 325,606 | (d) | 325,606 | ||||||
| Other assets |
13,000 | (1,813 | ) (e) | 11,187 | ||||||
| Total assets acquired |
$ | 1,588,766 | $ | 126,500 | $ | 1,715,266 | ||||
| Liabilities |
||||||||||
| Deposits |
$ | 1,552,454 | $ | 10,483 | (f) | $ | 1,562,937 | |||
| FHLB advances |
115,500 | $ | 804 | (g) | $ | 116,304 | ||||
| Other liabilities |
2,402 | $ | 12,891 | (g) | $ | 15,293 | ||||
| Total liabilities acquired |
$ | 1,670,356 | $ | 24,178 | $ | 1,694,534 | ||||
| Net assets acquired “bargain purchase” gain |
$ | 20,732 | ||||||||
Explanation of Fair Value Adjustments
| (a) | Adjustment is for cash received from the FDIC for first losses. |
| (b) | This estimated adjustment is necessary as of the acquisition date to write down People’s First book value of loans to the estimated fair value as a result of future loan losses. |
| (c) | This fair value adjustment represents the value of the core deposit base assumed in the acquisition based on a study performed by an independent valuation firm. This amount was recorded by the Company as an identifiable asset and will be amortized as an expense using a mix of straight-line and accelerated methods over the average life of the core deposit base, which is estimated to be 10 years. |
| (d) | This adjustment is the estimated fair value of the amount that the Company will receive from the FDIC under its loss sharing agreement as a result of future loan losses. |
| (e) | These are adjustments made to acquired assets to reflect fair value primarily for a write-down of an investment in a subsidiary and accrued interest receivable for loans that should have been placed on non-accrual prior to the acquisition. |
| (f) | This fair value adjustment was recorded because the weighted average interest rate of People’s First time deposits exceeded the cost of similar wholesale funding at the time of the acquisition. This amount will be amortized to reduce interest expense on a declining basis over the average life of the portfolio of approximately 7 months. |
| (g) | The fair value adjustment was recorded because the interest rates of People’s fixed rate borrowings exceeded the current interest rates on similar borrowings. This amount will be amortized to interest expense over terms of the borrowings. |
75
Table of Contents
HANCOCK HOLDING COMPANY AND SUBSIDIARIES
NOTES TO CONSOLIDATED FINANCIAL STATEMENTS—(Continued)
Note 2. Acquisition of Peoples First Community Bank (continued)
The operating results of the Company for the period ended December 31, 2009 include the operating results of the acquired assets and assumed liabilities for the 13 days subsequent to the acquisition date of December 18, 2009. The operations of Peoples First provided $0.2 million in net income for the period from the acquisition and is included in the consolidated financial statements. Peoples First results of operations prior to the acquisition are not included in Hancock’s statement of income. Merger related charges of $3.7 million are recorded in the consolidated statement of income and include incremental costs to integrate the operations of the Company and Peoples First. These charges represent costs associated with severance and employee related charges, systems integrations, and other merger-related charges. Due primarily to the significant amount of fair value adjustments and the FDIC loss sharing agreements now in place, historical results of Peoples First are not believed to be relevant to the Company’s results, and thus no pro forma information is presented.
The carrying amount of the covered loans at December 18, 2009, consisted of loans accounted for in accordance with generally accepted accounting principles governing the accounting for certain loans acquired in a transfer. The covered loans were divided into loans with evidence of credit quality deterioration for which the Company believes, at the date of acquisition, it is probable that the Company will be unable to collect all contractually required payments receivable and loans that do not meet this criteria. In addition, the loans are further categorized into different loan pools per loan types. The Company determined expected cash flows on the covered loans based on the best available information at the date of acquisition. If new information is obtained about facts and circumstances about expected cash flows that existed as of the acquisition date, management will adjust accordingly in accordance with accounting for business combinations.
The covered loans at the acquisition date of December 18, 2009 are presented in the following table.
| Loans with Deterioration of Credit Quality |
Loans without a Deterioration of Credit Quality |
Total Covered Loans | |||||||
| (In thousands) | |||||||||
| Construction |
$ | 138,908 | $ | 134,531 | $ | 273,439 | |||
| Real estate secured |
504,974 | 132,086 | 637,060 | ||||||
| Commercial and Industrial |
3,145 | 10,277 | 13,422 | ||||||
| Consumer |
795 | 25,714 | 26,509 | ||||||
| $ | 647,822 | $ | 302,608 | $ | 950,430 | ||||
76
Table of Contents
HANCOCK HOLDING COMPANY AND SUBSIDIARIES
NOTES TO CONSOLIDATED FINANCIAL STATEMENTS—(Continued)
Note 2. Acquisition of Peoples First Community Bank (continued)
The following table presents the loans receivable at the acquisition date for loans without a deterioration of credit quality. The Company has elected to recognize income on these loans in the same manner as loans with credit quality deterioration.
| Contractually required principal payments receivable |
$ | 413,876 | |
| Nonaccretable difference |
20,252 | ||
| Present value of cash flows expected to be collected |
393,624 | ||
| Accretable difference |
91,016 | ||
| Fair value of loans acquired without a deterioration of credit quality |
$ | 302,608 | |
The following table presents the loans receivable (in thousands) at the acquisition date for loans with a deterioration in credit quality.
| Contractually required principal payments receivable |
$ | 1,506,165 | |
| Nonaccretable difference |
633,577 | ||
| Present value of cash flows expected to be collected |
872,588 | ||
| Accretable difference |
224,766 | ||
| Fair value of loans acquired with a deterioration of credit quality |
$ | 647,822 | |
At December 18, 2009, the carrying value of loans receivable with a deterioration in credit quality accounted for using the cost recovery method was $55.6 million due to our initial assessment of the uncertainty of the expected cash flows. Each of the loans is on nonaccrual status. Loans with a deterioration in credit quality that have an accretable difference are not included in nonperforming balances even though the customer may be contractually past due. These loans will accrete interest income over the remaining life of the loan.
Note 3. Securities
The amortized cost and fair value of securities classified as available for sale follow (in thousands):
| December 31, 2009 | December 31, 2008 | |||||||||||||||||||||||
| Amortized Cost |
Gross Unrealized Gains |
Gross Unrealized Losses |
Fair Value |
Amortized Cost |
Gross Unrealized Gains |
Gross Unrealized Losses |
Fair Value | |||||||||||||||||
| U.S. Treasury |
$ | 11,869 | $ | 63 | $ | 2 | $ | 11,930 | $ | 11,250 | $ | 192 | $ | — | $ | 11,442 | ||||||||
| U.S. government agencies |
131,858 | 1,328 | 1,361 | 131,825 | 224,803 | 1,836 | 29 | 226,610 | ||||||||||||||||
| Municipal obligations |
188,656 | 5,634 | 2,622 | 191,668 | 151,706 | 3,182 | 2,418 | 152,470 | ||||||||||||||||
| Mortgage-backed securities |
1,076,708 | 36,075 | 2,236 | 1,110,547 | 1,041,805 | 25,703 | 387 | 1,067,121 | ||||||||||||||||
| CMOs |
140,663 | 6,506 | — | 147,169 | 195,771 | 2,692 | 1 | 198,462 | ||||||||||||||||
| Other debt securities |
15,578 | 842 | 94 | 16,326 | 25,117 | 5 | 2,850 | 22,272 | ||||||||||||||||
| Other equity securities |
1,071 | 860 | 69 | 1,862 | 1,047 | 462 | 130 | 1,379 | ||||||||||||||||
| $ | 1,566,403 | $ | 51,308 | $ | 6,384 | $ | 1,611,327 | $ | 1,651,499 | $ | 34,072 | $ | 5,815 | $ | 1,679,756 | |||||||||
77
Table of Contents
HANCOCK HOLDING COMPANY AND SUBSIDIARIES
NOTES TO CONSOLIDATED FINANCIAL STATEMENTS—(Continued)
Note 3. Securities (continued)
The amortized cost and fair value of securities classified as available for sale at December 31, 2009, by contractual maturity, (expected maturities will differ from contractual maturities because of rights to call or repay obligations with or without penalties), and the amortized cost and fair value of trading securities were as follows (in thousands):
| Amortized Cost |
Fair Value | |||||
| Due in one year or less |
$ | 55,131 | $ | 55,626 | ||
| Due after one year through five years |
86,386 | 90,704 | ||||
| Due after five years through ten years |
114,271 | 114,365 | ||||
| Due after ten years |
92,173 | 91,054 | ||||
| 347,961 | 351,749 | |||||
| Mortgage-backed securities & CMOs |
1,217,371 | 1,257,716 | ||||
| Equity securities |
1,071 | 1,862 | ||||
| Total available for sale securities |
$ | 1,566,403 | $ | 1,611,327 | ||
The Company held no securities classified as held to maturity at December 31, 2009 or 2008.
The details concerning securities classified as available for sale with unrealized losses as of December 31, 2009 follow (in thousands):
| Losses < 12 months | Losses 12 months or > | Total | ||||||||||||||||
| Fair Value |
Gross Unrealized Losses |
Fair Value |
Gross Unrealized Losses |
Fair Value |
Gross Unrealized Losses | |||||||||||||
| U.S. Treasury |
$ | 9,967 | $ | 2 | $ | — | $ | — | $ | 9,967 | $ | 2 | ||||||
| U.S. government agencies |
— | — | 73,639 | 1,361 | 73,639 | 1,361 | ||||||||||||
| Municipal obligations |
— | — | 62,400 | 2,622 | 62,400 | 2,622 | ||||||||||||
| Mortgage-backed securities |
— | — | 270,099 | 2,236 | 270,099 | 2,236 | ||||||||||||
| Other debt securities |
— | — | 1,211 | 94 | 1,211 | 94 | ||||||||||||
| Equity securities |
— | — | 177 | 69 | 177 | 69 | ||||||||||||
| $ | 9,967 | $ | 2 | $ | 407,526 | $ | 6,382 | $ | 417,493 | $ | 6,384 | |||||||
The details concerning securities classified as available for sale with unrealized losses as of December 31, 2008 were as follows (in thousands):
| Losses < 12 months | Losses 12 months or > | Total | ||||||||||||||||
| Fair Value |
Gross Unrealized Losses |
Fair Value |
Gross Unrealized Losses |
Fair Value |
Gross Unrealized Losses | |||||||||||||
| U.S. government agencies |
$ | — | $ | — | $ | 20,077 | $ | 29 | $ | 20,077 | $ | 29 | ||||||
| Municipal obligations |
— | — | 38,610 | 2,418 | 38,610 | 2,418 | ||||||||||||
| Mortgage-backed securities |
— | — | 20,385 | 387 | 20,385 | 387 | ||||||||||||
| CMOs |
— | — | 4,442 | 1 | 4,442 | 1 | ||||||||||||
| Other debt securities |
1,029 | 25 | 22,077 | 2,825 | 23,106 | 2,850 | ||||||||||||
| Equity securities |
— | — | 135 | 130 | 135 | 130 | ||||||||||||
| $ | 1,029 | $ | 25 | $ | 105,726 | $ | 5,790 | $ | 106,755 | $ | 5,815 | |||||||
78
Table of Contents
HANCOCK HOLDING COMPANY AND SUBSIDIARIES
NOTES TO CONSOLIDATED FINANCIAL STATEMENTS—(Continued)
Note 3. Securities (continued)
The unrealized losses relate to fixed-rate debt securities that have incurred fair value reductions due to higher market interest rates since the respective purchase date. The unrealized losses are not likely to reverse unless and until market interest rates decline to the levels that existed when the securities were purchased. Since none of the unrealized losses relate to the marketability of the securities or the issuer’s ability to honor redemption obligations, none of the securities are deemed to be other than temporarily impaired.
As of December 31, 2009, the securities portfolio totaled $1.61 billion. Of the total portfolio, $417.5 million of securities were in an unrealized loss position of $6.4 million. Management and the Asset/Liability Committee continually monitor the securities portfolio and management is able to effectively measure and monitor the unrealized loss position on these securities. The Company has adequate liquidity and therefore does not plan to sell and is more likely than not, not to be required to sell these securities before recovery. Accordingly, the unrealized loss of these securities has been determined to be temporary.
The Company’s securities portfolio is an important source of liquidity and earnings for the Company. A stated objective in managing the securities portfolio is to provide consistent liquidity to support balance sheet growth but also to provide a safe and consistent stream of earnings. To that end, management is open to opportunities that present themselves which enables the Company to improve the structure and earnings potential of the securities portfolio.
Available for Sale Securities
Proceeds from sales and pay downs of available for sale securities were approximately $11.7 million in 2009, $213.8 million in 2008 and $9.2 million in 2007. Gross gains of $0.4 million in 2009, $6.0 million in 2008 and $0.4 million in 2007 and gross losses of $0.3 million in 2009, $4.1 million in 2008 and $0.1 million in 2007 were realized on such sales and pay downs.
Securities with a carrying value of approximately $1.20 billion at December 31, 2009 and $1.49 billion at December 31, 2008, were pledged primarily to secure public deposits and securities sold under agreements to repurchase. The Company has approximately $4.6 million and $4.8 million of securities pledged with various state regulatory authorities to secure reinsurance receivables as of December 31, 2009 and 2008, respectively.
Trading Securities
There was no activity in the trading portfolio during 2009. In 2008, the Company recognized $2.9 million in net gains, including a net gain of $3.2 million on a portfolio of trading securities which were subsequently transferred to available for sale. There were no trading gains or losses in 2007.
Short-term Investments
The Company held $214.8 million at December 31, 2009 and $362.9 million at December 31, 2008 in U.S. government agency discount notes as securities available for sale at amortized cost. The short-term investments all mature in less than 1 year. As the amortized cost is a reasonable estimate for fair value of these short-term investments, there were no gross unrealized losses to evaluate for impairment in the years ended December 31, 2009 and December 31, 2008.
79
Table of Contents
HANCOCK HOLDING COMPANY AND SUBSIDIARIES
NOTES TO CONSOLIDATED FINANCIAL STATEMENTS—(Continued)
Note 4. Loans
Loans, net of unearned income, consisted of the following (in thousands):
| December 31, | ||||||
| 2009 | 2008 | |||||
| Real estate loans |
$ | 3,670,164 | $ | 2,680,507 | ||
| Commercial and industrial loans |
372,355 | 420,981 | ||||
| Loans to individuals for household, family and other consumer expenditures |
560,967 | 619,115 | ||||
| Leases and other loans |
510,689 | 528,687 | ||||
| $ | 5,114,175 | $ | 4,249,290 | |||
The Company generally makes loans in its market areas of South Mississippi, South Alabama, South and Central Louisiana and Central and North Florida. Loans are made in the normal course of business to its directors, executive officers and their associates on substantially the same terms, including interest rates and collateral, as those prevailing at the time for comparable transactions with other persons. Such loans did not involve more than normal risk of collectibility. Balances of loans to the Company’s directors, executive officers and their affiliates at December 31, 2009 and 2008 were approximately $26.3 million and $31.6 million, respectively. New loans, repayments and changes of directors and executive officers and their affiliates on these loans for 2009 were $5.0 million, $8.9 million and ($1.4) million, respectively. New loans, repayments and changes of directors and executive officers and their affiliates on these loans for 2008 were $20.7 million, $4.3 million and $2.1 million, respectively.
Changes in the allowance for loan losses follow (in thousands):
| 2009 | 2008 | 2007 | ||||||||||
| Balance at January 1 |
$ | 61,725 | $ | 47,123 | $ | 46,772 | ||||||
| Recoveries |
4,650 | 5,224 | 7,210 | |||||||||
| Loans charged off |
(54,915 | ) | (27,407 | ) | (14,452 | ) | ||||||
| Provision for loan losses |
54,590 | 36,785 | 7,593 | |||||||||
| Balance at December 31 |
$ | 66,050 | $ | 61,725 | $ | 47,123 | ||||||
In some instances, loans are placed on non-accrual status. All accrued but uncollected interest related to the loan is deducted from income in the period the loan is assigned a non-accrual status. For such period as a loan is in non-accrual status, any cash receipts are applied first to principal, second to expenses incurred to cause payment to be made and lastly to the recovery of any reversed interest income and interest that would be due and owing subsequent to the loan being placed on non-accrual status.
The Company’s investments in impaired loans at December 31, 2009 and December 31, 2008 were $242.9 million and $22.1 million, respectively. Non-accrual and renegotiated loans amounted to approximately 1.69% and 0.71% of total loans at December 31, 2009 and 2008, respectively. Accruing loans 90 days past due as a percent of loans was 0.23% and 0.26% at December 31, 2009 and 2008, respectively. The average amounts of impaired loans carried on the Company’s books for 2009, 2008 and 2007 were $40.1 million, $19.3 million and $7.7 million, respectively. The amount of interest that would have been recorded on non-accrual loans had the loans not been classified as non-accrual in 2009, 2008 or 2007, was $2.0 million, $1.1 million and $0.5 million, respectively. Interest actually received on non-accrual loans at December 31, 2009 was $0.3 million and for the years ended December 31, 2008 and 2007 was not material.
80
Table of Contents
HANCOCK HOLDING COMPANY AND SUBSIDIARIES
NOTES TO CONSOLIDATED FINANCIAL STATEMENTS—(Continued)
Note 4. Loans (continued)
The following table presents the makeup of allowance for loan losses by:
| December 31, | ||||||
| 2009 | 2008 | |||||
| (In thousands) | ||||||
| Impaired loans |
||||||
| Requiring a loss allowance |
$ | 38,839 | $ | 15,089 | ||
| Not requiring a loss allowance |
94,743 | 7,015 | ||||
| Total recorded investment in impaired loans |
133,582 | 22,104 | ||||
| Impairment loss allowance required |
$ | 10,972 | $ | 7,317 | ||
As of December 31, 2009 and 2008, the Company had $38.0 million and $28.2 million, respectively, in loans carried at fair value. The Company held $36.1 million and $22.3 million in loans held for sale at December 31, 2009 and 2008 carried at lower of cost or market. Gain on the sale of loans totaled $0.6 million, $0.4 million, and $0.6 million for 2009, 2008, and 2007, respectively. These loans are originated on a best-efforts basis, whereby a commitment by a third party to purchase the loan has been received concurrent with the Banks’ commitment to the borrower to originate the loan.
Note 5. Property and Equipment
Property and equipment stated at cost, less accumulated depreciation and amortization, consisted of the following (in thousands):
| December 31, | ||||||||
| 2009 | 2008 | |||||||
| Land and land improvements |
$ | 37,178 | $ | 38,090 | ||||
| Buildings and leasehold improvements |
185,814 | 178,374 | ||||||
| Furniture, fixtures and equipment |
66,819 | 61,525 | ||||||
| Construction in progress |
1,434 | 4,111 | ||||||
| Software |
25,855 | 24,862 | ||||||
| 317,100 | 306,962 | |||||||
| Accumulated depreciation and amortization |
(113,967 | ) | (101,050 | ) | ||||
| Property and equipment, net |
$ | 203,133 | $ | 205,912 | ||||
Depreciation and amortization expense was $15.5 million, $15.8 million and $14.0 million for the years ended December 31, 2009, 2008 and 2007, respectively. Capitalized interest was $0.02 million, $0.1 million, and $1.0 million for the years ended December 31, 2009, 2008, and 2007, respectively.
81
Table of Contents
HANCOCK HOLDING COMPANY AND SUBSIDIARIES
NOTES TO CONSOLIDATED FINANCIAL STATEMENTS—(Continued)
Note 6. Goodwill and Other Intangible Assets
Goodwill represents costs in excess of the fair value of net assets acquired in connection with purchase business combinations. In accordance with the provisions of FASB’s guidance for goodwill and other intangibles, the Company tests its goodwill for impairment annually. No impairment charges were recognized during 2009, 2008, or 2007. The carrying amount of goodwill was $62.3 million at both December 31, 2009 and 2008.
The following tables present information regarding the components of the Company’s other intangible assets, and related amortization for the dates indicated (in thousands):
| December 31, 2009 | |||||||||
| Gross Carrying Amount |
Accumulated Amortization |
Net Carrying Amount | |||||||
| Core deposit intangibles |
$ | 25,747 | $ | 10,727 | $ | 15,020 | |||
| Value of insurance business acquired |
2,752 | 1,544 | 1,208 | ||||||
| Non-compete agreements |
322 | 308 | 14 | ||||||
| Trade name |
100 | 90 | 10 | ||||||
| $ | 28,921 | $ | 12,669 | $ | 16,252 | ||||
| December 31, 2008 | |||||||||
| Gross Carrying Amount |
Accumulated Amortization |
Net Carrying Amount | |||||||
| Core deposit intangibles |
$ | 14,137 | $ | 9,613 | $ | 4,524 | |||
| Value of insurance business acquired |
2,752 | 1,289 | 1,463 | ||||||
| Non-compete agreements |
322 | 280 | 42 | ||||||
| Trade name |
100 | 70 | 30 | ||||||
| $ | 17,311 | $ | 11,252 | $ | 6,059 | ||||
| Years Ended December 31, | |||||||||
| 2009 | 2008 | 2007 | |||||||
| Aggregate amortization expense for: |
|||||||||
| Core deposit intangibles |
$ | 1,114 | $ | 1,113 | $ | 1,210 | |||
| Value of insurance business acquired |
255 | 271 | 348 | ||||||
| Non-compete agreements |
28 | 28 | 73 | ||||||
| Trade name |
20 | 20 | 20 | ||||||
| $ | 1,417 | $ | 1,432 | $ | 1,651 | ||||
The Company recorded a core deposit intangible asset of $11.6 million associated with the acquisition of Peoples First Community Bank on December 18, 2009. The amortization period used for core deposit intangibles and value of insurance business acquired is 10 years. The amortization period used for non-compete agreements and trade name intangibles is 5 years. The following table shows estimated amortization expense of other intangible assets for the five succeeding years and thereafter, calculated based on current amortization schedules (in thousands):
| 2010 |
$ | 2,760 | |
| 2011 |
2,450 | ||
| 2012 |
2,207 | ||
| 2013 |
2,002 | ||
| 2014 |
1,542 | ||
| Thereafter |
5,291 | ||
| $ | 16,252 | ||
82
Table of Contents
HANCOCK HOLDING COMPANY AND SUBSIDIARIES
NOTES TO CONSOLIDATED FINANCIAL STATEMENTS—(Continued)
Note 7. Deposits
The maturities of time deposits at December 31, 2009 follow (in thousands):
| 2010 |
$ | 2,380,991 | |
| 2011 |
265,963 | ||
| 2012 |
258,865 | ||
| 2013 |
37,771 | ||
| 2014 |
23,028 | ||
| thereafter |
106,125 | ||
| $ | 3,072,743 | ||
Time deposits of $100,000 or more totaled approximately $955.5 million and $1.1 billion at December 31, 2009 and 2008, respectively.
Note 8. Borrowings
Short-Term Borrowings
The following table presents information concerning federal funds purchased and sold, securities sold under agreements to repurchase and other short-term borrowings (in thousands):
| December 31, | ||||||||
| 2009 | 2008 | |||||||
| Federal funds sold |
||||||||
| Amount outstanding at period-end |
$ | 410 | $ | 175,166 | ||||
| Weighted average interest rate at period-end |
16.64 | % | 0.11 | % | ||||
| Federal funds purchased |
||||||||
| Amount outstanding at period-end |
$ | 250 | $ | — | ||||
| Weighted average interest rate at period-end |
0.11 | % | — | |||||
| Weighted average interest rate during the year |
0.21 | % | 2.20 | % | ||||
| Average daily balance during the year |
$ | 3,484 | $ | 16,003 | ||||
| Maximum month end balance during the year |
$ | 4,700 | $ | 33,775 | ||||
| Securities sold under agreements to repurchase |
||||||||
| Amount outstanding at period-end |
$ | 484,457 | $ | 505,932 | ||||
| Weighted average interest rate at period-end |
1.99 | % | 2.10 | % | ||||
| Weighted average interest rate during the year |
2.06 | % | 2.76 | % | ||||
| Average daily balance during the year |
$ | 523,351 | $ | 524,712 | ||||
| Maximum month end balance during the year |
$ | 567,888 | $ | 621,424 | ||||
| Other short-term investments |
||||||||
| Amount outstanding at period-end |
$ | 30,805 | $ | — | ||||
| Weighted average interest rate at period-end |
0.38 | % | — | |||||
| Weighted average interest rate during the year |
0.17 | % | 2.04 | % | ||||
| Average daily balance during the year |
$ | 75,160 | $ | 2,650 | ||||
| Maximum month end balance during the year |
$ | 156,000 | $ | — | ||||
83
Table of Contents
HANCOCK HOLDING COMPANY AND SUBSIDIARIES
NOTES TO CONSOLIDATED FINANCIAL STATEMENTS—(Continued)
Note 8. Borrowings (continued)
The contractual maturity of federal funds purchased and securities sold under agreements to repurchase is demand or due overnight.
Specific U. S. Treasury and U. S. Government agencies with carrying values of $450.1 million at December 31, 2009 and $504.8 million at December 31, 2008 collateralized the retail and wholesale repurchase agreements. The fair value of this collateral approximated $458.3 million at December 31, 2009 and $513.3 million at December 31, 2008. In addition, there was cash collateral in the amount of $54.5 million for the wholesale repurchase agreements at December 31, 2009.
Long-Term Borrowings
As of December 31, 2009, the Company had $225.0 million in long-term borrowings classified as securities sold under agreements to repurchase. Combined with short-term borrowings of $259.5 million, the Company’s total position in securities sold under agreements to repurchase was $484.5 million. The Company has an approved line of credit with the FHLB of approximately $367.2 million, which is secured by a blanket pledge of certain residential mortgage loans. This line of credit had an outstanding balance of $10.7 million at December 31, 2009 and no outstanding balance at December 31, 2008.
Note 9. Stockholders’ Equity
Regulatory Capital
Common stockholders’ equity of the Company includes the undistributed earnings of the bank subsidiaries. Dividends are payable only out of undivided profits or current earnings. Moreover, dividends to the Company's stockholders can generally be paid only from dividends paid to the Company by the Banks. Consequently, dividends are dependent upon earnings, capital needs, regulatory policies and statutory limitations affecting the Banks. Federal and state banking laws and regulations restrict the amount of dividends and loans a bank may make to its parent company. Dividends paid by Hancock Bank are subject to approval by the Commissioner of Banking and Consumer Finance of the State of Mississippi and those paid by Hancock Bank of Louisiana are subject to approval by the Commissioner of Financial Institutions of the State of Louisiana. Dividends paid by Hancock Bank of Florida are subject to approval by the Florida Department of Financial Services and those paid by Hancock Bank of Alabama are subject to approval by Alabama State Banking Department. The amount of capital of the subsidiary banks available for dividends at December 31, 2009 was approximately $69.9 million.
Risk-based capital requirements are intended to make regulatory capital more sensitive to risk elements of the Company. Currently, the Company and its bank subsidiaries are required to maintain minimum risk-based capital ratios of 8.0%, with not less than 4.0% in Tier 1 capital. In addition, the Company and its bank subsidiaries must maintain minimum Tier 1 leverage ratios (Tier 1 capital to total average assets) of at least 3.0% based upon the regulators latest composite rating of the institution.
The Federal Deposit Insurance Corporation Improvement Act of 1991 (FDICIA) required each federal banking agency to implement prompt corrective actions for institutions that it regulates. The rules provide that an institution is “well capitalized” if its total risk-based capital ratio is 10.0% or greater, its Tier 1 risked-based capital ratio is 6.0% or greater, its leverage ratio is 5.0% or greater and the institution is not subject to a capital directive. Under this regulation, all of the subsidiary banks were deemed to be “well capitalized” as of December 31, 2009 and 2008 based upon the most recent notifications from their regulators. There are no conditions or events since those notifications that management believes would change these classifications.
The Company and its bank subsidiaries are required to maintain certain minimum capital levels. At December 31, 2009 and 2008, the Company and the Banks were in compliance with their respective statutory minimum capital requirements.
84
Table of Contents
HANCOCK HOLDING COMPANY AND SUBSIDIARIES
NOTES TO CONSOLIDATED FINANCIAL STATEMENTS—(Continued)
Note 9. Stockholders’ Equity (continued)
Following is a summary of the actual capital levels at December 31, 2009 and 2008 (amounts in thousands):
| Actual | Required for Minimum Capital Adequacy |
To Be Well Capitalized Under Prompt Corrective Action Provisions | |||||||||||||
| Amount | Ratio % | Amount | Ratio % | Amount | Ratio % | ||||||||||
| At December 31, 2009 |
|||||||||||||||
| Total capital (to risk weighted assets) |
|||||||||||||||
| Company |
$ | 822,505 | 13.04 | $ | 504,457 | 8.00 | $ | N/A | N/A | ||||||
| Hancock Bank |
403,807 | 11.24 | 287,342 | 8.00 | 359,178 | 10.00 | |||||||||
| Hancock Bank of Louisiana |
326,127 | 14.53 | 179,591 | 8.00 | 224,489 | 10.00 | |||||||||
| Hancock Bank of Florida |
43,962 | 16.11 | 21,825 | 8.00 | 27,282 | 10.00 | |||||||||
| Hancock Bank of Alabama |
23,597 | 13.33 | 14,164 | 8.00 | 17,705 | 10.00 | |||||||||
| Tier 1 capital (to risk weighted assets) |
|||||||||||||||
| Company |
$ | 756,108 | 11.99 | $ | 252,228 | 4.00 | $ | N/A | N/A | ||||||
| Hancock Bank |
371,013 | 10.33 | 143,671 | 4.00 | 215,507 | 6.00 | |||||||||
| Hancock Bank of Louisiana |
302,316 | 13.47 | 89,796 | 4.00 | 134,694 | 6.00 | |||||||||
| Hancock Bank of Florida |
40,521 | 14.85 | 10,913 | 4.00 | 16,369 | 6.00 | |||||||||
| Hancock Bank of Alabama |
21,364 | 12.07 | 7,082 | 4.00 | 10,623 | 6.00 | |||||||||
| Tier 1 leverage capital |
|||||||||||||||
| Company |
$ | 756,108 | 10.60 | $ | 214,043 | 3.00 | $ | N/A | N/A | ||||||
| Hancock Bank |
371,013 | 9.45 | 117,788 | 3.00 | 196,313 | 5.00 | |||||||||
| Hancock Bank of Louisiana |
302,316 | 10.67 | 85,005 | 3.00 | 141,674 | 5.00 | |||||||||
| Hancock Bank of Florida |
40,521 | 10.38 | 11,707 | 3.00 | 19,512 | 5.00 | |||||||||
| Hancock Bank of Alabama |
21,364 | 12.29 | 5,216 | 3.00 | 8,694 | 5.00 | |||||||||
| At December 31, 2008 |
|||||||||||||||
| Total capital (to risk weighted assets) |
|||||||||||||||
| Company |
$ | 612,090 | 11.86 | $ | 413,014 | 8.00 | $ | N/A | N/A | ||||||
| Hancock Bank |
293,110 | 10.91 | 214,914 | 8.00 | 268,558 | 10.00 | |||||||||
| Hancock Bank of Louisiana |
243,117 | 10.48 | 185,635 | 8.00 | 232,043 | 10.00 | |||||||||
| Hancock Bank of Florida |
40,173 | 12.23 | 26,278 | 8.00 | 32,848 | 10.00 | |||||||||
| Hancock Bank of Alabama |
15,673 | 10.45 | 12,000 | 8.00 | 15,000 | 10.00 | |||||||||
| Tier 1 capital (to risk weighted assets) |
|||||||||||||||
| Company |
$ | 550,216 | 10.66 | $ | 206,507 | 4.00 | $ | N/A | N/A | ||||||
| Hancock Bank |
261,726 | 9.74 | 107,457 | 4.00 | 161,135 | 6.00 | |||||||||
| Hancock Bank of Louisiana |
217,186 | 9.36 | 92,817 | 4.00 | 139,226 | 6.00 | |||||||||
| Hancock Bank of Florida |
37,144 | 11.31 | 13,139 | 4.00 | 19,709 | 6.00 | |||||||||
| Hancock Bank of Alabama |
14,250 | 9.50 | 6,000 | 4.00 | 9,000 | 6.00 | |||||||||
| Tier 1 leverage capital |
|||||||||||||||
| Company |
$ | 550,216 | 8.06 | $ | 204,680 | 3.00 | $ | N/A | N/A | ||||||
| Hancock Bank |
261,726 | 7.08 | 110,878 | 3.00 | 184,797 | 5.00 | |||||||||
| Hancock Bank of Louisiana |
217,186 | 7.48 | 87,099 | 3.00 | 145,165 | 5.00 | |||||||||
| Hancock Bank of Florida |
37,144 | 12.78 | 8,717 | 3.00 | 14,528 | 5.00 | |||||||||
| Hancock Bank of Alabama |
14,250 | 10.11 | 4,230 | 3.00 | 7,050 | 5.00 | |||||||||
85
Table of Contents
HANCOCK HOLDING COMPANY AND SUBSIDIARIES
NOTES TO CONSOLIDATED FINANCIAL STATEMENTS—(Continued)
Note 10. Retirement and Employee Benefit Plans
At December 31, 2009, the Company had a pension plan and two postretirement plans for employees, which are described more fully below. The Company has accounted for its defined benefit pension plan using the actuarial model required by generally accepted accounting principles regarding employers’ accounting for pensions. The compensation cost of an employee’s pension benefit has been recognized on the projected unit credit method over the employee’s approximate service period. The aggregate cost method has been utilized for funding purposes. The Company also sponsors two defined benefit postretirement plans, which provide medical benefits and life insurance benefits. The Company has accounted for these plans using the actuarial computations required by generally accepted accounting principles regarding employers accounting for postretirement benefits other than pensions. The cost of the defined benefit postretirement plan has been recognized on the projected unit credit method over the employee’s approximate service period.
Under generally accepted accounting principles, the Company is required to recognize the over funded or under funded status of a defined benefit postretirement plan as an asset or liability on its balance sheet. The Company recognizes changes in that funded status in the year in which the changes occur through comprehensive income effective for years ending after December 15, 2006. In addition, generally accepted accounting principles requires an employer to measure the funded status of a plan as of the date of its year-end statement of financial position effective for fiscal years ending after December 15, 2008. With the adoption of the change in measurement date, the Company recorded an $815,107 adjustment to beginning 2008 retained earnings. Results for prior periods have not been restated.
Defined Benefit Plan—Pension
The Company has a noncontributory defined benefit pension plan covering employees who have been employed by the Company one year and who have worked a minimum of 1,000 hours during the calendar year. The Company’s current policy is to contribute annually the minimum amount that can be deducted for federal income tax purposes. The benefits are based upon years of service and the employee’s compensation during the last five years of employment.
86
Table of Contents
HANCOCK HOLDING COMPANY AND SUBSIDIARIES
NOTES TO CONSOLIDATED FINANCIAL STATEMENTS—(Continued)
Note 10. Retirement and Employee Benefit Plans (continued)
The measurement date for the pension plan is December 31, 2009. Data relative to the pension plan is as follows (in thousands):
| December 31, | ||||||||
| 2009 | 2008* | |||||||
| Change in benefit obligation |
||||||||
| Benefit obligation, beginning of year |
$ | 82,862 | $ | 73,203 | ||||
| Service cost |
3,107 | 3,283 | ||||||
| Interest cost |
4,833 | 5,646 | ||||||
| Actuarial loss |
2,502 | 4,999 | ||||||
| Benefits paid |
(3,584 | ) | (4,269 | ) | ||||
| Benefit obligation, end of year |
89,720 | 82,862 | ||||||
| Change in plan assets |
||||||||
| Fair value of plan assets, beginning of year |
51,001 | 59,741 | ||||||
| Actual return on plan assets |
7,758 | (11,757 | ) | |||||
| Employer contributions |
6,431 | 7,467 | ||||||
| Benefit payments |
(3,584 | ) | (4,269 | ) | ||||
| Expenses |
(294 | ) | (181 | ) | ||||
| Fair value of plan assets, end of year |
61,312 | 51,001 | ||||||
| Funded status at end of year—net liability |
$ | (28,408 | ) | $ | (31,861 | ) | ||
| Amounts recognized in accumulated other comprehensive loss |
||||||||
| Unrecognized loss at beginning of year |
$ | 40,490 | $ | 18,699 | ||||
| Amount of (loss)/gain recognized during the year |
(2,648 | ) | (1,184 | ) | ||||
| Net actuarial loss/(gain) |
(1,089 | ) | 22,975 | |||||
| Unrecognized loss at end of year |
$ | 36,753 | $ | 40,490 | ||||
| * | 2008 amounts are for the 15 month period October 1, 2007—December 31, 2008. |
Net periodic expense is as follows (in thousands):
| Years Ended December 31, | ||||||||||||
| 2009 | 2008 | 2007 | ||||||||||
| Net periodic benefit cost |
||||||||||||
| Service cost |
$ | 3,107 | $ | 2,626 | $ | 2,656 | ||||||
| Interest cost |
4,833 | 4,517 | 3,834 | |||||||||
| Expected return on plan assets |
(3,873 | ) | (4,830 | ) | (4,206 | ) | ||||||
| Recognized net amortization and deferral |
2,648 | 947 | 1,122 | |||||||||
| Net pension benefit cost |
6,715 | 3,260 | 3,406 | |||||||||
| Other changes in plan assets and benefit obligations recognized in other comprehensive income, before taxes |
||||||||||||
| Net (loss)/gain recognized during the year |
(2,648 | ) | (1,184 | ) | (1,122 | ) | ||||||
| Net actuarial loss/(gain) |
(1,089 | ) | 22,975 | (486 | ) | |||||||
| Total recognized in other comprehensive income |
(3,737 | ) | 21,791 | (1,608 | ) | |||||||
| Total recognized in net periodic benefit cost and other comprehensive income |
$ | 2,978 | $ | 25,051 | $ | 1,798 | ||||||
| Weighted average assumptions as of measurement date |
||||||||||||
| Discount rate for benefit obligations |
5.95 | % | 5.96 | % | 6.31 | % | ||||||
| Discount rate for net periodic benefit cost |
5.96 | % | 6.31 | % | 5.75 | % | ||||||
| Expected long-term return on plan assets |
7.50 | % | 7.50 | % | 8.00 | % | ||||||
| Rate of compensation increase |
4.00 | % | 4.00 | % | 4.00 | % | ||||||
87
Table of Contents
HANCOCK HOLDING COMPANY AND SUBSIDIARIES
NOTES TO CONSOLIDATED FINANCIAL STATEMENTS—(Continued)
Note 10. Retirement and Employee Benefit Plans (continued)
The long term rate of return is determined by using the weighted-average of historical real returns for major asset classes based on target asset allocations. The result is then adjusted for inflation. The Company changed to the Citigroup Pension Discount Curve Liability Index (CPD) in 2007 from the Aa Seasoned Moody Twenty Year Bond Rate which was used in 2006. At December 31, 2009, the discount rate was calculated by matching expected future cash flows to the CPD Curve Liability Index. The published duration of the CPD curve was 15.8 years and the duration for the Company’s valuation was 16.03 years for December 2009.
The Company has been making the contributions required by the Internal Revenue Service. The Company’s contributions to this plan were $6.4 million in 2009, $4.8 million in 2008 and $4.6 million in 2007. The Company expects to contribute approximately $6.7 million to the pension plan in 2010. The following pension plan benefit payments, which reflect expected future service, are expected to be made (in thousands):
| 2010 |
$ | 3,505 | |
| 2011 |
3,556 | ||
| 2012 |
3,709 | ||
| 2013 |
4,208 | ||
| 2014 |
4,380 | ||
| 2015 - 2019 |
26,079 | ||
| $ | 45,437 | ||
The expected benefits to be paid are based on the same assumptions used to measure the Company’s benefit obligation at December 31, 2009.
The plan assets are held in the Company’s Hancock Horizon mutual funds, as follows: Hancock Horizon Government Money Market Fund, Hancock Horizon Strategic Income Bond Fund, Hancock Horizon Quantitative Long/Short Fund, Hancock Horizon Diversified International Fund, Hancock Horizon Burkenroad Fund, Hancock Horizon Growth Fund, and Hancock Horizon Value Fund. The fair values of the Company’s pension plan assets at December 31, 2009, by asset category, are shown in the following table (in thousands):
Fair Value Measurements at December 31, 2009
| Asset Category | Total | Quoted Prices in Active Markets for Identical Assets (Level 1) |
Significant Observable Inputs (Level 2) |
Significant Unobservable Inputs (Level 3) | ||||||||
| Cash and cash equivalets |
$ | 2,542 | $ | 2,542 | $ | — | $ | — | ||||
| Equity Securities: |
||||||||||||
| U.S. large/mid-cap stock |
27,880 | 27,880 | — | — | ||||||||
| International stocks |
5,444 | 5,444 | — | — | ||||||||
| U.S. small-cap growth |
3,291 | 3,291 | — | — | ||||||||
| Fixed income securities: |
||||||||||||
| U.S. Agencies |
12,629 | 12,629 | — | — | ||||||||
| Corporate bonds (a) |
9,527 | 9,527 | — | — | ||||||||
| TOTAL |
$ | 61,313 | $ | 61,313 | $ | — | $ | — | ||||
| (a) | This category represents investment grade bonds of U.S. issuers from diverse industries |
88
Table of Contents
HANCOCK HOLDING COMPANY AND SUBSIDIARIES
NOTES TO CONSOLIDATED FINANCIAL STATEMENTS—(Continued)
Note 10. Retirement and Employee Benefit Plans (continued)
The Company’s pension plan weighted-average asset allocations and target allocations at December 31, 2009 and 2008, by asset category, are as follows:
| Plan Assets at December 31, |
Target Allocation at December 31, |
|||||||||||
| Asset category | 2009 | 2008 | 2009 | 2008 | ||||||||
| Equity securities |
60 | % | 49 | % | 40-70 | % | 40-70 | % | ||||
| Fixed income securities |
36 | % | 47 | % | 30-60 | % | 30-60 | % | ||||
| Cash equivalents |
4 | % | 4 | % | 0-10 | % | 0-10 | % | ||||
| 100 | % | 100 | % | |||||||||
The investment strategy of the pension plan is to emphasize a balanced return of current income and growth of principal while accepting a moderate level of risk. The investment goal of the plan is to meet or exceed the return of balanced market index comprised of 55% of the S&P 500 Index and 45% Barclays Intermediate Aggregate Index. The pension plan investment committee meets periodically to review the policy, strategy and performance of the plan.
Defined Benefit Plan—Postretirement
The Company sponsors two defined benefit postretirement plans, other than the pension plan, that cover full-time employees who have reached 55 years of age with fifteen years of service, age 62 with twelve years of service or age 65 with ten years of service. One plan provides medical benefits and the other provides life insurance benefits. The postretirement health care plan is contributory, with retiree contributions adjusted annually and subject to certain employer contribution maximums. The following year-end financial information regarding the Company’s postretirement health care plan reflects the Medicare Part D subsidy. The life insurance plan is noncontributory.
The measurement date for the plans is December 31, 2009. The Company used a 6.00% discount rate for the determination of the projected postretirement benefit obligation as of December 31, 2009 and 2008. The discount rate is based on the Citigroup Discount Pension Curve.
89
Table of Contents
HANCOCK HOLDING COMPANY AND SUBSIDIARIES
NOTES TO CONSOLIDATED FINANCIAL STATEMENTS—(Continued)
Note 10. Retirement and Employee Benefit Plans (continued)
Data relative to these postretirement benefits is as follows (in thousands):
| Years Ended December 31, | ||||||||
| 2009 | 2008 | |||||||
| Change in postretirement benefit obligation |
||||||||
| Projected postretirement benefit obligation, beginning of year |
$ | 8,727 | $ | 8,481 | ||||
| Service cost |
114 | 174 | ||||||
| Interest cost |
565 | 505 | ||||||
| Plan participants’ contributions |
299 | 304 | ||||||
| Actuarial loss |
1,574 | 269 | ||||||
| Benefit payments |
(989 | ) | (1,006 | ) | ||||
| Projected postretirement benefit obligation, end of year |
10,290 | 8,727 | ||||||
| Change in plan assets |
||||||||
| Plan assets, beginning of year |
— | — | ||||||
| Employer contributions |
690 | 702 | ||||||
| Plan participants’ contributions |
299 | 304 | ||||||
| Benefit payments |
(989 | ) | (1,006 | ) | ||||
| Plan assets, end of year |
— | — | ||||||
| Funded status at end of year—net liability |
$ | (10,290 | ) | $ | (8,727 | ) | ||
| Amounts recognized in accumulated other comprehensive loss |
||||||||
| Net loss |
$ | 3,846 | $ | 2,568 | ||||
| Prior service cost |
(155 | ) | (208 | ) | ||||
| Net obligation |
10 | 15 | ||||||
| $ | 3,701 | $ | 2,375 | |||||
90
Table of Contents
HANCOCK HOLDING COMPANY AND SUBSIDIARIES
NOTES TO CONSOLIDATED FINANCIAL STATEMENTS—(Continued)
Note 10. Retirement and Employee Benefit Plans (continued)
The following table shows the composition of net period postretirement benefit cost (in thousands):
| Years Ended December 31, | ||||||||||||
| 2009 | 2008 | 2007 | ||||||||||
| Net periodic postretirement benefit cost |
||||||||||||
| Service cost |
$ | 114 | $ | 174 | $ | 168 | ||||||
| Interest costs |
565 | 505 | 485 | |||||||||
| Amortization of net loss |
296 | 177 | 249 | |||||||||
| Amortization of prior service cost |
(48 | ) | (48 | ) | (48 | ) | ||||||
| Net periodic postretirement benefit cost |
927 | 808 | 854 | |||||||||
| Other changes in plan assets and benefit obligations recognized in other comprehensive income, before taxes |
||||||||||||
| Amount of loss recognized during the year |
(296 | ) | (177 | ) | (249 | ) | ||||||
| Net actuarial (gain)/loss |
1,574 | 269 | 1,012 | |||||||||
| Amortization of prior service cost |
48 | 48 | 48 | |||||||||
| Total recognized in other comprehensive income |
1,326 | 140 | 811 | |||||||||
| Total recognized in net periodic benefit cost and other comprehensive income |
$ | 2,253 | $ | 948 | $ | 1,665 | ||||||
For measurement purposes in 2009, a 9.0% annual rate of increase in the over age 65 per capita costs of covered health care benefits was assumed for 2010. The rate was assumed to decrease uniformly to 5.0% over 8 years and remain at that level thereafter. In 2008, a 7.0% annual rate of increase in the over age 65 per capita costs of covered health care benefits was assumed. The rate was assumed to decrease gradually to 5.0% over 2 years and remain at that level thereafter. The health care cost trend rate assumption has an effect on the amounts reported. The following table illustrates the effect on the postretirement benefit obligation of a 1% increase or 1% decrease in the assumed health care cost trend rates:
| 1% Decrease in Rates |
Assumed Rates |
1% Increase in Rates | |||||||
| Aggregated service and interest cost |
$ | 603 | $ | 679 | $ | 773 | |||
| Postretirement benefit obligation |
9,236 | 10,290 | 11,573 | ||||||
The Company expects to contribute $0.7 million to the plans in 2010. Expected benefits to be paid over the next ten years and are reflected the following table (in thousands):
| 2010 |
$ | 702 | |
| 2011 |
744 | ||
| 2012 |
638 | ||
| 2013 |
618 | ||
| 2014 |
640 | ||
| 2015 - 2019 |
2,936 | ||
| $ | 6,278 | ||
91
Table of Contents
HANCOCK HOLDING COMPANY AND SUBSIDIARIES
NOTES TO CONSOLIDATED FINANCIAL STATEMENTS—(Continued)
Note 10. Retirement and Employee Benefit Plans (continued)
The following table shows the amounts in accumulated other comprehensive loss that the Company expects to be recognized as net periodic benefit cost during the year ending December 31, 2010 (in thousands):
| Prior service cost |
$ | (53 | ) | |
| Net transition obligation |
5 | |||
| Net loss |
301 | |||
| Total |
$ | 253 | ||
Defined Contribution Plan – 401(k)
The Company has a 401(k) retirement plan covering substantially all employees who have been employed 90 days excluding on call, temporary, and seasonal employees and meet certain other requirements. Under this plan, employees can contribute a portion of their salary within limits provided by the Internal Revenue Code into the plan. The Company’s contributions to this plan were $1.8 million in 2009, $1.7 million in 2008 and $1.5 million in 2007.
Nonqualified Deferred Compensation Plans
The Company has one nonqualified deferred compensation plan covering key employees who have met certain requirements. The Company’s contributions to this plan were $0.8 million in 2009, $1.0 million in 2008 and $0.5 million in 2007.
Employee Stock Purchase Plan
The Company has an employee stock purchase plan that is designed to provide the employees of the Company a convenient means of purchasing common stock of the Company. Substantially all salaried, full time employees, who have been employed by the Company 90 days excluding on call, temporary, and seasonal employees, are eligible to participate. The Company makes no contribution to each participant’s contribution. The numbers of shares purchased under this plan were 12,516 in 2009, 9,864 in 2008 and 11,623 in 2007.
The postretirement plans relating to health care payments and life insurance are not guaranteed and are subject to immediate cancellation and/or amendment. These plans are predicated on future Company profit levels that will justify their continuance. Overall health care costs are also a factor in the level of benefits provided and continuance of these post-retirement plans. There are no vested rights under the postretirement health or life insurance plans.
Note 11. Stock-Based Payment Arrangements
At December 31, 2009, the Company had two share-based payment plans for employees, which are described below. The Company follows the fair value recognition provisions of FASB’s guidance regarding share-based payment. For the years ended December 31, 2009, 2008, and 2007 total compensation cost for share-based compensation recognized in income was $3.3 million, $2.8 million, and $1.2 million, respectively. The total recognized tax benefit related to the share-based compensation was $0.8 million, $0.7 million, and $0.3 million, respectively, for years 2009, 2008 and 2007.
Prior to the adoption of the guidance, the Company presented all tax benefits of deductions resulting from the exercise of stock options as operating cash flows in the Consolidated Statement of Cash Flows. The guidance requires the cash flows resulting from the tax benefits resulting from tax deductions in excess of the compensation cost recognized for those options (excess tax benefits) to be classified as financing cash flows. The excess tax benefit classified as a financing cash inflow and classified as an operating cash outflow for the years ended December 31, 2009, 2008, and 2007 was $480 thousand, $4.5 million, and $0.3 million, respectively.
92
Table of Contents
HANCOCK HOLDING COMPANY AND SUBSIDIARIES
NOTES TO CONSOLIDATED FINANCIAL STATEMENTS—(Continued)
Note 11. Stock-Based Payment Arrangements (continued)
Stock Option Plans
The 1996 Hancock Holding Company Long-Term Incentive Plan (the “1996 Plan”) that was approved by the Company’s shareholders in 1996 was designed to provide annual incentive stock awards. Awards as defined in the 1996 Plan include, with limitations, stock options (including restricted stock options), restricted and performance shares, and performance stock awards, all on a stand-alone, combination or tandem basis. A total of fifteen million (15,000,000) common shares can be granted under the 1996 Plan with an annual grant maximum of two percent (2%) of the Company’s outstanding common stock as reported for the fiscal year ending immediately prior to such plan year. Grants of restricted stock awards are limited to one-third of the grant totals.
The exercise price is equal to the closing market price on the date immediately preceding the date of grant, except for certain of those granted to major stockholders where the option price is 110 percent of the market price. Option awards generally vest based on five years of continuous service and have ten-year contractual terms. The Company’s policy is to issue new shares upon share option exercise and issue treasury shares upon restricted stock award vesting. The 1996 Long-Term Incentive Plan expired in 2006.
In March of 2005, the stockholders of the Company approved Hancock Holding Company’s 2005 Long-Term Incentive Plan (the “2005 Plan”) as the successor plan to the 1996 LTIP. The 2005 Plan is designed to enable employees and directors to obtain a proprietary interest in the Company and to attract and retain outstanding personnel.
The 2005 Plan provides that awards for up to an aggregate of five million (5,000,000) shares of the Company’s common stock may be granted during the term of the 2005 Plan. The 2005 Plan limits the number of shares for which awards may be granted during any calendar year to two percent (2%) of the outstanding Company’s common stock as reported for the fiscal year ending immediately prior to such plan year.
The fair value of each option award is estimated on the date of grant using Black-Scholes-Merton option valuation model that uses the assumptions noted in the following table. Expected volatilities are based on implied volatilities from traded options on the Company’s stock, historical volatility of the Company’s stock and other factors. The expected term of options granted is derived from the output of the option valuation model and represents the period of time that options granted are expected to be outstanding. The risk-free rate for periods within the contractual life of the option is based on the U.S. Treasury yield curve in effect at the time of grant.
| Years Ended December 31, | |||||||||
| 2009* | 2008 | 2007 | |||||||
| Expected volatility |
40.45 | % | 29.02% - 35.33 | % | 29.02% - 30.89 | % | |||
| Expected dividends |
2.49 | % | 2.31% - 2.60 | % | 2.47% - 2.52 | % | |||
| Expected term (in years) |
8.7 | 5.6 - 8.7 | 5.6 - 9 | ||||||
| Risk-free rates |
3.28 | % | 2.07% -3.71 | % | 3.87% - 5.10 | % | |||
| * | During 2009, there was only one option award to one class of recipients |
A summary of option activity and changes under the plans for 2009 is presented below:
| Options |
Number of Shares |
Average Exercise Price ($) |
Contractual Term (Years) |
Aggregate Intrinsic Value ($000) | |||||||
| Outstanding at January 1, 2009 |
1,013,677 | $ | 33.75 | ||||||||
| Granted |
136,688 | $ | 38.48 | ||||||||
| Exercised |
(75,963 | ) | $ | 20.61 | $ | 1,477 | |||||
| Forfeited or expired |
(74,153 | ) | $ | 37.14 | |||||||
| Outstanding at December 31, 2009 |
1,000,249 | $ | 35.15 | 6.3 | $ | 8,689 | |||||
| Exercisable at December 31, 2009 |
594,754 | $ | 31.72 | 4.9 | $ | 7,206 | |||||
| Share options expected to vest |
405,495 | $ | 40.18 | 8.4 | $ | 1,483 | |||||
93
Table of Contents
HANCOCK HOLDING COMPANY AND SUBSIDIARIES
NOTES TO CONSOLIDATED FINANCIAL STATEMENTS—(Continued)
Note 11. Stock-Based Payment Arrangements (continued)
The weighted-average grant-date fair values of options granted during 2009, 2008, and 2007 were $14.52, $13.19, and $12.14, respectively, per optioned share. The total intrinsic value of options exercised during 2009, 2008 and 2007 was $1.5 million, $12.6 million, and $5.2 million, respectively.
A summary of the status of the Company’s nonvested shares as of December 31, 2009, and changes during 2009, is presented below:
| Number of Shares |
Weighted- Average Grant-Date Fair Value | |||||
| Nonvested at January 1, 2009 |
621,621 | $ | 22.57 | |||
| Granted |
230,556 | $ | 24.79 | |||
| Vested |
(146,769 | ) | $ | 18.46 | ||
| Forfeited |
(20,288 | ) | $ | 24.57 | ||
| Nonvested at December 31, 2009 |
685,120 | $ | 24.14 | |||
As of December 31, 2009, there was $12.0 million of total unrecognized compensation cost related to nonvested share-based compensation arrangements granted under the plans. That cost is expected to be recognized over a weighted-average period of 3.7 years. The total fair value of shares which vested during 2009 and 2008 was $2.7 million and $3.0 million, respectively.
Note 12. Fair Value of Financial Instruments
The Financial Accounting Standards Board (FASB) issued authoritative guidance that establishes a framework for measuring fair value under generally accepted accounting principles (GAAP), clarifies the definition of fair value within that framework, and expands disclosures about the use of fair value measurements. The guidance defines a fair value hierarchy that prioritizes the inputs to these valuation techniques used to measure fair value giving preference to quoted prices in active markets (level 1) and the lowest priority to unobservable inputs such as a reporting entity’s own data (level 3). Level 2 inputs include quoted prices for similar assets or liabilities in active markets, quoted prices for identical assets or liabilities in markets that are not active, observable inputs other than quoted prices, such as interest rates and yield curves, and inputs that are derived principally from or corroborated by observable market data by correlation or other means. Available for sale securities classified as level 1 within the valuation hierarchy include U.S. Treasury securities, obligations of U.S. Government-sponsored agencies, and other debt and equity securities. Level 2 classified available for sale securities include mortgage-backed debt securities, collateralized mortgage obligations, and state and municipal bonds. There were no transfers between levels during the year.
The Company adopted the provisions of the guidance for nonfinancial assets and nonfinancial liabilities on January 1, 2009.
94
Table of Contents
HANCOCK HOLDING COMPANY AND SUBSIDIARIES
NOTES TO CONSOLIDATED FINANCIAL STATEMENTS—(Continued)
Note 12. Fair Value of Financial Instruments (continued)
Fair Value of Assets Measured on a Recurring Basis
The following table presents for each of the fair-value hierarchy levels the Company’s financial assets and liabilities that are measured at fair value (in thousands) on a recurring basis at December 31, 2009 and 2008.
| As of December 31, 2009 | |||||||||
| Level 1 | Level 2 | Net Balance | |||||||
| Assets |
|||||||||
| Available for sale securities: |
|||||||||
| Debt securities issued by the U.S. Treasury and other government corporations and agencies |
$ | 143,755 | $ | — | $ | 143,755 | |||
| Debt securities issued by states of the United States and political subdivisions of the states |
— | 191,668 | 191,668 | ||||||
| Corporate debt securities |
16,326 | — | 16,326 | ||||||
| Residential mortgage-backed securities |
— | 1,110,547 | 1,110,547 | ||||||
| Collateralized mortgage obligations |
— | 147,169 | 147,169 | ||||||
| Equity securities |
1,862 | — | 1,862 | ||||||
| Trading securities: |
|||||||||
| Equity securities |
1,635 | — | 1,635 | ||||||
| Short-term investments |
214,771 | — | 214,771 | ||||||
| Loans carried at fair value |
— | 38,021 | 38,021 | ||||||
| Total assets |
$ | 378,349 | $ | 1,487,405 | $ | 1,865,754 | |||
| Liabilities |
|||||||||
| Swaps |
$ | — | $ | 2,209 | $ | 2,209 | |||
| Total Liabilities |
$ | — | $ | 2,209 | $ | 2,209 | |||
| As of December 31, 2008 | |||||||||
| Level 1 | Level 2 | Net Balance | |||||||
| Assets |
|||||||||
| Available for sale securities: |
|||||||||
| Debt securities issued by the U.S. Treasury and other government corporations and agencies |
$ | 238,052 | $ | — | $ | 238,052 | |||
| Debt securities issued by states of the United |
|||||||||
| States and political subdivisions of the states |
— | 152,470 | 152,470 | ||||||
| Corporate debt securities |
22,272 | — | 22,272 | ||||||
| Residential mortgage-backed securities |
— | 1,067,121 | 1,067,121 | ||||||
| Collateralized mortgage obligations |
— | 198,462 | 198,462 | ||||||
| Equity securities |
1,379 | — | 1,379 | ||||||
| Trading securities: |
|||||||||
| Equity securities |
2,201 | — | 2,201 | ||||||
| Short-term investments |
362,895 | — | 362,895 | ||||||
| Loans carried at fair value |
— | 28,248 | 28,248 | ||||||
| Total assets |
$ | 626,799 | $ | 1,446,301 | $ | 2,073,100 | |||
| Liabilities |
|||||||||
| Swaps |
$ | — | $ | 4,123 | $ | 4,123 | |||
| Total Liabilities |
$ | — | $ | 4,123 | $ | 4,123 | |||
95
Table of Contents
HANCOCK HOLDING COMPANY AND SUBSIDIARIES
NOTES TO CONSOLIDATED FINANCIAL STATEMENTS—(Continued)
Note 12. Fair Value of Financial Instruments (continued)
Fair Value of Assets Measured on a Nonrecurring Basis
Certain assets and liabilities are measured at fair value on a nonrecurring basis and, therefore, are not included in the above table. Impaired loans are level 2 assets measured using appraisals from external parties of the collateral less any prior liens or based on recent sales activity for similar assets in the property’s market. Other real estate owned are level 2 properties recorded at the balance of the loan or at estimated fair value less estimated selling costs, whichever is less, at the date acquired. Fair values are determined by sales agreement or appraisal. Inputs include appraisal values on the properties or recent sales activity for similar assets in the property’s market. The following table presents for each of the fair value hierarchy levels the Company’s financial assets that are measured at fair value (in thousands) on a nonrecurring basis at December 31, 2009 and 2008.
| As of December 31, 2009 | |||||||||
| Level 1 | Level 2 | Net Balance | |||||||
| Assets |
|||||||||
| Impaired loans |
$ | — | $ | 122,610 | $ | 122,610 | |||
| Other real estate owned |
— | 13,786 | 13,786 | ||||||
| Total assets |
$ | — | $ | 136,396 | $ | 136,396 | |||
| As of December 31, 2008 | |||||||||
| Level 1 | Level 2 | Net Balance | |||||||
| Assets |
|||||||||
| Impaired loans |
$ | — | $ | 14,787 | $ | 14,787 | |||
| Other real estate owned |
— | 5,195 | 5,195 | ||||||
| Total assets |
$ | — | $ | 19,982 | $ | 19,982 | |||
The following methods and assumptions were used to estimate the fair value regarding disclosures about fair value of financial instruments of each class of financial instruments for which it is practicable to estimate:
Cash, Short-Term Investments and Federal Funds Sold—For those short-term instruments, the carrying amount is a reasonable estimate of fair value.
Securities—Estimated fair values for securities are based on quoted market prices where available. If quoted market prices are not available, estimated fair values are based on market prices of comparable instruments.
Loans, Net of Unearned Income—The fair value of loans is estimated by discounting the future cash flows using the current rates for similar loans with the same remaining maturities.
Accrued Interest Receivable and Accrued Interest Payable—The carrying amounts are a reasonable estimate of their fair values.
Deposits—The guidance requires that the fair value of deposits with no stated maturity, such as noninterest-bearing demand deposits, interest-bearing checking and savings accounts, be assigned fair values equal to amounts payable upon demand (carrying amounts). The fair value of fixed-maturity certificates of deposit is estimated using the rates currently offered for deposits of similar remaining maturities.
Federal Funds Purchased—For these short-term liabilities, the carrying amount is a reasonable estimate of fair value.
96
Table of Contents
HANCOCK HOLDING COMPANY AND SUBSIDIARIES
NOTES TO CONSOLIDATED FINANCIAL STATEMENTS—(Continued)
Note 12. Fair Value of Financial Instruments (continued)
Securities Sold under Agreements to Repurchase, Federal Funds Purchased, and Other Short-Term Borrowing – For these short-term liabilities, the carrying amount is a reasonable estimate of fair value.
Long-Term Notes—Rates currently available to the Company for debt with similar terms and remaining maturities are used to estimate fair value of existing debt. The fair value is estimated by discounting the future contractual cash flows using current market rates at which similar Notes over the same remaining term could be obtained.
Commitments—The fair value of loan commitments and letters of credit approximate the fees currently charged for similar agreements or the estimated cost to terminate or otherwise settle similar obligations. The fees associated with these financial instruments, or the estimated cost to terminate, as applicable are immaterial.
The estimated fair values of the Company’s financial instruments were as follows (in thousands):
| December 31, | ||||||||||||
| 2009 | 2008 | |||||||||||
| Carrying Amount |
Fair Value |
Carrying Amount |
Fair Value | |||||||||
| Financial assets: |
||||||||||||
| Cash, interest-bearing deposits, federal funds sold, and short-term investments |
$ | 1,001,976 | $ | 1,001,976 | $ | 749,191 | $ | 749,191 | ||||
| Securities |
1,612,962 | 1,612,962 | 1,681,957 | 1,681,957 | ||||||||
| Loans, net of unearned income |
5,150,287 | 5,263,246 | 4,271,580 | 4,625,130 | ||||||||
| Accrued interest receivable |
35,468 | 35,468 | 33,067 | 33,067 | ||||||||
| Financial liabilities: |
||||||||||||
| Deposits |
$ | 7,195,812 | $ | 7,241,363 | $ | 5,930,937 | $ | 5,990,883 | ||||
| Federal funds purchased |
250 | 250 | — | — | ||||||||
| Securities sold under agreements to repurchase |
484,457 | 484,457 | 505,932 | 505,932 | ||||||||
| Other short-term borrowings |
30,805 | 30,805 | — | — | ||||||||
| Long-term notes |
671 | 671 | 638 | 638 | ||||||||
| Accrued interest payable |
4,824 | 4,824 | 6,322 | 6,322 | ||||||||
Note 13. Commitments and Contingencies
Lending Related
In the normal course of business, the Company enters into financial instruments, such as commitments to extend credit and letters of credit, to meet the financing needs of its customers. Such instruments are not reflected in the accompanying consolidated financial statements until they are funded and involve, to varying degrees, elements of credit risk not reflected in the consolidated balance sheets. The contract amounts of these instruments reflect the Company’s exposure to credit loss in the event of non-performance by the other party on whose behalf the instrument has been issued. The Company undertakes the same credit evaluation in making commitments and conditional obligations as it does for on-balance sheet instruments and may require collateral or other credit support for off-balance sheet financial instruments. These obligations are summarized below (in thousands):
| December 31, | ||||||
| 2009 | 2008 | |||||
| Commitments to extend credit |
$ | 983,242 | $ | 885,156 | ||
| Letters of credit |
108,736 | 113,274 | ||||
97
Table of Contents
HANCOCK HOLDING COMPANY AND SUBSIDIARIES
NOTES TO CONSOLIDATED FINANCIAL STATEMENTS—(Continued)
Note 13. Commitments and Contingencies (continued)
Approximately $679.0 million and $610.4 million of commitments to extend credit at December 31, 2009 and 2008, respectively, were at variable rates and the remainder was at fixed rates. A commitment to extend credit is an agreement to lend to a customer as long as the conditions established in the agreement have been satisfied. A commitment to extend credit generally has a fixed expiration date or other termination clauses and may require payment of a fee by the borrower. Since commitments often expire without being fully drawn, the total commitment amounts do not necessarily represent future cash requirements of the Company. The Company continually evaluates each customer’s credit worthiness on a case-by-case basis. Occasionally, a credit evaluation of a customer requesting a commitment to extend credit results in the Company obtaining collateral to support the obligation.
Letters of credit are conditional commitments issued by the Company to guarantee the performance of a customer to a third party. The credit risk involved in issuing a letter of credit is essentially the same as that involved in extending a loan. The Company accounts for these commitments under the provisions of the FASB’s authoritative guidance. The liability associated with letters of credit is not material to the Company’s consolidated financial statements. Letters of credit are supported by collateral or borrower guarantee sufficient to cover any draw on the letter that would result in an outstanding loan.
Legal Proceedings
The Company is party to various legal proceedings arising in the ordinary course of business. In the opinion of management, after consultation with legal counsel, each matter is adequately covered by insurance and indemnification, or, if not so covered, is not expected to have a material adverse effect on the financial statements of the Company.
Lease Commitments
Hancock currently has capital and operating leases for buildings and equipment that expire from 2010 to 2048. It is expected that certain leases will be renewed or equipment replaced as leases expire. Certain of these leases have escalation clauses that are being amortized on a straight-line basis over the term of the lease as required by authoritative guidance regarding accounting for leases.
Future minimum lease payments for all non-cancelable capital and operating leases with initial or remaining terms of one year or more consisted of the following at December 31, 2009 (in thousands):
| Capital Leases | Operating Leases | |||||
| 2010 |
$ | 280 | $ | 5,810 | ||
| 2011 |
26 | 3,824 | ||||
| 2012 |
28 | 3,071 | ||||
| 2013 |
31 | 2,333 | ||||
| 2014 |
34 | 2,200 | ||||
| Thereafter |
49 | 17,315 | ||||
| Total minimum lease payments |
$ | 448 | $ | 34,553 | ||
| Amounts representing interest |
83 | |||||
| Present value of net minimum lease payments |
$ | 365 | ||||
Rental expense approximated $4.5 million, $5.7 million, and $6.4 million for the years ended December 31, 2009, 2008, and 2007, respectively. Rental expense is included in net occupancy expense on the consolidated statement of income.
98
Table of Contents
HANCOCK HOLDING COMPANY AND SUBSIDIARIES
NOTES TO CONSOLIDATED FINANCIAL STATEMENTS—(Continued)
Note 14. Other Noninterest Income and Other Noninterest Expense
The components of other noninterest income and other noninterest expense are as follows (in thousands):
| Years Ended December 31, | ||||||||||
| 2009 | 2008 | 2007 | ||||||||
| Other noninterest income: |
||||||||||
| Income from bank owned life insurance |
$ | 5,527 | $ | 5,906 | $ | 4,912 | ||||
| Outsourced check income |
(94 | ) | 284 | 2,288 | ||||||
| Safety deposit box income |
794 | 821 | 794 | |||||||
| Appraisal fee income |
854 | 1,001 | 926 | |||||||
| Other |
8,966 | 5,564 | 5,820 | |||||||
| Total other noninterest income |
$ | 16,047 | $ | 13,576 | $ | 14,740 | ||||
| Other noninterest expense: |
||||||||||
| Postage |
$ | 3,505 | $ | 3,902 | $ | 3,851 | ||||
| Communication |
4,969 | 5,552 | 6,602 | |||||||
| Data processing |
19,043 | 18,432 | 17,585 | |||||||
| Legal and professional services |
12,321 | 12,718 | 15,234 | |||||||
| Ad valorem and franchise taxes |
3,621 | 3,532 | 3,514 | |||||||
| Printing and supplies |
1,911 | 1,833 | 2,252 | |||||||
| Advertising |
5,597 | 6,917 | 7,032 | |||||||
| Regulatory and other fees |
16,391 | 6,935 | 4,433 | |||||||
| Miscellaneous expense |
4,247 | 3,705 | 10,522 | |||||||
| Other expense |
8,810 | 8,182 | 7,208 | |||||||
| Total other noninterest expense |
$ | 80,415 | $ | 71,708 | $ | 78,233 | ||||
Note 15. Income Taxes
Income taxes consisted of the following components (in thousands):
| Years Ended December 31, | |||||||||||
| 2009 | 2008 | 2007 | |||||||||
| Current federal |
$ | 15,816 | $ | 24,603 | $ | 19,150 | |||||
| Current state |
(241 | ) | 2,028 | 1,209 | |||||||
| Total current provision |
15,575 | 26,631 | 20,359 | ||||||||
| Deferred federal |
6,753 | (4,675 | ) | 6,264 | |||||||
| Deferred state |
591 | (337 | ) | 1,296 | |||||||
| Total deferred provision |
7,344 | (5,012 | ) | 7,560 | |||||||
| Total tax expense |
$ | 22,919 | $ | 21,619 | $ | 27,919 | |||||
Deferred income taxes reflect the net tax effects of temporary differences between the carrying amounts of assets and liabilities for financial reporting purposes and the amounts used for income tax reporting purposes.
99
Table of Contents
HANCOCK HOLDING COMPANY AND SUBSIDIARIES
NOTES TO CONSOLIDATED FINANCIAL STATEMENTS—(Continued)
Note 15. Income Taxes (continued)
Significant components of the Company's deferred tax assets and liabilities were as follows (in thousands):
| December 31, | ||||||||
| 2009 | 2008 | |||||||
| Deferred tax assets: |
||||||||
| Minimum pension liability |
$ | 15,066 | $ | 16,004 | ||||
| Allowance for loan losses |
24,549 | 22,792 | ||||||
| Compensation |
8,259 | 8,740 | ||||||
| Capital loss |
1,063 | 1,405 | ||||||
| Federal net operating loss |
123 | 182 | ||||||
| State net operting losses |
1,059 | 1,032 | ||||||
| Other |
1,720 | 1,496 | ||||||
| Gross deferred tax assets |
51,839 | 51,651 | ||||||
| Federal valuation allowance |
(85 | ) | (85 | ) | ||||
| State valuation allowances |
(1,059 | ) | (1,032 | ) | ||||
| Subtotal Valuation allowances |
(1,144 | ) | (1,117 | ) | ||||
| Net deferred tax assets |
50,695 | 50,534 | ||||||
| Deferred tax liabilities: |
||||||||
| Fixed assets & intangibles |
(27,240 | ) | (26,432 | ) | ||||
| Unrealized gain on securities available for sale |
(16,538 | ) | (10,479 | ) | ||||
| Deferred gain |
(7,276 | ) | ||||||
| Other |
(6,757 | ) | (7,804 | ) | ||||
| Gross deferred tax liabilities |
(57,811 | ) | (44,715 | ) | ||||
| Net deferred tax asset (liability) |
$ | (7,116 | ) | $ | 5,819 | |||
At December 31, 2009, the Company had a federal valuation allowance related to a federal net operating loss carryforward and a state valuation allowance related to miscellaneous state net operating losses. The federal net operating loss carryforward will expire in 2011. Other than these items, no valuation allowance related to deferred tax assets has been recorded on December 31, 2009 and 2008, as management believes it is more likely than not that the remaining deferred tax assets will be realized.
The reason for differences in income taxes reported compared to amounts computed by applying the statutory income tax rate of 35% to earnings before income taxes were as follows (in thousands):
| Years Ended December 31, | |||||||||||||||||||||
| 2009 | 2008 | 2007 | |||||||||||||||||||
| Amount | % | Amount | % | Amount | % | ||||||||||||||||
| Taxes computed at statutory rate |
$ | 34,195 | 35 | % | $ | 30,445 | 35 | % | $ | 35,634 | 35 | % | |||||||||
| Increases (decreases) in taxes resulting from: |
|||||||||||||||||||||
| State income taxes, net of federal income tax benefit |
228 | 0 | % | 1,099 | 1 | % | 1,628 | 2 | % | ||||||||||||
| Tax-exempt interest |
(6,703 | ) | -7 | % | (5,827 | ) | -7 | % | (5,072 | ) | -5 | % | |||||||||
| Bank owned life insurance |
(2,097 | ) | -2 | % | (2,159 | ) | -2 | % | (1,807 | ) | -2 | % | |||||||||
| Tax credits |
(5,251 | ) | -5 | % | (3,514 | ) | -4 | % | (3,510 | ) | -3 | % | |||||||||
| Other, net |
2,547 | 2 | % | 1,575 | 2 | % | 1,046 | 1 | % | ||||||||||||
| Income tax expense |
$ | 22,919 | 23 | % | $ | 21,619 | 25 | % | $ | 27,919 | 28 | % | |||||||||
100
Table of Contents
HANCOCK HOLDING COMPANY AND SUBSIDIARIES
NOTES TO CONSOLIDATED FINANCIAL STATEMENTS—(Continued)
Note 15. Income Taxes (continued)
The tax credits available to the Company for the 2009 tax year included the Worker’s Opportunity Tax Credit, the Gulf Tax Credit and the New Markets Tax Credit and the 2008 tax year included the Worker’s Opportunity Tax Credit and the Gulf Tax Credit.
The Company adopted authoritative guidance regarding accounting for uncertainty in income taxes on January 1, 2007 and determined that no adjustment was required to retained earnings due to the adoption of this Interpretation. There were no material uncertain tax positions at December 31, 2009. The Company does not expect that unrecognized tax benefits will significantly increase or decrease within the next 12 months.
It is the Company’s policy to recognize interest and penalties accrued relative to unrecognized tax benefits in income tax expense. As of December 31, 2009, the interest accrued is considered immaterial to the Company’s consolidated balance sheet.
The Company and its subsidiaries file a consolidated U.S. federal income tax return, as well as filing various returns in the states where its banking offices are located. Its filed income tax returns are no longer subject to examination by taxing authorities for years before 2006.
Note 16. Earnings Per Share
Following is a summary of the information used in the computation of earnings per common share (in thousands):
| Years Ended December 31, | |||||||||
| 2009 | 2008 | 2007 | |||||||
| Numerator: |
|||||||||
| Net income to common shareholders |
$ | 74,775 | $ | 65,366 | $ | 73,892 | |||
| Net income allocated to participating securities—basic and diluted |
247 | 221 | 235 | ||||||
| Net income allocated to common shareholders—basic and diluted |
$ | 74,528 | $ | 65,145 | $ | 73,657 | |||
| Denominator: |
|||||||||
| Weighted-average common shares—basic |
32,747 | 31,491 | 32,000 | ||||||
| Dilutive potential common shares |
187 | 392 | 545 | ||||||
| Weighted average common shares—diluted |
32,934 | 31,883 | 32,545 | ||||||
| Earnings per common share: |
|||||||||
| Basic |
$ | 2.28 | $ | 2.07 | $ | 2.30 | |||
| Diluted |
$ | 2.26 | $ | 2.04 | $ | 2.26 | |||
The Company had no shares of anti-dilutive options in 2009, 2008 or 2007.
101
Table of Contents
HANCOCK HOLDING COMPANY AND SUBSIDIARIES
NOTES TO CONSOLIDATED FINANCIAL STATEMENTS—(Continued)
Note 17. Segment Reporting
The Company’s primary segments are divided into the Mississippi (MS), Louisiana (LA), Florida (FL) and Alabama (AL) markets. The activity and assets of Peoples First acquired in December 2009 are included in Mississippi. Each segment offers the same products and services but is managed separately due to different pricing, product demand and consumer markets. The four segments offer commercial, consumer and mortgage loans and deposit services. In all tables, the column “Other” includes additional consolidated subsidiaries of the Company: Hancock Investment Services, Inc., Hancock Insurance Agency, Inc., Harrison Finance Company, Magna Insurance Company and three real estate corporations owning land and buildings that house bank branches and other facilities. Following is selected information for the Company’s segments (in thousands):
| Year Ended | ||||||||||||||||||||||||
| December 31, 2009 | ||||||||||||||||||||||||
| MS | LA | FL | AL | Other | Eliminations | Consolidated | ||||||||||||||||||
| (In thousands) | ||||||||||||||||||||||||
| Interest income |
$ | 142,485 | $ | 138,767 | $ | 16,338 | $ | 8,291 | $ | 23,931 | $ | (6,085 | ) | $ | 323,727 | |||||||||
| Interest expense |
58,418 | 29,772 | 5,042 | 2,750 | 4,942 | (5,624 | ) | 95,300 | ||||||||||||||||
| Net interest income |
84,067 | 108,995 | 11,296 | 5,541 | 18,989 | (461 | ) | 228,427 | ||||||||||||||||
| Provision for loan losses |
14,573 | 18,398 | 7,780 | 7,160 | 6,679 | — | 54,590 | |||||||||||||||||
| Noninterest income |
86,691 | 42,321 | 1,664 | 1,754 | 25,177 | (280 | ) | 157,327 | ||||||||||||||||
| Depreciation and amortization |
10,662 | 3,467 | 508 | 315 | 597 | — | 15,549 | |||||||||||||||||
| Other noninterest expense |
93,988 | 81,850 | 7,687 | 5,185 | 29,310 | (99 | ) | 217,921 | ||||||||||||||||
| Income before income taxes |
51,535 | 47,601 | (3,015 | ) | (5,365 | ) | 7,580 | (642 | ) | 97,694 | ||||||||||||||
| Income tax expense (benefit) |
13,390 | 12,866 | (2,281 | ) | (1,960 | ) | 904 | — | 22,919 | |||||||||||||||
| Net income (loss) |
$ | 38,145 | $ | 34,735 | $ | (734 | ) | $ | (3,405 | ) | $ | 6,676 | $ | (642 | ) | $ | 74,775 | |||||||
| Total assets |
$ | 5,258,350 | $ | 2,890,341 | $ | 351,686 | $ | 179,701 | $ | 1,114,826 | $ | (1,097,821 | ) | $ | 8,697,083 | |||||||||
| Total interest income from affiliates |
$ | 6,075 | $ | — | $ | 9 | $ | 1 | $ | — | $ | (6,085 | ) | $ | — | |||||||||
| Total interest income from external customers |
$ | 136,410 | $ | 138,767 | $ | 16,329 | $ | 8,290 | $ | 23,931 | $ | — | $ | 323,727 | ||||||||||
| Year Ended December 31, 2008 | ||||||||||||||||||||||||
| MS | LA | FL | AL | Other | Eliminations | Consolidated | ||||||||||||||||||
| (In thousands) | ||||||||||||||||||||||||
| Interest income |
$ | 158,288 | $ | 145,546 | $ | 9,717 | $ | 5,088 | $ | 26,574 | $ | (9,776 | ) | $ | 335,437 | |||||||||
| Interest expense |
73,477 | 48,813 | 5,355 | 2,508 | 5,164 | (9,315 | ) | 126,002 | ||||||||||||||||
| Net interest income |
84,811 | 96,733 | 4,362 | 2,580 | 21,410 | (461 | ) | 209,435 | ||||||||||||||||
| Provision for loan losses |
11,922 | 15,715 | 2,419 | 1,393 | 5,336 | — | 36,785 | |||||||||||||||||
| Noninterest income |
55,640 | 46,231 | 1,633 | 702 | 23,606 | (34 | ) | 127,778 | ||||||||||||||||
| Depreciation and amortization |
10,778 | 3,555 | 484 | 377 | 567 | — | 15,761 | |||||||||||||||||
| Other noninterest expense |
87,318 | 68,340 | 6,894 | 4,634 | 30,613 | (117 | ) | 197,682 | ||||||||||||||||
| Income before income taxes |
30,433 | 55,354 | (3,802 | ) | (3,122 | ) | 8,500 | (378 | ) | 86,985 | ||||||||||||||
| Income tax expense (benefit) |
6,627 | 14,854 | (1,953 | ) | (1,163 | ) | 3,254 | — | 21,619 | |||||||||||||||
| Net income (loss) |
$ | 23,806 | $ | 40,500 | $ | (1,849 | ) | $ | (1,959 | ) | $ | 5,246 | $ | (378 | ) | $ | 65,366 | |||||||
| Total assets |
$ | 3,795,890 | $ | 3,008,320 | $ | 367,134 | $ | 155,862 | $ | 871,758 | $ | (1,031,710 | ) | $ | 7,167,254 | |||||||||
| Total interest income from affiliates |
$ | 9,754 | $ | 8 | $ | 14 | $ | — | $ | — | $ | (9,776 | ) | $ | — | |||||||||
| Total interest income from external customers |
$ | 148,534 | $ | 145,538 | $ | 9,703 | $ | 5,088 | $ | 26,574 | $ | — | $ | 335,437 | ||||||||||
102
Table of Contents
HANCOCK HOLDING COMPANY AND SUBSIDIARIES
NOTES TO CONSOLIDATED FINANCIAL STATEMENTS—(Continued)
Note 17. Segment Reporting (continued)
| Year Ended | |||||||||||||||||||||||||
| December 31, 2007 | |||||||||||||||||||||||||
| MS | LA | FL | AL | Other | Eliminations | Consolidated | |||||||||||||||||||
| (In thousands) | |||||||||||||||||||||||||
| Interest income |
$ | 179,775 | $ | 148,708 | $ | 9,583 | $ | 1,238 | $ | 25,769 | $ | (19,376 | ) | $ | 345,697 | ||||||||||
| Interest expense |
79,189 | 66,699 | 5,023 | 462 | 7,779 | (18,916 | ) | 140,236 | |||||||||||||||||
| Net interest income |
100,586 | 82,009 | 4,560 | 776 | 17,990 | (460 | ) | 205,461 | |||||||||||||||||
| Provision for (reversal of) loan losses |
(22 | ) | 3,744 | 427 | 400 | 3,044 | — | 7,593 | |||||||||||||||||
| Noninterest income |
53,787 | 37,035 | 883 | 56 | 28,967 | (42 | ) | 120,686 | |||||||||||||||||
| Depreciation and amortization |
9,665 | 3,323 | 452 | 54 | 547 | — | 14,041 | ||||||||||||||||||
| Other noninterest expense |
89,626 | 70,984 | 5,610 | 1,567 | 36,509 | (1,594 | ) | 202,702 | |||||||||||||||||
| Income before income taxes |
55,104 | 40,993 | (1,046 | ) | (1,189 | ) | 6,857 | 1,092 | 101,811 | ||||||||||||||||
| Income tax expense (benefit) |
15,788 | 10,458 | (603 | ) | (399 | ) | 2,675 | — | 27,919 | ||||||||||||||||
| Net income (loss) |
$ | 39,316 | $ | 30,535 | $ | (443 | ) | $ | (790 | ) | $ | 4,182 | $ | 1,092 | $ | 73,892 | |||||||||
| Total assets |
$ | 3,351,986 | $ | 2,512,200 | $ | 168,790 | $ | 48,619 | $ | 815,011 | $ | (840,627 | ) | $ | 6,055,979 | ||||||||||
| Total interest income from affiliates |
$ | 19,327 | $ | — | $ | — | $ | 49 | $ | — | $ | (19,376 | ) | $ | — | ||||||||||
| Total interest income from external customers |
$ | 160,448 | $ | 148,708 | $ | 9,583 | $ | 1,189 | $ | 25,769 | $ | — | $ | 345,697 | |||||||||||
The Company allocated administrative charges among its Louisiana, Florida, Alabama and Other segments and its Mississippi segment and the Parent Company. This allocation was based on an analysis of costs for 2008. The administrative charges allocated to the Louisiana segment were $22.4 million in 2009, $18.9 million in 2008, and $18.0 million in 2007. The Florida segment received $0.7 million in allocated administrative charges in 2009, $0.3 million in 2008, and $0.2 million in 2007. The administrative charges allocated to the Alabama segment were $0.2 in 2009, $0.05 million in 2008, and $0 in 2007. The Other segment’s allocated charges were $2.6 million in 2009, $1.2 million in 2008 and $1.0 million in 2007. The aforementioned administrative charges were allocated from the Mississippi segment ($25.8 million in 2009, $20.3 million in 2008, and $19.2 million in 2007). Subsidiaries of the Mississippi segment were included in the cost allocation process beginning in 2004. Administrative charges allocated from the Parent Company were $0.1 million in 2009, $0.1 million in 2008 and $0.1 million in 2007.
Goodwill and other intangible assets assigned to the Mississippi segment totaled approximately $24.6 million, of which $12.1 million represented goodwill and $12.5 million represented core deposit intangibles at December 31, 2009. At December 31, 2008, goodwill and other intangible assets assigned to the Mississippi segment totaled approximately $13.1 million, of which $12.1 million represented goodwill and $1.0 million represented core deposit intangibles. The related core deposit amortization was approximately $0.4 million in 2009, $0.4 million in 2008, and $0.4 million in 2007.
Goodwill and other intangible assets assigned to the Louisiana segment totaled approximately $36.1 million, of which $33.8 million represented goodwill and $2.3 million represented core deposit intangibles at December 31, 2009. Goodwill and other intangible assets assigned to the Louisiana segment totaled approximately $36.7 million, of which $33.8 million represented goodwill and $2.9 million represented core deposit intangibles at December 31, 2008. The related core deposit amortization was approximately $0.6 million in 2009, $0.6 million in 2008, and $0.7 million in 2007.
Goodwill and other intangible assets assigned to the Florida segment totaled approximately $11.8 million, of which $11.3 million represented goodwill and $0.5 million represented core deposit intangibles, at December 31, 2009. At December 31, 2008, goodwill and other intangible assets assigned to the Florida segment totaled approximately $11.9 million, of which $11.3 million represented goodwill and $0.6 million represented core deposit intangibles. The related core deposit amortization was approximately $0.1 million in 2009, $0.1 million in 2008 and $0.1 million in 2007.
103
Table of Contents
HANCOCK HOLDING COMPANY AND SUBSIDIARIES
NOTES TO CONSOLIDATED FINANCIAL STATEMENTS—(Continued)
Note 17. Segment Reporting (continued)
Other intangible assets are also assigned to subsidiaries that are included in the “Other” category in the table above and totaled $6.3 million at December 31, 2009 and $6.7 million at December 31, 2008. At December 31, 2009, those intangibles consist of goodwill, $5.1 million; value of insurance expirations, approximately $1.2 million; non-compete agreements, approximately $.01 million and trade name of $.01 million.
The Company performed a fair value based impairment test of goodwill and determined that the fair values of these reporting units exceeded their carrying values at December 2009, 2008 and 2007. No impairment loss, therefore, was recorded.
Note 18. Condensed Parent Company Information
The following condensed financial information reflects the accounts and transactions of Hancock Holding Company (parent company only) for the dates indicated (in thousands):
Condensed Balance Sheets
| December 31, | ||||||
| 2009 | 2008 | |||||
| Assets: |
||||||
| Cash |
$ | 306 | $ | 4,053 | ||
| Investment in bank subsidiaries |
816,033 | 592,275 | ||||
| Investment in non-bank subsidiaries |
20,591 | 12,807 | ||||
| Due from subsidiaries and other assets |
1,526 | 1,115 | ||||
| $ | 838,456 | $ | 610,250 | |||
| Liabilities and Stockholders’ Equity: |
||||||
| Due to subsidiaries |
$ | 139 | $ | 198 | ||
| Other liabilities |
654 | 553 | ||||
| Stockholders’ equity |
837,663 | 609,499 | ||||
| $ | 838,456 | $ | 610,250 | |||
104
Table of Contents
HANCOCK HOLDING COMPANY AND SUBSIDIARIES
NOTES TO CONSOLIDATED FINANCIAL STATEMENTS—(Continued)
Note 18. Condensed Parent Company Information (continued)
Condensed Statements of Income
| Years Ended December 31, | ||||||||||||
| 2009 | 2008 | 2007 | ||||||||||
| Operating Income |
||||||||||||
| From subsidiaries |
||||||||||||
| Dividends received from bank subsidiaries |
$ | 36,700 | $ | 43,700 | $ | 90,400 | ||||||
| Dividends received from non-bank subsidiaries |
— | — | — | |||||||||
| Equity in earnings of subsidiaries greater than (less than) dividends received |
38,161 | 21,646 | (18,214 | ) | ||||||||
| Total operating income |
74,861 | 65,346 | 72,186 | |||||||||
| Other (expense) income |
(178 | ) | (19 | ) | 1,473 | |||||||
| Income tax provision (benefit) |
(92 | ) | (39 | ) | (233 | ) | ||||||
| Net income |
$ | 74,775 | $ | 65,366 | $ | 73,892 | ||||||
Condensed Statements of Cash Flows
| Years Ended December 31, | ||||||||||||
| 2009 | 2008 | 2007 | ||||||||||
| Cash flows from operating activities—principally dividends received from subsidiaries |
$ | 36,743 | $ | 35,493 | $ | 93,886 | ||||||
| Cash flows from investing activities—principally contribution of capital to subsidiary |
(181,798 | ) | (20,500 | ) | (10,000 | ) | ||||||
| Net cash used by investing activities |
(181,798 | ) | (20,500 | ) | (10,000 | ) | ||||||
| Cash flows from financing activities: |
||||||||||||
| Dividends paid to stockholders |
(32,011 | ) | (30,453 | ) | (30,957 | ) | ||||||
| Stock transactions, net |
173,319 | 15,670 | (55,755 | ) | ||||||||
| Net cash used by financing activities |
141,308 | (14,783 | ) | (86,712 | ) | |||||||
| Net increase (decrease) in cash |
(3,747 | ) | 210 | (2,826 | ) | |||||||
| Cash, beginning of year |
4,053 | 3,843 | 6,669 | |||||||||
| Cash, end of year |
$ | 306 | $ | 4,053 | $ | 3,843 | ||||||
105
Table of Contents
| ITEM 9. | CHANGES IN AND DISAGREEMENTS WITH ACCOUNTANTS ON ACCOUNTING AND FINANCIAL DISCLOSURE |
Effective as of January 1, 2009, the Board of Directors of Hancock Holding Company (“the Company”) appointed PricewaterhouseCoopers, a firm of independent certified public accountants, as auditors for the fiscal year ending December 31, 2009, and until their successors are selected. The decision to change auditors was approved by the Audit Committee of the Company’s Board of Directors during its December, 2008 meeting.
The Company has been advised that neither the firm nor any of its partners has any direct or any material indirect financial interest in the securities of the Company or any of its subsidiaries, except as auditors and consultants on accounting procedures and tax matters.
Additionally, during the two fiscal years ended December 31, 2008 and 2007 and through the subsequent period through the current period, there were no consultations between the Company and PricewaterhouseCoopers regarding: (i) the application of accounting principles to a specified transaction, either completed or proposed; or the type of audit opinion that might be rendered on the Company’s financial statements and either a written report was provided to the Company or oral advice was provided that the new accountant concluded was an important factor considered by the Company in reaching a decision as to the accounting, auditing, or financial reporting issue (ii) any matter that was the subject of a disagreement under Item 304(a)(1)(iv) of Regulation S-K, or a reportable event under Item 304(a)(1)(v) of Regulation S-K; or (iii) any other matter.
Although not required to do so, the Company’s Board of Directors chose to submit its appointment of PricewaterhouseCoopers for ratification by the Company’s shareholders. This matter was submitted to the Company’s shareholders for ratification and approved during the Company’s annual meeting held on March 26, 2009.
No Adverse Opinion or Disagreement
The audit reports of KPMG LLP on the consolidated financial statements of the Company as of and for the years ended December 31, 2008 and 2007 did not contain an adverse opinion or disclaimer of opinion, and were not qualified or modified as to uncertainty, audit scope or accounting principles, except as follows: KPMG LLP’s report on the consolidated financial statements of Hancock Holding Company as of and for the years ended December 31, 2008 and 2007, contained a separate paragraph stating that “As discussed in Note 1 to the consolidated financial statements, the Company changed its method of accounting for defined benefit pension postretirement benefit plans effective December 31, 2006”, and additionally as of and for the year ended December 31, 2007, contained a separate paragraph stating that “As discussed in Note 1 to the consolidated financial statements, the Company changed its method of accounting for share based payments and evaluating prior year misstatements effective January 1, 2006”. The audit reports of KPMG LLP on the effectiveness of internal control over financial reporting as of December 31, 2008 and 2007 did not contain an adverse opinion or disclaimer of opinion, and was not qualified or modified as to uncertainty, audit scope or accounting principles.
In connection with the audits of the two fiscal years ended December 31, 2008 and 2007 and the subsequent period through the current period, there were no: (1) disagreements with KPMG LLP on any matter of accounting principles or practices, financial statement disclosure, or auditing scope or procedures, which disagreements, if not resolved to their satisfaction, would have caused them to make reference in connection with their opinion to the subject matter of the disagreement, or (2) reportable events.
The Company has agreed to indemnify and hold KPMG harmless against and from any and all legal costs and expenses incurred by KPMG in successful defense of any legal action or proceeding that arises as a result of KPMG’s consent to the inclusion or incorporation by reference of its audit report on the Company’s past consolidated financial statements included or incorporated by reference in the Registration Statements on Form S-8 and Form S-3.
106
Table of Contents
| ITEM 9A. | CONTROLS AND PROCEDURES |
Evaluation of Disclosure Controls and Procedures
As defined by the Securities and Exchange Commission in Exchange Act Rules 13a-14(c) and 15d-14(c), a company’s “disclosure controls and procedures” means controls and other procedures of an issuer that are designed to ensure that information required to be disclosed by the issuer in the reports that it files or submits under the Exchange Act is recorded, processed, summarized and reported, within time periods specified in the Commission’s rules and forms.
As of December 31, 2009, (the “Evaluation Date”), our Chief Executive Officers and Chief Financial Officer have evaluated the effectiveness of our disclosure controls and procedures as defined in the Exchange Act Rules. Based on their evaluation, our Chief Executive Officers and Chief Financial Officer have concluded Hancock’s disclosure controls and procedures are sufficiently effective to ensure that material information relating to us and required to be disclosed by us in the reports that we file or submit under the Exchange Act is recorded, processed, summarized and reported within the time periods specified in the Commission’s rules and forms.
Internal Control over Financial Reporting
The management of Hancock Holding Company has prepared the consolidated financial statements and other information in our Annual Report in accordance with accounting principles generally accepted in the United States of America and is responsible for its accuracy. The financial statements necessarily include amounts that are based on management’s best estimates and judgments. In meeting its responsibility, management relies on internal accounting and related control systems. The internal control systems are designed to ensure that transactions are properly authorized and recorded in our financial records and to safeguard our assets from material loss or misuse. Such assurance cannot be absolute because of inherent limitations in any internal control system.
Management is responsible for establishing and maintaining the adequate internal control over financial reporting, as such term is defined in the Exchange Act Rules 13 – 15(f). Under the supervision and with the participation of management, including our principal executive officers and principal financial officer, we conducted an evaluation of the effectiveness of internal control over financial reporting based on the framework in Internal Control – Integrated Framework issued by the Committee of Sponsoring Organizations of the Treadway Commission. Management also conducted an assessment of requirements pertaining to Section 112 of the Federal Deposit Insurance Corporation Improvement Act (FDICIA). This section relates to management’s evaluation of internal control over financial reporting including controls over the preparation of the schedules equivalent to the basic financial statements and compliance with laws and regulations. Our evaluation included a review of the documentation of controls, evaluations of the design of the internal control system and tests of the effectiveness of internal controls.
Based on our evaluation under the framework in Internal Control – Integrated Framework, management concluded that internal control over financial reporting was effective as of December 31, 2009. PricewatershouseCoopers LLP, under Auditing Standard No. 5, does not express an opinion on management’s assessment as occurred under Auditing Standard No. 2. Under Auditing Standard No. 5 management is responsible for maintaining effective internal control over financial reporting and for its assessment of the effectiveness of internal control over financial reporting. PricewatershouseCoopers’ responsibility is to express an opinion on the effectiveness of the Company’s internal control over financial reporting based on their audit.
| ITEM 9B. | OTHER INFORMATION |
None
107
Table of Contents
PART III
| ITEM 10. | DIRECTORS, EXECUTIVE OFFICERS AND CORPORATE GOVERNANCE |
Pursuant to General Instruction G (3), information on directors and executive officers of the Registrant will be incorporated by reference from the Company’s Definitive Proxy Statement for the annual meeting to be held on March 17, 2010.
| ITEM 11. | EXECUTIVE COMPENSATION |
Pursuant to General Instructions G (3), information on executive compensation will be incorporated by reference from the Company’s Definitive Proxy Statement for the annual meeting to be held on March 17, 2010.
| ITEM 12. | SECURITY OWNERSHIP OF CERTAIN BENEFICIAL OWNERS AND MANAGEMENT AND RELATED STOCKHOLDER MATTERS |
Pursuant to General Instructions G (3), information on security ownership of certain beneficial owners and management will be incorporated by reference from the Company’s Definitive Proxy Statement for the annual meeting to be held on March 17, 2010.
| ITEM 13. | CERTAIN RELATIONSHIPS AND RELATED TRANSACTIONS , AND DIRECTOR INDEPENDENCE |
Pursuant to General Instructions G (3), information on certain relationships and related transactions will be incorporated by reference from the Company’s Definitive Proxy Statement for the annual meeting to be held on March 17, 2010.
| ITEM 14. | PRINCIPAL ACCOUNTANT FEES AND SERVICES |
Pursuant to General Instructions G (3), information on principal accountant fees and services will be incorporated by reference from the Company’s Definitive Proxy Statement for the annual meeting to be held on March 17, 2010.
PART IV
| ITEM 15. | EXHIBITS, FINANCIAL STATEMENT SCHEDULES |
| (a) | The following documents are filed as part of this report: |
| 1. | The following consolidated financial statements of Hancock Holding Company and subsidiaries are filed as part of this report under Item 8 – Financial Statements and Supplementary Data: |
Consolidated balance sheets – December 31, 2009 and 2008
Consolidated statements of income – Years ended December 31, 2009, 2008, and 2007
Consolidated statements of stockholders’ equity – Years ended December 31, 2009, 2008, and 2007
Consolidated statements of cash flows –Years ended December 31, 2009, 2008, and 2007
Notes to consolidated financial statements – December 31, 2009 (pages 65 to 105)
| 2. | Financial schedules required to be filed by Item 8 of this form, and by Item 15(d) below: |
The schedules to the consolidated financial statements set forth by Article 9 of Regulation S-X are not required under the related instructions or are inapplicable and therefore have been omitted.
| 3. | Exhibits required to be filed by Item 601 of Regulation S-K, and by Item 15(b) below. |
| (b) | Exhibits: |
All other financial statements and schedules are omitted as the required information is inapplicable or the required information is presented in the consolidated financial statements or related notes.
108
Table of Contents
(a) 3. Exhibits:
| Exhibit |
Description | |
| 2.1 | Agreement and Plan of Merger between Hancock Holding Company and Lamar Capital Corporation dated February 21, 2001 (Appendix C to the Prospectus contained in the S-4 Registration Statement 333-60280 filed on May 4, 2001 and incorporated by reference herein). | |
| 3.1 | Amended and Restated Articles of Incorporation dated November 8, 1990 (filed as Exhibit 3.1 to the Registrant’s Form 10-K for the year ended December 31, 1990 and incorporated herein by reference). | |
| 3.2 | Amended and Restated Bylaws dated November 8, 1990 (filed as Exhibit 3.2 to the Registrant’s Form 10-K for the year ended December 31, 1990 and incorporated herein by reference). | |
| 3.3 | Articles of Amendment to the Articles of Incorporation of Hancock Holding Company, dated October 16, 1991 (filed as Exhibit 4.1 to the Registrant’s Form 10-Q for the quarter ended September 30, 1991). | |
| 3.4 | Articles of Correction, filed with Mississippi Secretary of State on November 15, 1991 (filed as Exhibit 4.2 to the Registrant’s Form 10-Q for the quarter ended September 30, 1991). | |
| 3.5 | Articles of Amendment to the Articles of Incorporation of Hancock Holding Company, adopted February 13, 1992 (filed as Exhibit 3.5 to the Registrant’s Form 10-K for the year ended December 31, 1992 and incorporated herein by reference). | |
| 3.6 | Articles of Correction, filed with Mississippi Secretary of State on March 2, 1992 (filed as Exhibit 3.6 to the Registrant’s Form 10-K for the year ended December 31, 1992 and incorporated herein by reference). | |
| 3.7 | Articles of Amendment to the Articles of Incorporation adopted February 20, 1997 (filed as Exhibit 3.7 to the Registrant’s Form 10-K for the year ended December 31, 1996 and incorporated herein by reference). | |
| 3.8 | Articles of Amendment to the Articles of Incorporation adopted March 29, 2007 (filed as Exhibit 3.8 to the Registrant’s Form 10-K for the year ended December 31, 2008 and incorporated herein by reference). | |
| 4.1 | Specimen stock certificate (reflecting change in par value from $10.00 to $3.33, effective March 6, 1989) (filed as Exhibit 4.1 to the Registrant’s Form 10-Q for the quarter ended March 31, 1989 and incorporated herein by reference). | |
| 4.2 | By executing this Form 10-K, the Registrant hereby agrees to deliver to the Commission upon request copies of instruments defining the rights of holders of long-term debt of the Registrant or its consolidated subsidiaries or its unconsolidated subsidiaries for which financial statements are required to be filed, where the total amount of such securities authorized there under does not exceed 10 percent of the total assets of the Registrant and its subsidiaries on a consolidated basis. | |
| *10.1 | 1996 Long Term Incentive Plan (filed as Exhibit 10.1 to the Registrant’s Form 10-K for the year ended December 31, 1995, and incorporated herein by reference). | |
| *10.2 | Description of Hancock Bank Executive Supplemental Reimbursement Plan, as amended (filed as Exhibit 10.2 to the Registrant’s Form 10-K for the year ended December 31, 1996, and incorporated herein by reference). | |
| *10.3 | Description of Hancock Bank Automobile Plan (filed as Exhibit 10.3 to the Registrant’s Form 10-K for the year ended December 31, 1996, and incorporated herein by reference). | |
| *10.4 | Description of Deferred Compensation Arrangement for Directors (filed as Exhibit 10.4 to the Registrant’s Form 10-K for the year ended December 31, 1996, and incorporated herein by reference). | |
109
Table of Contents
| *10.5 | Hancock Holding Company 2005 Long-Term Incentive Plan, filed as Appendix “A” to the Company’s Definitive Proxy Statement filed with the Commission on February 28, 2005 and incorporated herein by reference. | |
| *10.6 | Hancock Holding Company Nonqualified Deferred Compensation Plan, filed as Exhibit 99.1 to the Company’s Current Report on Form 8-K filed with the Commission on December 21, 2005 and incorporated herein by reference. | |
| 10.7 | Shareholder Rights Agreement dated as of February 21, 1997, between Hancock Holding Company and Hancock Bank, as Rights Agent as extended by the Company, attached as Exhibit 1 to Form 8-A12G filed with the Commission on February 27, 1997, as extended by Amendment No. 1 filed with the Commission as Exhibit 4.1 to Form 8-K filed with the Commission on February 20, 2007, both of which are incorporated herein by reference. | |
| 10.8 | Purchase and Assumption Agreement (“Agreement”) with the Federal Deposit Insurance Corporation, Receiver of Peoples First Community Bank, Panama City Florida (“PCFB”) and the Federal Deposit Insurance Corporation acting in its corporate capacity (“FDIC”) | |
| 21 | Subsidiaries of Hancock Holding Company. | |
| 22 | Proxy Statement for the Registrant’s Annual Meeting of Shareholders on March 17, 2010 (deemed “filed” for the purposes of this Form 10-K only for those portions which are specifically incorporated herein by reference). | |
| 23.1 | Consent of PricewaterhouseCoopers LLP. | |
| 23.2 | Consent of KPMG LLP. | |
| 31.1 | Certification of Chief Executive Officers pursuant to Rule 13a-14(a) and Rule 15d-14(a) of the Securities Exchange Act, as amended. | |
| 31.2 | Certification of Chief Financial Officer pursuant to Rule 13a-14(a) and Rule 15d-14(a) of the Securities Exchange Act, as amended. | |
| 32.1 | Certification of Chief Executive Officers Pursuant to 18 U.S.C. 1350, as adopted pursuant to Section 906 of the Sarbanes-Oxley Act of 2002. | |
| 32.2 | Certification of Chief Financial Officer Pursuant to 18 U.S.C. 1350, as adopted pursuant to Section 906 of the Sarbanes-Oxley Act of 2002. | |
| * | Compensatory plan or arrangement. |
110
Table of Contents
SIGNATURES
Pursuant to the requirements of Section 13 or 15(d) of the Securities Exchange Act of 1934, the Registrant has duly caused this report to be signed on its behalf by the undersigned, thereunto duly authorized.
| HANCOCK HOLDING COMPANY | ||||
| Registrant | ||||
| February 17, 2010 | By: |
/S/ CARL J. CHANEY | ||
| Date |
Carl J. Chaney | |||
| President & Chief Executive Officer | ||||
| Director | ||||
| February 17, 2010 |
||||
| Date |
By: |
/S/ JOHN M. HAIRSTON | ||
| John M. Hairston | ||||
| Chief Executive Officer & Chief Operating Officer | ||||
| Director | ||||
| February 17, 2010 |
||||
| Date |
By: |
/S/ MICHAEL M. ACHARY | ||
| Michael M. Achary | ||||
| Chief Financial Officer | ||||
Pursuant to the requirements of the Securities Exchange Act of 1934, this report has been signed below by the following persons on behalf of the Registrant and in the capacities and on the dates indicated.
| /S/ JAMES B. ESTABROOK, JR |
Chairman of the Board, |
February 17, 2010 | ||
| James B. Estabrook, Jr. | Director |
|||
| /S/ ALTON G. BANKSTON |
Director |
February 17, 2010 | ||
| Alton G. Bankston | ||||
| /S/ FRANK E. BERTUCCI |
Director |
February 17, 2010 | ||
| Frank E. Bertucci | ||||
| /S/ DON P. DESCANT |
Director |
February 17, 2010 | ||
| Don P. Descant | ||||
| /S/ JERRY LEVENS |
Director |
February 17, 2010 | ||
| Jerry Levens | ||||
| /S/ JAMES H. HORNE |
Director |
February 17, 2010 | ||
| James H. Horne | ||||
Table of Contents
(signatures continued)
| /S/ JOHN H. PACE |
Director |
February 17, 2010 | ||
| John H. Pace | ||||
| /S/ CHRISTINE L. PICKERING |
Director |
February 17, 2010 | ||
| Christine L. Pickering | ||||
| /S/ ROBERT W. ROSEBERRY |
Director |
February 17, 2010 | ||
| Robert W. Roseberry | ||||
| /S/ ANTHONY J. TOPAZI |
Director |
February 17, 2010 | ||
| Anthony J. Topazi | ||||
| /S/ RANDY HANNA |
Director |
February 17, 2010 | ||
| Randy Hanna | ||||
| /S/ THOMAS OLINDE |
Director |
February 17, 2010 | ||
| Thomas Olinde | ||||
Table of Contents
EXHIBIT INDEX
| Exhibit Number |
Description | |
| 2.1 | Agreement and Plan of Merger between Hancock Holding Company and Lamar Capital Corporation dated February 21, 2001 (Appendix C to the Prospectus contained in the S-4 Registration Statement 333-60280 filed on May 4, 2001 and incorporated by reference herein). | |
| 3.1 | Amended and Restated Articles of Incorporation dated November 8, 1990 (filed as Exhibit 3.1 to the Registrant’s Form 10-K for the year ended December 31, 1990 and incorporated herein by reference). | |
| 3.2 | Amended and Restated Bylaws dated November 8, 1990 (filed as Exhibit 3.2 to the Registrant’s Form 10-K for the year ended December 31, 1990 and incorporated herein by reference). | |
| 3.3 | Articles of Amendment to the Articles of Incorporation of Hancock Holding Company, dated October 16, 1991 (filed as Exhibit 4.1 to the Registrant’s Form 10-Q for the quarter ended September 30, 1991). | |
| 3.4 | Articles of Correction, filed with Mississippi Secretary of State on November 15, 1991 (filed as Exhibit 4.2 to the Registrant’s Form 10-Q for the quarter ended September 30, 1991). | |
| 3.5 | Articles of Amendment to the Articles of Incorporation of Hancock Holding Company, adopted February 13, 1992 (filed as Exhibit 3.5 to the Registrant’s Form 10-K for the year ended December 31, 1992 and incorporated herein by reference). | |
| 3.6 | Articles of Correction, filed with Mississippi Secretary of State on March 2, 1992 (filed as Exhibit 3.6 to the Registrant’s Form 10-K for the year ended December 31, 1992 and incorporated herein by reference). | |
| 3.7 | Articles of Amendment to the Articles of Incorporation adopted February 20, 1997 (filed as Exhibit 3.7 to the Registrant’s Form 10-K for the year ended December 31, 1996 and incorporated herein by reference). | |
| 3.8 | Articles of Amendment to the Articles of Incorporation adopted March 29, 2007 (filed as Exhibit 3.8 to the Registrant’s Form 10-K for the year ended December 31, 2008 and incorporated herein by reference). | |
| 4.1 | Specimen stock certificate (reflecting change in par value from $10.00 to $3.33, effective March 6, 1989) (filed as Exhibit 4.1 to the Registrant’s Form 10-Q for the quarter ended March 31, 1989 and incorporated herein by reference). | |
| 4.2 | By executing this Form 10-K, the Registrant hereby agrees to deliver to the Commission upon request copies of instruments defining the rights of holders of long-term debt of the Registrant or its consolidated subsidiaries or its unconsolidated subsidiaries for which financial statements are required to be filed, where the total amount of such securities authorized there under does not exceed 10 percent of the total assets of the Registrant and its subsidiaries on a consolidated basis. | |
Table of Contents
| *10.1 | 1996 Long Term Incentive Plan (filed as Exhibit 10.1 to the Registrant’s Form 10-K for the year ended December 31, 1995, and incorporated herein by reference). | |
| *10.2 | Description of Hancock Bank Executive Supplemental Reimbursement Plan, as amended (filed as Exhibit 10.2 to the Registrant’s Form 10-K for the year ended December 31, 1996, and incorporated herein by reference). | |
| *10.3 | Description of Hancock Bank Automobile Plan (filed as Exhibit 10.3 to the Registrant’s Form 10-K for the year ended December 31, 1996, and incorporated herein by reference). | |
| *10.4 | Description of Deferred Compensation Arrangement for Directors (filed as Exhibit 10.4 to the Registrant’s Form 10-K for the year ended December 31, 1996, and incorporated herein by reference). | |
| *10.5 | Hancock Holding Company 2005 Long-Term Incentive Plan, filed as Appendix “A” to the Company’s Definitive Proxy Statement filed with the Commission on February 28, 2005 and incorporated herein by reference. | |
| *10.6 | Hancock Holding Company Nonqualified Deferred Compensation Plan, filed as Exhibit 99.1 to the Company’s Current Report on Form 8-K filed with the Commission on December 21, 2005 and incorporated herein by reference. | |
| 10.7 | Shareholder Rights Agreement dated as of February 21, 1997, between Hancock Holding Company and Hancock Bank, as Rights Agent as extended by the Company, attached as Exhibit 1 to Form 8-A12G filed with the Commission on February 27, 1997, as extended by Amendment No. 1 filed with the Commission as Exhibit 4.1 to Form 8-K filed with the Commission on February 20, 2007, both of which are incorporated herein by reference. | |
| 10.8 | Purchase and Assumption Agreement (“Agreement”) with the Federal Deposit Insurance Corporation, Receiver of Peoples First Community Bank, Panama City Florida (“PCFB”) and the Federal Deposit Insurance Corporation acting in its corporate capacity (“FDIC”) | |
| 21 | Subsidiaries of Hancock Holding Company. | |
| 22 | Proxy Statement for the Registrant’s Annual Meeting of Shareholders on March 17, 2010 (deemed “filed” for the purposes of this Form 10-K only for those portions which are specifically incorporated herein by reference). | |
| 23.1 | Consent of PricewaterhouseCoopers LLP. | |
| 23.2 | Consent of KPMG LLP | |
| 31.1 | Certification of Chief Executive Officers pursuant to Rule 13a-14(a) and Rule 15d-14(a) of the Securities Exchange Act, as amended. | |
| 31.2 | Certification of Chief Financial Officer pursuant to Rule 13a-14(a) and Rule 15d-14(a) of the Securities Exchange Act, as amended. | |
| 32.1 | Certification of Chief Executive Officers Pursuant to 18 U.S.C. 1350, as adopted pursuant to Section 906 of the Sarbanes-Oxley Act of 2002. | |
| 32.2 | Certification of Chief Financial Officer Pursuant to 18 U.S.C. 1350, as adopted pursuant to Section 906 of the Sarbanes-Oxley Act of 2002. | |
| * | Compensatory plan or arrangement. |