Attached files
| file | filename |
|---|---|
| EX-99.1 - EX-99.1 - Recro Pharma, Inc. | reph-20210817ex99_1.htm |
| 8-K - 8-K - Recro Pharma, Inc. | reph-20210817.htm |
Recro Acquires IRISYS August 2021 Exhibit 99.2
components and raw materials, or the Company's or IRISYS's customers facing increasing or new competition. These forward-looking statements should be considered together with the risks and uncertainties that may affect our business or the business of IRISYS and future results presented herein along with those risks and uncertainties discussed in our filings with the Securities and Exchange Commission (the “SEC”) at www.sec.gov. These forward-looking statements are based on information currently available to us, and we assume no obligation to update any forward-looking statements except as required by applicable law. Any historical or projected financial information contained in this presentation for IRISYS and Recro are not intended to be indicative of future financial results of the combined business. The events and circumstances reflected in the Company's forward-looking statements, including potential results related to IRISYS, may not be achieved or occur, and actual results could differ materially from those projected in the forward-looking statements. Undue reliance should not be placed on the forward-looking statements. Moreover, the Company operates in a dynamic industry and economy. New risk factors could emerge from time to time, and it is not possible for the Company's management to predict all uncertainties that the Company may face. Non-GAAP To supplement IRISYS financial results determined by U.S. generally accepted accounting principles (“GAAP”), we have included certain non-GAAP information for IRISYS’s business, including EBITDA. We believe this non-GAAP financial measure is helpful in understanding IRISYS’ past and potential future business performance as it is useful to investors in allowing for greater transparency of supplemental information used by management. Non-GAAP financial measures should be considered in addition to, but not as a substitute for, reported GAAP results. Please see the "Reconciliation of GAAP to Non-GAAP Financial Measures" at the end of this presentation for a reconciliation of non-GAAP EBITDA, to its most directly comparable GAAP measure. This presentation includes forward-looking statements within the meaning of Section 27A of the Securities Act of 1933 and Section 21E of the Securities Exchange Act of 1934. These statements, among other things, relate to the Company’s growth drivers and expected levels of our organic growth; synergies and value creation potential created by our acquisition of IRISYS, LLC (“IRISYS”) (the “Acquisition”); the impact of our investment in development and commercial initiatives; financial guidance, including timing of revenues and EBITDA from the Acquisition; our ability to manage costs and to achieve our financial goals; our ability to operate under increased leverage and associated lending covenants; our ability to pay our debt under our credit agreement and to maintain relationships with CDMO commercial partners and develop additional commercial and development partnerships. The words "anticipate", "believe", "could", "estimate", “upcoming”, "expect", "intend", "may", "plan", "predict", "project", "will" and similar terms and phrases may be used to identify forward-looking statements in this presentation. The forward-looking statements in this presentation are only predictions. Our operations involve risks and uncertainties, many of which are outside our control, and any one of which, or a combination of which, could materially affect our results of operations, and the forward-looking statements contained herein could ultimately prove to be incorrect. Factors that could cause our actual outcomes to differ materially from those expressed in or underlying these forward-looking statements include the ability to successfully integrate IRISYS with the Company (including achievement of synergies and cost reductions), our ability to fund our combined operations, our expectations and beliefs regarding future growth of the combined business and the markets in which we operate, the final accounting treatment of the Acquisition, the ongoing economic and social consequences of the COVID-19 pandemic, including any adverse impact on customer ordering patterns or inventory rebalancing or disruption in raw materials or supply chain; demand for our services, which depends in part on customers’ research and development and the clinical plans and market success of their products; customers' changing inventory requirements and manufacturing plans; customers’ and prospective customers’ decisions to move forward with our manufacturing services; the average profitability, or mix, of the products the Company or IRISYS manufactures; our ability to enhance existing or introduce new services in a timely manner; fluctuations in the costs, availability, and suitability of the components of the products the Company manufactures, including active pharmaceutical ingredients, excipients, purchased Forward Looking Statements
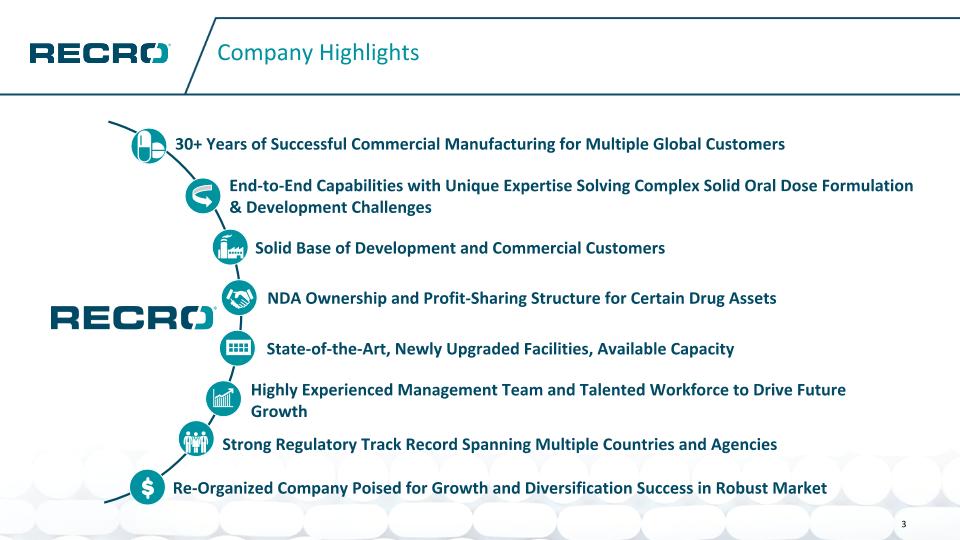
Company Highlights Re-Organized Company Poised for Growth and Diversification Success in Robust Market State-of-the-Art, Newly Upgraded Facilities, Available Capacity 30+ Years of Successful Commercial Manufacturing for Multiple Global Customers Solid Base of Development and Commercial Customers Highly Experienced Management Team and Talented Workforce to Drive Future Growth Strong Regulatory Track Record Spanning Multiple Countries and Agencies NDA Ownership and Profit-Sharing Structure for Certain Drug Assets End-to-End Capabilities with Unique Expertise Solving Complex Solid Oral Dose Formulation & Development Challenges 3
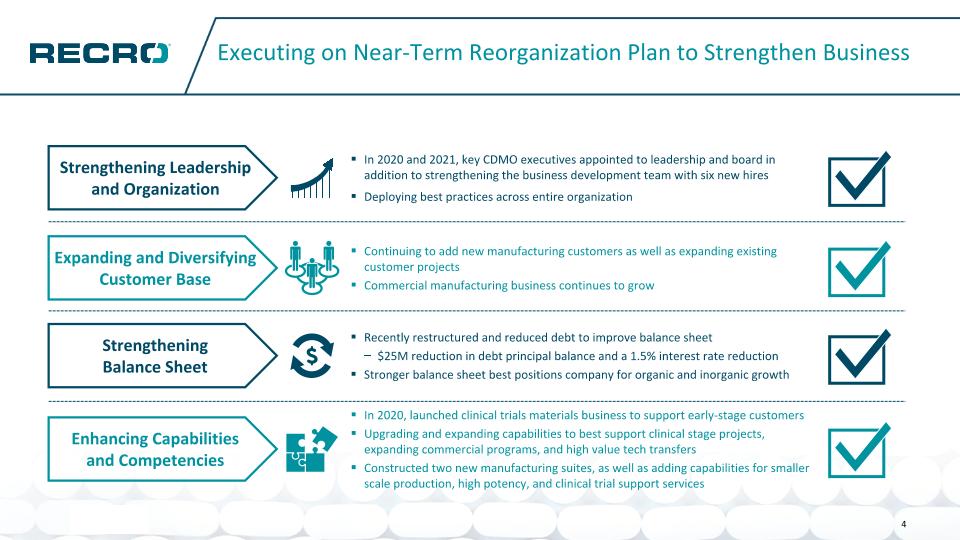
Executing on Near-Term Reorganization Plan to Strengthen Business In 2020 and 2021, key CDMO executives appointed to leadership and board in addition to strengthening the business development team with six new hires Deploying best practices across entire organization Strengthening Leadership and Organization Strengthening Balance Sheet Recently restructured and reduced debt to improve balance sheet $25M reduction in debt principal balance and a 1.5% interest rate reduction Stronger balance sheet best positions company for organic and inorganic growth Expanding and Diversifying Customer Base Continuing to add new manufacturing customers as well as expanding existing customer projects Commercial manufacturing business continues to grow In 2020, launched clinical trials materials business to support early-stage customers Upgrading and expanding capabilities to best support clinical stage projects, expanding commercial programs, and high value tech transfers Constructed two new manufacturing suites, as well as adding capabilities for smaller scale production, high potency, and clinical trial support services Enhancing Capabilities and Competencies 4
Pipeline and revenue diversification Expands capabilities beyond oral solid dose, including sterile injectables, and other advanced dosage forms Ability to leverage a variety of functional capabilities across wider footprint Potential synergies within business development, clinical development, and commercial scale-up Creates a bi-coastal presence; increases talent pool Expands global customer base Strong cultural alignment and fit Multiple potential platforms for future organic growth Strategic Rationale 5
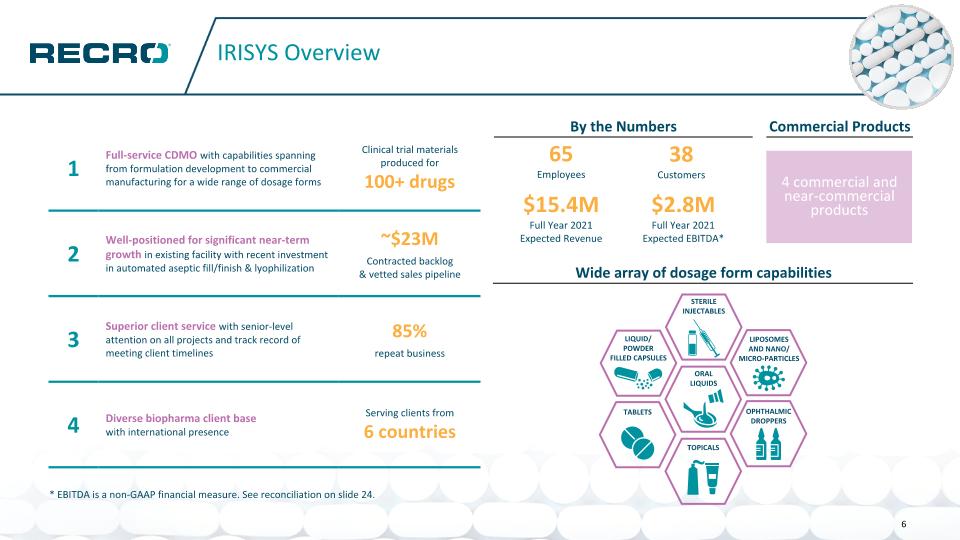
IRISYS Overview 1 Full-service CDMO with capabilities spanning from formulation development to commercial manufacturing for a wide range of dosage forms Clinical trial materials produced for 100+ drugs 2 Well-positioned for significant near-term growth in existing facility with recent investment in automated aseptic fill/finish & lyophilization ~$23M Contracted backlog & vetted sales pipeline 3 Superior client service with senior-level attention on all projects and track record of meeting client timelines 85% repeat business 4 Diverse biopharma client base with international presence Serving clients from 6 countries By the Numbers Wide array of dosage form capabilities LIPOSOMES AND NANO/ MICRO-PARTICLES LIQUID/ POWDER FILLED CAPSULES ORAL LIQUIDS TABLETS OPHTHALMIC DROPPERS STERILE INJECTABLES TOPICALS Commercial Products 65 Employees 38 Customers $15.4M Full Year 2021 Expected Revenue $2.8M Full Year 2021 Expected EBITDA* 4 commercial and near-commercial products 6 * EBITDA is a non-GAAP financial measure. See reconciliation on slide 24.
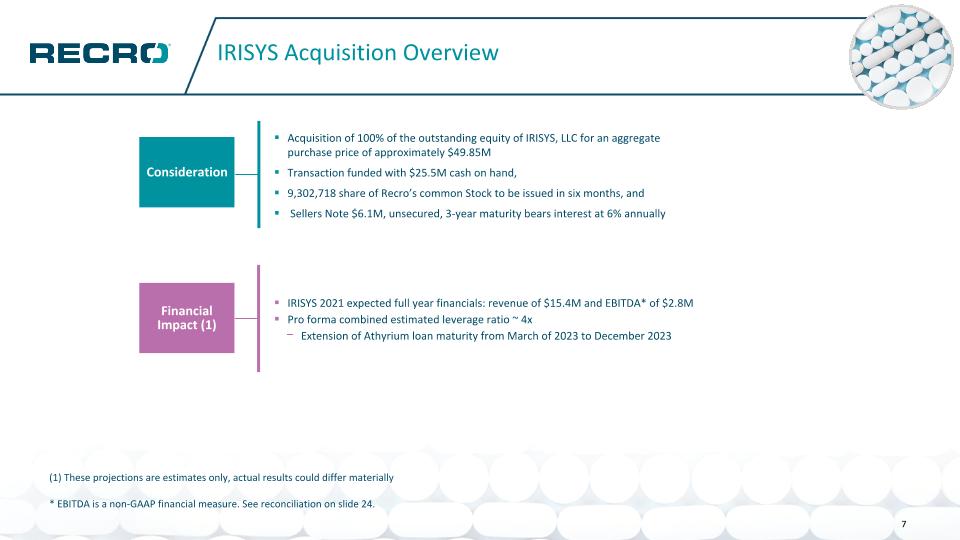
IRISYS Acquisition Overview Consideration Financial Impact (1) Acquisition of 100% of the outstanding equity of IRISYS, LLC for an aggregate purchase price of approximately $49.85M Transaction funded with $25.5M cash on hand, 9,302,718 share of Recro’s common Stock to be issued in six months, and Sellers Note $6.1M, unsecured, 3-year maturity bears interest at 6% annually IRISYS 2021 expected full year financials: revenue of $15.4M and EBITDA* of $2.8M Pro forma combined estimated leverage ratio ~ 4x Extension of Athyrium loan maturity from March of 2023 to December 2023 7 (1) These projections are estimates only, actual results could differ materially * EBITDA is a non-GAAP financial measure. See reconciliation on slide 24.
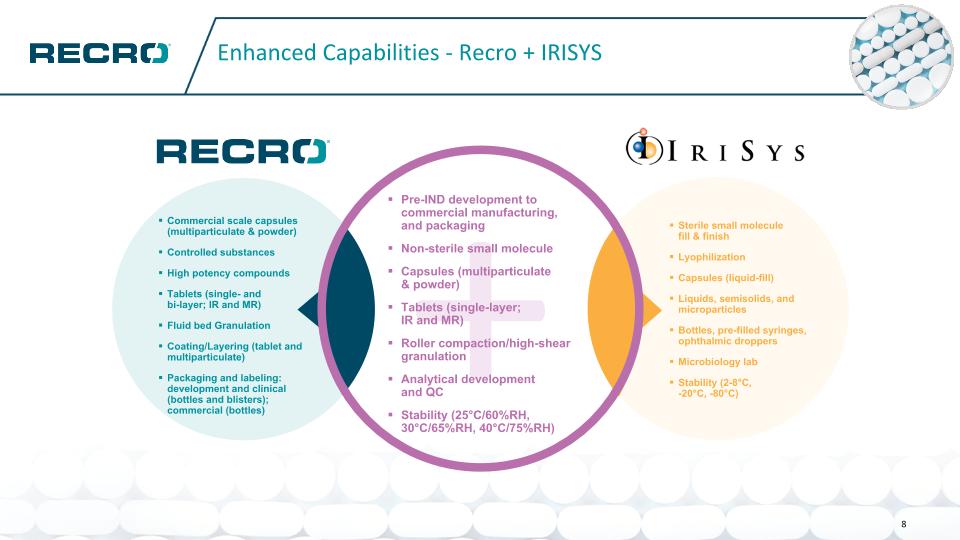
Enhanced Capabilities - Recro + IRISYS + Pre-IND development to commercial manufacturing, and packaging Non-sterile small molecule Capsules (multiparticulate & powder) Tablets (single-layer; IR and MR) Roller compaction/high-shear granulation Analytical development and QC Stability (25°C/60%RH, 30°C/65%RH, 40°C/75%RH) Commercial scale capsules (multiparticulate & powder) Controlled substances High potency compounds Tablets (single- and bi-layer; IR and MR) Fluid bed Granulation Coating/Layering (tablet and multiparticulate) Packaging and labeling: development and clinical (bottles and blisters); commercial (bottles) Sterile small molecule fill & finish Lyophilization Capsules (liquid-fill) Liquids, semisolids, and microparticles Bottles, pre-filled syringes, ophthalmic droppers Microbiology lab Stability (2-8°C, -20°C, -80°C) 8
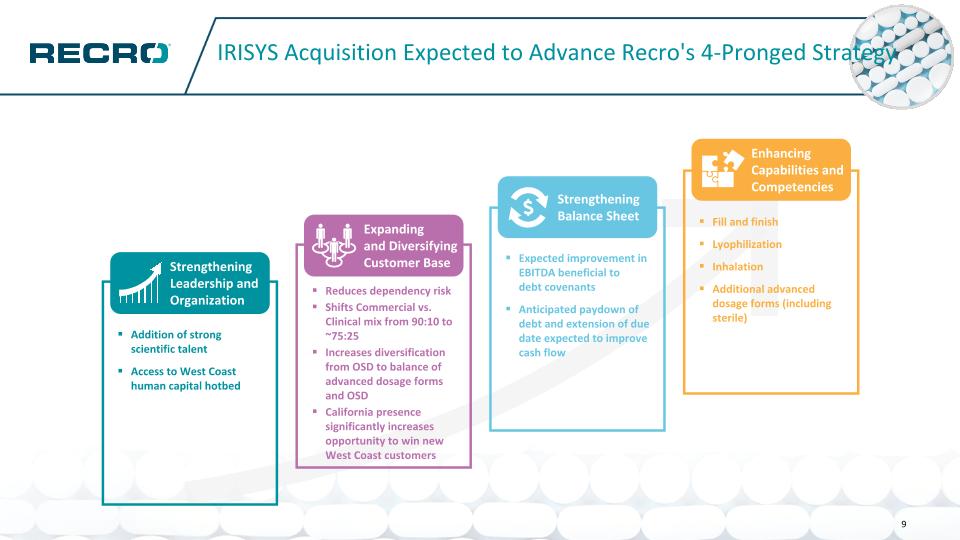
IRISYS Acquisition Expected to Advance Recro's 4-Pronged Strategy Fill and finish Lyophilization Inhalation Additional advanced dosage forms (including sterile) Enhancing Capabilities and Competencies Expected improvement in EBITDA beneficial to debt covenants Anticipated paydown of debt and extension of due date expected to improve cash flow Strengthening Balance Sheet Reduces dependency risk Shifts Commercial vs. Clinical mix from 90:10 to ~75:25 Increases diversification from OSD to balance of advanced dosage forms and OSD California presence significantly increases opportunity to win new West Coast customers Expanding and Diversifying Customer Base Addition of strong scientific talent Access to West Coast human capital hotbed Strengthening Leadership and Organization 9
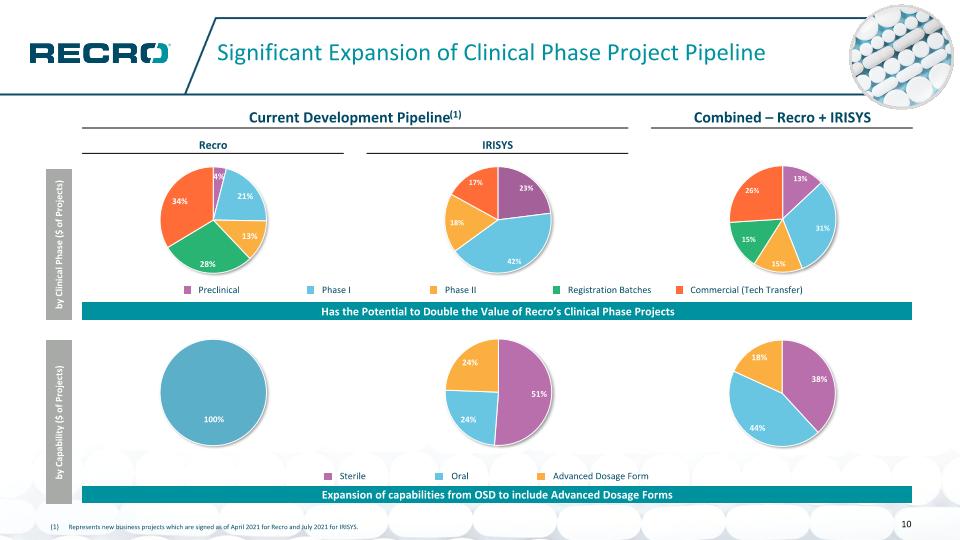
Significant Expansion of Clinical Phase Project Pipeline Represents new business projects which are signed as of April 2021 for Recro and July 2021 for IRISYS. Recro Expansion of capabilities from OSD to include Advanced Dosage Forms Current Development Pipeline(1) Combined – Recro + IRISYS Recro IRISYS by Clinical Phase ($ of Projects) Has the Potential to Double the Value of Recro’s Clinical Phase Projects by Capability ($ of Projects) Preclinical Phase I Phase II Registration Batches Commercial (Tech Transfer) Sterile Oral Advanced Dosage Form 10
Product Life Cycle & New Business Overview August 2021
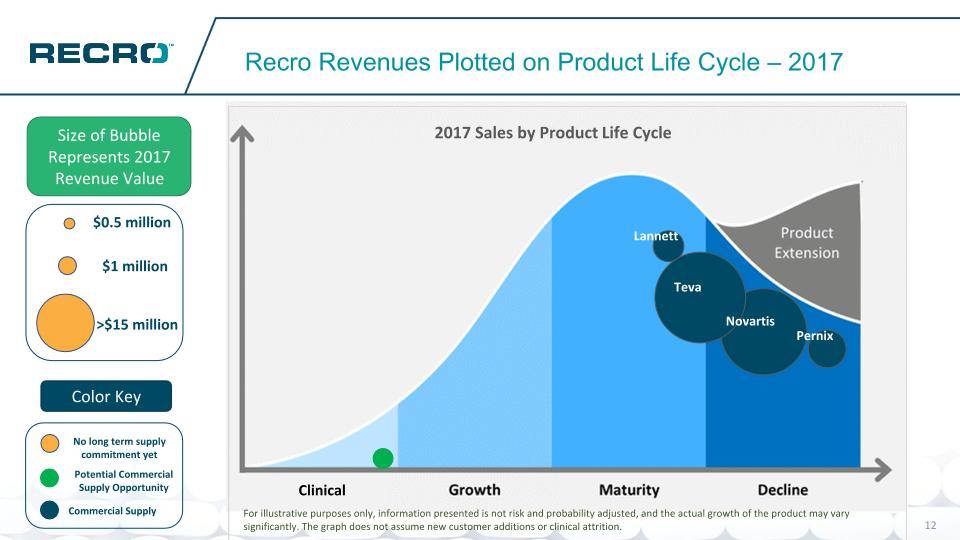
Potential Commercial Supply Opportunity No long term supply commitment yet Recro Revenues Plotted on Product Life Cycle – 2017 Size of Bubble Represents 2017 Revenue Value Color Key For illustrative purposes only, information presented is not risk and probability adjusted, and the actual growth of the product may vary significantly. The graph does not assume new customer additions or clinical attrition. Novartis Teva Lannett $1 million >$15 million $0.5 million Commercial Supply Clinical Pernix
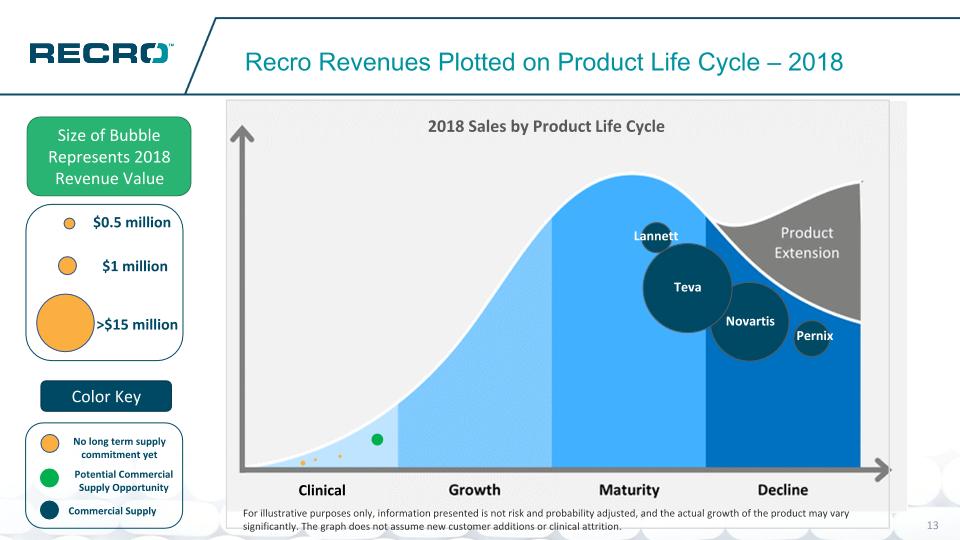
Potential Commercial Supply Opportunity No long term supply commitment yet Recro Revenues Plotted on Product Life Cycle – 2018 Size of Bubble Represents 2018 Revenue Value Color Key Novartis Teva Lannett $1 million >$15 million $0.5 million Commercial Supply Clinical Pernix For illustrative purposes only, information presented is not risk and probability adjusted, and the actual growth of the product may vary significantly. The graph does not assume new customer additions or clinical attrition.
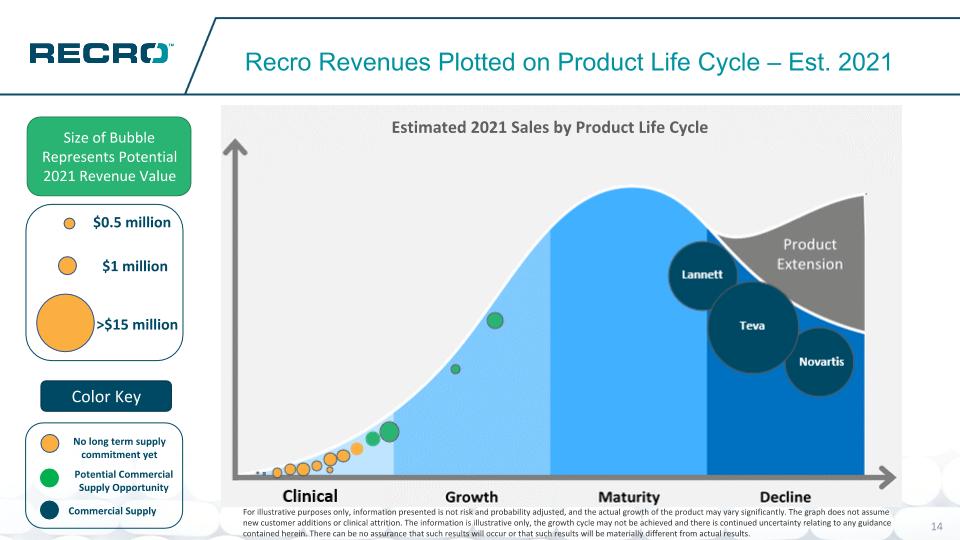
Potential Commercial Supply Opportunity No long term supply commitment yet Recro Revenues Plotted on Product Life Cycle – Est. 2021 Size of Bubble Represents Potential 2021 Revenue Value Color Key Novartis Teva Lannett $1 million >$15 million $0.5 million Commercial Supply For illustrative purposes only, information presented is not risk and probability adjusted, and the actual growth of the product may vary significantly. The graph does not assume new customer additions or clinical attrition. The information is illustrative only, the growth cycle may not be achieved and there is continued uncertainty relating to any guidance contained herein. There can be no assurance that such results will occur or that such results will be materially different from actual results. Estimated 2021 Sales by Product Life Cycle
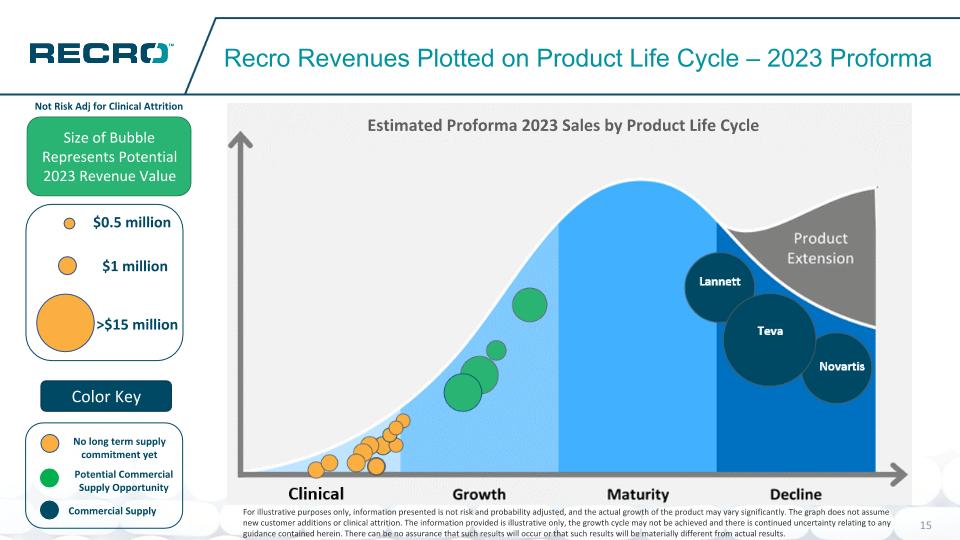
Potential Commercial Supply Opportunity No long term supply commitment yet Recro Revenues Plotted on Product Life Cycle – 2023 Proforma Size of Bubble Represents Potential 2023 Revenue Value Color Key Novartis Teva Lannett $1 million >$15 million $0.5 million Commercial Supply Not Risk Adj for Clinical Attrition For illustrative purposes only, information presented is not risk and probability adjusted, and the actual growth of the product may vary significantly. The graph does not assume new customer additions or clinical attrition. The information provided is illustrative only, the growth cycle may not be achieved and there is continued uncertainty relating to any guidance contained herein. There can be no assurance that such results will occur or that such results will be materially different from actual results. Estimated Proforma 2023 Sales by Product Life Cycle
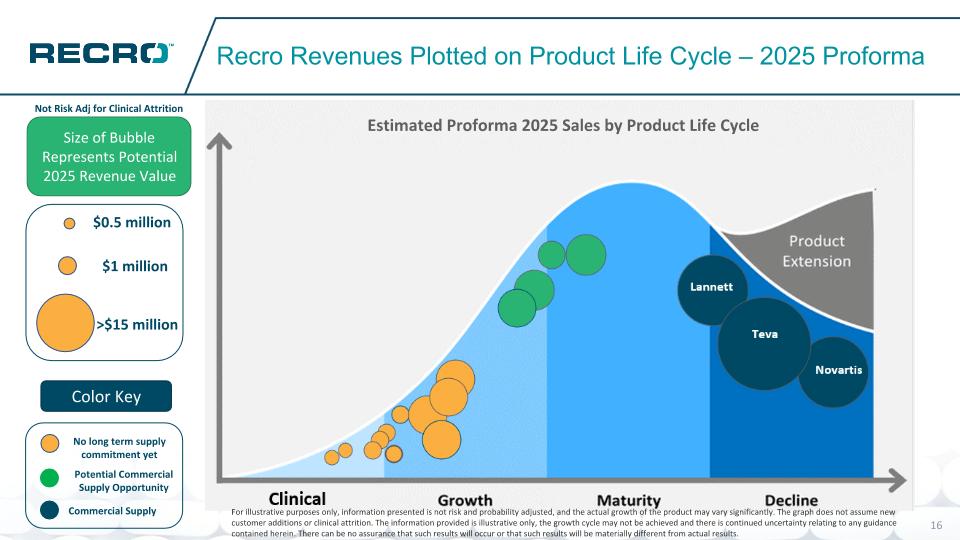
Potential Commercial Supply Opportunity No long term supply commitment yet Recro Revenues Plotted on Product Life Cycle – 2025 Proforma Size of Bubble Represents Potential 2025 Revenue Value Color Key Novartis Teva Lannett $1 million >$15 million $0.5 million Commercial Supply Not Risk Adj for Clinical Attrition Estimated Proforma 2025 Sales by Product Life Cycle For illustrative purposes only, information presented is not risk and probability adjusted, and the actual growth of the product may vary significantly. The graph does not assume new customer additions or clinical attrition. The information provided is illustrative only, the growth cycle may not be achieved and there is continued uncertainty relating to any guidance contained herein. There can be no assurance that such results will occur or that such results will be materially different from actual results.
Addition of IriSys
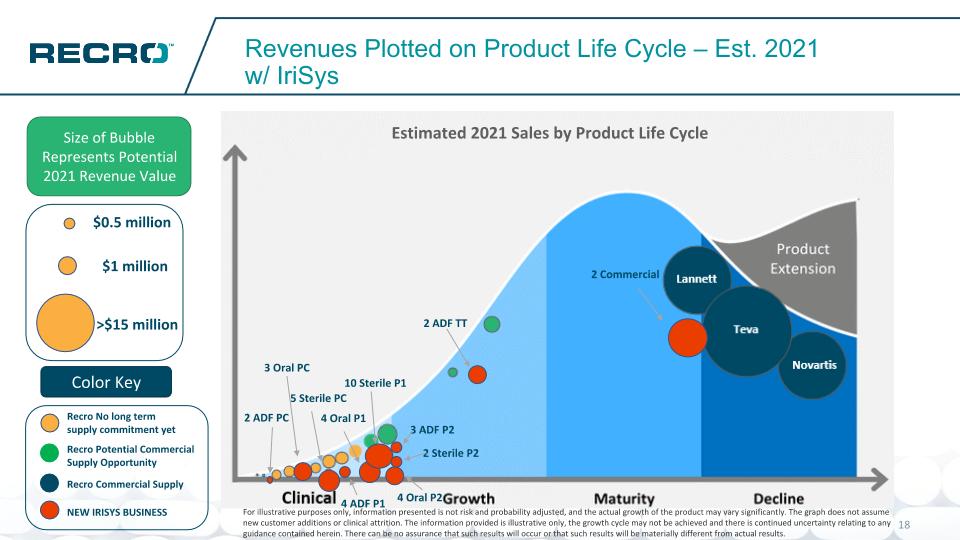
Revenues Plotted on Product Life Cycle – Est. 2021 w/ IriSys Size of Bubble Represents Potential 2021 Revenue Value Color Key Novartis Teva Lannett $1 million >$15 million $0.5 million 2 ADF TT 2 ADF PC 3 Oral PC 5 Sterile PC 4 ADF P1 4 Oral P1 10 Sterile P1 3 ADF P2 4 Oral P2 2 Sterile P2 2 Commercial Estimated 2021 Sales by Product Life Cycle For illustrative purposes only, information presented is not risk and probability adjusted, and the actual growth of the product may vary significantly. The graph does not assume new customer additions or clinical attrition. The information provided is illustrative only, the growth cycle may not be achieved and there is continued uncertainty relating to any guidance contained herein. There can be no assurance that such results will occur or that such results will be materially different from actual results. Recro Potential Commercial Supply Opportunity Recro No long term supply commitment yet Recro Commercial Supply NEW IRISYS BUSINESS
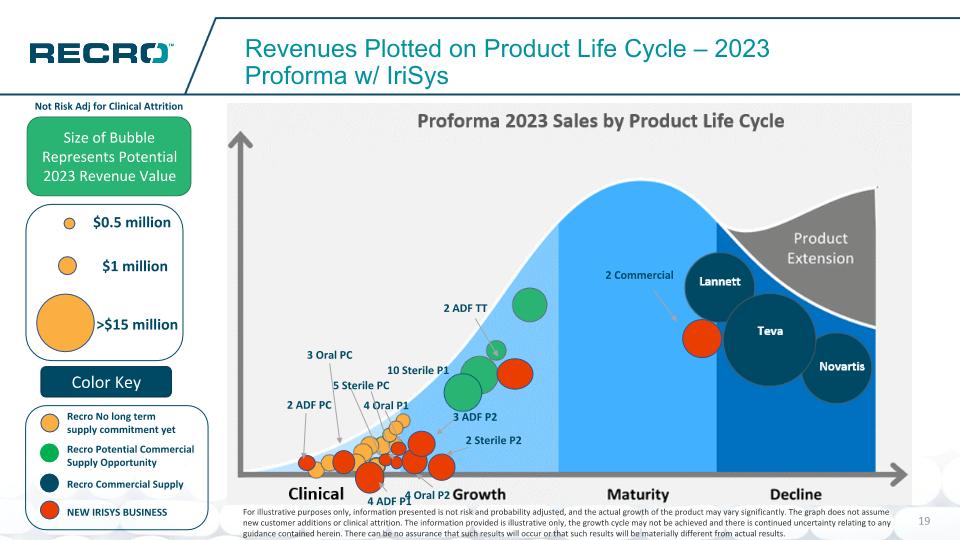
Revenues Plotted on Product Life Cycle – 2023 Proforma w/ IriSys Size of Bubble Represents Potential 2023 Revenue Value Novartis Teva Lannett $1 million >$15 million $0.5 million Not Risk Adj for Clinical Attrition 2 ADF TT 2 ADF PC 3 Oral PC 5 Sterile PC 4 ADF P1 4 Oral P1 10 Sterile P1 3 ADF P2 4 Oral P2 2 Sterile P2 2 Commercial Recro Potential Commercial Supply Opportunity Recro No long term supply commitment yet Color Key Recro Commercial Supply NEW IRISYS BUSINESS For illustrative purposes only, information presented is not risk and probability adjusted, and the actual growth of the product may vary significantly. The graph does not assume new customer additions or clinical attrition. The information provided is illustrative only, the growth cycle may not be achieved and there is continued uncertainty relating to any guidance contained herein. There can be no assurance that such results will occur or that such results will be materially different from actual results.
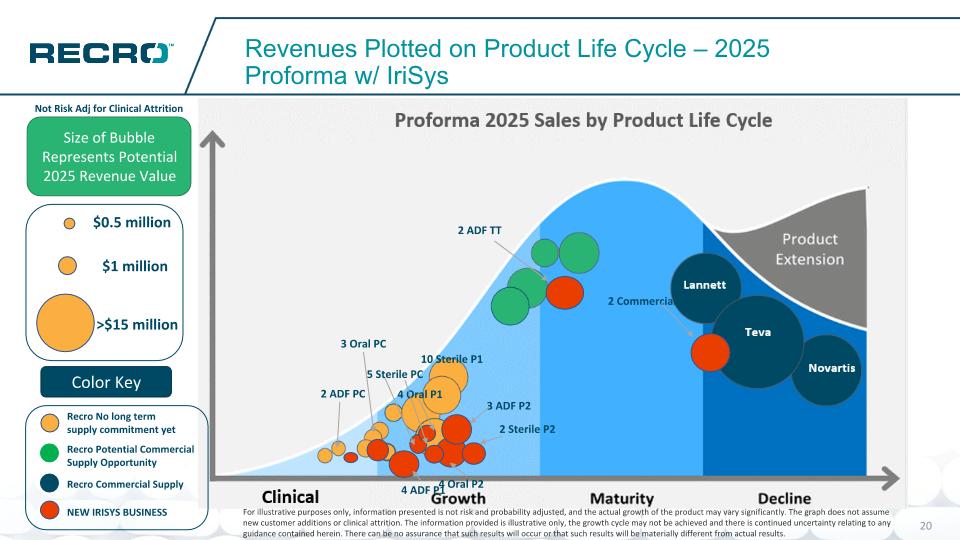
Revenues Plotted on Product Life Cycle – 2025 Proforma w/ IriSys Size of Bubble Represents Potential 2025 Revenue Value Novartis Teva Lannett $1 million >$15 million $0.5 million Not Risk Adj for Clinical Attrition 2 ADF TT 2 ADF PC 3 Oral PC 5 Sterile PC 4 ADF P1 4 Oral P1 10 Sterile P1 3 ADF P2 4 Oral P2 2 Sterile P2 2 Commercial Color Key For illustrative purposes only, information presented is not risk and probability adjusted, and the actual growth of the product may vary significantly. The graph does not assume new customer additions or clinical attrition. The information provided is illustrative only, the growth cycle may not be achieved and there is continued uncertainty relating to any guidance contained herein. There can be no assurance that such results will occur or that such results will be materially different from actual results. Recro Potential Commercial Supply Opportunity Recro No long term supply commitment yet Recro Commercial Supply NEW IRISYS BUSINESS
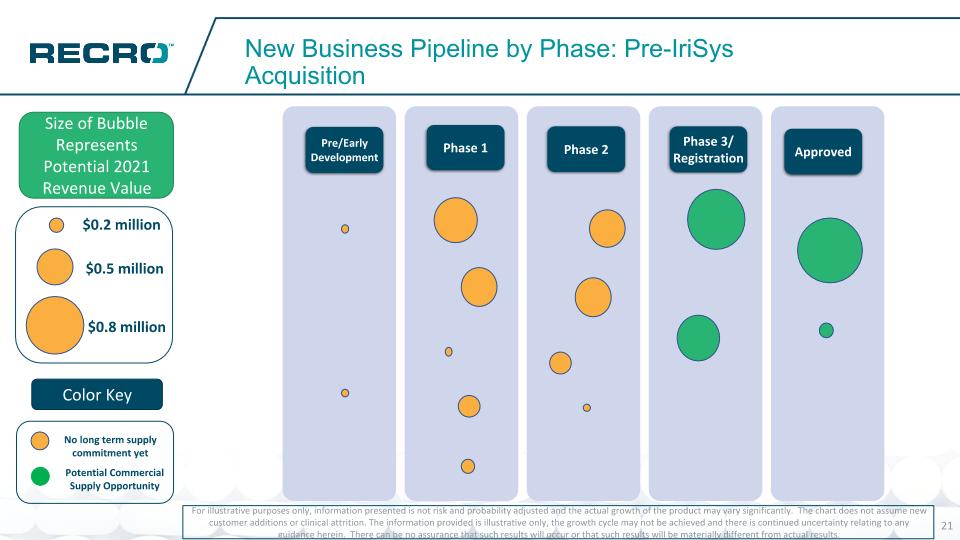
New Business Pipeline by Phase: Pre-IriSys Acquisition For illustrative purposes only, information presented is not risk and probability adjusted and the actual growth of the product may vary significantly. The chart does not assume new customer additions or clinical attrition. The information provided is illustrative only, the growth cycle may not be achieved and there is continued uncertainty relating to any guidance herein. There can be no assurance that such results will occur or that such results will be materially different from actual results. Size of Bubble Represents Potential 2021 Revenue Value Pre/Early Development Phase 1 Phase 2 Phase 3/ Registration Approved Bubble Size: $0.1 – $0.2 – .2 $0.3 – $0.4 - $0.5 - $0.6 - .6 $0.7 - $0.8 – 0.8 $0.9 – 0.85 $1.0 - $1.1 - $1.2 - $1.3 - $1.4 - $1.5 - $0.5 million $0.8 million $0.2 million Potential Commercial Supply Opportunity No long term supply commitment yet Color Key
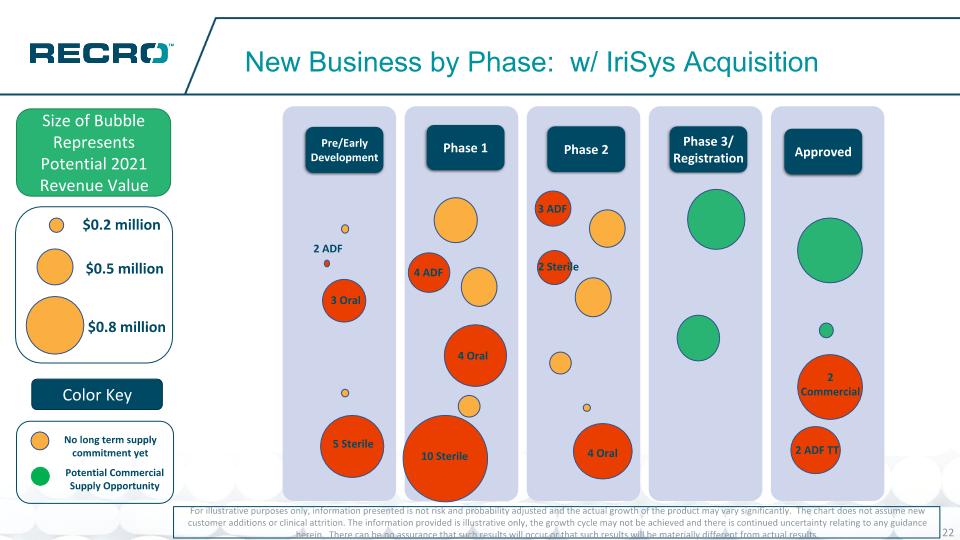
New Business by Phase: w/ IriSys Acquisition For illustrative purposes only, information presented is not risk and probability adjusted and the actual growth of the product may vary significantly. The chart does not assume new customer additions or clinical attrition. The information provided is illustrative only, the growth cycle may not be achieved and there is continued uncertainty relating to any guidance herein. There can be no assurance that such results will occur or that such results will be materially different from actual results. Size of Bubble Represents Potential 2021 Revenue Value Pre/Early Development Phase 1 Phase 2 Phase 3/ Registration Approved Bubble Size: $0.1 – $0.2 – .2 $0.3 – $0.4 - $0.5 - $0.6 - .6 $0.7 - $0.8 – 0.8 $0.9 – 0.85 $1.0 - $1.1 - $1.2 - $1.3 - $1.4 - $1.5 - $0.5 million $0.8 million $0.2 million Potential Commercial Supply Opportunity No long term supply commitment yet Color Key 3 Oral 5 Sterile 4 ADF 4 Oral 10 Sterile 3 ADF 4 Oral 2 Sterile 2 ADF TT 2 Commercial 2 ADF
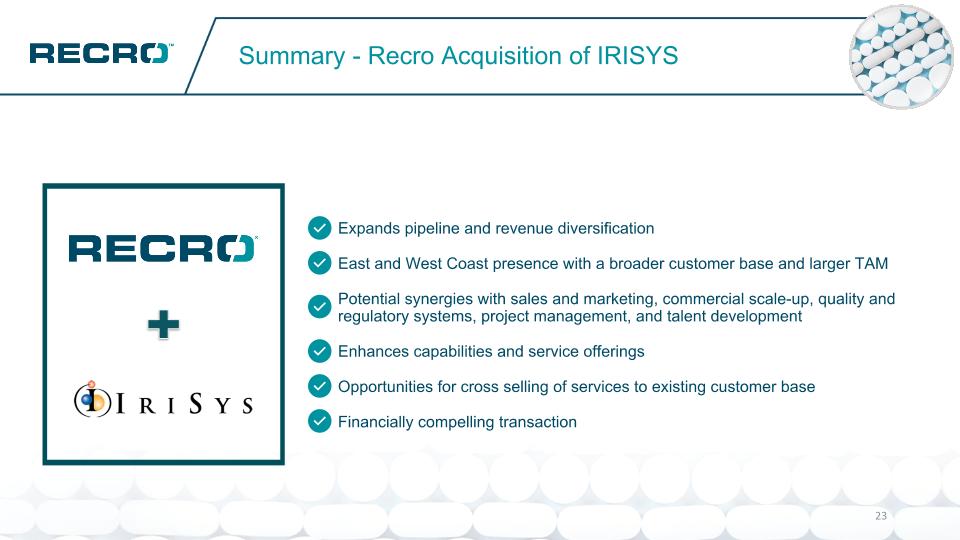
Summary - Recro Acquisition of IRISYS Expands pipeline and revenue diversification East and West Coast presence with a broader customer base and larger TAM Potential synergies with sales and marketing, commercial scale-up, quality and regulatory systems, project management, and talent development Enhances capabilities and service offerings Opportunities for cross selling of services to existing customer base Financially compelling transaction
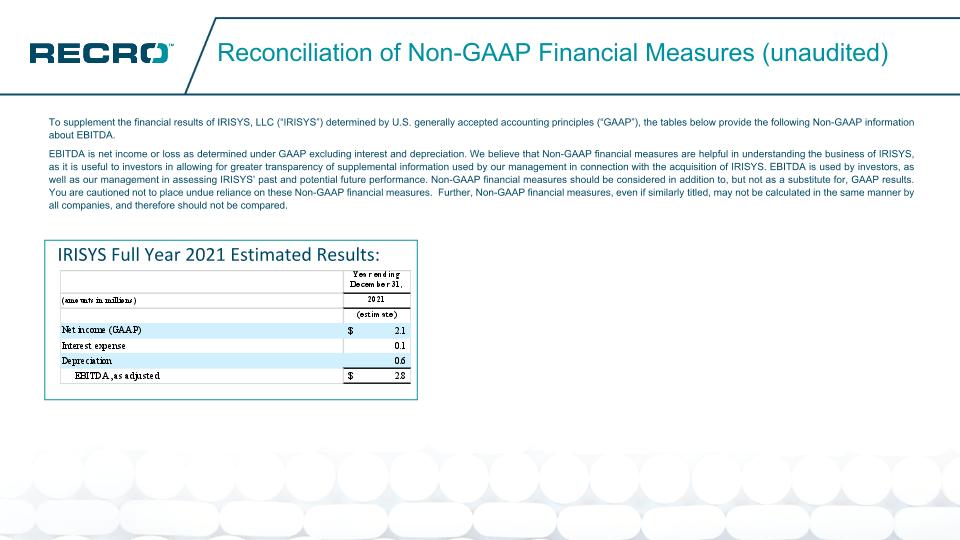
Reconciliation of Non-GAAP Financial Measures (unaudited) To supplement the financial results of IRISYS, LLC (“IRISYS”) determined by U.S. generally accepted accounting principles (“GAAP”), the tables below provide the following Non-GAAP information about EBITDA. EBITDA is net income or loss as determined under GAAP excluding interest and depreciation. We believe that Non-GAAP financial measures are helpful in understanding the business of IRISYS, as it is useful to investors in allowing for greater transparency of supplemental information used by our management in connection with the acquisition of IRISYS. EBITDA is used by investors, as well as our management in assessing IRISYS’ past and potential future performance. Non-GAAP financial measures should be considered in addition to, but not as a substitute for, GAAP results. You are cautioned not to place undue reliance on these Non-GAAP financial measures. Further, Non-GAAP financial measures, even if similarly titled, may not be calculated in the same manner by all companies, and therefore should not be compared. IRISYS Full Year 2021 Estimated Results:
