Attached files
| file | filename |
|---|---|
| EX-99.1 - EX-99.1 - Williams Industrial Services Group Inc. | wlms-20210818xex99d1.htm |
| 8-K - 8-K - Williams Industrial Services Group Inc. | wlms-20210818x8k.htm |
Exhibit 99.2
| Q2 2021 Financial Results August 18, 2021 Tracy Pagliara President & CEO NYSE American: WLMS Randy Lay SVP & Chief Financial Officer |

| 2 2 Forward-looking Statement Disclaimer This presentation contains “forward-looking statements” within the meaning of the term set forth in the Private Securities Litigation Reform Act of 1995. The forward-looking statements include statements or expectations regarding the Company’s ability to perform in accordance with guidance, build and diversify its backlog and convert backlog to revenue, realize opportunities, including receiving contract awards on outstanding bids and successfully pursuing future opportunities, benefit from potential growth in the Company’s end markets, including the possibility of increased infrastructure spending by the U.S. federal government, and successfully achieve its growth and strategic initiatives, including decreasing the Company’s outstanding indebtedness, future demand for the Company’s services, and expectations regarding future revenues, cash flow, and other related matters. These statements reflect the Company’s current views of future events and financial performance and are subject to a number of risks and uncertainties, some of which have been, and may further be, exacerbated by the COVID-19 pandemic, including the Company’s level of indebtedness and ability to make payments on, and satisfy the financial and other covenants contained in, its debt facilities, as well as its ability to engage in certain transactions and activities due to limitations and covenants contained in such facilities; its ability to generate sufficient cash resources to continue funding operations and the possibility that it may be unable to obtain any additional funding as needed or incur losses from operations in the future; exposure to market risks from changes in interest rates; failure to maintain effective internal control over financial reporting and disclosure controls and procedures; the Company’s ability to attract and retain qualified personnel, skilled workers, and key officers; failure to successfully implement or realize its business strategies, plans and objectives of management, and liquidity, operating and growth initiatives and opportunities, including its expansion into international markets and its ability to identify potential candidates for, and consummate, acquisition, disposition, or investment transactions; the loss of one or more of its significant customers; its competitive position; market outlook and trends in the Company’s industry, including the possibility of reduced investment in, or increased regulation of, nuclear power plants, declines in public infrastructure construction, and reductions in government funding; the failure of the U.S. Congress to pass infrastructure-related legislation benefiting the Company’s end markets; costs exceeding estimates the Company uses to set fixed-price contracts; harm to the Company’s reputation or profitability due to, among other things, internal operational issues, poor subcontractor performances or subcontractor insolvency; potential insolvency or financial distress of third parties, including customers and suppliers; the Company’s contract backlog and related amounts to be recognized as revenue; its ability to maintain its safety record, the risks of potential liability and adequacy of insurance; adverse changes in the Company’s relationships with suppliers, vendors, and subcontractors; compliance with environmental, health, safety and other related laws and regulations; limitations or modifications to indemnification regulations of the U.S. or Canada; the Company’s expected financial condition, future cash flows, results of operations and future capital and other expenditures; the impact of general economic conditions including the current economic disruption and any recession resulting from the COVID-19 pandemic; the impact of the COVID-19 pandemic on the Company’s business, results of operations, financial condition, and cash flows, including the potential for additional COVID-19 cases to occur at the Company’s active or future job sites, which potentially could impact cost and labor availability; information technology vulnerabilities and cyberattacks on the Company’s networks; the Company’s failure to comply with applicable laws and regulations, including, but not limited to, those relating to privacy and anti-bribery; the Company’s participation in multiemployer pension plans; the impact of any disruptions resulting from the expiration of collective bargaining agreements; the impact of natural disasters and other severe catastrophic events (such as the ongoing COVID-19 pandemic); the impact of changes in tax regulations and laws, including future income tax payments and utilization of net operating loss and foreign tax credit carryforwards; volatility of the market price for the Company’s common stock; the Company’s ability to maintain its stock exchange listing; the effects of anti-takeover provisions in the Company’s organizational documents and Delaware law; the impact of future offerings or sales of the Company’s common stock on the market price of such stock; expected outcomes of legal or regulatory proceedings and their anticipated effects on the Company’s results of operations; and any other statements regarding future growth, future cash needs, future operations, business plans and future financial results. Other important factors that may cause actual results to differ materially from those expressed in the forward-looking statements are discussed in the Company’s filings with the U.S. Securities and Exchange Commission, including the section of the Annual Report on Form 10-K for its 2020 fiscal year titled “Risk Factors.” Any forward-looking statement speaks only as of the date of this press release. Except as may be required by applicable law, the Company undertakes no obligation to publicly update or revise any forward-looking statements, whether as a result of new information, future events or otherwise, and you are cautioned not to rely upon them unduly. Non-GAAP Financial Measures This presentation will discuss some non-GAAP financial measures, which the Company believes are useful in evaluating its performance. You should not consider the presentation of this additional information in isolation or as a substitute for results prepared in accordance with GAAP. The Company has provided reconciliations of comparable GAAP to non-GAAP measures in tables found on the slides following the “Supplemental Information” slide of this presentation. Cautionary Notes Note: Unless otherwise noted, all discussion is based upon continuing operations. |

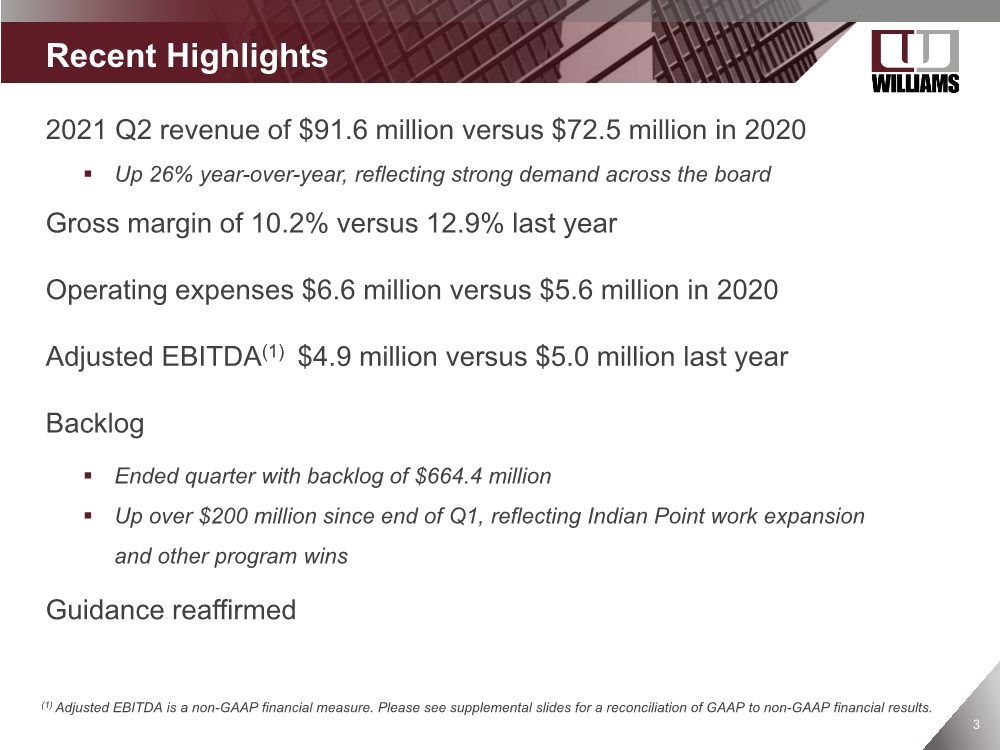
| 3 Recent Highlights 2021 Q2 revenue of $91.6 million versus $72.5 million in 2020 ▪ Up 26% year-over-year, reflecting strong demand across the board Gross margin of 10.2% versus 12.9% last year Operating expenses $6.6 million versus $5.6 million in 2020 Adjusted EBITDA(1) $4.9 million versus $5.0 million last year Backlog ▪ Ended quarter with backlog of $664.4 million ▪ Up over $200 million since end of Q1, reflecting Indian Point work expansion and other program wins Guidance reaffirmed (1) Adjusted EBITDA is a non-GAAP financial measure. Please see supplemental slides for a reconciliation of GAAP to non-GAAP financial results. |
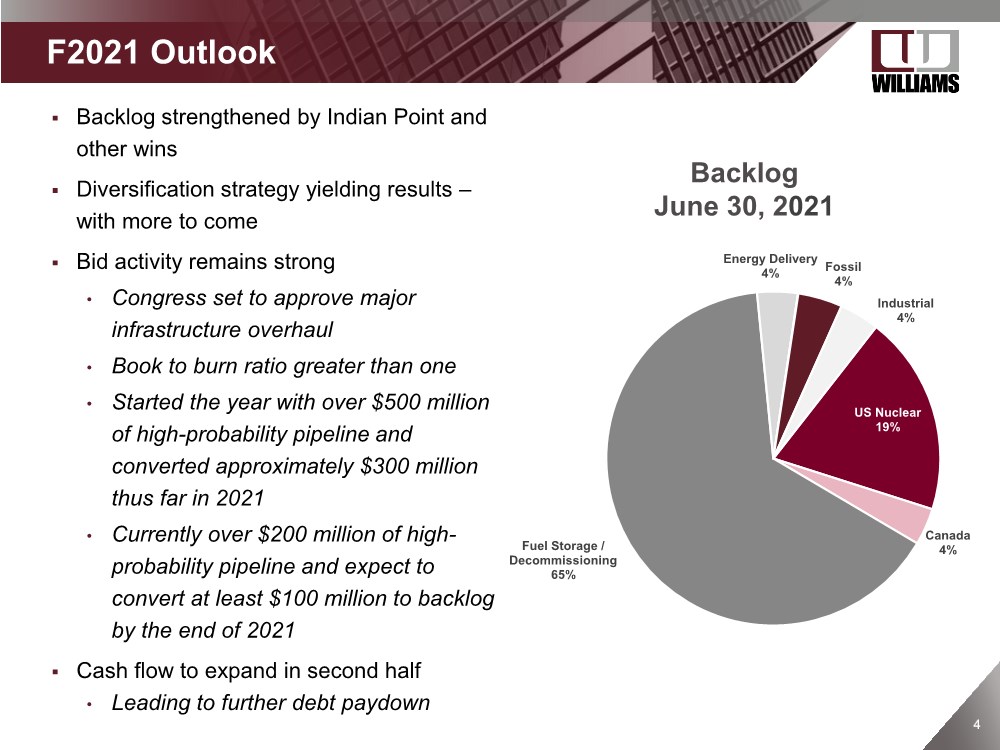
| 4 4 F2021 Outlook ▪ Backlog strengthened by Indian Point and other wins ▪ Diversification strategy yielding results – with more to come ▪ Bid activity remains strong • Congress set to approve major infrastructure overhaul • Book to burn ratio greater than one • Started the year with over $500 million of high-probability pipeline and converted approximately $300 million thus far in 2021 • Currently over $200 million of high- probability pipeline and expect to convert at least $100 million to backlog by the end of 2021 ▪ Cash flow to expand in second half • Leading to further debt paydown US Nuclear 19% Canada 4% Fuel Storage / Decommissioning 65% Energy Delivery 4% Fossil 4% Industrial 4% Backlog June 30, 2021 |
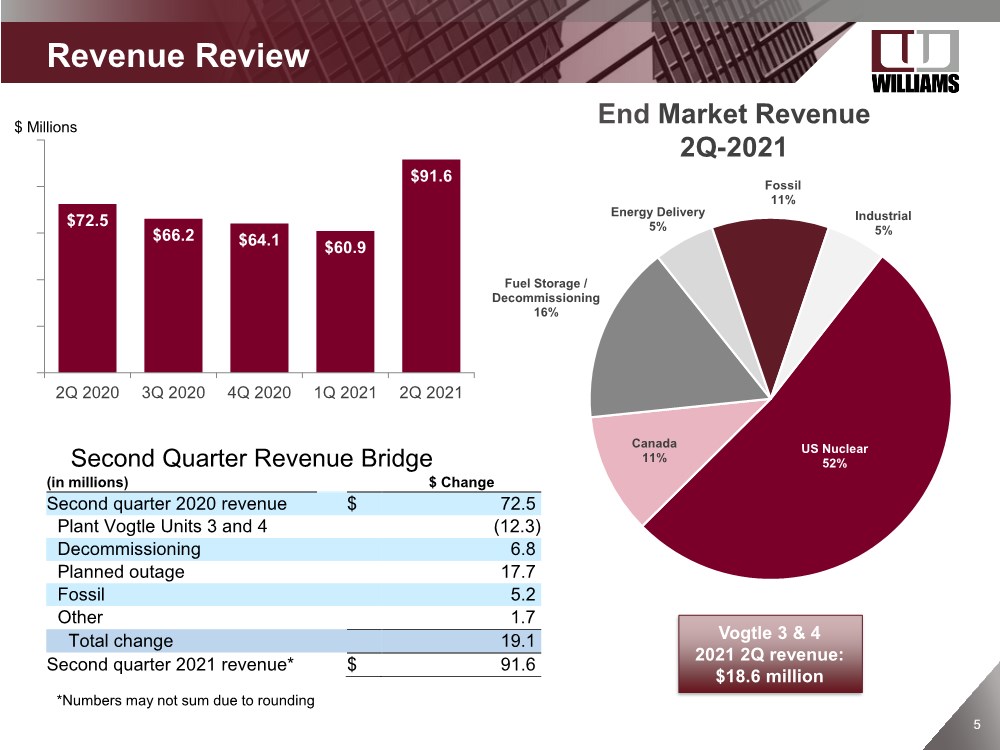
| 5 5 US Nuclear 52% Canada 11% Fuel Storage / Decommissioning 16% Energy Delivery 5% Fossil 11% Industrial 5% Revenue Review End Market Revenue 2Q-2021 Vogtle 3 & 4 2021 2Q revenue: $18.6 million $72.5 $66.2 $64.1 $60.9 $91.6 2Q 2020 3Q 2020 4Q 2020 1Q 2021 2Q 2021 Second Quarter Revenue Bridge $ Millions *Numbers may not sum due to rounding (in millions) $ Change Second quarter 2020 revenue $ 72.5 Plant Vogtle Units 3 and 4 (12.3) Decommissioning 6.8 Planned outage 17.7 Fossil 5.2 Other 1.7 Total change 19.1 Second quarter 2021 revenue* $ 91.6 |
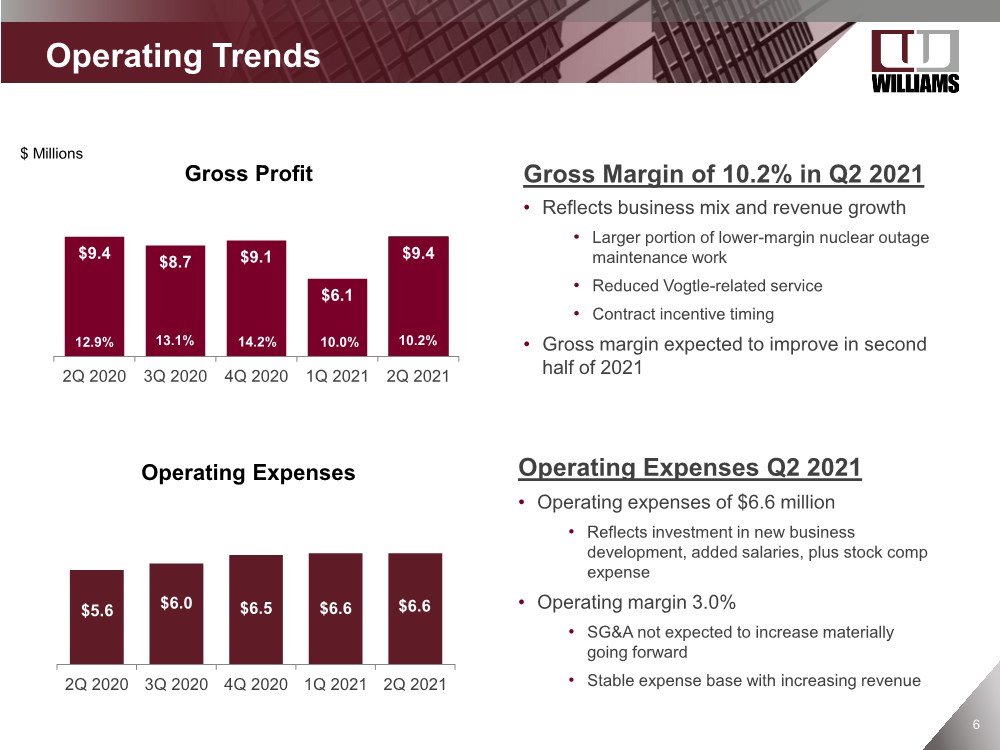
| 6 Operating Trends Gross Margin of 10.2% in Q2 2021 • Reflects business mix and revenue growth • Larger portion of lower-margin nuclear outage maintenance work • Reduced Vogtle-related service • Contract incentive timing • Gross margin expected to improve in second half of 2021 $9.4 $8.7 $9.1 $6.1 $9.4 2Q 2020 3Q 2020 4Q 2020 1Q 2021 2Q 2021 12.9% 10.0% $ Millions 14.2% $5.6 $6.0 $6.5 $6.6 $6.6 2Q 2020 3Q 2020 4Q 2020 1Q 2021 2Q 2021 Gross Profit Operating Expenses Q2 2021 • Operating expenses of $6.6 million • Reflects investment in new business development, added salaries, plus stock comp expense • Operating margin 3.0% • SG&A not expected to increase materially going forward • Stable expense base with increasing revenue 10.2% Operating Expenses 13.1% |
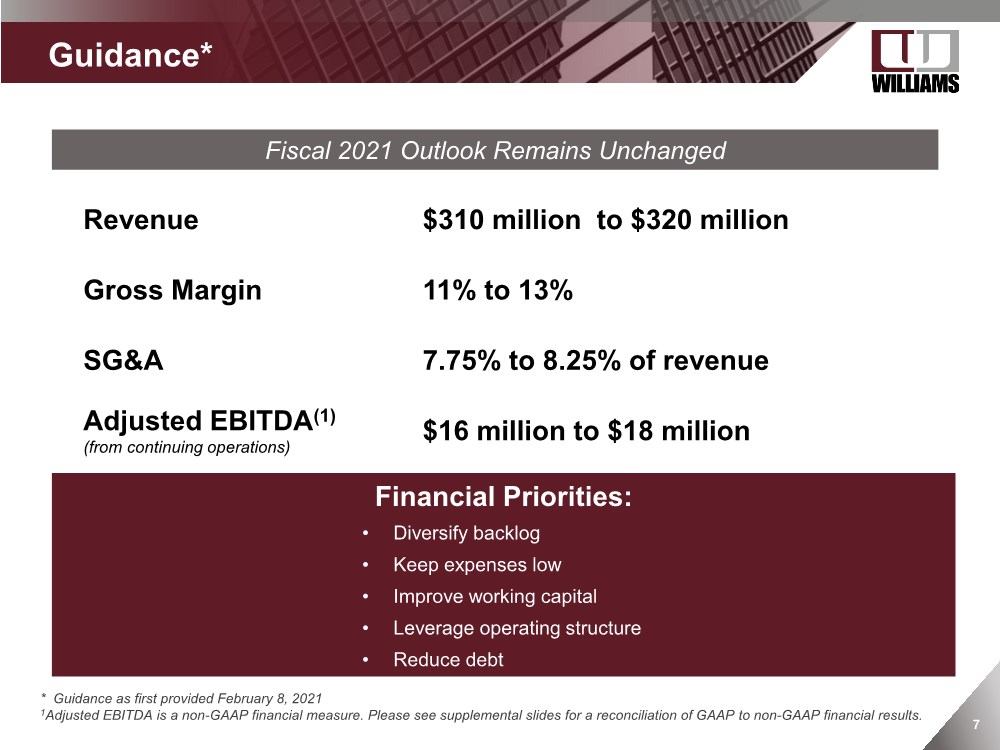
| 7 ▪ Guidance* * Guidance as first provided February 8, 2021 1Adjusted EBITDA is a non-GAAP financial measure. Please see supplemental slides for a reconciliation of GAAP to non-GAAP financial results. Fiscal 2021 Outlook Remains Unchanged Revenue $310 million to $320 million Gross Margin 11% to 13% SG&A 7.75% to 8.25% of revenue Adjusted EBITDA(1) (from continuing operations) $16 million to $18 million Financial Priorities: • Diversify backlog • Keep expenses low • Improve working capital • Leverage operating structure • Reduce debt |
| NYSE American: WLMS Adjusted EBITDA Adjusted EBITDA is not calculated through the application of GAAP and is not the required form of disclosure by the U.S. Securities and Exchange Commission. Adjusted EBITDA is the sum of the Company’s net income (loss) before interest expense, net, and income tax (benefit) expense and unusual gains or charges. It also excludes non-cash charges such as depreciation and amortization. The Company’s management believes adjusted EBITDA is an important measure of operating performance because it allows management, investors and others to evaluate and compare the performance of its core operations from period to period by removing the impact of the capital structure (interest), tangible and intangible asset base (depreciation and amortization), taxes and unusual gains or charges (stock-based compensation, severance costs, other non-recurring expenses, franchise taxes, loss on other receivables, consulting expenses, bank fees, foreign currency (gain) loss, loss on extinguishment of debt and settlement expenses), which are not always commensurate with the reporting period in which such items are included. Williams’ credit facility also contains ratios based on EBITDA. Adjusted EBITDA should not be considered an alternative to net income or as a better measure of liquidity than net cash flows from operating activities, as determined by GAAP, and, therefore, should not be used in isolation from, but in conjunction with, the GAAP measures. The use of any non-GAAP measure may produce results that vary from the GAAP measure and may not be comparable to a similarly defined non-GAAP measure used by other companies. Note Regarding Forward-Looking Non-GAAP Financial Measures The Company does not provide a reconciliation of forward-looking non-GAAP financial measures to their comparable GAAP financial measures because it could not do so without unreasonable effort due to the unavailability of the information needed to calculate reconciling items and due to the variability, complexity and limited visibility of the adjusting items that would be excluded from the non- GAAP financial measures in future periods. When planning, forecasting and analyzing future periods, the Company does so primarily on a non-GAAP basis without preparing a GAAP analysis. ▪ Supplemental Information |
| 9 9 Adjusted EBITDA Reconciliation Three Months Ended June 30, Six Months Ended June 30, (in thousands) 2021 2020 2021 2020 Income from continuing operations $ 2,646 $ 2,509 $ 1,063 $ 1,580 Add back: Interest expense, net 1,213 1,566 2,506 3,099 Income tax expense 78 196 262 244 Depreciation and amortization expense 46 57 87 98 Stock-based compensation 745 616 1,460 1,087 Other professional fees — 7 — 163 Franchise taxes 62 63 122 139 Settlement expenses — — — 69 Foreign currency (gain) loss 86 (36) (4) 59 Adjusted EBITDA - continuing operations $ 4,876 $ 4,978 $ 5,496 $ 6,538 |
