Attached files
| file | filename |
|---|---|
| 8-K - FORM 8-K - SmartStop Self Storage REIT, Inc. | ck1585389-8k_20210817.htm |
| EX-99.1 - EX-99.1 - SmartStop Self Storage REIT, Inc. | ck1585389-ex991_15.htm |
Exhibit 99.2

Smartshop self storage reit, inc. …the smarter way to store!® financial supplement Q2 2021

Table of Contents Portfolio Snapshot as of 6/30/21 3 About SmartStop Self Storage REIT, Inc 4 Earnings Release 5 Financial Highlights 18 Trailing Five Quarter Financials: Condensed Balance Sheet 19 Trailing Five Quarter Financials: Condensed Income Statement 20 Trailing Five Quarter Financials: FFO Reconciliation 21 Store Portfolio Reporting Information22 Same-Store Portfolio Details 23 Same-Store Portfolio MSA Summary 24 Total Portfolio MSA Summary as of 6/30/21 25 Toronto Portfolio Overview at 6/30/21 26 SmartCentres Joint Venture Overview 27 Debt and Capital Structure Summary 28 Managed REIT Overview 29 Appendix 30 Reconciliation of Same-Store Revenue and Net Operating Income 31 Reconciliation of Net Loss to Net Operating Income: Trailing 5 Quarters 32 Forward Looking Statements 33

Portfolio Snapshot as of 6/30/21 SmartStop Self Storage REIT, Inc. The Smarter Way to Store! 155 Properties Owned & Managed in the US and Canada 96.3% SmartStop Same-Store Occupancy as of 6/30/21 11.9M NRSF Owned & Managed in the US and Canada 21.5% Same-Store Revenue Growth in 2Q21 17 PROPERTIES Owned & Managed in the Greater Toronto Area 28.7 Same-Store NOI Growth in 2Q21 Historical SmartStop Self Storage REIT, Inc. Properties 114 properties Historical SST IV Properties*30 properties *Includes properties owned in JV with SmartCentres Note: SmartStop Self Storage REIT, Inc. acquired the 30 assets owned by Strategic Storage Trust IV, Inc. ("SST IV") in a merger that closed on 3/17/21. Property counts are as of 6/30/21. 1. Same-store revenue and NOI are non-GAAP measures. See Appendix for a reconciliation of these measures to the most directly comparable GAAP financial measure. SmartStop Self Storage REIT, Inc. | Financial Supplement 2021 Q2 3

About SmartStop Self Storage REIT, Inc. SmartStop Self Storage REIT, Inc. The Smarter Way to Store! SmartStop Self Storage REIT, Inc. SmartStop Self Storage REIT, Inc. ("SmartStop") is a self-managed REIT with a fully integrated operations team of approximately 400 self storage professionals focused on growing the SmartStop® Self Storage brand. SmartStop, through its indirect subsidiary SmartStop REIT Advisors, LLC, also sponsors other self storage programs. SmartStop is the tenth- largest self storage company in the U.S., with approximately $1.8 billion of real estate assets under management, including an owned and managed portfolio of 155 properties in 19 states and Ontario, Canada and comprising approximately 105,000 units and 11.9 million rentable square feet. SmartStop and its affiliates own or manage 17 operating self storage properties in Ontario, Canada, which total approximately 14,300 units and 1.5 million rentable square feet. Additional information regarding SmartStop is available at www.smartstopselfstorage.com. COMPANY INFORMATION Headquarters: Investor Relations: Information Requests: 10 Terrace Road David Corak To request an Investor Relations package or annual report, please visit our website at Ladera Ranch, California 92694 VP of Corporate Finance 949-542-3331 www.smartstop.com or email ir@smartstop.com Ladera Ranch, California SmartStop Self Storage REIT, Inc. | Financial Supplement 2021 Q2

Earnings Release SmartStop Self Storage REIT, Inc. The Smarter Way to Store! SmartStop Self Storage REIT, Inc. The Smarter Way to Store! August 17, 2021 SmartStop Self Storage REIT, Inc. Reports Strong Second Quarter 2021 Results with Record Same-Store Revenue and NOI Growth LADERA RANCH, CA – August 17, 2021 – SmartStop Self Storage REIT, Inc. (“SmartStop”), a self-managed and fully- integrated self storage company with approximately $1.8 billion of self storage assets under management, announced its overall results for the three and six months ended June 30, 2021. “SmartStop had an exceptionally strong second quarter, with our highest ever recorded same-store occupancy of 96.3% at quarter end and strong rental rate growth. This resulted in same-store revenue and NOI growth of 21.5% and 28.7% for the quarter, respectively, both higher than all of our publicly-traded peers,” said H. Michael Schwartz, Chairman and Chief Executive Officer of SmartStop. “Our best-in-class portfolio posted strong results in all of our markets throughout North America. Specifically, the Greater Toronto Area (“the GTA”) was our best performing market this quarter with same- store revenue and NOI growth of 33.6% and 45.0%, respectively. The GTA continues to be a high performing market, a key differentiator between SmartStop and our peer group and a primary piece of our Company’s growth initiatives. On the external growth front, we continue to find accretive acquisitions, acquiring two wholly-owned properties for $31 million during the quarter and our acquisition pipeline remains healthy. With ample attractively priced capital, a strong acquisitions pipeline and a robust operating environment, we believe the company is well positioned to execute both our internal and external growth initiatives, driving stockholder value in 2021 and beyond.” Three Months Ended June 30, 2021 Financial Highlights: Net loss attributable to common stockholders decreased by approximately $4.6 million when compared to the same period in 2020. Net loss per Class A and Class T shares (basic and diluted) decreased $0.09 when compared to the same period in 2020. Total self storage-related revenues increased by approximately $14.0 million, or 53.6%, when compared to the same period in 2020. FFO, as adjusted (attributable to common stockholders and Operating Partnership (“OP”) unit holders), increased by approximately $7.7 million, or 445%, when compared to the same period in 2020. FFO, as adjusted per share and OP unit outstanding - diluted was $0.10, an increase of $0.07, or 233%, when compared to the same period in 2020. Same-store revenues increased by 21.5% compared to the same period in 2020. Same-store expenses increased by 7.2% compared to the same period in 2020. Same-store NOI increased by 28.7% compared to the same period in 2020. Same-store average physical occupancy increased by 6.1% to 95.8% for the three months ended June 30, 2021, compared to 89.7% during the same period in 2020. Same-store annualized rent per occupied square foot was approximately $16.50 for the three months ended June 30, 2021, which represented an increase of approximately 14.7% when compared to the same period in 2020. Six Months Ended June 30, 2021 Financial Highlights: Net loss attributable to common stockholders decreased by approximately $25.8 million when compared to the same period in 2020. Net loss per Class A and Class T shares (basic and diluted) decreased $0.50 when compared to the same period in 2020. SmartStop Self Storage REIT, Inc. | Financial Supplement 2021 Q2 5

Earnings Release(Continued) SmartStop Self Storage REIT, Inc. The Smarter Way to Store! Total self storage-related revenues increased by approximately $18.3 million, or 34.7%, when compared to the same period in 2020. Same-store revenues increased by 15.5% compared to the same period in 2020. Same-store expenses increased by 4.1% compared to the same period in 2020. Same-store NOI increased by 21.4% compared to the same period in 2020. Same-store average physical occupancy increased by 5.3% to 94.5% for the six months ended June 30, 2021, compared to 89.2% during the same period in 2020. Same-store annualized rent per occupied square foot was approximately $15.93 for the six months ended June 30, 2021, which represented an increase of approximately 8.9% when compared to the same period in 2020. External Growth In April, SmartStop acquired a recently built, six-story self storage facility in Oakville, Ontario, Canada. The property was completed in April 2020 and was approximately 40% occupied at acquisition. The property’s 1,070 units are 100% climate-controlled across approximately 81,500 square feet. The property offers customers a variety of amenities including state-of-the-art security systems, elevators, keypad access, a gated drive-in loading area and more. The facility is our third in Oakville, establishing SmartStop as a dominant player in the submarket. This was SmartStop’s 17th owned or managed operating property in the GTA. In May, SmartStop acquired a self storage facility in Riverside, CA, the most populous city in Southern California’s “Inland Empire.” This prime location has great visibility from Van Buren Boulevard and provides easy access from the Riverside Freeway. The facility serves the communities of La Sierra, Corona, East Vale, Ramona, and Jurupa Valley and is located next to Riverside Municipal Airport. The property’s 379 units and 71 RV parking spaces span across approximately 68,700 square feet. The property offers customers a variety of amenities including a gated drive-in loading area, state-of-the- art security systems, keypad access and large truck accessibility. With an RV parking component, this new facility offers customers a complimentary product type from our two neighboring SmartStop facilities, one of which is directly adjacent. The facility is the Company’s third in the submarket and 29th owned or managed location in California. Declared Distributions On June 23, 2021, SmartStop’s board of directors declared a distribution rate for the third quarter of 2021, of approximately $0.00164 per day per share on the outstanding shares of common stock payable to both Class A and Class T stockholders. In connection with these distributions, after the stockholder servicing fee is paid, approximately $0.0014 per day will be paid per Class T share. Such distributions payable to each stockholder of record during a month will be paid the following month. Contact: David Corak VP of Corporate Finance SmartStop Self Storage REIT, Inc. 949-542-3331 ir@smartstop.com SmartStop Self Storage REIT, Inc. | Financial Supplement 2021 Q2 6

Earnings Release(Continued) SmartStop Self Storage REIT, Inc. The Smarter Way to Store! SMARTSTOP SELF STORAGE REIT, INC. AND SUBSIDIARIES CONSOLIDATED BALANCE SHEETS June 30, 2021(Unaudited) December 31, 2020 ASSETS Real estate facilities: Land $ 396,430,618 $ 335,800,354 Buildings 1,101,336,919 810,480,845Site improvements 77,553,126 63,821,383 1,575,320,663 1,210,102,582 Accumulated depreciation (135,187,165 ) (115,903,045 ) 1,440,133,498 1,094,199,537 Construction in process 1,857,047 1,761,303 Real estate facilities, net 1,441,990,545 1,095,960,840 Cash and cash equivalents 26,580,765 72,705,624 Restricted cash 7,276,448 7,952,052 Investments in unconsolidated real estate ventures 20,682,690 —Investments in and advances to Managed REITs 12,033,750 15,624,389 Other assets, net 14,087,618 7,734,276 Intangible assets, net of accumulated amortization 21,190,218 12,406,427 Trademarks, net of accumulated amortization 16,123,529 16,194,118 Goodwill 53,643,331 53,643,331 Debt issuance costs, net of accumulated amortization 2,258,004 — Total assets $ 1,615,866,898 $ 1,282,221,057 LIABILITIES AND EQUITY Debt, net $ 849,209,991 $ 717,952,233 Accounts payable and accrued liabilities 24,971,528 23,038,976 Due to affiliates 694,739 667,429 Distributions payable 8,088,854 6,650,317 Contingent earnout 19,900,000 28,600,000 Deferred tax liabilities 7,704,673 8,380,215 Total liabilities 910,569,785 785,289,170 Commitments and contingencies Redeemable common stock 64,028,104 57,335,575 Preferred stock, $0.001 par value; 200,000,000 shares authorized: Series A Convertible Preferred Stock, $0.001 par value; 200,000 shares authorized; 200,000 and 200,000 shares issued and outstanding at June 30, 2021 and December 31, 2020, respectively, with aggregate liquidation preferences of $203,116,438 and $202,928,620 at June 30, 2021 and December 31, 2020, respectively 196,356,107 196,356,107 Equity: SmartStop Self Storage REIT, Inc. equity: Class A common stock, $0.001 par value; 350,000,000 shares authorized; 76,516,281 and 52,660,402 shares issued and outstanding at June 30, 2021 and December 31, 2020, respectively Class T common stock, $0.001 par value; 350,000,000 shares authorized; 7,978,951 and 7,903,911 shares issued and outstanding at June 30, 2021 and December 31, 2020, respectively 7,979 7,904 Additional paid-in capital 724,292,971 492,408,006 Distributions (185,799,706 ) (163,953,169 ) Accumulated deficit (159,234,728 ) (141,444,880 ) Accumulated other comprehensive loss (1,882,006 ) (3,834,228 ) Total SmartStop Self Storage REIT, Inc. equity 377,461,027 183,236,294 Noncontrolling interests in our Operating Partnership 67,440,975 59,982,111 Other noncontrolling interests 10,900 21,800 Total noncontrolling interests 67,451,875 60,003,911 Total equity 444,912,902 243,240,205 Total liabilities and equity $ 1,615,866,898 $ 1,282,221,057

Earnings Release (Continued) SMARTSTOP SELF STORAGE REIT, INC. AND SUBSIDIARIES CONSOLIDATED STATEMENTS OF OPERATIONS (Unaudited) Three Months Ended June 30, Six Months Ended June 30, 2021 2020 2021 2020 Revenues: Self storage rental revenue $ 38,104,699 $ 24,946,793 $ 67,608,141 $ 50,514,812 Ancillary operating revenue 2,027,041 1,183,418 3,584,471 2,336,261 Managed REIT Platform revenue 1,058,291 1,852,893 3,346,031 3,636,680 Reimbursable costs from Managed REITs 1,061,619 1,486,441 2,277,662 3,279,915 Total revenues 42,251,650 29,469,545 76,816,305 59,767,668 Operating expenses: Property operating expenses 12,479,969 9,195,043 22,823,250 18,870,069 Managed REIT Platform expenses 316,142 1,008,014 636,032 2,182,823 Reimbursable costs from Managed REITs 1,061,619 1,486,441 2,277,662 3,279,915 General and administrative 6,811,313 4,149,713 11,564,302 7,817,660 Depreciation 10,742,801 7,842,443 19,286,728 15,559,114 Intangible amortization expense 3,653,681 3,218,152 4,913,228 6,887,783 Acquisition expenses 30,448 97,221 336,098 125,326 Contingent earnout adjustment 400,000 500,000 2,519,744 (6,700,000 ) Impairment of goodwill and intangible assets — — — 36,465,732 Impairment of investments in Managed REITs — — — 4,376,879 Write-off of equity interest and preexisting relationships in SST IV upon acquisition of control — — 8,389,573 — Total operating expenses 35,495,973 27,497,027 72,746,617 88,865,301 Gain on sale of real estate 178,631 — 178,631 — Operating income (loss) 6,934,308 1,972,518 4,248,319 (29,097,633 ) Other income (expense): Interest expense (7,950,702 ) (8,284,429 ) (15,926,166 ) (16,623,732 ) Interest expense – accretion of fair market value of secured debt 31,250 32,892 63,116 65,549 Interest expense – debt issuance costs (496,897 ) (936,278 ) (1,169,370 ) (1,879,761 ) Net loss on extinguishment of debt — — (2,444,788 ) — Other 171,203 152,456 1,614,585 2,729,155 Net loss (1,310,838 ) (7,062,841 ) (13,614,304 ) (44,806,422 ) Net loss attributable to the noncontrolling interests in our Operating Partnership 546,092 933,443 2,023,086 5,965,095 Less: Distributions to preferred stockholders (3,116,438 ) (2,362,023 ) (6,198,630 ) (4,724,045 ) Net loss attributable to SmartStop Self Storage REIT, Inc. common stockholders $ (3,881,184 ) $ (8,491,421 ) $ (17,789,848 ) $ (43,565,372 ) Net loss per Class A share – basic and diluted $ (0.05 ) $ (0.14 ) $ (0.24 ) $ (0.74 ) Net loss per Class T share – basic and diluted $ (0.05 ) $ (0.14 ) $ (0.24 ) $ (0.74 ) Weighted average Class A shares outstanding – basic and diluted 75,994,754 51,622,509 66,252,067 51,469,807 Weighted average Class T shares outstanding – basic and diluted 7,960,999 7,776,128 7,944,502 7,764,393 SmartStop Self Storage REIT, Inc. Financial Supplement 2021 Q2 8

Earnings Release (Continued) SMARTSTOP SELF STORAGE REIT, INC. AND SUBSIDIARIES NON-GAAP MEASURE – COMPUTATION OF ADJUSTED FUNDS FROM OPERATIONS (Unaudited) Three Months Ended June 30, 2021 Three Months Ended June 30, 2020 Six Months Ended June 30, 2021 Six Months Ended June 30, 2020 Net loss (attributable to common stockholders) $ (3,881,184 ) $ (8,491,421 ) $ (17,789,848 ) $ (43,565,372 ) Add: Depreciation of real estate 10,521,283 7,705,792 18,898,768 15,293,130 Depreciation and amortization of real estate and intangible assets from unconsolidated entities 213,959 — 230,996 — Amortization of real estate related intangible assets 3,441,144 2,170,465 4,003,229 4,343,030 Gain on deconsolidation (169,533 ) — (169,533 ) — Gain on sale of real estate (178,631 ) — (178,631 ) — Deduct: Adjustment for noncontrolling interests (1,500,869 ) (1,305,577 ) (2,616,924 ) (2,603,208 ) FFO (attributable to common stockholders) 8,446,169 79,259 2,378,057 (26,532,420 ) Other Adjustments: Intangible amortization expense - contracts(1) 212,537 1,047,687 909,999 2,544,753 Acquisition expenses(2) 30,448 97,221 336,098 125,326 Acquisition expenses and foreign currency (gains) losses, net from unconsolidated entities 107,388 — 107,388 — Contingent earnout adjustment(3) 400,000 500,000 2,519,744 (6,700,000 ) Impairment of goodwill and intangible assets(4) — — — 36,465,732 Impairment of investments in Managed REITs(4) — — — 4,376,879 Write-off of equity interest and preexisting relationships in SST IV upon acquisition of control — — 8,389,573 — Accretion of fair market value of secured debt(5) (31,250 ) (32,892 ) (63,116 ) (65,549 ) Net loss on extinguishment of debt(6) — — 2,444,788 — Foreign currency and interest rate derivative (gains) losses, net(7) (643,547 ) (57,676 ) (425,549 ) 109,843 Adjustment of deferred tax liabilities(1) (56,880 ) (276,216 ) (1,929,746 ) (3,023,113 ) Adjustment for noncontrolling interests (1,784 ) (168,680 ) (1,435,079 ) (4,488,613 ) FFO, as adjusted (attributable to common stockholders) 8,463,081 1,188,703 13,232,157 2,812,838 Net loss attributable to the noncontrolling interests in our Operating Partnership (546,092 ) (933,443 ) (2,023,086 ) (5,965,095 ) Adjustment for noncontrolling interests 1,502,653 1,474,257 4,052,003 7,091,820 FFO, as adjusted (attributable to common Stockholders and OP unit holders) $ 9,419,642 $ 1,729,517 $ 15,261,074 $ 3,939,563 (1) These items represent the amortization, accretion, or adjustment of intangible assets or deferred tax liabilities. As these items are non-cash and not primary drivers in SmartStop’s decision-making process, FFO is adjusted for their effect to arrive at FFO, as adjusted, as a means of determining a comparable sustainable operating performance metric to other real estate companies. (2) In evaluating investments in real estate, SmartStop differentiates the costs to acquire the investment from the operations derived from the investment. Such information would be comparable only for publicly registered, non-traded REITs that have generally completed their acquisition activity and have other similar operating characteristics. (3) The contingent earnout adjustment represents the adjustment to the fair value of the Class A-2 Units issued in connection with the Self Administration Transaction. FFO is adjusted to arrive at FFO, as adjusted, as this acquisition related item is not a primary driver in SmartStop’s decision-making process and excluding this provides investors a view of SmartStop’s continuing operating portfolio performance over time. SmartStop Self Storage REIT, Inc. Financial Supplement 2021 Q2 9

Earnings Release (Continued) (4) The impairment charges relate to SmartStop’s goodwill, intangible assets and investments in the Managed REIT Platform acquired in the Self Administration Transaction. SmartStop believes that adjusting for such non-recurring items provides useful supplemental information because such expenses may not be reflective of on-going operations and is consistent with management’s analysis of SmartStop’s operating performance and provides for a means of determining a comparable sustainable operating performance metric. (5) This represents the difference between the stated interest rate and the estimated market interest rate on assumed notes as of the date of acquisition. Such amounts have been excluded from FFO, as adjusted, because SmartStop believes FFO, as adjusted, provides useful supplementary information by focusing on operating fundamentals, rather than events not related to SmartStop’s normal operations. SmartStop is responsible for managing interest rate risk and do not rely on another party to manage such risk. (6) The net loss associated with the extinguishment of debt includes prepayment penalties, the write-off of unamortized deferred financing fees, and other fees incurred. SmartStop believes that adjusting for such non-recurring items provides useful supplemental information because such losses may not be reflective of on-going transactions and operations and is consistent with management’s analysis of SmartStop’s operating performance. (7) This represents the mark-to-market adjustment for SmartStop’s derivative instruments not designated for hedge accounting and the ineffective portion of the change in fair value of derivatives recognized in earnings, as well as changes in foreign currency related to SmartStop’s foreign equity investments not classified as long term. These derivative contracts are intended to manage the Company’s exposure to interest rate and foreign currency risk which may not be reflective of SmartStop’s ongoing performance and may reflect unrealized impacts on SmartStop’s operating performance. Such amounts are recorded in “Other” within SmartStop’s consolidated statements of operations.

SMARTSTOP SELF STORAGE REIT, INC. AND SUBSIDIARIES NON-GAAP MEASURE – COMPUTATION OF SAME-STORE OPERATING RESULTS (Unaudited) The following table sets forth operating data for SmartStop’s same-store facilities (those properties included in the consolidated results of operations since January 1, 2020, excluding nine lease-up properties SmartStop owned as of January 1, 2020) for the three months ended June 30, 2021 and 2020. SmartStop considers the following data to be meaningful as this allows for the comparison of results without the effects of acquisition, lease up, or development activity. Same-Store Facilities Non Same-Store Facilities Total 2021 2020 % Change 2021 2020 % Change 2021 2020 % Change Revenue (1) $ 30,011,041 $ 24,702,072 21.5 % $ 10,120,699 $ 1,428,139 N/M $ 40,131,740 $ 26,130,211 53.6 % Property operating expenses (2) 8,878,839 8,279,464 7.2 % 3,601,130 915,579 N/M 12,479,969 9,195,043 35.7 % Property operating income $ 21,132,202 $ 16,422,608 28.7 % $ 6,519,569 $ 512,560 N/M $ 27,651,771 $ 16,935,168 63.3 % Number of facilities 103 103 36 ( 6) 9 139 (6) 112 Rentable square feet (3) 7,595,600 7,557,300 2,982,400 680,300 10,578,000 (6) 8,237,600 Average physical occupancy (4) 95.8 % 89.7 % N/M N/M 94.6 % 88.1 % Annualized rent per occupied square foot (5) $ 16.50 $ 14.38 N/M N/M $ 16.18 $ 14.12 N/M Not meaningful (1) Revenue includes rental revenue, Tenant Programs revenue, ancillary revenue, and administrative and late fees. (2) Property operating expenses excludes corporate general and administrative expenses, interest expense, depreciation, amortization expense, and acquisition expenses. (3) Of the total rentable square feet, parking represented approximately 937,000 square feet and 678,000 square feet as of June 30, 2021 and 2020, respectively. On a same-store basis, for the same periods, parking represented approximately 678,000 square feet. (4) Determined by dividing the sum of the month-end occupied square feet for the applicable group of facilities for each applicable period by the sum of their month-end rentable square feet for the period. (5) Determined by dividing the aggregate realized rental income for each applicable period by the aggregate of the month-end occupied square feet for the period. Properties are included in the respective calculations in their first full month of operations, as appropriate. SmartStop has excluded the realized rental revenue and occupied square feet related to parking herein for the purpose of calculating annualized rent per occupied square foot. (6) Included in the non same-store data is a self storage facility consisting of approximately 84,000 square feet owned by SST VI OP for the period during which SmartStop consolidated their financial statements. As of June 30, 2021, SmartStop was no longer required to consolidate their financial statements. SmartStop’s same-store revenue increased by approximately $5.3 million for the three months ended June 30, 2021 compared to the three months ended June 30, 2020 due to higher annualized rent per occupied square foot and increased occupancy. SmartStop Self Storage REIT, Inc. | Financial Supplement 2021 Q211

The following table presents a reconciliation of net loss as presented on SmartStop’s consolidated statements of operations to property operating income, as stated above, for the periods indicated: For the Three Months Ended June 30, 2021 2020 Net loss $ (1,310,838 ) $ (7,062,841 ) Adjusted to exclude: Managed REIT Platform revenue (1,058,291 ) (1,852,893 ) Managed REIT Platform expenses 316,142 1,008,014 General and administrative 6,811,313 4,149,713 Depreciation 10,742,801 7,842,443 Intangible amortization expense 3,653,681 3,218,152 Acquisition expenses 30,448 97,221 Contingent earnout adjustment 400,000 500,000 Gain on sale of real estate (178,631 ) — Interest expense 7,950,702 8,284,429 Interest expense – accretion of fair market value of secured debt (31,250 ) (32,892 ) Interest expense – debt issuance costs 496,897 936,278 Other (171,203 ) (152,456 ) Total property operating income $ 27,651,771 $ 16,935,168 SmartStop Self Storage REIT, Inc. | Financial Supplement 2021 Q212

The following table presents a reconciliation of same-store metrics by Metropolitan Statistical Area (“MSA”) or Census Metropolitan Areas (“CMA”), for the periods indicated: indicated: (1) RentPOF defined as rental revenue net of discounts & concessions, excluding late fees, admin fees and parking income, divided by occupied square feet of storage.. (2) Presented in US Dollars (USD) as translated on average for the quarter. (3) Same-store revenue, expense and NOI are non-GAAP measures. See Computation of Same-Store Operating Results for a reconciliation of these measures to the most directly comparable GAAP financial measures. % of # of Net Rentable Net Rent per Occupied Sq. Ft. for the Three Months Ended June 30,(1) Avg. Occupancy for the Three Months Ended June 30, % Revenue for the Three Months Ended June 30,(3) % Expenses for the Three Months Ended June 30,(3) % NOI for the Three Months Ended June 30,(3) % MSA/CMA NOI Stores Sq. Ft. Units 2021 2020 2021 2020 Change 2021 2020 Change 2021 2020 Change 2021 2020 Change Miami – Fort Lauderdale 15.8 % 9 941,400 7,750 $ 20.65 $ 18.70 94.8 % 88.8 % 6.0 % $ 4,429,592 $ 3,790,280 16.9 % $ 1,087,089 $ 1,009,228 7.7 % $ 3,342,503 $ 2,781,052 20.2 % Toronto (2) 14.7 % 10 849,600 7,800 20.20 15.13 95.5 % 92.5 % 3.0 % 4,222,800 3,159,757 33.6 % 1,107,797 1,011,978 9.5 % 3,115,003 2,147,779 45.0 % Los Angeles 11.4 % 10 660,400 6,200 19.78 17.75 96.8 % 90.8 % 5.9 % 3,201,084 2,640,544 21.2 % 794,447 750,095 5.9 % 2,406,637 1,890,449 27.3 % Asheville 7.6 % 13 780,200 5,530 12.79 11.35 95.4 % 89.3 % 6.1 % 2,243,269 1,941,617 15.5 % 645,575 579,851 11.3 % 1,597,694 1,361,766 17.3 % Las Vegas 7.2 % 5 552,500 4,380 15.30 13.35 96.3 % 91.3 % 5.0 % 1,871,000 1,523,832 22.8 % 355,546 344,191 3.3 % 1,515,454 1,179,641 28.5 % San Francisco – Oakland 6.2 % 4 322,600 2,920 21.93 19.66 95.5 % 88.5 % 7.1 % 1,748,144 1,436,514 21.7 % 445,084 421,353 5.6 % 1,303,060 1,015,161 28.4 % Detroit 3.1 % 4 266,100 2,220 13.05 11.93 96.8 % 87.8 % 8.9 % 874,187 724,116 20.7 % 212,137 200,405 5.9 % 662,050 523,711 26.4 % Riverside - SB 3.0 % 3 180,700 1,770 17.58 14.50 98.8 % 92.8 % 6.0 % 828,481 643,495 28.7 % 192,051 186,064 3.2 % 636,430 457,431 39.1 % Dayton 2.8 % 7 392,400 3,340 10.58 8.89 95.5 % 92.9 % 2.6 % 1,035,962 857,345 20.8 % 441,251 361,157 22.2 % 594,711 496,188 19.9 % Port St. Lucie 2.7 % 3 251,600 2,010 15.46 13.49 96.6 % 86.9 % 9.7 % 896,173 707,321 26.7 % 333,659 344,826 -3.2 % 562,514 362,495 55.2 % Denver 2.6 % 5 290,700 2,550 12.73 11.66 96.3 % 86.7 % 9.6 % 945,909 779,657 21.3 % 401,721 375,148 7.1 % 544,188 404,509 34.5 % Chicago 2.4 % 5 315,600 2,880 11.97 10.82 95.8 % 87.7 % 8.1 % 959,511 785,361 22.2 % 459,223 416,239 10.3 % 500,288 369,122 35.5 % Myrtle Beach 2.1 % 2 197,800 1,450 12.51 11.86 93.7 % 88.0 % 5.8 % 572,286 501,239 14.2 % 133,829 127,569 4.9 % 438,457 373,670 17.3 % Raleigh - Cary 1.4 % 3 163,800 1,090 11.02 10.17 96.6 % 89.6 % 7.0 % 436,942 369,200 18.3 % 151,057 159,630 -5.4 % 285,885 209,570 36.4 % Other 17.2 % 20 1,430,200 12,780 16.42 14.53 95.9 % 89.1 % 6.7 % 5,745,701 4,841,794 18.7 % 2,118,373 1,991,730 6.4 % 3,627,328 2,850,064 27.3 % Total Same-Store 100.0 % 103 7,595,600 64,670 $ 16.50 $ 14.38 95.8 % 89.7 % 6.1 % $ 30,011,041 $ 24,702,072 21.5 % $ 8,878,839 $ 8,279,464 7.2 % $ 21,132,202 $ 16,422,608 28.7 % SmartStop Self Storage REIT, Inc. | Financial Supplement 2021 Q213

The following table sets forth operating data for SmartStop’s same-store facilities (those properties included in the consolidated results of operations since January 1, 2020, excluding nine lease-up properties SmartStop owned as of January 1, 2020) for the six months ended June 30, 2021 and 2020. SmartStop considers the following data to be meaningful as this allows for the comparison of results without the effects of acquisition, lease up, or development activity. Same-Store Facilities Non Same-Store Facilities Total 2021 2020 % Change 2021 2020 % Change 2021 2020 % Change Revenue (1) $ 57,882,936 $ 50,107,107 15.5 % $ 13,309,676 $ 2,743,966 N/M $ 71,192,612 $ 52,851,073 34.7 % Property operating expenses (2) 17,696,351 16,996,158 4.1 % 5,126,899 1,873,911 N/M 22,823,250 18,870,069 20.9 % Property operating income $ 40,186,585 $ 33,110,949 21.4 % $ 8,182,777 $ 870,055 N/M $ 48,369,362 $ 33,981,004 42.3 % Number of facilities 103 103 36 (6) 9 139 (6) 112 Rentable square feet (3) 7,595,600 7,557,300 2,982,400 680,300 10,578,000 (6) 8,237,600 Average physical occupancy (4) 94.5 % 89.2 % N/M N/M 93.5 % 87.4 % Annualized rent per occupied square foot (5) $ 15.93 $ 14.63 N/M N/M $ 15.72 $ 14.40 N/M Not meaningful (1) Revenue includes rental revenue, Tenant Programs revenue, ancillary revenue, and administrative and late fees. (2) Property operating expenses excludes corporate general and administrative expenses, interest expense, depreciation, amortization expense, and acquisition expenses. Property operating expenses for the six months ended June 30, 2020 also includes COVID-19 related costs, including specialized cleaning costs, the purchase of personal protective equipment, and bonuses to SmartStop’s store personnel, totaling approximately $0.5 million. On a same-store basis, COVID-19 related costs represented approximately $0.5 million of the total property operating expenses for the six months ended June 30, 2020. (3) Of the total rentable square feet, parking represented approximately 937,000 square feet and 678,000 square feet as of June 30, 2021 and 2020, respectively. On a same-store basis, for the same periods, parking represented approximately 678,000 square feet. (4) Determined by dividing the sum of the month-end occupied square feet for the applicable group of facilities for each applicable period by the sum of their month-end rentable square feet for the period. (5) Determined by dividing the aggregate realized rental income for each applicable period by the aggregate of the month-end occupied square feet for the period. Properties are included in the respective calculations in their first full month of operations, as appropriate. SmartStop has excluded the realized rental revenue and occupied square feet related to parking herein for the purpose of calculating annualized rent per occupied square foot. (6) Included in the non same-store data is a self storage facility consisting of approximately 84,000 square feet owned by SST VI OP for the period during which SmartStop consolidated their financial statements. As of June 30, 2021, SmartStop was no longer required to consolidate their financial statements. SmartStop’s same-store revenue increased by approximately $7.8 million for the six months ended June 30, 2021 compared to the six months ended June 30, 2020 due to higher annualized rent per occupied square foot and increased occupancy. SmartStop Self Storage REIT, Inc. | Financial Supplement 2021 Q214

The following table presents a reconciliation of net loss as presented on SmartStop’s consolidated statements of operations to property operating income, as stated above, for the periods indicated: For the Six Months Ended June 30, 2021 2020 Net loss $ (13,614,304 ) $ (44,806,422 ) Adjusted to exclude: Managed REIT Platform revenue (3,346,031 ) (3,636,680 ) Managed REIT Platform expenses 636,032 2,182,823 General and administrative 11,564,302 7,817,660 Depreciation 19,286,728 15,559,114 Intangible amortization expense 4,913,228 6,887,783 Acquisition expenses 336,098 125,326 Contingent earnout adjustment 2,519,744 (6,700,000 ) Impairment of goodwill and intangible assets — 36,465,732 Impairment of investments in Managed REITs — 4,376,879 Write-off of equity interest and preexisting relationships in SST IV upon acquisition of control 8,389,573 — Gain on sale of real estate (178,631 ) — Interest expense 15,926,166 16,623,732 Interest expense – accretion of fair market value of secured debt (63,116 ) (65,549 ) Interest expense – debt issuance costs 1,169,370 1,879,761 Net loss on extinguishment of debt 2,444,788 — Other (1,614,585 ) (2,729,155 ) Total property operating income $ 48,369,362 $ 33,981,004 SmartStop Self Storage REIT, Inc. | Financial Supplement 2021 Q215

ADDITIONAL INFORMATION REGARDING NOI, FFO, and FFO, as adjusted Net Operating Income (“NOI”) NOI is a non-GAAP measure that SmartStop defines as net income (loss), computed in accordance with GAAP, generated from properties before corporate general and administrative expenses, asset management fees, interest expense, depreciation, amortization, acquisition expenses and other non-property related expenses. SmartStop believes that NOI is useful for investors as it provides a measure of the operating performance of its operating assets because NOI excludes certain items that are not associated with the ongoing operation of the properties. Additionally, SmartStop believes that NOI (also referred to as property operating income) is a widely accepted measure of comparative operating performance in the real estate community. However, SmartStop’s use of the term NOI may not be comparable to that of other real estate companies as they may have different methodologies for computing this amount. Funds from Operations (“FFO”) and FFO, as Adjusted Funds from Operations Funds from operations (“FFO”) is an industry wide metric promulgated by the National Association of Real Estate Investment Trusts, or NAREIT, which SmartStop believes to be an appropriate supplemental measure to reflect the operating performance of a REIT. The use of FFO is recommended by the REIT industry as a supplemental performance measure. SmartStop defines FFO, a non-GAAP measure, consistent with the standards established by the White Paper on FFO approved by the Board of Governors of NAREIT, or the White Paper. The White Paper defines FFO as net income (loss) computed in accordance with GAAP, excluding gains or losses from sales of property and asset impairment write downs, plus depreciation and amortization, and after adjustments for unconsolidated partnerships and joint ventures. Additionally, gains and losses from change in control are excluded from the determination of FFO. Adjustments for unconsolidated partnerships and joint ventures are calculated to reflect FFO on the same basis. SmartStop’s FFO calculation complies with NAREIT’s policy described above. FFO, as Adjusted SmartStop uses FFO, as adjusted, as an additional non-GAAP financial measure to evaluate its operating performance. SmartStop previously used Modified Funds from Operations (“MFFO”) (as defined by the Institute for Portfolio Alternatives) as a non-GAAP measure of operating performance. Management replaced the MFFO measure with FFO, as adjusted, because FFO, as adjusted, provides investors with supplemental performance information that is consistent with the performance models and analysis used by management. In addition, FFO, as adjusted, is a measure used among SmartStop’s peer group, which includes publicly traded REITs. Further, SmartStop believes FFO, as adjusted, is useful in comparing the sustainability of its operating performance with the sustainability of the operating performance of other real estate companies. In determining FFO, as adjusted, SmartStop makes further adjustments to the NAREIT computation of FFO to exclude the effects of non-real estate related asset impairments and intangible amortization, acquisition related costs, other write-offs incurred in connection with acquisitions, contingent earnout expenses, adjustments of fair value of debt adjustments, gains or losses from extinguishment of debt, accretion of deferred tax liabilities, realized and unrealized gains/losses on foreign exchange transactions, and gains/losses on foreign exchange and interest rate derivatives not designated for hedge accounting, which SmartStop believes are not indicative of the Company’s overall long-term operating performance. SmartStop excludes these items from GAAP net income to arrive at FFO, as adjusted, as they are not the primary drivers in its decision-making process and excluding these items provides investors a view of its continuing operating portfolio performance over time and makes its results more comparable period to period and to other REITs, which in any respective period may experience fluctuations in such acquisition, merger or other similar activities that are not of a long-term operating performance nature. FFO, as adjusted, also reflects adjustments for unconsolidated partnerships and jointly owned investments. SmartStop uses FFO, as adjusted, as one measure of operating performance when SmartStop formulates corporate goals and evaluate the effectiveness of its strategies. Presentation of FFO and FFO, as adjusted, is intended to provide useful information to investors as they compare the operating performance of different REITs, although it should be noted that not all REITs calculate FFO and FFO, as adjusted, the same way, so comparisons with other REITs may not be meaningful. Furthermore, FFO and FFO, as adjusted, are not necessarily indicative of cash flow available to fund cash needs and should not be considered as an alternative to net income (loss) or income (loss) from continuing operations as an indication of SmartStop’s performance, as an alternative to cash flows from operations, which is an indication of liquidity, or indicative of funds available to fund SmartStop’s cash needs including SmartStop’s ability to make distributions to its stockholders. FFO and FFO, as adjusted, should not be considered as an alternative to net income (determined in accordance with GAAP) and should be reviewed in conjunction with other measurements as an indication of SmartStop’s performance. SmartStop Self Storage REIT, Inc. | Financial Supplement 2021 Q2 16

Neither the SEC, NAREIT, nor any other regulatory body has passed judgment on the acceptability of the adjustments that SmartStop uses to calculate FFO or FFO, as adjusted. In the future, the SEC, NAREIT or another regulatory body may decide to standardize the allowable adjustments across the publicly registered, non-traded REIT industry and SmartStop would have to adjust its calculation and characterization of FFO or FFO, as adjusted. About SmartStop Self Storage REIT, Inc. (“SmartStop”): SmartStop is a self-managed REIT with a fully integrated operations team of approximately 400 self storage professionals focused on growing the SmartStop® Self Storage brand. SmartStop, through its indirect subsidiary SmartStop REIT Advisors, LLC, also sponsors other self storage programs. SmartStop is the tenth-largest self storage company in the U.S., with approximately $1.8 billion of real estate assets under management, including an owned and managed portfolio of 155 properties in 19 states and Toronto, Canada and comprising approximately 105,000 units and 11.9 million rentable square feet. SmartStop and its affiliates own or manage 17 operating self storage properties in the Greater Toronto Area, which total approximately 14,300 units and 1.5 million rentable square feet. Additional information regarding SmartStop is available at www.smartstopselfstorage.com. Certain of the matters discussed in this communication constitute forward-looking statements within the meaning of the safe harbor provisions of the Private Securities Litigation Reform Act of 1995. Such forward-looking statements can generally be identified by our use of forward-looking terminology such as “may,” “will,” “expect,” “intend,” “anticipate,” “estimate,” “believe,” “continue,” or other similar words. Readers are cautioned not to place undue reliance on these forward-looking statements and any such forward-looking statements are qualified in their entirety by reference to the following cautionary statements. All forward-looking statements speak only as of the date hereof and are based on current expectations and involve a number of assumptions, risks and uncertainties that could cause the actual results to differ materially from such forward-looking statements. Such forward-looking statements include, but are not limited to, statements about the expected effects and benefits of the SST IV merger, the SSGT merger, the self administration transaction and the Series A Preferred equity investment, including anticipated future financial and operating results and synergies, as well as all other statements in this press release, other than historical facts. There are several factors which could cause actual plans and results to differ materially from those expressed or implied in forward-looking statements, including, without limitation, the following: (i) risks related to disruption of management’s attention from SmartStop’s ongoing business operations due to the SST IV merger, the self administration transaction, or other business matters; (ii) significant transaction costs, including financing costs, and unknown liabilities; (iii) failure to realize the expected benefits and synergies of either of the SST IV merger, the SSGT merger or the self administration transaction in the expected timeframes or at all; (iv) costs or difficulties related to the integration of acquired self storage facilities and operations, including facilities acquired through the SST IV merger, the SSGT merger and operations acquired through the self administration transaction; (v) changes in the political and economic climate, economic conditions and fiscal imbalances in the United States, and other major developments, including wars, natural disasters, epidemics and pandemics, including the outbreak of novel coronavirus (COVID-19), military actions, and terrorist attacks; (vi) changes in tax and other laws and regulations; or (vii) difficulties in SmartStop’s ability to attract and retain qualified personnel and management. Actual results may differ materially from those indicated by such forward-looking statements. In addition, the forward-looking statements represent SmartStop’s views as of the date on which such statements were made. SmartStop anticipates that subsequent events and developments may cause its views to change. These forward-looking statements should not be relied upon as representing SmartStop’s views as of any date subsequent to the date hereof. Additional factors that may affect the business or financial results of SmartStop are described in the risk factors included in SmartStop’s filings with the SEC, including SmartStop’s Annual Report on Form 10-K for the fiscal year ended December 31, 2020 and subsequent Quarterly Reports on Form 10-Q and Current Reports on Form 8-K, which factors are incorporated herein by reference, all of which are filed with the SEC and available at www.sec.gov. SmartStop expressly disclaims a duty to provide updates to forward-looking statements, whether as a result of new information, future events or other occurrences. SmartStop Self Storage REIT, Inc. | Financial Supplement 2021 Q2 17

Financial Highlights SmartStop Self Storage REIT,Inc. The Smarter Way to Store! Common Stock Equivalents (Fully Diluted) 2Q21 Quarter Ending Class A Common Shares 75,994,754 76,516,281 Class T Common Shares 7,960,999 7,978,951 Operating Partnership Units 10,270,455 10,270,455 Other Dilutive Securities 239,279 155,900 Total Fully Diluted Common Stock Equivalents 94,465,487 94,921,587 2Q21 Operating Portfolio Snapshot # of Stores NRSF Units 2Q21 Ending Occupancy(3) Wholly-Owned Same-Store 103 7,595,600 64,670 96.3% Wholly-Owned Non Same-Store(1) 35 2,898,200 26,420 94.2% Total Wholly Owned Stores(1) 138 10,493,800 91,090 95.7% Joint Venture Stores 3 320,000 2,930 33.1% Managed Stores(2) 14 1,100,500 10,535 85.5% Total Stores 155 11,914,300 104,555 Balance Sheet Highlights 6/30/21 3/31/21 12/31/20 9/30/20 6/30/20 Real estate facilities $1,575,320,663 $1,552,957,668 $1,210,102,582 $1,191,037,320 $1,183,920,445 Accumulated depreciation (135,187,165) (124,490,121) (115,903,045) (106,556,223) (98,435,981) Real estate facilities, net 1,441,990,545 1,432,728,259 1,095,960,840 1,086,072,890 1,086,416,832 Debt, net 849,209,991 822,490,580 717,952,233 712,789,410 710,116,684 Preferred stock, gross 200,000,000 200,000,000 200,000,000 150,000,000 150,000,000 For the Quarter Ended: Same-Store Performance (103 Stores) 6/30/21 3/31/21 12/31/20 9/30/20 6/30/20 Revenue(4) $30,011,041 $27,871,895 $27,238,620 $26,419,911 $24,702,072 Expenses(4) 8,878,839 8,817,512 8,699,157 8,827,519 8,279,464 NOI(4) $21,132,202 $19,054,383 $18,539,463 $17,592,392 $16,422,608 Ending Occupancy 96.3% 94.1% 91.7% 92.3% 90.7% Average Occupancy 95.8% 93.1% 92.2% 91.7% 89.7% RentPOF(5) $16.50 $15.43 $15.25 $14.67 $14.38 Move Ins 10,575 10,151 9,611 11,179 9,810 Move Outs 8,789 8,665 9,829 10,331 8,533 For the Quarter Ended: FFO, as adjusted per shares & units outstanding - diluted 6/30/21 3/31/21 12/31/20 9/30/20 6/30/20 FFO, as adjusted (4) $0.10 $0.08 $0.08 $0.06 $0.03 1. Excludes one property owned by Strategic Storage Trust VI, Inc.'s operating partnership, which was consolidated by us until May 1, 2021. This property is included in managed stores. 2. Includes 11 operating properties in Strategic Storage Growth Trust II, Inc., two operating properties in Strategic Storage Trust VI, Inc. and one other property managed by us. 3. Weighted by net rentable square feet. 4. Same-store revenue, expense, and NOI and FFO, as adjusted are non-GAAP measures. See Appendix for a reconciliation of the same store measures and the FFO Reconciliation to the most directly comparable GAAP financial measure. 5. RentPOF defined as rental revenue net of discounts & concessions, excluding late fees, admin fees and parking income, divided by occupied square feet of storage SmartStop Self Storage REIT, Inc. | Financial Supplement 2021 Q2 18
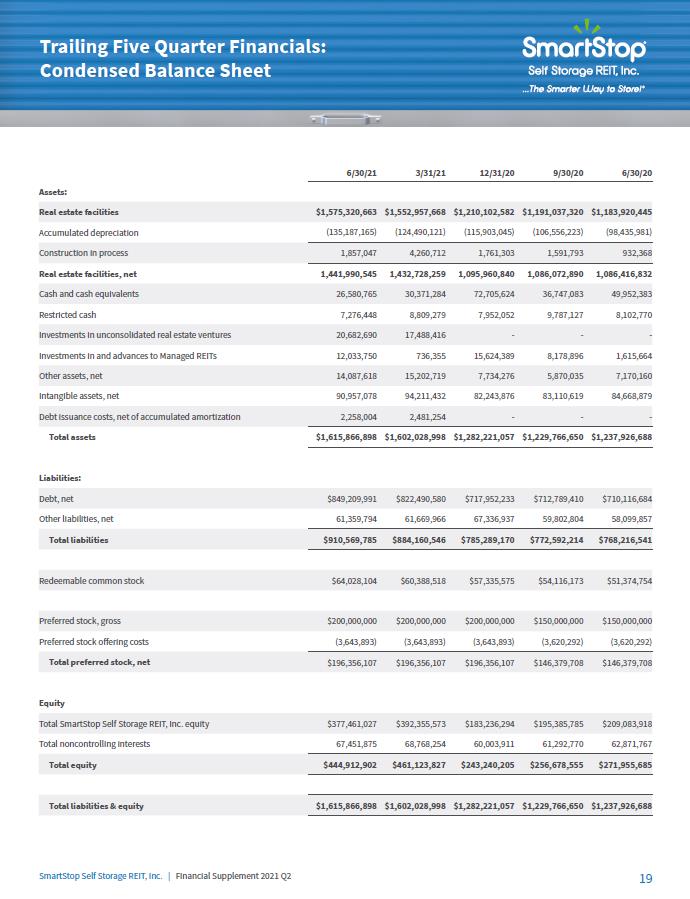
Trailing Five Quarter Financials Condensed Balance Sheet SmartStop Self Storage REIT,Inc. The Smarter Way to Store! 6/30/21 3/31/21 12/31/20 9/30/20 6/30/20 Assets: Real estate facilities $1,575,320,663 $1,552,957,668 $1,210,102,582 $1,191,037,320 $1,183,920,445 Accumulated depreciation (135,187,165) (124,490,121) (115,903,045) (106,556,223) (98,435,981) Construction in process 1,857,047 4,260,712 1,761,303 1,591,793 932,368 Real estate facilities, net 1,441,990,545 1,432,728,259 1,095,960,840 1,086,072,890 1,086,416,832 Cash and cash equivalents 26,580,765 30,371,284 72,705,624 36,747,083 49,952,383 Restricted cash 7,276,448 8,809,279 7,952,052 9,787,127 8,102,770 Investments in unconsolidated real estate ventures 20,682,690 17,488,416 - - - Investments in and advances to Managed REITs 12,033,750 736,355 15,624,389 8,178,896 1,615,664 Other assets, net 14,087,618 15,202,719 7,734,276 5,870,035 7,170,160 Intangible assets, net 90,957,078 94,211,432 82,243,876 83,110,619 84,668,879 Debt issuance costs, net of accumulated amortization 2,258,004 2,481,254 - - - Total assets $1,615,866,898 $1,602,028,998 $1,282,221,057 $1,229,766,650 $1,237,926,688 Liabilities: Debt, net $849,209,991 $822,490,580 $717,952,233 $712,789,410 $710,116,684 Other liabilities, net 61,359,794 61,669,966 67,336,937 59,802,804 58,099,857 Total liabilities $910,569,785 $884,160,546 $785,289,170 $772,592,214 $768,216,541 Redeemable common stock $64,028,104 $60,388,518 $57,335,575 $54,116,173 $51,374,754 Preferred stock, gross $200,000,000 $200,000,000 $200,000,000 $150,000,000 $150,000,000 Preferred stock offering costs (3,643,893) (3,643,893) (3,643,893) (3,620,292) (3,620,292) Total preferred stock, net $196,356,107 $196,356,107 $196,356,107 $146,379,708 $146,379,708 Equity Total SmartStop Self Storage REIT, Inc. equity $377,461,027 $392,355,573 $183,236,294 $195,385,785 $209,083,918 Total noncontrolling interests 67,451,875 68,768,254 60,003,911 61,292,770 62,871,767 Total equity $444,912,902 $461,123,827 $243,240,205 $256,678,555 $271,955,685 Total liabilities & equity $1,615,866,898 $1,602,028,998 $1,282,221,057 $1,229,766,650 $1,237,926,688 SmartStop Self Storage REIT, Inc. | Financial Supplement 2021 Q2 19

Trailing Five Quarter Financials Condensed Income Statement SmartStop Self Storage REIT,Inc. The Smarter Way to Store! 6/30/21 3/31/21 12/31/20 9/30/20 6/30/20 Revenues: Self storage rental revenue $38,104,699 $29,503,442 $27,667,870 $26,706,201 $24,946,793 Ancillary operating revenue 2,027,041 1,557,430 1,517,829 1,431,952 1,183,418 Managed REIT Platform revenue 1,058,291 2,287,740 2,360,929 2,051,021 1,852,893 Reimbursable costs from Managed REITs 1,061,619 1,216,043 1,346,945 1,173,948 1,486,441 Total revenues 42,251,650 34,564,655 32,893,573 31,363,122 29,469,545 Expenses: Property operating expenses 12,479,969 10,343,281 9,618,356 9,816,774 9,195,043 Managed REIT Platform expenses 316,142 319,890 294,818 329,280 1,008,014 Reimbursable costs from Managed REITs 1,061,619 1,216,043 1,346,945 1,173,948 1,486,441 General and administrative 6,811,313 4,752,989 4,641,467 4,012,072 4,149,713 Depreciation & amortization of real estate assets 14,396,482 9,803,474 10,033,360 9,591,486 11,060,595 Write-off of equity interest and preexisting relationships in SST IV upon acquisition of control - 8,389,573 - - - Other 430,448 2,425,394 3,372,189 2,068,577 597,221 Total operating expenses 35,495,973 37,250,644 29,307,135 26,992,137 27,497,027 Gain on sale of real estate 178,631 - - - - Operating income (loss) 6,934,308 (2,685,989) 3,586,438 4,370,985 1,972,518 Interest expense – total 8,416,349 8,616,071 8,602,201 9,013,167 9,187,815 Net loss on extinguishment of debt - 2,444,788 - - - Other (171,203) (1,443,382) (3,071,879) (185,685) (152,456) Net loss (1,310,838) (12,303,466) (1,943,884) (4,456,497) (7,062,841) Net loss attributable to the noncontrolling interests in our OP 546,092 1,476,994 351,476 585,360 933,443 Less: Distributions to preferred stockholders (3,116,438) (3,082,192) (2,937,500) (2,387,977) (2,362,023) Net loss attributable to common stockholders $(3,881,184) $(13,908,664) $(4,529,908) $(6,259,114) $(8,491,421) Net loss per Class A & T share – basic and diluted ($0.05) ($0.22) ($0.08) ($0.10) ($0.14) Weighted average Class A & T shares outstanding – basic & diluted 83,955,753 64,326,697 60,167,502 59,847,321 59,398,637 SmartStop Self Storage REIT, Inc. | Financial Supplement 2021 Q2 20

Trailing Five Quarter Financials: FFO Reconciliation SmartStop Self Storage REIT,Inc. The Smarter Way to Store! 6/30/21 3/31/21 12/31/20 9/30/20 6/30/20 Reconciliation to FFO & FFO, as adjusted: Net loss (attributable to common stockholders) $(3,881,184) $(13,908,664) $(4,529,908) $(6,259,114) $(8,491,421) Depreciation & amortization of real estate and intangible assets from unconsolidated entities 14,176,386 8,956,607 8,804,733 8,380,416 9,876,257 Gain on deconsolidation (169,533) - - - - Gain on sale of real estate (178,631) - - - - Adjustment for noncontrolling interests (1,500,869) (1,116,054) (1,051,900) (1,101,471) (1,305,577) FFO (attributable to common stockholders) 8,446,169 (6,068,111) 3,222,925 1,019,831 79,259 Intangible amortization expense - contracts 212,537 697,462 1,071,436 1,050,720 1,047,687 Acquisition expenses 30,448 305,650 772,189 468,577 97,221 Acquisition expenses and foreign currency (gains) losses, net from unconsolidated entities 107,388 - - - - Contingent earnout adjustment 400,000 2,119,744 2,600,000 1,600,000 500,000 Write-off of equity interest and preexisting relationships in SST IV upon acquisition of control - 8,389,573 - - - Accretion of fair market value of secured debt (31,250) (31,866) (32,345) (32,788) (32,892) Net loss on extinguishment of debt - 2,444,788 - - - Foreign currency and interest rate derivative (gains) losses, net (643,547) 217,998 40,649 53,503 (57,676) Adjustment of deferred tax liabilities (56,880) (1,872,866) (2,627,403) (276,216) (276,216) Adjustment for noncontrolling interests (1,784) (1,433,296) (457,271) (375,841) (168,680) FFO, as adjusted (attributable to common stockholders) $8,463,081 $4,769,076 $4,590,180 $3,507,786 $1,188,703 Fully Diluted FFO Calculation: FFO (attributable to common stockholders) $8,446,169 $(6,068,111) $3,222,925 $1,019,831 $79,259 Net loss attributable to the noncontrolling interests in our OP (546,092) (1,476,994) (351,476) (585,360) (933,443) Adjustment for noncontrolling interests 1,500,869 1,116,054 1,051,900 1,101,471 1,305,577 FFO (attributable to common stockholders and OP unit holders) $9,400,946 $(6,429,051) $3,923,349 $1,535,942 $451,393 Fully Diluted FFO, as adjusted Calculation: FFO, as adjusted (attributable to common stockholders) $8,463,081 $4,769,076 $4,590,180 $3,507,786 $1,188,703 Net loss attributable to the noncontrolling interests in our OP (546,092) (1,476,994) (351,476) (585,360) (933,443) Adjustment for noncontrolling interests 1,502,653 2,549,350 1,509,171 1,477,312 1,474,257 FFO, as adjusted (attributable to common stockholders and OP unit holders) $9,419,642 $5,841,432 $5,747,875 $4,399,738 $1,729,517 Weighted average Class A & T shares outstanding 83,955,753 64,326,697 60,167,502 59,847,321 59,398,637 Weighted average OP units outstanding 10,270,455 9,248,375 9,095,029 9,095,029 9,095,029 Weighted average other dilutive securities 239,279 159,700 174,636 132,215 131,977 Weighted average Shares & OP Units outstanding – diluted (1) 94,465,487 73,734,772 69,437,167 69,074,565 68,625,643 FFO and FFO, as adjusted per shares & units outstanding - diluted FFO $0.10 ($0.09) $0.06 $0.02 $0.01 FFO, as adjusted $0.10 $0.08 $0.08 $0.06 $0.03 Trailing Five Quarter Financials: FFO Reconciliation 1. Includes all Class A Shares, Class T Shares and OP Units, as well as the dilutive effect of both unvested restricted stock and long term incentive plan (both time-based units and performance based-units). The outstanding convertible preferred stock was excluded as the conversion of such shares was antidilutive. SmartStop Self Storage REIT, Inc. | Financial Supplement 2021 Q2 21

Store Portfolio Reporting Information SmartStop Self Storage REIT,Inc. The Smarter Way to Store! Net Rent / Occupied Sq. Ft. for the Three Months Ended June 30,(1) Ending Occupancy for the Three Months Ended June 30, Revenue for the Three Months Ended June 30,(5) Expenses for the Three Months Ended June 30,(5) NOI for the Three Months Ended June 30,( 5) Owned Operating Store Segment # of Stores NRSF Units 2021 2020 2021 2020 Change 2021 2020 % Change 2021 2020 % Change 2021 2020 % Change Same-Store Wholly-Owned 103 7,595,600 64,670 $16.50 $14.67 96.3% 90.7% 5.6% $30,011,041 $24,702,072 21.5% $8,878,839 $8,279,464 7.2% $21,132,202 $16,422,608 28.7% Non Same-Store Wholly-Owned Historical SSST REIT Non-Stabilized(2) 9 697,100 7,020 14.12 10.74 93.2% 72.3% 20.9% 2,364,496 1,428,150 65.6% 1,055,139 915,579 15.2% 1,309,357 512,571 155.4% Historical SSST REIT Non-Stabilized(3) 16 1,392,600 11,340 NM NM 96.0% NM 5,028,081 NM 1,600,241 NM 3,427,840 NM Historical SST IV Non-Stabilized(3) 8 658,300 6,540 NM NM 96.0% NM 2,463,117 NM 805,439 NM 1,657,678 NM Recent Acquisitions(4) 2 150,200 1,520 NM NM 74.5% NM 216,593 NM 108,946 NM 107,647 NM Total Non Same-Store Wholly-Owned 35 2,898,200 26,420 NM NM 94.2% NM 10,072,287 NM 3,569,765 NM 6,502,522 NM Total Wholly-Owned Operating Stores 138 10,493,800 91,090 NM NM 95.7% NM $40,083,328 NM $12,448,604 NM $27,634,724 NM Total Joint Venture Operating Stores 3 320,000 2,930 33.1% NM Total All Owned Operating Stores 141 10,813,800 94,020 Net Rent / Occupied Sq. Ft. for the Three Months Ended June 30,(1) Ending Occupancy for the Three Months Ended June 30, Revenue for the Three Months Ended June 30,(5) Expenses for the Three Months Ended June 30,(5) NOI for the Three Months Ended June 30,( 5) 1. RentPOF defined as rental revenue net of discounts & concessions, excluding late fees, admin fees and parking income, divided by occupied square feet of storage. 2. Represents stores that were owned by SmartStop Self Storage REIT, Inc. prior to the merger with Strategic Storage Trust IV, Inc. that closed in March 2021. Excludes the results of one property owned by Strategic Storage Trust VI, Inc.'s operating partnership, which was consolidated until May 1, 2021. This property's revenue and expenses for the peiod we consolidated during the quarter ended 6/30/2021 were $48,412 and $31,365, respectively. 3. Represents stores that were previously owned by Strategic Storage Trust IV, Inc. that were acquired by SmartStop Self Storage REIT, Inc. as part of the merger that closed in March 2021. Stabilized properties for the Strategic Storage Trust IV, Inc. pool consist of the sixteen properties accounted for in Strategic Storage Trust IV, Inc.'s same-store pool as of Strategic Storage Trust IV, Inc.'s most recently filed Form 10-Q for the period ended 9/30/2020. 4. Represents stores that were recently acquired that are not in the same-store pool. Revenue, expenses and NOI represent partial quarter. 5. Same-store revenue, expense, and NOI are non-GAAP measures. See Appendix for a reconciliation of these measures to the most directly comparable GAAP financial measure. Burlington, Ontario Chula Vista, California SmartStop Self Storage REIT, Inc. | Financial Supplement 2021 Q2 22

Same-Store Portfolio Details Store Portfolio Reporting Information SmartStop Self Storage REIT,Inc. The Smarter Way to Store! Revenues: 6/30/21 3/31/21 12/31/20 9/30/20 6/30/20 Self storage rental revenue(1) $28,537,202 $26,487,511 $25,867,563 $25,130,023 $23,626,987 Ancillary operating revenue(2) 1,473,839 1,384,384 1,371,057 1,289,888 1,075,085 Total revenues $30,011,041 $27,871,895 $27,238,620 $26,419,911 $24,702,072 Expenses: Property taxes $2,885,531 $2,800,728 $2,503,744 $2,736,412 $2,616,999 Payroll 2,148,246 2,270,018 2,236,152 2,166,483 2,106,752 Advertising 784,189 741,489 736,511 804,485 757,748 Repairs & maintenance 466,935 589,901 703,680 539,007 554,589 Utilities 674,511 750,329 695,197 804,019 654,974 Property insurance 413,501 405,323 399,276 331,587 329,748 Other(3) 1,505,926 1,259,724 1,424,597 1,445,526 1,258,654 Total expenses $8,878,839 $8,817,512 $8,699,157 $8,827,519 $8,279,464 Net operating income: $21,132,202 $19,054,383 $18,539,463 $17,592,392 $16,422,608 Gross margin 70.4% 68.4% 68.1% 66.6% 66.5% Period ending occupancy 96.3% 94.1% 91.7% 92.3% 90.7% Period average occupancy 95.8% 93.1% 92.2% 91.7% 89.7% RentPOF(4) $16.50 $15.43 $15.25 $14.67 $14.38 Move ins 10,575 10,151 9,611 11,179 9,810 Move outs 8,789 8,665 9,829 10,331 8,533 1. Includes rental income and associated late fees and administrative fees. 2. Includes Tenant Programs revenue, solar revenue, merchandise sales and other. 3. Includes administrative expenses, professional expenses, software expenses and other expenses. 4. RentPOF defined as rental revenue net of discounts & concessions, excluding late fees, admin fees and parking income, divided by occupied square feet of storage SmartStop Self Storage REIT, Inc. | Financial Supplement 2021 Q2 23

Same-Store Portfolio MSA Summary SmartStop Self Storage REIT,Inc. The Smarter Way to Store! Net Rent / Occupied Sq. Ft. for the Three Months Ended June 30,(2) Avg. Occupancy for the Three Months Ended June 30, Revenue for the Three Months Ended June 30,(4) Expenses for the Three Months Ended June 30, (4) NOI for the Three Months Ended June 30, (4) MSA/CMA(1) % of NOI # of Stores NRSF Units 2021 2020 2021 2020 Change 2021 2020 % Change 2021 2020 % Change 2021 2020 % Change Miami - Fort Lauderdale 15.8% 9 941,400 7,750 $20.65 $18.70 94.8% 88.8% 6.0% $4,429,592 $3,790,280 16.9% $1,087,089 $1,009,228 7.7% $3,342,503 $2,781,052 20.2% Toronto(3) 14.7% 10 849,600 7,800 20.20 15.13 95.5% 92.5% 3.0% 4,222,800 3,159,757 33.6% 1,107,797 1,011,978 9.5% 3,115,003 2,147,779 45.0% Los Angeles 11.4% 10 660,400 6,200 19.78 17.75 96.8% 90.8% 5.9% 3,201,084 2,640,544 21.2% 794,447 750,095 5.9% 2,406,637 1,890,449 27.3% Asheville 7.6% 13 780,200 5,530 12.79 11.35 95.4% 89.3% 6.1% 2,243,269 1,941,617 15.5% 645,575 579,851 11.3% 1,597,694 1,361,766 17.3% Las Vegas 7.2% 5 552,500 4,380 15.30 13.35 96.3% 91.3% 5.0% 1,871,000 1,523,832 22.8% 355,546 344,191 3.3% 1,515,454 1,179,641 28.5% San Francisco - Oakland 6.2% 4 322,600 2,920 21.93 19.66 95.5% 88.5% 7.1% 1,748,144 1,436,514 21.7% 445,084 421,353 5.6% 1,303,060 1,015,161 28.4% Detroit 3.1% 4 266,100 2,220 13.05 11.93 96.8% 87.8% 8.9% 874,187 724,116 20.7% 212,137 200,405 5.9% 662,050 523,711 26.4% Dayton 3.0% 3 180,700 1,770 17.58 14.50 98.8% 92.8% 6.0% 828,481 643,495 28.7% 192,051 186,064 3.2% 636,430 457,431 39.1% Riverside - SB 2.8% 7 392,400 3,340 10.58 8.89 95.5% 92.9% 2.6% 1,035,962 857,345 20.8% 441,251 361,157 22.2% 594,711 496,188 19.9% Port St. Lucie 2.7% 3 251,600 2,010 15.46 13.49 96.6% 86.9% 9.7% 896,173 707,321 26.7% 333,659 344,826 -3.2% 562,514 362,495 55.2% Denver 2.6% 5 290,700 2,550 12.73 11.66 96.3% 86.7% 9.6% 945,909 779,657 21.3% 401,721 375,148 7.1% 544,188 404,509 34.5% Chicago 2.4% 5 315,600 2,880 11.97 10.82 95.8% 87.7% 8.1% 959,511 785,361 22.2% 459,223 416,239 10.3% 500,288 369,122 35.5% Myrtle Beach 2.1% 2 197,800 1,450 12.51 11.86 93.7% 88.0% 5.8% 572,286 501,239 14.2% 133,829 127,569 4.9% 438,457 373,670 17.3% Raleigh - Cary 1.4% 3 163,800 1,090 11.02 10.17 96.6% 89.6% 7.0% 436,942 369,200 18.3% 151,057 159,630 -5.4% 285,885 209,570 36.4% Other 17.2% 20 1,430,200 12,780 16.42 14.53 95.9% 89.1% 6.7% 5,745,701 4,841,794 18.7% 2,118,373 1,991,730 6.4% 3,627,328 2,850,064 27.3% Total Same-Store 100.0% 103 7,595,600 64,670 $16.50 $14.38 95.8% 89.7% 6.1% $30,011,041 $24,702,072 21.5% $8,878,839 $8,279,464 7.2% $21,132,202 $16,422,608 28.7% Net Rent / Occupied Sq. Ft. for the Six Months Ended June 30,(2) Avg. Occupancy for the Six Months Ended June 30, Revenue for the Six Months Ended June 30,(4) Expenses for the Six Months Ended June 30, (4) NOI for the Six Months Ended June 30, (4) MSA/CMA(1) % of NOI # of Stores NRSF Units 2021 2020 2021 2020 Change 2021 2020 % Change 2021 2020 % Change 2021 2020 % Change Miami - Fort Lauderdale 16.1% 9 941,400 7,750 $20.12 $18.95 93.8% 89.1% 4.7% $8,625,328 $7,698,444 12.0% $2,168,330 $2,091,216 3.7% $6,456,998 $5,607,228 15.2% Toronto(3) 14.1% 10 849,600 7,800 19.14 15.74 94.2% 91.5% 2.7% 7,939,625 6,424,714 23.6% 2,262,524 2,212,797 2.2% 5,677,101 4,211,917 34.8% Los Angeles 11.5% 10 660,400 6,200 19.10 17.86 95.8% 91.0% 4.9% 6,206,285 5,342,951 16.2% 1,589,969 1,576,033 0.9% 4,616,316 3,766,918 22.5% Asheville 7.6% 13 780,200 5,530 12.48 11.65 94.0% 88.4% 5.6% 4,373,197 3,949,141 10.7% 1,323,247 1,250,076 5.9% 3,049,950 2,699,065 13.0% Las Vegas 7.2% 5 552,500 4,380 14.80 13.61 94.7% 90.5% 4.2% 3,624,260 3,121,622 16.1% 717,693 704,667 1.8% 2,906,567 2,416,955 20.3% San Francisco - Oakland 6.3% 4 322,600 2,920 21.34 19.76 94.5% 88.6% 5.9% 3,404,953 2,917,718 16.7% 881,601 863,339 2.1% 2,523,352 2,054,379 22.8% Detroit 3.1% 4 266,100 2,220 12.74 12.16 94.4% 87.7% 6.6% 1,691,145 1,482,513 14.1% 430,680 460,098 -6.4% 1,260,465 1,022,415 23.3% Dayton 3.0% 3 180,700 1,770 16.78 14.64 97.9% 91.9% 6.0% 1,596,889 1,292,293 23.6% 390,702 397,060 -1.6% 1,206,187 895,233 34.7% Riverside - SB 2.9% 7 392,400 3,340 10.07 9.00 94.2% 90.8% 3.4% 1,994,178 1,695,793 17.6% 810,547 749,132 8.2% 1,183,631 946,661 25.0% Port St. Lucie 2.6% 3 251,600 2,010 14.76 13.89 95.2% 86.9% 8.3% 1,706,769 1,457,530 17.1% 655,351 651,233 0.6% 1,051,418 806,297 30.4% Denver 2.5% 5 290,700 2,550 12.29 11.83 94.3% 86.6% 7.7% 1,814,015 1,585,348 14.4% 804,630 758,374 6.1% 1,009,385 826,974 22.1% Chicago 2.3% 5 315,600 2,880 11.51 10.92 94.5% 88.5% 6.0% 1,849,253 1,600,360 15.6% 931,841 883,178 5.5% 917,412 717,182 27.9% Myrtle Beach 2.1% 2 197,800 1,450 12.09 12.10 92.6% 87.4% 5.2% 1,105,109 1,018,263 8.5% 265,015 264,522 0.2% 840,094 753,741 11.5% Raleigh - Cary 1.3% 3 163,800 1,090 10.70 10.44 95.0% 87.3% 7.7% 845,706 736,546 14.8% 313,551 329,599 -4.9% 532,155 406,947 30.8% Other 17.3% 20 1,430,200 12,780 15.88 14.71 94.4% 88.5% 5.9% 11,106,224 9,783,870 13.5% 4,150,670 3,804,834 9.1% 6,955,554 5,979,036 16.3% Total Same-Store 100.0% 103 7,595,600 64,670 $15.93 $14.63 94.5% 89.2% 5.2% $57,882,936 $50,107,107 15.5% $17,696,351 $16,996,158 4.1% $40,186,585 $33,110,949 21.4% 1. MSAs (Metropolitan Statistical Areas) as defined by the U.S. Census Bureau. Toronto CMA (Census Metropolitan Area) as defined by Statistics Canada. 2. RentPOF defined as rental revenue net of discounts & concessions, excluding late fees, admin fees and parking income, divided by occupied square feet of storage. 3. Presented in US Dollars (USD) as translated on average for the quarter. 4. Same-store revenue, expense and NOI are non-GAAP measures. See Appendix for a reconciliation of these measures to the most directly comparable GAAP financial measure. SmartStop Self Storage REIT, Inc. | Financial Supplement 2021 Q2 24

Total Portfolio MSA Summary as of 6/30/21 SmartStop Self Storage REIT, Inc. The Smarter Way to Store! MSA/CMA(1) % of Portfolio by NRSF NRSF # of Stores Units Toronto 10.4% 1,092,300 13 10,610 Miami - Fort Lauderdale 9.8% 1,025,300 10 8,620 Asheville 8.1% 851,900 14 6,200 Las Vegas 7.2% 757,100 8 6,210 Los Angeles 6.3% 660,400 10 6,200 Houston 5.7% 602,100 8 4,490 Dayton 3.7% 392,400 7 3,340 San Francisco - Oakland 3.1% 322,600 4 2,920 Port St. Lucie 3.0% 318,900 4 2,610 Riverside - SB 2.9% 306,700 5 2,690 Chicago 3.0% 315,600 5 2,880 Denver 2.8% 290,700 5 2,550 Phoenix 2.5% 265,000 3 2,540 Detroit 2.5% 266,100 4 2,220 Seattle - Tacoma 1.9% 196,600 3 1,680 Myrtle Beach 1.9% 197,800 2 1,450 Charlotte 1.7% 176,700 2 1,900 San Diego 1.7% 181,400 2 2,020 Raleigh - Cary 1.6% 163,800 3 1,090 Other(2) 20.1% 2,110,400 26 18,870 Total Stores 100.0% 10,493,800 138 91,090 SmartStop Self Storage REIT, Inc. | Financial Supplement 2021 Q2 25

Total Portfolio MSA Summary as of 6/30/21 SmartStop Self Storage REIT, Inc. The Smarter Way to Store! Revenue for the Three Months Ended June 30, (3) Net Rent / Occupied Sq. Ft. for the Three Months Ended June 30,(2) NOI for the Three Months Ended June 30,(3) Expenses for the Three Months Ended June 30,(3) Avg. Occupancy for the Three Months Ended June 30, Figures represent the total joint venture, not just SmartStop's proportionate percentage. SmartStop % Owned Operating Properties Stores Ownership NRSF Units 2021 2020 2021 2020 2021 2020 2021 2020 2021 2020 Same-Store Wholly-Owned Stores 10 100.0% 849,600 7,750 $20.20 $15.13 95.5% 92.5% $4,222,800 $3,159,757 $1,107,797 $1,011,978 $3,115,003 $2,147,779 Non-Same-Store Wholly-Owned Stores 3 100.0% 242,700 2,810 14.62 NM 71.9% NM 644,569 NM 328,073 NM 316,496 NM Joint Venture Properties (1) 3 50.0% 320,000 2,930 NM NM 33.1% NM 330,554 NM 393,936 NM (63,382) NM Total Owned Operating Stores 16 1,412,300 13,490 Owned Projects Under Construction Stores SmartStop % Ownership Projected NRSF Projected Units Total Anticipated Project Costs SmartStop Portion of Anticipated Project Costs Total Under Construction Stores 3 50.0% 291,700 2,865 $47,300,143 $23,650,072 Note: All dollars denominated in U.S. Dollars (USD) NM: Not meaningful comparison RentPOF defined as rental revenue net of discounts & concessions, excluding late fees, admin fees and parking income, divided by occupied square feet of storage. Same-store revenue, expense, and NOI are non-GAAP measures. See Appendix for a reconciliation of these measures to the most directly comparable GAAP financial measure. SmartStop Self Storage REIT, Inc. | Financial Supplement 2021 Q2 26

SmartCentres Joint Venture Overview SmartStop Self Storage REIT, Inc. The Smarter Way to Store! For the Quarter Ended June 30, 2021 JV Owned Operating Properties MSA/ CMA(1) SmartStop % Ownership NRSF Units Investment Value(2) Date Opened East York - Laird Toronto 50.0% 100,000 1,000 $6,609,595 Jul-20 Brampton Toronto 50.0% 101,300 1,050 2,506,115 Nov-20 Vaughan Toronto 50.0% 118,700 880 3,062,021 Jan-21 Total JV Operating Properties 320,000 2,930 $12,177,730 For the Quarter Ended June 30, 2021 Projected JV Owned Projects Under Construction MSA/ CMA(1) SmartStop % Ownership NRSF Units Investment Value(2) Projected Completion Oshawa - Champlain Toronto 50.0% 92,500 940 $1,596,921 Q3 2021 Kingspoint Toronto 50.0% 100,300 982 4,648,402 Q3 2022 Scarborough Toronto 50.0% 98,900 943 2,259,636 Q4 2021 Total JV Properties Under Construction 291,700 2,865 $8,504,960 Note: All dollars denominated in U.S. Dollars (USD) MSAs (Metropolitan Statistical Areas) as defined by the U.S. Census Bureau. Toronto CMA (Census Metropolitan Area) as defined by Statistics Canada. Through the acquisition of the Oshawa - Champlain, East York - Laird, Brampton, Vaughan, and Scarborough joint venture partnerships, the Company also became party to a master mortgage commitment agreement (the “MMCA”) with SmartCentres Storage Finance LP (the “SmartCentres Lender”) (collectively, the “SmartCentres Financing”). The SmartCentres Lender is an affiliate of SmartCentres. The initial maximum amount available is approximately $60 million CAD, however, the SmartCentres Financing includes an accordion feature such that borrowings pursuant thereto may be increased up to approximately $120 million CAD subject to certain conditions set forth in the MMCA. As of June 30, 2021, approximately $52.2 million CAD was outstanding on the SmartCentres Financing. SmartStop Self Storage REIT, Inc. | Financial Supplement 2021 Q227

Debt and Capital Structure Summary SmartStop Self Storage REIT, Inc. The Smarter Way to Store! Loan 6/30/2021 Interest Rate(1) Maturity Date KeyBank CMBS Loan $95,000,000 3.89% 8/1/2026 KeyBank Florida CMBS Loan 52,000,000 4.65% 5/1/2027 Midland North Carolina CMBS Loan 46,094,457 5.31% 8/1/2024 CMBS Loan 104,000,000 5.00% 2/1/2029 SST IV CMBS Loan 40,500,000 3.56% 2/1/2030 SST IV TCF Loan 40,782,255 3.75% 3/30/2023 Credit Facility Term Loan - USD 250,000,000 1.90% 3/17/2026 Credit Facility Revolver - USD 207,201,288 1.95% 3/17/2024 Oakville III BMO Loan - CAD(2) 13,107,250 2.66% 5/16/2024 Ladera Office Loan 4,056,887 4.29% 11/1/2026 Premium on secured debt, net 282,430 Debt issuance costs, net (3,814,576) Total debt(2) $849,209,991 Debt Maturity Schedule (millions)(2,3)$400$350$300$250$200$150$100$50$02012022202320242025202620272028+$41$46$220$99$250$52$145variableratedebtfixedratedebt Capital Structure(4)5%43%10%42%debtpreferredequitycommonstockopunitequity$2.0billiontotal capitazation Represents the stated interest rate. Effective at quarter end, the Company was subject to a swap for $235 million at LIBOR 1.79% that expires in February 2022 and an $80 million interest rate cap of LIBOR 0.50% that expired in August 2021. Debt denominated in foreign currency has been converted based on the rate in effect as of June 30, 2021. Excludes amortizing debt payments. Total capitalization includes debt, preferred equity and equity market cap based on approx. 95 million shares and OP Units at 6/30/21 valued at the most recently published Net Asset Value. SmartStop Self Storage REIT, Inc. | Financial Supplement 2021 Q2 28

Managed REIT Overview SmartStop Self Storage REIT, Inc. The Smarter Way to Store! Selected Fund Information SSGT II(1) SST VI(2) Year established 2018 2021 AUM - end of current quarter $161.6 million $27.4 million Max Offering $270 million $220 million Type of Offering Private Placement Private Placement Fee Summary - 2Q 2021 SSGT II(1) SST VI(2) Other Total Advisory agreement $457,859 $28,045 - $485,904 Property management agreement 156,328 16,393 - $172,721 Tenant Program revenue 144,169 30,380 - $174,549 Other(3) - 76,903 148,214 $225,117 Total Fees $758,356 $151,721 $148,214 $1,058,291 Represents Strategic Storage Growth Trust II, Inc. ("SSGT II"). Represents Strategic Storage Trust VI, Inc. ("SST VI"). Such revenues primarily include construction management, development fees, acquisition fees, and other miscellaneous revenues SmartStop Self Storage REIT, Inc. | Financial Supplement 2021 Q229
Appendix SmartStop Self Storage REIT, Inc.the Smarter wat to store! Financial Supplement 2021 Q2 30

Reconciliation of Same-Store Revenue and Net Operating Income Self Storage REIT, Inc. the Smarter wat to store Same-Store Facilities 2021 Q2 Non Same-Store Facilities 2021 Q2 Total 2021 Q2 Revenue (1) $30,011,041 $10,120,699 $40,131,740 Expenses (2) 8,878,839 3,601,130 12,479,969 NOI 21,132,202 6,519,569 $27,651,771 Same-Store Facilities 2021 Q1 Non Same-Store Facilities 2021 Q1 Total 2021 Q1 Revenue (1) $27,871,895 $3,188,977 $31,060,872 Expenses (2) 8,817,512 1,525,769 10,343,281 NOI 19,054,383 1,663,208 $20,717,591 Same-Store Facilities 2020 Q4 Non Same-Store Facilities 2020 Q4 Total 2020 Q4 Revenue (1) $27,238,620 $1,947,079 $29,185,699 Expenses (2) 8,699,157 919,199 9,618,356 NOI 18,539,463 1,027,880 $19,567,343 Same-Store Facilities 2020 Q3 Non Same-Store Facilities 2020 Q3 Total 2020 Q3 Revenue (1) $26,419,911 $1,718,242 $28,138,153 Expenses (2) 8,827,519 989,255 9,816,774 NOI 17,592,392 728,987 $18,321,379 Same-Store Facilities 2020 Q2 Non Same-Store Facilities 2020 Q2 Total 2020 Q2 Revenue (1) $24,702,072 $1,428,139 $26,130,211 Expenses (2) 8,279,464 915,579 9,195,043 NOI 16,422,608 512,560 $16,935,168 Same-Store Facilities 6/30/2021 YTD Non Same-Store Facilities 6/30/2021 YTD Total 6/30/2021 YTD Revenue (1) $57,882,936 $13,309,676 $71,192,612 Expenses (2) 17,696,351 5,126,899 22,823,250 NOI 40,186,585 8,182,777 $48,369,362 Same-Store Facilities 6/30/2020 YTD Non Same-Store Facilities 6/30/2020 YTD Total 6/30/2020 YTD Revenue (1) $50,107,107 $2,743,966 $52,851,073 Expenses (2) 16,996,158 1,873,911 18,870,069 NOI 33,110,949 870,055 $33,981,004 1.Revenue includes rental revenue, Tenant Programs revenue, ancillary revenue, and administrative and late fees.2.Expenses excludes corporate general and administrative expenses, asset management fees, interest expense, depreciation, amortization expense, and acquisition expenses, but includes property management fees as applicable. SmartStop Self Storage REIT, Inc. Financial Supplement 2021 Q2 31

Reconciliation of Net Loss to Net Operating Income: Trailing 5 Quarters SmartStop Self Storage REIT, Inc.the Smarter wat to store! 2021 Q2 2021 Q1 2020 Q4 2020 Q3 2020 Q2 Net loss $(1,310,838) $(12,303,466) $(1,943,884) $(4,456,497) $(7,062,841) Adjusted to exclude: Managed REIT Platform revenue (1,058,291) (2,287,740) (2,360,929) (2,051,021) (1,852,893) Managed REIT Platform expenses 316,142 319,890 294,818 329,280 1,008,014 General and administrative 6,811,313 4,752,989 4,641,467 4,012,072 4,149,713 Depreciation 10,742,801 8,543,927 8,731,926 8,003,587 7,842,443 Intangible amortization expense 3,653,681 1,259,547 1,301,434 1,587,899 3,218,152 Acquisition expenses 30,448 305,650 772,189 468,577 97,221 Contingent earnout adjustment 400,000 2,119,744 2,600,000 1,600,000 500,000 Write-off of equity interest and preexisting relationships in SST IV upon acquisition of control — 8,389,573 — — — Gain on sale of real estate (178,631) Interest expense 7,950,702 7,975,464 7,880,405 8,093,476 8,284,429 Interest expense—accretion of fair market value of secured debt (31,250) (31,866) (32,345) (32,788) (32,892) Interest expense—debt issuance costs 496,897 672,473 754,141 952,479 936,278 Net loss on extinguishment of debt — 2,444,788 — — — Other (171,203) (1,443,382) (3,071,879) (185,685) (152,456) Total property operating income $27,651,771 $20,717,591 $19,567,343 $18,321,379 $16,935,168 Total revenue $40,131,740 $31,060,872 $29,185,699 $28,138,153 $26,130,211 Total property operating expenses 12,479,969 10,343,281 9,618,356 9,816,774 9,195,043 Total property operating income $27,651,771 $20,717,591 $19,567,343 $18,321,379 $16,935,168 2021 YTD 2020 YTD Net loss $(13,614,304) $(44,806,422) Adjusted to exclude: Managed REIT Platform revenue (3,346,031) (3,636,680) Managed REIT Platform expenses 636,032 2,182,823 General and administrative 11,564,302 7,817,660 Depreciation 19,286,728 15,559,114 Intangible amortization expense 4,913,228 6,887,783 Acquisition expenses 336,098 125,326 Contingent earnout adjustment 2,519,744 (6,700,000) Impairment of goodwill and intangible assets — 36,465,732 Impairment of investments in Managed REITs — 4,376,879 Write-off of equity interest and preexisting relationships in SST IV upon acquisition of control 8,389,573 — Gain on sale of real estate (178,631) — Interest expense 15,926,166 16,623,732 Interest expense—accretion of fair market value of secured debt (63,116) (65,549) Interest expense—debt issuance costs 1,169,370 1,879,761 Net loss on extinguishment of debt 2,444,788 — Other (1,614,585) (2,729,155) Total property operating income $48,369,362 $33,981,004 Total revenue $71,192,612 $52,851,073 Total property operating expenses 22,823,250 18,870,069 Total property operating income $48,369,362 $33,981,004 SmartStop Self Storage REIT, Inc. Financial Supplement 2021 Q2 32

Forward Looking Statements SmartStop Self Storage REIT, Inc.the Smarter wat to store! Certain of the matters discussed in this communication constitute forward-looking statements within the meaning of the safe harbor provisions of the Private Securities Litigation Reform Act of 1995. Such forward-looking statements can generally be identified by our use of forward-looking terminology such as “may,” “will,” “expect,” “intend,” “anticipate,” “estimate,” “believe,” “continue,” or other similar words. Readers are cautioned not to place undue reliance on these forward-looking statements and any such forward-looking statements are qualified in their entirety by reference to the following cautionary statements. All forward-looking statements speak only as of the date hereof and are based on current expectations and involve a number of assumptions, risks and uncertainties that could cause the actual results to differ materially from such forward-looking statements. Such forward-looking statements include, but are not limited to, statements about the expected effects and benefits of the SST IV merger, the SSGT merger, the self administration transaction and the Series A Preferred equity investment, including anticipated future financial and operating results and synergies, as well as all other statements in this communication, other than historical facts. There are several factors which could cause actual plans and results to differ materially from those expressed or implied in forward-looking statements, including, without limitation, the following: (i) risks related to disruption of management’s attention from SmartStop’s ongoing business operations due to the SST IV merger or other business matters; (ii) significant transaction costs, including financing costs, and unknown liabilities; (iii) failure to realize the expected benefits and synergies of either of the SST IV merger, the SSGT merger or the self administration transaction in the expected time frames or at all; (iv) costs or difficulties related to the integration of acquired self storage facilities and operations; (v) changes in the political and economic climate, economic conditions and fiscal imbalances in the United States, and other major developments, including wars, natural disasters, epidemics and pandemics, including the outbreak of novel coronavirus (COVID-19), military actions, and terrorist attacks; (vi) changes in tax and other laws and regulations; or (vii) difficulties in SmartStop’s ability to attract and retain qualified personnel and management. Actual results may differ materially from those indicated by such forward-looking statements. In addition, the forward-looking statements represent SmartStop’s views as of the date on which such statements were made. SmartStop anticipates that subsequent events and developments may cause its views to change. These forward-looking statements should not be relied upon as representing SmartStop’s views as of any date subsequent to the date hereof. Additional factors that may affect the business or financial results of SmartStop are described in the risk factors included in SmartStop’s filings with the SEC, including SmartStop’s Annual Report on Form 10-K for the fiscal year ended December 31, 2020 and subsequent Quarterly Reports on Form 10-Q and Current Reports on Form 8-K, which factors are incorporated herein by reference, all of which are filed with the SEC and available at www.sec.gov. SmartStop expressly disclaims a duty to provide updates to forward-looking statements, whether as a result of new information, future events or other occurrences. SmartStop Self Storage REIT, Inc. Financial Supplement 2021 Q2 33

SmartStop Self Storage REIT, Inc.the Smarter wat to store!