Attached files
| file | filename |
|---|---|
| EX-99.2 - EXHIBIT 99.2 - CHESAPEAKE ENERGY CORP | tm2124808d1_ex99-2.htm |
| EX-99.1 - EXHIBIT 99.1 - CHESAPEAKE ENERGY CORP | tm2124808d1_ex99-1.htm |
| 8-K - FORM 8-K - CHESAPEAKE ENERGY CORP | tm2124808d1_8k.htm |
Exhibit 99.3

Consistent Returns, Sustainable Future 2Q 2021 EARNINGS / AUGUST 10, 2021

Forward - Looking Statements 2Q’21 Earnings – August 10, 2021 2 This presentation include “forward - looking statements” within the meaning of Section 27 A of the Securities Act of 1933 and Section 21 E of the Securities Exchange Act of 1934 . Forward - looking statements are statements other than statements of historical fact . They include statements that give our current expectations, management’s outlook guidance or forecasts of future events, expected natural gas and oil growth trajectory, projected cash flow and liquidity, our ability to enhance our cash flow and financial flexibility, dividend plans, future production and commodity mix, plans and objectives for future operations, ESG initiatives, the ability of our employees, portfolio strength and operational leadership to create long - term value, and the assumptions on which such statements are based . Although we believe the expectations and forecasts reflected in the forward - looking statements are reasonable, we can give no assurance they will prove to have been correct . They can be affected by inaccurate or changed assumptions or by known or unknown risks and uncertainties . Factors that could cause actual results to differ materially from expected results include those described under “Risk Factors” in Item 1 A of our annual report on Form 10 - K and any updates to those factors set forth in Chesapeake’s subsequent quarterly reports on Form 10 - Q or current reports on Form 8 - K (available at http : //www . chk . com/investors/sec - filings) . These risk factors include : the impact of the COVID - 19 pandemic and its effect on the company’s business, financial condition, employees, contractors and vendors, and on the global demand for oil and natural gas and U . S . and world financial markets ; the volatility of oil, natural gas and NGL prices ; the limitations our level of indebtedness may have on our financial flexibility ; our inability to access the capital markets on favorable terms ; the availability of cash flows from operations and other funds to fund cash dividends, to finance reserve replacement costs or satisfy our debt obligations ; write - downs of our oil and natural gas asset carrying values due to low commodity prices ; our ability to replace reserves and sustain production ; uncertainties inherent in estimating quantities of oil, natural gas and NGL reserves and projecting future rates of production and the amount and timing of development expenditures ; our ability to generate profits or achieve targeted results in drilling and well operations ; leasehold terms expiring before production can be established ; commodity derivative activities resulting in lower prices realized on oil, natural gas and NGL sales ; the need to secure derivative liabilities and the inability of counterparties to satisfy their obligations ; adverse developments or losses from pending or future litigation and regulatory proceedings, including royalty claims ; charges incurred in response to market conditions ; drilling and operating risks and resulting liabilities ; effects of environmental protection laws and regulations on our business ; legislative and regulatory initiatives further regulating hydraulic fracturing ; our need to secure adequate supplies of water for our drilling operations and to dispose of or recycle the water used ; impacts of potential legislative and regulatory actions addressing climate change ; federal and state tax proposals affecting our industry ; potential OTC derivatives regulation limiting our ability to hedge against commodity price fluctuations ; competition in the oil and gas exploration and production industry ; a deterioration in general economic, business or industry conditions ; negative public perceptions of our industry ; limited control over properties we do not operate ; pipeline and gathering system capacity constraints and transportation interruptions ; terrorist activities and cyber - attacks adversely impacting our operations ; and an interruption in operations at our headquarters due to a catastrophic event . In addition, disclosures concerning the estimated contribution of derivative contracts to our future results of operations are based upon market information as of a specific date . These market prices are subject to significant volatility . Our production forecasts are also dependent upon many assumptions, including estimates of production decline rates from existing wells and the outcome of future drilling activity . We caution you not to place undue reliance on our forward - looking statements that speak only as of the date of this presentation, and we undertake no obligation to update any of the information provided in this presentation, except as required by applicable law . In addition, this presentation contains time - sensitive information that reflects management's best judgment only as of the date of this presentation .

Chesapeake Value Drivers 2Q’21 Earnings – August 10, 2021 3 (1) Adjusted EBITDAX is a non - GAAP financial measure and is defined as earnings before interest, taxes, depreciation and amortizatio n, exploration expenses and other. See the appendix for a reconciliation of net income (loss) to adjusted EBITDAX. (2) Long - term leverage = net debt / adjusted EBITDAX. Net debt (non - GAAP) = Total debt (GAAP) – Premiums and issuance costs on debt – Cash and cash equivalents. (3) Defined as volume methane emissions / volume gross gas produced. (4) Defined as tCO 2 e/gross mboe produced . (5) Free cash flow (non - GAAP) = Net cash provided by (used in) operating activities (GAAP) + Cash paid for reorganization items , net – Capital expenditures. Estimated based on 7/30/21 strip pricing from 2021 to 2025. Disciplined capital reinvestment rate 60 – 70% of projected adjusted EBITDAX (1) Achieve net - zero direct GHG emissions by 2035 Eliminate routine flaring on all new wells completed from 2021 forward and enterprise - wide by 2025 Reduce methane intensity (3) to 0.09% and greenhouse gas (GHG) intensity (4) to 5.5 by 2025 Returning cash to shareholders 2021E FCF yield ~15% ~2.5% base dividend yield Variable return program defined: delivering 50% of FCF quarterly beginning 1Q’22 >$4B of FCF projected over next five years (5) Maintain balance sheet strength <1x long - term leverage (2)

Chesapeake Today ➤ Strong balance sheet with low leverage ➤ Generating sustainable free cash flow ➤ Disciplined capital reinvestment strategy ➤ World - class natural gas assets, with oil optionality and scale to win ➤ Committed to ESG and safety excellence (1) Non - GAAP measure as defined in the supplemental financial tables available on the company’s website at www.chk.com. (2) Free cash flow (non - GAAP) = Net cash provided by (used in) operating activities (GAAP) + Cash paid for reorganization items, net – Capital expenditures. (3) Net debt (non - GAAP) = Total debt (GAAP) – Premiums and issuance costs on debt – Cash and cash equivalents. 2Q’21 Earnings – August 10, 2021 Delivering Value: 2Q Highlights 4 Adjusted EBITDAX (1) $429mm Strong projected FCF and cash return on capital invested for 2021 Balance sheet cash $612mm As of 6/30/21 Net debt (3) to 2021E adjusted EBITDAX 0.3x Free cash flow (2) $292mm Annual G&A guidance reduced 15%

Meeting Our ESG Pledges ➤ Chesapeake seeks to be the first company to independently certify and continuously monitor its natural gas production across two major shale gas basins under the standards developed by MiQ and Equitable Origin • Haynesville gas to be RSG certified by 4Q’21; Marcellus gas by 2Q’22 ➤ Certification supports Chesapeake’s pledge to reduce methane and GHG intensity and achieve net - zero direct greenhouse gases by 2035 ➤ Recently entered into and are continuing to pursue supply agreements providing RSG certified gas from our Marcellus Shale production “Chesapeake Energy Aims to Take Lead in Responsibly Sourced Gas Movement” – Hart Energy We are excited to be working with MiQ and Chesapeake on this new project. Chesapeake is committed to protecting the country’s natural resources and reducing its environmental footprint. We look forward to working with them to help them bring that commitment to life.” – Equitable Origin CEO “ 2Q’21 Earnings – August 10, 2021 5

2021 Updated Guidance 2Q’21 Earnings – August 10, 2021 6 Note: Percentages based on midpoints. (1) Adjusted EBITDAX is a non - GAAP financial measure and is defined as earnings before interest, taxes, depreciation and amorti zation, exploration expenses and other. See the appendix for a reconciliation of net income (loss) to adjusted EBITDAX. Adjusted EBITDAX (1) : $1.8 – 1.9B 16% improvement Annual G&A guidance: 15% reduction Production: 415 – 435 mboe/d Raising guidance due to lower base declines across portfolio Affirmed disciplined capital spending : $670 – $ 740mm No change

Deep Portfolio: Diversified Positions Across Multiple Basins 2Q’21 Earnings – August 10, 2021 7 Note: Net acres and projected WI and NRI estimates as of 12/31/20. 2Q’21 PRODUCTION ~ 433 mboe/d Appalachia: 1,279 mmcf/d Brazos Valley: 37 mboe/d Gulf Coast: 531 mmcf/d Powder River: 23 mboe/d South Texas: 72 mboe/d Projected 2021 Capex $670mm – 740mm ’21E ASSET DEVELOPMENT DETAIL 2Q’21 PRODUCTION MIX ’21E ACTIVITY POWDER RIVER BASIN ~190,000 net acres ~80% WI, 65% NRI .25 active rigs, ~4 wells drilled Powder River Basin APPALACHIA ~540,000 net acres ~40% WI, 35% NRI ~3 active rigs, ~65 wells drilled $700 – 750 cost/lateral foot Appalachia GULF COAST ~225,000 net acres ~80% WI, 65% NRI 3 active rigs, ~30 wells drilled $900 – 1,000 cost/lateral foot Gulf Coast BRAZOS VALLEY ~420,000 net acres ~95% WI, 75% NRI 0 active rigs, 0 wells drilled Brazos Valley SOUTH TEXAS ~220,000 net acres ~60% WI, 45% NRI ~1 active rig, ~19 wells drilled $425 – 475 cost/lateral foot South Texas NGL 6% Oil 17% Gas 77% Appalachia ~40% South Texas ~13% Gulf Coast ~40% Powder River ~5% Brazos Valley ~2%

Appendix

Current Hedge Position Note: Hedged volumes and prices reflect positions as of 7/31/21, percentages are fixed price hedges vs. guidance. AVERAGE HEDGED PRICE RMDR 2021 FY 2022 FY 2023 Gas ($/mcf) $ 2.67 $ 2.52 $ 2.75 Oil ($/bbl) $ 42.62 $ 44.30 $ 47.17 NATURAL GAS OIL SWAPS COLLARS SWAPS Date Volume bcf Avg. Price $/mcf Volume bcf Avg. Put $/mcf Avg. Call $/mcf Volume mmbbl Avg. Price $/bbl 3Q 2021 126.6 2.66 8.3 2.80 3.29 4.6 42.62 4Q 2021 115.2 2.67 8.3 2.80 3.29 4.3 42.62 RMDR 2021 241.8 2.67 16.6 2.80 3.29 8.9 42.62 1Q 2022 77.7 2.55 18.0 2.50 2.86 3.2 43.57 2Q 2022 69.0 2.51 18.2 2.50 2.86 2.8 43.12 3Q 2022 66.8 2.55 18.4 2.50 2.86 2.7 44.85 4Q 2022 35.9 2.62 41.8 2.39 2.90 2.6 45.92 FY 2022 249.5 2.55 96.4 2.45 2.88 11.2 44.30 1Q 2023 45.2 2.75 – – – 1.9 47.17 FY 2023 45.2 2.75 – – – 1.9 47.17 Gas % Hedged Oil % Hedged 75% 45% 78% 52% FY 2021 FY 2022 2Q’21 Earnings – August 10, 2021 9 ➤ In 2Q’21, CHK amended its RBL which eliminated the hedge requirement of >50% of PDP on a rolling 24 - month basis

ARGUS HOUSTON VS ARGUS WTI RMDR 2021: 1.2 mmbbls @ $1.10/bbl WTI - NYMEX ROLL RMDR 2021: 5.7 mmbbls @ $0.37/bbl 2022: 6.0 mmbbls @ $0.34/bbl CGT MAINLINE BASIS RMDR 2021: 5.5 bcf @ ($0.23)/mcf HSC INDEX SWAPS RMDR 2021: 3.7 bcf @ $0.01/mcf Hedged Basis Projection 2Q’21 Earnings – August 10, 2021 10 (1) Transport spread vs. TGP Z4 300L As of 7/31/2021 APPALACHIA NATURAL GAS HEDGES BASIS TRANSPORT SPREAD (1) TOTAL APPALACHIA TETCO M3 TGP Z4 300L LEIDY TETCO M3 LEIDY Date Volume bcf % of Exposure Avg. Price $/mcf Volume bcf % of Exposure Avg. Price $/mcf Volume bcf % of Exposure Avg. Price $/mcf Volume bcf % of Exposure Avg. Price $/mcf Volume bcf % of Exposure Avg. Price $/mcf Volume bcf % of Exposure Avg. Price $/mcf 3Q 2021 48.2 41% (0.89) 13.8 52% (0.61) 19.4 42% (1.00) 15.0 43% (1.02) – – – 2.3 7% 0.11 4Q 2021 26.3 23% (0.59) 9.2 35% (0.01) 10.3 23% (0.89) 6.8 20% (0.90) 5.4 20% 0.79 0.8 2% 0.11 RMDR 2021 74.5 32% (0.79) 23.0 43% (0.37) 29.7 33% (0.96) 21.8 31% (0.98) 5.4 10% 0.79 3.1 4% 0.11 1Q 2022 18.9 17% (0.30) 6.8 26% 0.59 7.7 17% (0.82) 4.5 13% (0.74) 11.1 42% 0.79 – – – 2Q 2022 1.4 1% (0.07) 1.4 5% (0.07) – – – – – – 11.3 43% 0.79 – – – 3Q 2022 1.4 1% (0.07) 1.4 5% (0.07) – – – – – – 11.4 42% 0.79 – – – 4Q 2022 0.5 0% (0.07) 0.5 2% (0.07) – – – – – – 9.9 37% 0.77 – – – FY 2022 22.1 5% (0.26) 10.0 9% 0.38 7.7 3% (0.82) 4.5 6% (0.74) 43.7 41% 0.78 – – – 1Q 2023 – – – – – – – – – – – – 6.8 26% 0.76 – – – 2Q 2023 – – – – – – – – – – – – 6.8 26% 0.76 – – – 3Q 2023 – – – – – – – – – – – – 6.9 27% 0.76 – – – 4Q 2023 – – – – – – – – – – – – 2.9 11% 0.76 – – – FY 2023 – – – – – – – – – – – – 23.4 22% 0.76 – – –
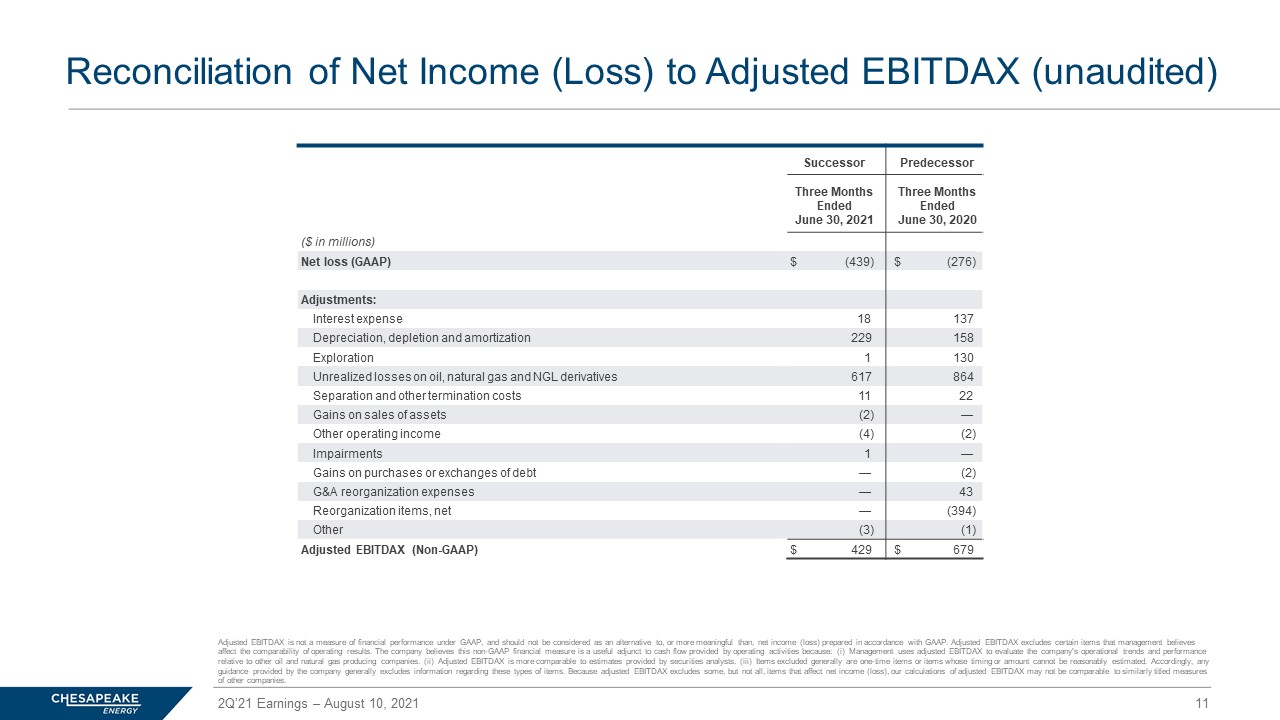
Reconciliation of Net Income (Loss) to Adjusted EBITDAX (unaudited) 2Q’21 Earnings – August 10, 2021 11 Adjusted EBITDAX is not a measure of financial performance under GAAP, and should not be considered as an alternative to, or mor e meaningful than, net income (loss) prepared in accordance with GAAP. Adjusted EBITDAX excludes certain items that managemen t b elieves affect the comparability of operating results. The company believes this non - GAAP financial measure is a useful adjunct to cash flow provided by operating activities because: (i) Management uses adjusted EBITDAX to evaluate the company's operational trend s and performance relative to other oil and natural gas producing companies. (ii) Adjusted EBITDAX is more comparable to estimates provided by se curities analysts. (iii) Items excluded generally are one - time items or items whose timing or amount cannot be reasonably estim ated. Accordingly, any guidance provided by the company generally excludes information regarding these types of items. Because adjusted EBITDAX exclude s some, but not all, items that affect net income (loss), our calculations of adjusted EBITDAX may not be comparable to simil arl y titled measures of other companies. Successor Predecessor Three Months Ended June 30, 2021 Three Months Ended June 30, 2020 ($ in millions) Net loss (GAAP) $ (439) $ (276) Adjustments: Interest expense 18 137 Depreciation, depletion and amortization 229 158 Exploration 1 130 Unrealized losses on oil, natural gas and NGL derivatives 617 864 Separation and other termination costs 11 22 Gains on sales of assets (2) — Other operating income (4) (2) Impairments 1 — Gains on purchases or exchanges of debt — (2) G&A reorganization expenses — 43 Reorganization items, net — (394) Other (3) (1) Adjusted EBITDAX (Non - GAAP) $ 429 $ 679

Reconciliations of Free Cash Flow and Net Debt 2Q’21 Earnings – August 10, 2021 12 FREE CASH FLOW Successor Predecessor Three Months Ended June 30, 2021 Three Months Ended June 30, 2020 ($ in millions) Net cash provided by operating activities (GAAP) $ 394 $ 376 Cash paid for reorganization items, net 47 55 Capital expenditures (149) (349) Free cash flow (Non - GAAP) $ 292 $ 82 NET DEBT Successor June 30, 2021 ($ in millions) Total debt (GAAP) $ 1,261 Premiums and issuance costs on debt (40) Principal amount of debt 1,221 Cash and cash equivalents (612) Net debt (Non - GAAP) $ 609

Management’s Outlook as of August 10, 2021 2Q’21 Earnings – August 10, 2021 13 (a) Includes ~$0.08/boe of expenses associated with stock - based compensation, which are recorded in general and administrative expen ses in Chesapeake’s Condensed Consolidated Statement of Operations. (b) Includes ~$15 million of non - cash interest expense due to timing of interest payments in 2021. (c) Adjusted EBITDAX is a non - GAAP measure used by management to evaluate the company’s operational trends and performance relative to other oil and natural gas producing companies. Adjusted EBITDAX excludes certain items that management believes affect the comparability of operating results. The most directly comparable GAAP measure is net income (loss), but it is not possible, w ith out unreasonable efforts, to identify the amount or significance of events or transactions that may be included in future GAA P n et income (loss) but that management does not believe to be representative of underlying business performance. The company further believes th at providing estimates of the amounts that would be required to reconcile forecasted adjusted EBITDAX to forecasted GAAP net inc ome (loss) would imply a degree of precision that may be confusing or misleading to investors. Items excluded from net income to arrive at adjusted EBITDAX include interest expense, income taxes, depreciation, depletion and amortization expense, and exploration ex pen se as well as one - time items or items whose timing or amount cannot be reasonably estimated. Year Ending 12/31/2021 Total production: Oil – mmbbls 23.5 – 25.5 NGL – mmbbls 6.5 – 8.5 Natural gas – bcf 725 – 745 Total daily rate – mboe per day 415 – 435 Estimated basis to NYMEX prices, based on 7/30/21 strip prices: Oil – $/bbl ($0.90) – ($1.30) Natural gas – $/mcf ($0.40) – ($0.50) NGL – realizations as a % of WTI 40% – 45% Operating costs per boe of projected production: Production expense $1.85 – $2.15 Gathering, processing and transportation expenses $4.90 – $5.40 Oil – $/bbl $2.65 – $2.85 Natural Gas – $/mcf $0.90 – $1.00 Severance and ad valorem taxes $0.90 – $1.10 General and administrative (a) $0.75 – $0.95 Depreciation, depletion and amortization expense $5.00 – $6.00 Marketing net margin and Other ($ in millions) $0 – $10 Interest expense ($ in millions) (b) $70 – $80 Cash taxes ($ in millions) $0 – $20 Adjusted EBITDAX, based on 7/30/21 strip prices ($ in millions) (c) $1,800 – $1,900 Total capital expenditures ($ in millions) $670 – $740