Attached files
| file | filename |
|---|---|
| EX-99.3 - EXHIBIT 99.3 - CHESAPEAKE ENERGY CORP | tm2124808d1_ex99-3.htm |
| EX-99.1 - EXHIBIT 99.1 - CHESAPEAKE ENERGY CORP | tm2124808d1_ex99-1.htm |
| 8-K - FORM 8-K - CHESAPEAKE ENERGY CORP | tm2124808d1_8k.htm |
Exhibit 99.2

Acquisition of Vine Energy Inc. AUGUST 11, 2021

Disclaimer Vine Energy Inc. Acquisition – August 2021 2 Forward - Looking Statements This presentation includes forward - looking statements . Forward - looking statements are identified as any statement that does not relate strictly to historical or current facts . Statements using words such as “anticipate,” “believe,” “intend,” “project,” “plan,” “expect,” “continue,” “estimate,” “ goaI ,” “forecast,” “may,” or similar expressions help identify forward - looking statements . Chesapeake Energy Corporation (“CHK”) and Vine Energy Inc . (“VEI”) cannot give any assurance that expectations and projections about future events will prove to be correct . Forward - looking statements are subject to a variety of risks, uncertainties arid assumptions . These risks and uncertainties include the risks that the proposed transaction may not be consummated or the benefits contemplated therefrom may not be realized . Additional risks include : the ability to obtain requisite regulatory and stockholder approval and the satisfaction of the other conditions to the consummation of the proposed transaction, the ability of CHK to successfully integrate VEI's operations and employees and realize anticipated synergies and cost savings, the potential impact of the announcement or consummation of the proposed transaction on relationships, including with employees, suppliers, customers, competitors and credit rating agencies, the ability to achieve revenue growth, and volatility in the price of oil, natural gas, and natural gas liquids . Actual results arid outcomes may differ materially from those expressed in such forward - looking statements . These and other risks and uncertainties are discussed in more detail in filings made by CHK and VEI with the Securities and Exchange Commission (the “SEC”), which are available to the public free of charge on the SEC’s website at www . sec . gov . CHK and VEI undertake no obligation to update publicly or to revise any forward - looking statements, whether as a result of new information, future events or otherwise . Additional Information and Where to Find It This document relates to a proposed transaction between CHK and VEI . This document does not constitute an offer to sell or exchange, or the solicitation of an offer to buy or exchange, any securities, nor shall there be any sale of securities in any jurisdiction in which such offer, sale or exchange would be unlawful prior to registration or qualification under the securities laws of any such jurisdiction . CHK intends to file a registration statement on Form S - 4 that includes a proxy statement/prospectus . The proxy statement/prospectus will be sent to all VEI stockholders . CHK and VEI will also file other documents regarding the proposed transaction with the SEC . Before making any voting decision, investors and security holders of VEI are urged to read the registration statement, the proxy statement/prospectus and all other relevant documents filed or that will be filed with the SEC in connection with the proposed transaction as they become available because they will contain important information about the proposed transaction . Investors and security holders will be able to obtain free copies of the proxy statement/prospectus and all other relevant documents filed or that will be filed with the SEC by CHK and VEI through the website maintained by the SEC at www . sec . gov . Participants in Solicitation CHK and VEI and their respective directors and officers may be deemed to be participants in the solicitation of proxies from VEI’s stockholders in connection with the proposed transaction . Information about VEI’s directors and executive officers and their ownership of VEI securities is set forth in VEI’s filings with the SEC . To the extent that holdings of VEI securities have changed since the amounts printed in VEI’s most recent proxy statement, such changes have been or will be reflected on Statements of Change in Ownership on Form 4 filed with the SEC . Additional information regarding the interests of those persons and other persons who may be deemed participants in the proposed transaction may be obtained by reading the proxy statement/prospectus regarding the proposed transaction when it becomes available . You may obtain free copies of this document and other applicable documents as described in the preceding paragraph . No Offer or Solicitation This presentation is for informational purposes only and does not constitute an offer to sell or the solicitation of an offer to buy any securities or a solicitation of any vote or approval, in any jurisdiction, pursuant to the proposed merger or otherwise, nor shall there be any sale, issuance, exchange or transfer or the securities referred to in this document in any jurisdiction in contravention of applicable law . No offer of securities shall be made except by means of a prospectus meeting the requirements of Section 10 of the Securities Act of 1933 , as amended .

(1) A non - GAAP measure as defined in the appendix. (2) Based on 7/30/21 strip prices and 8/06/21 CHK stock price. CHK acquires VEI at zero premium using 8% cash, 92% equity $1.20 plus 0.2486 shares of CHK common stock per VEI share of common stock Adding ~370 premium Haynesville/Bossier locations >50% ROR at $2.50 gas Pro forma net debt - to - EBITDAX (1) 0.6x in 2022 Preserving balance sheet strength Consolidates Haynesville CHK to become the largest producer in the Haynesville ~1.6 net bcf per day (2Q’21) Immediately accretive to: Cash flow/share FCF/share (1) FCF yield (1) GHG emissions profile ~$6B in 5 - yr FCF (1)(2) Increasing base dividend by 27% and initiating variable return program 100% of PF Haynesville/Bossier production will be Responsibly Sourced Gas (RSG) certified by YE 2021 Vine Energy Inc. Acquisition – August 2021 3 Increasing FCF . Enhancing scale . Delivering RSG to premium markets . Returning cash to shareholders .

Haynesville / Bossier Shale CHK CHK PF Net Acres 225,000 348,000 Held by Production 100% 99% Average Working Interest 80% 83% Gross Locations 900 1,500 2Q’21 Net Daily Production (mmcf/d) 531 1,581 Pro forma company = largest Haynesville producer Building the Dominant Gulf Coast Operator ➤ Adjacent positions providing premium over - pressured stacked gas opportunities in Haynesville and Mid - Bossier shale plays VEI Rig CHK Rig VEI Acreage CHK Acreage Haynesville Bossier Vine Energy Inc. Acquisition – August 2021 4

Enhanced Pro Forma GHG Emissions Profile Vine Energy Inc. Acquisition – August 2021 5 (1) Pro forma estimates include 2020 CHK and VEI numbers. (2) Defined as tCO 2 e/gross mboe produced . (3) Defined as volume methane emissions / volume gross gas produced. (4) Chesapeake intends to independently certify and continuously monitor its natural gas production across the Haynesville u nde r the standards developed by MiQ and Equitable Origin. Pro forma corporate methane intensity (1)(3) 0.11% 2020 CHK: 0.13% Pro forma GHG emissions intensity (1)(2) 5.4 kg CO 2 e/boe 2020 CHK: 6.0 kg CO 2 e/boe PF Haynesville/Bossier production will be RSG certified (4) by YE 2021 100%

Dominant RSG Supplier to Premium Gulf Coast and Export Markets ➤ Combined production of CHK and VEI represents dominant supplier of RSG to the Gulf Coast and LNG export markets • No firm transport in VEI’s current portfolio • Several new projects (new construction and expansion of existing) focused on delivering gas from NW Louisiana to export markets • Majority of VEI firm sales expire within three years, allowing CHK to capitalize on competitive downstream pipeline and LNG markets • Expect to achieve RSG certification for all CHK and VEI production by YE 2021 1.6 bcf /d net Facility/Power Plant Existing LNG Facility Approved LNG Project Gathering Facility Sales Point VEI Acreage CHK Acreage Vine Energy Inc. Acquisition – August 2021 6

Cost Savings Create Significant Shareholder Value G&A and LOE Efficiencies $20 million Capital Efficiencies $30 million ANNUAL AVERAGE SAVINGS $50 million ➤ Operational efficiencies include savings from reduced G&A and LOE including VEI corporate workforce synergies ➤ Capital efficiencies include savings from reduced capex and improved cycle time ➤ Expect to recognize additional savings from midstream contract opportunities, leasehold optimization and other operational and capital efficiencies Vine Energy Inc. Acquisition – August 2021 7

Accelerating Cash to Shareholders ➤ Initiated annual base dividend of $1.375/share, annualized, in 2Q’21 ➤ With this transaction, increasing base dividend by 27% to $1.75/share, annualized (post closing) • Immediate delivery of synergies to shareholders • Maintain leadership among peers on dividend yields ➤ New variable return policy returns additional FCF (1) to shareholders • 50% of quarterly FCF (1) to be returned to shareholders through variable dividend • To be calculated quarterly and paid in following quarter, payable starting in 1Q’22 • Potential to push towards double digit dividend yields $0.3438 $0.3438 $0.4375 3Q'21 4Q'21 Projected 1Q'22 Projected 1Q'22 Variable cash return to shareholders Larger base dividend and new variable dividend as a result of the significant increase in free cash flow Vine Energy Inc. Acquisition – August 2021 8 (1) A non - GAAP measure as defined in the appendix.

Preliminary Pro Forma 2022 Outlook Vine Energy Inc. Acquisition – August 2021 9 Immediately accretive to: Cash flow/share FCF/share (2) FCF yield (2) (1) Based on 7/30/21 strip prices and 8/06/21 CHK stock price. (2) A non - GAAP measure as defined in the appendix. 2022 Projected Multiples (1) 2022E CHK 2022E CHK Pro Forma Operating Cash Flow per Share ~$16.10 ~$18.50 FCF (2) / Fully Diluted Share ~$7.10 ~$7.80 FCF Yield (2) 13% 14 % Net Debt / EBITDAX (2) 0.3x 0.6x Updated 2021E – Preliminary 2022E Outlook (1) 2021E CHK Previous 2021E CHK 8/10/21 2022E CHK 2022E CHK Pro Forma Oil Production ( mmbbl ) 23.0 – 25.0 23.5 – 25.5 20 – 22 20 – 22 Gas Production (bcf) 715 – 735 725 – 745 750 – 775 1,095 – 1,125 Total Production (mboe/d) 410 – 420 415 – 435 415 – 435 575 – 595 LOE per boe $1.85 – $2.15 $1.85 – $2.15 $1.85 – $2.15 $ 1.65 – $ 1.95 GP&T per boe $4.90 – $5.40 $4.90 – $5.40 $4.70 – $5.20 $ 3.90 – $ 4.40 G&A per boe $0.85 – $1.15 $0.75 – $0.95 $0.75 – $0.95 $ 0.55 – $ 0.75 Adjusted EBITDAX (2) ($B) $1.55 – $1.65 $1.8 – $1.9 $1.85 – $2.05 $ 2.55 – $2.75 Total Capex ($mm) $670 – $740 $670 – $740 $900 – $1,200 $ 1,300 – $ 1,600 Reinvestment Rate ~44% ~38% ~54% ~55 % Enterprise Value ($B) $7.0 $ 9.1 Net Debt (2) ($B) (6/30/21) $0.6 $ 1.7 Fully Diluted Shares (mm) 116 135

1.9x 1.8x 1.4x 1.4x 1.1x 0.8x 0.7x 0.6x 0.6x 0.3x 0.1x EQT SWN FANG OVV MRO DVN PXD COG PF CHK PF CHK EOG Current net debt / 2022E EBITDAX (1) Large - cap Diversified Peer Benchmarking Vine Energy Inc. Acquisition – August 2021 10 Source: FactSet as of 8/6/21, company filings; Note: Peers include: COG, DVN, EOG, FANG, MRO, OVV and PXD. (1) A non - GAAP measure as defined in the appendix. (2) Payout ratio calculated as total dividends plus share repurchases divided by operating cash flow; Total dividends are inclusi ve of both fixed dividend and any variable dividend plans; Free cash flow used to calculate variable dividends is calculated as ope rating cash flow less capex; Repurchases are consensus estimates. (3) Total dividend yield is calculated as projected fixed and variable dividends per common share divided by 8/6/21 share price. $1,950 $2,272 $2,650 $2,724 $3,359 $3,412 $3,775 $4,912 $5,971 $9,404 $10,451 CHK SWN CHK PF EQT COG PF MRO OVV FANG DVN PXD EOG 2022E EBITDAX (1) ($mm) 3.2x 3.4x 3.6x 3.9x 4.0x 4.0x 4.1x 4.6x 4.6x 4.7x 4.7x OVV CHK PF CHK MRO DVN SWN EOG EQT FANG COG PF PXD EV / 2022E EBITDAX (1) 10% 5% ~ 9% 5% 11% 6% ~ 16% 28% 30% 41% 12% 0% 0% ~8% 7% 9% 13% 17% ~ 25% 35% 41% 47% EQT SWN OVV FANG CHK EOG MRO CHK PF DVN COG PF PXD 2022E payout ratio (2) Increased scale and strong balance sheet Compelling value proposition Fixed dividend Variable dividend Share repurchases 2% 2% 2.5% 2% 2% 9% 10% 12% 10% 2022E total div. yield (3) 0% 0%
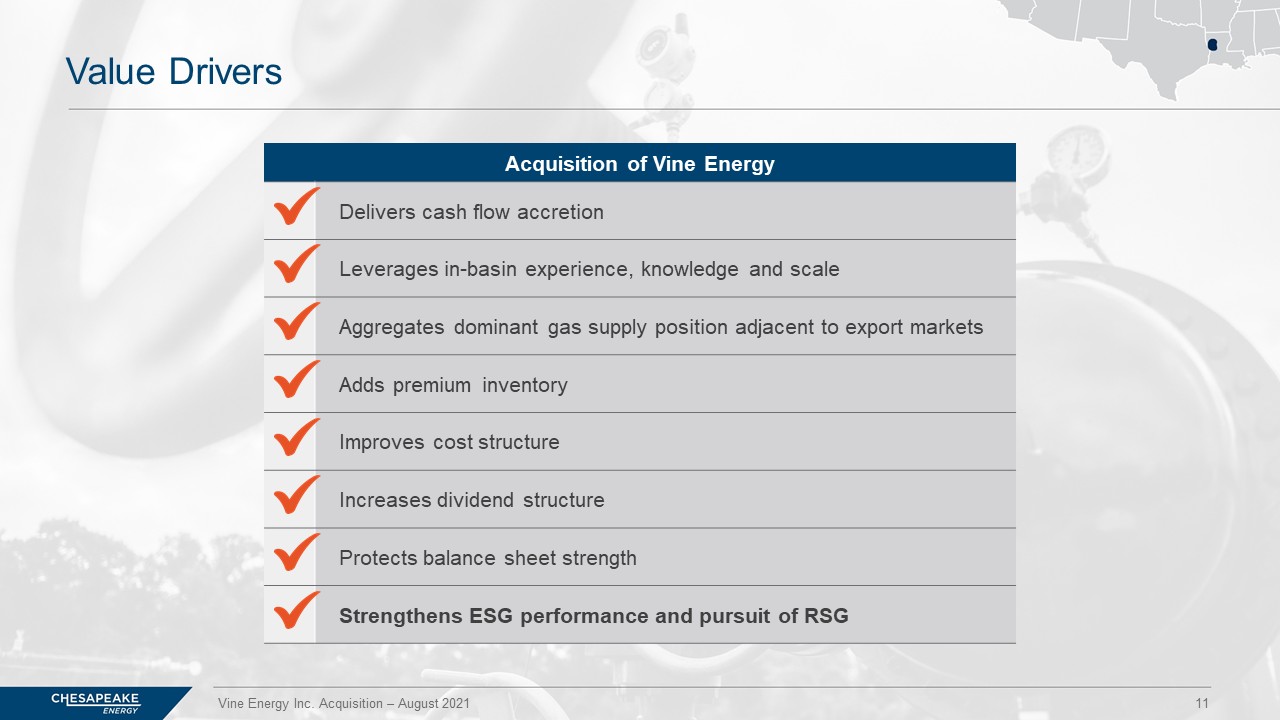
Value Drivers Vine Energy Inc. Acquisition – August 2021 11 Acquisition of Vine Energy Delivers cash flow accretion Leverages in - basin experience, knowledge and scale Aggregates dominant gas supply position adjacent to export markets Adds premium inventory Improves cost structure Increases dividend structure Protects balance sheet strength Strengthens ESG performance and pursuit of RSG

Appendix
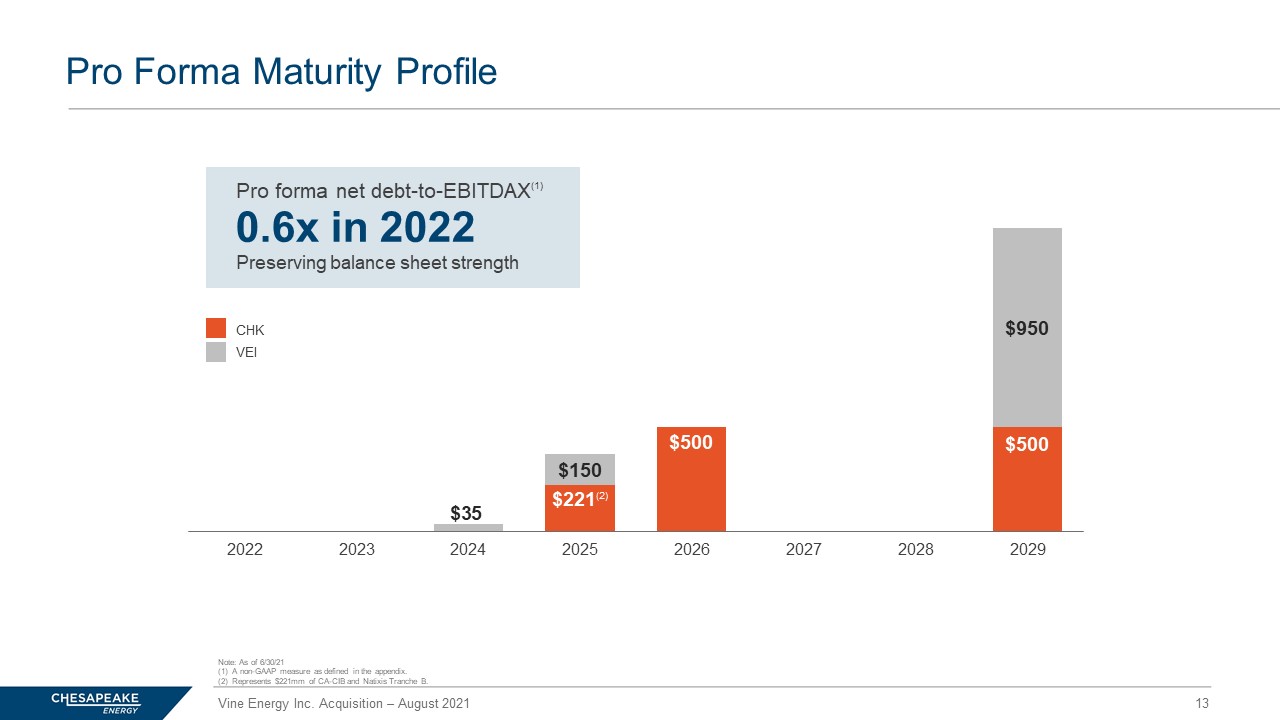
$221 (2) $500 $500 $35 $150 $950 2022 2023 2024 2025 2026 2027 2028 2029 Pro Forma Maturity Profile Vine Energy Inc. Acquisition – August 2021 13 Note: As of 6/30/21 (1) A non - GAAP measure as defined in the appendix. (2) Represents $221mm of CA - CIB and Natixis Tranche B. VEI CHK Pro forma net debt - to - EBITDAX (1) 0.6x in 2022 Preserving balance sheet strength

60 % 23% 45 % 6 % 50% 11% 2022 2023 GAS % HEDGED Hedging Program Reduces Risk, Protects Returns Vine Energy Inc. Acquisition – August 2021 14 Note: Hedged volumes and prices reflect positions as of 8/10/21, percentages are fixed price hedges vs. preliminary outlook. AVERAGE HEDGED PRICE FY 2022 2023 VEI $/mcf $ 2.55 $ 2.65 CHK $/mcf $ 2.52 $ 2.75 PF $/mcf $ 2.53 $ 2.68 VEI CHK Pro Forma

Non - GAAP Financial Measures This document includes non - GAAP financial measures . Such non - GAAP measures should not be considered as an alternative to, or more meaningful than, GAAP measures . The Company’s management believes that these measures provide useful information to external users of the Company's consolidated financial statements, such as industry analysts, lenders and ratings agencies . Due to the forward - looking nature of adjusted EBITDAX, net debt, projected free cash flow, free cash flow yield and free cash flow per share used herein, management cannot reliably predict certain of the necessary components of the most directly comparable forward - looking GAAP measures . Accordingly, the Company is unable to present a quantitative reconciliation of such forward - looking non - GAAP financial measures to their most directly comparable forward - looking GAAP financial measures without unreasonable effort . Amounts excluded from these non - GAAP measures in future periods could be significant . Adjusted EBITDAX : Adjusted EBITDAX is a non - GAAP measure used by management to evaluate the Company's operational trends and performance relative to other oil and natural gas producing companies . Adjusted EBITDAX excludes certain items that management believes affect the comparability of operating results . The most directly comparable GAAP measure is net income (loss) . Items excluded from net income (loss) to arrive at adjusted EBITDAX include interest expense, income taxes, depreciation, depletion and amortization expense, and exploration expense as well as one - time items or items whose timing or amount cannot be reasonably estimated . Net Debt : Net debt is defined as total GAAP debt excluding premiums, discounts, and deferred issuance costs less cash and cash equivalents . Net debt is presented as a widely understood measure of liquidity, but should not be considered as an alternative to, or more meaningful than, total debt presented in accordance with GAAP . Free Cash Flow, Free Cash Flow Yield and Free Cash Flow Per Share : • Free cash flow is defined as net cash provided by operating activities (GAAP), plus cash paid for reorganization items, net, less cash capital expenditures . • Free cash flow yield is defined as free cash flow divided by market capitalization . • Free cash flow per share is defined as free cash flow divided by the Company’s outstanding shares of common stock . Free cash flow, free cash flow yield and free cash flow per share are non - GAAP supplemental financial measures used by the Company’s management to assess liquidity, including the Company’s ability to generate cash flow in excess of its capital requirements and return cash to shareholders . Free cash flow, free cash flow yield and free cash flow per share should not be considered as alternatives to, or more meaningful than, net cash provided by operating activities or any other measure of liquidity presented in accordance with GAAP . Vine Energy Inc. Acquisition – August 2021 15