Attached files
| file | filename |
|---|---|
| 8-K - 8-K - MEDICAL PROPERTIES TRUST INC | d329706d8k.htm |
| EX-99.1 - EX-99.1 - MEDICAL PROPERTIES TRUST INC | d329706dex991.htm |
Exhibit 99.2
Medical Properties Trust Q2 SUPPLEMENTAL 2021

3 COMPANY OVERVIEW Company Information 3 FINANCIAL INFORMATION Reconciliation of Net Income to Funds from Operations 6 6 Debt Summary 7 Debt Maturity Schedule 8 Pro Forma Net Debt /Annualized Adjusted EBITDA 9 PORTFOLIO INFORMATION Lease and Loan Maturity Schedule 10 10 Total Pro Forma Gross Assets and Adjusted Revenue by Asset Type, Operator, State and Country 11 EBITDARM to Rent Coverage 14 Summary of Investments and Development Projects 15 FINANCIAL STATEMENTS 16 Consolidated Statements of Income 16 Consolidated Balance Sheets 17 Unconsolidated Joint Venture Investments 18 FORWARD-LOOKING STATEMENTS Forward-looking statements involve known and unknown risks, uncertainties and other factors that may cause the actual results of the Company or future events to differ materially from those expressed in or underlying such forward-looking statements, including without limitation: Normalized FFO per share; expected payout ratio; the amount of acquisitions of healthcare real estate, if any; estimated debt metrics; portfolio diversification; capital markets conditions; the repayment of debt arrangements; statements concerning the additional income to the Company as a result of ownership interests in certain hospital operations and the timing of such income; the payment of future dividends, if any; completion of additional debt arrangements and additional investments; national and international economic, business, real estate and other market conditions; the competitive environment in which the Company operates; the execution of the Company’s business plan; financing risks; the Company’s ability to maintain its status as a REIT for federal income tax purposes; acquisition and development risks; potential environmental and other liabilities; potential impact from COVID-19 on our tenants/borrowers and the related impact to us; and other factors affecting the real estate industry generally or health-care real estate in particular. For further discussion of the factors that could affect outcomes, please refer to the “Risk Factors” section of the Company’s Annual Report on Form 10-K for the year ended December 31, 2020, and as updated by the Company’s subsequently filed Quarterly Reports on Form 10-Q and other SEC filings. Except as otherwise required by the federal securities laws, the Company undertakes no obligation to update the information in this report. Certain information in the supplemental package is shown pro forma for the transactions completed subsequent to period end and the consummation of pending transactions. The pro forma adjustments are based upon available information and assumptions that we believe are reasonable. There is no assurance that the pending transactions will occur. Columbus Springs, a behavioral health facility operated by Springstone in Columbus, Ohio.

MEDICAL PROPERTIES TRUST | SUPPLEMENTAL INFORMATION | Q2 2021 2 COMPANY OVERVIEW edical Properties Trust, Inc. is a self-advised MPT’s financing model facilitates acquisitions Mreal estate investment trust formed in and recapitalizations and allows operators 2003 to acquire and develop net-leased hospital of hospitals to unlock the value of their real facilities. From its inception in Birmingham, estate assets to fund facility improvements, Alabama, the Company has grown to become one technology upgrades and other investments of the world’s largest owners of hospitals. in operations. 446 51 ~47,000 32 9 properties operators beds U. S. states countries MEDICAL PROPERTIES TRUST | SUPPLEMENTAL INFORMATION | Q2 2021 3

COMPANY OVERVIEW MPT OFFICERS: From the Left: Charles R. Lambert, Rosa H. Hooper, R. Lucas Savage, Edward K. Aldag, Jr., R. Steven Hamner, Emmett E. McLean and J. Kevin Hanna. Officers Edward K. Aldag, Jr. Chairman, President and Chief Executive Officer R. Steven Hamner Executive Vice President and Chief Financial Officer Emmett E. McLean Executive Vice President, Chief Operating Officer and Secretary J. Kevin Hanna Vice President, Controller and Chief Accounting Officer Rosa H. Hooper Vice President, Managing Director of Asset Management and Underwriting R. Lucas Savage Vice President, Head of Global Acquisitions Charles R. Lambert Vice President, Treasurer and Managing Director of Capital Markets Board of Directors Corporate Headquarters Edward K. Aldag, Jr. G. Steven Dawson Medical Properties Trust, Inc. R. Steven Hamner 1000 Urban Center Drive, Suite 501 Caterina A. Mozingo Birmingham, AL 35242 Elizabeth N. Pitman (205) 969-3755 D. Paul Sparks, Jr. (205) 969-3756 (fax) Michael G. Stewart C. Reynolds Thompson, III www.medicalpropertiestrust.com MEDICAL PROPERTIES TRUST | SUPPLEMENTAL INFORMATION | Q2 2021 4

COMPANY OVERVIEW INVESTOR RELATIONS Drew Babin Tim Berryman Senior Managing Director of Corporate Communications Managing Director of Investor Relations (646) 884-9809 dbabin@medicalpropertiestrust.com (205) 397-8589 tberryman@medicalpropertiestrust.com Stock Exchange Senior Transfer Listing and Unsecured Agent Trading Symbol Debt Ratings American Stock Transfer New York Stock Exchange Moody’s – Ba1 and Trust Company (NYSE): MPW Standard & Poor’s – BBB- 6201 15th Avenue Brooklyn, NY 11219 Above: Newbury Manor operated by Priory in Coleford, England. MEDICAL PROPERTIES TRUST | SUPPLEMENTAL INFORMATION | Q2 2021 5
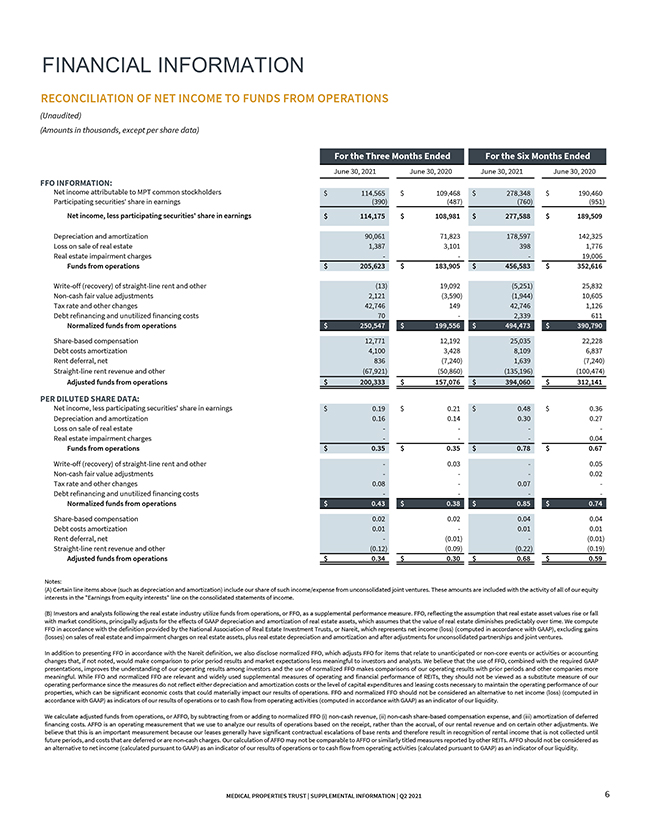
FINANCIAL INFORMATION RECONCILIATION OF NET INCOME TO FUNDS FROM OPERATIONS (Unaudited) (Amounts in thousands, except per share data) For the Three Months Ended For the Six Months Ended June 30, 2021 June 30, 2020 June 30, 2021 June 30, 2020 FFO INFORMATION: Net income attributable to MPT common stockholders $ 114,565 $ 109,468 $ 278,348 $ 190,460 Participating securities’ share in earnings (390) (487) (760) (951) Net income, less participating securities’ share in earnings $ 114,175 $ 108,981 $ 277,588 $ 189,509 Depreciation and amortization 90,061 71,823 178,597 142,325 Loss on sale of real estate 1,387 3,101 398 1,776 Real estate impairment charges — — — 19,006 Funds from operations $ 205,623 $ 183,905 $ 456,583 $ 352,616 Write-off (recovery) of straight-line rent and other (13) 19,092 (5,251) 25,832 Non-cash fair value adjustments 2,121 (3,590) (1,944) 10,605 Tax rate and other changes 42,746 149 42,746 1,126 Debt refinancing and unutilized financing costs 70 — 2,339 611 Normalized funds from operations $ 250,547 $ 199,556 $ 494,473 $ 390,790 Share-based compensation 12,771 12,192 25,035 22,228 Debt costs amortization 4,100 3,428 8,109 6,837 Rent deferral, net 836 (7,240) 1,639 (7,240) Straight-line rent revenue and other (67,921) (50,860) (135,196) (100,474) Adjusted funds from operations $ 200,333 $ 157,076 $ 394,060 $ 312,141 PER DILUTED SHARE DATA: Net income, less participating securities’ share in earnings $ 0.19 $ 0.21 $ 0.48 $ 0.36 Depreciation and amortization 0.16 0.14 0.30 0.27 Loss on sale of real estate — — — -Real estate impairment charges — — — 0.04 Funds from operations $ 0.35 $ 0.35 $ 0.78 $ 0.67 Write-off (recovery) of straight-line rent and other — 0.03 — 0.05 Non-cash fair value adjustments — — — 0.02 Tax rate and other changes 0.08 — 0.07 -Debt refinancing and unutilized financing costs — — — — Normalized funds from operations $ 0.43 $ 0.38 $ 0.85 $ 0.74 Share-based compensation 0.02 0.02 0.04 0.04 Debt costs amortization 0.01 — 0.01 0.01 Rent deferral, net — (0.01) — (0.01) Straight-line rent revenue and other (0.12) (0.09) (0.22) (0.19) Adjusted funds from operations $ 0.34 $ 0.30 $ 0.68 $ 0.59 Notes: (A) Certain line items above (such as depreciation and amortization) include our share of such income/expense from unconsolidated joint ventures. These amounts are included with the activity of all of our equity interests in the “Earnings from equity interests” line on the consolidated statements of income. (B) Investors and analysts following the real estate industry utilize funds from operations, or FFO, as a supplemental performance measure. FFO, reflecting the assumption that real estate asset values rise or fall with market conditions, principally adjusts for the effects of GAAP depreciation and amortization of real estate assets, which assumes that the value of real estate diminishes predictably over time. We compute FFO in accordance with the definition provided by the National Association of Real Estate Investment Trusts, or Nareit, which represents net income (loss) (computed in accordance with GAAP), excluding gains (losses) on sales of real estate and impairment charges on real estate assets, plus real estate depreciation and amortization and after adjustments for unconsolidated partnerships and joint ventures. In addition to presenting FFO in accordance with the Nareit definition, we also disclose normalized FFO, which adjusts FFO for items that relate to unanticipated or non-core events or activities or accounting changes that, if not noted, would make comparison to prior period results and market expectations less meaningful to investors and analysts. We believe that the use of FFO, combined with the required GAAP presentations, improves the understanding of our operating results among investors and the use of normalized FFO makes comparisons of our operating results with prior periods and other companies more meaningful. While FFO and normalized FFO are relevant and widely used supplemental measures of operating and financial performance of REITs, they should not be viewed as a substitute measure of our operating performance since the measures do not reflect either depreciation and amortization costs or the level of capital expenditures and leasing costs necessary to maintain the operating performance of our properties, which can be significant economic costs that could materially impact our results of operations. FFO and normalized FFO should not be considered an alternative to net income (loss) (computed in accordance with GAAP) as indicators of our results of operations or to cash flow from operating activities (computed in accordance with GAAP) as an indicator of our liquidity. We calculate adjusted funds from operations, or AFFO, by subtracting from or adding to normalized FFO (i) non-cash revenue, (ii) non-cash share-based compensation expense, and (iii) amortization of deferred financing costs. AFFO is an operating measurement that we use to analyze our results of operations based on the receipt, rather than the accrual, of our rental revenue and on certain other adjustments. We believe that this is an important measurement because our leases generally have significant contractual escalations of base rents and therefore result in recognition of rental income that is not collected until future periods, and costs that are deferred or are non-cash charges. Our calculation of AFFO may not be comparable to AFFO or similarly titled measures reported by other REITs. AFFO should not be considered as an alternative to net income (calculated pursuant to GAAP) as an indicator of our results of operations or to cash flow from operating activities (calculated pursuant to GAAP) as an indicator of our liquidity. MEDICAL PROPERTIES TRUST | SUPPLEMENTAL INFORMATION | Q2 2021 6
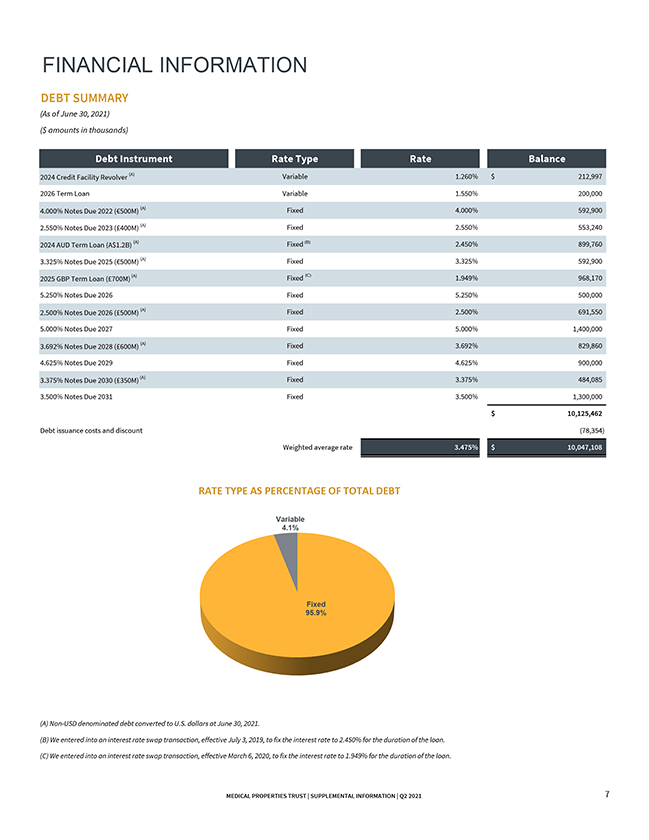
FINANCIAL INFORMATION DEBT SUMMARY (As of June 30, 2021) ($ amounts in thousands) Debt Instrument Rate Type Rate Balance 2024 Credit Facility Revolver (A) Variable 1.260% $ 212,997 2026 Term Loan Variable 1.550% 200,000 4.000% Notes Due 2022 (€500M) (A) Fixed 4.000% 592,900 2.550% Notes Due 2023 (Ł400M) (A) Fixed 2.550% 553,240 2024 AUD Term Loan (A$1.2B) (A) Fixed (B) 2.450% 899,760 3.325% Notes Due 2025 (€500M) (A) Fixed 3.325% 592,900 2025 GBP Term Loan (Ł700M) (A) Fixed (C) 1.949% 968,170 5.250% Notes Due 2026 Fixed 5.250% 500,000 2.500% Notes Due 2026 (Ł500M) (A) Fixed 2.500% 691,550 5.000% Notes Due 2027 Fixed 5.000% 1,400,000 3.692% Notes Due 2028 (Ł600M) (A) Fixed 3.692% 829,860 4.625% Notes Due 2029 Fixed 4.625% 900,000 3.375% Notes Due 2030 (Ł350M) (A) Fixed 3.375% 484,085 3.500% Notes Due 2031 Fixed 3.500% 1,300,000 $ 10,125,462 Debt issuance costs and discount (78,354) Weighted average rate 3.475% $ 10,047,108 RATE TYPE AS PERCENTAGE OF TOTAL DEBT Variable 4.1% Fixed 95.9% (A) Non-USD denominated debt converted to U.S. dollars at June 30, 2021. (B) We entered into an interest rate swap transaction, effective July 3, 2019, to fix the interest rate to 2.450% for the duration of the loan. (C) We entered into an interest rate swap transaction, effective March 6, 2020, to fix the interest rate to 1.949% for the duration of the loan. MEDICAL PROPERTIES TRUST | SUPPLEMENTAL INFORMATION | Q2 2021 7
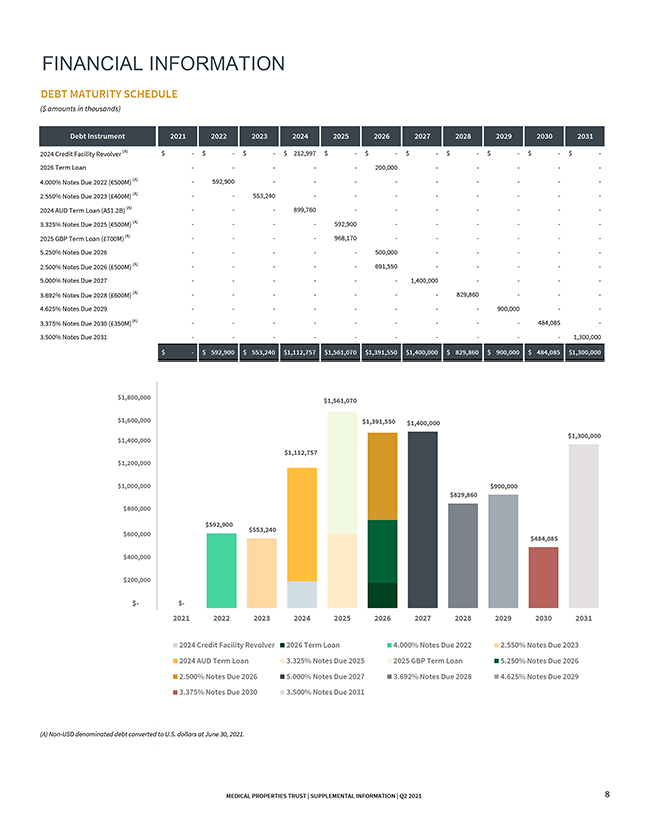
FINANCIAL INFORMATION DEBT MATURITY SCHEDULE ($ amounts in thousands) Debt Instrument 2021 2022 2023 2024 2025 2026 2027 2028 2029 2030 2031 2024 Credit Facility Revolver (A) $ —$ —$ —$ 212,997 $ —$ —$ —$ —$ —$ —$ -2026 Term Loan — — — — — 200,000 — — — — — 4.000% Notes Due 2022 (€500M) (A) — 592,900 — — — — — — — — — 2.550% Notes Due 2023 (Ł400M) (A) — — 553,240 — — — — — — — -2024 AUD Term Loan (A$1.2B) (A) — — — 899,760 — — — — — — — 3.325% Notes Due 2025 (€500M) (A) — — — — 592,900 — — — — — -2025 GBP Term Loan (Ł700M) (A) — — — — 968,170 — — — — — — 5.250% Notes Due 2026 — — — — — 500,000 — — — — — 2.500% Notes Due 2026 (Ł500M) (A) — — — — — 691,550 — — — — — 5.000% Notes Due 2027 — — — — — — 1,400,000 — — — — 3.692% Notes Due 2028 (Ł600M) (A) — — — — — — — 829,860 — — — 4.625% Notes Due 2029 — — — — — — — — 900,000 — — 3.375% Notes Due 2030 (Ł350M) (A) — — — — — — — — — 484,085 — 3.500% Notes Due 2031 — — — — — — — — — — 1,300,000 $ —$ 592,900 $ 553,240 $1,112,757 $1,561,070 $1,391,550 $1,400,000 $ 829,860 $ 900,000 $ 484,085 $1,300,000 $1,800,000 $1,561,070 $1,600,000 $1,391,550 $1,400,000 $1,300,000 $1,400,000 $1,112,757 $1,200,000 $1,000,000 $900,000 $829,860 $800,000 $592,900 $553,240 $600,000 $484,085 $400,000 $200,000 $- $- 2021 2022 2023 2024 2025 2026 2027 2028 2029 2030 2031 2024 Credit Facility Revolver 2026 Term Loan 4.000% Notes Due 2022 2.550% Notes Due 2023 2024 AUD Term Loan 3.325% Notes Due 2025 2025 GBP Term Loan 5.250% Notes Due 2026 2.500% Notes Due 2026 5.000% Notes Due 2027 3.692% Notes Due 2028 4.625% Notes Due 2029 3.375% Notes Due 2030 3.500% Notes Due 2031 (A) Non-USD denominated debt converted to U.S. dollars at June 30, 2021. MEDICAL PROPERTIES TRUST | SUPPLEMENTAL INFORMATION | Q2 2021 8
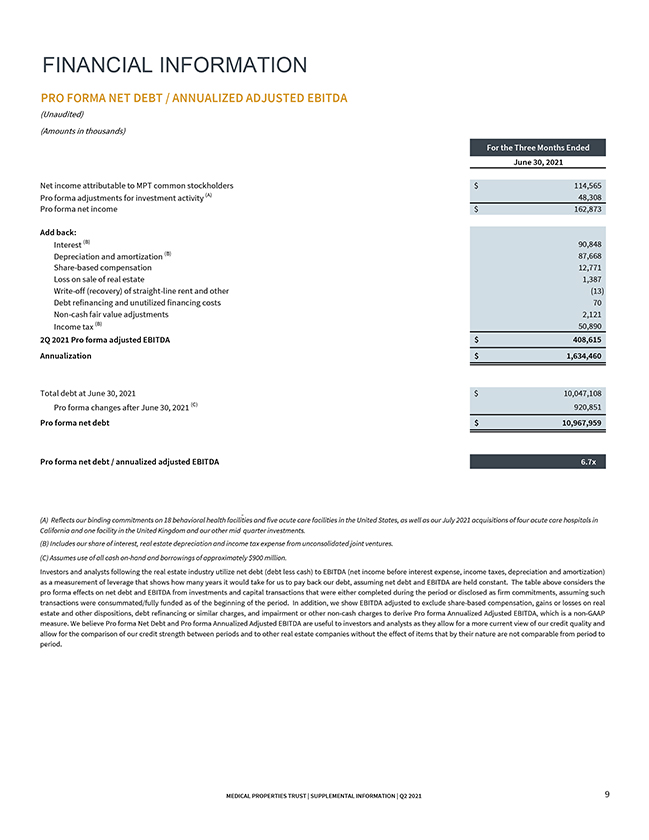
FINANCIAL INFORMATION PRO FORMA NET DEBT / ANNUALIZED ADJUSTED EBITDA (Unaudited) (Amounts in thousands) For the Three Months Ended June 30, 2021 Net income attributable to MPT common stockholders $ 114,565 Pro forma adjustments for investment activity (A) 48,308 Pro forma net income $ 162,873 Add back: Interest (B) 90,848 Depreciation and amortization (B) 87,668 Share-based compensation 12,771 Loss on sale of real estate 1,387 Write-off (recovery) of straight-line rent and other (13) Debt refinancing and unutilized financing costs 70 Non-cash fair value adjustments 2,121 Income tax (B) 50,890 2Q 2021 Pro forma adjusted EBITDA $ 408,615 Annualization $ 1,634,460 Total debt at June 30, 2021 $ 10,047,108 Pro forma changes after June 30, 2021 (C) 920,851 Pro forma net debt $ 10,967,959 Pro forma net debt / annualized adjusted EBITDA 6.7x (A) Reflects our binding commitments on 18 behavioral health facilities and five acute care facilities in the United States, as well as our July 2021 acquisitions of four acute care hospitals in California and one facility in the United Kingdom and our other mid quarter investments. (B) Includes our share of interest, real estate depreciation and income tax expense from unconsolidated joint ventures. (C) Assumes use of all cash on-hand and borrowings of approximately $900 million. Investors and analysts following the real estate industry utilize net debt (debt less cash) to EBITDA (net income before interest expense, income taxes, depreciation and amortization) as a measurement of leverage that shows how many years it would take for us to pay back our debt, assuming net debt and EBITDA are held constant. The table above considers the pro forma effects on net debt and EBITDA from investments and capital transactions that were either completed during the period or disclosed as firm commitments, assuming such transactions were consummated/fully funded as of the beginning of the period. In addition, we show EBITDA adjusted to exclude share-based compensation, gains or losses on real estate and other dispositions, debt refinancing or similar charges, and impairment or other non-cash charges to derive Pro forma Annualized Adjusted EBITDA, which is a non-GAAP measure. We believe Pro forma Net Debt and Pro forma Annualized Adjusted EBITDA are useful to investors and analysts as they allow for a more current view of our credit quality and allow for the comparison of our credit strength between periods and to other real estate companies without the effect of items that by their nature are not comparable from period to period. MEDICAL PROPERTIES TRUST | SUPPLEMENTAL INFORMATION | Q2 2021 9
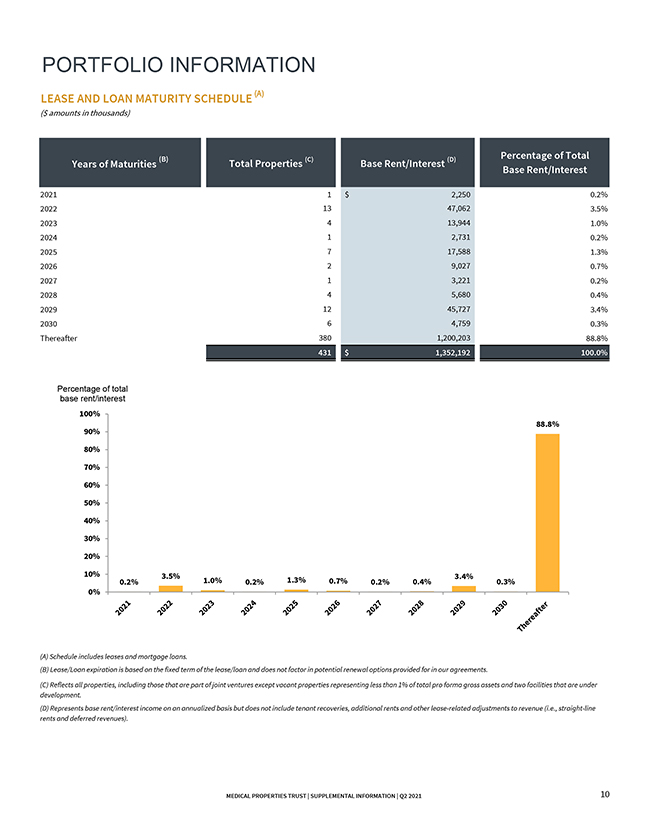
PORTFOLIO INFORMATION LEASE AND LOAN MATURITY SCHEDULE (A) ($ amounts in thousands) (B) (C) (D) Percentage of Total Years of Maturities Total Properties Base Rent/Interest Base Rent/Interest 2021 1 $ 2,250 0.2% 2022 13 47,062 3.5% 2023 4 13,944 1.0% 2024 1 2,731 0.2% 2025 7 17,588 1.3% 2026 2 9,027 0.7% 2027 1 3,221 0.2% 2028 4 5,680 0.4% 2029 12 45,727 3.4% 2030 6 4,759 0.3% Thereafter 380 1,200,203 88.8% 431 $ 1,352,192 100.0% Percentage of total base rent/interest 100% 88.8% 90% 80% 70% 60% 50% 40% 30% 20% 10% 3.5% 3.4% 0.2% 1.0% 0.2% 1.3% 0.7% 0.2% 0.4% 0.3% 0% (A) Schedule includes leases and mortgage loans. (B) Lease/Loan expiration is based on the fixed term of the lease/loan and does not factor in potential renewal options provided for in our agreements. (C) Reflects all properties, including those that are part of joint ventures except vacant properties representing less than 1% of total pro forma gross assets and two facilities that are under development. (D) Represents base rent/interest income on an annualized basis but does not include tenant recoveries, additional rents and other lease-related adjustments to revenue (i.e., straight-line rents and deferred revenues). MEDICAL PROPERTIES TRUST | SUPPLEMENTAL INFORMATION | Q2 2021 10
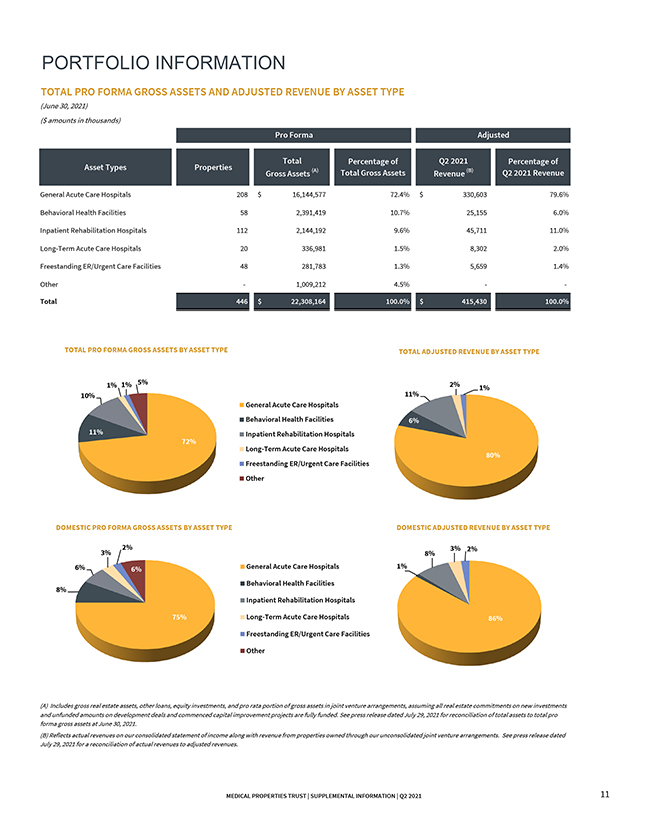
PORTFOLIO INFORMATION TOTAL PRO FORMA GROSS ASSETS AND ADJUSTED REVENUE BY ASSET TYPE (June 30, 2021) ($ amounts in thousands) Pro Forma Adjusted Total Percentage of Q2 2021 Percentage of Asset Types Properties (A) (B) Gross Assets Total Gross Assets Revenue Q2 2021 Revenue General Acute Care Hospitals 208 $ 16,144,577 72.4% $ 330,603 79.6% Behavioral Health Facilities 58 2,391,419 10.7% 25,155 6.0% Inpatient Rehabilitation Hospitals 112 2,144,192 9.6% 45,711 11.0% Long-Term Acute Care Hospitals 20 336,981 1.5% 8,302 2.0% Freestanding ER/Urgent Care Facilities 48 281,783 1.3% 5,659 1.4% Other — 1,009,212 4.5% — — Total 446 $ 22,308,164 100.0% $ 415,430 100.0% TOTAL PRO FORMA GROSS ASSETS BY ASSET TYPE TOTAL ADJUSTED REVENUE BY ASSET TYPE 1% 1% 5% 2% 1% 10% 11% General Acute Care Hospitals Behavioral Health Facilities 6% 11% Inpatient Rehabilitation Hospitals 72% Long-Term Acute Care Hospitals 80% Freestanding ER/Urgent Care Facilities Other DOMESTIC PRO FORMA GROSS ASSETS BY ASSET TYPE DOMESTIC ADJUSTED REVENUE BY ASSET TYPE 2% 3% 2% 3% 8% 6% 6% General Acute Care Hospitals 1% Behavioral Health Facilities 8% Inpatient Rehabilitation Hospitals 75% Long-Term Acute Care Hospitals 86% Freestanding ER/Urgent Care Facilities Other (A) Includes gross real estate assets, other loans, equity investments, and pro rata portion of gross assets in joint venture arrangements, assuming all real estate commitments on new investments and unfunded amounts on development deals and commenced capital improvement projects are fully funded. See press release dated July 29, 2021 for reconciliation of total assets to total pro forma gross assets at June 30, 2021. (B) Reflects actual revenues on our consolidated statement of income along with revenue from properties owned through our unconsolidated joint venture arrangements. See press release dated July 29, 2021 for a reconciliation of actual revenues to adjusted revenues. MEDICAL PROPERTIES TRUST | SUPPLEMENTAL INFORMATION | Q2 2021 11
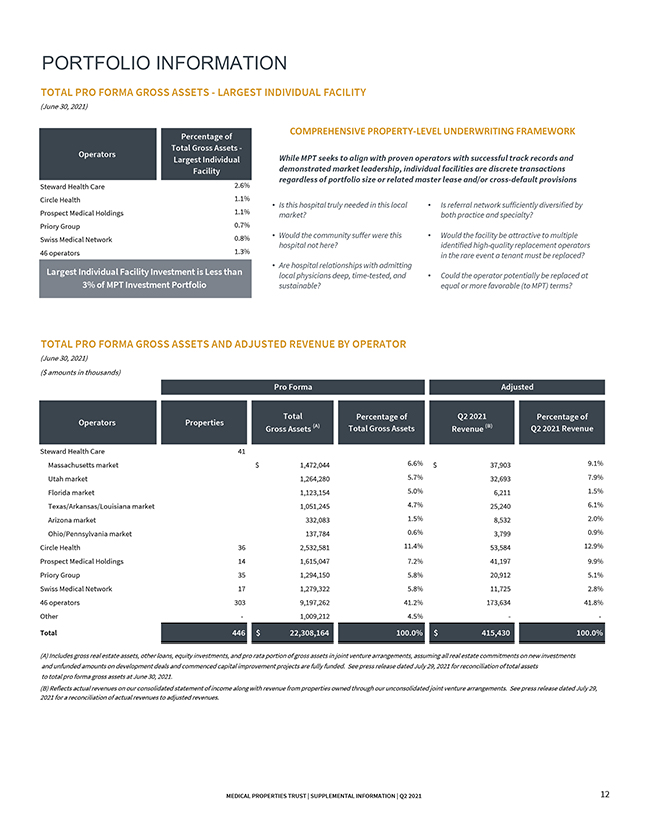
PORTFOLIO INFORMATION TOTAL PRO FORMA GROSS ASSETS—LARGEST INDIVIDUAL FACILITY (June 30, 2021) COMPREHENSIVE PROPERTY-LEVEL UNDERWRITING FRAMEWORK Percentage of Total Gross Assets— Operators While MPT seeks to align with proven operators with successful track records and Largest Individual Facility demonstrated market leadership, individual facilities are discrete transactions regardless of portfolio size or related master lease and/or cross-default provisions Steward Health Care 2.6% Circle Health 1.1% • Is this hospital truly needed in this local • Is referral network sufficiently diversified by Prospect Medical Holdings 1.1% market? both practice and specialty? Priory Group 0.7% 0.8% • Would the community suffer were this • Would the facility be attractive to multiple Swiss Medical Network hospital not here? identified high-quality replacement operators 46 operators 1.3% in the rare event a tenant must be replaced? • Are hospital relationships with admitting Largest Individual Facility Investment is Less than local physicians deep, time-tested, and • Could the operator potentially be replaced at 3% of MPT Investment Portfolio sustainable? equal or more favorable (to MPT) terms? TOTAL PRO FORMA GROSS ASSETS AND ADJUSTED REVENUE BY OPERATOR (June 30, 2021) ($ amounts in thousands) Pro Forma Adjusted Total Percentage of Q2 2021 Percentage of Operators Properties (A) (B) Gross Assets Total Gross Assets Revenue Q2 2021 Revenue Steward Health Care 41 Massachusetts market $ 1,472,044 6.6% $ 37,903 9.1% Utah market 1,264,280 5.7% 32,693 7.9% Florida market 1,123,154 5.0% 6,211 1.5% Texas/Arkansas/Louisiana market 1,051,245 4.7% 25,240 6.1% Arizona market 332,083 1.5% 8,532 2.0% Ohio/Pennsylvania market 137,784 0.6% 3,799 0.9% Circle Health 36 2,532,581 11.4% 53,584 12.9% Prospect Medical Holdings 14 1,615,047 7.2% 41,197 9.9% Priory Group 35 1,294,150 5.8% 20,912 5.1% Swiss Medical Network 17 1,279,322 5.8% 11,725 2.8% 46 operators 303 9,197,262 41.2% 173,634 41.8% Other — 1,009,212 4.5% — — Total 446 $ 22,308,164 100.0% $ 415,430 100.0% (A) Includes gross real estate assets, other loans, equity investments, and pro rata portion of gross assets in joint venture arrangements, assuming all real estate commitments on new investments and unfunded amounts on development deals and commenced capital improvement projects are fully funded. See press release dated July 29, 2021 for reconciliation of total assets to total pro forma gross assets at June 30, 2021. (B) Reflects actual revenues on our consolidated statement of income along with revenue from properties owned through our unconsolidated joint venture arrangements. See press release dated July 29, 2021 for a reconciliation of actual revenues to adjusted revenues. MEDICAL PROPERTIES TRUST | SUPPLEMENTAL INFORMATION | Q2 2021 12
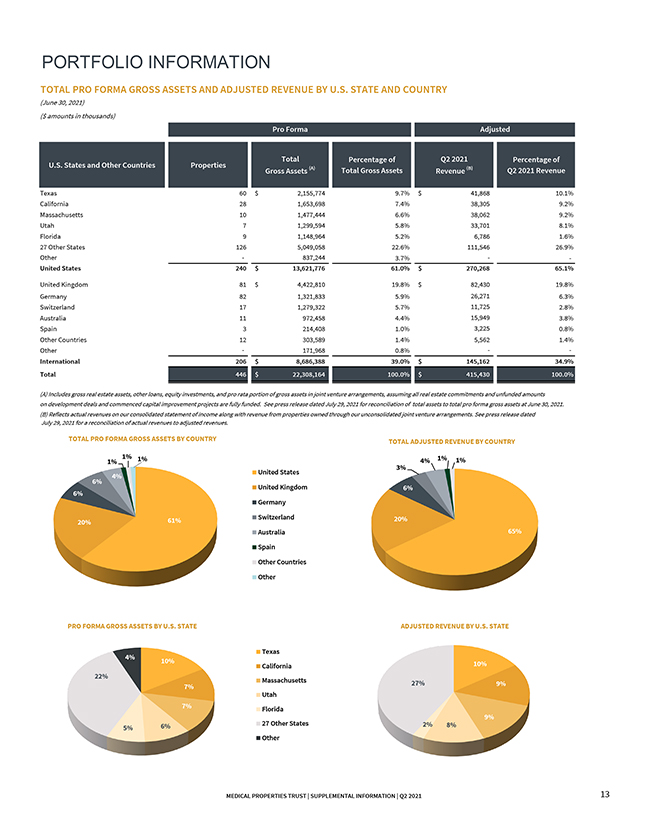
PORTFOLIO INFORMATION TOTAL PRO FORMA GROSS ASSETS AND ADJUSTED REVENUE BY U.S. STATE AND COUNTRY (June 30, 2021) ($ amounts in thousands) Pro Forma Adjusted Total Percentage of Q2 2021 Percentage of U.S. States and Other Countries Properties (A) (B) Gross Assets Total Gross Assets Revenue Q2 2021 Revenue Texas 60 $ 2,155,774 9.7% $ 41,868 10.1% California 28 1,653,698 7.4% 38,305 9.2% Massachusetts 10 1,477,444 6.6% 38,062 9.2% Utah 7 1,299,594 5.8% 33,701 8.1% Florida 9 1,148,964 5.2% 6,786 1.6% 27 Other States 126 5,049,058 22.6% 111,546 26.9% Other — 837,244 3.7% — — United States 240 $ 13,621,776 61.0% $ 270,268 65.1% United Kingdom 81 $ 4,422,810 19.8% $ 82,430 19.8% Germany 82 1,321,833 5.9% 26,271 6.3% Switzerland 17 1,279,322 5.7% 11,725 2.8% Australia 11 972,458 4.4% 15,949 3.8% Spain 3 214,408 1.0% 3,225 0.8% Other Countries 12 303,589 1.4% 5,562 1.4% Other— 171,968 0.8%— — International 206 $ 8,686,388 39.0% $ 145,162 34.9% Total 446 $ 22,308,164 100.0% $ 415,430 100.0% (A) Includes gross real estate assets, other loans, equity investments, and pro rata portion of gross assets in joint venture arrangements, assuming all real estate commitments and unfunded amounts on development deals and commenced capital improvement projects are fully funded. See press release dated July 29, 2021 for reconciliation of total assets to total pro forma gross assets at June 30, 2021. (B) Reflects actual revenues on our consolidated statement of income along with revenue from properties owned through our unconsolidated joint venture arrangements. See press release dated July 29, 2021 for a reconciliation of actual revenues to adjusted revenues. TOTAL PRO FORMA GROSS ASSETS BY COUNTRY TOTAL ADJUSTED REVENUE BY COUNTRY 1% 1% 1% 1% 1% 3% 4% United States 4% 6% United Kingdom 6% 6% Germany 61% Switzerland 20% 20% Australia 65% Spain Other Countries Other PRO FORMA GROSS ASSETS BY U.S. STATE ADJUSTED REVENUE BY U.S. STATE Texas 4% 10% 10% California 22% Massachusetts 27% 9% 7% Utah 7% Florida 9% 6% 27 Other States 2% 8% 5% Other MEDICAL PROPERTIES TRUST | SUPPLEMENTAL INFORMATION | Q2 2021 13
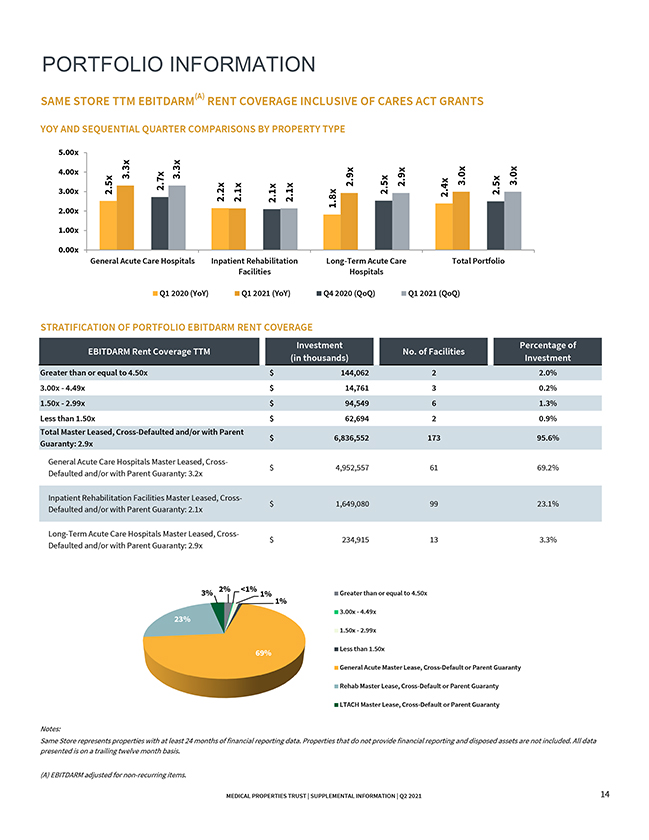
PORTFOLIO INFORMATION SAME STORE TTM EBITDARM(A) RENT COVERAGE INCLUSIVE OF CARES ACT GRANTS YOY AND SEQUENTIAL QUARTER COMPARISONS BY PROPERTY TYPE 5.00x 4.00x 3.3x 3.3x 2.9x 2.9x 3.0x 3.0x 3.00x 2.5x 2.7x 2.5x 2.4x 2.5x 2.2x 2.1x 2.1x 2.1x 1.8x 2.00x 1.00x 0.00x General Acute Care Hospitals Inpatient Rehabilitation Long-Term Acute Care Total Portfolio Facilities Hospitals Q1 2020 (YoY) Q1 2021 (YoY) Q4 2020 (QoQ) Q1 2021 (QoQ) STRATIFICATION OF PORTFOLIO EBITDARM RENT COVERAGE Investment Percentage of EBITDARM Rent Coverage TTM No. of Facilities (in thousands) Investment Greater than or equal to 4.50x $ 144,062 2 2.0% 3.00x—4.49x $ 14,761 3 0.2% 1.50x—2.99x $ 94,549 6 1.3% Less than 1.50x $ 62,694 2 0.9% Total Master Leased, Cross-Defaulted and/or with Parent $ 6,836,552 173 95.6% Guaranty: 2.9x General Acute Care Hospitals Master Leased, Cross$ 4,952,557 61 69.2% Defaulted and/or with Parent Guaranty: 3.2x Inpatient Rehabilitation Facilities Master Leased, Cross$ 1,649,080 99 23.1% Defaulted and/or with Parent Guaranty: 2.1x Long-Term Acute Care Hospitals Master Leased, Cross$ 234,915 13 3.3% Defaulted and/or with Parent Guaranty: 2.9x 2% <1% 3% 1% 1% Greater than or equal to 4.50x 3.00x—4.49x 23% 1.50x—2.99x 69% Less than 1.50x General Acute Master Lease, Cross-Default or Parent Guaranty Rehab Master Lease, Cross-Default or Parent Guaranty LTACH Master Lease, Cross-Default or Parent Guaranty Notes: Same Store represents properties with at least 24 months of financial reporting data. Properties that do not provide financial reporting and disposed assets are not included. All data presented is on a trailing twelve month basis. (A) EBITDARM adjusted for non-recurring items. MEDICAL PROPERTIES TRUST | SUPPLEMENTAL INFORMATION | Q2 2021 14
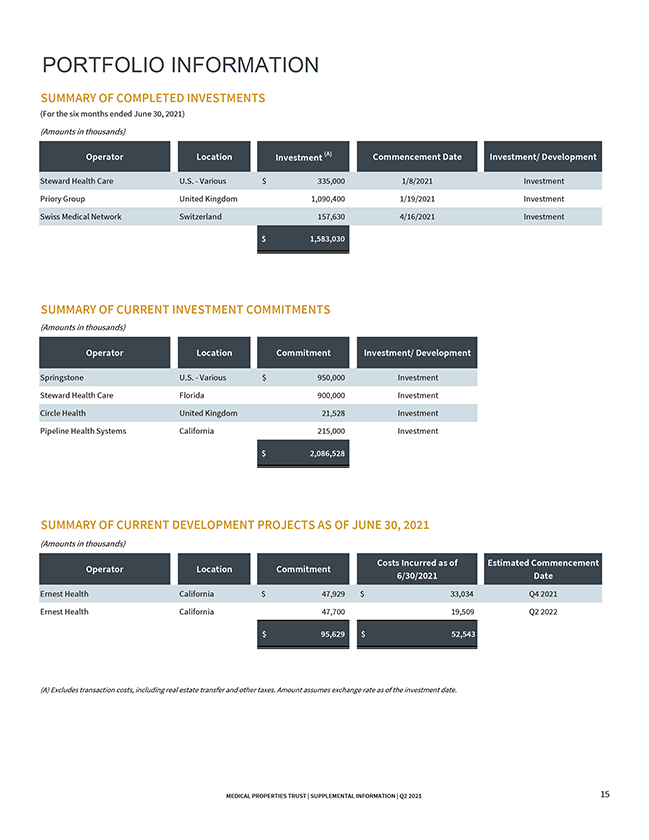
PORTFOLIO INFORMATION SUMMARY OF COMPLETED INVESTMENTS (For the six months ended June 30, 2021) (Amounts in thousands) Operator Location Investment (A) Commencement Date Investment/ Development Steward Health Care U.S.—Various $ 335,000 1/8/2021 Investment Priory Group United Kingdom 1,090,400 1/19/2021 Investment Swiss Medical Network Switzerland 157,630 4/16/2021 Investment $ 1,583,030 SUMMARY OF CURRENT INVESTMENT COMMITMENTS (Amounts in thousands) Operator Location Commitment Investment/ Development Springstone U.S.—Various $ 950,000 Investment Steward Health Care Florida 900,000 Investment Circle Health United Kingdom 21,528 Investment Pipeline Health Systems California 215,000 Investment $ 2,086,528 SUMMARY OF CURRENT DEVELOPMENT PROJECTS AS OF JUNE 30, 2021 (Amounts in thousands) Costs Incurred as of Estimated Commencement Operator Location Commitment 6/30/2021 Date Ernest Health California $ 47,929 $ 33,034 Q4 2021 Ernest Health California 47,700 19,509 Q2 2022 $ 95,629 $ 52,543 (A) Excludes transaction costs, including real estate transfer and other taxes. Amount assumes exchange rate as of the investment date. MEDICAL PROPERTIES TRUST | SUPPLEMENTAL INFORMATION | Q2 2021 15
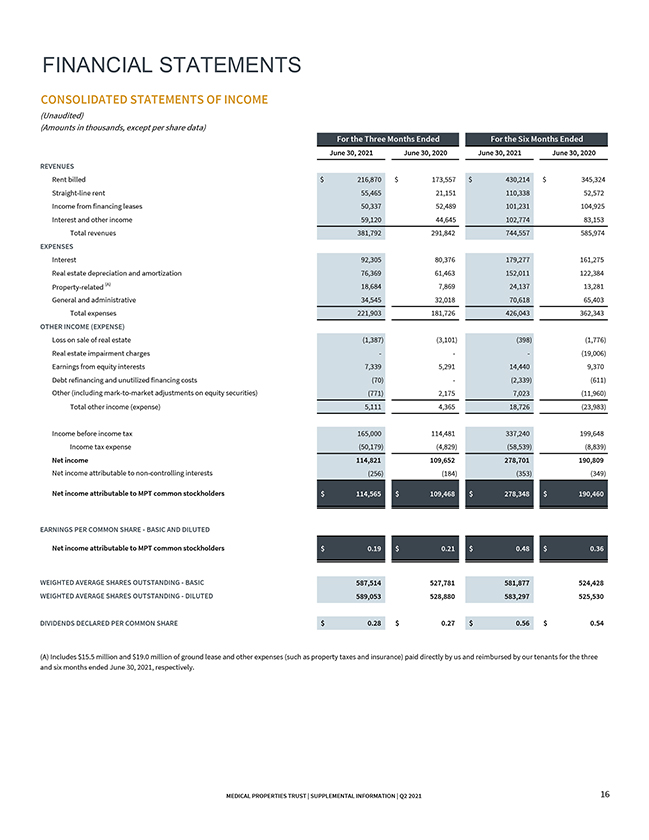
FINANCIAL STATEMENTS CONSOLIDATED STATEMENTS OF INCOME (Unaudited) (Amounts in thousands, except per share data) For the Three Months Ended For the Six Months Ended June 30, 2021 June 30, 2020 June 30, 2021 June 30, 2020 REVENUES Rent billed $ 216,870 $ 173,557 $ 430,214 $ 345,324 Straight-line rent 55,465 21,151 110,338 52,572 Income from financing leases 50,337 52,489 101,231 104,925 Interest and other income 59,120 44,645 102,774 83,153 Total revenues 381,792 291,842 744,557 585,974 EXPENSES Interest 92,305 80,376 179,277 161,275 Real estate depreciation and amortization 76,369 61,463 152,011 122,384 Property-related (A) 18,684 7,869 24,137 13,281 General and administrative 34,545 32,018 70,618 65,403 Total expenses 221,903 181,726 426,043 362,343 OTHER INCOME (EXPENSE) Loss on sale of real estate (1,387) (3,101) (398) (1,776) Real estate impairment charges — — — (19,006) Earnings from equity interests 7,339 5,291 14,440 9,370 Debt refinancing and unutilized financing costs (70) — (2,339) (611) Other (including mark-to-market adjustments on equity securities) (771) 2,175 7,023 (11,960) Total other income (expense) 5,111 4,365 18,726 (23,983) Income before income tax 165,000 114,481 337,240 199,648 Income tax expense (50,179) (4,829) (58,539) (8,839) Net income 114,821 109,652 278,701 190,809 Net income attributable to non-controlling interests (256) (184) (353) (349) Net income attributable to MPT common stockholders $ 114,565 $ 109,468 $ 278,348 $ 190,460 EARNINGS PER COMMON SHARE—BASIC AND DILUTED Net income attributable to MPT common stockholders $ 0.19 $ 0.21 $ 0.48 $ 0.36 WEIGHTED AVERAGE SHARES OUTSTANDING—BASIC 587,514 527,781 581,877 524,428 WEIGHTED AVERAGE SHARES OUTSTANDING—DILUTED 589,053 528,880 583,297 525,530 $ —$ — DIVIDENDS DECLARED PER COMMON SHARE $ 0.28 $ 0.27 $ 0.56 $ 0.54 (A) Includes $15.5 million and $19.0 million of ground lease and other expenses (such as property taxes and insurance) paid directly by us and reimbursed by our tenants for the three and six months ended June 30, 2021, respectively. MEDICAL PROPERTIES TRUST | SUPPLEMENTAL INFORMATION | Q2 2021 16
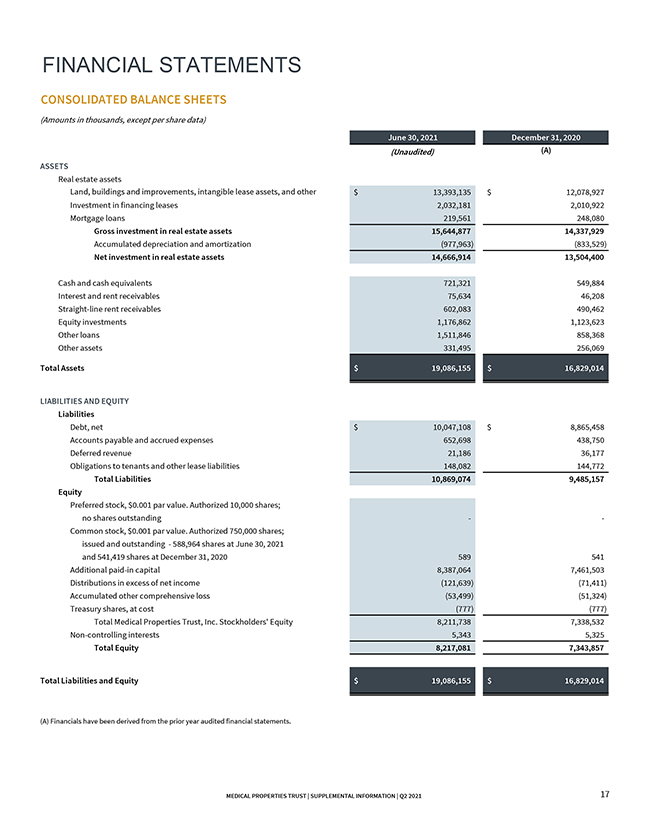
FINANCIAL STATEMENTS CONSOLIDATED BALANCE SHEETS (Amounts in thousands, except per share data) June 30, 2021 December 31, 2020 (Unaudited) (A) ASSETS Real estate assets Land, buildings and improvements, intangible lease assets, and other $ 13,393,135 $ 12,078,927 Investment in financing leases 2,032,181 2,010,922 Mortgage loans 219,561 248,080 Gross investment in real estate assets 15,644,877 14,337,929 Accumulated depreciation and amortization (977,963) (833,529) Net investment in real estate assets 14,666,914 13,504,400 Cash and cash equivalents 721,321 549,884 Interest and rent receivables 75,634 46,208 Straight-line rent receivables 602,083 490,462 Equity investments 1,176,862 1,123,623 Other loans 1,511,846 858,368 Other assets 331,495 256,069 Total Assets $ 19,086,155 $ 16,829,014 LIABILITIES AND EQUITY Liabilities Debt, net $ 10,047,108 $ 8,865,458 Accounts payable and accrued expenses 652,698 438,750 Deferred revenue 21,186 36,177 Obligations to tenants and other lease liabilities 148,082 144,772 Total Liabilities 10,869,074 9,485,157 Equity Preferred stock, $0.001 par value. Authorized 10,000 shares; no shares outstanding — -Common stock, $0.001 par value. Authorized 750,000 shares; issued and outstanding —588,964 shares at June 30, 2021 and 541,419 shares at December 31, 2020 589 541 Additional paid-in capital 8,387,064 7,461,503 Distributions in excess of net income (121,639) (71,411) Accumulated other comprehensive loss (53,499) (51,324) Treasury shares, at cost (777) (777) Total Medical Properties Trust, Inc. Stockholders’ Equity 8,211,738 7,338,532 Non-controlling interests 5,343 5,325 Total Equity 8,217,081 7,343,857 Total Liabilities and Equity $ 19,086,155 $ 16,829,014 (A) Financials have been derived from the prior year audited financial statements. MEDICAL PROPERTIES TRUST | SUPPLEMENTAL INFORMATION | Q2 2021 17
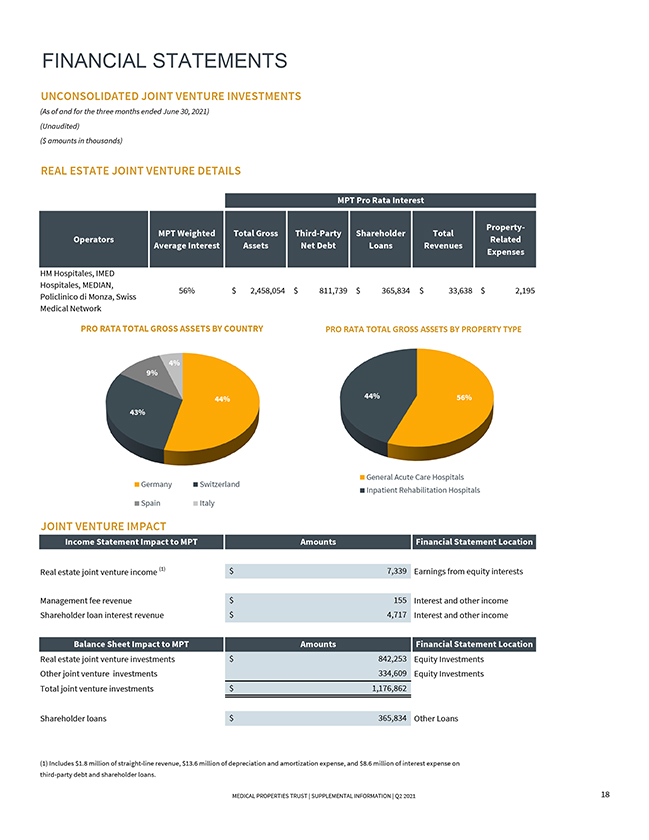
FINANCIAL STATEMENTS UNCONSOLIDATED JOINT VENTURE INVESTMENTS (As of and for the three months ended June 30, 2021) (Unaudited) ($ amounts in thousands) REAL ESTATE JOINT VENTURE DETAILS MPT Pro Rata Interest Property-MPT Weighted Total Gross Third-Party Shareholder Total Operators Related Average Interest Assets Net Debt Loans Revenues Expenses HM Hospitales, IMED Hospitales, MEDIAN, 56% $ 2,458,054 $ 811,739 $ 365,834 $ 33,638 $ 2,195 Policlinico di Monza, Swiss Medical Network PRO RATA TOTAL GROSS ASSETS BY COUNTRY PRO RATA TOTAL GROSS ASSETS BY PROPERTY TYPE 4% 9% 44% 44% 56% 43% General Acute Care Hospitals Germany Switzerland Inpatient Rehabilitation Hospitals Spain Italy JOINT VENTURE IMPACT Income Statement Impact to MPT Amounts Financial Statement Location Real estate joint venture income (1) $ 7,339 Earnings from equity interests Management fee revenue $ 155 Interest and other income Shareholder loan interest revenue $ 4,717 Interest and other income Balance Sheet Impact to MPT Amounts Financial Statement Location Real estate joint venture investments $ 842,253 Equity Investments Other joint venture investments 334,609 Equity Investments Total joint venture investments $ 1,176,862 Shareholder loans $ 365,834 Other Loans (1) Includes $1.8 million of straight-line revenue, $13.6 million of depreciation and amortization expense, and $8.6 million of interest expense on third-party debt and shareholder loans. MEDICAL PROPERTIES TRUST | SUPPLEMENTAL INFORMATION | Q2 2021 18
1000 Urban Center Drive, Suite 501 Birmingham, AL 35242 (205) 969-3755 NYSE: MPW www.medicalpropertiestrust.com Contact: Drew Babin, Senior Managing Director of Corporate Communications (646) 884-9809 or dbabin@medicalpropertiestrust.com or Tim Berryman, Managing Director of Investor Relations (205) 397-8589 or tberryman@medicalpropertiestrust.com