Attached files
| file | filename |
|---|---|
| EX-32.2 - EX-32.2 - MEDICAL PROPERTIES TRUST INC | d295656dex322.htm |
| EX-32.1 - EX-32.1 - MEDICAL PROPERTIES TRUST INC | d295656dex321.htm |
| EX-31.4 - EX-31.4 - MEDICAL PROPERTIES TRUST INC | d295656dex314.htm |
| EX-31.3 - EX-31.3 - MEDICAL PROPERTIES TRUST INC | d295656dex313.htm |
| EX-31.2 - EX-31.2 - MEDICAL PROPERTIES TRUST INC | d295656dex312.htm |
| EX-31.1 - EX-31.1 - MEDICAL PROPERTIES TRUST INC | d295656dex311.htm |
| EX-23.2 - EX-23.2 - MEDICAL PROPERTIES TRUST INC | d295656dex232.htm |
| EX-23.1 - EX-23.1 - MEDICAL PROPERTIES TRUST INC | d295656dex231.htm |
| EX-21.1 - EX-21.1 - MEDICAL PROPERTIES TRUST INC | d295656dex211.htm |
| EX-12.1 - EX-12.1 - MEDICAL PROPERTIES TRUST INC | d295656dex121.htm |
| EX-10.35 - EX-10.35 - MEDICAL PROPERTIES TRUST INC | d295656dex1035.htm |
| EX-10.34 - EX-10.34 - MEDICAL PROPERTIES TRUST INC | d295656dex1034.htm |
| EX-10.33 - EX-10.33 - MEDICAL PROPERTIES TRUST INC | d295656dex1033.htm |
Table of Contents
Index to Financial Statements
UNITED STATES
SECURITIES AND EXCHANGE COMMISSION
Washington, D.C. 20549
FORM 10-K
(Mark One)
| ☒ | ANNUAL REPORT PURSUANT TO SECTION 13 OR 15(d) OF THE SECURITIES EXCHANGE ACT OF 1934 |
For the fiscal year ended December 31, 2016
or
| ☐ | TRANSITION REPORT PURSUANT TO SECTION 13 OR 15(d) OF THE SECURITIES EXCHANGE ACT OF 1934 |
For the transition period from to
Commission file number 001-32559
Medical Properties Trust, Inc.
MPT Operating Partnership, L.P.
(Exact Name of Registrant as Specified in Its Charter)
| Maryland Delaware |
20-0191742 20-0242069 | |
| (State or Other Jurisdiction of Incorporation or Organization) |
(IRS Employer Identification No.) | |
| 1000 Urban Center Drive, Suite 501 Birmingham, AL |
35242 | |
| (Address of Principal Executive Offices) | (Zip Code) |
(205) 969-3755
(Registrant’s telephone number, including area code)
Securities registered pursuant to Section 12(b) of the Act:
| Title of Each Class |
Name of Each Exchange on Which Registered | |
| Common Stock, par value $0.001 per share of Medical Properties Trust, Inc. |
New York Stock Exchange |
Securities registered pursuant to Section 12(g) of the Act:
None
Indicate by check mark if the registrant is a well-known seasoned issuer, as defined in Rule 405 of the Securities Act.
Medical Properties Trust, Inc. Yes ☒ No ☐ MPT Operating Partnership, L.P. Yes ☐ No ☒
Indicate by check mark if the registrant is not required to file reports pursuant to Section 13 or Section 15(d) of the Act.
Medical Properties Trust, Inc. Yes ☐ No ☒ MPT Operating Partnership, L.P. Yes ☐ No ☒
Indicate by check mark whether the registrant (1) has filed all reports required to be filed by Section 13 or 15(d) of the Securities Exchange Act of 1934 during the preceding 12 months (or for such shorter period that the registrant was required to file such reports), and (2) has been subject to such filing requirements for the past 90 days.
Medical Properties Trust, Inc. Yes ☒ No ☐ MPT Operating Partnership, L.P. Yes ☒ No ☐
Indicate by check mark whether the registrant has submitted electronically and posted on its corporate Website, if any, every Interactive Data File required to be submitted and posted pursuant to Rule 405 of Regulation S-T (§ 232.405 of this chapter) during the preceding 12 months (or for such shorter period that the registrant was required to submit and post such files).
Medical Properties Trust, Inc. Yes ☒ No ☐ MPT Operating Partnership, L.P. Yes ☒ No ☐
Indicate by check mark if disclosure of delinquent filers pursuant to Item 405 of Regulation S-K (§229.405 of this chapter) is not contained herein, and will not be contained, to the best of registrant’s knowledge, in definitive proxy or information statements incorporated by reference in Part III of this Form 10-K or any amendment to this Form 10-K. ☐.
Indicate by check mark whether the registrant is a large accelerated filer, an accelerated filer, a non-accelerated filer or a smaller reporting company. See the definitions of “large accelerated filer,” “accelerated filer” and “smaller reporting company” in Rule 12b-2 of the Exchange Act (Check one):
Medical Properties Trust, Inc.
| Large accelerated Filer | ☒ | Accelerated Filer | ☐ | |||
| Non-accelerated Filer | ☐ (Do not check if a smaller reporting company) | Smaller Reporting Company | ☐ |
MPT Operating Partnership, L.P.
| Large accelerated Filer | ☐ | Accelerated Filer | ☐ | |||
| Non-accelerated Filer | ☒ (Do not check if a smaller reporting company) | Smaller Reporting Company | ☐ |
Indicate by check mark whether the registrant is a shell company (as defined in 12b-2 of the Act).
Medical Properties Trust, Inc. Yes ☐ No ☒ MPT Operating Partnership, L.P. Yes ☐ No ☒
As of June 30, 2016, the aggregate market value of the 236,587,490 shares of common stock, par value $0.001 per share (“Common Stock”), held by non-affiliates of the registrant was $3,598,495,723 based upon the last reported sale price of $15.21 on the New York Stock Exchange on that date. For purposes of the foregoing calculation only, all directors and executive officers of the registrant have been deemed affiliates.
As of February 24, 2017, 320,934,225 shares of Medical Properties Trust, Inc. Common Stock were outstanding.
DOCUMENTS INCORPORATED BY REFERENCE
Portions of the registrant’s definitive Proxy Statement for the Annual Meeting of Stockholders to be held on May 25, 2017 are incorporated by reference into Items 10 through 14 of Part III, of this Annual Report on Form 10-K.
Table of Contents
Index to Financial Statements
| 3 | ||||||
| ITEM 1 |
5 | |||||
| ITEM 1A. |
18 | |||||
| ITEM 1B. |
38 | |||||
| ITEM 2. |
39 | |||||
| ITEM 3. |
41 | |||||
| ITEM 4. |
41 | |||||
| ITEM 5. |
42 | |||||
| ITEM 6. |
44 | |||||
| ITEM 7. |
Management’s Discussion and Analysis of Financial Condition and Results of Operations |
48 | ||||
| ITEM 7A. |
68 | |||||
| ITEM 8. |
69 | |||||
| ITEM 9. |
Changes in and Disagreements With Accountants on Accounting and Financial Disclosure |
120 | ||||
| ITEM 9A. |
120 | |||||
| ITEM 9B. |
121 | |||||
| ITEM 10. |
122 | |||||
| ITEM 11. |
122 | |||||
| ITEM 12. |
Security Ownership of Certain Beneficial Owners and Management and Related Stockholder Matters |
122 | ||||
| ITEM 13. |
Certain Relationships and Related Transactions, and Director Independence |
122 | ||||
| ITEM 14. |
122 | |||||
| ITEM 15. |
123 | |||||
| ITEM 16. |
131 | |||||
| 132 | ||||||
2
Table of Contents
Index to Financial Statements
EXPLANATORY NOTE
This report combines the Annual Reports on Form 10-K for the year ended December 31, 2016, of Medical Properties Trust, Inc., a Maryland corporation, and MPT Operating Partnership, L.P., a Delaware limited partnership, through which Medical Properties Trust, Inc. conducts substantially all of its operations. Unless otherwise indicated or unless the context requires otherwise, all references in this report to “we,” “us,” “our,” “our company,” “Medical Properties,” “MPT,” or “the Company” refer to Medical Properties Trust, Inc. together with its consolidated subsidiaries, including MPT Operating Partnership, L.P. Unless otherwise indicated or unless the context requires otherwise, all references to “our operating partnership” or “the operating partnership” refer to MPT Operating Partnership, L.P. together with its consolidated subsidiaries.
CAUTIONARY LANGUAGE REGARDING FORWARD LOOKING STATEMENTS
We make forward-looking statements in this Annual Report on Form 10-K that are subject to risks and uncertainties. These forward-looking statements include information about possible or assumed future results of our business, financial condition, liquidity, results of operations, plans and objectives. Statements regarding the following subjects, among others, are forward-looking by their nature:
| • | our business strategy; |
| • | our projected operating results; |
| • | our ability to acquire or develop additional facilities in the United States (“U.S.”) or Europe; |
| • | availability of suitable facilities to acquire or develop; |
| • | our ability to enter into, and the terms of, our prospective leases and loans; |
| • | our ability to raise additional funds through offerings of debt and equity securities and/or property disposals; |
| • | our ability to obtain future financing arrangements; |
| • | estimates relating to, and our ability to pay, future distributions; |
| • | our ability to service our debt and comply with all of our debt covenants; |
| • | our ability to compete in the marketplace; |
| • | lease rates and interest rates; |
| • | market trends; |
| • | projected capital expenditures; and |
| • | the impact of technology on our facilities, operations and business. |
The forward-looking statements are based on our beliefs, assumptions and expectations of our future performance, taking into account information currently available to us. These beliefs, assumptions and expectations can change as a result of many possible events or factors, not all of which are known to us. If a change occurs, our business, financial condition, liquidity and results of operations may vary materially from those expressed in our forward-looking statements. You should carefully consider these risks before you make an investment decision with respect to our common stock and other securities, along with, among others, the following factors that could cause actual results to vary from our forward-looking statements:
| • | the factors referenced in this Annual Report on Form 10-K, including those set forth under the sections captioned “Risk Factors,” “Management’s Discussion and Analysis of Financial Condition and Results of Operations,” and “Business;” |
3
Table of Contents
Index to Financial Statements
| • | U.S. (both national and local) and European (in particular Germany, the United Kingdom, Spain and Italy) political, economic, business, real estate, and other market conditions; |
| • | the competitive environment in which we operate; |
| • | the execution of our business plan; |
| • | financing risks; |
| • | acquisition and development risks; |
| • | potential environmental contingencies and other liabilities; |
| • | other factors affecting the real estate industry generally or the healthcare real estate industry in particular; |
| • | our ability to maintain our status as a real estate investment trust, or REIT, for U.S. federal and state income tax purposes; |
| • | our ability to attract and retain qualified personnel; |
| • | changes in foreign currency exchange rates; |
| • | U.S. (both federal and state) and European (in particular Germany, the United Kingdom, Spain and Italy) healthcare and other regulatory requirements; and |
| • | U.S. national and local economic conditions, as well as conditions in Europe and any other foreign jurisdictions where we own or will own healthcare facilities, which may have a negative effect on the following, among other things: |
| • | the financial condition of our tenants, our lenders, or institutions that hold our cash balances, which may expose us to increased risks of default by these parties; |
| • | our ability to obtain equity or debt financing on attractive terms or at all, which may adversely impact our ability to pursue acquisition and development opportunities, refinance existing debt and our future interest expense; and |
| • | the value of our real estate assets, which may limit our ability to dispose of assets at attractive prices or obtain or maintain debt financing secured by our properties or on an unsecured basis. |
When we use the words “believe,” “expect,” “may,” “potential,” “anticipate,” “estimate,” “plan,” “will,” “could,” “intend” or similar expressions, we are identifying forward-looking statements. You should not place undue reliance on these forward-looking statements. Except as required by law, we disclaim any obligation to update such statements or to publicly announce the result of any revisions to any of the forward-looking statements contained in this Annual Report on Form 10-K to reflect future events or developments.
4
Table of Contents
Index to Financial Statements
| ITEM 1. | Business |
Overview
We are a self-advised real estate investment trust (“REIT”) focused on investing in and owning net-leased healthcare facilities across the U.S. and selectively in foreign jurisdictions. We have operated as a REIT since April 6, 2004, and accordingly, elected REIT status upon the filing of our calendar year 2004 federal income tax return. Medical Properties Trust, Inc. was incorporated under Maryland law on August 27, 2003, and MPT Operating Partnership, L.P. was formed under Delaware law on September 10, 2003. We conduct substantially all of our business through MPT Operating Partnership, L.P. We acquire and develop healthcare facilities and lease the facilities to healthcare operating companies under long-term net leases, which require the tenant to bear most of the costs associated with the property. We also make mortgage loans to healthcare operators collateralized by their real estate assets. In addition, we selectively make loans to certain of our operators through our taxable REIT subsidiaries, the proceeds of which are typically used for acquisition and working capital purposes. Finally, from time to time, we acquire a profits or other equity interest in our tenants that gives us a right to share in such tenants’ profits and losses.
Our investments in healthcare real estate, including mortgage and other loans, as well as any equity investments in our tenants are considered a single reportable segment as further discussed in Note 1 of Item 8 in Part II of this Annual Report on Form 10-K. All of our investments are currently located in the United States and Europe. At December 31, 2016 and 2015, we had $6.4 billion and $5.6 billion, respectively, in total assets made up of the following:
| (dollars in thousands) | 2016 | 2015 | ||||||||||||||
| Real estate owned (gross) |
$ | 4,912,320 | 76.6 | % | $ | 3,875,536 | 69.1 | % | ||||||||
| Mortgage loans |
1,060,400 | 16.5 | % | 757,581 | 13.5 | % | ||||||||||
| Other loans |
155,721 | 2.4 | % | 664,822 | 11.9 | % | ||||||||||
| Construction in progress |
53,648 | 0.8 | % | 49,165 | 0.9 | % | ||||||||||
| Other assets |
236,447 | 3.7 | % | 262,247 | 4.6 | % | ||||||||||
|
|
|
|
|
|
|
|
|
|||||||||
| Total(1) |
$ | 6,418,536 | 100.0 | % | $ | 5,609,351 | 100.0 | % | ||||||||
|
|
|
|
|
|
|
|
|
|||||||||
| (1) | Includes $1.3 billion of healthcare real estate owned and other assets in Europe in 2016 and 2015. |
Revenue by property type:
The following is our revenue by property type for the year ended December 31 (dollars in thousands):
| 2016 | 2015 | 2014 | ||||||||||||||||||||||
| General Acute Care Hospitals(1) |
$ | 344,523 | 63.7 | % | $ | 255,029 | 57.7 | % | $ | 187,060 | 59.9 | % | ||||||||||||
| Inpatient Rehabilitation Hospitals |
149,964 | 27.7 | % | 134,198 | 30.4 | % | 71,564 | 22.9 | % | |||||||||||||||
| Long-Term Acute Care Hospitals |
46,650 | 8.6 | % | 52,651 | 11.9 | % | 53,908 | 17.2 | % | |||||||||||||||
|
|
|
|
|
|
|
|
|
|
|
|
|
|||||||||||||
| Total revenue(2) |
$ | 541,137 | 100.0 | % | $ | 441,878 | 100.0 | % | $ | 312,532 | 100.0 | % | ||||||||||||
|
|
|
|
|
|
|
|
|
|
|
|
|
|||||||||||||
| (1) | Includes three medical office buildings. |
| (2) | Includes $101.6 million and $83.0 million in revenue (primarily from rehabilitation facilities) from the healthcare real estate assets in Europe in 2016 and 2015, respectively. |
See “Overview” in Item 7 of this Annual Report on Form 10-K for details of transaction activity for 2016, 2015 and 2014. More information is available on the Internet at www.medicalpropertiestrust.com.
5
Table of Contents
Index to Financial Statements
Portfolio of Properties
As of February 24, 2017, our portfolio consisted of 232 properties: 215 facilities (of the 220 facilities that we own) are leased to 30 tenants, five are under development, and the remaining assets are in the form of mortgage loans to four operators. Our facilities consist of 136 general acute care hospitals, 79 inpatient rehabilitation hospitals, and 17 long-term acute care hospitals (“LTACHs”).
At February 24, 2017, no single property accounted for more than 3.6% of our total gross assets.
Outlook and Strategy
Our strategy is to lease the facilities that we acquire or develop to experienced healthcare operators pursuant to long-term net leases. Alternatively, we have structured certain of our investments as long-term, interest-only mortgage loans to healthcare operators, and we may make similar investments in the future. Our mortgage loans are structured such that we obtain similar economic returns as our net leases. In addition, we have obtained and will continue to obtain profits or other interests in certain of our tenants’ operations in order to enhance our overall return. The market for healthcare real estate is extensive and includes real estate owned by a variety of healthcare operators. We focus on acquiring and developing those net-leased facilities that are specifically designed to reflect the latest trends in healthcare delivery methods and that focus on the most critical components of healthcare. We typically invest in facilities that have the highest intensity of care including:
| • | General acute care — provide inpatient care for the treatment of acute conditions and manifestations of chronic conditions. They also provide ambulatory care through hospital outpatient departments and emergency rooms. |
| • | Inpatient rehabilitation — provide rehabilitation to patients with various neurological, muscular, skeletal orthopedic and other medical conditions following stabilization of their acute medical issues. |
| • | Long-term acute care — specialty-care hospital designed for patients with serious medical problems that require intense, special treatment for an extended period of time, sometimes requiring a hospital stay averaging in excess of three weeks. |
6
Table of Contents
Index to Financial Statements
Diversification
A fundamental component of our business plan is the continued diversification of our tenant relationships, the types of hospitals we own and the geographic areas in which we invest. From a tenant relationship perspective, see section titled “Significant Tenants” below for detail. See sections titled “Revenue by Property Type” and “Portfolio of Properties” above for information on the diversification of our hospital types. From a geographical perspective, we have investments across the U.S. and in Europe. See below for investment and revenue concentration in the U.S. and our global concentration at December 31, 2016:
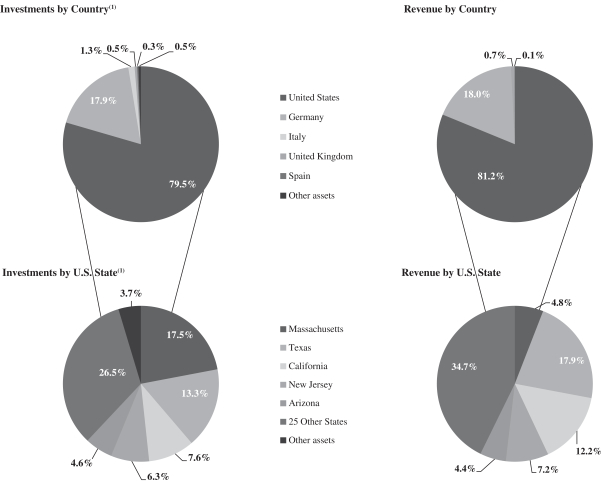
| (1) | Represents investment concentration as a percentage of gross real estate assets, other loans, and equity investments assuming all real estate commitments at December 31, 2016 are fully funded. |
We continue to believe that Europe represents an attractive market in which to invest, particularly in Germany. Germany is an attractive investment opportunity for us given Germany’s strong macroeconomic position and healthcare environment. Germany’s Gross Domestic Product (“GDP”), which is approximately $3,363 billion according to World Bank 2015 data, has been relatively more stable than other countries in the European Union due to Germany’s stable business practices and monetary policy. In addition to cultural influences, government policies emphasizing sound public finance and a significant presence of small and medium-sized enterprises (which employ 68% of the employment base) have also contributed to Germany’s strong and sustainable economic position. The above factors have contributed to an unemployment rate in Germany of 3.9% as of December 2016, which is significantly less than the 9.6% unemployment rate in the European Union as of December 2016, according to Eurostat.
7
Table of Contents
Index to Financial Statements
Underwriting/Asset Management
Our revenue is derived from rents we earn pursuant to the lease agreements with our tenants, from interest income from loans to our tenants and other facility owners and from profits or equity interests in certain of our tenants’ operations. Our tenants operate in the healthcare industry, generally providing medical, surgical and rehabilitative care to patients. The capacity of our tenants to pay our rents and interest is dependent upon their ability to conduct their operations at profitable levels. We believe that the business environment of the industry segments in which our tenants operate is generally positive for efficient operators. However, our tenants’ operations are subject to economic, regulatory and market conditions that may affect their profitability, which could impact our results. Accordingly, we monitor certain key factors, changes to which we believe may provide early indications of conditions that may affect the level of risk in our portfolio.
Key factors that we consider in underwriting prospective tenants and in our ongoing monitoring of our tenants’ (and any guarantors’) performance include the following:
| • | the scope and breadth of clinical services and programs, including admission levels by service type; |
| • | the current, historical and prospective operating margins (measured by a tenant’s earnings before interest, taxes, depreciation, amortization and facility rent) of each tenant and at each facility; |
| • | the ratio of our tenants’ operating earnings both to facility rent and to other fixed costs, including debt costs; |
| • | trends in the source of our tenants’ revenue, including the relative mix of public payors (including Medicare, Medicaid/MediCal, and managed care in the U.S. as well as equivalent payors in Germany, the United Kingdom, Italy, and Spain) and private payors (including commercial insurance and private pay patients); |
| • | trends in tenant cash collections, including comparison to recorded net patient service revenues; |
| • | the effect of any legal, regulatory or compliance proceedings with our tenants; |
| • | the effect of evolving healthcare legislation and other regulations (including changes in reimbursement) on our tenants’ profitability and liquidity; |
| • | demographics of the local and surrounding areas in which our tenants operate; |
| • | the competition, including the prospective tenant’s market position relative to competition; |
| • | evaluation of medical staff doctors and physician leadership associated with the facility/facilities, including specialty, tenure and number of procedures performed; |
| • | evaluation of the operator’s and facility’s administrative team, as applicable, including background and tenure within the healthcare industry; |
| • | compliance, accreditation, quality performance and health outcomes as measured by The Centers for Medicare and Medicaid Services (“CMS”) and Joint Commission; and |
| • | the level of investment in the hospital infrastructure and health IT systems. |
Healthcare Industry
The delivery of healthcare services, whether in the U.S. or elsewhere, requires real estate and, as a consequence, healthcare providers depend on real estate to maintain and grow their businesses. We believe that the healthcare real estate market provides investment opportunities due to the:
| • | compelling demographics driving the demand for healthcare services; |
| • | specialized nature of healthcare real estate investing; and |
| • | consolidation of the fragmented healthcare real estate sector. |
8
Table of Contents
Index to Financial Statements
United States
Healthcare is the single largest industry in the U.S. based on GDP. According to the National Health Expenditures report dated July 2016 by the CMS: (i) national health expenditures are projected to grow 5.1% in 2017; (ii) the average compound annual growth rate for national health expenditures, over the projection period of 2017 through 2025, is anticipated to be 6.0%; and (iii) the healthcare industry is projected to represent 20.1% of U.S. GDP by 2025.
Germany
The healthcare industry is also the single largest industry in Germany. Behind only the U.S., Netherlands and France, Germany’s healthcare expenditures represent approximately 11.0% of its total GDP according to the Organization for Economic Co-operation and Development’s 2013 data.
The German rehabilitation market (which includes our facilities in Germany) serves a broader scope of treatment with over 1,233 rehabilitation facilities (compared to 1,165 in the U.S.) and 208.5 beds per 100,000 population (compared to 114.7 in the U.S.). Approximately 90% of the payments in the German system come from governmental sources. The largest payor category is the public pension fund system representing 39% of payments. Public health insurance and payments for government employees represent 46% of payments. The balance of the payments into the German rehabilitation market come from a variety of sources including private pay and private insurance. One particular focus area of investors in the German market is the healthcare industry because the German Social Code mandates universal access, coverage and a high standard of care, thereby creating a robust healthcare dynamic in the country.
United Kingdom
Healthcare services in the United Kingdom are provided through the National Health Service (“NHS”). In 2013, the United Kingdom spent 8.8% of GDP on healthcare. The majority of this funding for the NHS comes from general taxation, and a smaller proportion from national insurance (a payroll tax). The NHS also receives income from copayments, people using NHS services as private patients, and some other minor sources. In 2012, 10.9% of the United Kingdom population had private voluntary health insurance provided mostly through employers. Private insurance offers more rapid and convenient access to care, especially for elective hospital procedures. It is estimated that four insurers account for 87.5% of the market, with small providers comprising the rest.
Publicly owned hospitals are organized either as NHS trusts, approximately 98 in number or as Foundation trusts, approximately 147 in number. NHS trusts are accountable to the Department of Health while foundation trusts enjoy greater freedom from central control. An estimated 548 hospitals are located in the United Kingdom and offer a range of treatments. Their charges to private patients are not regulated, and they receive no public subsidies. NHS use of private hospitals remains low with about 3.6% of NHS funding used for this purpose. The NHS budget was flat for the period from 2010 to 2015.
Italy
The Italian national health service (Servizio Sanitario Nazionale) is regionally based and organized at the national, regional, and local levels. Under the Italian constitution, responsibility for healthcare is shared by the national government and the 19 regions and 2 autonomous provinces. The central government controls the distribution of tax revenue for publicly financed health care and defines a national statutory benefits package to be offered to all residents in every region — the “Essential Levels of Care.” The 19 regions and two autonomous provinces have responsibility for the organization and delivery of health services through local health units.
Public financing accounted for 78% of total health spending in 2013, with total expenditure standing at 9.1% of GDP. The public system is financed primarily through a corporate tax (approximately 35.6% of the
9
Table of Contents
Index to Financial Statements
overall funding in 2012) pooled nationally and allocated back to regions, typically the source region, and a fixed proportion of national value-added tax revenue (approximately 47.3% of the total in 2012) collected by the central government and redistributed to regions unable to raise sufficient resources to provide the essential levels of care.
In 2011, there were approximately 194,000 beds in public hospitals and 47,500 beds in private accredited hospitals. A diagnosis-related group-based prospective payment system operates across the country and accounts for most hospital revenue.
Private health insurance plays a limited role in the health system, accounting for roughly 1% of total spending in 2009. Approximately 15% of the population has some form of private insurance which generally covers services excluded under the Essential Levels of Care, to offer a higher standard of comfort and privacy in hospital facilities, and wider choice among public and private providers. Some private health insurance policies also cover copayments for privately provided services, or a daily rate of compensation during hospitalization. There are two types of private health insurance: corporate, where companies cover employees and sometimes their families; and non-corporate, with individuals buying insurance for themselves or their family.
Depending on the region, public funds are allocated by local health units to public and accredited private hospitals. Rates paid to hospitals include all hospital costs including those of physicians. Funding for health is defined by the July 2014 Pact for Health which defines funding between $143.4 billion and $151.3 billion annually for the years 2014 to 2016.
Spain
The Spanish health system was established by the General Health Law of 1986. This law carries out a mandate of the Spanish Constitution which establishes the right of all citizens to protection of their health. The National Health System (Sistema Nacional de Salud, SNS) is the administrative device set up by the law. Spain spends approximately 9.6% of its GDP on health care. Expenditures for private healthcare are 26.4% of total health expenditures have been growing at a compounded annual growth rate of 1.7%. 80% of all Spanish patients use a combination of both private and public healthcare services.
Private hospitals comprise 53% of total Spanish hospitals and 32% of total beds. Private hospitals account for 24% of hospital discharges, 30% of surgeries and 20% of visits to Accident and Emergency Services. Demand for private hospital services is increasing at a compound rate of 3.8% from 2008 through 2011. In terms of private insurance, the top ten companies in Spain account for 82% of the market.
Our Leases and Loans
The leases for our facilities are “net” leases with terms generally requiring the tenant to pay all ongoing operating and maintenance expenses of the facility, including property, casualty, general liability and other insurance coverages, utilities and other charges incurred in the operation of the facilities, as well as real estate and certain other taxes, ground lease rent (if any) and the costs of capital expenditures, repairs and maintenance (including any repairs mandated by regulatory requirements). Similarly, borrowers under our mortgage loan arrangements retain the responsibilities of ownership, including physical maintenance and improvements and all costs and expenses. Our leases and loans typically require our tenants to indemnify us for any past or future environmental liabilities. Our current leases and loans have a weighted-average remaining initial lease or loan term of 14.1 years (see Item 2 for more information on remaining lease or loan terms). Based on current monthly revenue, approximately 99% of our leases and loans provide for annual rent or interest escalations based on either increases in the U.S. Consumer Price Index (“CPI”) or minimum annual rent or interest escalations ranging from 0.5% to 5%. In some cases, our domestic leases and loans provide for escalations based on CPI subject to floors and/or ceilings. In certain limited cases, we may have arrangements that provide for additional rents based on the level of a tenant’s revenue.
10
Table of Contents
Index to Financial Statements
RIDEA Investments
We have and will make equity investments, loans (with equity like returns) and obtain profit interests in certain of our tenants. Some of these investments fall under a structure permitted by the REIT Investment Diversification and Empowerment Act of 2007 (“RIDEA”), which was signed into law under the Housing and Economic Recovery Act of 2008. Under the provisions of RIDEA, a REIT may lease “qualified health care properties” on an arm’s length basis to a taxable REIT subsidiary (“TRS”) if the property is operated on behalf of such subsidiary by a person who qualifies as an “eligible independent contractor.” We view RIDEA as a structure primarily to be used on properties that present attractive valuation entry points. At December 31, 2016, our RIDEA investments totaled approximately $105.8 million.
Significant Tenants
At December 31, 2016, we had total assets of approximately $6.4 billion comprised of 231 healthcare properties in 30 states, in Germany, the United Kingdom, Italy, and Spain. The properties are leased to or mortgaged by 30 different hospital operating companies. On a gross asset basis (which is total assets before accumulated depreciation/amortization and assumes all real estate commitments at that time are fully funded), our top five tenants were as follows (dollars in thousands):
Gross Assets by Operator
| As of December 31, 2016 | As of December 31, 2015 | |||||||||||||||
| Operators |
Total Gross Assets |
Percentage of Total Gross Assets |
Total Gross Assets |
Percentage of Total Gross Assets |
||||||||||||
| Steward |
$ | 1,250,000 | 17.5 | % | $ | — | — | |||||||||
| Prime |
1,144,055 | 16.0 | % | 1,032,353 | 17.1 | % | ||||||||||
| MEDIAN |
993,677 | 13.9 | % | 1,031,039 | 17.1 | % | ||||||||||
| Ernest |
627,906 | 8.8 | % | 579,182 | 9.6 | % | ||||||||||
| RCCH |
566,600 | 7.9 | % | 1,059,989 | 17.6 | % | ||||||||||
Affiliates of Steward Health Care System LLC (“Steward”) lease five facilities pursuant to a master lease agreement, which has a 15-year term with three five-year extension options, plus annual inflation-based escalators. At December 31, 2016, these facilities had an average remaining lease term of 14.8 years. In addition to the master lease, we hold a mortgage loan on four facilities with terms and provisions substantially similar to the master lease agreement. The master lease and loan agreements include extension options that must include all or none of the properties, cross default provisions for the leases and loans, and a right of first refusal for the repurchase of the leased properties. We closed on the Steward properties on October 3, 2016 for a combined investment of $1.25 billion, which includes a $50 million minority equity contribution in Steward.
Affiliates of Prime Healthcare Services, Inc. (“Prime”) lease 22 facilities pursuant to five master lease agreements. Four of the master leases are for 10 years and contain two renewal options of five years each. The fifth master lease is for 15 years and contains three renewal options for five years each. Rent escalates each year based on the CPI increase, with a 2% minimum floor. At the end of the initial or any renewal term, Prime must exercise any available extension or purchase option with respect to all or none of the leased and mortgaged properties relative to each master lease. The master leases include repurchase options, including provisions establishing minimum repurchase prices equal to our total investment. At December 31, 2016, these facilities had an average remaining initial fixed term of 8.1 years. In addition to leases, we hold mortgage loans on three facilities owned by affiliates of Prime. The terms and provisions of these loans are generally equivalent to the terms and provisions of our Prime lease arrangements.
Affiliates of Median Kliniken S.à r.l.(“MEDIAN”) lease 50 facilities pursuant to two master lease agreements. Each master lease agreement has an approximate 27-year fixed term with no renewal or repurchase
11
Table of Contents
Index to Financial Statements
options. The annual escalator for one master lease that represents 15 facilities of the MEDIAN portfolio provides for fixed increases of 2% for 2017 and additional fixed increases of 0.5% each year thereafter. In addition, at December 31, 2020 and every three years thereafter, rent will be increased, if needed, to reflect 70% of cumulative increases in German CPI. The annual escalator for the other master lease that covers the remaining facilities of the MEDIAN portfolio provides for increases of the greater of 1% or 70% of the change in German CPI.
Affiliates of Ernest Health, Inc. (“Ernest”) lease 22 facilities, including one under development, pursuant to a master lease agreement and two stand-alone lease agreements. The original master lease agreement entered into in 2012, covering 20 properties, had a 20-year initial fixed term with three five-year extension options and provides for consumer price-indexed increases, limited to a 2% floor and 5% ceiling annually. At December 31, 2016, these facilities had a remaining initial fixed lease term of 15.2 years. This master lease includes purchase options that allow the lessee to purchase the leased property at on option price equal to the greater of fair market value of the lease property or the lease base increased by an amount equal to the annual rate of increase in the CPI on each adjustment date. All leases and loans are cross-defaulted, including the mortgage loans. In addition to the original master lease, Ernest affiliates lease the remaining properties, including one property that is currently under development, pursuant to two separate stand-alone leases that have terms generally similar to the original master lease agreement. Furthermore, we hold a mortgage loan on four facilities owned by affiliates of Ernest that will mature in 2032. The terms and provisions of these loans are generally equivalent to the terms and provisions of the original master lease agreement.
Affiliates of RCCH Healthcare Partners (“RCCH”) (formally Capella Healthcare Inc.) lease six facilities (four of which are leased pursuant to a master lease agreement). The master lease agreement has an initial fixed 13.5-year term with four five-year extension options, plus consumer price-indexed increases, limited to a 2% floor and a 4% ceiling annually. The extension options may be exercised with respect to any or all of the properties. At the end of the fixed term, and during any exercised extension options, the lessee will have the right of first refusal to purchase the leased property. At December 31, 2016, these facilities had an average remaining initial fixed lease term of 12.2 years. In addition to the master lease, two facilities are leased pursuant to stand-alone leases with a weighted average remaining fixed term of 12.3 years. The terms and provisions of these leases are generally equivalent to the terms and provisions of the master lease agreement.
No other tenant accounted for more than 7% of our total gross assets at December 31, 2016.
Environmental Matters
Under various federal, state and local environmental laws and regulations, a current or previous owner, operator or tenant of real estate may be required to remediate hazardous or toxic substance releases or threats of releases. There may also be certain obligations and liabilities on property owners with respect to asbestos containing materials. Investigation, remediation and monitoring costs may be substantial. The confirmed presence of contamination or the failure to properly remediate contamination on a property may adversely affect our ability to sell or rent that property or to borrow funds using such property as collateral and may adversely impact our investment in that property. Generally, prior to completing any acquisition or closing any mortgage loan, we obtain Phase I environmental assessments (or their equivalent studies outside the U.S.) in order to attempt to identify potential environmental concerns at the facilities. These assessments are carried out in accordance with an appropriate level of due diligence and generally include a physical site inspection, a review of relevant environmental and health agency database records, one or more interviews with appropriate site-related personnel, review of the property’s chain of title and review of historic aerial photographs and other information on past uses of the property. We may also conduct limited subsurface investigations and test for substances of concern where the results of the Phase I environmental assessments or other information indicates possible contamination or where our consultants recommend such procedures. Upon closing and for the remainder of the lease or loan term, our transaction documents require our tenants to repair and remediate any environmental concern at the applicable facility, and to comply in full with all environmental laws and regulations.
12
Table of Contents
Index to Financial Statements
California Seismic Standards
California’s Alfred E. Alquist Hospital Facilities Seismic Safety Act of 1973 (the “Alquist Act”) established a seismic safety building standards program under the Office of Statewide Health Planning and Development (“OSHPD”) jurisdiction for hospitals built on or after March 7, 1973. It required the California Building Standards Commission to adopt earthquake performance categories, seismic evaluation procedures, standards and timeframes for upgrading certain facilities, and seismic retrofit building standards. These regulations required hospitals to meet certain seismic performance standards to ensure that they are capable of providing medical services to the public after an earthquake or other disaster. This legislation was adopted to avoid the loss of life and the disruption of operations and the provision of emergency medical services that may result from structural damage sustained to hospitals resulting from an earthquake.
The Building Standards Commission completed its adoption of evaluation criteria and retrofit standards in 1998. The Alquist Act required the Building Standards Commission to adopt certain evaluation criteria and retrofit standards such as:
| • | hospitals in California must conduct seismic evaluations and submit these evaluations to the OSHPD, Facilities Development Division for its review and approval; |
| • | hospitals in California must identify the most critical nonstructural systems that represent the greatest risk of failure during an earthquake and submit timetables for upgrading these systems to the OSHPD, Facilities Development Division for its review and approval; and |
| • | hospitals in California must prepare a plan and compliance schedule for each regulated building demonstrating the steps a hospital will take to bring the hospital buildings into substantial compliance with the regulations and standards. |
Since the Alquist Act, subsequent legislation has modified requirements of seismic safety standards and deadlines for compliance. Originally, hospital buildings considered hazardous and at risk of collapse in the event of an earthquake must have been retrofitted, replaced or removed from providing acute care services by January 1, 2008; however, provisions were made to allow this deadline to be extended to January 1, 2013.
Senate Bill 499 was signed into law that provided for a number of seismic relief measures, including criteria for reclassifying buildings into a lower seismic risk category. These buildings would have until January 1, 2030 to comply with structural seismic safety standards. Buildings denied reclassification must have met seismic compliance standards by January 1, 2013, unless further extensions were granted.
California’s AB 306 legislation permitted OSHPD to grant extensions to acute care hospitals that lacked the financial capacity to meet the January 1, 2013, retrofit deadline, and instead, requires them to replace those buildings by January 1, 2020. More recently, California SB 90 allows a hospital to seek an extension for seismic compliance up to seven years based on three elements:
| • | the structural integrity of the building; |
| • | the loss of essential hospital services to the community if the hospital is closed; and |
| • | financial hardship. |
As of December 31, 2016, we have 13 hospitals in California totaling investments of $542.9 million. Exclusive of four hospitals granted extensions by OSHPD, all of our California buildings are seismically compliant through 2030 as determined by OSHPD. For our hospitals that were granted extensions, three (representing a total investment of $173.3 million) completed their seismic retro upgrades in 2016 and are currently awaiting final OSHPD reclassification. Our fourth hospital (with a total investment of $20 million) that was granted an extension began retrofit planning this year, and we expect full compliance by their 2020 deadline.
Under our current agreements, our tenants are responsible for capital expenditures in connection with seismic laws. We do not expect California seismic standards to have a negative impact on our financial condition
13
Table of Contents
Index to Financial Statements
or cash flows. We also do not expect compliance with California seismic standards to materially impact the financial condition of our tenants.
Competition
We compete in acquiring and developing facilities with financial institutions, other lenders, real estate developers, healthcare operators, other REITs, other public and private real estate companies, and private real estate investors. Among the factors that may adversely affect our ability to compete are the following:
| • | we may have less knowledge than our competitors of certain markets in which we seek to invest in or develop facilities; |
| • | some of our competitors may have greater financial and operational resources than we have; |
| • | some of our competitors may have lower costs of capital than we do; |
| • | our competitors or other entities may pursue a strategy similar to ours; and |
| • | some of our competitors may have existing relationships with our potential customers. |
To the extent that we experience vacancies in our facilities, we will also face competition in leasing those facilities to prospective tenants. The actual competition for tenants varies depending on the characteristics of each local market. Virtually all of our facilities operate in highly competitive environments, and patients and referral sources, including physicians, may change their preferences for healthcare facilities from time to time. The operators of our properties compete on a local and regional basis with operators of properties that provide comparable services. Operators compete for patients and residents based on a number of factors including quality of care, reputation, physical appearance of a facility, location, services offered, physicians, staff, and price. We also face competition from other health care facilities for tenants, such as physicians and other health care providers that provide comparable facilities and services.
For additional information, see “Risk Factors” in Item 1A of this Annual Report on Form 10-K.
Insurance
Our leases and mortgage loans require our tenants to carry property, loss of income, general liability, professional liability, and other insurance coverages in order to protect our interests. We monitor the adequacy of such coverages on an ongoing basis. In addition, we maintain separate insurance that provides coverage for bodily injury and property damage to third parties arising from our ownership of the healthcare facilities that are leased to and occupied by our tenants, as well as contingent business interruption insurance. At December 31, 2016, we believe that the policy specifications and insured limits are appropriate given the relative risk of loss, the cost of the coverage, and standard industry practice.
Healthcare Regulatory Matters
The following discussion describes certain material federal healthcare laws and regulations that may affect our operations and those of our tenants. The discussion, however, does not address all applicable federal healthcare laws, and does not address state healthcare laws and regulations, except as otherwise indicated. These state laws and regulations, like the federal healthcare laws and regulations, could affect the operations of our tenants and, accordingly, our operations. In addition, in some instances we own a minority interest in our tenants’ operations and, in addition to the effect on our tenant’s ability to meet its financial obligations to us, our ownership and investment returns may also be negatively impacted by such laws and regulations. Moreover, the discussion relating to reimbursement for healthcare services addresses matters that are subject to frequent review and revision by Congress and the agencies responsible for administering federal payment programs. Consequently, predicting future reimbursement trends or changes, along with the potential impact to us, is inherently difficult.
14
Table of Contents
Index to Financial Statements
Ownership and operation of hospitals and other healthcare facilities are subject, directly and indirectly, to substantial federal, state, and local government healthcare laws, rules, and regulations. Our tenants’ failure to comply with these laws and regulations could adversely affect their ability to meet their obligations to us. Physician investment in us or in our facilities also will be subject to such laws and regulations. Although we are not a healthcare provider or in a position to influence the referral of patients or ordering of items and services reimbursable by the federal government, to the extent that a healthcare provider engages in transactions with our tenants, such as sublease or other financial arrangements, the Anti-Kickback Statute and the Stark Law (both discussed in this section) could be implicated. Our leases and mortgage loans require the tenants to comply with all applicable laws, including healthcare laws. We intend for all of our business activities and operations to conform in all material respects with all applicable laws, rules, and regulations, including healthcare laws, rules, and regulations.
Applicable Laws
Anti-Kickback Statute. The federal Anti-Kickback Statute (codified at 42 U.S.C. § 1320a-7b(b)) prohibits, among other things, the offer, payment, solicitation, or acceptance of remuneration, directly or indirectly, in return for referring an individual to a provider of items or services for which payment may be made in whole, or in part, under a federal healthcare program, including the Medicare or Medicaid programs. Violation of the Anti-Kickback Statute is a crime, punishable by fines of up to $25,000 per violation, five years imprisonment, or both. Violations may also result in civil sanctions, including civil monetary penalties of up to $50,000 per violation, exclusion from participation in federal healthcare programs, including Medicare and Medicaid, and additional monetary penalties in amounts treble to the underlying remuneration.
The Office of Inspector General of the Department of Health and Human Services (“OIG”) has issued “Safe Harbor Regulations” that describe practices that will not be considered violations of the Anti-Kickback Statute. Nonetheless, the fact that a particular arrangement does not meet safe harbor requirements does not also mean that the arrangement violates the Anti-Kickback Statute. Rather, the safe harbor regulations simply provide a guaranty that qualifying arrangements will not be prosecuted under the Anti-Kickback Statute. We intend to use commercially reasonable efforts to structure our arrangements involving facilities, so as to satisfy, or meet as closely as possible, all safe harbor conditions. We cannot assure you, however, that we will meet all the conditions for an applicable safe harbor.
Physician Self-Referral Statute (“Stark Law”). Any physicians investing in us or our subsidiary entities could also be subject to the Ethics in Patient Referrals Act of 1989, or the Stark Law (codified at 42 U.S.C. § 1395nn). Unless subject to an exception, the Stark Law prohibits a physician from making a referral to an “entity” furnishing “designated health services,” including certain inpatient and outpatient hospital services, clinical laboratory services, and radiology services, paid by Medicare or Medicaid if the physician or a member of his immediate family has a “financial relationship” with that entity. A reciprocal prohibition bars the entity from billing Medicare or Medicaid for any services furnished pursuant to a prohibited referral. Sanctions for violating the Stark Law include denial of payment, refunding amounts received for services provided pursuant to prohibited referrals, civil monetary penalties of up to $15,000 per prohibited service provided, and exclusion from the participation in federal healthcare programs. The statute also provides for a penalty of up to $100,000 for a circumvention scheme.
There are exceptions to the self-referral prohibition for many of the customary financial arrangements between physicians and providers, including employment contracts, leases, and recruitment agreements. Unlike safe harbors under the Anti-Kickback Statute, the Stark Law imposes strict liability on the parties to an arrangement and an arrangement must comply with every requirement of a Stark Law exception or the arrangement is in violation of the Stark Law.
The CMS has issued multiple phases of final regulations implementing the Stark Law and continues to make changes to these regulations. While these regulations help clarify the exceptions to the Stark Law, it is unclear
15
Table of Contents
Index to Financial Statements
how the government will interpret many of these exceptions for enforcement purposes. Although our lease agreements require lessees to comply with the Stark Law, and we intend for facilities to comply with the Stark Law where we own an interest in our tenants’ operations, we cannot offer assurance that the arrangements entered into by us and our facilities will be found to be in compliance with the Stark Law, as it ultimately may be implemented or interpreted. In addition, changes to the Stark Law could require our tenants to restructure certain arrangements with physicians, which could impact the business of our tenants.
False Claims Act. The federal False Claims Act prohibits the making or presenting of any false claim for payment to the federal government; it is the civil equivalent to federal criminal provisions prohibiting the submission of false claims to federally funded programs. Additionally, qui tam, or whistleblower, provisions of the federal False Claims Act allow private individuals to bring actions on behalf of the federal government alleging that the defendant has defrauded the federal government. Whistleblowers may collect a portion of the federal government’s recovery — an incentive which increases the frequency of such actions. A successful federal False Claims Act case may result in a penalty of three times the actual damages, plus additional civil penalties payable to the government, plus reimbursement of the fees of counsel for the whistleblower. Many states have enacted similar statutes preventing the presentation of a false claim to a state government, and we expect more to do so because the Social Security Act provides a financial incentive for states to enact statutes establishing state level liability.
The Civil Monetary Penalties Law. Among other things, the Civil Monetary Penalties law prohibits the knowing presentation of a claim for certain healthcare services that is false or fraudulent, the presentation of false or misleading information in connection with claims for payment, and other acts involving fraudulent conduct. Penalties include a monetary civil penalty of up to $10,000 for each item or service, $15,000 for each individual with respect to whom false or misleading information was given, as well as treble damages for the total amount of remuneration claimed.
Licensure. Our tenants are subject to extensive federal, state, and local licensure, certification, and inspection laws and regulations including, in some cases, certificate of need laws. Further, various licenses and permits are required to dispense narcotics, operate pharmacies, handle radioactive materials, and operate equipment. Failure to comply with any of these laws could result in loss of licensure, certification or accreditation, denial of reimbursement, imposition of fines, and suspension or decertification from federal and state healthcare programs.
EMTALA. Our tenants that provide emergency care are subject to the Emergency Medical Treatment and Active Labor Act (“EMTALA”). This federal law requires such healthcare facilities to conduct an appropriate medical screening examination of every individual who presents to the hospital’s emergency room for treatment and, if the individual is suffering from an emergency medical condition, to either stabilize the condition or make an appropriate transfer of the individual to a facility able to handle the condition. The obligation to screen and stabilize emergency medical conditions exists regardless of an individual’s ability to pay for treatment. There are severe penalties under EMTALA if a hospital fails to screen or appropriately stabilize or transfer an individual or if the hospital delays appropriate treatment in order to first inquire about the individual’s ability to pay. Liability for violations of EMTALA includes, among other things, civil monetary penalties and exclusion from participation in the federal healthcare programs. Our lease and mortgage loan agreements require our tenants to comply with EMTALA, and we believe our tenants conduct business in substantial compliance with EMTALA.
Reimbursement Pressures. Healthcare facility operating margins continue to face significant pressure due to the deterioration in pricing flexibility and payor mix, a shift toward alternative payment models, increases in operating expenses that exceed increases in payments under the Medicare program, reductions in levels of Medicaid funding due to state budget shortfalls, and other similar cost pressures on our tenants. More specifically, LTACHs continue to face reimbursement pressures including those resulting from the passage of the SGR Reform Act of 2013, and CMS is also implementing regulatory restrictions on reimbursement for hospital outpatient departments, which could lead to decreased reimbursement for our tenants. We cannot predict how and
16
Table of Contents
Index to Financial Statements
to what extent these or other initiatives will impact the business of our tenants or whether our business will be adversely impacted.
Healthcare Reform. Generally, the Patient Protection and Affordable Care Act ( the “Reform Law”) provides expanded health insurance coverage through tax subsidies and federal health insurance programs, individual and employer mandates for health insurance coverage, and health insurance exchanges. The Reform Law also includes various cost containment initiatives, including quality control and payment system refinements for federal programs, such as pay-for-performance criteria and value-based purchasing programs, bundled provider payments, accountable care organizations, geographic payment variations, comparative effectiveness research, and lower payments for hospital readmissions. The Reform Law also increases health information technology standards for healthcare providers in an effort to improve quality and reduce costs. The Reform Law has led, and will continue to lead, to significant changes in the healthcare system. There are, however, continuing efforts to repeal and replace the Reform Law. We cannot predict the continued impact of the Reform Law, or the impact of its possible repeal and replacement, on our business, as some aspects benefit the operations of our tenants, while other aspects present challenges.
Employees
We have 54 employees as of February 24, 2017. As we continue to grow, we expect our head count to increase as well. However, we do not believe that any adjustments to the number of employees will have a material effect on our operations or to general and administrative expenses as a percent of revenues. We believe that our relations with our employees are good. None of our employees are members of any union.
Available Information
Our website address is www.medicalpropertiestrust.com and provides access in the “Investor Relations” section, free of charge, to our Annual Report on Form 10-K, quarterly reports on Form 10-Q, current reports on Form 8-K, including exhibits, and all amendments to these reports as soon as reasonably practicable after such material is electronically filed with or furnished to the Securities and Exchange Commission (“SEC”). Also available on our website, free of charge, are our Corporate Governance Guidelines, the charters of our Ethics, Nominating and Corporate Governance, Audit and Compensation Committees and our Code of Ethics and Business Conduct. If you are not able to access our website, the information is available in print free of charge to any stockholder who should request the information directly from us at (205) 969-3755. Information on or connected to our website is neither part of nor incorporated by reference into this Annual Report or any other SEC filings.
17
Table of Contents
Index to Financial Statements
| ITEM 1A. | Risk Factors |
The risks and uncertainties described herein are not the only ones facing us and there may be additional risks that we do not presently know of or that we currently consider not likely to have a significant impact on us. All of these risks could adversely affect our business, results of operations and financial condition. Some statements in this report including statements in the following risk factors constitute forward-looking statements. Please refer to the section entitled “Cautionary Language Regarding Forward Looking Statements” at the beginning of this Annual Report.
RISKS RELATED TO OUR BUSINESS AND GROWTH STRATEGY (Including Financing Risks)
Limited access to capital may restrict our growth.
Our business plan contemplates growth through acquisitions and development of facilities. As a REIT, we are required to make cash distributions, which reduce our ability to fund acquisitions and developments with retained earnings. We are dependent on acquisition financing and access to the capital markets for cash to make investments in new facilities. Due to market or other conditions, we may have limited access to capital from the equity and debt markets. We may not be able to obtain additional equity or debt capital or dispose of assets on favorable terms, if at all, at the time we need additional capital to acquire healthcare properties or to meet our obligations, which could have a material adverse effect on our results of operations and our ability to make distributions to our stockholders.
Our indebtedness could adversely affect our financial condition and may otherwise adversely impact our business operations and our ability to make distributions to stockholders.
As of February 24, 2017, we had $3.0 billion of debt outstanding, which excludes the €200 million 5.750% Senior Notes due 2020 to be redeemed on March 4, 2017.
Our indebtedness could have significant effects on our business. For example, it could:
| • | require us to use a substantial portion of our cash flow from operations to service our indebtedness, which would reduce the available cash flow to fund working capital, development projects and other general corporate purposes and reduce cash for distributions; |
| • | require payments of principal and interest that may be greater than our cash flow from operations; |
| • | force us to dispose of one or more of our properties, possibly on disadvantageous terms, to make payments on our debt; |
| • | increase our vulnerability to general adverse economic and industry conditions; limit our flexibility in planning for, or reacting to, changes in our business and the industry in which we operate; |
| • | restrict us from making strategic acquisitions or exploiting other business opportunities; |
| • | make it more difficult for us to satisfy our obligations; and |
| • | place us at a competitive disadvantage compared to our competitors that have less debt. |
Our future borrowings under our loan facilities may bear interest at variable rates in addition to the $0.8 billion in variable interest rate debt that we had outstanding as of February 24, 2017. If interest rates increase significantly, our operating results would decline along with the cash available for distributions to our stockholders.
In addition, most of our current debt is, and we anticipate that much of our future debt will be, non-amortizing and payable in balloon payments. Therefore, we will likely need to refinance at least a portion of that debt as it matures. There is a risk that we may not be able to refinance debt maturing in future years or that
18
Table of Contents
Index to Financial Statements
the terms of any refinancing will not be as favorable as the terms of the then-existing debt. If principal payments due at maturity cannot be refinanced, extended or repaid with proceeds from other sources, such as new equity capital or sales of facilities, our cash flow may not be sufficient to repay all maturing debt in years when significant balloon payments come due. Additionally, we may incur significant penalties if we choose to prepay the debt. See Item 7 of Part II of this Annual Report on Form 10-K for further information on our current debt maturities.
Covenants in our debt instruments limit our operational flexibility, and a breach of these covenants could materially affect our financial condition and results of operations.
The terms of our unsecured credit facility (“Credit Facility”) and the indentures governing our outstanding unsecured senior notes, and other debt instruments that we may enter into in the future are subject to customary financial and operational covenants. For example, our Credit Facility imposes certain restrictions on us, including restrictions on our ability to: incur debts; create or incur liens; provide guarantees in respect of obligations of any other entity; make redemptions and repurchases of our capital stock; prepay, redeem or repurchase debt; engage in mergers or consolidations; enter into affiliated transactions; dispose of real estate; and change our business. In addition, the agreements governing our unsecured credit facility limit the amount of dividends we can pay as a percentage of normalized adjusted funds from operations, as defined, on a rolling four quarter basis. Through the quarter ending December 31, 2016, the dividend restriction was 95% of normalized adjusted funds from operations (“FFO”). The indentures governing our senior unsecured notes also limit the amount of dividends we can pay based on the sum of 95% of FFO, proceeds of equity issuances and certain other net cash proceeds. Finally, our senior unsecured notes require us to maintain total unencumbered assets (as defined in the related indenture) of not less than 150% of our unsecured indebtedness.
From time-to-time, the lenders of our Credit Facility may adjust certain covenants to give us more flexibility to complete a transaction; however, such modified covenants are temporary, and we must be in a position to meet the lowered reset covenants in the future. Our continued ability to incur debt and operate our business is subject to compliance with the covenants in our debt instruments, which limit operational flexibility. Breaches of these covenants could result in defaults under applicable debt instruments and other debt instruments due to cross-default provisions, even if payment obligations are satisfied. Financial and other covenants that limit our operational flexibility, as well as defaults resulting from a breach of any of these covenants in our debt instruments, could have a material adverse effect on our financial condition and results of operations.
Failure to hedge effectively against interest rate changes may adversely affect our results of operations and our ability to make distributions to our stockholders.
As of February 24, 2017, we had approximately $0.8 billion in variable interest rate debt, which constitutes 26.5% of our overall indebtedness and subjects us to interest rate volatility. We may seek to manage our exposure to interest rate volatility by using interest rate hedging arrangements, such as when we entered into the $125 million of interest rate swaps in 2010 to fix the interest rate on our 2006 Senior Unsecured Notes due 2016, which were paid in full on October 31, 2016. However, even these hedging arrangements involve risk, including the risk that counterparties may fail to honor their obligations under these arrangements, that these arrangements may not be effective in reducing our exposure to interest rate changes and that these arrangements may result in higher interest rates than we would otherwise have. Moreover, no hedging activity can completely insulate us from the risks associated with changes in interest rates. Failure to hedge effectively against interest rate changes may materially adversely affect our results of operations and our ability to make distributions to our stockholders.
Dependence on our tenants for payments of rent and interest may adversely impact our ability to make distributions to our stockholders.
We expect to continue to qualify as a REIT and, accordingly, as a REIT operating in the healthcare industry, we are severely limited by current tax law with respect to our ability to operate or manage the businesses conducted in our facilities.
19
Table of Contents
Index to Financial Statements
Accordingly, we rely heavily on rent payments from our tenants under leases or interest payments from operators under mortgage or other loans for cash with which to make distributions to our stockholders. We have no control over the success or failure of these tenants’ businesses. Significant adverse changes in the operations of our facilities, or the financial condition of our tenants, operators or guarantors, could have a material adverse effect on our ability to collect rent and interest payments and, accordingly, on our ability to make distributions to our stockholders. Facility management by our tenants and their compliance with healthcare and other laws could have a material impact on our tenants’ operating and financial condition and, in turn, their ability to pay rent and interest to us.
It may be costly to replace defaulting tenants and we may not be able to replace defaulting tenants with suitable replacements on suitable terms.
Failure on the part of a tenant to comply materially with the terms of a lease could give us the right to terminate our lease with that tenant, repossess the applicable facility, cross default certain other leases and loans with that tenant and enforce the payment obligations under the lease. The process of terminating a lease with a defaulting tenant and repossessing the applicable facility may be costly and require a disproportionate amount of management’s attention. In addition, defaulting tenants or their affiliates may initiate litigation in connection with a lease termination or repossession against us or our subsidiaries. If a tenant-operator defaults and we choose to terminate our lease, we are then required to find another tenant-operator, such as the case was with our Monroe facility in 2014. The transfer of most types of healthcare facilities is highly regulated, which may result in delays and increased costs in locating a suitable replacement tenant. The sale or lease of these properties to entities other than healthcare operators may be difficult due to the added cost and time of refitting the properties. If we are unable to re-let the properties to healthcare operators, we may be forced to sell the properties at a loss due to the repositioning expenses likely to be incurred by non-healthcare purchasers. Alternatively, we may be required to spend substantial amounts to adapt the facility to other uses. There can be no assurance that we would be able to find another tenant in a timely fashion, or at all, or that, if another tenant were found, we would be able to enter into a new lease on favorable terms. Defaults by our tenants under our leases may adversely affect our results of operations, financial condition, and our ability to make distributions to our stockholders. Defaults by our significant tenants under master leases (like Steward, Prime, MEDIAN, Ernest, and RCCH) will have an even greater effect.
It may be costly to find new tenants when lease terms end and we may not be able to replace such tenants with suitable replacements on suitable terms.
Failure on the part of a tenant to renew or extend the lease at the end of its fixed term on one of our facilities could result in us having to search for, negotiate with and execute new lease agreements, such was the case with our two South Carolina facilities — Bennettsville and Cheraw in 2015. The process of finding and negotiating with a new tenant along with costs (such as maintenance, property taxes, utilities, etc.) that we will incur while the facility is untenanted may be costly and require a disproportionate amount of management’s attention. There can be no assurance that we would be able to find another tenant in a timely fashion, or at all, or that, if another tenant were found, we would be able to enter into a new lease on favorable terms. If we are unable to re-let the properties to healthcare operators, we may be forced to sell the properties at a loss due to the repositioning expenses likely to be incurred by non-healthcare purchasers. Alternatively, we may be required to spend substantial amounts to adapt the facility to other uses. Thus, the non-renewal or extension of leases may adversely affect our results of operations, financial condition, and our ability to make distributions to our stockholders. This risk is even greater for those properties under master leases (like Steward, Prime, MEDIAN, Ernest, and RCCH) because several properties have the same lease ending dates.
20
Table of Contents
Index to Financial Statements
We have made investments in the operators of certain of our healthcare facilities and the cash flows (and related returns) from these investments are subject to more volatility than our properties with the traditional net leasing structure.
At December 31, 2016, we have 11 investments in the operations of certain of our healthcare facilities by utilizing RIDEA (or similar investments). These investments include profits interest, equity investments, and equity like loans that generate returns dependent upon the operator’s performance. As a result, the cash flow and returns from these investments may be more volatile than that of our traditional triple-net leasing structure. Our business, results of operations, and financial condition may be adversely affected if the related operators fail to successfully operate the facilities efficiently and in a manner that is in our best interest.
We have limited experience with healthcare facilities in Germany, the United Kingdom, Italy, and Spain or anywhere else outside the U.S.
We have limited experience investing in healthcare properties or other real estate-related assets located outside the U.S. Investing in real estate located in foreign countries, including Germany, the United Kingdom, Italy, and Spain, creates risks associated with the uncertainty of foreign laws and markets including, without limitation, laws respecting foreign ownership, the enforceability of loan and lease documents and foreclosure laws. German real estate and tax laws are complex and subject to change, and we cannot assure you we will always be in compliance with those laws or that compliance will not expose us to additional expense. The properties we acquired in connection with the MEDIAN acquisition (as more fully described in Note 3 to Item 8 of this Form 10-K) will also face risks in connection with unexpected changes in German or European regulatory requirements, political and economic instability, potential imposition of adverse or confiscatory taxes, possible challenges to the anticipated tax treatment of the structures that allow us to acquire and hold investments, possible currency transfer restrictions, the difficulty in enforcing obligations in other countries and the burden of complying with a wide variety of foreign laws. In addition, to qualify as a REIT, we generally will be required to operate any non-U.S. investments in accordance with the rules applicable to U.S. REITs, which may be inconsistent with local practices. We may also be subject to fluctuations in local real estate values or markets or the European economy as a whole, which may adversely affect our European investments.
In addition, the rents payable under our leases of foreign assets are payable in either euros or British pounds, which could expose us to losses resulting from fluctuations in exchange rates to the extent we have not hedged our position, which in turn could adversely affect our revenues, operating margins and dividends, and may also affect the book value of our assets and the amount of stockholders’ equity. Further, any international currency gain recognized with respect to changes in exchange rates may not qualify under the 75% gross income test that we must satisfy annually in order to qualify and maintain our status as a REIT. Although we expect to hedge some of our foreign currency risk, we may not be able to do so successfully and may incur losses on our investments as a result of exchange rate fluctuations. Furthermore, we are subject to laws and regulations, such as the Foreign Corrupt Practices Act and similar local anti-bribery laws, that generally prohibit companies and their employees, agents and contractors from making improper payments to governmental officials for the purpose of obtaining or retaining business. Failure to comply with these laws could subject us to civil and criminal penalties that could materially adversely affect our results of operations, the value of our international investments, and our ability to make distributions to our stockholders.
Our revenues are dependent upon our relationships with, and success of, our largest tenants, Steward, Prime, MEDIAN, Ernest, RCCH and Adeptus Health.
For the year ended December 31, 2016, our top tenants were Steward, Prime, MEDIAN, Ernest, RCCH, and Adeptus Health representing 4.8% (based on fourth quarter revenue only when we closed the Steward acquisition), 22.3%, 17.3%, 12.5%, 9.7% and 7.0 %, respectively, of our total revenues. Our relationships with these operators and their financial performance and resulting ability to satisfy their lease and loan obligations to us are material to our financial results and our ability to service our debt and make distributions to our stockholders. We are dependent
21
Table of Contents
Index to Financial Statements
upon the ability of these operators to make rent and loan payments to us, and any failure to meet these obligations could have a material adverse effect on our financial condition and results of operations.
Our tenants operate in the healthcare industry that is highly regulated by federal, state, and local laws and changes in regulations may negatively impact our tenants’ operations until they are able to make the appropriate adjustments to their business. For example, recent modifications to regulations concerning patient criteria and reimbursement for LTACHs have resulted in volume and profitability declines in certain facilities operated by Ernest.
We are aware of various federal and state inquiries, investigations and other proceedings currently affecting several of our tenants and would expect such government compliance and enforcement activities to be ongoing at any given time with respect to one or more of our tenants, either on a confidential or public basis. During the second quarter of 2016, the Department of Justice joined a lawsuit against Prime alleging irregular admission practices intended to increase the number of inpatient care admissions of Medicare patients, including unnecessarily classifying some patients as “inpatient” rather than “observation”. Other large acute hospital operators have also recently defended similar allegations, sometimes resulting in financial settlements and agreements with regulators to modify admission policies, resulting in lower reimbursements for those patients.
In November 2016, Adeptus Health disclosed that it raised approximately $57 million in liquidity in order to address a cash shortfall that it reported was a result of inattention to revenue collection and expense controls and changes in its business model. Adeptus Health is a rapidly expanding company and has, during the second half of 2016, replaced its Chief Executive Officer, Chief Financial Officer and Corporate Controller.
An adverse result to Ernest, Prime, Adeptus Health, or one of our larger tenants in regulatory proceedings or financial or operational setbacks may have a material adverse effect on the relevant tenant’s operations and financial condition and on its ability to make required lease and loan payments to us, which could negatively affect our ability to service our debt and make distributions to our stockholders. The protections that we have in place to protect against such failure or delay, which can include letters of credit, cross default provisions, parent guarantees, repair reserves and the right to exercise remedies including the termination of the lease and replacement of the operator, may prove to be insufficient, in whole or in part, or may entail further delays. In instances where we have an equity investment in our tenant’s operations, in addition to the effect on these tenants’ ability to meet their financial obligation to us, our ownership and investment interests may also be negatively impacted.
We have now, and may have in the future, exposure to contingent rent escalators, which could hinder our growth and profitability.
We receive a significant portion of our revenues by leasing assets under long-term net leases that generally provide for fixed rental rates subject to annual escalations. These annual escalations may be contingent on changes in CPI, typically with specified caps and floors. Certain of our other leases may provide for additional rents contingent upon a percentage of the tenant’s revenues in excess of specified threshold. If, as a result of weak economic conditions or other factors, the CPI does not increase or the properties subject to these leases do not generate sufficient revenue to achieve the specified threshold, our growth and profitability may be hindered by these leases. In addition, if strong economic conditions result in significant increases in CPI, but the escalations under our leases are capped, our growth and profitability may be limited.
The bankruptcy or insolvency of our tenants or investees could harm our operating results and financial condition.
Some of our tenants/investees are, and some of our prospective tenants/investees may be, newly organized, have limited or no operating history and may be dependent on loans from us to acquire the facility’s operations and for initial working capital. Any bankruptcy filings by or relating to one of our tenants/investees could bar us
22
Table of Contents
Index to Financial Statements
from collecting pre-bankruptcy debts from that tenant or their property, unless we receive an order permitting us to do so from the bankruptcy court. A tenant bankruptcy can be expected to delay our efforts to collect past due balances under our leases and loans, and could ultimately preclude collection of these sums. If a lease is assumed by a tenant in bankruptcy, we expect that all pre-bankruptcy balances due under the lease would be paid to us in full. However, if a lease is rejected by a tenant in bankruptcy, we would have only a general unsecured claim for damages. Any secured claims we have against our tenants may only be paid to the extent of the value of the collateral, which may not cover any or all of our losses. Any unsecured claim (such as our equity interests in our tenants) we hold against a bankrupt entity may be paid only to the extent that funds are available and only in the same percentage as is paid to all other holders of unsecured claims. We may recover none or substantially less than the full value of any unsecured claims, which would harm our financial condition.
Our business is highly competitive and we may be unable to compete successfully.
We compete for development opportunities and opportunities to purchase healthcare facilities with, among others:
| • | private investors, including large private equity funds; |
| • | healthcare providers, including physicians; |
| • | other REITs; |
| • | real estate developers; |
| • | government-sponsored and/or not-for-profit agencies; |
| • | financial institutions; and |
| • | other lenders. |
Some of these competitors may have substantially greater financial and other resources than we have and may have better relationships with lenders and sellers. Competition for healthcare facilities from competitors may adversely affect our ability to acquire or develop healthcare facilities and the prices we pay for those facilities. If we are unable to acquire or develop facilities or if we pay too much for facilities, our revenue, earnings growth and financial return could be materially adversely affected. Certain of our facilities, or facilities we may acquire or develop in the future will face competition from other nearby facilities that provide services comparable to those offered at our facilities. Some of those facilities are owned by governmental agencies and supported by tax revenues, and others are owned by tax-exempt corporations and may be supported to a large extent by endowments and charitable contributions. Those types of support are not generally available to our facilities. In addition, competing healthcare facilities located in the areas served by our facilities may provide healthcare services that are not available at our facilities and additional facilities we may acquire or develop. From time to time, referral sources, including physicians and managed care organizations, may change the healthcare facilities to which they refer patients, which could adversely affect our tenants and thus our rental revenues, interest income, and/or our earnings from equity investments.
Most of our current tenants have, and prospective tenants may have, an option to purchase the facilities we lease to them which could disrupt our operations.
Most of our current tenants have, and some prospective tenants will have, the option to purchase the facilities we lease to them. There is no assurance that the formulas we have developed for setting the purchase price will yield a fair market value purchase price.
In the event our tenants and prospective tenants determine to purchase the facilities they lease either during the lease term or after their expiration, the timing of those purchases may be outside of our control and we may not be able to re-invest the capital on as favorable terms, or at all. Our inability to effectively manage the turnover of our facilities could materially adversely affect our ability to execute our business plan and our results of operations.
23
Table of Contents
Index to Financial Statements
We have 131 leased properties that are subject to purchase options as of December 31, 2016. For 104 of these properties, the purchase option generally allows the lessee to purchase the real estate at the end of the lease term, as long as no default has occurred, at a price equivalent to the greater of (i) fair market value or (ii) our original purchase price (increased, in some cases, by a certain annual rate of return from lease commencement date). The lease agreements provide for an appraisal process to determine fair market value. For 17 of these properties, the purchase option generally allows the lessee to purchase the real estate at the end of the lease term, as long as no default has occurred, at our purchase price (increased, in some cases, by a certain annual rate of return from lease commencement date). For the remaining 10 leases, the purchase options approximate fair value. At December 31, 2016, none of our leases contained any bargain purchase options.
In certain circumstances, a prospective purchaser of our hospital real estate may be deemed to be subject to Anti-Kickback and Stark statutes, which are described on in the “Healthcare Regulatory Matters” section in Item 1 of this Annual Report on Form 10-K. In such event, it may not be practicable for us to sell property to such prospective purchasers at prices other than fair market value.
We may not be able to adapt our management and operational systems to manage the net-leased facilities we have acquired or are developing or those that we may acquire or develop in the future without unanticipated disruption or expense.
There is no assurance that we will be able to adapt our management, administrative, accounting and operational systems, or hire and retain sufficient operational staff, to manage the facilities we have acquired and those that we may acquire or develop, including those properties located in Europe or any future investments outside the U.S. Our failure to successfully manage our current portfolio of facilities or any future acquisitions or developments could have a material adverse effect on our results of operations and financial condition and our ability to make distributions to our stockholders.
Merger and acquisition activity or consolidation in the healthcare industry may result in a change of control of, or a competitor’s investment in, one or more of our tenants or operators, which could have a material adverse effect on us.
The healthcare industry has recently experienced increased consolidation, including among owners of real estate and healthcare providers. We compete with other healthcare REITs, healthcare providers, healthcare lenders, real estate partnerships, banks, insurance companies, private equity firms and other investors that pursue a variety of investments, which may include investments in our tenants or operators. We have historically developed strong, long-term relationships with many of our tenants and operators. A competitor’s investment in one of our tenants or operators, any change of control of a tenant or operator, or a change in the tenant’s or operator’s management team could enable our competitor to influence or control that tenant’s or operator’s business and strategy. This influence could have a material adverse effect on us by impairing our relationship with the tenant or operator, negatively affecting our interest, or impacting the tenant’s or operator’s financial and operational performance, including their ability to pay us rent or interest. Depending on our contractual agreements and the specific facts and circumstances, we may have consent rights, termination rights, remedies upon default or other rights and remedies related to a competitor’s investment in, a change of control of, or other transactions impacting a tenant or operator. In deciding whether to exercise our rights and remedies, including termination rights or remedies upon default, we assess numerous factors, including legal, contractual, regulatory, business and other relevant considerations.
We depend on key personnel, the loss of any one of whom may threaten our ability to operate our business successfully.
We depend on the services of Edward K. Aldag, Jr., R. Steven Hamner, and Emmett E. McLean to carry out our business and investment strategy. If we were to lose any of these executive officers, it may be more difficult for us to locate attractive acquisition targets, complete our acquisitions and manage the facilities that we have
24
Table of Contents
Index to Financial Statements
acquired or developed. Additionally, as we expand, we will continue to need to attract and retain additional qualified officers and employees. The loss of the services of any of our executive officers, or our inability to recruit and retain qualified personnel in the future, could have a material adverse effect on our business and financial results.
The market price and trading volume of our common stock may be volatile.
The market price of our common stock may be highly volatile and be subject to wide fluctuations. In addition, the trading volume in our common stock may fluctuate and cause significant price variations to occur. If the market price of our common stock declines significantly, you may be unable to resell your shares at or above your purchase price.
We cannot assure you that the market price of our common stock will not fluctuate or decline significantly in the future. Some of the factors that could negatively affect our share price or result in fluctuations in the price or trading volume of our common stock include:
| • | actual or anticipated variations in our quarterly operating results or distributions; |
| • | changes in our funds from operations or earnings estimates or publication of research reports about us or the real estate industry; |
| • | increases in market interest rates that lead purchasers of our shares of common stock to demand a higher yield; |
| • | changes in market valuations of similar companies; |
| • | adverse market reaction to any increased indebtedness we incur in the future; |
| • | additions or departures of key management personnel; |
| • | actions by institutional stockholders; |
| • | local conditions such as an oversupply of, or a reduction in demand for, inpatient rehabilitation hospitals, LTACHs, ambulatory surgery centers, medical office buildings, specialty hospitals, skilled nursing facilities, regional and community hospitals, women’s and children’s hospitals and other single-discipline facilities; |
| • | speculation in the press or investment community; and |
| • | general market and economic conditions. |
Future sales of common stock may have adverse effects on our stock price.
We cannot predict the effect, if any, of future sales of common stock, or the availability of shares for future sales, on the market price of our common stock. Sales of substantial amounts of common stock, or the perception that these sales could occur, may adversely affect prevailing market prices for our common stock. We may issue from time to time additional common stock or units of our operating partnership in connection with the acquisition of facilities and we may grant additional demand or piggyback registration rights in connection with these issuances. Sales of substantial amounts of common stock or the perception that these sales could occur may adversely affect the prevailing market price for our common stock. In addition, the sale of these shares could impair our ability to raise future capital through a sale of additional equity securities.
Downgrades in our credit ratings could have a material adverse effect on our cost and availability of capital.
As of February 24, 2017, our corporate credit rating from Standard and Poor’s Ratings Service was BB+, and our corporate family rating from Moody’s Investors Service was Ba1. There can be no assurance that we will
25
Table of Contents
Index to Financial Statements
be able to maintain our current credit ratings. Any downgrades in terms of ratings or outlook by any or all of the rating agencies could have a material adverse effect on our cost and availability of capital, which could in turn have a material adverse effect on our financial condition and results of operations.
An increase in market interest rates may have an adverse effect on the market price of our securities.
One of the factors that investors may consider in deciding whether to buy or sell our securities is our distribution rate as a percentage of our price per share of common stock, relative to market interest rates. If market interest rates increase, prospective investors may desire a higher distribution on our securities or seek securities paying higher distributions. The market price of our common stock likely will be based primarily on the earnings that we derive from rental and interest income with respect to our facilities and our related distributions to stockholders, and not from the underlying appraised value of the facilities themselves. As a result, interest rate fluctuations and capital market conditions can affect the market price of our common stock. In addition, rising interest rates would result in increased interest expense on our variable-rate debt, thereby adversely affecting cash flow and our ability to service our indebtedness and make distributions.
Changes in currency exchange rates may subject us to risk.
As our operations have expanded internationally where the U.S. dollar is not the denominated currency, currency exchange rate fluctuations could affect our results of operations and financial position. A significant change in the value of the foreign currency of one or more countries where we have a significant investment may have a material adverse effect on our financial position, debt covenant ratios, results of operations and cash flow.
Although we may enter into foreign exchange agreements with financial institutions and/or obtain local currency mortgage debt in order to reduce our exposure to fluctuations in the value of foreign currencies, we cannot assure you that foreign currency fluctuations will not have a material adverse effect on us.
The United Kingdom’s exit from the European Union could adversely affect us.
On June 23, 2016, the United Kingdom held a referendum in which a majority of voters voted to exit the European Union, known as Brexit. Negotiations have commenced to determine the future terms of the United Kingdom’s relationship with the European Union, including, among other things, the terms of trade between the United Kingdom and the European Union. The effects of Brexit will depend on any agreements the United Kingdom makes to retain access to European Union markets either during a transitional period or more permanently. Brexit could adversely affect European and global economic or market conditions and could contribute to instability in global financial markets. In addition, Brexit could lead to legal uncertainty and potentially divergent national laws and regulations as the United Kingdom determines which European Union laws to replace or replicate. Any of these effects of Brexit, and others we cannot anticipate, may adversely affect us.
We currently hold, and may acquire additional, interests in healthcare facilities located in the United Kingdom and Europe, as well as other investments that are denominated in British pounds and euros. In addition, our operating partnership has issued, and may issue in the future, senior unsecured notes denominated in euros. Any of the effects of Brexit described above, and others we cannot anticipate, could have a material adverse effect on our business, the value of our real estate and other investments, and our potential growth in Europe, and could amplify the currency risks faced by us.
RISKS RELATING TO REAL ESTATE INVESTMENTS
Our real estate, mortgage, and equity investments are and are expected to continue to be concentrated in a single industry segment, making us more vulnerable economically than if our investments were more diversified.
We acquire, develop, and make mortgage investments in healthcare real estate. In addition, we selectively make RIDEA investments in healthcare operators. We are subject to risks inherent in concentrating investments
26
Table of Contents
Index to Financial Statements
in real estate. The risks resulting from a lack of diversification become even greater as a result of our business strategy to invest solely in healthcare facilities. A downturn in the real estate industry could materially adversely affect the value of our facilities. A downturn in the healthcare industry could negatively affect our tenants’ ability to make lease or loan payments to us as well as our return on our equity investments. Consequently, our ability to meet debt service obligations or make distributions to our stockholders are dependent on the real estate and healthcare industries. These adverse effects could be more pronounced than if we diversified our investments outside of real estate or outside of healthcare facilities.
Our facilities may not have efficient alternative uses, which could impede our ability to find replacement tenants in the event of termination or default under our leases.
All of the facilities in our current portfolio are and all of the facilities we expect to acquire or develop in the future will be net-leased healthcare facilities. If we, or our tenants, terminate the leases for these facilities, or if these tenants lose their regulatory authority to operate these facilities, we may not be able to locate suitable replacement tenants to lease the facilities for their specialized uses. Alternatively, we may be required to spend substantial amounts to adapt the facilities to other uses. Any loss of revenues or additional capital expenditures occurring as a result could have a material adverse effect on our financial condition and results of operations and could hinder our ability to meet debt service obligations or make distributions to our stockholders.
Illiquidity of real estate investments could significantly impede our ability to respond to adverse changes in the performance of our facilities and harm our financial condition.
Real estate investments are relatively illiquid. Additionally, the real estate market is affected by many factors beyond our control, including adverse changes in global, national, and local economic and market conditions and the availability, costs and terms of financing. Our ability to quickly sell or exchange any of our facilities in response to changes in economic and other conditions will be limited. No assurances can be given that we will recognize full value for any facility that we are required to sell for liquidity reasons. Our inability to respond rapidly to changes in the performance of our investments could adversely affect our financial condition and results of operations.
Development and construction risks could adversely affect our ability to make distributions to our stockholders.
We have developed and constructed facilities in the past and are currently developing six facilities. We will develop additional facilities in the future as opportunities present themselves. Our development and related construction activities may subject us to the following risks:
| • | we may have to compete for suitable development sites; |
| • | our ability to complete construction is dependent on there being no title, environmental or other legal proceedings arising during construction; |
| • | we may be subject to delays due to weather conditions, strikes and other contingencies beyond our control; |
| • | we may be unable to obtain, or suffer delays in obtaining, necessary zoning, land-use, building, occupancy healthcare regulatory and other required governmental permits and authorizations, which could result in increased costs, delays in construction, or our abandonment of these projects; |
| • | we may incur construction costs for a facility which exceed our original estimates due to increased costs for materials or labor or other costs that we did not anticipate; and |
| • | we may not be able to obtain financing on favorable terms, which may render us unable to proceed with our development activities. |
27
Table of Contents
Index to Financial Statements
We expect to fund our development projects over time. The time frame required for development and construction of these facilities means that we may have to wait for some time to earn significant cash returns. In addition, our tenants may not be able to obtain managed care provider contracts in a timely manner or at all. Finally, there is no assurance that future development projects will occur without delays and cost overruns. Risks associated with our development projects may reduce anticipated rental revenue which could affect the timing of, and our ability to make, distributions to our stockholders.
We may be subject to risks arising from future acquisitions of real estate.
We may be subject to risks in connection with our acquisition of healthcare real estate, including without limitation the following:
| • | we may have no previous business experience with the tenants at the facilities acquired, and we may face difficulties in managing them; |
| • | underperformance of the acquired facilities due to various factors, including unfavorable terms and conditions of the existing lease agreements relating to the facilities, disruptions caused by the management of our tenants or changes in economic conditions; |
| • | diversion of our management’s attention away from other business concerns; |
| • | exposure to any undisclosed or unknown potential liabilities relating to the acquired facilities; and |
| • | potential underinsured losses on the acquired facilities. |
We cannot assure you that we will be able to manage the new properties without encountering difficulties or that any such difficulties will not have a material adverse effect on us.
Our facilities may not achieve expected results or we may be limited in our ability to finance future acquisitions, which may harm our financial condition and operating results and our ability to make the distributions to our stockholders required to maintain our REIT status.
Acquisitions and developments entail risks that investments will fail to perform in accordance with expectations and that estimates of the costs of improvements necessary to acquire and develop facilities will prove inaccurate, as well as general investment risks associated with any new real estate investment. Newly-developed or newly-renovated facilities may not have operating histories that are helpful in making objective pricing decisions. The purchase prices of these facilities will be based in part upon projections by management as to the expected operating results of the facilities, subjecting us to risks that these facilities may not achieve anticipated operating results or may not achieve these results within anticipated time frames.
We anticipate that future acquisitions and developments will largely be financed through externally generated funds such as borrowings under credit facilities and other secured and unsecured debt financing and from issuances of equity securities. Because we must distribute at least 90% of our REIT taxable income, excluding net capital gains, each year to maintain our qualification as a REIT, our ability to rely upon income from operations or cash flows from operations to finance our growth and acquisition activities will be limited.
If our facilities do not achieve expected results and generate ample cash flows from operations or if we are unable to obtain funds from borrowings or the capital markets to finance our acquisition and development activities, amounts available for distribution to stockholders could be adversely affected and we could be required to reduce distributions, thereby jeopardizing our ability to maintain our status as a REIT.
If we suffer losses that are not covered by insurance or that are in excess of our insurance coverage limits, we could lose investment capital and anticipated profits.
Our leases generally require our tenants to carry property, general liability, professional liability, loss of earnings, all risk and extended coverage insurance in amounts sufficient to permit the replacement of the facility
28
Table of Contents
Index to Financial Statements
in the event of a total loss, subject to applicable deductibles. We carry general liability insurance and loss of earnings coverage on all of our properties as a contingent measure in case our tenant’s coverage is not sufficient. However, there are certain types of losses, generally of a catastrophic nature, such as earthquakes, floods, hurricanes and acts of terrorism, which may be uninsurable or not insurable at a price we or our tenants can afford. Inflation, changes in building codes and ordinances, environmental considerations and other factors also might make it impracticable to use insurance proceeds to replace a facility after it has been damaged or destroyed. Under such circumstances, the insurance proceeds we receive might not be adequate to restore our economic position with respect to the affected facility. If any of these or similar events occur, it may reduce our return from the facility and the value of our investment. We continually review the insurance maintained by our tenants and operators and believe the coverage provided to be adequate and customary for similarly situated companies in our industry. However, we cannot provide any assurances that such insurance will be available at a reasonable cost in the future. Also, we cannot assure you that material uninsured losses, or losses in excess of insurance proceeds, will not occur in the future.
Our capital expenditures for facility renovation may be greater than anticipated and may adversely impact rent payments by our tenants and our ability to make distributions to stockholders.
Facilities, particularly those that consist of older structures, have an ongoing need for renovations and other capital improvements, including periodic replacement of fixtures and fixed equipment. Although our leases require our tenants to be primarily responsible for the cost of such expenditures, renovation of facilities involves certain risks, including the possibility of environmental problems, regulatory requirements, construction cost overruns and delays, uncertainties as to market demand or deterioration in market demand after commencement of renovation and the emergence of unanticipated competition from other facilities. All of these factors could adversely impact rent and loan payments by our tenants and returns on our equity investments, which in turn could have a material adverse effect on our financial condition and results of operations along with our ability to make distributions to our stockholders.
All of our healthcare facilities are subject to property taxes that may increase in the future and adversely affect our business.
Our facilities are subject to real and personal property taxes that may increase as property tax rates change and as the facilities are assessed or reassessed by taxing authorities. Our leases generally provide that the property taxes are charged to our tenants as an expense related to the facilities that they occupy. As the owner of the facilities, however, we are ultimately responsible for payment of the taxes to the government. If property taxes increase, our tenants may be unable to make the required tax payments, ultimately requiring us to pay the taxes. If we incur these tax liabilities, our ability to make expected distributions to our stockholders could be adversely affected. In addition, if such taxes increase on properties in which we have an equity investment in the tenant, our return on investment maybe negatively affected.
As the owner and lessor of real estate, we are subject to risks under environmental laws, the cost of compliance with which and any violation of which could materially adversely affect us.
Our operating expenses could be higher than anticipated due to the cost of complying with existing and future environmental laws and regulations. Various environmental laws may impose liability on the current or prior owner or operator of real property for removal or remediation of hazardous or toxic substances. Current or prior owners or operators may also be liable for government fines and damages for injuries to persons, natural resources and adjacent property. These environmental laws often impose liability whether or not the owner or operator knew of, or was responsible for, the presence or disposal of the hazardous or toxic substances. The cost of complying with environmental laws could materially adversely affect amounts available for distribution to our stockholders and could exceed the value of all of our facilities. In addition, the presence of hazardous or toxic substances, or the failure of our tenants to properly manage, dispose of or remediate such substances, including medical waste generated by physicians and our other healthcare tenants, may adversely affect our tenants or our
29
Table of Contents
Index to Financial Statements
ability to use, sell or rent such property or to borrow using such property as collateral which, in turn, could reduce our revenue and our financing ability. We typically obtain Phase I environmental assessments (or similar studies) on facilities we acquire or develop or on which we make mortgage loans, and intend to obtain on future facilities we acquire. However, even if the Phase I environmental assessment reports do not reveal any material environmental contamination, it is possible that material environmental contamination and liabilities may exist, of which we are unaware.
Although the leases for our facilities and our mortgage loans generally require our operators to comply with laws and regulations governing their operations, including the disposal of medical waste, and to indemnify us for certain environmental liabilities, the scope of their obligations may be limited. We cannot assure you that our tenants would be able to fulfill their indemnification obligations and, therefore, any material violation of environmental laws could have a material adverse affect on us. In addition, environmental laws are constantly evolving, and changes in laws, regulations or policies, or changes in interpretations of the foregoing, could create liabilities where none exist today.
Our interests in facilities through ground leases expose us to the loss of the facility upon breach or termination of the ground lease and may limit our use of the facility.
We have acquired interests in 33 of our facilities, at least in part, by acquiring leasehold interests in the land on which the facility is located rather than an ownership interest in the property, and we may acquire additional facilities in the future through ground leases. As lessee under ground leases, we are exposed to the possibility of losing the property upon termination, or an earlier breach by us, of the ground lease. Ground leases may also restrict our use of facilities, which may limit our flexibility in renting the facility and may impede our ability to sell the property.
Our acquisitions may not prove to be successful.
We are exposed to the risk that some of our acquisitions may not prove to be successful. We could encounter unanticipated difficulties and expenditures relating to any acquired properties, including contingent liabilities, and acquired properties might require significant management attention that would otherwise be devoted to our ongoing business. In addition, we might be exposed to undisclosed and unknown liabilities related to any acquired properties. If we agree to provide construction funding to an operator/tenant and the project is not completed, we may need to take steps to ensure completion of the project. Moreover, if we issue equity securities or incur additional debt, or both, to finance future acquisitions, it may reduce our per share financial results. These costs may negatively affect our results of operations.
RISKS RELATING TO THE HEALTHCARE INDUSTRY
Reductions in reimbursement from third-party payors and shift towards alternative payment models, could adversely affect the profitability of our tenants and hinder their ability to make payments to us.
Sources of revenue for our tenants and operators may include the Medicare and Medicaid programs, private insurance carriers, and health maintenance organizations, among others. Efforts by such payors to reduce healthcare costs could continue, which may result in reductions or slower growth in reimbursement for certain services provided by some of our tenants. In addition, the failure of any of our tenants to comply with various laws and regulations could jeopardize their ability to continue participating in Medicare, Medicaid, and other government-sponsored payment programs.
The U.S. healthcare industry continues to face various challenges, including increased government and private payor pressure on healthcare providers to control or reduce costs. For example, we believe that our tenants will continue to experience a shift in payor mix away from fee-for-service payors, which would result in an increase in the percentage of revenues attributable to alternative payment models implemented by private and
30
Table of Contents
Index to Financial Statements
government payors. CMS is particularly focused on transitioning Medicare from its traditional fee-for-service model to models that employ one or more capitated, value-based, or bundled payment approaches, and private payors are continuing to explore and implement similar types of alternative payment models. Such efforts from private and government payors, in addition to general industry trends, continue to place pressures on our tenants to control healthcare costs. Furthermore, pressures to control healthcare costs and a shift away from traditional health insurance reimbursement have resulted in an increase in the number of patients whose healthcare coverage is provided under managed care plans, such as health maintenance organizations and preferred provider organizations. These shifts place further cost pressures on our tenants. We also continue to believe that, due to the aging of the population and the expansion of governmental payor programs, there will be a marked increase in the number of patients relying on healthcare coverage provided by governmental payors. All of these changes could have a material adverse effect on the financial condition of some or all of our tenants, which could have a material adverse effect on our financial condition and results of operations and could negatively affect our ability to make distributions to our stockholders. In instances where we have an equity investment in our tenants’ operations, in addition to the effect on these tenants’ ability to meet their financial obligations to us, our ownership and investment interests may also be negatively impacted.
CMS’s increased regulatory restrictions on reimbursement for LTACH and inpatient rehabilitation facilities (“IRFs”), has reduced reimbursement for some tenants that operate LTACHs and IRFs, and CMS has also begun to implement regulatory restrictions on reimbursement for hospital outpatient departments (“HOPD”), which may also lead to reduced to reimbursement for our tenants that operate HOPDs. CMS is likely to continue exploring other restrictions on LTACH, IRF, and HOPD reimbursement and possibly develop more restrictive facility and patient level criteria for these types of facilities or departments. These changes could have a material adverse effect on the financial condition of some of our tenants, which could have a material adverse effect on our financial condition and results of operations and could negatively affect our ability to make distributions to our stockholders.
The Reform Law represented a major shift in the U.S. healthcare industry by, among other things, allowing millions of formerly uninsured individuals to obtain health insurance coverage and by significantly expanding Medicaid. The Reform Law, however, remains controversial, and there are continuing efforts to repeal and replace the Reform Law. In the event the Reform Law is repealed, this could have a material adverse effect on the financial condition of some or all of our tenants.
The U.S. healthcare industry is heavily regulated and loss of licensure or certification or failure to obtain licensure or certification could negatively impact our financial condition and results of operations.
The U.S. healthcare industry is highly regulated by federal, state, and local laws (as discussed on pages 10-13) and is directly affected by federal conditions of participation, state licensing requirements, facility inspections, state and federal reimbursement policies, regulations concerning capital and other expenditures, certification requirements and other such laws, regulations, and rules. We are aware of various federal and state inquiries, investigations, and other proceedings currently affecting several of our tenants and would expect such governmental compliance and enforcement activities to be ongoing at any given time with respect to one or more of our tenants, either on a confidential or public basis. As discussed in further detail below, an adverse result to our tenants in one or more such governmental proceedings may have a material adverse effect on the relevant tenant’s operations and financial condition and on its ability to make required lease and/or mortgage payments to us. In instances where we have an equity investment in our tenants’ operations, in addition to the effect on these tenants’ ability to meet their financial obligation to us, our ownership and investment interests may also be negatively impacted.
Licensed health care facilities must comply with minimum health and safety standards and are subject to survey and inspection by state and federal agencies and their agents or affiliates, including CMS, the Joint Commission, and state departments of health. CMS develops Conditions of Participation and Conditions for Coverage that health care organizations must meet in order to begin and continue participating in the Medicare
31
Table of Contents
Index to Financial Statements
and Medicaid programs and receive payment under such programs. These minimum health and safety standards are aimed at improving quality and protecting the health and safety of beneficiaries, and there are several common criteria that exist across health entities. The failure to comply with any of these standards could jeopardize a healthcare organization’s Medicare certification and, in turn, its right to receive payment under the Medicare and Medicaid programs.
Further, many hospitals and other institutional providers are accredited by accrediting agencies such as the Joint Commission, a national healthcare accrediting organization. The Joint Commission was created to accredit healthcare organizations that meet its minimum health and safety standards. A national accrediting organization, such as the Joint Commission, enforces standards that meet or exceed such requirements. Surveyors for the Joint Commission, prior to the opening of a facility and approximately every three years thereafter, conduct on site surveys of facilities for compliance with a multitude of patient safety, treatment, and administrative requirements. Facilities may lose accreditation for failure to meet such requirements, which in turn may result in the loss of license or certification including under the Medicare and Medicaid programs. For example, a facility may lose accreditation for failing to maintain proper medication in the operating room to treat potentially fatal reactions to anesthesia or for failure to maintain safe and sanitary medical equipment.
Finally, healthcare facility reimbursement practices and quality of care issues may result in loss of license or certification. For instance, the practice of “upcoding,” whereby services are billed for higher procedure codes than were actually performed, may lead to the revocation of a hospital’s license. An event involving poor quality of care, such as that which leads to the serious injury or death of a patient, may also result in loss of license or certification. Prime continues certain litigation against the Service Employees International Union (“SEIU”) relating to allegations that SEIU and other defendants conspired to drive Prime out of certain markets, primarily by lobbying for governmental action relating to alleged fraudulent billing practices. Prime has addressed these fraudulent billing practice allegations publicly and has provided clinical and other data to us refuting these allegations. Prime has also informed us that SEIU regularly attempts to organize certain Prime employees. Prime has also disclosed a complaint filed against it by the U.S. Department of Justice relating to alleged improper admitting practices. Prime has addressed this complaint publicly and denied the allegations.
The failure of any tenant to comply with such laws, requirements, and regulations resulting in a loss of its license would affect its ability to continue its operation of the facility and would adversely affect the tenant’s ability to make lease and/or principal and interest payments to us. This, in turn, could have a material adverse effect on our financial condition and results of operations and could negatively affect our ability to make distributions to our stockholders. In instances where we have an equity investment in our tenants’ operations, in addition to the effects on these tenants’ ability to meet their financial obligations to us, our ownership and investment interests would be negatively impacted.
In addition, establishment of healthcare facilities and transfers of operations of healthcare facilities are subject to regulatory approvals not required for establishment, or transfers, of other types of commercial operations and real estate including, but not limited to, state certificate of need laws. Restrictions and delays in transferring the operations of healthcare facilities, in obtaining new third-party payor contracts, including Medicare and Medicaid provider agreements, and in receiving licensure and certification approval from appropriate state and federal agencies by new tenants, may affect our ability to terminate lease agreements, remove tenants that violate lease terms, and replace existing tenants with new tenants. Furthermore, these matters may affect a new tenant’s ability to obtain reimbursement for services rendered, which could adversely affect their ability to pay rent to us and/or to pay principal and interest on their loans from us. In instances where we have an equity investment in our tenants’ operations, in addition to the effect on these tenants’ ability to meet their financial obligations to us, our ownership and investment interests may also be negatively impacted.
32
Table of Contents
Index to Financial Statements
Our tenants are subject to fraud and abuse laws, the violation of which by a tenant may jeopardize the tenant’s ability to make payments to us and adversely affect their profitability.
As noted earlier, the federal government and numerous state governments have passed laws and regulations that attempt to eliminate healthcare fraud and abuse by prohibiting business arrangements that induce patient referrals or the ordering of specific ancillary services. In addition, federal and state governments continue to investigate and conduct enforcement activity to detect and eliminate fraud and abuse in the Medicare and Medicaid programs. It is anticipated that the trend toward increased investigation and enforcement activity in the areas of fraud and abuse and patient self-referrals will continue in future years. Violations of these laws may result in the imposition of criminal and civil penalties, including possible exclusion from federal and state healthcare programs. Imposition of any of these penalties upon any of our tenants could jeopardize a tenant’s ability to operate a facility or to make lease and/or loan payments, thereby potentially adversely affecting us. In instances where we have an equity investment in our tenants’ operations, in addition to the effect on the tenants’ ability to meet their financial obligations to us, our ownership and investment interests may also be negatively impacted.
Some of our tenants have accepted, and prospective tenants may accept, an assignment of the previous operator’s Medicare provider agreement. Such operators and other new-operator tenants that take assignment of Medicare provider agreements might be subject to liability for federal or state regulatory, civil, and criminal investigations of the previous owner’s operations and claims submissions. While we conduct due diligence in connection with the acquisition of such facilities, these types of issues may not be discovered prior to purchase. Adverse decisions, fines, or recoupments might negatively impact our tenants’ financial condition, and in turn their ability to make lease and/or loan payments to us. In instances where we have an equity investment in our tenants’ operations, in addition to the effect on these tenants’ ability to meet their financial obligations to us, our ownership and investment interests may also be negatively impacted.
Certain of our lease arrangements may be subject to fraud and abuse or physician self-referral laws.
Although no such investment exists today, physician investment in our operating partnership or our subsidiaries that own our facilities could subject our lease arrangements to scrutiny under fraud and abuse and physician self-referral laws. Under the Stark Law, and its implementing regulations, if our lease arrangements do not satisfy the requirements of an applicable exception, the ability of our tenants to bill for services provided to Medicare beneficiaries pursuant to referrals from physician investors could be adversely impacted and subject us and our tenants to fines, which could impact our tenants’ ability to make lease and loan payments to us. In instances where we have an equity investment in our tenants’ operations, in addition to the effect on the tenants’ ability to meet their financial obligations to us, our ownership and investment interests may also be negatively impacted.
We intend to use our good faith efforts to structure our lease arrangements to comply with these laws; however, if we are unable to do so, this failure may restrict our ability to permit physician investment or, where such physicians do participate, may restrict the types of lease arrangements into which we may enter, including our ability to enter into percentage rent arrangements.
We may be required to incur substantial renovation costs to make certain of our healthcare properties suitable for other operators and tenants.
Healthcare facilities are typically highly customized and may not be easily adapted to non-healthcare-related uses. The improvements generally required to conform a property to healthcare use can be costly and at times tenant-specific. A new or replacement operator or tenant may require different features in a property, depending on that operator’s or tenant’s particular business. If a current operator or tenant is unable to pay rent and/or vacates a property, we may incur substantial expenditures to modify a property before we are able to secure another operator or tenant. Also, if the property needs to be renovated to accommodate multiple operators or tenants, we may incur substantial expenditures before we are able to re-lease the space. These expenditures or renovations may have a material adverse effect on our business, results of operations, and financial condition.
33
Table of Contents
Index to Financial Statements
State certificate of need laws may adversely affect our development of facilities and the operations of our tenants.
Certain healthcare facilities in which we invest may also be subject to state laws which require regulatory approval in the form of a certificate of need prior to the transfer of a healthcare facility or prior to initiation of certain projects, including, but not limited to, the establishment of new or replacement facilities, the addition of beds, the addition or expansion of services and certain capital expenditures. State certificate of need laws are not uniform throughout the U.S., are subject to change, and may delay developments of facilities or acquisitions or certain other transfers of ownership of facilities. We cannot predict the impact of state certificate of need laws on any of the preceding activities or on the operations of our tenants. Certificate of need laws often materially impact the ability of competitors to enter into the marketplace of our facilities. In addition, in limited circumstances, loss of state licensure or certification or closure of a facility could ultimately result in loss of authority to operate the facility and require re-licensure or new certificate of need authorization to re-institute operations. As a result, a portion of the value of the facility may be related to the limitation on new competitors. In the event of a change in the certificate of need laws, this value may markedly change.
RISKS RELATING TO OUR ORGANIZATION AND STRUCTURE
Maryland law and our charter and bylaws contain provisions which may prevent or deter changes in management and third-party acquisition proposals that you may believe to be in your best interest, depress the price of Medical Properties common stock or cause dilution.
Our charter contains ownership limitations that may restrict business combination opportunities, inhibit change of control transactions and reduce the value of our common stock. To qualify as a REIT under the Internal Revenue Code of 1986, as amended, or the Code, no more than 50% in value of our outstanding stock, after taking into account options to acquire stock, may be owned, directly or indirectly, by five or fewer persons during the last half of each taxable year. Our charter generally prohibits direct or indirect ownership by any person of more than 9.8% in value or in number, whichever is more restrictive, of outstanding shares of any class or series of our securities, including our common stock. Generally, our common stock owned by affiliated owners will be aggregated for purposes of the ownership limitation. The ownership limitation could have the effect of delaying, deterring or preventing a change in control or other transaction in which holders of common stock might receive a premium for their common stock over the then-current market price or which such holders otherwise might believe to be in their best interests. The ownership limitation provisions also may make our common stock an unsuitable investment vehicle for any person seeking to obtain, either alone or with others as a group, ownership of more than 9.8% of either the value or number of the outstanding shares of our common stock.
Our charter and bylaws contain provisions that may impede third-party acquisition proposals that may be in the best interests of our stockholders. Our charter and bylaws also provide that our directors may only be removed by the affirmative vote of the holders of two-thirds of our common stock, that stockholders are required to give us advance notice of director nominations and new business to be conducted at our annual meetings of stockholders and that special meetings of stockholders can only be called by our president, our board of directors or the holders of at least 25% of stock entitled to vote at the meetings. These and other charter and bylaw provisions may delay or prevent a change of control or other transaction in which holders of our common stock might receive a premium for their common stock over the then-current market price or which such holders otherwise might believe to be in their best interests.
Our UPREIT structure may result in conflicts of interest between our stockholders and the holders of our operating partnership units.
We are organized as an umbrella partnership real estate investment trust, “UPREIT”, which means that we hold our assets and conduct substantially all of our operations through an operating limited partnership, and may issue operating partnership units to employees and/or third parties. Persons holding operating partnership units
34
Table of Contents
Index to Financial Statements
would have the right to vote on certain amendments to the partnership agreement of our operating partnership, as well as on certain other matters. Persons holding these voting rights may exercise them in a manner that conflicts with the interests of our stockholders. Circumstances may arise in the future, such as the sale or refinancing of one of our facilities, when the interests of limited partners in our operating partnership conflict with the interests of our stockholders. As the sole member of the general partner of the operating partnership, we have fiduciary duties to the limited partners of the operating partnership that may conflict with fiduciary duties that our officers and directors owe to its stockholders. These conflicts may result in decisions that are not in the best interest of our stockholders.
We rely on information technology in our operations, and any material failure, inadequacy, interruption or security failure of that technology could harm our business.
We rely on information technology networks and systems, including the Internet, to process, transmit and store electronic information, and to manage or support a variety of business processes, including financial transactions and records, and maintaining personal identifying information and tenant and lease data. We purchase or license some of our information technology from vendors, on whom our systems depend. We rely on commercially available systems, software, tools and monitoring to provide security for the processing, transmission and storage of confidential tenant data. Although we have taken steps to protect the security of our information systems and the data maintained in those systems, it is possible that our safety and security measures will not prevent the systems’ improper functioning or the improper access or disclosure of our or our tenant’s information such as in the event of cyber-attacks. Security breaches, including physical or electronic break-ins, computer viruses, attacks by hackers and similar breaches, can create system disruptions, shutdowns or unauthorized disclosure of confidential information. The risk of security breaches has generally increased as the number, intensity and sophistication of attacks have increased. In some cases, it may be difficult to anticipate or immediately detect such incidents and the damage they cause. Any failure to maintain proper function, security and availability of our information systems could interrupt our operations, damage our reputation, subject us to liability claims or regulatory penalties and could have a materially adverse effect on our business, financial condition and results of operations.
Changes in accounting pronouncements could adversely affect our operating results, in addition to the reported financial performance of our tenants.
Uncertainties posed by various initiatives of accounting standard-setting by the Financial Accounting Standards Board (“FASB”) and the Securities and Exchange Commission (“SEC”), which create and interpret applicable accounting standards for U.S. companies, may change the financial accounting and reporting standards or their interpretation and application of these standards that govern the preparation of our financial statements. Proposed changes include, but are not limited to, changes in lease accounting, revenue recognition and the adoption of accounting standards likely to require the increased use of “fair-value” measures.
These changes could have a material impact on our reported financial condition and results of operations. In some cases, we could be required to apply a new or revised standard retroactively, resulting in potentially material restatements of prior period financial statements. Similarly, these changes could have a material impact on our tenants’ reported financial condition or results of operations or could affect our tenants’ preferences regarding leasing real estate.
TAX RISKS ASSOCIATED WITH OUR STATUS AS A REIT
Loss of our tax status as a REIT would have significant adverse consequences to us and the value of our common stock.
We believe that we qualify as a REIT for federal income tax purposes and have elected to be taxed as a REIT under the federal income tax laws commencing with our taxable year that began on April 6, 2004, and
35
Table of Contents
Index to Financial Statements
ended on December 31, 2004. The REIT qualification requirements are extremely complex, and interpretations of the federal income tax laws governing qualification as a REIT are limited. Accordingly, there is no assurance that we will be successful in operating so as to qualify as a REIT. At any time, new laws, regulations, interpretations or court decisions may change the federal tax laws relating to, or the federal income tax consequences of, qualification as a REIT. It is possible that future economic, market, legal, tax or other considerations may cause our board of directors to revoke the REIT election, which it may do without stockholder approval.
If we lose or revoke our REIT status, we will face serious tax consequences that will substantially reduce the funds available for distribution because:
| • | we would not be allowed a deduction for distributions to stockholders in computing our taxable income; therefore, we would be subject to federal income tax at regular corporate rates, and we might need to borrow money or sell assets in order to pay any such tax; |
| • | we also could be subject to the federal alternative minimum tax and possibly increased state and local taxes; and |
| • | unless we are entitled to relief under statutory provisions, we also would be disqualified from taxation as a REIT for the four taxable years following the year during which we ceased to qualify. |
As a result of all these factors, a failure to achieve or a loss or revocation of our REIT status could have a material adverse effect on our financial condition and results of operations and would adversely affect the value of our common stock.
Failure to make required distributions would subject us to tax.
In order to qualify as a REIT, each year we must distribute to our stockholders at least 90% of our REIT taxable income, excluding net capital gains. To the extent that we satisfy the distribution requirement, but distribute less than 100% of our taxable income, we will be subject to federal corporate income tax on our undistributed income. In addition, we will incur a 4% nondeductible excise tax on the amount, if any, by which our distributions in any year are less than the sum of (1) 85% of our ordinary income for that year; (2) 95% of our capital gain net income for that year; and (3) 100% of our undistributed taxable income from prior years.
We may be required to make distributions to stockholders at disadvantageous times or when we do not have funds readily available for distribution. Differences in timing between the recognition of income and the related cash receipts or the effect of required debt amortization payments could require us to borrow money or sell assets to pay out enough of our taxable income to satisfy the distribution requirement and to avoid corporate income tax and the 4% excise tax in a particular year. In the future, we may borrow to pay distributions to our stockholders and the limited partners of our operating partnership. Any funds that we borrow would subject us to interest rate and other market risks.
Complying with REIT requirements may cause us to forego otherwise attractive opportunities.
To qualify as a REIT for U.S. federal income tax purposes, we must continually satisfy tests concerning, among other things, the sources of our income, the nature and diversification of our assets, the amounts we distribute to our stockholders and the ownership of our stock. In order to meet these tests, we may be required to forego attractive business or investment opportunities. Currently, no more than 25% of the value of our assets may consist of securities of one or more TRSs and no more than 25% of the value of our assets may consist of securities that are not qualifying assets under the test requiring that 75% of a REIT’s assets consist of real estate and other related assets. In addition, at least 75% of our gross income must be generated from either rents from real estate or interest on loans secured by real estate (i.e. mortgage loans). Further, a TRS may not directly or indirectly operate or manage a healthcare facility. For purposes of this definition a “healthcare facility” means a hospital, nursing facility, assisted living facility, congregate care facility, qualified continuing care facility, or
36
Table of Contents
Index to Financial Statements
other licensed facility which extends medical or nursing or ancillary services to patients and which is operated by a service provider that is eligible for participation in the Medicare program under Title XVIII of the Social Security Act with respect to the facility. Compliance with current and future changes to REIT requirements may limit our flexibility in executing our business plan.
If certain sale-leaseback transactions are not characterized by the Internal Revenue Service (“IRS”) as “true leases,” we may be subject to adverse tax consequences.
We have purchased certain properties and leased them back to the sellers of such properties, and we may enter into similar transactions in the future. We intend for any such sale-leaseback transaction to be structured in a manner that the lease will be characterized as a “true lease,” thereby allowing us to be treated as the owner of the property for U.S. federal income tax purposes. However, depending on the terms of any specific transaction, the IRS might take the position that the transaction is not a “true lease” but is more properly treated in some other manner. In the event any sale-leaseback transaction is challenged and successfully re-characterized, we might fail to satisfy the REIT asset tests or income test and, consequently could lose our REIT status effective with the year of re-characterizations.
Transactions with TRSs may be subject to excise tax.
We have historically entered into lease and other transactions with our TRSs and their subsidiaries and expect to continue to do so in the future. Under applicable rules, transactions such as leases between our TRSs and their parent REIT that are not conducted on a market terms basis may be subject to a 100% excise tax. While we believe that all of our transactions with our TRSs are at arm’s length, imposition of a 100% excise tax could have a material adverse effect on our financial condition and results of operations and could adversely affect the trading price of our common stock.
Loans to our tenants could be characterized as equity, in which case our income from that tenant might not be qualifying income under the REIT rules and we could lose our REIT status.
In connection with the acquisition in 2004 of certain Vibra Healthcare, LLC (“Vibra”) facilities, one of our TRSs made a loan to Vibra to acquire the operations at those Vibra facilities. The acquisition loan bore interest at an annual rate of 10.25%. Our operating partnership loaned the funds to the TRS to make this loan. The loan from our operating partnership to the TRS bore interest at an annual rate of 9.25%.
Like the Vibra loan discussed above, our TRSs have made and will make loans to tenants in our facilities to acquire operations or for working capital purposes. The IRS may take the position that certain loans to tenants should be treated as equity interests rather than debt, and that our interest income from such tenant should not be treated as qualifying income for purposes of the REIT gross income tests. If the IRS were to successfully treat a loan to a particular tenant as equity interests, the tenant would be a “related party tenant” with respect to our company and the rent that we receive from the tenant would not be qualifying income for purposes of the REIT gross income tests. As a result, we could be in jeopardy of failing the 75% income test discussed above, which if we did would cause us to lose our REIT status. In addition, if the IRS were to successfully treat a particular loan as interests held by our operating partnership rather than by our TRSs, we could fail the 5% asset test, and if the IRS further successfully treated the loan as other than straight debt, we could fail the 10% asset test with respect to such interest. As a result of the failure of either test, we could lose our REIT status, which would subject us to corporate level income tax and adversely affect our ability to make distributions to our stockholders.
Certain property transfers may generate prohibited transaction income, resulting in a penalty tax on gain attributable to the transaction.
From time to time, we may transfer or otherwise dispose of some of our properties, including by contributing properties to our co-investment ventures. Under the Code, any gain resulting from transfers of
37
Table of Contents
Index to Financial Statements
properties we hold as inventory or primarily for sale to customers in the ordinary course of business is treated as income from a prohibited transaction subject to a 100% penalty tax. We do not believe that our transfers or disposals of property or our contributions of properties into our co-investment ventures are prohibited transactions. However, whether property is held for investment purposes is a question of fact that depends on all the facts and circumstances surrounding the particular transaction. The IRS may contend that certain transfers or dispositions of properties by us or contributions of properties into our co-investment ventures are prohibited transactions. While we believe that the IRS would not prevail in any such dispute, if the Code were to argue successfully that a transfer, disposition or contribution of property constituted a prohibited transaction, we would be required to pay a 100% penalty tax on any gain allocable to us from the prohibited transaction. In addition, income from a prohibited transaction might adversely affect our ability to satisfy the income tests for qualification as a REIT.
Changes in U.S. or foreign tax laws, regulations, including changes to tax rates, may adversely affect our results of operations.
We are headquartered in the U.S. with subsidiaries and investments globally and are subject to income taxes in these jurisdictions. Significant judgment is required in determining our provision for income taxes. Although we believe that we have adequately assessed and accounted for our potential tax liabilities, and that our tax estimates are reasonable, there can be no assurance that additional taxes will not be due upon audit of our tax returns or as a result of changes to applicable tax laws. The U.S. government (particularly with the recent presidential election coupled with a Republican-controlled Congress) as well as the governments of many of the countries in which we operate (such as Germany, the United Kingdom, and Luxembourg, which is where our Europe entities are domiciled) are actively discussing changes to the corporate recognition and taxation of worldwide income. The nature and timing of any changes to each jurisdiction’s tax laws and the impact on our future tax liabilities both in the U.S. and abroad cannot be predicted with any accuracy but could materially and adversely impact our results of operations and cash flows.
Dividends payable by REITs do not qualify for the reduced tax rates available for some dividends.
Income from “qualified dividends” payable to U.S. stockholders that are individuals, trusts and estates are generally subject to tax at preferential rates. Dividends payable by REITs, however, generally are not eligible for the preferential tax rates applicable to qualified dividend income. Although these rules do not adversely affect the taxation of REITs or dividends payable by REITs, to the extent that the preferential rates continue to apply to regular corporate qualified dividends, investors who are individuals, trusts and estates may perceive investments in REITs to be relatively less attractive than investments in the stocks of non-REIT corporations that pay dividends, which could materially and adversely affect the value of the shares of REITs, including the per share trading price of our capital stock.
| ITEM 1B. | Unresolved Staff Comments |
None.
38
Table of Contents
Index to Financial Statements
| ITEM 2. | Properties |
At December 31, 2016, our portfolio consisted of 231 properties: 213 facilities (of the 219 facilities that we owned) were in operation and leased to 30 operators, 12 assets were in the form of first mortgage loans to four operators, and six properties were under construction. Our owned facilities consisted of 125 general acute care hospitals, 75 inpatient rehabilitation hospitals, 16 LTACHs, and three medical office buildings. The 12 non-owned facilities consisted of eight general acute care facilities, three inpatient rehabilitation hospitals, and one LTACH.
| Total Properties |
Total 2016 Revenue |
Total Assets (A) |
||||||||||
| (Dollars in thousands) | ||||||||||||
| United States: |
||||||||||||
| Alabama |
2 | $ | 763 | $ | 8,614 | |||||||
| Arizona |
13 | 23,798 | 286,847 | (B) | ||||||||
| Arkansas |
1 | 14,457 | 90,335 | (F) | ||||||||
| California |
13 | 66,197 | 542,889 | |||||||||
| Colorado |
13 | 12,684 | 100,298 | |||||||||
| Connecticut |
— | 90 | 1,500 | (D) | ||||||||
| Florida |
1 | 2,250 | 25,810 | |||||||||
| Idaho |
4 | 12,581 | 103,059 | |||||||||
| Indiana |
2 | 4,806 | 52,003 | |||||||||
| Kansas |
3 | 11,177 | 98,356 | |||||||||
| Louisiana |
5 | 11,124 | 128,687 | (E) | ||||||||
| Massachusetts |
9 | 26,098 | 1,250,000 | |||||||||
| Michigan |
2 | 4,367 | 40,743 | |||||||||
| Missouri |
4 | 19,621 | 210,921 | |||||||||
| Montana |
1 | 2,589 | 21,821 | |||||||||
| Nevada |
1 | 9,949 | 84,601 | |||||||||
| New Jersey |
8 | 39,084 | 417,436 | |||||||||
| New Mexico |
2 | 6,027 | 55,960 | |||||||||
| Ohio |
2 | 1,936 | 20,388 | (B) | ||||||||
| Oklahoma |
1 | 12,283 | 58,743 | (F) | ||||||||
| Oregon |
2 | 15,146 | 133,503 | |||||||||
| Pennsylvania |
1 | 4,492 | 38,204 | |||||||||
| South Carolina |
6 | 15,618 | 172,996 | |||||||||
| Texas |
58 | 96,992 | 877,315 | (B)(C)(E) | ||||||||
| Utah |
3 | 9,943 | 107,151 | |||||||||
| Virginia |
1 | 1,072 | 10,915 | |||||||||
| Washington |
1 | 5,942 | 103,168 | |||||||||
| West Virginia |
1 | 2,756 | 23,792 | |||||||||
| Wisconsin |
1 | 2,936 | 29,062 | |||||||||
| Wyoming |
1 | 2,754 | 23,229 | |||||||||
| Other Assets |
— | — | 27,623 | |||||||||
|
|
|
|
|
|
|
|||||||
| Total United States |
162 | $ | 439,532 | $ | 5,145,969 | |||||||
| International: |
||||||||||||
| Germany |
59 | $ | 97,382 | $ | 1,098,002 | |||||||
| United Kingdom |
1 | 3,871 | 34,861 | |||||||||
| Italy |
8 | — | 89,511 | (G) | ||||||||
| Spain |
1 | 352 | 18,800 | |||||||||
| Other Assets |
— | — | 31,393 | |||||||||
|
|
|
|
|
|
|
|||||||
| Total International |
69 | $ | 101,605 | $ | 1,272,567 | |||||||
|
|
|
|
|
|
|
|||||||
| Total |
231 | $ | 541,137 | $ | 6,418,536 | |||||||
|
|
|
|
|
|
|
|||||||
39
Table of Contents
Index to Financial Statements
| (A) | Represents total assets at December 31, 2016. |
| (B) | Includes development projects still under construction at December 31, 2016. |
| (C) | Includes our Twelve Oaks facility that is 55% occupied. Our total gross investment in the facility is $63 million. |
| (D) | We do not own any property in this state as of December 31, 2016; however, we hold a $1.5 million note related to a property disposed of in 2015. |
| (E) | Includes revenue in the amount of $10.9 million related to properties that were disposed during 2016. |
| (F) | Includes revenue in the amount of $7.3 million related to mortgage loans repaid during 2016. |
| (G) | Includes our equity investment in eight facilities that is included in other assets on the balance sheet at December 31, 2016. |
| Type of Property (includes properties subject to leases and mortgage loans) |
Number of Properties |
Number of Square Feet |
Number of Licensed Beds(C) |
|||||||||
| General Acute Care Hospitals(A) |
136 | 20,216,265 | 11,646 | |||||||||
| Inpatient Rehabilitation Hospitals(B) |
78 | 8,831,567 | 12,018 | |||||||||
| Long-Term Acute Care Hospitals |
17 | 1,002,664 | 1,043 | |||||||||
|
|
|
|
|
|
|
|||||||
| 231 | 30,050,496 | 24,707 | ||||||||||
|
|
|
|
|
|
|
|||||||
| (A) | One of our general acute care hospitals, currently under development, with 387,500 square feet and 183 beds, is located in Spain. One of our general acute care hospitals, with 69,965 square feet and 28 beds, is located in the United Kingdom. Eight of our general acute care hospitals, with 822,000 square feet and 807 beds, are located in Italy. Two of our general acute care hospitals, with 238,732 square feet and 233 beds, are located in Germany. |
| (B) | 57 of our rehabilitation facilities, with 7.8 million square feet and 11,097 beds, are located in Germany. |
| (C) | Excludes our six facilities that are under development. |
The following table shows lease and mortgage loan expirations, for the next 10 years and thereafter, assuming that none of the tenants/borrowers exercise any of their renewal options (dollars in thousands):
| Total Lease and Mortgage Loan Portfolio(2) |
Total Leases/Mortgage Loans |
Base Rent/ Interest(1) |
% of Total Base Rent/Interest |
Total Square Footage |
Total Licensed Beds |
|||||||||||||||
| 2017 |
— | $ | — | — | — | — | ||||||||||||||
| 2018 |
1 | 2,016 | 0.4 | % | 66,459 | 62 | ||||||||||||||
| 2019 |
2 | 5,017 | 0.9 | % | 307,706 | 306 | ||||||||||||||
| 2020 |
5 | 10,662 | 1.9 | % | 1,205,908 | 590 | ||||||||||||||
| 2021 |
3 | 13,125 | 2.3 | % | 422,679 | 338 | ||||||||||||||
| 2022 |
15 | 72,532 | 12.9 | % | 3,543,907 | 2,571 | ||||||||||||||
| 2023 |
4 | 12,630 | 2.2 | % | 912,652 | 851 | ||||||||||||||
| 2024 |
1 | 2,237 | 0.4 | % | 183,545 | 204 | ||||||||||||||
| 2025 |
7 | 21,927 | 3.9 | % | 1,293,953 | 812 | ||||||||||||||
| 2026 |
5 | 24,598 | 4.4 | % | 969,349 | 892 | ||||||||||||||
| Thereafter |
188 | 396,662 | 70.7 | % | 21,050,715 | 19,453 | ||||||||||||||
|
|
|
|
|
|
|
|
|
|
|
|||||||||||
| Total |
231 | $ | 561,406 | 100.0 | % | 29,956,873 | 26,079 | |||||||||||||
|
|
|
|
|
|
|
|
|
|
|
|||||||||||
| (1) | The most recent monthly base rent and mortgage loan interest annualized. This does not include tenant recoveries, additional rents and other lease/loan-related adjustments to revenue (i.e., straight-line rents and deferred revenues). |
| (2) | Excludes six of our facilities that are under development, our Twelve Oaks facility that is not fully occupied, and the nine properties that we own through joint venture arrangements. In addition, the schedule |
40
Table of Contents
Index to Financial Statements
| reflects post December 31, 2016 transactions and commitments, including the acquisition of two RCCH facilities and the remaining 14 facilities in Germany — see Note 8 to Item 8 of the Annual Report on Form 10-K for details of our commitments at December 31, 2016. |
| ITEM 3. | Legal Proceedings |
From time to time, there are various legal proceedings pending to which we are a party or to which some of our properties are subject to arising in the normal course of business. At this time, we do not believe that the ultimate resolution of these proceedings will have a material adverse effect on our consolidated financial position or results of operations.
| ITEM 4. | Mine Safety Disclosures |
None.
41
Table of Contents
Index to Financial Statements
| ITEM 5. | Market for Registrant’s Common Equity, Related Stockholder Matters, and Issuer Purchases of Equity Securities |
(a) Medical Properties’ common stock is traded on the New York Stock Exchange under the symbol “MPW.” The following table sets forth the high and low sales prices for the common stock for the periods indicated, as reported by the New York Stock Exchange Composite Tape, and the dividends per share declared by us with respect to each such period.
| High | Low | Dividends | ||||||||||
| Year ended December 31, 2016 |
||||||||||||
| First Quarter |
$ | 13.29 | $ | 9.61 | $ | 0.22 | ||||||
| Second Quarter |
15.50 | 12.61 | 0.23 | |||||||||
| Third Quarter |
15.92 | 13.64 | 0.23 | |||||||||
| Fourth Quarter |
15.04 | 11.54 | 0.23 | |||||||||
| Year ended December 31, 2015 |
||||||||||||
| First Quarter |
$ | 15.62 | $ | 13.81 | $ | 0.22 | ||||||
| Second Quarter |
15.42 | 13.04 | 0.22 | |||||||||
| Third Quarter |
13.98 | 10.79 | 0.22 | |||||||||
| Fourth Quarter |
12.21 | 10.59 | 0.22 | |||||||||
On February 24, 2017, the closing price for our common stock, as reported on the New York Stock Exchange, was $13.36 per share. As of February 24, 2017, there were 75 holders of record of our common stock. This figure does not reflect the beneficial ownership of shares held in nominee name.
To qualify as a REIT, we must distribute at least 90% of our REIT taxable income, excluding net capital gain, as dividends to our stockholders. If dividends are declared in a quarter, those dividends will be paid during the subsequent quarter. We expect to continue the policy of distributing our taxable income through regular cash dividends on a quarterly basis, although there is no assurance as to future dividends because they depend on future earnings, capital requirements, and our financial condition. In addition, our Credit Facility limits the amounts of dividends we can pay — see Note 4 of Item 8 of this Annual Report on Form 10-K for more information.
Recent Sales of Unregistered Securities
As previously disclosed, we issued an aggregate of 10.3 shares of common stock in a private placement on October 7, 2016, in connection with our acquisition of the Steward portfolio, for total proceeds of $150 million. The shares were issued pursuant to a Stock Purchase Agreement between us and an affiliate of Cerberus Capital Management (“Cerberus”), the controlling member of Steward. Prior to issuance, Cerberus assigned a portion of its rights to acquire the shares under the Stock Purchase Agreement to certain members of the management of Steward. The private placement was conducted in reliance on the exemption from registration provided by Section 4(a)(2) of the Securities Act.
(b) Not applicable.
(c) None.
42
Table of Contents
Index to Financial Statements
The following graph provides comparison of cumulative total stockholder return for the period from December 31, 2011 through December 31, 2016, among us, the Russell 2000 Index, NAREIT All Equity REIT Index, and SNL US REIT Healthcare Index. The stock performance graph assumes an investment of $100 in us and the three indices, and the reinvestment of dividends. The historical information below is not indicative of future performance.
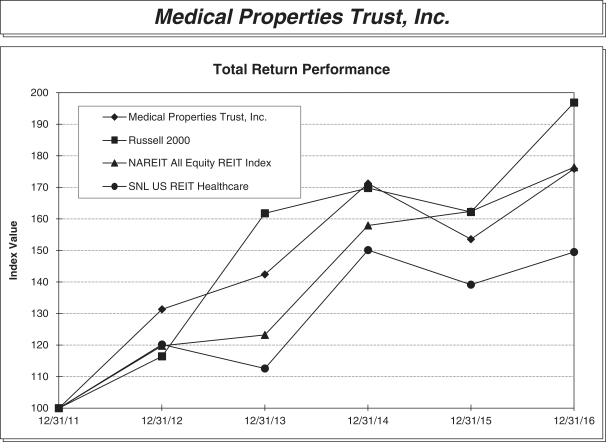
| Period Ending | ||||||||||||||||||||||||
| Index |
12/31/11 | 12/31/12 | 12/31/13 | 12/31/14 | 12/31/15 | 12/31/16 | ||||||||||||||||||
| Medical Properties Trust, Inc. |
100.00 | 131.19 | 142.19 | 170.84 | 153.28 | 175.50 | ||||||||||||||||||
| Russell 2000 |
100.00 | 116.35 | 161.52 | 169.43 | 161.95 | 196.45 | ||||||||||||||||||
| NAREIT All Equity REIT Index |
100.00 | 119.70 | 123.12 | 157.63 | 162.08 | 176.07 | ||||||||||||||||||
| SNL US REIT Healthcare |
100.00 | 120.06 | 112.53 | 149.86 | 138.96 | 149.27 | ||||||||||||||||||
The graph and accompanying text shall not be deemed incorporated by reference by any general statement incorporating by reference this Annual Report on Form 10-K into any filing under the Securities Act of 1933, as amended, or under the Securities Exchange Act of 1934, as amended.
43
Table of Contents
Index to Financial Statements
| ITEM 6. | Selected Financial Data |
The following tables set forth are selected consolidated financial and operating data for Medical Properties Trust, Inc. and MPT Operating Partnership, L.P. and their respective subsidiaries. You should read the following selected financial data in conjunction with the consolidated historical financial statements and notes thereto of each of Medical Properties Trust, Inc. and MPT Operating Partnership, L.P. and their respective subsidiaries included in Item 8, in this Annual Report on Form 10-K, along with “Management’s Discussion and Analysis of Financial Condition and Results of Operations” included in Item 7, in this Annual Report on Form 10-K.
Medical Properties Trust, Inc.
The consolidated operating data and balance sheets have been derived from our audited consolidated financial statements. As of December 31, 2016, Medical Properties Trust, Inc. had a 99.9% equity ownership interest in the Operating Partnership. Medical Properties Trust, Inc. has no significant operations other than as the sole member of its wholly owned subsidiary, Medical Properties Trust, LLC, which is the sole general partner of the Operating Partnership, and no material assets, other than its direct and indirect investment in the Operating Partnership.
| 2016(1) | 2015(1) | 2014(1) | 2013(1) | 2012(1) | ||||||||||||||||
| (In thousands except per share data) | ||||||||||||||||||||
| OPERATING DATA |
||||||||||||||||||||
| Total revenue |
$ | 541,137 | $ | 441,878 | $ | 312,532 | $ | 242,523 | $ | 198,125 | ||||||||||
| Real estate depreciation and amortization (expense) |
(94,374 | ) | (69,867 | ) | (53,938 | ) | (36,978 | ) | (32,815 | ) | ||||||||||
| Property-related and general and administrative (expenses) |
(51,623 | ) | (47,431 | ) | (39,125 | ) | (32,513 | ) | (30,039 | ) | ||||||||||
| Acquisition expenses(2) |
(46,273 | ) | (61,342 | ) | (26,389 | ) | (19,494 | ) | (5,420 | ) | ||||||||||
| Impairment (charge) |
(7,229 | ) | — | (50,128 | ) | — | — | |||||||||||||
| Gain on sale of real estate and other asset dispositions, net |
61,224 | 3,268 | 2,857 | 7,659 | 16,369 | |||||||||||||||
| Interest and other (expense) income |
(1,618 | ) | 175 | 5,183 | (4,424 | ) | (15,088 | ) | ||||||||||||
| Unutilized financing fees/ debt refinancing costs |
(22,539 | ) | (4,367 | ) | (1,698 | ) | — | — | ||||||||||||
| Interest (expense) |
(159,597 | ) | (120,884 | ) | (98,156 | ) | (66,746 | ) | (58,243 | ) | ||||||||||
| Income tax benefit (expense)(3) |
6,830 | (1,503 | ) | (340 | ) | (726 | ) | (19 | ) | |||||||||||
|
|
|
|
|
|
|
|
|
|
|
|||||||||||
| Income from continuing operations |
225,938 | 139,927 | 50,798 | 89,301 | 72,870 | |||||||||||||||
| Income (loss) from discontinued operations |
(1 | ) | — | (2 | ) | 7,914 | 17,207 | |||||||||||||
|
|
|
|
|
|
|
|
|
|
|
|||||||||||
| Net income |
225,937 | 139,927 | 50,796 | 97,215 | 90,077 | |||||||||||||||
| Net income attributable to non-controlling interests |
(889 | ) | (329 | ) | (274 | ) | (224 | ) | (177 | ) | ||||||||||
|
|
|
|
|
|
|
|
|
|
|
|||||||||||
| Net income attributable to MPT common stockholders |
$ | 225,048 | $ | 139,598 | $ | 50,522 | $ | 96,991 | $ | 89,900 | ||||||||||
|
|
|
|
|
|
|
|
|
|
|
|||||||||||
| Income from continuing operations attributable to MPT common stockholders per diluted share |
$ | 0.86 | $ | 0.63 | $ | 0.29 | $ | 0.58 | $ | 0.54 | ||||||||||
| Income from discontinued operations attributable to MPT common stockholders per diluted share |
— | — | — | 0.05 | 0.13 | |||||||||||||||
|
|
|
|
|
|
|
|
|
|
|
|||||||||||
| Net income attributable to MPT common stockholders per diluted share |
$ | 0.86 | $ | 0.63 | $ | 0.29 | $ | 0.63 | $ | 0.67 | ||||||||||
|
|
|
|
|
|
|
|
|
|
|
|||||||||||
| Weighted average number of common shares — diluted |
261,072 | 218,304 | 170,540 | 152,598 | 132,333 | |||||||||||||||
| OTHER DATA |
||||||||||||||||||||
| Dividends declared per common share |
$ | 0.91 | $ | 0.88 | $ | 0.84 | $ | 0.81 | $ | 0.80 | ||||||||||
44
Table of Contents
Index to Financial Statements
| December 31, | ||||||||||||||||||||
| 2016(1) | 2015(1) | 2014(1) | 2013(1) | 2012(1) | ||||||||||||||||
| (In thousands) | ||||||||||||||||||||
| BALANCE SHEET DATA |
||||||||||||||||||||
| Real estate assets — at cost |
$ | 4,965,968 | $ | 3,924,701 | $ | 2,612,291 | $ | 2,296,479 | $ | 1,591,189 | ||||||||||
| Real estate accumulated depreciation/amortization |
(325,125 | ) | (257,928 | ) | (202,627 | ) | (159,776 | ) | (122,796 | ) | ||||||||||
| Mortgage and other loans |
1,216,121 | 1,422,403 | 970,761 | 549,746 | 527,893 | |||||||||||||||
| Cash and equivalents |
83,240 | 195,541 | 144,541 | 45,979 | 37,311 | |||||||||||||||
| Other assets |
478,332 | 324,634 | 195,364 | 147,915 | 128,393 | |||||||||||||||
|
|
|
|
|
|
|
|
|
|
|
|||||||||||
| Total assets |
$ | 6,418,536 | $ | 5,609,351 | $ | 3,720,330 | $ | 2,880,343 | $ | 2,161,990 | ||||||||||
|
|
|
|
|
|
|
|
|
|
|
|||||||||||
| Debt, net |
$ | 2,909,341 | $ | 3,322,541 | $ | 2,174,648 | $ | 1,397,329 | $ | 1,008,264 | ||||||||||
| Other liabilities |
255,967 | 179,545 | 163,635 | 138,806 | 103,912 | |||||||||||||||
| Total Medical Properties Trust, Inc. Stockholders’ Equity |
3,248,378 | 2,102,268 | 1,382,047 | 1,344,208 | 1,049,814 | |||||||||||||||
| Non-controlling interests |
4,850 | 4,997 | — | — | — | |||||||||||||||
|
|
|
|
|
|
|
|
|
|
|
|||||||||||
| Total equity |
3,253,228 | 2,107,265 | 1,382,047 | 1,344,208 | 1,049,814 | |||||||||||||||
|
|
|
|
|
|
|
|
|
|
|
|||||||||||
| Total liabilities and equity |
$ | 6,418,536 | $ | 5,609,351 | $ | 3,720,330 | $ | 2,880,343 | $ | 2,161,990 | ||||||||||
|
|
|
|
|
|
|
|
|
|
|
|||||||||||
| (1) | Cash paid for acquisitions and other related investments totaled $1.5 billion, $1.8 billion, $767.7 million, $654.9 million, and $621.5 million in 2016, 2015, 2014, 2013, and 2012, respectively. The results of operations resulting from these investments are reflected in our consolidated financial statements from the dates invested. See Note 3 in Item 8 of this Annual Report on Form 10-K for further information on acquisitions of real estate, new loans, and other investments. We funded these investments generally from issuing common stock, utilizing additional amounts of our revolving facility, incurring additional debt, or from the sale of facilities. See Notes 4, 9, and 3, in Item 8 on this Annual Report on Form 10-K for further information regarding our debt, common stock and property disposals, respectively. |
| (2) | Includes $30.1 million, $37.0 million, $5.8 million and $12.0 million in transfer and capital gains taxes in 2016, 2015, 2014 and 2013, respectively, related to our property acquisitions in foreign jurisdictions. |
| (3) | Includes $9.1 million tax benefit generated from the reversal of foreign valuation allowances and acquisition expenses incurred by certain international subsidiaries in 2016. |
45
Table of Contents
Index to Financial Statements
MPT Operating Partnership, L.P.
The consolidated operating data and balance sheets presented below have been derived from the Operating Partnership’s audited consolidated financial statements.
| 2016(4) | 2015(4) | 2014(4) | 2013(4) | 2012(4) | ||||||||||||||||
| (In thousands except per unit data) | ||||||||||||||||||||
| OPERATING DATA |
||||||||||||||||||||
| Total revenue |
$ | 541,137 | $ | 441,878 | $ | 312,532 | $ | 242,523 | $ | 198,125 | ||||||||||
| Real estate depreciation and amortization (expense) |
(94,374 | ) | (69,867 | ) | (53,938 | ) | (36,978 | ) | (32,815 | ) | ||||||||||
| Property-related and general and administrative (expenses) |
(51,623 | ) | (47,431 | ) | (39,125 | ) | (32,513 | ) | (30,039 | ) | ||||||||||
| Acquisition expenses(5) |
(46,273 | ) | (61,342 | ) | (26,389 | ) | (19,494 | ) | (5,420 | ) | ||||||||||
| Impairment (charge) |
(7,229 | ) | — | (50,128 | ) | — | — | |||||||||||||
| Gain on sale of real estate and other asset dispositions, net |
61,224 | 3,268 | 2,857 | 7,659 | 16,369 | |||||||||||||||
| Interest and other (expense) income |
(1,618 | ) | 175 | 5,183 | (4,424 | ) | (15,088 | ) | ||||||||||||
| Unutilized financing fees/ debt refinancing costs |
(22,539 | ) | (4,367 | ) | (1,698 | ) | — | — | ||||||||||||
| Interest (expense) |
(159,597 | ) | (120,884 | ) | (98,156 | ) | (66,746 | ) | (58,243 | ) | ||||||||||
| Income tax benefit (expense)(6) |
6,830 | (1,503 | ) | (340 | ) | (726 | ) | (19 | ) | |||||||||||
|
|
|
|
|
|
|
|
|
|
|
|||||||||||
| Income from continuing operations |
225,938 | 139,927 | 50,798 | 89,301 | 72,870 | |||||||||||||||
| Income (loss) from discontinued operations |
(1 | ) | — | (2 | ) | 7,914 | 17,207 | |||||||||||||
|
|
|
|
|
|
|
|
|
|
|
|||||||||||
| Net income |
225,937 | 139,927 | 50,796 | 97,215 | 90,077 | |||||||||||||||
| Net income attributable to non-controlling interests |
(889 | ) | (329 | ) | (274 | ) | (224 | ) | (177 | ) | ||||||||||
|
|
|
|
|
|
|
|
|
|
|
|||||||||||
| Net income attributable to MPT Operating Partnership, L.P. partners |
$ | 225,048 | $ | 139,598 | $ | 50,522 | $ | 96,991 | $ | 89,900 | ||||||||||
|
|
|
|
|
|
|
|
|
|
|
|||||||||||
| Income from continuing operations attributable to MPT Operating Partnership, L.P. partners per diluted unit |
$ | 0.86 | $ | 0.63 | $ | 0.29 | $ | 0.58 | $ | 0.54 | ||||||||||
| Income from discontinued operations attributable to MPT Operating Partnership, L.P. partners per diluted unit |
— | — | — | 0.05 | 0.13 | |||||||||||||||
|
|
|
|
|
|
|
|
|
|
|
|||||||||||
| Net income, attributable to MPT Operating Partnership, L.P. partners per diluted unit |
$ | 0.86 | $ | 0.63 | $ | 0.29 | $ | 0.63 | $ | 0.67 | ||||||||||
|
|
|
|
|
|
|
|
|
|
|
|||||||||||
| Weighted average number of units — diluted |
261,072 | 218,304 | 170,540 | 152,598 | 132,333 | |||||||||||||||
| OTHER DATA |
||||||||||||||||||||
| Dividends declared per unit |
$ | 0.91 | $ | 0.88 | $ | 0.84 | $ | 0.81 | $ | 0.80 | ||||||||||
46
Table of Contents
Index to Financial Statements
| December 31, | ||||||||||||||||||||
| 2016(4) | 2015(4) | 2014(4) | 2013(4) | 2012(4) | ||||||||||||||||
| (In thousands) | ||||||||||||||||||||
| BALANCE SHEET DATA |
||||||||||||||||||||
| Real estate assets — at cost |
$ | 4,965,968 | $ | 3,924,701 | $ | 2,612,291 | $ | 2,296,479 | $ | 1,591,189 | ||||||||||
| Real estate accumulated depreciation/amortization |
(325,125 | ) | (257,928 | ) | (202,627 | ) | (159,776 | ) | (122,796 | ) | ||||||||||
| Mortgage and other loans |
1,216,121 | 1,422,403 | 970,761 | 549,746 | 527,893 | |||||||||||||||
| Cash and equivalents |
83,240 | 195,541 | 144,541 | 45,979 | 37,311 | |||||||||||||||
| Other assets |
478,332 | 324,634 | 195,364 | 147,915 | 128,393 | |||||||||||||||
|
|
|
|
|
|
|
|
|
|
|
|||||||||||
| Total assets |
$ | 6,418,536 | $ | 5,609,351 | $ | 3,720,330 | $ | 2,880,343 | $ | 2,161,990 | ||||||||||
|
|
|
|
|
|
|
|
|
|
|
|||||||||||
| Debt, net |
$ | 2,909,341 | $ | 3,322,541 | $ | 2,174,648 | $ | 1,397,329 | $ | 1,008,264 | ||||||||||
| Other liabilities |
255,577 | 179,155 | 163,245 | 138,416 | 103,522 | |||||||||||||||
| Total MPT Operating Partnership, L.P. capital |
3,248,768 | 2,102,658 | 1,382,437 | 1,344,598 | 1,050,204 | |||||||||||||||
| Non-controlling interests |
4,850 | 4,997 | — | — | — | |||||||||||||||
|
|
|
|
|
|
|
|
|
|
|
|||||||||||
| Total capital |
3,253,618 | 2,107,655 | 1,382,437 | 1,344,598 | 1,050,204 | |||||||||||||||
|
|
|
|
|
|
|
|
|
|
|
|||||||||||
| Total liabilities and capital |
$ | 6,418,536 | $ | 5,609,351 | $ | 3,720,330 | $ | 2,880,343 | $ | 2,161,990 | ||||||||||
|
|
|
|
|
|
|
|
|
|
|
|||||||||||
| (4) | Cash paid for acquisitions and other related investments totaled $1.5 billion, $1.8 billion, $767.7 million, $654.9 million, and $621.5 million in 2016, 2015, 2014, 2013, and 2012, respectively. The results of operations resulting from these investments are reflected in our consolidated financial statements from the dates invested. See Note 3 in Item 8 of this Annual Report on Form 10-K for further information on acquisitions of real estate, new loans, and other investments. We funded these investments generally from issuing units, utilizing additional amounts of our revolving facility, incurring additional debt, or from the sale of facilities. See Notes 4, 9, and 3, in Item 8 on this Annual Report on Form 10-K for further information regarding our debt, partners’ capital and property disposals, respectively. |
| (5) | Includes $30.1 million, $37.0 million, $5.8 million and $12.0 million in transfer and capital gains taxes in 2016, 2015, 2014 and 2013, respectively, related to our property acquisitions in foreign jurisdictions. |
| (6) | Includes $9.1 million tax benefit generated from the reversal of foreign valuation allowances and acquisition expenses incurred by certain international subsidiaries in 2016. |
47
Table of Contents
Index to Financial Statements
| ITEM 7. | Management’s Discussion and Analysis of Financial Condition and Results of Operations |
Unless otherwise indicated, references to “our,” “we” and “us” in this management’s discussion and analysis of financial condition and results of operations refer to Medical Properties Trust, Inc. and its consolidated subsidiaries, including MPT Operating Partnership, L.P.
Overview
We were incorporated in Maryland on August 27, 2003, primarily for the purpose of investing in and owning net-leased healthcare facilities. We also make real estate mortgage loans and other loans to our tenants. We conduct our business operations in one segment. We have healthcare investments in the U.S. and Europe. We have operated as a REIT since April 6, 2004, and accordingly, elected REIT status upon the filing of our calendar year 2004 U.S. federal income tax return. Our existing tenants are, and our prospective tenants will generally be, healthcare operating companies and other healthcare providers that use substantial real estate assets in their operations. We offer financing for these operators’ real estate through 100% lease and mortgage financing and generally seek lease and loan terms on a long-term basis ranging from 10 to 15 years with a series of shorter renewal terms at the option of our tenants and borrowers. We also have included and intend to include in our lease and loan agreements annual contractual minimum rate increases. Our existing portfolio’s minimum escalators range from 0.5% to 5%, while a limited number of our properties do not have an escalator. Most of our leases and loans also include rate increases based on the general rate of inflation if greater than the minimum contractual increases. In addition to rent or mortgage interest, our leases and loans typically require our tenants to pay all operating costs and expenses associated with the facility. Some leases also may require our tenants to pay percentage rents, which are based on the tenant’s revenues from their operations. Finally, we may acquire a profits or other equity interest in our tenants that gives us a right to share in the tenant’s income or loss.
We selectively make loans to certain of our operators through our TRSs, which the operators use for acquisitions and working capital. We consider our lending business an important element of our overall business strategy for two primary reasons: (1) it provides opportunities to make income-earning investments that yield attractive risk-adjusted returns in an industry in which our management has expertise, and (2) by making debt capital available to certain qualified operators, we believe we create for our company a competitive advantage over other buyers of, and financing sources for, healthcare facilities.
At December 31, 2016, our portfolio consisted of 231 properties leased or loaned to 30 operators, of which six are under development and 12 are in the form of mortgage loans.
2016 Highlights
In 2016, we invested or committed to invest approximately $1.8 billion in healthcare real estate assets. These significant investments enhanced the size and quality of our healthcare portfolio, while improving our tenant concentration and expanding our geographic footprint in the U.S. Furthermore, we strategically sold assets for proceeds totaling more than $800 million, refinanced $1 billion of debt, and sold 82.7 million shares generating proceeds of approximately $1.2 billion in order to strengthen our balance sheet, reduce leverage, and fund acquisitions.
A summary of our 2016 highlights is as follows:
| • | Acquired real estate assets (or committed to acquire real estate assets), entered into development agreements, entered into leases and made new loan investments, totaling more than $1.8 billion as noted below: |
| • | Acquired a portfolio of five acute care hospitals and completed mortgage financing on four acute care hospitals in Massachusetts and invested in a minority equity contribution in Steward for an aggregate investment of $1.25 billion; |
| • | Acquired 12 inpatient rehabilitation hospitals in Germany for a combined purchase price of €85.2 million and committed €174.6 million to acquire 14 additional inpatient rehabilitation hospitals. These facilities are leased or will be leased to MEDIAN or its affiliates; |
48
Table of Contents
Index to Financial Statements
| • | Acquired an acute care hospital in Newark, New Jersey, from Prime for an aggregate purchase price of $63.0 million and committed to advance an additional $30 million to Prime over a three-year period to be used solely for capital additions to the real estate; any such addition will be added to the basis upon which the lessee will pay us rents; |
| • | Closed on the final MEDIAN property, as part of the initial MEDIAN transaction, for a purchase price of €41.6 million. See “2015 Activity” for a description of the initial MEDIAN Transaction; |
| • | Completed the sale leaseback transaction with Prime converting our existing mortgage loan on three general acute care hospitals and one free-standing emergency department in New Jersey to real estate, for an aggregate investment of $115 million; |
| • | Completed the sale leaseback transaction converting the remaining $93.3 million RCCH acquisition loan on the Olympia, Washington property to real estate, including funding an additional $7 million; and |
| • | Committed to purchase two acute care hospitals in Washington and Idaho for an aggregate purchase price of $105 million, which will be leased to RCCH. |
After these new investments, our largest tenant made up 17.5% of our gross assets as of December 31, 2016, slightly down from 17.6% as of December 31, 2015.
| • | Sold investments in real estate and equity interests and received payments in full on loans for proceeds of more than $800 million as noted below: |
| • | Completed the Capella Healthcare, Inc. (“Capella”) Disposal Transaction (as fully described in Note 3 to Item 8 of this Annual Report on Form 10-K) in which we sold our equity investment, received $395 million to settle outstanding acquisition loans and received $210 million in prepayment of two mortgage loans for hospitals in Russellville, Arkansas and Lawton, Oklahoma, resulting in net proceeds of approximately $600 million; |
| • | Sold the real estate of five properties (three of which were in Texas and two in Louisiana), received payment in full for outstanding loans, and recovered our investment in operations for proceeds of $71 million, resulting in a net gain of approximately $15 million; |
| • | Sold the real estate of a long-term acute care facility in Corinth, Texas, for proceeds of $28 million; and |
| • | Sold the real estate of three inpatient rehabilitation hospitals located in Texas, for proceeds of $111.5 million, resulting in a net gain of approximately $45 million. |
| • | Refinanced $1 billion of debt and sold 82.7 million shares generating proceeds of approximately $1.2 billion: |
| • | Completed a $500 million senior unsecured notes offering in February 2016 and used the proceeds to reduce our outstanding balance on our revolving credit facility; |
| • | Completed a $500 million senior unsecured notes offering in July 2016 and used the proceeds to redeem our $450 million 6.875% Senior Unsecured Notes due 2021; |
| • | Sold the remaining 14.9 million shares under our January 2014 at-the-market equity offering program resulting in net proceeds of approximately $224 million; |
| • | Completed an underwritten public offering of 57.5 million shares of our common stock, resulting in net proceeds of $799.5 million, after deducting estimated offering expenses; and |
| • | Sold 10.3 million shares of common stock in a private placement, generating total proceeds of $150 million. |
With these transactions, our net debt to gross assets at December 31, 2016, improved to 43.1% versus 56.6% at December 31, 2015.
49
Table of Contents
Index to Financial Statements
2015 Highlights
In 2015, we invested or committed to invest approximately $1.8 billion in healthcare real estate assets. These significant investments greatly strengthened our portfolio through geographic, tenant and property type diversification. We expanded total assets by 51%, increased revenues by 41%, and lowered our general and administrative expense as a percentage of revenue to less than 10%.
A summary of our 2015 highlights is as follows:
| • | Acquired (or committed to acquire) real estate assets, entered into development agreements, entered into leases and made new loan investments, totaling more than $1.8 billion as noted below: |
| • | Acquired the original Capella hospital portfolio (now RCCH) including seven acute care hospitals throughout the U.S. and obtained a stake in their operations for a combined total of approximately $900 million. Also, acquired an eighth facility (Kershaw) for $35 million later in the year. |
| • | Completed the sale-leaseback transaction (step 2 of the initial transaction in 2014) of 31 MEDIAN facilities in Germany for an aggregate purchase price of €646 million; |
| • | Initiated long term relationship with AXA Real Estate Investment Managers to co-invest with AXA-advised accounts for the acquisition of acute care hospitals in Spain and Italy via a joint venture arrangement; |
| • | Executed a $19 million agreement to develop an inpatient rehabilitation hospital in Toledo, Ohio, acquired an inpatient rehabilitation facility and a long-term acute care hospital in Lubbock, Texas for an aggregate purchase price of $31.5 million, and acquired an inpatient rehabilitation hospital in Weslaco, Texas for $10.7 million all leased to Ernest; |
| • | Completed $30 million mortgage financing to Prime for a general acute care hospital in Port Huron, Michigan and subsequently converted a portion of the loan to real estate for $20 million, which reduced the mortgage loan accordingly; |
| • | Provided $100 million mortgage financing to Prime for three general acute care hospitals and one free-standing emergency department in New Jersey and acquired two general acute care hospitals in the Kansas City area for $110 million; |
| • | Acquired a 266-bed outpatient rehabilitation clinic located in Hannover, Germany from MEDIAN for €18.7 million; |
| • | Executed an additional $250 million agreement with Adeptus Health for the development of acute care hospitals and free-standing emergency departments; and |
| • | Completed construction and began recording rental income on 17 acute care facilities in Texas, Arizona, and Colorado with Adeptus Health totaling approximately $102.6 million and an acute care facility and a medical office building in Birmingham, Alabama with UAB Medical West totaling $8.6 million. |
| • | Sold the real estate of a long-term acute care facility in Luling, Texas, and real estate of six wellness centers in the U.S. for a net gain; and |
| • | Increased our senior Credit Facility to $1.95 billion comprised of a $1.3 billion senior unsecured revolving credit facility and a $250 million senior unsecured term loan facility along with a $400 million accordion feature, issued €500 million of unsecured notes, and raised $817 million in equity to fund the acquisition activity mentioned above. |
2014 Highlights
In 2014, we invested or committed to invest approximately $1.4 billion in healthcare real estate assets. These significant investments greatly strengthened our portfolio through geographic, tenant and property type diversification.
50
Table of Contents
Index to Financial Statements
A summary of our 2014 highlights is as follows:
| • | Acquired (or committed to acquire) real estate assets, entered into development agreements, entered into leases and made new loan investments, totaling more than $1.4 billion as noted below: |
| • | Completed Step 1 of the two step acquisition of 32 MEDIAN facilities for €688 million by loaning €425 million to Waterland Private Equity Fund VC.V.(“Waterland”) and MEDIAN; |
| • | Completed the acquisition of three MEDIAN (formally RHM) facilities located in Germany for a transaction valued at approximately €64 million incurring approximately €3 million of transfer and other taxes that have been expensed as acquisition costs; |
| • | Acquired an acute care hospital in Fairmont, West Virginia for an aggregate purchase price of $15 million from Alecto Healthcare Services (“Alecto”), made a $5 million working capital loan to the tenant and a commitment to fund up to $5 million in capital improvements; |
| • | Acquired an acute care hospital in Sherman, Texas for an aggregate purchase price of $32.5 million from Alecto and funded a $7.5 million working capital loan to the tenant; |
| • | Entered the United Kingdom healthcare market by acquiring an acute care hospital in Peasedown St. John, United Kingdom from Circle Health Ltd., through its subsidiary Circle Hospital (Bath) Ltd. valued at approximately £28.3 million incurring approximately £1.1 million of transfer and other taxes that have been expensed as acquisition costs; |
| • | Acquired a general acute care hospital and an adjacent parcel of land for an aggregate purchase price of $115 million from a joint venture of LHP Hospital Group, Inc. and Hackensack University Medical Center Mountainside; |
| • | Executed an additional $150 million agreement with Adeptus Health for the development of acute care hospitals and free-standing emergency departments; and |
| • | Completed construction and began recording rental income on the following facilities: |
| • | Northern Utah Rehabilitation Hospital — $19 million inpatient rehabilitation facility located in South Ogden, Utah leased to Ernest; |
| • | Oakleaf Surgical Hospital — $30.5 million acute care facility located in Altoona, Wisconsin leased to National Surgical Hospitals; and |
| • | Adeptus Health — Completed 17 acute care facilities totaling approximately $80.3 million. |
| • | Sold the real estate of La Palma Community Hospital to Prime recognizing a gain on sale of $2.9 million; |
| • | Sold the real estate of our Bucks facility pursuant to a purchase option, resulting in a $3.1 million impairment charge; |
| • | Restructured our investment in Monroe Hospital by entering into a lease with an affiliate of Prime which had acquired the operations of the facility; |
| • | Completed a $1.15 billion senior unsecured credit facility comprised of a $1.025 billion senior unsecured revolving credit facility and a $125 million senior unsecured term loan facility, issued $300 million of unsecured notes, and raised $138 million in equity to fund the acquisition activity mentioned above; and |
| • | Received investment grade rating on our unsecured debt of BBB- and a corporate credit rating upgrade from Standard & Poor’s Ratings Services to BB+. |
Critical Accounting Policies
In order to prepare financial statements in conformity with generally accepted accounting principles (“GAAP”) in the U.S., we must make estimates about certain types of transactions and account balances. We
51
Table of Contents
Index to Financial Statements
believe that our estimates of the amount and timing of our revenues, credit losses, fair values (either as part of a purchase price allocation, impairment analysis or in valuing certain of our equity investments), periodic depreciation of our real estate assets, and stock compensation expense, along with our assessment as to whether an entity that we do business with should be consolidated with our results, have significant effects on our financial statements. Each of these items involves estimates that require us to make subjective judgments. We rely on our experience, collect historical and current market data, and develop relevant assumptions to arrive at what we believe to be reasonable estimates. Under different conditions or assumptions, materially different amounts could be reported related to the critical accounting policies described below. In addition, application of these critical accounting policies involves the exercise of judgment on the use of assumptions as to future uncertainties and, as a result, actual results could materially differ from these estimates. See Note 2 to Item 8 of this Annual Report on Form 10-K for more information regarding our critical accounting policies and recent accounting developments. Our accounting estimates include the following:
Revenue Recognition: We receive income from operating leases based on the fixed, minimum required rents (base rents) per the lease agreements. Rent revenue from base rents is recorded on the straight-line method over the terms of the related lease agreements for new leases and the remaining terms of existing leases for those acquired as part of a property acquisition. The straight-line method records the periodic average amount of base rent earned over the term of a lease, taking into account contractual rent adjustments over the lease term. The straight-line method typically has the effect of recording more rent revenue from a lease than a tenant is required to pay early in the term of the lease. During the later parts of a lease term, this effect reverses with less rent revenue recorded than a tenant is required to pay. Rent revenue, as recorded on the straight-line method, in the consolidated statements of income is presented as two amounts: rent billed revenue and straight-line revenue. Rent billed revenue is the amount of base rent actually billed to the customer each period as required by the lease. Straight-line rent revenue is the difference between rent revenue earned based on the straight-line method and the amount recorded as rent billed revenue. We record the difference between base rent revenues earned and amounts due per the respective lease agreements, as applicable, as an increase or decrease to straight-line rent receivable.
Certain leases may provide for additional rents contingent upon a percentage of the tenant’s revenues in excess of specified base amount/threshold (percentage rents). Percentage rents are recognized in the period in which revenue thresholds are met. Rental payments received prior to their recognition as income are classified as deferred revenue. We also receive additional rent (contingent rent) under some leases based on increases in the CPI or where the CPI exceeds the annual minimum percentage increase in the lease. Contingent rents are recorded as rent billed revenue in the period earned.
We use direct financing lease (“DFL”) accounting to record rent on certain leases deemed to be financing leases, per accounting rules, rather than operating leases. For leases accounted for as DFLs, future minimum lease payments are recorded as a receivable. The difference between the future minimum lease payments and the estimated residual values less the cost of the properties is recorded as unearned income. Unearned income is deferred and amortized to income over the lease terms to provide a constant yield when collectability of the lease payments is reasonably assured. Investments in DFLs are presented net of unearned income.
In instances where we have a profits or equity interest in our tenants’ operations, we record income equal to our percentage interest of the tenants’ profits, as defined in the lease or tenants’ operating agreements, once annual thresholds, if any, are met.
We begin recording base rent income from our development projects when the lessee takes physical possession of the facility, which may be different from the stated start date of the lease. Also, during construction of our development projects, we are generally entitled to accrue rent based on the cost paid during the construction period (construction period rent). We accrue construction period rent as a receivable with a corresponding offset to deferred revenue during the construction period. When the lessee takes physical possession of the facility, we begin recognizing the deferred construction period revenue on the straight-line method over the remaining term of the lease.
52
Table of Contents
Index to Financial Statements
We receive interest income from our tenants/borrowers on mortgage loans, working capital loans, and other long-term loans. Interest income from these loans is recognized as earned based upon the principal outstanding and terms of the loans.
Commitment fees received from lessee for development and leasing services are initially recorded as deferred revenue and recognized as income over the initial term of a lease to produce a constant effective yield on the lease (interest method). Commitment and origination fees from lending services are also recorded as deferred revenue initially and recognized as income over the life of the loan using the interest method.
Investments in Real Estate: We maintain our investments in real estate at cost, and we capitalize improvements and replacements when they extend the useful life or improve the efficiency of the asset. While our tenants are generally responsible for all operating costs at a facility, to the extent that we incur costs of repairs and maintenance, we expense those costs as incurred. We compute depreciation using the straight-line method over the weighted-average useful life of approximately 38.8 years for buildings and improvements.
When circumstances indicate a possible impairment of the value of our real estate investments, we review the recoverability of the facility’s carrying value. The review of the recoverability is generally based on our estimate of the future undiscounted cash flows, excluding interest charges, from the facility’s use and eventual disposition. Our forecast of these cash flows considers factors such as expected future operating income, market and other applicable trends, and residual value, as well as the effects of leasing demand, competition and other factors. If impairment exists due to the inability to recover the carrying value of a facility on an undiscounted basis, such as was the case with our Monroe and Bucks facilities in 2014, an impairment loss is recorded to the extent that the carrying value exceeds the estimated fair value of the facility. We do not believe that the value of any of our facilities was impaired at December 31, 2016; however, given the highly specialized aspects of our properties no assurance can be given that future impairment charges will not be taken.
Acquired Real Estate Purchase Price Allocation: For existing properties acquired for leasing purposes, we account for such acquisitions based on business combination accounting rules. We allocate the purchase price of acquired properties to net tangible and identified intangible assets acquired based on their fair values. In making estimates of fair values for purposes of allocating purchase prices of acquired real estate, we may utilize a number of sources, including available real estate broker data, independent appraisals that may be obtained in connection with the acquisition or financing of the respective property, internal data from previous acquisitions or developments, and other market data. We also consider information obtained about each property as a result of our pre-acquisition due diligence, marketing and leasing activities in estimating the fair value of the tangible and intangible assets acquired.
We record above-market and below-market in-place lease values, if any, for the facilities we own which are based on the present value of the difference between (i) the contractual amounts to be paid pursuant to the in-place leases and (ii) management’s estimate of fair market lease rates for the corresponding in-place leases, measured over a period equal to the remaining non-cancelable term of the lease. We amortize any resulting capitalized above-market lease values as a reduction of rental income over lease term. We amortize any resulting capitalized below-market lease values as an increase to rental income over the lease term. Because our strategy to a large degree involves the origination and acquisition of long-term lease arrangements at market rates with independent parties, we do not expect the above-market and below-market in-place lease values to be significant for many of our transactions.
We measure the aggregate value of other lease intangible assets to be acquired based on the difference between (i) the property valued with new or in-place leases adjusted to market rental rates and (ii) the property valued as if vacant when acquired. Management’s estimates of value are made using methods similar to those used by independent appraisers (e.g., discounted cash flow analysis). Factors considered by management in our analysis include an estimate of carrying costs during hypothetical expected lease-up periods, considering current market conditions, and costs to execute similar leases. We also consider information obtained about each targeted
53
Table of Contents
Index to Financial Statements
facility as a result of our pre-acquisition due diligence, marketing, and leasing activities in estimating the fair value of the intangible assets acquired. In estimating carrying costs, management includes real estate taxes, insurance and other operating expenses and estimates of lost rentals at market rates during the expected lease-up periods, which we expect to be about six months (based on experience) depending on specific local market conditions. Management also estimates costs to execute similar leases including leasing commissions, legal costs, and other related expenses to the extent that such costs are not already incurred in connection with a new lease origination as part of the transaction.
Other intangible assets acquired may include customer relationship intangible values, which are based on management’s evaluation of the specific characteristics of each prospective tenant’s lease and our overall relationship with that tenant. Characteristics to be considered by management in allocating these values include the nature and extent of our existing business relationships with the tenant, growth prospects for developing new business with the tenant, the tenant’s credit quality, and expectations of lease renewals, including those existing under the terms of the lease agreement, among other factors. At December 31, 2016, we have assigned no value to customer relationship intangibles.
We amortize the value of lease intangibles to expense over the term of the respective leases, which have a weighted average useful life of 17.9 years at December 31, 2016. If a lease is terminated, the unamortized portion of the lease intangible is charged to expense as was the case with our Twelve Oaks property in 2015.
Losses from Rent Receivables: For all leases, we continuously monitor the performance of our existing tenants including, but not limited to: admission levels and surgery/procedure volumes by type; current operating margins; ratio of our tenants’ operating margins both to facility rent and to facility rent plus other fixed costs; trends in revenue and patient mix; and the effect of evolving healthcare regulations on tenants’ profitability and liquidity.
Losses from Operating Lease Receivables: We utilize the information above along with the tenants’ payment and default history in evaluating (on a property-by-property basis) whether or not a provision for losses on outstanding rent receivables is needed. A provision for losses on rent receivables (including straight-line rent receivables) is ultimately recorded when it becomes probable that the receivable will not be collected in full. The provision is an amount which reduces the receivable to its estimated net realizable value based on a determination of the eventual amounts to be collected either from the debtor or from existing collateral, if any.
Losses on DFL Receivables: Allowances are established for DFLs based upon an estimate of probable losses on a property-by-property basis. DFLs are impaired when it is deemed probable that we will be unable to collect all amounts due in accordance with the contractual terms of the lease. Like operating lease receivables, the need for an allowance is based upon our assessment of the lessee’s overall financial condition; economic resources and payment record; the prospects for support from any financially responsible guarantors; and, if appropriate, the realizable value of any collateral. These estimates consider all available evidence including the expected future cash flows discounted at the DFL’s effective interest rate, fair value of collateral, and other relevant factors, as appropriate. DFLs are placed on non-accrual status when we determine that the collectability of contractual amounts is not reasonably assured. If on non-accrual status, we generally account for the DFLs on a cash basis, in which income is recognized only upon receipt of cash.
Loans: Loans consist of mortgage loans, working capital loans and other long-term loans. Mortgage loans are collateralized by interests in real property. Working capital and other long-term loans are generally collateralized by interests in receivables and corporate and individual guarantees. We record loans at cost. We evaluate the collectability of both interest and principal on a loan-by-loan basis (using the same process as we do for assessing the collectability of rents as discussed above) to determine whether they are impaired. A loan is considered impaired when, based on current information and events, it is probable that we will be unable to collect all amounts due according to the existing contractual terms. When a loan is considered to be impaired, the amount of the allowance is calculated by comparing the recorded investment to either the value determined by
54
Table of Contents
Index to Financial Statements
discounting the expected future cash flows using the loans effective interest rate or to the fair value of the collateral, if the loan is collateral dependent.
Stock-Based Compensation: During the years ended December 31, 2016, 2015, and 2014, we recorded $7.9 million, $11.1 million, and $9.2 million, respectively, of expense for share-based compensation related to grants of restricted common stock and other stock-based awards. Starting in 2010, we granted annual performance-based restricted share awards that vest based on the achievement of certain market conditions as defined by the accounting rules. Typical market conditions for our awards are based on our total shareholder return (factoring in stock price appreciation and dividends paid) including comparisons of our total shareholder returns to an index of other REIT stocks. Because these awards are earned based on the achievement of these market conditions, we must initially evaluate and estimate the probability of achieving these market conditions in order to determine the fair value of the award and over what period we should recognize stock compensation expense. Because of the complexities inherently involved with these awards, we work with an independent consultant to assist us in modeling both the value of the award and the various periods over which each tranche of an award will be earned. We use what is termed a Monte Carlo simulation model, which determines a value and earnings periods based on multiple outcomes and their probabilities. We record expense over the expected or derived vesting periods using the calculated value of the awards. We record expense over these vesting periods even though the awards have not yet been earned and, in fact, may never be earned — such as was the case with our 2014 performance awards in which 500,000 shares were forfeited because the related market conditions were not achieved for the period of January 1, 2014 through December 31, 2016. If awards vest faster than our original estimate, we will record a catch-up of expense, which we did in the 2014 and 2013 fourth quarters due to our 2012 and 2011 stock awards being earned earlier than expected.
Fair Value Option Election: We elected to account for certain investments acquired on February 29, 2012, as part of the Ernest transaction, using the fair value option method, which means we mark these investments to fair market value on a recurring basis. Any changes in the fair value of these investments are non-cash adjustments that will not impact our financial condition or cash flows unless we decided to liquidate these investments.
These investments include the following at December 31, 2016 (in thousands):
| Asset (Liability) |
Total Fair Value |
|||
| Mortgage loans |
$ | 112,836 | ||
| Acquisition and other loans |
116,298 | |||
| Equity investment |
3,300 | |||
|
|
|
|||
| Total |
$ | 232,434 | ||
|
|
|
|||
We measure the estimated fair value of most of these investments utilizing Level 2 and 3 of the fair value hierarchy. Under current accounting guidance, Level 3 represents fair value measurements derived from valuation techniques in which one or more significant inputs or significant value drivers are unobservable.
Our mortgage and acquisition loans with Ernest are recorded at fair value based on Level 2 inputs by discounting the estimated cash flows using the market rates which similar loans would be made to borrowers with similar credit ratings and the same remaining maturities. Our equity investment in Ernest is recorded at fair value based on Level 3 inputs, by using a discounted cash flow model, which requires significant estimates of our investee such as projected revenue and expenses and appropriate consideration of the underlying risk profile of the forecasted assumptions associated with the investee. We classify the equity investment as Level 3, as we use certain unobservable inputs to the valuation methodology that are significant to the fair value measurement, and the valuation requires management judgment due to the absence of quoted market prices. For the cash flow model, our observable inputs include use of a capitalization rate, discount rate (which is based on a weighted-
55
Table of Contents
Index to Financial Statements
average cost of capital), and market interest rates, and our unobservable input includes an adjustment for a marketability discount (“DLOM”) on our equity investment of 40% at December 31, 2016.
In regards to the underlying projection of revenues and expenses used in the discounted cash flow model, such projections are provided by Ernest. However, we will modify such projections (including underlying assumptions used) as needed based on our review and analysis of their historical results, meetings with key members of management, and our understanding of trends and developments within the healthcare industry.
In arriving at the DLOM, we started with a DLOM range based on the results of studies supporting valuation discounts for other transactions or structures without a public market. To select the appropriate DLOM within the range, we then considered many qualitative factors including the percent of control, the nature of the underlying investee’s business along with our rights as an investor pursuant to the operating agreement, the size of investment, expected holding period, number of shareholders, access to capital marketplace, etc. To illustrate the effect of movements in the DLOM, we performed a sensitivity analysis below by using basis point variations (dollars in thousands):
| Basis Point Change in Marketability Discount |
Estimated Increase (Decrease) In Fair Value |
|||
| +100 basis points |
$ | (49 | ) | |
| - 100 basis points |
49 | |||
Because the fair value of Ernest investments noted above approximate their original cost, we did not recognize any unrealized gains/losses during 2016.
In 2015, we held an equity investment in Capella (now RCCH) similar to our Ernest equity investment. We accounted for this investment under the fair value option election as well. Similar to Ernest, we recorded no unrealized gain/loss on this investment in 2015 and through April 2016. In April 2016, we sold our Capella equity investment at cost resulting in no recognized gain/loss.
Principles of Consolidation: Property holding entities and other subsidiaries of which we own 100% of the equity or have a controlling financial interest evidenced by ownership of a majority voting interest are consolidated. All inter-company balances and transactions are eliminated. For entities in which we own less than 100% of the equity interest, we consolidate the property if we have the direct or indirect ability to control the entities’ activities based upon the terms of the respective entities’ ownership agreements. For these entities, we record a non-controlling interest representing equity held by non-controlling interests.
We continually evaluate all of our transactions and investments to determine if they represent variable interests in a variable interest entity. If we determine that we have a variable interest in a variable interest entity, we then evaluate if we are the primary beneficiary of the variable interest entity. The evaluation is a qualitative assessment as to whether we have the ability to direct the activities of a variable interest entity that most significantly impact the entity’s economic performance. We consolidate each variable interest entity in which we, by virtue of or transactions with our investments in the entity, are considered to be the primary beneficiary. At December 31, 2016 and 2015, we determined that we were not the primary beneficiary of any of our variable interest entities because we do not control the activities (such as the day-to-day operations of the hospital) that most significantly impact the economic performance of these entities.
56
Table of Contents
Index to Financial Statements
Disclosure of Contractual Obligations
The following table summarizes known material contractual obligations (including interest) as of December 31, 2016, excluding the impact of subsequent events (amounts in thousands):
| Contractual Obligations |
Less Than 1 Year |
1-3 Years | 3-5 Years | After 5 Years |
Total | |||||||||||||||
| 6.375% Senior Unsecured Notes due 2022 |
$ | 22,313 | $ | 44,625 | $ | 44,625 | $ | 361,156 | $ | 472,719 | ||||||||||
| 5.750% Senior Unsecured Notes due 2020(1) |
12,095 | 24,189 | 220,419 | — | 256,703 | |||||||||||||||
| 4.000% Senior Unsecured Notes due 2022(1) |
21,034 | 42,047 | 42,089 | 539,104 | 644,274 | |||||||||||||||
| 5.500% Senior Unsecured Notes due 2024 |
16,500 | 33,000 | 33,000 | 341,250 | 423,750 | |||||||||||||||
| 6.375% Senior Unsecured Notes due 2024 |
31,875 | 63,750 | 63,750 | 579,688 | 739,063 | |||||||||||||||
| 5.250% Senior Unsecured Notes due 2026 |
26,906 | 52,500 | 52,500 | 631,250 | 763,156 | |||||||||||||||
| Revolving credit facility(2) |
10,190 | 294,755 | — | — | 304,945 | |||||||||||||||
| Term loans |
7,117 | 271,617 | — | — | 278,734 | |||||||||||||||
| Operating lease commitments(3) |
7,328 | 14,176 | 12,968 | 251,982 | 286,454 | |||||||||||||||
| Purchase obligations(4) |
464,592 | 43,638 | — | — | 508,230 | |||||||||||||||
|
|
|
|
|
|
|
|
|
|
|
|||||||||||
| Totals |
$ | 619,950 | $ | 884,297 | $ | 469,351 | $ | 2,704,430 | $ | 4,678,028 | ||||||||||
|
|
|
|
|
|
|
|
|
|
|
|||||||||||
| (1) | Our 5.750% Senior Unsecured Notes due 2020 and 4.000% Senior Unsecured Notes due 2022 are euro-denominated. We used the exchange rate at December 31, 2016, (or 1.0517) in preparing this table. |
| (2) | As of December 31, 2016, we have a $1.3 billion revolving credit facility. However, this table assumes the balance outstanding under the revolver and rate in effect at December 31, 2016 (which was $290 million as of December 31, 2016) remains in effect through maturity. |
| (3) | Most of our contractual obligations to make operating lease payments are related to ground leases for which we are reimbursed by our tenants along with corporate office and equipment leases. |
| (4) | Includes approximately $95.5 million of future expenditures related to development projects. |
Off Balance Sheet Arrangements
We own interests in certain unconsolidated joint ventures as described under Note 3 to Item 8 of this Annual Report on Form 10-K. Except in limited circumstances, our risk of loss is limited to our investment in the joint venture and any outstanding receivables. We have no other material off-balance sheet arrangements that we expect would materially affect our liquidity and capital resources except those described above under “Disclosure of Contractual Obligations”.
Liquidity and Capital Resources
2016 Cash Flow Activity
We generated cash of $264.7 million from operating activities during 2016, primarily consisting of rent and interest from mortgage and other loans. We used these operating cash flows along with cash on-hand to fund our dividends of $218.4 million and certain investing activities including the additional funding of our development activities.
In regards to other financing activities in which we used such net proceeds to ultimately fund our approximate $1.5 billion of acquisitions in 2016 and the remainder of our development activities, we did the following:
| a) | On February 22, 2016, we completed a senior unsecured notes offering for $500 million. |
| b) | On March 1, 2016, we updated our at-the-market equity program, which gave us the ability to sell up to $227 million of stock with a commission rate of 1.25%. During 2016, we sold approximately 15 million shares of our common stock under this program, resulting in net proceeds of approximately |
57
Table of Contents
Index to Financial Statements
| $224 million, after deducting expenses of approximately $2.8 million of commissions. We have no capacity to sell additional shares under this at-the-market equity offering program. |
| c) | On April 30, 2016, we closed on the Capella Disposal Transaction (as further discussed in Note 3 to Item 8 of this Annual Report on Form 10-K) resulting in net proceeds of $550 million along with an additional $50 million once we sold our investment in RegionalCare Hospital Partners, Inc. (“RegionalCare”) bonds in June 2016. |
| d) | On May 23, 2016, we sold our investment in five properties leased and operated by Post Acute Medical (“Post Acute”) for $71 million. |
| e) | On June 17, 2016, we sold our investment in one property leased and operated by Corinth Investor Holdings for $28 million. |
| f) | On July 13, 2016, we completed a new $500 million senior unsecured notes offering. We used the net proceeds from this offering to redeem our $450 million 6.875% Senior Unsecured Notes due 2021, which was completed on August 12, 2016. Net proceeds from the notes offering and redemption approximated $19 million, and we incurred a one-time charge of $22.5 million related to the redemption (see Note 4 to Item 8 of this Annual Report on Form 10-K for further details). |
| g) | On July 20, 2016, we sold three facilities leased to HealthSouth Corporation (“HealthSouth”) for $111.5 million. |
| h) | On September 30, 2016, we completed a public offering of 57.5 million shares of our common stock, resulting in net proceeds of $799.5 million, after deducting offering expenses. |
| i) | On October 7, 2016, we sold 10.3 million shares of common stock in a private placement to Cerberus, and certain members of Steward management. We sold these shares at a price per share of $14.50, equal to the public offering price of our September 2016 equity offering, generating total proceeds of $150 million. |
| j) | Subsequent to December 31, 2016, we replaced our credit facility with a new credit facility that includes a $1.3 billion unsecured revolving loan facility, a $200 million unsecured term loan facility, and a €200 million unsecured term loan facility. We plan to use the proceeds of the €200 million unsecured notes along with cash on hand to redeem the 5.750% Senior Unsecured Notes due 2020 in the same principal amounts. On February 2, 2017, we delivered an irrevocable notice of full redemption to the holders of these notes and set a redemption date of March 4, 2017. With the new credit facility and bond redemption, we expect to incur a one-time charge of approximately $13 million in the 2017 first quarter of which $9 million relates to a prepayment penalty. See Note 13 to Item 8 of this Annual Report on Form 10-K for further discussion of the subsequent event activities. |
2015 Cash Flow Activity
We generated cash of $207.0 million from operating activities during 2015, primarily consisting of rent and interest from mortgage and other loans. We used these operating cash flows along with cash on-hand to fund our dividends of $183.0 million and certain investing activities including the additional funding of our development activities.
In regards to other financing activities in which we used such net proceeds to ultimately fund our approximate $1.8 billion of acquisitions in 2015 and the remainder of our development activities, we did the following:
| a) | On August 19, 2015, we completed a public offering of €500 million aggregate principal amount of 4.00% senior unsecured notes. In addition, on September 30, 2015, we entered into an amendment to our amended and restated revolving credit and term loan agreement, dated as of June 19, 2014. The amendment, among other things, increased our revolver availability to $1.3 billion and increased borrowings under our term loan by $125 million. |
58
Table of Contents
Index to Financial Statements
| b) | On August 11, 2015, we completed an underwritten public offering of 28.75 million shares of our common stock, resulting in net proceeds of approximately $337 million, after deducting estimated offering expenses. |
| c) | On January 14, 2015, we completed an underwritten public offering of 34.5 million shares of our common stock, resulting in net proceeds of approximately $480 million, after deducting estimated offering expenses. |
2014 Cash Flow Activity
We generated cash of $150.4 million from operating activities during 2014, primarily consisting of rent and interest from mortgage and other loans, which with cash on-hand, was principally used to fund our dividends of $144.4 million and certain of our investing activities including the additional funding of our development properties.
In regards to other financing activities in which we used such net proceeds to ultimately fund our $767.7 million of acquisitions in 2014 and to fund other investment activities, we did the following:
| a) | On March 11, 2014, we completed an underwritten public offering of 7.7 million shares of our common stock, resulting in net proceeds of approximately $100 million, after deducting estimated offering expenses. We also granted the underwriters a 30-day option to purchase up to an additional 1.2 million shares of common stock. The option, which was exercised in full, closed on April 8, 2014 and resulted in additional net proceeds of approximately $16 million. |
| b) | On April 17, 2014, we completed a $300 million senior unsecured notes offering. |
| c) | On October 17, 2014, we entered into an amendment to our revolving credit and term loan agreement to increase the aggregate committed size of the facility to $1.15 billion with an additional $400 million accordion available increasing the total aggregate capacity to $1.55 billion. The amendment also increased the alternative currency sublimit under the facility to €500 million and amended certain covenants in order to permit us to consummate and finance the MEDIAN transaction. |
| d) | We established an at-the-market equity offering program in January 2014, which gave us the ability to sell up to $250 million in shares. In 2014, we sold 1.7 million shares resulting in net proceeds of $22.6 million. |
Debt Restrictions and Covenants
Our debt facilities impose certain restrictions on us, including, but not limited to, restrictions on our ability to: incur debt; create or incur liens; provide guarantees in respect of obligations of any other entity; make redemptions and repurchases of our capital stock; prepay, redeem or repurchase debt; engage in mergers or consolidations; enter into affiliated transactions; dispose of real estate or other assets; and change our business. In addition, the credit agreement governing our Credit Facility limits the amount of dividends we can pay to 95% of normalized adjusted funds from operations, as defined in the agreements, on a rolling four quarter basis. The indentures governing our senior unsecured notes also limit the amount of dividends we can pay based on the sum of 95% of funds from operations, proceeds of equity issuances and certain other net cash proceeds. Finally, our senior unsecured notes require us to maintain total unencumbered assets (as defined in the related indenture) of not less than 150% of our unsecured indebtedness.
In addition to these restrictions, the Credit Facility contains customary financial and operating covenants, including covenants relating to our total leverage ratio, fixed charge coverage ratio, secured leverage ratio, unsecured leverage ratio, consolidated adjusted net worth, and unsecured interest coverage ratio. This facility also contains customary events of default, including among others, nonpayment of principal or interest, material inaccuracy of representations and failure to comply with our covenants. If an event of default occurs and is continuing under the facility, the entire outstanding balance may become immediately due and payable. At December 31, 2016, we were in compliance with all such financial and operating covenants.
59
Table of Contents
Index to Financial Statements
In order for us to continue to qualify as a REIT we are required to distribute annual dividends equal to a minimum of 90% of our REIT taxable income, computed without regard to the dividends paid deduction and our net capital gains. See section titled “Distribution Policy” within this Item 7 of this Annual Report on Form 10-K for further information on our dividend policy along with the historical dividends paid on a per share basis.
Short-term Liquidity Requirements:
As of February 24, 2017, we have less than $0.4 million in debt principal payments due in 2017 — see debt maturity schedule below. At February 24, 2017, our availability under our revolving credit facility plus cash on-hand (after adjusting for the redemption of the €200 million 5.750% Senior Unsecured Notes due 2020) approximated $1.2 billion. We believe this liquidity and our current monthly cash receipts from rent and loan interest is sufficient to fund our operations, debt and interest obligations, our purchase obligations as disclosed in the “Contractual Obligations” schedule earlier, and dividends in order to comply with REIT requirements for the next twelve months.
Long-term Liquidity Requirements:
As of February 24, 2017, after adjusting for the new credit facility and notes redemption discussed above, we have less than $15 million in debt and principal payment due between now and January 2020. With our liquidity as of February 24, 2017 of approximately $1.2 billion, along with our current monthly cash receipts from rent and loan interest, we believe we have the liquidity available for us to fund our operations, debt and interest obligations, dividends in order to comply with REIT requirements, and our purchase obligations included in the “Contractual Obligations” schedule for the foreseeable future.
However, in order to fund our investment strategies and to fund debt maturities coming due in later years, we believe the following sources of capital are generally available in the market and we may access one or a combination of them:
| • | amending or entering into new bank term loans, |
| • | issuance of new USD or EUR denominated debt securities, including senior unsecured notes, |
| • | placing new secured loans on real estate located in the U.S. and/or Europe, |
| • | entering into joint venture arrangements, |
| • | proceeds from strategic property sales, and/or |
| • | sale of equity securities. |
However, there is no assurance that conditions will be favorable for such possible transactions or that our plans will be successful.
Principal payments due on our debt (which is adjusted for the closing of the February 1, 2017 credit facility and the redemption of the €200 million 5.750% Senior Unsecured Notes due 2020 and exclude the effects of any discounts, premiums, or debt issue costs recorded) are as follows (in thousands):
| 2017 |
$ | 320 | ||
| 2018 |
12,781 | |||
| 2019 |
— | |||
| 2020 |
210,340 | |||
| 2021 |
340,000 | |||
| Thereafter |
2,375,850 | |||
|
|
|
|||
| Total |
$ | 2,939,291 | ||
|
|
|
60
Table of Contents
Index to Financial Statements
Results of Operations
Our operating results may vary significantly from year-to-year due to a variety of reasons including acquisitions made during the year, incremental revenues and expenses from acquisitions made in the prior year, revenues and expenses from completed development properties, property disposals, annual escalation provisions, foreign currency exchange rate changes, new or amended debt agreements, issuances of shares through an equity offering, etc. Thus, our operating results for the current year are not necessarily indicative of the results that may be expected in future years.
Year Ended December 31, 2016 Compared to the Year Ended December 31, 2015
Net income for the year ended December 31, 2016, was $225.0 million compared to net income of $139.6 million for the year ended December 31, 2015. This increase is primarily due to additional revenue generated from our new investments and from completed development projects, $61.2 million of gains on real estate and other disposals, and a $15 million reduction in acquisition expenses, partially offset by higher debt refinancing costs and interest expense in 2016. FFO, after adjusting for certain items (as more fully described in Reconciliation of Non-GAAP Financial Measures), was $334.8 million, or $1.28 per diluted share for 2016 as compared to $274.8 million, or $1.26 per diluted share for 2015, a 2% increase on a per share basis. This increase in FFO per share is primarily due to additional revenue from new investments, partially offset by the loss of income from properties disposed of in 2016, higher interest costs and an increase in the number of shares outstanding during 2016 to fund such new investments.
A comparison of revenues for the years ended December 31, 2016 and 2015 is as follows (dollar amounts in thousands):
| 2016 | 2015 | Change | ||||||||||||||||||
| (Dollar amounts in thousands) | ||||||||||||||||||||
| Rent billed |
$ | 327,269 | 60.5 | % | $ | 247,604 | 56.0 | % | $ | 79,665 | ||||||||||
| Straight-line rent |
41,067 | 7.6 | % | 23,375 | 5.3 | % | 17,692 | |||||||||||||
| Income from direct financing leases |
64,307 | 11.9 | % | 58,715 | 13.3 | % | 5,592 | |||||||||||||
| Interest and fee income |
108,494 | 20.0 | % | 112,184 | 25.4 | % | (3,690 | ) | ||||||||||||
|
|
|
|
|
|
|
|
|
|
|
|||||||||||
| Total revenues |
$ | 541,137 | 100.0 | % | $ | 441,878 | 100.0 | % | $ | 99,259 | ||||||||||
|
|
|
|
|
|
|
|
|
|
|
|||||||||||
Our total revenue for 2016 is up $99.3 million or 22.5% over the prior year. This increase is made up of the following:
| • | Operating lease revenue (including rent billed and straight-line rent) — up $97.4 million over the prior year of which $0.2 million is from our annual escalation provisions in our leases, $69.6 million is from incremental revenue from acquisitions made in 2016 (including $15.0 million related to Steward), $20.2 million is incremental revenue from development properties that were completed and put into service in 2016 and 2015, and $2.1 million is from capital additions at our existing facilities during 2016. The increase is also attributable to $15.0 million earned on our Capella properties after lease reclassification from DFL to operating lease accounting as part of the April 29, 2016 amendments. These increases are partially offset by $10.3 million of lower revenues from the 2016 dispositions. |
| • | Income from direct financing leases — up $5.6 million over the prior year of which $0.8 million is from annual escalation provisions in our leases and $6.7 million is from incremental revenue from acquisitions made in 2016. This increase is also attributable to $0.3 million of incremental revenue on the Capella properties prior to lease reclassification. The increase was partially offset by the $2.6 million write-off of DFL non-cash income in connection with the Capella lease reclassification (see Note 3 to Item 8 of this Annual Report on Form 10-K for details). |
| • | Interest and fee income — down $3.7 million over the prior year, which was attributable to $22.9 million in interest earned in 2015 from loans that were converted to real estate on or before December 31, 2016, |
61
Table of Contents
Index to Financial Statements
| in connection with the MEDIAN Transaction and $1.1 million related to loan pay downs in 2016. The decrease was partially offset by $18.0 million of additional interest from other loans made during 2016, including the Prime mortgage loans, $2.1 million of interest on the Capella mortgage and acquisition loans that were outstanding longer in 2016 than in 2015, and $0.4 million in annual escalation provisions of our loans. |
Real estate depreciation and amortization during 2016 was $94.4 million compared to $69.9 million in 2015 primarily due to the incremental depreciation/amortization from the facilities acquired in 2016 and the development properties completed in 2015 and 2016. In the 2016 second quarter, we accelerated the amortization of the lease intangible asset related to our Corinth facility resulting in $1.1 million of additional expense. This was offset by a similar $1.1 million of expense in 2015 to accelerate the amortization of lease intangible assets associated with Twelve Oaks, Luling, and Healthtrax properties.
Property expenses for 2016 decreased $1.1 million compared to 2015. This decrease is primarily due to the reimbursement of $0.8 million from the tenant of our Twelve Oaks facility for property expenses incurred in previous periods.
Acquisition expenses decreased from $61.3 million in 2015 to $46.3 million in 2016 primarily as a result of $31.7 million in lower real estate transfer taxes associated with our international acquisitions. This decrease was partially offset by $24.8 million of acquisition expenses incurred in 2016 associated with contingent consideration adjustments involving the seller’s capital gains taxes on our MEDIAN transaction in 2015.
General and administrative expenses in 2016 totaled $48.9 million, which is 9.0% of revenues, down from 9.9% of revenues in the prior year. The decline in general and administrative expenses as a percentage of revenues is primarily due to our business model as we can generally increase our revenues significantly without increasing our headcount and related expense at the same rate. On a dollar basis, general and administrative expenses were up $5.3 million from the prior year due to higher international administrative expenses, and to a lesser extent personnel and travel costs, which are up as a result of the growth and expansion of our company.
Interest expense for 2016 and 2015 totaled $159.6 million and $120.9 million, respectively. This increase is related to higher average debt balances in the current year associated with our 4.000% Senior Unsecured Notes due 2022 entered into in August 2015 and our 6.375% Senior Unsecured Notes due 2024 entered into in February 2016 and our expanded credit facility. In addition, we incurred $1.7 million in additional interest expense in 2016 between the time we issued the $500 million 5.250% Senior Unsecured Notes due 2026 in July 2016 and when we were able to redeem the $450 million 6.875% Senior Unsecured Notes due 2021 in August 2016. Our weighted average interest rate was 4.9% for 2016, up from 4.3% in 2015 due to more permanent debt financing in 2016 and higher LIBOR rates. See Note 4 to our consolidated financial statements in Item 8 to this Annual Report on Form 10-K for further information on our debt activities.
During the year ended December 31, 2016, we had various dispositions resulting in a net gain on sale of real estate and other asset dispositions of $61.2 million and impairment charges of $7.2 million (see Note 3 to Item 8 of this Annual Report on Form 10-K for further details).
Earnings from our equity interests declined from $2.8 million of income in the 2015 to a loss of $1.1 million in 2016. The loss in 2016 includes approximately $5.4 million of one-time acquisition expenses, representing our share of such expenses incurred by our Italian joint venture to acquire its eight hospital properties. Excluding these acquisition expenses, our earnings from our equity interest would have been $4.3 million, an increase over 2015 due to $3.4 million of income from our Italian joint venture (no such income was recorded in 2015).
With the redemption of the $450 million in senior unsecured notes, we incurred $22.5 million in debt refinancing charges ($15.5 million of which was a redemption premium) during 2016. During 2015, we incurred $4.4 million of charges primarily related to structuring and underwriting fees associated with the bridge loan entered into as a back stop on financing the original Capella acquisition.
62
Table of Contents
Index to Financial Statements
Income tax expense includes U.S. federal and state income taxes on our TRS entities, as well as non-U.S. income based taxes and withholding taxes on certain investments located in jurisdictions outside the U.S. The provision for income taxes was a benefit of $6.8 million for 2016 compared to expense of $1.5 million for 2015. As discussed in Note 5 to Item 8 of this Annual Report on Form 10-K, the income tax benefit recognized for 2016 was primarily due to acquisition costs associated with our European investments (approximately $5.1 million) and the release of valuation allowances on foreign deferred tax assets of approximately $4 million. The reversal of the valuation allowances on these foreign deferred tax assets is expected to result in higher income tax expense related to our European investments in future periods. We continue to reflect a valuation allowance against our U.S. and certain foreign net deferred tax assets at December 31, 2016.
Year Ended December 31, 2015 Compared to the Year Ended December 31, 2014
Net income for the year ended December 31, 2015, was $139.6 million compared to net income of $50.5 million for the year ended December 31, 2014. This increase is primarily due to additional income generated from our 2015 acquisitions and from completed development projects. In addition, we incurred $50.1 million of impairment charges in 2014 — see Note 3 to Item 8 of this Annual Report on Form 10-K for further details. FFO, after adjusting for certain items (as more fully described in “Reconciliation of Non-GAAP Financial Measures”), was $274.8 million, or $1.26 per diluted share for 2015 as compared to $181.7 million, or $1.06 per diluted share for 2014, a 19% increase on a per share basis. This increase in FFO was primarily due to the increase in revenue from acquisitions and the completion of development projects during 2015.
A comparison of revenues for the years ended December 31, 2015 and 2014 is as follows (dollar amounts in thousands):
| 2015 | 2014 | Change | ||||||||||||||||||
| (Dollar amounts in thousands) | ||||||||||||||||||||
| Rent billed |
$ | 247,604 | 56.0 | % | $ | 187,018 | 59.9 | % | $ | 60,586 | ||||||||||
| Straight-line rent |
23,375 | 5.3 | % | 13,507 | 4.3 | % | 9,868 | |||||||||||||
| Income from direct financing leases |
58,715 | 13.3 | % | 49,155 | 15.7 | % | 9,560 | |||||||||||||
| Interest and fee income |
112,184 | 25.4 | % | 62,852 | 20.1 | % | 49,332 | |||||||||||||
|
|
|
|
|
|
|
|
|
|
|
|||||||||||
| Total revenues |
$ | 441,878 | 100.0 | % | $ | 312,532 | 100.0 | % | $ | 129,346 | ||||||||||
|
|
|
|
|
|
|
|
|
|
|
|||||||||||
Our total revenue for 2015 is up $129.3 million or 41.4% over the prior year. This increase is made up of the following:
| • | Operating lease revenue (including rent billed and straight-line rent) — up $70.5 million over the prior year of which $0.4 million is from our annual escalation provisions in our leases, $69.6 million is from incremental revenue from acquisitions made in 2015, $16.4 million is incremental revenue from development properties that were completed and put into service in 2015, and $2.0 million is net incremental revenue from properties where we changed operators and began recording straight-line rent on the respective leases. This increase is partially offset by $12.7 million attributable to the decline in the euro and a $3.1 million write-off of straight-line rent related to our Luling and Twelve Oaks properties. In addition, approximately $2.7 million of base rents were recorded in 2014 related to our disposed properties but none was recorded in 2015. |
| • | Income from direct financing leases — up $9.6 million over the prior year of which $1.0 million is from annual escalation provisions in our leases and $8.5 million is from incremental revenue from acquisitions made in 2015. |
| • | Interest and fee income — up $49.3 million over the prior period of which $1.8 million is from our annual escalation provisions in our loans and $52.6 million is primarily from new loans, partially offset by $0.1 million due to the repayment of loans in 2015 and $5.0 million attributable to the decline in the euro. |
63
Table of Contents
Index to Financial Statements
Real estate depreciation and amortization during 2015 was $69.9 million compared to $53.9 million in 2014 primarily due to the incremental depreciation/amortization from the facilities acquired in 2015 and the development properties completed in 2014 and 2015. In addition, we accelerated the related lease intangible of our Twelve Oaks, Luling, and Healthtrax properties resulting in an additional $1.1 million of expense in 2015.
During 2014, we recorded a $3.1 million real estate impairment charge on our Bucks facility and a $47.0 million impairment charge on our Monroe facility — see Note 3 to Item 8 of this Annual Report on Form 10-K for further details.
Acquisition expenses increased from $26.4 million in 2014 to $61.3 million in 2015 primarily as a result of the completion of the MEDIAN and Capella acquisitions. Included in the 2015 and 2014 acquisition expenses are $37.0 million and $5.8 million, respectively, of real estate transfer taxes associated with our international properties.
General and administrative expenses in 2015 totaled $43.6 million, which is 9.9% of revenues, down from 11.9% of revenues in the prior year. The decline in general and administrative expenses as a percentage of revenue is primarily due to our business model as we can generally increase our revenue significantly without increasing our headcount and related expense at the same rate. On a dollar basis, general and administrative expenses were up $6.4 million from the prior year due to higher compensation expense, travel and international administrative expenses, which are up as a result of the growth and expansion of our company.
Interest expense for 2015 and 2014 totaled $120.9 million and $98.2 million, respectively. This increase is related to higher average debt balances in the current year associated with our 5.500% Senior Unsecured Notes due 2024 (entered into in April 2014), our 4.000% Senior Unsecured Notes due 2022 and the expansion of our credit facility in 2015. Our weighted average interest rate was 4.3% for 2015, down from 5.4% in 2014, due to the issuance of our 4.000% Senior Unsecured Notes due 2022 and a higher outstanding balance on the revolving credit facility in 2015.
With the expansion of our credit facility in 2015, along with a bridge loan entered into in the 2015 third quarter to fund the Capella transaction, we incurred $4.4 million of unutilized financing fees/debt refinancing costs compared to $1.7 million in 2014.
Gain on sale of real estate increased slightly from 2014 due to the $1.7 million and $1.5 million gains on the Healthrax and Luling property sales in 2015, respectively, compared to the $2.9 million gain on the La Palma property sale in 2014.
Earnings from equity and other interests increased slightly from 2014 due to increased investee earnings, partially offset by lower income from our interest in Bucks as the property was sold in August 2014 — this interest generated about $1 million of income annually.
Other income (expense) was down $5.2 million in 2015 primarily due to $4.9 million of foreign currency transaction gains in 2014.
Income tax expense was $1.5 million for 2015 — up from $0.3 million in 2014, primarily due to the increase in income in certain of our European entities.
Reconciliation of Non-GAAP Financial Measures
Investors and analysts following the real estate industry utilize funds from operations, or FFO, as a supplemental performance measure. FFO, reflecting the assumption that real estate asset values rise or fall with market conditions, principally adjusts for the effects of GAAP depreciation and amortization of real estate assets, which assumes that the value of real estate diminishes predictably over time. We compute FFO in accordance with the definition provided by the National Association of Real Estate Investment Trusts, or NAREIT, which represents net income (loss) (computed in accordance with GAAP), excluding gains (losses) on sales of real estate and impairment charges on real estate assets, plus real estate depreciation and amortization and after adjustments for unconsolidated partnerships and joint ventures.
64
Table of Contents
Index to Financial Statements
In addition to presenting FFO in accordance with the NAREIT definition, we also disclose normalized FFO, which adjusts FFO for items that relate to unanticipated or non-core events or activities or accounting changes that, if not noted, would make comparison to prior period results and market expectations potentially less meaningful to investors and analysts.
We believe that the use of FFO, combined with the required GAAP presentations, improves the understanding of our operating results among investors and the use of normalized FFO makes comparisons of our operating results with prior periods and other companies more meaningful. While FFO and normalized FFO are relevant and widely used supplemental measures of operating and financial performance of REITs, they should not be viewed as a substitute measure of our operating performance since the measures do not reflect either depreciation and amortization costs or the level of capital expenditures and leasing costs necessary to maintain the operating performance of our properties, which can be significant economic costs that could materially impact our results of operations. FFO and normalized FFO should not be considered an alternative to net income (loss) (computed in accordance with GAAP) as indicators of our financial performance or to cash flow from operating activities (computed in accordance with GAAP) as an indicator of our liquidity.
65
Table of Contents
Index to Financial Statements
The following table presents a reconciliation of net income attributable to MPT common stockholders to FFO and normalized FFO for the years ended December 31, 2016, 2015, and 2014 ($ amounts in thousands except per share data):
| For the Year Ended | ||||||||||||
| December 31, 2016 |
December 31, 2015 |
December 31, 2014 |
||||||||||
| FFO information: |
||||||||||||
| Net income attributable to MPT common stockholders |
$ | 225,048 | $ | 139,598 | $ | 50,522 | ||||||
| Participating securities’ share in earnings |
(559 | ) | (1,029 | ) | (895 | ) | ||||||
|
|
|
|
|
|
|
|||||||
| Net income, less participating securities’ share in earnings |
$ | 224,489 | $ | 138,569 | $ | 49,627 | ||||||
| Depreciation and amortization |
96,157 | 69,867 | 53,938 | |||||||||
| Gain on sale of real estate |
(67,168 | ) | (3,268 | ) | (2,857 | ) | ||||||
| Real estate impairment charge |
— | — | 5,974 | |||||||||
|
|
|
|
|
|
|
|||||||
| Funds from operations |
$ | 253,478 | $ | 205,168 | $ | 106,682 | ||||||
| Write-off of straight line rent and other |
3,063 | 3,928 | 2,818 | |||||||||
| Transaction costs from non-real estate dispositions |
5,944 | — | — | |||||||||
| Acquisition expenses, net of tax benefit |
46,529 | 61,342 | 26,389 | |||||||||
| Release of valuation allowance |
(3,956 | ) | — | — | ||||||||
| Impairment charges |
7,229 | — | 44,154 | |||||||||
| Unutilized financing fees/ debt refinancing costs |
22,539 | 4,367 | 1,698 | |||||||||
|
|
|
|
|
|
|
|||||||
| Normalized funds from operations attributable to MPT common stockholders |
$ | 334,826 | $ | 274,805 | $ | 181,741 | ||||||
|
|
|
|
|
|
|
|||||||
| Per diluted share data: |
||||||||||||
| Net income, less participating securities’ share in earnings |
$ | 0.86 | $ | 0.63 | $ | 0.29 | ||||||
| Depreciation and amortization |
0.37 | 0.32 | 0.31 | |||||||||
| Gain on sale of real estate |
(0.26 | ) | (0.01 | ) | (0.01 | ) | ||||||
| Real estate impairment charge |
— | — | 0.04 | |||||||||
|
|
|
|
|
|
|
|||||||
| Funds from operations |
$ | 0.97 | $ | 0.94 | $ | 0.63 | ||||||
| Write-off of straight line rent and other |
0.01 | 0.02 | 0.02 | |||||||||
| Transaction costs from non-real estate dispositions |
0.02 | — | — | |||||||||
| Acquisition expenses, net of tax benefit |
0.18 | 0.28 | 0.15 | |||||||||
| Release of valuation allowance |
(0.02 | ) | — | — | ||||||||
| Impairment charges |
0.03 | — | 0.26 | |||||||||
| Unutilized financing fees/ debt refinancing costs |
0.09 | 0.02 | — | |||||||||
|
|
|
|
|
|
|
|||||||
| Normalized funds from operations attributable to MPT common stockholders |
$ | 1.28 | $ | 1.26 | $ | 1.06 | ||||||
|
|
|
|
|
|
|
|||||||
66
Table of Contents
Index to Financial Statements
Distribution Policy
We have elected to be taxed as a REIT commencing with our taxable year that began on April 6, 2004 and ended on December 31, 2004. To qualify as a REIT, we must meet a number of organizational and operational requirements, including a requirement that we distribute at least 90% of our REIT taxable income, excluding net capital gain, to our stockholders. It is our current intention to comply with these requirements and maintain such status going forward.
The table below is a summary of our distributions declared for the three year period ended December 31, 2016:
| Declaration Date |
Record Date |
Date of Distribution |
Distribution per Share | |||||
| November 10, 2016 |
December 8, 2016 |
January 12, 2017 |
$ | 0.23 | ||||
| August 18, 2016 |
September 15, 2016 |
October 13, 2016 |
$ | 0.23 | ||||
| May 19, 2016 |
June 16, 2016 |
July 14, 2016 |
$ | 0.23 | ||||
| February 19, 2016 |
March 17, 2016 |
April 14, 2016 |
$ | 0.22 | ||||
| November 12, 2015 |
December 10, 2015 |
January 14, 2016 |
$ | 0.22 | ||||
| August 20, 2015 |
September 17, 2015 |
October 15, 2015 |
$ | 0.22 | ||||
| May 14, 2015 |
June 11, 2015 |
July 9, 2015 |
$ | 0.22 | ||||
| February 23, 2015 |
March 12, 2015 |
April 9, 2015 |
$ | 0.22 | ||||
| November 13, 2014 |
December 4, 2014 |
January 8, 2015 |
$ | 0.21 | ||||
| August 21, 2014 |
September 18, 2014 |
October 15, 2014 |
$ | 0.21 | ||||
| May 15, 2014 |
June 12, 2014 |
July 10, 2014 |
$ | 0.21 | ||||
| February 21, 2014 |
March 14, 2014 |
April 11, 2014 |
$ | 0.21 | ||||
On February 16, 2017, we announced that our Board of Directors declared a regular quarterly cash dividend of $0.24 per share of common stock to be paid on April 13, 2017, to stockholders of record on March 16, 2017.
We intend to pay to our stockholders, within the time periods prescribed by the Code, all or substantially all of our annual REIT taxable income, including taxable gains from the sale of real estate and recognized gains on the sale of securities. It is our policy to make sufficient cash distributions to stockholders in order for us to maintain our status as a REIT under the Code and to avoid corporate income and excise taxes on undistributed income. However, our Credit Facility limits the amounts of dividends we can pay — see Note 4 to our consolidated financial statements in Item 8 to this Annual Report on Form 10-K for further information.
67
Table of Contents
Index to Financial Statements
| ITEM 7A. | Quantitative and Qualitative Disclosures about Market Risk |
Market risk includes risks that arise from changes in interest rates, foreign currency exchange rates, commodity prices, equity prices and other market changes that affect market sensitive instruments. We seek to mitigate the effects of fluctuations in interest rates by matching the terms of new investments with new long-term fixed rate borrowings to the extent possible. We may or may not elect to use financial derivative instruments to hedge interest rate or foreign currency exposure. For interest rate hedging, these decisions are principally based on our policy to match our variable rate investments with comparable borrowings, but are also based on the general trend in interest rates at the applicable dates and our perception of the future volatility of interest rates. For foreign currency, these decisions are principally based on how our investments are financed, the long-term nature of our investments, the need to repatriate earnings back to the U.S. and the general trend in foreign currency exchange rates.
In addition, the value of our facilities will be subject to fluctuations based on changes in local and regional economic conditions and changes in the ability of our tenants to generate profits, all of which may affect our ability to refinance our debt if necessary. The changes in the value of our facilities would be impacted also by changes in “cap” rates, which is measured by the current base rent divided by the current market value of a facility.
Our primary exposure to market risks relates to fluctuations in interest rates and foreign currency. The following analyses present the sensitivity of the market value, earnings and cash flows of our significant financial instruments to hypothetical changes in interest rates and exchange rates as if these changes had occurred. The hypothetical changes chosen for these analyses reflect our view of changes that are reasonably possible over a one-year period. These forward looking disclosures are selective in nature and only address the potential impact from these hypothetical changes. They do not include other potential effects which could impact our business as a result of changes in market conditions. In addition, they do not include measures we may take to minimize our exposure such as entering into future interest rate swaps to hedge against interest rate increases on our variable rate debt.
Interest Rate Sensitivity
For fixed rate debt, interest rate changes affect the fair market value but do not impact net income to common stockholders or cash flows. Conversely, for floating rate debt, interest rate changes generally do not affect the fair market value but do impact net income to common stockholders and cash flows, assuming other factors are held constant. At December 31, 2016, our outstanding debt totaled $2.9 billion, which consisted of fixed-rate debt of $2.4 billion and variable rate debt of $0.5 billion. If market interest rates increase by one-percent, the fair value of our debt at December 31, 2016 would decrease by approximately $5.8 million. Changes in the fair value of our fixed rate debt will not have any impact on us unless we decided to repurchase the debt in the open markets.
If market rates of interest on our variable rate debt increase by 1%, the increase in annual interest expense on our variable rate debt would decrease future earnings and cash flows by $0.1 million per year. If market rates of interest on our variable rate debt decrease by 1%, the decrease in interest expense on our variable rate debt would increase future earnings and cash flows by $0.1 million per year. This assumes that the average amount outstanding under our variable rate debt for a year is $0.5 billion, the balance of our revolver and term loan at December 31, 2016.
Foreign Currency Sensitivity
With our investments in Germany, the United Kingdom, Spain, and Italy, we are subject to fluctuations in the euro and British pound to U.S. dollar currency exchange rates. Increases or decreases in the value of the euro to U.S. dollar and the British pound to U.S. dollar exchange rates may impact our financial condition and/or our results of operations. Based solely on operating results for 2016 and on an annualized basis, if the euro exchange rate were to change by 5%, our FFO would change by approximately $3.5 million. Based solely on operating results for 2016 and on an annualized basis, if the British pound exchange rate were to change by 5%, our FFO would change by less than $0.2 million.
68
Table of Contents
Index to Financial Statements
| ITEM 8. | Financial Statements and Supplementary Data |
Report of Independent Registered Public Accounting Firm
To the Board of Directors and Stockholders
of Medical Properties Trust, Inc.:
In our opinion, the consolidated financial statements listed in the index appearing under Item 15(a) present fairly, in all material respects, the financial position of Medical Properties Trust, Inc. and its subsidiaries at December 31, 2016 and December 31, 2015, and the results of their operations and their cash flows for each of the three years in the period ended December 31, 2016 in conformity with accounting principles generally accepted in the United States of America. In addition, in our opinion, the financial statement schedules listed in the index under Item 15(a) present fairly, in all material respects, the information set forth therein when read in conjunction with the related consolidated financial statements. Also in our opinion, the Company maintained, in all material respects, effective internal control over financial reporting as of December 31, 2016, based on criteria established in Internal Control — Integrated Framework (2013) issued by the Committee of Sponsoring Organizations of the Treadway Commission (COSO). The Company’s management is responsible for these financial statements and financial statement schedules, for maintaining effective internal control over financial reporting and for its assessment of the effectiveness of internal control over financial reporting, included in Management’s Report on Internal Control over Financial Reporting appearing under Item 9a. Our responsibility is to express opinions on these financial statements, on the financial statement schedules, and on the Company’s internal control over financial reporting based on our integrated audits. We conducted our audits in accordance with the standards of the Public Company Accounting Oversight Board (United States). Those standards require that we plan and perform the audits to obtain reasonable assurance about whether the financial statements are free of material misstatement and whether effective internal control over financial reporting was maintained in all material respects. Our audits of the financial statements included examining, on a test basis, evidence supporting the amounts and disclosures in the financial statements, assessing the accounting principles used and significant estimates made by management, and evaluating the overall financial statement presentation. Our audit of internal control over financial reporting included obtaining an understanding of internal control over financial reporting, assessing the risk that a material weakness exists, and testing and evaluating the design and operating effectiveness of internal control based on the assessed risk. Our audits also included performing such other procedures as we considered necessary in the circumstances. We believe that our audits provide a reasonable basis for our opinions.
A company’s internal control over financial reporting is a process designed to provide reasonable assurance regarding the reliability of financial reporting and the preparation of financial statements for external purposes in accordance with generally accepted accounting principles. A company’s internal control over financial reporting includes those policies and procedures that (i) pertain to the maintenance of records that, in reasonable detail, accurately and fairly reflect the transactions and dispositions of the assets of the company; (ii) provide reasonable assurance that transactions are recorded as necessary to permit preparation of financial statements in accordance with generally accepted accounting principles, and that receipts and expenditures of the company are being made only in accordance with authorizations of management and directors of the company; and (iii) provide reasonable assurance regarding prevention or timely detection of unauthorized acquisition, use, or disposition of the company’s assets that could have a material effect on the financial statements.
Because of its inherent limitations, internal control over financial reporting may not prevent or detect misstatements. Also, projections of any evaluation of effectiveness to future periods are subject to the risk that controls may become inadequate because of changes in conditions, or that the degree of compliance with the policies or procedures may deteriorate.
/s/ PricewaterhouseCoopers LLP
Birmingham, AL
March 1, 2017
69
Table of Contents
Index to Financial Statements
Report of Independent Registered Public Accounting Firm
To the Partners
of MPT Operating Partnership, L.P.:
In our opinion, the consolidated financial statements listed in the index appearing under Item 15(a) present fairly, in all material respects, the financial position of MPT Operating Partnership, L.P. and its subsidiaries at December 31, 2016 and December 31, 2015, and the results of their operations and their cash flows for each of the three years in the period ended December 31, 2016 in conformity with accounting principles generally accepted in the United States of America. In addition, in our opinion, the financial statement schedules listed in the index under Item 15(a) present fairly, in all material respects, the information set forth therein when read in conjunction with the related consolidated financial statements. Also in our opinion, the Company maintained, in all material respects, effective internal control over financial reporting as of December 31, 2016, based on criteria established in Internal Control—Integrated Framework (2013) issued by the Committee of Sponsoring Organizations of the Treadway Commission (COSO). The Company’s management is responsible for these financial statements and financial statement schedules, for maintaining effective internal control over financial reporting and for its assessment of the effectiveness of internal control over financial reporting, included in Management’s Report on Internal Control over Financial Reporting appearing under Item 9a. Our responsibility is to express opinions on these financial statements, on the financial statement schedules, and on the Company’s internal control over financial reporting based on our integrated audits. We conducted our audits in accordance with the standards of the Public Company Accounting Oversight Board (United States). Those standards require that we plan and perform the audits to obtain reasonable assurance about whether the financial statements are free of material misstatement and whether effective internal control over financial reporting was maintained in all material respects. Our audits of the financial statements included examining, on a test basis, evidence supporting the amounts and disclosures in the financial statements, assessing the accounting principles used and significant estimates made by management, and evaluating the overall financial statement presentation. Our audit of internal control over financial reporting included obtaining an understanding of internal control over financial reporting, assessing the risk that a material weakness exists, and testing and evaluating the design and operating effectiveness of internal control based on the assessed risk. Our audits also included performing such other procedures as we considered necessary in the circumstances. We believe that our audits provide a reasonable basis for our opinions.
A company’s internal control over financial reporting is a process designed to provide reasonable assurance regarding the reliability of financial reporting and the preparation of financial statements for external purposes in accordance with generally accepted accounting principles. A company’s internal control over financial reporting includes those policies and procedures that (i) pertain to the maintenance of records that, in reasonable detail, accurately and fairly reflect the transactions and dispositions of the assets of the company; (ii) provide reasonable assurance that transactions are recorded as necessary to permit preparation of financial statements in accordance with generally accepted accounting principles, and that receipts and expenditures of the company are being made only in accordance with authorizations of management and directors of the company; and (iii) provide reasonable assurance regarding prevention or timely detection of unauthorized acquisition, use, or disposition of the company’s assets that could have a material effect on the financial statements.
Because of its inherent limitations, internal control over financial reporting may not prevent or detect misstatements. Also, projections of any evaluation of effectiveness to future periods are subject to the risk that controls may become inadequate because of changes in conditions, or that the degree of compliance with the policies or procedures may deteriorate.
/s/ PricewaterhouseCoopers LLP
Birmingham, AL
March 1, 2017
70
Table of Contents
Index to Financial Statements
MEDICAL PROPERTIES TRUST, INC. AND SUBSIDIARIES
Consolidated Balance Sheets
| December 31, | ||||||||
| 2016 | 2015 | |||||||
| (Amounts in thousands, except for per share data) |
||||||||
| ASSETS | ||||||||
| Real estate assets |
||||||||
| Land |
$ | 417,368 | $ | 315,787 | ||||
| Buildings and improvements |
3,550,674 | 2,675,803 | ||||||
| Construction in progress and other |
53,648 | 49,165 | ||||||
| Intangible lease assets |
296,176 | 256,950 | ||||||
| Net investment in direct financing leases |
648,102 | 626,996 | ||||||
| Mortgage loans |
1,060,400 | 757,581 | ||||||
|
|
|
|
|
|||||
| Gross investment in real estate assets |
6,026,368 | 4,682,282 | ||||||
| Accumulated depreciation |
(292,786 | ) | (232,675 | ) | ||||
| Accumulated amortization |
(32,339 | ) | (25,253 | ) | ||||
|
|
|
|
|
|||||
| Net investment in real estate assets |
5,701,243 | 4,424,354 | ||||||
| Cash and cash equivalents |
83,240 | 195,541 | ||||||
| Interest and rent receivables |
57,698 | 46,939 | ||||||
| Straight-line rent receivables |
116,861 | 82,155 | ||||||
| Other loans |
155,721 | 664,822 | ||||||
| Other assets |
303,773 | 195,540 | ||||||
|
|
|
|
|
|||||
| Total Assets |
$ | 6,418,536 | $ | 5,609,351 | ||||
|
|
|
|
|
|||||
| LIABILITIES AND EQUITY | ||||||||
| Liabilities |
||||||||
| Debt, net |
$ | 2,909,341 | $ | 3,322,541 | ||||
| Accounts payable and accrued expenses |
207,711 | 137,356 | ||||||
| Deferred revenue |
19,933 | 29,358 | ||||||
| Lease deposits and other obligations to tenants |
28,323 | 12,831 | ||||||
|
|
|
|
|
|||||
| Total Liabilities |
3,165,308 | 3,502,086 | ||||||
| Commitments and Contingencies |
||||||||
| Equity |
||||||||
| Preferred stock, $0.001 par value. Authorized 10,000 shares; no shares outstanding |
— | — | ||||||
| Common stock, $0.001 par value. Authorized 500,000 shares; issued and outstanding — 320,514 shares at December 31, 2016 and 236,744 shares at December 31, 2015 |
321 | 237 | ||||||
| Additional paid-in capital |
3,775,336 | 2,593,827 | ||||||
| Distributions in excess of net income |
(434,114 | ) | (418,650 | ) | ||||
| Accumulated other comprehensive loss |
(92,903 | ) | (72,884 | ) | ||||
| Treasury shares, at cost |
(262 | ) | (262 | ) | ||||
|
|
|
|
|
|||||
| Total Medical Properties Trust, Inc. Stockholders’ Equity |
3,248,378 | 2,102,268 | ||||||
| Non-controlling interests |
4,850 | 4,997 | ||||||
|
|
|
|
|
|||||
| Total Equity |
3,253,228 | 2,107,265 | ||||||
|
|
|
|
|
|||||
| Total Liabilities and Equity |
$ | 6,418,536 | $ | 5,609,351 | ||||
|
|
|
|
|
|||||
See accompanying notes to consolidated financial statements.
71
Table of Contents
Index to Financial Statements
MEDICAL PROPERTIES TRUST, INC. AND SUBSIDIARIES
Consolidated Statements of Net Income
| For the Years Ended December 31, | ||||||||||||
| 2016 | 2015 | 2014 | ||||||||||
| (Amounts in thousands, except for per share data) |
||||||||||||
| Revenues |
||||||||||||
| Rent billed |
$ | 327,269 | $ | 247,604 | $ | 187,018 | ||||||
| Straight-line rent |
41,067 | 23,375 | 13,507 | |||||||||
| Income from direct financing leases |
64,307 | 58,715 | 49,155 | |||||||||
| Interest and fee income |
108,494 | 112,184 | 62,852 | |||||||||
|
|
|
|
|
|
|
|||||||
| Total revenues |
541,137 | 441,878 | 312,532 | |||||||||
| Expenses |
||||||||||||
| Real estate depreciation and amortization |
94,374 | 69,867 | 53,938 | |||||||||
| Impairment charges |
7,229 | — | 50,128 | |||||||||
| Property-related |
2,712 | 3,792 | 1,851 | |||||||||
| Acquisition expenses |
46,273 | 61,342 | 26,389 | |||||||||
| General and administrative |
48,911 | 43,639 | 37,274 | |||||||||
|
|
|
|
|
|
|
|||||||
| Total operating expenses |
199,499 | 178,640 | 169,580 | |||||||||
|
|
|
|
|
|
|
|||||||
| Operating income |
341,638 | 263,238 | 142,952 | |||||||||
| Other income (expense) |
||||||||||||
| Interest expense |
(159,597 | ) | (120,884 | ) | (98,156 | ) | ||||||
| Gain on sale of real estate and other asset dispositions, net |
61,224 | 3,268 | 2,857 | |||||||||
| Earnings from equity and other interests |
(1,116 | ) | 2,849 | 2,559 | ||||||||
| Unutilized financing fees/ debt refinancing costs |
(22,539 | ) | (4,367 | ) | (1,698 | ) | ||||||
| Other income (expense) |
(502 | ) | (2,674 | ) | 2,624 | |||||||
| Income tax benefit (expense) |
6,830 | (1,503 | ) | (340 | ) | |||||||
|
|
|
|
|
|
|
|||||||
| Net other expenses |
(115,700 | ) | (123,311 | ) | (92,154 | ) | ||||||
|
|
|
|
|
|
|
|||||||
| Income from continuing operations |
225,938 | 139,927 | 50,798 | |||||||||
| Loss from discontinued operations |
(1 | ) | — | (2 | ) | |||||||
|
|
|
|
|
|
|
|||||||
| Net income |
225,937 | 139,927 | 50,796 | |||||||||
| Net income attributable to non-controlling interests |
(889 | ) | (329 | ) | (274 | ) | ||||||
|
|
|
|
|
|
|
|||||||
| Net income attributable to MPT common stockholders |
$ | 225,048 | $ | 139,598 | $ | 50,522 | ||||||
|
|
|
|
|
|
|
|||||||
| Earnings per share — basic |
||||||||||||
| Income from continuing operations attributable to MPT common stockholders |
$ | 0.86 | $ | 0.64 | $ | 0.29 | ||||||
| Income from discontinued operations attributable to MPT common stockholders |
— | — | — | |||||||||
|
|
|
|
|
|
|
|||||||
| Net income attributable to MPT common stockholders |
$ | 0.86 | $ | 0.64 | $ | 0.29 | ||||||
|
|
|
|
|
|
|
|||||||
| Weighted average shares outstanding — basic |
260,414 | 217,997 | 169,999 | |||||||||
|
|
|
|
|
|
|
|||||||
| Earnings per share — diluted |
||||||||||||
| Income from continuing operations attributable to MPT common stockholders |
$ | 0.86 | $ | 0.63 | $ | 0.29 | ||||||
| Income from discontinued operations attributable to MPT common stockholders |
— | — | — | |||||||||
|
|
|
|
|
|
|
|||||||
| Net income attributable to MPT common stockholders |
$ | 0.86 | $ | 0.63 | $ | 0.29 | ||||||
|
|
|
|
|
|
|
|||||||
| Weighted average shares outstanding — diluted |
261,072 | 218,304 | 170,540 | |||||||||
|
|
|
|
|
|
|
|||||||
See accompanying notes to consolidated financial statements.
72
Table of Contents
Index to Financial Statements
MEDICAL PROPERTIES TRUST, INC. AND SUBSIDIARIES
Consolidated Statements of Comprehensive Income
| For the Years Ended December 31, |
||||||||||||
| (In thousands) | 2016 | 2015 | 2014 | |||||||||
| Net income |
$ | 225,937 | $ | 139,927 | $ | 50,796 | ||||||
| Other comprehensive income (loss): |
||||||||||||
| Unrealized gain on interest rate swap |
2,904 | 3,139 | 2,964 | |||||||||
| Foreign currency translation loss |
(22,923 | ) | (54,109 | ) | (15,937 | ) | ||||||
|
|
|
|
|
|
|
|||||||
| Total comprehensive income |
205,918 | 88,957 | 37,823 | |||||||||
| Comprehensive income attributable to non-controlling interests |
(889 | ) | (329 | ) | (274 | ) | ||||||
|
|
|
|
|
|
|
|||||||
| Comprehensive income attributable to MPT common stockholders |
$ | 205,029 | $ | 88,628 | $ | 37,549 | ||||||
|
|
|
|
|
|
|
|||||||
See accompanying notes to consolidated financial statements.
73
Table of Contents
Index to Financial Statements
MEDICAL PROPERTIES TRUST, INC. AND SUBSIDIARIES
Consolidated Statements of Equity
For the Years Ended December 31, 2016, 2015 and 2014
(Amounts in thousands, except per share data)
| Preferred | Common | Additional Paid-in Capital |
Distributions in Excess of Net Income |
Accumulated Other Comprehensive Loss |
Treasury Stock |
Non- Controlling Interests |
Total Equity |
|||||||||||||||||||||||||||||||||
| Shares | Par Value |
Shares | Par Value |
|||||||||||||||||||||||||||||||||||||
| Balance at December 31, 2013 |
— | $ | — | 161,310 | $ | 161 | $ | 1,618,054 | $ | (264,804 | ) | $ | (8,941 | ) | $ | (262 | ) | $ | — | $ | 1,344,208 | |||||||||||||||||||
|
|
|
|
|
|
|
|
|
|
|
|
|
|
|
|
|
|
|
|
|
|||||||||||||||||||||
| Net income |
— | — | — | — | — | 50,522 | — | — | 274 | 50,796 | ||||||||||||||||||||||||||||||
| Unrealized gain on interest rate swap |
— | — | — | — | — | — | 2,964 | — | — | 2,964 | ||||||||||||||||||||||||||||||
| Foreign currency translation loss |
— | — | — | — | — | — | (15,937 | ) | — | — | (15,937 | ) | ||||||||||||||||||||||||||||
| Stock vesting and amortization of stock-based compensation |
— | — | 777 | — | 9,165 | — | — | — | — | 9,165 | ||||||||||||||||||||||||||||||
| Distributions to non-controlling interests |
— | — | — | — | — | — | — | — | (274 | ) | (274 | ) | ||||||||||||||||||||||||||||
| Proceeds from offering (net of offering costs) |
— | — | 10,656 | 11 | 138,162 | — | — | — | — | 138,173 | ||||||||||||||||||||||||||||||
| Dividends declared ($0.84 per common share) |
— | — | — | — | — | (147,048 | ) | — | — | — | (147,048 | ) | ||||||||||||||||||||||||||||
|
|
|
|
|
|
|
|
|
|
|
|
|
|
|
|
|
|
|
|
|
|||||||||||||||||||||
| Balance at December 31, 2014 |
— | $ | — | 172,743 | $ | 172 | $ | 1,765,381 | $ | (361,330 | ) | $ | (21,914 | ) | $ | (262 | ) | $ | — | $ | 1,382,047 | |||||||||||||||||||
|
|
|
|
|
|
|
|
|
|
|
|
|
|
|
|
|
|
|
|
|
|||||||||||||||||||||
| Net income |
— | — | — | — | — | 139,598 | — | — | 329 | 139,927 | ||||||||||||||||||||||||||||||
| Sale of non-controlling interests |
— | — | — | — | — | — | — | — | 5,000 | 5,000 | ||||||||||||||||||||||||||||||
| Unrealized gain on interest rate swap |
— | — | — | — | — | — | 3,139 | — | — | 3,139 | ||||||||||||||||||||||||||||||
| Foreign currency translation loss |
— | — | — | — | — | — | (54,109 | ) | — | — | (54,109 | ) | ||||||||||||||||||||||||||||
| Stock vesting and amortization of stock-based compensation |
— | — | 751 | 2 | 11,120 | — | — | — | — | 11,122 | ||||||||||||||||||||||||||||||
| Distributions to non-controlling interests |
— | — | — | — | — | — | — | — | (332 | ) | (332 | ) | ||||||||||||||||||||||||||||
| Proceeds from offering (net of offering costs) |
— | — | 63,250 | 63 | 817,326 | — | — | — | — | 817,389 | ||||||||||||||||||||||||||||||
| Dividends declared ($0.88 per common share) |
— | — | — | — | — | (196,918 | ) | — | — | — | (196,918 | ) | ||||||||||||||||||||||||||||
|
|
|
|
|
|
|
|
|
|
|
|
|
|
|
|
|
|
|
|
|
|||||||||||||||||||||
| Balance at December 31, 2015 |
— | $ | — | 236,744 | $ | 237 | $ | 2,593,827 | $ | (418,650 | ) | $ | (72,884 | ) | $ | (262 | ) | $ | 4,997 | $ | 2,107,265 | |||||||||||||||||||
|
|
|
|
|
|
|
|
|
|
|
|
|
|
|
|
|
|
|
|
|
|||||||||||||||||||||
| Net income |
— | — | — | — | — | 225,048 | — | — | 889 | 225,937 | ||||||||||||||||||||||||||||||
| Unrealized gain on interest rate swap |
— | — | — | — | — | — | 2,904 | — | — | 2,904 | ||||||||||||||||||||||||||||||
| Foreign currency translation loss |
— | — | — | — | — | — | (22,923 | ) | — | — | (22,923 | ) | ||||||||||||||||||||||||||||
| Stock vesting and amortization of stock-based compensation |
— | — | 1,021 | 1 | 7,941 | — | — | — | — | 7,942 | ||||||||||||||||||||||||||||||
| Distributions to non-controlling interests |
— | — | — | — | — | — | — | — | (1,036 | ) | (1,036 | ) | ||||||||||||||||||||||||||||
| Proceeds from offering (net of offering costs) |
— | — | 82,749 | 83 | 1,173,568 | — | — | — | — | 1,173,651 | ||||||||||||||||||||||||||||||
| Dividends declared ($0.91 per common share) |
— | — | — | — | — | (240,512 | ) | — | — | — | (240,512 | ) | ||||||||||||||||||||||||||||
|
|
|
|
|
|
|
|
|
|
|
|
|
|
|
|
|
|
|
|
|
|||||||||||||||||||||
| Balance at December 31, 2016 |
— | $ | — | 320,514 | $ | 321 | $ | 3,775,336 | $ | (434,114 | ) | $ | (92,903 | ) | $ | (262 | ) | $ | 4,850 | $ | 3,253,228 | |||||||||||||||||||
|
|
|
|
|
|
|
|
|
|
|
|
|
|
|
|
|
|
|
|
|
|||||||||||||||||||||
See accompanying notes to consolidated financial statements.
74
Table of Contents
Index to Financial Statements
MEDICAL PROPERTIES TRUST, INC. AND SUBSIDIARIES
Consolidated Statements of Cash Flows
| For the Years Ended December 31, | ||||||||||||
| 2016 | 2015 | 2014 | ||||||||||
| (Amounts in thousands) | ||||||||||||
| Operating activities |
||||||||||||
| Net income |
$ | 225,937 | $ | 139,927 | $ | 50,796 | ||||||
| Adjustments to reconcile net income to net cash provided by operating activities: |
||||||||||||
| Depreciation and amortization |
97,601 | 71,827 | 55,162 | |||||||||
| Amortization of deferred financing costs and debt discount |
7,613 | 6,085 | 5,105 | |||||||||
| Direct financing lease interest accretion |
(9,120 | ) | (8,032 | ) | (6,701 | ) | ||||||
| Straight-line rent revenue |
(41,567 | ) | (26,187 | ) | (16,325 | ) | ||||||
| Share-based compensation |
7,942 | 11,122 | 9,165 | |||||||||
| Gain from sale of real estate and other asset dispositions, net |
(61,224 | ) | (3,268 | ) | (2,857 | ) | ||||||
| Impairment charges |
7,229 | — | 50,128 | |||||||||
| Straight-line rent and other write-off |
3,063 | 2,812 | 2,818 | |||||||||
| Unutilized financing fees/ debt refinancing costs |
22,539 | 4,367 | 1,698 | |||||||||
| Other adjustments |
3,563 | (6,334 | ) | (1,178 | ) | |||||||
| Decrease (increase) in: |
||||||||||||
| Interest and rent receivable |
(13,247 | ) | (5,599 | ) | (3,856 | ) | ||||||
| Other assets |
(18,357 | ) | (8,297 | ) | 764 | |||||||
| Accounts payable and accrued expenses |
41,583 | 26,540 | 6,209 | |||||||||
| Deferred revenue |
(8,872 | ) | 2,033 | (485 | ) | |||||||
|
|
|
|
|
|
|
|||||||
| Net cash provided by operating activities |
264,683 | 206,996 | 150,443 | |||||||||
| Investing activities |
||||||||||||
| Cash paid for acquisitions and other related investments |
(1,682,409 | ) | (2,218,869 | ) | (767,696 | ) | ||||||
| Net proceeds from sale of real estate |
198,767 | 19,175 | 34,649 | |||||||||
| Principal received on loans receivable |
906,757 | 771,785 | 11,265 | |||||||||
| Investment in loans receivable |
(109,027 | ) | (354,001 | ) | (12,782 | ) | ||||||
| Construction in progress and other |
(171,209 | ) | (146,372 | ) | (102,333 | ) | ||||||
| Investment in unsecured senior notes |
(50,000 | ) | — | — | ||||||||
| Proceeds from sale of unsecured notes |
50,000 | — | — | |||||||||
| Other investments, net |
(69,423 | ) | (17,339 | ) | (13,126 | ) | ||||||
|
|
|
|
|
|
|
|||||||
| Net cash used for investing activities |
(926,544 | ) | (1,945,621 | ) | (850,023 | ) | ||||||
| Financing activities |
||||||||||||
| Proceeds from term debt |
1,000,000 | 681,000 | 425,000 | |||||||||
| Payments of term debt |
(575,299 | ) | (283 | ) | (100,266 | ) | ||||||
| Payment of deferred financing costs |
(15,468 | ) | (7,686 | ) | (14,496 | ) | ||||||
| Revolving credit facilities, net |
(810,000 | ) | 509,415 | 490,625 | ||||||||
| Distributions paid |
(218,393 | ) | (182,980 | ) | (144,365 | ) | ||||||
| Lease deposits and other obligations to tenants |
14,557 | (10,839 | ) | 7,892 | ||||||||
| Proceeds from sale of common shares, net of offering costs |
1,173,651 | 817,389 | 138,173 | |||||||||
| Other financing activities |
(16,485 | ) | (5,326 | ) | — | |||||||
|
|
|
|
|
|
|
|||||||
| Net cash provided by financing activities |
552,563 | 1,800,690 | 802,563 | |||||||||
|
|
|
|
|
|
|
|||||||
| Increase in cash and cash equivalents for the year |
(109,298 | ) | 62,065 | 102,983 | ||||||||
| Effect of exchange rate changes |
(3,003 | ) | (11,065 | ) | (4,421 | ) | ||||||
| Cash and cash equivalents at beginning of year |
195,541 | 144,541 | 45,979 | |||||||||
|
|
|
|
|
|
|
|||||||
| Cash and cash equivalents at end of year |
$ | 83,240 | $ | 195,541 | $ | 144,541 | ||||||
|
|
|
|
|
|
|
|||||||
| Interest paid, including capitalized interest of $2,320 in 2016, $1,425 in 2015, and $1,860 in 2014 |
$ | 138,770 | $ | 107,228 | $ | 91,890 | ||||||
| Supplemental schedule of non-cash investing activities: |
||||||||||||
| Mortgage loan issued from sale of real estate |
$ | — | $ | — | $ | 12,500 | ||||||
| Increase in development project construction costs incurred, not paid |
15,857 | 2,684 | — | |||||||||
| Supplemental schedule of non-cash financing activities: |
||||||||||||
| Dividends declared, not paid |
$ | 74,521 | $ | 52,402 | $ | 38,461 | ||||||
See accompanying notes to consolidated financial statements.
75
Table of Contents
Index to Financial Statements
MPT OPERATING PARTNERSHIP, L.P. AND SUBSIDIARIES
Consolidated Balance Sheets
| December 31, | ||||||||
| 2016 | 2015 | |||||||
| (Amounts in thousands, except for per unit data) |
||||||||
| ASSETS | ||||||||
| Real estate assets |
||||||||
| Land |
$ | 417,368 | $ | 315,787 | ||||
| Buildings and improvements |
3,550,674 | 2,675,803 | ||||||
| Construction in progress and other |
53,648 | 49,165 | ||||||
| Intangible lease assets |
296,176 | 256,950 | ||||||
| Net investment in direct financing leases |
648,102 | 626,996 | ||||||
| Mortgage loans |
1,060,400 | 757,581 | ||||||
|
|
|
|
|
|||||
| Gross investment in real estate assets |
6,026,368 | 4,682,282 | ||||||
| Accumulated depreciation |
(292,786 | ) | (232,675 | ) | ||||
| Accumulated amortization |
(32,339 | ) | (25,253 | ) | ||||
|
|
|
|
|
|||||
| Net investment in real estate assets |
5,701,243 | 4,424,354 | ||||||
| Cash and cash equivalents |
83,240 | 195,541 | ||||||
| Interest and rent receivables |
57,698 | 46,939 | ||||||
| Straight-line rent receivables |
116,861 | 82,155 | ||||||
| Other loans |
155,721 | 664,822 | ||||||
| Other assets |
303,773 | 195,540 | ||||||
|
|
|
|
|
|||||
| Total Assets |
$ | 6,418,536 | $ | 5,609,351 | ||||
|
|
|
|
|
|||||
| LIABILITIES AND CAPITAL | ||||||||
| Liabilities |
||||||||
| Debt, net |
$ | 2,909,341 | $ | 3,322,541 | ||||
| Accounts payable and accrued expenses |
132,868 | 84,628 | ||||||
| Deferred revenue |
19,933 | 29,358 | ||||||
| Lease deposits and other obligations to tenants |
28,323 | 12,831 | ||||||
| Payable due to Medical Properties Trust, Inc. |
74,453 | 52,338 | ||||||
|
|
|
|
|
|||||
| Total Liabilities |
3,164,918 | 3,501,696 | ||||||
| Commitments and Contingencies |
||||||||
| Capital |
||||||||
| General partner — issued and outstanding — 3,204 units at December 31, 2016 and 2,363 units at December 31, 2015 |
33,436 | 21,773 | ||||||
| Limited Partners: |
||||||||
| Common units — issued and outstanding — 317,310 units at December 31, 2016 and 234,381 units at December 31, 2015 |
3,308,235 | 2,153,769 | ||||||
| LTIP units — issued and outstanding — 292 units at December 31, 2016 and December 31, 2015 |
— | — | ||||||
| Accumulated other comprehensive loss |
(92,903 | ) | (72,884 | ) | ||||
|
|
|
|
|
|||||
| Total MPT Operating Partnership, L.P. capital |
3,248,768 | 2,102,658 | ||||||
| Non-controlling interests |
4,850 | 4,997 | ||||||
|
|
|
|
|
|||||
| Total Capital |
3,253,618 | 2,107,655 | ||||||
|
|
|
|
|
|||||
| Total Liabilities and Capital |
$ | 6,418,536 | $ | 5,609,351 | ||||
|
|
|
|
|
|||||
See accompanying notes to consolidated financial statements.
76
Table of Contents
Index to Financial Statements
MPT OPERATING PARTNERSHIP, L.P. AND SUBSIDIARIES
Consolidated Statements of Net Income
| For the Years Ended December 31, | ||||||||||||
| 2016 | 2015 | 2014 | ||||||||||
| (Amounts in thousands, except for per unit data) |
||||||||||||
| Revenues |
||||||||||||
| Rent billed |
$ | 327,269 | $ | 247,604 | $ | 187,018 | ||||||
| Straight-line rent |
41,067 | 23,375 | 13,507 | |||||||||
| Income from direct financing leases |
64,307 | 58,715 | 49,155 | |||||||||
| Interest and fee income |
108,494 | 112,184 | 62,852 | |||||||||
|
|
|
|
|
|
|
|||||||
| Total revenues |
541,137 | 441,878 | 312,532 | |||||||||
| Expenses |
||||||||||||
| Real estate depreciation and amortization |
94,374 | 69,867 | 53,938 | |||||||||
| Impairment charges |
7,229 | — | 50,128 | |||||||||
| Property-related |
2,712 | 3,792 | 1,851 | |||||||||
| Acquisition expenses |
46,273 | 61,342 | 26,389 | |||||||||
| General and administrative |
48,911 | 43,639 | 37,274 | |||||||||
|
|
|
|
|
|
|
|||||||
| Total operating expense |
199,499 | 178,640 | 169,580 | |||||||||
|
|
|
|
|
|
|
|||||||
| Operating income |
341,638 | 263,238 | 142,952 | |||||||||
| Other income (expense) |
||||||||||||
| Interest expense |
(159,597 | ) | (120,884 | ) | (98,156 | ) | ||||||
| Gain on sale of real estate and other asset dispositions, net |
61,224 | 3,268 | 2,857 | |||||||||
| Earnings from equity and other interests |
(1,116 | ) | 2,849 | 2,559 | ||||||||
| Unutilized financing fees/ debt refinancing costs |
(22,539 | ) | (4,367 | ) | (1,698 | ) | ||||||
| Other income (expense) |
(502 | ) | (2,674 | ) | 2,624 | |||||||
| Income tax benefit (expense) |
6,830 | (1,503 | ) | (340 | ) | |||||||
|
|
|
|
|
|
|
|||||||
| Net other expenses |
(115,700 | ) | (123,311 | ) | (92,154 | ) | ||||||
|
|
|
|
|
|
|
|||||||
| Income from continuing operations |
225,938 | 139,927 | 50,798 | |||||||||
| Loss from discontinued operations |
(1 | ) | — | (2 | ) | |||||||
|
|
|
|
|
|
|
|||||||
| Net income |
225,937 | 139,927 | 50,796 | |||||||||
| Net income attributable to non-controlling interests |
(889 | ) | (329 | ) | (274 | ) | ||||||
|
|
|
|
|
|
|
|||||||
| Net income attributable to MPT Operating Partnership partners |
$ | 225,048 | $ | 139,598 | $ | 50,522 | ||||||
|
|
|
|
|
|
|
|||||||
| Earnings per unit — basic |
||||||||||||
| Income from continuing operations attributable to MPT Operating Partnership partners |
$ | 0.86 | $ | 0.64 | $ | 0.29 | ||||||
| Income from discontinued operations attributable to MPT Operating Partnership partners |
— | — | — | |||||||||
|
|
|
|
|
|
|
|||||||
| Net income attributable to MPT Operating Partnership partners |
$ | 0.86 | $ | 0.64 | $ | 0.29 | ||||||
|
|
|
|
|
|
|
|||||||
| Weighted average units outstanding — basic |
260,414 | 217,997 | 169,999 | |||||||||
|
|
|
|
|
|
|
|||||||
| Earnings per unit — diluted |
||||||||||||
| Income from continuing operations attributable to MPT Operating Partnership partners |
$ | 0.86 | $ | 0.63 | $ | 0.29 | ||||||
| Income from discontinued operations attributable to MPT Operating Partnership partners |
— | — | — | |||||||||
|
|
|
|
|
|
|
|||||||
| Net income attributable to MPT Operating Partnership partners |
$ | 0.86 | $ | 0.63 | $ | 0.29 | ||||||
|
|
|
|
|
|
|
|||||||
| Weighted average units outstanding — diluted |
261,072 | 218,304 | 170,540 | |||||||||
|
|
|
|
|
|
|
|||||||
See accompanying notes to consolidated financial statements.
77
Table of Contents
Index to Financial Statements
MPT OPERATING PARTNERSHIP, L.P. AND SUBSIDIARIES
Consolidated Statements of Comprehensive Income
| For the Years Ended December 31, |
||||||||||||
| (In thousands) | 2016 | 2015 | 2014 | |||||||||
| Net income |
$ | 225,937 | $ | 139,927 | $ | 50,796 | ||||||
| Other comprehensive income (loss): |
||||||||||||
| Unrealized gain on interest rate swap |
2,904 | 3,139 | 2,964 | |||||||||
| Foreign currency translation loss |
(22,923 | ) | (54,109 | ) | (15,937 | ) | ||||||
|
|
|
|
|
|
|
|||||||
| Total comprehensive income |
205,918 | 88,957 | 37,823 | |||||||||
| Comprehensive income attributable to non-controlling interests |
(889 | ) | (329 | ) | (274 | ) | ||||||
|
|
|
|
|
|
|
|||||||
| Comprehensive income attributable to MPT Operating Partnership partners |
$ | 205,029 | $ | 88,628 | $ | 37,549 | ||||||
|
|
|
|
|
|
|
|||||||
See accompanying notes to consolidated financial statements.
78
Table of Contents
Index to Financial Statements
MPT OPERATING PARTNERSHIP, L.P. AND SUBSIDIARIES
Consolidated Statements of Capital
For the Years Ended December 31, 2016, 2015 and 2014
(Amounts in thousands, except per unit data)
| General Partner |
Limited Partners | Accumulated Other Comprehensive Loss |
Non- Controlling Interests |
Total Capital |
||||||||||||||||||||||||||||||||
| Common | LTIPs | |||||||||||||||||||||||||||||||||||
| Units | Unit Value |
Units | Unit Value |
Units | Unit Value |
|||||||||||||||||||||||||||||||
| Balance at December 31, 2013 |
1,608 | $ | 13,541 | 159,702 | $ | 1,339,998 | 292 | $ | — | $ | (8,941 | ) | $ | — | $ | 1,344,598 | ||||||||||||||||||||
|
|
|
|
|
|
|
|
|
|
|
|
|
|
|
|
|
|
|
|||||||||||||||||||
| Net income |
— | 508 | — | 49,769 | — | 245 | — | 274 | 50,796 | |||||||||||||||||||||||||||
| Unrealized gain on interest rate swap |
— | — | — | — | — | — | 2,964 | — | 2,964 | |||||||||||||||||||||||||||
| Foreign currency translation loss |
— | — | — | — | — | — | (15,937 | ) | — | (15,937 | ) | |||||||||||||||||||||||||
| Unit vesting and amortization of unit-based compensation |
8 | 92 | 769 | 9,073 | — | — | — | — | 9,165 | |||||||||||||||||||||||||||
| Distributions to non- controlling interests |
— | — | — | — | — | — | — | (274 | ) | (274 | ) | |||||||||||||||||||||||||
| Proceeds from offering (net of offering costs) |
106 | 1,382 | 10,550 | 136,791 | — | — | — | — | 138,173 | |||||||||||||||||||||||||||
| Distributions declared ($0.84 per unit) |
— | (1,468 | ) | — | (145,335 | ) | — | (245 | ) | — | — | (147,048 | ) | |||||||||||||||||||||||
|
|
|
|
|
|
|
|
|
|
|
|
|
|
|
|
|
|
|
|||||||||||||||||||
| Balance at December 31, 2014 |
1,722 | $ | 14,055 | 171,021 | $ | 1,390,296 | 292 | $ | — | $ | (21,914 | ) | $ | — | $ | 1,382,437 | ||||||||||||||||||||
|
|
|
|
|
|
|
|
|
|
|
|
|
|
|
|
|
|
|
|||||||||||||||||||
| Net income |
— | 1,399 | — | 138,199 | — | — | — | 329 | 139,927 | |||||||||||||||||||||||||||
| Sale of non-controlling interests |
— | — | — | — | — | — | — | 5,000 | 5,000 | |||||||||||||||||||||||||||
| Unrealized gain on interest rate swap |
— | — | — | — | — | — | 3,139 | — | 3,139 | |||||||||||||||||||||||||||
| Foreign currency translation loss |
— | — | — | — | — | — | (54,109 | ) | — | (54,109 | ) | |||||||||||||||||||||||||
| Unit vesting and amortization of unit-based compensation |
8 | 111 | 743 | 11,011 | — | — | — | — | 11,122 | |||||||||||||||||||||||||||
| Distributions to non- controlling interests |
— | — | — | — | — | — | — | (332 | ) | (332 | ) | |||||||||||||||||||||||||
| Proceeds from offering (net of offering costs) |
633 | 8,175 | 62,617 | 809,214 | — | — | — | — | 817,389 | |||||||||||||||||||||||||||
| Distributions declared ($0.88 per unit) |
— | (1,967 | ) | — | (194,951 | ) | — | — | — | — | (196,918 | ) | ||||||||||||||||||||||||
|
|
|
|
|
|
|
|
|
|
|
|
|
|
|
|
|
|
|
|||||||||||||||||||
| Balance at December 31, 2015 |
2,363 | $ | 21,773 | 234,381 | $ | 2,153,769 | 292 | $ | — | $ | (72,884 | ) | $ | 4,997 | $ | 2,107,655 | ||||||||||||||||||||
|
|
|
|
|
|
|
|
|
|
|
|
|
|
|
|
|
|
|
|||||||||||||||||||
| Net income |
— | 2,251 | — | 222,797 | — | — | — | 889 | 225,937 | |||||||||||||||||||||||||||
| Unrealized gain on interest rate swap |
— | — | — | — | — | — | 2,904 | — | 2,904 | |||||||||||||||||||||||||||
| Foreign currency translation loss |
— | — | — | — | — | — | (22,923 | ) | — | (22,923 | ) | |||||||||||||||||||||||||
| Unit vesting and amortization of unit-based compensation |
10 | 80 | 1,011 | 7,862 | — | — | — | — | 7,942 | |||||||||||||||||||||||||||
| Distributions to non- controlling interests |
— | — | — | — | — | — | — | (1,036 | ) | (1,036 | ) | |||||||||||||||||||||||||
| Proceeds from offering (net of offering costs) |
831 | 11,737 | 81,918 | 1,161,914 | — | — | — | — | 1,173,651 | |||||||||||||||||||||||||||
| Distributions declared ($0.91 per unit) |
— | (2,405 | ) | — | (238,107 | ) | — | — | — | — | (240,512 | ) | ||||||||||||||||||||||||
|
|
|
|
|
|
|
|
|
|
|
|
|
|
|
|
|
|
|
|||||||||||||||||||
| Balance at December 31, 2016 |
3,204 | $ | 33,436 | 317,310 | $ | 3,308,235 | 292 | $ | — | $ | (92,903 | ) | $ | 4,850 | $ | 3,253,618 | ||||||||||||||||||||
|
|
|
|
|
|
|
|
|
|
|
|
|
|
|
|
|
|
|
|||||||||||||||||||
See accompanying notes to consolidated financial statements.
79
Table of Contents
Index to Financial Statements
MPT OPERATING PARTNERSHIP, L.P. AND SUBSIDIARIES
Consolidated Statements of Cash Flows
| For the Years Ended December 31, | ||||||||||||
| 2016 | 2015 | 2014 | ||||||||||
| (Amounts in thousands) | ||||||||||||
| Operating activities |
||||||||||||
| Net income |
$ | 225,937 | $ | 139,927 | $ | 50,796 | ||||||
| Adjustments to reconcile net income to net cash provided by operating activities: |
||||||||||||
| Depreciation and amortization |
97,601 | 71,827 | 55,162 | |||||||||
| Amortization of deferred financing costs and debt discount |
7,613 | 6,085 | 5,105 | |||||||||
| Direct financing lease interest accretion |
(9,120 | ) | (8,032 | ) | (6,701 | ) | ||||||
| Straight-line rent revenue |
(41,567 | ) | (26,187 | ) | (16,325 | ) | ||||||
| Unit-based compensation |
7,942 | 11,122 | 9,165 | |||||||||
| Gain from sale of real estate and other asset dispositions, net |
(61,224 | ) | (3,268 | ) | (2,857 | ) | ||||||
| Impairment charges |
7,229 | — | 50,128 | |||||||||
| Straight-line rent and other write-off |
3,063 | 2,812 | 2,818 | |||||||||
| Unutilized financing fees/ debt refinancing costs |
22,539 | 4,367 | 1,698 | |||||||||
| Other adjustments |
3,563 | (6,334 | ) | (1,178 | ) | |||||||
| Decrease (increase) in: |
||||||||||||
| Interest and rent receivable |
(13,247 | ) | (5,599 | ) | (3,856 | ) | ||||||
| Other assets |
(18,357 | ) | (8,297 | ) | 764 | |||||||
| Accounts payable and accrued expenses |
41,583 | 26,540 | 6,209 | |||||||||
| Deferred revenue |
(8,872 | ) | 2,033 | (485 | ) | |||||||
|
|
|
|
|
|
|
|||||||
| Net cash provided by operating activities |
264,683 | 206,996 | 150,443 | |||||||||
| Investing activities |
||||||||||||
| Cash paid for acquisitions and other related investments |
(1,682,409 | ) | (2,218,869 | ) | (767,696 | ) | ||||||
| Net proceeds from sale of real estate |
198,767 | 19,175 | 34,649 | |||||||||
| Principal received on loans receivable |
906,757 | 771,785 | 11,265 | |||||||||
| Investment in loans receivable |
(109,027 | ) | (354,001 | ) | (12,782 | ) | ||||||
| Construction in progress and other |
(171,209 | ) | (146,372 | ) | (102,333 | ) | ||||||
| Investment in unsecured senior notes |
(50,000 | ) | — | — | ||||||||
| Proceeds from sale of unsecured senior notes |
50,000 | — | — | |||||||||
| Other investments, net |
(69,423 | ) | (17,339 | ) | (13,126 | ) | ||||||
|
|
|
|
|
|
|
|||||||
| Net cash used for investing activities |
(926,544 | ) | (1,945,621 | ) | (850,023 | ) | ||||||
| Financing activities |
||||||||||||
| Proceeds from term debt |
1,000,000 | 681,000 | 425,000 | |||||||||
| Payments of term debt |
(575,299 | ) | (283 | ) | (100,266 | ) | ||||||
| Payment of deferred financing costs |
(15,468 | ) | (7,686 | ) | (14,496 | ) | ||||||
| Revolving credit facilities, net |
(810,000 | ) | 509,415 | 490,625 | ||||||||
| Distributions paid |
(218,393 | ) | (182,980 | ) | (144,365 | ) | ||||||
| Lease deposits and other obligations to tenants |
14,557 | (10,839 | ) | 7,892 | ||||||||
| Proceeds from sale of units, net of offering costs |
1,173,651 | 817,389 | 138,173 | |||||||||
| Other financing activities |
(16,485 | ) | (5,326 | ) | — | |||||||
|
|
|
|
|
|
|
|||||||
| Net cash provided by financing activities |
552,563 | 1,800,690 | 802,563 | |||||||||
|
|
|
|
|
|
|
|||||||
| Increase in cash and cash equivalents for the year |
(109,298 | ) | 62,065 | 102,983 | ||||||||
| Effect of exchange rate changes |
(3,003 | ) | (11,065 | ) | (4,421 | ) | ||||||
| Cash and cash equivalents at beginning of year |
195,541 | 144,541 | 45,979 | |||||||||
|
|
|
|
|
|
|
|||||||
| Cash and cash equivalents at end of year |
$ | 83,240 | $ | 195,541 | $ | 144,541 | ||||||
|
|
|
|
|
|
|
|||||||
| Interest paid, including capitalized interest of $2,320 in 2016, $1,425 in 2015, and $1,860 in 2014 |
$ | 138,770 | $ | 107,228 | $ | 91,890 | ||||||
| Supplemental schedule of non-cash investing activities: |
||||||||||||
| Mortgage loan issued from sale of real estate |
$ | — | $ | — | $ | 12,500 | ||||||
| Increase in development project construction costs incurred, not paid |
15,857 | 2,684 | — | |||||||||
| Supplemental schedule of non-cash financing activities: |
||||||||||||
| Dividends declared, not paid |
$ | 74,521 | $ | 52,402 | $ | 38,461 | ||||||
See accompanying notes to consolidated financial statements.
80
Table of Contents
Index to Financial Statements
MEDICAL PROPERTIES TRUST, INC. AND SUBSIDIARIES
MPT OPERATING PARTNERSHIP, L.P. AND SUBSIDIARIES
Notes To Consolidated Financial Statements
1. Organization
Medical Properties Trust, Inc., a Maryland corporation, was formed on August 27, 2003, under the General Corporation Law of Maryland for the purpose of engaging in the business of investing in, owning, and leasing healthcare real estate. Our operating partnership subsidiary, MPT Operating Partnership, L.P., through which we conduct all of our operations, was formed in September 2003. Through another wholly-owned subsidiary, Medical Properties Trust, LLC, we are the sole general partner of the Operating Partnership. At present, we directly own substantially all of the limited partnership interests in the Operating Partnership and have elected to report our required disclosures and that of the Operating Partnership on a combined basis except where material differences exist.
We have operated as a REIT since April 6, 2004, and accordingly, elected REIT status upon the filing in September 2005 of the calendar year 2004 federal income tax return. Accordingly, we will generally not be subject to U.S. federal income tax, provided that we continue to qualify as a REIT and our distributions to our stockholders equal or exceed our taxable income.
Our primary business strategy is to acquire and develop real estate and improvements, primarily for long-term lease to providers of healthcare services such as operators of general acute care hospitals, inpatient physical rehabilitation hospitals, long-term acute care hospitals, surgery centers, centers for treatment of specific conditions such as cardiac, pulmonary, cancer, and neurological hospitals, and other healthcare-oriented facilities. We also make mortgage and other loans to operators of similar facilities. In addition, we may obtain profits or equity interests in our tenants, from time to time, in order to enhance our overall return. We manage our business as a single business segment. All of our properties are located in the U.S. and Europe.
2. Summary of Significant Accounting Policies
Use of Estimates: The preparation of financial statements in conformity with accounting principles generally accepted in the U.S. requires management to make estimates and assumptions that affect the reported amounts of assets and liabilities and disclosure of contingent assets and liabilities at the date of the financial statements and the reported amounts of revenues and expenses during the reporting period. Actual results could differ from those estimates.
Principles of Consolidation: Property holding entities and other subsidiaries of which we own 100% of the equity or have a controlling financial interest evidenced by ownership of a majority voting interest are consolidated. All inter-company balances and transactions are eliminated. For entities in which we own less than 100% of the equity interest, we consolidate the property if we have the direct or indirect ability to control the entities’ activities based upon the terms of the respective entities’ ownership agreements. For these entities, we record a non-controlling interest representing equity held by non-controlling interests.
We continually evaluate all of our transactions and investments to determine if they represent variable interests in a variable interest entity (“VIE”). If we determine that we have a variable interest in a VIE, we then evaluate if we are the primary beneficiary of the VIE. The evaluation is a qualitative assessment as to whether we have the ability to direct the activities of a VIE that most significantly impact the entity’s economic performance. We consolidate each VIE in which we, by virtue of or transactions with our investments in the entity, are considered to be the primary beneficiary.
81
Table of Contents
Index to Financial Statements
At December 31, 2016, we had loans and/or equity investments in certain VIEs, which are also tenants of our facilities, (including but not limited to Ernest and Vibra). We have determined that we are not the primary beneficiary of these VIEs. The carrying value and classification of the related assets and maximum exposure to loss as a result of our involvement with these VIEs are presented below at December 31, 2016 (in thousands):
| VIE Type |
Maximum Loss Exposure(1) |
Asset Type Classification |
Carrying Amount(2) |
|||||||||
| Loans, net |
$ | 316,179 | Mortgage and other loans | $ | 235,613 | |||||||
| Equity investments |
$ | 13,223 | Other assets | $ | 140 | |||||||
| (1) | Our maximum loss exposure related to loans with VIEs represents our current aggregate gross carrying value of the loan plus accrued interest and any other related assets (such as rent receivables), less any liabilities. Our maximum loss exposure related to our equity investment in VIEs represent the current carrying values of such investment plus any other related assets (such as rent receivables) less any liabilities. |
| (2) | Carrying amount reflects the net book value of our loan or equity interest only in the VIE. |
For the VIE types above, we do not consolidate the VIE because we do not have the ability to control the activities (such as the day-to-day healthcare operations of our borrowers or investees) that most significantly impact the VIE’s economic performance. As of December 31, 2016, we were not required to provide financial support through a liquidity arrangement or otherwise to our unconsolidated VIEs, including circumstances in which it could be exposed to further losses (e.g., cash short falls).
Typically, our loans are collateralized by assets of the borrower (some assets of which are on the premises of facilities owned by us) and further supported by limited guarantees made by certain principals of the borrower.
See Note 3 and 10 for additional description of the nature, purpose and activities of some of our VIEs and interests therein.
Investments in Unconsolidated Entities: Investments in entities in which we have the ability to influence (but not control) are typically accounted for by the equity method. Under the equity method of accounting, our share of the investee’s earnings or losses are included in our consolidated statements of net income, and we have elected to record our share of such investee’s earnings or losses on a 90-day lag basis. The initial carrying value of investments in unconsolidated entities is based on the amount paid to purchase the interest in the investee entity. Subsequently, our investments are increased/decreased by our share in the investees’ earnings and decreased by cash distributions from our investees. To the extent that our cost basis is different from the basis reflected at the investee entity level, the basis difference is generally amortized over the lives of the related assets and liabilities, and such amortization is included in our share of equity in earnings of the investee.
Investments in entities in which we do not control nor do we have the ability to influence (such as our investments in Steward and MEDIAN) are accounted for using the cost method. The initial carrying value of such investments is based on the amount paid to purchase the interest in the investee entity. No income is recorded on our cost method investments until distributions are received.
We evaluate our equity and cost method investments for impairment based upon a comparison of the fair value of the equity method investment to its carrying value, when impairment indicators exist. If we determine a decline in the fair value of an investment in an unconsolidated investee entity below its carrying value is other-than-temporary, an impairment is recorded.
Cash and Cash Equivalents: Certificates of deposit, short-term investments with original maturities of three months or less and money-market mutual funds are considered cash equivalents. The majority of our cash and cash equivalents are held at major commercial banks, which at times may exceed the Federal Deposit Insurance Corporation limit. We have not experienced any losses to date on our invested cash. Cash and cash equivalents which have been restricted as to its use are recorded in other assets.
82
Table of Contents
Index to Financial Statements
Revenue Recognition: We receive income from operating leases based on the fixed, minimum required rents (base rents) per the lease agreements. Rent revenue from base rents is recorded on the straight-line method over the terms of the related lease agreements for new leases and the remaining terms of existing leases for those acquired as part of a property acquisition. The straight-line method records the periodic average amount of base rent earned over the term of a lease, taking into account contractual rent increases over the lease term. The straight-line method typically has the effect of recording more rent revenue from a lease than a tenant is required to pay early in the term of the lease. During the later parts of a lease term, this effect reverses with less rent revenue recorded than a tenant is required to pay. Rent revenue, as recorded on the straight-line method, in the consolidated statements of net income is presented as two amounts: rent billed and straight-line revenue. Rent billed revenue is the amount of base rent actually billed to the customer each period as required by the lease. Straight-line rent revenue is the difference between rent revenue earned based on the straight-line method and the amount recorded as rent billed revenue. We record the difference between base rent revenues earned and amounts due per the respective lease agreements, as applicable, as an increase or decrease to straight-line rent receivable.
Certain leases may provide for additional rents contingent upon a percentage of the tenant’s revenue in excess of specified base amounts/thresholds (percentage rents). Percentage rents are recognized in the period in which revenue thresholds are met. Rental payments received prior to their recognition as income are classified as deferred revenue. We also receive additional rent (contingent rent) under some leases based on increases in the CPI or when the CPI exceeds the annual minimum percentage increase in the lease. Contingent rents are recorded as rent billed revenue in the period earned.
We use DFL accounting to record rent on certain leases deemed to be financing leases, per accounting rules, rather than operating leases. For leases accounted for as DFLs, the future minimum lease payments are recorded as a receivable. The difference between the future minimum lease payments and the estimated residual values less the cost of the properties is recorded as unearned income. Unearned income is deferred and amortized to income over the lease terms to provide a constant yield when collectability of the lease payments is reasonably assured. Investments in DFLs are presented net of unearned income.
In instances where we have a profits or equity interest in our tenants’ operations, we record income equal to our percentage interest of the tenants’ profits, as defined in the lease or tenants’ operating agreements, once annual thresholds, if any, are met.
We begin recording base rent income from our development projects when the lessee takes physical possession of the facility, which may be different from the stated start date of the lease. Also, during construction of our development projects, we are generally entitled to accrue rent based on the cost paid during the construction period (construction period rent). We accrue construction period rent as a receivable with a corresponding offset to deferred revenue during the construction period. When the lessee takes physical possession of the facility, we begin recognizing the deferred construction period revenue on the straight-line method over the remaining term of the lease.
We receive interest income from our tenants/borrowers on mortgage loans, working capital loans, and other long-term loans. Interest income from these loans is recognized as earned based upon the principal outstanding and terms of the loans.
Commitment fees received from lessees for development and leasing services are initially recorded as deferred revenue and recognized as income over the initial term of a lease to produce a constant effective yield on the lease (interest method). Commitment and origination fees from lending services are also recorded as deferred revenue initially and recognized as income over the life of the loan using the interest method.
Tenant payments for certain taxes, insurance, and other operating expenses related to our facilities (most of which are paid directly by our tenants to the government or appropriate third party vendor) are recorded net of the respective expense as generally our leases are “triple-net” leases, with terms requiring such expenses to be
83
Table of Contents
Index to Financial Statements
paid by our tenants. Failure on the part of our tenants to pay such expense or to pay late would result in a violation of the lease agreement, which could lead to an event of default, if not cured.
Acquired Real Estate Purchase Price Allocation: For existing properties acquired for leasing purposes, we account for such acquisitions based on business combination accounting rules. We allocate the purchase price of acquired properties to net tangible and identified intangible assets acquired based on their fair values. In making estimates of fair values for purposes of allocating purchase prices of acquired real estate, we may utilize a number of sources, from time to time, including available real estate broker data, independent appraisals that may be obtained in connection with the acquisition or financing of the respective property, internal data from previous acquisitions or developments, and other market data. We also consider information obtained about each property as a result of our pre-acquisition due diligence, marketing and leasing activities in estimating the fair value of the tangible and intangible assets acquired.
We measure the aggregate value of lease intangible assets acquired based on the difference between (i) the property valued with new or in-place leases adjusted to market rental rates and (ii) the property valued as if vacant. Management’s estimates of value are made using methods similar to those used by independent appraisers (e.g., discounted cash flow analysis). Factors considered by management in our analysis include an estimate of carrying costs during hypothetical expected lease-up periods, considering current market conditions, and costs to execute similar leases. We also consider information obtained about each targeted facility as a result of our pre-acquisition due diligence, marketing, and leasing activities in estimating the fair value of the intangible assets acquired. In estimating carrying costs, management includes real estate taxes, insurance and other operating expenses and estimates of lost rentals at market rates during the expected lease-up periods, which we expect to be about six months depending on specific local market conditions. Management also estimates costs to execute similar leases including leasing commissions, legal costs, and other related expenses to the extent that such costs are not already incurred in connection with a new lease origination as part of the transaction.
We record above-market and below-market in-place lease values, if any, for our facilities, which are based on the present value of the difference between (i) the contractual amounts to be paid pursuant to the in-place leases and (ii) management’s estimate of fair market lease rates for the corresponding in-place leases, measured over a period equal to the remaining non-cancelable term of the lease. We amortize any resulting capitalized above-market lease values as a reduction of rental income over the lease term. We amortize any resulting capitalized below-market lease values as an increase to rental income over the lease term.
Other intangible assets acquired may include customer relationship intangible values which are based on management’s evaluation of the specific characteristics of each prospective tenant’s lease and our overall relationship with that tenant. Characteristics to be considered by management in allocating these values include the nature and extent of our existing business relationships with the tenant, growth prospects for developing new business with the tenant, the tenant’s credit quality and expectations of lease renewals, including those existing under the terms of the lease agreement, among other factors.
We amortize the value of these intangible assets to expense over the term of the respective leases. If a lease is terminated early, the unamortized portion of the lease intangibles are charged to expense.
Goodwill: Goodwill is deemed to have an indefinite economic life and is not subject to amortization. Goodwill is tested annually for impairment and is tested for impairment more frequently if events and circumstances indicate that the asset might be impaired. The impairment testing involves a two-step approach. The first step determines if goodwill is impaired by comparing the fair value of the reporting unit as a whole to its book value. If a deficiency exists, the second step measures the amount of the impairment loss as the difference between the implied fair value of goodwill and its carrying value.
Real Estate and Depreciation: Real estate, consisting of land, buildings and improvements, are maintained at cost. Although typically paid by our tenants, any expenditure for ordinary maintenance and repairs that we pay
84
Table of Contents
Index to Financial Statements
are expensed to operations as incurred. Significant renovations and improvements which improve and/or extend the useful life of the asset are capitalized and depreciated over their estimated useful lives. We record impairment losses on long-lived assets used in operations when events and circumstances indicate that the assets might be impaired and the undiscounted cash flows estimated to be generated by those assets, including an estimated liquidation amount, during the expected holding periods are less than the carrying amounts of those assets. Impairment losses are measured as the difference between carrying value and fair value of the assets. For assets held for sale, we cease recording depreciation expense and adjust the assets’ value to the lower of its carrying value or fair value, less cost of disposal. Fair value is based on estimated cash flows discounted at a risk-adjusted rate of interest. We classify real estate assets as held for sale when we have commenced an active program to sell the assets, and in the opinion of management, it is probable the asset will be sold within the next 12 months.
Construction in progress includes the cost of land, the cost of construction of buildings, improvements and fixed equipment, and costs for design and engineering. Other costs, such as interest, legal, property taxes and corporate project supervision, which can be directly associated with the project during construction, are also included in construction in progress. We commence capitalization of costs associated with a development project when the development of the future asset is probable and activities necessary to get the underlying property ready for its intended use have been initiated. We stop the capitalization of costs when the property is substantially complete and ready for its intended use.
Depreciation is calculated on the straight-line method over the estimated useful lives of the related real estate and other assets. Our weighted-average useful lives at December 31, 2016 are as follows:
| Buildings and improvements |
38.8 years | |||
| Tenant lease intangibles |
23.9 years | |||
| Leasehold improvements |
17.9 years | |||
| Furniture, equipment and other |
9.5 years |
Losses from Rent Receivables: For all leases, we continuously monitor the performance of our existing tenants including, but not limited to: admission levels and surgery/procedure volumes by type; current operating margins; ratio of our tenants’ operating margins both to facility rent and to facility rent plus other fixed costs; trends in cash collections; trends in revenue and patient mix; and the effect of evolving healthcare regulations on tenants’ profitability and liquidity.
Losses from Operating Lease Receivables: We utilize the information above along with the tenant’s payment and default history in evaluating (on a property-by-property basis) whether or not a provision for losses on outstanding rent receivables is needed. A provision for losses on rent receivables (including straight-line rent receivables) is ultimately recorded when it becomes probable that the receivable will not be collected in full. The provision is an amount which reduces the receivable to its estimated net realizable value based on a determination of the eventual amounts to be collected either from the debtor or from existing collateral, if any.
Losses on DFL Receivables: Allowances are established for DFLs based upon an estimate of probable losses on a property-by-property basis. DFLs are impaired when it is deemed probable that we will be unable to collect all amounts due in accordance with the contractual terms of the lease. Like operating lease receivables, the need for an allowance is based upon our assessment of the lessee’s overall financial condition; economic resources and payment record; the prospects for support from any financially responsible guarantors; and, if appropriate, the realizable value of any collateral. These estimates consider all available evidence including the expected future cash flows discounted at the DFL’s effective interest rate, fair value of collateral, and other relevant factors, as appropriate. DFLs are placed on non-accrual status when we determine that the collectability of contractual amounts is not reasonably assured. If on non-accrual status, we generally account for the DFLs on a cash basis, in which income is recognized only upon receipt of cash.
85
Table of Contents
Index to Financial Statements
Loans: Loans consist of mortgage loans, working capital loans and other long-term loans. Mortgage loans are collateralized by interests in real property. Working capital and other long-term loans are generally collateralized by interests in receivables and corporate and individual guarantees. We record loans at cost. We evaluate the collectability of both interest and principal on a loan-by-loan basis (using the same process as we do for assessing the collectability of rents) to determine whether they are impaired. A loan is considered impaired when, based on current information and events, it is probable that we will be unable to collect all amounts due according to the existing contractual terms. When a loan is considered to be impaired, the amount of the allowance is calculated by comparing the recorded investment to either the value determined by discounting the expected future cash flows using the loan’s effective interest rate or to the fair value of the collateral, if the loan is collateral dependent. If a loan is deemed to be impaired, we generally place the loan on non-accrual status and record interest income only upon receipt of cash.
Earnings Per Share/Units: Basic earnings per common share/unit is computed by dividing net income applicable to common shares/units by the weighted number of shares/units of common stock/units outstanding during the period. Diluted earnings per common share/units is calculated by including the effect of dilutive securities.
Our unvested restricted stock/unit awards contain non-forfeitable rights to dividends, and accordingly, these awards are deemed to be participating securities. These participating securities are included in the earnings allocation in computing both basic and diluted earnings per common share/unit.
Income Taxes: We conduct our business as a REIT under Sections 856 through 860 of the Code. To qualify as a REIT, we must meet certain organizational and operational requirements, including a requirement to distribute to stockholders at least 90% of our REIT’s ordinary taxable income. As a REIT, we generally pay little federal and state income tax because of the dividends paid deduction that we are allowed to take. If we fail to qualify as a REIT in any taxable year, we will then be subject to federal income taxes on our taxable income at regular corporate rates and will not be permitted to qualify for treatment as a REIT for federal income tax purposes for four years following the year during which qualification is lost, unless the IRS grants us relief under certain statutory provisions. Such an event could materially adversely affect our net income and net cash available for distribution to stockholders. However, we intend to operate in such a manner so that we will remain qualified as a REIT for federal income tax purposes.
Our financial statements include the operations of TRSs, including MPT Development Services, Inc. (“MDS”), along with many other entities, which are single member LLCs that are disregarded for tax purposes and are reflected in the tax returns of MDS. Our TRS entities are not entitled to a dividends paid deduction and are subject to federal, state, and local income taxes. Our TRS entities are authorized to provide property development, leasing, and management services for third-party owned properties, and they may make loans to and/or investments in our lessees.
With the property acquisitions and investments in Europe, we are subject to income taxes internationally. However, we do not expect to incur any additional income taxes in the U.S. as such income from our international properties will flow through our REIT income tax returns. For our TRS and international subsidiaries, we determine deferred tax assets and liabilities based on the differences between the financial reporting and tax bases of assets and liabilities using enacted tax rates in effect for the year in which the differences are expected to reverse. Any increase or decrease in our deferred tax receivables/liabilities that results from a change in circumstances and that causes us to change our judgment about expected future tax consequences of events, is reflected in our tax provision when such changes occur. Deferred income taxes also reflect the impact of operating loss carryforwards. A valuation allowance is provided if we believe it is more likely than not that all or some portion of our deferred tax assets will not be realized. Any increase or decrease in the valuation allowance that results from a change in circumstances, and that causes us to change our judgment about the realizability of the related deferred tax asset, is reflected in our tax provision when such changes occur.
86
Table of Contents
Index to Financial Statements
The calculation of our tax liabilities involve dealing with uncertainties in the application of complex tax laws and regulations in a multitude of jurisdictions across our global operations. A tax benefit from an uncertain tax position may be recognized when it is more likely than not that the position will be sustained upon examination, including resolutions of any related appeals or litigation processes, on the basis of technical merits. However, if a more likely than not position cannot be reached, we record a liability as an off-set to the tax benefit and adjust the liabilities when our judgment changes as a result of the evaluation of new information not previously available. Because of the complexity of some of these uncertainties, the ultimate resolution may result in a payment that is materially different from our current estimate of the uncertain tax position liabilities. These differences will be reflected as increases or decreases to income tax expense in the period in which new information is available.
Stock-Based Compensation: We adopted the 2013 Equity Incentive Plan (the “Equity Incentive Plan”) during the second quarter of 2013. Awards of restricted stock, stock options and other equity-based awards with service conditions are amortized to compensation expense over the vesting periods (typically three years), using the straight-line method. Awards that contain market conditions are amortized to compensation expense over the derived vesting periods, which correspond to the periods over which we estimate the awards will be earned, which generally range from three to five years, using the straight-line method. Awards with performance conditions are amortized using the straight-line method over the service period in which the performance conditions are measured, adjusted for the probability of achieving the performance conditions. Forfeitures of stock-based awards are recognized as they occur.
Deferred Costs: Costs incurred that directly relate to the offerings of stock are deferred and netted against proceeds received from the offering. Leasing commissions and other leasing costs directly attributable to tenant leases are capitalized as deferred leasing costs and amortized on the straight-line method over the terms of the related lease agreements. Costs identifiable with loans made to borrowers are recognized as a reduction in interest income over the life of the loan.
Deferred Financing Costs: We amortize deferred financing costs incurred in connection with anticipated financings and refinancings of debt. These costs are amortized over the lives of the related debt as an addition to interest expense. For debt with defined principal re-payment terms, the deferred costs are amortized to produce a constant effective yield on the debt (interest method) and are included within Debt, net on our consolidated balance sheets. For debt without defined principal repayment terms, such as revolving credit agreements, the deferred costs are amortized on the straight-line method over the term of the debt and are included as a component of Other Assets on our consolidated balance sheets.
Foreign Currency Translation and Transactions: Certain of our international subsidiaries’ functional currencies are the local currencies of their respective countries. We translate the results of operations of our foreign subsidiaries into U.S. dollars using average rates of exchange in effect during the period, and we translate balance sheet accounts using exchange rates in effect at the end of the period. We record resulting currency translation adjustments in accumulated other comprehensive income (loss), a component of stockholders’ equity on our consolidated balance sheets.
Certain of our U.S. subsidiaries will enter into short-term and long-term transactions denominated in a foreign currency from time to time. Gains or losses resulting from these foreign currency transactions are translated into U.S. dollars at the rates of exchange prevailing at the dates of the transactions. The effects of transaction gains or losses on our short-term transactions are included in other income in the consolidated statements of income, while the translation effects on our long-term investments are recorded in accumulated other comprehensive income (loss) on our consolidated balance sheets.
Derivative Financial Investments and Hedging Activities: During our normal course of business, we may use certain types of derivative instruments for the purpose of managing interest rate and/or foreign currency risk. We record our derivative and hedging instruments at fair value on the balance sheet. Changes in the estimated fair value of derivative instruments that are not designated as hedges or that do not meet the criteria for hedge
87
Table of Contents
Index to Financial Statements
accounting are recognized in earnings. For derivatives designated as cash flow hedges, the change in the estimated fair value of the effective portion of the derivative is recognized in accumulated other comprehensive income (loss), whereas the change in the estimated fair value of the ineffective portion is recognized in earnings. For derivatives designated as fair value hedges, the change in the estimated fair value of the effective portion of the derivatives offsets the change in the estimated fair value of the hedged item, whereas the change in the estimated fair value of the ineffective portion is recognized in earnings.
To qualify for hedge accounting, we formally document all relationships between hedging instruments and hedged items, as well as our risk management objective and strategy for undertaking the hedge prior to entering into a derivative transaction. This process includes specific identification of the hedging instrument and the hedge transaction, the nature of the risk being hedged and how the hedging instrument’s effectiveness in hedging the exposure to the hedged transaction’s variability in cash flows attributable to the hedged risk will be assessed. Both at the inception of the hedge and on an ongoing basis, we assess whether the derivatives that are used in hedging transactions are highly effective in offsetting changes in cash flows or fair values of hedged items. In addition, for cash flow hedges, we assess whether the underlying forecasted transaction will occur. We discontinue hedge accounting if a derivative is not determined to be highly effective as a hedge or that it is probable that the underlying forecasted transaction will not occur.
Fair Value Measurement: We measure and disclose the estimated fair value of financial assets and liabilities utilizing a hierarchy of valuation techniques based on whether the inputs to a fair value measurement are considered to be observable or unobservable in a marketplace. Observable inputs reflect market data obtained from independent sources, while unobservable inputs reflect our market assumptions. This hierarchy requires the use of observable market data when available. These inputs have created the following fair value hierarchy:
| • | Level 1 — quoted prices for identical instruments in active markets; |
| • | Level 2 — quoted prices for similar instruments in active markets; quoted prices for identical or similar instruments in markets that are not active; and model-derived valuations in which significant inputs and significant value drivers are observable in active markets; and |
| • | Level 3 — fair value measurements derived from valuation techniques in which one or more significant inputs or significant value drivers are unobservable. |
We measure fair value using a set of standardized procedures that are outlined herein for all assets and liabilities which are required to be measured at their estimated fair value on either a recurring or non-recurring basis. When available, we utilize quoted market prices from an independent third party source to determine fair value and classify such items in Level 1. In some instances where a market price is available, but the instrument is in an inactive or over-the-counter market, we apply the dealer (market maker) pricing estimate and classify the asset or liability in Level 2.
If quoted market prices or inputs are not available, fair value measurements are based upon valuation models that utilize current market or independently sourced market inputs, such as interest rates, option volatilities, credit spreads, market capitalization rates, etc. Items valued using such internally-generated valuation techniques are classified according to the lowest level input that is significant to the fair value measurement. As a result, the asset or liability could be classified in either Level 2 or 3 even though there may be some significant inputs that are readily observable. Internal fair value models and techniques used by us include discounted cash flow and Monte Carlo valuation models. We also consider our counterparty’s and own credit risk on derivatives and other liabilities measured at their estimated fair value.
Fair Value Option Election: For our equity interest in Ernest along with any related loans (as more fully described in Note 3 and 10), we have elected to account for these investments at fair value due to the size of the investments and because we believe this method is more reflective of current values. Other than the Capella equity investment held at December 31, 2015, we have not made a similar election for other existing equity interest or loans.
88
Table of Contents
Index to Financial Statements
Recent Accounting Developments:
Revenue from Contracts with Customers
In May 2014, the FASB issued Accounting Standards Update (“ASU”) No. 2014-09, “Revenue from Contracts with Customers.” Under the new standard, revenue is recognized at the time a good or service is transferred to a customer for the amount of consideration received for that specific good or service. Entities may use a full retrospective approach or report the cumulative effect as of the date of adoption. On April 1, 2015, the FASB proposed deferring the effective date of this standard by one year to December 15, 2017, for annual reporting periods beginning after that date. The FASB also proposed permitting early adoption of the standard, but not before the original effective date of December 15, 2016. We do not expect this standard to have a significant impact on our financial results, as a substantial portion of our revenue consists of rental income from leasing arrangements, which are specifically excluded from ASU No. 2014-09.
Leases
In February 2016, the FASB issued ASU 2016-02, “Leases”, which sets out the principles for the recognition, measurement, presentation and disclosure of leases for both parties to a contract (i.e. lessees and lessors). The new standard requires lessees to apply a dual approach, classifying leases as either finance or operating leases based on the principle of whether or not the lease is effectively a financed purchase by the lessee. This classification will determine whether lease expense is recognized based on an effective interest method or on a straight line basis over the term of the lease. A lessee is also required to record a right-of-use asset and a lease liability for all leases with a term of greater than 12 months regardless of their classification. Leases with a term of 12 months or less will be accounted for similar to existing guidance for operating leases today. The new standard requires lessors to account for leases using an approach that is substantially equivalent to existing guidance for sales-type leases, direct financing leases and operating leases. The ASU is not effective for us until January 1, 2019, with early adoption permitted. We are continuing to evaluate this standard and the impact to us from both a lessor and lessee perspective.
Measurement of Credit Losses on Financial Instruments
In June 2016, the FASB issued ASU 2016-13, “Measurement of Credit Losses on Financial Instruments”, which is intended to improve financial reporting by requiring timely recording of credit losses on loans and other financial instruments held by financial institutions and other organizations. The ASU requires the measurement of all expected credit losses for financial assets not recorded at fair value based on historical experience, current conditions, and reasonable and supportable forecasts. The ASU will be required to be implemented through a cumulative-effect adjustment to retained earnings as of the beginning of the first reporting period in which the amendments are effective. The ASU is not effective for us until January 1, 2019. We do not expect the adoption of this ASU to have a significant impact on our consolidated financial statements.
Classification of Certain Cash Receipts and Cash Payments
In August 2016, the FASB issued ASU No. 2016-15, “Classification of Certain Cash Receipts and Cash Payments”, which clarifies the classification within the statement of cash flows for certain transactions, including debt extinguishment costs, zero-coupon debt, contingent consideration related to business combinations, insurance proceeds, equity method distributions and beneficial interests in securitizations. The standard also clarifies that cash flows with aspects of multiple classes of cash flows or that cannot be separated by source or use should be classified based on the activity that is likely to be the predominant source or use of cash flows for the item. This guidance is effective for us starting January 1, 2018; however, we believe our current cash flow presentation is generally consistent with this standard.
Clarifying the Definition of a Business
In January 2017, the FASB issued ASU No. 2017-01, “Clarifying the Definition of a Business” (“ASU 2017-01”). The amendments in ASU 2017-01 provide an initial screen to determine if substantially all of the fair
89
Table of Contents
Index to Financial Statements
value of the gross assets acquired is concentrated in a single identifiable asset or a group of similar identifiable assets, in which case, the transaction would be accounted for as an asset acquisition. In addition, ASU 2017-01 clarifies the requirements for a set of activities to be considered a business and narrows the definition of an output. ASU 2017-01 is effective for fiscal years, and interim periods within, beginning after December 15, 2017. Early adoption is permitted. A reporting entity must apply the amendments in ASU 2017-01 using a prospective approach. Upon adoption of ASU 2017-01, we expect to recognize a majority of our real estate acquisitions as asset transactions rather than business combinations which will result in the capitalization of related third party transaction costs.
Reclassifications and Revisions:
Certain amounts in the consolidated financial statements for prior periods have been reclassified to conform to the current period presentation.
3. Real Estate and Loans Receivable
Acquisitions
We acquired the following assets:
| 2016 | 2015 | 2014 | ||||||||||
| (in thousands) | ||||||||||||
| Assets Acquired |
||||||||||||
| Land |
$ | 91,176 | $ | 120,746 | $ | 22,569 | ||||||
| Building |
654,772 | 741,935 | 241,242 | |||||||||
| Intangible lease assets — subject to amortization (weighted average useful life of 28.5 years in 2016, 30.0 years in 2015 and 18.2 years in 2014) |
94,614 | 176,383 | 22,513 | |||||||||
| Net investments in direct financing leases |
178,000 | 174,801 | — | |||||||||
| Mortgage loans |
600,000 | 380,000 | — | |||||||||
| Other loans |
— | 523,605 | 447,664 | |||||||||
| Equity investments and other assets |
70,166 | 101,716 | 33,708 | |||||||||
| Liabilities assumed |
(6,319 | ) | (317 | ) | — | |||||||
|
|
|
|
|
|
|
|||||||
| Total assets acquired |
$ | 1,682,409 | $ | 2,218,869 | $ | 767,696 | ||||||
| Loans repaid(1) |
(193,262 | ) | (385,851 | ) | — | |||||||
|
|
|
|
|
|
|
|||||||
| Total net assets acquired |
$ | 1,489,147 | $ | 1,833,018 | $ | 767,696 | ||||||
|
|
|
|
|
|
|
|||||||
| (1) | $93.3 million loans advanced to Capella in 2015 and repaid in 2016 as a part of the Capella transaction, and $100.0 million loans advanced to Prime in 2015 and repaid in 2016 as part of the sale leaseback conversion of four properties in New Jersey. $385.9 million loans advanced to MEDIAN in 2014 and repaid in 2015 as a part of the MEDIAN transaction. |
Purchase price allocations attributable to acquisitions made during the 2016 fourth quarter are preliminary. When all relevant information is obtained, resulting changes, if any, to our provisional purchase price allocation will be adjusted to reflect new information obtained about the facts and circumstances that existed as of the respective acquisition dates that, if known, would have affected the measurement of the amounts recognized as of those dates.
2016 Activity
Acquisition of Steward Portfolio
On October 3, 2016, we closed on a portfolio of nine acute care hospitals in Massachusetts operated by Steward. Our investment in the portfolio includes the acquisition of five hospitals for $600 million, the making of
90
Table of Contents
Index to Financial Statements
$600 million in mortgage loans on four facilities, and a $50 million minority equity contribution in Steward, for a combined investment of $1.25 billion. The five facilities acquired are being leased to Steward under a master lease agreement that has a 15-year term with three 5-year extension options, plus annual inflation-based escalators. The terms of the mortgage loan are substantially similar to the master lease.
Other Acquisitions
From October 27, 2016 to December 31, 2016, we acquired 12 rehabilitation hospitals in Germany for an aggregate purchase price to us of €85.2 million. Of these acquisitions, five properties (totaling €35.7 million) are leased to affiliates of MEDIAN, pursuant to a master lease agreement reached with MEDIAN in 2015. (See “2015 Activity” below for further details of this master lease). The remaining seven properties (totaling €49.5 million) are leased to affiliates of MEDIAN, pursuant to a third master lease that has terms similar to the original master lease in 2015.
On October 21, 2016, we acquired three general acute care hospitals and one free-standing emergency department and health center in New Jersey from Prime (as originally contemplated in the agreements) by reducing the $100 million mortgage loan made in September 2015 and advancing an additional $15 million. We are leasing these properties to Prime pursuant to a fifth master lease, which has a 15-year term with three five-year extension options, plus consumer-price indexed increases.
On July 22, 2016, we acquired an acute care facility in Olympia, Washington in exchange for a $93.3 million loan and an additional $7 million in cash, as contemplated in the initial Capella acquisition transaction in 2015. The terms of the Olympia lease are substantially similar to those of the master lease with Capella post lease amendment. See the Capella Disposal Transaction under the subheading “Disposals” below for further details on the terms of the Capella leases.
On June 22, 2016, we closed on the final property of the initial MEDIAN transaction that began in 2014 for a purchase price of € 41.6 million. See “2015 and 2014 Activity” for a description of the initial MEDIAN Transaction.
On May 2, 2016, we acquired an acute care hospital in Newark, New Jersey for an aggregate purchase price of $63 million leased to Prime pursuant to the fifth master lease. Furthermore, we committed to advance an additional $30 million to Prime over a three-year period to be used solely for capital additions to the real estate; any such addition will be added to the basis upon which the lessee will pay us rents.
From the respective acquisition dates in 2016 through year-end, the properties acquired during the year ended December 31, 2016, contributed $37.4 million and $31.7 million of revenue and income (excluding related acquisition expenses), respectively, for the year ended December 31, 2016. In addition, we incurred $12.1 million of acquisition-related costs on the 2016 acquisitions for the year ended December 31, 2016.
2015 Activity
Acquisition of Capella Portfolio
In July 2015, we entered into definitive agreements to acquire a portfolio of seven acute care hospitals owned and operated by Capella for a combined purchase price and investment of approximately $900 million, adjusted for any cash on hand. The transaction included our investments in seven acute care hospitals (two of which were in the form of mortgage loans) for an aggregate investment of approximately $600 million, an acquisition loan for approximately $290 million and a 49% equity interest in the ongoing operator of the facilities.
In conjunction with the acquisition, MPT Camaro Opco, LLC, a wholly-owned subsidiary of MDS, formed a joint venture limited liability company, Capella Health Holdings, LLC (“Capella Holdings”), with an entity affiliated with the senior management of Capella (“ManageCo”). MPT Camaro Opco, LLC held 49% of the equity interests in Capella Holdings and the ManageCo held the remaining 51%. Capella and its operating subsidiaries were managed and operated by ManageCo pursuant to the terms of one or more management
91
Table of Contents
Index to Financial Statements
agreements, the terms of which included base management fees payable to ManageCo and incentive payments tied to agreed benchmarks. Pursuant to the limited liability company agreement of Capella Holdings, ManageCo and MPT Camaro Opco, LLC shared profits and distributions from Capella Holdings according to a distribution waterfall under which, if certain benchmarks were met, after taking into account interest paid on the acquisition loan, ManageCo and MPT Camaro Opco, LLC shared in cash generated by Capella Holdings in a ratio of 35% to ManageCo and 65% to MPT Camaro Opco, LLC. The limited liability company agreement provided that ManageCo managed Capella Holdings and MPT Camaro Opco, LLC had no management authority or control except for certain protective rights consistent with a passive ownership interest, such as a limited right to approve certain components of the annual budgets and the right to approve extraordinary transactions.
On August 31, 2015, we closed on six of the seven Capella properties, two of which were in the form of mortgage loans. We closed on the seventh property on July 22, 2016 (as discussed above). We entered into a master lease, a stand-alone lease, and mortgage loans for the acquired properties providing for 15-year terms with four 5-year extension options, plus consumer price-indexed increases, limited to a 2% floor and a 4% ceiling annually. The acquisition loan had a 15-year term and carried a fixed interest rate of 8%.
On October 30, 2015, we acquired an additional acute hospital in Camden, South Carolina for an aggregate purchase price of $25.8 million. We leased this hospital to Capella pursuant to the 2015 master lease. In connection with the transaction, we funded an additional acquisition loan to Capella of $9.2 million.
See the Capella Disposal Transaction under the subheading “Disposals” below for an update to this transaction.
MEDIAN Transaction
During early 2015, we made additional loans (as part of the initial MEDIAN transaction discussed below under “2014 Activity”) of approximately € 240 million on behalf of MEDIAN, to complete step one of a two step process to acquire the healthcare real estate of MEDIAN. On April 29, 2015, we entered into a series of definitive agreements with MEDIAN to complete step two, which involved the acquisition of the real estate assets of 32 hospitals owned by MEDIAN for an aggregate purchase price of approximately € 688 million. Upon acquisition, each property became subject to a master lease between us and MEDIAN providing for the leaseback of the property to MEDIAN. The master lease had an initial term of 27 years and provided for annual escalations of rent at the greater of one percent or 70% of the German consumer price index.
At each closing, the purchase price for each facility was reduced and offset against the interim loans made to affiliates of Waterland and MEDIAN and against the amount of any debt assumed or repaid by us in connection with the closing. As part of this transaction, we incurred approximately $37 million of real estate transfer tax in 2015. As of December 31, 2015, we had closed on 31 of the 32 properties for an aggregate amount of € 646 million, and we had no loans outstanding to MEDIAN.
Other Acquisitions
On December 3, 2015, we acquired a 266-bed outpatient rehabilitation clinic located in Hannover, Germany from MEDIAN (formally RHM) for €18.7 million. Upon acquisition, the facility was leased back under the initial master lease with MEDIAN in 2013, providing for a remaining term of 25 years at that time and annual rent increases of 2.0% in 2017 and 0.5% thereafter. On December 31, 2020 and every three years thereafter, rent will also be increased to reflect 70% of cumulative increases in the German CPI.
On November 18, 2015, we acquired seven acute care hospitals and a freestanding clinic in northern Italy for an aggregate purchase price to us of approximately €90 million. The acquisition was effected through a newly-formed joint venture between us and affiliates of AXA Real Estate, in which we own a 50% interest. The facilities are leased to an Italian acute care hospital operator, pursuant to a long-term master lease. We are accounting for our 50% interest in this joint venture under the equity method.
92
Table of Contents
Index to Financial Statements
On September 30, 2015, we provided a $100 million mortgage financing to Prime for three general acute care hospitals and one free-standing emergency department and health center in New Jersey. The loan had a five-year term and provided for consumer-priced indexed interest increases, subject to a floor. As previously noted above, we acquired these facilities in October 2016 by reducing the mortgage loan and advancing an additional $15 million.
On September 9, 2015, we acquired the real estate of a general acute care hospital under development located in Valencia, Spain. The acquisition was effected through a newly-formed joint venture between us and clients of AXA Real Estate, in which we will own a 50% interest. Our expected share of the aggregate purchase and development price is €21.4 million. Upon completion, the facility will be leased to a Spanish operator of acute care hospitals, pursuant to a long-term lease. We expect construction to be complete on this facility in the second quarter of 2017.
On August 31, 2015, we closed on a $30 million mortgage loan transaction with Prime for the acquisition of Lake Huron Medical Center, a 144-bed general acute care hospital located in Port Huron, Michigan. The loan provided for consumer-priced indexed interest increases, subject to a floor. The mortgage loan had a five-year term with conversion rights to our standard sale leaseback agreement, which we exercised on December 31, 2015, when we acquired the real estate of Lake Huron Medical Center for $20 million, which reduced the mortgage loan accordingly. The facility is being leased to Prime under our master lease agreement.
On June 16, 2015, we acquired the real estate of two facilities in Lubbock, Texas, a 60-bed inpatient rehabilitation hospital and a 37-bed LTACH, for an aggregate purchase price of $31.5 million. We entered into a 20-year lease with Ernest for the rehabilitation hospital, which provides for three five-year extension options, and separately entered into a lease with Ernest for the long-term acute care hospital that has a final term ending December 31, 2034. In connection with the transaction, we funded an acquisition loan to Ernest of approximately $12.0 million. Ernest operates the rehabilitation hospital in a joint venture with Covenant Health System. Effective July 18, 2016, we amended the lease of the rehabilitation hospital to include the long-term acute care hospital. Ernest’s plans are to convert the long-term acute care facility into a rehabilitation facility by the second quarter of 2017.
On February 27, 2015, we acquired an inpatient rehabilitation hospital in Weslaco, Texas for $10.7 million. We have leased this hospital to Ernest pursuant to the 2012 master lease, which had a remaining 17-year fixed term at that time and three extension options of five years each. This lease provides for consumer-priced-indexed annual rent increases, subject to a floor and a cap. In addition, we funded an acquisition loan in the amount of $5 million.
On February 13, 2015, we acquired two general acute care hospitals in the Kansas City area for $110 million. Prime is the tenant and operator pursuant to a new master lease that has similar terms and security enhancements as the other master lease agreements entered into in 2013. This master lease has a 10-year initial fixed term with two extension options of five years each. The lease provides for consumer-price-indexed annual rent increases, subject to a specified floor. In addition, we funded a mortgage loan in the amount of $40 million, which has a 10-year term.
From the respective acquisition dates in 2015 through that year end, the properties and mortgage loans acquired in 2015 contributed $102.7 million and $87.7 million of revenue and income (excluding related acquisition expenses), respectively, for the year ended December 31, 2015. In addition, we incurred $58 million of acquisition related costs on the 2015 acquisitions for the year ended December 31, 2015.
2014 Activity
MEDIAN Transaction
On October 15, 2014, we entered into definitive agreements pursuant to which we would acquire substantially all the real estate assets of MEDIAN. The transaction was structured using a two step process in
93
Table of Contents
Index to Financial Statements
partnership with affiliates of Waterland. In the first step, an affiliate of Waterland acquired 94.9% of the outstanding equity interest in MEDIAN pursuant to a stock purchase agreement with MEDIAN’s current owners. We indirectly acquired the remaining 5.1% of the outstanding equity interest and provided or committed to provide interim acquisition loans to Waterland and MEDIAN in aggregate amounts of approximately €425 million, of which €349 million had been advanced at December 31, 2014. These interim loans bore interest at a rate similar to the initial lease rate under the planned sale and leaseback transactions. See “2015 and 2016 Activity” for an update on the second step of this transaction — the sale-leaseback of the real estate.
Other Acquisitions
In the fourth quarter of 2014, we acquired three RHM (now MEDIAN) rehabilitation facilities in Germany for an aggregate purchase price of € 63.6 million (approximately $81 million based on currency exchange rates at that time) including approximately € 3.0 million (or approximately $3.6 million) of transfer and other taxes that have been expensed as acquisition costs. These facilities included: Bad Mergentheim (211 beds), Bad Tolz (248 beds), and Bad Liebenstein (271 beds). All three properties are included under our initial master lease agreement with MEDIAN in 2013.
On October 31, 2014, we acquired a 237-bed acute care hospital, associated medical office buildings, and a behavioral health facility in Sherman, Texas for $32.5 million. Alecto is the tenant and operator pursuant to a 15-year lease agreement with three five-year extension options. In addition, we funded a working capital loan of $7.5 million, and we obtained a 20% interest in the operator of the facility.
On September 19, 2014, we acquired an acute care hospital in Fairmont, West Virginia for an aggregate purchase price of $15 million from Alecto. The facility was simultaneously leased back to the seller under a 15-year initial term with three five-year extension options. In addition, we made a $5 million working capital loan to the tenant with a five year term and a commitment to fund up to $5 million in capital improvements. Finally, we obtained a 20% interest in the operator of this facility.
On July 1, 2014, we acquired an acute care hospital in Peasedown St. John, United Kingdom from Circle Health Ltd. (“Circle”), through its subsidiary Circle Hospital (Bath) Ltd. The sale/leaseback transaction, excluding any transfer taxes, was valued at approximately £28.3 million (or approximately $48.0 million based on exchange rates at that time). The lease has an initial term of 15-years with a tenant option to extend the lease for an additional 15 years. The lease includes annual rent increases, which will equal the year-over-year change in the retail price index with a floor of 2% and a cap of 5%. With the transaction, we incurred approximately £1.1 million (approximately $1.9 million) of transfer and other taxes that have been expensed as acquisition costs.
On March 31, 2014, we acquired a general acute care hospital and an adjacent parcel of land for an aggregate purchase price of $115 million from a joint venture of LHP Hospital Group, Inc. and Hackensack University Medical Center Mountainside. The facility was simultaneously leased back to the seller under a lease with a 15-year initial term with a 3-year extension option, followed by a further 12-year extension option at fair market value. The lease provides for consumer price-indexed annual rent increases, subject to a specified floor and ceiling. The lease includes a customary right of first refusal with respect to a subsequent proposed sale of the facility.
From the respective acquisition dates in 2014 through that year end, the 2014 acquisitions contributed $12.4 million and $8.7 million of revenue and income (excluding related acquisition and financing expenses) for the period ended December 31, 2014. In addition, we incurred $26.4 million of acquisition related expenses in 2014, of which $25.2 million (including $5.8 million in transfer taxes as part of our MEDIAN and Circle transactions) related to acquisitions consummated as of December 31, 2014.
94
Table of Contents
Index to Financial Statements
Pro Forma Information
The following unaudited supplemental pro forma operating data is presented below as if each acquisition was completed on January 1, 2015 and January 1, 2014 for the year ended December 31, 2016 and 2015, respectively. The unaudited supplemental pro forma operating data is not necessarily indicative of what the actual would have been assuming the transactions had been completed as set forth above, nor do they purport to represent our results of operations for future periods (in thousands, except per share/unit amounts).
| For the Year Ended December 31, (Unaudited) |
||||||||
| 2016 | 2015 | |||||||
| Total revenues |
$ | 627,583 | $ | 624,443 | ||||
| Net income |
310,019 | 306,756 | ||||||
| Net income per share/unit |
$ | 0.97 | $ | 0.96 | ||||
Development Activities
2016 Activity
During 2016, we completed construction and began recording rental income on the following facilities:
| • | Adeptus Health — We completed 19 acute care facilities for this tenant during 2016. These facilities are leased pursuant to the master leases entered into in both 2014 and 2015 and are cross-defaulted with each other and with the original master lease executed in 2013. |
| • | Ernest Toledo — This $18.4 million inpatient rehabilitation facility located in Toledo, Ohio opened on April 1, 2016 and is being leased to Ernest pursuant to the original 2012 master lease. |
On August 23, 2016, we entered into an agreement to finance the development of and lease an inpatient rehabilitation facility in Flagstaff, Arizona, for $28.1 million, which will be leased to Ernest pursuant to a stand-alone lease, which has terms generally similar to the original master lease. The facility is expected to be completed in the third quarter of 2017.
2015 Activity
During 2015, we completed construction and began recording rental income on the following facilities:
| • | Adeptus Health — We completed 17 acute care facilities for this tenant during 2015 totaling $102.6 million. Fourteen of these facilities are leased pursuant to the master lease entered into in 2014 and are cross-defaulted with the original master lease executed with Adeptus Health in 2013. Three properties are leased pursuant to the master lease entered into in 2015 and are cross-defaulted with the master leases entered into in 2014 and 2013. |
| • | UAB Medical West — This $8.6 million acute care facility and medical office building located in Birmingham, Alabama is leased to Medical West, an affiliate of The University of Alabama at Birmingham, for 15 years and contains four renewal options of five years each. The rent increases 2% annually. |
In April 2015, we executed an agreement with Adeptus Health that provides for the acquisition and development of general acute care hospitals and free standing emergency facilities with an aggregate commitment of $250 million. These facilities will be leased to Adeptus Health pursuant to the terms of the 2014 and 2015 master lease agreements that have a 15-year initial term with three extension options of five years each that provide for annual rent increases based on changes in the CPI with a 2% minimum. With this commitment, along with similar agreements entered into in 2014 and 2013, we have committed to fund up to $500 million in acute care facilities with Adeptus Health. At December 31, 2016, we have 54 completed and open facilities and five still under construction. See table below for an update on our remaining commitments to Adeptus Health.
95
Table of Contents
Index to Financial Statements
2014 Activity
During 2014, we completed construction and began recording rental income on the following facilities:
| • | Northern Utah Rehabilitation Hospital — This $19 million inpatient rehabilitation facility located in South Ogden, Utah is leased to Ernest pursuant to the 2012 master lease. |
| • | Oakleaf Surgical Hospital — This approximately $30 million acute care facility located in Altoona, Wisconsin. This facility is leased to National Surgical Hospitals for 15 years and contains two renewal options of five years each plus an additional option for nearly another five years, and the rent increases annually based on changes in the consumer price-index. |
| • | Adeptus Health — We completed 17 acute care facilities for this tenant during 2014 totaling approximately $83.0 million. These facilities are leased pursuant to the master lease entered into in 2013. |
See table below for a status update on our current development projects (in thousands):
| Operator |
Commitment | Costs Incurred as of 12/31/16 |
Estimated Completion Date |
|||||||||
| Adeptus Health |
$ | 5,848 | $ | 2,710 | 1Q 2017 | |||||||
| Adeptus Health |
67,185 | 44,948 | 2Q 2017 | |||||||||
| Ernest Health |
28,067 | 4,342 | 4Q 2017 | |||||||||
| Adeptus Health |
7,804 | 1,648 | 1Q 2018 | |||||||||
| Adeptus Health |
53,866 | — | Various | |||||||||
|
|
|
|
|
|||||||||
| $ | 162,770 | $ | 53,648 | |||||||||
|
|
|
|
|
|||||||||
Disposals
2016 Activity
Capella Disposal Transaction
On March 21, 2016, we entered into definitive agreements with RegionalCare, an affiliate of certain funds managed by affiliates of Apollo Global Management, LLC (together with its consolidated subsidiaries, “Apollo”), under which our investment in the operations of Capella would be merged with RegionalCare, forming RCCH.
On April 29, 2016, this transaction closed and funded, effective April 30, 2016. As part of the transaction, we received net proceeds of approximately $550 million including approximately $492 million for our equity investment and loans made as part of the original Capella acquisition that closed on August 31, 2015. In addition, we received $210 million in prepayment of two mortgage loans for hospitals in Russellville, Arkansas, and Lawton, Oklahoma, that we made to subsidiaries of Capella in connection with the Capella transaction on August 31, 2015. We made a new $93.3 million loan for a hospital property in Olympia, Washington (which was subsequently converted to real estate on July 22, 2016 as previously disclosed). Additionally, we and an Apollo affiliate invested $50 million each in unsecured senior notes issued by RegionalCare, which we sold to a large institution on June 20, 2016 at par. The proceeds from this transaction represented the recoverability of our investment in full, except for transaction costs incurred of $6.3 million.
We maintained our ownership of five Capella hospitals in Hot Springs, Arkansas; Camden, South Carolina; Hartsville, South Carolina; Muskogee, Oklahoma; and McMinnville, Oregon. Pursuant to the transaction described above, the underlying leases, one of which is a master lease covering all but one property, was amended to shorten the initial fixed lease term (to 13.5 years for the master lease and 11.5 years for the other stand-alone lease) , increase the security deposit, and eliminate the lessees’ purchase option provisions. Due to this lease amendment, we reclassified the lease of the properties under the master lease from a DFL to an operating lease. This reclassification resulted in a write-off of $2.6 million in unbilled DFL rent in the 2016 second quarter.
96
Table of Contents
Index to Financial Statements
Post Acute Transaction
On May 23, 2016, we sold five properties (three of which were in Texas and two in Louisiana) that were leased and operated by Post Acute. As part of this transaction, our outstanding loans of $4 million were paid in full, and we recovered our investment in the operations. Total proceeds from this transaction were $71 million, resulting in a net gain of approximately $15 million.
Corinth Transaction
On June 17, 2016, we sold the Atrium Medical Center real estate located in Corinth, Texas, which was leased and operated by Corinth Investor Holdings. Total proceeds from the transaction were $28 million, resulting in a gain on the sale of real estate of approximately $8 million. This gain on real estate was offset by approximately $9 million of non-cash charges that included the write-off of our investment in the operations of the facility, straight-line rent receivables, and a lease intangible.
HealthSouth Transaction
On July 20, 2016, we sold three inpatient rehabilitation hospitals located in Texas and operated by HealthSouth for $111.5 million, resulting in a net gain of approximately $45 million.
Summary of Operations for Disposed Assets in 2016
The properties sold during 2016 did not meet the definition of discontinued operations. However, the following represents the operating results (excluding gain on sale, transaction costs, and impairment or other non-cash charges) from these properties (excluding loans repaid in the Capella Disposal Transaction) for the periods presented (in thousands):
| For the Year Ended December 31, | ||||||||||||
| 2016 | 2015 | 2014 | ||||||||||
| Revenues |
$ | 7,851 | $ | 18,112 | $ | 18,225 | ||||||
| Real estate depreciation and amortization |
(1,754 | ) | (3,795 | ) | (3,789 | ) | ||||||
| Property-related expenses |
(114 | ) | (121 | ) | (60 | ) | ||||||
| Other income (expense) |
(23 | ) | 1,079 | 462 | ||||||||
|
|
|
|
|
|
|
|||||||
| Income from real estate dispositions, net |
$ | 5,960 | $ | 15,275 | $ | 14,838 | ||||||
|
|
|
|
|
|
|
|||||||
2015 Activity
On July 30, 2015, we sold a long-term acute care facility in Luling, Texas for approximately $9.7 million, resulting in a gain of $1.5 million. Due to this sale, we wrote off $0.9 million of straight-line receivables. On August 5, 2015, we sold six wellness centers in the U.S. for total proceeds of approximately $9.5 million (of which $1.5 million is in the form of a promissory note), resulting in a gain of $1.7 million. Due to this sale, we wrote off $0.9 million of billed rent receivables. With these disposals, we accelerated the amortization of the related lease intangible assets resulting in approximately $0.7 million of additional expense.
The sale of the Luling facility and the six wellness centers were not strategic shifts in our operations, and therefore the results of operations related to these facilities were not reclassified as discontinued operations.
2014 Activity
On December 31, 2014, we sold our La Palma facility for $12.5 million, resulting in a gain of $2.9 million. Due to this sale, we wrote-off $1.3 million of straight-line rent receivables.
97
Table of Contents
Index to Financial Statements
On May 20, 2014, the tenant of our Bucks facility gave notice of their intent to exercise the lease’s purchase option. Pursuant to this purchase option, the tenant acquired the facility on August 6, 2014 for $35 million. We wrote down this facility to fair market value less cost to sell, resulting in a $3.1 million real estate impairment charge in the 2014 second quarter.
The sale of the Bucks and La Palma facilities was not a strategic shift in our operations, and therefore the results of the Bucks and La Palma operations were not reclassified as discontinued operations.
Intangible Assets
At December 31, 2016 and 2015, our intangible lease assets were $296.2 million ($263.8 million, net of accumulated amortization) and $257.0 million ($231.7 million, net of accumulated amortization), respectively.
We recorded amortization expense related to intangible lease assets of $13.4 million, $9.1 million, and $7.0 million in 2016, 2015, and 2014, respectively, and expect to recognize amortization expense from existing lease intangible assets as follows (amounts in thousands):
| For the Year Ended December 31: |
||||
| 2017 |
$ | 22,130 | ||
| 2018 |
22,069 | |||
| 2019 |
22,021 | |||
| 2020 |
21,818 | |||
| 2021 |
21,751 | |||
As of December 31, 2016, capitalized lease intangibles have a weighted average remaining life of 22.1 years.
Leasing Operations
All of our leases are accounted for as operating leases, except we are accounting for 15 Ernest facilities and ten Prime facilities as DFLs. The components of our net investment in DFLs consisted of the following (in thousands):
| As of December 31, 2016 |
As of December 31, 2015 |
|||||||
| Minimum lease payments receivable |
$ | 2,207,625 | $ | 2,587,912 | ||||
| Estimated residual values |
407,647 | 393,097 | ||||||
| Less unearned income |
(1,967,170 | ) | (2,354,013 | ) | ||||
|
|
|
|
|
|||||
| Net investment in direct financing leases |
$ | 648,102 | $ | 626,996 | ||||
|
|
|
|
|
|||||
Minimum rental payments due to us in future periods under operating leases and DFLs, which have non-cancelable terms extending beyond one year at December 31, 2016, are as follows (amounts in thousands):
| Total Under Operating Leases |
Total Under DFLs |
Total | ||||||||||
| 2017 |
$ | 386,058 | $ | 62,419 | $ | 448,477 | ||||||
| 2018 |
388,808 | 63,668 | 452,476 | |||||||||
| 2019 |
392,577 | 64,941 | 457,518 | |||||||||
| 2020 |
395,339 | 66,240 | 461,579 | |||||||||
| 2021 |
400,607 | 67,565 | 468,172 | |||||||||
| Thereafter |
7,077,794 | 1,673,600 | 8,751,394 | |||||||||
|
|
|
|
|
|
|
|||||||
| $ | 9,041,183 | $ | 1,998,433 | $ | 11,039,616 | |||||||
|
|
|
|
|
|
|
|||||||
98
Table of Contents
Index to Financial Statements
Adeptus Health
On November 1, 2016, Adeptus Health announced their 2016 third quarter results showing a decline in net income over the prior year and disclosing collection issues associated with a third party billing agent among other things. At December 31, 2016, we have no outstanding receivables due from this tenant. Furthermore, Adeptus Health is current on its rent obligations to us through February 2017. In addition, we currently hold letters of credit approximating $12.4 million. At December 31, 2016, we have approximately $400 million invested in 59 properties (including five properties still under development) that are leased, pursuant to master lease agreements, to Adeptus Health, along with additional funding commitments as disclosed earlier. This investment represents approximately 7% of our total assets at December 31, 2016. At December 31, 2016, we believe this investment is fully recoverable; however, no assurances can be made that we will not have any impairment charges related to this investment in the future.
Hoboken Facility
In the 2015 third quarter, a subsidiary of the operator of our Hoboken facility acquired 10% of our subsidiary that owns the real estate for $5 million, which is reflected in the non-controlling interest line of our consolidated balance sheets.
Twelve Oaks Facility
In the third quarter of 2015, we sent notice of termination of the lease to the tenant at our Twelve Oaks facility. As a result of the lease terminating, we recorded a charge of $1.9 million to reserve against the straight-line rent receivables. In addition, we accelerated the amortization of the related lease intangible asset resulting in $0.5 million of additional expense during 2015. This former tenant has continued to occupy the facility. During the third quarter of 2016, the tenant paid us approximately $2.5 million representing substantially all of amounts owed to us and agreed to general terms of a new lease, which we expect to execute in 2017. The tenant is current on all of its obligations to us through February 2017. Although no assurances can be made that we will not have any impairment charges in the future, we believe our real estate investment in Twelve Oaks at December 31, 2016 is fully recoverable.
Monroe Facility
During 2014, the previous operator of our Monroe facility continued to underperform and became further behind on payments to us as required by the real estate lease agreement and working capital loan agreement. In August 2014, this operator filed for bankruptcy. Based on these developments and the fair value of our real estate and the underlying collateral of our loan (using Level 2 inputs), we recorded a $47.0 million impairment charge in 2014. Effective December 31, 2014, the bankruptcy court approved the purchase by Prime of the assets of the prior operator. Prime leases the facility from us pursuant to terms under an existing master lease. Prime has been current on its rent since lease inception. At December 31, 2016, our investment in Monroe is approximately $36 million, which we believe is fully recoverable.
Loans
The following is a summary of our loans ($ amounts in thousands):
| As of December 31, 2016 | As of December 31, 2015 | |||||||||||||||
| Balance | Weighted Average Interest Rate |
Balance | Weighted Average Interest Rate |
|||||||||||||
| Mortgage loans |
$ | 1,060,400 | 8.8 | % | $ | 757,581 | 9.5 | % | ||||||||
| Acquisition loans |
121,464 | 13.7 | % | 610,469 | 9.1 | % | ||||||||||
| Working capital and other loans |
34,257 | 9.0 | % | 54,353 | 10.2 | % | ||||||||||
|
|
|
|
|
|||||||||||||
| $ | 1,216,121 | $ | 1,422,403 | |||||||||||||
|
|
|
|
|
|||||||||||||
99
Table of Contents
Index to Financial Statements
Our mortgage loans cover 12 of our properties with four operators. The increase in mortgage loans relates to the loans made to Steward totaling $600 million for four properties in October 2016, partially offset by the repayment of two loans for $210 million by RCCH (formally Capella) and the conversion of a $100 million mortgage loan to Prime into a sale/leaseback of the property — See “2016 Activity” under the Disposal and Acquisition sections for more details.
Other loans typically consist of loans to our tenants for acquisitions and working capital purposes. At December 31, 2016, acquisition loans include our $115 million of loans to Ernest. The Capella acquisition loans of approximately $489 million at December 31, 2015 were paid in full during 2016 — See “2016 Activity” under the Disposal section for more details.
On March 1, 2012, pursuant to our convertible note agreement, we converted $1.7 million of our $5.0 million convertible note into a 9.9% equity interest in the operator of our Hoboken University Medical Center facility. On October 1, 2016, we converted the remaining $3.3 million of our convertible note into a 15.1% of equity interest in the operator for a total 25% equity interest in the operator.
Concentration of Credit Risks
Revenue by Operator
(Dollar amounts in thousands)
| For the Years Ended December 31, | ||||||||||||||||
| 2016 | 2015 | |||||||||||||||
| Operators (A) |
Total Revenue |
Percentage of Total Revenue |
Total Revenue |
Percentage of Total Revenue |
||||||||||||
| Prime |
$ | 120,558 | 22.3 | % | $ | 104,325 | 23.6 | % | ||||||||
| MEDIAN |
93,425 | 17.3 | % | 78,540 | 17.8 | % | ||||||||||
| Ernest |
67,742 | 12.5 | % | 61,988 | 14.0 | % | ||||||||||
| RCCH |
52,720 | 9.7 | % | 28,567 | 6.4 | % | ||||||||||
| Other operators |
206,692 | 38.2 | % | 168,458 | 38.2 | % | ||||||||||
|
|
|
|
|
|
|
|
|
|||||||||
| Total |
$ | 541,137 | 100.0 | % | $ | 441,878 | 100.0 | % | ||||||||
|
|
|
|
|
|
|
|
|
|||||||||
(A) Steward is not included herein as the Steward transaction closed on October 3, 2016.
Revenue by U.S. State and Country
(Dollar amounts in thousands)
| For the Years Ended December 31, | ||||||||||||||||
| 2016 | 2015 | |||||||||||||||
| U.S. States and Other Countries |
Total Revenue |
Percentage of Total Revenue |
Total Revenue |
Percentage of Total Revenue |
||||||||||||
| Texas |
$ | 96,992 | 17.9 | % | $ | 87,541 | 19.8 | % | ||||||||
| California |
66,197 | 12.2 | % | 66,120 | 15.0 | % | ||||||||||
| New Jersey |
39,084 | 7.2 | % | 27,688 | 6.3 | % | ||||||||||
| Massachusetts |
26,098 | 4.8 | % | 69 | 0.0 | % | ||||||||||
| Arizona |
23,798 | 4.4 | % | 21,188 | 4.8 | % | ||||||||||
| Other States |
187,363 | 34.7 | % | 156,256 | 35.3 | % | ||||||||||
|
|
|
|
|
|
|
|
|
|||||||||
| Total U.S. |
$ | 439,532 | 81.2 | % | $ | 358,862 | 81.2 | % | ||||||||
| Germany |
$ | 97,382 | 18.0 | % | $ | 78,540 | 17.8 | % | ||||||||
| United Kingdom, Italy, and Spain |
4,223 | 0.8 | % | 4,476 | 1.0 | % | ||||||||||
|
|
|
|
|
|
|
|
|
|||||||||
| Total International |
$ | 101,605 | 18.8 | % | $ | 83,016 | 18.8 | % | ||||||||
|
|
|
|
|
|
|
|
|
|||||||||
| Total |
$ | 541,137 | 100.0 | % | $ | 441,878 | 100.0 | % | ||||||||
|
|
|
|
|
|
|
|
|
|||||||||
100
Table of Contents
Index to Financial Statements
From an asset perspective, approximately 80% of our total assets are in the U.S., while 20% reside in Europe (primarily Germany) as of December 31, 2016, consistent with December 31, 2015.
Related Party Transactions
Lease and interest revenue earned from tenants in which we have an equity interest in were $282.9 million, $215.4 million and $101.8 million in 2016, 2015 and 2014, respectively.
4. Debt
The following is a summary of debt ($ amounts in thousands):
| As of December 31, | ||||||||
| 2016 | 2015 | |||||||
| Revolving credit facility |
$ | 290,000 | $ | 1,100,000 | ||||
| Term loans |
263,101 | 263,400 | ||||||
| Senior Unsecured Notes due 2016 |
— | 125,000 | ||||||
| 6.875% Senior Unsecured Notes due 2021 |
— | 450,000 | ||||||
| 6.375% Senior Unsecured Notes due 2022: |
||||||||
| Principal amount |
350,000 | 350,000 | ||||||
| Unamortized premium |
1,814 | 2,168 | ||||||
|
|
|
|
|
|||||
| 351,814 | 352,168 | |||||||
| 5.750% Senior Unsecured Notes due 2020 (A) |
210,340 | 217,240 | ||||||
| 4.000% Senior Unsecured Notes due 2022 (A) |
525,850 | 543,100 | ||||||
| 5.500% Senior Unsecured Notes due 2024 |
300,000 | 300,000 | ||||||
| 6.375% Senior Unsecured Notes due 2024 |
500,000 | — | ||||||
| 5.250% Senior Unsecured Notes due 2026 |
500,000 | — | ||||||
|
|
|
|
|
|||||
| $ | 2,941,105 | $ | 3,350,908 | |||||
| Debt issue costs, net |
(31,764 | ) | (28,367 | ) | ||||
|
|
|
|
|
|||||
| $ | 2,909,341 | $ | 3,322,541 | |||||
|
|
|
|
|
|||||
As of December 31, 2016, principal payments due on our debt (which exclude the effects of any discounts, premiums, or debt issue costs recorded) are as follows ($ amounts in thousands):
| 2017 |
$ | 320 | ||
| 2018 |
302,781 | |||
| 2019 |
250,000 | |||
| 2020 |
210,340 | |||
| 2021 |
— | |||
| Thereafter |
2,175,850 | |||
|
|
|
|||
| Total |
$ | 2,939,291 | ||
|
|
|
| (A) | These notes are Euro-denominated and reflect the exchange rates at December 31, 2016 and 2015, respectively. |
Revolving Credit Facility
On June 19, 2014, we closed on the Credit Facility for $900 million. The Credit Facility was comprised of a $775 million senior unsecured revolving credit facility (the “Revolving credit facility”) and a $125 million senior unsecured term loan facility (the “Term Loan”). The Credit Facility had an accordion feature that allowed us to expand the size of the facility by up to $250 million through increases to the Revolving credit facility, Term
101
Table of Contents
Index to Financial Statements
Loan, both or as a separate term loan tranche. The Credit Facility replaced our previous $400 million unsecured revolving credit facility and $100 million unsecured term loan. This transaction resulted in a refinancing charge of approximately $0.3 million in the 2014 second quarter.
On October 17, 2014, we entered into an amendment to our Credit Facility to exercise the $250 million accordion on the Revolving credit facility. This amendment increased the Credit Facility to $1.15 billion and added a new accordion feature that allowed us to expand our credit facility by another $400 million.
On August 4, 2015, we entered into an amendment to our Revolving credit facility and Term Loan agreement to further increase the current aggregate committed size to $1.25 billion and amend certain covenants in order to permit us to consummate and finance the acquisition of Capella.
On September 30, 2015, we further amended our Credit Facility to, among other things, increase the aggregate commitment under our Revolving credit facility to $1.3 billion and increase the Term Loan portion to $250 million. In addition, this amendment included a new accordion feature that allowed us to expand the Credit Facility by another $400 million for a total commitment of $1.95 billion. This amendment resulted in a $0.1 million expense in the 2015 third quarter.
The Revolving credit facility matures in June 2018 and can be extended for an additional 12 months at our option. The Revolving credit facility’s interest rate was originally set as (1) the higher of the “prime rate”, federal funds rate plus 0.50%, or Eurodollar rate plus 1.00%, plus a spread that was adjustable from 0.70% to 1.25% based on current total leverage, or (2) LIBOR plus a spread that was adjustable from 1.70% to 2.25% based on current total leverage. In addition to interest expense, we were required to pay a quarterly commitment fee on the undrawn portion of the revolving credit facility, ranging from 0.25% to 0.35% per year.
In November 2014, we received an upgrade to our credit rating resulting in an improvement in our interest rate spreads and commitment fee rates. Effective December 10, 2014, the Revolving credit facility’s interest rate is (1) the higher of the “prime rate”, federal funds rate plus 0.50%, or Eurodollar rate plus 1.00% plus a fixed spread of 0.40% or (2) LIBOR plus a fixed spread of 1.40%. In regards to commitment fees, we now pay based on the total facility at a rate of 0.30% per year.
At December 31, 2016 and 2015, we had $290 million and $1.1 billion, respectively, outstanding on the Revolving credit facility.
At December 31, 2016, our availability under our Revolving credit facility was $1 billion. The weighted average interest rate on this facility was 2.0% and 1.7% for 2016 and 2015, respectively.
See Note 13 for subsequent event activity impacting our Credit Facility.
Term Loans
As noted above in the Revolving Credit Facility section, we closed on the Term Loan for $125 million in the second quarter of 2014. Furthermore, as noted above, we amended the credit facility to increase the Term Loan portion to $250 million in the third quarter of 2015. The Term Loan matures in June 2019. The Term Loan’s initial interest rate was (1) the higher of the “prime rate”, federal funds rate plus 0.50%, or Eurodollar rate plus 1.00%, plus a spread that was adjustable from 0.60% to 1.20% based on current total leverage, or (2) LIBOR plus a spread that was adjustable from 1.60% to 2.20% based on current total leverage. With the upgrade to our credit rating as discussed above, the Term Loan’s interest rate, effective December 10, 2014, improved to (1) the higher of the “prime rate”, federal funds rate plus 0.50%, or Euro dollar rate plus 1.00% plus a fixed spread of 0.65%, or (2) LIBOR plus a fixed spread of 1.65%. At December 31, 2016 and 2015, the interest rate in effect on the Term Loan was 2.36% and 2.05%, respectively.
102
Table of Contents
Index to Financial Statements
In connection with our acquisition of the Northland LTACH Hospital on February 14, 2011, we assumed a $14.6 million mortgage. The Northland mortgage loan requires monthly principal and interest payments based on a 30-year amortization period. The Northland mortgage loan has a fixed interest rate of 6.2%, matures on January 1, 2018 and can be prepaid, subject to a certain prepayment premium. At December 31, 2016, the remaining balance on this term loan was $13.1 million. The loan is collateralized by the real estate of the Northland LTACH Hospital, which had a net book value of $16.4 million and $16.9 million at December 31, 2016 and 2015, respectively.
See Note 13 for subsequent activity impacting our Credit Facility.
Senior Unsecured Notes due 2016
During 2006, we issued $125.0 million of senior unsecured notes (the “Senior Unsecured Notes due 2016”). One of the issuances of the Senior Unsecured Notes due 2016 totaling $65.0 million paid interest quarterly at a floating annual rate of three-month LIBOR plus 2.30% and could be called at par value by us at any time. This portion of the Senior Unsecured Notes due 2016 matured in July 2016. The remaining issuances of Senior Unsecured Notes due 2016 paid interest quarterly at a floating annual rate of three-month LIBOR plus 2.30% and could also be called at par value by us at any time. These remaining notes matured in October 2016.
During the second quarter 2010, we entered into an interest rate swap to manage our exposure to variable interest rates by fixing $65 million of our $125 million Senior Unsecured Notes due 2016, which started July 31, 2011 (date on which the interest rate turned variable) through maturity date (or July 2016), at a rate of 5.507%. We also entered into an interest rate swap to fix $60 million of our Senior Unsecured Notes due 2016 which started October 31, 2011 (date on which the related interest rate turned variable) through the maturity date (or October 2016) at a rate of 5.675%. At December 31, 2015, the fair value of the interest rate swaps was $2.9 million, which is reflected in accounts payable and accrued expenses on the consolidated balance sheets. These interest rate swaps expired in 2016 in connection with the maturity of the related notes. We accounted for our interest rate swaps as cash flow hedges. We did not have any hedge ineffectiveness from inception of our interest rate swaps through their expiration in 2016; and therefore, there was no income statement effect recorded during the years ended December 31, 2016, 2015, and 2014.
6.875% Senior Unsecured Notes due 2021
On April 26, 2011, we closed on a private placement of $450 million senior notes (the “6.875% Senior Unsecured Notes due 2021”) to qualified institutional buyers in reliance on Rule 144A under the Securities Act. The notes were subsequently registered under the Securities Act pursuant to an exchange offer. Interest on the notes was payable semi-annually on May 1 and November 1 of each year. The notes paid interest in cash at a rate of 6.875% per year, would have matured on May 1, 2021, and offered a redemption option to redeem some or all of the notes at a premium, plus accrued and unpaid interest to, but not including, the redemption date.
On July 22, 2016, we used the net proceeds from the 5.250% Senior Unsecured Notes due 2026 offering (see discussion below for further details on these notes) to redeem our $450 million 6.875% Senior Unsecured Notes due 2021. This redemption resulted in a $22.5 million debt refinancing charge during the 2016 third quarter, consisting of a $15.5 million redemption premium along with the write-off of deferred debt issuance costs associated with the redeemed notes.
6.375% Senior Unsecured Notes due 2022
On February 17, 2012, we completed a $200 million offering of senior unsecured notes (“6.375% Senior Unsecured Notes due 2022”), and on August 20, 2013, we completed a $150 million tack on to the notes. These 6.375% Senior Unsecured Notes due 2022 accrue interest at a fixed rate of 6.375% per year and mature on February 15, 2022. The 2013 tack on offering, was issued at a premium (price of 102%), resulting in an effective
103
Table of Contents
Index to Financial Statements
rate of 5.998%. Interest on these notes is payable semi-annually on February 15 and August 15 of each year. We may redeem some or all of the notes at a premium that will decrease over time, plus accrued and unpaid interest to, but not including, the redemption date. In the event of a change of control, each holder of the 6.375% Senior Unsecured Notes due 2022 may require us to repurchase some or all of its notes at a repurchase price equal to 101% of the aggregate principal amount plus accrued and unpaid interest to the date of purchase.
5.750% Senior Unsecured Notes due 2020
On October 10, 2013, we completed a €200 million offering of senior unsecured notes (“5.750% Senior Unsecured Notes due 2020”). Interest on the notes is payable semi-annually on April 1 and October 1 of each year. The 5.750% Senior Unsecured Notes due 2020 pay interest in cash at a rate of 5.750% per year. The notes mature on October 1, 2020. We may redeem some or all of the notes at any time at a “make-whole” redemption price that will decrease over time. In the event of a change of control, each holder of the notes may require us to repurchase some or all of our notes at a repurchase price equal to 101% of the aggregate principal amount of the notes plus accrued and unpaid interest to the date of purchase. See Note 13 for subsequent event activity related to these notes.
4.000% Senior Unsecured Notes due 2022
On August 19, 2015, we completed a €500 million senior unsecured notes offering (“4.000% Senior Unsecured Notes due 2022”). Interest on the notes is payable annually on August 19 of each year. The notes pay interest in cash at a rate of 4.00% per year. The notes mature on August 19, 2022. We may redeem some or all of the 4.000% Senior Unsecured Notes due 2022 at any time. If the notes are redeemed prior to 90 days before maturity, the redemption price will be 100% of their principal amount, plus a make-whole premium, plus accrued and unpaid interest to, but excluding, the applicable redemption date. Within the period beginning on or after 90 days before maturity, the notes may be redeemed, in whole or in part, at a redemption price equal to 100% of their principal amount, plus accrued and unpaid interest to, but excluding, the applicable redemption date. The 4.000% Senior Unsecured Notes due 2022 are fully and unconditionally guaranteed on an unsecured basis by us. In the event of a change of control, each holder of the notes may require us to repurchase some or all of our notes at a repurchase price equal to 101% of the aggregate principal amount of the notes plus accrued and unpaid interest to the date of the purchase.
5.500% Senior Unsecured Notes due 2024
On April 17, 2014, we completed a $300 million senior unsecured notes offering (“5.500% Senior Unsecured Notes due 2024”). Interest on the notes is payable semi-annually on May 1 and November 1 of each year. The notes pay interest in cash at a rate of 5.50% per year. The notes mature on May 1, 2024. We may redeem some or all of the notes at any time prior to May 1, 2019 at a “make-whole” redemption price. On or after May 1, 2019, we may redeem some or all of the notes at a premium that will decrease over time. In addition, at any time prior to May 1, 2017, we may redeem up to 35% of the aggregate principal amount of the notes using the proceeds of one or more equity offerings. In the event of a change of control, each holder of the notes may require us to repurchase some or all of our notes at a repurchase price equal to 101% of the aggregate principal amount of the notes plus accrued and unpaid interest to the date of purchase.
6.375% Senior Unsecured Notes due 2024
On February 22, 2016, we completed a $500 million senior unsecured notes offering (“6.375% Senior Unsecured Notes due 2024”). Interest on the notes is payable on March 1 and September 1 of each year. Interest on the notes is paid in cash at a rate of 6.375% per year. The notes mature on March 1, 2024. We may redeem some or all of the notes at any time prior to March 1, 2019 at a “make whole” redemption price. On or after March 1, 2019, we may redeem some or all of the notes at a premium that will decrease over time. In addition, at any time prior to March 1, 2019, we may redeem up to 35% of the notes at a redemption price equal to 106.375%
104
Table of Contents
Index to Financial Statements
of the aggregate principal amount thereof, plus accrued and unpaid interest thereon, using proceeds from one or more equity offerings. In the event of a change in control, each holder of the notes may require us to repurchase some or all of the notes at a repurchase price equal to 101% of the aggregate principal amount of the notes plus accrued and unpaid interest to the date of purchase.
5.250% Senior Unsecured Notes due 2026
On July 22, 2016, we completed a $500 million senior unsecured notes offering (“5.250% Senior Unsecured Notes due 2026”). Interest on the notes is payable on February 1 and August 1 of each year, commencing on February 1, 2017. Interest on the notes is to be paid in cash at a rate of 5.25% per year. The notes mature on August 1, 2026. We may redeem some or all of the notes at any time prior to August 1, 2021 at a “make whole” redemption price. On or after August 1, 2021, we may redeem some or all of the notes at a premium that will decrease over time. In addition, at any time prior to August 1, 2019, we may redeem up to 35% of the notes at a redemption price equal to 105.25% of the aggregate principal amount thereof, plus accrued and unpaid interest thereon, using proceeds from one or more equity offerings. In the event of a change in control, each holder of the notes may require us to repurchase some or all of the notes at a repurchase price equal to 101% of the aggregate principal amount of the notes plus accrued and unpaid interest to the date of purchase.
Other Financing
On July 27, 2015, we received a commitment to provide a senior unsecured bridge loan facility in the original principal amount of $1.0 billion to fund the acquisition of Capella pursuant to a commitment letter from JPMorgan Chase Bank, N.A. and Goldman, Sachs & Co. Funding under the bridge facility was not necessary as we funded the acquisition through a combination of an equity issuance and other borrowings. We incurred and expensed certain customary structuring and underwriting fees of $3.9 million in the 2015 third quarter related to the bridge commitment.
Covenants
Our debt facilities impose certain restrictions on us, including restrictions on our ability to: incur debts; create or incur liens; provide guarantees in respect of obligations of any other entity; make redemptions and repurchases of our capital stock; prepay, redeem or repurchase debt; engage in mergers or consolidations; enter into affiliated transactions; dispose of real estate or other assets; and change our business. In addition, the credit agreements governing our Credit Facility limit the amount of dividends we can pay as a percentage of normalized adjusted funds from operations, as defined in the agreements, on a rolling four quarter basis. Through 2016, the dividend restriction was 95% of normalized adjusted FFO. The indentures governing our senior unsecured notes also limit the amount of dividends we can pay based on the sum of 95% of FFO, proceeds of equity issuances and certain other net cash proceeds. Finally, our senior unsecured notes require us to maintain total unencumbered assets (as defined in the related indenture) of not less than 150% of our unsecured indebtedness.
In addition to these restrictions, the Credit Facility contains customary financial and operating covenants, including covenants relating to our total leverage ratio, fixed charge coverage ratio, secured leverage ratio, consolidated adjusted net worth, unsecured leverage ratio, and unsecured interest coverage ratio. This Credit Facility also contains customary events of default, including among others, nonpayment of principal or interest, material inaccuracy of representations and failure to comply with our covenants. If an event of default occurs and is continuing under the Credit Facility, the entire outstanding balance may become immediately due and payable. At December 31, 2016, we were in compliance with all such financial and operating covenants.
105
Table of Contents
Index to Financial Statements
5. Income Taxes
Medical Properties Trust, Inc.
We have maintained and intend to maintain our election as a REIT under the Code of 1986, as amended. To qualify as a REIT, we must meet a number of organizational and operational requirements, including a requirement to distribute at least 90% of our taxable income to our stockholders. As a REIT, we generally will not be subject to U.S. federal income tax if we distribute 100% of our taxable income to our stockholders and satisfy certain other requirements. Income tax is paid directly by our stockholders on the dividends distributed to them. If our taxable income exceeds our dividends in a tax year, REIT tax rules allow us to designate dividends from the subsequent tax year in order to avoid current taxation on undistributed income. If we fail to qualify as a REIT in any taxable year, we will be subject to federal income taxes at regular corporate rates, including any applicable alternative minimum tax. Taxable income from non-REIT activities managed through our TRSs is subject to applicable U.S. federal, state and local income taxes. Our international subsidiaries are also subject to income taxes in the jurisdictions in which they operate.
From our TRSs and our foreign operations, income tax (benefit) expense were as follows (in thousands):
| For the years ended December 31, | ||||||||||||
| 2016 | 2015 | 2014 | ||||||||||
| Current income tax expense: |
||||||||||||
| Domestic |
$ | 42 | $ | 147 | $ | 114 | ||||||
| Foreign |
1,856 | 1,614 | 225 | |||||||||
|
|
|
|
|
|
|
|||||||
| 1,898 | 1,761 | 339 | ||||||||||
| Deferred income tax (benefit) expense: |
||||||||||||
| Domestic |
147 | (360 | ) | (23 | ) | |||||||
| Foreign |
(8,875 | ) | 102 | 24 | ||||||||
|
|
|
|
|
|
|
|||||||
| (8,728 | ) | (258 | ) | 1 | ||||||||
|
|
|
|
|
|
|
|||||||
| Income tax (benefit) expense |
$ | (6,830 | ) | $ | 1,503 | $ | 340 | |||||
|
|
|
|
|
|
|
|||||||
The foreign provision (benefit) for income taxes is based on foreign loss before income taxes of $23.5 million in 2016 as compared with foreign loss before income taxes of $29.4 million in 2015, and foreign loss before income taxes of $7.5 million in 2014.
The domestic provision (benefit) for income taxes is based on a loss before income taxes of $1.4 million in 2016 from our taxable REIT subsidiaries as compared with income before income taxes of $7.1 million in 2015, and a loss before income taxes of $20.9 million in 2014.
106
Table of Contents
Index to Financial Statements
At December 31, 2016 and 2015, components of our deferred tax assets and liabilities were as follows (in thousands):
| 2016 | 2015 | |||||||
| Deferred tax liabilities: |
||||||||
| Property and equipment |
$ | (3,781 | ) | $ | (1,636 | ) | ||
| Unbilled rent |
(7,045 | ) | (4,495 | ) | ||||
| Partnership investments |
(5,103 | ) | (3,362 | ) | ||||
| Other |
(6,757 | ) | (6,141 | ) | ||||
|
|
|
|
|
|||||
| Total deferred tax liabilities |
$ | (22,686 | ) | $ | (15,634 | ) | ||
| Deferred tax assets: |
||||||||
| Operating loss and interest deduction carry forwards |
$ | 28,289 | $ | 19,016 | ||||
| Other |
10,085 | 10,314 | ||||||
|
|
|
|
|
|||||
| Total deferred tax assets |
38,374 | 29,330 | ||||||
| Valuation allowance |
(15,975 | ) | (23,005 | ) | ||||
|
|
|
|
|
|||||
| Total net deferred tax assets |
$ | 22,399 | $ | 6,325 | ||||
|
|
|
|
|
|||||
| Net deferred tax (liability) |
$ | (287 | ) | $ | (9,309 | ) | ||
|
|
|
|
|
|||||
At December 31, 2016, our U.S. net operating losses (“NOLs”) consisted of $60 million of federal NOLs and $113.5 million of state NOLs available as offsets to future years’ taxable income. We have federal and state capital loss carryforwards of $8.1 million. The NOLs primarily expire between 2021 and 2035 and the capital loss carryforward expires in 2022. We have alternative minimum tax credits of $0.3 million as of December 31, 2016, which may be carried forward indefinitely. At December 31, 2016, we had foreign NOLs of $13.3 million that may be carried forward indefinitely.
In the evaluation of the need for a valuation allowance on the U.S. deferred income tax assets, we considered all available positive and negative evidence, including scheduled reversals of deferred income tax liabilities, carryback of future period losses to prior periods, projected future taxable income, tax planning strategies and recent financial performance. Based on our review of all positive and negative evidence, including a three year U.S. cumulative pre-tax loss, we concluded that a valuation allowance should remain against those deferred income tax assets that are not expected to be realized through future sources of taxable income generated from scheduled reversals of deferred income tax liabilities. As a result, a valuation allowance continues to be recorded to reflect the portion of the U.S. federal and state deferred income tax assets that are not likely to be realized based upon all available evidence. If we later determine that we will more likely than not realize all, or a portion, of the deferred income tax assets, we will reverse the valuation allowance in a future period. All future reversals of the valuation allowance would result in a tax benefit in the period recognized.
We also evaluated the need for a valuation allowance on our foreign deferred income tax assets. In doing so, we considered all available evidence to determine whether it is more likely than not that the foreign deferred income tax assets will be realized. When comparing 2016 results to prior periods, we noted a significant increase in positive evidence, which included a strong positive trend in foreign earnings and forecasted foreign income projections in 2017 and future periods. For instance, several of our initial foreign subsidiaries achieved a cumulative pre-tax income position as of the 2016 fourth quarter, and we expect the majority of our remaining foreign subsidiaries to be in a cumulative pre-tax income position within the next 12-18 months. Current year earnings resulted in the use of $2 million of beginning of the year valuation allowances on deferred tax assets which offset corresponding current tax expense. The positive evidence noted above resulted in our conclusion to make a one-time release of $4 million of the valuation allowance on our foreign deferred income tax assets in the 2016 fourth quarter. We also noted that sufficient objective positive evidence did not exist for a portion of foreign deferred income tax assets at December 31, 2016 due to the lack of future sources of taxable income to utilize these deferred income tax assets. A valuation allowance of $2.2 million has remained to reserve against these foreign deferred tax assets.
We have no uncertain tax position liabilities and related interest or penalties recorded at December 31, 2016.
107
Table of Contents
Index to Financial Statements
A reconciliation of the income tax (benefit) expense at the statutory income tax rate and the effective tax rate for income from continuing operations before income taxes for the years ended December 31, 2016, 2015, and 2014 is as follows (in thousands):
| 2016 | 2015 | 2014 | ||||||||||
| Income from continuing operations (before-tax) |
$ | 219,108 | $ | 141,430 | $ | 51,138 | ||||||
| Income tax at the US statutory federal rate (35%) |
76,688 | 49,501 | 17,898 | |||||||||
| Increase (decrease) resulting from: |
||||||||||||
| Rate differential |
1,434 | 5,047 | 1,145 | |||||||||
| State income taxes, net of federal benefit |
66 | (601 | ) | (337 | ) | |||||||
| Dividends paid deduction |
(84,927 | ) | (57,109 | ) | (27,873 | ) | ||||||
| Equity investments |
4,297 | — | — | |||||||||
| Change in valuation allowance |
(6,104 | ) | 6,174 | 8,988 | ||||||||
| Other items, net |
1,716 | (1,509 | ) | 519 | ||||||||
|
|
|
|
|
|
|
|||||||
| Total income tax (benefit) expense |
$ | (6,830 | ) | $ | 1,503 | $ | 340 | |||||
|
|
|
|
|
|
|
|||||||
We have met the annual REIT distribution requirements by payment of at least 90% of our estimated taxable income in 2016, 2015, and 2014. Earnings and profits, which determine the taxability of such distributions, will differ from net income reported for financial reporting purposes due primarily to differences in cost basis, differences in the estimated useful lives used to compute depreciation, and differences between the allocation of our net income and loss for financial reporting purposes and for tax reporting purposes.
A schedule of per share distributions we paid and reported to our stockholders is set forth in the following:
| For the Years Ended December 31, | ||||||||||||
| 2016 | 2015 | 2014 | ||||||||||
| Common share distribution |
$ | 0.900000 | $ | 0.870000 | $ | 0.840000 | ||||||
| Ordinary income |
0.619368 | 0.769535 | 0.520692 | |||||||||
| Capital gains(1) |
0.102552 | — | 0.000276 | |||||||||
| Unrecaptured Sec. 1250 gain |
0.045432 | — | 0.000276 | |||||||||
| Return of capital |
0.178080 | 0.100465 | 0.319032 | |||||||||
| (1) | Capital gains include unrecaptured Sec. 1250 gains. |
MPT Operating Partnership, L.P.
As a partnership, the allocated share of income of the Operating Partnership is included in the income tax returns of the general and limited partners. Accordingly, no accounting for income taxes is generally required for such income of the Operating Partnership. However, the Operating Partnership has formed TRSs on behalf of Medical Properties Trust, Inc., which are subject to federal, state and local income taxes at regular corporate rates, and its international subsidiaries are subject to income taxes in the jurisdictions in which they operate. See discussion above under Medical Properties Trust, Inc. for more details of income taxes associated with our TRSs and international operations.
108
Table of Contents
Index to Financial Statements
6. Earnings Per Share/Unit
Medical Properties Trust, Inc.
Our earnings per share were calculated based on the following (amounts in thousands):
| For the Years Ended December 31, | ||||||||||||
| 2016 | 2015 | 2014 | ||||||||||
| Numerator: |
||||||||||||
| Income from continuing operations |
$ | 225,938 | $ | 139,927 | $ | 50,798 | ||||||
| Non-controlling interests’ share in continuing operations |
(889 | ) | (329 | ) | (274 | ) | ||||||
| Participating securities’ share in earnings |
(559 | ) | (1,029 | ) | (894 | ) | ||||||
|
|
|
|
|
|
|
|||||||
| Income from continuing operations, less participating securities’ share in earnings |
224,490 | 138,569 | 49,630 | |||||||||
| Income (loss) from discontinued operations attributable to MPT common stockholders |
(1 | ) | — | (2 | ) | |||||||
|
|
|
|
|
|
|
|||||||
| Net income, less participating securities’ share in earnings |
$ | 224,489 | $ | 138,569 | $ | 49,628 | ||||||
|
|
|
|
|
|
|
|||||||
| Denominator: |
||||||||||||
| Basic weighted-average common shares |
260,414 | 217,997 | 169,999 | |||||||||
| Dilutive potential common shares |
658 | 307 | 541 | |||||||||
|
|
|
|
|
|
|
|||||||
| Diluted weighted-average common shares |
261,072 | 218,304 | 170,540 | |||||||||
|
|
|
|
|
|
|
|||||||
MPT Operating Partnership, L.P.
Our earnings per unit were calculated based on the following (amounts in thousands):
| For the Years Ended December 31, | ||||||||||||
| 2016 | 2015 | 2014 | ||||||||||
| Numerator: |
||||||||||||
| Income from continuing operations |
$ | 225,938 | $ | 139,927 | $ | 50,798 | ||||||
| Non-controlling interests’ share in continuing operations |
(889 | ) | (329 | ) | (274 | ) | ||||||
| Participating securities’ share in earnings |
(559 | ) | (1,029 | ) | (894 | ) | ||||||
|
|
|
|
|
|
|
|||||||
| Income from continuing operations, less participating securities’ share in earnings |
224,490 | 138,569 | 49,630 | |||||||||
| Income (loss) from discontinued operations attributable to MPT Operating Partnership partners |
(1 | ) | — | (2 | ) | |||||||
|
|
|
|
|
|
|
|||||||
| Net income, less participating securities’ share in earnings |
$ | 224,489 | $ | 138,569 | $ | 49,628 | ||||||
|
|
|
|
|
|
|
|||||||
| Denominator: |
||||||||||||
| Basic weighted-average units |
260,414 | 217,997 | 169,999 | |||||||||
| Dilutive potential units |
658 | 307 | 541 | |||||||||
|
|
|
|
|
|
|
|||||||
| Diluted weighted-average units |
261,072 | 218,304 | 170,540 | |||||||||
|
|
|
|
|
|
|
|||||||
7. Stock Awards
Stock Awards
Our Equity Incentive Plan authorizes the issuance of common stock options, restricted stock, restricted stock units, deferred stock units, stock appreciation rights, performance units and awards of interests in our Operating Partnership. Our Equity Incentive Plan is administered by the Compensation Committee of the Board of Directors. We have reserved 8,196,770 shares of common stock for awards under the Equity Incentive Plan and 5,265,916 shares remain available for future stock awards as of December 31, 2016. The Equity Incentive Plan contains a limit of 5,000,000 shares as the maximum number of shares of common stock that may be awarded to
109
Table of Contents
Index to Financial Statements
an individual in any fiscal year. Awards under the Equity Incentive Plan are subject to forfeiture due to termination of employment prior to vesting. In the event of a change in control, outstanding and unvested options will immediately vest, unless otherwise provided in the participant’s award or employment agreement, and restricted stock, restricted stock units, deferred stock units and other stock-based awards will vest if so provided in the participant’s award agreement. The term of the awards is set by the Compensation Committee, though Incentive Stock Options may not have terms of more than ten years. Forfeited awards are returned to the Equity Incentive Plan and are then available to be re-issued as future awards. For each share of common stock issued by Medical Properties Trust, Inc. pursuant to its Equity Incentive Plan, the Operating Partnership issues a corresponding number of Operating Partnership units.
The following awards have been granted pursuant to our Equity Incentive Plan (and its predecessor plan):
Restricted Equity Awards
These stock-based awards are in the form of service-based awards and performance awards based on certain market conditions. The service-based awards vest as the employee provides the required service (typically three to five years). Service based awards are valued at the average price per share of common stock on the date of grant. In 2016, 2015, and 2014, the Compensation Committee granted performance — based awards to employees which vest based on us achieving certain total shareholder returns or comparisons of our total shareholder returns to peer total return indices. Generally, dividends are not paid on performance awards until the award is earned. See below for details of such performance award grants:
2016 performance awards — The 2016 performance awards were granted in two parts:
| 1) | One-half of the 2016 performance awards were based on us achieving a cumulative total shareholder return from January 1, 2016 to December 31, 2018. The minimum total shareholder return needed to earn a portion of this award is 27.0% with 100% of the award earned if our total shareholder return reaches 35.0%. If any shares are earned from this award, the shares will vest in equal annual amounts on January 1, 2019, 2020, and 2021. The fair value of this award was estimated on the dates of grant using a Monte Carlo valuation model that assumed the following: risk free interest rates of 1.0%; expected volatility of 24.4%; expected dividend yield of 7.0%; and expected service period of 5 years. |
| 2) | The remainder of the 2016 performance awards will be earned if our total shareholder return outpaces that of the MSCI U.S. REIT Index (“Index”) over the cumulative period from January 1, 2016 to December 31, 2018. Our total shareholder return must be within 3% of the Index to earn the minimum number of shares under this award, while it must exceed the Index by 3% to earn 100% of the award. If any shares are earned from this award, the shares will vest in equal annual amounts on January 1, 2019, 2020, and 2021. The fair value of this award was estimated on the dates of grant using a Monte Carlo valuation model that assumed the following: risk free interest rate of 1.0%; expected volatility of 24.4%; expected dividend yield of 7.0%; and expected service period of 5 years. |
No 2016 performance awards were earned and vested in 2016, and 2,400 performance awards were forfeited in 2016. At December 31, 2016, we have 797,404 of 2016 performance awards remaining to be earned.
2015 performance awards — The 2015 performance awards were granted in three parts:
| 1) | Approximately 40% of the 2015 performance awards were based on us achieving a simple 9.0% annual total shareholder return. For the three-year period from January 1, 2015 through December 31, 2017, one-third of the awards will be earned annually (until the award is fully earned) if a 9.0% total shareholder return is achieved. If total shareholder return does not reach 9.0% in a particular year, shares for that year can be earned in a future period (during the three-year period) if the cumulative total shareholder return is equal to or greater than a 9.0% annual return for such cumulative period. The fair value of this award was estimated on the date of grant using a Monte Carlo valuation model that assumed the following: risk free interest rate of 1.1%; expected volatility of 20%; expected dividend yield of 7.2%; and expected service period of 3 years. |
110
Table of Contents
Index to Financial Statements
| 2) | Approximately 30% of the 2015 performance awards were based on us achieving a cumulative total shareholder return from January 1, 2015 to December 31, 2017. The minimum total shareholder return needed to earn a portion of this award is 27.0% with 100% of the award earned if our total shareholder return reaches 35.0%. If any shares are earned from this award, the shares will vest in equal annual amounts on December 31, 2017, 2018, and 2019. The fair value of this award was estimated on the date of grant using a Monte Carlo valuation model that assumed the following: risk free interest rate of 1.1%; expected volatility of 20%; expected dividend yield of 7.2%; and expected service period of 5 years. |
| 3) | The remainder of the 2015 performance awards will be earned if our total shareholder return outpaces the Index over the cumulative period from January 1, 2015 to December 31, 2017. Our total shareholder return must exceed that of the Index to earn the minimum number of shares under this award, while it must exceed the Index by 6% to earn 100% of the award. If any shares are earned from this award, the shares will vest in equal annual amounts on December 31, 2017, 2018, and 2019. The fair value of this award was estimated on the date of grant using a Monte Carlo valuation model that assumed the following: risk free interest rate of 1.1%; expected volatility of 20%; expected dividend yield of 7.2%; and expected service period of 5 years. |
In 2016, 98,526 shares were earned and vested, and 66,792 performance awards were forfeited in 2016. No 2015 performance awards were earned and vested in 2015, and 4,500 performance awards were forfeited in 2015. At December 31, 2016, we have 702,070 of 2015 performance awards remaining to be earned.
2014 performance awards — The 2014 performance awards were granted in three parts:
| 1) | Approximately 40% of the 2014 performance awards were based on us achieving a simple 9.0% annual total shareholder return. For the five-year period from January 1, 2014 through December 31, 2018, one-third of the awards will be earned annually (until the award is fully earned) if a 9.0% total shareholder return is achieved. If total shareholder return does not reach 9.0% in a particular year, shares for that year can be earned in a future period (during the five-year period) if the cumulative total shareholder return is equal to or greater than a 9.0% annual return for such cumulative period. The fair value of this award was estimated on the date of grant using a Monte Carlo valuation model that assumed the following: risk free interest rate of 1.7%; expected volatility of 27%; expected dividend yield of 8.0%; and expected service period of 3 years. |
| 2) | Approximately 30% of the 2014 performance awards were based on us achieving a cumulative total shareholder return from January 1, 2014 to December 31, 2016. The minimum total shareholder return needed to earn a portion of this award is 27.0% with 100% of the award earned if our total shareholder return reaches 35.0%. If any shares are earned from this award, the shares will vest in equal annual amounts on December 31, 2016, 2017, and 2018. The fair value of this award was estimated on the date of grant using a Monte Carlo valuation model that assumed the following: risk free interest rate of 0.8%; expected volatility of 27%; expected dividend yield of 8.0%; and expected service period of 5 years. |
| 3) | The remainder of the 2014 performance awards were to be earned if our total shareholder return outpaced that of the Index over the cumulative period from January 1, 2014 to December 31, 2016. Our total shareholder return must exceed that of the Index to earn the minimum number of shares under this award, while it must exceed the Index by 6% to earn 100% of the award. If any shares are earned from this award, the shares will vest in equal annual amounts on December 31, 2016, 2017, and 2018. The fair value of this award was estimated on the date of grant using a Monte Carlo valuation model that assumed the following: risk free interest rate of 0.8%; expected volatility of 27%; expected dividend yield of 8.0%; and expected service period of 5 years. |
In 2014 and 2016, 108,261 and 99,959 shares were earned and vested under the 2014 performance awards, respectively. No such awards were earned and vested in 2015. In 2016, 500,000 shares, which
111
Table of Contents
Index to Financial Statements
related to the latter two parts of the award as described above, were forfeited as the three-year cumulative total shareholder return hurdles from January 1, 2014 to December 31, 2016 were not met. An additional 72,003 performance shares were forfeited prior to the measurement date in 2016. At December 31, 2016, we have 99,935 of 2014 performance awards remaining to be earned.
The following summarizes restricted equity award activity in 2016 and 2015 (which includes awards granted in 2016, 2015, 2014, and any applicable prior years), respectively:
For the Year Ended December 31, 2016:
| Vesting Based on Service | Vesting Based on Market/ Performance Conditions |
|||||||||||||||
| Shares | Weighted Average Value at Award Date |
Shares | Weighted Average Value at Award Date |
|||||||||||||
| Nonvested awards at beginning of the year |
509,634 | $ | 13.25 | 2,331,152 | $ | 6.38 | ||||||||||
| Awarded |
254,574 | $ | 13.07 | 799,804 | $ | 7.30 | ||||||||||
| Vested |
(349,356 | ) | $ | 13.07 | (671,983 | ) | $ | 6.50 | ||||||||
| Forfeited |
(67,724 | ) | $ | 13.06 | (647,298 | ) | $ | 6.28 | ||||||||
|
|
|
|
|
|||||||||||||
| Nonvested awards at end of year |
347,128 | $ | 13.35 | 1,811,675 | $ | 6.78 | ||||||||||
|
|
|
|
|
|||||||||||||
For the Year Ended December 31, 2015:
| Vesting Based on Service |
Vesting Based on Market/Performance Conditions |
|||||||||||||||
| Shares | Weighted Average Value at Award Date |
Shares | Weighted Average Value at Award Date |
|||||||||||||
| Nonvested awards at beginning of the year |
452,263 | $ | 12.11 | 2,428,518 | $ | 5.81 | ||||||||||
| Awarded |
407,969 | $ | 13.94 | 871,888 | $ | 6.62 | ||||||||||
| Vested |
(343,904 | ) | $ | 12.56 | (406,970 | ) | $ | 4.94 | ||||||||
| Forfeited |
(6,694 | ) | $ | 13.08 | (562,284 | ) | $ | 5.33 | ||||||||
|
|
|
|
|
|||||||||||||
| Nonvested awards at end of year |
509,634 | $ | 13.25 | 2,331,152 | $ | 6.38 | ||||||||||
|
|
|
|
|
|||||||||||||
The value of stock-based awards is charged to compensation expense over the vesting periods. In the years ended December 31, 2016, 2015, and 2014, we recorded $7.9 million, $11.1 million, and $9.2 million, respectively, of non-cash compensation expense. The remaining unrecognized cost from restricted equity awards at December 31, 2016, is $12.4 million, which will be recognized over a weighted average period of 2.78 years. Restricted equity awards that vested in 2016, 2015, and 2014 had a value of $12.7 million, $10.2 million, and $10.2 million, respectively.
8. Commitments and Contingencies
Commitments
On July 20, 2016, we entered into definitive agreements to acquire 20 rehabilitation hospitals in Germany for an aggregate purchase price to us of approximately €215.7 million. Upon closing, the facilities will be leased to affiliates of MEDIAN, pursuant to a new master lease with a term of approximately 27 years. Closing of the transaction, which began during the fourth quarter of 2016, is subject to customary real estate, regulatory and other closing conditions. As discussed in Note 3, we have closed seven of the 20 facilities in the amount of €49.5 million on December 31, 2016.
112
Table of Contents
Index to Financial Statements
On September 9, 2016, we entered into definitive agreements to acquire six rehabilitation hospitals in Germany for an aggregate purchase price to us of approximately €44.1 million. Upon closing, the facilities will be leased to affiliates of MEDIAN, pursuant to the existing long-term master lease. Closing of the transaction, which began during the fourth quarter of 2016, is subject to customary real estate, regulatory and other closing conditions. As discussed in Note 3, we have closed on five of the six facilities in the amount of €35.7 million as of December 31, 2016. We closed on the final property on January 27, 2017, in the amount of €8.4 million.
On September 28, 2016, we entered into definitive agreements to acquire two acute care hospitals in Washington and Idaho for an aggregate purchase price to us of approximately $105 million. Upon closing, the facilities will be leased to RCCH, pursuant to the current master lease. Closing of the transaction, which is expected to be completed in the first half of 2017, is subject to customary real estate, regulatory and other closing conditions.
Operating leases, in which we are the lessee, primarily consist of ground leases on which certain of our facilities or other related property reside along with corporate office and equipment leases. The ground leases are long-term leases (almost all having terms of 30 years or more), some of which contain escalation provisions and one contains a purchase option. Properties subject to these ground leases are subleased to our tenants. Lease and rental expense (which is recorded on the straight-line method) for 2016, 2015 and 2014, respectively, were $6.8 million, $4.6 million, and $2.3 million, which was offset by sublease rental income of $4.2 million, $2.3 million, and $0.3 million for 2016, 2015, and 2014, respectively.
Fixed minimum payments due under operating leases with non-cancelable terms of more than one year and amounts to be received in the future from non-cancelable subleases at December 31, 2016 are as follows: (amounts in thousands)
| Fixed minimum payments |
Amounts to be received from subleases |
Net payments |
||||||||||
| 2017 |
$ | 7,328 | $ | (4,725 | ) | $ | 2,603 | |||||
| 2018 |
7,249 | (4,731 | ) | 2,518 | ||||||||
| 2019 |
6,925 | (4,755 | ) | 2,170 | ||||||||
| 2020 |
6,944 | (4,860 | ) | 2,084 | ||||||||
| 2021 |
6,024 | (4,966 | ) | 1,058 | ||||||||
| Thereafter |
251,981 | (249,662 | ) | 2,319 | ||||||||
|
|
|
|
|
|
|
|||||||
| $ | 286,451 | $ | (273,699 | ) | $ | 12,752 | ||||||
|
|
|
|
|
|
|
|||||||
Contingencies
We are a party to various legal proceedings incidental to our business. In the opinion of management, after consultation with legal counsel, the ultimate liability, if any, with respect to these proceedings is not presently expected to materially affect our financial position, results of operations or cash flows.
9. Common Stock/Partner’s Capital
Medical Properties Trust, Inc.
2016 Activity
On October 7, 2016, we sold 10.3 million shares of common stock in a private placement to an affiliate of Cerberus, the controlling member of Steward, and certain members of Steward management. We sold these shares at a price per share of $14.50, equal to the public offering price of our September 2016 equity offering, generating total proceeds of $150 million.
113
Table of Contents
Index to Financial Statements
On September 30, 2016, we completed an underwritten public offering of 57.5 million shares (including the exercise of the underwriters’ 30-day option to purchase an additional 7.5 million shares) of our common stock, resulting in net proceeds of $799.5 million, after deducting estimated offering expenses.
On March 1, 2016, we updated our at-the-market equity offering program, which gave us the ability to sell up to $227 million of stock with a commission rate of 1.25%. During 2016, we sold approximately 15 million shares of our common stock under this program, resulting in net proceeds of approximately $224 million, after deducting approximately $2.8 million of commissions. We have no capacity to sell additional shares under this at-the-market equity offering program.
2015 Activity
On August 11, 2015, we completed an underwritten public offering of 28.75 million shares (including the exercise of the underwriters’ 30-day option to purchase an additional 3.8 million shares) of our common stock, resulting in net proceeds of approximately $337 million, after deducting estimated offering expenses.
On August 4, 2015, we filed Articles of Amendment to our charter with the Maryland State Department of Assessments and Taxation increasing the number of authorized shares of common stock, par value $0.001 per share available for issuance from 250,000,000 to 500,000,000.
On January 14, 2015, we completed an underwritten public offering of 34.5 million shares (including the exercise of the underwriters’ 30-day option to purchase an additional 4.5 million shares) of our common stock, resulting in net proceeds of approximately $480 million, after deducting estimated offering expenses.
MPT Operating Partnership, L.P.
The Operating Partnership is made up of a general partner, Medical Properties Trust, LLC (“General Partner”) and limited partners, including the Company (which owns 100% of the General Partner) and three other partners. By virtue of its ownership of the General Partner, the Company has a 99.9% ownership interest in Operating Partnership via its ownership of all the common units. The remaining ownership interest is held by the two employees and one director via their ownership of LTIP units. These LTIP units were issued pursuant to the 2007 Multi-Year Incentive Plan, which is now part of the Equity Incentive Plan discussed in Note 7 and once vested in accordance with their award agreement, may be converted to common units per the Second Amended and Restated Agreement of Limited Partnership of MPT Operating Partnership, L.P. (“Operating Partnership Agreement”).
In regards to distributions, the Operating Partnership shall distribute cash at such times and in such amounts as are determined by the General Partner in its sole and absolute discretion, to common unit holders who are common unit holders on the record date. However, per the Operating Partnership Agreement, the General Partner shall use its reasonable efforts to cause the Operating Partnership to distribute amounts sufficient to enable the Company to pay stockholder dividends that will allow the Company to (i) meet its distribution requirement for qualification as a REIT and (ii) avoid any federal income or excise tax liability imposed by the Code, other than to the extent the Company elects to retain and pay income tax on its net capital gain. In accordance with the Operating Partnership Agreement, LTIP units are treated as common units for distribution purposes.
The Operating Partnership’s net income will generally be allocated first to the General Partner to the extent of any cumulative losses and then to the limited partners in accordance with their respective percentage interests in the common units issued by the Operating Partnership. Any losses of the Operating Partnership will generally be allocated first to the limited partners until their capital account is zero and then to the General Partner. In accordance with the Operating Partnership Agreement, LTIP units are treated as common units for purposes of income and loss allocations. Limited partners have the right to require the Operating Partnership to redeem part or all of their common units. It is at the Operating Partnership’s discretion to redeem such common units for cash
114
Table of Contents
Index to Financial Statements
based on the fair market value of an equivalent number of shares of the Company’s common stock at the time of redemption or, alternatively, redeem the common units for shares of the Company’s common stock on a one-for-one basis, subject to adjustment in the event of stock splits, stock dividends, or similar events. In order for LTIP units to be redeemed, they must first be converted to common units and then must wait two years from the issuance of the LTIP units to be redeemed.
For each share of common stock issued by Medical Properties Trust, Inc., the Operating Partnership issues a corresponding number of operating partnership units.
10. Fair Value of Financial Instruments
We have various assets and liabilities that are considered financial instruments. We estimate that the carrying value of cash and cash equivalents, and accounts payable and accrued expenses approximate their fair values. Included in our accounts payable and accrued expenses at December 31, 2015, were our interest rate swaps, which were recorded at fair value based on Level 2 observable market assumptions using standardized derivative pricing models. We estimate the fair value of our interest and rent receivables using Level 2 inputs such as discounting the estimated future cash flows using the current rates at which similar receivables would be made to others with similar credit ratings and for the same remaining maturities. The fair value of our mortgage and working capital loans are estimated by using Level 2 inputs such as discounting the estimated future cash flows using the current rates which similar loans would be made to borrowers with similar credit ratings and for the same remaining maturities. We determine the fair value of our senior unsecured notes, using Level 2 inputs such as quotes from securities dealers and market makers. We estimate the fair value of our Revolving credit facility and term loans using Level 2 inputs based on the present value of future payments, discounted at a rate which we consider appropriate for such debt.
Fair value estimates are made at a specific point in time, are subjective in nature, and involve uncertainties and matters of significant judgment. Settlement of such fair value amounts may not be possible and may not be a prudent management decision. The following table summarizes fair value estimates for our financial instruments (in thousands):
| December 31, 2016 |
December 31, 2015 |
|||||||||||||||
| Asset (Liability) |
Book Value |
Fair Value |
Book Value |
Fair Value |
||||||||||||
| Interest and rent receivables |
$ | 57,698 | $ | 57,707 | $ | 46,939 | $ | 46,858 | ||||||||
| Loans(1) |
986,987 | 1,017,428 | 508,851 | 543,859 | ||||||||||||
| Debt, net |
(2,909,341 | ) | (2,966,759 | ) | (3,322,541 | ) | (3,372,773 | ) | ||||||||
| (1) | Excludes loans related to Ernest and Capella (2015 only) since they are recorded at fair value as discussed below. |
Items Measured at Fair Value on a Recurring Basis
Our equity interest in Ernest, Capella (2015 only) and related loans, as discussed in Note 2, are being measured at fair value on a recurring basis as we elected to account for these investments using the fair value option method. We have elected to account for these investments at fair value due to the size of the investments and because we believe this method is more reflective of current values. We have not made a similar election for other equity interests or loans in or prior to 2016.
115
Table of Contents
Index to Financial Statements
At December 31, 2016, the amounts recorded under the fair value option method were as follows (in thousands):
| Asset (Liability) |
Fair Value |
Cost | Asset Type Classification | |||||||
| Mortgage loan |
$ | 112,836 | $ | 112,836 | Mortgage loans | |||||
| Acquisition and other loans |
116,298 | 116,298 | Other loans | |||||||
| Equity investment |
3,300 | 3,300 | Other assets | |||||||
|
|
|
|
|
|||||||
| $ | 232,434 | $ | 232,434 | |||||||
|
|
|
|
|
|||||||
At December 31, 2015, the amounts recorded under the fair value option method were as follows (in thousands):
| Asset (Liability) |
Fair Value |
Cost | Asset Type Classification |
|||||||||
| Mortgage loan |
$ | 310,000 | $ | 310,000 | Mortgage loans | |||||||
| Acquisition and other loans |
603,552 | 603,552 | Other loans | |||||||||
| Equity investment |
7,349 | 7,349 | Other assets | |||||||||
|
|
|
|
|
|||||||||
| $ | 920,901 | $ | 920,901 | |||||||||
|
|
|
|
|
|||||||||
Our mortgage and other loans with Ernest and Capella (2015 only) are recorded at fair value based on Level 2 inputs by discounting the estimated cash flows using the market rates which similar loans would be made to borrowers with similar credit ratings and the same remaining maturities. Our equity investments in Ernest and Capella (2015 only) are recorded at fair value based on Level 3 inputs, by using a discounted cash flow model, which requires significant estimates of our investee such as projected revenue and expenses and appropriate consideration of the underlying risk profile of the forecasted assumptions associated with the investee. We classify the equity investments as Level 3, as we use certain unobservable inputs to the valuation methodology that are significant to the fair value measurement, and the valuation requires management judgment due to the absence of quoted market prices. For these cash flow models, our observable inputs include use of a capitalization rate, discount rate (which is based on a weighted-average cost of capital), and market interest rates, and our unobservable input includes an adjustment for a DLOM on our equity investment of 40% at December 31, 2016.
In regards to the underlying projection of revenues and expenses used in the discounted cash flow model, such projections are provided by Ernest and Capella (2015 only), respectively. However, we will modify such projections (including underlying assumptions used) as needed based on our review and analysis of their historical results, meetings with key members of management, and our understanding of trends and developments within the healthcare industry.
In arriving at the DLOM, we started with a DLOM range based on the results of studies supporting valuation discounts for other transactions or structures without a public market. To select the appropriate DLOM within the range, we then considered many qualitative factors including the percent of control, the nature of the underlying investee’s business along with our rights as an investor pursuant to the operating agreement, the size of investment, expected holding period, number of shareholders, access to capital marketplace, etc. To illustrate the effect of movements in the DLOM, we performed a sensitivity analysis below by using basis point variations (dollars in thousands):
| Basis Point Change in Marketability Discount |
Estimated Increase (Decrease) In Fair Value |
|||
| +100 basis points |
$ | (49 | ) | |
| - 100 basis points |
49 | |||
116
Table of Contents
Index to Financial Statements
Because the fair value of Ernest and Capella (2015 only) investments noted above approximate their original cost, we did not recognize any unrealized gains/losses during 2016, 2015, or 2014. To date, we have not received any distribution payments from our equity investment in Ernest. In regards to the Capella investment, we sold this investment in 2016 at our original cost (see Note 3 for further details of this disposal).
11. Other Assets
The following is a summary of our other assets (in thousands):
| At December 31, | ||||||||
| 2016 | 2015 | |||||||
| Debt issue costs, net(1) |
$ | 4,478 | $ | 7,628 | ||||
| Equity investments |
177,430 | 129,337 | ||||||
| Other corporate assets |
77,580 | 31,547 | ||||||
| Prepaids and other assets |
44,285 | 27,028 | ||||||
|
|
|
|
|
|||||
| Total other assets |
$ | 303,773 | $ | 195,540 | ||||
|
|
|
|
|
|||||
| (1) | Relates to Revolving credit facility |
Equity investments have increased over the prior year primarily due to our new investment in Steward — see Note 3 for further details. Other corporate assets include leasehold improvements associated with our corporate office space, furniture and fixtures, equipment, software, deposits, etc. Included in prepaids and other assets is prepaid insurance, prepaid taxes, goodwill, deferred income tax assets (net of valuation allowances, if any), and lease inducements made to tenants, among other items.
12. Quarterly Financial Data (unaudited)
Medical Properties Trust, Inc.
The following is a summary of the unaudited quarterly financial information for the years ended December 31, 2016 and 2015: (amounts in thousands, except for per share data)
| For the Three Month Periods in 2016 Ended | ||||||||||||||||
| March 31 | June 30 | September 30 | December 31 | |||||||||||||
| Revenues |
$ | 134,999 | $ | 126,300 | $ | 126,555 | $ | 153,283 | ||||||||
| Income from continuing operations |
58,226 | 53,924 | 70,543 | 43,245 | ||||||||||||
| Net income |
58,225 | 53,924 | 70,543 | 43,245 | ||||||||||||
| Net income attributable to MPT common stockholders |
57,927 | 53,724 | 70,358 | 43,039 | ||||||||||||
| Net income attributable to MPT common stockholders per share — basic |
$ | 0.24 | $ | 0.23 | $ | 0.29 | $ | 0.13 | ||||||||
| Weighted average shares outstanding — basic |
237,510 | 238,082 | 246,230 | 319,833 | ||||||||||||
| Net income attributable to MPT common stockholders per share — diluted |
$ | 0.24 | $ | 0.22 | $ | 0.28 | $ | 0.13 | ||||||||
| Weighted average shares outstanding — diluted |
237,819 | 239,008 | 247,468 | 319,994 | ||||||||||||
| For the Three Month Periods in 2015 Ended | ||||||||||||||||
| March 31 | June 30 | September 30 | December 31 | |||||||||||||
| Revenues |
$ | 95,961 | $ | 99,801 | $ | 114,570 | $ | 131,546 | ||||||||
| Income from continuing operations |
35,976 | 22,489 | 23,123 | 58,339 | ||||||||||||
| Net income |
35,976 | 22,489 | 23,123 | 58,339 | ||||||||||||
| Net income attributable to MPT common stockholders |
35,897 | 22,407 | 23,057 | 58,237 | ||||||||||||
| Net income attributable to MPT common stockholders per share — basic |
$ | 0.18 | $ | 0.11 | $ | 0.10 | $ | 0.24 | ||||||||
| Weighted average shares outstanding — basic |
202,958 | 208,071 | 223,948 | 237,011 | ||||||||||||
| Net income attributable to MPT common stockholders per share —diluted |
$ | 0.17 | $ | 0.11 | $ | 0.10 | $ | 0.24 | ||||||||
| Weighted average shares outstanding — diluted |
203,615 | 208,640 | 223,948 | 237,011 | ||||||||||||
117
Table of Contents
Index to Financial Statements
MPT Operating Partnership, L.P.
The following is a summary of the unaudited quarterly financial information for the years ended December 31, 2016 and 2015: (amounts in thousands, except for per unit data)
| For the Three Month Periods in 2016 Ended | ||||||||||||||||
| March 31 | June 30 | September 30 | December 31 | |||||||||||||
| Revenues |
$ | 134,999 | $ | 126,300 | $ | 126,555 | $ | 153,283 | ||||||||
| Income from continuing operations |
58,226 | 53,924 | 70,543 | 43,245 | ||||||||||||
| Net income |
58,225 | 53,924 | 70,543 | 43,245 | ||||||||||||
| Net income attributable to MPT Operating Partnership partners |
57,927 | 53,724 | 70,358 | 43,039 | ||||||||||||
| Net income attributable to MPT Operating Partnership partners per unit — basic |
$ | 0.24 | $ | 0.23 | $ | 0.29 | $ | 0.13 | ||||||||
| Weighted average units outstanding — basic |
237,510 | 238,082 | 246,230 | 319,833 | ||||||||||||
| Net income attributable to MPT Operating Partnership partners per unit — diluted |
$ | 0.24 | $ | 0.22 | $ | 0.28 | $ | 0.13 | ||||||||
| Weighted average units outstanding — diluted |
237,819 | 239,008 | 247,468 | 319,994 | ||||||||||||
| For the Three Month Periods in 2015 Ended | ||||||||||||||||
| March 31 | June 30 | September 30 | December 31 | |||||||||||||
| Revenues |
$ | 95,961 | $ | 99,801 | $ | 114,570 | $ | 131,546 | ||||||||
| Income from continuing operations |
35,976 | 22,489 | 23,123 | 58,339 | ||||||||||||
| Net income |
35,976 | 22,489 | 23,123 | 58,339 | ||||||||||||
| Net income attributable to MPT Operating Partnership partners |
35,897 | 22,407 | 23,057 | 58,237 | ||||||||||||
| Net income attributable to MPT Operating Partnership partners per unit — basic |
$ | 0.18 | $ | 0.11 | $ | 0.10 | $ | 0.24 | ||||||||
| Weighted average units outstanding — basic |
202,958 | 208,071 | 223,948 | 237,011 | ||||||||||||
| Net income attributable to MPT Operating Partnership partners per unit — diluted |
$ | 0.17 | $ | 0.11 | $ | 0.10 | $ | 0.24 | ||||||||
| Weighted average units outstanding — diluted |
203,615 | 208,640 | 223,948 | 237,011 | ||||||||||||
13. Subsequent Events
On February 1, 2017, we replaced our Credit Facility with a new revolving credit and term loan agreement. The new agreement includes a $1.3 billion unsecured revolving loan facility, a $200 million unsecured term loan facility, and a €200 million unsecured term loan facility. The new unsecured revolving loan facility matures in February 2021 and can be extended for an additional 12 months at our option. The $200 million unsecured term loan facility matures on February 1, 2022 and the €200 million unsecured term loan facility matures on January 31, 2020, and can be extended for an additional 12 months at our option. The commitment fee on the total facility is paid at a rate of 0.25%. The term loan and/or revolving loan commitments may be increased in an aggregate amount not to exceed $500 million.
At our election, loans under the new credit facility may be made as either ABR Loans or Eurodollar Loans. The applicable margin for term loans that are ABR Loans is adjustable on a sliding scale from 0.00% to 0.95% based on our current credit rating. The applicable margin for term loans that are Eurodollar Loans is adjustable on a sliding scale from 0.90% to 1.95% based on our current credit rating. The applicable margin for revolving loans that are ABR Loans is adjustable on a sliding scale from 0.00% to 0.65% based on our current credit rating. The applicable margin for revolving loans that are Eurodollar Loans is adjustable on a sliding scale from 0.875% to 1.65% based on our current credit rating. The facility fee is adjustable on a sliding scale from 0.125% to 0.30% based on our current credit rating and is payable on the revolving loan facility.
118
Table of Contents
Index to Financial Statements
On February 2, 2017, we delivered an irrevocable notice of full redemption to the holders of the €200 million aggregate principal amount of our 5.750% Senior Notes due 2020 and set a redemption date of March 4, 2017. To fund such redemption, including any premium and accrued interest, we plan to use the proceeds of the new euro term loan together with cash on hand.
With the new revolving credit facility and term loans along with the redemption of the 5.750% Senior Notes due 2020, we expect to incur a one-time debt refinancing charge of approximately $13 million in the 2017 first quarter (of which approximately $9 million relates to the redemption premium).
119
Table of Contents
Index to Financial Statements
| ITEM 9. | Changes in and Disagreements With Accountants on Accounting and Financial Disclosure |
None.
| ITEM 9A. | Controls and Procedures |
Medical Properties Trust, Inc.
(a) Evaluation of Disclosure Controls and Procedures. As required by Rule 13a-15(b), under the Securities Exchange Act of 1934, as amended, we have carried out an evaluation, under the supervision and with the participation of management, including our Chief Executive Officer and Chief Financial Officer, of the effectiveness of the design and operation of our disclosure controls and procedures as of the end of the period covered by this report. Based on the foregoing, our Chief Executive Officer and Chief Financial Officer concluded that our disclosure controls and procedures are effective in timely alerting them to material information required to be disclosed by us in the reports that we file with the SEC.
(b) Management’s Report on Internal Control over Financial Reporting. The management of Medical Properties Trust, Inc. has prepared the consolidated financial statements and other information in our Annual Report in accordance with accounting principles generally accepted in the United States of America and is responsible for its accuracy. The financial statements necessarily include amounts that are based on management’s best estimates and judgments. In meeting its responsibility, management relies on internal accounting and related control systems. The internal control systems are designed to ensure that transactions are properly authorized and recorded in our financial records and to safeguard our assets from material loss or misuse. Such assurance cannot be absolute because of inherent limitations in any internal control system.
Management of Medical Properties Trust, Inc. is responsible for establishing and maintaining adequate internal control over financial reporting as defined in Rule 13a-15(f) of the Securities Exchange Act of 1934. Our internal control over financial reporting is a process designed to provide reasonable assurance regarding the reliability of financial reporting and the preparation of financial statements for external purposes in accordance with generally accepted accounting principles.
Because of inherent limitations, internal control over financial reporting may not prevent or detect misstatements. Also, projections of any evaluation of effectiveness to future periods are subject to the risk that controls may become inadequate because of changes in conditions, or that the degree of compliance with the policies or procedures may deteriorate.
In connection with the preparation of our annual financial statements, management has undertaken an assessment of the effectiveness of our internal control over financial reporting as of December 31, 2016. The assessment was based upon the framework described in the “Integrated Control-Integrated Framework” issued by the Committee of Sponsoring Organizations of the Treadway Commission (“COSO”) based on criteria established in Internal Control — Integrated Framework (2013). Management’s assessment included an evaluation of the design of internal control over financial reporting and testing of the operational effectiveness of internal control over financial reporting. We have reviewed the results of the assessment with the Audit Committee of our Board of Directors.
Based on our assessment under the criteria set forth in COSO, management has concluded that, as of December 31, 2016, Medical Properties Trust, Inc. maintained effective internal control over financial reporting.
The effectiveness of our internal control over financial reporting as of December 31, 2016, has been audited by PricewaterhouseCoopers LLP, an independent registered public accounting firm, as stated in their report which appears herein.
(c) Changes in Internal Controls over Financial Reporting. There has been no change in Medical Properties Trust, Inc.’s internal control over financial reporting during our most recent fiscal quarter that has materially affected, or is reasonably likely to materially affect, our internal control over financial reporting.
120
Table of Contents
Index to Financial Statements
MPT Operating Partnership, L.P.
(a) Evaluation of Disclosure Controls and Procedures. As required by Rule 13a-15(b), under the Securities Exchange Act of 1934, as amended, we have carried out an evaluation, under the supervision and with the participation of management, including our Chief Executive Officer and Chief Financial Officer, of the effectiveness of the design and operation of our disclosure controls and procedures as of the end of the period covered by this report. Based on the foregoing, our Chief Executive Officer and Chief Financial Officer concluded that our disclosure controls and procedures are effective in timely alerting them to material information required to be disclosed by us in the reports that we file with the SEC.
(b) Management’s Report on Internal Control over Financial Reporting. The management of MPT Operating Partnership, L.P. has prepared the consolidated financial statements and other information in our Annual Report in accordance with accounting principles generally accepted in the United States of America and is responsible for its accuracy. The financial statements necessarily include amounts that are based on management’s best estimates and judgments. In meeting its responsibility, management relies on internal accounting and related control systems. The internal control systems are designed to ensure that transactions are properly authorized and recorded in our financial records and to safeguard our assets from material loss or misuse. Such assurance cannot be absolute because of inherent limitations in any internal control system.
Management of MPT Operating Partnership, L.P. is responsible for establishing and maintaining adequate internal control over financial reporting as defined in Rule 13a-15(f) of the Securities Exchange Act of 1934. Our internal control over financial reporting is a process designed to provide reasonable assurance regarding the reliability of financial reporting and the preparation of financial statements for external purposes in accordance with generally accepted accounting principles.
Because of inherent limitations, internal control over financial reporting may not prevent or detect misstatements. Also, projections of any evaluation of effectiveness to future periods are subject to the risk that controls may become inadequate because of changes in conditions, or that the degree of compliance with the policies or procedures may deteriorate.
In connection with the preparation of our annual financial statements, management has undertaken an assessment of the effectiveness of our internal control over financial reporting as of December 31, 2016. The assessment was based upon the framework described in the “Integrated Control-Integrated Framework” issued by COSO based on criteria established in Internal Control — Integrated Framework (2013). Management’s assessment included an evaluation of the design of internal control over financial reporting and testing of the operational effectiveness of internal control over financial reporting. We have reviewed the results of the assessment with the Audit Committee of our Board of Directors.
Based on our assessment under the criteria set forth in COSO, management has concluded that, as of December 31, 2016, MPT Operating Partnership, L.P. maintained effective internal control over financial reporting.
The effectiveness of our internal control over financial reporting as of December 31, 2016, has been audited by PricewaterhouseCoopers LLP, an independent registered public accounting firm, as stated in their report which appears herein.
(c) Changes in Internal Controls over Financial Reporting. There has been no change in MPT Operating Partnership, L.P.’s internal control over financial reporting during our most recent fiscal quarter that has materially affected, or is reasonably likely to materially affect, our internal control over financial reporting.
| ITEM 9B. | Other Information |
None.
121
Table of Contents
Index to Financial Statements
| ITEM 10. | Directors, Executive Officers and Corporate Governance |
The information required by this Item 10 is incorporated by reference to our definitive Proxy Statement for the 2017 Annual Meeting of Stockholders, which will be filed by us with the Commission not later than April 30, 2017.
| ITEM 11. | Executive Compensation |
The information required by this Item 11 is incorporated by reference to our definitive Proxy Statement for the 2017 Annual Meeting of Stockholders, which will be filed by us with the Commission not later than April 30, 2017.
| ITEM 12. | Security Ownership of Certain Beneficial Owners and Management and Related Stockholder Matters |
The information required by this Item 12 is incorporated by reference to our definitive Proxy Statement for the 2017 Annual Meeting of Stockholders, which will be filed by us with the Commission not later than April 30, 2017.
| ITEM 13. | Certain Relationships and Related Transactions, and Director Independence |
The information required by this Item 13 is incorporated by reference to our definitive Proxy Statement for the 2017 Annual Meeting of Stockholders, which will be filed by us with the Commission not later than April 30, 2017.
| ITEM 14. | Principal Accountant Fees and Services |
The information required by this Item 14 is incorporated by reference to our definitive Proxy Statement for the 2017 Annual Meeting of Stockholders, which will be filed by us with the Commission not later than April 30, 2017.
122
Table of Contents
Index to Financial Statements
| ITEM 15. | Exhibits and Financial Statement Schedules |
(a) Financial Statements and Financial Statement Schedules
Index of Financial Statements of Medical Properties Trust, Inc. and MPT Operating Partnership, L.P. which are included in Part II, Item 8 of this Annual Report on Form 10-K:
| 69 | ||||
| 70 | ||||
| Medical Properties Trust, Inc. |
||||
| Consolidated Balance Sheets as of December 31, 2016 and 2015 |
71 | |||
| Consolidated Statements of Net Income for the Years Ended December 31, 2016, 2015 and 2014 |
72 | |||
| 73 | ||||
| Consolidated Statements of Equity for the Years Ended December 31, 2016, 2015 and 2014 |
74 | |||
| Consolidated Statements of Cash Flows for the Years Ended December 31, 2016, 2015 and 2014 |
75 | |||
| MPT Operating Partnership, L.P. |
||||
| Consolidated Balance Sheets as of December 31, 2016 and 2015 |
76 | |||
| Consolidated Statements of Net Income for the Years Ended December 31, 2016, 2015 and 2014 |
77 | |||
| 78 | ||||
| Consolidated Statements of Capital for the Years Ended December 31, 2016, 2015 and 2014 |
79 | |||
| Consolidated Statements of Cash Flows for the Years Ended December 31, 2016, 2015, and 2014 |
80 | |||
| Medical Properties Trust, Inc. and MPT Operating Partnership, L.P. |
||||
| 81 | ||||
| Financial Statement Schedules |
||||
| 133 | ||||
| 134 | ||||
| 143 | ||||
123
Table of Contents
Index to Financial Statements
(b) Exhibits
| Exhibit Number |
Exhibit Title | |
| 3.1(1) | Medical Properties Trust, Inc. Second Articles of Amendment and Restatement | |
| 3.2(3) | Articles of Amendment of Second Articles of Amendment and Restatement of Medical Properties Trust, Inc. | |
| 3.3(6) | Articles of Amendment of Second Articles of Amendment and Restatement of Medical Properties Trust, Inc. | |
| 3.4(19) | Articles of Amendment to Second Articles of Amendment and Restatement of Medical Properties Trust, Inc. | |
| 3.5(32) | Articles of Amendment to Second Articles of Amendment and Restatement of Medical Properties Trust, Inc. | |
| 3.6(33) | Articles of Amendment to Second Articles of Amendment and Restatement of Medical Properties Trust, Inc. | |
| 3.7(2) | Medical Properties Trust, Inc. Second Amended and Restated Bylaws | |
| 3.8(32) | Amendment to Second Amended and Restated Bylaws of Medical Properties Trust, Inc. | |
| 3.9(40) | Amendment to Second Amended and Restated Bylaws of Medical Properties Trust, Inc. | |
| 3.10(41) | Amendment to Second Amended and Restated Bylaws of Medical Properties Trust, Inc. | |
| 4.1(1) | Form of Common Stock Certificate | |
| 4.2(4) | Indenture, dated July 14, 2006, among Medical Properties Trust, Inc., MPT Operating Partnership, L.P. and the Wilmington Trust Company, as trustee | |
| 4.3(9) | Indenture, dated as of April 26, 2011, Medical Properties Trust, Inc., MPT Operating Partnership, L.P., MPT Finance Corporation, the Subsidiary Guarantors and Wilmington Trust Company, as Trustee. | |
| 4.4(26) | First Supplemental Indenture to 2011 Indenture, dated as of August 10, 2011, among Medical Properties Trust, Inc., MPT Operating Partnership, L.P., MPT Finance Corporation, the Subsidiary Guarantors and Wilmington Trust, N.A., as Trustee. | |
| 4.5(26) | Second Supplemental Indenture to 2011 Indenture, dated as of October 3, 2011, among Medical Properties Trust, Inc., MPT Operating Partnership, L.P., MPT Finance Corporation, the Subsidiary Guarantors and Wilmington Trust, N.A., as Trustee. | |
| 4.6(26) | Third Supplemental Indenture to 2011 Indenture, dated as of December 2, 2011, among Medical Properties Trust, Inc., MPT Operating Partnership, L.P., MPT Finance Corporation, the Subsidiary Guarantors and Wilmington Trust, N.A., as Trustee. | |
| 4.7(26) | Fourth Supplemental Indenture to 2011 Indenture, dated as of January 19, 2012, among Medical Properties Trust, Inc., MPT Operating Partnership, L.P., MPT Finance Corporation, the Subsidiary Guarantors and Wilmington Trust, N.A., as Trustee. | |
| 4.8(26) | Fifth Supplemental Indenture to 2011 Indenture, dated as of April 9, 2012, among Medical Properties Trust, Inc., MPT Operating Partnership, L.P., MPT Finance Corporation, the Subsidiary Guarantors and Wilmington Trust, N.A., as Trustee. | |
| 4.9(26) | Sixth Supplemental Indenture to 2011 Indenture, dated as of June 27, 2012, among Medical Properties Trust, Inc., MPT Operating Partnership, L.P., MPT Finance Corporation, the Subsidiary Guarantors and Wilmington Trust, N.A., as Trustee. | |
124
Table of Contents
Index to Financial Statements
| Exhibit Number |
Exhibit Title | |
| 4.10(26) | Seventh Supplemental Indenture to 2011 Indenture, dated as of July 31, 2012, among Medical Properties Trust, Inc., MPT Operating Partnership, L.P., MPT Finance Corporation, the Subsidiary Guarantors and Wilmington Trust, N.A., as Trustee. | |
| 4.11(26) | Eighth Supplemental Indenture to 2011 Indenture, dated as of September 28, 2012, among Medical Properties Trust, Inc., MPT Operating Partnership, L.P., MPT Finance Corporation, the Subsidiary Guarantors and Wilmington Trust, N.A., as Trustee. | |
| 4.12(26) | Ninth Supplemental Indenture to 2011 Indenture, dated as of December 28, 2012, among Medical Properties Trust, Inc., MPT Operating Partnership, L.P., MPT Finance Corporation, the Subsidiary Guarantors and Wilmington Trust, N.A., as Trustee. | |
| 4.13(26) | Tenth Supplemental Indenture to 2011 Indenture, dated as of June 27, 2013, among Medical Properties Trust, Inc., MPT Operating Partnership, L.P., MPT Finance Corporation, the Subsidiary Guarantors and Wilmington Trust, N.A., as Trustee. | |
| 4.14(26) | Eleventh Supplemental Indenture to 2011 Indenture, dated as of August 8, 2013, among Medical Properties Trust, Inc., MPT Operating Partnership, L.P., MPT Finance Corporation, the Subsidiary Guarantors and Wilmington Trust, N.A., as Trustee. | |
| 4.15(26) | Twelfth Supplemental Indenture to 2011 Indenture, dated as of October 30, 2013, among Medical Properties Trust, Inc., MPT Operating Partnership, L.P., MPT Finance Corporation, the Subsidiary Guarantors and Wilmington Trust, N.A., as Trustee. | |
| 4.16(26) | Thirteenth Supplemental Indenture to 2011 Indenture, dated as of December 20, 2013, among Medical Properties Trust, Inc., MPT Operating Partnership, L.P., MPT Finance Corporation, the Subsidiary Guarantors and Wilmington Trust, N.A., as Trustee. | |
| 4.17(31) | Fourteenth Supplemental Indenture to 2011 Indenture, dated as of March 31, 2014, among Medical Properties Trust, Inc., MPT Operating Partnership, L.P., MPT Finance Corporation, the Subsidiary Guarantors and Wilmington Trust, N.A., as Trustee. | |
| 4.18(27) | Fifteenth Supplemental Indenture to 2011 Indenture, dated as of June 30, 2014, among Medical Properties Trust, Inc., MPT Operating Partnership, L.P., MPT Finance Corporation, the Subsidiary Guarantors and Wilmington Trust, N.A., as Trustee. | |
| 4.19(31) | Sixteenth Supplemental Indenture to 2011 Indenture, dated as of October 3, 2014, among Medical Properties Trust, Inc., MPT Operating Partnership, L.P., MPT Finance Corporation, the Subsidiary Guarantors and Wilmington Trust, N.A., as Trustee. | |
| 4.20(20) | Indenture, dated as of February 17, 2012, among Medical Properties Trust, Inc., MPT Operating Partnership, L.P., MPT Finance Corporation, the Subsidiary Guarantors and Wilmington Trust, N.A., as Trustee. | |
| 4.21(23) | First Supplemental Indenture to 2012 Indenture, dated as of April 9, 2012, among Medical Properties Trust, Inc., MPT Operating Partnership, L.P., MPT Finance Corporation, the Subsidiary Guarantors and Wilmington Trust, N.A., as Trustee. | |
| 4.22(23) | Second Supplemental Indenture to 2012 Indenture, dated as of June 27, 2012, among Medical Properties Trust, Inc., MPT Operating Partnership, L.P., MPT Finance Corporation, the Subsidiary Guarantors and Wilmington Trust, N.A., as Trustee. | |
| 4.23(23) | Third Supplemental Indenture to 2012 Indenture, dated as of July 31, 2012, among Medical Properties Trust, Inc., MPT Operating Partnership, L.P., MPT Finance Corporation, the Subsidiary Guarantors and Wilmington Trust, N.A., as Trustee. | |
| 4.24(23) | Fourth Supplemental Indenture to 2012 Indenture, dated as of September 28, 2012, among Medical Properties Trust, Inc., MPT Operating Partnership, L.P., MPT Finance Corporation, the Subsidiary Guarantors and Wilmington Trust, N.A., as Trustee. | |
125
Table of Contents
Index to Financial Statements
| Exhibit Number |
Exhibit Title | |
| 4.25(23) | Fifth Supplemental Indenture to 2012 Indenture, dated as of December 26, 2012, among Medical Properties Trust, Inc., MPT Operating Partnership, L.P., MPT Finance Corporation, the Subsidiary Guarantors and Wilmington Trust, N.A., as Trustee. | |
| 4.26(23) | Sixth Supplemental Indenture to 2012 Indenture, dated as of June 27, 2013, among Medical Properties Trust, Inc., MPT Operating Partnership, L.P., MPT Finance Corporation, the Subsidiary Guarantors and Wilmington Trust, N.A., as Trustee. | |
| 4.27(23) | Seventh Supplemental Indenture to 2012 Indenture, dated as of August 8, 2013, among Medical Properties Trust, Inc., MPT Operating Partnership, L.P., MPT Finance Corporation, the Subsidiary Guarantors and Wilmington Trust, N.A., as Trustee. | |
| 4.28(24) | Eighth Supplemental Indenture to 2012 Indenture, dated as of August 20, 2013, among Medical Properties Trust, Inc., MPT Operating Partnership, L.P., MPT Finance Corporation, the Subsidiary Guarantors and Wilmington Trust, N.A., as Trustee. | |
| 4.29(26) | Ninth Supplemental Indenture to 2012 Indenture, dated as of October 30, 2013, among Medical Properties Trust, Inc., MPT Operating Partnership, L.P., MPT Finance Corporation, the Subsidiary Guarantors and Wilmington Trust, N.A., as Trustee. | |
| 4.30(26) | Tenth Supplemental Indenture to 2012 Indenture, dated as of December 20, 2013, among Medical Properties Trust, Inc., MPT Operating Partnership, L.P., MPT Finance Corporation, the Subsidiary Guarantors and Wilmington Trust, N.A., as Trustee. | |
| 4.31(28) | Eleventh Supplemental Indenture to 2012 Indenture, dated as of March 31, 2014, among Medical Properties Trust, Inc., MPT Operating Partnership, L.P., MPT Finance Corporation, the Subsidiary Guarantors and Wilmington Trust, N.A., as Trustee. | |
| 4.32(27) | Twelfth Supplemental Indenture to 2012 Indenture, dated as of June 30, 2014, among Medical Properties Trust, Inc., MPT Operating Partnership, L.P., MPT Finance Corporation, the Subsidiary Guarantors and Wilmington Trust, N.A., as Trustee. | |
| 4.33(31) | Thirteenth Supplemental Indenture to 2012 Indenture, dated as of October 3, 2014, among Medical Properties Trust, Inc., MPT Operating Partnership, L.P., MPT Finance Corporation, the Subsidiary Guarantors and Wilmington Trust, N.A., as Trustee. | |
| 4.34(25) | Indenture, dated as of October 10, 2013, among Medical Properties Trust, Inc., MPT Operating Partnership, L.P., MPT Finance Corporation, the Subsidiary Guarantors and Wilmington Trust, N.A., as Trustee. | |
| 4.35(25) | First Supplemental Indenture to 2013 Indenture, dated as of October 10, 2013, among Medical Properties Trust, Inc., MPT Operating Partnership, L.P., MPT Finance Corporation, the Subsidiary Guarantors and Wilmington Trust, N.A., as Trustee. | |
| 4.36(26) | Second Supplemental Indenture to 2013 Indenture, dated as of October 30, 2013, among Medical Properties Trust, Inc., MPT Operating Partnership, L.P., MPT Finance Corporation, the Subsidiary Guarantors and Wilmington Trust, N.A., as Trustee. | |
| 4.37(26) | Third Supplemental Indenture to 2013 Indenture, dated as of December 20, 2013, among Medical Properties Trust, Inc., MPT Operating Partnership, L.P., MPT Finance Corporation, the Subsidiary Guarantors and Wilmington Trust, N.A., as Trustee. | |
| 4.38(28) | Fourth Supplemental Indenture to 2013 Indenture, dated as of March 31, 2014, among Medical Properties Trust, Inc., MPT Operating Partnership, L.P., MPT Finance Corporation, the Subsidiary Guarantors and Wilmington Trust, N.A., as Trustee. | |
| 4.39(29) | Fifth Supplemental Indenture to 2013 Indenture, dated as of April 17, 2014, among Medical Properties Trust, Inc., MPT Operating Partnership, L.P., MPT Finance Corporation, the Subsidiary Guarantors and Wilmington Trust, N.A., as Trustee. | |
126
Table of Contents
Index to Financial Statements
| Exhibit Number |
Exhibit Title | |
| 4.40(27) | Sixth Supplemental Indenture to 2013 Indenture, dated as of June 30, 2014, among Medical Properties Trust, Inc., MPT Operating Partnership, L.P., MPT Finance Corporation, the Subsidiary Guarantors and Wilmington Trust, N.A., as Trustee. | |
| 4.41(31) | Seventh Supplemental Indenture to 2013 Indenture, dated as of October 3, 2014, among Medical Properties Trust, Inc., MPT Operating Partnership, L.P., MPT Finance Corporation, the Subsidiary Guarantors and Wilmington Trust, N.A., as Trustee. | |
| 4.42(34) | Eighth Supplemental Indenture to 2013 Indenture, dated as of August 19, 2015, among Medical Properties Trust, Inc., MPT Operating Partnership, L.P., MPT Finance Corporation, Wilmington trust, N.A., as Trustee, Deutsche Bank Trust company Americas, as Paying Agent, and Deutsche Bank Luxembourg S.A., as Registrar and Transfer Agent. | |
| 4.43(36) | Ninth Supplemental Indenture, dated as of February 22, 2016, by and among MPT Operating Partnership, L.P. and MPT Finance Corporation, as issuers, Medical Properties Trust, Inc., as parent and guarantor, and Wilmington Trust, National Association, as trustee. | |
| 4.44(39) | Tenth Supplemental Indenture, dated as of July 22, 2016, by and among MPT Operating Partnership, L.P. and MPT Finance Corporation, as issuers, Medical Properties Trust, Inc., as parent and guarantor, and Wilmington Trust, National Association, as trustee. | |
| 10.2(8) | Medical Properties Trust, Inc. 2013 Equity Incentive Plan | |
| 10.3(7) | Form of Stock Option Award | |
| 10.4(7) | Form of Restricted Stock Award | |
| 10.5(7) | Form of Deferred Stock Unit Award | |
| 10.6(1) | Employment Agreement between Medical Properties Trust, Inc. and Edward K. Aldag, Jr., dated September 10, 2003 | |
| 10.7(1) | First Amendment to Employment Agreement between Registrant and Edward K. Aldag, Jr., dated March 8, 2004 | |
| 10.8(1) | Employment Agreement between Medical Properties Trust, Inc. and R. Steven Hamner, dated September 10, 2003 | |
| 10.9(1) | Employment Agreement between Medical Properties Trust, Inc. and Emmett E. McLean, dated September 10, 2003 | |
| 10.10(1) | Form of Indemnification Agreement between Medical Properties Trust, Inc. and executive officers and directors | |
| 10.11(11) | Form of Medical Properties Trust, Inc. 2007 Multi-Year Incentive Plan Award Agreement (LTIP Units) | |
| 10.12(11) | Form of Medical Properties Trust, Inc. 2007 Multi-Year Incentive Plan Award Agreement (Restricted Shares) | |
| 10.13(16) | Second Amendment to Employment Agreement between Medical Properties Trust, Inc. and Edward K. Aldag, Jr., dated September 29, 2006 | |
| 10.14(16) | First Amendment to Employment Agreement between Medical Properties Trust, Inc. and R. Steven Hamner, dated September 29, 2006 | |
| 10.15(16) | First Amendment to Employment Agreement between Medical Properties Trust, Inc. and Emmett E. McLean, dated September 29, 2006 | |
| 10.16(17) | Second Amendment to Employment Agreement between Medical Properties Trust, Inc. and Emmett E. McLean, dated January 1, 2008 | |
127
Table of Contents
Index to Financial Statements
| Exhibit Number |
Exhibit Title | |
| 10.17(17) | Third Amendment to Employment Agreement between Medical Properties Trust, Inc. and Emmett E. McLean, dated January 1, 2009 | |
| 10.18(17) | Second Amendment to Employment Agreement between Medical Properties Trust, Inc. and Richard S. Hamner, dated January 1, 2008 | |
| 10.19(17) | Third Amendment to Employment Agreement between Medical Properties Trust, Inc. and R. Steven Hamner, dated January 1, 2009 | |
| 10.20(17) | Third Amendment to Employment Agreement between Medical Properties Trust, Inc. and Edward K. Aldag, Jr., dated January 1, 2008 | |
| 10.21(17) | Fourth Amendment to Employment Agreement between Medical Properties Trust, Inc. and Edward K. Aldag, Jr., dated January 1, 2009 | |
| 10.22(9) | Amended and Restated Revolving Credit and Term Loan Agreement, dated as of April 26, 2011, among Medical Properties Trust, Inc., MPT Operating Partnership, L.P., KeyBank National Association as syndication agent, and JPMorgan Chase Bank, N.A., as administrative agent | |
| 10.23(30) | Amended and Restated Revolving Credit and Term Loan Agreement, dated as of June 19, 2014, among Medical Properties Trust, Inc., MPT Operating Partnership, L.P., the several lenders from time to time party thereto, Bank of America, N.A., as syndication agent, and JPMorgan Chase Bank, N.A., as administrative agent. | |
| 10.24(31) | First Amendment to Amended and Restated Revolving Credit and Term Loan Agreement, dated as of October 17, 2014, among Medical Properties Trust, Inc., MPT Operating Partnership, L.P., the several lenders from time to time party thereto, Bank of America, N.A., as syndication agent, and JPMorgan Chase Bank, N.A., as administrative agent. | |
| 10.25(35) | Second Amendment to Amended and Restated Revolving Credit and Term Loan Agreement, dated as of August 4, 2015, among Medical Properties Trust, Inc., MPT Operating Partnership, L.P., the several lenders from time to time party thereto, Bank of America, N.A., as syndication agent, and JPMorgan Chase Bank, N.A., as administrative agent. | |
| 10.26(35) | Third Amendment to Amended and Restated Revolving Credit and Term Loan Agreement, dated as of September 30, 2015, among Medical Properties Trust, Inc., MPT Operating Partnership, L.P., the several lenders from time to time party thereto, Bank of America, N.A., as syndication agent, and JPMorgan Chase Bank, N.A., as administrative agent. | |
| 10.27(19) | Master Sublease Agreement between certain subsidiaries of MPT Development Services, Inc. as Lessor, and certain subsidiaries of Ernest Health, Inc., as Lessee. | |
| 10.28(22) | Master Lease Agreement I between certain subsidiaries of MPT Operating Partnership, LP, as Lessor, and certain subsidiaries of Prime Healthcare Services, Inc., as Lessee and related first amendment and Master Lease Agreement II between certain subsidiaries of MPT Operating Partnership, LP, as Lessor, and certain subsidiaries of Prime Healthcare Services, Inc., as Lessee and related first amendment. | |
| 10.29(33) | Form of Master Lease Agreement between certain subsidiaries of MPT Operating Partnership, L.P., as Lessor, and MEDIAN Kliniken S.a.r.l. and certain of its subsidiaries, as Lessee, and related first and second amendments. | |
| 10.30(37) | Master Lease Agreement between certain subsidiaries of MPT Development Services, Inc., as Lessor, and certain subsidiaries of Capella Holdings, Inc., as Lessee. | |
| 10.31(37) | Joinder and Amendment to Master Lease Agreement between certain subsidiaries of MPT Development Services, Inc., as Lessor, and certain subsidiaries of Capella Holdings, Inc., as Lessee. | |
128
Table of Contents
Index to Financial Statements
| Exhibit Number |
Exhibit Title | |
| 10.32(38) | Amended and Restated Master Lease Agreement between certain subsidiaries of MPT Operating Partnership, L.P., as lessor and certain subsidiaries of Capella Holdings, Inc., as lessee. | |
| 10.33* | Master Lease Agreement by and among certain subsidiaries of MPT Operating Partnership, L.P. as Lessor and certain subsidiaries of Steward Health Care System LLC, Lessee. | |
| 10.34* | Real Estate Loan Agreement by and among certain subsidiaries of MPT Operating Partnership, L.P. as Lessor and certain subsidiaries of Steward Health Care System LLC, Lessee. | |
| 10.35* | Amended and Restated Revolving Credit and Term Loan Agreement, dated as of February 1, 2017, among Medical Properties Trust, Inc., MPT Operating Partnership, L.P., the several lenders from time to time party thereto, Bank of America, N.A., as syndication agent, and JPMorgan Chase Bank, N.A., as administrative agent. | |
| 12.1* | Statement re Computation of Ratios | |
| 21.1* | Subsidiaries of Medical Properties Trust, Inc. | |
| 23.1* | Consent of PricewaterhouseCoopers LLP | |
| 23.2* | Consent of PricewaterhouseCoopers LLP | |
| 31.1* | Certification of Chief Executive Officer pursuant to Rule 13a-14(a) under the Securities Exchange Act of 1934. (Medical Properties Trust, Inc.) | |
| 31.2* | Certification of Chief Financial Officer pursuant to Rule 13a-14(a) under the Securities Exchange Act of 1934. (Medical Properties Trust, Inc.) | |
| 31.3* | Certification of Chief Executive Officer pursuant to Rule 13a-14(a) under the Securities Exchange Act of 1934. (MPT Operating Partnership, L.P.) | |
| 31.4* | Certification of Chief Financial Officer pursuant to Rule 13a-14(a) under the Securities Exchange Act of 1934. (MPT Operating Partnership, L.P.) | |
| 32.1** | Certification of Chief Executive Officer and Chief Financial Officer pursuant to Rule 13a-14(b) under the Securities Exchange Act of 1934 and 18 U.S.C. Section 1350 as adopted pursuant to Section 906 of the Sarbanes-Oxley Act of 2002. (Medical Properties Trust, Inc.) | |
| 32.2** | Certification of Chief Executive Officer and Chief Financial Officer pursuant to Rule 13a-14(b) under the Securities Exchange Act of 1934 and 18 U.S.C. Section 1350 as adopted pursuant to Section 906 of the Sarbanes-Oxley Act of 2002. (MPT Operating Partnership, L.P.) | |
| Exhibit 101.INS | XBRL Instance Document | |
| Exhibit 101.SCH | XBRL Taxonomy Extension Schema Document | |
| Exhibit 101.CAL | XBRL Taxonomy Extension Calculation Linkbase Document | |
| Exhibit 101.DEF | XBRL Taxonomy Extension Definition Linkbase Document | |
| Exhibit 101.LAB | XBRL Taxonomy Extension Label Linkbase Document | |
| Exhibit 101.PRE | XBRL Taxonomy Extension Presentation Linkbase Document | |
| * | Filed herewith. |
| ** | Furnished herewith. |
| (1) | Incorporated by reference to Registrant’s Registration Statement on Form S-11 filed with the Commission on October 26, 2004, as amended (File No. 333-119957). |
| (2) | Incorporated by reference to Registrant’s current report on Form 8-K, filed with the Commission on November 24, 2009. |
129
Table of Contents
Index to Financial Statements
| (3) | Incorporated by reference to Registrant’s quarterly report on Form 10-Q for the quarter ended September 30, 2005, filed with the Commission on November 10, 2005. |
| (4) | Incorporated by reference to Registrant’s current report on Form 8-K, filed with the Commission on July 20, 2006. |
| (5) | Reserved. |
| (6) | Incorporated by reference to the Registrant’s current report on Form 8-K, filed with the Commission on January 13, 2009. |
| (7) | Incorporated by reference to Registrant’s current report on Form 8-K, filed with the Commission on October 18, 2005. |
| (8) | Incorporated by reference to Registrant’s definitive proxy statement on Schedule 14A, filed with the Commission on April 26, 2013. |
| (9) | Incorporated by reference to Registrant’s current report on Form 8-K, filed with the Commission on May 2, 2011. |
| (10) | Reserved. |
| (11) | Incorporated by reference to Registrant’s current report on Form 8-K, filed with the Commission on August 6, 2007, as amended by Medical Properties Trust, Inc.’s current report on Form 8-K/A, filed with the Commission on August 15, 2007. |
| (12) | Reserved. |
| (13) | Reserved. |
| (14) | Reserved. |
| (15) | Reserved. |
| (16) | Incorporated by reference to Registrant’s annual report on Form 10-K/A for the period ended December 31, 2007, filed with the Commission on July 11, 2008. |
| (17) | Incorporated by reference to Registrant’s annual report on Form 10-K for the period ended December 31, 2008, filed with the Commission on March 13, 2009. |
| (18) | Incorporated by reference to Registrant’s current report on Form 8-K, filed with the Commission on June 11, 2010. |
| (19) | Incorporated by reference to Medical Properties Trust, Inc.’s current report on Form 8-K, filed with the Commission on January 31, 2012. |
| (20) | Incorporated by reference to Medical Properties Trust, Inc. and MPT Operating Partnership, L.P.’s current report on Form 8-K, filed with the Commission on February 24, 2012. |
| (21) | Reserved. |
| (22) | Incorporated by reference to Medical Properties Trust, Inc. and MPT Operating Partnership, L.P.’s quarterly report on Form 10-Q, filed with the Commission on November 9, 2012. |
| (23) | Incorporated by reference to Medical Properties Trust, Inc., MPT Operating Partnership, L.P. and MPT Finance Corporation’s registration statement on Form S-3, filed with the Commission on August 9, 2013. |
| (24) | Incorporated by reference to Medical Properties Trust, Inc. and MPT Operating Partnership, L.P.’s current report on Form 8-K, filed with the Commission on August 20, 2013. |
| (25) | Incorporated by reference to Medical Properties Trust, Inc. and MPT Operating Partnership, L.P.’s current report on Form 8-K, filed with the Commission on October 16, 2013. |
| (26) | Incorporated by reference to Medical Properties Trust, Inc. and MPT Operating Partnership, L.P.’s annual report on Form 10-K, filed with the Commission on March 3, 2014. |
| (27) | Incorporated by reference to Medical Properties Trust, Inc. and MPT Operating Partnership, L.P.’s quarterly report on Form 10-Q, filed with the Commission on August 11, 2014. |
| (28) | Incorporated by reference to Medical Properties Trust, Inc., MPT Operating Partnership, L.P. and MPT Finance Corporation’s post-effective amendment to registration statement on Form S-3, filed with the Commission on April 10, 2014. |
| (29) | Incorporated by reference to Medical Properties Trust, Inc. and MPT Operating Partnership, L.P.’s current report on Form 8-K, filed with the Commission on April 23, 2014. |
| (30) | Incorporated by reference to Medical Properties Trust, Inc. and MPT Operating Partnership, L.P.’s current report on Form 8-K, filed with the Commission on June 25, 2014. |
130
Table of Contents
Index to Financial Statements
| (31) | Incorporated by reference to Medical Properties Trust, Inc. and MPT Operating Partnership, L.P.’s annual report on Form 10-K, filed with the Commission on March 2, 2015. |
| (32) | Incorporated by reference to Medical Properties Trust, Inc.’s current report on Form 8-K, filed with the Commission on June 26, 2015. |
| (33) | Incorporated by reference to Medical Properties Trust, Inc. and MPT Operating Partnership, L.P.’s quarterly report on Form 10-Q, filed with the Commission on August 10, 2015. |
| (34) | Incorporated by reference to Medical Properties Trust, Inc.’s current report on Form 8-K, filed with the Commission on August 21, 2015. |
| (35) | Incorporated by reference to Medical Properties Trust, Inc. and MPT Operating Partnership, L.P.’s quarterly report on Form 10-Q, filed with the Commission on November 9, 2015. |
| (36) | Incorporated by reference to Registrant’s current report on Form 8-K, filed with the Commission on February 22, 2016. |
| (37) | Incorporated by reference to Medical Properties Trust, Inc. and MPT Operating Partnership, L.P.’s annual report on Form 10-K, filed with the Commission on February 29, 2016. |
| (38) | Incorporated by reference to Medical Properties Trust, Inc. and MPT Operating Partnership, L.P.’s quarterly report on Form 10-Q, filed with the Commission on May 10, 2016. |
| (39) | Incorporated by reference to Medical Properties Trust, Inc’s Current Report on Form 8-K filed with the Commission on July 22, 2016. |
| (40) | Incorporated by reference to Medical Properties Trust, Inc’s Current Report on Form 8-K filed with the Commission on November 16, 2016. |
| (41) | Incorporated by reference to Medical Properties Trust, Inc’s Current Report on Form 8-K filed with the Commission on February 22, 2017. |
| ITEM 16. | Form 10-K Summary |
None.
131
Table of Contents
Index to Financial Statements
Pursuant to the requirements of Section 13 or 15(d) of the Securities Exchange Act of 1934, the Registrant has duly caused this Report to be signed on its behalf by the undersigned, thereunto duly authorized.
| MEDICAL PROPERTIES TRUST, INC. | ||
| By:
|
/s/ J. Kevin Hanna | |
| J. Kevin Hanna | ||
| Vice President, Controller, and Chief Accounting Officer | ||
| MPT OPERATING PARTNERSHIP, L.P. | ||
| By:
|
/s/ J. Kevin Hanna | |
| J. Kevin Hanna | ||
| Vice President, Controller, and Chief Accounting Officer of the sole member of the general partner of MPT Operating Partnership, L.P. | ||
Date: March 1, 2017
Pursuant to the requirements of the Securities Exchange Act of 1934, as amended, this Report has been signed by the following persons on behalf of the Registrant and in the capacities and on the dates indicated.
| Signature |
Title |
Date | ||
| /s/ Edward K. Aldag, Jr. Edward K. Aldag, Jr. |
Chairman of the Board, President, Chief Executive Officer and Director (Principal Executive Officer) |
March 1, 2017 | ||
| /s/ R. Steven Hamner R. Steven Hamner |
Executive Vice President, Chief Financial Officer and Director (Principal Financial Officer) |
March 1, 2017 | ||
| /s/ G. Steven Dawson G. Steven Dawson |
Director |
March 1, 2017 | ||
| /s/ Robert E. Holmes, Ph.D. Robert E. Holmes, Ph.D. |
Director |
March 1, 2017 | ||
| /s/ Sherry A. Kellett Sherry A. Kellett |
Director |
March 1, 2017 | ||
| /s/ William G. McKenzie William G. McKenzie |
Director |
March 1, 2017 | ||
| /s/ Michael G. Stewart Michael G. Stewart |
Director |
March 1, 2017 | ||
| /s/ D. Paul Sparks, Jr. D. Paul Sparks |
Director |
March 1, 2017 | ||
| /s/ C. Reynolds Thompson, III C. Reynolds Thompson, III |
Director |
March 1, 2017 | ||
132
Table of Contents
Index to Financial Statements
Medical Properties Trust, Inc. and MPT Operating Partnership, L.P.
Schedule II: Valuation and Qualifying Accounts
December 31, 2016
| Additions | Deductions | |||||||||||||||
| Year Ended December 31, |
Balance at Beginning of Year(1) |
Charged Against Operations(1) |
Net Recoveries/ Writeoffs(1) |
Balance at End of Year(1) |
||||||||||||
| (In thousands) | ||||||||||||||||
| 2016 |
$ | 27,384 | $ | 2,722 | (2) | $ | (11,254 | )(3) | $ | 18,852 | ||||||
| 2015 |
$ | 20,129 | $ | 8,205 | (4) | $ | (950 | )(5) | $ | 27,384 | ||||||
| 2014 |
$ | 41,573 | $ | 65,512 | (6) | $ | (86,956 | )(7) | $ | 20,129 | ||||||
| (1) | Includes allowance for doubtful accounts, straight-line rent reserves, allowance for loan losses, tax valuation allowances and other reserves. |
| (2) | Includes $1.9 million of rent reserves related to our Twelve Oaks facility and $0.8 million of rent reserves related to our Corinth facility. |
| (3) | Includes writeoffs of $3.3 million related to payment of rent, late fees, and loans for our Twelve Oaks facility; $0.8 million of writeoffs for rent and interest reserves related to the sale of the Corinth facility; $0.1 million of writeoffs related to the McLeod Healthcare loan; and $6.1 million decrease in valuation allowance (which includes the $4 million release of foreign valuation allowances in the 2016 fourth quarter) to reserve our net deferred tax assets. |
| (4) | Includes $1.5 million of rent and late fee reserves related to our Twelve Oaks facility; $0.5 million of rent reserves related to our Healthtrax properties; and $6.2 million to fully reserve our net deferred tax assets. |
| (5) | Writeoffs of rent and interest reserves related to sale of Healthtrax properties. |
| (6) | Includes the $47 million of impairment charges related to the Monroe property, $9.5 million of rent and interest reserves primarily related to the Monroe property (prior to change in operators — see Note 3 to Item 8 of this Annual Report on Form 10-K for further details), and approximately $9 million increase in the valuation allowance to fully reserve our net deferred tax assets. |
| (7) | Writeoffs of loans and other receivables related to the Monroe facility due to change in operators. |
133
Table of Contents
Index to Financial Statements
SCHEDULE III — REAL ESTATE INVESTMENTS AND ACCUMULATED DEPRECIATION
December 31, 2016
| Initial Costs | Additions Subsequent to Acquisition |
Cost at December 31, 2016(1) | Accumulated |
Life on which depreciation in latest income statements is computed (Years) |
||||||||||||||||||||||||||||||||||||||||||
| Location |
Type of Property |
Land | Buildings | Improvements | Carrying Costs |
Land | Buildings | Total | Depreciation | Encumbrances | Date of Construction |
Date Acquired |
||||||||||||||||||||||||||||||||||
| (Dollar amounts in thousands) | ||||||||||||||||||||||||||||||||||||||||||||||
| Bad Rappenau, Germany |
Rehabilitation hospital | $ | — | $ | 9,159 | $ | — | $ | — | $ | — | $ | 9,159 | $ | 9,159 | $ | 706 | $ | — | 1994 | November 30, 2013 |
40 | ||||||||||||||||||||||||
| Dahlen, Germany |
Rehabilitation hospital | 360 | 19,863 | — | — | 360 | 19,863 | 20,223 | 1,531 | — | 1996 | November 30, 2013 |
40 | |||||||||||||||||||||||||||||||||
| Bad Dürkheim, Germany |
Rehabilitation hospital | 3,074 | 14,531 | — | — | 3,074 | 14,531 | 17,605 | 1,120 | — | 1960 | November 30, 2013 |
40 | |||||||||||||||||||||||||||||||||
| Bad Liebenwerda, Germany |
Rehabilitation hospital | 335 | 17,307 | — | — | 335 | 17,307 | 17,642 | 1,334 | — | 1994 | November 30, 2013 |
40 | |||||||||||||||||||||||||||||||||
| Ortenberg, Germany |
Rehabilitation hospital | 89 | 5,070 | — | — | 89 | 5,070 | 5,159 | 391 | — | 1981 | November 30, 2013 |
40 | |||||||||||||||||||||||||||||||||
| Wiesbaden, Germany |
Rehabilitation hospital | 2,980 | 14,334 | — | — | 2,980 | 14,334 | 17,314 | 1,105 | — | 1977 | November 30, 2013 |
40 | |||||||||||||||||||||||||||||||||
| Bad Dürkheim, Germany |
Rehabilitation hospital | — | 28,758 | — | — | — | 28,758 | 28,758 | 2,217 | — | 1992 | November 30, 2013 |
40 | |||||||||||||||||||||||||||||||||
| Bad Liebenwerda, Germany |
Rehabilitation hospital | 522 | 14,469 | — | — | 522 | 14,469 | 14,991 | 1,115 | — | 1904, 1995 | November 30, 2013 |
40 | |||||||||||||||||||||||||||||||||
| Bad Dürkheim, Germany |
Rehabilitation hospital | 705 | 6,337 | — | — | 705 | 6,337 | 7,042 | 488 | — | 1980 | November 30, 2013 |
40 | |||||||||||||||||||||||||||||||||
| Bad Dürkheim, Germany |
Rehabilitation hospital | 5,649 | 15,597 | — | — | 5,649 | 15,597 | 21,246 | 1,202 | — | 1930 | November 30, 2013 |
40 | |||||||||||||||||||||||||||||||||
| Bad Rappenau, Germany |
Rehabilitation hospital | 3,312 | 5,642 | — | — | 3,312 | 5,642 | 8,954 | 435 | — | 1986 | November 30, 2013 |
40 | |||||||||||||||||||||||||||||||||
| Bad Tölz, Germany |
Rehabilitation hospital | 2,134 | 9,187 | — | — | 2,134 | 9,187 | 11,321 | 478 | — | 1974 | November 19, 2014 |
40 | |||||||||||||||||||||||||||||||||
| Bad Liebenstein, Germany |
Rehabilitation hospital | 1,554 | 32,836 | — | — | 1,554 | 32,836 | 34,390 | 1,779 | — | 1954, 1992 | November 5, 2014 |
40 | |||||||||||||||||||||||||||||||||
| Bad Mergentheim, Germany |
Rehabilitation hospital | — | 10,891 | — | — | — | 10,891 | 10,891 | 567 | — | 1988, 1995 | December 11, 2014 |
40 | |||||||||||||||||||||||||||||||||
| Bath, UK |
Acute care general hospital | 1,463 | 30,316 | — | — | 1,463 | 30,316 | 31,779 | 1,895 | — | 2008, 2009 | July 1, 2014 |
40 | |||||||||||||||||||||||||||||||||
| Ottenhöfen, Germany |
Rehabilitation hospital | 2,182 | 12,278 | 105 | — | 2,287 | 12,278 | 14,565 | 471 | — | 1956/1957 | July 3, 2015 |
40 | |||||||||||||||||||||||||||||||||
| Bad Berka, Germany |
Rehabilitation hospital | 3,124 | 14,569 | 163 | — | 3,287 | 14,569 | 17,856 | 531 | — | 1997 | July 22, 2015 |
40 | |||||||||||||||||||||||||||||||||
| Wiesbaden, Germany |
Rehabilitation hospital | 1,557 | 7,220 | 37 | — | 1,594 | 7,220 | 8,814 | 274 | — | 1974 | June 30, 2015 |
40 | |||||||||||||||||||||||||||||||||
| Bad Lausick, Germany |
Rehabilitation hospital | 1,677 | 15,176 | 147 | — | 1,824 | 15,176 | 17,000 | 584 | — | 1993 | June 30, 2015 |
40 | |||||||||||||||||||||||||||||||||
| Bad Sülze, Germany |
Rehabilitation hospital | 2,224 | 19,184 | 189 | — | 2,413 | 19,184 | 21,597 | 738 | — | 1993 | June 30, 2015 |
40 | |||||||||||||||||||||||||||||||||
| Kurort Berggießhübel, Germany |
Rehabilitation hospital | 2,966 | 14,961 | 131 | — | 3,097 | 14,961 | 18,058 | 542 | — | 1993 | July 21, 2015 |
40 | |||||||||||||||||||||||||||||||||
| Braunfels, Germany |
Acute care general hospital | 2,019 | 12,907 | 53 | — | 2,072 | 12,907 | 14,979 | 489 | — | 1977 | June 30, 2015 |
40 | |||||||||||||||||||||||||||||||||
| Bernkastel-Kues, Germany |
Rehabilitation hospital | 3,386 | 14,709 | 42 | — | 3,428 | 14,709 | 18,137 | 525 | — | 1982 | July 15, 2015 |
40 | |||||||||||||||||||||||||||||||||
| Flechtingen, Germany | Rehabilitation hospital | 2,692 | 13,590 | 142 | — | 2,834 | 13,590 | 16,424 | 524 | — | 1993 | June 30, 2015 | 40 | |||||||||||||||||||||||||||||||||
| Flechtingen, Germany |
Rehabilitation hospital | 2,692 | 21,291 | 210 | — | 2,902 | 21,291 | 24,193 | 819 | — | 1993-1995 | June 30, 2015 |
40 | |||||||||||||||||||||||||||||||||
| Nordrach, Germany |
Rehabilitation hospital | 294 | 2,818 | 79 | — | 373 | 2,818 | 3,191 | 114 | — | 1960 | July 7, 2015 |
40 | |||||||||||||||||||||||||||||||||
| Bad Gottleuba, Germany |
Rehabilitation hospital | 49 | 14,462 | 835 | — | 884 | 14,462 | 15,346 | 417 | — | 1913 | December 16, 2015 |
40 | |||||||||||||||||||||||||||||||||
| Grünheide, Germany |
Rehabilitation hospital | 2,674 | 39,306 | 321 | — | 2,995 | 39,306 | 42,301 | 1,422 | — | 1994/2014 | July 31, 2015 |
40 | |||||||||||||||||||||||||||||||||
| Baden-Baden, Germany |
Rehabilitation hospital | 1,230 | 8,652 | 121 | — | 1,351 | 8,652 | 10,003 | 337 | — | 1900/2002- 2003 |
June 30, 2015 |
40 | |||||||||||||||||||||||||||||||||
| Gyhum, Germany |
Rehabilitation hospital | 3,755 | 21,461 | 330 | — | 4,085 | 21,461 | 25,546 | 838 | — | 1994 | June 30, 2015 |
40 | |||||||||||||||||||||||||||||||||
| Hannover, Germany |
Rehabilitation hospital | 3,081 | 14,562 | 300 | — | 3,381 | 14,562 | 17,943 | 416 | — | 1900 (renovations in 1997, 2000, 2009) |
December 1, 2015 |
40 | |||||||||||||||||||||||||||||||||
| Heiligendamm, Germany |
Rehabilitation hospital | 4,049 | 25,235 | 200 | — | 4,249 | 25,235 | 29,484 | 966 | — | 1995 | June 30, 2015 |
40 | |||||||||||||||||||||||||||||||||
| Bad Camberg, Germany |
Rehabilitation hospital | 1,961 | 14,956 | 252 | — | 2,213 | 14,956 | 17,169 | 586 | — | 1973 | June 30, 2015 |
40 | |||||||||||||||||||||||||||||||||
| Hoppegarten, Germany |
Rehabilitation hospital | 3,770 | 23,351 | 231 | — | 4,001 | 23,351 | 27,352 | 849 | — | 1994 | July 27, 2015 |
40 | |||||||||||||||||||||||||||||||||
| Ban Nauheim, Germany |
Rehabilitation hospital | 2,976 | 15,036 | 137 | — | 3,113 | 15,036 | 18,149 | 578 | — | 1977 | June 30, 2015 |
40 | |||||||||||||||||||||||||||||||||
| Kalbe, Germany |
Rehabilitation hospital | 3,292 | 21,994 | 158 | — | 3,450 | 21,994 | 25,444 | 841 | — | 1995 | July 6, 2015 |
40 | |||||||||||||||||||||||||||||||||
| Bad Soden-Salmünster, Germany |
Rehabilitation hospital | 904 | 6,276 | 116 | — | 1,020 | 6,276 | 7,296 | 247 | — | 1974 | June 30, 2015 |
40 | |||||||||||||||||||||||||||||||||
| Berlin, Germany | Rehabilitation hospital | — | 20,107 | 179 | — | 179 | 20,107 | 20,286 | 775 | — | 1998 | July 16, 2015 |
40 | |||||||||||||||||||||||||||||||||
134
Table of Contents
Index to Financial Statements
| Initial Costs | Additions Subsequent to Acquisition |
Cost at December 31, 2016(1) | Accumulated |
Life on which depreciation in latest income statements is computed (Years) |
||||||||||||||||||||||||||||||||||||||||||
| Location |
Type of Property |
Land | Buildings | Improvements | Carrying Costs |
Land | Buildings | Total | Depreciation | Encumbrances | Date of Construction |
Date Acquired |
||||||||||||||||||||||||||||||||||
| (Dollar amounts in thousands) | ||||||||||||||||||||||||||||||||||||||||||||||
| Bad Lobenstein, Germany |
Rehabilitation hospital | 3,429 | 19,442 | 174 | — | 3,603 | 19,442 | 23,045 | 746 | — | 1994 | June 30, 2015 |
40 | |||||||||||||||||||||||||||||||||
| Bernkastel-Kues, Germany |
Rehabilitation hospital | 757 | 10,926 | 126 | — | 883 | 10,926 | 11,809 | 422 | — | 1993 | July 14, 2015 |
40 | |||||||||||||||||||||||||||||||||
| Magdeburg, Germany |
Rehabilitation hospital | 13,931 | 51,674 | 242 | — | 14,173 | 51,674 | 65,847 | 1,853 | — | 1999/2014 | July 22, 2015 |
40 | |||||||||||||||||||||||||||||||||
| Schlangenbad, Germany |
Rehabilitation hospital | 1,015 | 3,302 | 258 | — | 1,273 | 3,302 | 4,575 | 150 | — | 1973 | June 30, 2015 |
40 | |||||||||||||||||||||||||||||||||
| Bad Dürrheim, Germany |
Rehabilitation hospital | 1,346 | 11,038 | 221 | — | 1,567 | 11,038 | 12,605 | 412 | — | 1960-1970 | July 24, 2015 |
40 | |||||||||||||||||||||||||||||||||
| Bad Krozingen, Germany |
Rehabilitation hospital | 1,425 | 10,392 | 110 | — | 1,535 | 10,392 | 11,927 | 378 | — | 2008 | July 24, 2015 |
40 | |||||||||||||||||||||||||||||||||
| Bad Nauheim, Germany |
Rehabilitation hospital | 1,704 | 8,906 | 53 | — | 1,757 | 8,906 | 10,663 | 339 | — | 1972-1973 | June 30, 2015 |
40 | |||||||||||||||||||||||||||||||||
| Bad Tennstedt, Germany |
Rehabilitation hospital | 3,560 | 26,396 | 195 | — | 3,755 | 26,396 | 30,151 | 1,009 | — | 1993 | June 30, 2015 |
40 | |||||||||||||||||||||||||||||||||
| Wismar, Germany |
Rehabilitation hospital | 3,355 | 19,989 | 189 | — | 3,544 | 19,989 | 23,533 | 769 | — | 1996 | June 30, 2015 |
40 | |||||||||||||||||||||||||||||||||
| Heidelberg, Germany |
Rehabilitation hospital | 5,757 | 33,689 | 438 | — | 6,195 | 33,689 | 39,884 | 436 | — | 1885/1991 | June 22, 2016 |
40 | |||||||||||||||||||||||||||||||||
| Bad Kösen, Germany |
Rehabilitation hospital | 1,189 | 6,941 | — | — | 1,189 | 6,941 | 8,130 | 29 | — | 1992 | October 27, 2016 |
40 | |||||||||||||||||||||||||||||||||
| Bad Kösen, Germany |
Rehabilitation hospital | 1,203 | 7,095 | — | — | 1,203 | 7,095 | 8,298 | 30 | — | 1996 | October 27, 2016 |
40 | |||||||||||||||||||||||||||||||||
| Bad Kösen, Germany |
Rehabilitation hospital | 717 | 4,473 | — | — | 717 | 4,473 | 5,190 | 19 | — | 1997 | October 27, 2016 |
40 | |||||||||||||||||||||||||||||||||
| Bad Salzdetfurth, Germany |
Rehabilitation hospital | 1,129 | 6,556 | — | — | 1,129 | 6,556 | 7,685 | 14 | — | 1987 | November 23, 2016 |
40 | |||||||||||||||||||||||||||||||||
| Bad Bertrich, Germany |
Rehabilitation hospital | 631 | 3,787 | — | — | 631 | 3,787 | 4,418 | 8 | — | 1910,1980- 1985 |
November 30, 2016 |
40 | |||||||||||||||||||||||||||||||||
| Lübeck, Germany |
Rehabilitation hospital | 673 | 4,922 | 38 | — | 711 | 4,922 | 5,633 | — | — | 1900/2011 | December 31, 2016 |
40 | |||||||||||||||||||||||||||||||||
| Vitense-Parber, Germany |
Rehabilitation hospital | 540 | 3,938 | 30 | — | 570 | 3,938 | 4,508 | — | — | 1800/1995 | December 31, 2016 |
40 | |||||||||||||||||||||||||||||||||
| Breuberg-Sandbach, Germany |
Rehabilitation hospital | 1,554 | 11,485 | 88 | — | 1,642 | 11,485 | 13,127 | — | — | 1901/1984 | December 31, 2016 |
40 | |||||||||||||||||||||||||||||||||
| Ravensrush, Germany |
Rehabilitation hospital | 407 | 3,199 | 25 | — | 432 | 3,199 | 3,631 | — | — | 1860/1992 | December 31, 2016 |
40 | |||||||||||||||||||||||||||||||||
| Wildeck, Germany |
Rehabilitation hospital | 731 | 5,250 | 40 | — | 771 | 5,250 | 6,021 | — | — | 1600/2013 | December 31, 2016 |
40 | |||||||||||||||||||||||||||||||||
| Römhild, Germany |
Rehabilitation hospital | 169 | 8,039 | 62 | — | 231 | 8,039 | 8,270 | — | — | 1902/2000 | December 31, 2016 |
40 | |||||||||||||||||||||||||||||||||
| Bad Hersfield, Germany |
Rehabilitation hospital | 507 | 3,773 | 29 | — | 536 | 3,773 | 4,309 | — | — | 1930/2014 | December 31, 2016 |
40 | |||||||||||||||||||||||||||||||||
| Houston, TX |
Acute care general hospital | 3,501 | 34,530 | 8,477 | 16,589 | 3,274 | 59,823 | 63,097 | 9,663 | — | 1960 | August 10, 2007 |
40 | |||||||||||||||||||||||||||||||||
| Allen, TX |
Freestanding ER | 1,550 | 3,921 | — | — | 1,550 | 3,921 | 5,471 | 245 | — | 2014 | July 14, 2014 |
40 | |||||||||||||||||||||||||||||||||
| San Diego, CA |
Acute care general hospital | 12,663 | 52,432 | — | — | 12,663 | 52,432 | 65,095 | 7,755 | — | 1973 | February 9, 2011 |
40 | |||||||||||||||||||||||||||||||||
| Alvin, TX |
Freestanding ER | 105 | 4,087 | — | — | 105 | 4,087 | 4,192 | 258 | — | 2014 | March 19, 2014 |
40 | |||||||||||||||||||||||||||||||||
| Houston, TX | Freestanding ER | 950 | 4,576 | — | — | 950 | 4,576 | 5,526 | 29 | — | 2016 | September 26, 2016 |
40 | |||||||||||||||||||||||||||||||||
| Aurora, CO |
Freestanding ER | — | 4,812 | — | — | — | 4,812 | 4,812 | 150 | — | 2015 | September 17, 2015 |
40 | |||||||||||||||||||||||||||||||||
| Ft. Worth, TX |
Freestanding ER | — | 4,392 | — | — | — | 4,392 | 4,392 | 192 | — | 2015 | March 27, 2015 |
40 | |||||||||||||||||||||||||||||||||
| Bayonne, NJ |
Acute care general hospital | 2,003 | 51,495 | — | — | 2,003 | 51,495 | 53,498 | 15,234 | — | 1918 | February 4, 2011 |
20 | |||||||||||||||||||||||||||||||||
| Bennettsville, SC |
Acute care general hospital | 794 | 15,772 | — | — | 794 | 15,772 | 16,566 | 3,419 | — | 1984 | April 1, 2008 |
40 | |||||||||||||||||||||||||||||||||
| Blue Springs, MO |
Acute care general hospital | 4,347 | 23,494 | — | — | 4,347 | 23,494 | 27,841 | 1,183 | — | 1980 | February 13, 2015 |
40 | |||||||||||||||||||||||||||||||||
| Bossier City, LA |
Long term acute care hospital | 900 | 17,818 | — | — | 900 | 17,818 | 18,718 | 3,895 | — | 1982 | April 1, 2008 |
40 | |||||||||||||||||||||||||||||||||
| Brighton, MA |
Acute care general hospital | 18,638 | 147,266 | — | — | 18,638 | 147,266 | 165,904 | 922 | — | 1917-2009 | October 3, 2016 |
41 | |||||||||||||||||||||||||||||||||
| Brockton, MA |
Acute care general hospital | 18,141 | 66,562 | — | — | 18,141 | 66,562 | 84,703 | 526 | — | 1965-2010 | October 3, 2016 |
41 | |||||||||||||||||||||||||||||||||
| Austin, TX |
Freestanding ER | 1,140 | 3,853 | — | — | 1,140 | 3,853 | 4,993 | 249 | — | 2014 | May 29, 2014 |
40 | |||||||||||||||||||||||||||||||||
| Broomfield, CO |
Freestanding ER | 825 | 3,895 | — | — | 825 | 3,895 | 4,720 | 243 | — | 2014 | July 3, 2014 |
40 | |||||||||||||||||||||||||||||||||
| Glendale, AZ |
Freestanding ER | 1,144 | 6,005 | — | — | 1,144 | 6,005 | 7,149 | 25 | — | 2016 | October 21, 2016 |
40 | |||||||||||||||||||||||||||||||||
| New Orleans, LA |
Freestanding ER | 2,850 | 5,599 | — | — | 2,850 | 5,599 | 8,449 | 35 | — | 2016 | September 23, 2016 |
40 | |||||||||||||||||||||||||||||||||
135
Table of Contents
Index to Financial Statements
| Initial Costs | Additions Subsequent to Acquisition |
Cost at December 31, 2016(1) | Accumulated |
Life on which depreciation in latest income statements is computed (Years) |
||||||||||||||||||||||||||||||||||||||||||
| Location |
Type of Property |
Land | Buildings | Improvements | Carrying Costs |
Land | Buildings | Total | Depreciation | Encumbrances | Date of Construction |
Date Acquired |
||||||||||||||||||||||||||||||||||
| (Dollar amounts in thousands) | ||||||||||||||||||||||||||||||||||||||||||||||
| Carrollton, TX |
Acute care general hospital | 729 | 34,342 | — | — | 729 | 34,342 | 35,071 | 1,216 | — | 2015 | July 17, 2015 |
40 | |||||||||||||||||||||||||||||||||
| Cedar Hill. TX |
Freestanding ER | 1,122 | 3,644 | — | — | 1,122 | 3,644 | 4,766 | 228 | — | 2014 | June 23, 2014 |
40 | |||||||||||||||||||||||||||||||||
| Spring, TX |
Freestanding ER |
1,310 | 4,203 | — | — | 1,310 | 4,203 | 5,513 | 263 | — | 2014 | July 15, 2014 |
40 | |||||||||||||||||||||||||||||||||
| Chandler, AZ |
Freestanding ER |
— | 4,783 | — | — | — | 4,783 | 4,783 | 199 | — | 2015 | April 24, 2015 |
40 | |||||||||||||||||||||||||||||||||
| Chandler, AZ |
Freestanding ER |
750 | 3,852 | — | — | 750 | 3,852 | 4,602 | 120 | — | 2015 | October 7, 2015 |
40 | |||||||||||||||||||||||||||||||||
| Cheraw, SC |
Acute care general hospital |
657 | 19,576 | — | — | 657 | 19,576 | 20,233 | 4,242 | — | 1982 | April 1, 2008 |
40 | |||||||||||||||||||||||||||||||||
| Katy, TX |
Freestanding ER |
— | 3,873 | — | — | — | 3,873 | 3,873 | 113 | — | 2015 | October 21, 2015 |
40 | |||||||||||||||||||||||||||||||||
| Webster, TX |
Long term acute care hospital | 663 | 33,751 | — | — | 663 | 33,751 | 34,414 | 5,063 | — | 2004 | December 21, 2010 |
40 | |||||||||||||||||||||||||||||||||
| Commerce City, TX |
Freestanding ER | 707 | 4,236 | — | — | 707 | 4,236 | 4,943 | 221 | — | 2014 | December 11, 2014 |
40 | |||||||||||||||||||||||||||||||||
| Conroe, TX |
Freestanding ER | 1,338 | 3,712 | — | — | 1,338 | 3,712 | 5,050 | 131 | — | 2015 | July 29, 2015 |
40 | |||||||||||||||||||||||||||||||||
| Converse, TX |
Freestanding ER | 750 | 4,423 | — | — | 750 | 4,423 | 5,173 | 194 | — | 2015 | April 10, 2015 |
40 | |||||||||||||||||||||||||||||||||
| The Woodlands, TX |
Freestanding ER | — | 4,740 | — | — | — | 4,740 | 4,740 | 89 | — | 2016 | March 28, 2016 |
40 | |||||||||||||||||||||||||||||||||
| Dallas, TX |
Long term acute care hospital | 1,000 | 13,589 | — | 368 | 1,421 | 13,536 | 14,957 | 3,496 | — | 2006 | September 5, 2006 |
40 | |||||||||||||||||||||||||||||||||
| Denver, CO |
Freestanding ER | — | 4,276 | — | — | — | 4,276 | 4,276 | 169 | — | 2015 | June 8, 2015 |
40 | |||||||||||||||||||||||||||||||||
| DeSoto, TX |
Freestanding ER | 750 | 4,569 | — | — | 750 | 4,569 | 5,319 | 67 | — | 2016 | May 23, 2016 |
40 | |||||||||||||||||||||||||||||||||
| DeSoto, TX |
Long term acute care hospital | 1,067 | 10,701 | 86 | 8 | 1,161 | 10,701 | 11,862 | 1,476 | — | 2008 | July 18, 2011 |
40 | |||||||||||||||||||||||||||||||||
| Detroit, MI |
Long term acute care hospital | 1,220 | 8,687 | — | (365 | ) | 1,220 | 8,322 | 9,542 | 1,862 | — | 1956 | May 22, 2008 |
40 | ||||||||||||||||||||||||||||||||
| San Antonio, TX |
Freestanding ER | — | 5,157 | — | — | — | 5,157 | 5,157 | 11 | — | 2016 | December 9, 2016 |
40 | |||||||||||||||||||||||||||||||||
| Dulles, TX |
Freestanding ER | 1,076 | 3,784 | — | — | 1,076 | 3,784 | 4,860 | 220 | — | 2014 | September 12, 2014 |
40 | |||||||||||||||||||||||||||||||||
| Houston, TX | Freestanding ER | 1,345 | 3,678 | — | — | 1,345 | 3,678 | 5,023 | 230 | — | 2014 | June 20, 2014 |
40 | |||||||||||||||||||||||||||||||||
| Fairmont, CA |
Acute care general hospital | 1,000 | 12,301 | 3,928 | — | 1,277 | 15,952 | 17,229 | 857 | — | 1939,1972,1985 | September 19, 2014 |
40 | |||||||||||||||||||||||||||||||||
| Fall River, MA |
Acute care general hospital | 2,406 | 82,358 | — | — | 2,406 | 82,358 | 84,764 | 526 | — | 1950-2012 | October 3, 2016 |
41 | |||||||||||||||||||||||||||||||||
| Firestone, TX |
Freestanding ER | 495 | 3,963 | — | — | 495 | 3,963 | 4,458 | 256 | — | 2014 | June 6, 2014 |
40 | |||||||||||||||||||||||||||||||||
| Florence, AZ |
Acute care general hospital | 900 | 28,462 | 105 | — | 900 | 28,567 | 29,467 | 3,388 | — | 2012 | February 7, 2012 |
40 | |||||||||||||||||||||||||||||||||
| Fort Lauderdale, FL |
Rehabilitation hospital | 3,499 | 21,939 | — | 1 | 3,499 | 21,940 | 25,439 | 4,763 | — | 1985 | April 22, 2008 |
40 | |||||||||||||||||||||||||||||||||
| Fountain, CO |
Freestanding ER | 1,508 | 4,131 | — | — | 1,508 | 4,131 | 5,639 | 250 | — | 2014 | July 31, 2014 |
40 | |||||||||||||||||||||||||||||||||
| Frisco, TX |
Freestanding ER | — | 4,735 | — | — | — | 4,735 | 4,735 | 99 | — | 2016 | March 4, 2016 |
40 | |||||||||||||||||||||||||||||||||
| Frisco, TX |
Freestanding ER | 2,441 | 4,474 | — | — | 2,441 | 4,474 | 6,915 | 130 | — | 2015 | November 13, 2015 |
40 | |||||||||||||||||||||||||||||||||
| Frisco, TX |
Freestanding ER | 1,500 | 3,863 | 27 | (89 | ) | 1,411 | 3,890 | 5,301 | 251 | — | 2014 | June 13, 2014 |
40 | ||||||||||||||||||||||||||||||||
| Garden Grove, CA |
Acute care general hospital | 5,502 | 10,748 | — | 51 | 5,502 | 10,799 | 16,301 | 2,196 | — | 1982 | November 25, 2008 |
40 | |||||||||||||||||||||||||||||||||
| Garland, TX |
Freestanding ER | — | 4,954 | — | — | — | 4,954 | 4,954 | 21 | — | 2016 | November 15, 2016 |
40 | |||||||||||||||||||||||||||||||||
| Garden Grove, CA |
Medical Office Building | 862 | 7,888 | — | 28 | 862 | 7,916 | 8,778 | 1,603 | — | 1982 | November 25, 2008 |
40 | |||||||||||||||||||||||||||||||||
| Gilbert, AZ |
Acute care general hospital | 150 | 15,553 | — | — | 150 | 15,553 | 15,703 | 2,333 | — | 2005 | January 4, 2011 |
40 | |||||||||||||||||||||||||||||||||
| Gilbert, AZ |
Freestanding ER | 1,518 | 4,660 | — | — | 1,518 | 4,660 | 6,178 | 165 | — | 2015 | July 22, 2015 |
40 | |||||||||||||||||||||||||||||||||
| Glendale, AZ |
Freestanding ER | — | 4,046 | — | — | — | 4,046 | 4,046 | 160 | — | 2015 | June 5, 2015 |
40 | |||||||||||||||||||||||||||||||||
| Goodyear, AZ |
Freestanding ER | 1,800 | 4,709 | — | — | 1,800 | 4,709 | 6,509 | 88 | — | 2016 | April 4, 2016 |
40 | |||||||||||||||||||||||||||||||||
136
Table of Contents
Index to Financial Statements
| Initial Costs | Additions Subsequent to Acquisition |
Cost at December 31, 2016(1) | Accumulated |
Life on which depreciation in latest income statements is computed (Years) |
||||||||||||||||||||||||||||||||||||||||||
| Location |
Type of Property |
Land | Buildings | Improvements | Carrying Costs |
Land | Buildings | Total | Depreciation | Encumbrances | Date of Construction |
Date Acquired |
||||||||||||||||||||||||||||||||||
| (Dollar amounts in thousands) | ||||||||||||||||||||||||||||||||||||||||||||||
| Hartsville, SC |
Acute care general hospital | 2,050 | 43,970 | — | — | 2,050 | 43,970 | 46,020 | 957 | — | 1999 | August 31, 2015 |
34 | |||||||||||||||||||||||||||||||||
| Hausman, TX |
Acute care general hospital | 1,500 | 8,958 | — | — | 1,500 | 8,958 | 10,458 | 835 | — | 2013 | March 1, 2013 |
40 | |||||||||||||||||||||||||||||||||
| Helotes, TX |
Freestanding ER | 1,900 | 5,297 | — | — | 1,900 | 5,297 | 7,197 | 110 | — | 2016 | March 10, 2016 |
40 | |||||||||||||||||||||||||||||||||
| Highland Village, TX |
Freestanding ER | — | 4,016 | — | — | — | 4,016 | 4,016 | 126 | — | 2015 | September 22, 2015 |
40 | |||||||||||||||||||||||||||||||||
| Hill County, TX |
Acute care general hospital | 1,120 | 17,882 | — | — | 1,120 | 17,882 | 19,002 | 7,492 | — | 1980 | September 17, 2010 |
40 | |||||||||||||||||||||||||||||||||
| Hoboken, NJ |
Acute care general hospital | 1,387 | 44,351 | — | — | 1,387 | 44,351 | 45,738 | 11,394 | — | 1863 | November 4, 2011 |
20 | |||||||||||||||||||||||||||||||||
| Hoover, AL |
Freestanding ER | — | 7,581 | — | — | — | 7,581 | 7,581 | 369 | — | 2015 | May 1, 2015 |
34 | |||||||||||||||||||||||||||||||||
| Hoover, AL |
Medical Office Building | — | 1,034 | — | — | — | 1,034 | 1,034 | 50 | — | 2015 | May 1, 2015 |
34 | |||||||||||||||||||||||||||||||||
| Hot Springs, AR |
Acute care general hospital | 7,100 | 59,432 | 19,113 | — | 7,100 | 78,545 | 85,645 | 2,480 | — | 1985 | August 31, 2015 |
40 | |||||||||||||||||||||||||||||||||
| Highlands Ranch, CO |
Freestanding ER | 4,200 | 4,763 | — | — | 4,200 | 4,763 | 8,963 | 50 | — | 2016 | July 25, 2016 |
40 | |||||||||||||||||||||||||||||||||
| Idaho Falls, ID |
Acute care general hospital | 1,822 | 37,467 | — | 4,665 | 1,822 | 42,132 | 43,954 | 9,086 | — | 2002 | April 1, 2008 |
40 | |||||||||||||||||||||||||||||||||
| Kansas City, MO |
Acute care general hospital | 10,497 | 64,419 | — | — | 10,497 | 64,419 | 74,916 | 3,146 | — | 1978 | February 13, 2015 |
40 | |||||||||||||||||||||||||||||||||
| Katy, TX |
Freestanding ER | — | 4,671 | — | — | — | 4,671 | 4,671 | 29 | — | 2016 | October 10, 2016 |
40 | |||||||||||||||||||||||||||||||||
| Camden, SC |
Acute care general hospital | — | 22,739 | — | — | — | 22,739 | 22,739 | 384 | — | 1954-2004 | October 30, 2015 |
20 | |||||||||||||||||||||||||||||||||
| Lafayette, IN |
Rehabilitation hospital | 800 | 14,968 | (25 | ) | — | 800 | 14,943 | 15,743 | 1,450 | — | 2013 | February 1, 2013 |
40 | ||||||||||||||||||||||||||||||||
| Little Elm, TX | Freestanding ER | 1,241 | 3,491 | — | — | 1,241 | 3,491 | 4,732 | 266 | — | 2013 | December 1, 2013 |
40 | |||||||||||||||||||||||||||||||||
| Longmont, CO |
Freestanding ER | — | 4,770 | — | — | — | 4,770 | 4,770 | 109 | — | 2016 | February 10, 2016 |
40 | |||||||||||||||||||||||||||||||||
| Lubbock, TX |
Rehabilitation hospital | 1,376 | 28,292 | 705 | — | 1,376 | 28,997 | 30,373 | 1,072 | — | 2008 | June 16, 2015 |
40 | |||||||||||||||||||||||||||||||||
| Mandeville, LA |
Freestanding ER | 2,800 | 5,004 | — | — | 2,800 | 5,004 | 7,804 | 21 | — | 2016 | October 28, 2016 |
40 | |||||||||||||||||||||||||||||||||
| Marrero, LA |
Freestanding ER | — | 5,756 | — | — | — | 5,756 | 5,756 | 72 | — | 2016 | July 15, 2016 |
40 | |||||||||||||||||||||||||||||||||
| McKinney, TX |
Freestanding ER | — | 4,060 | — | — | — | 4,060 | 4,060 | 193 | — | 2015 | July 31, 2015 |
30 | |||||||||||||||||||||||||||||||||
| McMinnville, OR |
Acute care general hospital | 5,000 | 97,900 | — | — | 5,000 | 97,900 | 102,900 | 1,663 | — | 1996 | August 31, 2015 |
41 | |||||||||||||||||||||||||||||||||
| Mesa, AZ |
Acute care general hospital | 4,900 | 97,980 | 2,242 | — | 7,142 | 97,980 | 105,122 | 8,576 | — | 2007 | September 26, 2013 |
40 | |||||||||||||||||||||||||||||||||
| Methuen, MA |
Acute general care hospital | 23,809 | 89,505 | — | — | 23,809 | 89,505 | 113,314 | 638 | — | 1950-2011 | October 3, 2016 |
41 | |||||||||||||||||||||||||||||||||
| Bloomington, IN |
Acute care general hospital | 2,392 | 28,212 | 5,000 | 408 | 2,392 | 33,620 | 36,012 | 8,483 | — | 2006 | August 8, 2006 |
40 | |||||||||||||||||||||||||||||||||
| Montclair, NJ |
Acute care general hospital | 7,900 | 99,632 | 585 | — | 8,477 | 99,640 | 108,117 | 7,152 | — | 1920-2000 | April 1, 2014 |
40 | |||||||||||||||||||||||||||||||||
| Muskogee, OK |
Acute care general hospital | 1,420 | 51,953 | — | — | 1,420 | 51,953 | 53,373 | 1,046 | — | 1959,2009 | August 31, 2015 |
30 | |||||||||||||||||||||||||||||||||
| San Antonio, TX | Freestanding ER | 351 | 3,952 | — | — | 351 | 3,952 | 4,303 | 271 | — | 2014 | January 1, 2014 |
40 | |||||||||||||||||||||||||||||||||
| Houston, TX |
Acute care general hospital | 4,757 | 56,238 | (37 | ) | 1,259 | 5,427 | 56,790 | 62,217 | 14,270 | — | 2006 | December 1, 2006 |
40 | ||||||||||||||||||||||||||||||||
| Colorado Springs, CO |
Freestanding ER | 600 | 4,231 | — | — | 600 | 4,231 | 4,831 | 274 | — | 2014 | June 5, 2014 |
40 | |||||||||||||||||||||||||||||||||
| Northland, MO |
Long term acute care hospital | 834 | 17,182 | — | — | 834 | 17,182 | 18,016 | 2,542 | 13,101 | 2007 | February 14, 2011 |
40 | |||||||||||||||||||||||||||||||||
137
Table of Contents
Index to Financial Statements
| Initial Costs | Additions Subsequent to Acquisition |
Cost at December 31, 2016(1) | Accumulated |
Life on which depreciation in latest income statements is computed (Years) |
||||||||||||||||||||||||||||||||||||||||||
| Location |
Type of Property |
Land | Buildings | Improvements | Carrying Costs |
Land | Buildings | Total | Depreciation | Encumbrances | Date of Construction |
Date Acquired |
||||||||||||||||||||||||||||||||||
| (Dollar amounts in thousands) | ||||||||||||||||||||||||||||||||||||||||||||||
| Altoona, WI |
Acute care general hospital | — | 29,062 | — | — | — | 29,062 | 29,062 | 1,695 | — | 2014 | August 31, 2014 |
40 | |||||||||||||||||||||||||||||||||
| Ogden, UT |
Rehabilitation hospital | 1,759 | 16,414 | — | — | 1,759 | 16,414 | 18,173 | 1,150 | — | 2014 | March 1, 2014 |
40 | |||||||||||||||||||||||||||||||||
| Olympia, WA |
Acute care general hospital | 7,220 | 89,348 | — | — | 7,220 | 89,348 | 96,568 | 993 | — | 1984 | July 22, 2016 |
40 | |||||||||||||||||||||||||||||||||
| Overlook, TX |
Acute care general hospital | 2,452 | 9,666 | 7 | — | 2,452 | 9,673 | 12,125 | 926 | — | 2012 | February 1, 2013 |
40 | |||||||||||||||||||||||||||||||||
| San Diego, CA |
Acute care general hospital | 6,550 | 15,653 | — | 77 | 6,550 | 15,730 | 22,280 | 3,799 | — | 1964 | May 9, 2007 |
40 | |||||||||||||||||||||||||||||||||
| Parker, CO |
Freestanding ER | 1,301 | 4,448 | — | — | 1,301 | 4,448 | 5,749 | 130 | — | 2015 | November 6, 2015 |
40 | |||||||||||||||||||||||||||||||||
| Pearland, TX |
Freestanding ER | 1,075 | 3,577 | — | — | 1,075 | 3,577 | 4,652 | 209 | — | 2014 | September 8, 2014 |
40 | |||||||||||||||||||||||||||||||||
| Petersburg, VA |
Rehabilitation hospital | 1,302 | 9,121 | — | — | 1,302 | 9,121 | 10,423 | 1,938 | — | 2006 | July 1, 2008 |
40 | |||||||||||||||||||||||||||||||||
| Plano, TX |
Freestanding ER | — | 5,060 | — | — | — | 5,060 | 5,060 | 32 | — | 2016 | September 30, 2016 |
40 | |||||||||||||||||||||||||||||||||
| Poplar Bluff, MO |
Acute care general hospital | 2,659 | 38,694 | — | 1 | 2,660 | 38,694 | 41,354 | 8,400 | — | 1980 | April 22, 2008 |
40 | |||||||||||||||||||||||||||||||||
| Port Arthur, TX |
Acute care general hospital | 3,000 | 72,341 | 1,062 | — | 4,062 | 72,341 | 76,403 | 6,071 | — | 2005 | September 26, 2013 |
40 | |||||||||||||||||||||||||||||||||
| Port Huron, MI |
Acute care general hospital | 3,029 | 14,622 | — | — | 3,029 | 14,622 | 17,651 | 490 | — | 1953, 1973-1983 |
December 31, 2015 |
40 | |||||||||||||||||||||||||||||||||
| Portland, OR |
Long term acute care hospital | 3,085 | 17,859 | — | 2,559 | 3,071 | 20,432 | 23,503 | 4,897 | — | 1964 | April 18, 2007 |
40 | |||||||||||||||||||||||||||||||||
| Post Falls, ID |
Rehabilitation hospital | 417 | 12,175 | 1,905 | — | 767 | 13,730 | 14,497 | 1,039 | — | 2013 | December 31, 2013 |
40 | |||||||||||||||||||||||||||||||||
| San Antonio, TX |
Freestanding ER | — | 4,837 | — | — | — | 4,837 | 4,837 | 20 | — | 2016 | October 27, 2016 |
40 | |||||||||||||||||||||||||||||||||
| Redding, CA |
Acute care general hospital | 1,555 | 53,863 | — | 13 | 1,555 | 53,876 | 55,431 | 12,692 | — | 1974 | August 10, 2007 |
40 | |||||||||||||||||||||||||||||||||
| Redding, CA |
Long term acute care hospital | — | 19,952 | — | 4,360 | 1,629 | 22,683 | 24,312 | 6,406 | — | 1991 | June 30, 2005 |
40 | |||||||||||||||||||||||||||||||||
| Rosenberg, TX |
Freestanding ER |
— | 4,731 | — | — | — | 4,731 | 4,731 | 118 | — | 2016 | January 15, 2016 |
40 | |||||||||||||||||||||||||||||||||
| San Dimas, CA |
Acute care general hospital | 6,160 | 6,839 | — | 34 | 6,160 | 6,873 | 13,033 | 1,390 | — | 1972 | November 25, 2008 |
40 | |||||||||||||||||||||||||||||||||
| San Dimas, CA |
Medical Office Building | 1,915 | 5,085 | — | 18 | 1,915 | 5,103 | 7,018 | 1,033 | — | 1979 | November 25, 2008 |
40 | |||||||||||||||||||||||||||||||||
| Sherman, TX |
Acute care general hospital | 4,491 | 24,802 | — | — | 4,491 | 24,802 | 29,293 | 1,418 | — | 1913, 1960- 2010 |
October 31, 2014 |
40 | |||||||||||||||||||||||||||||||||
| Sienna, TX |
Freestanding ER | 999 | 3,591 | — | — | 999 | 3,591 | 4,590 | 209 | — | 2014 | August 20, 2014 |
40 | |||||||||||||||||||||||||||||||||
| Spartanburg, SC |
Rehabilitation hospital | 1,135 | 15,717 | — | — | 1,135 | 15,717 | 16,852 | 1,325 | — | 2013 | August 1, 2013 |
40 | |||||||||||||||||||||||||||||||||
| Houston, TX |
Freestanding ER | 1,423 | 3,770 | — | — | 1,423 | 3,770 | 5,193 | 173 | — | 2015 | February 18, 2015 |
40 | |||||||||||||||||||||||||||||||||
| Taunton, MA |
Acute care general hospital | 4,428 | 73,433 | — | — | 4,428 | 73,433 | 77,861 | 488 | — | 1940-2015 | October 3, 2016 |
41 | |||||||||||||||||||||||||||||||||
| Thornton, CO |
Freestanding ER | 1,350 | 4,259 | — | — | 1,350 | 4,259 | 5,609 | 248 | — | 2014 | August 29, 2014 |
40 | |||||||||||||||||||||||||||||||||
| Toledo, OH | Rehabilitation hospital | — | 17,740 | — | — | — | 17,740 | 17,740 | 333 | — | 2016 | April 1, 2016 |
40 | |||||||||||||||||||||||||||||||||
| Tomball, TX |
Long term acute care hospital | 1,299 | 23,982 | — | — | 1,299 | 23,982 | 25,281 | 3,597 | — | 2005 | December 21, 2010 |
40 | |||||||||||||||||||||||||||||||||
| Houston, TX |
Acute care general hospital | 4,047 | 41,914 | — | — | 4,047 | 41,914 | 45,961 | 524 | — | 2016 | July 7, 2016 |
40 | |||||||||||||||||||||||||||||||||
| League City, TX |
Freestanding ER | — | 3,901 | — | — | — | 3,901 | 3,901 | 146 | — | 2015 | June 19, 2015 |
40 | |||||||||||||||||||||||||||||||||
| Anaheim, CA |
Acute care general hospital | 1,875 | 21,814 | — | 10 | 1,875 | 21,824 | 23,699 | 5,547 | — | 1964 | November 8, 2006 |
40 | |||||||||||||||||||||||||||||||||
138
Table of Contents
Index to Financial Statements
| Initial Costs | Additions Subsequent to Acquisition |
Cost at December 31, 2016(1) | Accumulated |
Life on which depreciation in latest income statements is computed (Years) |
||||||||||||||||||||||||||||||||||||||||||
| Location |
Type of Property |
Land | Buildings | Improvements | Carrying Costs |
Land | Buildings | Total | Depreciation | Encumbrances | Date of Construction |
Date Acquired |
||||||||||||||||||||||||||||||||||
| (Dollar amounts in thousands) | ||||||||||||||||||||||||||||||||||||||||||||||
| West Monroe, LA |
Acute care general hospital | 12,000 | 69,433 | 552 | — | 12,552 | 69,433 | 81,985 | 5,822 | — | 1962 | September 26, 2013 |
40 | |||||||||||||||||||||||||||||||||
| San Antonio, TX |
Acute care general hospital | 2,248 | 5,880 | — | — | 2,248 | 5,880 | 8,128 | 609 | — | 2012 | October 2, 2012 |
40 | |||||||||||||||||||||||||||||||||
| West Valley City, UT |
Acute care general hospital | 5,516 | 58,314 | 2,036 | (114 | ) | 5,402 | 60,350 | 65,752 | 12,716 | — | 1980 | April 22, 2008 |
40 | ||||||||||||||||||||||||||||||||
| Wichita, KS |
Rehabilitation hospital | 1,019 | 18,373 | — | 1 | 1,019 | 18,374 | 19,393 | 4,018 | — | 1992 | April 4, 2008 |
40 | |||||||||||||||||||||||||||||||||
|
|
|
|
|
|
|
|
|
|
|
|
|
|
|
|
|
|
|
|||||||||||||||||||||||||||||
| $ | 403,141 | $ | 3,482,455 | $ | 52,564 | $ | 29,882 | $ | 417,368 | $ | 3,550,674 | $ | 3,968,042 | $ | 292,786 | $ | 13,101 | |||||||||||||||||||||||||||||
|
|
|
|
|
|
|
|
|
|
|
|
|
|
|
|
|
|
|
|||||||||||||||||||||||||||||
| (1) | The aggregate cost for federal income tax purposes is $4,471,179. |
139
Table of Contents
Index to Financial Statements
The changes in total real estate assets (excluding construction in progress, intangible lease assets, investment in direct financing leases, and mortgage loans) are as follows for the years ended (in thousands):
| December 31, 2016 | December 31, 2015 | December 31, 2014 | ||||||||||
| COST |
||||||||||||
| Balance at beginning of period |
$ | 2,991,590 | $ | 2,040,727 | $ | 1,733,194 | ||||||
| Acquisitions |
745,948 | 975,239 | 263,811 | |||||||||
| Transfers from construction in progress |
163,080 | 23,163 | 41,772 | |||||||||
| Additions |
33,279 | 7,376 | 84,831 | |||||||||
| Dispositions |
(138,886 | ) | (24,701 | ) | (56,590 | ) | ||||||
| Other |
173,031 | (30,214 | ) | (26,291 | ) | |||||||
|
|
|
|
|
|
|
|||||||
| Balance at end of period |
$ | 3,968,042 | $ | 2,991,590 | $ | 2,040,727 | ||||||
|
|
|
|
|
|
|
|||||||
The changes in accumulated depreciation are as follows for the years ended (in thousands):
| December 31, 2016 | December 31, 2015 | December 31, 2014 | ||||||||||
| ACCUMULATED DEPRECIATION |
||||||||||||
| Balance at beginning of period |
$ | 232,675 | $ | 181,441 | $ | 144,235 | ||||||
| Depreciation |
81,010 | 60,796 | 46,935 | |||||||||
| Depreciation on disposed property |
(19,086 | ) | (8,887 | ) | (9,213 | ) | ||||||
| Other |
(1,813 | ) | (675 | ) | (516 | ) | ||||||
|
|
|
|
|
|
|
|||||||
| Balance at end of period |
$ | 292,786 | $ | 232,675 | $ | 181,441 | ||||||
|
|
|
|
|
|
|
|||||||
140
Table of Contents
Index to Financial Statements
SCHEDULE IV — MORTGAGE LOANS ON REAL ESTATE
MEDICAL PROPERTIES TRUST, INC. AND MPT OPERATING PARTNERSHIP, L.P.
| Column A |
Column B | Column C | Column D | Column E | Column F | Column G(3) | Column H | |||||||||||||||||||||
| Description |
Interest Rate |
Final Maturity Date |
Periodic Payment Terms |
Prior Liens |
Face Amount of Mortgages |
Carrying Amount of Mortgages |
Principal Amount of Loans Subject to Delinquent Principal or Interest |
|||||||||||||||||||||
| (Dollar amounts in thousands) | ||||||||||||||||||||||||||||
| Long-term first mortgage loan: |
|
Payable in monthly installments of interest plus principal payable in full at maturity |
||||||||||||||||||||||||||
| Desert Valley Hospital |
11.0 | % | 2022 | (1) | $ | 70,000 | $ | 70,000 | (2) | |||||||||||||||||||
| Desert Valley Hospital |
11.7 | % | 2022 | (1) | 20,000 | 20,000 | (2) | |||||||||||||||||||||
| Desert Valley Hospital |
11.0 | % | 2022 | (1) | 12,500 | 12,500 | (2) | |||||||||||||||||||||
| Chino Valley Medical Center |
11.0 | % | 2022 | (1) | 50,000 | 50,000 | (2) | |||||||||||||||||||||
| Paradise Valley Hospital |
10.6 | % | 2022 | (1) | 25,000 | 25,000 | (2) | |||||||||||||||||||||
| Ernest Mortgage Loan(4) |
9.6 | % | 2032 | (1) | 112,836 | 112,836 | (2) | |||||||||||||||||||||
| Centinela Hospital Medical Center |
11.2 | % | 2022 | (1) | 100,000 | 100,000 | (2) | |||||||||||||||||||||
| Olympia Medical Center |
11.2 | % | 2024 | (1) | 20,000 | 20,000 | (2) | |||||||||||||||||||||
| St. Joseph Medical Center |
8.7 | % | 2025 | (1) | 30,000 | 30,000 | (2) | |||||||||||||||||||||
| St. Mary’s Medical Center |
8.7 | % | 2025 | (1) | 10,000 | 10,000 | (2) | |||||||||||||||||||||
| Lake Huron Medical Center |
8.7 | % | 2020 | (1) | 10,000 | 10,000 | (2) | |||||||||||||||||||||
| Steward Mortgage Loan(6) |
7.5 | % | 2031 | (1) | 600,000 | 600,000 | (2) | |||||||||||||||||||||
|
|
|
|
|
|||||||||||||||||||||||||
| $ | 1,060,336 | $ | 1,060,336 | (5) | ||||||||||||||||||||||||
|
|
|
|
|
|||||||||||||||||||||||||
| (1) | There were no prior liens on loans as of December 31, 2016. |
| (2) | The mortgage loan was not delinquent with respect to principal or interest. |
| (3) | The aggregate cost for federal income tax purposes is $1,060,336. |
| (4) | Mortgage loans covering four properties in two tranches. Interest rate is weighted average of both tranches. |
| (5) | Excludes unamortized loan issue costs of $0.1 million at December 31, 2016. |
| (6) | Mortgage loans covering four properties. |
Changes in mortgage loans (excluding unamortized loan issue costs) for the years ended December 31, 2016, 2015, and 2014 are summarized as follows:
| Year Ended December 31, | ||||||||||||
| 2016 | 2015 | 2014 | ||||||||||
| (Dollar amounts in thousands) | ||||||||||||
| Balance at beginning of year |
$ | 757,500 | $ | 397,500 | $ | 388,650 | ||||||
| Additions during year: |
||||||||||||
| New mortgage loans and additional advances on existing loans |
612,836 | 380,000 | 12,500 | |||||||||
|
|
|
|
|
|
|
|||||||
| 1,370,336 | 777,500 | 401,150 | ||||||||||
|
|
|
|
|
|
|
|||||||
| Deductions during year: |
||||||||||||
| Collection of principal |
(310,000 | ) | (20,000 | ) | (3,650 | ) | ||||||
|
|
|
|
|
|
|
|||||||
| (310,000 | ) | (20,000 | ) | (3,650 | ) | |||||||
|
|
|
|
|
|
|
|||||||
| Balance at end of year |
$ | 1,060,336 | $ | 757,500 | $ | 397,500 | ||||||
|
|
|
|
|
|
|
|||||||
141
Table of Contents
Index to Financial Statements
INDEX TO EXHIBITS
| Exhibit Number |
Exhibit Title | |
| 3.1(1) | Medical Properties Trust, Inc. Second Articles of Amendment and Restatement | |
| 3.2(3) | Articles of Amendment of Second Articles of Amendment and Restatement of Medical Properties Trust, Inc. | |
| 3.3(6) | Articles of Amendment of Second Articles of Amendment and Restatement of Medical Properties Trust, Inc. | |
| 3.4(19) | Articles of Amendment to Second Articles of Amendment and Restatement of Medical Properties Trust, Inc. | |
| 3.5(32) | Articles of Amendment to Second Articles of Amendment and Restatement of Medical Properties Trust, Inc. | |
| 3.6(33) | Articles of Amendment to Second Articles of Amendment and Restatement of Medical Properties Trust, Inc. | |
| 3.7(2) | Medical Properties Trust, Inc. Second Amended and Restated Bylaws | |
| 3.8(32) | Amendment to Second Amended and Restated Bylaws of Medical Properties Trust, Inc. | |
| 3.9(40) | Amendment to Second Amended and Restated Bylaws of Medical Properties Trust, Inc. | |
| 3.10(41) | Amendment to Second Amended and Restated Bylaws of Medical Properties Trust, Inc. | |
| 4.1(1) | Form of Common Stock Certificate | |
| 4.2(4) | Indenture, dated July 14, 2006, among Medical Properties Trust, Inc., MPT Operating Partnership, L.P. and the Wilmington Trust Company, as trustee | |
| 4.3(9) | Indenture, dated as of April 26, 2011, Medical Properties Trust, Inc., MPT Operating Partnership, L.P., MPT Finance Corporation, the Subsidiary Guarantors and Wilmington Trust Company, as Trustee. | |
| 4.4(26) | First Supplemental Indenture to 2011 Indenture, dated as of August 10, 2011, among Medical Properties Trust, Inc., MPT Operating Partnership, L.P., MPT Finance Corporation, the Subsidiary Guarantors and Wilmington Trust, N.A., as Trustee. | |
| 4.5(26) | Second Supplemental Indenture to 2011 Indenture, dated as of October 3, 2011, among Medical Properties Trust, Inc., MPT Operating Partnership, L.P., MPT Finance Corporation, the Subsidiary Guarantors and Wilmington Trust, N.A., as Trustee. | |
| 4.6(26) | Third Supplemental Indenture to 2011 Indenture, dated as of December 2, 2011, among Medical Properties Trust, Inc., MPT Operating Partnership, L.P., MPT Finance Corporation, the Subsidiary Guarantors and Wilmington Trust, N.A., as Trustee. | |
| 4.7(26) | Fourth Supplemental Indenture to 2011 Indenture, dated as of January 19, 2012, among Medical Properties Trust, Inc., MPT Operating Partnership, L.P., MPT Finance Corporation, the Subsidiary Guarantors and Wilmington Trust, N.A., as Trustee. | |
| 4.8(26) | Fifth Supplemental Indenture to 2011 Indenture, dated as of April 9, 2012, among Medical Properties Trust, Inc., MPT Operating Partnership, L.P., MPT Finance Corporation, the Subsidiary Guarantors and Wilmington Trust, N.A., as Trustee. | |
| 4.9(26) | Sixth Supplemental Indenture to 2011 Indenture, dated as of June 27, 2012, among Medical Properties Trust, Inc., MPT Operating Partnership, L.P., MPT Finance Corporation, the Subsidiary Guarantors and Wilmington Trust, N.A., as Trustee. | |
142
Table of Contents
Index to Financial Statements
| Exhibit Number |
Exhibit Title | |
| 4.10(26) | Seventh Supplemental Indenture to 2011 Indenture, dated as of July 31, 2012, among Medical Properties Trust, Inc., MPT Operating Partnership, L.P., MPT Finance Corporation, the Subsidiary Guarantors and Wilmington Trust, N.A., as Trustee. | |
| 4.11(26) | Eighth Supplemental Indenture to 2011 Indenture, dated as of September 28, 2012, among Medical Properties Trust, Inc., MPT Operating Partnership, L.P., MPT Finance Corporation, the Subsidiary Guarantors and Wilmington Trust, N.A., as Trustee. | |
| 4.12(26) | Ninth Supplemental Indenture to 2011 Indenture, dated as of December 28, 2012, among Medical Properties Trust, Inc., MPT Operating Partnership, L.P., MPT Finance Corporation, the Subsidiary Guarantors and Wilmington Trust, N.A., as Trustee. | |
| 4.13(26) | Tenth Supplemental Indenture to 2011 Indenture, dated as of June 27, 2013, among Medical Properties Trust, Inc., MPT Operating Partnership, L.P., MPT Finance Corporation, the Subsidiary Guarantors and Wilmington Trust, N.A., as Trustee. | |
| 4.14(26) | Eleventh Supplemental Indenture to 2011 Indenture, dated as of August 8, 2013, among Medical Properties Trust, Inc., MPT Operating Partnership, L.P., MPT Finance Corporation, the Subsidiary Guarantors and Wilmington Trust, N.A., as Trustee. | |
| 4.15(26) | Twelfth Supplemental Indenture to 2011 Indenture, dated as of October 30, 2013, among Medical Properties Trust, Inc., MPT Operating Partnership, L.P., MPT Finance Corporation, the Subsidiary Guarantors and Wilmington Trust, N.A., as Trustee. | |
| 4.16(26) | Thirteenth Supplemental Indenture to 2011 Indenture, dated as of December 20, 2013, among Medical Properties Trust, Inc., MPT Operating Partnership, L.P., MPT Finance Corporation, the Subsidiary Guarantors and Wilmington Trust, N.A., as Trustee. | |
| 4.17(31) | Fourteenth Supplemental Indenture to 2011 Indenture, dated as of March 31, 2014, among Medical Properties Trust, Inc., MPT Operating Partnership, L.P., MPT Finance Corporation, the Subsidiary Guarantors and Wilmington Trust, N.A., as Trustee. | |
| 4.18(27) | Fifteenth Supplemental Indenture to 2011 Indenture, dated as of June 30, 2014, among Medical Properties Trust, Inc., MPT Operating Partnership, L.P., MPT Finance Corporation, the Subsidiary Guarantors and Wilmington Trust, N.A., as Trustee. | |
| 4.19(31) | Sixteenth Supplemental Indenture to 2011 Indenture, dated as of October 3, 2014, among Medical Properties Trust, Inc., MPT Operating Partnership, L.P., MPT Finance Corporation, the Subsidiary Guarantors and Wilmington Trust, N.A., as Trustee. | |
| 4.20(20) | Indenture, dated as of February 17, 2012, among Medical Properties Trust, Inc., MPT Operating Partnership, L.P., MPT Finance Corporation, the Subsidiary Guarantors and Wilmington Trust, N.A., as Trustee. | |
| 4.21(23) | First Supplemental Indenture to 2012 Indenture, dated as of April 9, 2012, among Medical Properties Trust, Inc., MPT Operating Partnership, L.P., MPT Finance Corporation, the Subsidiary Guarantors and Wilmington Trust, N.A., as Trustee. | |
| 4.22(23) | Second Supplemental Indenture to 2012 Indenture, dated as of June 27, 2012, among Medical Properties Trust, Inc., MPT Operating Partnership, L.P., MPT Finance Corporation, the Subsidiary Guarantors and Wilmington Trust, N.A., as Trustee. | |
| 4.23(23) | Third Supplemental Indenture to 2012 Indenture, dated as of July 31, 2012, among Medical Properties Trust, Inc., MPT Operating Partnership, L.P., MPT Finance Corporation, the Subsidiary Guarantors and Wilmington Trust, N.A., as Trustee. | |
| 4.24(23) | Fourth Supplemental Indenture to 2012 Indenture, dated as of September 28, 2012, among Medical Properties Trust, Inc., MPT Operating Partnership, L.P., MPT Finance Corporation, the Subsidiary Guarantors and Wilmington Trust, N.A., as Trustee. | |
143
Table of Contents
Index to Financial Statements
| Exhibit Number |
Exhibit Title | |
| 4.25(23) | Fifth Supplemental Indenture to 2012 Indenture, dated as of December 26, 2012, among Medical Properties Trust, Inc., MPT Operating Partnership, L.P., MPT Finance Corporation, the Subsidiary Guarantors and Wilmington Trust, N.A., as Trustee. | |
| 4.26(23) | Sixth Supplemental Indenture to 2012 Indenture, dated as of June 27, 2013, among Medical Properties Trust, Inc., MPT Operating Partnership, L.P., MPT Finance Corporation, the Subsidiary Guarantors and Wilmington Trust, N.A., as Trustee. | |
| 4.27(23) | Seventh Supplemental Indenture to 2012 Indenture, dated as of August 8, 2013, among Medical Properties Trust, Inc., MPT Operating Partnership, L.P., MPT Finance Corporation, the Subsidiary Guarantors and Wilmington Trust, N.A., as Trustee. | |
| 4.28(24) | Eighth Supplemental Indenture to 2012 Indenture, dated as of August 20, 2013, among Medical Properties Trust, Inc., MPT Operating Partnership, L.P., MPT Finance Corporation, the Subsidiary Guarantors and Wilmington Trust, N.A., as Trustee. | |
| 4.29(26) | Ninth Supplemental Indenture to 2012 Indenture, dated as of October 30, 2013, among Medical Properties Trust, Inc., MPT Operating Partnership, L.P., MPT Finance Corporation, the Subsidiary Guarantors and Wilmington Trust, N.A., as Trustee. | |
| 4.30(26) | Tenth Supplemental Indenture to 2012 Indenture, dated as of December 20, 2013, among Medical Properties Trust, Inc., MPT Operating Partnership, L.P., MPT Finance Corporation, the Subsidiary Guarantors and Wilmington Trust, N.A., as Trustee. | |
| 4.31(28) | Eleventh Supplemental Indenture to 2012 Indenture, dated as of March 31, 2014, among Medical Properties Trust, Inc., MPT Operating Partnership, L.P., MPT Finance Corporation, the Subsidiary Guarantors and Wilmington Trust, N.A., as Trustee. | |
| 4.32(27) | Twelfth Supplemental Indenture to 2012 Indenture, dated as of June 30, 2014, among Medical Properties Trust, Inc., MPT Operating Partnership, L.P., MPT Finance Corporation, the Subsidiary Guarantors and Wilmington Trust, N.A., as Trustee. | |
| 4.33(31) | Thirteenth Supplemental Indenture to 2012 Indenture, dated as of October 3, 2014, among Medical Properties Trust, Inc., MPT Operating Partnership, L.P., MPT Finance Corporation, the Subsidiary Guarantors and Wilmington Trust, N.A., as Trustee. | |
| 4.34(25) | Indenture, dated as of October 10, 2013, among Medical Properties Trust, Inc., MPT Operating Partnership, L.P., MPT Finance Corporation, the Subsidiary Guarantors and Wilmington Trust, N.A., as Trustee. | |
| 4.35(25) | First Supplemental Indenture to 2013 Indenture, dated as of October 10, 2013, among Medical Properties Trust, Inc., MPT Operating Partnership, L.P., MPT Finance Corporation, the Subsidiary Guarantors and Wilmington Trust, N.A., as Trustee. | |
| 4.36(26) | Second Supplemental Indenture to 2013 Indenture, dated as of October 30, 2013, among Medical Properties Trust, Inc., MPT Operating Partnership, L.P., MPT Finance Corporation, the Subsidiary Guarantors and Wilmington Trust, N.A., as Trustee. | |
| 4.37(26) | Third Supplemental Indenture to 2013 Indenture, dated as of December 20, 2013, among Medical Properties Trust, Inc., MPT Operating Partnership, L.P., MPT Finance Corporation, the Subsidiary Guarantors and Wilmington Trust, N.A., as Trustee. | |
| 4.38(28) | Fourth Supplemental Indenture to 2013 Indenture, dated as of March 31, 2014, among Medical Properties Trust, Inc., MPT Operating Partnership, L.P., MPT Finance Corporation, the Subsidiary Guarantors and Wilmington Trust, N.A., as Trustee. | |
| 4.39(29) | Fifth Supplemental Indenture to 2013 Indenture, dated as of April 17, 2014, among Medical Properties Trust, Inc., MPT Operating Partnership, L.P., MPT Finance Corporation, the Subsidiary Guarantors and Wilmington Trust, N.A., as Trustee. | |
144
Table of Contents
Index to Financial Statements
| Exhibit Number |
Exhibit Title | |
| 4.40(27) | Sixth Supplemental Indenture to 2013 Indenture, dated as of June 30, 2014, among Medical Properties Trust, Inc., MPT Operating Partnership, L.P., MPT Finance Corporation, the Subsidiary Guarantors and Wilmington Trust, N.A., as Trustee. | |
| 4.41(31) | Seventh Supplemental Indenture to 2013 Indenture, dated as of October 3, 2014, among Medical Properties Trust, Inc., MPT Operating Partnership, L.P., MPT Finance Corporation, the Subsidiary Guarantors and Wilmington Trust, N.A., as Trustee. | |
| 4.42(34) | Eighth Supplemental Indenture to 2013 Indenture, dated as of August 19, 2015, among Medical Properties Trust, Inc., MPT Operating Partnership, L.P., MPT Finance Corporation, Wilmington Trust, N.A., as Trustee, Deutsche Bank Trust Company Americas, as Paying Agent, and Deutsche Bank Luxembourg S.A., as Registrar and Transfer Agent. | |
| 4.43(36) | Ninth Supplemental Indenture, dated as of February 22, 2016, by and among MPT Operating Partnership, L.P. and MPT Finance Corporation, as issuers, Medical Properties Trust, Inc., as parent and guarantor, and Wilmington Trust, National Association, as trustee. | |
| 4.44(39) | Tenth Supplemental Indenture, dated as of July 22, 2016, by and among MPT Operating Partnership, L.P. and MPT Finance Corporation, as issuers, Medical Properties Trust, Inc., as parent and guarantor, and Wilmington Trust, National Association, as trustee. | |
| 10.2(8) | Medical Properties Trust, Inc. 2013 Equity Incentive Plan | |
| 10.3(7) | Form of Stock Option Award | |
| 10.4(7) | Form of Restricted Stock Award | |
| 10.5(7) | Form of Deferred Stock Unit Award | |
| 10.6(1) | Employment Agreement between Medical Properties Trust, Inc. and Edward K. Aldag, Jr., dated September 10, 2003 | |
| 10.7(1) | First Amendment to Employment Agreement between Registrant and Edward K. Aldag, Jr., dated March 8, 2004 | |
| 10.8(1) | Employment Agreement between Medical Properties Trust, Inc. and R. Steven Hamner, dated September 10, 2003 | |
| 10.9(1) | Employment Agreement between Medical Properties Trust, Inc. and Emmett E. McLean, dated September 10, 2003 | |
| 10.10(1) | Form of Indemnification Agreement between Medical Properties Trust, Inc. and executive officers and directors | |
| 10.11(11) | Form of Medical Properties Trust, Inc. 2007 Multi-Year Incentive Plan Award Agreement (LTIP Units) | |
| 10.12(11) | Form of Medical Properties Trust, Inc. 2007 Multi-Year Incentive Plan Award Agreement (Restricted Shares) | |
| 10.13(16) | Second Amendment to Employment Agreement between Medical Properties Trust, Inc. and Edward K. Aldag, Jr., dated September 29, 2006 | |
| 10.14(16) | First Amendment to Employment Agreement between Medical Properties Trust, Inc. and R. Steven Hamner, dated September 29, 2006 | |
| 10.15(16) | First Amendment to Employment Agreement between Medical Properties Trust, Inc. and Emmett E. McLean, dated September 29, 2006 | |
145
Table of Contents
Index to Financial Statements
| Exhibit Number |
Exhibit Title | |
| 10.16(17) | Second Amendment to Employment Agreement between Medical Properties Trust, Inc. and Emmett E. McLean, dated January 1, 2008 | |
| 10.17(17) | Third Amendment to Employment Agreement between Medical Properties Trust, Inc. and Emmett E. McLean, dated January 1, 2009 | |
| 10.18(17) | Second Amendment to Employment Agreement between Medical Properties Trust, Inc. and Richard S. Hamner, dated January 1, 2008 | |
| 10.19(17) | Third Amendment to Employment Agreement between Medical Properties Trust, Inc. and R. Steven Hamner, dated January 1, 2009 | |
| 10.20(17) | Third Amendment to Employment Agreement between Medical Properties Trust, Inc. and Edward K. Aldag, Jr., dated January 1, 2008 | |
| 10.21(17) | Fourth Amendment to Employment Agreement between Medical Properties Trust, Inc. and Edward K. Aldag, Jr., dated January 1, 2009 | |
| 10.22(9) | Amended and Restated Revolving Credit and Term Loan Agreement, dated as of April 26, 2011, among Medical Properties Trust, Inc., MPT Operating Partnership, L.P., KeyBank National Association as syndication agent, and JPMorgan Chase Bank, N.A., as administrative agent | |
| 10.23(30) | Amended and Restated Revolving Credit and Term Loan Agreement, dated as of June 19, 2014, among Medical Properties Trust, Inc., MPT Operating Partnership, L.P., the several lenders from time to time party thereto, Bank of America, N.A., as syndication agent, and JPMorgan Chase Bank, N.A., as administrative agent. | |
| 10.24(31) | First Amendment to Amended and Restated Revolving Credit and Term Loan Agreement, dated as of October 17, 2014, among Medical Properties Trust, Inc., MPT Operating Partnership, L.P., the several lenders from time to time party thereto, Bank of America, N.A., as syndication agent, and JPMorgan Chase Bank, N.A., as administrative agent. | |
| 10.25(35) | Second Amendment to Amended and Restated Revolving Credit and Term Loan Agreement, dated as of August 4, 2015, among Medical Properties Trust, Inc., MPT Operating Partnership, L.P., the several lenders from time to time party thereto, Bank of America, N.A., as syndication agent, and JPMorgan Chase Bank, N.A., as administrative agent. | |
| 10.26(35) | Third Amendment to Amended and Restated Revolving Credit and Term Loan Agreement, dated as of September 30, 2015, among Medical Properties Trust, Inc., MPT Operating Partnership, L.P., the several lenders from time to time party thereto, Bank of America, N.A., as syndication agent, and JPMorgan Chase Bank, N.A., as administrative agent. | |
| 10.27(19) | Master Sublease Agreement between certain subsidiaries of MPT Development Services, Inc. as Lessor, and certain subsidiaries of Ernest Health, Inc., as Lessee. | |
| 10.28(22) | Master Lease Agreement I between certain subsidiaries of MPT Operating Partnership, LP, as Lessor, and certain subsidiaries of Prime Healthcare Services, Inc., as Lessee and related first amendment and Master Lease Agreement II between certain subsidiaries of MPT Operating Partnership, LP, as Lessor, and certain subsidiaries of Prime Healthcare Services, Inc., as Lessee and related first amendment. | |
| 10.29(33) | Form of Master Lease Agreement between certain subsidiaries of MPT Operating Partnership, L.P., as Lessor, and MEDIAN Kliniken S.a.r.l. and certain of its subsidiaries, as Lessee, and related first and second amendments. | |
| 10.30(37) | Master Lease Agreement between certain subsidiaries of MPT Development Services, Inc., as Lessor, and certain subsidiaries of Capella Holdings, Inc., as Lessee. | |
146
Table of Contents
Index to Financial Statements
| Exhibit Number |
Exhibit Title | |
| 10.31(37) | Joinder and Amendment to Master Lease Agreement between certain subsidiaries of MPT Development Services, Inc., as Lessor, and certain subsidiaries of Capella Holdings, Inc., as Lessee. | |
| 10.32(38) | Amended and Restated Master Lease Agreement between certain subsidiaries of MPT Operating Partnership, L.P., as lessor and certain subsidiaries of Capella Holdings, Inc., as lessee. | |
| 10.33* | Master Lease Agreement by and among certain subsidiaries of MPT Operating Partnership, L.P. as Lessor and certain subsidiaries of Steward Health Care System LLC, Lessee. | |
| 10.34* | Real Estate Loan Agreement by and among certain subsidiaries of MPT Operating Partnership, L.P. as Lessor and certain subsidiaries of Steward Health Care System LLC, Lessee. | |
| 10.35* | Amended and Restated Revolving Credit and Term Loan Agreement, dated as of February 1, 2017, among Medical Properties Trust, Inc., MPT Operating Partnership, L.P., the several lenders from time to time party thereto, Bank of America, N.A., as syndication agent, and JPMorgan Chase Bank, N.A., as administrative agent. | |
| 12.1* | Statement re Computation of Ratios | |
| 21.1* | Subsidiaries of Medical Properties Trust, Inc. | |
| 23.1* | Consent of PricewaterhouseCoopers LLP | |
| 23.2* | Consent of PricewaterhouseCoopers LLP | |
| 31.1* | Certification of Chief Executive Officer pursuant to Rule 13a-14(a) under the Securities Exchange Act of 1934. (Medical Properties Trust, Inc.) | |
| 31.2* | Certification of Chief Financial Officer pursuant to Rule 13a-14(a) under the Securities Exchange Act of 1934. (Medical Properties Trust, Inc.) | |
| 31.3* | Certification of Chief Executive Officer pursuant to Rule 13a-14(a) under the Securities Exchange Act of 1934. (MPT Operating Partnership, L.P.) | |
| 31.4* | Certification of Chief Financial Officer pursuant to Rule 13a-14(a) under the Securities Exchange Act of 1934. (MPT Operating Partnership, L.P.) | |
| 32.1** | Certification of Chief Executive Officer and Chief Financial Officer pursuant to Rule 13a-14(b) under the Securities Exchange Act of 1934 and 18 U.S.C. Section 1350 as adopted pursuant to Section 906 of the Sarbanes-Oxley Act of 2002. (Medical Properties Trust, Inc.) | |
| 32.2** | Certification of Chief Executive Officer and Chief Financial Officer pursuant to Rule 13a-14(b) under the Securities Exchange Act of 1934 and 18 U.S.C. Section 1350 as adopted pursuant to Section 906 of the Sarbanes-Oxley Act of 2002. (MPT Operating Partnership, L.P.) | |
| Exhibit 101.INS | XBRL Instance Document | |
| Exhibit 101.SCH | XBRL Taxonomy Extension Schema Document | |
| Exhibit 101.CAL | XBRL Taxonomy Extension Calculation Linkbase Document | |
| Exhibit 101.DEF | XBRL Taxonomy Extension Definition Linkbase Document | |
| Exhibit 101.LAB | XBRL Taxonomy Extension Label Linkbase Document | |
| Exhibit 101.PRE | XBRL Taxonomy Extension Presentation Linkbase Document | |
| * | Filed herewith. |
| ** | Furnished herewith. |
| (1) | Incorporated by reference to Registrant’s Registration Statement on Form S-11 filed with the Commission on October 26, 2004, as amended (File No. 333-119957). |
147
Table of Contents
Index to Financial Statements
| (2) | Incorporated by reference to Registrant’s current report on Form 8-K, filed with the Commission on November 24, 2009. |
| (3) | Incorporated by reference to Registrant’s quarterly report on Form 10-Q for the quarter ended September 30, 2005, filed with the Commission on November 10, 2005. |
| (4) | Incorporated by reference to Registrant’s current report on Form 8-K, filed with the Commission on July 20, 2006. |
| (5) | Reserved. |
| (6) | Incorporated by reference to the Registrant’s current report on Form 8-K, filed with the Commission on January 13, 2009. |
| (7) | Incorporated by reference to Registrant’s current report on Form 8-K, filed with the Commission on October 18, 2005. |
| (8) | Incorporated by reference to Registrant’s definitive proxy statement on Schedule 14A, filed with the Commission on April 26, 2013. |
| (9) | Incorporated by reference to Registrant’s current report on Form 8-K, filed with the Commission on May 2, 2011. |
| (10) | Reserved. |
| (11) | Incorporated by reference to Registrant’s current report on Form 8-K, filed with the Commission on August 6, 2007, as amended by Medical Properties Trust, Inc.’s current report on Form 8-K/A, filed with the Commission on August 15, 2007. |
| (12) | Reserved. |
| (13) | Reserved. |
| (14) | Reserved. |
| (15) | Reserved. |
| (16) | Incorporated by reference to Registrant’s annual report on Form 10-K/A for the period ended December 31, 2007, filed with the Commission on July 11, 2008. |
| (17) | Incorporated by reference to Registrant’s annual report on Form 10-K for the period ended December 31, 2008, filed with the Commission on March 13, 2009. |
| (18) | Incorporated by reference to Registrant’s current report on Form 8-K, filed with the Commission on June 11, 2010. |
| (19) | Incorporated by reference to Medical Properties Trust, Inc.’s current report on Form 8-K, filed with the Commission on January 31, 2012. |
| (20) | Incorporated by reference to Medical Properties Trust, Inc. and MPT Operating Partnership, L.P.’s current report on Form 8-K, filed with the Commission on February 24, 2012. |
| (21) | Reserved. |
| (22) | Incorporated by reference to Medical Properties Trust, Inc. and MPT Operating Partnership, L.P.’s quarterly report on Form 10-Q, filed with the Commission on November 9, 2012. |
| (23) | Incorporated by reference to Medical Properties Trust, Inc., MPT Operating Partnership, L.P. and MPT Finance Corporation’s registration statement on Form S-3, filed with the Commission on August 9, 2013. |
| (24) | Incorporated by reference to Medical Properties Trust, Inc. and MPT Operating Partnership, L.P.’s current report on Form 8-K, filed with the Commission on August 20, 2013. |
| (25) | Incorporated by reference to Medical Properties Trust, Inc. and MPT Operating Partnership, L.P.’s current report on Form 8-K, filed with the Commission on October 16, 2013. |
| (26) | Incorporated by reference to Medical Properties Trust, Inc. and MPT Operating Partnership, L.P.’s annual report on Form 10-K, filed with the Commission on March 3, 2014. |
| (27) | Incorporated by reference to Medical Properties Trust, Inc. and MPT Operating Partnership, L.P.’s quarterly report on Form 10-Q, filed with the Commission on August 11, 2014. |
| (28) | Incorporated by reference to Medical Properties Trust, Inc., MPT Operating Partnership, L.P. and MPT Finance Corporation’s post-effective amendment to registration statement on Form S-3, filed with the Commission on April 10, 2014. |
| (29) | Incorporated by reference to Medical Properties Trust, Inc. and MPT Operating Partnership, L.P.’s current report on Form 8-K, filed with the Commission on April 23, 2014. |
148
Table of Contents
Index to Financial Statements
| (30) | Incorporated by reference to Medical Properties Trust, Inc. and MPT Operating Partnership, L.P.’s current report on Form 8-K, filed with the Commission on June 25, 2014. |
| (31) | Incorporated by reference to Medical Properties Trust, Inc. and MPT Operating Partnership, L.P.’s annual report on Form 10-K, filed with the Commission on March 2, 2015. |
| (32) | Incorporated by reference to Medical Properties Trust, Inc.’s current report on Form 8-K, filed with the Commission on June 26, 2015. |
| (33) | Incorporated by reference to Medical Properties Trust, Inc. and MPT Operating Partnership, L.P.’s quarterly report on Form 10-Q, filed with the Commission on August 10, 2015. |
| (34) | Incorporated by reference to Medical Properties Trust, Inc.’s current report on Form 8-K, filed with the Commission on August 21, 2015. |
| (35) | Incorporated by reference to Medical Properties Trust, Inc. and MPT Operating Partnership, L.P.’s quarterly report on Form 10-Q, filed with the Commission on November 9, 2015. |
| (36) | Incorporated by reference to Registrant’s current report on Form 8-K, filed with the Commission on February 22, 2016. |
| (37) | Incorporated by reference to Medical Properties Trust, Inc. and MPT Operating Partnership, L.P.’s annual report on Form 10-K, filed with the Commission on February 29, 2016. |
| (38) | Incorporated by reference to Medical Properties Trust, Inc. and MPT Operating Partnership, L.P.’s quarterly report on Form 10-Q, filed with the Commission on May 10, 2016. |
| (39) | Incorporated by reference to Medical Properties Trust, Inc’s Current Report on Form 8-K filed with the Commission on July 22, 2016. |
| (40) | Incorporated by reference to Medical Properties Trust, Inc’s Current Report on Form 8-K filed with the Commission on November 16, 2016. |
| (41) | Incorporated by reference to Medical Properties Trust, Inc’s Current Report on Form 8-K filed with the Commission on February 22, 2017. |
149