Attached files
| file | filename |
|---|---|
| 8-K - 8-K - INDEPENDENT BANK CORP /MI/ | brhc10027222_8k.htm |
| EX-99.2 - EXHIBIT 99.2 - INDEPENDENT BANK CORP /MI/ | brhc10027222_ex99-2.htm |
| EX-99.1 - EXHIBIT 99.1 - INDEPENDENT BANK CORP /MI/ | brhc10027222_ex99-1.htm |
Exhibit 99.3
Independent Bank Corporation (IBCP) Earnings CallSecond Quarter 2021July 29, 2021
Cautionary note regarding forward-looking statements This presentation contains forward-looking
statements about Independent Bank Corporation. Statements that are not historical or current facts, including statements about beliefs and expectations, are forward-looking statements and are based on the information available to, and
assumptions and estimates made by, management as of the date hereof. These forward-looking statements cover, among other things, anticipated future revenue and expenses and the future plans and prospects of Independent Bank Corporation.
Forward-looking statements involve inherent risks and uncertainties, and important factors could cause actual results to differ materially from those anticipated. The COVID-19 pandemic is adversely affecting Independent Bank Corporation, its
customers, counterparties, employees, and third-party service providers, and the ultimate extent of the impacts on its business, financial position, results of operations, liquidity, and prospects is uncertain. Continued deterioration in
general business and economic conditions or turbulence in domestic or global financial markets could adversely affect Independent Bank Corporation’s revenues and the values of its assets and liabilities, reduce the availability of funding from
certain financial institutions, lead to a tightening of credit, and increase stock price volatility. In addition, changes to statutes, regulations, or regulatory policies or practices could affect Independent Bank Corporation in substantial and
unpredictable ways. Independent Bank Corporation’s results could also be adversely affected by changes in interest rates; further increases in unemployment rates; deterioration in the credit quality of its loan portfolios or in the value of the
collateral securing those loans; deterioration in the value of its investment securities; legal and regulatory developments; litigation; increased competition from both banks and non-banks; changes in the level of tariffs and other trade
policies of the United States and its global trading partners; changes in customer behavior and preferences; breaches in data security; failures to safeguard personal information; effects of mergers and acquisitions and related integration;
effects of critical accounting policies and judgments; and management’s ability to effectively manage credit risk, market risk, operational risk, compliance risk, strategic risk, interest rate risk, liquidity risk and reputation risk. Certain
risks and important factors that could affect Independent Bank Corporation's future results are identified in its Annual Report on Form 10-K for the year ended December 31, 2020 and other reports filed with the SEC, including among other things
under the heading “Risk Factors” in such Annual Report on Form 10-K. Any forward-looking statement speaks only as of the date on which it is made, and Independent Bank Corporation undertakes no obligation to update any forward-looking
statement, whether to reflect events or circumstances after the date on which the statement is made, to reflect new information or the occurrence of unanticipated events, or otherwise. 2

Agenda Formal Remarks.William B. (Brad) Kessel, President and Chief Executive OfficerGavin A. Mohr,
Executive Vice President and Chief Financial OfficerQuestion and Answer session.Closing Remarks.Note: This presentation is available at www.IndependentBank.com in the Investor Relations area under the “Presentations” tab. 3
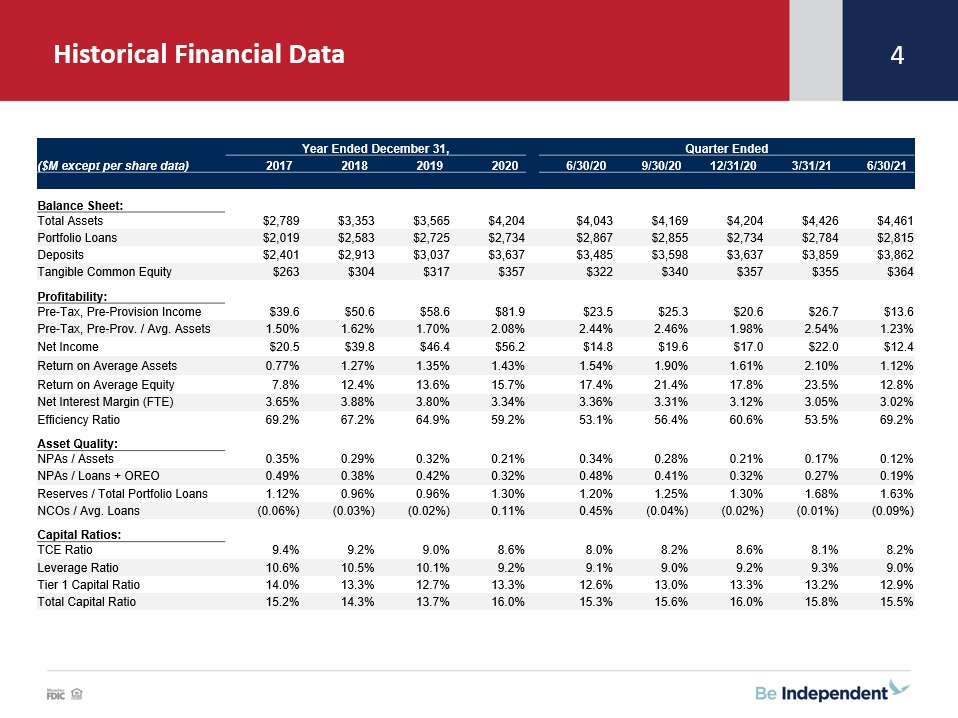
Historical Financial Data 4 Year Ended December 31, Quarter Ended ($M except
per share data) 2017 2018 2019 2020 6/30/20 9/30/20 12/31/20 3/31/21 6/30/21 Balance Sheet: Total Assets $2,789 $3,353 $3,565 $4,204 $4,043 $4,169
$4,204 $4,426 $4,461 Portfolio Loans $2,019 $2,583 $2,725 $2,734 $2,867 $2,855 $2,734 $2,784 $2,815 Deposits $2,401 $2,913 $3,037 $3,637 $3,485 $3,598 $3,637 $3,859 $3,862 Tangible Common
Equity $263 $304 $317 $357 $322 $340 $357 $355 $364 Profitability: Pre-Tax, Pre-Provision Income $39.6 $50.6 $58.6 $81.9 $23.5 $25.3 $20.6 $26.7 $13.6 Pre-Tax, Pre-Prov. /
Avg. Assets 1.50% 1.62% 1.70% 2.08% 2.44% 2.46% 1.98% 2.54% 1.23% Net Income $20.5 $39.8 $46.4 $56.2 $14.8 $19.6 $17.0 $22.0 $12.4 Return on Average
Assets 0.77% 1.27% 1.35% 1.43% 1.54% 1.90% 1.61% 2.10% 1.12% Return on Average Equity 7.8% 12.4% 13.6% 15.7% 17.4% 21.4% 17.8% 23.5% 12.8% Net Interest Margin
(FTE) 3.65% 3.88% 3.80% 3.34% 3.36% 3.31% 3.12% 3.05% 3.02% Efficiency Ratio 69.2% 67.2% 64.9% 59.2% 53.1% 56.4% 60.6% 53.5% 69.2% Asset Quality: NPAs /
Assets 0.35% 0.29% 0.32% 0.21% 0.34% 0.28% 0.21% 0.17% 0.12% NPAs / Loans + OREO 0.49% 0.38% 0.42% 0.32% 0.48% 0.41% 0.32% 0.27% 0.19% Reserves / Total Portfolio
Loans 1.12% 0.96% 0.96% 1.30% 1.20% 1.25% 1.30% 1.68% 1.63% NCOs / Avg. Loans (0.06%) (0.03%) (0.02%) 0.11% 0.45% (0.04%) (0.02%) (0.01%) (0.09%) Capital Ratios: TCE
Ratio 9.4% 9.2% 9.0% 8.6% 8.0% 8.2% 8.6% 8.1% 8.2% Leverage Ratio 10.6% 10.5% 10.1% 9.2% 9.1% 9.0% 9.2% 9.3% 9.0% Tier 1 Capital Ratio 14.0% 13.3% 12.7% 13.3% 12.6% 13.0% 13.3% 13.2% 13.0% Total
Capital Ratio 15.2% 14.3% 13.7% 16.0% 15.3% 15.6% 16.0% 15.8% 15.5%
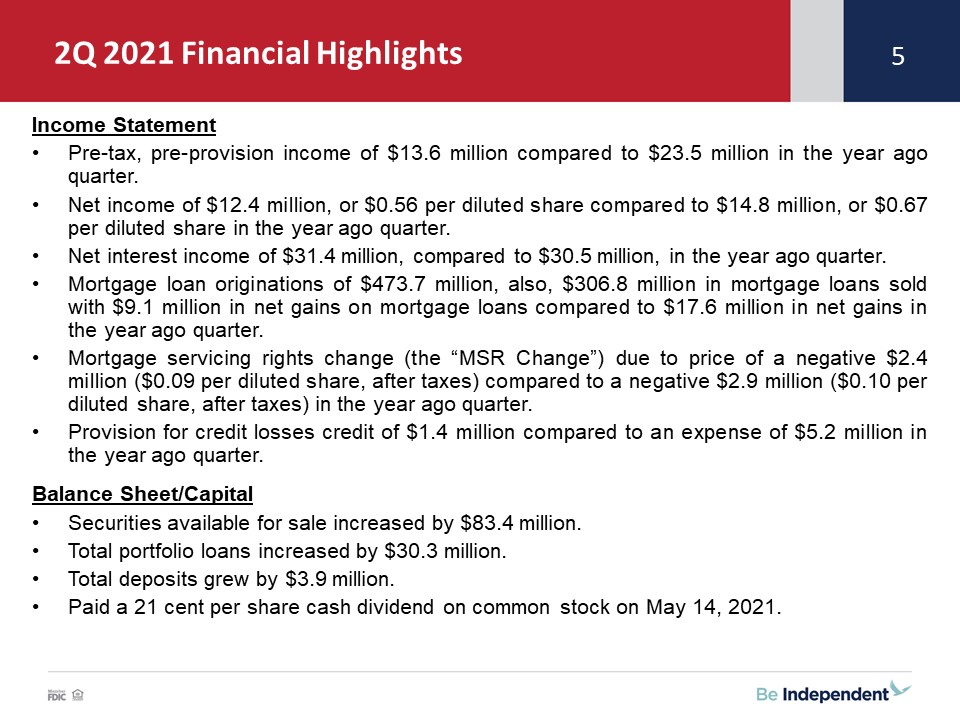
2Q 2021 Financial Highlights Income StatementPre-tax, pre-provision income of $13.6 million compared to
$23.5 million in the year ago quarter.Net income of $12.4 million, or $0.56 per diluted share compared to $14.8 million, or $0.67 per diluted share in the year ago quarter.Net interest income of $31.4 million, compared to $30.5 million, in the
year ago quarter.Mortgage loan originations of $473.7 million, also, $306.8 million in mortgage loans sold with $9.1 million in net gains on mortgage loans compared to $17.6 million in net gains in the year ago quarter. Mortgage servicing
rights change (the “MSR Change”) due to price of a negative $2.4 million ($0.09 per diluted share, after taxes) compared to a negative $2.9 million ($0.10 per diluted share, after taxes) in the year ago quarter. Provision for credit losses
credit of $1.4 million compared to an expense of $5.2 million in the year ago quarter. Balance Sheet/CapitalSecurities available for sale increased by $83.4 million.Total portfolio loans increased by $30.3 million.Total deposits grew by $3.9
million.Paid a 21 cent per share cash dividend on common stock on May 14, 2021. 5
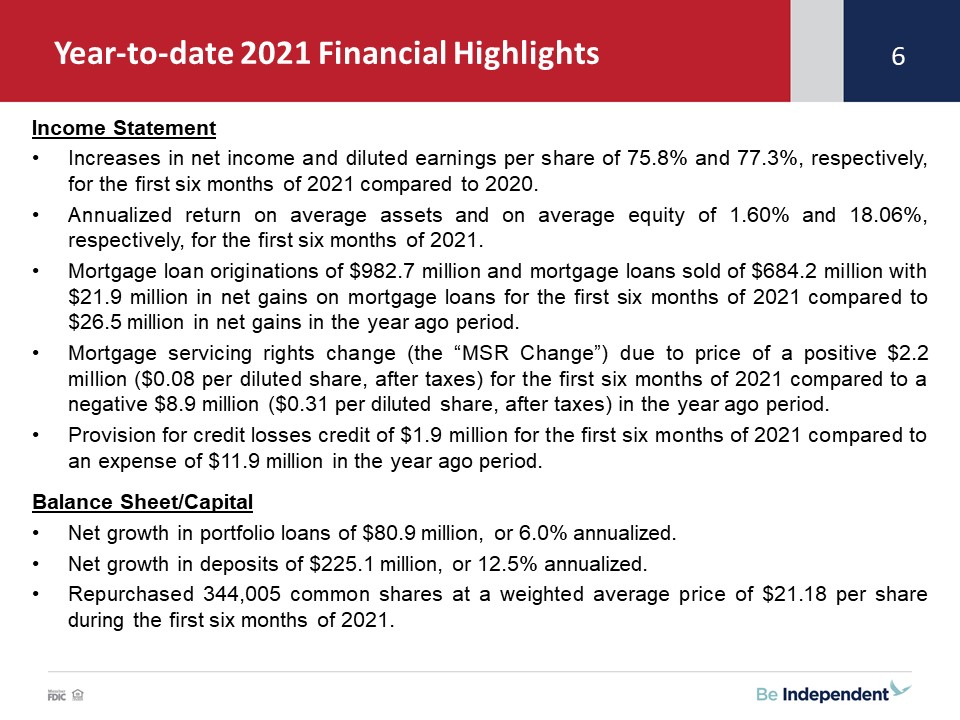
Year-to-date 2021 Financial Highlights Income StatementIncreases in net income and diluted earnings per
share of 75.8% and 77.3%, respectively, for the first six months of 2021 compared to 2020.Annualized return on average assets and on average equity of 1.60% and 18.06%, respectively, for the first six months of 2021.Mortgage loan originations
of $982.7 million and mortgage loans sold of $684.2 million with $21.9 million in net gains on mortgage loans for the first six months of 2021 compared to $26.5 million in net gains in the year ago period. Mortgage servicing rights change (the
“MSR Change”) due to price of a positive $2.2 million ($0.08 per diluted share, after taxes) for the first six months of 2021 compared to a negative $8.9 million ($0.31 per diluted share, after taxes) in the year ago period. Provision for
credit losses credit of $1.9 million for the first six months of 2021 compared to an expense of $11.9 million in the year ago period. Balance Sheet/CapitalNet growth in portfolio loans of $80.9 million, or 6.0% annualized.Net growth in deposits
of $225.1 million, or 12.5% annualized.Repurchased 344,005 common shares at a weighted average price of $21.18 per share during the first six months of 2021. 6
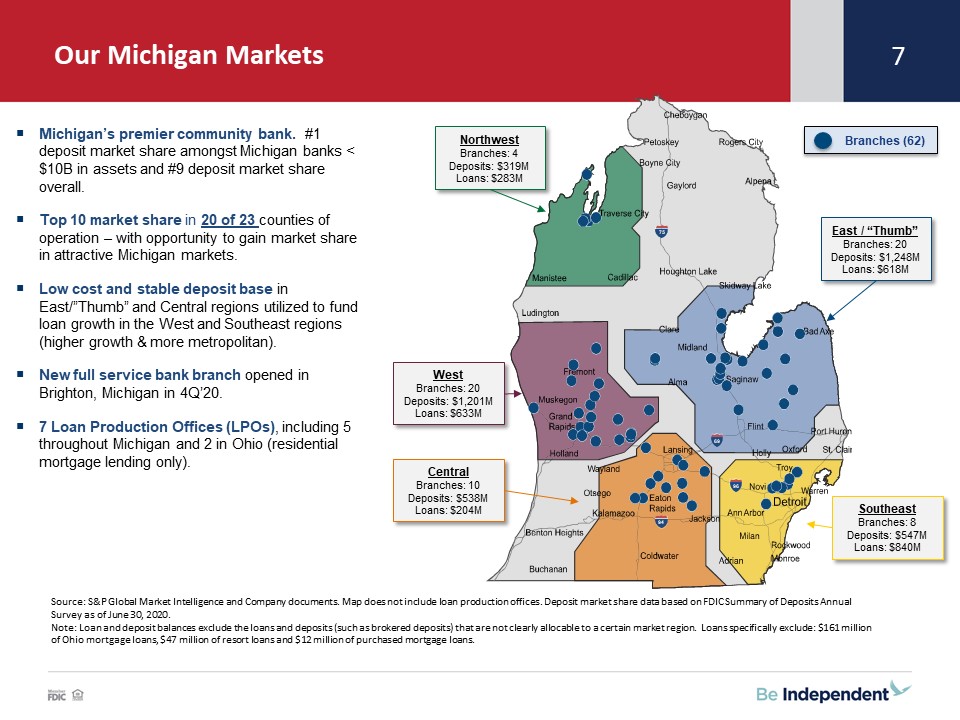
Our Michigan Markets 7 Source: S&P Global Market Intelligence and Company documents. Map does not
include loan production offices. Deposit market share data based on FDIC Summary of Deposits Annual Survey as of June 30, 2020.Note: Loan and deposit balances exclude the loans and deposits (such as brokered deposits) that are not clearly
allocable to a certain market region. Loans specifically exclude: $161 million of Ohio mortgage loans, $47 million of resort loans and $12 million of purchased mortgage loans. 94 96 75 69 Michigan’s premier
community bank. #1 deposit market share amongst Michigan banks < $10B in assets and #9 deposit market share overall. Top 10 market share in 20 of 23 counties of operation – with opportunity to gain market share in attractive Michigan
markets.Low cost and stable deposit base in East/”Thumb” and Central regions utilized to fund loan growth in the West and Southeast regions (higher growth & more metropolitan).New full service bank branch opened in Brighton, Michigan in
4Q’20.7 Loan Production Offices (LPOs), including 5 throughout Michigan and 2 in Ohio (residential mortgage lending only). Branches (62) East / “Thumb”Branches: 20Deposits: $1,248MLoans: $618M SoutheastBranches: 8Deposits: $547MLoans:
$840M CentralBranches: 10Deposits: $538MLoans: $204M WestBranches: 20Deposits: $1,201MLoans: $633M NorthwestBranches: 4Deposits: $319MLoans: $283M
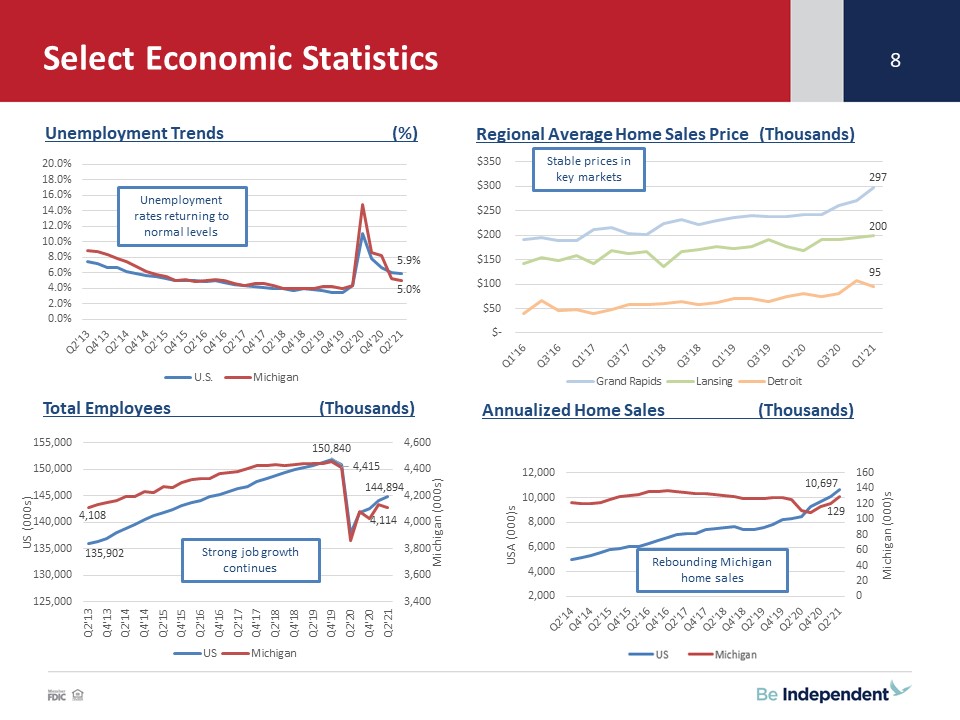
Select Economic Statistics 8 Unemployment Trends (%) Total Employees (Thousands) Regional Average
Home Sales Price (Thousands) Annualized Home Sales (Thousands) Select Economic Statistics Unemployment rates returning to normal levels Stable prices in key markets Strong job growth continues Rebounding Michigan home sales
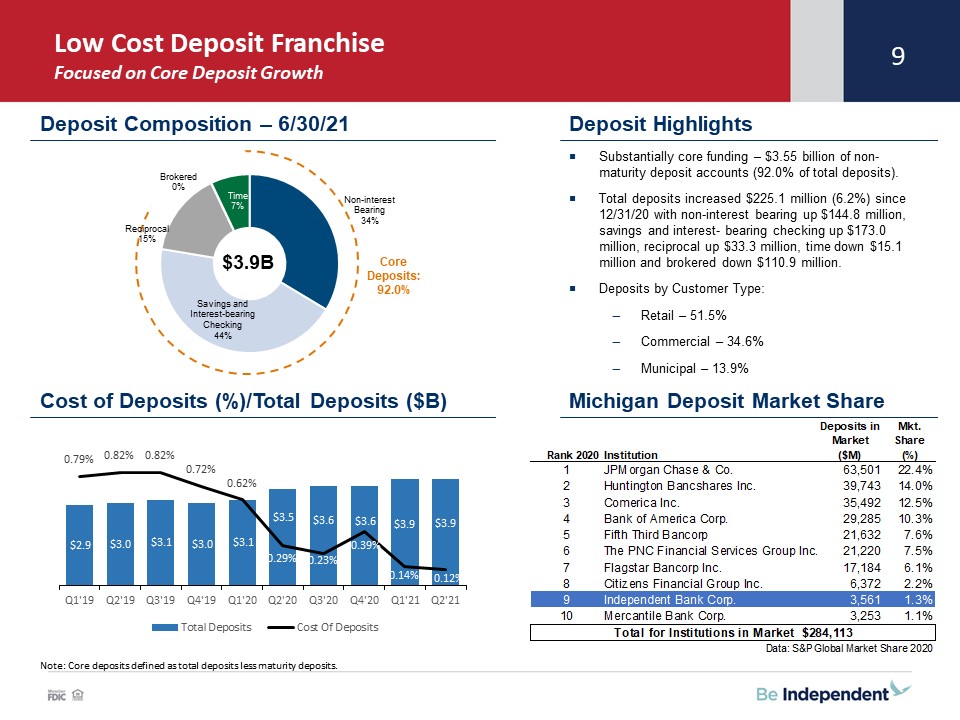
Low Cost Deposit Franchise Focused on Core Deposit Growth 9 Substantially core funding – $3.55
billion of non-maturity deposit accounts (92.0% of total deposits).Total deposits increased $225.1 million (6.2%) since 12/31/20 with non-interest bearing up $144.8 million, savings and interest- bearing checking up $173.0 million, reciprocal
up $33.3 million, time down $15.1 million and brokered down $110.9 million.Deposits by Customer Type:Retail – 51.5%Commercial – 34.6%Municipal – 13.9% Deposit Composition – 6/30/21 Deposit Highlights Michigan Deposit Market
Share $3.9B Core Deposits: 92.0% Cost of Deposits (%)/Total Deposits ($B) Note: Core deposits defined as total deposits less maturity deposits.
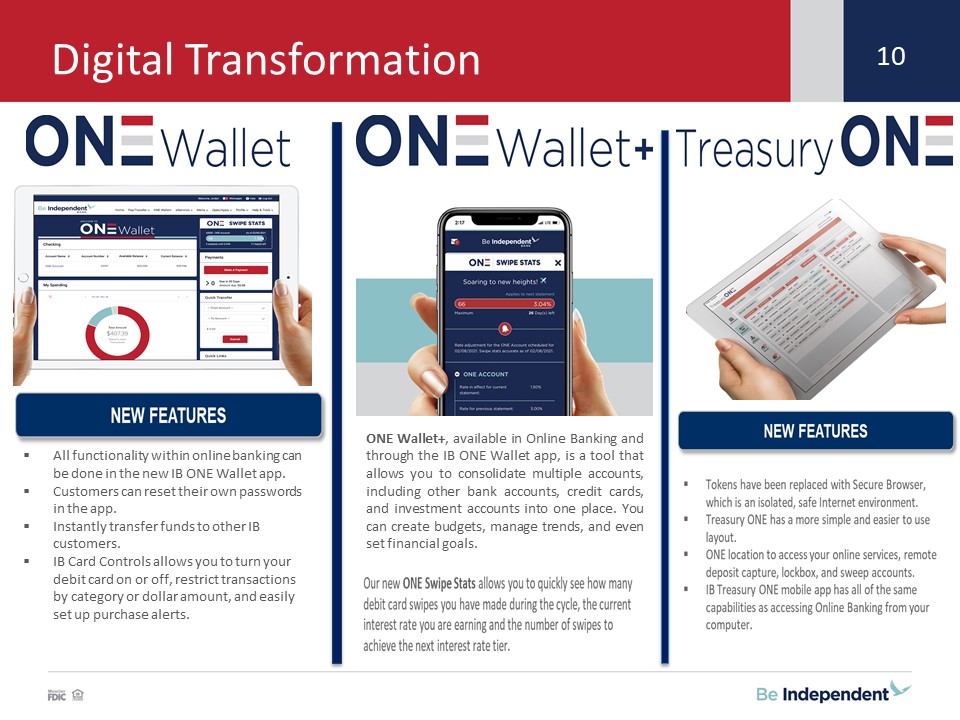
10 10 All functionality within online banking can be done in the new IB ONE Wallet app.Customers can
reset their own passwords in the app. Instantly transfer funds to other IB customers. IB Card Controls allows you to turn your debit card on or off, restrict transactions by category or dollar amount, and easily set up purchase alerts.
ONE Wallet+, available in Online Banking and through the IB ONE Wallet app, is a tool that allows you to consolidate multiple accounts, including other bank accounts, credit cards, and investment accounts into one place. You can create
budgets, manage trends, and even set financial goals. Digital Transformation
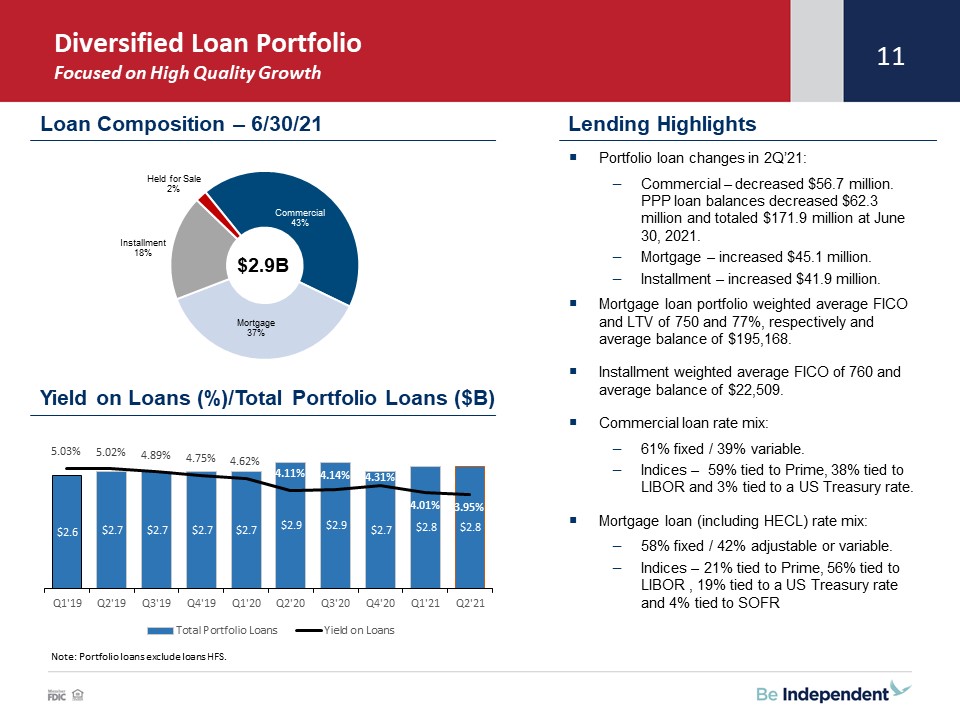
Diversified Loan PortfolioFocused on High Quality Growth 11 Lending Highlights Note: Portfolio loans
exclude loans HFS. Portfolio loan changes in 2Q’21:Commercial – decreased $56.7 million. PPP loan balances decreased $62.3 million and totaled $171.9 million at June 30, 2021.Mortgage – increased $45.1 million.Installment – increased $41.9
million.Mortgage loan portfolio weighted average FICO and LTV of 750 and 77%, respectively and average balance of $195,168.Installment weighted average FICO of 760 and average balance of $22,509.Commercial loan rate mix:61% fixed / 39%
variable.Indices – 59% tied to Prime, 38% tied to LIBOR and 3% tied to a US Treasury rate.Mortgage loan (including HECL) rate mix: 58% fixed / 42% adjustable or variable. Indices – 21% tied to Prime, 56% tied to LIBOR , 19% tied to a US
Treasury rate and 4% tied to SOFR Loan Composition – 6/30/21 $2.9B Yield on Loans (%)/Total Portfolio Loans ($B)
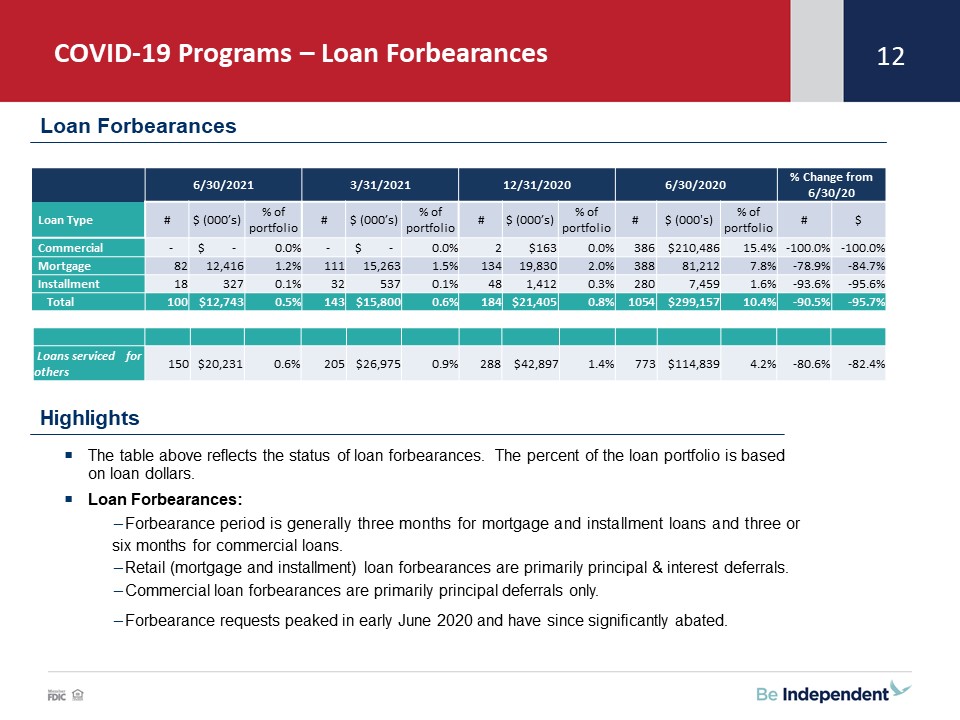
COVID-19 Programs – Loan Forbearances 12 Highlights Loan Forbearances The table above reflects the
status of loan forbearances. The percent of the loan portfolio is based on loan dollars.Loan Forbearances:Forbearance period is generally three months for mortgage and installment loans and three or six months for commercial loans. Retail
(mortgage and installment) loan forbearances are primarily principal & interest deferrals.Commercial loan forbearances are primarily principal deferrals only.Forbearance requests peaked in early June 2020 and have since significantly
abated. 6/30/2021 3/31/2021 12/31/2020 6/30/2020 % Change from 6/30/20 Loan Type # $ (000’s) % of portfolio # $ (000’s) % of portfolio # $ (000’s) % of portfolio # $ (000's) % of portfolio # $
Commercial - $ - 0.0% - $ - 0.0% 2 $163 0.0% 386 $210,486 15.4% -100.0% -100.0% Mortgage 82 12,416 1.2% 111 15,263 1.5% 134 19,830 2.0% 388 81,212 7.8% -78.9% -84.7%
Installment 18 327 0.1% 32 537 0.1% 48 1,412 0.3% 280 7,459 1.6% -93.6% -95.6% Total 100 $12,743 0.5% 143 $15,800 0.6% 184 $21,405 0.8% 1054 $299,157
10.4% -90.5% -95.7% Loans serviced for others 150 $20,231 0.6% 205 $26,975 0.9% 288 $42,897 1.4% 773 $114,839 4.2% -80.6% -82.4%
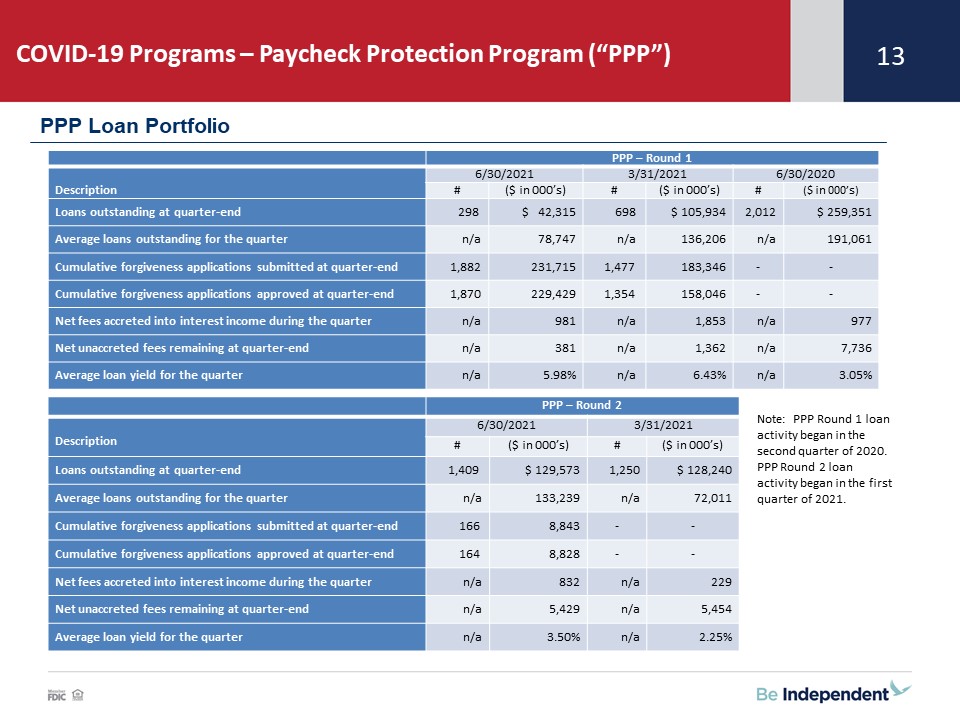
COVID-19 Programs – Paycheck Protection Program (“PPP”) 13 PPP Loan Portfolio PPP – Round
1 Description 6/30/2021 3/31/2021 6/30/2020 # ($ in 000’s) # ($ in 000’s) # ($ in 000’s) Loans outstanding at quarter-end 298 $ 42,315 698 $ 105,934 2,012 $ 259,351 Average loans outstanding for the
quarter n/a 78,747 n/a 136,206 n/a 191,061 Cumulative forgiveness applications submitted at quarter-end 1,882 231,715 1,477 183,346 - - Cumulative forgiveness applications approved at
quarter-end 1,870 229,429 1,354 158,046 - - Net fees accreted into interest income during the quarter n/a 981 n/a 1,853 n/a 977 Net unaccreted fees remaining at quarter-end n/a 381 n/a 1,362 n/a 7,736 Average loan yield
for the quarter n/a 5.98% n/a 6.43% n/a 3.05% PPP – Round 2 Description 6/30/2021 3/31/2021 # ($ in 000’s) # ($ in 000’s) Loans outstanding at quarter-end 1,409 $ 129,573 1,250 $ 128,240 Average loans
outstanding for the quarter n/a 133,239 n/a 72,011 Cumulative forgiveness applications submitted at quarter-end 166 8,843 - - Cumulative forgiveness applications approved at quarter-end 164 8,828 - - Net fees accreted into
interest income during the quarter n/a 832 n/a 229 Net unaccreted fees remaining at quarter-end n/a 5,429 n/a 5,454 Average loan yield for the quarter n/a 3.50% n/a 2.25% Note: PPP Round 1 loan activity began in the second
quarter of 2020. PPP Round 2 loan activity began in the first quarter of 2021.
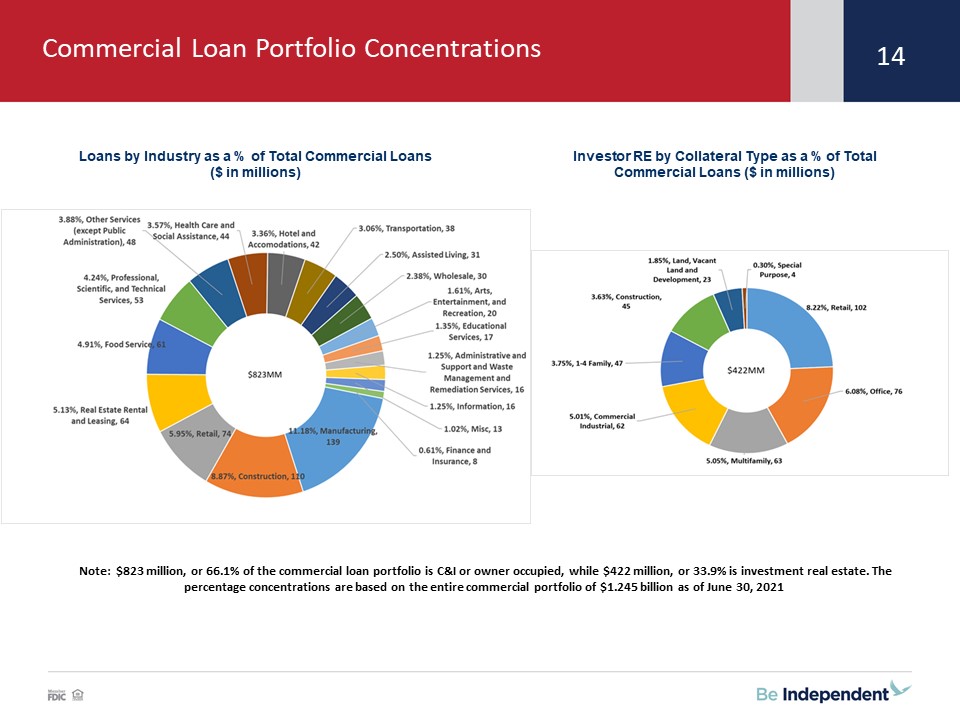
Loans by Industry as a % of Total Commercial Loans ($ in millions) Investor RE by Collateral Type as a %
of Total Commercial Loans ($ in millions) 14 Commercial Loan Portfolio Concentrations 14 Note: $823 million, or 66.1% of the commercial loan portfolio is C&I or owner occupied, while $422 million, or 33.9% is investment real estate.
The percentage concentrations are based on the entire commercial portfolio of $1.245 billion as of June 30, 2021
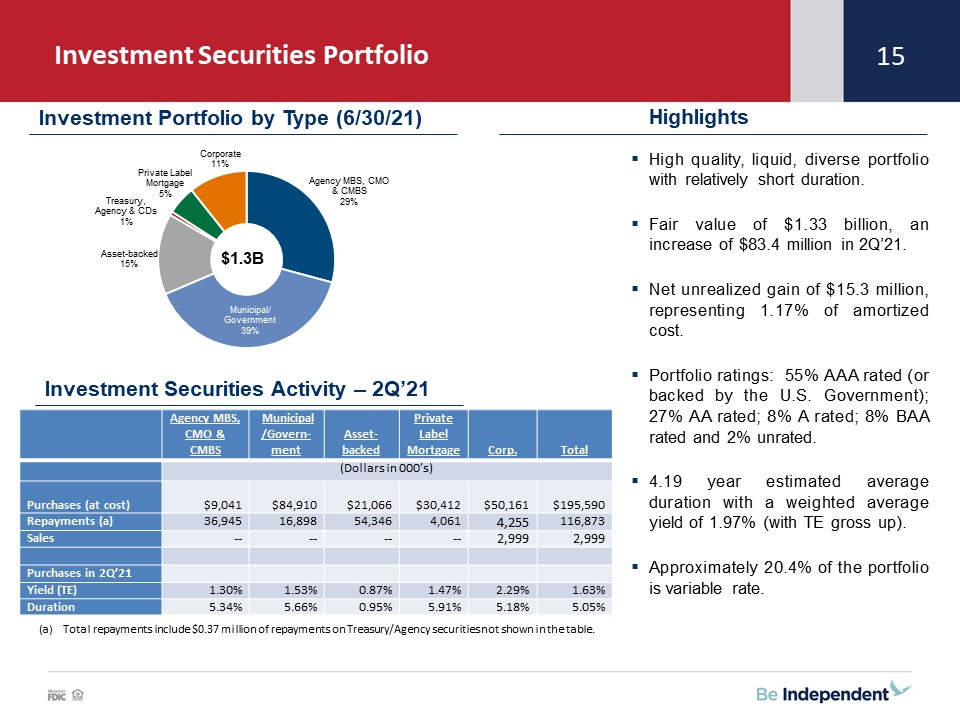
Investment Securities Portfolio 15 Highlights High quality, liquid, diverse portfolio with relatively
short duration.Fair value of $1.33 billion, an increase of $83.4 million in 2Q’21.Net unrealized gain of $15.3 million, representing 1.17% of amortized cost.Portfolio ratings: 55% AAA rated (or backed by the U.S. Government); 27% AA rated; 8% A
rated; 8% BAA rated and 2% unrated.4.19 year estimated average duration with a weighted average yield of 1.97% (with TE gross up).Approximately 20.4% of the portfolio is variable rate. $1.3B Investment Portfolio by Type
(6/30/21) Investment Securities Activity – 2Q’21 Total repayments include $0.37 million of repayments on Treasury/Agency securities not shown in the table. Agency MBS, CMO & CMBS Municipal/Govern-ment Asset-backed Private Label
Mortgage Corp. Total (Dollars in 000’s) Purchases (at cost) $9,041 $84,910 $21,066 $30,412 $50,161 $195,590 Repayments
(a) 36,945 16,898 54,346 4,061 4,255 116,873 Sales -- -- -- -- 2,999 2,999 Purchases in 2Q’21 Yield (TE) 1.30% 1.53% 0.87% 1.47% 2.29% 1.63% Duration 5.34% 5.66% 0.95% 5.91% 5.18% 5.05%
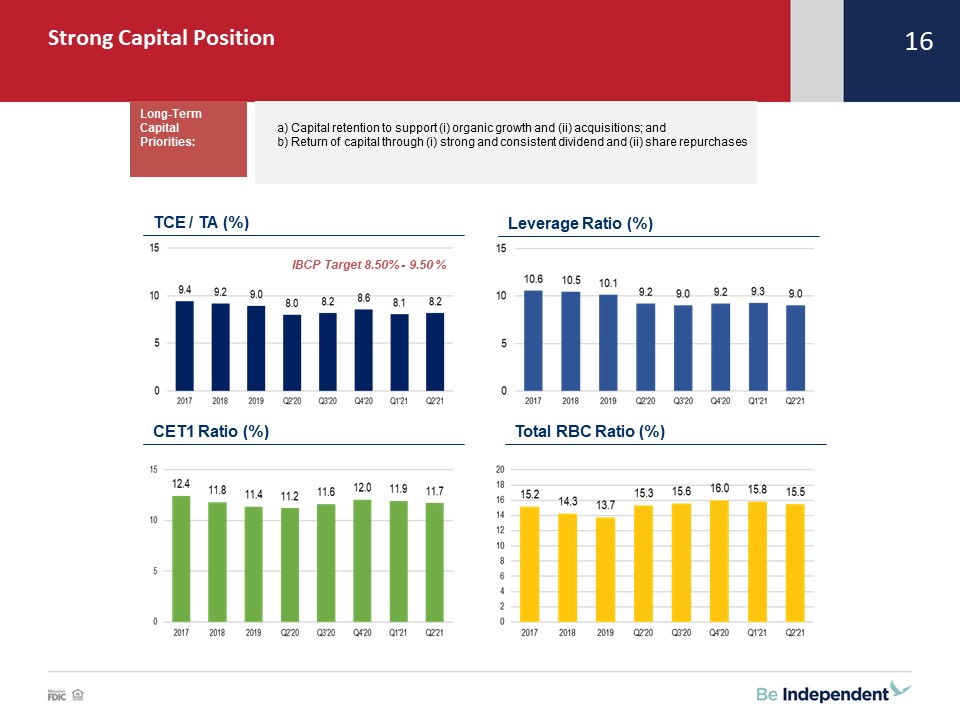
Strong Capital Position 16 TCE / TA (%) Leverage Ratio (%) CET1 Ratio (%) Total RBC Ratio (%)
IBCP Target 8.50% - 9.50 % Capital retention to support (i) organic growth and (ii) acquisitions; and Return of capital through (i) strong and consistent dividend and (ii) share repurchases Long-Term Capital Priorities: Strong Capital
Position
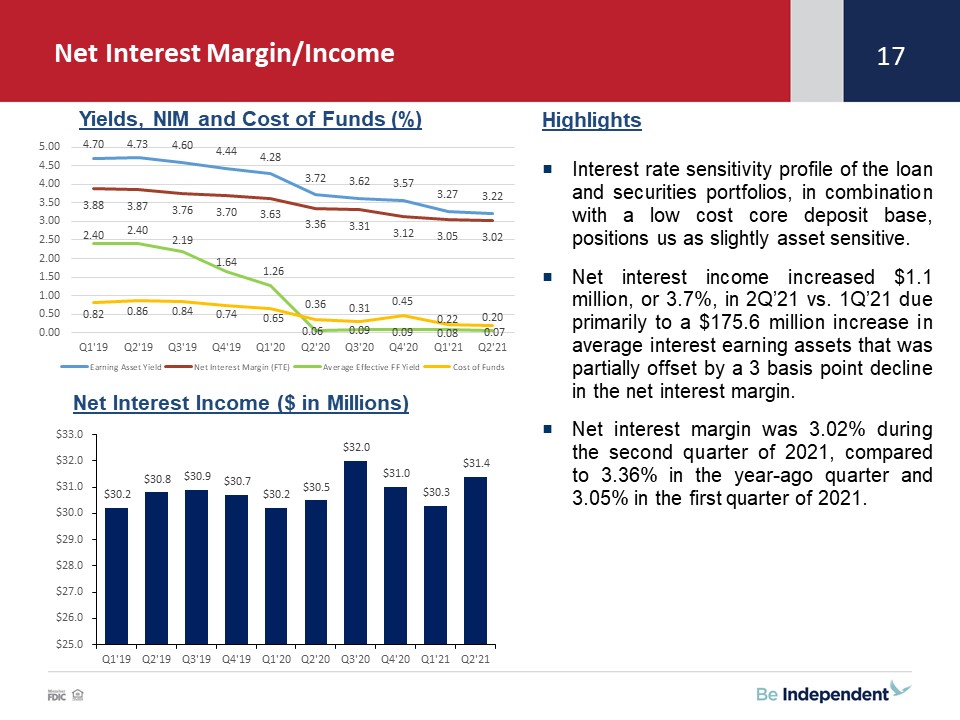
HighlightsInterest rate sensitivity profile of the loan and securities portfolios, in combination with a
low cost core deposit base, positions us as slightly asset sensitive.Net interest income increased $1.1 million, or 3.7%, in 2Q’21 vs. 1Q’21 due primarily to a $175.6 million increase in average interest earning assets that was partially offset
by a 3 basis point decline in the net interest margin. Net interest margin was 3.02% during the second quarter of 2021, compared to 3.36% in the year-ago quarter and 3.05% in the first quarter of 2021. Yields, NIM and Cost of Funds (%) Net
Interest Income ($ in Millions) Net Interest Margin/Income 17
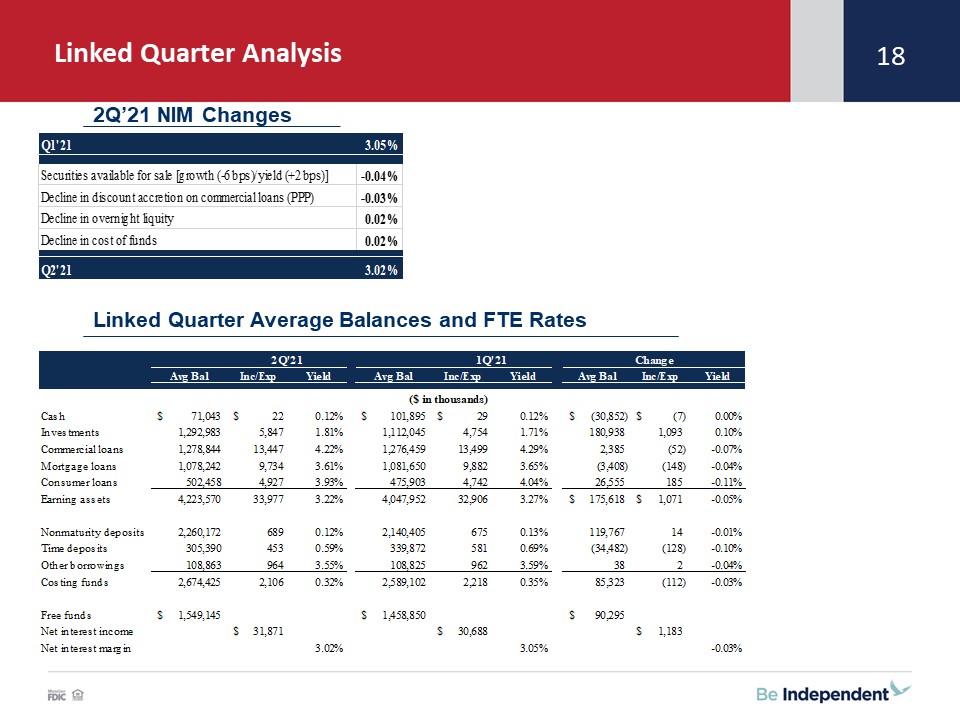
Linked Quarter Analysis 18 2Q’21 NIM Changes Linked Quarter Average Balances and FTE Rates
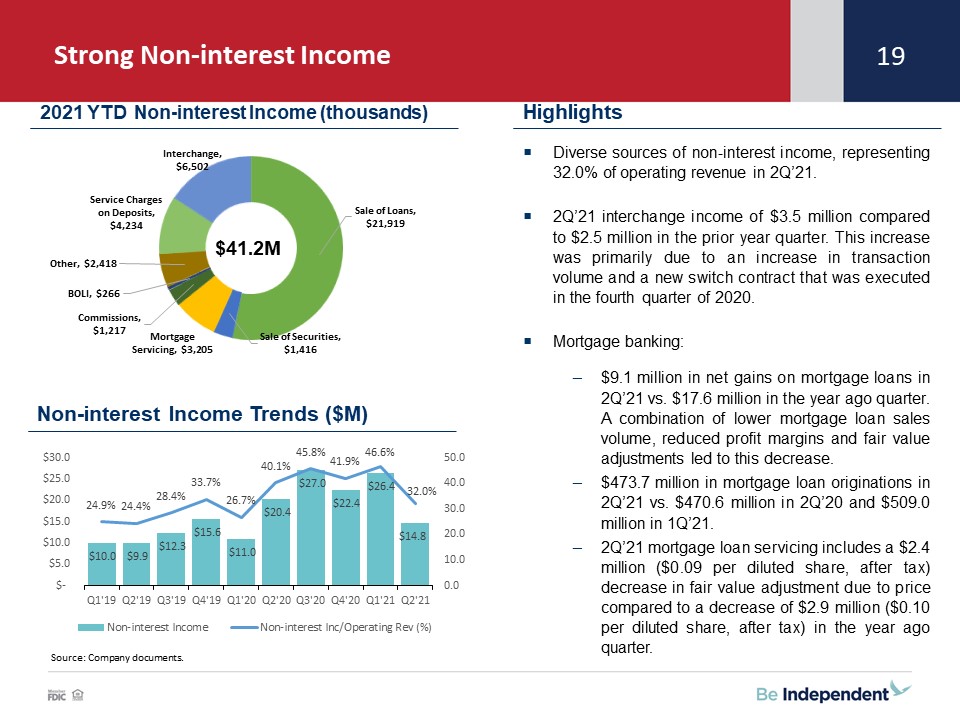
Strong Non-interest Income 19 Diverse sources of non-interest income, representing 32.0% of operating
revenue in 2Q’21.2Q’21 interchange income of $3.5 million compared to $2.5 million in the prior year quarter. This increase was primarily due to an increase in transaction volume and a new switch contract that was executed in the fourth quarter
of 2020. Mortgage banking: $9.1 million in net gains on mortgage loans in 2Q’21 vs. $17.6 million in the year ago quarter. A combination of lower mortgage loan sales volume, reduced profit margins and fair value adjustments led to this
decrease.$473.7 million in mortgage loan originations in 2Q’21 vs. $470.6 million in 2Q’20 and $509.0 million in 1Q’21.2Q’21 mortgage loan servicing includes a $2.4 million ($0.09 per diluted share, after tax) decrease in fair value adjustment
due to price compared to a decrease of $2.9 million ($0.10 per diluted share, after tax) in the year ago quarter. Source: Company documents. $41.2M 2021 YTD Non-interest Income (thousands) Non-interest Income Trends ($M) Highlights
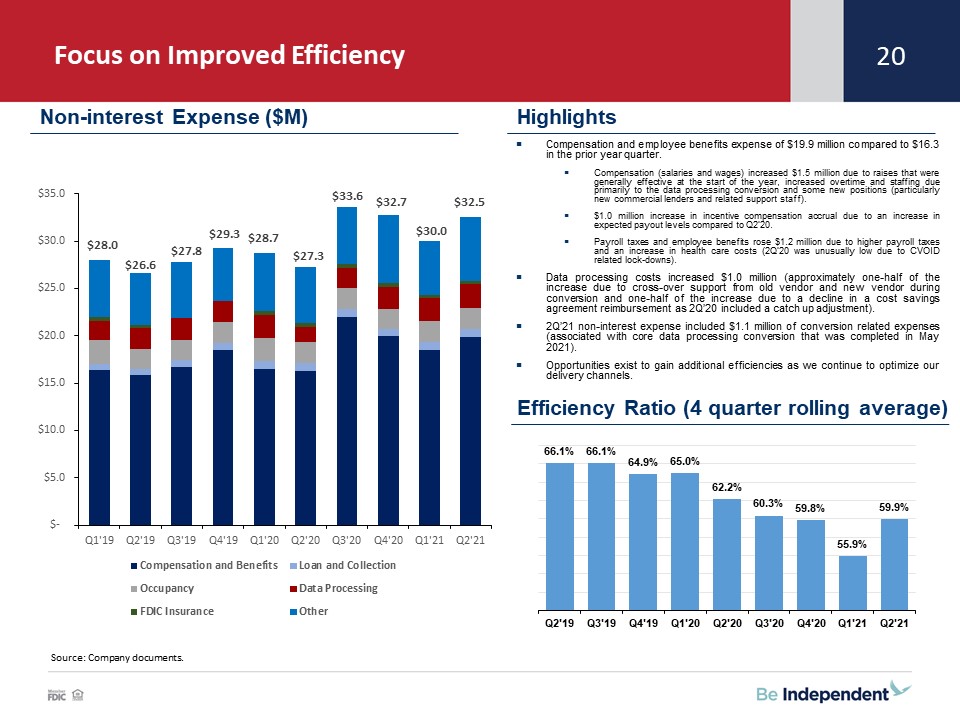
Focus on Improved Efficiency 20 Source: Company documents. Non-interest Expense ($M) Highlights
Efficiency Ratio (4 quarter rolling average) Compensation and employee benefits expense of $19.9 million compared to $16.3 in the prior year quarter. Compensation (salaries and wages) increased $1.5 million due to raises that were generally
effective at the start of the year, increased overtime and staffing due primarily to the data processing conversion and some new positions (particularly new commercial lenders and related support staff). $1.0 million increase in incentive
compensation accrual due to an increase in expected payout levels compared to Q2’20. Payroll taxes and employee benefits rose $1.2 million due to higher payroll taxes and an increase in health care costs (2Q’20 was unusually low due to CVOID
related lock-downs). Data processing costs increased $1.0 million (approximately one-half of the increase due to cross-over support from old vendor and new vendor during conversion and one-half of the increase due to a decline in a cost savings
agreement reimbursement as 2Q’20 included a catch up adjustment).2Q’21 non-interest expense included $1.1 million of conversion related expenses (associated with core data processing conversion that was completed in May 2021).Opportunities
exist to gain additional efficiencies as we continue to optimize our delivery channels.
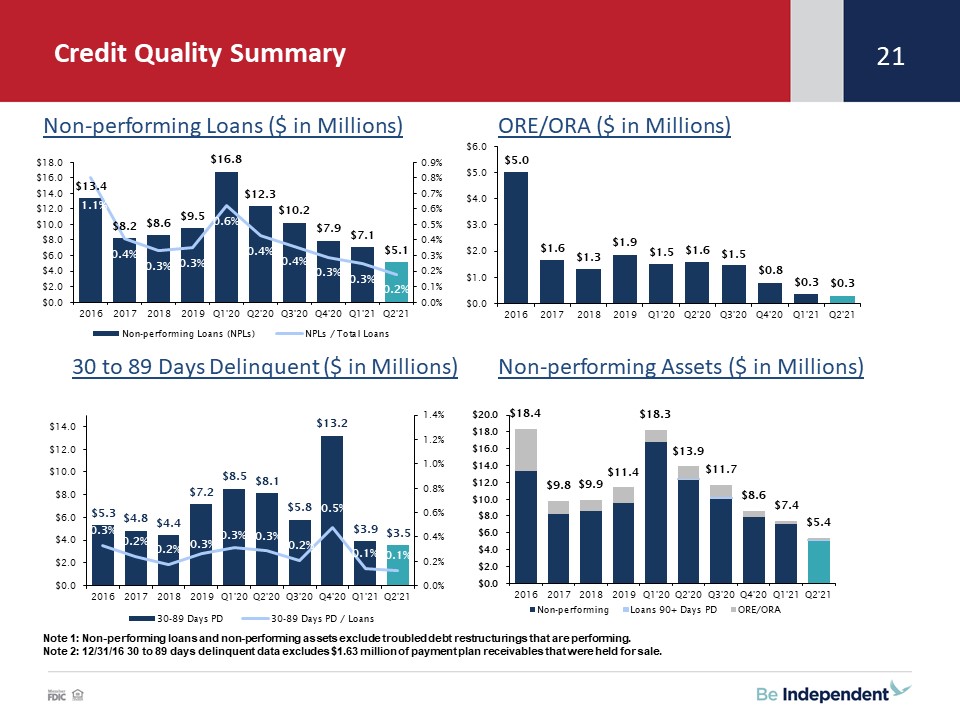
Credit Quality Summary Note 1: Non-performing loans and non-performing assets exclude troubled debt
restructurings that are performing.Note 2: 12/31/16 30 to 89 days delinquent data excludes $1.63 million of payment plan receivables that were held for sale. Non-performing Assets ($ in Millions) ORE/ORA ($ in Millions) Non-performing Loans
($ in Millions) 30 to 89 Days Delinquent ($ in Millions) 21
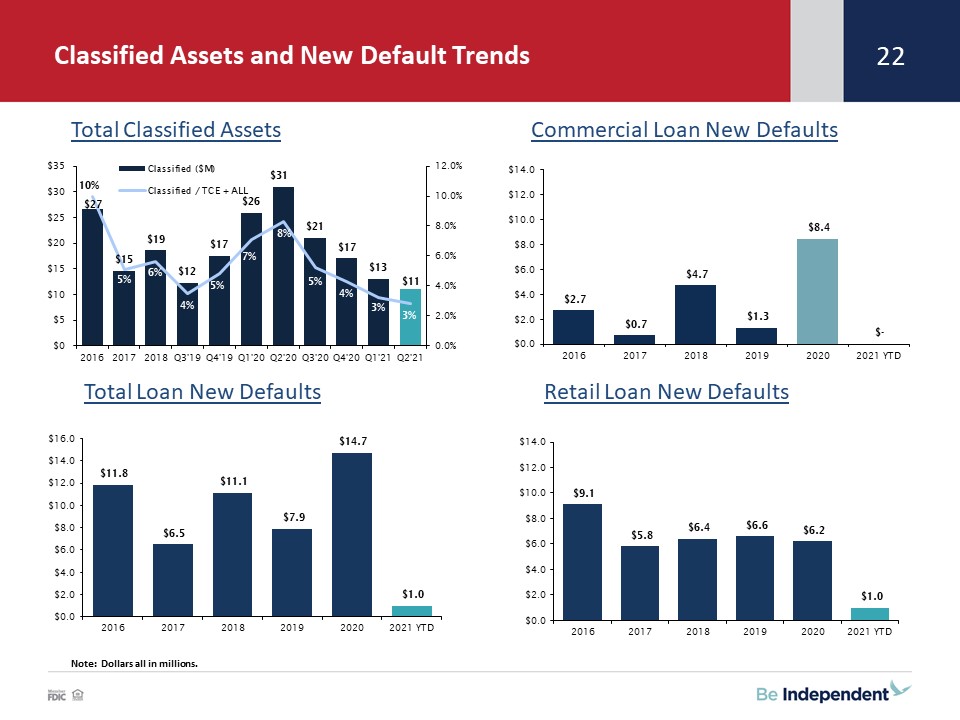
Classified Assets and New Default Trends Note: Dollars all in millions. Total Classified
Assets Commercial Loan New Defaults Total Loan New Defaults Retail Loan New Defaults 22
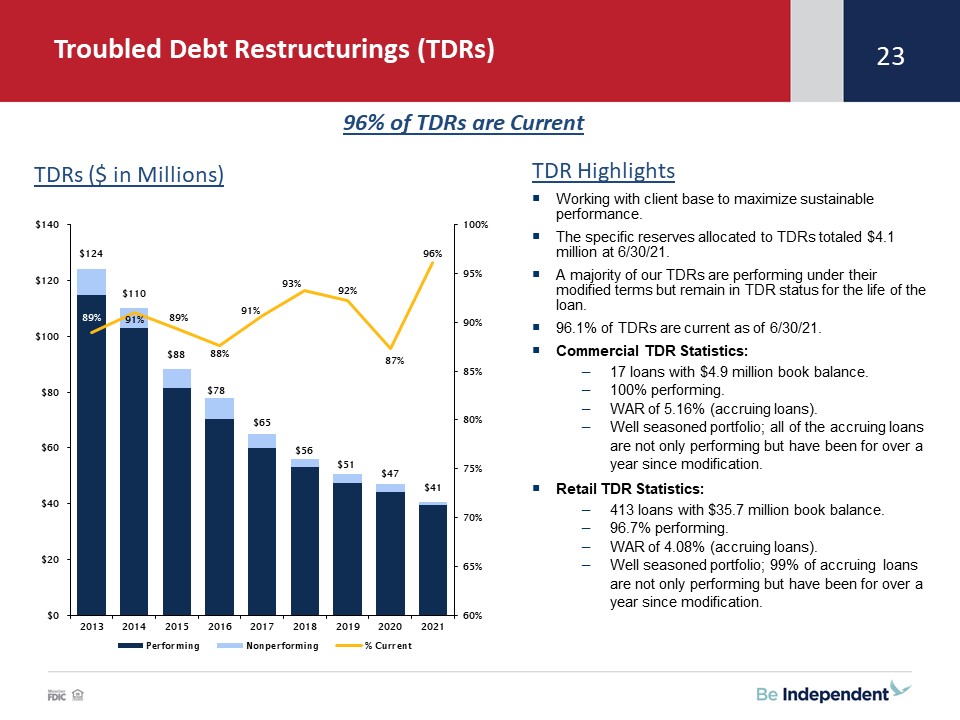
Troubled Debt Restructurings (TDRs) TDR HighlightsWorking with client base to maximize sustainable
performance.The specific reserves allocated to TDRs totaled $4.1 million at 6/30/21.A majority of our TDRs are performing under their modified terms but remain in TDR status for the life of the loan.96.1% of TDRs are current as of
6/30/21.Commercial TDR Statistics:17 loans with $4.9 million book balance.100% performing.WAR of 5.16% (accruing loans).Well seasoned portfolio; all of the accruing loans are not only performing but have been for over a year since
modification.Retail TDR Statistics:413 loans with $35.7 million book balance.96.7% performing.WAR of 4.08% (accruing loans).Well seasoned portfolio; 99% of accruing loans are not only performing but have been for over a year since
modification. TDRs ($ in Millions) 96% of TDRs are Current 23
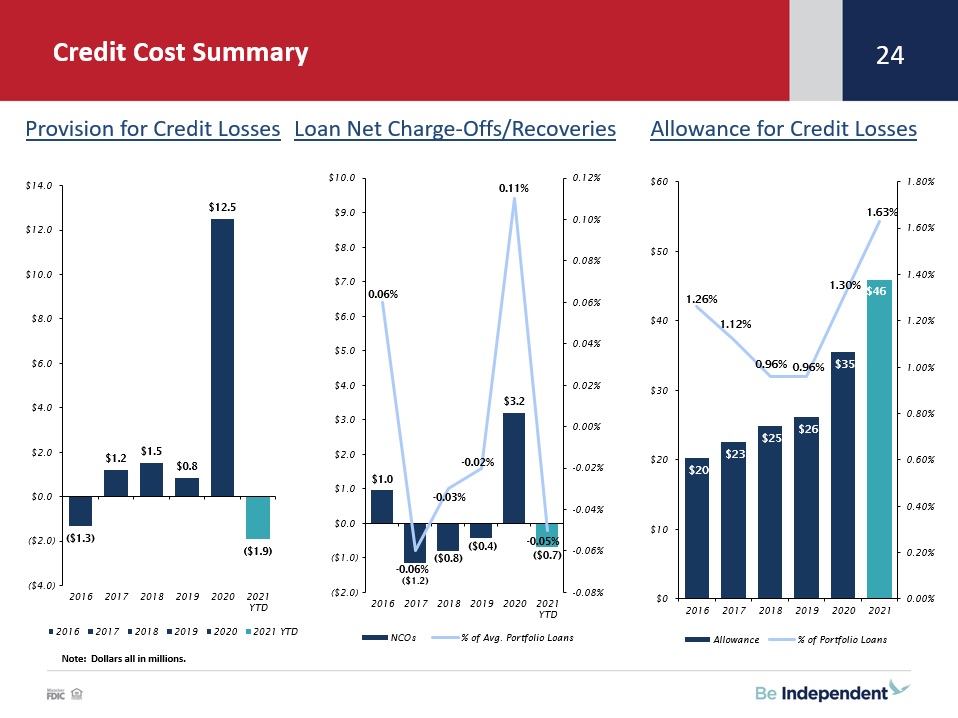
Note: Dollars all in millions. Provision for Credit Losses Loan Net Charge-Offs/Recoveries
Allowance for Credit Losses Credit Cost Summary 24
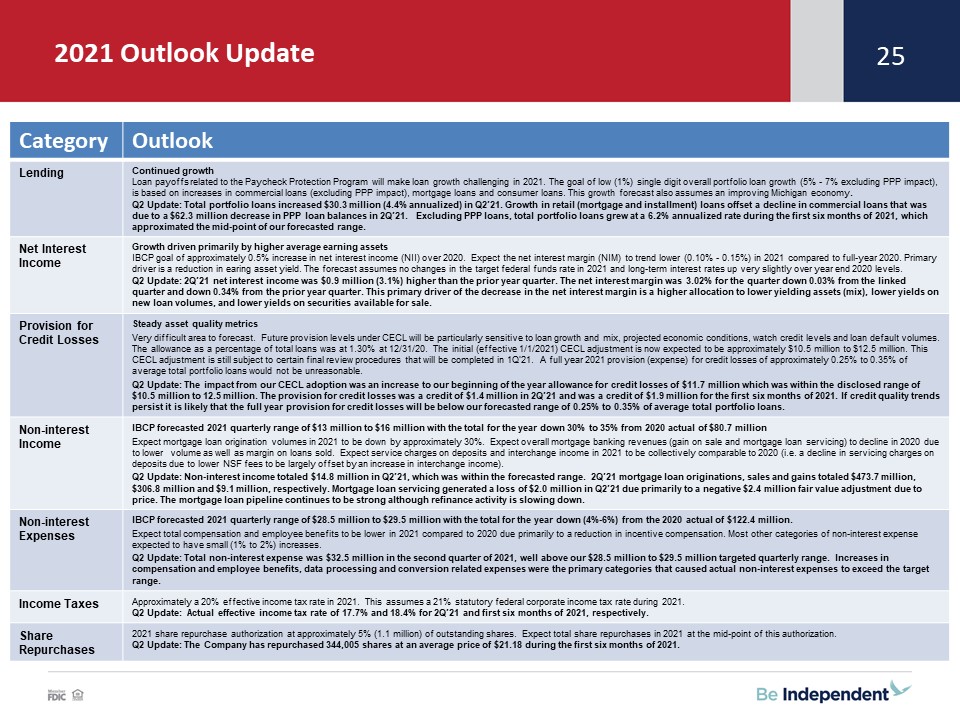
2021 Outlook Update Category Outlook Lending Continued growthLoan payoffs related to the Paycheck
Protection Program will make loan growth challenging in 2021. The goal of low (1%) single digit overall portfolio loan growth (5% - 7% excluding PPP impact), is based on increases in commercial loans (excluding PPP impact), mortgage loans and
consumer loans. This growth forecast also assumes an improving Michigan economy.Q2 Update: Total portfolio loans increased $30.3 million (4.4% annualized) in Q2’21. Growth in retail (mortgage and installment) loans offset a decline in
commercial loans that was due to a $62.3 million decrease in PPP loan balances in 2Q’21. Excluding PPP loans, total portfolio loans grew at a 6.2% annualized rate during the first six months of 2021, which approximated the mid-point of our
forecasted range. Net Interest Income Growth driven primarily by higher average earning assetsIBCP goal of approximately 0.5% increase in net interest income (NII) over 2020. Expect the net interest margin (NIM) to trend lower (0.10% - 0.15%)
in 2021 compared to full-year 2020. Primary driver is a reduction in earing asset yield. The forecast assumes no changes in the target federal funds rate in 2021 and long-term interest rates up very slightly over year end 2020 levels. Q2
Update: 2Q’21 net interest income was $0.9 million (3.1%) higher than the prior year quarter. The net interest margin was 3.02% for the quarter down 0.03% from the linked quarter and down 0.34% from the prior year quarter. This primary driver
of the decrease in the net interest margin is a higher allocation to lower yielding assets (mix), lower yields on new loan volumes, and lower yields on securities available for sale. Provision for Credit Losses Steady asset quality
metricsVery difficult area to forecast. Future provision levels under CECL will be particularly sensitive to loan growth and mix, projected economic conditions, watch credit levels and loan default volumes. The allowance as a percentage of
total loans was at 1.30% at 12/31/20. The initial (effective 1/1/2021) CECL adjustment is now expected to be approximately $10.5 million to $12.5 million. This CECL adjustment is still subject to certain final review procedures that will be
completed in 1Q’21. A full year 2021 provision (expense) for credit losses of approximately 0.25% to 0.35% of average total portfolio loans would not be unreasonable.Q2 Update: The impact from our CECL adoption was an increase to our beginning
of the year allowance for credit losses of $11.7 million which was within the disclosed range of $10.5 million to 12.5 million. The provision for credit losses was a credit of $1.4 million in 2Q’21 and was a credit of $1.9 million for the first
six months of 2021. If credit quality trends persist it is likely that the full year provision for credit losses will be below our forecasted range of 0.25% to 0.35% of average total portfolio loans. Non-interest Income IBCP forecasted 2021
quarterly range of $13 million to $16 million with the total for the year down 30% to 35% from 2020 actual of $80.7 millionExpect mortgage loan origination volumes in 2021 to be down by approximately 30%. Expect overall mortgage banking
revenues (gain on sale and mortgage loan servicing) to decline in 2020 due to lower volume as well as margin on loans sold. Expect service charges on deposits and interchange income in 2021 to be collectively comparable to 2020 (i.e. a decline
in servicing charges on deposits due to lower NSF fees to be largely offset by an increase in interchange income). Q2 Update: Non-interest income totaled $14.8 million in Q2’21, which was within the forecasted range. 2Q’21 mortgage loan
originations, sales and gains totaled $473.7 million, $306.8 million and $9.1 million, respectively. Mortgage loan servicing generated a loss of $2.0 million in Q2’21 due primarily to a negative $2.4 million fair value adjustment due to price.
The mortgage loan pipeline continues to be strong although refinance activity is slowing down. Non-interest Expenses IBCP forecasted 2021 quarterly range of $28.5 million to $29.5 million with the total for the year down (4%-6%) from the
2020 actual of $122.4 million.Expect total compensation and employee benefits to be lower in 2021 compared to 2020 due primarily to a reduction in incentive compensation. Most other categories of non-interest expense expected to have small (1%
to 2%) increases.Q2 Update: Total non-interest expense was $32.5 million in the second quarter of 2021, well above our $28.5 million to $29.5 million targeted quarterly range. Increases in compensation and employee benefits, data processing and
conversion related expenses were the primary categories that caused actual non-interest expenses to exceed the target range. Income Taxes Approximately a 20% effective income tax rate in 2021. This assumes a 21% statutory federal corporate
income tax rate during 2021. Q2 Update: Actual effective income tax rate of 17.7% and 18.4% for 2Q’21 and first six months of 2021, respectively. Share Repurchases 2021 share repurchase authorization at approximately 5% (1.1 million) of
outstanding shares. Expect total share repurchases in 2021 at the mid-point of this authorization.Q2 Update: The Company has repurchased 344,005 shares at an average price of $21.18 during the first six months of 2021. 25
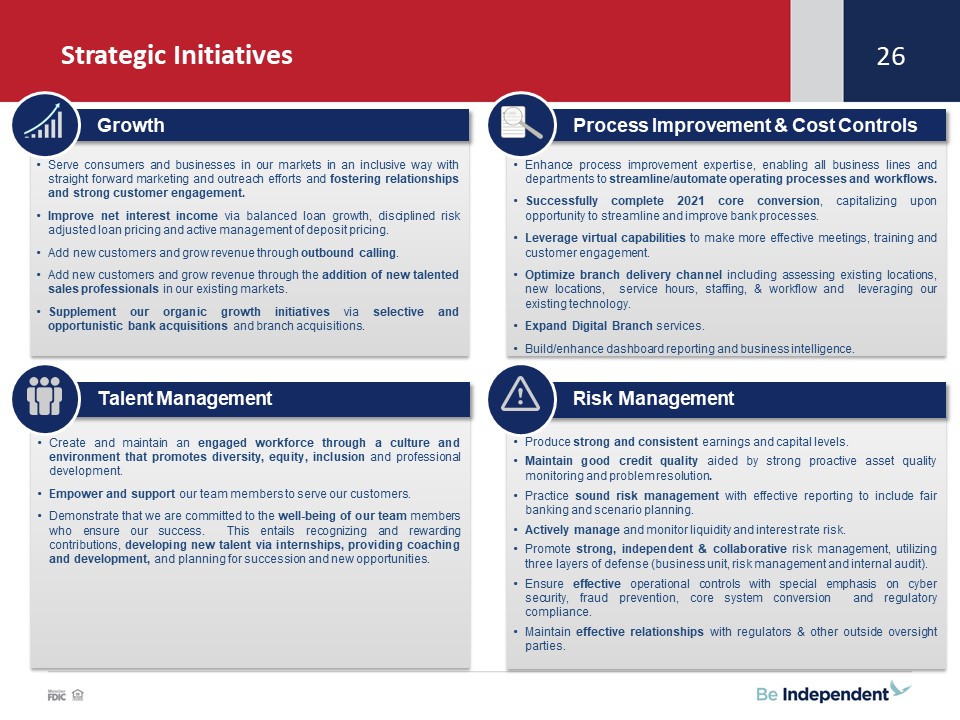
Strategic Initiatives 26 Serve consumers and businesses in our markets in an inclusive way with
straight forward marketing and outreach efforts and fostering relationships and strong customer engagement.Improve net interest income via balanced loan growth, disciplined risk adjusted loan pricing and active management of deposit pricing.
Add new customers and grow revenue through outbound calling.Add new customers and grow revenue through the addition of new talented sales professionals in our existing markets. Supplement our organic growth initiatives via selective and
opportunistic bank acquisitions and branch acquisitions. Growth Enhance process improvement expertise, enabling all business lines and departments to streamline/automate operating processes and workflows.Successfully complete 2021 core
conversion, capitalizing upon opportunity to streamline and improve bank processes.Leverage virtual capabilities to make more effective meetings, training and customer engagement.Optimize branch delivery channel including assessing existing
locations, new locations, service hours, staffing, & workflow and leveraging our existing technology. Expand Digital Branch services.Build/enhance dashboard reporting and business intelligence. Process Improvement & Cost
Controls Create and maintain an engaged workforce through a culture and environment that promotes diversity, equity, inclusion and professional development. Empower and support our team members to serve our customers. Demonstrate that we
are committed to the well-being of our team members who ensure our success. This entails recognizing and rewarding contributions, developing new talent via internships, providing coaching and development, and planning for succession and new
opportunities. Talent Management Produce strong and consistent earnings and capital levels. Maintain good credit quality aided by strong proactive asset quality monitoring and problem resolution.Practice sound risk management with
effective reporting to include fair banking and scenario planning.Actively manage and monitor liquidity and interest rate risk.Promote strong, independent & collaborative risk management, utilizing three layers of defense (business unit,
risk management and internal audit). Ensure effective operational controls with special emphasis on cyber security, fraud prevention, core system conversion and regulatory compliance.Maintain effective relationships with regulators & other
outside oversight parties. Risk Management

Q&A and Closing Remarks Question and Answer SessionClosing RemarksThank you for attending!NASDAQ:
IBCP 27