Attached files
| file | filename |
|---|---|
| EX-99.1 - EX-99.1 - CapStar Financial Holdings, Inc. | cstr-20210722ex99_1.htm |
| 8-K - 8-K - CapStar Financial Holdings, Inc. | cstr-20210722.htm |

Second Quarter 2021 Earnings Call July 23, 2021 Exhibit 99.2
FORWARD-LOOKING STATEMENTS This investor presentation contains forward-looking statements, as defined by federal securities laws, including statements about CapStar Financial Holdings, Inc. (“CapStar”) and its financial outlook and business environment. All statements, other than statements of historical fact, included in this release and any oral statements made regarding the subject of this release, including in the conference call referenced herein, that address activities, events or developments that the Company expects, believes or anticipates will or may occur in the future are “forward-looking statements“ within the meaning of Section 27A of the Securities Act of 1933, as amended, and Section 21E of the Securities Exchange Act of 1934, as amended, and are made pursuant to the safe harbor provisions of the Private Securities Litigation Reform Act of 1955. The words “expect“, “anticipate”, “intend”, “may”, “should”, “plan”, “believe”, “seek“, “estimate“ and similar expressions are intended to identify such forward-looking statements, but other statements not based on historical information may also be considered forward-looking statements. These forward-looking statements are subject to known and unknown risks, uncertainties and other factors that could cause the actual results to differ materially from the statements, including, but not limited to: (I) deterioration in the financial condition of borrowers of the Company and its subsidiaries, resulting in significant increases in loan losses and provisions for those losses; (II) the effects of the emergence of widespread health emergencies or pandemics, including the magnitude and duration of the Covid-19 pandemic and its impact on general economic and financial market conditions and on the Company’s customer’s business, results of operations, asset quality and financial condition; (III) the ability to grow and retain low-cost, core deposits and retain large, uninsured deposits, including during times when the Company is seeking to lower rates it pays on deposits; (IV) the impact of competition with other financial institutions, including pricing pressures and the resulting impact on the Company’s results, including as a result of compression to net interest margin; (V) fluctuations or differences in interest rates on loans or deposits from those that the Company is modeling or anticipating, including as a result of the Company’s inability to better match deposit rates with the changes in the short term rate environment, or that affect the yield curve; (VI) difficulties and delays in integrating required businesses or fully realizing cost savings or other benefits from acquisitions; (VII) the Company‘s ability to profitably grow its business and successfully execute on its business plans; (VIII) any matter that would cause the Company to conclude that there was impairment of any asset, including goodwill or other intangible assets; (IX) the vulnerability of the Company’s network and online banking portals, and the systems of customers or parties with whom the Company contracts, to unauthorized access, computer viruses, phishing schemes, spam attacks, human error, natural disasters, power loss and other security breaches; (X) the availability of and access to capital; (XI) adverse results (including costs, fines, reputational harm, inability to obtain necessary approvals, and/or other negative affects) from current or future litigation, regulatory examinations or other legal and/or regulatory actions, including as a result of the Company’s participation in and execution of government programs related to the Covid-19 pandemic; and (XII) general competitive, economic, political and market conditions. Additional factors which could affect the forward-looking statements can be found in the Company’s Annual Report on Form 10-K, Quarterly Reports on Form 10-Q, and Current Reports on Form 8-K, filed with the SEC. The Company disclaims any obligation to update or revise any forward-looking statements contained in this press release (we speak only as of the date hereof ), whether as a result of new information, future events, or otherwise. NON-GAAP MEASURES This investor presentation includes financial information determined by methods other than in accordance with generally accepted accounting principles (“GAAP”). This financial information includes certain operating performance measures, which exclude merger-related and other charges that are not considered part of recurring operations. Such measures include: “Efficiency ratio – operating,” “Expenses – operating,” “Earnings per share – operating,” “Diluted earnings per share – operating,” “Tangible book value per share,” “Return on common equity – operating,” “Return on tangible common equity – operating,” “Return on assets – operating,” and “Tangible common equity to tangible assets.” Management has included these non-GAAP measures because it believes these measures may provide useful supplemental information for evaluating CapStar’s underlying performance trends. Further, management uses these measures in managing and evaluating CapStar’s business and intends to refer to them in discussions about our operations and performance. Operating performance measures should be viewed in addition to, and not as an alternative to or substitute for, measures determined in accordance with GAAP, and are not necessarily comparable to non-GAAP measures that may be presented by other companies. To the extent applicable, reconciliations of these non-GAAP measures to the most directly comparable GAAP measures can be found in the ‘Non-GAAP Reconciliation Tables’ included in the exhibits to this presentation. Disclosures
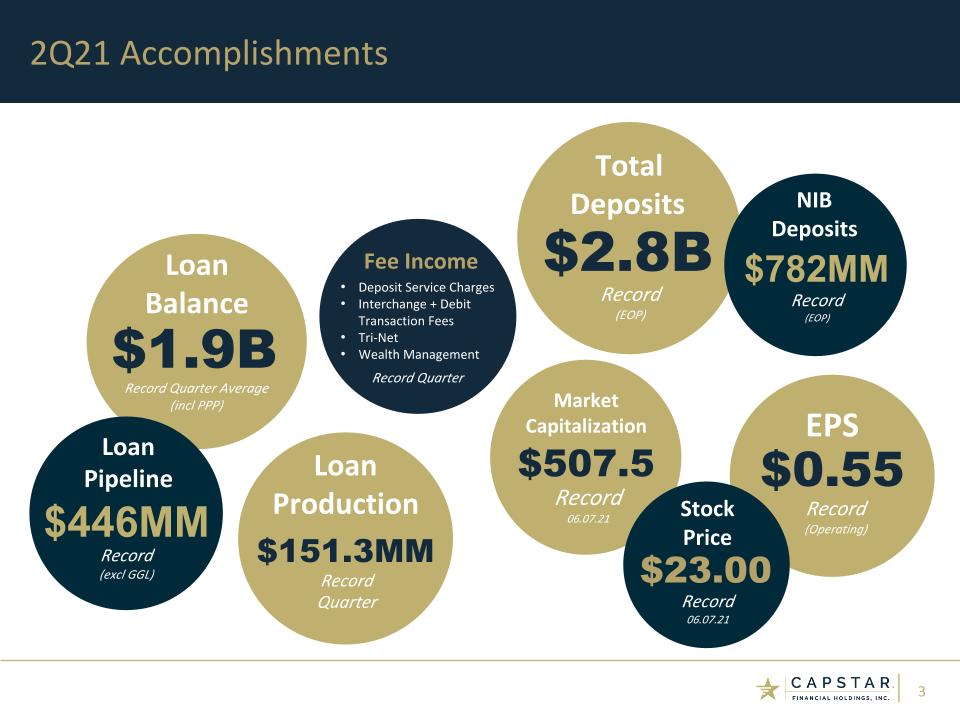
$507.5 Market Capitalization Record 06.07.21 2Q21 Accomplishments $1.9B Loan Balance Record Quarter Average (incl PPP) $0.55 EPS Record (Operating) $2.8B Total Deposits Record (EOP) $151.3MM Loan Production Record Quarter $782MM NIB Deposits Record (EOP) $446MM Loan Pipeline Record (excl GGL) $23.00 Stock Price Record 06.07.21 Deposit Service Charges Interchange + Debit Transaction Fees Tri-Net Wealth Management Fee Income Record Quarter
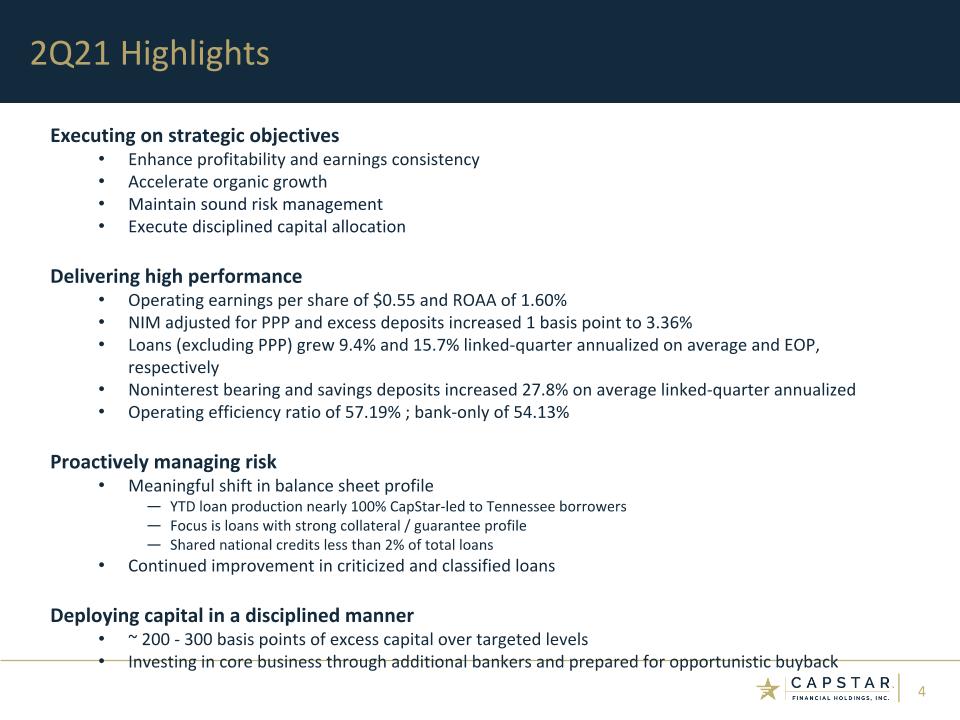
Executing on strategic objectives Enhance profitability and earnings consistency Accelerate organic growth Maintain sound risk management Execute disciplined capital allocation Delivering high performance Operating earnings per share of $0.55 and ROAA of 1.60% NIM adjusted for PPP and excess deposits increased 1 basis point to 3.36% Loans (excluding PPP) grew 9.4% and 15.7% linked-quarter annualized on average and EOP, respectively Noninterest bearing and savings deposits increased 27.8% on average linked-quarter annualized Operating efficiency ratio of 57.19% ; bank-only of 54.13% Proactively managing risk Meaningful shift in balance sheet profile YTD loan production nearly 100% CapStar-led to Tennessee borrowers Focus is loans with strong collateral / guarantee profile Shared national credits less than 2% of total loans Continued improvement in criticized and classified loans Deploying capital in a disciplined manner ~ 200 - 300 basis points of excess capital over targeted levels Investing in core business through additional bankers and prepared for opportunistic buyback 2Q21 Highlights
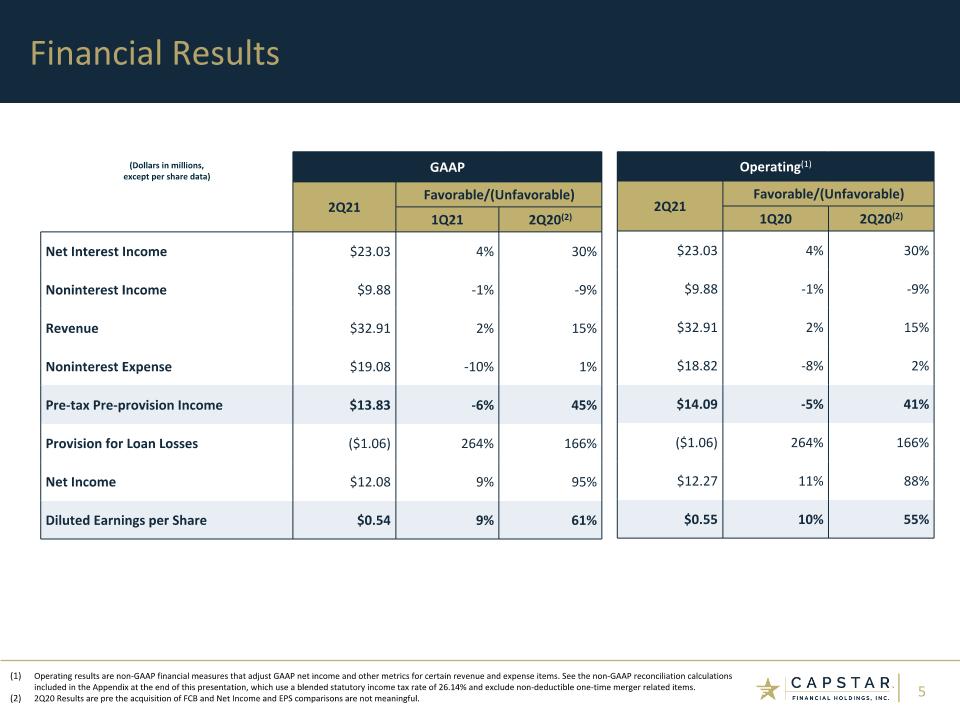
Financial Results (Dollars in millions, except per share data) GAAP 2Q21 Favorable/(Unfavorable) 1Q21 2Q20(2) Net Interest Income $23.03 4% 30% Noninterest Income $9.88 -1% -9% Revenue $32.91 2% 15% Noninterest Expense $19.08 -10% 1% Pre-tax Pre-provision Income $13.83 -6% 45% Provision for Loan Losses ($1.06) 264% 166% Net Income $12.08 9% 95% Diluted Earnings per Share $0.54 9% 61% Operating(1) 2Q21 Favorable/(Unfavorable) 1Q20 2Q20(2) $23.03 4% 30% $9.88 -1% -9% $32.91 2% 15% $18.82 -8% 2% $14.09 -5% 41% ($1.06) 264% 166% $12.27 11% 88% $0.55 10% 55% Operating results are non-GAAP financial measures that adjust GAAP net income and other metrics for certain revenue and expense items. See the non-GAAP reconciliation calculations included in the Appendix at the end of this presentation, which use a blended statutory income tax rate of 26.14% and exclude non-deductible one-time merger related items. 2Q20 Results are pre the acquisition of FCB and Net Income and EPS comparisons are not meaningful.
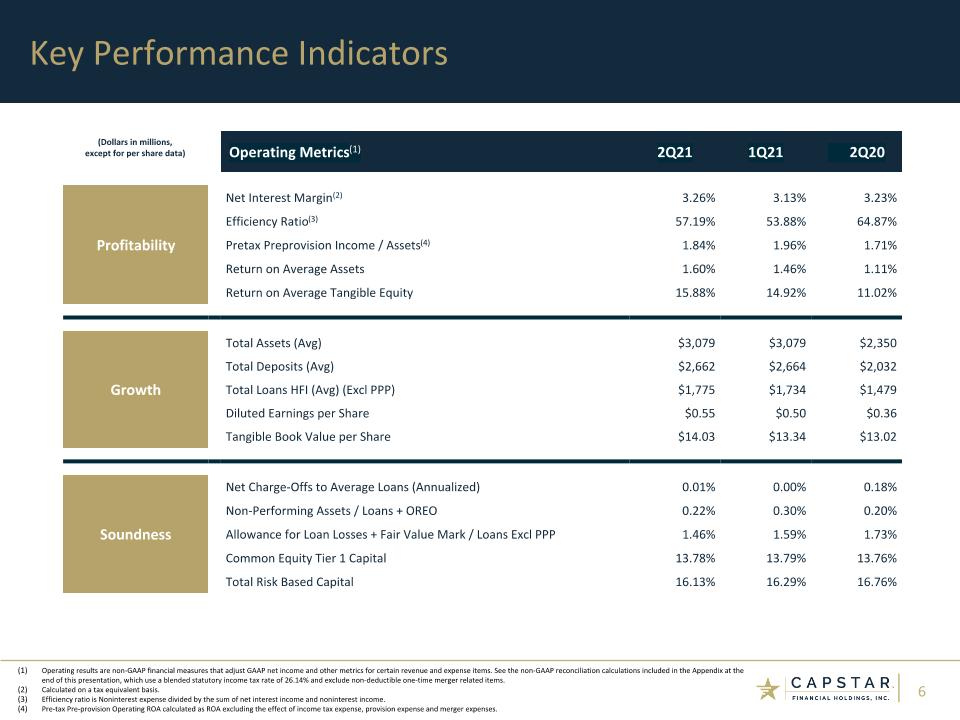
Operating Metrics(1) 2Q21 1Q21 2Q20 Profitability Net Interest Margin(2) 3.26% 3.13% 3.23% Efficiency Ratio(3) 57.19% 53.88% 64.87% Pretax Preprovision Income / Assets(4) 1.84% 1.96% 1.71% Return on Average Assets 1.60% 1.46% 1.11% Return on Average Tangible Equity 15.88% 14.92% 11.02% Growth Total Assets (Avg) $3,079 $3,079 $2,350 Growth Total Deposits (Avg) $2,662 $2,664 $2,032 Total Loans HFI (Avg) (Excl PPP) $1,775 $1,734 $1,479 Diluted Earnings per Share $0.55 $0.50 $0.36 Tangible Book Value per Share $14.03 $13.34 $13.02 Soundness Net Charge-Offs to Average Loans (Annualized) 0.01% 0.00% 0.18% Non-Performing Assets / Loans + OREO 0.22% 0.30% 0.20% Allowance for Loan Losses + Fair Value Mark / Loans Excl PPP 1.46% 1.59% 1.73% Common Equity Tier 1 Capital 13.78% 13.79% 13.76% Total Risk Based Capital 16.13% 16.29% 16.76% Key Performance Indicators Operating results are non-GAAP financial measures that adjust GAAP net income and other metrics for certain revenue and expense items. See the non-GAAP reconciliation calculations included in the Appendix at the end of this presentation, which use a blended statutory income tax rate of 26.14% and exclude non-deductible one-time merger related items. Calculated on a tax equivalent basis. Efficiency ratio is Noninterest expense divided by the sum of net interest income and noninterest income. Pre-tax Pre-provision Operating ROA calculated as ROA excluding the effect of income tax expense, provision expense and merger expenses. (Dollars in millions, except for per share data)

Financial Detail
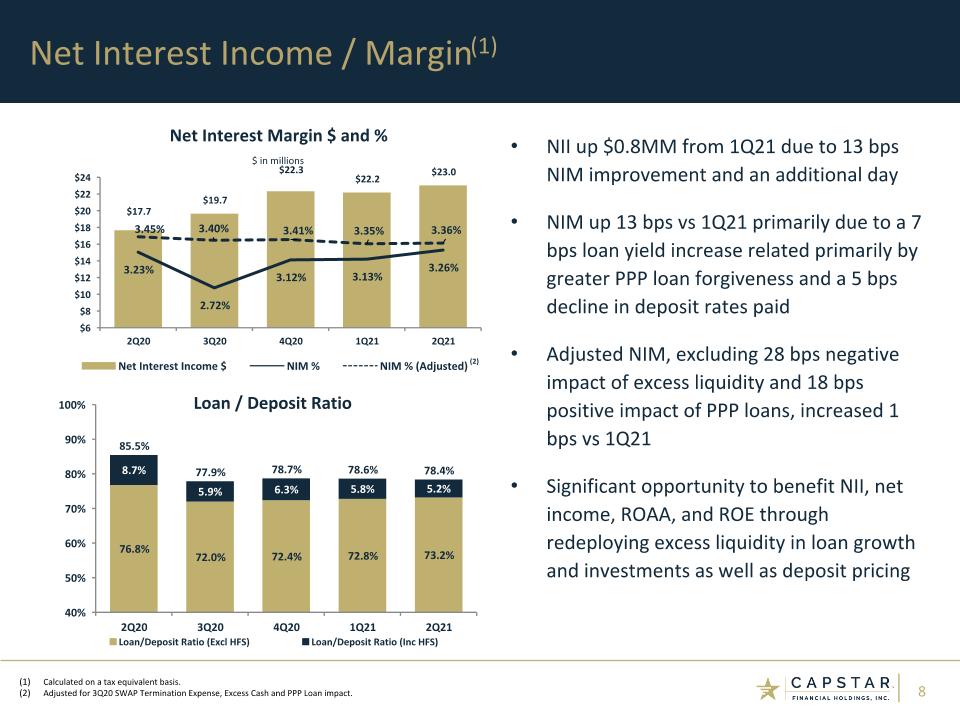
Net Interest Income / Margin(1) NII up $0.8MM from 1Q21 due to 13 bps NIM improvement and an additional day NIM up 13 bps vs 1Q21 primarily due to a 7 bps loan yield increase related primarily by greater PPP loan forgiveness and a 5 bps decline in deposit rates paid Adjusted NIM, excluding 28 bps negative impact of excess liquidity and 18 bps positive impact of PPP loans, increased 1 bps vs 1Q21 Significant opportunity to benefit NII, net income, ROAA, and ROE through redeploying excess liquidity in loan growth and investments as well as deposit pricing Calculated on a tax equivalent basis. Adjusted for 3Q20 SWAP Termination Expense, Excess Cash and PPP Loan impact. (2)
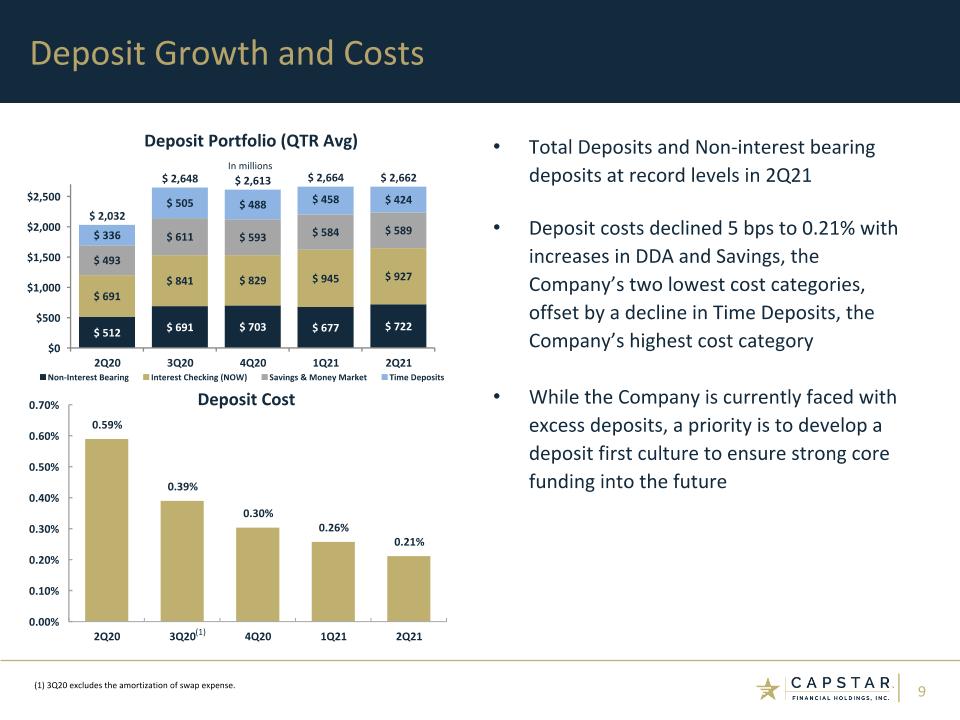
Deposit Growth and Costs Total Deposits and Non-interest bearing deposits at record levels in 2Q21 Deposit costs declined 5 bps to 0.21% with increases in DDA and Savings, the Company’s two lowest cost categories, offset by a decline in Time Deposits, the Company’s highest cost category While the Company is currently faced with excess deposits, a priority is to develop a deposit first culture to ensure strong core funding into the future (1) 3Q20 excludes the amortization of swap expense. (1)
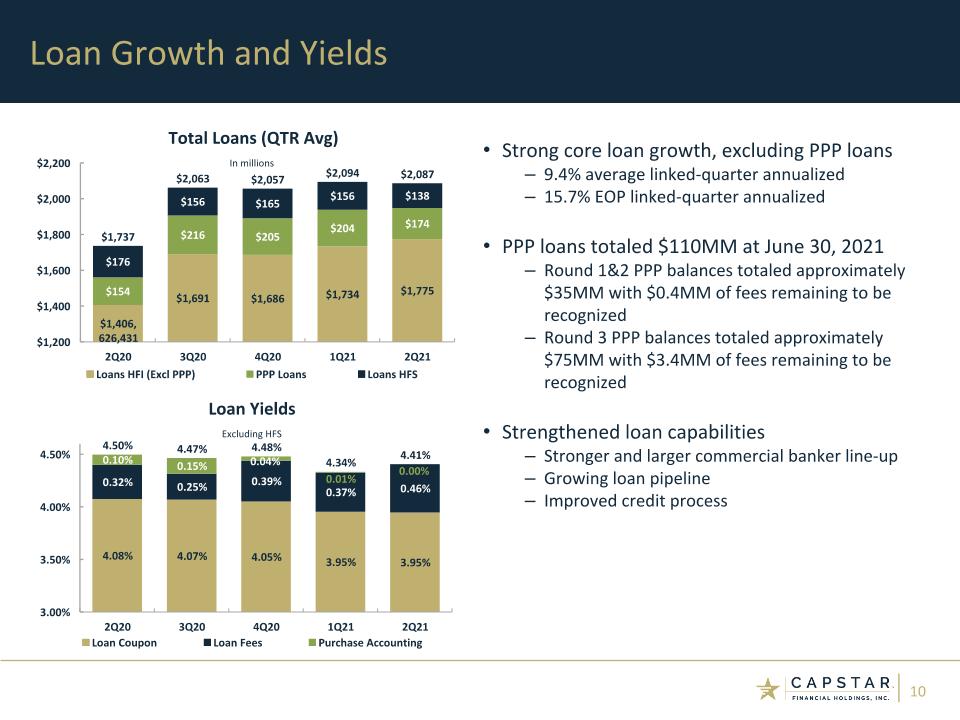
Strong core loan growth, excluding PPP loans 9.4% average linked-quarter annualized 15.7% EOP linked-quarter annualized PPP loans totaled $110MM at June 30, 2021 Round 1&2 PPP balances totaled approximately $35MM with $0.4MM of fees remaining to be recognized Round 3 PPP balances totaled approximately $75MM with $3.4MM of fees remaining to be recognized Strengthened loan capabilities Stronger and larger commercial banker line-up Growing loan pipeline Improved credit process Loan Growth and Yields
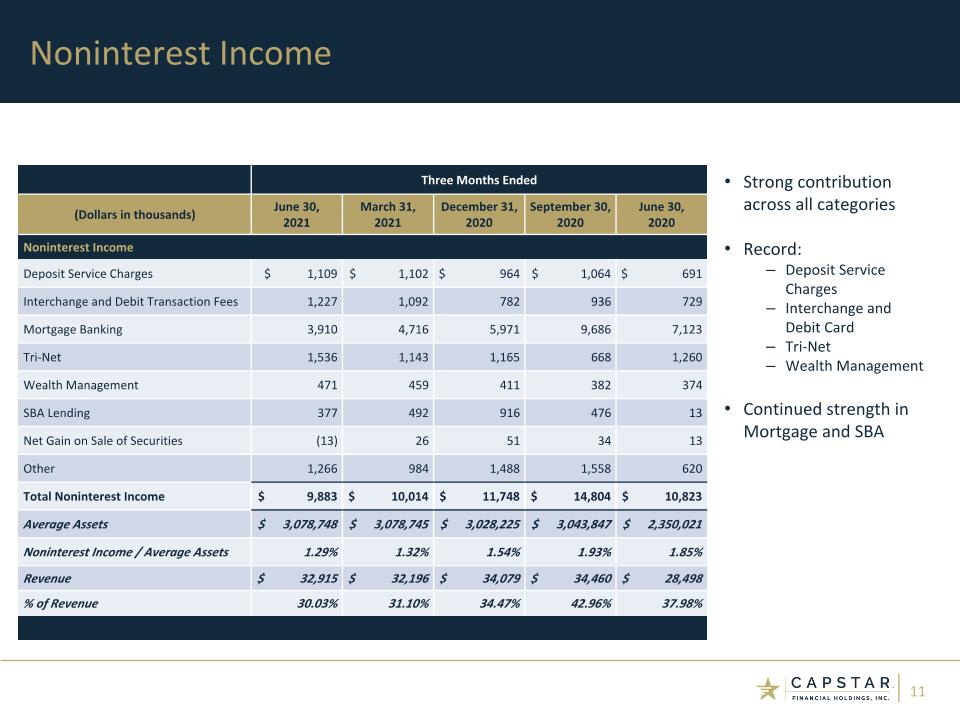
Noninterest Income Strong contribution across all categories Record: Deposit Service Charges Interchange and Debit Card Tri-Net Wealth Management Continued strength in Mortgage and SBA Three Months Ended (Dollars in thousands) June 30, March 31, December 31, September 30, June 30, 2021 2021 2020 2020 2020 Noninterest Income Deposit Service Charges $ 1,109 $ 1,102 $ 964 $ 1,064 $ 691 Interchange and Debit Transaction Fees 1,227 1,092 782 936 729 Mortgage Banking 3,910 4,716 5,971 9,686 7,123 Tri-Net 1,536 1,143 1,165 668 1,260 Wealth Management 471 459 411 382 374 SBA Lending 377 492 916 476 13 Net Gain on Sale of Securities (13) 26 51 34 13 Other 1,266 984 1,488 1,558 620 Total Noninterest Income $ 9,883 $ 10,014 $ 11,748 $ 14,804 $ 10,823 Average Assets $ 3,078,748 $ 3,078,745 $ 3,028,225 $ 3,043,847 $ 2,350,021 Noninterest Income / Average Assets 1.29% 1.32% 1.54% 1.93% 1.85% Revenue $ 32,915 $ 32,196 $ 34,079 $ 34,460 $ 28,498 % of Revenue 30.03% 31.10% 34.47% 42.96% 37.98%
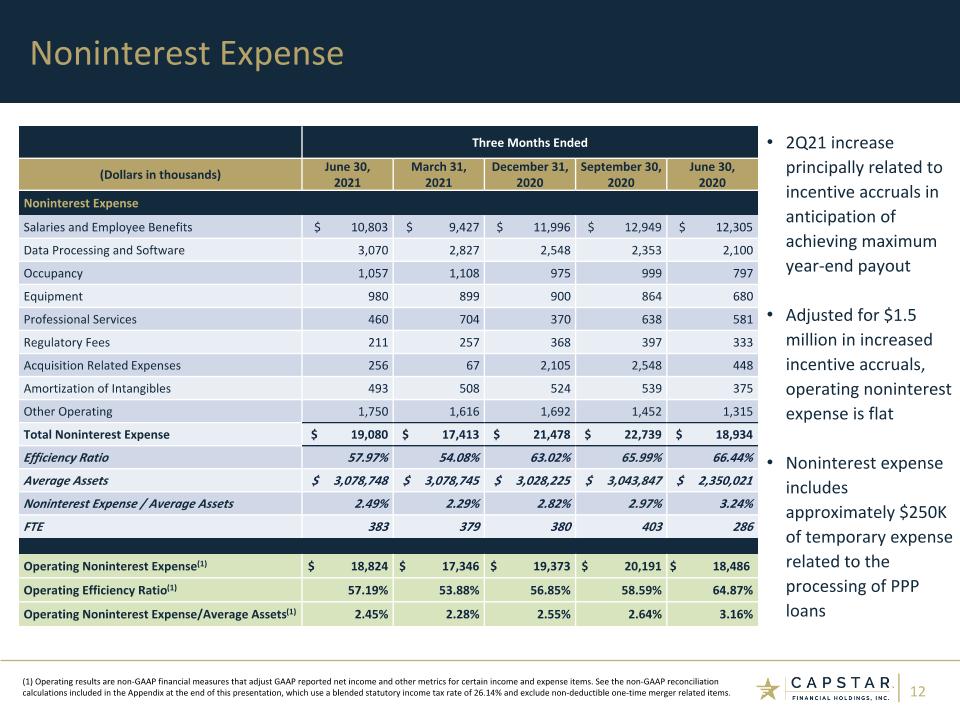
Noninterest Expense Three Months Ended (Dollars in thousands) June 30, 2021 March 31, 2021 December 31, 2020 September 30, 2020 June 30, 2020 Noninterest Expense Salaries and Employee Benefits $ 10,803 $ 9,427 $ 11,996 $ 12,949 $ 12,305 Data Processing and Software 3,070 2,827 2,548 2,353 2,100 Occupancy 1,057 1,108 975 999 797 Equipment 980 899 900 864 680 Professional Services 460 704 370 638 581 Regulatory Fees 211 257 368 397 333 Acquisition Related Expenses 256 67 2,105 2,548 448 Amortization of Intangibles 493 508 524 539 375 Other Operating 1,750 1,616 1,692 1,452 1,315 Total Noninterest Expense $ 19,080 $ 17,413 $ 21,478 $ 22,739 $ 18,934 Efficiency Ratio 57.97% 54.08% 63.02% 65.99% 66.44% Average Assets $ 3,078,748 $ 3,078,745 $ 3,028,225 $ 3,043,847 $ 2,350,021 Noninterest Expense / Average Assets 2.49% 2.29% 2.82% 2.97% 3.24% FTE 383 379 380 403 286 Operating Noninterest Expense(1) $ 18,824 $ 17,346 $ 19,373 $ 20,191 $ 18,486 Operating Efficiency Ratio(1) 57.19% 53.88% 56.85% 58.59% 64.87% Operating Noninterest Expense/Average Assets(1) 2.45% 2.28% 2.55% 2.64% 3.16% (1) Operating results are non-GAAP financial measures that adjust GAAP reported net income and other metrics for certain income and expense items. See the non-GAAP reconciliation calculations included in the Appendix at the end of this presentation, which use a blended statutory income tax rate of 26.14% and exclude non-deductible one-time merger related items. 2Q21 increase principally related to incentive accruals in anticipation of achieving maximum year-end payout Adjusted for $1.5 million in increased incentive accruals, operating noninterest expense is flat Noninterest expense includes approximately $250K of temporary expense related to the processing of PPP loans
Risk Management
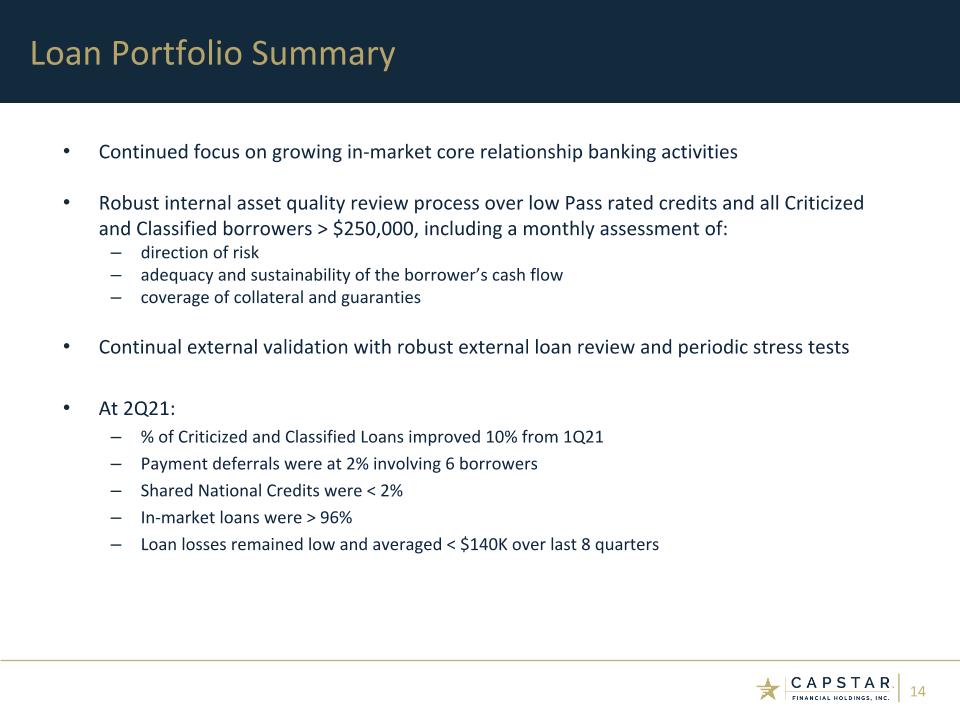
Continued focus on growing in-market core relationship banking activities Robust internal asset quality review process over low Pass rated credits and all Criticized and Classified borrowers > $250,000, including a monthly assessment of: direction of risk adequacy and sustainability of the borrower’s cash flow coverage of collateral and guaranties Continual external validation with robust external loan review and periodic stress tests At 2Q21: % of Criticized and Classified Loans improved 10% from 1Q21 Payment deferrals were at 2% involving 6 borrowers Shared National Credits were < 2% In-market loans were > 96% Loan losses remained low and averaged < $140K over last 8 quarters Loan Portfolio Summary (1)
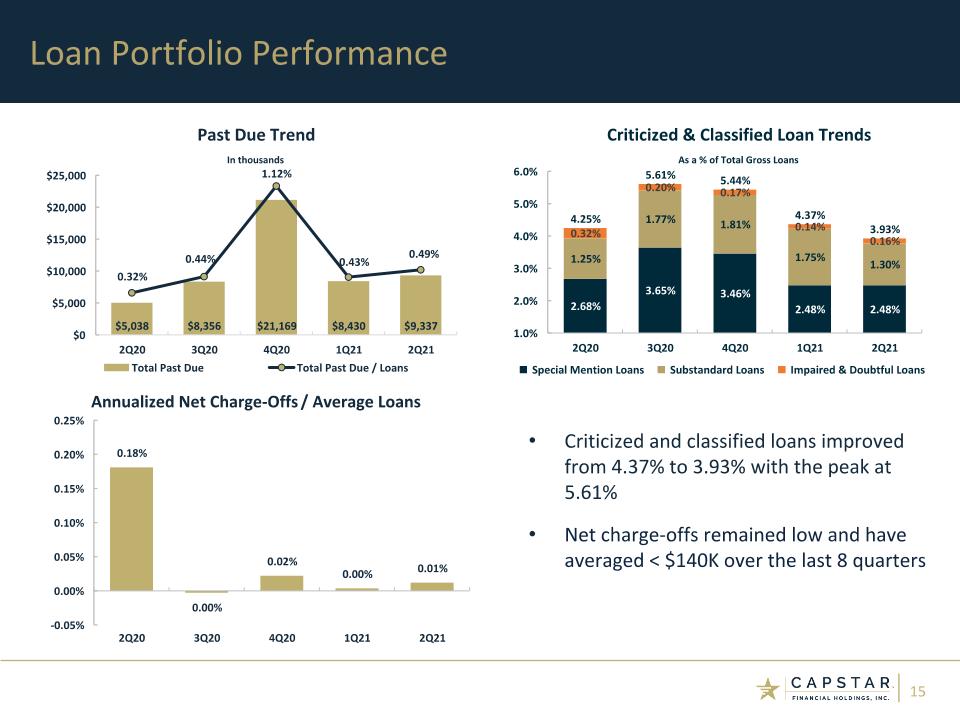
Loan Portfolio Performance (1) Criticized and classified loans improved from 4.37% to 3.93% with the peak at 5.61% Net charge-offs remained low and have averaged < $140K over the last 8 quarters
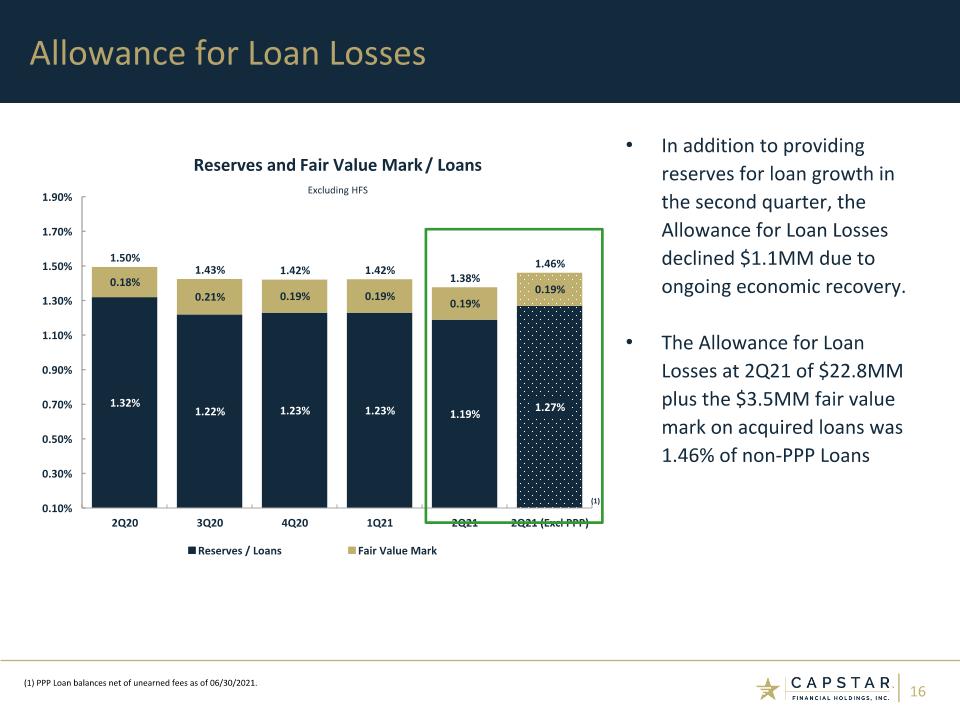
Allowance for Loan Losses In addition to providing reserves for loan growth in the second quarter, the Allowance for Loan Losses declined $1.1MM due to ongoing economic recovery. The Allowance for Loan Losses at 2Q21 of $22.8MM plus the $3.5MM fair value mark on acquired loans was 1.46% of non-PPP Loans (1) PPP Loan balances net of unearned fees as of 06/30/2021. (1)

Capital Management
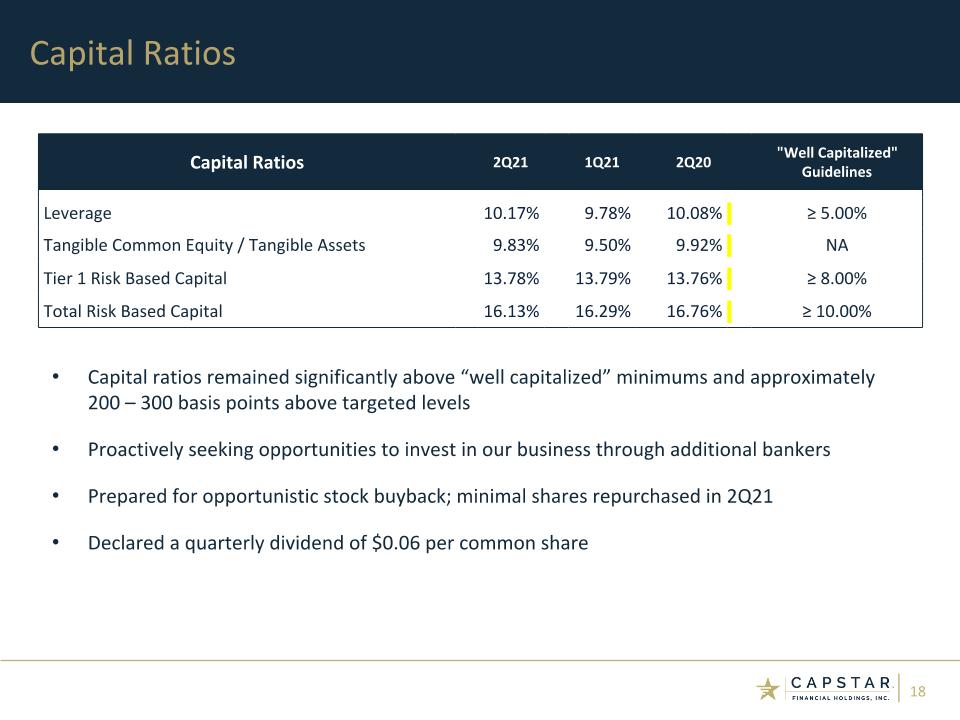
Capital Ratios Capital ratios remained significantly above “well capitalized” minimums and approximately 200 – 300 basis points above targeted levels Proactively seeking opportunities to invest in our business through additional bankers Prepared for opportunistic stock buyback; minimal shares repurchased in 2Q21 Declared a quarterly dividend of $0.06 per common share Capital Ratios 2Q21 1Q21 2Q20 "Well Capitalized" Guidelines Leverage 10.17% 9.78% 10.08% ≥ 5.00% Tangible Common Equity / Tangible Assets 9.83% 9.50% 9.92% NA Tier 1 Risk Based Capital 13.78% 13.79% 13.76% ≥ 8.00% Total Risk Based Capital 16.13% 16.29% 16.76% ≥ 10.00%

Looking Forward
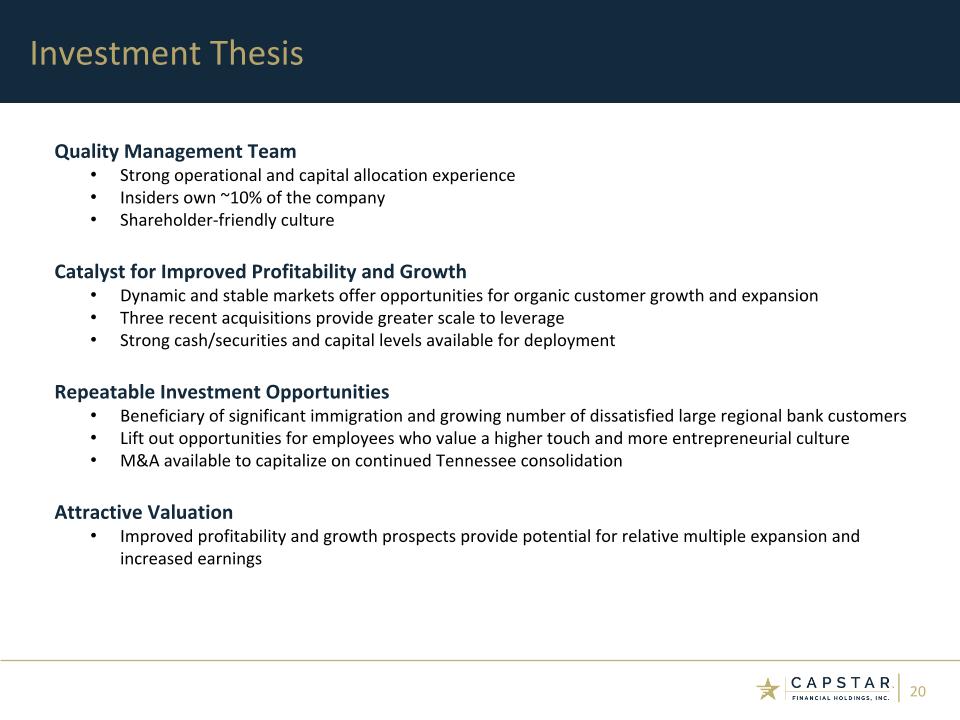
Investment Thesis Quality Management Team Strong operational and capital allocation experience Insiders own ~10% of the company Shareholder-friendly culture Catalyst for Improved Profitability and Growth Dynamic and stable markets offer opportunities for organic customer growth and expansion Three recent acquisitions provide greater scale to leverage Strong cash/securities and capital levels available for deployment Repeatable Investment Opportunities Beneficiary of significant immigration and growing number of dissatisfied large regional bank customers Lift out opportunities for employees who value a higher touch and more entrepreneurial culture M&A available to capitalize on continued Tennessee consolidation Attractive Valuation Improved profitability and growth prospects provide potential for relative multiple expansion and increased earnings
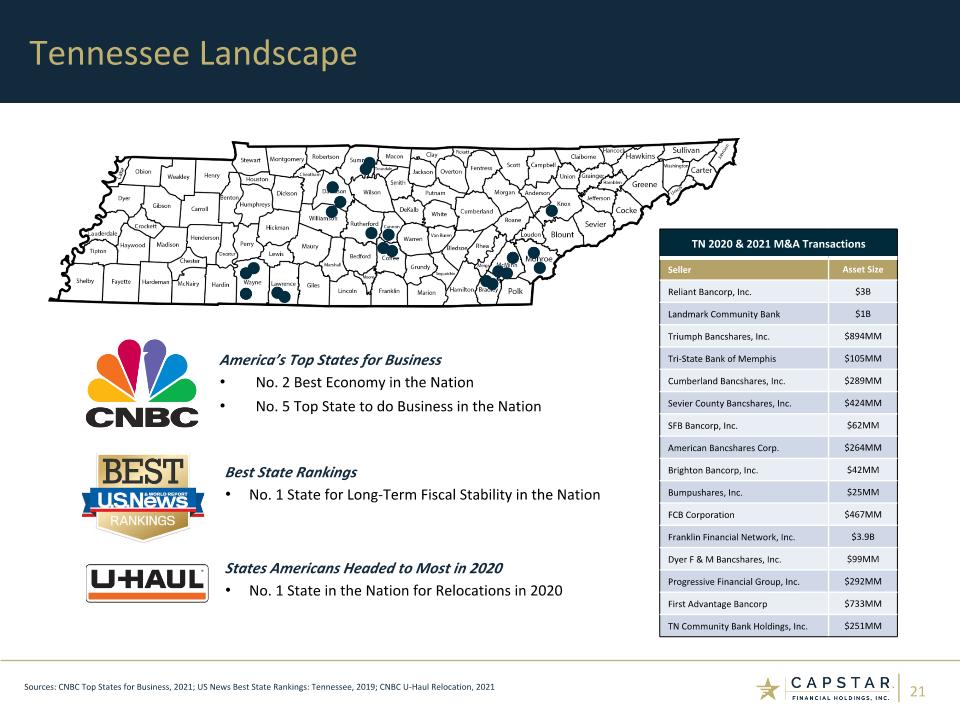
Board Draft 4 America’s Top States for Business No. 2 Best Economy in the Nation No. 5 Top State to do Business in the Nation TN 2020 & 2021 M&A Transactions Seller Asset Size Reliant Bancorp, Inc. $3B Landmark Community Bank $1B Triumph Bancshares, Inc. $894MM Tri-State Bank of Memphis $105MM Cumberland Bancshares, Inc. $289MM Sevier County Bancshares, Inc. $424MM SFB Bancorp, Inc. $62MM American Bancshares Corp. $264MM Brighton Bancorp, Inc. $42MM Bumpushares, Inc. $25MM FCB Corporation $467MM Franklin Financial Network, Inc. $3.9B Dyer F & M Bancshares, Inc. $99MM Progressive Financial Group, Inc. $292MM First Advantage Bancorp $733MM TN Community Bank Holdings, Inc. $251MM Best State Rankings No. 1 State for Long-Term Fiscal Stability in the Nation States Americans Headed to Most in 2020 No. 1 State in the Nation for Relocations in 2020 Sources: CNBC Top States for Business, 2021; US News Best State Rankings: Tennessee, 2019; CNBC U-Haul Relocation, 2021 Tennessee Landscape
Appendix: Other Financial Results and Non-GAAP Reconciliations
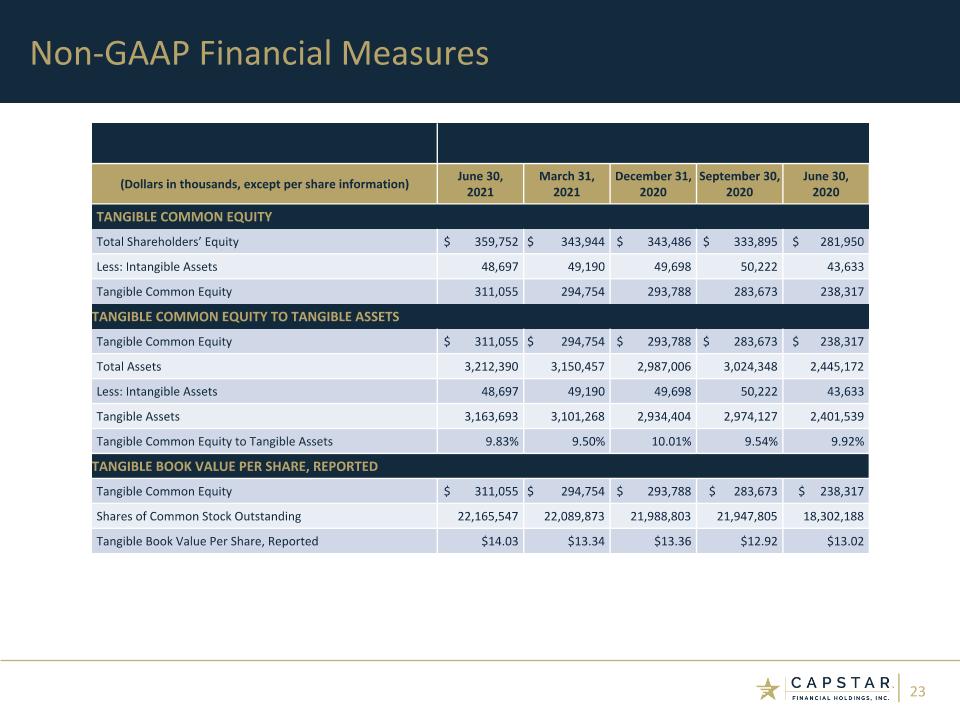
(Dollars in thousands, except per share information) June 30, 2021 March 31, 2021 December 31, 2020 September 30, 2020 June 30, 2020 TANGIBLE COMMON EQUITY Total Shareholders’ Equity $ 359,752 $ 343,944 $ 343,486 $ 333,895 $ 281,950 Less: Intangible Assets 48,697 49,190 49,698 50,222 43,633 Tangible Common Equity 311,055 294,754 293,788 283,673 238,317 TANGIBLE COMMON EQUITY TO TANGIBLE ASSETS Tangible Common Equity $ 311,055 $ 294,754 $ 293,788 $ 283,673 $ 238,317 Total Assets 3,212,390 3,150,457 2,987,006 3,024,348 2,445,172 Less: Intangible Assets 48,697 49,190 49,698 50,222 43,633 Tangible Assets 3,163,693 3,101,268 2,934,404 2,974,127 2,401,539 Tangible Common Equity to Tangible Assets 9.83% 9.50% 10.01% 9.54% 9.92% TANGIBLE BOOK VALUE PER SHARE, REPORTED Tangible Common Equity $ 311,055 $ 294,754 $ 293,788 $ 283,673 $ 238,317 Shares of Common Stock Outstanding 22,165,547 22,089,873 21,988,803 21,947,805 18,302,188 Tangible Book Value Per Share, Reported $14.03 $13.34 $13.36 $12.92 $13.02 Non-GAAP Financial Measures
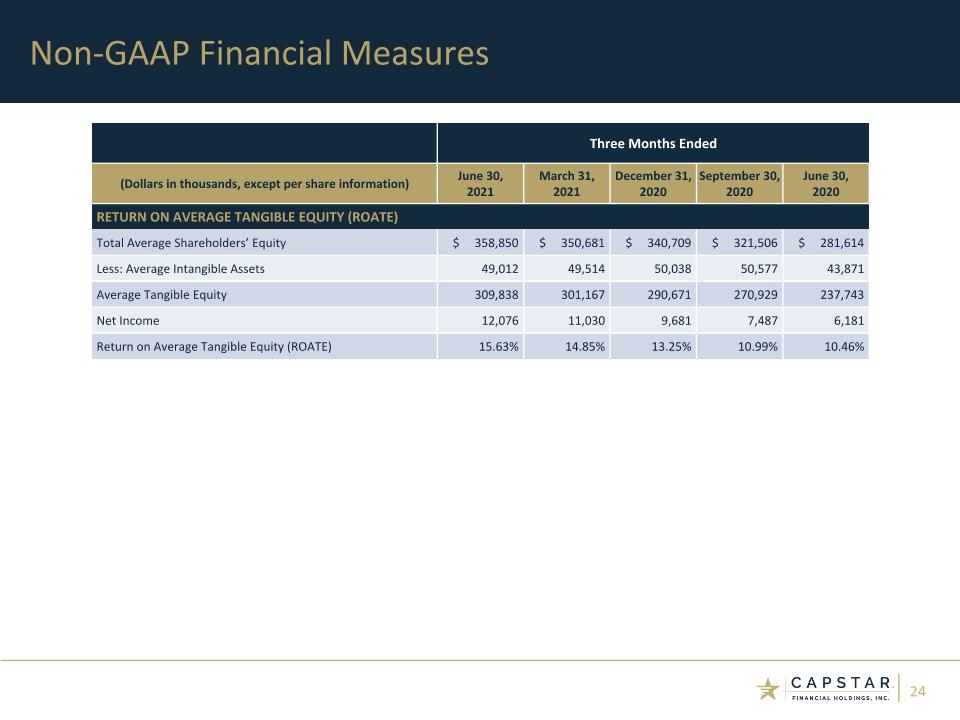
Three Months Ended (Dollars in thousands, except per share information) June 30, 2021 March 31, 2021 December 31, 2020 September 30, 2020 June 30, 2020 RETURN ON AVERAGE TANGIBLE EQUITY (ROATE) Total Average Shareholders’ Equity $ 358,850 $ 350,681 $ 340,709 $ 321,506 $ 281,614 Less: Average Intangible Assets 49,012 49,514 50,038 50,577 43,871 Average Tangible Equity 309,838 301,167 290,671 270,929 237,743 Net Income 12,076 11,030 9,681 7,487 6,181 Return on Average Tangible Equity (ROATE) 15.63% 14.85% 13.25% 10.99% 10.46% Non-GAAP Financial Measures
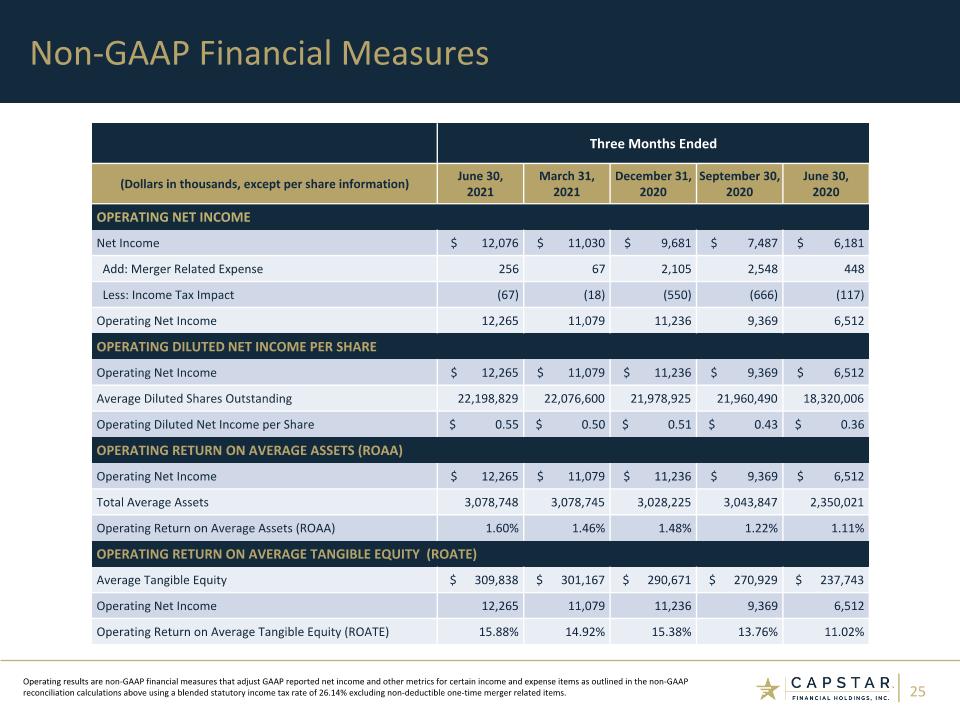
Three Months Ended (Dollars in thousands, except per share information) June 30, 2021 March 31, 2021 December 31, 2020 September 30, 2020 June 30, 2020 OPERATING NET INCOME Net Income $ 12,076 $ 11,030 $ 9,681 $ 7,487 $ 6,181 Add: Merger Related Expense 256 67 2,105 2,548 448 Less: Income Tax Impact (67) (18) (550) (666) (117) Operating Net Income 12,265 11,079 11,236 9,369 6,512 OPERATING DILUTED NET INCOME PER SHARE Operating Net Income $ 12,265 $ 11,079 $ 11,236 $ 9,369 $ 6,512 Average Diluted Shares Outstanding 22,198,829 22,076,600 21,978,925 21,960,490 18,320,006 Operating Diluted Net Income per Share $ 0.55 $ 0.50 $ 0.51 $ 0.43 $ 0.36 OPERATING RETURN ON AVERAGE ASSETS (ROAA) Operating Net Income $ 12,265 $ 11,079 $ 11,236 $ 9,369 $ 6,512 Total Average Assets 3,078,748 3,078,745 3,028,225 3,043,847 2,350,021 Operating Return on Average Assets (ROAA) 1.60% 1.46% 1.48% 1.22% 1.11% OPERATING RETURN ON AVERAGE TANGIBLE EQUITY (ROATE) Average Tangible Equity $ 309,838 $ 301,167 $ 290,671 $ 270,929 $ 237,743 Operating Net Income 12,265 11,079 11,236 9,369 6,512 Operating Return on Average Tangible Equity (ROATE) 15.88% 14.92% 15.38% 13.76% 11.02% Non-GAAP Financial Measures Operating results are non-GAAP financial measures that adjust GAAP reported net income and other metrics for certain income and expense items as outlined in the non-GAAP reconciliation calculations above using a blended statutory income tax rate of 26.14% excluding non-deductible one-time merger related items.
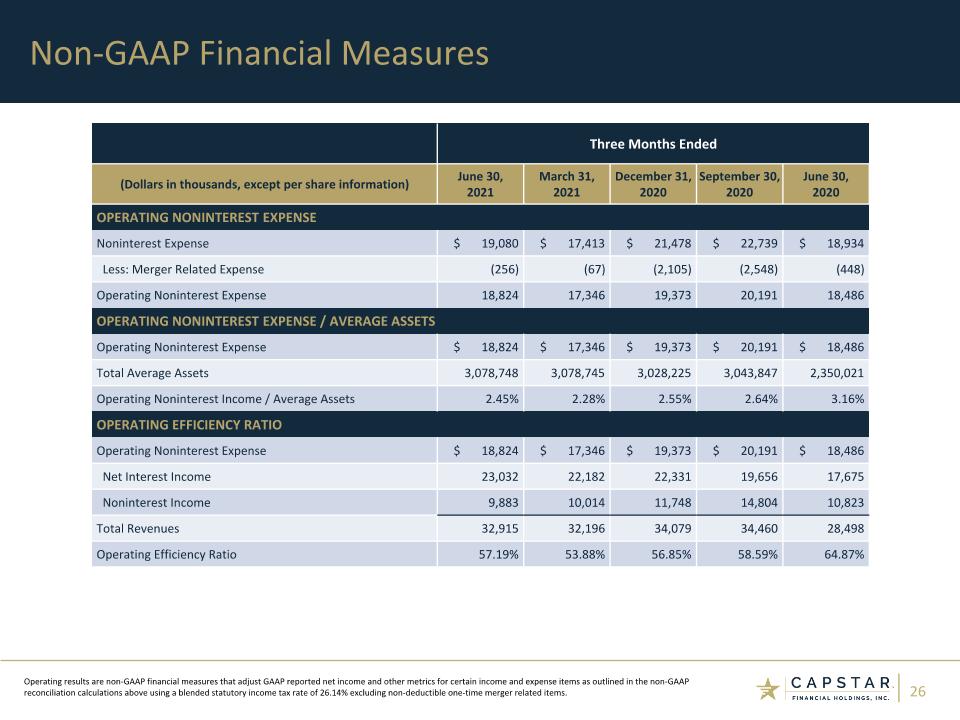
Three Months Ended (Dollars in thousands, except per share information) June 30, 2021 March 31, 2021 December 31, 2020 September 30, 2020 June 30, 2020 OPERATING NONINTEREST EXPENSE Noninterest Expense $ 19,080 $ 17,413 $ 21,478 $ 22,739 $ 18,934 Less: Merger Related Expense (256) (67) (2,105) (2,548) (448) Operating Noninterest Expense 18,824 17,346 19,373 20,191 18,486 OPERATING NONINTEREST EXPENSE / AVERAGE ASSETS Operating Noninterest Expense $ 18,824 $ 17,346 $ 19,373 $ 20,191 $ 18,486 Total Average Assets 3,078,748 3,078,745 3,028,225 3,043,847 2,350,021 Operating Noninterest Income / Average Assets 2.45% 2.28% 2.55% 2.64% 3.16% OPERATING EFFICIENCY RATIO Operating Noninterest Expense $ 18,824 $ 17,346 $ 19,373 $ 20,191 $ 18,486 Net Interest Income 23,032 22,182 22,331 19,656 17,675 Noninterest Income 9,883 10,014 11,748 14,804 10,823 Total Revenues 32,915 32,196 34,079 34,460 28,498 Operating Efficiency Ratio 57.19% 53.88% 56.85% 58.59% 64.87% Non-GAAP Financial Measures Operating results are non-GAAP financial measures that adjust GAAP reported net income and other metrics for certain income and expense items as outlined in the non-GAAP reconciliation calculations above using a blended statutory income tax rate of 26.14% excluding non-deductible one-time merger related items.
CapStar Financial Holdings, Inc. 1201 Demonbreun Street, Suite 700 Nashville, TN 37203 Mail: P.O. Box 305065 Nashville, TN 37230-5065 (615) 732-6400 Telephone www.capstarbank.com (615) 732-6455 Email: ir@capstarbank.com Contact Information Investor Relations Executive Leadership Denis J. Duncan Chief Financial Officer CapStar Financial Holdings, Inc. (615) 732-7492 Email: denis.duncan@capstarbank.com Corporate Headquarters
