Attached files
| file | filename |
|---|---|
| EX-99.7 - EX-99.7 UNAUDITED PRO FORMA FINANCIAL INFO OF CCI AS OF 3.31.21 & 12.31.20 - Cottonwood Communities, Inc. | proforma-fullycombinedx033.htm |
| EX-99.6 - EX-99.6 FINANCIAL STATEMENTS OF CMRII 3.31.21 (UNAUDITED) - Cottonwood Communities, Inc. | cmriifinancialstatements-3.htm |
| EX-99.5 - EX-99.5 FINANCIAL STATEMENTS OF CMRI 3.31.21 (UNAUDITED) - Cottonwood Communities, Inc. | cmrifinancialstatements-33.htm |
| EX-99.4 - EX-99.4 FINANCIAL STATEMENTS OF CRII 3.31.21 (UNAUDITED) - Cottonwood Communities, Inc. | a1q21criifinancialstatemen.htm |
| EX-99.3 - EX-99.3 FINANCIAL STATEMENTS OF CMRII 12/31/20 (AUDITED) - Cottonwood Communities, Inc. | cmrii20inancialstatementsa.htm |
| EX-99.2 - EX-99.2 FINANCIAL STATEMENTS OF CMRI 12.31.20 (AUDITED) - Cottonwood Communities, Inc. | cmri20inancialstatementsau.htm |
| 8-K/A - 8-K/A - Cottonwood Communities, Inc. | cciaauditedfsinterimfsprof.htm |
Exhibit 99.1
| Index to Consolidated Financial Statements | |||||
| Report of Independent Auditor | |||||
| Consolidated Financial Statements | |||||
| Consolidated Balance Sheets as of December 31, 2020 and 2019 | |||||
| Consolidated Statements of Operations for the Years Ended December 31, 2020 and 2019 | |||||
| Consolidated Statements of Stockholders' Equity for the Years Ended December 31, 2020 and 2019 | |||||
| Consolidated Statements of Cash Flows for the Years Ended December 31, 2020 and 2019 | |||||
| Notes to Consolidated Financial Statements | |||||
| Appendix A: Real Estate and Accumulated Depreciation (Unaudited) | |||||
| Appendix B: Selected Financial Data on Unconsolidated Stabilized Property Investments (Unaudited) | |||||
Independent Auditors’ Report
The Board of Directors and Stockholders
Cottonwood Residential II, Inc.:
Report on the Financial Statements
We have audited the accompanying consolidated financial statements of Cottonwood Residential II, Inc. and its subsidiaries, which comprise the consolidated balance sheets as of December 31, 2020 and 2019, and the related consolidated statements of operations, stockholders’ equity, and cash flows for the years then ended, and the related notes to the consolidated financial statements.
Management’s Responsibility for the Financial Statements
Management is responsible for the preparation and fair presentation of these consolidated financial statements in accordance with U.S. generally accepted accounting principles; this includes the design, implementation, and maintenance of internal control relevant to the preparation and fair presentation of consolidated financial statements that are free from material misstatement, whether due to fraud or error.
Auditors’ Responsibility
Our responsibility is to express an opinion on these consolidated financial statements based on our audits. We conducted our audits in accordance with auditing standards generally accepted in the United States of America. Those standards require that we plan and perform the audit to obtain reasonable assurance about whether the consolidated financial statements are free from material misstatement.
An audit involves performing procedures to obtain audit evidence about the amounts and disclosures in the consolidated financial statements. The procedures selected depend on the auditors’ judgment, including the assessment of the risks of material misstatement of the consolidated financial statements, whether due to fraud or error. In making those risk assessments, the auditor considers internal control relevant to the entity’s preparation and fair presentation of the consolidated financial statements in order to design audit procedures that are appropriate in the circumstances, but not for the purpose of expressing an opinion on the effectiveness of the entity’s internal control. Accordingly, we express no such opinion. An audit also includes evaluating the appropriateness of accounting policies used and the reasonableness of significant accounting estimates made by management, as well as evaluating the overall presentation of the consolidated financial statements.
We believe that the audit evidence we have obtained is sufficient and appropriate to provide a basis for our audit opinion.
Opinion
In our opinion, the consolidated financial statements referred to above present fairly, in all material respects, the financial position of Cottonwood Residential II, Inc. and its subsidiaries as of December 31, 2020 and 2019, and the results of their operations and their cash flows for the years then ended in accordance with U.S. generally accepted accounting principles.
1
Emphasis of Matter
Report on Other Legal and Regulatory Requirements
Our audit was conducted for the purpose of forming an opinion on the basic financial statements as a whole. The Appendix A: Real Estate and Accumulated Depreciation and Appendix B: Selected Financial Data on Unconsolidated Stabilized Property Investments are presented for purposes of additional analysis and are not a required part of the basic financial statements. Such information has not been subjected to the auditing procedures applied in the audit of the basic financial statements, and accordingly, we do not express an opinion or provide any assurance on it.
/s/KPMG LLP
Denver, Colorado
May 4, 2021
2
| Cottonwood Residential II, Inc. | |||||||||||
| Consolidated Balance Sheets | |||||||||||
(Amounts in Thousands, Except Share Data) | |||||||||||
| December 31, | |||||||||||
| 2020 | 2019 | ||||||||||
| Assets | |||||||||||
| Real estate assets, net | $ | 823,569 | $ | 675,821 | |||||||
| Investments in unconsolidated real estate entities | 44,723 | 73,015 | |||||||||
| Cash and cash equivalents | 36,359 | 44,568 | |||||||||
| Restricted cash | 20,643 | 8,127 | |||||||||
| Related party notes | 9,177 | 9,208 | |||||||||
| Related party receivables | 1,187 | 1,485 | |||||||||
| Deficiency notes | — | 10,130 | |||||||||
| Other assets | 36,163 | 38,378 | |||||||||
| Total assets | $ | 971,821 | $ | 860,732 | |||||||
| Liabilities, Equity, and Noncontrolling Interests | |||||||||||
| Liabilities | |||||||||||
| Mortgage notes, net | $ | 628,042 | $ | 568,451 | |||||||
| Construction loans, net | 50,007 | — | |||||||||
| Preferred stock, net | 143,532 | 139,986 | |||||||||
| Unsecured promissory notes, net | 46,642 | 44,829 | |||||||||
| Accounts payable, accrued expenses and other liabilities | 34,582 | 20,394 | |||||||||
| Total liabilities | 902,805 | 773,660 | |||||||||
Commitments and contingencies (Note 11) | |||||||||||
| Equity and Noncontrolling Interests | |||||||||||
| Stockholders’ equity | |||||||||||
| Common stock, $0.01 par value per share; 1,100,000,000 shares authorized, 213,484 and 297,650 shares issued and outstanding at December 31, 2020 and 2019, respectively | 2 | 3 | |||||||||
| Additional paid-in capital | 3,554 | 5,355 | |||||||||
| Cumulative distributions | (380) | (166) | |||||||||
| Accumulated deficit | (1,897) | (930) | |||||||||
| Total stockholders’ equity | 1,279 | 4,262 | |||||||||
| Noncontrolling interests | |||||||||||
| Limited partners | (70,856) | (35,634) | |||||||||
| Partially owned entities | 138,593 | 118,444 | |||||||||
| Total noncontrolling interests | 67,737 | 82,810 | |||||||||
| Total equity and noncontrolling interests | 69,016 | 87,072 | |||||||||
| Total liabilities, equity and noncontrolling interests | $ | 971,821 | $ | 860,732 | |||||||
| See accompanying notes to consolidated financial statements | |||||||||||
3
| Cottonwood Residential II, Inc. | |||||||||||
| Consolidated Statements of Operations | |||||||||||
(Amounts in Thousands) | |||||||||||
| For the Year Ended December 31, | |||||||||||
| 2020 | 2019 | ||||||||||
| Revenues | |||||||||||
| Rental and other property revenues | $ | 85,851 | $ | 85,203 | |||||||
| Property management and development | 15,532 | 12,545 | |||||||||
| Advisory services | 5,316 | 2,717 | |||||||||
| Total revenues | 106,699 | 100,465 | |||||||||
| Operating expenses | |||||||||||
| Property operations | 34,266 | 35,189 | |||||||||
| Property management | 14,732 | 14,070 | |||||||||
| Depreciation and amortization | 32,858 | 32,793 | |||||||||
| General and administrative | 14,245 | 14,568 | |||||||||
| Total operating expenses | 96,101 | 96,620 | |||||||||
| Income from operations | 10,598 | 3,845 | |||||||||
| Equity in earnings of unconsolidated real estate entities | 589 | 1,179 | |||||||||
| Interest income | 4,137 | 1,412 | |||||||||
| Interest expense | (41,704) | (41,488) | |||||||||
| Gain on sale of unconsolidated real estate entities | — | 6,823 | |||||||||
| Loss on consolidation of variable interest entity | (2,543) | — | |||||||||
| Other expenses, net | (2,387) | (148) | |||||||||
| Loss before income taxes | (31,310) | (28,377) | |||||||||
| Income tax benefit (loss) | 3,590 | (292) | |||||||||
| Net loss | (27,720) | (28,669) | |||||||||
| Net loss attributable to noncontrolling interests: | |||||||||||
| Limited partners | 24,065 | 22,194 | |||||||||
| Partially owned entities | 2,688 | 5,546 | |||||||||
| Net loss attributable to common stockholders | $ | (967) | $ | (929) | |||||||
| See accompanying notes to consolidated financial statements | |||||||||||
4
| Cottonwood Residential II, Inc. | ||||||||||||||||||||||||||||||||
| Consolidated Statements of Stockholders' Equity | ||||||||||||||||||||||||||||||||
| (Amounts in Thousands, Except Share Data) | ||||||||||||||||||||||||||||||||
| Cottonwood Residential II, Inc. Stockholders’ Equity | Noncontrolling Interests | |||||||||||||||||||||||||||||||
| Common Stock | Additional Paid-In-Capital | Cumulative Distributions | Accumulated Deficit | Total Stockholders' Equity | Limited Partners | Partially Owned Entities | Total Equity and Noncontrolling Interests | |||||||||||||||||||||||||
| Shares | Amount | |||||||||||||||||||||||||||||||
| Balance at December 31, 2018 | 50 | $ | — | $ | 1 | $ | — | $ | (1) | $ | 0 | $ | 2,989 | $ | 65,018 | $ | 68,007 | |||||||||||||||
| Acquisition of consolidated real estate assets | — | — | — | — | — | — | — | 28,866 | 28,866 | |||||||||||||||||||||||
| OP Units issued for interests in unconsolidated real estate entities | — | — | — | — | — | — | 9,697 | — | 9,697 | |||||||||||||||||||||||
| Development contributions from noncontrolling interests | — | — | — | — | — | — | — | 30,416 | 30,416 | |||||||||||||||||||||||
| Advisor contributions from noncontrolling interests | — | — | — | — | — | — | — | 6,457 | 6,457 | |||||||||||||||||||||||
| Issuance of common stock, net of issuance costs | 297,600 | 3 | 5,354 | — | — | 5,357 | — | — | 5,357 | |||||||||||||||||||||||
| Repurchase of OP Units | — | — | — | — | — | — | (15,492) | — | (15,492) | |||||||||||||||||||||||
| Share based compensation | — | — | — | — | — | — | 2,302 | — | 2,302 | |||||||||||||||||||||||
| Other comprehensive income | — | — | — | — | — | — | 143 | — | 143 | |||||||||||||||||||||||
| Net loss | — | — | — | — | (929) | (929) | (22,194) | (5,546) | (28,669) | |||||||||||||||||||||||
| Distributions | — | — | — | (166) | — | (166) | (13,079) | (6,767) | (20,012) | |||||||||||||||||||||||
| Balance at December 31, 2019 | 297,650 | $ | 3 | $ | 5,355 | $ | (166) | $ | (930) | $ | 4,262 | $ | (35,634) | $ | 118,444 | $ | 87,072 | |||||||||||||||
| Development contributions from noncontrolling interests | — | — | — | — | — | — | — | 20,453 | 20,453 | |||||||||||||||||||||||
Consolidation upon change of control (Note 3) | — | — | — | — | — | — | — | 15,430 | 15,430 | |||||||||||||||||||||||
Consolidation upon exchange of senior executive notes (Note 5) | — | — | — | — | — | — | (2,800) | (2,800) | ||||||||||||||||||||||||
Interest acquired upon exchange of senior executive notes (Note 5) | — | — | — | — | — | — | 1,714 | (1,714) | — | |||||||||||||||||||||||
| Redemption of common stock | (84,166) | (1) | (1,801) | — | — | (1,802) | — | — | (1,802) | |||||||||||||||||||||||
| Repurchase of OP Units | — | — | — | — | — | — | (2,792) | — | (2,792) | |||||||||||||||||||||||
| Share based compensation | — | — | — | — | — | — | 2,987 | — | 2,987 | |||||||||||||||||||||||
| Other | — | — | — | — | — | — | 356 | — | 356 | |||||||||||||||||||||||
| Net loss | — | — | — | — | (967) | (967) | (24,065) | (2,688) | (27,720) | |||||||||||||||||||||||
| Distributions | — | — | — | (214) | — | (214) | (13,422) | (8,532) | (22,168) | |||||||||||||||||||||||
| Balance at December 31, 2020 | 213,484 | $ | 2 | $ | 3,554 | $ | (380) | $ | (1,897) | $ | 1,279 | $ | (70,856) | $ | 138,593 | $ | 69,016 | |||||||||||||||
| See accompanying notes to consolidated financial statements | ||||||||||||||||||||||||||||||||
5
| Cottonwood Residential II, Inc. | |||||||||||
| Consolidated Statements of Cash Flows | |||||||||||
| (Amounts in Thousands) | |||||||||||
| For the Year Ended December 31, | |||||||||||
| 2020 | 2019 | ||||||||||
| Operating activities | |||||||||||
| Net loss | $ | (27,720) | $ | (28,669) | |||||||
| Adjustments to reconcile net loss to cash provided by operating activities: | |||||||||||
| Depreciation and amortization | 32,858 | 32,793 | |||||||||
| Amortization of deferred financing costs | 6,632 | 6,301 | |||||||||
| Loss on consolidation of variable interest entity | 2,543 | — | |||||||||
| Gain on sale of unconsolidated real estate entities | — | (6,823) | |||||||||
| Share based compensation | 2,987 | 2,302 | |||||||||
| Other operating | (64) | 126 | |||||||||
| Equity in earnings of unconsolidated real estate entities | (589) | (1,179) | |||||||||
| Distributions from unconsolidated real estate entities - return on capital | 4,310 | 4,389 | |||||||||
| Changes in operating assets and liabilities: | |||||||||||
| Other assets | 715 | 4,920 | |||||||||
| Accounts payable, accrued and other liabilities | 7,288 | 259 | |||||||||
| Net cash provided by operating activities | 28,960 | 14,419 | |||||||||
| Cash flows from investing activities | |||||||||||
| Acquisition of interests in consolidated real estate assets, net of cash and restricted cash acquired | — | (1,675) | |||||||||
| Capital expenditures and development activities | (56,343) | (19,933) | |||||||||
| Contributions to developments from noncontrolling interests | 22,168 | 21,525 | |||||||||
| Investment in unconsolidated real estate entities | (274) | (9,186) | |||||||||
| Cash and restricted cash from consolidation of variable interest entity | 8,681 | — | |||||||||
| Distributions from unconsolidated real estate entities - return of capital | — | 11,140 | |||||||||
| Related party receivables | 451 | (1,056) | |||||||||
| Related party notes | (4,484) | (4,553) | |||||||||
| Issuance of deficiency notes | (30,942) | (10,130) | |||||||||
| Contributions to Advisor from noncontrolling interests | — | 6,457 | |||||||||
| Sponsored offering costs | (3,992) | (11,374) | |||||||||
| Other investing activities | (15) | (114) | |||||||||
| Net cash used in investing activities | (64,750) | (18,899) | |||||||||
6
| Cottonwood Residential II, Inc. | |||||||||||
| Consolidated Statements of Cash Flows (continued) | |||||||||||
| (Amounts in Thousands) | |||||||||||
| For the Year Ended December 31, | |||||||||||
| 2020 | 2019 (1) | ||||||||||
| Cash flows from financing activities | |||||||||||
| Principal payments on mortgage notes | (829) | (918) | |||||||||
| Proceeds from mortgage notes, net of issuance costs | 218,291 | 117,132 | |||||||||
| Proceeds from construction loans | 8,361 | — | |||||||||
| Repayment of mortgage notes | (158,834) | (95,679) | |||||||||
| Redemption of preferred stock | (1,192) | (1,640) | |||||||||
| Issuance of unsecured promissory notes, net of issuance costs | 947 | 21,819 | |||||||||
| Issuance of common stock | — | 5,665 | |||||||||
| Redemption of common stock | (1,802) | — | |||||||||
| Repurchase of OP Units | (2,792) | (15,492) | |||||||||
| Distributions to common stockholders | (214) | (166) | |||||||||
| Distributions to noncontrolling interest holders | (21,963) | (19,908) | |||||||||
| Other financing activity | 124 | 467 | |||||||||
| Net cash provided by financing activities | 40,097 | 11,280 | |||||||||
| Net increase in cash, cash equivalents and restricted cash | 4,307 | 6,800 | |||||||||
| Cash, cash equivalents, and restricted cash at the beginning of period | 52,695 | 45,895 | |||||||||
| Cash, cash equivalents, and restricted cash at the end of period | $ | 57,002 | $ | 52,695 | |||||||
| Reconciliation of cash, cash equivalents and restricted cash to the consolidated balance sheets: | |||||||||||
Cash and cash equivalents (1) | $ | 36,359 | $ | 44,568 | |||||||
Restricted cash (1) | 20,643 | 8,127 | |||||||||
| Total cash, cash equivalents and restricted cash | $ | 57,002 | $ | 52,695 | |||||||
| Supplemental schedule of cash flow information | |||||||||||
| Interest paid | $ | 33,813 | $ | 34,688 | |||||||
| Income taxes paid (refunded), net | (2,907) | 90 | |||||||||
| Supplemental schedule of noncash investing and financing activities | |||||||||||
| Consolidation upon change of control | |||||||||||
| Capitalized development costs | $ | 119,532 | $ | — | |||||||
| Construction loan | 41,646 | — | |||||||||
| Elimination of deficiency notes | 41,072 | — | |||||||||
| Acquisition of investments in unconsolidated entities | |||||||||||
| Value of OP Units issued for investments in unconsolidated real estate entities | — | 9,697 | |||||||||
| Note receivable exchanged for investment in unconsolidated real estate entity | — | 2,474 | |||||||||
| Related party note issuance | — | 4,655 | |||||||||
| Related party notes extinguished on exchange | 4,514 | — | |||||||||
(1) As of January 1, 2019, our cash and cash equivalents balance was $33,052 and our restricted cash balance was $12,843. | |||||||||||
| See accompanying notes to consolidated financial statements | |||||||||||
7
Cottonwood Residential II, Inc.
Notes to Consolidated Financial Statements
(Amounts in Thousands, Except Property, Share and Unit Data)
1. Organization and Business
Cottonwood Residential II, Inc. (“CRII”) is a Maryland real estate investment trust (“REIT”) dedicated to acquiring, developing, managing and investing in multifamily apartment properties located throughout the United States. Cottonwood Residential O.P., L.P. is our Operating Partnership and together with its subsidiaries holds the Company's real estate interests and conducts the ongoing operations of the Company. CRII is the general partner, and owns interests in, our Operating Partnership. As used herein, the term “Company”, “we”, “our” or “us” includes CRII, our Operating Partnership and its subsidiaries, unless the context indicates otherwise.
This chart illustrates our corporate structure and ownership percentages as of December 31, 2020:
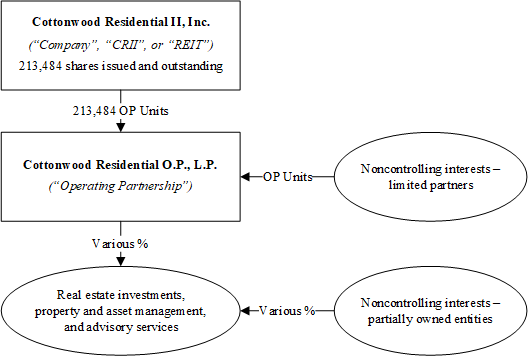
The Company is structured as an umbrella partnership REIT and contributes all net proceeds from its equity offerings to the Operating Partnership. In return for those contributions, the Company receives Operating Partnership Units (“OP Units”) in the Operating Partnership equal to the number of shares of Common Stock it has issued. Interests in properties can be contributed directly to the Operating Partnership through tax-deferred transactions, which is one of the reasons why we are structured in the manner shown above. OP Units can be exchanged for Common Stock on a one-for-one basis after certain criteria are met. OP Units can also be redeemed for cash at the discretion of the board of directors. We maintain a one-for-one relationship between the OP Units issued to CRII and Common Stock. Therefore, holders of Common Stock share in the profits, losses and cash distributions of the Operating Partnership similarly to holders of OP Units.
At December 31, 2020, we held controlling and noncontrolling investments in 28 multifamily apartment properties representing approximately 8,200 apartment units and managed 20 properties for third parties, bringing the total number of properties which we owned interests in or managed to 48, representing approximately 14,000 units located in 13 states. This number includes structured investment interests in two properties as well as investments in four development projects.
8
Cottonwood Residential II, Inc.
Notes to Consolidated Financial Statements - (Continued)
(Amounts in Thousands, Except Property, Share and Unit Data)
We perform advisory services for Cottonwood Communities, Inc. ("CCI"), Cottonwood Multifamily REIT I, Inc. ("CMRI"), Cottonwood Multifamily REIT II, Inc. ("CMRII"), and Cottonwood Multifamily Opportunity Fund, Inc. ("CMOF"). These are separately sponsored REITs that we have joint ventured with and have small ownership interests in. CCI, CMRI, and CMR II are advised by Cottonwood Communities Advisors, LLC (the "Advisor"). We own 50.005% of the Advisor with the remaining being owned by senior executives. We also invested $2,000 of promotional interests in CCI, CMRI, CMRII in an entity and receive a 5% cumulative but not compounded return on this contribution. Executives are entitled to receive a percentage membership interest in this entity should certain performance thresholds be met. In such case, our percentage interest will be reduced.
2. Basis of Presentation and Principles of Consolidation
The consolidated financial statements are presented on the accrual basis of accounting in accordance with U.S. generally accepted accounting principles (“GAAP”) and include the accounts of the Company and subsidiaries under its control. The Operating Partnership and its subsidiaries are consolidated as they are controlled by CRII. All intercompany balances and transactions have been eliminated in consolidation.
Some of our partially owned and unconsolidated properties are owned through a tenant in common (“TIC interest”) structure. TIC interests constitute separate and undivided interests in real property. TIC interests in properties for which we exercise significant influence are accounted for using the equity method of accounting until we have acquired a 100% interest in the property.
Number of units and certain other measures used to describe real estate assets included in the notes to the consolidated financial statements are presented on an unaudited basis.
Certain amounts in the prior year consolidated financial statements and supporting note disclosures have been reclassified to conform to the current year presentation. Specifically, other liabilities of $1,101 are now included in the accounts payable, accrued expenses, and other liabilities line on the consolidated balance sheet. Items reclassified on the consolidated statement of operations include $2,033 from loss on debt extinguishment to interest expense, and $1,412 of interest income into its own line. Such reclassifications did not impact previously reported net loss or accumulated deficit or change net cash provided by or used in operating, investing or financing activities.
In the opinion of management, the accompanying consolidated financial statements contain all adjustments and eliminations, consisting only of normal recurring adjustments necessary for a fair presentation in conformity with GAAP.
Use of Estimates
We make estimates and assumptions in preparing these consolidated financial statements that affect reported amounts of assets and liabilities and the disclosure of contingent liabilities at the dates of the consolidated financial statements as well, as the amounts of revenues and expenses during the reporting periods. Actual amounts could differ from those estimates.
Variable Interest Entities
We invest in entities that qualify as variable interest entities (“VIEs”). All VIEs for which we are the primary beneficiary are consolidated. VIEs for which we are not the primary beneficiary are accounted for under the equity method. A VIE is a legal entity in which the equity investors at risk lack sufficient equity to finance the entity's activities without additional subordinated financial support or, as a group, the equity investors at risk lack the power to direct the entity's activities and the obligation to absorb the entity's expected losses or the right to receive the entity's expected residual returns. Qualitative and quantitative factors are considered in determining whether we are the primary beneficiary of a VIE, including, but not limited to, which activities most significantly impact economic performance, which party controls such activities, the amount and characteristics of our investments, the obligation or likelihood for us or other investors to provide financial support, and the management relationship of the property.
The Operating Partnership is a VIE as the limited partners lack substantive kick-out rights and substantive participating rights. We are the primary beneficiary of the Operating Partnership as we have the power to direct the activities that most significantly impact economic performance and the rights to receive economic benefits. Substantially all of our assets and liabilities are held in the Operating Partnership.
9
Cottonwood Residential II, Inc.
Notes to Consolidated Financial Statements - (Continued)
(Amounts in Thousands, Except Property, Share and Unit Data)
In cases where we become the primarily beneficiary of a VIE, we recognized a gain or loss for the difference between the sum of (1) the fair value of any consideration paid, the fair value of the noncontrolling interest, and the reported amount of our equity method investment and (2) the net fair value of identifiable assets and liabilities of the VIE.
Acquisition of Real Estate Assets
Our real estate acquisitions qualify as asset acquisitions and are recorded at cost based on relative fair value. Real estate assets and liabilities include land, building, furniture, fixtures and equipment, other personal property, in-place lease intangibles and debt. The value of land, buildings and improvements are determined as if vacant using methods similar to those used by independent appraisers. These methods include third-party appraisals, replacement cost estimates less depreciation, discounted cash flows, and direct capitalization of net operating income. In-place leases are valued based on current rental rates and the average time necessary to lease a unit and are amortized over the estimated remaining term. We generally do not record an asset or liability for above or below market leases as acquired leases approximate market rates due to lease terms generally not extending beyond one year. The fair value of debt assumed is determined using a discounted cash flow analysis based on remaining loan terms and principal. Discount rates are based on management’s estimates of current market interest rates for instruments with similar characteristics, and consider remaining loan term and loan-to-value ratio. Transactional costs are capitalized.
Asset acquisition accounting is also used when we acquire a controlling interest through the acquisition of additional interests in partially owned real estate.
Real Estate Assets, Net
Real estate assets are reported at cost, less accumulated depreciation. We capitalize costs related to the development, construction, improvement, and significant renovation of properties, which include capital replacements such as scheduled carpet replacement, new roofs, HVAC units, plumbing, concrete, masonry and other paving, pools and various exterior building improvements. We also capitalize salary costs directly attributable to significant renovation work.
We compute depreciation on a straight-line basis over the estimated useful lives of the related assets as follows (in years):
Land improvements | 5–15 | ||||
Building | 30 | ||||
Building improvements | 5–15 | ||||
Furniture, fixtures, and equipment | 5–15 | ||||
We expense ordinary maintenance and repairs to operations as incurred. We capitalize significant renovations and improvements that improve and/or extend the useful life of an asset and amortize over their estimated useful life, generally five to 15 years.
Impairment of Long-Lived Assets
Long-lived assets include real estate assets and acquired intangible assets. Intangible assets are amortized on a straight-line basis over their estimated useful lives. We review for impairment whenever events or changes in circumstances indicate that the carrying value may not be recoverable. Indicators that may cause an impairment review include, but are not limited to, significant under-performance relative to historical or projected future operating results and significant market or economic trends. When we determine the carrying value of a long-lived asset may not be recoverable based upon the existence of one or more of the above indicators, we determine recoverability by comparing the carrying amount of the asset to the net future undiscounted cash flows the asset is expected to generate. We recognize, if appropriate, an impairment charge equal to the amount by which the carrying amount exceeds the fair value of the asset. No impairment losses were recognized for the years ended December 31, 2020 or 2019 related to long-lived assets.
10
Cottonwood Residential II, Inc.
Notes to Consolidated Financial Statements - (Continued)
(Amounts in Thousands, Except Property, Share and Unit Data)
Investments in Unconsolidated Real Estate Entities
Real estate investments where we have significant noncontrolling influence and VIEs where we are not the primary beneficiary are accounted for under the equity method.
Equity method investments in unconsolidated real estate entities are recorded at cost, adjusted for our share of net earnings or losses each period, and reduced by distributions. Equity in earnings or losses is generally recognized based on our ownership interest in the earnings or losses of the unconsolidated real estate entities. We follow the “look through” approach for classification of distributions from unconsolidated real estate entities in the consolidated statements of cash flows. Under this approach, distributions are reported under operating cash flow unless the facts and circumstances of a specific distribution clearly indicate that it is a return of capital (e.g., a liquidating dividend or distribution of the proceeds from the entity’s sale of assets), in which case it is reported as an investing activity.
We assess potential impairment of investments in unconsolidated real estate entities whenever events or changes in circumstances indicate that the fair value of the investment is less than its carrying value. To the extent impairment has occurred, and is not considered temporary, the impairment is measured as the excess of the carrying amount of the investment over the fair value of the investment. No impairment losses were recognized for the years ended December 31, 2020 or 2019 related to our investments in unconsolidated real estate entities.
Transaction costs incurred for investments in unconsolidated real estate entities not related to the issuance of OP Units are included in the carrying amount of that investment.
Cash and Cash Equivalents
We consider all cash on deposit, money market funds and short-term investments with original maturities of three months or less to be cash and cash equivalents.
We maintain cash in demand deposit accounts at several major commercial banks where balances in individual accounts at times exceeds FDIC insured amounts. We have not experienced any losses in such accounts.
Restricted Cash
Restricted cash includes a construction bond, residents’ security deposits, cash in escrow for self-insurance retention, cash in escrow for acquisitions, escrow deposits held by lenders for property taxes, insurance, debt service and replacement reserves, and utility deposits.
Other Assets
Other assets consist primarily of sponsored offering costs, intangible assets and goodwill acquired in connection with the acquisition of affiliated companies in 2011, receivables, deferred tax assets, prepaid expenses, equipment and other assets.
Sponsored offering costs are organizational and offering costs for our sponsored REITs. We pay the organizational and offering costs for these offerings and in return earn asset management fees and receive promotional interests should returns be met above certain thresholds when the company terminates. We may also serve as the property manager, which entitles us to earn property management and ancillary fees. These organizational and offering costs are deferred and amortized over the expected life of the sponsored company. As of December 31, 2020 and 2019, we had $21,059 and $20,530 of unamortized sponsored offering costs, respectively.
Unsecured Promissory Notes
The 2017 and 2019 6% Notes and 2017 6.25% Notes are unsecured notes issued to investors outside of the United States. These notes are described in Note 7. These instruments are similar in nature, have fixed interest rates and maturity dates, and are denominated in U.S. dollars.
11
Cottonwood Residential II, Inc.
Notes to Consolidated Financial Statements - (Continued)
(Amounts in Thousands, Except Property, Share and Unit Data)
Preferred Stock
Series 2016 Preferred Stock and Series 2017 Preferred Stock are described in Note 8. These instruments are similar in nature and classified as liabilities on the consolidated balance sheet due to the mandatory redemption of these instruments on a fixed date for a fixed amount. Preferred stock distributions are recorded as interest expense.
Debt Financing Costs
Debt financing costs are presented as a direct deduction from the carrying amount of the associated debt liability, which includes mortgage notes, unsecured promissory notes, and preferred stock. Debt financing costs are amortized over the life of the related debt through interest expense.
Revenue Recognition
We lease our multifamily residential units with rents generally due on a monthly basis. Terms are one year or less, renewable upon consent of both parties on an annual or monthly basis. Rental and other property revenues is recognized in accordance with Accounting Standards Codification ("ASC") No. 842, Leases ("Topic 842"). Rental and other property revenues represented approximately 80% of our total revenue for the year ended December 31, 2020.
Our non-lease related revenue consists of income earned from our property management, development, and advisory services. Property management and development revenue is derived primarily from our property management services, development and construction work, and internet services. Advisory services revenue is derived from services provided to our sponsored REITs and based on a percent of gross asset value, as defined in the advisory services agreements.
Non-lease revenues are recognized in accordance with Accounting Standards Update No. 2014-09, Revenue from Contracts with Customers ("Topic 606") ("ASU 2014-09"), as subsequently amended. We adopted this standard on January 1, 2020 using the modified retrospective approach. The guidance requires that revenue (outside of the scope of Topic 842) is recognized when a customer obtains control of promised goods or services in an amount that reflects the consideration the entity expects to receive in exchange for those goods or services. The adoption of this ASU did not have a material impact on our consolidated financial statements or our accounting policies and did not result in an opening adjustment to retained earnings.
Leases
On January 1, 2020, we adopted Topic 842 using the modified retrospective transition approach. This standard established new principles, presentation and disclosure requirements for lease accounting for both the lessee and lessor. Under the new standard, lessors generally account for leases in a similar manner as previous lease accounting guidance. Lessees recognize a lease obligation liability and a right-of-use asset for all leases with terms of more than twelve months, and record lease expense in a similar manner to past practice.
The adoption of the new lease standard did not result in a significant change in the accounting for our rental revenues. We have elected the practical expedient to account for separate lease and non-lease components as a single lease component and report as one line item, “Rental and other property revenues”.
We are also the lessee of office and other operating leases which are immaterial to us.
12
Cottonwood Residential II, Inc.
Notes to Consolidated Financial Statements - (Continued)
(Amounts in Thousands, Except Property, Share and Unit Data)
Income Taxes
CRII, as a REIT, is not subject to federal income tax with respect to that portion of its income that meets certain criteria and is distributed annually to stockholders. To continue to qualify as a REIT, we must meet certain organizational and operational requirements, including a requirement to distribute at least 90% of the REIT’s taxable income, excluding net capital gains, to stockholders. We have adhered to, and intend to continue to adhere to, these requirements to maintain REIT status. If we fail to qualify as a REIT in any taxable year, we will be subject to federal income taxes at regular corporate rates and may not qualify as a REIT for four subsequent taxable years. As a qualified REIT, we are still subject to certain state and local taxes and may be subject to federal income and excise taxes on undistributed taxable income. For the years ended December 31, 2020 and 2019, 100% (unaudited) of all distributions to stockholders were reported as a return of capital. In addition, taxable income from activities managed through our taxable REIT subsidiary (“TRS”) are subject to federal, state and local income taxes. Provision for such taxes has been included in income tax expense on our consolidated statements of operations.
The Operating Partnership is generally not subject to federal and state income taxes. OP Unit holders, including CRII, are subject to tax on their respective allocable shares of the Operating Partnership’s taxable income. However, there are certain states that require an entity level tax on the Operating Partnership.
We determine deferred tax assets and liabilities applicable to the TRS based on differences between financial reporting and tax bases of existing assets and liabilities. A deferred tax asset is recognized for unused tax losses, tax credits and deductible temporary differences, only to the extent that it is more likely than not that future taxable profits will be available against which they can be utilized. We recognize interest and penalties relating to uncertain tax positions in income tax expense when incurred.
Our net deferred tax assets were fully allowed for in 2019. In 2020, we released the full valuation allowance primarily as a result of the passage of the CARES act and projected fees from our development services. The release created a benefit of $1,214. For the year ended December 31, 2020, we had an income tax benefit of $3,590, of which $2,050 was current and $1,540 was deferred. For the year ended December 31, 2020, we had an income tax provision of $292, of which all was current. As of December 31, 2020, our net deferred tax asset was $1,540.
Noncontrolling Interests
The portion of ownership interests in consolidated entities not attributable to CRII are reported as noncontrolling interests. Equity and net income (loss) directly attributable to CRII and to noncontrolling interests are presented separately on the consolidated financial statements. Changes in noncontrolling ownership interests are accounted for as equity transactions.
Noncontrolling interest – limited partners – These noncontrolling interests represent OP Units not held by CRII, the general partner. Net income or loss is allocated to noncontrolling interests in the Operating Partnership based on ownership percentage. It is calculated by dividing the weighted average number of OP Units held by the limited partners by the total number of OP Units outstanding (i.e. OP Units held by CRII and the limited partners). Issuance of additional Common Stock and OP Units changes the ownership interests of both CRII and the limited partners in the Operating Partnership.
Consistent with the one-for-one relationship between the OP Units issued to CRII, limited partners are attributed a share of net income or loss in the Operating Partnership based on their weighted average ownership interest in the Operating Partnership during the period.
Noncontrolling interest – partially owned entities – These noncontrolling interests represent ownership interests that are not held by us in consolidated entities. Net income (loss) is allocated to noncontrolling interests in partially owned entities based on ownership percentage in those entities.
Refer to Note 10 for more information on our noncontrolling interests.
13
Cottonwood Residential II, Inc.
Notes to Consolidated Financial Statements - (Continued)
(Amounts in Thousands, Except Property, Share and Unit Data)
Recent Accounting Pronouncements
The following table provides a brief description of recent accounting pronouncements that could have a material effect on our consolidated financial statements:
| Standard | Description | Required date of adoption | Effect on the Financial Statements or Other Significant Matters | ||||||||
ASU 2016-13, Financial Instruments - Credit Losses (Topic 326): Measurement of Credit Losses on Financial Instruments | This ASU requires entities to estimate a lifetime expected credit loss for most financial assets, including trade and other receivables and other long term financings including available for sale and held-to-maturity debt securities, and loans. Subsequently, the FASB issued ASU 2018-19, Codification Improvements to Topic 326, Financial Instruments-Credit Losses, which amends the scope of ASU 2016-13 and clarified that receivables arising from operating leases are not within the scope of the standard and should continue to be accounted for in accordance with the leases standard (Topic 842). | January 1, 2023 | ASU 2016-13 affects entities holding financial assets and net investments in leases that are not accounted for at fair value through net income. The amendments in ASU 2016-13 require a financial asset (or a group of financial assets) measured at amortized cost basis to be presented at the net amount expected to be collected. We are evaluating the impact of adopting ASU 2016-13 on our financial statements. | ||||||||
3. Real Estate Assets
The following table summarizes the carrying amounts of our consolidated real estate assets:
| December 31, | |||||||||||
| 2020 | 2019 | ||||||||||
Land | $ | 121,029 | $ | 103,372 | |||||||
Construction in progress (1) | 168,836 | 15,570 | |||||||||
Depreciable property: | |||||||||||
Buildings and improvement | 624,672 | 624,671 | |||||||||
Furniture, fixtures, and equipment | 30,114 | 26,302 | |||||||||
Intangible assets | 17,976 | 17,976 | |||||||||
| 962,627 | 787,891 | ||||||||||
Less: Accumulated depreciation and amortization | (139,058) | (112,070) | |||||||||
Real estate assets, net | $ | 823,569 | $ | 675,821 | |||||||
(1) Includes construction in progress for our development projects and capitalized costs for improvements not yet placed in service at our stabilized properties. | |||||||||||
Change of Control
Sugarmont is a development in Salt Lake City, UT that we invested in through a joint venture (the "Sugarmont JV") with a third-party developer (the "Sugarmont JV Partner"). The project commenced in July 2016. Due to continued delays, Sugarmont JV terminated the initial general contractor and engaged a replacement general contractor in 2019. In November 2020, we became the primary beneficiary and consolidated Sugarmont JV, a VIE, by replacing the Sugarmont JV Partner as the manager and obtaining control. The assets and liabilities of Sugarmont JV were recorded at fair value, along with a loss of $2,543 related to the difference between the (1) the reported amount of our equity method investment in Sugarmont JV and the fair value of noncontrolling interest; and (2) the net fair value of Sugarmont JV's identifiable assets and liabilities. The consolidation of Sugarmont JV added $119,532 of capitalized development costs to the consolidated balance sheet.
14
Cottonwood Residential II, Inc.
Notes to Consolidated Financial Statements - (Continued)
(Amounts in Thousands, Except Property, Share and Unit Data)
Asset Acquisition
In January 2019, we consolidated Heights at Meridian through the purchase of a 10% controlling ownership interest. The Heights at Meridian interest was purchased for approximately $3,200 in cash. We had no ownership of or investment in Heights at Meridian prior to the acquisition. Acquired assets were recorded at relative fair value as follows:
| Allocated Amounts | ||||||||||||||||||||
| Property | Consolidation Date | Land | Building | Property Improvements | Intangible | Net Other | ||||||||||||||
| Heights at Meridian | January 8, 2019 | $ | 5,855 | $ | 52,920 | $ | 4,153 | $ | 1,658 | $ | 942 | |||||||||
4. Investments in Unconsolidated Real Estate Entities
Stabilized Properties
Our equity method investments consisted of the following as of December 31, 2020 and 2019, respectively:
| December 31, | ||||||||||||||
| Property | % Owned | 2020 | 2019 | |||||||||||
| Stabilized Assets | ||||||||||||||
| 3800 Main | 50.0% | $ | 6,152 | $ | 6,892 | |||||||||
| Cottonwood Bayview | 71.0% | 21,127 | 22,368 | |||||||||||
| Cottonwood Ridgeview | 90.5% | 3,086 | 3,974 | |||||||||||
| Fox Point | 52.8% | 5,428 | 5,640 | |||||||||||
| Toscana at Valley Ridge | 58.6% | 3,689 | 3,988 | |||||||||||
| Development Projects | ||||||||||||||
| Sugarmont JV | — | 24,690 | ||||||||||||
| Melrose Phase II | 4,175 | 4,175 | ||||||||||||
| Other | 1,066 | 1,288 | ||||||||||||
| Total | $ | 44,723 | $ | 73,015 | ||||||||||
In 2019, we recognized gains of $6,823 from the sale of two equity method investments. Selected information on our stabilized assets is found in Appendix B to these consolidated financial statements (unaudited).
Other Projects and Investments
For the years ended December 31, 2020 and 2019, we had equity method investments in development projects and other real estate related investments. These investments have various capital commitments, promotes and preferred returns as outlined in their respective governing documents. The decrease in our investments in unconsolidated real estate entities during the year ended December 31, 2020 was driven primarily by the consolidation of Sugarmont, which was previously accounted for as an equity method investment. Refer to Note 3.
5. Transactions with Related Parties
Related Party Notes
As of December 31, 2020 and 2019, our Operating Partnership had outstanding notes to senior executives. These notes were created under an executive compensation plan whereby the Operating Partnership could lend money to senior executives so they could purchase interests in affiliated real estate and business related entities. The loans cover the senior executives' equity investment and additional capital commitments, if necessary, for their acquired interests. Half of the loans are nonrecourse and secured by the executive’s interest in the respective entity, the other half are recourse and secured by certain collateral. Nonrecourse loans cannot exceed 50% of the applicable executive’s investment in the applicable entity. The nonrecourse loans and recourse loans bear interest at a rate of 5.75% and 4.75%, respectively. They mature no later than June 30, 2024.
15
Cottonwood Residential II, Inc.
Notes to Consolidated Financial Statements - (Continued)
(Amounts in Thousands, Except Property, Share and Unit Data)
The Advisor has also issued a $2,000 unsecured revolving note to CMRI and a $2,600 unsecured revolving note to CMRII that bear interest of 6% per annum and mature on June 30, 2021. These sponsored REITs may draw on this note as needs required.
The following table summarized the related party notes as described above:
| December 31, | |||||||||||||||||
| Lender | Debtor | Investment Type | 2020 | 2019 | |||||||||||||
| Operating Partnership | Senior Executives | Cottonwood Communities Advisor | $ | 6,457 | $ | 6,457 | |||||||||||
| Operating Partnership | Senior Executives | Park Avenue Development | — | 1,811 | |||||||||||||
| Operating Partnership | Senior Executives | Broadway Development | — | 940 | |||||||||||||
| Cottonwood Communities Advisor | Cottonwood Multifamily REIT I, Inc. | Sponsored REIT | 996 | — | |||||||||||||
| Cottonwood Communities Advisor | Cottonwood Multifamily REIT II, Inc. | Sponsored REIT | 1,724 | — | |||||||||||||
| $ | 9,177 | $ | 9,208 | ||||||||||||||
In 2020, the notes provided to certain senior executives for their investment in the Park Avenue and Broadway developments increased to $2,800 and $1,714, respectively. On October 1, 2020, the executives transferred to the Operating Partnership the rights to a 5% preferred return and the capital interest associated with their respective investments in exchange for the notes. Each of these senior executives continue to hold residual interests in Park Avenue and Broadway.
The exchange of the Broadway investment was accounted for as an equity transaction as we acquired an additional interest in a previously consolidated entity. The entity holding the employee's interest in Park Avenue is a VIE. We acquired an ownership interest in this entity through the exchange and consolidated it as the new primary beneficiary.
Related Party Receivables
As of December 31, 2020 and 2019, we had receivables of $1,187 and $1,485 from entities for which we sponsor, manage or to which we are affiliated. These receivables are generally short term in nature and cover operating and other obligations on behalf of these entities.
Other Transactions with Related Parties
We own a de minimis number of shares in our sponsored REITs. We received asset management fees of $5,316 and $2,717 during the years ended December 31, 2020 and 2019, respectively, for our advisory services to these sponsored REITs.
6. Deficiency Notes
In 2019, we began funding Sugarmont JV's capital calls in the form of deficiency notes, which included the Sugarmont JV Partner's capital commitment, under the terms of our joint venture agreement. The notes bear interest at 10% for the first 90 days and 18% thereafter. The notes can be converted to capital contributions at any time after 180 days of making the deficit loan.
As of 12/31/2019, we had outstanding deficiency notes to Sugarmont JV of $10,130. The deficiency notes remain outstanding but were eliminated when Sugarmont JV was consolidated in 2020. Refer to Note 3.
16
Cottonwood Residential II, Inc.
Notes to Consolidated Financial Statements - (Continued)
(Amounts in Thousands, Except Property, Share and Unit Data)
7. Debt
Mortgage Notes, Net
Our mortgage notes are summarized as follows:
| December 31, | |||||||||||
| 2020 | 2019 | ||||||||||
Fixed rate mortgage notes | $ | 193,032 | $ | 252,275 | |||||||
Variable rate mortgage notes | 440,813 | 321,317 | |||||||||
| Total mortgage notes | 633,845 | 573,592 | |||||||||
Unamortized debt financing costs | (5,803) | (5,141) | |||||||||
| Mortgage notes, net | $ | 628,042 | $ | 568,451 | |||||||
Each mortgage note is collateralized or cross-collateralized by real estate. The mortgage notes outstanding at December 31, 2020 mature at various dates from 2022 through 2030, with a weighted average remaining term of approximately 6.2 years. The weighted average interest rate of our fixed rate mortgage notes was 4.03% and 4.14% at December 31, 2020 and 2019, respectively. The weighted average interest rate of our variable rate mortgage notes was 2.57% and 3.92% at December 31, 2020 and 2019, respectively.
Principal payments on mortgage notes for years subsequent to December 31, 2020, are as follows:
Year | Total | ||||
| 2021 | $ | 1,371 | |||
| 2022 | 17,187 | ||||
| 2023 | 83,465 | ||||
| 2024 | 140,383 | ||||
| 2025 | 4,135 | ||||
Thereafter | 387,304 | ||||
| $ | 633,845 | ||||
Construction Loans, Net
In 2020, we began drawing on construction loan facilities for two development projects. Information on those construction loans are as follows:
| Amount Drawn as of | ||||||||||||||
| Development | Interest Rate | Final Expiration Date | Loan Amount | December 31, 2020 | ||||||||||
| Sugarmont | 3.50% | October 1, 2022 | $ | 63,250 | $ | 41,646 | ||||||||
| Park Ave | Daily Libor + 1.9% | May 15, 2023 | 37,000 | 8,361 | ||||||||||
| $ | 100,250 | $ | 50,007 | |||||||||||
17
Cottonwood Residential II, Inc.
Notes to Consolidated Financial Statements - (Continued)
(Amounts in Thousands, Except Property, Share and Unit Data)
Unsecured Promissory Notes, Net
Our Operating Partnership has issued unsecured promissory notes to investors outside of the United States. These notes are subordinate to all debt of the Operating Partnership. Each note has two 1-year extension options during which the interest rate will increase 0.25% each additional period.
Information on our unsecured promissory notes are as follows:
| December 31, | ||||||||||||||||||||
| Offering Size | Interest Rate | Maturity Date | 2020 | 2019 | ||||||||||||||||
| 2017 6.25% Notes | $ | 5,000 | 6.25% | December 31, 2021 | $ | 5,000 | $ | 4,000 | ||||||||||||
| 2017 6% Notes | 35,000 | 6.00% | December 31, 2022 | 20,918 | 20,918 | |||||||||||||||
| 2019 6% Notes | 25,000 | 6.00% | December 31, 2023 | 22,725 | 22,675 | |||||||||||||||
| Unamortized debt financing costs | (2,001) | (2,764) | ||||||||||||||||||
| $ | 65,000 | $ | 46,642 | $ | 44,829 | |||||||||||||||
8. Preferred Stock
Our Series 2016 Preferred Stock and Series 2017 Preferred Stock receive a fixed preferred dividend based on a cumulative, but not compounded, annual return, have a fixed redemption date and are classified as liabilities on the consolidated balance sheets. We have the option to extend redemption of preferred stock for two 1-year extension periods, subject to an increase in the preferred dividend rate. We can also redeem the preferred stock early for cash at $10.20 per share plus all accrued and unpaid dividends. Dividends to preferred stockholders are classified as interest expense on the consolidated statement of operations.
Information on our preferred stock is as follows:
| Shares Outstanding at December 31, | |||||||||||||||||
| Dividend Rate | Extension Dividend Rate | Redemption Date | 2020 | 2019 | |||||||||||||
| Series 2016 Preferred Stock | 6.5% | 7.0% | January 31, 2021 | 14,149,943 | 14,277,566 | ||||||||||||
| Series 2017 Preferred Stock | 7.5% | 8.0% | January 31, 2022 | 258,550 | 258,550 | ||||||||||||
During the years ended December 31, 2020 and 2019, we incurred $9,239 and $9,349 in dividends on our Series 2016 Preferred Stock, and $194 and $197 in dividends on our Series 2017 Preferred Stock, respectively. We also redeemed 127,622 shares of Series 2016 Preferred Stock for $1,192 and 174,150 shares of Series 2016 Preferred Stock for $1,640 during the years ended December 31, 2020 and 2019. In December 2020, we elected to exercise our first one-year extension option on the Series 2016 Preferred Stock.
Series 2016 Preferred Stock and Series 2017 Preferred Stock have priority over common stock. Series 2016 Preferred Stock has a priority that is equal to Series 2017 Preferred Stock, except with respect to the earlier redemption date.
9. Stockholders' Equity
The Company's authorized and outstanding shares are summarized below:
| Shares Outstanding at December 31, | ||||||||||||||
| Class | Shares Authorized | 2020 | 2019 | |||||||||||
| Common Stock Total | 1,100,000,000 | 213,484 | 297,650 | |||||||||||
| Voting Common Stock | 50 | 50 | 50 | |||||||||||
| Non-Voting Common Stock | 2,000,000 | 213,434 | 213,434 | |||||||||||
| Non-Voting Series B Common Stock | 100,000 | — | 84,166 | |||||||||||
18
Cottonwood Residential II, Inc.
Notes to Consolidated Financial Statements - (Continued)
(Amounts in Thousands, Except Property, Share and Unit Data)
Voting Common Stock
At December 31, 2020 and 2019, 50 voting shares of Common Stock were outstanding. These shares are indirectly owned by senior executives of the Company.
Non-Voting Common Stock
At December 31, 2020, there were 213,434 shares of non-voting Common Stock outstanding. During 2020 we redeemed the shares designated as Series B Common Stock for $1,802. At December 31, 2019, there were 297,600 shares of non-voting Common Stock outstanding, of which 84,166 shares were Series B Common Stock.
10. Noncontrolling Interests
Noncontrolling Interests - Limited Partners
Common Limited OP Units and LTIP Units are Operating Partnership units not owned by CRII and collectively referred to as “Noncontrolling Interests – Limited Partners”.
Common Limited OP Units - Common Limited OP Units share in the profits, losses and cash distributions of the Operating Partnership as defined in the partnership agreement, subject to certain special allocations.
During 2019, we issued approximately 493,700 OP Units for real estate interests. We also repurchased approximately 820,800 OP Units for $15,492, of which $11,526 related to OP Units issued to employees with the conversion of their LTIP Units as a result of a restructuring transaction in 2018.
During the year ended December 31, 2020, we declared distributions to noncontrolling OP Unit holders of $13,422, of which $12,310 were paid and $1,112 were accrued. During the year ended December 31, 2019, we declared distributions to noncontrolling OP Unit holders of $13,079, of which $11,978 were paid and $1,101 were accrued.
LTIP Units - Certain executives and key employees receive Time-Based LTIP Unit Awards (“Time Awards”) and Performance-Based LTIP Unit Awards (“Performance Awards”), together “LTIP Units”, as a form of share based compensation. LTIP Units are partnership interests in the Operating Partnership constituting profits interests and have no voting rights in the Company.
Vesting of Time Awards is based on continued service. Vesting of Performance Awards is based on internal rate of return hurdles over a specified period. Time Awards receive the same distributions on a per unit basis as holders of OP Units. During the performance period, 10% of the Performance Awards receive the same distributions as holders of OP Units. At the end of the performance period additional LTIP Units are issued to cover unpaid distributions on actual LTIP Units earned.
Vested awards that receive the requisite allocation of book income through the operation of tax rules automatically convert into OP Units on a one-for-one basis and may in turn be converted into shares of Common Stock of CR II upon certain events.
As of December 31, 2020, there were 352,277 unvested Time Awards and 250,618 unvested Performance Awards outstanding. Share based compensation was $2,987 and $2,302 for the years ended December 31, 2020 and 2019, respectively. Total unrecognized compensation expense for LTIP Units at December 31, 2020 is $3,379 and is expected to be recognized on a straight-line basis through December 2023.
The fair value of Time and Performance Awards is determined based on a combination of third-party appraisals, third-party valuations and other market data points, such as the price used for the Restructuring Transactions and LTIP Unit redemptions.
Noncontrolling Interests - Partially Owned Entities
As of December 31, 2020, noncontrolling interests in entities not wholly owned by us ranged from 1% to 91%, with the average being 50%.
19
Cottonwood Residential II, Inc.
Notes to Consolidated Financial Statements - (Continued)
(Amounts in Thousands, Except Property, Share and Unit Data)
11. Commitments and Contingencies
Legal Proceedings
We are subject to a variety of legal actions for personal injury, property damage, or other matters arising in the ordinary course of its business, most of which are covered by liability insurance. Various claims of employment and resident discrimination are also periodically brought, most of which also are covered by insurance. While the resolution of these matters cannot be predicted with certainty, we believe the final outcome of such legal proceedings and claims will not have a material adverse effect on our liquidity, financial position or results of operations.
Operating Leases
We have operating leases for office space and office equipment with remaining terms of one to three years. Future minimum lease payments on these operating leases are not significant.
Environmental
As an owner of real estate, we are subject to various federal, state and local environmental laws. Compliance with existing laws has not had a material adverse effect on us. However, we cannot predict the impact of new or changed laws or regulations on our properties or on properties that we may acquire in the future.
COVID-19 Pandemic
One of the most significant risks and uncertainties facing the real estate industry generally continues to be the effect of the ongoing public health crisis of the novel coronavirus (COVID-19) pandemic. During the year ended December 31, 2020, we did not experience significant disruptions in our operations from the COVID-19 pandemic; however we continue to closely monitor the impact of the COVID-19 pandemic on all aspects of our business, including how the pandemic will impact our tenants and multifamily communities.
12. Subsequent Events
We had the following activity subsequent to December 31, 2020:
Merger with CCI
In March 2021, the holders of Common Limited OP Units voted in favor of merging CRII with CCI and our Operating Partnership with Cottonwood Communities's Operating Partnership ("CCOP") in a stock for stock and unit for unit transaction. The exchange ratio was 2.015 of CCI shares and units for one of ours. As a result of these mergers, the separate existence of CRII and CCOP will cease. Our Operating Partnership will survive as the new operating partnership of CCI. Refer to CCI's filings furnished to the U.S. Securities and Exchange Commission for further information regarding these mergers.
LTIP Grants
On January 2, 2021, we issued 57,290 Time Awards and 114,575 Performance Awards to board members, certain executives and key employees.
Sale of Timber Ridge
On April 13, 2021, Timber Ridge was sold for $33,350. We received proceeds of $4,434 related to our investment in the property.
20
Cottonwood Residential II, Inc.
Notes to Consolidated Financial Statements - (Continued)
(Amounts in Thousands, Except Property, Share and Unit Data)
Sugarmont
On April 19, 2021, we entered into a settlement agreement and release (the "Settlement Agreement") with the Sugarmont JV Partner on the Sugarmont project whereby we acquired all but one percent of the Sugarmont JV Partner's interest in the project for $4,950. The one percent interest retained by the Sugarmont JV Partner is limited in that it holds no membership or economic rights other than the right to control on behalf of Sugarmont JV the prosecution and resolutions of all litigation, claims, or causes of action that Sugarmont JV has or may have against certain third parties associated with the design and construction of Sugarmont ("Third-Party Claims"), as well as the obligation to defend any cross-claims resulting from these actions ("Third-Party Cross Claims"). The Sugarmont JV Partner will be responsible for payment of all upfront legal costs and expenses but will be reimbursed to the extent there is sufficient recover. Proceeds from any settlement of these claims will be split 70% to the Sugarmont JV Partner and 30% to us, after the payment of Third-Party Cross Claims, legal fees and other expenses as outlined in the Settlement Agreement. As a result of the settlement, all lawsuits and disputes between us and the Sugarmont JV Partner were settled and we were confirmed as the sole manager of Sugarmont JV. We have the right to purchase the Sugarmont JV Partner's remaining one percent interest upon the settlement or final resolution of all Third-Party Claims or Third-Party Cross Claims.
21
Cottonwood Residential II, Inc.
Appendix A: Real Estate and Accumulated Depreciation (Unaudited)
(Amounts in Thousands, Except Property, Share and Unit Data)
| Initial Cost to Company | December 31, 2020 | |||||||||||||||||||||||||||||||||||||||||||||||||
| Property Name | Property Location | Number of Units | Year(s) Built | Percent Owned by the Operating Partnership | Land | Buildings, Intangibles and Improvements | Cost Capitalized Subsequent to Acquisition | Land | Buildings and Fixtures | Total | Accumulated Depreciation and Amortization | Total Cost, Net | Encumbrances | |||||||||||||||||||||||||||||||||||||
| Stabilized Multifamily Communities | ||||||||||||||||||||||||||||||||||||||||||||||||||
| Alpha Mill | Charlotte, NC | 267 | 2007, 2014 | 10.0% | $ | 8,156 | $ | 43,770 | $ | 1,427 | $ | 8,156 | $ | 45,163 | $ | 53,319 | $ | (8,549) | $ | 44,770 | $ | (36,265) | ||||||||||||||||||||||||||||
| Cason Estates | Murfreesboro, TN | 262 | 2005 | 100.0% | 1,865 | 25,028 | 440 | 1,865 | 25,463 | 27,328 | (4,568) | 22,760 | (33,594) | |||||||||||||||||||||||||||||||||||||
| Cottonwood | Salt Lake City, UT | 264 | 1986 | 100.0% | 3,290 | 20,645 | 1,278 | 3,290 | 21,921 | 25,211 | (3,992) | 21,219 | (21,645) | |||||||||||||||||||||||||||||||||||||
| Cottonwood Reserve | Charlotte, NC | 352 | 2004 | 91.1% | 2,911 | 34,987 | 11,277 | 3,757 | 45,411 | 49,168 | (10,180) | 38,988 | (38,788) | |||||||||||||||||||||||||||||||||||||
| Cottonwood Westside | Atlanta, GA | 197 | 2014 | 10.0% | 5,894 | 37,107 | 852 | 5,894 | 37,954 | 43,848 | (6,901) | 36,947 | (25,655) | |||||||||||||||||||||||||||||||||||||
| Enclave at Golden Triangle | Keller, TX | 273 | 2006 | 98.9% | 2,523 | 23,984 | 1,565 | 2,523 | 25,545 | 28,068 | (7,226) | 20,842 | (34,000) | |||||||||||||||||||||||||||||||||||||
| Heights at Meridian | Durham, NC | 339 | 2015 | 10.0% | 5,882 | 58,703 | 308 | 5,882 | 59,008 | 64,890 | (6,093) | 58,797 | (33,750) | |||||||||||||||||||||||||||||||||||||
| Melrose | Nashville, TN | 220 | 2015 | 100.0% | 6,181 | 52,920 | 458 | 6,181 | 53,371 | 59,552 | (10,036) | 49,516 | (47,100) | |||||||||||||||||||||||||||||||||||||
| Parc Westborough | Westborough, MA | 249 | 2016 | 35.7% | 10,221 | 55,179 | 269 | 10,221 | 55,444 | 65,665 | (7,068) | 58,597 | (38,010) | |||||||||||||||||||||||||||||||||||||
| Pavilions | Albuquerque, NM | 240 | 1992 | 96.4% | 2,100 | 24,437 | 5,222 | 2,100 | 29,651 | 31,751 | (12,454) | 19,297 | (37,350) | |||||||||||||||||||||||||||||||||||||
| Raveneaux | Houston, TX | 382 | 2000 | 97.0% | 3,423 | 45,308 | 2,387 | 3,423 | 47,688 | 51,111 | (9,816) | 41,295 | (26,675) | |||||||||||||||||||||||||||||||||||||
| Regatta | Houston, TX | 490 | 1968-1976 | 100.0% | 4,633 | 21,033 | 2,037 | 4,633 | 23,053 | 27,686 | (3,697) | 23,989 | (35,367) | |||||||||||||||||||||||||||||||||||||
| Retreat at Peachtree | Peachtree City, GA | 312 | 1999 | 100.0% | 6,415 | 38,790 | 1,666 | 6,415 | 40,446 | 46,861 | (9,979) | 36,882 | (48,719) | |||||||||||||||||||||||||||||||||||||
| Scott Mountain | Portland, OR | 262 | 1997, 2000 | 95.8% | 3,500 | 34,672 | 2,496 | 3,500 | 37,163 | 40,663 | (9,352) | 31,311 | (48,373) | |||||||||||||||||||||||||||||||||||||
| Stonebriar of Frisco | Frisco, TX | 306 | 1999 | 84.2% | 3,785 | 22,843 | 3,110 | 3,785 | 25,958 | 29,743 | (7,922) | 21,821 | (36,400) | |||||||||||||||||||||||||||||||||||||
| Summer Park | Buford, GA | 358 | 2001 | 98.7% | 6,596 | 30,116 | 529 | 6,596 | 30,640 | 37,236 | (3,713) | 33,523 | (44,620) | |||||||||||||||||||||||||||||||||||||
| Timber Ridge | Mobile, AL | 320 | 1998, 2000 | 30.4% | 1,833 | 21,614 | 3,521 | 1,833 | 25,135 | 26,968 | (7,865) | 19,103 | (15,274) | |||||||||||||||||||||||||||||||||||||
| The Marq Highland Park | Tampa, FL | 239 | 2015 | 10.0% | 2,962 | 43,039 | 868 | 2,962 | 43,906 | 46,868 | (9,647) | 37,221 | (32,260) | |||||||||||||||||||||||||||||||||||||
| Development Projects | ||||||||||||||||||||||||||||||||||||||||||||||||||
| Sugarmont | Salt Lake City, UT | 341 | N/A | 60.6% | 15,037 | 113,179 | — | 15,037 | 113,460 | 128,497 | — | 128,497 | (41,646) | |||||||||||||||||||||||||||||||||||||
| Broadway | Salt Lake City, UT | 254 | N/A | 18.8% | 6,215 | 31,796 | — | 6,215 | 31,796 | 38,011 | — | 38,011 | (8,361) | |||||||||||||||||||||||||||||||||||||
| Other Developments | Various | 484 | N/A | Various | 16,761 | 22,373 | — | 16,761 | 23,422 | 40,183 | — | 40,183 | — | |||||||||||||||||||||||||||||||||||||
| 6,411 | $ | 120,183 | $ | 801,523 | $ | 39,710 | $ | 121,029 | $ | 841,598 | $ | 962,627 | $ | (139,058) | $ | 823,569 | $ | (683,852) | ||||||||||||||||||||||||||||||||
22
Cottonwood Residential II, Inc.
Appendix B: Selected Financial Data on Unconsolidated Stabilized Property Investments (Unaudited)
(Amounts in Thousands, Except Property, Share and Unit Data)
| Balance Sheet Information as of December 31, 2020 | Operating data for the period ending December 31, 2020 | |||||||||||||||||||||||||||||||||||||||||||||||||||||||
| Property | Location | % Owned | Apartment Units | Real Estate Assets, Net | Other Assets | Mortgage Debt | Other Liabilities | Equity | Revenue | Direct Expenses | Interest | Management Fee | Net Operating Income | Depreciation | Other Income (Loss) | Property Income (Loss) | ||||||||||||||||||||||||||||||||||||||||
| 3800 Main | Houston, TX | 50.0% | 319 | $ | 44,850 | $ | 2,435 | $ | 36,283 | $ | 1,673 | $ | 9,329 | $ | 5,623 | $ | 2,937 | $ | 1,165 | $ | 148 | $ | 1,373 | $ | 1,721 | $ | (48) | $ | (300) | |||||||||||||||||||||||||||
| Cottonwood Bayview | St. Petersburg, FL | 71.0% | 309 | 66,240 | 1,073 | 48,163 | 341 | 18,809 | 7,109 | 2,919 | 1,897 | 213 | 2,080 | 2,522 | 29 | (471) | ||||||||||||||||||||||||||||||||||||||||
| Cottonwood Ridgeview | Plano, TX | 90.5% | 322 | 36,369 | 1,744 | 30,394 | 1,294 | 6,425 | 5,740 | 2,516 | 1,330 | 172 | 1,722 | 1,689 | 57 | (24) | ||||||||||||||||||||||||||||||||||||||||
| Fox Point | Salt Lake City, UT | 52.8% | 398 | 25,263 | 1,171 | 20,809 | 338 | 5,287 | 5,461 | 1,721 | 705 | 218 | 2,817 | 1,226 | 8 | 1,583 | ||||||||||||||||||||||||||||||||||||||||
| Toscana at Valley Ridge | Lewisville, TX | 58.6% | 288 | 24,103 | 1,355 | 18,157 | 806 | 6,495 | 4,019 | 1,698 | 824 | 121 | 1,376 | 1,150 | (50) | 276 | ||||||||||||||||||||||||||||||||||||||||
| 1,636 | $ | 196,825 | $ | 7,778 | $ | 153,806 | $ | 4,452 | $ | 46,345 | $ | 27,952 | $ | 11,791 | $ | 5,921 | $ | 872 | $ | 9,368 | $ | 8,308 | $ | (4) | $ | 1,064 | ||||||||||||||||||||||||||||||
23