Attached files
| file | filename |
|---|---|
| EX-99.1 - EX-99.1 - Griffin-American Healthcare REIT IV, Inc. | d153975dex991.htm |
| EX-10.1 - EX-10.1 - Griffin-American Healthcare REIT IV, Inc. | d153975dex101.htm |
| EX-2.1 - EX-2.1 - Griffin-American Healthcare REIT IV, Inc. | d153975dex21.htm |
| 8-K - 8-K - Griffin-American Healthcare REIT IV, Inc. | d153975d8k.htm |
Exhibit 99.2 TRI-PARTY MERGER PRESENTATION JUNE 2021Exhibit 99.2 TRI-PARTY MERGER PRESENTATION JUNE 2021
Disclaimers Forward-Looking Statements This presentation contains statements that constitute “forward-looking statements,” as such term is defined in Section 27A of the Securities Act of 1933, as amended (the “Securities Act”), and Section 21E of the Securities Exchange Act of 1934, as amended (the “Exchange Act”), and such statements are intended to be covered by the safe harbor provided by the same. These statements are based on management’s current expectations and beliefs and are subject to a number of trends and uncertainties that could cause actual results to differ materially from those described in the forward-looking statements; no assurance can be given that these expectations will be attained. Factors that could cause actual results to differ materially from these expectations include, but are not limited to, the risk that the proposed merger will not be consummated within the expected time period or at all; the occurrence of any event, change or other circumstances that could give rise to the termination of the merger agreement; the inability of Griffin-American Healthcare REIT III, Inc. (“GAHR III”) or Griffin-American Healthcare REIT IV, Inc. (“GAHR IV”) to obtain the approval of the merger from its stockholders or the failure to satisfy the other conditions to completion of the merger; GAHR III’s inability to consummate the transaction to become self-managed; the ability of the combined REIT to achieve the expected operational efficiencies and cost savings or to engage in any liquidity event or public offering; the ability to attract institutional investors; risks that the board of directors of the combined REIT will not authorize distributions at the expected rate, or at all; risks related to disruption of management’s attention from the ongoing business operations due to the merger; availability of suitable investment opportunities; changes in interest rates; the availability and terms of financing; the impact of the COVID-19 pandemic on the operations and financial condition of each of GAHR III and GAHR IV and the real estate industries in which they operate, including with respect to occupancy rates, rent deferrals and the financial condition of their respective tenants and operators; general economic conditions; market conditions; legislative and regulatory changes that could adversely affect the business of GAHR III or GAHR IV; and other factors, including those set forth in the Risk Factors section of GAHR III’s and GAHR IV’s most recent Annual Reports on Form 10-K for the year ended December 31, 2020, as updated by GAHR III’s and GAHR IV’s subsequent Quarterly Reports on Form 10-Q for the period ended March 31, 2021, filed with the Securities and Exchange Commission (the “SEC”), and other reports filed by GAHR III and GAHR IV with the SEC, copies of which are available on the SEC’s website, www.sec.gov. GAHR III and GAHR IV undertake no obligation to update these statements for revisions or changes after the date of this release, except as required by law. 2Disclaimers Forward-Looking Statements This presentation contains statements that constitute “forward-looking statements,” as such term is defined in Section 27A of the Securities Act of 1933, as amended (the “Securities Act”), and Section 21E of the Securities Exchange Act of 1934, as amended (the “Exchange Act”), and such statements are intended to be covered by the safe harbor provided by the same. These statements are based on management’s current expectations and beliefs and are subject to a number of trends and uncertainties that could cause actual results to differ materially from those described in the forward-looking statements; no assurance can be given that these expectations will be attained. Factors that could cause actual results to differ materially from these expectations include, but are not limited to, the risk that the proposed merger will not be consummated within the expected time period or at all; the occurrence of any event, change or other circumstances that could give rise to the termination of the merger agreement; the inability of Griffin-American Healthcare REIT III, Inc. (“GAHR III”) or Griffin-American Healthcare REIT IV, Inc. (“GAHR IV”) to obtain the approval of the merger from its stockholders or the failure to satisfy the other conditions to completion of the merger; GAHR III’s inability to consummate the transaction to become self-managed; the ability of the combined REIT to achieve the expected operational efficiencies and cost savings or to engage in any liquidity event or public offering; the ability to attract institutional investors; risks that the board of directors of the combined REIT will not authorize distributions at the expected rate, or at all; risks related to disruption of management’s attention from the ongoing business operations due to the merger; availability of suitable investment opportunities; changes in interest rates; the availability and terms of financing; the impact of the COVID-19 pandemic on the operations and financial condition of each of GAHR III and GAHR IV and the real estate industries in which they operate, including with respect to occupancy rates, rent deferrals and the financial condition of their respective tenants and operators; general economic conditions; market conditions; legislative and regulatory changes that could adversely affect the business of GAHR III or GAHR IV; and other factors, including those set forth in the Risk Factors section of GAHR III’s and GAHR IV’s most recent Annual Reports on Form 10-K for the year ended December 31, 2020, as updated by GAHR III’s and GAHR IV’s subsequent Quarterly Reports on Form 10-Q for the period ended March 31, 2021, filed with the Securities and Exchange Commission (the “SEC”), and other reports filed by GAHR III and GAHR IV with the SEC, copies of which are available on the SEC’s website, www.sec.gov. GAHR III and GAHR IV undertake no obligation to update these statements for revisions or changes after the date of this release, except as required by law. 2

Disclaimers Additional Information and Where to Find It In connection with the proposed merger, GAHR IV will file with the SEC a registration statement on Form S-4 containing a Joint Proxy Statement/Prospectus jointly prepared by GAHR III and GAHR IV, and other related documents. The Joint Proxy Statement/Prospectus will contain important information about the merger and related matters. INVESTORS ARE URGED TO READ THE JOINT PROXY STATEMENT/PROSPECTUS (INCLUDING ALL AMENDMENTS AND SUPPLEMENTS THERETO) AND OTHER RELEVANT DOCUMENTS FILED BY GAHR III AND GAHR IV WITH THE SEC CAREFULLY IF AND WHEN THEY BECOME AVAILABLE BECAUSE THEY WILL CONTAIN IMPORTANT INFORMATION ABOUT GAHR III, GAHR IV AND THE PROPOSED MERGER. Investors and stockholders of GAHR III and GAHR IV may obtain free copies of the registration statement, the Joint Proxy Statement/Prospectus and other relevant documents filed by GAHR III and GAHR IV with the SEC (if and when they become available) through the website maintained by the SEC at www.sec.gov. Copies of the documents filed by GAHR III and GAHR IV with the SEC are also available free of charge on GAHR III’s and GAHR IV’s websites at http://www.healthcarereit3.com and http://www.healthcarereitiv.com, respectively. Participants in Solicitation Relating to the Merger GAHR III and GAHR IV and their respective directors and officers and other members of management may be deemed to be participants in the solicitation of proxies in respect of the proposed merger. Information regarding GAHR III’s directors and executive officers can be found in GAHR III’s 2020 Annual Report on Form 10-K filed with the SEC on March 25, 2021. Information regarding GAHR IV’s directors and executive officers can be found in GAHR IV’s 2020 Annual Report on Form 10-K filed with the SEC on March 26, 2021. Additional information regarding the interests of such potential participants will be included in the Joint Proxy Statement/Prospectus and other relevant documents filed with the SEC in connection with the merger if and when they become available. These documents are available free of charge on the SEC’s website and from GAHR III or GAHR IV, as applicable, using the sources indicated above. 3Disclaimers Additional Information and Where to Find It In connection with the proposed merger, GAHR IV will file with the SEC a registration statement on Form S-4 containing a Joint Proxy Statement/Prospectus jointly prepared by GAHR III and GAHR IV, and other related documents. The Joint Proxy Statement/Prospectus will contain important information about the merger and related matters. INVESTORS ARE URGED TO READ THE JOINT PROXY STATEMENT/PROSPECTUS (INCLUDING ALL AMENDMENTS AND SUPPLEMENTS THERETO) AND OTHER RELEVANT DOCUMENTS FILED BY GAHR III AND GAHR IV WITH THE SEC CAREFULLY IF AND WHEN THEY BECOME AVAILABLE BECAUSE THEY WILL CONTAIN IMPORTANT INFORMATION ABOUT GAHR III, GAHR IV AND THE PROPOSED MERGER. Investors and stockholders of GAHR III and GAHR IV may obtain free copies of the registration statement, the Joint Proxy Statement/Prospectus and other relevant documents filed by GAHR III and GAHR IV with the SEC (if and when they become available) through the website maintained by the SEC at www.sec.gov. Copies of the documents filed by GAHR III and GAHR IV with the SEC are also available free of charge on GAHR III’s and GAHR IV’s websites at http://www.healthcarereit3.com and http://www.healthcarereitiv.com, respectively. Participants in Solicitation Relating to the Merger GAHR III and GAHR IV and their respective directors and officers and other members of management may be deemed to be participants in the solicitation of proxies in respect of the proposed merger. Information regarding GAHR III’s directors and executive officers can be found in GAHR III’s 2020 Annual Report on Form 10-K filed with the SEC on March 25, 2021. Information regarding GAHR IV’s directors and executive officers can be found in GAHR IV’s 2020 Annual Report on Form 10-K filed with the SEC on March 26, 2021. Additional information regarding the interests of such potential participants will be included in the Joint Proxy Statement/Prospectus and other relevant documents filed with the SEC in connection with the merger if and when they become available. These documents are available free of charge on the SEC’s website and from GAHR III or GAHR IV, as applicable, using the sources indicated above. 3
Disclaimers No Offer or Solicitation This communication and the information contained herein does not constitute an offer to sell or the solicitation of an offer to buy or sell any securities or a solicitation of a proxy or of any vote or approval, nor shall there be any sale of securities in any jurisdiction in which such offer, solicitation or sale would be unlawful prior to registration or qualification under the securities laws of any such jurisdiction. No offering of securities shall be made except by means of a prospectus meeting the requirements of Section 10 of the Securities Act. This communication may be deemed to be solicitation material in respect of the proposed merger. 4Disclaimers No Offer or Solicitation This communication and the information contained herein does not constitute an offer to sell or the solicitation of an offer to buy or sell any securities or a solicitation of a proxy or of any vote or approval, nor shall there be any sale of securities in any jurisdiction in which such offer, solicitation or sale would be unlawful prior to registration or qualification under the securities laws of any such jurisdiction. No offering of securities shall be made except by means of a prospectus meeting the requirements of Section 10 of the Securities Act. This communication may be deemed to be solicitation material in respect of the proposed merger. 4
Contents I. Executive Summary II. Strategic Benefits – REIT Merger III. Strategic Benefits – Sponsor Acquisition IV. Market Opportunity V. Process, Timing, and Other Impacts Reno, NV - MOB 5Contents I. Executive Summary II. Strategic Benefits – REIT Merger III. Strategic Benefits – Sponsor Acquisition IV. Market Opportunity V. Process, Timing, and Other Impacts Reno, NV - MOB 5
Executive Summary Planned liquidity through combination of businesses* Overland, MO - MOB 6 * There can be no guarantee that the combined REIT will effect a listing of its common stock or any other type of liquidity event.Executive Summary Planned liquidity through combination of businesses* Overland, MO - MOB 6 * There can be no guarantee that the combined REIT will effect a listing of its common stock or any other type of liquidity event.
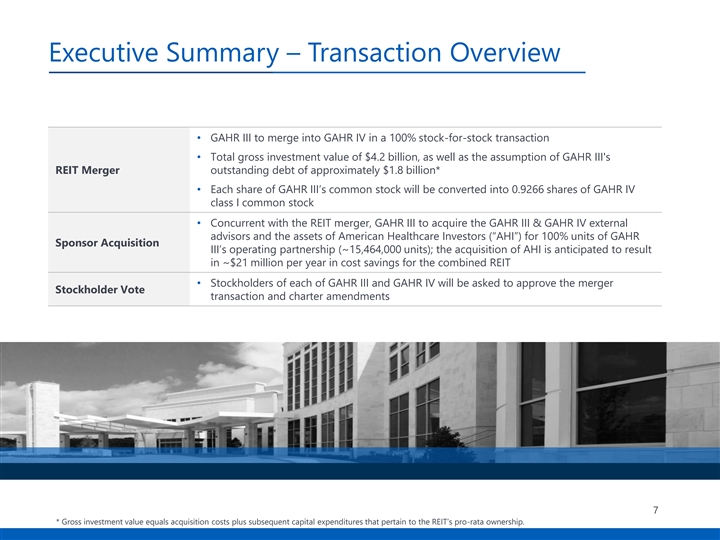
Executive Summary – Transaction Overview • GAHR III to merge into GAHR IV in a 100% stock-for-stock transaction • Total gross investment value of $4.2 billion, as well as the assumption of GAHR III's REIT Merger outstanding debt of approximately $1.8 billion* • Each share of GAHR III’s common stock will be converted into 0.9266 shares of GAHR IV class I common stock • Concurrent with the REIT merger, GAHR III to acquire the GAHR III & GAHR IV external advisors and the assets of American Healthcare Investors (“AHI”) for 100% units of GAHR Sponsor Acquisition III’s operating partnership (~15,464,000 units); the acquisition of AHI is anticipated to result in ~$21 million per year in cost savings for the combined REIT • Stockholders of each of GAHR III and GAHR IV will be asked to approve the merger Stockholder Vote transaction and charter amendments 7 * Gross investment value equals acquisition costs plus subsequent capital expenditures that pertain to the REIT’s pro-rata ownership.Executive Summary – Transaction Overview • GAHR III to merge into GAHR IV in a 100% stock-for-stock transaction • Total gross investment value of $4.2 billion, as well as the assumption of GAHR III's REIT Merger outstanding debt of approximately $1.8 billion* • Each share of GAHR III’s common stock will be converted into 0.9266 shares of GAHR IV class I common stock • Concurrent with the REIT merger, GAHR III to acquire the GAHR III & GAHR IV external advisors and the assets of American Healthcare Investors (“AHI”) for 100% units of GAHR Sponsor Acquisition III’s operating partnership (~15,464,000 units); the acquisition of AHI is anticipated to result in ~$21 million per year in cost savings for the combined REIT • Stockholders of each of GAHR III and GAHR IV will be asked to approve the merger Stockholder Vote transaction and charter amendments 7 * Gross investment value equals acquisition costs plus subsequent capital expenditures that pertain to the REIT’s pro-rata ownership.
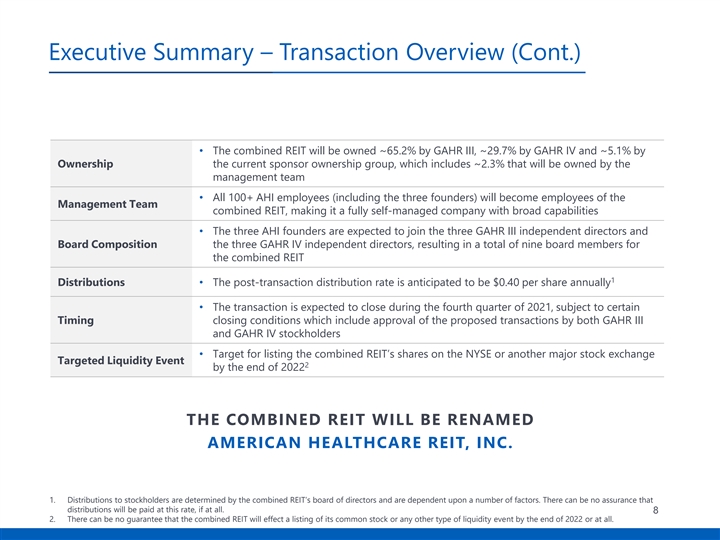
Executive Summary – Transaction Overview (Cont.) • The combined REIT will be owned ~65.2% by GAHR III, ~29.7% by GAHR IV and ~5.1% by Ownership the current sponsor ownership group, which includes ~2.3% that will be owned by the management team • All 100+ AHI employees (including the three founders) will become employees of the Management Team combined REIT, making it a fully self-managed company with broad capabilities • The three AHI founders are expected to join the three GAHR III independent directors and Board Composition the three GAHR IV independent directors, resulting in a total of nine board members for the combined REIT 1 Distributions• The post-transaction distribution rate is anticipated to be $0.40 per share annually • The transaction is expected to close during the fourth quarter of 2021, subject to certain Timing closing conditions which include approval of the proposed transactions by both GAHR III and GAHR IV stockholders • Target for listing the combined REIT’s shares on the NYSE or another major stock exchange Targeted Liquidity Event 2 by the end of 2022 THE COMBINED REIT WILL BE RENAMED AMERICAN HEALTHCARE REIT, INC. 1. Distributions to stockholders are determined by the combined REIT’s board of directors and are dependent upon a number of factors. There can be no assurance that distributions will be paid at this rate, if at all. 8 2. There can be no guarantee that the combined REIT will effect a listing of its common stock or any other type of liquidity event by the end of 2022 or at all.Executive Summary – Transaction Overview (Cont.) • The combined REIT will be owned ~65.2% by GAHR III, ~29.7% by GAHR IV and ~5.1% by Ownership the current sponsor ownership group, which includes ~2.3% that will be owned by the management team • All 100+ AHI employees (including the three founders) will become employees of the Management Team combined REIT, making it a fully self-managed company with broad capabilities • The three AHI founders are expected to join the three GAHR III independent directors and Board Composition the three GAHR IV independent directors, resulting in a total of nine board members for the combined REIT 1 Distributions• The post-transaction distribution rate is anticipated to be $0.40 per share annually • The transaction is expected to close during the fourth quarter of 2021, subject to certain Timing closing conditions which include approval of the proposed transactions by both GAHR III and GAHR IV stockholders • Target for listing the combined REIT’s shares on the NYSE or another major stock exchange Targeted Liquidity Event 2 by the end of 2022 THE COMBINED REIT WILL BE RENAMED AMERICAN HEALTHCARE REIT, INC. 1. Distributions to stockholders are determined by the combined REIT’s board of directors and are dependent upon a number of factors. There can be no assurance that distributions will be paid at this rate, if at all. 8 2. There can be no guarantee that the combined REIT will effect a listing of its common stock or any other type of liquidity event by the end of 2022 or at all.
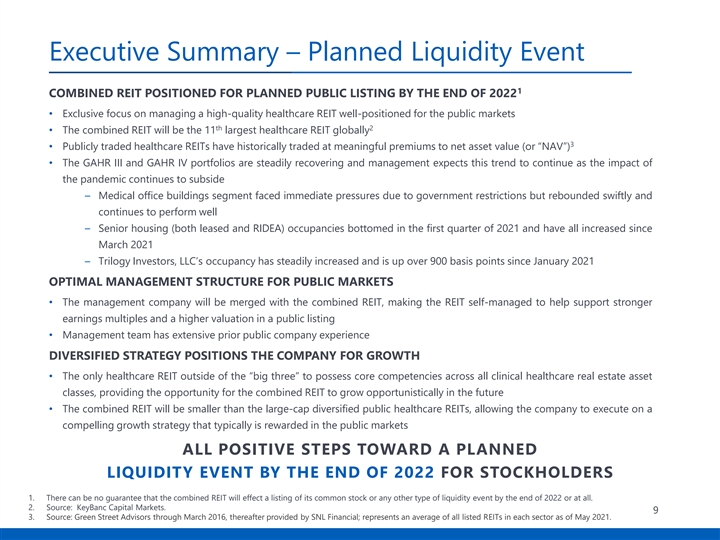
Executive Summary – Planned Liquidity Event 1 COMBINED REIT POSITIONED FOR PLANNED PUBLIC LISTING BY THE END OF 2022 • Exclusive focus on managing a high-quality healthcare REIT well-positioned for the public markets th 2 • The combined REIT will be the 11 largest healthcare REIT globally 3 • Publicly traded healthcare REITs have historically traded at meaningful premiums to net asset value (or “NAV”) • The GAHR III and GAHR IV portfolios are steadily recovering and management expects this trend to continue as the impact of the pandemic continues to subside – Medical office buildings segment faced immediate pressures due to government restrictions but rebounded swiftly and continues to perform well – Senior housing (both leased and RIDEA) occupancies bottomed in the first quarter of 2021 and have all increased since March 2021 – Trilogy Investors, LLC’s occupancy has steadily increased and is up over 900 basis points since January 2021 OPTIMAL MANAGEMENT STRUCTURE FOR PUBLIC MARKETS • The management company will be merged with the combined REIT, making the REIT self-managed to help support stronger earnings multiples and a higher valuation in a public listing • Management team has extensive prior public company experience DIVERSIFIED STRATEGY POSITIONS THE COMPANY FOR GROWTH • The only healthcare REIT outside of the “big three” to possess core competencies across all clinical healthcare real estate asset classes, providing the opportunity for the combined REIT to grow opportunistically in the future • The combined REIT will be smaller than the large-cap diversified public healthcare REITs, allowing the company to execute on a compelling growth strategy that typically is rewarded in the public markets ALL POSITIVE STEPS TOWARD A PLANNED LIQUIDITY EVENT BY THE END OF 2022 FOR STOCKHOLDERS 1. There can be no guarantee that the combined REIT will effect a listing of its common stock or any other type of liquidity event by the end of 2022 or at all. 2. Source: KeyBanc Capital Markets. 9 3. Source: Green Street Advisors through March 2016, thereafter provided by SNL Financial; represents an average of all listed REITs in each sector as of May 2021.Executive Summary – Planned Liquidity Event 1 COMBINED REIT POSITIONED FOR PLANNED PUBLIC LISTING BY THE END OF 2022 • Exclusive focus on managing a high-quality healthcare REIT well-positioned for the public markets th 2 • The combined REIT will be the 11 largest healthcare REIT globally 3 • Publicly traded healthcare REITs have historically traded at meaningful premiums to net asset value (or “NAV”) • The GAHR III and GAHR IV portfolios are steadily recovering and management expects this trend to continue as the impact of the pandemic continues to subside – Medical office buildings segment faced immediate pressures due to government restrictions but rebounded swiftly and continues to perform well – Senior housing (both leased and RIDEA) occupancies bottomed in the first quarter of 2021 and have all increased since March 2021 – Trilogy Investors, LLC’s occupancy has steadily increased and is up over 900 basis points since January 2021 OPTIMAL MANAGEMENT STRUCTURE FOR PUBLIC MARKETS • The management company will be merged with the combined REIT, making the REIT self-managed to help support stronger earnings multiples and a higher valuation in a public listing • Management team has extensive prior public company experience DIVERSIFIED STRATEGY POSITIONS THE COMPANY FOR GROWTH • The only healthcare REIT outside of the “big three” to possess core competencies across all clinical healthcare real estate asset classes, providing the opportunity for the combined REIT to grow opportunistically in the future • The combined REIT will be smaller than the large-cap diversified public healthcare REITs, allowing the company to execute on a compelling growth strategy that typically is rewarded in the public markets ALL POSITIVE STEPS TOWARD A PLANNED LIQUIDITY EVENT BY THE END OF 2022 FOR STOCKHOLDERS 1. There can be no guarantee that the combined REIT will effect a listing of its common stock or any other type of liquidity event by the end of 2022 or at all. 2. Source: KeyBanc Capital Markets. 9 3. Source: Green Street Advisors through March 2016, thereafter provided by SNL Financial; represents an average of all listed REITs in each sector as of May 2021.
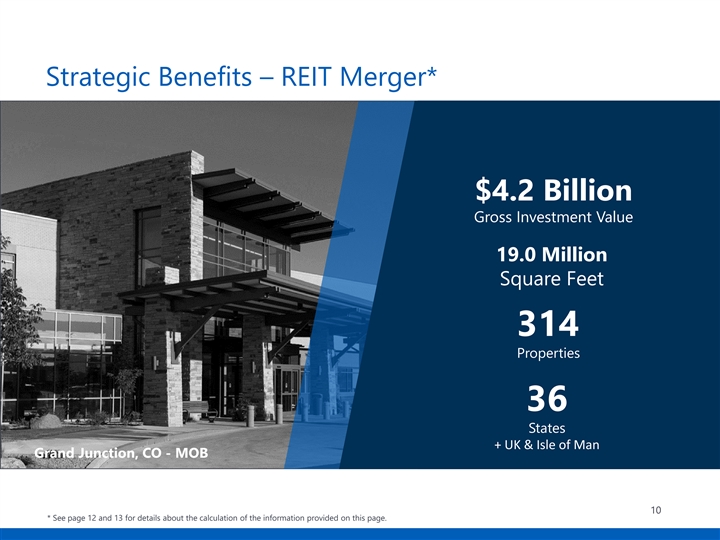
Strategic Benefits – REIT Merger* $4.2 Billion Gross Investment Value 19.0 Million Square Feet 314 Properties 36 States + UK & Isle of Man Grand Junction, CO - MOB 10 * See page 12 and 13 for details about the calculation of the information provided on this page.Strategic Benefits – REIT Merger* $4.2 Billion Gross Investment Value 19.0 Million Square Feet 314 Properties 36 States + UK & Isle of Man Grand Junction, CO - MOB 10 * See page 12 and 13 for details about the calculation of the information provided on this page.
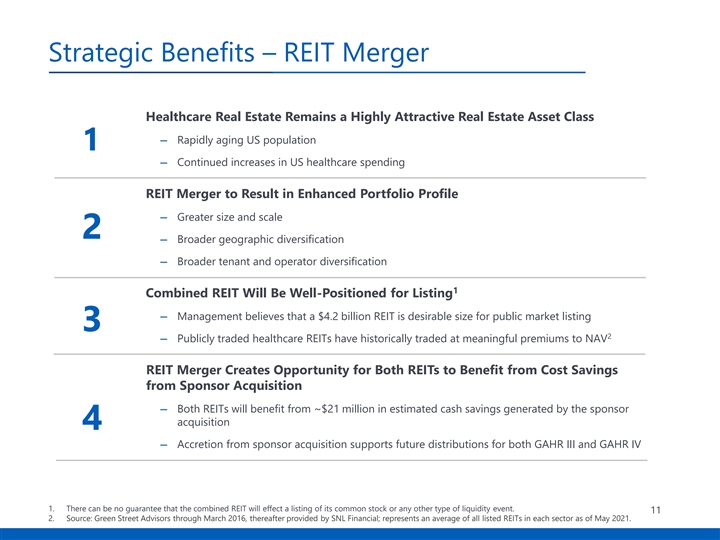
Strategic Benefits – REIT Merger Healthcare Real Estate Remains a Highly Attractive Real Estate Asset Class ― Rapidly aging US population 1 ― Continued increases in US healthcare spending REIT Merger to Result in Enhanced Portfolio Profile ― Greater size and scale 2 ― Broader geographic diversification ― Broader tenant and operator diversification 1 Combined REIT Will Be Well-Positioned for Listing ― Management believes that a $4.2 billion REIT is desirable size for public market listing 3 2 ― Publicly traded healthcare REITs have historically traded at meaningful premiums to NAV REIT Merger Creates Opportunity for Both REITs to Benefit from Cost Savings from Sponsor Acquisition ― Both REITs will benefit from ~$21 million in estimated cash savings generated by the sponsor acquisition 4 ― Accretion from sponsor acquisition supports future distributions for both GAHR III and GAHR IV 1. There can be no guarantee that the combined REIT will effect a listing of its common stock or any other type of liquidity event. 11 2. Source: Green Street Advisors through March 2016, thereafter provided by SNL Financial; represents an average of all listed REITs in each sector as of May 2021.Strategic Benefits – REIT Merger Healthcare Real Estate Remains a Highly Attractive Real Estate Asset Class ― Rapidly aging US population 1 ― Continued increases in US healthcare spending REIT Merger to Result in Enhanced Portfolio Profile ― Greater size and scale 2 ― Broader geographic diversification ― Broader tenant and operator diversification 1 Combined REIT Will Be Well-Positioned for Listing ― Management believes that a $4.2 billion REIT is desirable size for public market listing 3 2 ― Publicly traded healthcare REITs have historically traded at meaningful premiums to NAV REIT Merger Creates Opportunity for Both REITs to Benefit from Cost Savings from Sponsor Acquisition ― Both REITs will benefit from ~$21 million in estimated cash savings generated by the sponsor acquisition 4 ― Accretion from sponsor acquisition supports future distributions for both GAHR III and GAHR IV 1. There can be no guarantee that the combined REIT will effect a listing of its common stock or any other type of liquidity event. 11 2. Source: Green Street Advisors through March 2016, thereafter provided by SNL Financial; represents an average of all listed REITs in each sector as of May 2021.
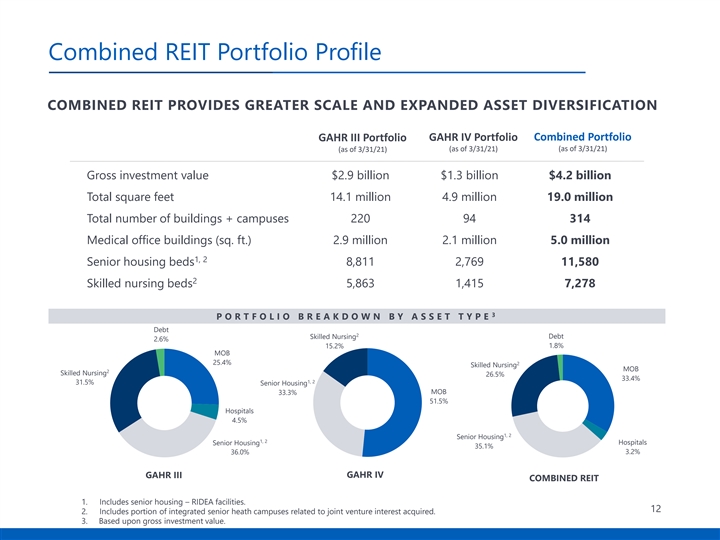
Combined REIT Portfolio Profile COMBINED REIT PROVIDES GREATER SCALE AND EXPANDED ASSET DIVERSIFICATION GAHR III Portfolio GAHR IV Portfolio Combined Portfolio (as of 3/31/21) (as of 3/31/21) (as of 3/31/21) Gross investment value $2.9 billion $1.3 billion $4.2 billion Total square feet 14.1 million 4.9 million 19.0 million Total number of buildings + campuses 220 94 314 Medical office buildings (sq. ft.) 2.9 million 2.1 million 5.0 million 1, 2 Senior housing beds 8,811 2,769 11,580 2 Skilled nursing beds 5,863 1,415 7,278 3 P O R T F O L I O B R E A K D O W N B Y A S S E T T Y P E Debt 2 Skilled Nursing Debt 2.6% 15.2% 1.8% MOB 25.4% 2 Skilled Nursing MOB 2 Skilled Nursing 26.5% 33.4% 1, 2 31.5% Senior Housing MOB 33.3% 51.5% Hospitals 4.5% 1, 2 Senior Housing 1, 2 Senior Housing Hospitals 35.1% 3.2% 36.0% GAHR III GAHR IV COMBINED REIT 1. Includes senior housing – RIDEA facilities. 12 2. Includes portion of integrated senior heath campuses related to joint venture interest acquired. 3. Based upon gross investment value.Combined REIT Portfolio Profile COMBINED REIT PROVIDES GREATER SCALE AND EXPANDED ASSET DIVERSIFICATION GAHR III Portfolio GAHR IV Portfolio Combined Portfolio (as of 3/31/21) (as of 3/31/21) (as of 3/31/21) Gross investment value $2.9 billion $1.3 billion $4.2 billion Total square feet 14.1 million 4.9 million 19.0 million Total number of buildings + campuses 220 94 314 Medical office buildings (sq. ft.) 2.9 million 2.1 million 5.0 million 1, 2 Senior housing beds 8,811 2,769 11,580 2 Skilled nursing beds 5,863 1,415 7,278 3 P O R T F O L I O B R E A K D O W N B Y A S S E T T Y P E Debt 2 Skilled Nursing Debt 2.6% 15.2% 1.8% MOB 25.4% 2 Skilled Nursing MOB 2 Skilled Nursing 26.5% 33.4% 1, 2 31.5% Senior Housing MOB 33.3% 51.5% Hospitals 4.5% 1, 2 Senior Housing 1, 2 Senior Housing Hospitals 35.1% 3.2% 36.0% GAHR III GAHR IV COMBINED REIT 1. Includes senior housing – RIDEA facilities. 12 2. Includes portion of integrated senior heath campuses related to joint venture interest acquired. 3. Based upon gross investment value.
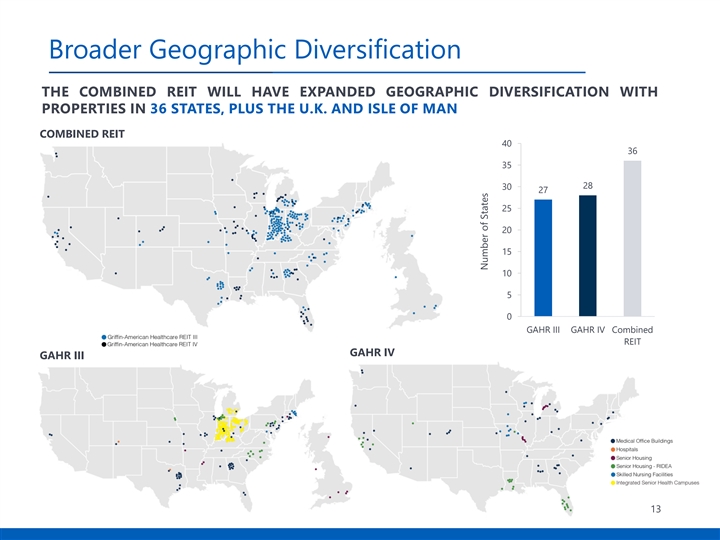
Broader Geographic Diversification GAHR III Portfolio (as of 3/31/16) THE COMBINED REIT WILL HAVE EXPANDED GEOGRAPHIC DIVERSIFICATION WITH PROPERTIES IN 36 STATES, PLUS THE U.K. AND ISLE OF MAN COMBINED REIT 40 36 35 28 30 27 25 20 15 10 5 0 GAHR III GAHR IV Combined REIT GAHR IV GAHR III 13 Number of StatesBroader Geographic Diversification GAHR III Portfolio (as of 3/31/16) THE COMBINED REIT WILL HAVE EXPANDED GEOGRAPHIC DIVERSIFICATION WITH PROPERTIES IN 36 STATES, PLUS THE U.K. AND ISLE OF MAN COMBINED REIT 40 36 35 28 30 27 25 20 15 10 5 0 GAHR III GAHR IV Combined REIT GAHR IV GAHR III 13 Number of States
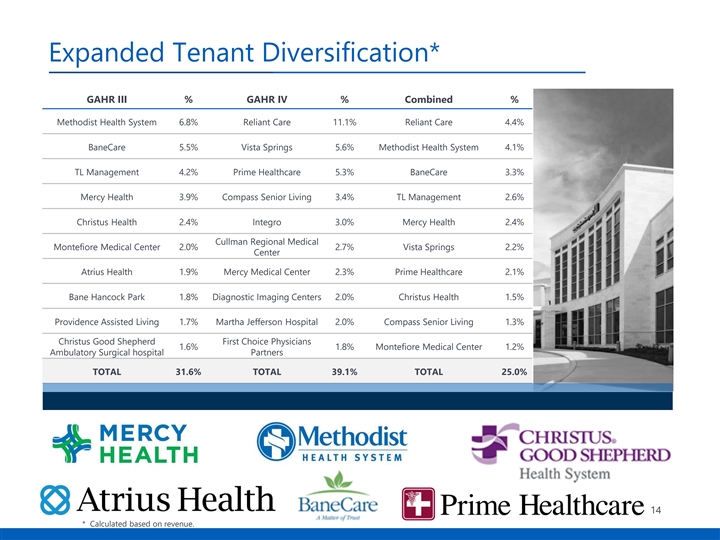
Expanded Tenant Diversification* GAHR III % GAHR IV % Combined % Methodist Health System 6.8% Reliant Care 11.1% Reliant Care 4.4% BaneCare 5.5% Vista Springs 5.6% Methodist Health System 4.1% TL Management 4.2% Prime Healthcare 5.3% BaneCare 3.3% Mercy Health 3.9% Compass Senior Living 3.4% TL Management 2.6% Christus Health 2.4% Integro 3.0% Mercy Health 2.4% Cullman Regional Medical Montefiore Medical Center 2.0% 2.7% Vista Springs 2.2% “TEXT” Center Atrius Health 1.9% Mercy Medical Center 2.3% Prime Healthcare 2.1% Bane Hancock Park 1.8% Diagnostic Imaging Centers 2.0% Christus Health 1.5% Providence Assisted Living 1.7% Martha Jefferson Hospital 2.0% Compass Senior Living 1.3% Christus Good Shepherd First Choice Physicians 1.6% 1.8% Montefiore Medical Center 1.2% Ambulatory Surgical hospital Partners TOTAL 31.6% TOTAL 39.1% TOTAL 25.0% 14 * Calculated based on revenue.Expanded Tenant Diversification* GAHR III % GAHR IV % Combined % Methodist Health System 6.8% Reliant Care 11.1% Reliant Care 4.4% BaneCare 5.5% Vista Springs 5.6% Methodist Health System 4.1% TL Management 4.2% Prime Healthcare 5.3% BaneCare 3.3% Mercy Health 3.9% Compass Senior Living 3.4% TL Management 2.6% Christus Health 2.4% Integro 3.0% Mercy Health 2.4% Cullman Regional Medical Montefiore Medical Center 2.0% 2.7% Vista Springs 2.2% “TEXT” Center Atrius Health 1.9% Mercy Medical Center 2.3% Prime Healthcare 2.1% Bane Hancock Park 1.8% Diagnostic Imaging Centers 2.0% Christus Health 1.5% Providence Assisted Living 1.7% Martha Jefferson Hospital 2.0% Compass Senior Living 1.3% Christus Good Shepherd First Choice Physicians 1.6% 1.8% Montefiore Medical Center 1.2% Ambulatory Surgical hospital Partners TOTAL 31.6% TOTAL 39.1% TOTAL 25.0% 14 * Calculated based on revenue.
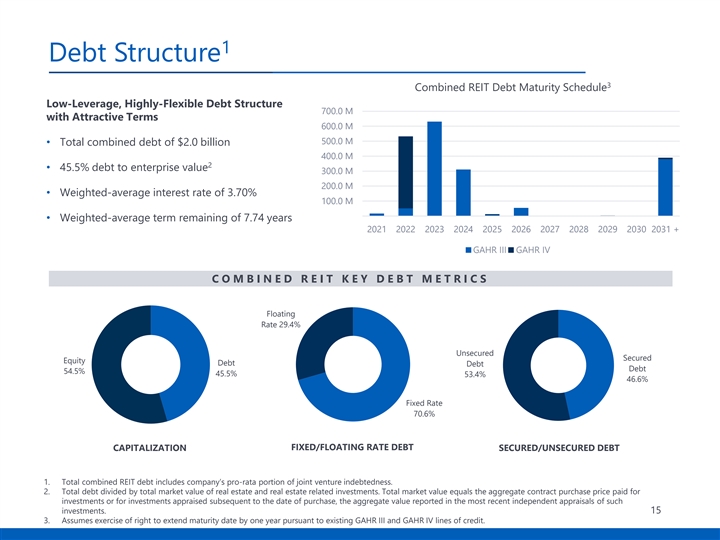
1 Debt Structure 3 Combined REIT Debt Maturity Schedule Low-Leverage, Highly-Flexible Debt Structure 700.0 M with Attractive Terms 600.0 M 500.0 M • Total combined debt of $2.0 billion 400.0 M 2 • 45.5% debt to enterprise value 300.0 M 200.0 M • Weighted-average interest rate of 3.70% 100.0 M • Weighted-average term remaining of 7.74 years 2021 2022 2023 2024 2025 2026 2027 2028 2029 2030 2031 + G REI AH T R IIIIII G REI AH T R IVIV C O M B I N E D R E I T K E Y D E B T M E T R I C S Floating Rate 29.4% Unsecured Secured Equity Debt Debt Debt 54.5% 45.5% 53.4% 46.6% Fixed Rate 70.6% FIXED/FLOATING RATE DEBT CAPITALIZATION SECURED/UNSECURED DEBT 1. Total combined REIT debt includes company’s pro-rata portion of joint venture indebtedness. 2. Total debt divided by total market value of real estate and real estate related investments. Total market value equals the aggregate contract purchase price paid for investments or for investments appraised subsequent to the date of purchase, the aggregate value reported in the most recent independent appraisals of such investments. 15 3. Assumes exercise of right to extend maturity date by one year pursuant to existing GAHR III and GAHR IV lines of credit.1 Debt Structure 3 Combined REIT Debt Maturity Schedule Low-Leverage, Highly-Flexible Debt Structure 700.0 M with Attractive Terms 600.0 M 500.0 M • Total combined debt of $2.0 billion 400.0 M 2 • 45.5% debt to enterprise value 300.0 M 200.0 M • Weighted-average interest rate of 3.70% 100.0 M • Weighted-average term remaining of 7.74 years 2021 2022 2023 2024 2025 2026 2027 2028 2029 2030 2031 + G REI AH T R IIIIII G REI AH T R IVIV C O M B I N E D R E I T K E Y D E B T M E T R I C S Floating Rate 29.4% Unsecured Secured Equity Debt Debt Debt 54.5% 45.5% 53.4% 46.6% Fixed Rate 70.6% FIXED/FLOATING RATE DEBT CAPITALIZATION SECURED/UNSECURED DEBT 1. Total combined REIT debt includes company’s pro-rata portion of joint venture indebtedness. 2. Total debt divided by total market value of real estate and real estate related investments. Total market value equals the aggregate contract purchase price paid for investments or for investments appraised subsequent to the date of purchase, the aggregate value reported in the most recent independent appraisals of such investments. 15 3. Assumes exercise of right to extend maturity date by one year pursuant to existing GAHR III and GAHR IV lines of credit.
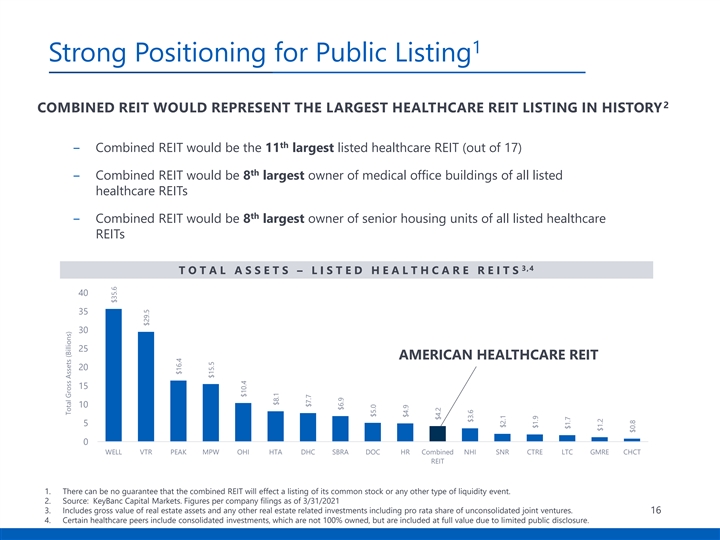
1 Strong Positioning for Public Listing 2 COMBINED REIT WOULD REPRESENT THE LARGEST HEALTHCARE REIT LISTING IN HISTORY th ‒ Combined REIT would be the 11 largest listed healthcare REIT (out of 17) th ‒ Combined REIT would be 8 largest owner of medical office buildings of all listed healthcare REITs th ‒ Combined REIT would be 8 largest owner of senior housing units of all listed healthcare REITs 3,4 T O T A L A S S E T S – L I S T E D H E A L T H C A R E R E I T S 40 35 30 25 AMERICAN HEALTHCARE REIT 20 15 10 5 0 WELL VTR PEAK MPW OHI HTA DHC SBRA DOC HR Combined NHI SNR CTRE LTC GMRE CHCT REIT 1. There can be no guarantee that the combined REIT will effect a listing of its common stock or any other type of liquidity event. 2. Source: KeyBanc Capital Markets. Figures per company filings as of 3/31/2021 3. Includes gross value of real estate assets and any other real estate related investments including pro rata share of unconsolidated joint ventures. 16 4. Certain healthcare peers include consolidated investments, which are not 100% owned, but are included at full value due to limited public disclosure. Total Gross Assets (Billions) $35.6 $29.5 $16.4 $15.5 $10.4 $8.1 $7.7 $6.9 $5.0 $4.9 $4.2 $3.6 $2.1 $1.9 $1.7 $1.2 $0.81 Strong Positioning for Public Listing 2 COMBINED REIT WOULD REPRESENT THE LARGEST HEALTHCARE REIT LISTING IN HISTORY th ‒ Combined REIT would be the 11 largest listed healthcare REIT (out of 17) th ‒ Combined REIT would be 8 largest owner of medical office buildings of all listed healthcare REITs th ‒ Combined REIT would be 8 largest owner of senior housing units of all listed healthcare REITs 3,4 T O T A L A S S E T S – L I S T E D H E A L T H C A R E R E I T S 40 35 30 25 AMERICAN HEALTHCARE REIT 20 15 10 5 0 WELL VTR PEAK MPW OHI HTA DHC SBRA DOC HR Combined NHI SNR CTRE LTC GMRE CHCT REIT 1. There can be no guarantee that the combined REIT will effect a listing of its common stock or any other type of liquidity event. 2. Source: KeyBanc Capital Markets. Figures per company filings as of 3/31/2021 3. Includes gross value of real estate assets and any other real estate related investments including pro rata share of unconsolidated joint ventures. 16 4. Certain healthcare peers include consolidated investments, which are not 100% owned, but are included at full value due to limited public disclosure. Total Gross Assets (Billions) $35.6 $29.5 $16.4 $15.5 $10.4 $8.1 $7.7 $6.9 $5.0 $4.9 $4.2 $3.6 $2.1 $1.9 $1.7 $1.2 $0.8
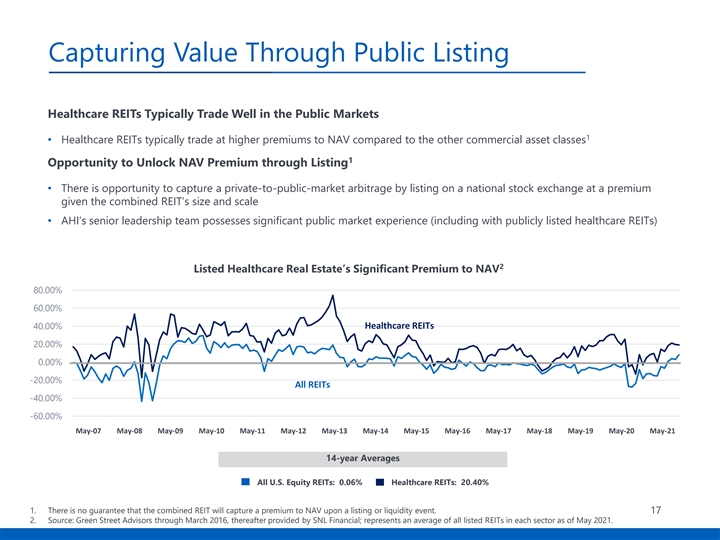
Capturing Value Through Public Listing Healthcare REITs Typically Trade Well in the Public Markets 1 • Healthcare REITs typically trade at higher premiums to NAV compared to the other commercial asset classes 1 Opportunity to Unlock NAV Premium through Listing • There is opportunity to capture a private-to-public-market arbitrage by listing on a national stock exchange at a premium given the combined REIT’s size and scale • AHI’s senior leadership team possesses significant public market experience (including with publicly listed healthcare REITs) 2 Listed Healthcare Real Estate’s Significant Premium to NAV 80.00% 60.00% 40.00% Healthcare REITs 20.00% 0.00% -20.00% All REITs -40.00% -60.00% May-07 May-08 May-09 May-10 May-11 May-12 May-13 May-14 May-15 May-16 May-17 May-18 May-19 May-20 May-21 14-year Averages All U.S. Equity REITs: 0.06% Healthcare REITs: 20.40% 1. There is no guarantee that the combined REIT will capture a premium to NAV upon a listing or liquidity event. 17 2. Source: Green Street Advisors through March 2016, thereafter provided by SNL Financial; represents an average of all listed REITs in each sector as of May 2021.Capturing Value Through Public Listing Healthcare REITs Typically Trade Well in the Public Markets 1 • Healthcare REITs typically trade at higher premiums to NAV compared to the other commercial asset classes 1 Opportunity to Unlock NAV Premium through Listing • There is opportunity to capture a private-to-public-market arbitrage by listing on a national stock exchange at a premium given the combined REIT’s size and scale • AHI’s senior leadership team possesses significant public market experience (including with publicly listed healthcare REITs) 2 Listed Healthcare Real Estate’s Significant Premium to NAV 80.00% 60.00% 40.00% Healthcare REITs 20.00% 0.00% -20.00% All REITs -40.00% -60.00% May-07 May-08 May-09 May-10 May-11 May-12 May-13 May-14 May-15 May-16 May-17 May-18 May-19 May-20 May-21 14-year Averages All U.S. Equity REITs: 0.06% Healthcare REITs: 20.40% 1. There is no guarantee that the combined REIT will capture a premium to NAV upon a listing or liquidity event. 17 2. Source: Green Street Advisors through March 2016, thereafter provided by SNL Financial; represents an average of all listed REITs in each sector as of May 2021.
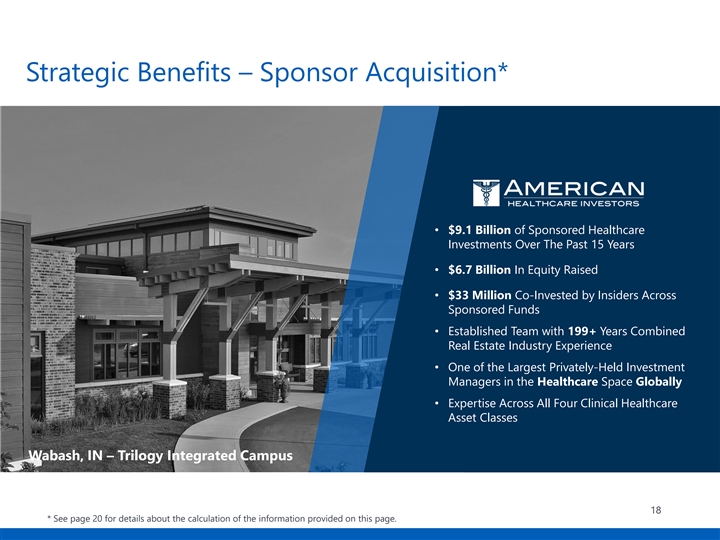
Strategic Benefits – Sponsor Acquisition* “Title” Section Change • $9.1 Billion of Sponsored Healthcare Investments Over The Past 15 Years • $6.7 Billion In Equity Raised • $33 Million Co-Invested by Insiders Across Sponsored Funds • Established Team with 199+ Years Combined Real Estate Industry Experience • One of the Largest Privately-Held Investment Managers in the Healthcare Space Globally • Expertise Across All Four Clinical Healthcare Asset Classes Wabash, IN – Trilogy Integrated Campus 18 * See page 20 for details about the calculation of the information provided on this page.Strategic Benefits – Sponsor Acquisition* “Title” Section Change • $9.1 Billion of Sponsored Healthcare Investments Over The Past 15 Years • $6.7 Billion In Equity Raised • $33 Million Co-Invested by Insiders Across Sponsored Funds • Established Team with 199+ Years Combined Real Estate Industry Experience • One of the Largest Privately-Held Investment Managers in the Healthcare Space Globally • Expertise Across All Four Clinical Healthcare Asset Classes Wabash, IN – Trilogy Integrated Campus 18 * See page 20 for details about the calculation of the information provided on this page.

Rationale and Benefits of Sponsor Acquisition Acquisition of Entire American Healthcare Investors Management Platform ‒ The combined REIT will absorb all 100+ employees of AHI (including the three founders) and its proven 1 track record Significant and Immediate Economic Benefits to Stockholders through Cost Savings 2 ‒ Estimated to result in cost savings of approximately $21 million per year Positions the Combined REIT for Planned Public Listing* ‒ Internal management structure positions the combined REIT to attract new institutional capital at strategically beneficial times and at favorable market terms 3 ‒ In public markets, self-managed REITs have historically traded at a material premium relative to externally-managed REITs Enhanced Alignment of Interests and Continuity of Management ‒ 100% of the purchase price for AHI will be in the form of REIT operating partnership units that may be later converted to American Healthcare REIT common stock, with market lock-up provisions 4 ‒ This structure creates significant and long-term alignment of interests between the management team and stockholders 19 * There can be no guarantee that the combined REIT will effect a listing of its common stock or any other type of liquidity event.Rationale and Benefits of Sponsor Acquisition Acquisition of Entire American Healthcare Investors Management Platform ‒ The combined REIT will absorb all 100+ employees of AHI (including the three founders) and its proven 1 track record Significant and Immediate Economic Benefits to Stockholders through Cost Savings 2 ‒ Estimated to result in cost savings of approximately $21 million per year Positions the Combined REIT for Planned Public Listing* ‒ Internal management structure positions the combined REIT to attract new institutional capital at strategically beneficial times and at favorable market terms 3 ‒ In public markets, self-managed REITs have historically traded at a material premium relative to externally-managed REITs Enhanced Alignment of Interests and Continuity of Management ‒ 100% of the purchase price for AHI will be in the form of REIT operating partnership units that may be later converted to American Healthcare REIT common stock, with market lock-up provisions 4 ‒ This structure creates significant and long-term alignment of interests between the management team and stockholders 19 * There can be no guarantee that the combined REIT will effect a listing of its common stock or any other type of liquidity event.
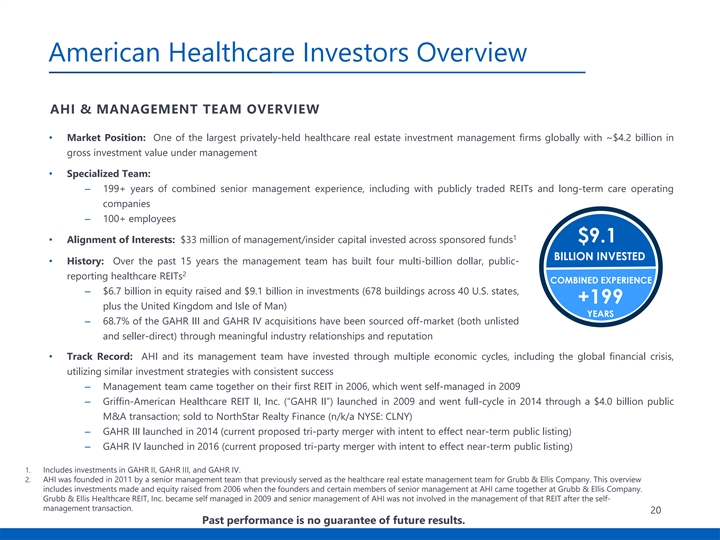
American Healthcare Investors Overview AHI & MANAGEMENT TEAM OVERVIEW • Market Position: One of the largest privately-held healthcare real estate investment management firms globally with ~$4.2 billion in gross investment value under management • Specialized Team: – 199+ years of combined senior management experience, including with publicly traded REITs and long-term care operating companies – 100+ employees 1 • Alignment of Interests: $33 million of management/insider capital invested across sponsored funds $9.1 BILLION INVESTED • History: Over the past 15 years the management team has built four multi-billion dollar, public- 2 reporting healthcare REITs COMBINED EXPERIENCE – $6.7 billion in equity raised and $9.1 billion in investments (678 buildings across 40 U.S. states, +199 plus the United Kingdom and Isle of Man) YEARS – 68.7% of the GAHR III and GAHR IV acquisitions have been sourced off-market (both unlisted and seller-direct) through meaningful industry relationships and reputation • Track Record: AHI and its management team have invested through multiple economic cycles, including the global financial crisis, utilizing similar investment strategies with consistent success – Management team came together on their first REIT in 2006, which went self-managed in 2009 – Griffin-American Healthcare REIT II, Inc. (“GAHR II”) launched in 2009 and went full-cycle in 2014 through a $4.0 billion public M&A transaction; sold to NorthStar Realty Finance (n/k/a NYSE: CLNY) – GAHR III launched in 2014 (current proposed tri-party merger with intent to effect near-term public listing) – GAHR IV launched in 2016 (current proposed tri-party merger with intent to effect near-term public listing) 1. Includes investments in GAHR II, GAHR III, and GAHR IV. 2. AHI was founded in 2011 by a senior management team that previously served as the healthcare real estate management team for Grubb & Ellis Company. This overview includes investments made and equity raised from 2006 when the founders and certain members of senior management at AHI came together at Grubb & Ellis Company. Grubb & Ellis Healthcare REIT, Inc. became self managed in 2009 and senior management of AHI was not involved in the management of that REIT after the self- management transaction. 20 Past performance is no guarantee of future results.American Healthcare Investors Overview AHI & MANAGEMENT TEAM OVERVIEW • Market Position: One of the largest privately-held healthcare real estate investment management firms globally with ~$4.2 billion in gross investment value under management • Specialized Team: – 199+ years of combined senior management experience, including with publicly traded REITs and long-term care operating companies – 100+ employees 1 • Alignment of Interests: $33 million of management/insider capital invested across sponsored funds $9.1 BILLION INVESTED • History: Over the past 15 years the management team has built four multi-billion dollar, public- 2 reporting healthcare REITs COMBINED EXPERIENCE – $6.7 billion in equity raised and $9.1 billion in investments (678 buildings across 40 U.S. states, +199 plus the United Kingdom and Isle of Man) YEARS – 68.7% of the GAHR III and GAHR IV acquisitions have been sourced off-market (both unlisted and seller-direct) through meaningful industry relationships and reputation • Track Record: AHI and its management team have invested through multiple economic cycles, including the global financial crisis, utilizing similar investment strategies with consistent success – Management team came together on their first REIT in 2006, which went self-managed in 2009 – Griffin-American Healthcare REIT II, Inc. (“GAHR II”) launched in 2009 and went full-cycle in 2014 through a $4.0 billion public M&A transaction; sold to NorthStar Realty Finance (n/k/a NYSE: CLNY) – GAHR III launched in 2014 (current proposed tri-party merger with intent to effect near-term public listing) – GAHR IV launched in 2016 (current proposed tri-party merger with intent to effect near-term public listing) 1. Includes investments in GAHR II, GAHR III, and GAHR IV. 2. AHI was founded in 2011 by a senior management team that previously served as the healthcare real estate management team for Grubb & Ellis Company. This overview includes investments made and equity raised from 2006 when the founders and certain members of senior management at AHI came together at Grubb & Ellis Company. Grubb & Ellis Healthcare REIT, Inc. became self managed in 2009 and senior management of AHI was not involved in the management of that REIT after the self- management transaction. 20 Past performance is no guarantee of future results.
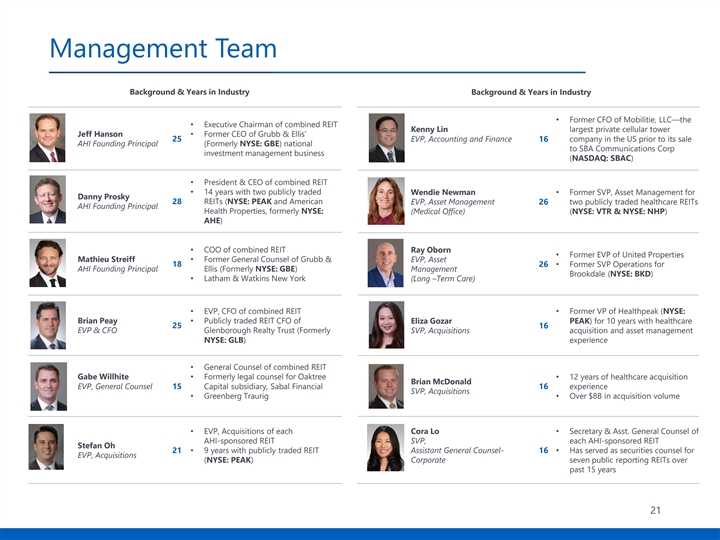
Management Team Background & Years in Industry Background & Years in Industry • Former CFO of Mobilitie, LLC—the • Executive Chairman of combined REIT Kenny Lin largest private cellular tower Jeff Hanson• Former CEO of Grubb & Ellis’ 25 EVP, Accounting and Finance 16 company in the US prior to its sale AHI Founding Principal (Formerly NYSE: GBE) national to SBA Communications Corp investment management business (NASDAQ: SBAC) • President & CEO of combined REIT • 14 years with two publicly traded Wendie Newman• Former SVP, Asset Management for Danny Prosky 28 REITs (NYSE: PEAK and American EVP, Asset Management 26 two publicly traded healthcare REITs AHI Founding Principal Health Properties, formerly NYSE: (Medical Office) (NYSE: VTR & NYSE: NHP) AHE) • COO of combined REIT Ray Oborn • Former EVP of United Properties Mathieu Streiff• Former General Counsel of Grubb & EVP, Asset 18 26• Former SVP Operations for AHI Founding Principal Ellis (Formerly NYSE: GBE) Management Brookdale (NYSE: BKD) • Latham & Watkins New York (Long –Term Care) • EVP, CFO of combined REIT• Former VP of Healthpeak (NYSE: Brian Peay• Publicly traded REIT CFO of Eliza Gozar PEAK) for 10 years with healthcare 25 16 EVP & CFO Glenborough Realty Trust (Formerly SVP, Acquisitions acquisition and asset management NYSE: GLB) experience • General Counsel of combined REIT Gabe Willhite• Formerly legal counsel for Oaktree • 12 years of healthcare acquisition Brian McDonald EVP, General Counsel 15 Capital subsidiary, Sabal Financial 16 experience SVP, Acquisitions • Greenberg Traurig• Over $8B in acquisition volume • EVP, Acquisitions of each Cora Lo• Secretary & Asst. General Counsel of AHI-sponsored REIT SVP, each AHI-sponsored REIT Stefan Oh 21• 9 years with publicly traded REIT Assistant General Counsel- 16• Has served as securities counsel for EVP, Acquisitions (NYSE: PEAK) Corporate seven public reporting REITs over past 15 years As of 9/30/19 21Management Team Background & Years in Industry Background & Years in Industry • Former CFO of Mobilitie, LLC—the • Executive Chairman of combined REIT Kenny Lin largest private cellular tower Jeff Hanson• Former CEO of Grubb & Ellis’ 25 EVP, Accounting and Finance 16 company in the US prior to its sale AHI Founding Principal (Formerly NYSE: GBE) national to SBA Communications Corp investment management business (NASDAQ: SBAC) • President & CEO of combined REIT • 14 years with two publicly traded Wendie Newman• Former SVP, Asset Management for Danny Prosky 28 REITs (NYSE: PEAK and American EVP, Asset Management 26 two publicly traded healthcare REITs AHI Founding Principal Health Properties, formerly NYSE: (Medical Office) (NYSE: VTR & NYSE: NHP) AHE) • COO of combined REIT Ray Oborn • Former EVP of United Properties Mathieu Streiff• Former General Counsel of Grubb & EVP, Asset 18 26• Former SVP Operations for AHI Founding Principal Ellis (Formerly NYSE: GBE) Management Brookdale (NYSE: BKD) • Latham & Watkins New York (Long –Term Care) • EVP, CFO of combined REIT• Former VP of Healthpeak (NYSE: Brian Peay• Publicly traded REIT CFO of Eliza Gozar PEAK) for 10 years with healthcare 25 16 EVP & CFO Glenborough Realty Trust (Formerly SVP, Acquisitions acquisition and asset management NYSE: GLB) experience • General Counsel of combined REIT Gabe Willhite• Formerly legal counsel for Oaktree • 12 years of healthcare acquisition Brian McDonald EVP, General Counsel 15 Capital subsidiary, Sabal Financial 16 experience SVP, Acquisitions • Greenberg Traurig• Over $8B in acquisition volume • EVP, Acquisitions of each Cora Lo• Secretary & Asst. General Counsel of AHI-sponsored REIT SVP, each AHI-sponsored REIT Stefan Oh 21• 9 years with publicly traded REIT Assistant General Counsel- 16• Has served as securities counsel for EVP, Acquisitions (NYSE: PEAK) Corporate seven public reporting REITs over past 15 years As of 9/30/19 21
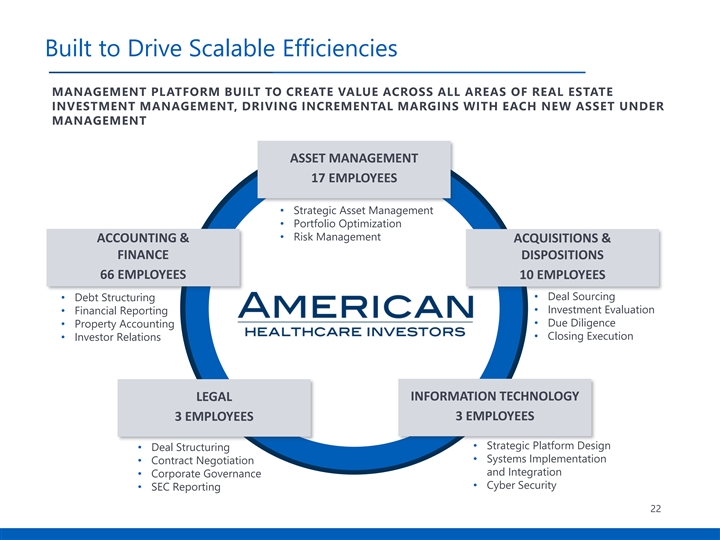
Built to Drive Scalable Efficiencies MANAGEMENT PLATFORM BUILT TO CREATE VALUE ACROSS ALL AREAS OF REAL ESTATE INVESTMENT MANAGEMENT, DRIVING INCREMENTAL MARGINS WITH EACH NEW ASSET UNDER MANAGEMENT ASSET MANAGEMENT 17 EMPLOYEES • Strategic Asset Management • Portfolio Optimization • Risk Management ACCOUNTING & ACQUISITIONS & FINANCE DISPOSITIONS 66 EMPLOYEES 10 EMPLOYEES • Deal Sourcing • Debt Structuring • Investment Evaluation • Financial Reporting • Due Diligence • Property Accounting • Closing Execution • Investor Relations LEGAL INFORMATION TECHNOLOGY 3 EMPLOYEES 3 EMPLOYEES • Strategic Platform Design • Deal Structuring • Systems Implementation • Contract Negotiation and Integration • Corporate Governance • Cyber Security • SEC Reporting 22Built to Drive Scalable Efficiencies MANAGEMENT PLATFORM BUILT TO CREATE VALUE ACROSS ALL AREAS OF REAL ESTATE INVESTMENT MANAGEMENT, DRIVING INCREMENTAL MARGINS WITH EACH NEW ASSET UNDER MANAGEMENT ASSET MANAGEMENT 17 EMPLOYEES • Strategic Asset Management • Portfolio Optimization • Risk Management ACCOUNTING & ACQUISITIONS & FINANCE DISPOSITIONS 66 EMPLOYEES 10 EMPLOYEES • Deal Sourcing • Debt Structuring • Investment Evaluation • Financial Reporting • Due Diligence • Property Accounting • Closing Execution • Investor Relations LEGAL INFORMATION TECHNOLOGY 3 EMPLOYEES 3 EMPLOYEES • Strategic Platform Design • Deal Structuring • Systems Implementation • Contract Negotiation and Integration • Corporate Governance • Cyber Security • SEC Reporting 22
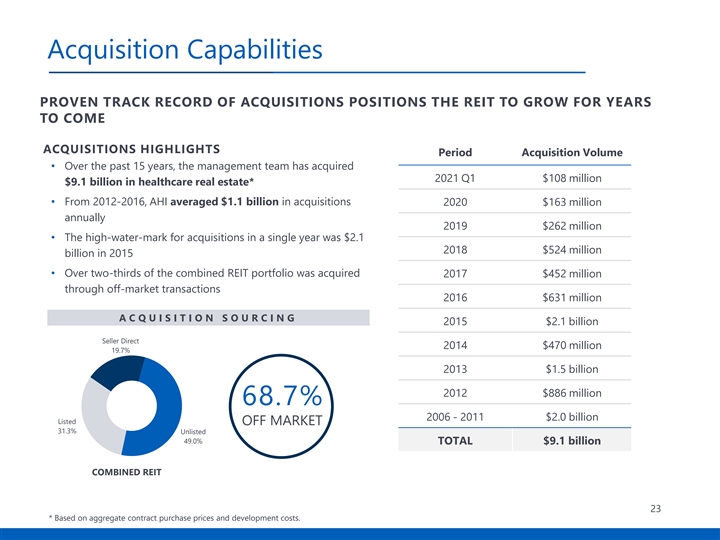
Acquisition Capabilities PROVEN TRACK RECORD OF ACQUISITIONS POSITIONS THE REIT TO GROW FOR YEARS TO COME ACQUISITIONS HIGHLIGHTS Period Acquisition Volume • Over the past 15 years, the management team has acquired 2021 Q1 $108 million $9.1 billion in healthcare real estate* • From 2012-2016, AHI averaged $1.1 billion in acquisitions 2020 $163 million annually 2019 $262 million • The high-water-mark for acquisitions in a single year was $2.1 2018 $524 million billion in 2015 • Over two-thirds of the combined REIT portfolio was acquired 2017 $452 million through off-market transactions 2016 $631 million A C Q U I S I T I O N S O U R C I N G 2015 $2.1 billion Seller Direct 2014 $470 million 19.7% 2013 $1.5 billion 2012 $886 million 68.7% 2006 - 2011 $2.0 billion Listed OFF MARKET 31.3% Unlisted 49.0% TOTAL $9.1 billion COMBINED REIT 23 * Based on aggregate contract purchase prices and development costs.Acquisition Capabilities PROVEN TRACK RECORD OF ACQUISITIONS POSITIONS THE REIT TO GROW FOR YEARS TO COME ACQUISITIONS HIGHLIGHTS Period Acquisition Volume • Over the past 15 years, the management team has acquired 2021 Q1 $108 million $9.1 billion in healthcare real estate* • From 2012-2016, AHI averaged $1.1 billion in acquisitions 2020 $163 million annually 2019 $262 million • The high-water-mark for acquisitions in a single year was $2.1 2018 $524 million billion in 2015 • Over two-thirds of the combined REIT portfolio was acquired 2017 $452 million through off-market transactions 2016 $631 million A C Q U I S I T I O N S O U R C I N G 2015 $2.1 billion Seller Direct 2014 $470 million 19.7% 2013 $1.5 billion 2012 $886 million 68.7% 2006 - 2011 $2.0 billion Listed OFF MARKET 31.3% Unlisted 49.0% TOTAL $9.1 billion COMBINED REIT 23 * Based on aggregate contract purchase prices and development costs.
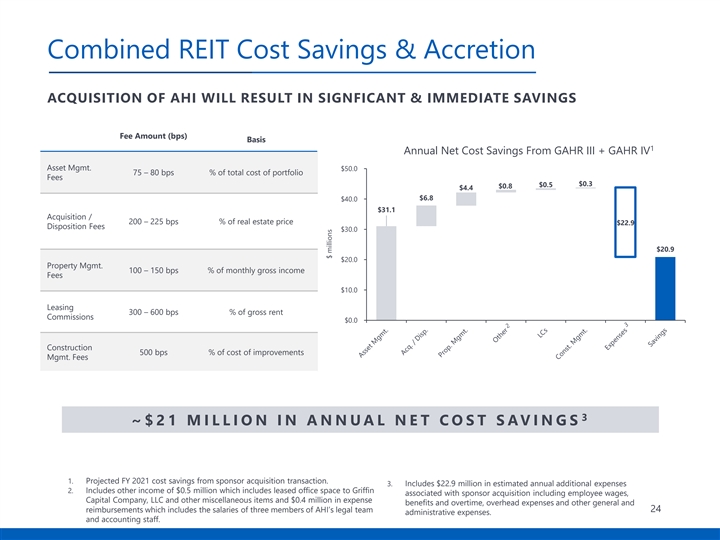
Combined REIT Cost Savings & Accretion ACQUISITION OF AHI WILL RESULT IN SIGNFICANT & IMMEDIATE SAVINGS Fee Amount (bps) Basis 1 Annual Net Cost Savings From GAHR III + GAHR IV Asset Mgmt. $50.0 75 – 80 bps % of total cost of portfolio Fees $0.3 $0.5 $0.8 $4.4 $6.8 $40.0 $31.1 Acquisition / 200 – 225 bps % of real estate price $22.9 Disposition Fees $30.0 $20.9 $20.0 Property Mgmt. 100 – 150 bps % of monthly gross income Fees $10.0 Leasing 300 – 600 bps % of gross rent Commissions $0.0 Construction 500 bps % of cost of improvements Mgmt. Fees 3 ~ $ 2 1 M I L L I O N I N A N N U A L N E T C O S T S A V I N G S 1. Projected FY 2021 cost savings from sponsor acquisition transaction. 3. Includes $22.9 million in estimated annual additional expenses 2. Includes other income of $0.5 million which includes leased office space to Griffin associated with sponsor acquisition including employee wages, Capital Company, LLC and other miscellaneous items and $0.4 million in expense benefits and overtime, overhead expenses and other general and reimbursements which includes the salaries of three members of AHI’s legal team 24 administrative expenses. and accounting staff. $ millionsCombined REIT Cost Savings & Accretion ACQUISITION OF AHI WILL RESULT IN SIGNFICANT & IMMEDIATE SAVINGS Fee Amount (bps) Basis 1 Annual Net Cost Savings From GAHR III + GAHR IV Asset Mgmt. $50.0 75 – 80 bps % of total cost of portfolio Fees $0.3 $0.5 $0.8 $4.4 $6.8 $40.0 $31.1 Acquisition / 200 – 225 bps % of real estate price $22.9 Disposition Fees $30.0 $20.9 $20.0 Property Mgmt. 100 – 150 bps % of monthly gross income Fees $10.0 Leasing 300 – 600 bps % of gross rent Commissions $0.0 Construction 500 bps % of cost of improvements Mgmt. Fees 3 ~ $ 2 1 M I L L I O N I N A N N U A L N E T C O S T S A V I N G S 1. Projected FY 2021 cost savings from sponsor acquisition transaction. 3. Includes $22.9 million in estimated annual additional expenses 2. Includes other income of $0.5 million which includes leased office space to Griffin associated with sponsor acquisition including employee wages, Capital Company, LLC and other miscellaneous items and $0.4 million in expense benefits and overtime, overhead expenses and other general and reimbursements which includes the salaries of three members of AHI’s legal team 24 administrative expenses. and accounting staff. $ millions
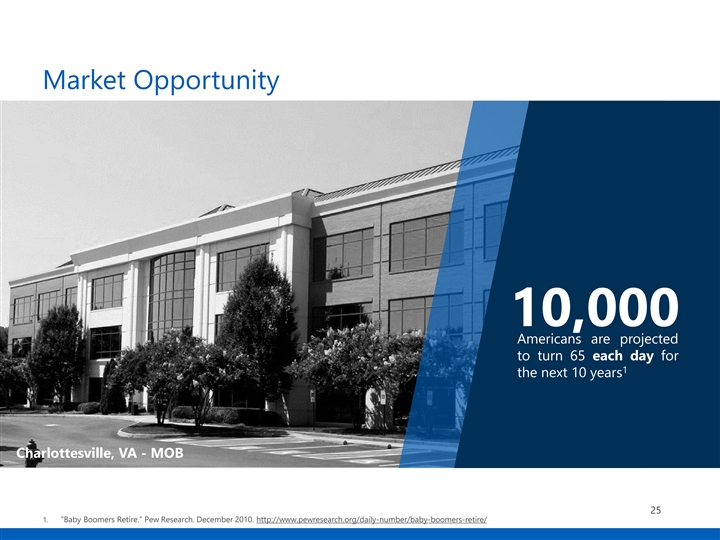
Market Opportunity 10,000 Americans are projected to turn 65 each day for 1 the next 10 years Charlottesville, VA - MOB 25 1. “Baby Boomers Retire.” Pew Research. December 2010. http://www.pewresearch.org/daily-number/baby-boomers-retire/Market Opportunity 10,000 Americans are projected to turn 65 each day for 1 the next 10 years Charlottesville, VA - MOB 25 1. “Baby Boomers Retire.” Pew Research. December 2010. http://www.pewresearch.org/daily-number/baby-boomers-retire/
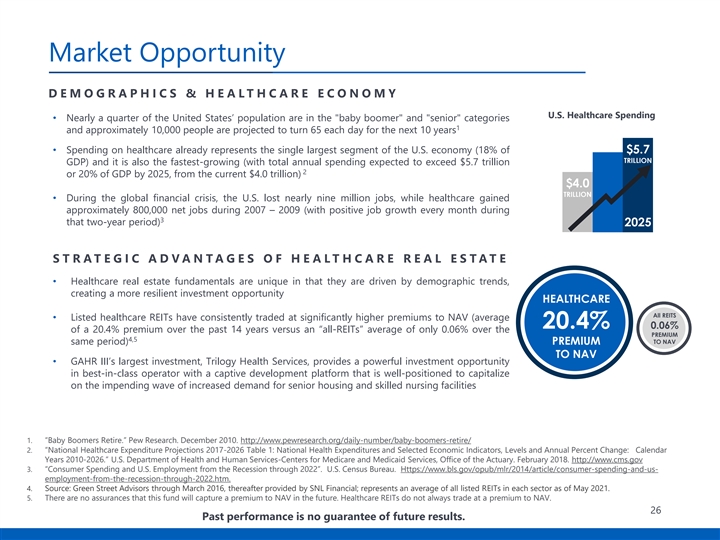
Market Opportunity D E M O G R A P H I C S & H E A L T H C A R E E C O N O M Y U.S. Healthcare Spending • Nearly a quarter of the United States’ population are in the baby boomer and senior categories 1 and approximately 10,000 people are projected to turn 65 each day for the next 10 years • Spending on healthcare already represents the single largest segment of the U.S. economy (18% of $5.7 TRILLION GDP) and it is also the fastest-growing (with total annual spending expected to exceed $5.7 trillion 2 or 20% of GDP by 2025, from the current $4.0 trillion) $4.0 TRILLION • During the global financial crisis, the U.S. lost nearly nine million jobs, while healthcare gained approximately 800,000 net jobs during 2007 – 2009 (with positive job growth every month during 3 that two-year period) 2025 S T R A T E G I C A D V A N T A G E S O F H E A L T H C A R E R E A L E S T A T E • Healthcare real estate fundamentals are unique in that they are driven by demographic trends, creating a more resilient investment opportunity HEALTHCARE All REITS • Listed healthcare REITs have consistently traded at significantly higher premiums to NAV (average 20.4% 0.06% of a 20.4% premium over the past 14 years versus an “all-REITs” average of only 0.06% over the PREMIUM 4,5 TO NAV same period) PREMIUM TO NAV • GAHR III’s largest investment, Trilogy Health Services, provides a powerful investment opportunity in best-in-class operator with a captive development platform that is well-positioned to capitalize on the impending wave of increased demand for senior housing and skilled nursing facilities 1. “Baby Boomers Retire.” Pew Research. December 2010. http://www.pewresearch.org/daily-number/baby-boomers-retire/ 2. “National Healthcare Expenditure Projections 2017-2026 Table 1: National Health Expenditures and Selected Economic Indicators, Levels and Annual Percent Change: Calendar Years 2010-2026.” U.S. Department of Health and Human Services-Centers for Medicare and Medicaid Services, Office of the Actuary. February 2018. http://www.cms.gov 3. “Consumer Spending and U.S. Employment from the Recession through 2022”. U.S. Census Bureau. Https://www.bls.gov/opub/mlr/2014/article/consumer-spending-and-us- employment-from-the-recession-through-2022.htm. 4. Source: Green Street Advisors through March 2016, thereafter provided by SNL Financial; represents an average of all listed REITs in each sector as of May 2021. 5. There are no assurances that this fund will capture a premium to NAV in the future. Healthcare REITs do not always trade at a premium to NAV. 26 Past performance is no guarantee of future results.Market Opportunity D E M O G R A P H I C S & H E A L T H C A R E E C O N O M Y U.S. Healthcare Spending • Nearly a quarter of the United States’ population are in the baby boomer and senior categories 1 and approximately 10,000 people are projected to turn 65 each day for the next 10 years • Spending on healthcare already represents the single largest segment of the U.S. economy (18% of $5.7 TRILLION GDP) and it is also the fastest-growing (with total annual spending expected to exceed $5.7 trillion 2 or 20% of GDP by 2025, from the current $4.0 trillion) $4.0 TRILLION • During the global financial crisis, the U.S. lost nearly nine million jobs, while healthcare gained approximately 800,000 net jobs during 2007 – 2009 (with positive job growth every month during 3 that two-year period) 2025 S T R A T E G I C A D V A N T A G E S O F H E A L T H C A R E R E A L E S T A T E • Healthcare real estate fundamentals are unique in that they are driven by demographic trends, creating a more resilient investment opportunity HEALTHCARE All REITS • Listed healthcare REITs have consistently traded at significantly higher premiums to NAV (average 20.4% 0.06% of a 20.4% premium over the past 14 years versus an “all-REITs” average of only 0.06% over the PREMIUM 4,5 TO NAV same period) PREMIUM TO NAV • GAHR III’s largest investment, Trilogy Health Services, provides a powerful investment opportunity in best-in-class operator with a captive development platform that is well-positioned to capitalize on the impending wave of increased demand for senior housing and skilled nursing facilities 1. “Baby Boomers Retire.” Pew Research. December 2010. http://www.pewresearch.org/daily-number/baby-boomers-retire/ 2. “National Healthcare Expenditure Projections 2017-2026 Table 1: National Health Expenditures and Selected Economic Indicators, Levels and Annual Percent Change: Calendar Years 2010-2026.” U.S. Department of Health and Human Services-Centers for Medicare and Medicaid Services, Office of the Actuary. February 2018. http://www.cms.gov 3. “Consumer Spending and U.S. Employment from the Recession through 2022”. U.S. Census Bureau. Https://www.bls.gov/opub/mlr/2014/article/consumer-spending-and-us- employment-from-the-recession-through-2022.htm. 4. Source: Green Street Advisors through March 2016, thereafter provided by SNL Financial; represents an average of all listed REITs in each sector as of May 2021. 5. There are no assurances that this fund will capture a premium to NAV in the future. Healthcare REITs do not always trade at a premium to NAV. 26 Past performance is no guarantee of future results.
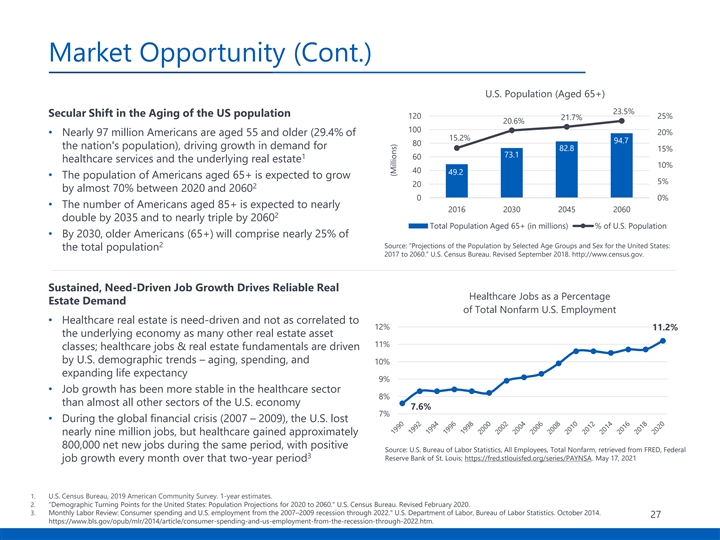
Market Opportunity (Cont.) U.S. Population (Aged 65+) 23.5% Secular Shift in the Aging of the US population 120 25% 21.7% 20.6% 100 20% • Nearly 97 million Americans are aged 55 and older (29.4% of 15.2% 94.7 80 the nation's population), driving growth in demand for 82.8 15% 73.1 1 60 healthcare services and the underlying real estate 10% 40 49.2 • The population of Americans aged 65+ is expected to grow 5% 20 2 by almost 70% between 2020 and 2060 0 0% • The number of Americans aged 85+ is expected to nearly 2016 2030 2045 2060 2 double by 2035 and to nearly triple by 2060 Total Population Aged 65+ (in millions) % of U.S. Population • By 2030, older Americans (65+) will comprise nearly 25% of 2 Source: “Projections of the Population by Selected Age Groups and Sex for the United States: the total population 2017 to 2060.” U.S. Census Bureau. Revised September 2018. http://www.census.gov. Sustained, Need-Driven Job Growth Drives Reliable Real Healthcare Jobs as a Percentage Estate Demand of Total Nonfarm U.S. Employment • Healthcare real estate is need-driven and not as correlated to 12% 11.2% the underlying economy as many other real estate asset 11% classes; healthcare jobs & real estate fundamentals are driven by U.S. demographic trends – aging, spending, and 10% expanding life expectancy 9% • Job growth has been more stable in the healthcare sector 8% than almost all other sectors of the U.S. economy 7.6% 7% • During the global financial crisis (2007 – 2009), the U.S. lost nearly nine million jobs, but healthcare gained approximately 800,000 net new jobs during the same period, with positive Source: U.S. Bureau of Labor Statistics, All Employees, Total Nonfarm, retrieved from FRED, Federal 3 Reserve Bank of St. Louis; https://fred.stlouisfed.org/series/PAYNSA. May 17, 2021 job growth every month over that two-year period 1. U.S. Census Bureau, 2019 American Community Survey. 1-year estimates. 2. “Demographic Turning Points for the United States: Population Projections for 2020 to 2060. U.S. Census Bureau. Revised February 2020. 3. Monthly Labor Review: Consumer spending and U.S. employment from the 2007–2009 recession through 2022. U.S. Department of Labor, Bureau of Labor Statistics. October 2014. 27 https://www.bls.gov/opub/mlr/2014/article/consumer-spending-and-us-employment-from-the-recession-through-2022.htm. (Millions)Market Opportunity (Cont.) U.S. Population (Aged 65+) 23.5% Secular Shift in the Aging of the US population 120 25% 21.7% 20.6% 100 20% • Nearly 97 million Americans are aged 55 and older (29.4% of 15.2% 94.7 80 the nation's population), driving growth in demand for 82.8 15% 73.1 1 60 healthcare services and the underlying real estate 10% 40 49.2 • The population of Americans aged 65+ is expected to grow 5% 20 2 by almost 70% between 2020 and 2060 0 0% • The number of Americans aged 85+ is expected to nearly 2016 2030 2045 2060 2 double by 2035 and to nearly triple by 2060 Total Population Aged 65+ (in millions) % of U.S. Population • By 2030, older Americans (65+) will comprise nearly 25% of 2 Source: “Projections of the Population by Selected Age Groups and Sex for the United States: the total population 2017 to 2060.” U.S. Census Bureau. Revised September 2018. http://www.census.gov. Sustained, Need-Driven Job Growth Drives Reliable Real Healthcare Jobs as a Percentage Estate Demand of Total Nonfarm U.S. Employment • Healthcare real estate is need-driven and not as correlated to 12% 11.2% the underlying economy as many other real estate asset 11% classes; healthcare jobs & real estate fundamentals are driven by U.S. demographic trends – aging, spending, and 10% expanding life expectancy 9% • Job growth has been more stable in the healthcare sector 8% than almost all other sectors of the U.S. economy 7.6% 7% • During the global financial crisis (2007 – 2009), the U.S. lost nearly nine million jobs, but healthcare gained approximately 800,000 net new jobs during the same period, with positive Source: U.S. Bureau of Labor Statistics, All Employees, Total Nonfarm, retrieved from FRED, Federal 3 Reserve Bank of St. Louis; https://fred.stlouisfed.org/series/PAYNSA. May 17, 2021 job growth every month over that two-year period 1. U.S. Census Bureau, 2019 American Community Survey. 1-year estimates. 2. “Demographic Turning Points for the United States: Population Projections for 2020 to 2060. U.S. Census Bureau. Revised February 2020. 3. Monthly Labor Review: Consumer spending and U.S. employment from the 2007–2009 recession through 2022. U.S. Department of Labor, Bureau of Labor Statistics. October 2014. 27 https://www.bls.gov/opub/mlr/2014/article/consumer-spending-and-us-employment-from-the-recession-through-2022.htm. (Millions)
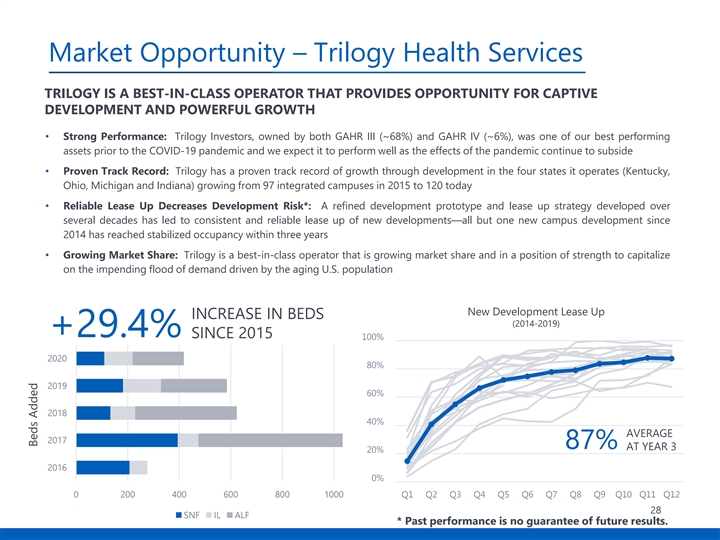
Market Opportunity – Trilogy Health Services TRILOGY IS A BEST-IN-CLASS OPERATOR THAT PROVIDES OPPORTUNITY FOR CAPTIVE DEVELOPMENT AND POWERFUL GROWTH • Strong Performance: Trilogy Investors, owned by both GAHR III (~68%) and GAHR IV (~6%), was one of our best performing assets prior to the COVID-19 pandemic and we expect it to perform well as the effects of the pandemic continue to subside • Proven Track Record: Trilogy has a proven track record of growth through development in the four states it operates (Kentucky, Ohio, Michigan and Indiana) growing from 97 integrated campuses in 2015 to 120 today • Reliable Lease Up Decreases Development Risk*: A refined development prototype and lease up strategy developed over several decades has led to consistent and reliable lease up of new developments—all but one new campus development since 2014 has reached stabilized occupancy within three years • Growing Market Share: Trilogy is a best-in-class operator that is growing market share and in a position of strength to capitalize on the impending flood of demand driven by the aging U.S. population New Development Lease Up INCREASE IN BEDS (2014-2019) +29.4% SINCE 2015 100% 2020 80% 2019 60% 2018 40% AVERAGE 2017 87% AT YEAR 3 20% 2016 0% 0 200 400 600 800 1000 Q1 Q2 Q3 Q4 Q5 Q6 Q7 Q8 Q9 Q10 Q11 Q12 28 SNF IL ALF * Past performance is no guarantee of future results. Beds AddedMarket Opportunity – Trilogy Health Services TRILOGY IS A BEST-IN-CLASS OPERATOR THAT PROVIDES OPPORTUNITY FOR CAPTIVE DEVELOPMENT AND POWERFUL GROWTH • Strong Performance: Trilogy Investors, owned by both GAHR III (~68%) and GAHR IV (~6%), was one of our best performing assets prior to the COVID-19 pandemic and we expect it to perform well as the effects of the pandemic continue to subside • Proven Track Record: Trilogy has a proven track record of growth through development in the four states it operates (Kentucky, Ohio, Michigan and Indiana) growing from 97 integrated campuses in 2015 to 120 today • Reliable Lease Up Decreases Development Risk*: A refined development prototype and lease up strategy developed over several decades has led to consistent and reliable lease up of new developments—all but one new campus development since 2014 has reached stabilized occupancy within three years • Growing Market Share: Trilogy is a best-in-class operator that is growing market share and in a position of strength to capitalize on the impending flood of demand driven by the aging U.S. population New Development Lease Up INCREASE IN BEDS (2014-2019) +29.4% SINCE 2015 100% 2020 80% 2019 60% 2018 40% AVERAGE 2017 87% AT YEAR 3 20% 2016 0% 0 200 400 600 800 1000 Q1 Q2 Q3 Q4 Q5 Q6 Q7 Q8 Q9 Q10 Q11 Q12 28 SNF IL ALF * Past performance is no guarantee of future results. Beds Added
Process, Timing and Other Impacts Target Closing: th 4 Quarter 2021 CULLMAN, AL - MOB 29Process, Timing and Other Impacts Target Closing: th 4 Quarter 2021 CULLMAN, AL - MOB 29
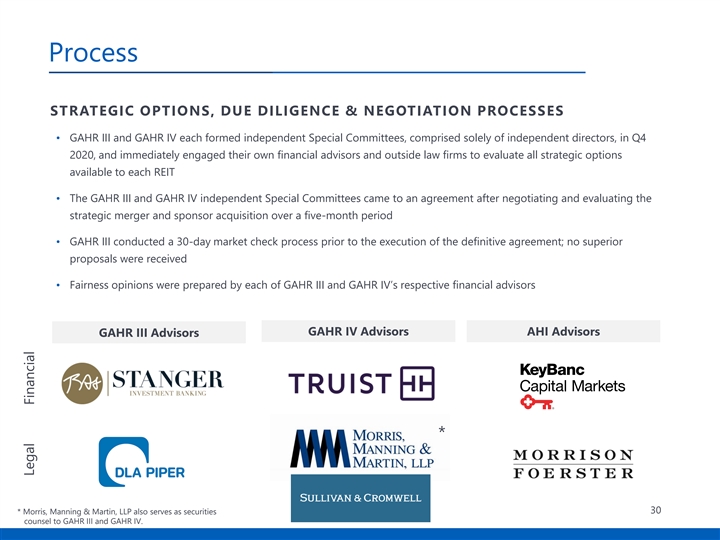
Process STRATEGIC OPTIONS, DUE DILIGENCE & NEGOTIATION PROCESSES • GAHR III and GAHR IV each formed independent Special Committees, comprised solely of independent directors, in Q4 2020, and immediately engaged their own financial advisors and outside law firms to evaluate all strategic options available to each REIT • The GAHR III and GAHR IV independent Special Committees came to an agreement after negotiating and evaluating the strategic merger and sponsor acquisition over a five-month period GAHR III conducted a 30-day market check process prior to the execution of the definitive agreement; no superior • proposals were received • Fairness opinions were prepared by each of GAHR III and GAHR IV’s respective financial advisors GAHR IV Advisors AHI Advisors GAHR III Advisors * * Morris, Manning & Martin, LLP also serves as securities 30 counsel to GAHR III and GAHR IV. Legal FinancialProcess STRATEGIC OPTIONS, DUE DILIGENCE & NEGOTIATION PROCESSES • GAHR III and GAHR IV each formed independent Special Committees, comprised solely of independent directors, in Q4 2020, and immediately engaged their own financial advisors and outside law firms to evaluate all strategic options available to each REIT • The GAHR III and GAHR IV independent Special Committees came to an agreement after negotiating and evaluating the strategic merger and sponsor acquisition over a five-month period GAHR III conducted a 30-day market check process prior to the execution of the definitive agreement; no superior • proposals were received • Fairness opinions were prepared by each of GAHR III and GAHR IV’s respective financial advisors GAHR IV Advisors AHI Advisors GAHR III Advisors * * Morris, Manning & Martin, LLP also serves as securities 30 counsel to GAHR III and GAHR IV. Legal Financial
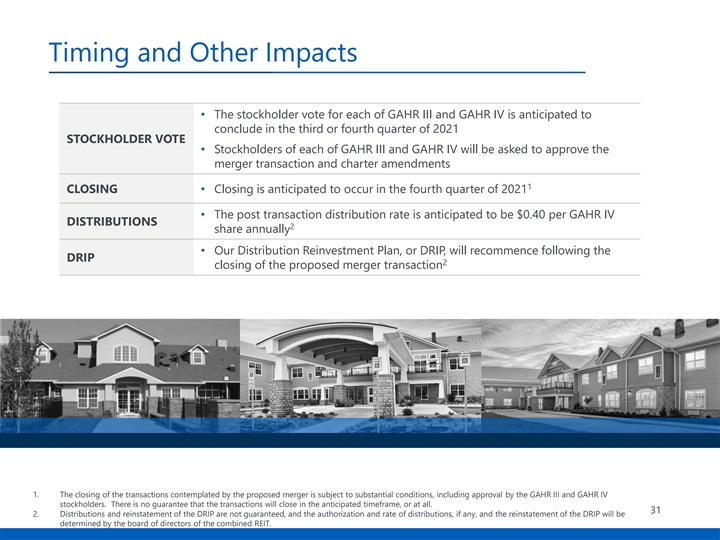
Timing and Other Impacts • The stockholder vote for each of GAHR III and GAHR IV is anticipated to conclude in the third or fourth quarter of 2021 STOCKHOLDER VOTE • Stockholders of each of GAHR III and GAHR IV will be asked to approve the merger transaction and charter amendments 1 CLOSING• Closing is anticipated to occur in the fourth quarter of 2021 • The post transaction distribution rate is anticipated to be $0.40 per GAHR IV DISTRIBUTIONS 2 share annually • Our Distribution Reinvestment Plan, or DRIP, will recommence following the DRIP 2 closing of the proposed merger transaction 1. The closing of the transactions contemplated by the proposed merger is subject to substantial conditions, including approval by the GAHR III and GAHR IV stockholders. There is no guarantee that the transactions will close in the anticipated timeframe, or at all. 31 2. Distributions and reinstatement of the DRIP are not guaranteed, and the authorization and rate of distributions, if any, and the reinstatement of the DRIP will be determined by the board of directors of the combined REIT.Timing and Other Impacts • The stockholder vote for each of GAHR III and GAHR IV is anticipated to conclude in the third or fourth quarter of 2021 STOCKHOLDER VOTE • Stockholders of each of GAHR III and GAHR IV will be asked to approve the merger transaction and charter amendments 1 CLOSING• Closing is anticipated to occur in the fourth quarter of 2021 • The post transaction distribution rate is anticipated to be $0.40 per GAHR IV DISTRIBUTIONS 2 share annually • Our Distribution Reinvestment Plan, or DRIP, will recommence following the DRIP 2 closing of the proposed merger transaction 1. The closing of the transactions contemplated by the proposed merger is subject to substantial conditions, including approval by the GAHR III and GAHR IV stockholders. There is no guarantee that the transactions will close in the anticipated timeframe, or at all. 31 2. Distributions and reinstatement of the DRIP are not guaranteed, and the authorization and rate of distributions, if any, and the reinstatement of the DRIP will be determined by the board of directors of the combined REIT.