Attached files
| file | filename |
|---|---|
| 8-K - FORM 8-K - AssetMark Financial Holdings, Inc. | dp152725_8k.htm |
Exhibit 99.1
1 For general public use. 2021 Analyst Dinner June 15, 2021
2 For general public use. Forward looking statements and non - GAAP financial measures Forward - Looking Statements This presentation contains forward - looking statements, including statements regarding our future financial and operating perform ance, which involve risks and uncertainties. Actual results may differ materially from the results predicted, and reported within the meaning of the Private Securities Litigation Act of 199 5, results should not be considered as an indication of future performance. Forward - looking statements include all statements that are not historical facts and can be identified by terms such as “may,” “might,” “will,” “should,” “expects,” “plans,” “anticipates,” “intends,” “believes,” “estimates,” “predicts,” “potential” or “continue,” the negative of these terms and other comparable t erm inology that conveys uncertainty of future events or outcomes. These forward - looking statements involve known and unknown risks, uncertainties, assumptions and other factors that may cause actual r esults to differ materially from statements made in this presentation, including in relation to our ability to attract and retain advisors, competition in the industry in which we op era te, the interest rate environment, shifting investor preferences, our financial performance, investments in new products, services and capabilities, our ability to execute strategic transactions, le gal and regulatory developments, general market, political, economic and business conditions and the impacts of the COVID - 19 pandemic on our operations, demand from our customers and end investors and our operating results. Other potential risks and uncertainties that could cause actual results to differ from the results predicted include, among others, those risks and unc ert ainties included under the captions “Risk Factors” and “Management’s Discussion and Analysis of Financial Condition and Results of Operations” in our Annual Report on Form 10 - K for th e year ended December 31, 2020. Additional information is also set forth in our Quarterly Report on Form 10 - Q for the quarter ended March 31, 2021. All information provided in this prese ntation is based on information available to us as of the date of this presentation and any forward - looking statements contained herein are based on assumptions that we believe are reasonable as of this date. Undue reliance should not be placed on the forward - looking statements in this presentation, which are inherently uncertain. We undertake no duty to update this information unless required by law. Use of Non - GAAP Financial Information To supplement our financial information, which is prepared and presented in accordance with generally accepted accounting pri nci ples in the United States of America, or GAAP, we use non - GAAP financial measures: adjusted EBITDA, adjusted EBITDA margin and adjusted net income. The presentation of these non - GAAP fin ancial metrics is not intended to be considered in isolation or as a substitute for, or superior to, the financial information prepared and presented in accordance with GAAP. W e b elieve that the presentation of non - GAAP financial information provides important supplemental information to management and investors regarding financial and business trends relating to o ur financial condition and results of operations. For further information regarding these non - GAAP measures, including the limitations thereof and reconciliations of each non - GAAP financial measure to its most directly comparable GAAP financial measure, please refer to our earnings release and Form 10 - Q.

3 For general public use. Today’s Speakers Natalie Wolfsen Chief Executive Officer Gary Zyla Chief Financial Officer Michael Kim President Carrie Hansen Chief Operating Officer
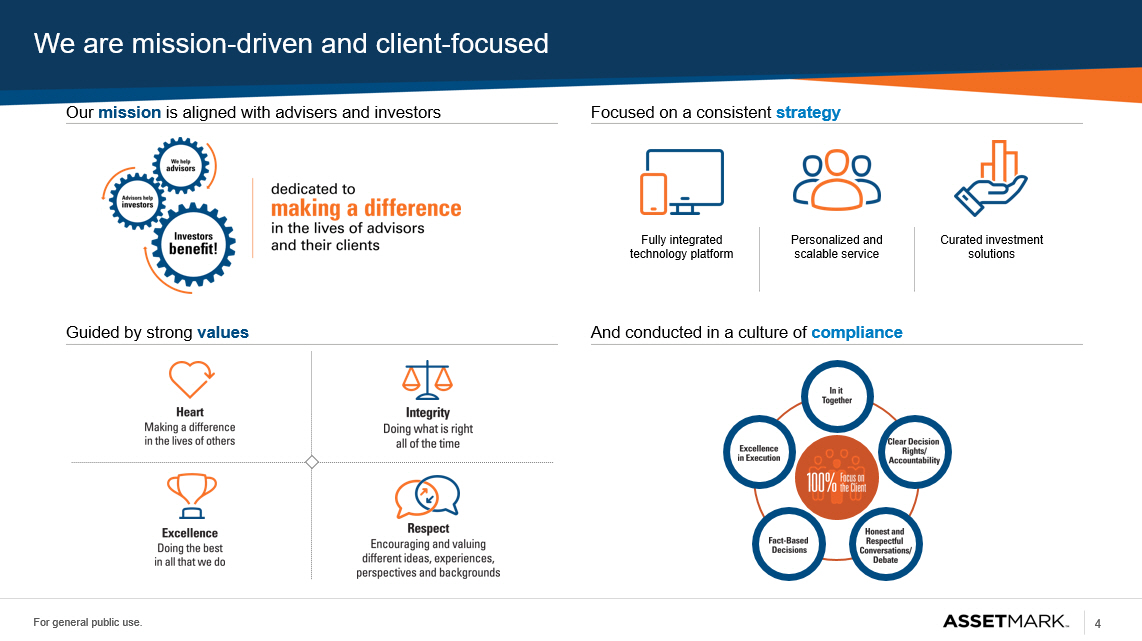
4 For general public use. We are mission - driven and client - focused Our mission is aligned with advisers and investors Focused on a consistent strategy Guided by strong values And conducted in a culture of compliance Fully integrated technology platform Personalized and scalable service Curated investment solutions
5 For general public use. State of the Business: AssetMark at a Glance
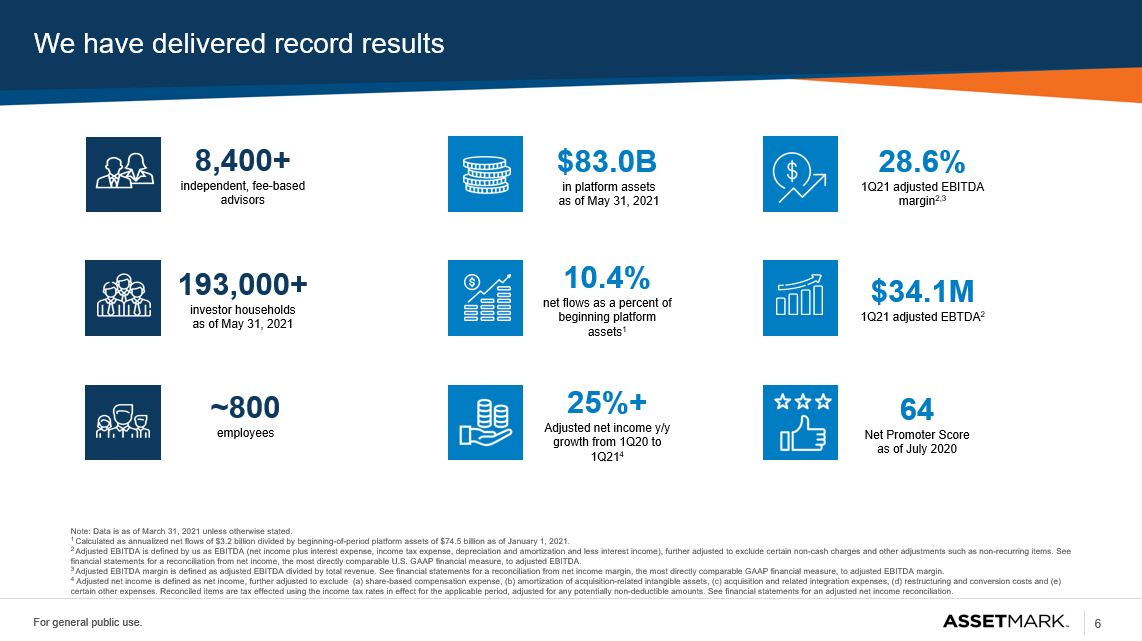
6 For general public use. We have delivered record results 8 ,400+ independent, fee - based advisors 193,000+ investor households as of May 31, 2021 ~800 employees 10.4 % net flows as a percent of beginning platform assets 1 $83.0B in platform assets as of May 31, 2021 $34.1M 1Q21 adjusted EBTDA 2 64 Net Promoter Score as of July 2020 25 %+ Adjusted net income y/y growth from 1Q20 to 1Q21 4 28.6% 1Q21 adjusted EBITDA margin 2 ,3 Note: Data is as of March 31 , 2021 unless otherwise stated. 1 Calculated as annualized net flows of $3.2 billion divided by beginning - of - period platform assets of $74.5 billion as of January 1, 2021. 2 Adjusted EBITDA is defined by us as EBITDA (net income plus interest expense, income tax expense, depreciation and amortizati on and less interest income), further adjusted to exclude certain non - cash charges and other adjustments such as non - recurring item s. See financial statements for a reconciliation from net income, the most directly comparable U.S. GAAP financial measure, to adjus ted EBITDA. 3 Adjusted EBITDA margin is defined as adjusted EBITDA divided by total revenue. See financial statements for a reconciliation fro m net income margin, the most directly comparable GAAP financial measure, to adjusted EBITDA margin. 4 Adjusted net income is defined as net income, further adjusted to exclude (a) share - based compensation expense, (b) amortizati on of acquisition - related intangible assets, (c) acquisition and related integration expenses, (d) restructuring and conversion costs and (e) certain other expenses. Reconciled items are tax effected using the income tax rates in effect for the applicable period, adj ust ed for any potentially non - deductible amounts. See financial statements for an adjusted net income reconciliation.
7 For general public use. Looking Ahead: What’s Next for AssetMark
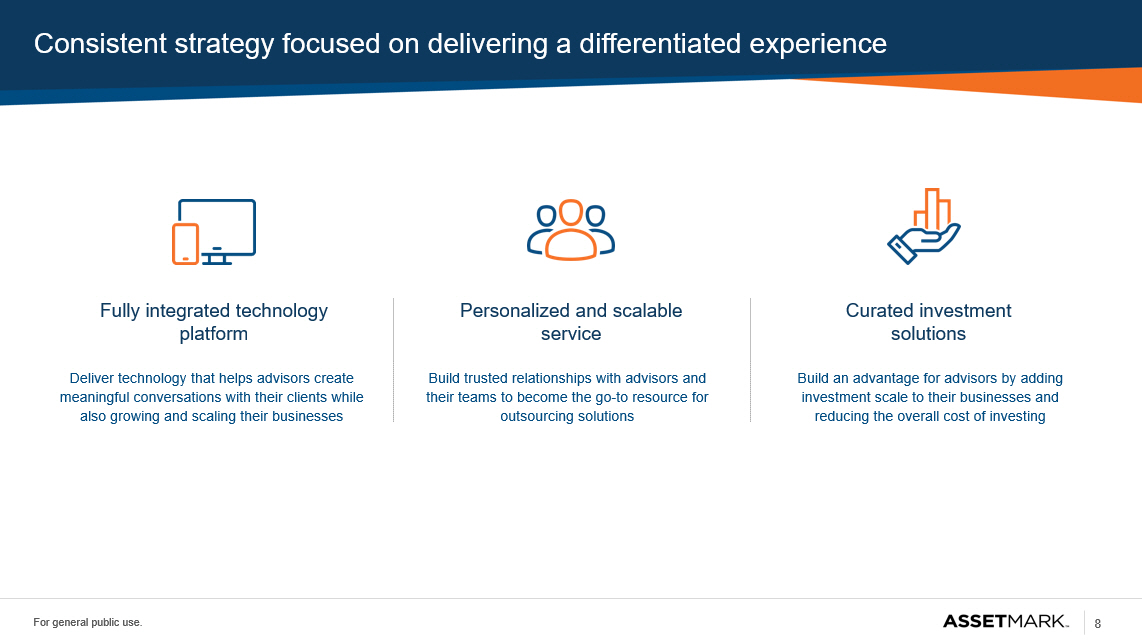
8 For general public use. Consistent strategy focused on delivering a differentiated experience Fully integrated technology platform Personalized and scalable service Curated investment solutions Deliver technology that helps advisors create meaningful conversations with their clients while also growing and scaling their businesses Build trusted relationships with advisors and their teams to become the go - to resource for outsourcing solutions Build an advantage for advisors by adding investment scale to their businesses and reducing the overall cost of investing
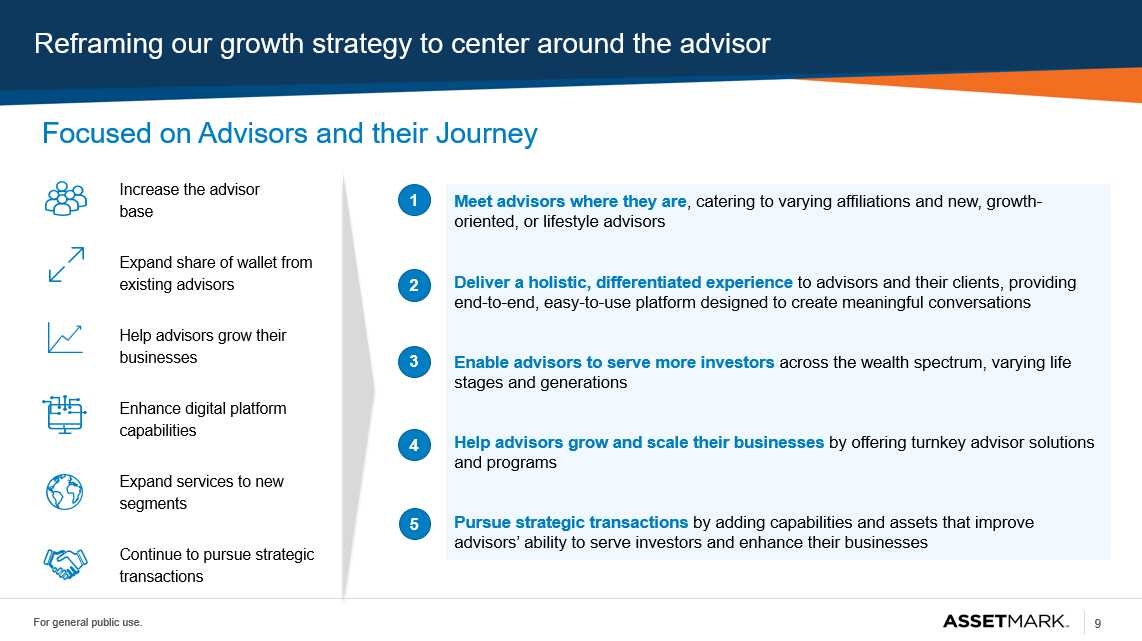
9 For general public use. Reframing our growth strategy to center around the advisor Increase the advisor base Expand share of wallet from existing advisors Help advisors grow their businesses Enhance digital platform capabilities Expand services to new segments Continue to pursue strategic transactions Meet advisors where they are , catering to varying affiliations and new, growth - oriented, or lifestyle advisors Deliver a holistic, differentiated experience to advisors and their clients, providing end - to - end, easy - to - use platform designed to create meaningful conversations Enable advisors to serve more investors across the wealth spectrum, varying life stages and generations Help advisors grow and scale their businesses by offering turnkey advisor solutions and programs Pursue strategic transactions by adding capabilities and assets that improve advisors’ ability to serve investors and enhance their businesses 1 2 3 4 5 Focused on Advisors and their Journey
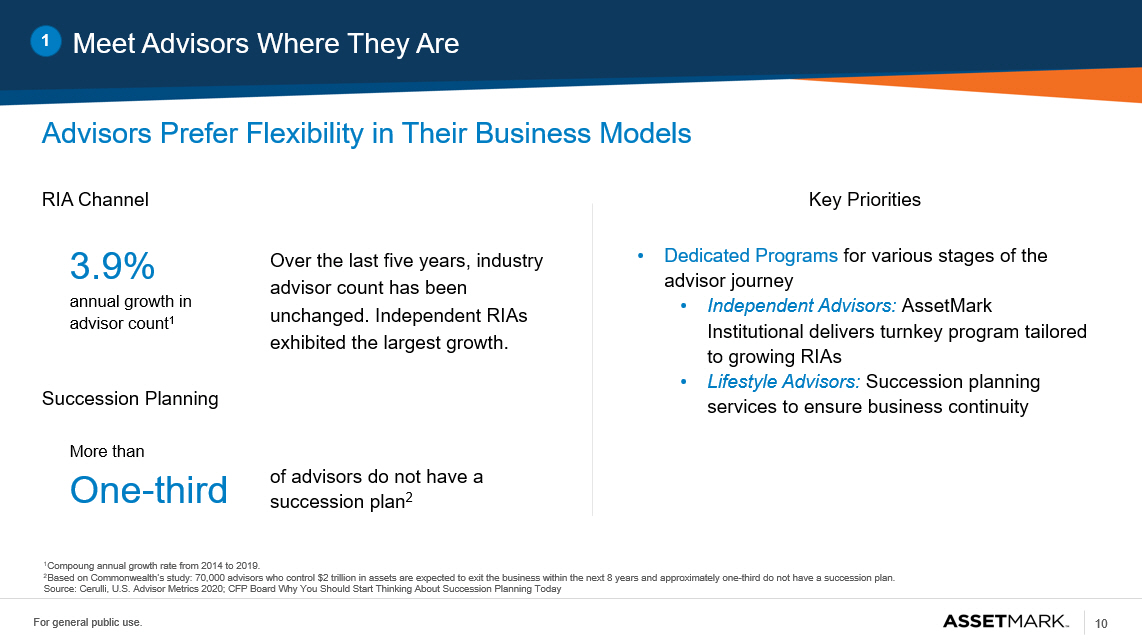
10 For general public use. Meet Advisors Where They Are 1 Key Priorities RIA Channel • Dedicated Programs for various stages of the advisor journey • Independent Advisors: AssetMark Institutional delivers turnkey program tailored to growing RIAs • Lifestyle Advisors: Succession planning services to ensure business continuity One - third of advisors do not have a succession plan 2 More than Succession Planning Over the last five years, industry advisor count has been unchanged. Independent RIAs exhibited the largest growth. 3.9% annual growth in advisor count 1 1 Compoung annual growth rate from 2014 to 2019. 2 Based on Commonwealth’s study: 70,000 advisors who control $2 trillion in assets are expected to exit the business within the ne xt 8 years and approximately one - third do not have a succession plan. Source: Cerulli , U.S. Advisor Metrics 2020; CFP Board Why You Should Start Thinking About Succession Planning Today Advisors Prefer Flexibility in Their Business Models
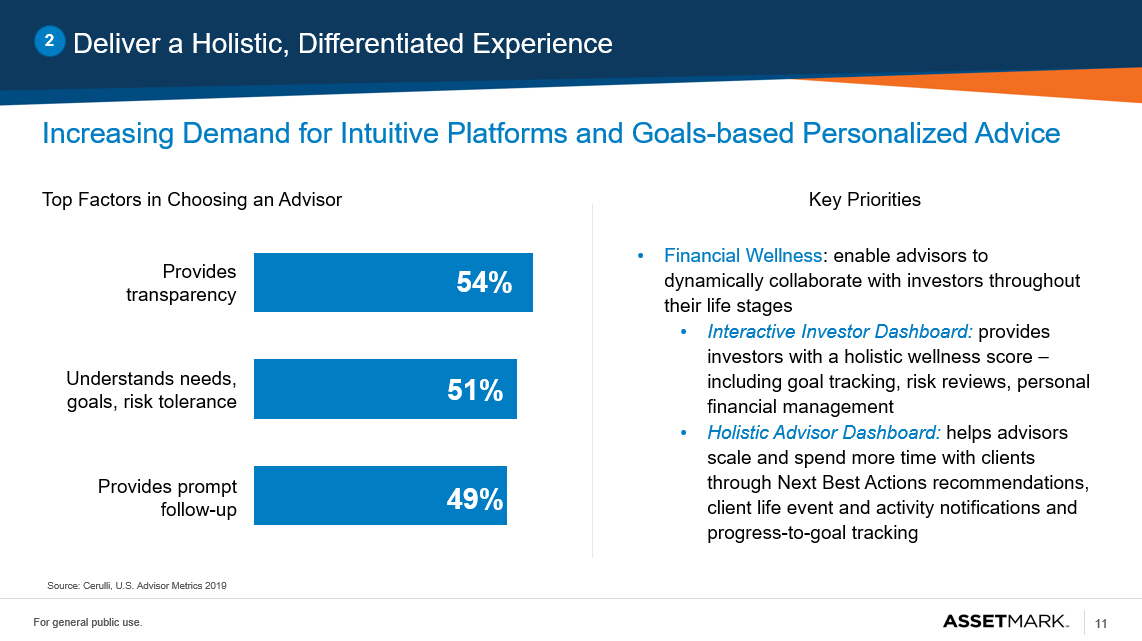
11 For general public use. Deliver a Holistic, Differentiated Experience 2 Increasing Demand for Intuitive Platforms and Goals - based Personalized Advice Understands needs, goals, risk tolerance Provides transparency Provides prompt follow - up 54% 51% 49% Key Priorities • Financial Wellness : enable advisors to dynamically collaborate with investors throughout their life stages • Interactive Investor Dashboard: provides investors with a holistic wellness score – including goal tracking, risk reviews, personal financial management • Holistic Advisor Dashboard: helps advisors scale and spend more time with clients through Next Best Actions recommendations, client life event and activity notifications and progress - to - goal tracking Top Factors in Choosing an Advisor Source: Cerulli , U.S. Advisor Metrics 2019
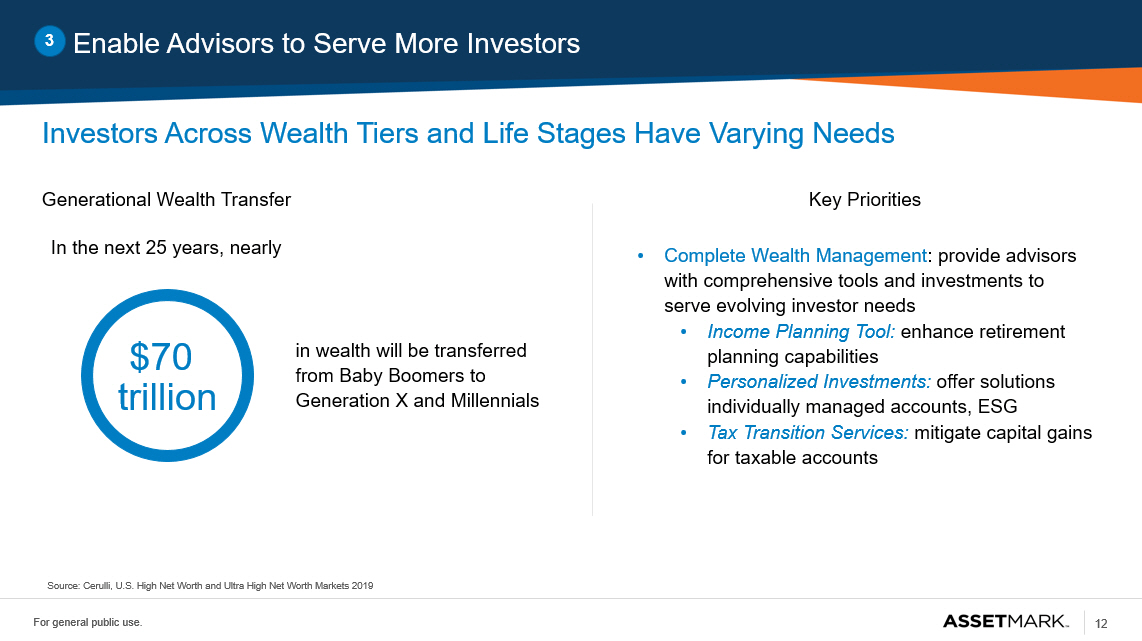
12 For general public use. Enable Advisors to Serve More Investors 3 Investors Across Wealth Tiers and Life Stages Have Varying Needs Generational Wealth Transfer • Complete Wealth Management : provide advisors with comprehensive tools and investments to serve evolving investor needs • Income Planning Tool: enhance retirement planning capabilities • Personalized Investments: offer solutions individually managed accounts, ESG • Tax Transition Services: mitigate capital gains for taxable accounts in wealth will be transferred from Baby Boomers to Generation X and Millennials In the next 25 years, nearly Source: Cerulli, U.S. High Net Worth and Ultra High Net Worth Markets 2019 $70 trillion Key Priorities
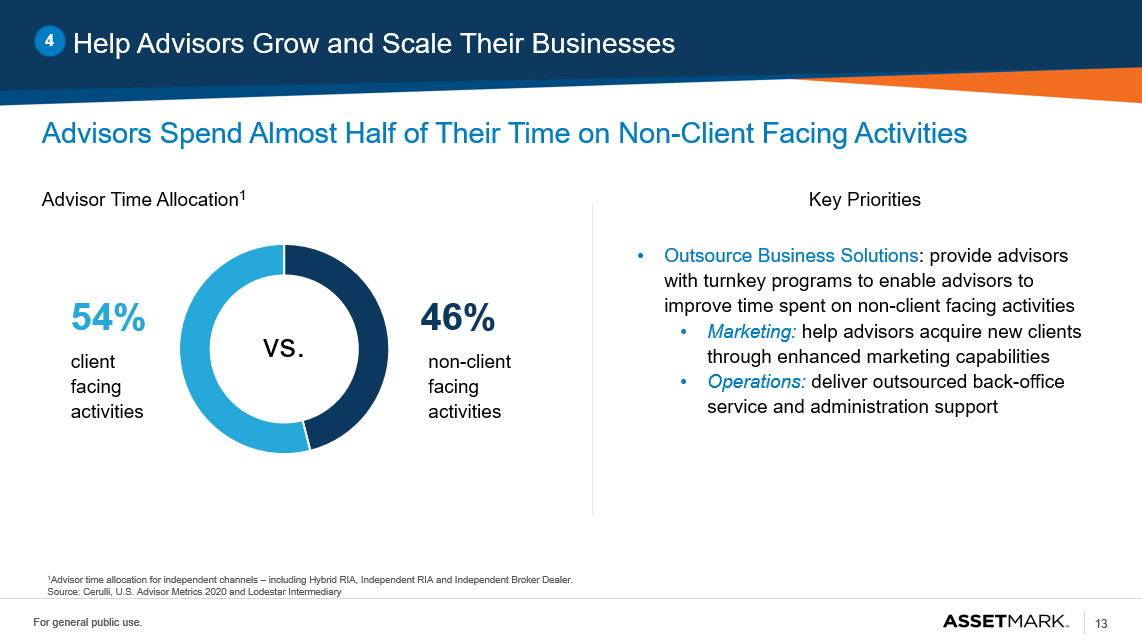
13 For general public use. Help Advisors Grow and Scale Their Businesses 4 Advisors Spend Almost Half of Their Time on Non - Client Facing Activities Advisor Time Allocation 1 Key Priorities • Outsource Business Solutions : provide advisors with turnkey programs to enable advisors to improve time spent on non - client facing activities • Marketing: help advisors acquire new clients through enhanced marketing capabilities • Operations: deliver outsourced back - office service and administration support vs. 54% 46% client facing activities non - client facing activities 1 Advisor time allocation for independent channels – including Hybrid RIA, Independent RIA and Independent Broker Dealer. Source: Cerulli , U.S. Advisor Metrics 2020 and Lodestar Intermediary
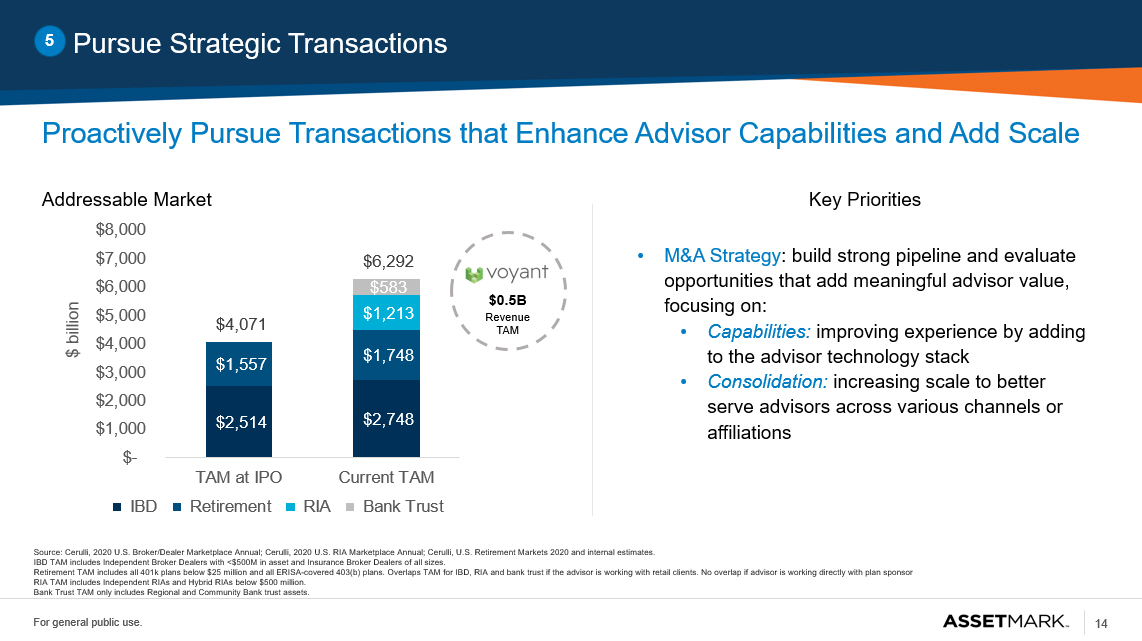
14 For general public use. Pursue Strategic Transactions 5 Proactively Pursue Transactions that Enhance Advisor Capabilities and Add Scale $ billion $2,514 $2,748 $1,557 $1,748 $1,213 $583 $4,071 $6,292 $- $1,000 $2,000 $3,000 $4,000 $5,000 $6,000 $7,000 $8,000 TAM at IPO Current TAM IBD Retirement RIA Bank Trust $0.5B Revenue TAM Key Priorities • M&A Strategy : build strong pipeline and evaluate opportunities that add meaningful advisor value, focusing on: • Capabilities: improving experience by adding to the advisor technology stack • Consolidation: increasing scale to better serve advisors across various channels or affiliations Addressable Market Source: Cerulli, 2020 U.S. Broker/Dealer Marketplace Annual; Cerulli, 2020 U.S. RIA Marketplace Annual; Cerulli, U.S. Retirem ent Markets 2020 and internal estimates. IBD TAM includes Independent Broker Dealers with <$500M in asset and Insurance Broker Dealers of all sizes. Retirement TAM includes all 401k plans below $25 million and all ERISA - covered 403(b) plans. Overlaps TAM for IBD, RIA and bank trust if the advisor is working with retail clients. No overlap if advisor is working directly with plan sponsor RIA TAM includes Independent RIAs and Hybrid RIAs below $500 million. Bank Trust TAM only includes Regional and Community Bank trust assets.

15 For general public use. Financial Update
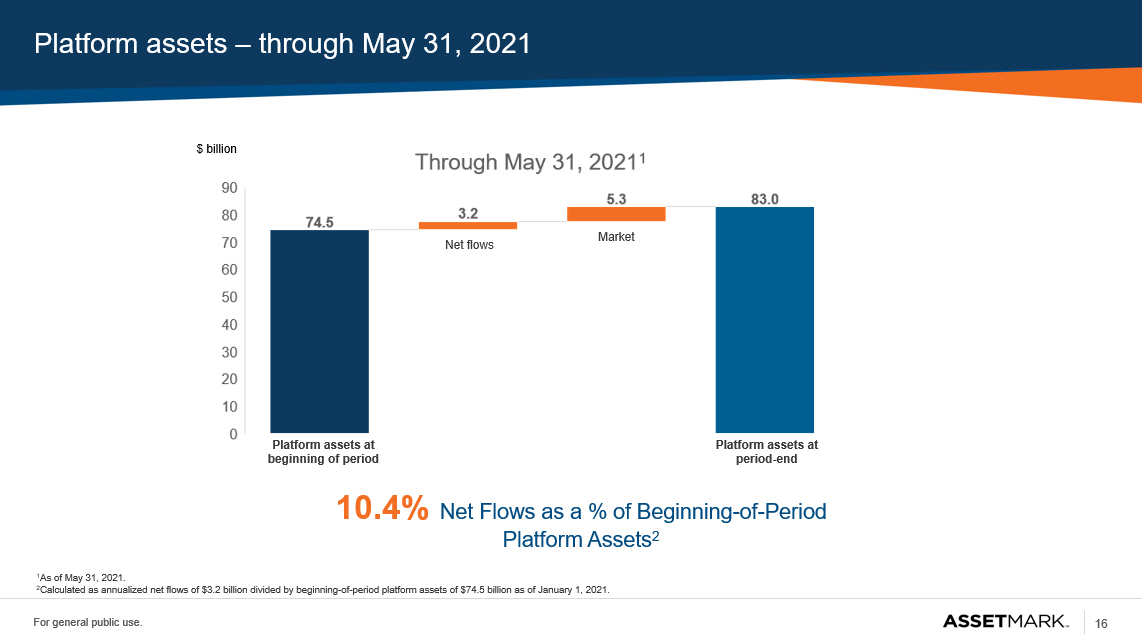
16 For general public use. Platform assets – through May 31, 2021 $ billion 10.4% Net Flows as a % of Beginning - of - Period Platform Assets 2 Platform assets at beginning of period Net flows Market Platform assets at period - end 1 As of May 31, 2021. 2 Calculated as annualized net flows of $3.2 billion divided by beginning - of - period platform assets of $74.5 billion as of January 1, 2021.
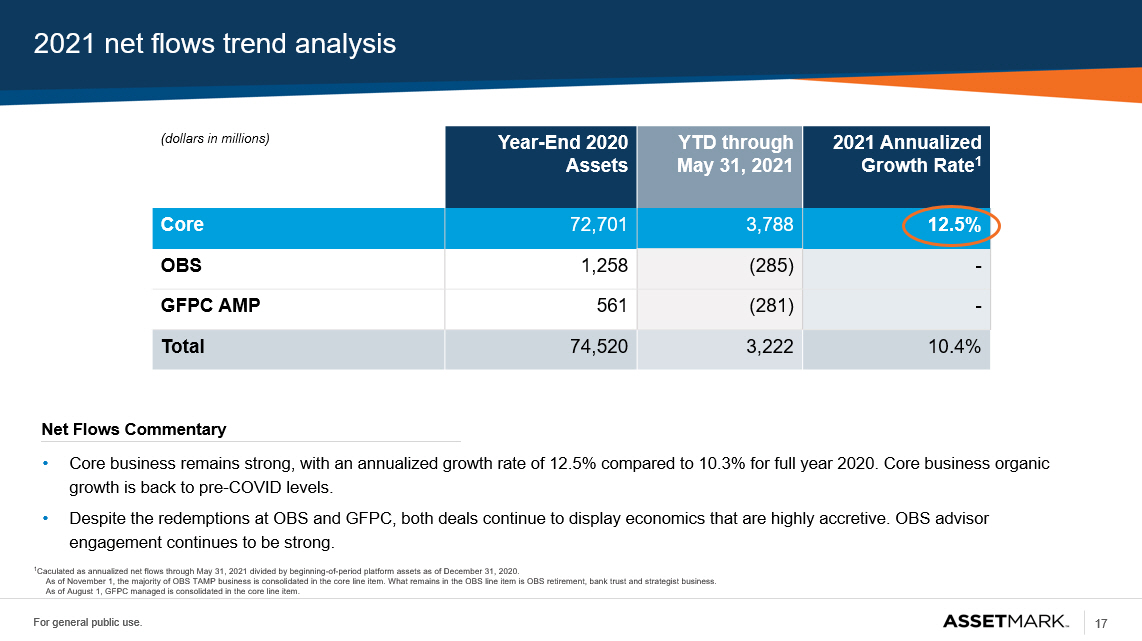
17 For general public use. 2021 net flows trend analysis (dollars in millions) Year - End 2020 Assets YTD through May 31, 2021 2021 Annualized Growth Rate 1 Core 72,701 3,788 12.5% OBS 1,258 (285) - GFPC AMP 561 (281) - Total 74,520 3,222 10.4% Net Flows Commentary • Core business remains strong, with an annualized growth rate of 12.5% compared to 10.3% for full year 2020. Core business org ani c growth is back to pre - COVID levels. • Despite the redemptions at OBS and GFPC, both deals continue to display economics that are highly accretive. OBS advisor engagement continues to be strong. 1 Caculated as annualized net flows through May 31, 2021 divided by beginning - of - period platform assets as of December 31, 2020. As of November 1, the majority of OBS TAMP business is consolidated in the core line item. What remains in the OBS line ite m is OBS retirement, bank trust and strategist business. As of August 1, GFPC managed is consolidated in the core line item.