Attached files
| file | filename |
|---|---|
| EX-32.2 - EX-32.2 - AssetMark Financial Holdings, Inc. | amk-ex322_137.htm |
| EX-32.1 - EX-32.1 - AssetMark Financial Holdings, Inc. | amk-ex321_138.htm |
| EX-31.2 - EX-31.2 - AssetMark Financial Holdings, Inc. | amk-ex312_140.htm |
| EX-31.1 - EX-31.1 - AssetMark Financial Holdings, Inc. | amk-ex311_139.htm |
| EX-23.2 - EX-23.2 - AssetMark Financial Holdings, Inc. | amk-ex232_305.htm |
| EX-23.1 - EX-23.1 - AssetMark Financial Holdings, Inc. | amk-ex231_304.htm |
| EX-21.1 - EX-21.1 - AssetMark Financial Holdings, Inc. | amk-ex211_164.htm |
| EX-4.3 - EX-4.3 - AssetMark Financial Holdings, Inc. | amk-ex43_165.htm |
UNITED STATES
SECURITIES AND EXCHANGE COMMISSION
WASHINGTON, D.C. 20549
FORM 10-K
(Mark One)
|
☒ |
ANNUAL REPORT PURSUANT TO SECTION 13 OR 15(d) OF THE SECURITIES EXCHANGE ACT OF 1934 |
For the fiscal year ended December 31, 2019
OR
|
☐ |
TRANSITION REPORT PURSUANT TO SECTION 13 OR 15(d) OF THE SECURITIES EXCHANGE ACT OF 1934 |
For the transition period from _____ to ______
Commission File Number: 001-38980
ASSETMARK FINANCIAL HOLDINGS, INC.
(Exact name of registrant as specified in its charter)
|
Delaware (State or other jurisdiction of incorporation or organization) |
|
|
|
30-0774039 (I.R.S. Employer Identification Number) |
|
|
|
|
|
|
|
|
|
1655 Grant Street, 10th Floor Concord, California 94520 (Address of principal executive offices) |
|
|
|
|
|
|
|
|
|
|
|
(925) 521-2200 (Registrant’s telephone number, including area code) |
|
|
Securities registered pursuant to Section 12(b) of the Securities Exchange Act of 1934:
|
Title of each class |
Trading symbol(s) |
Name of each exchange on which registered |
|
Common stock, par value $0.001 per share |
AMK |
New York Stock Exchange |
Securities registered pursuant to Section 12(g) of the Securities Exchange Act of 1934: None
Indicate by check mark if the registrant is a well-known seasoned issued, as defined in Rule 405 of the Securities Act of 1933. Yes ☐ No ☒
Indicate by check mark if the registrant is not required to file reports pursuant to Section 13 or Section 15(d) of the Securities Exchange Act of 1913. Yes ☐ No ☒
Indicate by check mark whether the registrant (1) has filed all reports required to be filed by Section 13 or 15(d) of the Securities Exchange Act of 1934 during the preceding 12 months (or for such shorter period that the registrant was required to file such reports), and (2) has been subject to such filing requirements for the past 90 days. Yes ☒ No ☐
Indicate by check mark whether the registrant has submitted electronically every Interactive Data File required to be submitted pursuant to Rule 405 of Regulation S-T (§232.405 of this chapter) during the preceding 12 months (or for such shorter period that the registrant was required to submit such files). Yes ☒ No ☐
Indicate by check mark whether the registrant is a large accelerated filer, an accelerated filer, a non-accelerated filer, a smaller reporting company or an emerging growth company. See the definitions of “large accelerated filer,” “accelerated filer,” “smaller reporting company” and “emerging growth company” in Rule 12b-2 of the Exchange Act.
|
Large accelerated filer |
☐ |
|
Accelerated filer |
☐ |
|
Non-accelerated filer |
☒ |
|
Smaller reporting company |
☐ |
|
|
|
|
Emerging growth company |
☒ |
If an emerging growth company, indicate by check mark if the registrant has elected not to use the extended transition period for complying with any new or revised financial accounting standards provided pursuant to Section 13(a) of the Exchange Act. Yes ☐ No ☒
Indicate by check mark whether the registrant is a shell company (as defined in Rule 12b-2 of the Exchange Act). Yes ☐ No ☒
The aggregate market value of the common stock held by non-affiliates of the Registrant, based on the closing price of $27.04 per share of the Registrant’s common stock on July 18, 2019 as reported by the New York Stock Exchange on such date, was approximately $1.8 billion. The Registrant has elected to use July 18, 2019, which was the initial trading date of the Registrant’s common stock on the New York Stock Exchange, as the calculation date because on June 28, 2019 (the last business day of the Registrant’s most recently completed second fiscal quarter), the Registrant was a privately held company. Shares of the Registrant’s common stock held by each executive officer, director and holder of 5% or more of the outstanding common stock have been excluded in that such persons may be deemed to be affiliates. This calculation does not reflect a determination that certain persons are affiliates of the registrant for any other purpose. The Registrant has no non-voting equity.
As of February 29, 2020, the number of shares of the registrant’s common stock outstanding was 72,390,080.
Documents Incorporated by Reference: Certain information required in response to Item 5 of Part II of Form 10-K and Part III of Form 10-K is hereby incorporated by reference to portions of the Registrant’s Proxy Statement for the Annual Meeting of Stockholders to be held in 2020. The Proxy Statement will be filed by the Registrant with the Securities and Exchange Commission no later than 120 days after the end of the Registrant’s fiscal year ended December 31, 2019.
ASSETMARK FINANCIAL HOLDINGS, INC.
TABLE OF CONTENTS
|
|
|
Page No. |
|
|
2 |
|
|
|
|
|
|
|
|
|
|
|
|
|
|
Item 1. |
3 |
|
|
Item 1A. |
11 |
|
|
Item 1B. |
30 |
|
|
Item 2. |
30 |
|
|
Item 3. |
30 |
|
|
Item 4. |
30 |
|
|
|
|
|
|
|
|
|
|
|
|
|
|
Item 5. |
31 |
|
|
Item 6. |
34 |
|
|
Item 7. |
Management’s Discussion and Analysis of Financial Condition and Results of Operations |
35 |
|
Item 7A. |
55 |
|
|
Item 8. |
56 |
|
|
Item 9. |
Changes in and Disagreements with Accountants on Accounting and Financial Disclosure |
83 |
|
Item 9A. |
83 |
|
|
Item 9B. |
83 |
|
|
|
|
|
|
|
|
|
|
|
|
|
|
Item 10. |
84 |
|
|
Item 11. |
84 |
|
|
Item 12. |
Security Ownership of Certain Beneficial Owners and Management and Related Stockholder Matters |
84 |
|
Item 13. |
Certain Relationships and Related Transactions, and Director Independence |
84 |
|
Item 14. |
84 |
|
|
|
|
|
|
|
|
|
|
|
|
|
|
Item 15. |
85 |
|
|
Item 16. |
85 |
1
SPECIAL NOTE REGARDING FORWARD-LOOKING STATEMENTS
This Annual Report on Form 10-K contains forward-looking statements within the meaning of the Private Securities Litigation Reform Act of 1995. All statements other than statements of historical facts contained in this Annual Report on Form 10-K, including statements regarding our future results of operations or financial condition, business strategy and plans and objectives of management for future operations, are forward-looking statements. In some cases, you can identify these statements by forward-looking words such as “may,” “might,” “will,” “should,” “expects,” “plans,” “anticipates,” “intends,” “believes,” “estimates,” “predicts,” “potential” or “continue,” the negative of these terms and other comparable terminology that conveys uncertainty of future events or outcomes. These forward-looking statements, which are subject to risks, uncertainties and assumptions about us, may include projections of our future financial performance and financial results, our anticipated growth strategies and anticipated trends in our business, our expectations regarding our industry outlook, market position, liquidity and capital resources, acquisition targets, addressable market, investments in new products, services and capabilities, our ability to close and execute on strategic transactions and our ability to comply with existing, modified and new laws and regulations applying to our business. These statements are only predictions based on our current expectations and projections about future events. There are important factors that could cause our actual results, level of activity, performance or achievements to differ materially from the results, level of activity, performance or achievements expressed or implied by the forward-looking statements, including those factors discussed in section titled “Risk Factors.” Although we believe the expectations reflected in the forward-looking statements are reasonable, we cannot guarantee future results, level of activity, performance or achievements. Moreover, neither we nor any other person assumes responsibility for the accuracy and completeness of any of these forward-looking statements. We are under no duty to update any of these forward-looking statements after the date of this Annual Report on Form 10-K to conform our prior statements to actual results or revised expectations, except as required by law. In addition, “we believe” and similar statements reflect our beliefs and opinions on the relevant subject. These statements are based upon information available to us as of the date of this Annual Report on Form 10-K, and while we believe such information forms a reasonable basis for such statements, such information may be limited or incomplete, and our statements should not be read to indicate that we have conducted an exhaustive inquiry into, or review of, all potentially available relevant information. These statements are inherently uncertain and investors are cautioned not to unduly rely upon these statements as predictions of future events.
2
Overview
AssetMark is a leading provider of extensive wealth management and technology solutions that power independent financial advisers and their clients. Our platform enables advisers to outsource high-cost and specialty services that would otherwise require significant investments of time and money—helping to level the playing field for independent financial advisers of all sizes. We provide an end-to-end experience, spanning nearly all elements of an adviser’s engagement with his or her client—from initial conversations to ongoing financial planning discussions, including performance reporting and billing. In addition, our platform provides tools and capabilities for advisers to better manage their day-to-day business activities, giving them more time for meaningful conversations with investors.
We believe that independent financial advisers who have a deep understanding of their communities and put the needs of investors first provide the best path for investors to achieve their long-term financial goals. We empower these adviser-entrepreneurs to start, run and grow independent advisory businesses.
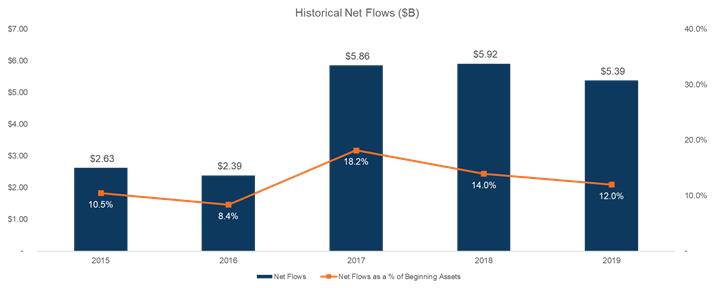
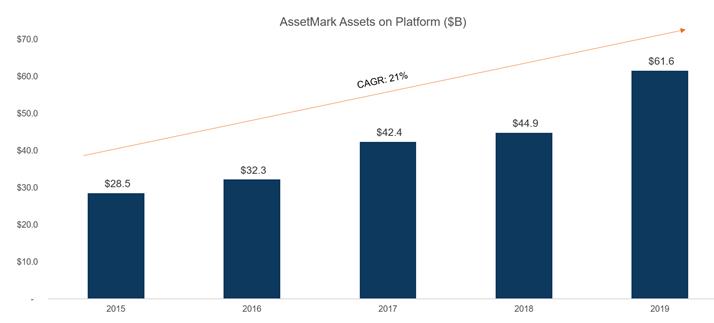
The compelling value of our tools for advisers and their clients has facilitated our rapid growth. From December 31, 2015 to December 31, 2019, our platform assets(1) grew from $29 billion to $62 billion, representing a compounded annual growth rate of 21%, and more recently grew 45% from December 31, 2017 to December 31, 2019. Further, our investors value the services they receive from advisers as evidenced by the growth in our net flows(2) from $2.6 billion in 2015 to $5.4 billion in 2019, representing 10% and 12% of beginning platform assets, respectively. As of December 31, 2019, our platform served approximately 162,000 investor Households (as defined in the section titled “Management’s Discussion and Analysis of Financial Condition and Results of Operations—Key Operating Metrics”) through our approximately 7,900 adviser relationships.
Our platform provides advisers with an integrated suite of products and services that facilitates growth, streamlines workflows and provides scale to advisers’ businesses so they can better serve their clients, who are large and small investors. Highlights of our platform include:
|
|
• |
Fully integrated technology platform: Our integrated platform is built for advisers, providing advisers access to a broad range of highly automated processes, including new account opening, portfolio construction, streamlined financial planning, customer billing, investor reporting, progress to goal analysis and client activity tracking. Our dual focus on technology utility and design has resulted in a platform that is accessible, easy-to-use, intuitive and expansive. |
|
|
• |
Personalized and scalable adviser service: We surround our advisers with highly experienced consulting and service support. We provide a full spectrum of services for many aspects of the adviser’s firm. These services include high-value day-to-day business support from field professionals, operations and service support teams and specialty teams including business management consultants, investment specialists and retirement consultants. Our offering is guided by extensive intellectual capital and well-established business performance benchmarking tools and responsive back- and middle-office outsourcing support from highly tenured service and operations professionals. We aim for every adviser to feel that their AssetMark service and consulting team is an integral part of their business. |
|
|
• |
Curated investment platform: We provide independent advisers with a curated set of over 25 thoroughly vetted specialty and leading third-party asset managers, in addition to our two proprietary investment providers. Our due diligence team narrows the universe of potential investment solutions to a select group of time-tested and emerging investment choices. In effect, we equip each adviser with a team of skilled investment professionals that act as a virtual extension of their investment staff, who deliver our solutions through an array of technology-enabled tools that assist in the creation and monitoring of goal-based portfolios. Further, the flexibility and breadth of our platform allows us to offer custom portfolios designed to meet the unique needs of investors, specifically mass-affluent and high-net-worth investors. |
|
|
1 |
We define platform assets as all assets on the AssetMark platform, whether these are assets for which we provide advisory services, referred to as assets under management, or non-advisory assets under administration, assets held in cash accounts or assets otherwise not managed. |
|
2 |
We define net flows for a period as production (the amount of new assets that are added to existing and new client accounts in the period) minus redemptions (the amount of assets that are terminated or withdrawn from client accounts in the period), excluding the impact of changes in the market value of investments held in client accounts and fees charged to advisers and end-investors. |
3
Our offering’s distinctive combination of a compelling technology platform, extensive and scalable value-added services and curated investment solutions has been a key driver of our market share expansion from 8% to 11% from December 31, 2014 to September 30, 2019. We define our market share based on assets managed by third-party vendors as calculated by Cerulli Associates (“Cerulli”), excluding non-advisory assets managed by Schwab’s Marketplace and Fidelity’s Separate Account Network, and, for SEI Investments, including only assets reported in Advisor Network, their third-party asset management segment. Additionally, our platform can act as a critical accelerant for the success of our advisers’ businesses, which in turn can result in an increase in assets on our platform; the success of our advisers is reflected in our continued strong net flows of $5.4 billion in 2019. Further, given that our platform and services are tightly integrated into our advisers’ businesses, we believe that we have engendered and will continue to engender deep loyalty from our advisers.
Our revenue model is almost entirely composed of fees that are recurring in nature, which provides a high level of visibility into our near-term financial performance. The two main components of our revenue are asset-based revenue and spread-based revenue. We generate asset-based revenue from fees billed to investors on a bundled basis in advance of each quarter. The quarterly nature of our asset-based revenue provides significant visibility into near-term revenue and helps minimize unexpected revenue fluctuations stemming from market volatility. Our spread-based revenue is driven by interest rates on the cash assets held by investors at our proprietary trust company. In the year ended December 31, 2019, we generated $377.7 million in asset-based revenue and $34.6 million in spread-based revenue.
4
In the year ended December 31, 2019, we generated total revenue of $417.9 million, net loss of $0.4 million, adjusted EBITDA of $109.9 million and adjusted net income of $66.1 million. We generated total revenue of $363.6 million, net income of $37.4 million, adjusted EBITDA of $88.9 million and adjusted net income of $60.8 million in the year ended December 31, 2018. From January of 2016 to December 31, 2019, our total revenue has grown at a compounded annual growth rate of 19%.
See the section titled “Management’s Discussion and Analysis of Financial Condition and Results of Operations—Key Operating Metrics—Non-GAAP Financial Metrics” for the definitions of adjusted EBITDA and adjusted net income as well as reconciliations of net income to adjusted EBITDA and net income to adjusted net income.
We were incorporated in the State of Delaware in 2013. We had approximately 729 employees as of December 31, 2019.
Market Opportunity
We serve fee-based, independent advisers who provide wealth management advice to U.S. investors. The wealth management market is large and has a long history of rapid growth fueled by several secular trends. According to Cerulli, in aggregate across the United States, 304,241 advisers managed $19.9 trillion in assets as of December 31, 2018, and total industry assets have grown at a compounded annual growth rate of 5% over the five years ended December 31, 2018. Cerulli expects these assets to grow to $24.7 trillion by 2023. Our current offering and growth plans are built to capitalize on favorable industry trends, which we expect will continue to support our growth.
|
|
• |
Total U.S. investible wealth is massive and growing: According to Cerulli, U.S. households had $99.8 trillion in net worth as of December 31, 2018, which has grown at a compounded annual growth rate of 9.0% over the five years ended December 31, 2018. As of December 31, 2018, advisers managed $19.9 trillion (approximately 20%) of this wealth, indicating ample runway for future growth of the financial advisory industry. |
|
|
• |
Investor demand for financial advisers is expanding: As investors have aged and their financial goals have become more complex, the demand for financial advice has expanded. According to Cerulli, demand for financial advice has increased from 35% to 39% from 2013 to 2019 measured by the percentage of investor households surveyed receiving assistance or direction from financial advisers relative to investor households self-managing their financial affairs. |
|
|
• |
Advisers are transitioning to an independent model, and we expect this trend to continue: The U.S. wealth management industry consists primarily of two types of channels, independent and traditional. We consider the “independent” channel to comprise registered investment advisers (“RIAs”), hybrid RIAs, independent broker-dealers and insurance broker-dealer advisers, and the “traditional” channel to comprise national and regional broker-dealers, bank broker-dealers and wirehouse advisers. According to Cerulli data and internal estimates of expected growth of the wealth management industry, from 2013 to 2018, independent channels have grown faster than traditional channels in terms of market share measured by assets, expanding by 7% annually at the expense of traditional channels. This trend is expected to continue, with independent assets forecasted to grow from $8.4 trillion in 2018 to $12.0 trillion in 2023, from 42% to 48% of total adviser-managed assets over the same period. |
|
|
• |
Shift from commissions to fee-based models: According to PriceMetrix, in 2018, advisers received over 60% of their total revenue from fees, which represented a record level relative to commissions. The long-term adviser trend towards a fiduciary standard of advice, catalyzed in part by the 2016 Department of Labor (“DOL”) rule (later vacated) that expanded the definition of “fiduciary investment advice” to include all financial professionals providing retirement advice, has helped drive this shift to a fee-based revenue model. |
5
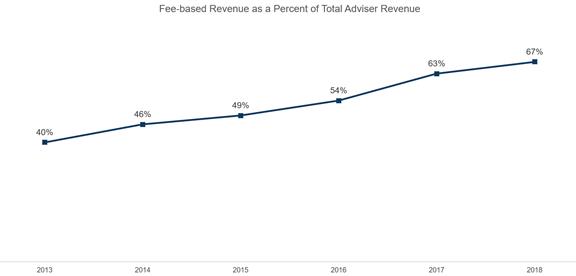
Note: Based on data from The State of Retail Wealth Management, PriceMetrix, 2016, 2017 and 2018.
|
|
• |
Advisers are increasingly reliant on technology to remain price competitive and achieve scale while serving evolving client needs: Individual investors are increasingly turning to independent financial advisers for their wealth management and investment needs. From 2013 to 2017, the average number of investors served by an RIA adviser increased by 20% according to Fidelity. Advisers are increasingly relying on technology to meet the needs of an expanding client base while continuing to scale their advisory businesses, as indicated by a 24% increase in the average number of software solutions used by advisers from 2013 to 2017, according to the 2017 InvestmentNews Adviser Technology Study. Investor preferences for service models delivered via mobile applications and online portals are also increasing advisers’ focus on the quality of their technology. 61% of investors surveyed recently stated that they prefer an advice model that combines human and digital elements to one that is either purely digital or limited to direct interaction with an adviser, according to the Fidelity 2017 Digital Advisor Adoption Study Update. |
|
|
• |
Advisers are rapidly expanding their use of model portfolios: Advisers are increasingly choosing to outsource key components of the asset management aspect of their role as financial advisers, including the choice of investment manager. As such, the use of model portfolios (which we define as mutual fund advisory, ETF advisory, unified managed account and separate account assets) among financial advisers grew at a compounded annual growth rate of 11% from 2013 to 2018, based on data from Cerulli and internal estimates. |
Our offering is built around technology, investment solutions and expert support, positioning us to benefit from these trends. Combined with our scalable, fee-based platform and services that help advisers put investors’ needs first, we believe that these favorable industry trends will give us the opportunity to continue to gain market share. Our gains in market share since 2014 have been due largely to organic growth, an area on which we plan to continue to focus.
Our Offering and Business Model
AssetMark’s purpose
Our over 700 employees come to work focused on our mission: to make a difference in the lives of our advisers and the investors they serve. Our mission is guided by a singular focus on successful outcomes for those investors. We strive to execute our mission through our stated corporate values of heart, integrity, excellence and respect, in everything that we do.
The AssetMark offering to advisers and the investors they serve
We provide independent financial advisers with an array of tools and services designed to streamline their workflow, help them develop and expand their businesses and provide goal-oriented investment solutions. We believe that the quality of our offering, coupled with our deep relationships with our advisers, has generated significant adviser satisfaction, as measured by our exceptional Net Promoter Score (“NPS”) of 59 as of June 30, 2019. Our offering is defined by solutions in three focus areas:
6
|
|
• |
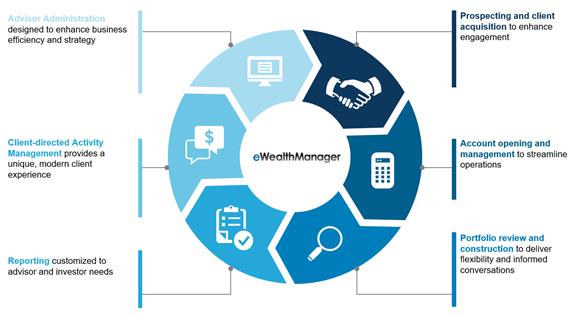
Fully integrated technology platform: Independent financial advisers and their teams are faced with a multitude of marketing, administrative and business management tasks. We offer a compelling technology suite that fully integrates leading third-party technology solutions with our core proprietary technology and helps advisers perform these tasks. Our solution helps advisers streamline their operations while providing a superior experience for their staff and clients. The combined capabilities of our technology platform support advisers throughout the investor life cycle, from initial prospecting and onboarding through ongoing service and reporting, and replace a complex array of technologies with a single, streamlined solution. With less time spent navigating multiple systems and technologies, advisers are able to focus on enhancing productivity. As advisers come to rely on our integrated platform, it becomes integral to their daily practices. This reliance, in conjunction with high adviser satisfaction due to our platform’s ability to optimize adviser workflow, has contributed to our strong growth in assets and net flows. |
We are dedicated to innovation and strive to continually improve our offering through the development of new tools and services. From January 1, 2015 to December 31, 2019, we invested $190 million in technology development and our dedicated technology team, and we have a proven track record of delivering innovative solutions that deepen our advisers’ offerings to their investor clients while also enhancing advisers’ scale. Recent innovations include a new portfolio construction and analysis tool that assists advisers in creating and monitoring investor portfolios, a streamlined account opening solution that reduces the time to onboard new accounts on our platform, a goals-based investor portal that serves as a hub for communications between advisers and their clients and a fully automated digital advice tool that connects our advisers with their clients.
|
|
• |
Personalized and scalable adviser service: Providing advisers access to high-quality service is a critical component of our value proposition. We develop deep, multi-level relationships with advisers’ firms, helping to ensure that, at all levels, advisers and their teams are connected with AssetMark. We tailor our services to the size of the adviser, allowing us to provide high service levels to a wide-range of adviser business sizes while also maintaining our operating leverage. |
The “Regional Consultant” is the centerpiece of an adviser’s relationship with AssetMark. Our highly experienced Regional Consultants ensure that advisers can draw from a wide array of resources and institutional knowledge as they build and grow their businesses. These professionals are the single point of contact for the adviser and bring in expertise to help the adviser grow and compete. As of December 31, 2019, our Regional Consultants in the field and phone-based consultants served approximately 7,900 advisers. Depending on the adviser’s business needs, our consultants introduce advisers to investment experts, business development professionals, retirement consultants and business consultants who can help the adviser reach his or her goals. For example, investment experts provide advisers with insights into portfolio construction and how specific investments help investors reach their goals, and our team of business consultants helps advisers build more efficient and scalable businesses. This relationship model provides each adviser with a trusted colleague whom the adviser can contact with questions and who can provide access to an array of specialty resources. The value our clients place on our sales model is reflected in our high Sales NPS of 66 as of June 30, 2019.
The “Relationship Manager” is at the heart of the back-office professional’s relationship with us. Our Relationship Managers work to ensure operational activity is accurately executed and seek to promptly resolve any issues investors may encounter. We feature high-touch, accurate and rapid client servicing from dedicated teams who strive to enhance the
7
responsiveness of the adviser’s back office. In addition, our Relationship Managers provide productivity and client-service best practices, gained through deep industry experience, to the adviser’s back office teams. Like our Regional Consultants, our Relationship Managers are go-to resources for our advisers and their offices. Depending on the size of the office, we offer a range of service models. Our largest advisers receive support from a dedicated Relationship Manager, while smaller offices are served by a centralized team of professionals. Our service model is highly valued by advisers of all sizes, as demonstrated by our high Service NPS of 64 as of June 30, 2019. Further, approximately 80% of those advisers who were identified as promoters of our services in the NPS surveys from June 30, 2019 selected service as a key reason for their high satisfaction with us.
|
|
• |
Curated investment solutions: Financial planning is the core competency and value proposition for most wealth managers. The various investment management functions that compose this role, such as formulating capital market assumptions, conducting manager due diligence, constructing portfolios and monitoring markets, managers and portfolios, can take time away from advisers’ ability to help their investors stay on track to reach their goals. As a result, many advisers outsource these activities to independent platforms like AssetMark. |
We perform this challenging work for the adviser through our dedicated team of investment professionals who assess markets, conduct due diligence on asset managers and construct model portfolios for advisers to offer to their clients. We deliver these capabilities through a portfolio construction methodology that can be broadly described in three categories:
|
|
• |
Core markets: Strategies that provide exposure to growth in domestic and global economies. |
|
|
• |
Tactical strategies: Supplemental equity strategies that can augment core performance or provide risk mitigation in periods of market decline. |
|
|
• |
Diversifying strategies: Equity alternative or bond and bond alternative strategies that offer lower volatility or lower correlation to help smooth portfolio performance or allow for greater equity exposure. |
Our portfolios feature a wide range of investment vehicles including ETFs, mutual funds, equities, individual bonds and options strategies. In addition, we provide turnkey solutions for advisers who would prefer to fully outsource a selection of investments, and portfolio components and construction tools for advisers who would prefer to build or customize portfolios themselves using our curated list of strategists.
The AssetMark business model
To achieve our mission, we have built a business model that allows us to reinvest in our advisers’ and their clients’ success. Our business model has delivered a track record of attractive revenue growth and adjusted EBITDA margin expansion, both driven by strong fundamentals including:
|
|
• |
Strong asset growth: We have experienced (1) platform asset growth from existing clients of approximately 43% from December 31, 2014 to December 31, 2019, (2) $20.1 billion in assets attracted from new advisers to the platform over the same period and (3) $7.3 billion in assets added to our platform through acquisitions of competitors over the same period, measured at the date of acquisition. |
|
|
• |
Recurring and resilient revenue model: In the year ended December 31, 2019, 99% of our total revenue was recurring in nature (based on revenue generated from assets that are under contract and not dependent on trading activity) and derived from either asset-based revenue or spread-based revenue from investor cash held at our proprietary custodian. In the year ended December 31, 2019, 90% of our total revenue was derived from asset-based revenue and 8% of our total revenue was derived from spread-based revenue. Since asset-based revenue is influenced by sector, asset class and market returns, while spread-based revenue is influenced by Federal Reserve movements and the amount of cash investors hold, our two sources of revenue are relatively uncorrelated, which has helped us establish a sustainable business model through various market fluctuations. |
|
|
• |
Attractive margin profile driven by a mix of proprietary and third-party solutions: Our open-architecture technology, investment solutions and custodial platform offer choice and superior capabilities for advisers. In addition, since we offer a balance of third-party and proprietary solutions, we capture incremental economics, which has led to enhanced margins. By offering proprietary solutions alongside third-party technology, asset management and custody solutions, we foster competition across our offering. This competition drives participants (including us) to improve their offerings or risk losing favor with advisers. Each solution competes on its own value proposition and merits, and we do not promote or advantage our proprietary offerings above those of third parties. Our trust company held approximately 70% of our platform assets, and our proprietary strategists served 21% of our platform assets, as of December 31, 2019, evidencing the strength of our proprietary offerings. |
|
|
• |
Consistently strong net flows: Because our platform offers an array of solutions to advisers and our technology is deeply integrated into advisers’ businesses, our net flows grew from $2.6 billion in 2015 to $5.4 billion in 2019, representing 10% and 12% of beginning platform assets, respectively. The decrease in our net flows from the year ended December 31, 2018 to the year ended December 31, 2019 was due to increased redemptions from GFPC’s adviser-managed business, which yielded nominal revenue to us. |
8
|
|
• |
Significant operating leverage: Our purpose-built platform and upfront investments in our business have positioned us to benefit from upside growth and continued scale with meaningful operating leverage, while continuing to deliver enhanced platform capabilities and solutions to advisers. Our net income margin decreased from 10.3% for the year ended December 31, 2018 to (0.1)% for the year ended December 31, 2019, primarily driven by non-cash share-based compensation expense as a result of the growth in the valuation of our business, non-recurring IPO and acquisition costs and interest expense under our Term Loan, as defined in the section titled “Management’s Discussion and Analysis of Financial Condition and Results of Operations—Liquidity and Capital Resources.” Although our net income margin has decreased, the power of the operating leverage in our model is most apparent from our ability to expand our adjusted EBITDA margin (defined as adjusted EBITDA divided by total revenue), which expanded from 24.5% for the year ended December 31, 2018 to 26.3% for the year ended December 31, 2019. |
Our strengths
For more than 20 years, we have focused on providing solutions that enhance and simplify the lives of our advisers and the investors they serve. We believe that this approach distinguishes us from many of our competitors. The following strengths underpin our competitive advantage:
|
|
• |
Our mission-driven, client-focused culture: We believe that our exceptional client-centric culture has driven our historical performance. The AssetMark team is dedicated to its mission of making a difference in the lives of advisers and investors through a culture that rests on our core pillars of heart, integrity, excellence and respect. We are also committed to helping advisers and the communities they serve. Through our Summer of Service and Community Inspiration Awards we seek to ensure that our firm’s and our advisers’ communities benefit from our charitable contributions. We believe that our focus on doing the right thing while also running a great business not only results in higher adviser loyalty and referrals, but also increases our employee tenure. |
|
|
• |
A deep understanding of fee-based, independent advisers: Our frequent, value-added interactions with our diverse group of advisers help us tailor offerings to meet their needs, at scale and in the context of their business opportunities and challenges. We also benefit from tracking and evaluating advisers’ extensive activity in our ecosystem. This allows us to create responsive service models, operational processes and solutions that help advisers reduce the time associated with administrative tasks. In addition, members of our community of advisers have access to each other’s best practices as well as data about their specific business activity, which helps our advisers grow their businesses and drives our extensive best practices library. |
|
|
• |
Proven ability to execute superior outsource solutions facilitated by a leading technology offering: We create outsource solutions that transform advisers’ businesses. We believe the transformation that we enable for the advisers on our platform is the result of our deeply integrated service model and robust, user-friendly technology, which together help advisers improve responsiveness to investors. Collectively, our outsource offerings optimize advisers’ time and, as a result, help improve investor outcomes. |
|
|
• |
We are a scale provider: We are an established leader as an outsource service provider for independent, fee-based financial advisers. Our scale and access enable us to establish favorable partnerships with technology and asset management institutions and provide attractive pricing for our advisers’ clients. In addition, scale allows us to consistently invest in our core offering of a fully integrated technology platform, personalized and scalable adviser service and curated investment solutions to address the evolving needs of investors and advisers. Our feature-rich technology solution scales to serve a broad-range of business sizes, from solo practices to ensemble firms. The scope and scale of our offering has made us an essential part of our advisers’ businesses, in turn making us the third largest outsource provider of the components of a managed account platform (known in the industry as a Turnkey Asset Management Program, or TAMP) in terms of platform assets as of September 30, 2019, according to WealthAdvisor’s 2020 America’s Best TAMPs report. As of September 30, 2019, our market share among U.S. TAMPs was 11%. |
|
|
• |
We are a disciplined acquirer: Growth through acquisition of small, subscale, outsource providers is a core competency of our business. Our value creation through acquisition is generated by purchase price discipline and our ability to grow relationships formed through these acquisitions. In 2014 and 2015, respectively, we acquired the platform assets of two firms that collectively added $3.5 billion in assets to our platform at the time of acquisition. On average, three years post-acquisition, these acquired assets had grown by 17% compounded annually. Subsequently, in April 2019, we closed our acquisition of Global Financial Private Capital for a cash purchase price of $35.9 million, which added another $3.8 billion in platform assets. In September 2019, we announced our agreement to acquire OBS Financial, which closed on February 29, 2020 and which added approximately $2.1 billion in platform assets. |
Our Growth Strategy
|
|
• |
Increase the adviser base: Through our marketing efforts and the outreach of our more than 100-person field force, we expect to continue building on our existing relationships with advisers and growing business from new relationships. |
9
|
|
• |
Expand share of wallet from existing adviser clients: According to our internal share of wallet study, as of March 31, 2019, we had approximately 33% of the total assets and 61% of the total advisory assets of our advisers with at least $5 million in positive net flows on our platform over the life of our relationship with them. We plan to work with existing advisers to add investment solutions to our platform that they otherwise obtain elsewhere. This work aims to help advisers further their operational efficiencies and improve their investor experience by shifting an increasing portion of their business to AssetMark. |
|
|
• |
Help advisers grow their businesses: Our turnkey, holistic platform and adviser engagement model are designed to help advisers grow and build sustainable businesses. We plan to continue to help advisers grow through our deep business consulting engagements and comprehensive platform support. |
|
|
• |
Expand our services to new segments: We are focused on introducing new products and enhancing services and capabilities in areas including cash management, business consulting and trading to further expand our reach into the RIA market, retirement services, bank trusts and the high-net-worth segment. We believe that these solutions will enhance our offering to existing advisers while also deepening and extending our relationships with high-growth segments of advisers. |
|
|
• |
Continue to pursue strategic transactions: We expect to continue to selectively pursue acquisitions that we believe will enhance the scale and operating leverage of our business. In addition, we may pursue acquisitions that expand the appeal of our offering to independent, fee-based advisers and the investors they serve. |
Competition
We compete with a broad range of wealth management firms that offer services to independent investment advisers. The principal factors on which participants in our industry compete are: 1) technological capabilities, 2) consulting and back-office servicing and 3) investment solutions. We believe that we compete favorably on each of these factors.
Our competitors offer a variety of products and services that compete with one or more of the investment solutions and services provided through our platform. Our principal competitors include:
|
|
• |
Other turnkey asset management platform providers: Most providers of turnkey asset management platforms typically provide financial advisers with one or more types of products and services, and vary in the number of choices offered in terms of custodians, technology features, investments and quality of service. |
|
|
• |
Independent broker-dealer proprietary wealth platforms: Many broker-dealers provide integrated proprietary wealth management platforms that offer an array of asset management solutions to their affiliated financial advisers. |
|
|
• |
Providers of specific service applications: Several of our competitors provide financial advisers with a product or service designed to address one or a limited number of specific needs, such as financial planning or performance reporting. |
|
|
• |
Adviser-built solutions: Some financial advisers have developed in-house solutions that overlap with some or all of the technology or services that we currently provide, including portfolio construction, portfolio analytics and model management. |
While we anticipate that we will see increased competition and experience fee pressure, we believe that our technology platform, along with our personalized service and curated investment solutions, will continue to drive revenue expansion.
Available Information
We make our annual reports on Form 10-K, quarterly reports on Form 10-Q and current reports on Form 8-K, as well as amendments to those reports, available free of charge at our corporate website as soon as reasonably practicable after they have been filed with the U.S. Securities and Exchange Commission (the “SEC”). Our corporate website address is ir.assetmark.com. Information on or available through our website is not part of this Annual Report on Form 10-K. The SEC maintains a website that contains the materials we file with the SEC at www.sec.gov.
10
Risks Related to Our Business and Operations
Our revenue may fluctuate from period to period, which could cause our share price to fluctuate.
Our revenue may fluctuate from period to period in the future due to a variety of factors, many of which are beyond our control. Factors relating to our business that may contribute to these fluctuations include the following events, as well as other factors described elsewhere in this Annual Report on Form 10-K:
|
|
• |
a decline or slowdown of the growth in the value of financial market assets or changes in the mix of assets on our platform, which may reduce the value of our platform assets and therefore our revenue and cash flows; |
|
|
• |
a lowering of interest rates that will directly and proportionately impact our spread-based revenue; |
|
|
• |
significant fluctuations in securities prices affecting the value of assets on our platform, including as a result of public health concerns or epidemics such as the recent coronavirus outbreak; |
|
|
• |
negative public perception and reputation of the financial services industry, which would reduce demand for our investment solutions and services; |
|
|
• |
unanticipated acceleration of client investment preferences to lower-fee options; |
|
|
• |
downward pressure on fees we charge our investor clients, which would reduce our revenue; |
|
|
• |
changes in laws or regulations that could impact our ability to offer investment solutions and services; |
|
|
• |
failure to obtain new clients or retain existing clients on our platform, or changes in the mix of clients on our platform; |
|
|
• |
failure by our financial adviser clients to obtain new investor clients or retain their existing investor clients; |
|
|
• |
failure to adequately protect our proprietary technology and intellectual property rights; |
|
|
• |
reduction in the suite of investment solutions and services made available by third-party providers to existing clients; |
|
|
• |
reduction in fee percentage or total fees for future periods, which may have a delayed impact on our results given that our asset-based fees are billed to advisers in advance of each quarter; |
|
|
• |
changes in our pricing policies or the pricing policies of our competitors to which we have to adapt; or |
|
|
• |
general domestic and international economic and political conditions that may decrease investor demand for financial advisers or investment services. |
As a result of these and other factors, our results of operations for any quarterly or annual period may differ materially from our results of operations for any prior or future quarterly or annual period and should not be relied upon as indications of our future performance.
We operate in an intensely competitive industry, with many firms competing for business from financial advisers on the basis of the quality and breadth of investment solutions and services, ability to innovate, reputation and the prices of services, among other factors, and this competition could hurt our financial performance.
We compete with many different types of companies that vary in size and scope, including other TAMPs. In addition, some of our adviser clients have developed or may develop the in-house capability to provide the technology or investment advisory services they have retained us to perform. These clients may also offer internally developed services to their financial advisers, obviating the need to hire us, and they may offer these services to third-party financial advisers or financial institutions, thereby competing directly with us for that business.
Some of our competitors have greater name recognition or greater resources than we do, and may offer a broader range of services across more markets. These resources may allow our competitors to respond more quickly to new technologies or changes in demand for investment solutions and services, devote greater resources to developing and promoting their services and make more attractive offers to potential clients and strategic partners, which could hurt our financial performance. Further, some of our competitors operate in a different regulatory environment than we do, which may give them certain competitive advantages in the services they offer.
We compete on a number of bases including the performance of our technology, the level of fees charged, the quality of our services, our reputation and position in the industry, our ability to adapt to technological developments or unforeseen market entrants and our ability to address the complex and changing needs of our clients. Our failure to successfully compete on the basis of any of these factors could result in a significant decline in market share, revenue and net income.
11
We derive nearly all of our revenue from the delivery of investment solutions and services to clients in the financial advisory industry and our revenue could suffer if that industry experiences a downturn.
We derive nearly all of our revenue from the delivery of investment solutions and services to clients in the financial advisory industry and we are therefore subject to the risks affecting that industry. A decline or lack of growth in demand for financial advisory services would adversely affect the financial advisers who work with us and, in turn, our results of operations, financial condition or business. For example, the availability of free or low-cost investment information and resources, including research and information relating to publicly traded companies and mutual funds available on the Internet or on company websites, could lead to lower demand by investors for the services provided by financial advisers. In addition, demand for our investment solutions and services among financial advisers could decline for many reasons. Consolidation or limited growth in the financial advisory industry could reduce the number of financial advisers and their potential clients. Events that adversely affect financial advisers’ businesses, rates of growth or the numbers of customers they serve, including decreased demand for their products and services, adverse conditions in the markets or adverse economic conditions generally, could decrease demand for our investment solutions and services and thereby decrease our revenue. Any of the foregoing could have a material adverse effect on our results of operations, financial condition or business.
Investors that pay us an asset-based fee may seek to negotiate a lower fee percentage, choose to use lower revenue products or cease using our services, which could limit the growth of our revenue or cause our revenue to decrease.
We derive a significant portion of our revenue from asset-based fees. Individual advisers or their clients may seek to negotiate a lower asset-based fee percentage. In particular, recent trends in the broker-dealer industry towards zero-commission trading may make self-directed brokerage services comparatively less expensive, and therefore more attractive to investors, than investment adviser services, which could prompt our investment adviser clients to attempt to renegotiate the fees they pay to us. In addition, clients may elect to use products that generate lower revenue, which may result in lower total fees being paid to us. For example, one of our broker-dealer clients recently decided to limit its advisers’ access to certain of our retail share class strategies, which may cause these advisers to shift to lower-revenue products offered on our platform. If other broker-dealer clients similarly limit access to certain of our strategies such that advisers shift to our lower-revenue products, we may be required to shift our service offering towards lower-revenue products, which would lead to a decline in asset-based revenue. In addition, we recently announced plans to transition certain third-party mutual fund strategies from retail to institutional share classes, which have lower operating expense ratios than our retail share class mutual fund offerings. This transition, which we expect to take effect in June 2020, will result in a lower overall cost of investment, and we expect that it will negatively impact our revenue and net income. Further, as competition among financial advisers increases, financial advisers may be required to lower the fees they charge to their end investors, which could cause them to seek lower fee options on our platform or to more aggressively negotiate the fees we charge. Any reduction in asset-based fees could persist beyond the near term given the recurring quarterly nature of our asset-based fee arrangements. Any of these factors could result in a fluctuation or decline in our asset-based revenue, which would have a material adverse effect on our results of operations, financial condition or business.
Investors may redeem or withdraw their investment assets generally at any time. Significant changes in investing patterns or large-scale withdrawal of investment funds could have a material adverse effect on our results of operations, financial condition or business.
The clients of our financial advisers are generally free to change financial advisers, forgo the advice and other services provided by financial advisers or withdraw the funds they have invested with financial advisers. These clients of financial advisers may elect to change their investment strategies, including by withdrawing all or a portion of their assets from their accounts to avoid securities markets-related risks. These actions by investors are outside of our control and could materially adversely affect the market value of our platform assets, which could materially adversely affect the asset-based revenue we receive.
Changes in market and economic conditions could lower the value of assets on which we earn revenue and could decrease the demand for our investment solutions and services.
Asset-based revenue makes up a significant portion of our revenue, representing 90% and 93% of our total revenue for the years ended December 31, 2019 and 2018, respectively. In addition, given our fee-based model, we expect that asset-based revenue will continue to account for a significant percentage of our total revenue in the future. Spread-based revenue accounted for 8% and 6% of our total revenue for the years ended December 31, 2019 and 2018, respectively. Significant fluctuations in securities prices, as well as recent and potential decreases in interest rates, may materially affect the value of the assets managed by our clients and may cause a decrease in our spread-based revenue. In particular, our spread-based revenue is directly correlated with changes in interest rates; for example, to the extent that interest rates in the U.S. approach or fall to zero, our spread-based revenue will similarly decline to those levels. Changes in interest rates may also influence financial adviser and investor decisions regarding whether to invest in, or maintain an investment in, one or more of our investment solutions. If such fluctuations in securities prices or decreases in interest rates were to lead to decreased investment in the securities markets, our revenue and earnings derived from asset-based and spread-based revenue could be simultaneously materially adversely affected.
12
We provide our investment solutions and services to the financial services industry. The financial markets, and in turn the financial services industry, are affected by many factors, such as U.S. and foreign economic and geopolitical conditions and general trends in business and finance that are beyond our control, and could be adversely affected by changes in the equity or debt marketplaces, unanticipated changes in currency exchange rates, interest rates, inflation rates, the yield curve, financial crises, war, terrorism, natural disasters, pandemics and outbreaks of disease or similar public health concerns such as the recent coronavirus outbreak and other factors that are difficult to predict. In the event that the U.S. or international financial markets suffer a severe or prolonged downturn, investments may lose value and investors may choose to withdraw assets from financial advisers and use the assets to pay expenses or transfer them to investments that they perceived to be more secure, such as bank deposits and Treasury securities. Any prolonged downturn in financial markets, or increased levels of asset withdrawals could have a material adverse effect on our results of operations, financial condition or business.
We must continue to introduce new investment solutions and services, and enhancements thereon, to address our clients’ changing needs, market changes and technological developments, and a failure to do so could have a material adverse effect on our results of operations, financial condition or business.
The market for our investment solutions and services is characterized by shifting client demands, evolving market practices and, for many of our investment solutions and services, rapid technological change, including an increased use of and reliance on web and social network properties. Changing client demands (including increased reliance on technology), new market practices or new technologies can render existing investment solutions and services obsolete and unmarketable. As a result, our future success will continue to depend upon our ability to develop and enhance investment solutions and services that address the future needs of our target markets and respond to technological and market changes. We may not be able to accurately estimate the impact of new investment solutions and services on our business or how their benefits will be perceived by our clients. Further, we may not be successful in developing, introducing and marketing our new investment solutions or services or enhancements on a timely and cost effective basis, or at all, and our new investment solutions and services and enhancements may not adequately meet the requirements of the marketplace or achieve market acceptance. In addition, clients may delay purchases in anticipation of new investment solutions or services or enhancements. Any of these factors could materially adversely affect our results of operations, financial condition or business.
We could face liability or incur costs to remediate operational errors or to address possible customer dissatisfaction.
Operational risk generally refers to the risk of loss resulting from our operations, including, but not limited to, improper or unauthorized execution and processing of transactions, deficiencies in our operating systems, business disruptions and inadequacies or breaches in our internal control processes. We operate in diverse markets and are reliant on the ability of our employees and systems to process large volumes of transactions often within short time frames. In the event of a breakdown or improper operation of systems, human error or improper action by employees, we could suffer financial loss, regulatory sanctions or damage to our reputation. In addition, there may be circumstances when our customers are dissatisfied with our investment solutions and services, even in the absence of an operational error. In such circumstances, we may elect to make payments or otherwise incur increased costs or lower revenue to maintain customer relationships. In any of the forgoing circumstances, our results of operations, financial condition or business could be materially adversely affected.
We may make future acquisitions which may be difficult to integrate, divert management resources, result in unanticipated costs or dilute our stockholders.
We may choose to grow our business in part through acquisitions, which could pose a number of risks to our operations. We may not be able to complete acquisitions, or integrate the operations, products, technologies or personnel gained through any such acquisition, such as our recent acquisitions of Global Financial Private Capital and OBS Financial, without a material adverse effect on our results of operations, financial condition or business. Assimilating the acquired businesses may divert significant management attention and financial resources from our other operations and could disrupt our ongoing business. We may have difficulty integrating the acquired operations, products, technologies or personnel, and may incur substantial unanticipated integration costs. Financing an acquisition could result in dilution from issuing equity securities or a weaker balance sheet from using cash or incurring debt. Any debt securities that we issue or credit agreements into which we enter to finance an acquisition may contain covenants that would restrict our operations, impair our ability to pay dividends or limit our ability to take advantage of other strategic opportunities. Further, we may fail to realize the potential cost savings or other financial benefits of the acquisition. In addition, acquisitions, including our recent acquisitions of Global Financial Private Capital and OBS Financial, may result in the loss of key employees or customers, particularly those of the acquired operations. Acquisitions, including our recent acquisitions of Global Financial Private Capital and OBS Financial, could further adversely affect our existing business relationships with third parties and/or cause us to incur regulatory, legal or other liabilities from the acquired businesses, including claims for infringement of intellectual property rights, for which we may not be indemnified in full or at all.
13
We may be subject to liability for losses that result from a breach of our fiduciary duties.
Certain of our investment advisory services involve fiduciary obligations that require us to act in the best interests of our clients, and we may be sued and face liabilities, regulatory investigations or enforcement actions for actual or claimed breaches of our fiduciary duties. Because we provide investment advisory services with respect to substantial assets, we could face substantial liability to our clients if it is determined that we have breached our fiduciary duties. In certain circumstances, which generally depend on the types of investment solutions and services we are providing, we may enter into client agreements jointly with advisers and retain third-party investment money managers and strategists on behalf of clients. We are responsible for conducting due diligence on the investment solutions and strategies offered by such third parties with whom we partner, and a failure to adequately conduct due diligence could subject us to liability for misstatements or omissions contained in marketing and other materials describing the investment solutions and strategies offered by such third parties to our investor clients. As such, we may be included as a defendant in lawsuits against financial advisers, strategists and third-party investment money managers that involve claims of breaches of the duties of such persons, and we may face liabilities for the improper actions and/or omissions of such advisers and third-party investment money managers and strategists. In addition, we may face claims based on the results of our investment advisory services, even in the absence of a breach of our fiduciary duty. Such claims and liabilities could therefore have a material adverse effect on our results of operations, financial condition or business.
If our reputation is harmed, our results of operations, financial condition or business could be materially adversely affected.
Our reputation, which depends on earning and maintaining the trust and confidence of our clients, is critical to our business. Our reputation is vulnerable to many threats that can be difficult or impossible to control, and costly or impossible to remediate. Regulatory inquiries or investigations, lawsuits initiated by our clients, employee misconduct, perceptions of conflicts of interest and rumors, among other developments, could substantially damage our reputation, even if they are baseless or satisfactorily addressed. Potential, perceived and actual conflicts of interest are inherent in our business activities and could give rise to client dissatisfaction or litigation. In particular, we offer both proprietary and third-party mutual funds, portfolios of mutual funds and custodial services on our platform, and financial advisers or their clients could conclude that we favor our proprietary investment products or services over those of third parties. In addition, any perception that the quality of our investment solutions and services may not be the same or better than that of other providers can also damage our reputation. Any damage to our reputation could harm our ability to attract and retain clients, which could materially adversely affect our results of operations, financial condition or business.
If our investment solutions and services fail to perform properly due to undetected errors or similar problems, our results of operations, financial condition or business could be materially adversely affected.
Investment solutions and services we develop or maintain may contain undetected errors or defects despite testing. Such errors can exist at any point in the life cycle of our investment solutions or services, but are typically found after introduction of new investment solutions and services or enhancements to existing investment solutions or services. We continually introduce new investment solutions and services and new versions of existing solutions and services. Our third-party providers, including asset managers whose products our clients access through our platform, could fail to detect errors or defects in the offered products that our clients use. Despite internal testing and testing by current and prospective clients, our current and future investment solutions and services may contain serious defects or malfunctions. If we detect any errors before release, we might be required to delay the release of the investment solution or service for an extended period of time while we address the problem. We might not discover errors that affect our new or current investment solutions, services or enhancements until after they are deployed, and we may need to provide enhancements to correct such errors. Errors may occur that could have a material adverse effect on our results of operations, financial condition or business and could result in harm to our reputation, lost sales, delays in commercial release, third-party claims, contractual disputes, contract terminations or renegotiations or unexpected expenses and diversion of management and other resources to remedy errors. In addition, negative public perception and reputational damage caused by such claims would adversely affect our client relationships and our ability to enter into new contracts. Any of these problems could have a material adverse effect on our results of operations, financial condition or business.
Our failure to successfully execute the conversion of our clients’ assets from their existing technology platform to our platform in a timely and accurate manner could have a material adverse effect on our results of operations, financial condition or business.
When we begin working with a new client, or acquire new client assets through an acquisition or other transaction, we may be required to convert the new assets from the clients’ existing technology platform to our technology platform. These conversions sometimes present significant technological and operational challenges, can be time-consuming, may result in the loss of the target company’s clients and may divert management’s attention from other operational challenges. If we fail to successfully complete our conversions in a timely and accurate manner, we may be required to expend more time and resources than anticipated, which could erode the profitability of the client relationship. In addition, any such failure may harm our reputation and may cause financial advisers or their clients to move their assets off of our platform or make it less likely that prospective clients will commit to working with us. Any of these risks could materially adversely affect our results of operations, financial condition or business.
14
Our business relies heavily on computer equipment, electronic delivery systems and the Internet. Any failures, disruptions or other adverse impacts could result in reduced revenue and the loss of customers.
The success of our business depends upon our ability to deliver time-sensitive, up-to-date data and information. Our business relies heavily on computer equipment (including servers), electronic delivery systems and the Internet, but these technologies are vulnerable to disruptions, failures or slowdowns caused by fire, earthquake, power loss, telecommunications failure, terrorist attacks, wars, Internet failures, cyber-attacks and other events beyond our control. In addition to such vulnerabilities, there can be no assurance that the Internet’s infrastructure will continue to be able to support the demands placed on it by sustained growth in the number of users and amount of traffic and, to the extent that the Internet’s infrastructure is unable to support the demands placed on it, our business may be impacted. Similarly, the reduction in the growth of, or a decline in, broadband and Internet access poses a risk to us.
Furthermore, we rely on agreements with our suppliers, such as our current data hosting and service providers, to provide us with access to certain computer equipment, electronic delivery systems and the Internet. We are unable to predict whether a future contractual dispute may arise with one of our suppliers that could cause a disruption in service, or whether our agreements with our suppliers can be obtained or renewed on acceptable terms, or at all. An unanticipated disruption, failure or slowdown affecting our key technologies or facilities may have significant ramifications, such as data-loss, data corruption, damaged software codes or inaccurate processing of transactions. We maintain off-site back-up facilities for our electronic information and computer equipment, but these facilities could be subject to the same interruptions that may affect our primary facilities. Any significant disruptions, failures, slowdowns, data-loss or data corruption could have a material adverse effect on our results of operations, financial condition or business and result in the loss of customers.
If government regulation of the Internet changes, or if consumer attitudes towards the Internet change, we may need to change the manner in which we conduct our business or incur greater operating expenses.
We rely heavily on the Internet in conducting our business. The adoption, modification or interpretation of laws or regulations relating to the Internet could adversely affect the manner in which we conduct our business. Such laws and regulations may cover sales practices, taxes, user privacy, data protection, pricing, content, copyrights, distribution, electronic contracts, consumer protection, broadband residential Internet access and the characteristics and quality of services. Moreover, it is not clear how existing laws governing these matters apply to the Internet. If we are required to comply with new regulations or legislation or new interpretations of existing regulations or legislation, we may be required to incur additional expenses or alter our business model, either of which could have a material adverse effect on our results of operations, financial condition or business.
Inadequacy or disruption of our disaster recovery plans and procedures in the event of a catastrophe could adversely affect our business.
We have made a significant investment in our infrastructure, and our operations are dependent on our ability to protect the continuity of our infrastructure against damage from catastrophe or natural disaster, breach of security, cyber-attack, loss of power, telecommunications failure or other natural or man-made events. A catastrophic event could have a direct negative impact on us by adversely affecting financial advisers, our employees or facilities, or an indirect impact on us by adversely affecting the financial markets or the overall economy. While we have implemented business continuity and disaster recovery plans and maintain business interruption insurance, it is impossible to fully anticipate and protect against all potential catastrophes. If our business continuity and disaster recovery plans and procedures were disrupted, inadequate or unsuccessful in the event of a catastrophe, we could experience a material adverse interruption of our operations.
We serve financial advisers and their clients using third-party data centers and cloud services. While we have electronic access to the infrastructure and components of our platform that are hosted by third parties, we do not control the operation of these facilities. Consequently, we may be subject to service disruptions as well as failures to provide adequate support for reasons that are outside of our direct control. These data centers and cloud services are vulnerable to damage or interruption from a variety of sources, including earthquakes, floods, fires, power loss, system failures, cyber-attacks, physical or electronic break-ins, human error or interference (including by employees, former employees or contractors), and other catastrophic events, including regional or global health events such as the recent coronavirus outbreak. Our data centers may also be subject to local administrative actions, changes to legal or permitting requirements and litigation to stop, limit or delay operations. Despite precautions taken at these facilities, such as disaster recovery and business continuity arrangements, the occurrence of a natural disaster or an act of terrorism, a decision to close the facilities without adequate notice or other unanticipated problems at these facilities could result in interruptions or delays in our services, impede our ability to scale our operations or have other adverse impacts upon our business.
We are reliant on our relationships with certain broker-dealers and strategists, the loss of which could adversely affect our results of operations, financial condition or business.
We maintain relationships with certain broker-dealers who serve clients on our platform. The loss of these relationships likely would result in a loss of adviser and investor clients. Likewise, we engage strategists who offer certain investment products on our platform. The loss of certain strategists and their investment products could cause our investor clients to leave our platform to follow such strategists and investment products to our competitors or otherwise. Additionally, the engagement contracts governing our
15
relationships with these broker-dealers and strategists are terminable by either us or the broker-dealer or strategist, as applicable, upon short-notice with or without cause. Loss of our investor clients, whether due to termination of a significant number of engagement contracts or otherwise, may have a material adverse effect on our financial condition and result in harm to our business.
We are dependent on third-party service providers in our operations.
We utilize numerous third-party service providers in our operations, including for the development of new product offerings, the provision of custodial, strategy and other services and the maintenance of our proprietary systems. A failure by a third-party service provider could expose us to an inability to provide contractual services to our clients in a timely manner. Additionally, if a third-party service provider is unable to provide these services, we may incur significant costs to either internalize some of these services or find a suitable alternative. We serve as the investment adviser for several of the products offered through our investment management programs and utilize the services of investment sub-advisers to manage many of these assets. A failure in the performance of our due diligence processes and controls related to the supervision and oversight of these firms in detecting and addressing conflicts of interest, fraudulent activity, data breaches and cyber-attacks, noncompliance with relevant securities and other laws could cause us to suffer financial loss, regulatory sanctions or damage to our reputation.
We are dependent on third-party pricing services for the valuation of securities invested in our investment products.
The majority of the securities held by our investment products are valued using quoted prices from active markets gathered by external third-party pricing services. Securities for which market prices are not readily available are valued in accordance with procedures applicable to that investment product. These procedures may utilize unobservable inputs that are not gathered from any active markets and involve considerable judgment. If these valuations prove to be inaccurate, our revenue and earnings from platform assets could be adversely affected.
We rely on our key personnel and principals.
We depend on the efforts of our executive officers, other management team members, employees and principals. Our executive officers, in particular, play an important role in the stability and growth of our business, and our future success depends, in part, on our ability to continue to attract and retain highly skilled personnel. The loss of any key personnel could have a material adverse effect on our results of operations, financial condition or business.
Principal, employee or third-party provider misconduct could expose us to significant legal liability and reputational harm.
We are vulnerable to reputational harm because we and our investment adviser clients operate in an industry in which personal relationships, integrity and the confidence of clients are of critical importance. Our management team and employees, as well as the management teams and employees at our investment adviser clients or our third-party service providers, could engage in misconduct that adversely affects our business. For example, if a member of management or an employee were to engage in illegal or suspicious activities, we or our investment adviser clients could be subject to regulatory sanctions and we could suffer serious harm to our reputation (as a consequence of the negative perception resulting from such activities), our financial position or financial advisers’ client relationships and ability to attract new clients. In addition, certain of our third-party providers may engage in illegal activities, which could result in disruptions to our platform or solutions, subject us to liability, fines, penalties, regulatory orders or reputational harm or require us to be involved in regulatory investigations. Further, our business and that of our financial adviser clients often require that we deal with confidential information, personal information and other sensitive data. If principals, employees or third-party providers were to improperly use or disclose this information, even if inadvertently, we or our financial adviser clients could be subject to legal or regulatory investigations or action and suffer serious harm to our reputation, financial position and current and future business relationships or those of our financial adviser clients. It is not always possible to deter misconduct, and the precautions we take to detect and prevent this activity may not always be effective. Misconduct by management, employees or third-party providers, or even unsubstantiated allegations of misconduct, could result in an adverse effect on our reputation and our business.
We could face liability related to our storage of personal information about our users.
We store extensive amounts of personal investment and financial information for consumers, including portfolio holdings, on our systems. We could be subject to liability if we were to inappropriately disclose any personal information or if third parties were able to penetrate our network security or otherwise access or misappropriate any personally identifiable information or portfolio holdings. Any such disclosure, security incident or breach could subject us to regulatory investigations and enforcement actions, the imposition of fines or other significant penalties and significant remediation costs, as well as claims for financial loss, impersonation or other similar fraud claims, claims under data protection laws, claims for other misuses of personal information, such as unauthorized marketing or unauthorized access to personal portfolio information, or indemnity claims by our clients for fines, penalties or other assessments arising from third-party claims. Further, any real or perceived defects, errors or vulnerabilities in our security systems could harm our reputation or otherwise adversely impact our business, financial position and results of operations.
16
We could face liability for certain information we provide, including information based on data we obtain from other parties.
We may be subject to claims for securities law violations, negligence, breach of fiduciary duties or other claims relating to the information we provide. For example, individuals may take legal action against us if they rely on information we have provided and it contains an error. In addition, we could be subject to claims based upon the content that is accessible from our website through links to other websites. Moreover, we could face liability based on inaccurate information provided to us by others. Defending any such claims could be expensive and time-consuming, and any such claim could materially adversely affect our results of operations, financial condition or business.
We are exposed to data and cyber-security risks that could result in data breaches, service interruptions, harm to our reputation, protracted and costly litigation or significant liability.
In connection with the products and services that we provide, we collect, use, store, transmit and otherwise process certain confidential, proprietary and sensitive information, including the personal information of end-users, third-party service providers and employees. We rely on the efficient, uninterrupted and secure operation of complex information technology systems and networks to operate our business and securely store, transmit and otherwise process such information. In the normal course of business, we also share information with our service providers and other third parties. A failure to safeguard the integrity, confidentiality, availability and authenticity of personal information, client data and our proprietary data from cyber-attacks, unauthorized access, fraudulent activity (e.g., check “kiting” or fraud, wire fraud or other dishonest acts), data breaches and other security incidents that we, our third-party service providers or our clients may experience may lead to modification, destruction, loss of availability or theft of critical and sensitive data pertaining to us, our clients or other third parties. We have established a strategy designed to protect against threats and vulnerabilities containing preventive and detective controls including, but not limited to, firewalls, intrusion detection systems, computer forensics, vulnerability scanning, server hardening, penetration testing, anti-virus software, data leak prevention, encryption and centralized event correlation monitoring. Such protective measures, as well as additional measures that may be required to comply with rapidly evolving data privacy and security standards and protocols imposed by law, regulation, industry standards or contractual obligations, have and will continue to create uncertainty and cause us to incur substantial expenses. Failure to timely upgrade or maintain computer systems, software and networks as necessary could also make us or our third-party service providers susceptible to breaches and unauthorized access and misuse. We may be required to expend significant additional resources to modify, investigate or remediate vulnerabilities or other exposures arising from data and cyber-security risks.
Improper access to our or our third-party service providers’ systems or databases could result in the theft, publication, deletion or modification of confidential, proprietary or sensitive information, including personal information. An actual or perceived breach of our security systems or those of our third-party service providers may require notification under applicable data privacy regulations or contractual obligations. The accidental or unauthorized access to or disclosure, loss, destruction, disablement, corruption or encryption of, use or misuse of or modification of our, our clients’ or other third parties’ confidential, proprietary or sensitive information, including personal information, by us or our third-party service providers could result in significant fines, penalties, orders, sanctions and proceedings or actions against us by governmental bodies and other regulatory authorities, customers or third parties, which could materially and adversely affect our business, financial condition and results of operations. Any such proceeding or action, and any related indemnification obligations, could damage our reputation, force us to incur significant expenses in defense of such proceeding or action, distract our management, increase our costs of doing business or result in the imposition of financial liability.
Despite our efforts to ensure the integrity, confidentiality, availability, and authenticity of our proprietary systems and information, it is possible that we may not be able to anticipate or to implement effective preventive measures against all cyber threats. No security solution, strategy, or measures can address all possible security threats or block all methods of penetrating a network or otherwise perpetrating a security incident. The risk of unauthorized circumvention of our security measures or those of our third-party providers, clients and partners has been heightened by advances in computer and software capabilities and the increasing sophistication of hackers, including those operating on behalf of nation-state actors, who employ complex techniques involving the theft or misuse of personal and financial information, counterfeiting, “phishing” or social engineering incidents, account takeover attacks, denial or degradation of service attacks, malware, fraudulent payment and identity theft. Because the techniques used by hackers change frequently and are increasingly complex and sophisticated, and new technologies may not be identified until they are launched against a target, we and our third-party service providers may be unable to anticipate these techniques or detect an incident, assess its severity or impact, react or appropriately respond in a timely manner or implement adequate preventative measures. Our systems are also subject to compromise from internal threats, such as theft, misuse, unauthorized access or other improper actions by employees, service provides and other third parties with otherwise legitimate access to our systems or databases. The latency of a compromise is often measured in months, but could be years, and we may not be able to detect a compromise in a timely manner.
Due to applicable laws and regulations or contractual obligations, we may also be held responsible for any failure or cybersecurity breaches attributed to our third-party service providers as they relate to the information we share with them. Although we generally have agreements relating to data privacy and security in place with our third-party service providers, they are limited in nature and we cannot guarantee that such agreements will prevent the accidental or unauthorized access to or disclosure, loss,
17
destruction, disablement, corruption or encryption of, use or misuse of or modification of confidential, proprietary or sensitive information, including personal information, or enable us to obtain reimbursement from third-party service providers in the event we should suffer incidents resulting in accidental or unauthorized access to or disclosure, loss, destruction, disablement or encryption of, use or misuse of or modification of confidential, proprietary or sensitive information, including personal information. In addition, because we do not control our third-party service providers and our ability to monitor their data security is limited, we cannot ensure the security measures they take will be sufficient to protect confidential, proprietary or sensitive information (including personal information).
Regardless of whether a security incident or act of fraud involving our solutions is attributable to us or our third-party service providers, such an incident could, among other things, result in improper disclosure of information, harm our reputation and brand, reduce the demand for our products and services, lead to loss of client business or confidence in the effectiveness of our security measures, disrupt normal business operations or result in our systems or products and services being unavailable. In addition, such incidents may require us to spend material resources to investigate or correct the incident and to prevent future security incidents, expose us to uninsured liability, increase our risk of regulatory scrutiny, expose us to protracted and costly litigation, trigger indemnity obligations, result in damages for contract breach, divert the attention of management from the operation of our business and otherwise cause us to incur significant costs or liabilities, any of which could affect our financial condition, results of operations and reputation. Moreover, there could be public announcements regarding any such incidents and any steps we take to respond to or remediate such incidents, and if securities analysts or investors perceive these announcements to be negative, it could, among other things, have a substantial adverse effect on the price of our common stock. In addition, our remediation efforts may not be successful. Further, any adverse findings in security audits or examinations could result in reputational damage to us, which could reduce the use and acceptance of our solutions, cause our customers to cease doing business with us or have a significant adverse impact on our revenue and future growth prospects. Furthermore, even if not directed at us specifically, attacks on other financial institutions could disrupt the overall functioning of the financial system or lead to additional regulation and oversight by federal and state agencies, which could impose new and costly compliance obligations.
If we are not able to satisfy data protection, security, privacy and other government- and industry-specific requirements or regulations, our results of operations, financial condition or business could be harmed.
Personal privacy, data protection, information security and other regulations are significant issues in the United States. We are subject to a variety of laws and regulations that apply to our collection, use, retention, protection, disclosure, transfer and other processing of personal information, and our handling of personal data is regulated by the U.S. federal government and various state and local governments and regulatory agencies. In addition to such laws and regulations, we may also be subject to self-regulatory standards or other rules pertaining to information security and data protection proposed by privacy advocates, industry groups, other self-regulatory bodies or other information security or data protection-related organizations. These and other industry standards may legally or contractually apply to us, or we may elect to comply with such standards. Further, our contractual arrangements may also impose additional, or more stringent, obligations upon us relating to our collection, use, retention, protection, disclosure, transfer and other processing of personal, financial and other data.
The data protection landscape is rapidly evolving, and we expect that there will continue to be new proposed laws, regulations and industry standards, and changes to and in the interpretation of existing laws, regulations and standards, concerning privacy, data protection, information security and telecommunications services. Interpretation and implementation standards and enforcement practices are likely to remain uncertain for the foreseeable future, and we cannot yet determine the impact such future laws, regulations and standards, or changes to and in the interpretation of existing laws, regulations and standards, may have on our business, but they may result in greater public scrutiny and escalated levels of enforcement and sanctions, increased compliance costs, increased liabilities, restrictions on our operations or other adverse impacts upon our business. For example, evolving and changing definitions of personal information and personal data, especially related to the classification of IP addresses, machine identification, location data and other information, may limit or inhibit our ability to operate or expand our business, including limiting the sharing of data.
Recently, the most rapid development in U.S. data privacy and security law has been at the state level. For example, on June 28, 2018, California enacted the California Consumer Privacy Act (the “CCPA”), which took effect on January 1, 2020. The CCPA increases privacy rights for California residents and imposes obligations on companies that process their personal information, including an obligation to provide certain new disclosures to such residents. Specifically, among other things, the CCPA creates new consumer rights, and imposes corresponding obligations on covered businesses, relating to the access to, deletion of and sharing of personal information collected by covered businesses, including California residents’ right to access and delete their personal information, opt out of certain sharing and sales of their personal information and receive detailed information about how their personal information is used. The CCPA provides for civil penalties for violations, as well as a private right of action for certain data breaches that result in the loss of personal information. This private right of action is expected to increase the likelihood of, and risks associated with, data breach litigation. The CCPA was amended in September 2018 and November 2019, and further amendments may be enacted. It remains unclear how various provisions of the CCPA will be interpreted and enforced, and multiple states have enacted or expected to enact similar laws. Some observers have noted that the CCPA could mark the beginning of a trend toward more stringent privacy legislation in the U.S., which could increase our potential liability and adversely affect our business. The CCPA and other similar state laws may require us to modify our data processing practices and policies and may increase our compliance costs and potential liability. There is also discussion in Congress of a new comprehensive federal data protection and privacy law to which we likely would be subject if it is enacted.
18
Many statutory requirements include obligations for companies to notify individuals of security breaches involving certain personal information, which could result from breaches experienced by us or our third-party service providers. For example, laws in all 50 U.S. states require businesses to provide notice to customers whose personal information has been disclosed as a result of a data breach. These laws are not consistent, and compliance in the event of a widespread data breach is difficult and may be costly. Moreover, states have been frequently amending existing laws, requiring attention to changing regulatory requirements. In addition, we may be contractually required to notify clients, end-investors or other counterparties of a security breach. Although we may have contractual protections with our third-party service providers, any security breach, or actual or perceived non-compliance with privacy or security laws, regulations, standards, policies or contractual obligations, could harm our reputation and brand, expose us to potential liability and require us to expend significant resources on data security and in responding to any such incident or actual or perceived non-compliance. Any contractual protections we may have from our third-party service providers may not be sufficient to adequately protect us from any such liabilities and losses, and we may be unable to enforce any such contractual protections.
We make public statements about our use and disclosure of personal information through our privacy policy, information provided on our website and press statements. Although we endeavor to comply with our public statements and documentation, we may at times fail to do so or be alleged to have failed to do so. The publication of our privacy policy and other statements that provide promises and assurances about data privacy and security can subject us to potential government or legal action if they are found to be deceptive, unfair or misrepresentative of our actual practices. In addition, from time to time, concerns may be expressed about whether our products and services compromise the privacy of clients and others. Even the perception, whether or not valid, of privacy concerns or any failure by us to comply with our posted privacy policies or with any legal or regulatory requirements, standards, certifications or orders or other privacy or consumer protection-related laws and regulations applicable to us may harm our reputation, inhibit adoption of our products by current and future customers or adversely impact our ability to attract and retain workforce talent.
Given the complexity of operationalizing data privacy and security laws and regulations to which we are subject, the maturity level of proposed compliance frameworks and the relative lack of guidance in the interpretation of the numerous requirements of the data privacy and security laws and regulations to which we are subject, we may not be able to respond quickly or effectively to regulatory, legislative and other developments, and these changes may in turn impair our ability to offer our existing or planned products and services or increase our cost of doing business. Although we work to comply with applicable laws and regulations, industry standards, contractual obligations and other legal obligations, such laws, regulations, standards and obligations are evolving and may be modified, interpreted and applied in an inconsistent manner from one jurisdiction to another, and may conflict with one another. In addition, they may conflict with other requirements or legal obligations that apply to our business or the features and services that our adviser clients and their investor clients expect from our products and services. As such, we cannot assure ongoing compliance with all such laws, regulations, standards and obligations. Any failure, or perceived failure, by us to adequately address privacy and security concerns, even if unfounded, or to comply with applicable laws, regulations and standards, or with employee, client and other data privacy and data security requirements pursuant to contract and our stated privacy notice(s), could result in investigations or proceedings against us by data protection authorities, governmental entities or others, including class action privacy litigation in certain jurisdictions, which could subject us to fines, civil or criminal liability, public censure, claims for damages by customers and other affected individuals, damage to our reputation and loss of goodwill (in relation to both existing and prospective clients), or we could be required to fundamentally change our business activities and practices, which may not be possible in a commercially reasonable manner, or at all. Any or all of these consequences could have a material adverse effect on our operations, financial performance and business.
If third parties infringe upon our intellectual property or if we were to infringe upon the intellectual property of third parties, we may expend significant resources enforcing or defending our rights or suffer competitive injury.
Our success depends in part on our proprietary technology. We rely on a combination of copyright, trademark and trade secret laws, confidentiality, nondisclosure, non-interference and invention assignment agreements and other contractual and technical security measures to establish and protect our intellectual property and proprietary rights. If we fail to successfully obtain, maintain, enforce, monitor, police or defend our intellectual property rights, or if we were to infringe on the intellectual property rights of others, our competitive position, operations, financial condition or business could suffer.
We license certain trademark and web domain rights from third parties and may be subject to claims of infringement if such parties do not possess the necessary intellectual property rights. In addition, we may face additional risk of infringement or misappropriation claims if we hire an employee who possesses third-party proprietary information who decides to use such information in connection with our investment solutions, services or business processes without such third party’s authorization. Furthermore, third parties may in the future assert intellectual property infringement claims against our customers, which, in certain circumstances, we have agreed to indemnify.
19
In some instances, litigation may be necessary to enforce our intellectual property rights and protect our proprietary information, or to defend against claims by third parties that we have infringed their intellectual property rights. Any litigation or claims brought by or against us, whether with or without merit, could result in substantial costs to us and divert the attention of our management, which could harm our results of operations, financial condition or business. In addition, any intellectual property litigation or claims against us could result in the loss or compromise of our intellectual property and proprietary rights, subject us to significant liabilities or require us to seek licenses on unfavorable terms or make changes to the investment services and solutions we offer, any of which could harm our results of operations, financial condition or business.
Confidentiality agreements with employees, consultants and others may not adequately prevent disclosure of trade secrets and other proprietary information.
We have devoted substantial resources to the development of our proprietary technologies, investment solutions and services. To protect our proprietary rights, we enter into confidentiality, nondisclosure, non-interference and invention assignment agreements with our employees, consultants and independent contractors. However, we cannot guarantee that we have entered into such agreements with each party that has or may have had access to our trade secrets and proprietary know-how. Further, these agreements may not effectively prevent unauthorized disclosure of confidential information or unauthorized parties from copying aspects of our technologies, investment solutions or products or obtaining and using information that we regard as proprietary. Moreover, these agreements may not provide an adequate remedy in the event of such unauthorized disclosures of confidential information and we cannot assure you that our rights under such agreements will be enforceable. In addition, others may independently discover trade secrets and proprietary information, and in such cases we could not assert any trade secret rights against such parties. Costly and time-consuming litigation could be necessary to enforce and determine the scope of our proprietary rights, and failure to obtain or maintain trade secret protection could reduce any competitive advantage we have developed and cause us to lose customers or otherwise harm our business.
The use of “open source code” in investment solutions may expose us to additional risks and harm our intellectual property rights.
We rely on code and software licensed under so-called “open source licenses” to some extent to develop our investment solutions and support our internal systems and infrastructure. While we monitor our use of open source code to attempt to avoid subjecting our investment solutions to conditions we do not intend, such use could occur. Many of the risks associated with the usage of open source software cannot be eliminated, and could, if not properly addressed, negatively impact our business. In the event that portions of our proprietary software are determined to be subject to an open source license that requires that we make available source code for modifications or derivative works we create based upon the open source software, we could be required to publicly release the affected portions of our source code, re-engineer all or a portion of our technologies or otherwise be limited in the licensing of our technologies, any of which could reduce or eliminate the value of our technologies and solutions. Additionally, if a third-party software provider has incorporated certain types of open source code into software we license from such third party for our investment solutions, we could, under certain circumstances, be required to disclose the source code for our investment solutions. This could harm our intellectual property position and have a material adverse effect on our results of operations, financial condition or business.
We may become subject to liability based on the use of our investment solutions and services by our clients.
Our investment solutions and services support the investment processes of our clients, which, in the aggregate, manage billions of dollars of assets. Our client agreements have provisions designed to limit our exposure to potential liability claims brought by our adviser clients, their clients or other third parties based on the use of our investment solutions and services. However, these provisions have certain exceptions and could be invalidated by unfavorable judicial decisions or by federal, state, foreign or local laws. Use of our products as part of the investment process creates the risk that clients, or the parties whose assets are managed by our clients, may pursue claims against us for significant dollar amounts. Any such claim, even if the outcome were to be ultimately favorable to us, would involve a significant commitment of our management, personnel, financial and other resources and could have a negative impact on our reputation. Such claims and lawsuits could therefore have a material adverse effect on our results of operations, financial condition or business.
Furthermore, our clients may use our investment solutions and services together with software, data or products from other companies. As a result, when problems occur, it might be difficult to identify the source of the problem. Even when our investment solutions and services do not cause these problems, the existence of these errors might cause us to incur significant costs and divert the attention of our management and technical personnel, any of which could materially adversely affect our results of operations, financial condition or business.
Lack of liquidity or access to capital could impair our business and financial condition.
We expend significant resources investing in our business, particularly with respect to our technology and service platforms. In addition, we must maintain certain levels of required capital. As a result, reduced levels of liquidity could have a significant negative effect on us. Some potential conditions that could negatively affect our liquidity include diminished access to debt or capital markets, unforeseen or increased cash or capital requirements, adverse legal settlements or judgments or illiquid or volatile markets.
20
The capital and credit markets continue to experience varying degrees of volatility and disruption. In some cases, the markets have exerted downward pressure on availability of liquidity and credit capacity for businesses similar to ours. Such market conditions may limit our ability to satisfy statutory capital requirements, generate fee and other market-related revenue to meet liquidity needs and access the capital necessary to grow our business. As such, we may be forced to delay raising capital, issue different types of capital than we would otherwise, less effectively deploy such capital or bear an unattractive cost of capital, which could decrease our profitability and significantly reduce our financial flexibility.
In the event that our current resources are insufficient to satisfy our needs, we may need to rely on financing sources such as bank debt. The availability of additional financing will depend on a variety of factors such as market conditions, the general availability of credit, the volume of trading activities, the overall availability of credit to the financial services industry, our credit ratings and credit capacity and the possibility that our stockholders, advisers or lenders could develop a negative perception of our long- or short-term financial prospects if the level of our business activity decreases due to a market downturn. Similarly, our access to funds may be impaired if regulatory authorities or rating organizations take negative actions against us.
We may not be able to generate sufficient cash to service our indebtedness and may be forced to take other actions to satisfy our obligations under our Credit Facility, which may not be successful.
As of December 31, 2019, we had total indebtedness of $123.7 million. Our ability to make scheduled payments on or to refinance our indebtedness depends on our financial condition and operating performance, which are subject to prevailing economic and competitive conditions and certain financial, business and other factors beyond our control. We may not be able to maintain a level of cash flow from operating activities sufficient to permit us to pay the principal and interest on our indebtedness. If our cash flows and capital resources are insufficient to fund our debt service obligations, we may be forced to reduce or delay acquisitions and capital expenditures, sell assets, seek additional capital or restructure or refinance our indebtedness. Our ability to restructure or refinance indebtedness will depend on the condition of the capital markets and our financial condition at such time. Any refinancing of indebtedness could be at higher interest rates and may require us to comply with more onerous covenants, which could further restrict our business operations. The terms of existing or future debt instruments may restrict us from adopting some of these alternatives. In addition, any failure to make payments of interest and principal on our outstanding indebtedness on a timely basis could harm our ability to incur additional indebtedness. In the absence of sufficient cash flows and capital resources, we could face substantial liquidity problems and might be required to dispose of material assets or operations to meet our debt service and other obligations. Our Credit Facility (as defined in the section titled “Management’s Discussion and Analysis of Financial Condition and Results of Operations—Liquidity and Capital Resources”) currently restricts our ability to dispose of assets and our use of the proceeds from such disposition. We may not be able to consummate those dispositions, and the proceeds of any such disposition may not be adequate to meet any debt service obligations then due. Any of these circumstances could adversely affect our results of operations, financial condition or business.
Restrictions in our existing and future debt agreements could limit our growth and our ability to engage in certain activities.
Our Credit Facility contains a number of covenants that impose operating and financial restrictions on us, including restrictions on our ability to incur additional indebtedness, create liens, make acquisitions, dispose of assets and make restricted payments, among others. In addition, our Credit Facility may require us to maintain certain financial ratios. These restrictions may also limit our ability to obtain future financings, to withstand a future downturn in our business or the economy in general, or to otherwise conduct necessary corporate activities. We may also be prevented from taking advantage of acquisitions or other business opportunities that arise because of the limitations that the restrictive covenants under our Credit Facility impose on us. A breach of any covenant in our Credit Facility would result in a default under the applicable agreement after any applicable grace periods. A default, if not waived, could result in acceleration of the indebtedness outstanding under the Credit Facility and our inability to borrow under the Revolver (as defined in the section titled “Management’s Discussion and Analysis of Financial Condition and Results of Operations—Liquidity and Capital Resources”). The accelerated indebtedness would become immediately due and payable. If that occurs, we may not be able to make all of the required payments or borrow on short notice sufficient funds to refinance such indebtedness. Even if new financing were available at that time, it may not be on terms that are acceptable to us.
Our insurance coverage may be inadequate or expensive.
We maintain voluntary and required insurance coverage, including, among others, general liability, property, director and officer, errors and omissions, network cyber-security and privacy, employee practices liability, fidelity bond and fiduciary liability insurance and insurance required under the Employee Retirement Income Security Act of 1974, as amended (“ERISA”). Recently in the insurance industry, premiums and deductible costs associated with certain insurance coverage have increased, and the number of insurers has decreased. If such trends continue, our insurance costs may increase, which may affect our financial condition. Further, while we endeavor to purchase coverage that is appropriate to our assessment of our risk, we are unable to predict with certainty the frequency, nature or magnitude of claims for direct or consequential damages. Our business may be negatively affected if in the future
21
our insurance proves to be inadequate or unavailable. In addition, insurance claims may harm our reputation or divert management resources away from operating our business.
We are a holding company and rely on dividends, distributions and other payments, advances and transfers of funds from our subsidiaries to meet our debt service and other obligations.
We have no direct operations and derive all of our cash flow from our subsidiaries. Because we conduct our operations through our subsidiaries, we depend on those entities for dividends and other payments or distributions to meet any existing or future debt service and other obligations. The deterioration of the earnings from, or other available assets of, our subsidiaries for any reason could limit or impair their ability to pay dividends or other distributions to us. In addition, SEC and FINRA regulations may under certain circumstances restrict the payment of dividends by a registered broker-dealer. Compliance with this regulation may impede our ability to receive dividends from AssetMark Brokerage, LLC.
Our controls and procedures may fail or be circumvented, our risk management policies and procedures may be inadequate and operational risks could adversely affect our reputation and financial condition.
We have adopted policies and procedures to identify, monitor and manage our operational risk. These policies and procedures, however, may not be fully effective. Some of our risk evaluation methods depend upon information provided by others and public information regarding markets, clients or other matters that are otherwise accessible by us. If our policies and procedures are not fully effective or we are not successful in capturing all risks to which we are or may be exposed, we may suffer harm to our reputation or be subject to litigation or regulatory actions that could have a material adverse effect on our business, results of operations or financial condition.
Risks Related to Our Controlling Stockholder’s Ultimate Parent Being a PRC Company with Stock Listed in Hong Kong and Shanghai.
Our controlling stockholder is subject to supervision by regulatory authorities in the PRC and must comply with certain PRC laws and regulations that may influence our controlling stockholder’s decisions relating to our business.
As a Delaware corporation with revenue and operations exclusively within the United States, we are not subject to regulation by foreign authorities. However, because our controlling stockholder is an enterprise incorporated under the laws of the People’s Republic of China (“PRC”), our controlling stockholder is subject to and must comply with PRC laws and regulations promulgated by PRC governmental authorities. Such regulations may influence the decisions of our controlling stockholder, as well as those of its director appointees serving on our board of directors, regarding our business and operations. Certain of these regulations require our controlling stockholder to approve specific corporate actions taken by us, including any amendment to our certificate of incorporation; certain mergers, acquisitions, asset sales and divestments that we may seek to undertake; and certain related-party transactions in which we are involved. In addition, certain PRC regulations require our controlling stockholder to file with or obtain approval from various PRC regulators before approving certain of our corporate actions, including:
|
|
• |
obtaining approval from or filing with the China National Development and Reform Commission (the “NDRC”), for certain debt issuances by us, or certain investments we seek to make involving a sensitive industry, country or region, as defined by the NDRC; and |
|
|
• |
filing with the China Securities Regulatory Commission (the “CSRC”), and registering with the State Administration of Foreign Exchange, to provide us with financing or to guarantee our obligations. |
In addition, PRC regulations require our controlling stockholder to ensure that our business focuses on securities, futures, asset management, broker-dealer services, financial information services, financial information technology system services, back-office support services for specific financial businesses or products or other financial-related businesses. A failure by our controlling stockholder to comply with these or other existing or future PRC laws or regulations could result in the imposition of administrative or financial sanctions against our controlling stockholder by PRC authorities. These laws and regulations could cause our controlling stockholder and its director appointees serving on our board of directors to act in a manner that may not be perceived to be in the best interests of our other stockholders. Likewise, any failure by our controlling stockholder to obtain certain approvals, make requisite filings or otherwise comply with PRC laws and regulations could materially limit our ability to raise debt financing or make certain investments, any of which could have a material adverse effect on our financial condition or business.
Our controlling stockholder is required by the stock exchanges on which its shares are listed to disclose and obtain approval from its board of directors or shareholders for certain corporate actions that we undertake.
HTSC is listed on The Shanghai Stock Exchange and The Stock Exchange of Hong Kong Limited, and is therefore subject to the Rules Governing the Listing of Stocks on The Shanghai Stock Exchange (the “SSE Listing Rules”), and the Rules Governing the Listing of Securities on The Stock Exchange of Hong Kong Limited (the “HKEx Listing Rules”). Under the SSE Listing Rules and the HKEx Listing Rules, HTSC must obtain approval from its board of directors and/or shareholders for certain major transactions in which we, as a subsidiary of HTSC, engage, including the purchase or sale of assets, mergers and acquisitions, lending, leasing of assets, donation or acceptance of assets, debt restructuring, license agreements, research and development joint ventures, and related-
22
party transactions, the value of which exceeds certain financial thresholds established by the applicable listing rules. In addition, the HKEx Listing Rules require our controlling stockholder to obtain shareholder approval for (i) any issuance of shares by us that results in a reduction of HTSC’s equity interest in us in excess of a specified dilution threshold, (ii) the implementation of a share option scheme involving the issuance of new shares by us and (iii) any issuance of debt by us outside the ordinary course of our business.
There can be no assurance that HTSC will obtain the requisite approvals if we desired to enter into any of the above transactions, and a failure to do so would restrict our ability to engage in such transactions. Furthermore, PRC regulators including the CSRC, The Shanghai Stock Exchange or The Stock Exchange of Hong Kong Limited could impose additional restrictions or approval requirements that could impact our ability to undertake certain corporate actions. We cannot guarantee that our controlling stockholder will be able to successfully or timely obtain any of the approvals needed to permit us to undertake any of the corporate actions described above, and the failure to do so may have a material adverse effect on our results of operations, financial condition or business.
The Committee on Foreign Investment in the United States (“CFIUS”) may modify, delay or prevent our future acquisition or investment activities.
For so long as HTSC retains a material ownership interest in us, we will be deemed a “foreign person” under the regulations relating to CFIUS. As such, acquisitions of or investments in U.S. businesses or foreign businesses with U.S. subsidiaries that we may wish to pursue may be subject to CFIUS review, the scope of which was recently expanded by the Foreign Investment Risk Review Modernization Act of 2018 (“FIRRMA”), to include certain non-passive, non-controlling investments (including certain investments in entities that hold or process personal information about U.S. nationals), certain acquisitions of real estate even with no underlying U.S. business, transactions the structure of which is designed or intended to evade or circumvent CFIUS jurisdiction and any transaction resulting in a “change in the rights” of a foreign person in a U.S. business if that change could result in either control of the business or a covered non-controlling investment. FIRRMA also subjects certain categories of investments to mandatory filings. If a particular proposed acquisition or investment in a U.S. business falls within CFIUS’s jurisdiction, we may determine that we are required to make a mandatory filing or that we will submit to CFIUS review on a voluntary basis, or to proceed with the transaction without submitting to CFIUS and risk CFIUS intervention, before or after closing the transaction. CFIUS may decide to block or delay an acquisition or investment by us, impose conditions with respect to such acquisition or investment or order us to divest all or a portion of a U.S. business that we acquired without first obtaining CFIUS approval, which may limit the attractiveness of or prevent us from pursuing certain acquisitions or investments that we believe would otherwise be beneficial to us and our stockholders. In addition, among other things, FIRRMA authorizes CFIUS to prescribe regulations defining “foreign person” differently in different contexts, which could result in less favorable treatment for investments and acquisitions by companies from countries of “special concern.” If such future regulations or other actions by the U.S. government impose additional burdens on acquisition and investment activities involving PRC and PRC-controlled entities, our ability to consummate transactions that might otherwise be beneficial to us and our stockholders may be hindered.
Risks Related to Regulation and Litigation
We are subject to extensive government regulation in the United States, and our failure or inability to comply with these regulations or regulatory action against us could adversely affect our results of operations, financial condition or business.
The financial services industry is among the most extensively regulated industries in the United States. We operate investment advisory, broker-dealer, mutual fund and custodial businesses, each of which is subject to a specific and extensive regulatory scheme. In addition, we are subject to numerous state and Federal laws and regulations of general application. It is very difficult to predict the future impact of the legislative and regulatory requirements affecting our business and our clients’ businesses.
Certain of our subsidiaries are registered as “investment advisers” with the SEC under the Investment Advisers Act of 1940 (as amended, the “Advisers Act”) and are regulated thereunder. In addition, many of our investment advisory services are conducted pursuant to the nonexclusive safe harbor from the definition of an “investment company” provided under Rule 3a-4 under the Investment Company Act of 1940 (as amended, the “1940 Act”). If Rule 3a-4 were to cease to be available, or if the SEC were to modify the rule or its interpretation of how the rule is applied, our business could be adversely affected. Certain of our registered investment adviser subsidiaries provide advice to mutual fund clients. Mutual funds are registered as “investment companies” under the 1940 Act. The Advisers Act and the 1940 Act, together with related regulations and interpretations of the SEC, impose numerous obligations and restrictions on investment advisers and mutual funds, including requirements relating to the safekeeping of client funds and securities, limitations on advertising, disclosure and reporting obligations, prohibitions on fraudulent activities, restrictions on transactions between an adviser and its clients, and between a mutual fund and its advisers and affiliates, and other detailed operating requirements, as well as general fiduciary obligations.
Our subsidiary AssetMark, Inc. is a commodity pool operator registered with the Commodity Futures Trading Commission (“CFTC”), and is a member of the National Futures Association (the “NFA”). As such, it is subject to regulatory requirements under
23
the Commodity Exchange Act (the “CEA”), CFTC regulations and NFA by-laws and rules. These include disclosure and reporting requirements, restrictions on advertising, registration and licensing of certain personnel and conduct and anti-fraud requirements, among others.
In addition, AssetMark Brokerage, LLC, our limited purpose broker-dealer subsidiary, is subject to regulatory restrictions and requirements imposed by applicable statutes, regulations and policies in the jurisdictions in which we operate. U.S. government agencies and self-regulatory organizations, including U.S. state securities commissions, are empowered to enforce the regulatory restrictions and requirements applicable to us and conduct administrative proceedings that can result in censure, fine, the issuance of cease-and-desist orders or the suspension or expulsion of a broker-dealer from registration or membership. AssetMark Brokerage, LLC is registered with the SEC and with all 53 U.S. states and jurisdictions as a limited purpose broker-dealer providing mutual fund distribution and underwriting, and is a member of FINRA, a securities industry self-regulatory organization that supervises and regulates the conduct and activities of its members. As a registered broker-dealer, AssetMark Brokerage, LLC is subject to periodic examinations and investigations by FINRA. Further, broker-dealers are subject to regulations which cover all applicable aspects of their business, which may include sales practices, anti-money laundering, handling of material non-public information, safeguarding data, recordkeeping, reporting and the conduct and qualifications of directors, officers, employees, representatives and other associated persons.
Further, AssetMark Brokerage, LLC, along with our mutual fund businesses, are subject to the Bank Secrecy Act (the “BSA”), as amended by the USA PATRIOT Act of 2001 (the “PATRIOT Act”), and the implementing regulations thereunder, which require financial institutions, including broker-dealers, to establish anti-money laundering compliance programs, file suspicious activity and other reports with the U.S. government and maintain certain records. Broker-dealers and mutual funds must also implement related customer identification procedures and beneficial ownership identification procedures.
Additionally, ATC, our wholly owned trust company subsidiary licensed with and regulated by the Arizona Department of Financial Institutions (“ADFI”), is one of several custodians on our platform that offers integrated custodial, brokerage and related services to clients of our adviser clients.
All of the foregoing laws and regulations are complex and we are required to expend significant resources to monitor and maintain our compliance with such laws and regulations. Any failure on our part to comply with these and other applicable laws and regulations could result in regulatory fines, suspensions of personnel or other sanctions, including revocation of our registration or that of our subsidiaries as an investment adviser, broker-dealer, commodity pool operator or trust company, as the case may be, which could, among other things, require changes to our business practices and scope of operations or harm our reputation, which, in turn could have a material adverse effect on our results of operations, financial condition or business.
Changes to the laws or regulations applicable to us or to our financial adviser clients could adversely affect our results of operations, financial condition or business.
We may be adversely affected as a result of new or revised legislation or regulations imposed by the SEC or other U.S. or foreign governmental regulatory authorities or self-regulatory organizations that supervise the financial markets around the world. In addition, we may be adversely affected by changes in the interpretation or enforcement of existing laws and rules by these governmental authorities and self-regulatory organizations. For example, on June 5, 2019, the SEC voted to adopt a package of rulemakings and interpretations that (i) require broker-dealers to act in the “best interest” of retail customers when making a recommendation, without placing the financial or other interests of the broker-dealer ahead of the interest of the retail customer (“Reg BI”), (ii) require that broker-dealers and investment advisers deliver to retail investors a short-form disclosure document (Form CRS) describing the firm’s relationship with and duties to the customer, (iii) clarify the scope of the “solely incidental” exception to Advisers Act registration by brokers when providing investment advice and (iv) clarify the SEC’s views on the fiduciary duty that investment advisers owe to their clients. The compliance date for Reg BI and Form CRS is June 30, 2020. Many broker-dealers and investment advisers appear to be re-evaluating their business models in light of Reg BI and other similar regulatory changes, and any ultimate change to their business models may affect their desire or ability to use our services and may therefore adversely affect our business. Legislative or regulatory actions and any required changes to our business operations resulting from such legislation and regulations, as well as any deficiencies in our compliance with such legislation and regulation, could result in significant loss of revenue, limit our ability to pursue business opportunities in which we might otherwise consider engaging or otherwise adversely affect our businesses.
It is impossible to determine the extent of the impact of any new laws, regulations or initiatives that may be proposed, or whether any current proposals will become law, and it is difficult to predict how any changes or potential changes could affect our business. Changes to laws or regulations could increase our potential liability in connection with the investment solutions and services that we provide. The introduction of any new laws or regulations could make our ability to comply with applicable laws and regulations more difficult and expensive. Any of the foregoing could have a material adverse effect on our results of operations, financial condition or business.
24
If we experience material weaknesses or otherwise fail to maintain an effective system of internal controls, we may not be able to accurately or timely report our financial condition or results of operations, which may adversely affect investor confidence in us and, as a result, the value of our common stock.
A material weakness is a deficiency, or combination of deficiencies, in internal controls over financial reporting such that there is a reasonable possibility that a material misstatement of a company’s annual or interim financial statements will not be prevented or detected on a timely basis. Until such time as we are no longer an “emerging growth company,” our independent registered public accounting firm will not be required to attest as to our internal controls over financial reporting. If we fail to identify or remediate any material weaknesses in our internal controls over financial reporting, if we are unable to comply with the requirements of Section 404 of the Sarbanes-Oxley Act in a timely manner, if we are unable to conclude that our internal controls over financial reporting are effective or if, once required, our independent registered public accounting firm is unable to express an opinion as to the effectiveness of our internal controls over financial reporting, investors may lose confidence in the accuracy and completeness of our financial reports and the market price of our common stock could be negatively affected. As a result of any such failures, we could also become subject to stockholder or other third-party litigation, as well as investigations by the NYSE, the SEC or other regulatory authorities, which could result in fines, trading suspensions or other remedies, harm our reputation and financial condition or divert financial and management resources from our regular business activities.
Failure to comply with ERISA and Internal Revenue Code regulations could result in penalties against us.
We are subject to ERISA and Sections 4975(c)(1)(A), (B), (C) and (D) of the Internal Revenue Code of 1986, as amended (the “Internal Revenue Code”) and to regulations promulgated thereunder, insofar as we act as a “fiduciary” under ERISA with respect to certain benefit plan clients or otherwise deal with benefit plan clients. ERISA and applicable provisions of the Internal Revenue Code impose duties on persons who are fiduciaries under ERISA, prohibit specified transactions involving ERISA plan clients (including, without limitation, employee benefit plans (as defined in Section 3(3) of ERISA), individual retirement accounts and Keogh plans) and impose monetary penalties for violations of these prohibitions. Our failure to comply with these requirements could result in significant penalties against us that could have a material adverse effect on our business (or, at worst, severely limit the extent to which we could act as a fiduciary for any plans under ERISA).
We are subject to litigation and regulatory examinations and investigations.
The financial services industry faces substantial regulatory risks and litigation. Like many firms operating within the financial services industry, we are experiencing a difficult regulatory environment across our markets. Our current scale and reach as a provider to the financial services industry, the increased regulatory oversight of the financial services industry generally, new laws and regulations affecting the financial services industry, ever-changing regulatory interpretations of existing laws and regulations and the retroactive imposition of new interpretations through enforcement actions have made this an increasingly challenging and costly regulatory environment in which to operate. These examinations or investigations, including any enforcement action brought by the SEC against us relating to any failure to comply with our settlement agreement dated August 25, 2016 (relating to allegations of misleading performance advertisements created by F-Squared Investments, Inc., one of our former investment strategists) could result in the identification of matters that may require remediation activities or enforcement proceedings by the regulator. The direct and indirect costs of responding to these examinations, or of defending ourselves in any litigation could be significant. Additionally, actions brought against us may result in settlements, awards, injunctions, fines and penalties. The outcome of litigation or regulatory action is inherently difficult to predict and could have an adverse effect on our ability to offer some of our products and services.
Failure to properly disclose conflicts of interest could harm our reputation, results of operations or business.
We are party to certain compensation arrangements pursuant to which we receive payments based on client assets invested in certain investment products, including ETFs, proprietary mutual funds and third-party mutual funds. In certain circumstances, such arrangements allow us to receive payments from multiple parties based on the same client asset. Further, we operate as an investment adviser; our status as a registered investment adviser subjects us to a legal obligation to operate under the fiduciary standard. The SEC and other regulators have increased their scrutiny of potential conflicts of interest, and we have implemented policies and procedures to mitigate such conflicts of interest. However, if we fail to fully disclose conflicts of interest, become subject to retroactive determinations that past disclosures were not sufficient or if our policies and procedures are not effective, we could face reputational damage, litigation or regulatory proceedings or penalties, any of which may adversely affect our reputation, results of operations or business.
In the event of a change of control of our company, we may be required to obtain FINRA approval and the consent of our advisory clients to the change of control, and any failure to obtain these consents could adversely affect our results of operations, financial condition or business.
As required by the Advisers Act, the investment advisory agreements entered into by our investment adviser subsidiaries provide that an “assignment” of the agreement may not be made without the client’s consent. Under the 1940 Act, advisory agreements with registered funds provide that they terminate automatically upon “assignment” and the board of directors and the
25
shareholders of the registered funds must approve a new agreement for advisory services to continue. Under both the Advisers Act and the 1940 Act, a change of ownership may constitute such an “assignment” if it is a change of control. For example, under certain circumstances, an assignment may be deemed to occur if a controlling block of voting securities is transferred, if any party acquires control, or, in certain circumstances, if a controlling party gives up control. Under the 1940 Act, a 25% voting interest is presumed to constitute control. HTSC, through its indirect subsidiary Huatai International Investment Holdings Limited (“HIIHL”), held a 70.3% voting interest in us as of December 31, 2019. An assignment or a change of control could be deemed to occur in the future if we, or one of our investment adviser subsidiaries, were to gain or lose a controlling person, or in other situations that may depend significantly on the facts and circumstances. In any such case we would seek to obtain the consent of our advisory clients, including any funds, to the assignment. Further, our U.S. broker-dealer subsidiary, AssetMark Brokerage, LLC, is a member of FINRA and subject to FINRA rules, which could impede or delay a change of control. FINRA’s Rule 1017 generally provides that FINRA approval must be obtained in connection with any transaction resulting in a single person or entity acquiring or controlling, directly or indirectly, 25% or more of a FINRA member firm’s or its parent company’s equity. If we fail to obtain such consents or approval, our results of operations, financial condition or business could be adversely affected.
Risks Related to Ownership of Our Common Stock
Control by our principal stockholder could adversely affect our other stockholders.
HTSC, through its indirect subsidiary HIIHL, owned approximately 70.3% of our outstanding shares of common stock as of December 31, 2019, and controls our management and affairs, including determining the outcome of matters requiring stockholder approval. So long as HTSC continues to own a significant amount of the outstanding shares of our common stock, even if such amount is less than a majority, HTSC will continue to be able to strongly influence or effectively control our decisions, including matters requiring approval by our stockholders (including the election of directors and the approval of mergers or other extraordinary transactions), regardless of whether or not other stockholders believe that the transaction is in their own best interests. Such concentration of voting power could also have the effect of delaying, deterring or preventing a change of control or other business combination that might otherwise be beneficial to our stockholders, could deprive our stockholders of an opportunity to receive a premium for their common stock as part of a sale of our company and might ultimately affect the market price of our common stock.
Further, HTSC and its affiliates engage in a broad spectrum of activities, including investments in the financial services industry in particular. In the ordinary course of their businesses, HTSC and its affiliates may engage in activities where their interests conflict with our interests or those of our stockholders. In addition, HTSC or an affiliate may pursue acquisition opportunities that may be complementary to our business, and, as a result, those acquisition opportunities may not be available to us. Further, although we are a stand-alone public company, a subsidiary of HTSC will remain our majority stockholder and may from time to time make strategic decisions that may be different from the decisions that we would have made on our own. HTSC’s decisions with respect to us or our business may be resolved in ways that favor HTSC and therefore HTSC’s own stockholders, which may not coincide with the interests of our stockholders. Although our audit committee reviews and approves all proposed related party transactions, including any transactions between us and HTSC, we may not be able to resolve certain conflicts of interest, or the resolution may be less favorable to us and our stockholders.
Our stock price may be volatile, and the value of our common stock may decline.
The market price of our common stock may be highly volatile and may fluctuate or decline substantially as a result of a number of factors, including those described in this “Risk Factors” section, many of which are beyond our control and may not be related to our operating performance. In addition, the limited public float of our common stock tends to increase the volatility of its trading price, in particular during times of high volatility in the broader stock market. Factors that could cause fluctuations in the market price of our common stock include the following:
|
|
• |
market conditions in the broader stock market in general, or in our industry in particular; |
|
|
• |
actual or anticipated fluctuations in our quarterly financial and operating results; |
|
|
• |
introduction of new products and services by us or our competitors; |
|
|
• |
issuance of new or changed securities analysts’ reports or recommendations; |
|
|
• |
sales of large blocks of our stock by our controlling stockholder or the perception that our controlling stockholder will sell our stock; |
|
|
• |
additions or departures of key personnel; |
|
|
• |
regulatory developments; litigation and governmental investigations; and |
|
|
• |
economic, political and geopolitical conditions or events, including public health concerns or epidemics such as the recent coronavirus outbreak. |
26
These and other factors may cause the market price and demand for our common stock to fluctuate substantially, which may limit or prevent investors from readily selling their shares of common stock and may otherwise negatively affect the liquidity of our common stock. In addition, in the past, when the market price of a stock has been volatile, holders of that stock have often instituted securities class action litigation against the company that issued the stock. If any of our stockholders brought a lawsuit against us, we could incur substantial defense costs. Such a lawsuit could also divert the time and attention of our management from our business.
An active market for our common stock may not be sustained, which may inhibit the ability of our stockholders to sell shares of our common stock.
Although we have listed our common stock on the NYSE under the symbol “AMK,” we cannot assure you that an active trading market for our common stock will continue on that exchange or elsewhere. Accordingly, we cannot assure you of the likelihood of your ability to sell your shares of our common stock when desired, the prices that you may be able to obtain for your shares or the liquidity of any trading market.
Future sales of a substantial number of shares of our common stock in the public market could cause the price of our common stock to decline.
Sales of a substantial number of shares of our common stock in the public market, or the perception that these sales might occur, could depress the market price of our common stock and could impair our ability to raise capital through the sale of additional equity securities. We cannot predict the effect that sales may have on the prevailing price of our common stock.
Specifically, HIIHL, the holder of 50,873,799 shares of our common stock, has the right, subject to certain exceptions and conditions, to require us to register its shares of common stock under the Securities Act and to participate in future registrations of securities by us. Registration of any of these outstanding shares of common stock would result in such shares becoming freely tradable without compliance with Rule 144 upon effectiveness of the applicable registration statement. In addition, the shares of our common stock already issued to employees or reserved for future issuance under our 2019 Equity Incentive Plan will become eligible for sale in the public market once such shares are issued, subject to various vesting arrangements and Rule 144, as applicable. A total of 4,887,691 shares of common stock have been reserved for issuance under our 2019 Equity Incentive Plan.
The market price of shares of our common stock may drop significantly when the restrictions on resale by our existing stockholders lapse if such stockholders sell shares or if HIIHL exercises its registration rights, or if the market perceives that such sales or exercise is likely to occur. A decline in the price of shares of our common stock might impede our ability to raise capital through the issuance of additional shares of our common stock or other equity securities. In the future, we may also issue our securities in connection with investments or acquisitions, and such issuances could constitute a material portion of the then-outstanding shares of our common stock. Any issuance of additional securities in connection therewith may result in additional dilution to our stockholders.
If securities or industry analysts do not publish research or reports about our business, or if they change their recommendations regarding our stock adversely, our stock price and trading volume could decline.
The trading market for our common stock may be influenced by the research and reports that industry or securities analysts publish about us or our business. If one or more of the analysts who cover us downgrade our stock or describe us or our business in a negative manner, our stock price would likely decline. If one or more of these analysts cease coverage of our company or fails to regularly publish reports on us, we could lose visibility in the financial markets, which in turn could cause our stock price or trading volume to decline. In addition, if we fail to meet the expectations and forecasts for our business provided by securities analysts, our stock price could decline.
We are a “controlled company” within the meaning of the NYSE listing standards and, as a result, qualify for, and intend to rely on, exemptions from certain corporate governance requirements. You will not have the same protections afforded to stockholders of companies that are subject to such requirements.
HTSC, through its indirect subsidiary HIIHL, controls a majority of the voting power of our common stock. As a result, we are a “controlled company” within the meaning of the NYSE listing standards. Under these rules, a company of which more than 50% of the voting power is held by an individual, a group or another company is a “controlled company” and may elect not to comply with certain corporate governance requirements of the NYSE, including (1) the requirement that a majority of the board of directors consist of independent directors, (2) the requirement that we have a nominating and corporate governance committee that is composed entirely of independent directors with a written charter addressing the committee’s purpose and responsibilities and (3) the requirement that we have a compensation committee that is composed entirely of independent directors with a written charter addressing the committee’s purpose and responsibilities. We rely on some or all of these exemptions. As a result, we do not have a majority of independent directors and our compensation and nominating and corporate governance committees do not consist entirely
27
of independent directors. Accordingly, our stockholders do not have the same protections afforded to stockholders of companies that are subject to all of the corporate governance requirements of the NYSE.
We are an “emerging growth company” and we cannot be certain if the reduced disclosure requirements applicable to emerging growth companies will make our common stock less attractive to investors.
We are an “emerging growth company” as defined in the JOBS Act, and we have elected to take advantage of certain exemptions from various reporting requirements that are applicable to other public companies that are not “emerging growth companies” including, but not limited to, not being required to comply with the auditor attestation requirements of Section 404 of the Sarbanes-Oxley Act and reduced disclosure obligations regarding executive compensation in our periodic reports and proxy statements. We cannot predict whether investors will find our common stock less attractive if we rely on these exemptions. If some investors find our common stock less attractive as a result, there may be a less active trading market for our common stock and our stock price may be more volatile.
The requirements of being a public company may strain our resources and distract our management, which could make it difficult to manage our business, particularly after we are no longer an “emerging growth company.”
As a public company, we are required to comply with various regulatory and reporting requirements, including those required by the SEC. Complying with these reporting and other regulatory requirements is time-consuming and may result in increased costs to us and could have a negative effect on our results of operations, financial condition or business.
We are subject to the reporting requirements of the Exchange Act and the requirements of the Sarbanes-Oxley Act, as well as the corporate governance requirements of the NYSE. Expenses incurred by public companies for reporting and governance purposes have generally been increasing and may continue to increase, and these requirements may place a strain on our systems and resources. The Exchange Act requires that we file annual, quarterly and current reports with respect to our business and financial condition. The Sarbanes-Oxley Act requires that we maintain effective disclosure controls and procedures and internal controls over financial reporting. To comply with our periodic reporting requirements and to maintain and improve the effectiveness of our disclosure controls and procedures, we have committed and will continue to commit significant resources, hire additional staff and provide additional management oversight. We have implemented and will continue to implement additional procedures and processes for the purpose of addressing the standards and requirements applicable to public companies. Sustaining our growth will also require us to commit additional management, operational and financial resources to identify new professionals to join our firm and to maintain appropriate operational and financial systems to adequately support expansion. These activities may divert management’s attention from other business concerns, which could have a material adverse effect on our results of operations, financial condition or business.
As an “emerging growth company” as defined in the JOBS Act, we have elected to take advantage of certain temporary exemptions from various reporting requirements including, but not limited to, the auditor attestation requirements of Section 404 of the Sarbanes-Oxley Act and certain disclosure obligations regarding executive compensation in our periodic reports and proxy statements. In addition, we have and may continue to delay adoption of new or revised accounting pronouncements applicable to public companies until such pronouncements are made applicable to private companies, as permitted by the JOBS Act.
When these exemptions cease to apply, we expect to incur additional expenses and devote increased management effort toward ensuring compliance with them. We cannot predict or estimate the amount of additional costs we may incur as a result of becoming a public company or the timing of such costs.
Our management has limited experience managing a public company, and our current resources may not be sufficient to fulfill our public company obligations.
As a public company, we are subject to various regulatory requirements, including those of the SEC and the NYSE. These requirements relate to, among other matters, record keeping, financial reporting and corporate governance. Our management team has limited experience in managing a public company, and our internal infrastructure may not be adequate to support our increased regulatory obligations. Further, we may be unable to hire, train or retain necessary staff and may initially be reliant on engaging outside consultants or professionals to overcome our lack of experience. Our business could be adversely affected if our internal infrastructure is inadequate, we are unable to engage outside consultants or are otherwise unable to fulfill our public company obligations.
28
Some provisions of Delaware law and our certificate of incorporation and bylaws may deter third parties from acquiring us.
Our amended and restated certificate of incorporation and our amended and restated bylaws provide for, among other things:
|
|
• |
a staggered board and restrictions on the ability of our stockholders to fill a vacancy on the board of directors; |
|
|
• |
the authorization of undesignated preferred stock, the terms of which may be established and shares of which may be issued without stockholder approval; |
|
|
• |
advance notice requirements for stockholder proposals; |
|
|
• |
certain limitations on convening special stockholder meetings; and |
|
|
• |
the amendment of certain provisions of our certificate of incorporation and bylaws only by the affirmative vote of the holders of at least two-thirds in voting power of all outstanding shares of our stock entitled to vote thereon, voting together as a single class. |
These anti-takeover defenses could discourage, delay or prevent a transaction involving a change in control of our company. These provisions could also discourage proxy contests and make it more difficult for you and other stockholders to elect directors of your choosing and cause us to take other corporate actions than you desire.
Delaware law may delay or prevent a change in control, and may discourage bids for our common stock at a premium over its market price.
We are subject to the provisions of Section 203 of the Delaware General Corporation Law (the “DGCL”). These provisions prohibit large stockholders, in particular a stockholder owning 15% or more of the outstanding voting stock, from consummating a merger or combination with a corporation unless such stockholder receives board approval for the transaction or 66 2/3% of the shares of voting stock not owned by such stockholder approve the transaction. These provisions of Delaware law may have the effect of delaying, deferring or preventing a change in control, and may discourage bids for our common stock at a premium over its market price.
Our amended and restated certificate of incorporation designates the Court of Chancery of the State of Delaware and, to the extent enforceable, the federal district courts of the United States as the sole and exclusive forums for certain types of actions and proceedings that may be initiated by our stockholders, which could limit our stockholders’ ability to obtain a favorable judicial forum for disputes with us or our directors, officers, employees or agents.
Our amended and restated certificate of incorporation provides that, unless we consent in writing to the selection of an alternative forum, the Court of Chancery of the State of Delaware is, to the fullest extent permitted by applicable law, the sole and exclusive forum for the following types of actions or proceedings under Delaware statutory or common law: (i) any derivative action or proceeding brought on our behalf, (ii) any action asserting a claim of breach of a fiduciary duty owed by any of our directors, officers, employees, agents or trustees to us or our stockholders, (iii) any action asserting a claim against us or any director or officer or other employee of ours arising pursuant to any provision of the DGCL, our amended and restated certificate of incorporation or our amended and restated bylaws or (iv) any action asserting a claim against us or any director or officer or other employee of ours that is governed by the internal affairs doctrine, in each such case subject to such Court of Chancery having personal jurisdiction over the indispensable parties named as defendants therein. This provision does not apply to suits brought to enforce a duty or liability created by the Exchange Act or any other claim for which the U.S. federal courts have exclusive jurisdiction.
Our amended and restated certificate of incorporation provides that, to the fullest extent permitted by law, unless we consent in writing to the selection of an alternative forum, the federal district courts of the United States are the sole and exclusive forum for resolving any complaint asserting a cause of action arising under the federal securities laws of the United States, subject to and contingent upon a final adjudication in the State of Delaware of the enforceability of such exclusive forum provision. Any person or entity purchasing or otherwise acquiring any interest in shares of our capital stock will be deemed to have notice of, and consented to, the provisions of our amended and restated certificate of incorporation described in the preceding sentences.
These exclusive-forum provisions may limit a stockholder’s ability to bring a claim in a judicial forum that it finds favorable for disputes with us or our directors, officers, employees or agents, which may discourage such lawsuits against us and such persons. If any court of competent jurisdiction were to find either exclusive-forum provision in our amended and restated certificate of incorporation to be inapplicable or unenforceable, we may incur additional costs associated with resolving such matters in other jurisdictions, which could adversely affect our results of operations or financial condition. For example, the Court of Chancery of the State of Delaware recently determined that a provision stating that U.S. federal district courts are the exclusive forum for resolving any complaint asserting a cause of action arising under the Securities Act is not enforceable. However, this decision may be reviewed and ultimately overturned by the Delaware Supreme Court.
29
Item 1B. Unresolved Staff Comments
None.
Our headquarters are located in Concord, California and consist of approximately 96,944 square feet of leased space. Our lease on this space expires on August 31, 2028. We lease an additional combined 117,131 square feet of office space in Phoenix, Arizona; Chicago, Illinois; State College, Pennsylvania; Encino, California; Atlanta, Georgia; Sarasota, Florida and Perrysburg, Ohio. We believe that our headquarters and other offices are adequate for our immediate needs and that additional or substitute space is available if needed to accommodate growth and expansion.
We are, from time to time, involved in various legal proceedings, litigation and regulatory matters that arise in the normal course of our business. We do not believe that the resolutions of any such matters we are currently involved in, individually or in the aggregate, will have a material adverse impact on our financial condition or results of operations. However, we can provide no assurance that any pending or future matters will not have a material effect on our financial condition or results of operations in the future.
Item 4. Mine Safety Disclosures
Not applicable.
30
Item 5. Market for Registrant’s Common Equity, Related Stockholder Matters and Issuer Purchases of Equity Securities
Market Information for Common Stock
Our common stock has been listed on the New York Stock Exchange under the symbol “AMK” since July 18, 2019. Prior to that date, no public trading market for our common stock existed.
Holders
As of February 29, 2019, there were 66 holders of record of our common stock. The actual number of stockholders is greater than the total number of record holders because it includes stockholders who are beneficial owners but whose shares are held in street name by brokers and other nominees.
Dividend Policy
In the fourth quarter of 2018, we made a one-time cash distribution to AssetMark Holdings LLC, in the amount of $234 million, consisting of a $75 million dividend payment and a $159 million return of capital. We currently intend to retain all available funds and any future earnings for use in the operation of our business and do not anticipate paying any dividends on our common stock in the foreseeable future. Any future determinations relating to our dividends and earning retention policies will be made at the discretion of our board of directors, who will review such policies from time to time in light of our earnings, cash flow generation, financial position, results of operations, the terms of our indebtedness and other contractual restrictions, capital requirements, business prospects and other factors our board of directors may deem relevant. The terms of our debt agreements limit our ability to pay dividends on our common stock.
Securities Authorized for Issuance Under Equity Compensation Plans
The information required under the relevant sections of this Item is incorporated by reference to the definitive Proxy Statement for our 2020 Annual Meeting of Stockholders, which will be filed with the SEC no later than 120 days after December 31, 2019 pursuant to Regulation 14A.
Use of Proceeds from Initial Public Offering of Common Stock
On July 22, 2019, we closed our initial public offering (our “IPO”), in which we sold 6,250,000 shares of common stock and the selling stockholder sold 8,125,000 shares of common stock (including shares sold in connection with the full exercise of the underwriters’ option to purchase additional shares) at a price to the public of $22.00 per share. The offer and sale of the shares in the IPO were registered under the Securities Act pursuant to a registration statement on Form S-1 (File No. 333-232312). We received net proceeds of $124.1 million from the IPO. We used the net proceeds to us from the IPO, together with cash on hand, to pay down approximately $125 million of indebtedness under our Term Loan. Such use of proceeds was in accordance with, and there was no material change from, our intended use of proceeds as described in our final prospectus dated July 17, 2019 filed with the SEC pursuant to Rule 424(b) of the Securities Act.
31
Stock Performance Graph
The following performance graph and related information shall not be deemed “soliciting material” or to be “filed” with the SEC for purposes of Section 18 of the Securities Exchange Act of 1934 (the “Exchange Act”), as amended, or otherwise subject to the liabilities under that Section, and shall not be deemed to be incorporated by reference into any filing of AssetMark under the Securities Act of 1933, as amended, or the Exchange Act, except as shall be expressly set forth by specific reference in such filing.
The graph below compares the cumulative total stockholder return on our common stock with the cumulative total return on the Russell 2000 Index and Dow Jones U.S. Financials Index. The graph assumes $100 was invested in our common stock at market close on July 18, 2019, which was our initial trading day. Data for the Russell 2000 Index and Dow Jones U.S. Financials Index assumes a reinvestment of dividends. The offering price of our common stock in our IPO, which had a closing stock price of $27.04 on July 18, 2019, was $22.00 per share.
The comparisons in the graph below are based upon historical data and are not indicative of, nor intended to forecast, future performance of our common stock.
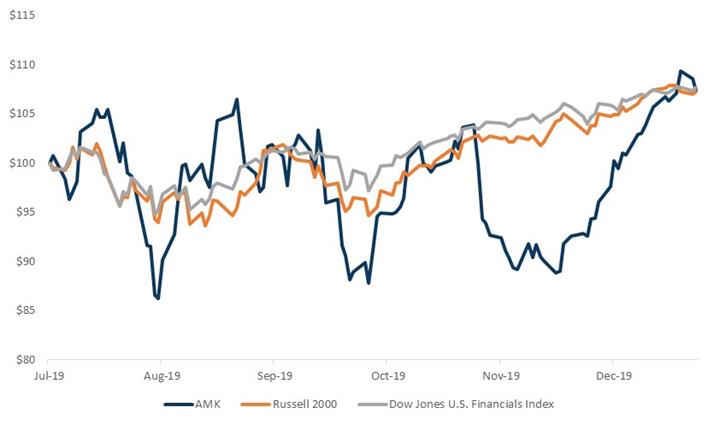
|
|
|
7/18/2019 |
|
|
8/30/2019 |
|
|
9/30/2019 |
|
|
10/31/2019 |
|
|
11/30/2019 |
|
|
12/31/2019 |
|
||||||
|
AssetMark |
|
$ |
100.00 |
|
|
$ |
104.29 |
|
|
$ |
96.34 |
|
|
$ |
101.48 |
|
|
$ |
92.57 |
|
|
$ |
107.32 |
|
|
Russell 2000 Index |
|
|
100.00 |
|
|
|
96.09 |
|
|
|
97.93 |
|
|
|
100.44 |
|
|
|
104.43 |
|
|
|
107.25 |
|
|
Dow Jones U.S. Financials Index |
|
|
100.00 |
|
|
|
97.92 |
|
|
|
100.57 |
|
|
|
102.35 |
|
|
|
105.72 |
|
|
|
107.68 |
|
32
Unregistered Sales of Equity Securities
Class C Unit Issuances
On January 18, 2019, AssetMark Holdings LLC granted to seven of our employees an aggregate of 120.02 Class C Common Units in AssetMark Holdings LLC. All such grants were made pursuant to those certain Service Member Unit Issuance Agreements by and between AssetMark Holdings LLC and each such director, executive officer or service provider.
Restricted Stock Awards
Prior to the liquidation and dissolution of AssetMark Holdings LLC, and in connection with our IPO, the executive officers of AssetMark Holdings held Class C common units of AssetMark Holdings, which were intended to be treated as profits interests. Immediately following the pricing of the IPO on July 17, 2019, AssetMark Holdings LLC liquidated and dissolved and distributed shares of our common stock to its members, including an aggregate number of restricted stock awards (“RSAs”) equal to 6,309,049 shares of our common stock to the 64 holders of the Class C common units of AssetMark Holdings LLC. All such distributions were pursuant to Restricted Stock Award Agreements by and between us and each such executive officer.
The sales, offers and issuances of the above securities were deemed to be exempt from registration under the Securities Act in reliance upon Section 4(a)(2) of the Securities Act or Regulation D promulgated thereunder as transactions by an issuer not involving a public offering, Section 3(a)(9) of the Securities Act as exchange transactions involving securities exchanged by the issuer with its existing security holders exclusively where no commission or other remuneration is paid or given for soliciting such exchange, or Rule 701 promulgated under Section 3(b) of the Securities Act as transactions by an issuer not involving any public offering under compensatory benefit plans and contracts relating to compensation. The recipients of the securities in each of these transactions represented their intentions to acquire the securities for investment only and not with a view to or for sale in connection with any distribution thereof. Appropriate legends were affixed to the securities issued in these transactions.
Purchases of Equity Securities by the Issuer and Affiliated Purchasers
None.
33
Item 6. Selected Consolidated Financial Data
The following selected consolidated financial data of AssetMark Financial Holdings, Inc. should be read in conjunction with, and are qualified by reference to, the section titled “Management’s Discussion and Analysis of Financial Condition and Results of Operations” and the consolidated financial statements and notes thereto included elsewhere in this Annual Report on Form 10-K. The consolidated statements of income data for the years ended December 31, 2019, 2018 and 2017 and the consolidated balance sheet data as of December 31, 2019, 2018 and 2017 are derived from, and qualified by reference to, the audited consolidated financial statements of AssetMark Financial Holdings, Inc. included elsewhere in this Annual Report on Form 10-K and should be read in conjunction with those consolidated financial statements and notes thereto. Results for historical periods may not be indicative of results expected for future periods.
|
|
|
Year Ended December 31, |
|
|||||||||
|
(in thousands) |
|
2019 |
|
|
2018 |
|
|
2017 |
|
|||
|
Consolidated statements of income data: |
|
|
|
|
|
|
|
|
|
|
|
|
|
Asset-based revenue |
|
$ |
377,718 |
|
|
$ |
338,031 |
|
|
$ |
282,966 |
|
|
Spread-based revenue |
|
|
34,586 |
|
|
|
20,403 |
|
|
|
10,430 |
|
|
Other revenue |
|
|
5,632 |
|
|
|
5,200 |
|
|
|
2,121 |
|
|
Total revenue |
|
|
417,936 |
|
|
|
363,634 |
|
|
|
295,517 |
|
|
Asset-based expenses |
|
|
125,985 |
|
|
|
116,763 |
|
|
|
98,401 |
|
|
Spread-based expenses |
|
|
5,014 |
|
|
|
1,671 |
|
|
|
976 |
|
|
Employee compensation |
|
|
154,999 |
|
|
|
107,091 |
|
|
|
105,413 |
|
|
General and operating expenses |
|
|
58,028 |
|
|
|
45,383 |
|
|
|
38,781 |
|
|
Professional fees |
|
|
14,084 |
|
|
|
10,139 |
|
|
|
9,622 |
|
|
Depreciation and amortization |
|
|
30,356 |
|
|
|
26,104 |
|
|
|
22,981 |
|
|
Total operating expenses |
|
|
388,466 |
|
|
|
307,151 |
|
|
|
276,174 |
|
|
Other income |
|
|
(1,089 |
) |
|
|
— |
|
|
|
— |
|
|
Interest expense |
|
|
12,269 |
|
|
|
1,920 |
|
|
|
— |
|
|
Other expense |
|
|
3,385 |
|
|
|
— |
|
|
|
— |
|
|
Income before income taxes |
|
|
14,905 |
|
|
|
54,563 |
|
|
|
19,343 |
|
|
Provision for (benefit from) income taxes |
|
|
15,325 |
|
|
|
17,137 |
|
|
|
(79,635 |
) |
|
Net income (loss) |
|
|
(420 |
) |
|
|
37,426 |
|
|
|
98,978 |
|
|
Net income (loss) per share, basic and diluted |
|
$ |
(0.01 |
) |
|
$ |
0.57 |
|
|
$ |
1.50 |
|
|
Other data: |
|
|
|
|
|
|
|
|
|
|
|
|
|
Capital expenditures |
|
$ |
22,496 |
|
|
$ |
17,414 |
|
|
$ |
15,652 |
|
|
Net cash provided by operating activities |
|
|
55,083 |
|
|
|
61,662 |
|
|
|
45,612 |
|
|
Net cash used in investing activities |
|
|
(59,914 |
) |
|
|
(17,714 |
) |
|
|
(15,652 |
) |
|
Net cash provided by (used in) financing activities |
|
$ |
(2,182 |
) |
|
$ |
11,259 |
|
|
$ |
— |
|
|
|
|
As of December 31, |
|
|||||||||
|
(in thousands) |
|
2019 |
|
|
2018 |
|
|
2017 |
|
|||
|
Consolidated balance sheet data: |
|
|
|
|
|
|
|
|
|
|
|
|
|
Cash and cash equivalents |
|
$ |
96,341 |
|
|
$ |
105,354 |
|
|
$ |
50,147 |
|
|
Working capital(1) |
|
|
91,277 |
|
|
|
77,521 |
|
|
|
20,091 |
|
|
Total assets |
|
|
1,188,960 |
|
|
|
1,147,275 |
|
|
|
1,097,741 |
|
|
Total liabilities |
|
|
330,099 |
|
|
|
448,264 |
|
|
|
211,783 |
|
|
Stockholders’ equity |
|
|
858,861 |
|
|
|
699,011 |
|
|
|
885,958 |
|
|
(1) |
Current assets less current liabilities. |
34
Item 7. Management’s Discussion and Analysis of Financial Condition and Results of Operations
You should read the following discussion and analysis of our financial condition and results of operations together with our consolidated financial statements and the related notes thereto and the other financial information included in this Annual Report on Form 10-K. Some of the information contained in this discussion and analysis or set forth elsewhere in this Annual Report on Form 10-K, including information with respect to our plans and strategy for our business, includes forward-looking statements that involve risks and uncertainties. You should review the sections titled “Special Note Regarding Forward-Looking Statements” and “Risk Factors” for a discussion of forward-looking statements and important factors that could cause actual results to differ materially from the results described in or implied by the forward-looking statements contained in the following discussion and analysis. Our fiscal year ends on December 31 each year.
Overview
AssetMark is a leading provider of extensive wealth management and technology solutions that power independent financial advisers and their clients. Our platform enables advisers to outsource high-cost and specialty services that would otherwise require significant investments of time and money—helping to level the playing field for independent financial advisers of all sizes. We provide an end-to-end experience, spanning nearly all elements of an adviser’s engagement with his or her client—from initial conversations to ongoing financial planning discussions, including performance reporting and billing. In addition, our platform provides tools and capabilities for advisers to better manage their day-to-day business activities, giving them more time for meaningful conversations with investors.
We believe that independent financial advisers who have a deep understanding of their communities and put the needs of investors first provide the best path for investors to achieve their long-term financial goals. We empower these adviser-entrepreneurs to start, run and grow independent advisory businesses. The compelling value of our tools for advisers and their clients has facilitated our rapid growth.
Business Highlights
|
|
• |
We completed the acquisition of GFPC on April 16, 2019. Through the GFPC acquisition, we acquired $3.8 billion in platform assets and 215 new financial adviser relationships, of which 93 advisers are engaged advisers. |
|
|
• |
We successfully completed our IPO on July 22, 2019 and raised $124.1 million after deducting underwriting discounts and commissions and offering costs payable by us. |
|
|
• |
We used the aggregate net proceeds to us from the IPO, together with cash on hand, to pay down $125 million of our outstanding indebtedness. On August 6, 2019, Moody’s upgraded our debt rating to Ba2 from B1, while S&P affirmed our BB+ rating. |
Financial Highlights
|
|
• |
Total revenue for the year ended December 31, 2019 was $417.9 million, up $54.3 million, or 14.9%, from $363.6 million for the year ended December 31, 2018. |
|
|
• |
Net loss for the year ended December 31, 2019 was $0.4 million, or $(0.01) per share, compared to net income of $37.4 million, or $0.57 per share, for the year ended December 31, 2018. This decrease was primarily due to (i) a $29.6 million increase in share-based compensation as a result of the growth in the valuation of our business and our issuance of RSAs immediately following the pricing of our IPO, (ii) a $14.2 million increase in non-recurring costs related to IPO readiness and the GFPC acquisition and integration and (iii) a $10.3 million increase in interest expense incurred in the year ended December 31, 2019 related to our Term Loan. |
|
|
• |
Adjusted net income for the year ended December 31, 2019 was $66.1 million, compared to $60.8 million for the year ended December 31, 2018. For a reconciliation of net income, the most directly comparable GAAP financial measure, to adjusted net income, see the section titled “—Key Operating Metrics—Non-GAAP Financial Metrics—Adjusted Net Income.” |
|
|
• |
Adjusted EBITDA for the year ended December 31, 2019 was $109.9 million, up $21.0 million, or 23.6%, from $88.9 million in the year ended December 31, 2018. For a reconciliation of net income, the most directly comparable GAAP financial measure, to adjusted EBITDA, see the section titled “—Key Operating Metrics—Non-GAAP Financial Metrics—Adjusted EBITDA.” |
Asset and Adviser Growth Trends
|
|
• |
Platform assets were $61.6 billion as of December 31, 2019, up 37.3% from $44.9 billion as of December 31, 2018. |
|
|
• |
We had 2,230 engaged advisers on our platform as of December 31, 2019, up 21.4% from 1,837 as of December 31, 2018. |
35
Key Factors Affecting Our Performance
Expansion of Our Existing Financial Adviser Base
We are focused on attracting new advisers to our platform with our end-to-end wealth management offering, composed of a fully integrated technology platform, high-touch sales and service support and a curated investment platform. Our extensive offering is built to enhance adviser efficiency so that advisers of all sizes can compete and grow. We also strive to increase our share of wallet, or portion of an adviser’s fee-based business that is invested on our platform, by providing a holistic platform for advisers and surrounding advisers with the tools they need to better serve their clients. Our business will depend in part on our ability to drive higher usage of our platform by financial advisers and their client bases.
Increase of New Financial Advisers on Our Platform
Within the wealth management industry, the percentage of assets served by independent financial advisers is forecasted to grow from 42% in 2018 to 48% in 2023, based on our internal estimates and Cerulli data on expected industry growth. We seek to capitalize on this trend and attract new financial advisers to our platform by continuing to invest in our technology platform, sales and service standards and curated investment offering. Our annual cohort of new producing advisers grew 63% from 548 new producing advisers in 2014 to 894 in 2019. Our business will depend in part on our ability to continue to attract new advisers to our platform.
Technology Development
We invested $190 million in the development of our technology and our dedicated technology team from January 1, 2015 to December 31, 2019. We intend to continue to invest in our technology platform to address the needs of financial advisers and their investors. Our revenue growth will depend, in part, on our ability to continue to launch new offerings and deliver solutions to financial advisers efficiently. While these investments may delay or reduce our profitability, we believe they will enable us to grow our revenue meaningfully in the long term.
Investments in Growth
We have made and expect to continue to make substantial investments across our business, including those related to increasing our total employee base, to support our continued growth. We intend to continue to expand our sales capacity and further improve sales productivity to drive additional revenue and support the growth of our client base. We may incur increased general and administrative expenses to support our growth and operations. Our results of operations will depend in part on our ability to continue to manage such expenses, as well as on the effectiveness of our investments. We expect to continue managing such expenses and investments to support expansion of our adjusted EBITDA margin.
Competition
We compete with a broad range of wealth management firms that offer services to independent investment advisers. Our competitive landscape is defined by three primary factors: 1) technological capabilities, 2) consulting and back-office servicing and 3) investment solutions. We may compete on these factors based on products, services or fees. While we anticipate that we will see increased competition and experience fee pressure, we believe that our technology platform, along with our personalized service and curated investment solutions, will continue to drive revenue expansion.
Value of Platform Assets
Our revenue is subject to fluctuations due to changes in general economic conditions, including market conditions and the changing interest rate environment. Most of our revenue is based on the value of assets invested in products on our platform, which is heavily influenced by general economic conditions. Fluctuations in securities prices may affect the value of such assets and may also influence an investor’s decision to select, grow, maintain or reduce an investment. We generate asset-based revenue from fees billed in advance of each quarter, providing visibility into near-term revenue and helping to minimize revenue fluctuations stemming from market volatility. In addition, we realize spread-based revenue, which represents a growing portion of our revenue. Spread-based revenue is subject to change based on interest rate changes and the amount of cash held by investors at our proprietary trust company.
Acquisitions
Our ability to pursue and execute strategic transactions may impact our assets and revenue. From 2014 to 2019, we acquired the platform assets of three firms, which collectively have added $7.3 billion in assets. In September 2019, we announced our agreement to acquire OBS Financial, which closed on February 29, 2020 and which added approximately $2.1 billion in platform assets. We expect to continue to selectively seek acquisitions that will enhance our scale, operating leverage and capabilities to further deepen our offering to advisers and investors.
36
Initial Public Offering
On July 22, 2019, we completed our IPO, in which we issued and sold 6,250,000 shares of our common stock, and the selling stockholder sold 8,125,000 shares of our common stock (including shares sold in connection with the full exercise of the underwriters’ option to purchase additional shares), at a price to the public of $22.00 per share. We received aggregate net proceeds of $124.1 million from the IPO after deducting underwriting discounts and commissions and offering expenses payable by us. We used the aggregate net proceeds to us, together with cash on hand, to pay down approximately $125 million of our indebtedness under the Term Loan.
Key Operating Metrics
In addition to our GAAP financials, we regularly review the following key metrics to measure performance, identify trends, formulate financial projections, compensate our employees and monitor our business. While we believe that these metrics are useful in evaluating our business, other companies may not use similar metrics or may not calculate similarly titled metrics in a consistent manner.
Key metrics for the fiscal years ended December 31, 2019, 2018 and 2017 include the following:
|
|
|
Year Ended December 31, |
|
|||||||||
|
|
|
2019 |
|
|
2018 |
|
|
2017 |
|
|||
|
Operational metrics: |
|
|
|
|
|
|
|
|
|
|
|
|
|
Platform assets (at period-beginning) (millions of dollars) |
|
$ |
44,855 |
|
|
$ |
42,385 |
|
|
$ |
32,251 |
|
|
Net flows (millions of dollars) |
|
|
5,389 |
|
|
|
5,916 |
|
|
|
5,863 |
|
|
Market impact net of fees (millions of dollars) |
|
|
7,575 |
|
|
|
(3,446 |
) |
|
|
4,271 |
|
|
Acquisition impact (millions of dollars) |
|
|
3,789 |
|
|
|
— |
|
|
|
— |
|
|
Platform assets (at period-end) (millions of dollars) |
|
$ |
61,608 |
|
|
$ |
44,855 |
|
|
$ |
42,385 |
|
|
Net flows lift (% of beginning-of-year platform assets) |
|
|
12.0 |
% |
|
|
14.0 |
% |
|
|
18.2 |
% |
|
Advisers (at period-end) |
|
|
7,958 |
|
|
|
7,573 |
|
|
|
7,183 |
|
|
Engaged advisers (at period-end) |
|
|
2,230 |
|
|
|
1,837 |
|
|
|
1,743 |
|
|
Assets from engaged advisers (at period-end) (millions of dollars) |
|
$ |
54,853 |
|
|
$ |
38,495 |
|
|
$ |
36,372 |
|
|
Households (at period-end) |
|
|
162,225 |
|
|
|
133,947 |
|
|
|
114,377 |
|
|
New producing advisers |
|
|
894 |
|
|
|
910 |
|
|
|
911 |
|
|
Production lift from existing advisers (annualized %) |
|
|
24.4 |
% |
|
|
22.1 |
% |
|
|
27.6 |
% |
|
Assets in custody at ATC (at period-end) (millions of dollars) |
|
$ |
43,393 |
|
|
$ |
31,767 |
|
|
$ |
28,422 |
|
|
ATC client cash (at period-end) (millions of dollars) |
|
$ |
1,876 |
|
|
$ |
1,612 |
|
|
$ |
1,146 |
|
|
Financial metrics: |
|
|
|
|
|
|
|
|
|
|
|
|
|
Total revenue (millions of dollars) |
|
$ |
418 |
|
|
$ |
364 |
|
|
$ |
296 |
|
|
Net income (loss) (millions of dollars) |
|
$ |
(0.4 |
) |
|
$ |
37.4 |
|
|
$ |
99.0 |
|
|
Net income (loss) margin (%) |
|
|
(0.1 |
)% |
|
|
10.3 |
% |
|
|
33.5 |
% |
|
Capital expenditure (millions of dollars) |
|
$ |
22.5 |
|
|
$ |
17.4 |
|
|
$ |
15.7 |
|
|
Non-GAAP financial metrics: |
|
|
|
|
|
|
|
|
|
|
|
|
|
Adjusted EBITDA (millions of dollars) |
|
$ |
109.9 |
|
|
$ |
88.9 |
|
|
$ |
58.9 |
|
|
Adjusted EBITDA margin (%) |
|
|
26.3 |
% |
|
|
24.5 |
% |
|
|
19.9 |
% |
|
Adjusted net income (millions of dollars) |
|
$ |
66.1 |
|
|
$ |
60.8 |
|
|
$ |
34.3 |
|
Platform Assets
We believe that the amount of assets on our platform is an important indicator of the strength and growth of our business, our increased customer footprint and the market acceptance of our platform. We define platform assets as all assets on the AssetMark platform, whether these are assets for which we provide advisory services, referred to as regulatory assets under management (“AUM”), or non-advisory assets under administration, assets held in cash accounts or otherwise not managed (collectively, “Other Assets”). There is generally no material economic difference to our financial results whether assets are considered AUM or Other Assets. We view our platform assets as reflective of our revenue growth and potential for future growth. We had platform assets of $61,608 million, $44,855 million and $42,385 million as of December 31, 2019, 2018 and 2017, respectively. Our regulatory AUM totaled $38,785 million, $29,959 million and $28,303 million as of December 31, 2019, 2018 and 2017, respectively. We intend to continue growing our platform assets with enhancements to our technology, services and investment solutions. We expect the growth in our platform assets will remain a significant indicator of our business momentum and results of operations as existing advisers and new advisers realize the benefits of our platform. Our platform assets in any period may continue to fluctuate as a result of several
37
factors, including our adviser satisfaction with the functionality, features, performance or pricing of our offering, overall fluctuations in the securities markets and other factors, a number of which are beyond our control.
The following table provides information regarding the degree to which production, redemptions, net flows and changes in the market value of existing assets contributed to changes in assets on our platform in the periods indicated.
|
|
|
Year Ended December 31, |
|
|||||||||
|
(in millions of dollars) |
|
2019 |
|
|
2018 |
|
|
2017 |
|
|||
|
Beginning platform assets |
|
$ |
44,855 |
|
|
$ |
42,385 |
|
|
$ |
32,251 |
|
|
Production |
|
|
13,181 |
|
|
|
10,843 |
|
|
|
10,399 |
|
|
Redemptions |
|
|
(7,792 |
) |
|
|
(4,927 |
) |
|
|
(4,536 |
) |
|
Net flows |
|
|
5,389 |
|
|
|
5,916 |
|
|
|
5,863 |
|
|
Market impact net of fees |
|
|
7,575 |
|
|
|
(3,446 |
) |
|
|
4,271 |
|
|
Acquisition impact |
|
|
3,789 |
|
|
|
— |
|
|
|
— |
|
|
Ending platform assets |
|
$ |
61,608 |
|
|
$ |
44,855 |
|
|
$ |
42,385 |
|
Net Flows, Market Impact Net of Fees and Acquisition Impact
The changes in our platform assets from period to period are primarily driven by the amount of new assets that are added to existing and new client accounts, which we refer to as production, and the amount of assets that are withdrawn from client accounts, which we refer to as redemption. We refer to the difference between production and redemption as net flows. Positive net flows indicate that the amount of assets added to client accounts exceeds the amount of assets that have been terminated or withdrawn from client accounts. The decrease in net flows from the year ended December 31, 2018 to the year ended December 31, 2019 was due to increased redemptions from GFPC’s adviser-managed business, which yielded nominal revenue to us. In addition to net flows, the change in the market value of investments held in client accounts between the beginning and end of a period, which we define as market impact, also influences platform assets. For each period, we show the market impact on platform assets net of the fees paid to financial advisers, AssetMark custodians and certain fees embedded in investment vehicles. Further, acquisition impact refers to the amount of assets added to our platform through acquisitions.
Net Flows Lift
Net flows lift refers to net flows over a given period divided by platform assets at the beginning of the year. Net flows lift allows us to determine the percentage return we are attaining in terms of net new assets from our asset base at the beginning of year. We use beginning-of-year platform assets to calculate net flows lift for a given quarter to eliminate market and net flows impacts from previous quarters of the calendar year, which allows for a more accurate and consistent quarterly comparison.
Advisers (at Period-End)
Adviser count reflects the total number of advisers who had at least one investor account on our platform at the end of the given period.
Engaged Advisers (at Period-End)
Engaged advisers are advisers with at least $5 million in platform assets.
Assets from Engaged Advisers (at Period-End)
Assets from engaged advisers are total platform assets attributable to engaged advisers.
Households (at Period-End)
We define a “Household” as one or more client accounts that are grouped together based on a relationship identification code as determined by the financial adviser.
New Producing Advisers
New producing advisers (“NPAs”) for a given period represents the number of advisers that invested their first client assets on our platform in that period.
38
Production Lift from Existing Advisers (Annualized)
Existing advisers for a given period are defined as those who had invested client assets on our platform as of the beginning of the period. Production lift from existing advisers for a given period is calculated by dividing production (the amount of new assets that are added to client accounts) attributable to existing advisers (excluding GFPC advisers) for such period by platform assets as of the beginning of such period and annualizing the result. This metric represents both the organic growth of these advisers as well as any incremental share of wallet of the adviser’s business that is added to our platform on an annualized basis. We previously disclosed described production lift from existing advisers as a year-to-date metric, despite calculating the metric on an annualized basis. As such, we have revised the description of this metric to match our calculations.
Assets in Custody at ATC (at Period-End)
Assets in custody at ATC represents platform assets that are in custody at AssetMark Trust Company (“ATC”).
ATC Client Cash (at Period-End)
In general, all accounts with ATC are required to have cash at a minimum level ranging from of 1.5% to 5% of invested assets. In addition to this minimum amount, strategists and advisers have the discretion to hold additional invested assets in cash. We refer to the aggregate amount of cash held at ATC as ATC client cash. As of December 31, 2019, 2018 and 2017, ATC client cash accounted for 4%, 5% and 4%, respectively, of the total assets in custody at ATC. As of December 31, 2019, 2018 and 2017, 99%, 86% and 85%, respectively, of the ATC client cash was placed with the ATC-insured cash deposit program and was the primary source of spread-based revenue for our business.
Total Revenue
Total revenue includes all revenue that we recognize, including asset-based revenue, spread-based revenue and other revenue. We recently announced plans to transition certain of our third-party mutual fund strategies from retail to institutional share classes, which have lower operating expense ratios than our retail share class mutual fund offerings. This transition, which we expect to take effect in June 2020, will result in a lower overall cost of investment, and we expect that it will negatively impact our total revenue.
Net Income (Loss)
Net income is defined as total revenue less total expenses and provision for income taxes.
Net Income (Loss) Margin
Net income margin is defined as net income divided by total revenue.
Capital Expenditure
Capital expenditure represents the long-term investments that we make on an annual basis. Capital expenditure primarily reflects investments in technology, the development of new products and services and other intangible assets, but also includes investments in property and equipment such as technology support and office space.
Non-GAAP Financial Metrics
Adjusted EBITDA and Adjusted EBITDA Margin
Adjusted EBITDA is defined as EBITDA (net income plus interest expense, income tax expense, depreciation and amortization and less interest income), further adjusted to exclude certain non-cash charges and other adjustments set forth below. Adjusted EBITDA margin is defined as adjusted EBITDA divided by total revenue. Adjusted EBITDA and adjusted EBITDA margin are useful financial metrics in assessing our operating performance from period to period because they exclude certain items that we believe are not representative of our core business, such as certain material non-cash items and other adjustments such as share-based compensation, strategic initiatives and reorganization and integration costs. We believe that adjusted EBITDA and adjusted EBITDA margin, viewed in addition to, and not in lieu of, our reported GAAP results, provide useful information to investors regarding our performance and overall results of operations for various reasons, including:
|
|
• |
non-cash equity grants made to employees at a certain price and point in time do not necessarily reflect how our business is performing at any particular time; as such, share-based compensation expense is not a key measure of our operating performance; and |
39
|
|
• |
costs associated with acquisitions and the resulting integrations, debt refinancing, restructuring, litigation and conversions can vary from period to period and transaction to transaction; as such, expenses associated with these activities are not considered a key measure of our operating performance. |
We use adjusted EBITDA and adjusted EBITDA margin:
|
|
• |
as measures of operating performance; |
|
|
• |
for planning purposes, including the preparation of budgets and forecasts; |
|
|
• |
to allocate resources to enhance the financial performance of our business; |
|
|
• |
to evaluate the effectiveness of our business strategies; |
|
|
• |
in communications with our board of directors concerning our financial performance; and |
|
|
• |
as considerations in determining compensation for certain employees. |
Adjusted EBITDA and adjusted EBITDA margin have limitations as analytical tools, and should not be considered in isolation to, or as substitutes for, analysis of our results as reported under GAAP. Some of these limitations are:
|
|
• |
adjusted EBITDA and adjusted EBITDA margin do not reflect all cash expenditures, future requirements for capital expenditures or contractual commitments; |
|
|
• |
adjusted EBITDA and adjusted EBITDA margin do not reflect changes in, or cash requirements for, working capital needs; |
|
|
• |
adjusted EBITDA and adjusted EBITDA margin do not reflect interest expense on our debt or the cash requirements necessary to service interest or principal payments; and |
|
|
• |
the definitions of adjusted EBITDA and adjusted EBITDA margin can differ significantly from company to company and as a result have limitations when comparing similarly titled measures across companies. |
Set forth below is a reconciliation from net income (loss) and net income (loss) margin, the most directly comparable GAAP financial measures, to adjusted EBITDA and adjusted EBITDA margin for the fiscal years ended December 31, 2019, 2018 and 2017.
|
|
|
Year Ended December 31, |
|
|
Year Ended December 31, |
|
||||||||||||||||||
|
(in thousands except for percentages) |
|
2019 |
|
|
2018 |
|
|
2017 |
|
|
2019 |
|
|
2018 |
|
|
2017 |
|
||||||
|
Net income (loss) |
|
$ |
(420 |
) |
|
$ |
37,426 |
|
|
$ |
98,978 |
|
|
|
(0.1 |
)% |
|
|
10.3 |
% |
|
|
33.5 |
% |
|
Provision for (benefit from) income taxes |
|
|
15,325 |
|
|
|
17,137 |
|
|
|
(79,635 |
) |
|
|
3.6 |
% |
|
|
4.7 |
% |
|
|
(26.9 |
)% |
|
Interest income (loss) |
|
|
(2,510 |
) |
|
|
(2,433 |
) |
|
|
(268 |
) |
|
|
(0.6 |
)% |
|
|
(0.7 |
)% |
|
|
(0.1 |
)% |
|
Interest expense |
|
|
12,269 |
|
|
|
1,920 |
|
|
|
— |
|
|
|
2.9 |
% |
|
|
0.6 |
% |
|
|
— |
|
|
Amortization/depreciation |
|
|
30,356 |
|
|
|
26,104 |
|
|
|
22,981 |
|
|
|
7.3 |
% |
|
|
7.2 |
% |
|
|
7.8 |
% |
|
EBITDA |
|
$ |
55,020 |
|
|
$ |
80,154 |
|
|
$ |
42,056 |
|
|
|
13.1 |
% |
|
|
22.1 |
% |
|
|
14.3 |
% |
|
Share-based compensation(1) |
|
|
36,202 |
|
|
|
6,568 |
|
|
|
6,920 |
|
|
|
8.7 |
% |
|
|
1.8 |
% |
|
|
2.3 |
% |
|
IPO readiness(2) |
|
|
3,323 |
|
|
|
1,182 |
|
|
|
— |
|
|
|
0.8 |
% |
|
|
0.3 |
% |
|
|
— |
|
|
Reorganization and integration costs(3) |
|
|
1,655 |
|
|
|
1,041 |
|
|
|
3,266 |
|
|
|
0.4 |
% |
|
|
0.3 |
% |
|
|
1.1 |
% |
|
Acquisition expenses(4) |
|
|
11,392 |
|
|
|
— |
|
|
|
1,339 |
|
|
|
2.8 |
% |
|
|
— |
|
|
|
0.4 |
% |
|
Debt acquisition cost write-down(5) |
|
|
2,296 |
|
|
|
— |
|
|
|
— |
|
|
|
0.5 |
% |
|
|
— |
|
|
|
— |
|
|
Strategic initiatives(6) |
|
|
— |
|
|
|
— |
|
|
|
2,026 |
|
|
|
— |
|
|
|
— |
|
|
|
0.7 |
% |
|
Settlement costs related to a non-routine legal dispute(7) |
|
|
— |
|
|
|
— |
|
|
|
2,000 |
|
|
|
— |
|
|
|
— |
|
|
|
0.7 |
% |
|
Retention bonus related to our 2016 sale to HTSC(8) |
|
|
— |
|
|
|
— |
|
|
|
1,215 |
|
|
|
— |
|
|
|
— |
|
|
|
0.4 |
% |
|
Transition services payment for 2015 acquisition(9) |
|
|
— |
|
|
|
— |
|
|
|
57 |
|
|
|
— |
|
|
|
— |
|
|
|
— |
|
|
Adjusted EBITDA |
|
$ |
109,888 |
|
|
$ |
88,945 |
|
|
$ |
58,879 |
|
|
|
26.3 |
% |
|
|
24.5 |
% |
|
|
19.9 |
% |
|
(1) |
“Share-based compensation” represents granted share-based compensation in the form of Class C Common Units (which are incentive units) of AssetMark Holdings LLC, our former parent company, and RSA, restricted stock unit and stock option grants by us to certain of our directors and employees. Although this expense occurred in each measurement period, we have added the expense back in our calculation of adjusted EBITDA because of its noncash impact. |
40
|
(2) |
“IPO readiness” includes professional fees related to our preparation for becoming a public company. These expenses primarily include services for financial and human resources systems implementation, executive compensation assessments and other consulting services. Although these expenses occurred in both 2018 and 2019, these expenses are nonrecurring as they are limited to our public-company readiness preparation and do not include ongoing public-company compliance costs. |
|
(3) |
“Reorganization and integration costs” includes costs related to our functional reorganization within our Operations, Technology and Retirement functions as well as duplicate costs related to the outsourcing of back-office operations functions. While we have incurred such expenses in all periods measured, these expenses serve varied reorganization and integration initiatives, each of which is non-recurring. We do not consider these expenses to be part of our core operations. |
|
(4) |
“Acquisition expenses” includes employee severance, transition and retention expenses, duplicative general and administrative expenses and other professional fees related to acquisitions. |
|
(5) |
“Debt acquisition cost write-down” represents capitalized debt issuance costs extinguished due to the partial repayment of $125 million of the Company’s outstanding indebtedness under the Term Loan. The repayment was considered a substantial modification and the debt was considered partially extinguished. |
|
(6) |
“Strategic initiatives” includes costs related to one-time investments for exploratory work regarding potential business opportunities in 2017. These strategic initiatives were part of the initial strategic review performed by HTSC in late 2016. These costs included research into such areas as RIA expansion, international products, retirement products and cash solutions. Such costs were non-recurring. |
|
(7) |
“Settlement costs related to a non-routine legal dispute” are costs related to the settlement of an unusual legal dispute with a technology vendor. We consider the settlement nonrecurring. |
|
(8) |
“Retention bonus related to our 2016 sale to HTSC” includes retention incentives paid to certain of our directors as an incentive to retain their services after HTSC acquired our company in 2016. This expense was a one-time incentive provided by HTSC to such directors. |
|
(9) |
“Transition services payment for 2015 acquisition” represents a 2017 expense related to a final payment pursuant to a one-time transition services agreement and is therefore nonrecurring. |
Set forth below is a summary of the adjustments involved in the reconciliation from net income (loss) and net income (loss) margin, the most directly comparable GAAP financial measures, to adjusted EBITDA and adjusted EBITDA margin for the fiscal years ended December 31, 2019, 2018 and 2017, broken out by compensation and non-compensation expenses.
|
|
|
Year Ended December 31, 2019 |
|
|
Year Ended December 31, 2018 |
|
|
Year Ended December 31, 2017 |
|
|||||||||||||||||||||||||||
|
(in thousands) |
|
Compensation |
|
|
Non- Compensation |
|
|
Total |
|
|
Compensation |
|
|
Non- Compensation |
|
|
Total |
|
|
Compensation |
|
|
Non- Compensation |
|
|
Total |
|
|||||||||
|
Share-based compensation(1) |
|
$ |
36,202 |
|
|
|
— |
|
|
$ |
36,202 |
|
|
$ |
6,568 |
|
|
|
— |
|
|
$ |
6,568 |
|
|
$ |
6,920 |
|
|
|
— |
|
|
$ |
6,920 |
|
|
IPO readiness(2) |
|
|
— |
|
|
$ |
3,323 |
|
|
|
3,323 |
|
|
|
158 |
|
|
$ |
1,024 |
|
|
|
1,182 |
|
|
|
— |
|
|
|
— |
|
|
|
— |
|
|
Reorganization and integration costs(3) |
|
|
1,369 |
|
|
|
286 |
|
|
|
1,655 |
|
|
|
891 |
|
|
|
150 |
|
|
|
1,041 |
|
|
|
2,576 |
|
|
$ |
690 |
|
|
|
3,266 |
|
|
Acquisition expenses(4) |
|
|
4,874 |
|
|
|
6,518 |
|
|
|
11,392 |
|
|
|
— |
|
|
|
— |
|
|
|
— |
|
|
|
3 |
|
|
|
1,336 |
|
|
|
1,339 |
|
|
Debt acquisition cost write-down(5) |
|
|
— |
|
|
|
2,296 |
|
|
|
2,296 |
|
|
|
— |
|
|
|
— |
|
|
|
— |
|
|
|
— |
|
|
|
— |
|
|
|
— |
|
|
Strategic initiatives(6) |
|
|
— |
|
|
|
— |
|
|
|
— |
|
|
|
— |
|
|
|
— |
|
|
|
— |
|
|
|
890 |
|
|
|
1,136 |
|
|
|
2,026 |
|
|
Settlement costs related to a non-routine legal dispute(7) |
|
|
— |
|
|
|
— |
|
|
|
— |
|
|
|
— |
|
|
|
— |
|
|
|
— |
|
|
|
— |
|
|
|
2,000 |
|
|
|
2,000 |
|
|
Retention bonus related to our 2016 sale to HTSC(8) |
|
|
— |
|
|
|
— |
|
|
|
— |
|
|
|
— |
|
|
|
— |
|
|
|
— |
|
|
|
1,215 |
|
|
|
— |
|
|
|
1,215 |
|
|
Transition services payment for 2015 acquisition(9) |
|
|
— |
|
|
|
— |
|
|
|
— |
|
|
|
— |
|
|
|
— |
|
|
|
— |
|
|
|
— |
|
|
|
57 |
|
|
|
57 |
|
|
Total adjustments to adjusted EBITDA |
|
$ |
42,445 |
|
|
$ |
12,423 |
|
|
$ |
54,868 |
|
|
$ |
7,617 |
|
|
$ |
1,174 |
|
|
$ |
8,791 |
|
|
$ |
11,604 |
|
|
$ |
5,219 |
|
|
$ |
16,823 |
|
41
|
|
|
Year Ended December 31, 2019 |
|
|
Year Ended December 31, 2018 |
|
|
Year Ended December 31, 2017 |
|
|||||||||||||||||||||||||||
|
(in percentages) |
|
Compensation |
|
|
Non- Compensation |
|
|
Total |
|
|
Compensation |
|
|
Non- Compensation |
|
|
Total |
|
|
Compensation |
|
|
Non- Compensation |
|
|
Total |
|
|||||||||
|
Share-based compensation(1) |
|
|
8.7 |
% |
|
|
— |
|
|
|
8.7 |
% |
|
|
1.8 |
% |
|
|
— |
|
|
|
1.8 |
% |
|
|
2.3 |
% |
|
|
— |
|
|
|
2.3 |
% |
|
IPO readiness(2) |
|
|
— |
|
|
|
0.8 |
% |
|
|
0.8 |
% |
|
|
— |
|
|
|
0.3 |
% |
|
|
0.3 |
% |
|
|
— |
|
|
|
— |
|
|
|
— |
|
|
Reorganization and integration costs(3) |
|
|
0.3 |
% |
|
|
0.1 |
% |
|
|
0.4 |
% |
|
|
0.3 |
% |
|
|
— |
|
|
|
0.3 |
% |
|
|
0.9 |
% |
|
|
0.2 |
% |
|
|
1.1 |
% |
|
Acquisition expenses(4) |
|
|
1.2 |
% |
|
|
1.6 |
% |
|
|
2.8 |
% |
|
|
— |
|
|
|
— |
|
|
|
— |
|
|
|
— |
|
|
|
0.4 |
% |
|
|
0.4 |
% |
|
Debt acquisition cost write-down(5) |
|
|
— |
|
|
|
0.5 |
% |
|
|
0.5 |
% |
|
|
— |
|
|
|
— |
|
|
|
— |
|
|
|
— |
|
|
|
— |
|
|
|
— |
|
|
Strategic initiatives(6) |
|
|
— |
|
|
|
— |
|
|
|
— |
|
|
|
— |
|
|
|
— |
|
|
|
— |
|
|
|
0.3 |
% |
|
|
0.4 |
% |
|
|
0.7 |
% |
|
Settlement costs related to a non-routine legal dispute(7) |
|
|
— |
|
|
|
— |
|
|
|
— |
|
|
|
— |
|
|
|
— |
|
|
|
— |
|
|
|
— |
|
|
|
0.7 |
% |
|
|
0.7 |
% |
|
Retention bonus related to our 2016 sale to HTSC(8) |
|
|
— |
|
|
|
— |
|
|
|
— |
|
|
|
— |
|
|
|
— |
|
|
|
— |
|
|
|
0.4 |
% |
|
|
— |
|
|
|
0.4 |
% |
|
Transition services payment for 2015 acquisition(9) |
|
|
— |
|
|
|
— |
|
|
|
— |
|
|
|
— |
|
|
|
— |
|
|
|
— |
|
|
|
— |
|
|
|
— |
|
|
|
— |
|
|
Total adjustments to adjusted EBITDA margin % |
|
|
10.2 |
% |
|
|
3.0 |
% |
|
|
13.2 |
% |
|
|
2.1 |
% |
|
|
0.3 |
% |
|
|
2.4 |
% |
|
|
3.9 |
% |
|
|
1.7 |
% |
|
|
5.6 |
% |
|
(1) |
“Share-based compensation” represents granted share-based compensation in the form of Class C Common Units (which are incentive units) of AssetMark Holdings LLC, our former parent company, and RSA, restricted stock unit and stock option grants by us to certain of our directors and employees. Although this expense occurred in each measurement period, we have added the expense back in our calculation of adjusted EBITDA because of its noncash impact. |
|
(2) |
“IPO readiness” includes professional fees related to our preparation for becoming a public company. These expenses primarily include services for financial and human resources systems implementation, executive compensation assessments and other consulting services. Although these expenses occurred in both 2018 and 2019, these expenses are nonrecurring as they are limited to our public-company readiness preparation and do not include ongoing public-company compliance costs. |
|
(3) |
“Reorganization and integration costs” includes costs related to our functional reorganization within our Operations, Technology and Retirement functions as well as duplicate costs related to the outsourcing of back-office operations functions. While we have incurred such expenses in all periods measured, these expenses serve varied reorganization and integration initiatives, each of which is non-recurring. We do not consider these expenses to be part of our core operations. |
|
(4) |
“Acquisition expenses” includes employee severance, transition and retention expenses, duplicative general and administrative expenses and other professional fees related to acquisitions. |
|
(5) |
“Debt acquisition cost write-down” represents capitalized debt issuance costs extinguished due to the partial repayment of $125 million of the Company’s outstanding indebtedness under the Term Loan. The repayment was considered a substantial modification and the debt was considered partially extinguished. |
|
(6) |
“Strategic initiatives” includes costs related to one-time investments for exploratory work regarding potential business opportunities in 2017. These strategic initiatives were part of the initial strategic review performed by HTSC in late 2016. These costs included research into such areas as RIA expansion, international products, retirement products and cash solutions. Such costs were non-recurring. |
|
(7) |
“Settlement costs related to a non-routine legal dispute” are costs related to the settlement of an unusual legal dispute with a technology vendor. We consider the settlement nonrecurring. |
|
(8) |
“Retention bonus related to our 2016 sale to HTSC” includes retention incentives paid to certain of our directors as an incentive to retain their services after HTSC acquired our company in 2016. This expense was a one-time incentive provided by HTSC to such directors. |
|
(9) |
“Transition services payment for 2015 acquisition” represents a 2017 expense related to a final payment pursuant to a one-time transition services agreement and is therefore nonrecurring. |
Adjusted Net Income
Adjusted net income represents net income before: (a) share-based compensation expense, (b) amortization of acquisition-related intangible assets, (c) acquisition and related integration expenses, (d) restructuring and conversion costs and (e) certain other expenses. Reconciled items are tax effected using the income tax rates in effect for the applicable period, adjusted for any potentially non-deductible amounts. We prepared adjusted net income to eliminate the effects of items that we do not consider indicative of our core operating performance. We have historically not used adjusted net income for internal management reporting and evaluation purposes; however, we believe that adjusted net income, viewed in addition to, and not in lieu of, our reported GAAP results, provides useful information to investors regarding our performance and overall results of operations for various reasons, including the following:
|
|
• |
non-cash equity grants made to employees at a certain price and point in time do not necessarily reflect how our business is performing at any particular time; as such, share-based compensation expense is not a key measure of our operating performance; |
|
|
• |
costs associated with acquisitions and related integrations, debt refinancing, restructuring and conversions can vary from period to period and transaction to transaction; as such, expenses associated with these activities are not considered a key measure of our operating performance; and |
|
|
• |
amortization expenses can vary substantially from company to company and from period to period depending upon each company’s financing and accounting methods, the fair value and average expected life of acquired intangible assets and |
42
|
|
the method by which assets were acquired; as such, the amortization of intangible assets obtained in acquisitions is not considered a key measure of our operating performance. |
Adjusted net income does not purport to be an alternative to net income (loss) or cash flows from operating activities. The term adjusted net income is not defined under GAAP, and adjusted net income is not a measure of net income (loss), operating income or any other performance or liquidity measure derived in accordance with GAAP. Therefore, adjusted net income has limitations as an analytical tool and should not be considered in isolation to, or as a substitute for, analysis of our results as reported under GAAP. Some of these limitations are:
|
|
• |
adjusted net income does not reflect all cash expenditures, future requirements for capital expenditures or contractual commitments; |
|
|
• |
adjusted net income does not reflect changes in, or cash requirements for, working capital needs; and |
|
|
• |
other companies in the financial services industry may calculate adjusted net income differently than we do, limiting its usefulness as a comparative measure. |
Set forth below is a reconciliation from net income (loss), the most directly comparable GAAP financial measure, to adjusted net income for the fiscal years ended December 31, 2019, 2018 and 2017.
|
|
|
Year Ended December 31, 2019 |
|
|
Year Ended December 31, 2018 |
|
|
Year Ended December 31, 2017 |
|
|||||||||||||||||||||||||||
|
(in thousands) |
|
Compensation |
|
|
Non- Compensation |
|
|
Total |
|
|
Compensation |
|
|
Non- Compensation |
|
|
Total |
|
|
Compensation |
|
|
Non- Compensation |
|
|
Total |
|
|||||||||
|
Net income (loss) |
|
|
|
|
|
|
|
|
|
$ |
(420 |
) |
|
|
|
|
|
|
|
|
|
$ |
37,426 |
|
|
|
|
|
|
|
|
|
|
$ |
98,978 |
|
|
Tax adjustments(1) |
|
|
— |
|
|
|
— |
|
|
|
— |
|
|
|
— |
|
|
|
— |
|
|
|
— |
|
|
|
— |
|
|
$ |
(90,055 |
) |
|
|
(90,055 |
) |
|
Acquisition-related amortization(2) |
|
|
— |
|
|
$ |
20,432 |
|
|
|
20,432 |
|
|
|
— |
|
|
$ |
20,432 |
|
|
|
20,432 |
|
|
|
— |
|
|
|
20,432 |
|
|
|
20,432 |
|
|
Expense adjustments(3) |
|
$ |
6,243 |
|
|
|
12,423 |
|
|
|
18,666 |
|
|
$ |
1,047 |
|
|
|
1,174 |
|
|
|
2,221 |
|
|
$ |
4,684 |
|
|
|
5,219 |
|
|
|
9,903 |
|
|
Share-based compensation |
|
|
36,202 |
|
|
|
— |
|
|
|
36,202 |
|
|
|
6,568 |
|
|
|
— |
|
|
|
6,568 |
|
|
|
6,920 |
|
|
|
— |
|
|
|
6,920 |
|
|
Tax effect of adjustments(4) |
|
|
(1,623 |
) |
|
|
(7,142 |
) |
|
|
(8,765 |
) |
|
|
(272 |
) |
|
|
(5,617 |
) |
|
|
(5,889 |
) |
|
|
(1,827 |
) |
|
|
(10,004 |
) |
|
|
(11,831 |
) |
|
Adjusted net income |
|
|
|
|
|
|
|
|
|
$ |
66,115 |
|
|
|
|
|
|
|
|
|
|
$ |
60,758 |
|
|
|
|
|
|
|
|
|
|
$ |
34,347 |
|
|
(1) |
Represents a non-recurring non-cash decrease in our deferred tax liability in connection with the lower federal tax rate attributable to the Tax Cuts and Jobs Act of 2017. |
|
(2) |
Relates to intangible assets established in connection with HTSC’s acquisition of our Company in 2016. |
|
(3) |
Consists of the adjustments to EBITDA listed in the adjusted EBITDA reconciliation table above other than share-based compensation. |
|
(4) |
Reflects the tax impact of expense adjustments and acquisition-related amortization, as well as discrete tax adjustments unrelated to current-year earnings. |
Components of Results of Operations
Revenue
Asset-Based Revenue
A majority of our revenue is derived from the fees we charge as a percentage of platform assets. We record this revenue as asset-based revenue. Our asset-based revenue varies based on the types of investment solutions and services that financial advisers utilize for their clients. Asset-based revenue accounted for approximately 90.4%, 93.0% and 95.8% of our total revenue for the years ended December 31, 2019, 2018 and 2017, respectively.
Spread-Based Revenue
Our spread-based revenue consists of the fees we earn on cash custodied at ATC, one of our wholly owned subsidiaries and one of several custodians offered on our platform. ATC utilizes third-party banks to place and hold client cash and is paid interest-rate-sensitive fees calculated by reference to such deposits.
Other Revenue
Other revenue consists primarily of interest earned on operating cash held by us. Other one-time income items are reported under “Other Revenue,” as discussed elsewhere in this section.
Operating Expenses
Asset-Based Expenses
Asset-based expenses primarily relate to costs incurred directly from the generation of asset-based revenue, including strategist, investment manager and sub-advisory fees, custody fees paid to our third-party custodian partners, payments to our broker-dealer
43
partners and business development allowance payments for our premier advisers. These expenses are typically calculated based upon a percentage of the market value of assets held in customer accounts measured as of the end of each fiscal quarter.
Spread-Based Expenses
Our spread-based expenses consist of expenses paid to ATC’s third-party administrator for administering ATC’s insured cash deposit program and interest payments to clients.
Employee Compensation
Employment and compensation expenses include salaries, commissions, non-cash share-based compensation, profit sharing, benefits and employer-related taxes. We expect that the majority of any increase in employee and compensation expenses in the next 12 months will arise in connection with additional non-cash share-based compensation and increased headcount to support our growth strategy.
General and Operating Expenses
General and operating expenses include occupancy expenses and expenses relating to trading, events, communications services, research and data services, website and systems development, marketing, legal services and travel and entertainment. We expect general and operating expenses to increase in absolute dollars in future periods as a result of increased costs associated with being a publicly traded company, including significant increased legal and accounting costs related to compliance with rules and regulations implemented by the SEC and the New York Stock Exchange (the “NYSE”), as well as additional insurance, investor relations and other costs associated with being a public company.
Professional Fees
Professional fee expenses primarily relate to the fees we pay to the third-party administrator of AssetMark Retirement Services, Inc., our wholly owned subsidiary that operates our retirement business, as well as fees associated with the outsourcing of administrative operations functions, audit costs and expenses related to being a publicly traded company.
Depreciation and Amortization
Amortization expense reflects the amortization of our intangible technology assets and our other assets such as trade names, broker-dealer licenses and ATC regulatory status, from the fair value established at the date of our sale to Huatai Securities Co., Ltd. (“HTSC”) in 2016. Depreciation expense reflects the ongoing cost of annual usage of property and equipment.
Other Income
Other income consists of unrealized net gains from investment securities.
Interest Expense
Interest expense reflects the interest we pay on our Term Loan, which may fluctuate over time.
Other Expense
Other expense represents capitalized debt issuance costs extinguished due to our partial repayment of $125 million of our outstanding indebtedness under the Term Loan.
44
Results of Operations
Year Ended December 31, 2019 Compared to Year Ended December 31, 2018
The following discussion presents an analysis of our results of operations for the years ended December 31, 2019 and 2018. Where appropriate, we have identified specific events and changes that affect comparability or trends and, where possible and practical, have quantified the impact of such items.
|
|
|
Year Ended December 31, |
|
|
|
|
|
|
|
|
|
|||||
|
(in thousands) |
|
2019 |
|
|
2018 |
|
|
$ Change |
|
|
% Change |
|
||||
|
Revenue: |
|
|
|
|
|
|
|
|
|
|
|
|
|
|
|
|
|
Asset-based revenue |
|
$ |
377,718 |
|
|
$ |
338,031 |
|
|
$ |
39,687 |
|
|
|
11.7 |
|
|
Spread-based revenue |
|
|
34,586 |
|
|
|
20,403 |
|
|
|
14,183 |
|
|
|
69.5 |
|
|
Other revenue |
|
|
5,632 |
|
|
|
5,200 |
|
|
|
432 |
|
|
|
8.3 |
|
|
Total revenue |
|
|
417,936 |
|
|
|
363,634 |
|
|
|
54,302 |
|
|
|
14.9 |
|
|
Operating expenses: |
|
|
|
|
|
|
|
|
|
|
|
|
|
|
|
|
|
Asset-based expenses |
|
|
125,985 |
|
|
|
116,763 |
|
|
|
9,222 |
|
|
|
7.9 |
|
|
Spread-based expenses |
|
|
5,014 |
|
|
|
1,671 |
|
|
|
3,343 |
|
|
|
200.1 |
|
|
Employee compensation |
|
|
154,999 |
|
|
|
107,091 |
|
|
|
47,908 |
|
|
|
44.7 |
|
|
General and operating expenses |
|
|
58,028 |
|
|
|
45,383 |
|
|
|
12,645 |
|
|
|
27.9 |
|
|
Professional fees |
|
|
14,084 |
|
|
|
10,139 |
|
|
|
3,945 |
|
|
|
38.9 |
|
|
Depreciation and amortization |
|
|
30,356 |
|
|
|
26,104 |
|
|
|
4,252 |
|
|
|
16.3 |
|
|
Total operating expenses |
|
|
388,466 |
|
|
|
307,151 |
|
|
|
81,315 |
|
|
|
26.5 |
|
|
Other income |
|
|
(1,089 |
) |
|
|
— |
|
|
|
(1,089 |
) |
|
* |
|
|
|
Interest expense |
|
|
12,269 |
|
|
|
1,920 |
|
|
|
10,349 |
|
|
|
539.0 |
|
|
Other expense |
|
|
3,385 |
|
|
|
— |
|
|
|
3,385 |
|
|
* |
|
|
|
Income before income taxes |
|
|
14,905 |
|
|
|
54,563 |
|
|
|
(39,658 |
) |
|
|
(72.7 |
) |
|
Provision for income taxes |
|
|
15,325 |
|
|
|
17,137 |
|
|
|
(1,812 |
) |
|
|
(10.6 |
) |
|
Net income (loss) |
|
$ |
(420 |
) |
|
$ |
37,426 |
|
|
$ |
(37,846 |
) |
|
|
(101.1 |
) |
|
Unrealized gain (loss) on available-for-sale investments, net of tax |
|
|
— |
|
|
|
(5 |
) |
|
|
5 |
|
|
* |
|
|
|
Net comprehensive income (loss) |
|
$ |
(420 |
) |
|
$ |
37,421 |
|
|
$ |
(37,841 |
) |
|
|
(101.1 |
) |
|
* |
Not meaningful. |
Asset-Based Revenue
Asset-based revenue increased by $39.7 million, or 11.7%, from $338.0 million in the year ended December 31, 2018 to $377.7 million in the year ended December 31, 2019. This increase was primarily related to increased platform fees and advisory fees of $37.7 million associated with growth in platform assets, primarily driven by positive net flows and strong market conditions. The remaining increase primarily related to higher custodial revenue driven by increased administrative service fees due to growth in mutual fund assets on our platform.
Spread-Based Revenue
Spread-based revenue increased by $14.2 million, or 69.5%, from $20.4 million in the year ended December 31, 2018 to $34.6 million in the year ended December 31, 2019. This increase was primarily due to higher cash balances held at ATC and increased interest rates on cash invested through ATC’s insured cash deposit program.
Other revenue increased by $0.4 million, or 8.3%, for the year ended December 31, 2019 compared to the year ended December 31, 2018. This increase was primarily related to higher fees collected at ATC.
Asset-Based Expenses
Asset-based expenses increased by $9.2 million, or 7.9%, from $116.8 million in the year ended December 31, 2018 to $126.0 million in the year ended December 31, 2019. This increase was primarily related to increased strategist, investment management and sub-adviser expenses of $7.1 million, due to growth in platform assets. We also experienced an increase in asset-based broker-dealer payments of $2.1 million driven by growth in platform assets.
45
Spread-Based Expenses
Spread-based expenses increased by $3.3 million, or 200.1%, from $1.7 million in the year ended December 31, 2018 to $5.0 million in the year ended December 31, 2019. This increase was due to $3.0 million in additional interest-credited payments to clients driven by higher cash balances at ATC and the introduction of ATC’s high yield cash product in 2019. The remaining increase was due to increased expenses paid to ATC’s third-party administrator related to ATC’s insured cash deposit program.
Employee Compensation
Employee compensation increased by $47.9 million, or 44.7%, from $107.1 million in the year ended December 31, 2018 to $155.0 million in the year ended December 31, 2019. This increase was due primarily to a $29.6 million increase in share-based compensation as a result of the growth in the valuation of our business and our issuance of RSAs immediately following the pricing of our IPO. The increase in employee compensation was also due to a $19.4 million increase in salaries and related expenses on account of our increased associate headcount to support our ongoing growth.
General and Operating Expenses
General and operating expenses increased by $12.6 million, or 27.9%, from $45.4 million in the year ended December 31, 2018 to $58.0 million in the year ended December 31, 2019. This increase was primarily due to $4.5 million in GFPC-related costs that will continue until we transition GFPC assets to our platform, and a $1.9 million increase in expenses related to our preparation for becoming a public company. The remaining increase in general and operating expenses was driven primarily by $1.6 million in higher events spend, primarily attributed to the timing of broker-dealer sponsorships, $1.4 million in higher subscription costs, $1.0 million in higher facilities costs, $0.9 million in higher trading cost and $0.6 million in higher software and hardware expenses. The remaining increase was attributed to higher travel costs and phone and data expenses.
Professional Fees
Professional fees increased by $3.9 million, or 38.9%, from $10.1 million in the year ended December 31, 2018 to $14.1 million in the year ended December 31, 2019. This increase was due in part to $1.9 million in GFPC-related costs and $0.9 million in costs related to our preparation for becoming a public company. The remaining increase was primarily due to higher consulting fees.
Depreciation and Amortization Expense
Depreciation and amortization expense increased by $4.2 million, or 16.3%, from $26.1 million in the year ended December 31, 2018 to $30.4 million in the year ended December 31, 2019. This increase was due in part to $0.7 million of amortization expense related to intangible assets established in connection with the GFPC acquisition. The remaining increase was related to incremental assets placed in service during 2018 and 2019. When HTSC acquired us on October 31, 2016, all intangible assets were adjusted to fair value, and those assets with definite lives commenced amortization schedules ranging from 3- to 20-years. Because fewer than four years had elapsed since the acquisition in late 2016, we experienced minimal fully amortized asset run-off in 2018 and 2019 with which to offset the incremental assets recently placed in service.
Other Income
Other income increased by $1.1 million from $0 in the year ended December 31, 2018 to $1.1 million in the year ended December 31, 2019. In 2015, we created a rabbi trust to support our deferred compensation plan; certain employees may elect to defer their compensation by contributing it to the rabbi trust for investment. In 2019, the Company recognized $1.1 million of unrealized gains related to employee investments in the rabbi trust, which gains are directly offset by deferred compensation expense recorded in other expense.
Interest Expense
Interest expense increased by $10.3 million, or 539.0%, from $1.9 million in the year ended December 31, 2018 to $12.3 million in the year ended December 31, 2019. This increase was related to the interest we paid on our Credit Facility issued in November 2018. Because we entered into our Credit Facility in November 2018, we incurred interest expense only in November and December of that year, as opposed to all twelve months in 2019.
Other Expense
Other expenses increased by $3.4 million from $0 in the year ended December 31, 2018 to $3.4 million in the year ended December 31, 2019. This increase was due to debt modification expenses of $2.3 million related to the $125 million long-term debt payment we made in July 2019 and $1.1 million of expenses related to the market appreciation of our deferred compensation plan.
46
Provision for Income Taxes
Provision for income taxes decreased by $1.8 million, or 10.6%, from $17.1 million in the year ended December 31, 2018 to $15.3 million in the year ended December 31, 2019. This decrease was due to the decrease in our income before income taxes and was offset in part by an increase in share-based compensation, which is not deductible for tax purposes, the effect of the limitations on the executive compensation tax deduction and the effect of discrete items unrelated to our current-year business operations.
Net Comprehensive Income (Loss)
Net comprehensive income decreased by $37.8 million, or 101.1%, from net income of $37.4 million in the year ended December 31, 2018 to a net loss of $0.4 million in the year ended December 31, 2019, despite a $54.3 million increase in total revenue over the same period. This decrease in net comprehensive income was due to increased expenses incurred in the year ended December 31, 2019, including (i) a $29.6 million increase in the carrying value of share-based compensation expenses attributed to the growth in our valuation, (ii) a $14.2 million increase in non-recurring costs related to IPO readiness and the GFPC acquisition and integration, (iii) $10.3 million in interest expense incurred in the year ended December 31, 2019 resulting from our drawdown on our Credit Facility to make a one-time distribution to AssetMark Holdings LLC and (iv) an increase in our effective tax rate from 31.4% in the year ended December 31, 2018 to 102.8% in the year ended December 31, 2019, primarily due to the fact that share-based compensation is not tax deductible, which resulted in our tax expenses remaining relatively constant over the same period despite lower pre-tax income in the year ended December 31, 2019.
Year Ended December 31, 2018 Compared to Year Ended December 31, 2017
The following discussion presents an analysis of our results of operations for the years ended December 31, 2018 and 2017. Where appropriate, we have identified specific events and changes that affect comparability or trends and, where possible and practical, have quantified the impact of such items.
|
|
|
Year Ended December 31, |
|
|
|
|
|
|
|
|
|
|||||
|
(in thousands) |
|
2018 |
|
|
2017 |
|
|
$ Change |
|
|
% Change |
|
||||
|
Revenue: |
|
|
|
|
|
|
|
|
|
|
|
|
|
|
|
|
|
Asset-based revenue |
|
$ |
338,031 |
|
|
$ |
282,966 |
|
|
$ |
55,065 |
|
|
|
19.5 |
|
|
Spread-based revenue |
|
|
20,403 |
|
|
|
10,430 |
|
|
|
9,973 |
|
|
|
95.6 |
|
|
Other revenue |
|
|
5,200 |
|
|
|
2,121 |
|
|
|
3,079 |
|
|
|
145.2 |
|
|
Total revenue |
|
|
363,634 |
|
|
|
295,517 |
|
|
|
68,117 |
|
|
|
23.1 |
|
|
Operating expenses: |
|
|
|
|
|
|
|
|
|
|
|
|
|
|
|
|
|
Asset-based expenses |
|
|
116,763 |
|
|
|
98,401 |
|
|
|
18,362 |
|
|
|
18.7 |
|
|
Spread-based expenses |
|
|
1,671 |
|
|
|
976 |
|
|
|
695 |
|
|
|
71.2 |
|
|
Employee compensation |
|
|
107,091 |
|
|
|
105,413 |
|
|
|
1,678 |
|
|
|
1.6 |
|
|
General and operating expenses |
|
|
45,383 |
|
|
|
38,781 |
|
|
|
6,602 |
|
|
|
17.0 |
|
|
Professional fees |
|
|
10,139 |
|
|
|
9,622 |
|
|
|
517 |
|
|
|
5.4 |
|
|
Depreciation and amortization |
|
|
26,104 |
|
|
|
22,981 |
|
|
|
3,123 |
|
|
|
13.6 |
|
|
Total operating expenses |
|
|
307,151 |
|
|
|
276,174 |
|
|
|
30,977 |
|
|
|
11.9 |
|
|
Interest expense |
|
|
1,920 |
|
|
|
— |
|
|
|
1,920 |
|
|
* |
|
|
|
Income before income taxes |
|
|
54,563 |
|
|
|
19,343 |
|
|
|
35,220 |
|
|
|
182.1 |
|
|
Provision for (benefit from) income taxes |
|
|
17,137 |
|
|
|
(79,635 |
) |
|
|
96,772 |
|
|
|
121.5 |
|
|
Net income |
|
$ |
37,426 |
|
|
$ |
98,978 |
|
|
$ |
(61,552 |
) |
|
|
(62.2 |
) |
|
Unrealized gain (loss) on available-for-sale investments, net of tax |
|
|
(5 |
) |
|
|
8 |
|
|
|
(13 |
) |
|
|
(162.5 |
) |
|
Net comprehensive income |
|
$ |
37,421 |
|
|
$ |
98,986 |
|
|
$ |
(61,565 |
) |
|
|
(62.2 |
) |
|
* |
Not meaningful. |
Asset-Based Revenue
Asset-based revenue increased by $55.1 million, or 19.5%, from $283.0 million in the year ended December 31, 2017 to $338.0 million in the year ended December 31, 2018. This increase was primarily due to increased platform fees of $50.8 million associated with growth in platform assets, primarily driven by positive net flows and strong market conditions. Administrative service fees also increased by $4.4 million due to growth in mutual fund assets on our platform.
47
Spread-Based Revenue
Spread-based revenue increased by $10.0 million, or 95.6%, from $10.4 million in the year ended December 31, 2017 to $20.4 million in the year ended December 31, 2018. This increase was primarily due to higher cash balances held at ATC and increased interest rates on cash invested through ATC’s insured cash deposit program.
Other Revenue
Other revenue increased by $3.1 million, or 145.2%, from $2.1 million in the year ended December 31, 2017 to $5.2 million in the year ended December 31, 2018. This increase was primarily due to an increase in interest income of $2.2 million attributable to higher interest rates and higher cash balances generated from our operating activities and the establishment of a receivable from a settled legal matter.
Asset-Based Expenses
Asset-based expenses increased by $18.4 million, or 18.7%, from $98.4 million in the year ended December 31, 2017 to $116.8 million in the year ended December 31, 2018. This increase was primarily due to a $16.0 million increase in strategist and investment management fees attributed to growth in platform assets, a $2.0 million increase in asset-based broker-dealer payments driven by growth in platform assets, a $0.7 million increase in sub-adviser fees associated with the expansion of our proprietary mutual funds and a $0.5 million increase in business development expenses due to growth in our largest platform advisers, partially offset by lower custody fees from improved negotiated rates with third-party custodians.
Spread-Based Expenses
Spread-based expenses increased by $0.7 million, or 71.2%, from $1.0 million in the year ended December 31, 2017 to $1.7 million in the year ended December 31, 2018. This increase was primarily due to increased expenses paid to ATC’s third-party administrator for ATC’s insured cash deposit program attributable to increased interest rates and higher cash balances at ATC.
Employee Compensation
Employee compensation increased by $1.7 million, or 1.6%, from $105.4 million in the year ended December 31, 2017 to $107.1 million in the year ended December 31, 2018. This increase was primarily due to a $7.3 million increase in salaries and related expenses from an increased associate headcount to support our ongoing growth, and was offset in part by (i) a $2.3 million decrease in sales incentive compensation expense in the year ended December 31, 2018 as a result of sales in the year ended December 31, 2017 exceeding projections, requiring higher incentive compensation payouts in 2017; (ii) a $2.8 million decrease in contractor liability costs in the year ended December 31, 2018; (iii) $1.2 million in retention bonuses related to our sale to HTSC in 2016 that we incurred in 2017; and (iv) a $0.4 million decrease in share-based compensation expense from the year ended December 31, 2017 to the year ended December 31, 2018. The remainder of the increase in employee compensation expense from the year ended December 31, 2017 to the year ended December 31, 2018 was related to $0.8 million in higher variable compensation expense in 2018 related to the performance of our business and $0.2 million related to higher overall employee headcount and lower capitalization of employee compensation expense.
General and Operating Expenses
General and operating expenses increased by $6.6 million, or 17.0%, from $38.8 million in the year ended December 31, 2017 to $45.4 million in the year ended December 31, 2018. This increase was primarily due to a $2.5 million increase in expenses related to events for our top advisers and higher travel expenses, a $2.1 million increase in subscription-based software expenditures and a $2.2 million increase in legal fees associated with actual and prospective mergers and acquisitions activity, strategic projects and preparation for becoming a public company.
Professional Fees
Professional fee expenses increased by $0.5 million, or 5.4%, from $9.6 million in the year ended December 31, 2017 to $10.1 million in the year ended December 31, 2018. This increase was attributed primarily to $1.1 million related to the outsourcing of certain back-end operations functions, a $0.7 million increase in third-party administrator fees related to our retirement business and $0.7 million in increased audit costs and costs associated with platform enhancements made within our investments, marketing and technology functions, partially offset by a decrease of $2.0 million in settlement costs related to non-routine litigation incurred in 2017.
48
Depreciation and Amortization Expense
Depreciation and amortization expense increased by $3.1 million, or 13.6%, from $23.0 million in the year ended December 31, 2017 to $26.1 million in the year ended December 31, 2018. This increase was primarily due to incremental assets placed in service during 2017 and 2018. When HTSC acquired us on October 31, 2016, all intangible assets were adjusted to fair value, and those assets with definite lives commenced amortization schedules ranging from 3- to 20-years. Because fewer than three years had elapsed since the acquisition in late 2016, we experienced minimal fully amortized asset run-off in 2017 and 2018 with which to offset the incremental assets recently placed in service.
Interest Expense
Interest expense increased by $1.9 million, from $0 in the year ended December 31, 2017 to $1.9 million in the year ended December 31, 2018. This increase was related to the interest we paid on our Credit Facility issued in November 2018. Because our Credit Facility was issued in 2018, we incurred no interest expense in 2017.
Provision for Income Taxes
Provision for income taxes increased by $96.8 million in the year ended December 31, 2018 compared to the year ended December 31, 2017. Our tax expense for the year ended December 31, 2017 included a $90.1 million decrease in our deferred tax liability in connection with the lower federal tax rate attributable to the Tax Cuts and Jobs Act of 2017, which did not recur in the year ended December 31, 2018. The remaining increase was related to higher pre-tax income in the year ended December 31, 2018 compared to the prior year.
Other Comprehensive Income
Other comprehensive income decreased $13 thousand for the year ended December 31, 2018 compared to the year ended December 31, 2017. This decrease was related to the fair market valuation of our available-for-sale investments related to seed funding of certain proprietary funds that we established.
Net Comprehensive Income
Net comprehensive income decreased by $61.6 million, or 62.2%, from $99.0 million in the year ended December 31, 2017 to $37.4 million in the year ended December 31, 2018, despite a $68.1 million increase in total revenue over the same period. This decrease in net comprehensive income was due to a $90.1 million decrease in our deferred tax liabilities, and increased expenses incurred in the year ended December 31, 2018, including (i) a $18.4 million increase in asset-based expenses related to the growth of our business, (ii) a $6.6 million increase in general and operating expenses related to the growth of our business and non-recurring costs related to legal fees for strategic projects, IPO readiness and the GFPC acquisition, and (iii) a $3.1 million increase in depreciation and amortization expense due to incremental assets placed in service during 2017 and 2018.
49
Quarterly Results of Operations
The following tables set forth our unaudited quarterly statements of income data for each of the periods presented, as well as the percentage of revenue that each line item represents for the applicable quarter. The information for each quarter has been prepared on a basis consistent with our audited financial statements included elsewhere in this Annual Report on Form 10-K, and reflect, in the opinion of management, all adjustments of a normal, recurring nature that are necessary for a fair presentation of the financial information contained in those statements. Our historical results are not necessarily indicative of the results that may be expected in the future. The following quarterly financial data should be read in conjunction with our audited financial statements included elsewhere in this Annual Report on Form 10-K. The sum of the quarterly amounts in the tables below may not agree to the annual amounts presented elsewhere in this prospectus due to rounding.
Quarterly Consolidated Statements of Income (Unaudited)
|
|
|
Three Months Ended |
|
|||||||||||||||||||||||||||||
|
(in thousands) |
|
Mar. 31, 2019 |
|
|
Jun. 30, 2019 |
|
|
Sept. 30, 2019 |
|
|
Dec. 31, 2019 |
|
|
Mar. 31, 2018 |
|
|
Jun. 30, 2018 |
|
|
Sept. 30, 2018 |
|
|
Dec. 31, 2018 |
|
||||||||
|
Revenue: |
|
|
|
|
|
|
|
|
|
|
|
|
|
|
|
|
|
|
|
|
|
|
|
|
|
|
|
|
|
|
|
|
|
Asset-based revenue |
|
$ |
83,063 |
|
|
$ |
94,273 |
|
|
$ |
99,211 |
|
|
$ |
101,171 |
|
|
$ |
79,076 |
|
|
$ |
83,234 |
|
|
$ |
86,513 |
|
|
$ |
89,208 |
|
|
Spread-based revenue |
|
|
7,549 |
|
|
|
8,810 |
|
|
|
9,638 |
|
|
|
8,589 |
|
|
|
3,749 |
|
|
|
4,734 |
|
|
|
5,405 |
|
|
|
6,515 |
|
|
Other revenue |
|
|
1,702 |
|
|
|
1,400 |
|
|
|
1,282 |
|
|
|
1,248 |
|
|
|
1,708 |
|
|
|
809 |
|
|
|
994 |
|
|
|
1,689 |
|
|
Total revenue |
|
|
92,314 |
|
|
|
104,483 |
|
|
|
110,131 |
|
|
|
111,008 |
|
|
|
84,533 |
|
|
|
88,777 |
|
|
|
92,912 |
|
|
|
97,412 |
|
|
Operating expenses: |
|
|
|
|
|
|
|
|
|
|
|
|
|
|
|
|
|
|
|
|
|
|
|
|
|
|
|
|
|
|
|
|
|
Asset-based expenses |
|
|
28,102 |
|
|
|
31,625 |
|
|
|
33,532 |
|
|
|
32,726 |
|
|
|
26,805 |
|
|
|
28,719 |
|
|
|
29,535 |
|
|
|
31,704 |
|
|
Spread-based expenses |
|
|
478 |
|
|
|
1,595 |
|
|
|
1,556 |
|
|
|
1,385 |
|
|
|
361 |
|
|
|
444 |
|
|
|
422 |
|
|
|
444 |
|
|
Employee compensation |
|
|
31,885 |
|
|
|
35,489 |
|
|
|
42,054 |
|
|
|
45,571 |
|
|
|
24,740 |
|
|
|
26,663 |
|
|
|
27,515 |
|
|
|
28,173 |
|
|
General and operating expenses |
|
|
12,292 |
|
|
|
13,135 |
|
|
|
16,028 |
|
|
|
16,573 |
|
|
|
10,651 |
|
|
|
10,602 |
|
|
|
11,238 |
|
|
|
12,892 |
|
|
Professional fees |
|
|
2,386 |
|
|
|
4,469 |
|
|
|
3,723 |
|
|
|
3,506 |
|
|
|
2,276 |
|
|
|
2,049 |
|
|
|
2,341 |
|
|
|
3,473 |
|
|
Depreciation and amortization |
|
|
6,896 |
|
|
|
7,613 |
|
|
|
7,523 |
|
|
|
8,324 |
|
|
|
6,037 |
|
|
|
6,698 |
|
|
|
6,564 |
|
|
|
6,805 |
|
|
Total operating expenses |
|
|
82,039 |
|
|
|
93,926 |
|
|
|
104,416 |
|
|
|
108,085 |
|
|
|
70,870 |
|
|
|
75,175 |
|
|
|
77,615 |
|
|
|
83,491 |
|
|
Other income |
|
|
— |
|
|
|
— |
|
|
|
— |
|
|
|
(1,089 |
) |
|
|
— |
|
|
|
— |
|
|
|
— |
|
|
|
— |
|
|
Interest expense |
|
|
4,024 |
|
|
|
4,031 |
|
|
|
2,512 |
|
|
|
1,702 |
|
|
|
— |
|
|
|
— |
|
|
|
— |
|
|
|
1,920 |
|
|
Other expense |
|
|
— |
|
|
|
— |
|
|
|
2,296 |
|
|
|
1,089 |
|
|
|
— |
|
|
|
— |
|
|
|
— |
|
|
|
— |
|
|
Income before income taxes |
|
|
6,251 |
|
|
|
6,526 |
|
|
|
907 |
|
|
|
1,221 |
|
|
|
13,663 |
|
|
|
13,602 |
|
|
|
15,297 |
|
|
|
12,001 |
|
|
Provision for income taxes |
|
|
3,440 |
|
|
|
3,289 |
|
|
|
4,635 |
|
|
|
3,961 |
|
|
|
3,872 |
|
|
|
4,337 |
|
|
|
4,943 |
|
|
|
3,985 |
|
|
Net income (loss) |
|
$ |
2,811 |
|
|
$ |
3,237 |
|
|
$ |
(3,728 |
) |
|
$ |
(2,740 |
) |
|
$ |
9,791 |
|
|
$ |
9,265 |
|
|
$ |
10,354 |
|
|
$ |
8,016 |
|
|
Net income (loss) per share attributable to common shareholder: |
|
|
|
|
|
|
|
|
|
|
|
|
|
|
|
|
|
|
|
|
|
|
|
|
|
|
|
|
|
|
|
|
|
Basic |
|
|
0.04 |
|
|
|
0.05 |
|
|
|
(0.05 |
) |
|
|
(0.04 |
) |
|
|
0.15 |
|
|
|
0.14 |
|
|
|
0.16 |
|
|
|
0.12 |
|
|
Diluted |
|
|
0.04 |
|
|
|
0.05 |
|
|
|
(0.05 |
) |
|
|
(0.04 |
) |
|
|
0.15 |
|
|
|
0.14 |
|
|
|
0.16 |
|
|
|
0.12 |
|
50
Percentage of Revenue Data (Unaudited)
|
|
|
Three Months Ended |
|
|||||||||||||||||||||||||||||||
|
|
|
Mar. 31, 2019 |
|
|
Jun. 30, 2019 |
|
|
Sept. 30, 2019 |
|
|
Dec. 31, 2019 |
|
|
Mar. 31, 2018 |
|
|
Jun. 30, 2018 |
|
|
Sept. 30, 2018 |
|
|
Dec. 31, 2018 |
|
||||||||||
|
Revenue: |
|
|
|
|
|
|
|
|
|
|
|
|
|
|
|
|
|
|
|
|
|
|
|
|
|
|
|
|
|
|
|
|
||
|
Asset-based revenue |
|
|
90 |
% |
|
|
90 |
% |
|
|
90 |
% |
|
|
91 |
% |
|
|
94 |
% |
|
|
94 |
% |
|
|
93 |
% |
|
|
92 |
% |
||
|
Spread-based revenue |
|
|
8 |
|
|
|
9 |
|
|
|
9 |
|
|
|
8 |
|
|
|
4 |
|
|
|
5 |
|
|
|
6 |
|
|
|
7 |
|
||
|
Other revenue |
|
|
2 |
|
|
|
1 |
|
|
|
1 |
|
|
|
1 |
|
|
|
2 |
|
|
|
1 |
|
|
|
1 |
|
|
|
1 |
|
||
|
Total revenue |
|
|
100 |
|
|
|
100 |
|
|
|
100 |
|
|
|
100 |
|
|
|
100 |
|
|
|
100 |
|
|
|
100 |
|
|
|
100 |
|
||
|
Operating expenses: |
|
|
|
|
|
|
|
|
|
|
|
|
|
|
|
|
|
|
|
|
|
|
|
|
|
|
|
|
|
|
|
|
||
|
Asset-based expenses |
|
|
30 |
|
|
|
30 |
|
|
|
30 |
|
|
|
30 |
|
|
|
32 |
|
|
|
32 |
|
|
|
32 |
|
|
|
33 |
|
||
|
Spread-based expenses |
|
|
1 |
|
|
|
2 |
|
|
|
1 |
|
|
|
1 |
|
|
|
— |
|
|
|
1 |
|
|
|
— |
|
|
|
— |
|
||
|
Employee compensation |
|
|
35 |
|
|
|
34 |
|
|
|
38 |
|
|
|
41 |
|
|
|
29 |
|
|
|
30 |
|
|
|
30 |
|
|
|
29 |
|
||
|
General and operating expenses |
|
|
13 |
|
|
|
13 |
|
|
|
15 |
|
|
|
15 |
|
|
|
13 |
|
|
|
12 |
|
|
|
12 |
|
|
|
13 |
|
||
|
Professional fees |
|
|
3 |
|
|
|
4 |
|
|
|
4 |
|
|
|
3 |
|
|
|
3 |
|
|
|
2 |
|
|
|
3 |
|
|
|
4 |
|
||
|
Depreciation and amortization |
|
|
7 |
|
|
|
7 |
|
|
|
7 |
|
|
|
7 |
|
|
|
7 |
|
|
|
8 |
|
|
|
7 |
|
|
|
7 |
|
||
|
Total operating expenses |
|
|
89 |
|
|
|
90 |
|
|
|
95 |
|
|
|
97 |
|
|
|
84 |
|
|
|
85 |
|
|
|
84 |
|
|
|
86 |
|
||
|
Other income |
|
|
— |
|
|
|
— |
|
|
|
— |
|
|
|
(1 |
) |
|
|
— |
|
|
|
— |
|
|
|
— |
|
|
|
— |
|
||
|
Interest expense |
|
|
4 |
|
|
|
4 |
|
|
|
2 |
|
|
|
2 |
|
|
|
— |
|
|
|
— |
|
|
|
— |
|
|
|
2 |
|
||
|
Other expense |
|
|
— |
|
|
|
— |
|
|
|
2 |
|
|
|
1 |
|
|
|
— |
|
|
|
— |
|
|
|
— |
|
|
|
— |
|
||
|
Income before income taxes |
|
|
7 |
|
|
|
6 |
|
|
|
1 |
|
|
|
1 |
|
|
|
16 |
|
|
|
15 |
|
|
|
16 |
|
|
|
12 |
|
||
|
Provision for income taxes |
|
|
4 |
|
|
|
3 |
|
|
|
4 |
|
|
|
3 |
|
|
|
4 |
|
|
|
5 |
|
|
|
5 |
|
|
|
4 |
|
||
|
Net income (loss) |
|
|
3 |
% |
|
|
3 |
% |
|
|
(3) |
% |
|
|
(2) |
% |
|
|
12 |
% |
|
|
10 |
% |
|
|
11 |
% |
|
|
8 |
% |
||
Quarterly Revenue Trends
Our quarterly revenue generally increased sequentially in each of the quarters presented due to growth in platform assets, primarily driven by positive net flows and strong market conditions.
Quarterly Operating Expense Trends
Total operating expenses generally increased sequentially for the quarters presented, primarily due to the expansion of our business. Our quarterly asset-based expenses generally increased sequentially in each of the periods presented due primarily to growth in platform assets. Employee compensation expense increased due to the addition of personnel in connection with the expansion of our business and an increase in share-based compensation as a result of the growth in the valuation of our business and our issuance of RSAs immediately following the pricing of our IPO. General and operating expenses, professional fees and depreciation and amortization expenses generally increased as a result of investments to support the growth of our business.
Quarterly Interest Expense Trends
We incurred interest expense on our $250 million Credit Facility issued in November 2019. Interest expense decreased in the quarters presented after we used the net proceeds to us from our IPO, together with cash on hand, to repay $125 million on our Term Loan in July 2019.
Quarterly Income Tax Trends
The quarterly tax provisions for 2018 and 2019 were primarily driven by our profitability and by an increase in share-based compensation, which is not deductible for tax purposes.
Liquidity and Capital Resources
Liquidity
Since 2016, our operations have been financed primarily through cash flows from operations. In November of 2018, we also established a credit facility consisting of a $250.0 million term loan and a $20.0 million revolving credit facility with Credit Suisse AG, Cayman Islands Branch (“Credit Suisse”). As of December 31, 2019, we had cash and cash equivalents of $96.3 million, and restricted cash of $9.0 million. Over the next twelve months, we expect that our cash and liquidity needs will continue to be met by cash generated by our ongoing operations as well as our credit facility. To the extent that existing cash, cash from operations and our
51
credit facility are not sufficient to fund our future operations, we may need to raise additional funds through public or private equity or additional debt financing. In addition, we may opportunistically seek to raise additional capital to fund our continued growth. To the extent that we are unsuccessful in additional debt or equity financings, our plans for continued growth may be curtailed.
Credit Facility
In November 2018, we entered into a credit agreement with Credit Suisse AG, Cayman Islands Branch, as administrative agent and collateral agent (collectively, the “Agent”), and the lenders party thereto (the “Credit Agreement”), which we amended on June 28, 2019. The Credit Agreement consists of a $250.0 million term loan (the “Term Loan”) and a $20.0 million revolving credit facility (the “Revolver,” and together with the Term Loan, collectively, the “Credit Facility”). Our obligations under the Credit Facility are guaranteed by certain of our subsidiaries and are secured by substantially all of our assets, and all of the assets of certain of our subsidiaries, subject to certain exceptions. We used the net proceeds to us from the IPO, together with cash on hand, to repay approximately $125 million of our indebtedness under the Term Loan on July 26, 2019. As of December 31, 2019, $123.7 million aggregate principal amount of the Term Loan remained outstanding and the Revolver was undrawn.
The Term Loan matures in November 2025 and requires quarterly amortization payments equal to $625,000, subject to a prepayment adjustment. The Revolver matures in November 2023 with outstanding loans thereunder payable within 364 days of the applicable drawdown date. Both the Term Loan and the Revolver bear interest at (x) the London InterBank Offered Rate (“LIBOR”) plus a margin of 3.50%, with a step down to 3.25% or (y) the Alternate Base Rate, as defined and specified in the Credit Agreement, plus a margin of 2.50%, with a step down to 2.25%, in each case based on our achievement of a specified first-lien leverage ratio. Additionally, the Term Loan’s margin was reduced by 0.25% following our IPO. With respect to the Revolver, a quarterly fee of 0.50% is due for the unused amounts thereunder with a stepdown to 0.375% based on our achievement of a specified first-lien leverage ratio. The Credit Agreement includes a process by which a successor rate to LIBOR will be determined in the event that LIBOR is no longer available in the market, whereby we and the Agent will endeavor to establish an alternative rate of interest giving consideration to the then-prevailing market conditions for syndicated loans in the United States.
The Credit Agreement contains customary affirmative and negative covenants, including reporting requirements and restrictions, subject to various exceptions, on the incurrence of additional indebtedness, the creation of liens, the making of acquisitions and investments, the disposal of assets and the making of restricted payments. Additionally, the Revolver includes a springing financial covenant, which provides that if, on the last day of a fiscal quarter, the principal amount of our revolving loans and letters of credit, subject to certain exceptions, exceeds $6.0 million, our total leverage ratio shall not exceed 4.75 to 1.00 for the fiscal quarters between March 31, 2019 and December 31, 2019 or 4.50 to 1.00 for the fiscal quarters ending on or after March 31, 2020. As of December 31, 2019, we were in compliance with all applicable covenants. The Credit Agreement also contains customary events of default, which could result in acceleration of amounts due under the Credit Facility. Such events of default include, subject to the grace periods specified therein, our failure to pay principal or interest when due, our failure to satisfy or comply with covenants, a change of control, the imposition of certain judgments and the invalidation of liens we have granted.
Cash Flows
The following table presents information regarding our cash flows, cash, cash equivalents and restricted cash for the periods indicated:
|
|
|
Year Ended December 31, |
|
|||||||||
|
(in thousands) |
|
2019 |
|
|
2018 |
|
|
2017 |
|
|||
|
Cash flow from operating activities |
|
$ |
55,083 |
|
|
$ |
61,662 |
|
|
$ |
45,612 |
|
|
Cash flow used in investing activities |
|
|
(59,914 |
) |
|
|
(17,714 |
) |
|
|
(15,652 |
) |
|
Cash flow from (used in) financing activities |
|
|
(2,182 |
) |
|
|
11,259 |
|
|
|
— |
|
|
Net change in cash, cash equivalents and restricted cash |
|
|
(7,013 |
) |
|
|
55,207 |
|
|
|
29,960 |
|
|
Cash, cash equivalents and restricted cash at beginning of period |
|
|
112,354 |
|
|
|
57,147 |
|
|
|
27,187 |
|
|
Cash, cash equivalents and restricted cash at end of period |
|
$ |
105,341 |
|
|
$ |
112,354 |
|
|
$ |
57,147 |
|
Cash Flows from Operating Activities
Cash flows from operating activities decreased by $6.6 million in the year ended December 31, 2019 compared to the year ended December 31, 2018, primarily due to a decrease in net income of $37.8 million and an increase in payables of $5.6 million. Such decreases were partially offset by adjustments to net income (loss) related to share-based compensation expense of $29.6 million, an increase in depreciation and amortization of $4.3 million and fees, an increase of $2.3 million related to a debt acquisition cost write-down, and a decrease in other receivables of $0.7 million.
52
Cash flows from operating activities increased by $16.1 million in the year ended December 31, 2018 compared to the year ended December 31, 2017, primarily due to adjustments to net income related to an increase in deferred income taxes of $90.1 million and depreciation and intangible amortization of $3.1 million. Such increases were partially offset by a decrease in net income of $61.5 million, decreases in adjustments related to the timing of payables, receivables and current income taxes of $15.6 million and a decrease in share-based compensation of $0.3 million.
Cash Flows from Investing Activities
Cash used in investing activities increased by $42.2 million in the year ended December 31, 2019 compared to the year ended December 31, 2018, primarily due to the $35.9 million purchase price for the GFPC acquisition and a $5.1 million increase in capital expenditures, partially offset by a $1.3 million decrease in purchases of investments.
Cash used in investing activities increased by $2.1 million in the year ended December 31, 2018 compared to the year ended December 31, 2017, primarily due to a $1.8 million increase in capital expenditures and $0.3 million in purchases of available-for-sale investments.
Cash Flows from Financing Activities
Cash flows from financing activities decreased by $13.4 million in the year ended December 31, 2019 compared to the year ended December 31, 2018. This decrease was primarily due to net cash outflows in 2019 of $2.2 million, which were related to our repayment of $125 million under the Term Loan, partially offset by net IPO proceeds received by us of $124.1 million, compared to net cash inflows in 2018 of $11.2 million, which were related to net proceeds received by us of $245.1 million from the Term Loan, partially offset by dividend distributions to our parent company of $233.9 million.
Cash flows from financing activities increased by $11.3 million in the year ended December 31, 2018 compared to the year ended December 31, 2017 primarily due to net proceeds received of $245.1 million from the Term Loan. The increase was partially offset by a one-time distribution to AssetMark Holdings LLC of $234 million through a $75 million dividend payment and $159 million return of capital.
Contractual Obligations
The following table describes our contractual obligations as of December 31, 2019:
|
|
|
Payments due by period |
|
|||||||||||||||||
|
(in thousands) |
|
Total |
|
|
Less than 1 year |
|
|
1-3 years |
|
|
3-5 years |
|
|
More than 5 years |
|
|||||
|
Operating lease obligations(1) |
|
$ |
45,224 |
|
|
$ |
3,267 |
|
|
$ |
16,694 |
|
|
$ |
12,050 |
|
|
$ |
13,213 |
|
|
Purchase obligations(2) |
|
|
6,426 |
|
|
|
5,009 |
|
|
|
1,417 |
|
|
|
— |
|
|
|
— |
|
|
Debt principal and interest(3) |
|
|
165,103 |
|
|
|
6,989 |
|
|
|
20,968 |
|
|
|
137,146 |
|
|
|
— |
|
|
Total contractual obligations |
|
$ |
216,753 |
|
|
$ |
15,265 |
|
|
$ |
39,079 |
|
|
$ |
149,196 |
|
|
$ |
13,213 |
|
|
(1) |
Represents minimum operating lease payments under operating leases for office facilities, excluding potential lease renewals. |
|
(2) |
Represents future minimum payments under non-cancelable purchase commitments. For those agreements with variable terms, we do not estimate what the total obligation may be beyond any minimum quantities and/or pricing. |
|
(3) |
Debt principal and interest includes payments under the Term Loan. Interest payments were calculated using the forecasted rate as of December 31, 2019. |
Off-Balance Sheet Arrangements
As of December 31, 2019, we had no off-balance sheet arrangements.
JOBS Act Accounting Election
We are an emerging growth company, as defined in the Tax Cuts and JOBS Act. Under the Jobs Act of 2017 (the “JOBS Act”), emerging growth companies can delay adopting new or revised accounting standards issued after the enactment of the JOBS Act until those standards apply to private companies. We have elected to use this extended transition period under the JOBS Act.
Critical Accounting Policies and Estimates
Our consolidated financial statements are prepared in accordance with GAAP. The preparation of consolidated financial statements in accordance with GAAP requires certain estimates, assumptions and judgments to be made that may affect our consolidated financial statements. While our accounting policies that have significant impact on our results are described more fully in
53
Note 2 to our consolidated financial statements included elsewhere in this Annual Report on Form 10-K, we believe that the following accounting policies are critical. We consider an accounting policy to be critical if the policy is subject to a material level of judgment and if changes in those judgments are reasonably likely to materially impact our results.
Valuation of Goodwill, Purchased Intangible Assets and Impairment of Long-lived Assets
We do not amortize goodwill but test it for impairment annually, and whenever events or changes in circumstances indicate the carrying value of goodwill may not be recoverable. Triggering events that may indicate impairment include, but are not limited to, a significant adverse change in client asset values or a significant decrease in expected cash flows.
We amortize purchased intangible assets related to trade names, the AssetMark broker-dealer license and the regulatory status of ATC over their estimated useful life. The estimated useful life for these assets is twenty years.
We test definite-lived intangible assets for impairment when their carrying value may not be recoverable and can be initially based on undiscounted cash flows, which requires the use of estimates and judgment, and, if impaired, can be written down to fair value. There were no impairments of definite-lived intangibles for any periods presented in this Annual Report on Form 10-K.
We test intangible assets with indefinite lives at least annually for impairment based on comparing the current carrying value to fair value and written down to fair value if the carrying value exceeds the fair value.
Income Tax
We use the asset-and-liability method of accounting for income taxes. Under this method, we recognize deferred tax assets and liabilities for the expected future tax consequences of temporary differences between the financial reporting and tax basis of assets and liabilities, as well as for operating loss and tax credit carryforwards. Deferred tax assets and liabilities are measured using enacted tax rates that are expected to apply to taxable income for the years in which those tax assets and liabilities are expected to be realized or settled.
We record a valuation allowance to reduce our deferred tax assets to the net amount that we believe is more likely than not to be realized. In assessing the need for a valuation allowance, we consider our historical levels of income, expectations of future taxable income and ongoing tax planning strategies.
We recognize and measure tax benefits from uncertain tax positions using a two-step approach. The first step is to evaluate the tax position taken or expected to be taken by determining if the weight of available evidence indicates that it is more likely than not that the tax position will be sustained in an audit, including resolution of any related appeals or litigation processes. The second step is to measure the tax benefit as the largest amount that is more than 50% likely to be realized upon ultimate settlement. Significant judgment is required to evaluate uncertain tax positions.
Although we believe that we have adequately reserved for our uncertain tax positions, we can provide no assurance that the final tax outcome of these matters will not be materially different. We evaluate our uncertain tax positions on a regular basis and evaluations are based on a number of factors, including changes in facts and circumstances, changes in tax law, correspondence with tax authorities during the course of an audit and effective settlement of issues.
We follow the policy of releasing residual tax effects from accumulated other comprehensive income based on a portfolio approach, whereby we release the residual tax effects only after the entire accumulated other comprehensive income adjustment has been reversed (e.g., when all available-for-sale debt securities are sold). We did not make an election to reclassify the income tax effects of the Tax Cuts and Jobs Act from accumulated other comprehensive income to retained earnings.
We record interest and penalties related to underpayment of income taxes as part of our operating expenses.
Recently Issued Accounting Pronouncements
See Note 2 to our consolidated financial statements included elsewhere in this Annual Report on Form 10-K.
54
Item 7A. Quantitative and Qualitative Disclosures About Market Risk
Market Risk
Our exposure to market risk is directly related to revenue from service and management fees earned based upon a percentage of assets on our platform. In the years ended December 31, 2019 and 2018, 97% and 93% of our total revenue, respectively, was based on the market value of assets on our platform and were recurring in nature. We expect this percentage to vary over time. A 1% decrease in the aggregate value of assets on the platform at the beginning of the period for the years ended December 31, 2019 and 2018 would have caused our total revenue to decline by 1% and 1%, respectively, and would have caused our pre-tax income to decline by 19% and 4%, respectively, assuming we did not initiate additional expense measures in response to a market decline.
Interest Rate Risk
Changes in interest rates will impact our spread-based revenue. As of December 31, 2019, client cash assets participating in the insured cash deposit program at ATC totaled $1.9 billion. A change in short-term interest rates of 100 basis points at the beginning of the period for the year ended December 31, 2019 would result in an increase or decrease in income before income taxes of approximately $16.0 million on an annual basis (based on total client cash assets at December 31, 2018) and subject to any changes to interest credited to the end-investor). Actual impacts may vary depending on interest rate levels and the significance of change.
Additionally, changes to interest rates will impact the cost of our borrowing. Borrowing under both the Term Loan and the Revolver bears interest at (x) LIBOR plus a margin of 3.50%, with a step down to 3.25% or (y) the Alternate Base Rate, as defined and specified in the Credit Agreement, plus a margin of 2.50%, with a stepdown to 2.25%, in each case based on our achievement of a specified first-lien leverage ratio. Additionally, the Term Loan’s margin was reduced by 0.25% following the IPO. With respect to the Revolver, a quarterly fee of 0.50% is due for the unused amounts thereunder, with a stepdown to 0.375% based on our achievement of a specified first-lien leverage ratio. If LIBOR-based interest rates increased by 100 basis points, our interest expense on an annualized basis would increase by approximately $1.2 million based on amounts drawn down under the Term Loan as of December 31, 2019 and assuming no draw down of the Revolver.
Operational Risk
Operational risk generally refers to the risk of loss resulting from our operations, including, but not limited to, improper or unauthorized execution and processing of transactions, deficiencies in our technology or financial operating systems and inadequacies or breaches in our control processes. We operate in diverse markets and are reliant on the ability of our employees and systems to process a large number of transactions. These risks are less direct and quantifiable than market risk, but managing them is critical, particularly in a rapidly changing environment with increasing transaction volumes. In the event of a breakdown or improper operation of systems or improper action by employees or advisers, we could suffer financial loss, regulatory sanctions and damage to our reputation. Business continuity plans exist for critical systems, and redundancies are built into the systems as deemed appropriate. To mitigate and control operational risk, we have developed and continue to enhance specific policies and procedures that are designed to identify and manage operational risk at appropriate levels throughout our organization and within various departments. These control mechanisms attempt to ensure that operational policies and procedures are being followed and that our employees operate within established corporate policies and limits.
55
Item 8. Financial Statements and Supplementary Data
AssetMark Financial Holdings, Inc.
Index to Consolidated Financial Statements
The following financial statements are filed as part of this Annual Report on form 10-K:
|
|
Page |
|
Report of KPMG LLP, Independent Registered Public Accounting Firm |
57 |
|
Report of Crowe LLP, Independent Registered Public Accounting Firm |
58 |
|
Consolidated Financial Statements |
|
|
59 |
|
|
60 |
|
|
61 |
|
|
62 |
|
|
63 |
The supplementary financial information required by this Item 8 is included in Part II, Item 7 under the caption “Quarterly Results of Operations,” which is incorporated herein by reference.
56
Report of KPMG LLP, Independent Registered Public Accounting Firm
To the Stockholders and Board of Directors
AssetMark Financial Holdings, Inc.:
Opinion on the Consolidated Financial Statements
We have audited the accompanying consolidated balance sheets of AssetMark Financial Holdings, Inc. and subsidiaries (the Company) as of December 31, 2019 and 2018, the related consolidated statements of income and comprehensive income, stockholders’ equity, and cash flows for each of the years in the two year period ended December 31, 2019, and the related notes (collectively, the consolidated financial statements). In our opinion, the consolidated financial statements present fairly, in all material respects, the financial position of the Company as of December 31, 2019 and 2018, and the results of its operations and its cash flows for each of the years in the two year period ended December 31, 2019, in conformity with U.S. generally accepted accounting principles.
Basis for Opinion
These consolidated financial statements are the responsibility of the Company’s management. Our responsibility is to express an opinion on these consolidated financial statements based on our audits. We are a public accounting firm registered with the Public Company Accounting Oversight Board (United States) (PCAOB) and are required to be independent with respect to the Company in accordance with the U.S. federal securities laws and the applicable rules and regulations of the Securities and Exchange Commission and the PCAOB.
We conducted our audits in accordance with the standards of the PCAOB. Those standards require that we plan and perform the audit to obtain reasonable assurance about whether the consolidated financial statements are free of material misstatement, whether due to error or fraud. The Company is not required to have, nor were we engaged to perform, an audit of its internal control over financial reporting. As part of our audits, we are required to obtain an understanding of internal control over financial reporting but not for the purpose of expressing an opinion on the effectiveness of the Company’s internal control over financial reporting. Accordingly, we express no such opinion.
Our audits included performing procedures to assess the risks of material misstatement of the consolidated financial statements, whether due to error or fraud, and performing procedures that respond to those risks. Such procedures included examining, on a test basis, evidence regarding the amounts and disclosures in the consolidated financial statements. Our audits also included evaluating the accounting principles used and significant estimates made by management, as well as evaluating the overall presentation of the consolidated financial statements. We believe that our audits provide a reasonable basis for our opinion.
KPMG LLP
We have served as the Company’s auditor since 2007.
San Francisco, California
March 13, 2020
57
Report of Crowe LLP, Independent Registered Public Accounting Firm
Board of Directors of AssetMark Financial Holdings, Inc.
Concord, California
Opinion on the Financial Statements
We have audited the accompanying consolidated statements of income and comprehensive income, changes in stockholders’ equity and cash flows of AssetMark Financial Holdings, Inc. (the "Company") for the year ended December 31, 2017, and the related notes to the consolidated financial statements (collectively referred to as the "financial statements"). In our opinion, the financial statements present fairly, in all material respects, the results of the Company’s operations and its cash flows for the year ended December 31, 2017, in conformity with accounting principles generally accepted in the United States of America.
Basis for Opinion
These financial statements are the responsibility of the Company's management. Our responsibility is to express an opinion on the Company's financial statements based on our audit. We are a public accounting firm registered with the Public Company Accounting Oversight Board (United States) ("PCAOB") and are required to be independent with respect to the Company in accordance with the U.S. federal securities laws and the applicable rules and regulations of the Securities and Exchange Commission and the PCAOB.
We conducted our audit in accordance with the standards of the PCAOB. Those standards require that we plan and perform the audit to obtain reasonable assurance about whether the financial statements are free of material misstatement, whether due to error or fraud. The Company is not required to have, nor were we engaged to perform, an audit of its internal control over financial reporting. As part of our audit we are required to obtain an understanding of internal control over financial reporting but not for the purpose of expressing an opinion on the effectiveness of the Company's internal control over financial reporting. Accordingly, we express no such opinion.
Our audit included performing procedures to assess the risks of material misstatement of the financial statements, whether due to error or fraud, and performing procedures that respond to those risks. Such procedures included examining, on a test basis, evidence regarding the amounts and disclosures in the financial statements. Our audit also included evaluating the accounting principles used and significant estimates made by management, as well as evaluating the overall presentation of the financial statements. We believe that our audit provides a reasonable basis for our opinion.
Crowe LLP
We were engaged in 2018 to audit the 2017 financial statements.
New York, New York
March 11, 2019, except for stock split disclosure included within note 12, which is as of July 8, 2019.
58
AssetMark Financial Holdings, Inc.
(in thousands, except share data and par value)
|
|
|
December 31, 2019 |
|
|
December 31, 2018 |
|
||
|
ASSETS |
|
|
|
|
|
|
|
|
|
Current assets: |
|
|
|
|
|
|
|
|
|
Cash and cash equivalents |
|
$ |
96,341 |
|
|
$ |
105,354 |
|
|
Restricted cash |
|
|
9,000 |
|
|
|
7,000 |
|
|
Investments, at fair value |
|
|
7,275 |
|
|
|
333 |
|
|
Fees and other receivables, net |
|
|
9,679 |
|
|
|
8,760 |
|
|
Income tax receivable, net |
|
|
3,994 |
|
|
|
918 |
|
|
Other current assets |
|
|
6,565 |
|
|
|
4,391 |
|
|
Total current assets |
|
|
132,854 |
|
|
|
126,756 |
|
|
Property, plant and equipment, net |
|
|
7,067 |
|
|
|
7,040 |
|
|
Capitalized software, net |
|
|
69,814 |
|
|
|
72,644 |
|
|
Other intangible assets, net |
|
|
651,915 |
|
|
|
642,420 |
|
|
Goodwill |
|
|
327,310 |
|
|
|
298,415 |
|
|
Total assets |
|
$ |
1,188,960 |
|
|
$ |
1,147,275 |
|
|
LIABILITIES AND STOCKHOLDERS' EQUITY |
|
|
|
|
|
|
|
|
|
Current liabilities: |
|
|
|
|
|
|
|
|
|
Accounts payable |
|
$ |
967 |
|
|
$ |
730 |
|
|
Accrued liabilities and other current liabilities |
|
|
40,610 |
|
|
|
38,200 |
|
|
Current portion of long-term debt |
|
|
— |
|
|
|
2,305 |
|
|
Current portion of acquisition earn-out |
|
|
— |
|
|
|
8,000 |
|
|
Total current liabilities |
|
|
41,577 |
|
|
|
49,235 |
|
|
Long-term debt, net |
|
|
121,692 |
|
|
|
242,817 |
|
|
Other long-term liabilities |
|
|
16,440 |
|
|
|
5,097 |
|
|
Deferred income tax liabilities, net |
|
|
150,390 |
|
|
|
151,115 |
|
|
Total long-term liabilities |
|
|
288,522 |
|
|
|
399,029 |
|
|
Total liabilities |
|
|
330,099 |
|
|
|
448,264 |
|
|
Commitments and contingencies |
|
|
— |
|
|
|
— |
|
|
Stockholders' equity: |
|
|
|
|
|
|
|
|
|
Common stock, $0.001 par value (675,000,000 shares authorized and 72,390,080 and 66,150,000 shares issued and outstanding as of December 31, 2019 and 2018, respectively) |
|
|
72 |
|
|
|
66 |
|
|
Additional paid-in capital |
|
|
796,406 |
|
|
|
635,096 |
|
|
Retained earnings |
|
|
62,383 |
|
|
|
63,846 |
|
|
Accumulated other comprehensive income, net of tax |
|
|
— |
|
|
|
3 |
|
|
Total stockholders' equity |
|
|
858,861 |
|
|
|
699,011 |
|
|
Total liabilities and stockholders' equity |
|
$ |
1,188,960 |
|
|
$ |
1,147,275 |
|
The accompanying notes are an integral part of the consolidated financial statements.
59
AssetMark Financial Holdings, Inc.
Consolidated Statements of Income and Comprehensive Income
(in thousands, except share and per share data)
|
|
|
Year Ended December 31, |
|
|||||||||
|
|
|
2019 |
|
|
2018 |
|
|
2017 |
|
|||
|
Revenue: |
|
|
|
|
|
|
|
|
|
|
|
|
|
Asset-based revenue |
|
$ |
377,718 |
|
|
$ |
338,031 |
|
|
$ |
282,966 |
|
|
Spread-based revenue |
|
|
34,586 |
|
|
|
20,403 |
|
|
|
10,430 |
|
|
Other revenue |
|
|
5,632 |
|
|
|
5,200 |
|
|
|
2,121 |
|
|
Total revenue |
|
|
417,936 |
|
|
|
363,634 |
|
|
|
295,517 |
|
|
Operating expenses: |
|
|
|
|
|
|
|
|
|
|
|
|
|
Asset-based expenses |
|
|
125,985 |
|
|
|
116,763 |
|
|
|
98,401 |
|
|
Spread-based expenses |
|
|
5,014 |
|
|
|
1,671 |
|
|
|
976 |
|
|
Employee compensation |
|
|
154,999 |
|
|
|
107,091 |
|
|
|
105,413 |
|
|
General and operating expenses |
|
|
58,028 |
|
|
|
45,383 |
|
|
|
38,781 |
|
|
Professional fees |
|
|
14,084 |
|
|
|
10,139 |
|
|
|
9,622 |
|
|
Depreciation and amortization |
|
|
30,356 |
|
|
|
26,104 |
|
|
|
22,981 |
|
|
Total operating expenses |
|
|
388,466 |
|
|
|
307,151 |
|
|
|
276,174 |
|
|
Other income |
|
|
(1,089 |
) |
|
|
— |
|
|
|
— |
|
|
Interest expense |
|
|
12,269 |
|
|
|
1,920 |
|
|
|
— |
|
|
Other expense |
|
|
3,385 |
|
|
|
— |
|
|
|
— |
|
|
Income before income taxes |
|
|
14,905 |
|
|
|
54,563 |
|
|
|
19,343 |
|
|
Provision for (benefit from) income taxes |
|
|
15,325 |
|
|
|
17,137 |
|
|
|
(79,635 |
) |
|
Net income (loss) |
|
|
(420 |
) |
|
|
37,426 |
|
|
|
98,978 |
|
|
Unrealized gain (loss) on investments, net of tax |
|
|
— |
|
|
|
(5 |
) |
|
|
8 |
|
|
Net comprehensive income (loss) |
|
$ |
(420 |
) |
|
$ |
37,421 |
|
|
$ |
98,986 |
|
|
Net income (loss) per share attributable to common stockholders: |
|
|
|
|
|
|
|
|
|
|
|
|
|
Net income (loss) per share, basic and diluted |
|
$ |
(0.01 |
) |
|
$ |
0.57 |
|
|
$ |
1.50 |
|
|
Weighted average number of common shares outstanding, basic and diluted |
|
|
66,298,553 |
|
|
|
66,150,000 |
|
|
|
66,150,000 |
|
The accompanying notes are an integral part of the consolidated financial statements.
60
AssetMark Financial Holdings, Inc.
Consolidated Statements of Stockholders’ Equity
For the Years ended December 31, 2019, 2018 and 2017
(in thousands, except share data)
|
|
|
Common stock |
|
|
Additional paid-in |
|
|
Retained |
|
|
Accumulated other comprehensive |
|
|
Total stockholders’ |
|
|||||||||
|
|
|
Shares |
|
|
Amount |
|
|
capital |
|
|
earnings |
|
|
income |
|
|
equity |
|
||||||
|
Balance at December 31, 2016 |
|
|
66,150,000 |
|
|
$ |
66 |
|
|
$ |
777,544 |
|
|
$ |
2,442 |
|
|
$ |
— |
|
|
$ |
780,052 |
|
|
Net income |
|
|
— |
|
|
|
— |
|
|
|
— |
|
|
|
98,978 |
|
|
|
— |
|
|
|
98,978 |
|
|
Other comprehensive income |
|
|
— |
|
|
|
— |
|
|
|
— |
|
|
|
— |
|
|
|
8 |
|
|
|
8 |
|
|
Share-based employee compensation |
|
|
— |
|
|
|
— |
|
|
|
6,920 |
|
|
|
— |
|
|
|
— |
|
|
|
6,920 |
|
|
Balance at December 31, 2017 |
|
|
66,150,000 |
|
|
$ |
66 |
|
|
$ |
784,464 |
|
|
$ |
101,420 |
|
|
$ |
8 |
|
|
$ |
885,958 |
|
|
Net income |
|
|
— |
|
|
|
— |
|
|
|
— |
|
|
|
37,426 |
|
|
|
— |
|
|
|
37,426 |
|
|
Other comprehensive income (loss) |
|
|
— |
|
|
|
— |
|
|
|
— |
|
|
|
— |
|
|
|
(5 |
) |
|
|
(5 |
) |
|
Share-based employee compensation |
|
|
— |
|
|
|
— |
|
|
|
6,568 |
|
|
|
— |
|
|
|
— |
|
|
|
6,568 |
|
|
Capital contribution |
|
|
— |
|
|
|
— |
|
|
|
2,910 |
|
|
|
— |
|
|
|
— |
|
|
|
2,910 |
|
|
Return of capital |
|
|
— |
|
|
|
— |
|
|
|
(158,846 |
) |
|
|
— |
|
|
|
— |
|
|
|
(158,846 |
) |
|
Dividends |
|
|
— |
|
|
|
— |
|
|
|
— |
|
|
|
(75,000 |
) |
|
|
— |
|
|
|
(75,000 |
) |
|
Balance at December 31, 2018 |
|
|
66,150,000 |
|
|
$ |
66 |
|
|
$ |
635,096 |
|
|
$ |
63,846 |
|
|
$ |
3 |
|
|
$ |
699,011 |
|
|
Net loss |
|
|
— |
|
|
|
— |
|
|
|
— |
|
|
|
(420 |
) |
|
|
— |
|
|
|
(420 |
) |
|
Other comprehensive income (loss) |
|
|
— |
|
|
|
— |
|
|
|
— |
|
|
|
3 |
|
|
|
(3 |
) |
|
|
— |
|
|
2018 dividend reclassification |
|
|
— |
|
|
|
— |
|
|
|
1,046 |
|
|
|
(1,046 |
) |
|
|
— |
|
|
|
— |
|
|
Share-based employee compensation |
|
|
— |
|
|
|
— |
|
|
|
36,202 |
|
|
|
— |
|
|
|
— |
|
|
|
36,202 |
|
|
Initial public offering proceeds, net of expenses |
|
|
6,250,000 |
|
|
$ |
6 |
|
|
|
124,062 |
|
|
|
— |
|
|
|
— |
|
|
|
124,068 |
|
|
Cancellation of unvested restricted stock awards |
|
|
(9,920 |
) |
|
|
— |
|
|
|
— |
|
|
|
— |
|
|
|
— |
|
|
|
— |
|
|
Balance at December 31, 2019 |
|
|
72,390,080 |
|
|
$ |
72 |
|
|
$ |
796,406 |
|
|
$ |
62,383 |
|
|
$ |
— |
|
|
$ |
858,861 |
|
The accompanying notes are an integral part of the consolidated financial statements.
61
AssetMark Financial Holdings, Inc.
Consolidated Statements of Cash Flows
(in thousands)
|
|
|
Year Ended December 31, |
|
|||||||||
|
|
|
2019 |
|
|
2018 |
|
|
2017 |
|
|||
|
CASH FLOWS FROM OPERATING ACTIVITIES |
|
|
|
|
|
|
|
|
|
|
|
|
|
Net income (loss) |
|
$ |
(420 |
) |
|
$ |
37,426 |
|
|
$ |
98,978 |
|
|
Adjustments to reconcile net income (loss) to net cash provided by operating activities: |
|
|
|
|
|
|
|
|
|
|
|
|
|
Depreciation and amortization |
|
|
30,356 |
|
|
|
26,104 |
|
|
|
22,981 |
|
|
Interest |
|
|
525 |
|
|
|
— |
|
|
|
— |
|
|
Deferred income taxes |
|
|
1,497 |
|
|
|
1,736 |
|
|
|
(88,688 |
) |
|
Share-based compensation |
|
|
36,202 |
|
|
|
6,568 |
|
|
|
6,920 |
|
|
Debt acquisition cost write-down |
|
|
2,296 |
|
|
|
— |
|
|
|
— |
|
|
Changes in certain assets and liabilities: |
|
|
|
|
|
|
|
|
|
|
|
|
|
Fees and other receivables, net |
|
|
(726 |
) |
|
|
(1,449 |
) |
|
|
(43 |
) |
|
Payables to (receivables from) related party |
|
|
— |
|
|
|
(130 |
) |
|
|
225 |
|
|
Other current assets |
|
|
(1,852 |
) |
|
|
(1,024 |
) |
|
|
(730 |
) |
|
Accounts payable, accrued expenses and other liabilities |
|
|
(9,719 |
) |
|
|
(4,167 |
) |
|
|
2,228 |
|
|
Income tax receivable and payable |
|
|
(3,076 |
) |
|
|
(3,402 |
) |
|
|
3,741 |
|
|
Net cash provided by operating activities |
|
|
55,083 |
|
|
|
61,662 |
|
|
|
45,612 |
|
|
CASH FLOWS FROM INVESTING ACTIVITIES |
|
|
|
|
|
|
|
|
|
|
|
|
|
Purchase of Global Financial Private Capital, LLC |
|
|
(35,906 |
) |
|
|
— |
|
|
|
— |
|
|
Purchase of investments |
|
|
(1,594 |
) |
|
|
(300 |
) |
|
|
— |
|
|
Sale of investments |
|
|
82 |
|
|
|
— |
|
|
|
— |
|
|
Purchase of property and equipment |
|
|
(1,882 |
) |
|
|
(2,034 |
) |
|
|
(2,709 |
) |
|
Purchase of computer software |
|
|
(20,614 |
) |
|
|
(15,380 |
) |
|
|
(12,943 |
) |
|
Net cash used in investing activities |
|
|
(59,914 |
) |
|
|
(17,714 |
) |
|
|
(15,652 |
) |
|
CASH FLOWS FROM FINANCING ACTIVITIES |
|
|
|
|
|
|
|
|
|
|
|
|
|
Initial public offering proceeds |
|
|
124,068 |
|
|
— |
|
|
— |
|
||
|
Payments on long-term debt |
|
|
(126,250 |
) |
|
|
— |
|
|
|
— |
|
|
Capital distributions |
|
— |
|
|
|
(158,846 |
) |
|
— |
|
||
|
Dividends paid |
|
— |
|
|
|
(75,000 |
) |
|
— |
|
||
|
Proceeds from issuance of long-term debt |
|
|
— |
|
|
|
245,105 |
|
|
|
— |
|
|
Net cash (used in) provided by financing activities |
|
|
(2,182 |
) |
|
|
11,259 |
|
|
|
— |
|
|
Net change in cash, cash equivalents, and restricted cash |
|
|
(7,013 |
) |
|
|
55,207 |
|
|
|
29,960 |
|
|
Cash, cash equivalents, and restricted cash at beginning of period |
|
|
112,354 |
|
|
|
57,147 |
|
|
|
27,187 |
|
|
Cash, cash equivalents, and restricted cash at end of period |
|
$ |
105,341 |
|
|
$ |
112,354 |
|
|
$ |
57,147 |
|
|
SUPPLEMENTAL CASH FLOW INFORMATION |
|
|
|
|
|
|
|
|
|
|
|
|
|
Income taxes paid |
|
$ |
16,116 |
|
|
$ |
19,497 |
|
|
$ |
4,773 |
|
|
Interest paid |
|
$ |
11,728 |
|
|
$ |
1,258 |
|
|
$ |
— |
|
The accompanying notes are an integral part of the consolidated financial statements.
62
AssetMark Financial Holdings, Inc.
Notes to Consolidated Financial Statements
December 31, 2019 and 2018
All dollar amounts presented are in thousands other than per share amounts for all notes.
1. Overview
Organization and Nature of Business
These consolidated financial statements include AssetMark Financial Holdings, Inc. and its subsidiaries, which include AssetMark Financial, Inc., which is the parent company of AssetMark, Inc., AssetMark Trust Company, AssetMark Brokerage, LLC, AssetMark Retirement Services, Inc., Global Private Financial Capital, Inc. and Global Financial Advisory, LLC (collectively, the “Company”).
The Company’s legal entity structure as of December 31, 2019 is as follows:
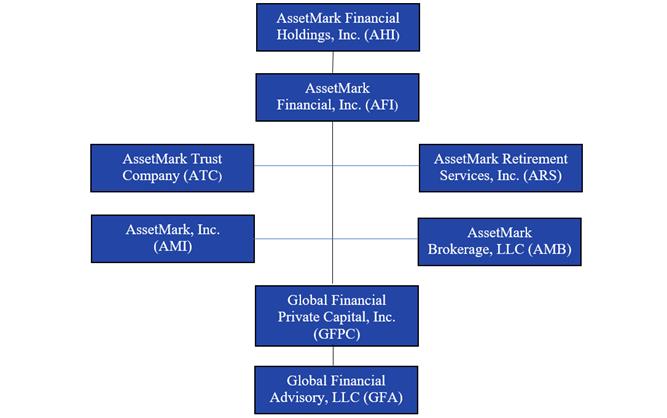
The Company offers a broad array of wealth management solutions to individual investors through financial advisers by providing an open‑architecture product platform along with tailored client advice, asset allocation options, practice management, support services and technology to the financial adviser channel.
AssetMark, Inc. (“AMI”) is a Registered Investment Advisory firm located in Concord, CA and was incorporated under the laws of the State of California on May 13, 1999. AMI offers a broad array of wealth management solutions to individual investors through financial advisers by providing an open‑architecture product platform along with tailored client advice, asset allocation options, practice management, support services and technology to the financial adviser channel.
AMI serves as investment adviser to the proprietary GuideMark Funds, GuidePath Funds and the Savos Dynamic Hedging Fund. The GuideMark and GuidePath Funds and the Savos Dynamic Hedging Fund are mutual funds offered to clients of financial advisers.
AssetMark Trust Company (“AssetMark Trust”) is a licensed trust company incorporated under the laws of the State of Arizona on August 24, 1994 and regulated by the Arizona Department of Financial Institutions. AssetMark Trust provides custodial
63
AssetMark Financial Holdings, Inc.
Notes to Consolidated Financial Statements — Continued
December 31, 2019 and 2018
recordkeeping services primarily to investor clients of registered investment advisers (including AMI) located throughout the United States.
AssetMark Brokerage, LLC is a limited-purpose broker-dealer located in Concord, CA and was incorporated under the laws of the State of Delaware on September 25, 2013. Its primary function is to distribute the mutual funds of the Company and to sponsor the FINRA licensing of those AssetMark associates who provide distribution support through promotion of the AssetMark programs and strategies that employ the Company’s mutual funds.
AssetMark Retirement Services, Inc. (“ARS”), formerly known as Aris Corporation of America, was incorporated under the laws of the State of Pennsylvania on April 30, 1974. ARS serves as the record-keeper and third-party administrator for the Aris Retirement product, which are 401(k) or 403(b) investment offerings utilized by small businesses.
Global Financial Private Capital, Inc. (“GFPC”), formerly known as Global Financial Private Capital, LLC and renamed effective July 12, 2019, is a registered investment adviser that was incorporated under the laws of the State of Florida on June 7, 2004. GFPC provides a broad suite of integrated wealth management services for institutional and individual investors.
Global Financial Advisory, LLC (“GFA”) is an insurance services company that was incorporated under the laws of the State of Delaware on June 30, 2016. GFA provides insurance services on an intermediary basis and is not a policy writer.
2. Summary of Significant Accounting Policies
The accompanying consolidated financial statements have been prepared in accordance with accounting principles generally accepted in the United States (“U.S. GAAP”).
Principles of Consolidation
The accompanying consolidated financial statements include the accounts of the Company and its wholly owned subsidiaries. All significant intercompany balances and transactions have been eliminated in consolidation.
Segment Information
The Company operates as one operating segment. The Company’s chief operating decision maker is its Chief Executive Officer, who reviews financial information presented on a consolidated basis for purposes of making operating decisions, assessing financial performance and allocating resources.
Use of Estimates
The preparation of consolidated financial statements in conformity with U.S. GAAP requires us to make estimates and assumptions that affect the reported amounts of assets and liabilities and disclosure of contingent assets and liabilities at the date of the consolidated financial statements and the reported amounts of revenue and expenses during the reporting period. Actual results could differ from those estimates. On an ongoing basis, the Company evaluates its estimates, including those related to intangible assets and goodwill, useful lives of intangible assets and property and equipment, internal use software, income taxes and contingent liabilities, among others. The Company bases its estimates on historical experience and on various other assumptions that are believed to be reasonable, the results of which form the basis for making judgments about the carrying values of assets and liabilities.
Concentration of Credit Risk and Significant Clients and Suppliers
The Company’s financial instruments that are exposed to concentration of credit risk consist primarily of cash and cash equivalents and accounts receivable. The Company deposits its cash primarily with one financial institution, and accordingly, such deposits regularly exceed federally insured limits.
Geographic Information
All of the Company’s revenue was generated in the United States.
64
AssetMark Financial Holdings, Inc.
Notes to Consolidated Financial Statements — Continued
December 31, 2019 and 2018
All of the Company’s property and equipment was located in the United States.
No single customer accounted for more than 10% of the Company’s revenue in any of the periods presented. There were two customers that represented 51% and 43% of the Company’s accounts receivable balance as of December 31, 2019 and 2018, respectively.
Cash, Cash Equivalents and Restricted Cash
Certificates of deposit, money market funds and other time deposits with original maturities of three months or less are considered cash equivalents.
Restricted cash consists of certificate of deposits the Company maintains in liquid capital in accordance to Arizona Revised Statutes requirements governing trust companies. See Note 16 for details regarding capital requirements.
The following table provides a reconciliation of cash, cash equivalents, and restricted cash reported within the consolidated balance sheets that sum to the total of the same such amounts shown in the consolidated statements of cash flows:
|
|
|
December 31, 2019 |
|
|
December 31, 2018 |
|
|
December 31, 2017 |
|
|||
|
Cash and cash equivalents |
|
$ |
96,341 |
|
|
$ |
105,354 |
|
|
$ |
50,147 |
|
|
Restricted cash |
|
|
9,000 |
|
|
|
7,000 |
|
|
|
7,000 |
|
|
Total cash, cash equivalents, and restricted cash shown in the statements of cash flows |
|
$ |
105,341 |
|
|
$ |
112,354 |
|
|
$ |
57,147 |
|
Investment Securities
The Company’s investments comprise equity investment and alternative investment securities funds. The Company determined the appropriate classification of its investment securities at the time of purchase and reevaluates such designation at each balance sheet date. The Company has classified and accounted for its investments as available-for-sale securities as the Company may sell these securities at any time for use in its current operations or for other purposes. Available-for-sale investment securities are recorded at fair value. Unrealized holding gains and losses were reported as other income until realized during 2019 and in unrealized gains (losses), net of tax, in prior years. Realized gains and losses from sales are determined on a specific-identification basis. Dividend and interest income are recognized when earned.
Fees and Other Receivables
Fee and other receivables represent service fees and advisory fees receivable, as well as custody fees in arrears. Fee and other receivables are recorded at the invoiced amount, net of allowances. These allowances are based on historical experience and evaluation of potential risk of loss associated with delinquent accounts. There were $14 and $85 allowance for doubtful accounts recorded as of December 31, 2019 and 2018, respectively.
Fair Value Measurements
The carrying amounts of the Company’s financial instruments, which include cash and cash equivalents, restricted cash, accounts receivable, accounts payable, and other accrued expense, approximate their fair values due to their relatively short maturity, and in the case of leases, market interest rates.
The accounting guidance for fair value measurements establishes a three-tier hierarchy, which prioritizes the inputs used in the valuation methodologies in measuring fair value as follows:
|
|
• |
Level 1 – Observable inputs that reflect quoted prices for identical assets or liabilities in active markets. |
|
|
• |
Level 2 – Inputs that are directly or indirectly observable in the marketplace. |
|
|
• |
Level 3 – unobservable inputs that are supported by little or no market activity. |
As of each reporting period, all assets recorded at fair value are classified in their entirety based on the lowest level of input that is significant to the fair value measurement. See Note 8 for more information regarding fair value measurements.
65
AssetMark Financial Holdings, Inc.
Notes to Consolidated Financial Statements — Continued
December 31, 2019 and 2018
Business Combinations
When the Company acquires a business, management allocates the purchase price to the net tangible and identifiable intangible assets acquired. Any residual purchase price is recorded as goodwill. The allocation of the purchase price requires management to make significant estimates in determining the fair values of assets acquired and liabilities assumed, especially with respect to intangible assets. These estimates are based on market and income approaches that include significant unobservable inputs. These estimates are inherently uncertain and unpredictable.
Goodwill, Acquired Intangible Assets and Impairment of Long-Lived Assets
Goodwill represents the excess purchase consideration of an acquired business over the fair value of the net tangible and identifiable intangible assets. Goodwill is evaluated for impairment annually on October 31, and whenever events or changes in circumstances indicate the carrying value of goodwill may not be recoverable. Triggering events that may indicate impairment include, but are not limited to, a significant adverse change in customer demand or business climate or a significant decrease in expected cash flows. An impairment loss is recognized to the extent that the carrying amount exceeds the reporting unit’s fair value. The Company has the option to first assess qualitative factors to determine whether events or circumstances indicate that it is more likely than not that the fair value of a reporting unit is less than its carrying amount and determine whether further action is needed. If after assessing the totality of events or circumstances, the Company determines it is not more likely than not that the fair value of a reporting unit is less than its carrying amount, then performing the two-step impairment test is unnecessary. No impairment charges were recorded during the years ended December 31, 2019, 2018 and 2017. See Note 5 for additional information related to goodwill.
AssetMark’s broad array of wealth management solutions are sold to individual investors through financial advisers associated with broker-dealers. The Company has long-standing, established relationships with these broker-dealers that are expected to result in future revenue and profit. While the relationships with the broker-dealers are contractual, the agreements have no fixed expiration dates or renewal terms, and there have been no instances of terminated agreements by either side to-date. Based on the foregoing, the acquired relationships with broker-dealers are identified and valued as a discrete indefinite-lived intangible asset. Indefinite-lived intangible assets are tested for impairment annually. An impairment exists if the carrying value of the indefinite-lived intangible asset exceeds its fair value.
Acquired definite-lived intangible assets consist of trade names, the AssetMark broker-dealer license, and the AssetMark Trust Company regulatory status, resulting from the Company’s acquisitions. Acquired definite-lived intangible assets are recorded at fair value on the date of acquisition and amortized over their estimated useful lives on a straight-line basis.
The carrying amounts of long-lived assets, including property and equipment, capitalized internal-use software, and acquired definite-lived intangible assets, are reviewed for impairment whenever events or changes in circumstances indicate that the carrying value of these assets may not be recoverable or that the useful life is shorter than originally estimated. Recoverability of assets to be held and used is measured by comparing the carrying amount of an asset to the future undiscounted cash flows that the assets or the asset group are expected to generate. If the carrying value of the assets are not recoverable, the impairment recognized is measured as the amount by which the carrying value exceeds its fair value. There were no events or changes in circumstances identified that indicated that the carrying amount of the long-lived assets were not recoverable during the years ended December 31, 2019 and 2018. See Note 5 for additional information related to intangible assets.
Property and Equipment
Property and equipment consist primarily of hardware, furniture and equipment and leasehold improvements. Depreciation is calculated on a straight‑line basis over the estimated useful lives of the related asset, generally three to ten years. Leasehold improvements are depreciated over the shorter of the economic useful life of the improvement or the remaining lease term. Depreciation expense for the years ended December 31, 2019, 2018 and 2017 was $2,012, $2,063 and $1,513, respectively.
66
AssetMark Financial Holdings, Inc.
Notes to Consolidated Financial Statements — Continued
December 31, 2019 and 2018
The following table shows balances of major classes of depreciable assets as of the date shown:
|
|
|
December 31, 2019 |
|
|
December 31, 2018 |
|
||
|
Computer software and equipment |
|
$ |
6,594 |
|
|
$ |
5,271 |
|
|
Furniture and equipment |
|
|
3,647 |
|
|
|
2,603 |
|
|
Leasehold improvements |
|
|
3,361 |
|
|
|
2,983 |
|
|
Total property and equipment |
|
|
13,602 |
|
|
|
10,857 |
|
|
Less: accumulated depreciation |
|
|
(6,535 |
) |
|
|
(3,817 |
) |
|
Property and equipment, net |
|
$ |
7,067 |
|
|
$ |
7,040 |
|
Capitalized Internal-Use Software
The Company capitalizes certain costs incurred during the application development stage in connection with software development for its platform. Costs related to the preliminary project activities and post-implementation activities are expensed as incurred. Capitalized costs are recorded as part of intangible assets. Maintenance and training costs are expensed as incurred.
Capitalized internal-use software costs are amortized on a straight-line basis over the software estimated useful life, which is generally five years. The Company records amortization related to capitalized internal-use software within depreciation and amortization expense in the consolidated statements of income and comprehensive income. The Company evaluates the useful lives of these assets on an annual basis and tests for impairment whenever events or changes in circumstances occur that could impact the recoverability of these assets. There were impairments of $578, $0 and $0 of internally developed software during the years ended December 31, 2019, 2018 and 2017, respectively.
Amortization expense for the years ended December 31, 2019, 2018 and 2017 was $23,497, $19,935 and $17,434, respectively. Accumulated amortization was $63,688 and $40,191 as of December 31, 2019 and 2018, respectively.
Revenue Recognition
On January 1, 2018, the Company adopted ASC Topic 606, Revenue from Contracts with Customers, using the full retrospective transition method. As such, results for reporting periods prior to January 1, 2018 are presented under Topic 606.
The Company recognizes revenue from services related to asset-based revenue, spread-based revenue and other revenue.
|
|
• |
Asset-based revenue — The Company primarily derives revenue from fees assessed against customers’ assets under management or administration for services the Company provides to its customers. Such services include investment manager due diligence and research, portfolio diagnostics, proposal generation, investment model management, rebalancing and trading, portfolio performance reporting and monitoring solutions, billing, and back office and middle-office operations and custody services. Investment decisions for assets under management or administration are made by the Company’s customers. The fee arrangements are based on a percentage applied to the customers’ assets under management or administration. The performance obligation is satisfied over time because the customer is receiving and consuming the benefits as they are provided by the Company. Fees are generally calculated, billed and collected quarterly in advance on the preceding quarter-end customer asset values, and are recognized as revenue at the time the services are provided in the period. Fees related to assets under management or administration increase or decrease based on values of existing customer accounts. The values are affected by inflows or outflows of customer funds and market fluctuations. |
|
|
• |
Spread-based revenue — Spread-based revenue consists of the interest rate return earned on cash assets custodied through AssetMark Trust, one of several custodians offered on the Company’s platform. AssetMark Trust utilizes third-party banks to invest customer cash and uses the proceeds from those investments to credit customer accounts and earn spread-based revenue for the Company. |
|
|
• |
Other revenue — Other revenue consists primarily of interest earned on operating cash held by the Company. |
67
AssetMark Financial Holdings, Inc.
Notes to Consolidated Financial Statements — Continued
December 31, 2019 and 2018
The Company has applied the practical expedient to recognize the incremental costs of obtaining contracts as an expense when incurred if the amortization period would have been one year or less. These costs are included in asset-based expenses on the consolidated statements of income and comprehensive income.
Asset-Based Expenses
Asset-based expenses are costs incurred by the Company directly related to the generation of asset-based revenue. Fees paid to third-party strategists, investment managers, proprietary fund sub-advisers and investment advisers are calculated based on a percentage of the customers’ assets under management or administration. As a practical expedient, these costs are paid monthly and quarterly in advance on the preceding quarter-end customer asset values, and expensed as incurred over the period of time that the services are expected to be provided to customers, since the amortization of costs are in one year or less. See Note 10 for a breakout of these costs.
Spread-Based Expenses
The Company recognizes spread-based expenses when costs are incurred. Spread-based expenses relate to expenses paid to AssetMark Trust’s third-party administrator for administering the custodian’s insured cash deposit program.
Share-Based Compensation
Share-based compensation issued to all officers of the Company, under the terms of the Amended & Restated Limited Liability Company Agreement of AssetMark Holdings LLC (the “LLC Agreement”), is measured based on the grant date fair value of the award and recognized as an expense over the requisite service and performance period for the Class C common units.
The Company’s use of a Monte Carlo simulation to estimate the fair value of the Class C common units requires the input of various estimates and assumptions. The assumptions and estimates are as follows:
|
|
• |
Fair value — The fair value of the shares underlying the Class C common units had been established by the Company based in part upon a valuation provided by a third-party valuation firm. |
|
|
• |
Risk free rate — The Company uses the U.S. Treasury yield that corresponds with the expected term. |
|
|
• |
Expected volatility — Expected volatility is a measure of the amount by which the stock price is expected to fluctuate. Since the Company does not have sufficient trading history of its common stock, it estimates the expected volatility of its stock options at their grant date by taking the weighted-average historical volatility of a group of comparable publicly traded companies over a period equal to the expected life of options. |
|
|
• |
Dividend yield — The Company utilizes a dividend yield of zero, given no expectations of or actual dividends to date on the Class C common units. |
|
|
• |
Discount for lack of marketability — The discount in value for lack of marketability was estimated using generally accepted valuation practices provided by a third-party valuation firm. |
The Company accounts for forfeitures as they occur.
Share-based compensation related to stock options issued to officers and directors is measured based on the grant date fair value of the award and is recognized on a straight-line basis over the requisite service period.
The Company uses the Black-Scholes options pricing model to estimate the fair value of stock options. The risk-free interest rate is the U.S. Treasury Yield that corresponds with the expected term. Expected volatility is estimated based on the volatility of a group of comparable public companies. The expected term was estimated using the simplified method due to limited historical information. The Company does not expect to pay dividends on its common shares. The Company accounts for forfeitures as they occur.
68
AssetMark Financial Holdings, Inc.
Notes to Consolidated Financial Statements — Continued
December 31, 2019 and 2018
Share-based compensation related to restricted stock awards and restricted stock units are measured on the grant date fair value of the award based on intrinsic value and are recognized on a straight-line basis over the requisite service period.
Operating Leases
In certain circumstances, the Company enters into leases with free rent periods, rent escalations or lease incentives over the term of the lease. In such cases, the Company calculates the total payments over the term of the lease and records them ratably as rent expense over that term.
Income Taxes
The Company uses the asset-and-liability method of accounting for income taxes. Under this method, the Company recognizes deferred tax assets and liabilities for the expected future tax consequences of temporary differences between the financial reporting and tax basis of assets and liabilities, as well as for operating loss and tax credit carryforwards. Deferred tax assets and liabilities are measured using enacted tax rates that are expected to apply to taxable income for the years in which those tax assets and liabilities are expected to be realized or settled.
The Company records a valuation allowance to reduce its deferred tax assets to the net amount that the Company believes is more likely than not to be realized. In assessing the need for a valuation allowance, the Company has considered its historical levels of income, existence of available offsetting deferred tax liabilities, expectations of future taxable income and ongoing tax planning strategies.
The Company recognizes and measure tax benefits from uncertain tax positions using a two-step approach.
The first step is to evaluate the tax position taken or expected to be taken by determining if the weight of available evidence indicates that it is more likely than not that the tax position will be sustained in an audit, including resolution of any related appeals or litigation processes. The second step is to measure the tax benefit as the largest amount that is more than 50% likely to be realized upon ultimate settlement. Significant judgment is required to evaluate uncertain tax positions.
Although the Company believes that it has adequately reserved for its uncertain tax positions, it can provide no assurance that the final tax outcome of these matters will not be materially different. The Company evaluates its uncertain tax position on a regular basis and evaluations are based on a number of factors, including changes in facts and circumstances, changes in tax law, correspondence with tax authorities during the course of an audit and effective settlement of issues.
The Company follows the policy of releasing residual tax effects from accumulated other comprehensive income based on a portfolio approach, whereby the Company releases the residual tax effects only after the entire accumulated other comprehensive income adjustment has been reversed (e.g., when all available-for-sale debt securities are sold). The Company did not make an election to reclassify the income tax effects of the Tax Cuts and Jobs Act from accumulated other comprehensive income to retained earnings.
The Company records interest and penalties related to underpayment of income taxes as part of its operating expenses.
Net Income (Loss) per Share
Basic net income (loss) per share is computed by dividing net income (loss) available to common stockholders by the weighted-average number of shares of common stock outstanding during the period. The computation of diluted net income (loss) per share is similar to the computation of basic net income (loss) per share, except that the denominator is increased to include the number of additional shares of common stock that would have been outstanding if dilutive potential shares of common stock had been issued.
Recent Accounting Pronouncements – Current Adoptions
In August 2016, the FASB issued ASU 2016-15, Classification of Certain Cash Receipts and Cash Payments, which clarifies how to classify certain types of cash payments and receipts on the statement of cash flows. The following amendments in ASU 2016-15 are or may be relevant to the Company: (1) debt prepayment or extinguishment costs should be classified as financing cash outflows; (2) cash consideration payments made soon after an acquisition’s consummation date (approximately three months or less) should be classified as cash outflows for investing activities. Payments made thereafter should be classified as cash outflows for
69
AssetMark Financial Holdings, Inc.
Notes to Consolidated Financial Statements — Continued
December 31, 2019 and 2018
financing activities up to the amount of the original contingent consideration liability. Payments made in excess of the amount of the original contingent consideration liability should be classified as cash outflows for operating activities; (3) proceeds from the settlement of insurance claims should be classified on the basis of the nature of the loss (or each component loss, if an entity receives a lump-sum settlement); (4) for distributions received from equity method investments, companies may elect either a cumulative earnings approach or the nature of distribution approach to determine whether distributions received from the equity method investees are returns on investment (operating cash inflows) or returns of investment (investing cash inflows); and (5) in the absence of specific guidance, companies determine each separately identifiable cash source and classify the receipt or payment based on the nature of the cash flow. ASU 2016-15 is effective for the Company in annual periods in fiscal years beginning after December 15, 2018, and requires retrospective application. Companies must adopt all amendments at the same time. The Company adopted the ASU on January 1, 2019 and it did not have a significant impact on the Company’s consolidated financial statements and related disclosures.
In January 2016, the FASB issued ASU 2016-01, Recognition and Measurement of Financial Assets and Financial Liabilities, which makes targeted improvements to the accounting for, and presentation and disclosure of, financial instruments. ASU 2016-01 requires that most equity investments be measured at fair value, with subsequent changes in fair value recognized in net income. ASU 2016-01 does not affect the accounting for investments that would otherwise be consolidated or accounted for under the equity method. The new standard also affects financial liabilities under the fair value option and the presentation and disclosure requirements for financial instruments. The provisions of ASU 2016-01 are effective for the Company for annual periods in fiscal years beginning after December 15, 2018. The Company adopted the new standard on January 1, 2019, and it did not have a significant impact on the Company’s consolidated financial statements or related disclosures.
Recent Accounting Pronouncements – Issued but Not Effective
In February 2016, the FASB issued ASU 2016-02, Leases (Topic 842), which requires lessees to recognize leases on-balance sheet and disclose key information about leasing arrangements. The new standard establishes a right-of-use (ROU) model that requires a lessee to recognize a ROU asset and lease liability on the balance sheet for all leases with a term longer than 12 months. Leases will be classified as finance or operating, with classification affecting the pattern and classification of expense recognition in the income statement. The new standard is effective for the Company beginning January 1, 2020, with early adoption permitted. The Company expects to use the modified retrospective transition method with certain available transitional practical expedients. The standard will have a material impact on the Company’s consolidated balance sheets and related disclosures but will not have a material impact on our consolidated statements of income and comprehensive income. The Company currently estimates adoption of ASU 2016-02 will result in the recognition of ROU assets and lease liabilities for operating leases in the range of approximately $35,000 to $40,000 as of January 1, 2020. The difference between the ROU assets and lease liabilities represents the existing deferred rent liabilities, resulting from historical straight-lining of operating leases, which will be reclassified upon adoption to reduce the measurement of the ROU assets.
In January 2017, the FASB issued ASU 2017-04, Intangibles, Goodwill and Other (Topic 350), Simplifying the Test for Goodwill Impairment, which removes step 2 from the goodwill impairment test. As a result, an entity should perform its annual goodwill impairment test by comparing the fair value of a reporting unit with its carrying amount and should recognize an impairment charge for the amount by which the carrying amount exceeds the reporting units’ fair value. The new standard is effective for the Company beginning January 1, 2020, with early adoption permitted. The Company does not expect a material impact on the Company’s consolidated financial statements.
In July 2018, the FASB issued ASU 2018-11, Lease (Topic 842) Targeted Improvements, which increases transparency and comparability among organizations by recognizing lease assets and lease liabilities on the balance sheet and disclosing key information about leasing transactions. The Company expects to adopt the new standard on January 1, 2020.
In August 2018, the FASB issued ASU 2018-15, Intangibles, Goodwill and Other, Internal-Use Software (Subtopic 350-40), which provides guidance to evaluate the accounting for fees paid by a customer in a cloud computing arrangement. If a cloud computing arrangement includes a license to internal-use-software, then the software license is accounted for by the customer in accordance with Subtopic ASC 350-40. An intangible asset is recognized for the software license and a liability also recognized. The new standard is effective for the Company beginning January 1, 2020, with early adoption permitted. The Company is currently evaluating the effect that ASU 2018-15 will have on its consolidated financial statements.
In October 2018, the FASB issued ASU 2018-17, Consolidation, Targeted Improvements to Related Party Guidance for Variable Interest Entities, which clarifies the determination as to whether a decision-making fee is a variable interest by requiring reporting entities to consider indirect interests held through related parties under common control on a proportional basis rather than as an equivalent of a direct interest in its entirety. The new standard is effective for the Company on January 1, 2020, with early adoption permitted. The Company is currently evaluating the effect that ASU 2018-17 will have on its consolidated financial statements.
70
AssetMark Financial Holdings, Inc.
Notes to Consolidated Financial Statements — Continued
December 31, 2019 and 2018
In December 2019, the FASB issued ASU 2019-12, Income Taxes (Topic 740), Simplifying the Accounting for Income Taxes, which removes certain exceptions to the general principles in Topic 740 and improves consistent application of U.S. GAAP by clarifying and amending existing guidance. The new standard is effective for the Company on January 1, 2021, with early adoption permitted. The Company is currently evaluating the effect that ASU 2019-12 will have on its consolidated financial statements.
3. Business Combinations
On August 11, 2018, the Company entered into a unit purchase agreement to acquire Global Financial Private Capital, LLC, which was renamed Global Financial Private Capital, Inc. effective July 12, 2019, and Global Financial Advisory, LLC, for a purchase price of $55,000, subject to client attrition and working capital purchase price adjustments and closing conditions that included approval from the Committee on Foreign Investment in the United States (“CFIUS”). On April 16, 2019, the Company closed the acquisition and paid a final purchase price of $35,906, net of working capital and client attrition adjustments. The Company recorded goodwill of $26,583, adviser relationships of $14,250 and deferred tax assets of $4,344 in connection with the acquisition.
4. Variable Interest Entities
A Variable interest entity (“VIE”) is an entity that has either a total equity investment that is insufficient to finance its activities without additional subordinated financial support or whose equity investors lack the ability to control the entity’s activities. Under existing accounting guidance, a VIE is consolidated by its primary beneficiary, the party that has both the power to direct the activities that most significantly impact the economic performance of the VIE and holds a variable interest that could potentially be significant to the VIE.
The Company evaluates whether an entity is a VIE upon creation and upon the occurrence of significant events, such as a change in an entity’s assets or activities. The determination of whether the Company is the primary beneficiary involves performing a qualitative analysis of the VIE. The analysis includes its design, capital structure, contractual terms, including the rights of each variable interest holder, the activities of the VIE that most significantly impact its economic performance, and whether the Company has the power to direct those activities and the Company’s obligation to absorb losses or right to receive benefits significant to the VIE.
In 2015, the Company created a rabbi trust to support the Company’s Deferred Compensation Plan, under which certain employees may defer their compensation and the Company will contribute the amounts to the rabbi trust. The rabbi trust subsequently invests the deferred compensation into diversified securities, and upon distribution, settles the deferred obligation in cash, which settlement includes the deferred compensation principal and any investment appreciation. The Company selects the investment options available for participants and is the primary beneficiary of the assets upon insolvency. During the fourth quarter of 2019, the Company determined that the rabbi trust was a VIE and it was therefore consolidated. The VIE had investments at fair value of $6,885 and other long-term liabilities of $6,885 as of December 31, 2019. The VIE had other income and other expense of $1,089 related to the rabbi trust’s unrealized gains for the year ended December 31, 2019. The impact was immaterial as of and for the years ended December 31, 2018 and 2017 and therefore prior period amounts have not been adjusted.
5. Goodwill and Other Intangible Assets
Goodwill
The Company’s goodwill balance was $327,310 and $298,415 as of December 31, 2019 and 2018, respectively. The Company, which has one reporting unit, performed an annual test for goodwill impairment in October of the years ended December 31, 2019 and 2018, and determined that goodwill was not impaired. In addition, there have been no significant events or circumstances affecting the valuation of goodwill subsequent to the Company’s annual assessment.
71
AssetMark Financial Holdings, Inc.
Notes to Consolidated Financial Statements — Continued
December 31, 2019 and 2018
Intangible Assets
Information regarding the Company’s intangible assets is as follows:
|
December 31, 2019 |
|
Gross carrying amount |
|
|
Accumulated amortization |
|
|
Net carrying amount |
|
|
Estimated useful life |
|||
|
Indefinite-lived intangible assets: |
|
|
|
|
|
|
|
|
|
|
|
|
|
|
|
Broker-dealer relationships |
|
$ |
570,480 |
|
|
$ |
— |
|
|
$ |
570,480 |
|
|
|
|
Definite-lived intangible assets: |
|
|
|
|
|
|
|
|
|
|
|
|
|
|
|
Trade names |
|
|
45,830 |
|
|
|
(7,256 |
) |
|
|
38,574 |
|
|
17 years |
|
Broker-dealer license |
|
|
11,550 |
|
|
|
(1,829 |
) |
|
|
9,721 |
|
|
17 years |
|
ATC regulatory status |
|
|
23,300 |
|
|
|
(3,689 |
) |
|
|
19,611 |
|
|
17 years |
|
GFPC adviser relationships |
|
|
14,250 |
|
|
|
(721 |
) |
|
|
13,529 |
|
|
13 years |
|
Total |
|
$ |
665,410 |
|
|
$ |
(13,495 |
) |
|
$ |
651,915 |
|
|
|
|
December 31, 2018 |
|
Gross carrying amount |
|
|
Accumulated amortization |
|
|
Net carrying amount |
|
|
Estimated useful life |
|||
|
Indefinite-lived intangible assets: |
|
|
|
|
|
|
|
|
|
|
|
|
|
|
|
Broker-dealer relationships |
|
$ |
570,480 |
|
|
$ |
— |
|
|
$ |
570,480 |
|
|
|
|
Definite-lived intangible assets: |
|
|
|
|
|
|
|
|
|
|
|
|
|
|
|
Trade names |
|
|
45,830 |
|
|
|
(4,965 |
) |
|
|
40,865 |
|
|
18 years |
|
Broker-dealer license |
|
|
11,550 |
|
|
|
(1,251 |
) |
|
|
10,299 |
|
|
18 years |
|
ATC regulatory status |
|
|
23,300 |
|
|
|
(2,524 |
) |
|
|
20,776 |
|
|
18 years |
|
Total |
|
$ |
651,160 |
|
|
$ |
(8,740 |
) |
|
$ |
642,420 |
|
|
|
The weighted average estimated remaining useful life at December 31, 2019 was 16.1 years for trade names, broker-dealer license, AssetMark Trust Company regulatory status and GFPC adviser relationships. Amortization expense for the years ended December 31, 2019, 2018 and 2017 was $4,755, $4,034 and $4,034, respectively.
Estimated amortization expense for definite‑lived intangible assets for future years is as follows:
|
Year Ended December 31: |
|
Estimated amortization |
|
|
|
2020 |
|
$ |
5,052 |
|
|
2021 |
|
|
5,052 |
|
|
2022 |
|
|
5,052 |
|
|
2023 |
|
|
5,052 |
|
|
2024 |
|
|
5,052 |
|
|
2025 and thereafter |
|
|
56,175 |
|
|
Total |
|
$ |
81,435 |
|
6. Accrued Expenses and Other Current Liabilities
The following table shows the breakdown of accrued expenses and other current liabilities:
|
|
|
December 31, 2019 |
|
|
December 31, 2018 |
|
||
|
Accrued bonus |
|
$ |
17,209 |
|
|
$ |
14,553 |
|
|
Compensation and benefits payable |
|
|
7,591 |
|
|
|
5,882 |
|
|
Asset-based payables |
|
|
3,718 |
|
|
|
4,041 |
|
|
Other accrued expenses |
|
|
12,092 |
|
|
|
13,724 |
|
|
Total |
|
$ |
40,610 |
|
|
$ |
38,200 |
|
72
AssetMark Financial Holdings, Inc.
Notes to Consolidated Financial Statements — Continued
December 31, 2019 and 2018
7. Other Long-Term Liabilities
Other long-term liabilities consisted of the following:
|
|
|
December 31, 2019 |
|
|
December 31, 2018 |
|
||
|
Contractor liability |
|
$ |
3,083 |
|
|
$ |
3,825 |
|
|
Deferred rent |
|
|
1,150 |
|
|
|
1,272 |
|
|
Deferred compensation plan liability |
|
|
6,885 |
|
|
|
— |
|
|
Purchase commitments related to acquisition of GFPC |
|
|
5,322 |
|
|
|
— |
|
|
Total |
|
$ |
16,440 |
|
|
$ |
5,097 |
|
8. Fair Value Measurements
The following tables set forth the fair value of the Company’s financial assets and liabilities measured at fair value in the consolidated balance sheets as of December 31, 2019 and 2018, based on the three-tier fair value hierarchy:
|
|
|
December 31, 2019 |
|
|||||||||||||
|
|
|
Fair Value |
|
|
Level I |
|
|
Level II |
|
|
Level III |
|
||||
|
Assets: |
|
|
|
|
|
|
|
|
|
|
|
|
|
|
|
|
|
Equity investment and alternative investment securities funds(1) |
|
$ |
390 |
|
|
$ |
390 |
|
|
$ |
— |
|
|
$ |
— |
|
|
Assets to fund deferred compensation liability(2) |
|
|
6,885 |
|
|
|
6,885 |
|
|
|
— |
|
|
|
— |
|
|
Total assets |
|
$ |
7,275 |
|
|
$ |
7,275 |
|
|
$ |
— |
|
|
$ |
— |
|
|
Liabilities: |
|
|
|
|
|
|
|
|
|
|
|
|
|
|
|
|
|
Deferred compensation liability(3) |
|
$ |
6,885 |
|
|
$ |
6,885 |
|
|
$ |
— |
|
|
$ |
— |
|
|
Total liabilities |
|
$ |
6,885 |
|
|
$ |
6,885 |
|
|
$ |
— |
|
|
$ |
— |
|
|
|
|
December 31, 2018 |
|
|||||||||||||
|
|
|
Fair Value |
|
|
Level I |
|
|
Level II |
|
|
Level III |
|
||||
|
Assets: |
|
|
|
|
|
|
|
|
|
|
|
|
|
|
|
|
|
Equity investment and alternative investment securities funds(1) |
|
$ |
333 |
|
|
$ |
333 |
|
|
$ |
— |
|
|
$ |
— |
|
|
Total assets |
|
$ |
333 |
|
|
$ |
333 |
|
|
$ |
— |
|
|
$ |
— |
|
|
(1) |
The fair values of the Company’s equity investment and alternative investment securities funds are based on the month-end quoted market prices for the net asset value of the various funds and securities, which mature on a daily basis. |
|
(2) |
The rabbi trust asset fair value is based on the month-end quoted market prices for the net asset value of the various investment funds. The Company recognized unrealized gains of $1,089 and $0 related to this asset within the statements of income and comprehensive income for the years ended December 31, 2019 and 2018, respectively. See Note 4 for more details. |
|
(3) |
The deferred compensation liability is included in other non-current liabilities in the consolidated balance sheets and its fair market value is based on the month-end market prices for the net asset value of the various funds of the Company’s rabbi trust that the participants have selected. The Company recognized other expenses of $1,089 and $0 related to this liability within the statements of income and comprehensive income for the years ended December 31, 2019 and 2018, respectively. See Note 4 for more details. See Note 4 for more details. |
9. Debt
On November 14, 2018, the Company executed a Credit Agreement with Credit Suisse AG for a $250,000 term loan (the “Term Loan”) and a revolving line of credit (the “Revolver”) that permits the Company to borrow up to $20,000. Both the Term Loan and the Revolver bear interest at (x) the London InterBank Offered Rate (“LIBOR”) plus a margin of 3.50%, with a step down to 3.25% or (y) the Alternate Base Rate, as defined and specified in the Credit Agreement, plus a margin of 2.50%, with a step down to 2.25%, in each case based on the Company’s achievement of a specified first-lien leverage ratio. Additionally, the Term Loan’s margin was reduced by 0.25% following the Company’s initial public offering. The Term Loan matures on November 14, 2025 and the Revolver matures on November 14, 2023. On July 26, 2019, the Company made a partial repayment of $125 million of the Company’s outstanding indebtedness under the Term Loan. The repayment was considered a substantial modification and the debt was considered partially extinguished. As of December 31, 2019, $123.7 million aggregate principal amount of the Term Loan remained outstanding and the
73
AssetMark Financial Holdings, Inc.
Notes to Consolidated Financial Statements — Continued
December 31, 2019 and 2018
Revolver was undrawn. Interest expense was $12,269, $1,920 and zero for the years ended December 31, 2019, 2018 and 2017, respectively.
10. Asset-Based Expenses
Asset-based expenses incurred by the Company relating to the generation of asset-based revenue were:
|
|
|
Year Ended December 31, |
|
|||||||||
|
|
|
2019 |
|
|
2018 |
|
|
2017 |
|
|||
|
Strategist and manager fees |
|
$ |
102,480 |
|
|
$ |
93,385 |
|
|
$ |
77,013 |
|
|
Premier broker-dealer fees |
|
|
10,197 |
|
|
|
8,107 |
|
|
|
6,084 |
|
|
Custody fees |
|
|
6,187 |
|
|
|
6,208 |
|
|
|
7,106 |
|
|
Fund advisory fees |
|
|
4,493 |
|
|
|
5,701 |
|
|
|
4,969 |
|
|
Marketing allowance |
|
|
2,576 |
|
|
|
2,573 |
|
|
|
2,066 |
|
|
External managers |
|
|
— |
|
|
|
788 |
|
|
|
1,151 |
|
|
Other |
|
|
52 |
|
|
|
1 |
|
|
|
12 |
|
|
Total |
|
$ |
125,985 |
|
|
$ |
116,763 |
|
|
$ |
98,401 |
|
11. Income Taxes
The income tax provision (benefit) was as follows:
|
|
|
Year Ended December 31, 2019 |
|
|
Year Ended December 31, 2018 |
|
|
Year Ended December 31, 2017 |
|
|||
|
Current provision |
|
|
|
|
|
|
|
|
|
|
|
|
|
Federal |
|
$ |
11,111 |
|
|
$ |
12,921 |
|
|
$ |
7,902 |
|
|
State |
|
|
2,717 |
|
|
|
2,480 |
|
|
|
1,151 |
|
|
Total current provision |
|
|
13,828 |
|
|
|
15,401 |
|
|
|
9,053 |
|
|
Deferred provision (benefit) |
|
|
|
|
|
|
|
|
|
|
|
|
|
Federal |
|
|
(970 |
) |
|
|
(1,846 |
) |
|
|
(88,913 |
) |
|
State |
|
|
2,467 |
|
|
|
3,582 |
|
|
|
225 |
|
|
Total deferred provision (benefit) |
|
|
1,497 |
|
|
|
1,736 |
|
|
|
(88,688 |
) |
|
Total income tax expense (benefit) |
|
$ |
15,325 |
|
|
$ |
17,137 |
|
|
$ |
(79,635 |
) |
Income taxes paid were $16,116, $19,497 and $4,773 for the years ended December 31, 2019, 2018 and 2017, respectively.
The reconciliation of the federal statutory tax rate to the effective income tax rate was as follows:
|
|
|
Year Ended December 31, 2019 |
|
|
Year Ended December 31, 2018 |
|
|
Year Ended December 31, 2017 |
|
|||
|
Statutory U.S. federal income tax rate: |
|
|
21.00 |
% |
|
|
21.00 |
% |
|
|
35.00 |
% |
|
Increase in rate resulting from: |
|
|
|
|
|
|
|
|
|
|
|
|
|
Non-deductible meals & entertainment |
|
|
1.09 |
% |
|
|
0.44 |
% |
|
|
1.01 |
% |
|
Equity compensation |
|
|
48.75 |
% |
|
|
2.53 |
% |
|
|
12.52 |
% |
|
Executive compensation limitation |
|
|
3.01 |
% |
|
|
— |
|
|
|
— |
|
|
State income tax, net of federal income tax effect |
|
|
26.16 |
% |
|
|
8.51 |
% |
|
|
4.50 |
% |
|
Unrecognized tax benefits |
|
|
2.98 |
% |
|
|
— |
|
|
|
— |
|
|
Other, net |
|
|
(0.18 |
)% |
|
|
0.41 |
% |
|
|
0.84 |
% |
|
Research & development tax credit |
|
|
— |
|
|
|
(1.48 |
)% |
|
|
— |
|
|
Federal deferred re-measurement due to change in federal tax rate |
|
|
— |
|
|
|
— |
|
|
|
(465.57 |
)% |
|
Effective rate |
|
|
102.81 |
% |
|
|
31.41 |
% |
|
|
(411.70 |
)% |
74
AssetMark Financial Holdings, Inc.
Notes to Consolidated Financial Statements — Continued
December 31, 2019 and 2018
The Tax Cuts and Jobs Act of 2017 (the “Tax Act”) was signed into law on December 22, 2017. Under the Tax Act, the corporate income tax rate is reduced from a maximum marginal rate of 35% to a flat 21% rate. Under ASC Topic 740, Income Taxes, total effect of tax rate changes on deferred tax balances is recorded as a component of the income tax provision related to continuing operations for the period in which the law is enacted, even if the assets and liabilities relate to other components of the financial statements, such as discontinued operations, a prior period business combination, or items of accumulated other comprehensive income. As a result, the Company’s deferred tax assets and liabilities were revalued using the enacted tax rate of 21% and the total tax effect on deferred tax balances was a tax benefit of $(90,055) during the year ended December 31, 2017. The Tax Act includes other provisions with effective dates for the Company beginning January 1, 2018 and beyond. The Company accounted for these provisions with changes to business-related income, exclusions, deductions and/or credits based on currently available information that is subject to interpretation and continues to evolve. Accounting for these items may be impacted by a number of additional considerations, including, but not limited to, the state-level income tax impacts of the Tax Act, clarifications of or changes to the Tax Act (including the issuance of final regulations), and additional guidance issued by the Securities and Exchange Commission or the Financial Accounting Standards Board.
The components of the net deferred income tax liability were as follows:
|
|
|
December 31, 2019 |
|
|
December 31, 2018 |
|
||
|
Assets: |
|
|
|
|
|
|
|
|
|
Accrued expenses |
|
$ |
8,159 |
|
|
$ |
6,156 |
|
|
Federal benefit of state tax expense |
|
|
5,132 |
|
|
|
4,094 |
|
|
State net operating loss carryforwards |
|
|
14,065 |
|
|
|
14,231 |
|
|
Tax credit carryforwards |
|
|
611 |
|
|
|
961 |
|
|
Other |
|
|
3,436 |
|
|
|
884 |
|
|
Earn-out liability |
|
|
— |
|
|
|
2,117 |
|
|
Gross deferred income tax assets |
|
|
31,403 |
|
|
|
28,443 |
|
|
Valuation allowance |
|
|
— |
|
|
|
— |
|
|
Total deferred income tax assets |
|
|
31,403 |
|
|
|
28,443 |
|
|
Liabilities: |
|
|
|
|
|
|
|
|
|
Other intangible assets |
|
|
161,028 |
|
|
|
159,095 |
|
|
Property and equipment, and capitalized software |
|
|
19,906 |
|
|
|
20,237 |
|
|
Other |
|
|
859 |
|
|
|
226 |
|
|
Total deferred income tax liabilities |
|
|
181,793 |
|
|
|
179,558 |
|
|
Net deferred income tax liability |
|
$ |
150,390 |
|
|
$ |
151,115 |
|
In assessing the realizability of deferred tax assets, the Company considers whether it is more likely than not that some portion or all of the deferred tax assets will not be realized. The ultimate realization of deferred tax assets is dependent upon the generation of future taxable income during the period in which those temporary differences become deductible. The Company considers projected future taxable income and tax planning strategies in making this assessment. During 2019 and 2018, the Company evaluated the realizability of its net deferred tax assets based on available positive and negative evidence. The Company concluded that it is more likely than not that all of the benefits of the deferred tax assets will be realized. As a result, the Company has not established a valuation allowance.
The Company’s state net operating loss carryforwards amounted to $277,881 and $279,444 as of December 31, 2019 and 2018, respectively. It is expected that the utilization limitations of Internal Revenue Code Section 382 will cause $113,873 of the Company’s state net operating loss carryforwards to expire unused, and these amounts are not included in the Company’s gross deferred income tax asset. If unused, the Company’s state net operating loss carryforwards will expire beginning in 2027. The Company had state tax credit carryforwards of $338 and $831 as of December 31, 2019 and 2018, respectively, which do not expire and can be carried forward indefinitely.
75
AssetMark Financial Holdings, Inc.
Notes to Consolidated Financial Statements — Continued
December 31, 2019 and 2018
The reconciliation of the beginning and ending amounts of unrecognized tax benefits was as follows:
|
|
|
December 31, 2019 |
|
|
December 31, 2018 |
|
||
|
Balance, beginning of year |
|
$ |
530 |
|
|
$ |
— |
|
|
Increases related to prior year tax positions |
|
|
2,707 |
|
|
|
— |
|
|
Increases related to current year tax positions |
|
|
164 |
|
|
|
530 |
|
|
Balance, end of year |
|
$ |
3,401 |
|
|
$ |
530 |
|
The Company had unrecognized tax benefits of $3,401 and $530 as of December 31, 2019 and 2018, respectively, solely related to research and development tax credits and states in which the Company had nexus but did not file tax returns. The total amount of unrecognized tax benefits that, if recognized, would affect the Company’s effective tax rate was $2,834 and $495 as of December 31, 2019 and 2018, respectively.
The consolidated statements of income and comprehensive income for the years ended December 31, 2019, 2018 and 2017 included $116, $0 and $0 of interest. The consolidated balance sheet included $107 and $0 of penalties related to unrecognized tax benefits as of December 31, 2019 and 2018, respectively.
The Company files U.S. Federal income tax returns and various state and local tax returns. The Company is no longer subject to U.S. Federal and state tax examinations for years through 2013.
12. Stockholders’ Equity
Each holder of Company common stock is entitled to one vote per share, to receive dividends and, upon liquidation or dissolution, to receive all assets available for distribution to such stockholder. The stockholders have no preemptive or other subscription rights and there are no redemption or sinking fund provisions with respect to such shares.
At the beginning of the year ended December 31, 2019, the Company was a wholly owned subsidiary of AssetMark Holdings LLC (“AssetMark Holdings”), which was organized for the purpose of Huatai Securities Co., Ltd.’s acquisition of the Company effective October 31, 2016. The following information represents the equity information of AssetMark Holdings and does not directly impact the outstanding common shares of the Company. The information is presented to provide information on the Class C common incentive units for which the Company continues to recognize share-based compensation. As of December 31, 2018, there were 100 shares of Company common stock owned by AssetMark Holdings.
Under the terms of the LLC Agreement, approved by all AssetMark Holdings’ common members in October 2016, three common unit classes were authorized and issued as follows:
|
|
• |
Class A and B common units have equal rights and voting privileges |
|
|
• |
Class C common units are non-voting units that were issued to AssetMark employees as part of a share-based employee compensation arrangement (see Note 13). |
76
AssetMark Financial Holdings, Inc.
Notes to Consolidated Financial Statements — Continued
December 31, 2019 and 2018
The table below shows by unit class the number of units outstanding and the related capital contribution as of December 31, 2018. Service members are employees of the Company.
|
(in thousands except unit and share data) |
|
Huatai International Investment Holdings Ltd |
|
|
Service Members |
|
|
Total |
|
|||
|
Class A common units |
|
|
|
|
|
|
|
|
|
|
|
|
|
Capital contribution |
|
$ |
— |
|
|
$ |
4,069 |
|
|
$ |
4,069 |
|
|
Common units |
|
|
— |
|
|
|
40,693 |
|
|
|
40,693 |
|
|
Class B common units |
|
|
|
|
|
|
|
|
|
|
|
|
|
Capital contribution |
|
$ |
768,419 |
|
|
$ |
6,980 |
|
|
$ |
775,399 |
|
|
Common units |
|
|
7,684,191 |
|
|
|
69,993 |
|
|
|
7,754,184 |
|
|
Class C common units |
|
|
|
|
|
|
|
|
|
|
|
|
|
Capital contribution |
|
$ |
— |
|
|
$ |
14,540 |
|
|
$ |
14,540 |
|
|
Common units |
|
|
— |
|
|
|
8,817 |
|
|
|
8,817 |
|
|
Total capital contribution |
|
|
|
|
|
|
|
|
|
|
794,008 |
|
|
(less capital contributions held at Huatai International Investment Holdings Limited) |
|
|
|
|
|
|
|
|
|
|
(158,846 |
) |
|
Total paid-in capital for Company at December 31, 2018 |
|
|
|
|
|
|
|
|
|
$ |
635,162 |
|
On July 5, 2019, the Company filed an amended and restated certificate of incorporation effecting a 661,500-for-one forward stock split. The par value was adjusted to $0.001 per share of common stock in connection with such filing. The number of authorized shares of common stock was increased to 675,000,000 and 75,000,000 shares of preferred stock were authorized to be issued; no preferred stock had been issued as of December 31, 2019. All share and per share data shown in the consolidated financial statements and related notes thereto have been retroactively revised to reflect the forward stock split.
On July 17, 2019, immediately following the pricing of its initial public offering (the “IPO”), AssetMark Holdings liquidated and dissolved and distributed shares of the Company’s common stock to its members as follows: holders of Class A Common Units and Class B Common Units of AssetMark Holdings received an aggregate of 59,840,951 shares of the Company’s common stock, and holders of Class C Common Units of AssetMark Holdings received an aggregate number of restricted stock awards equal to 6,309,049 shares of the Company’s common stock. Upon such liquidation and dissolution, the Company ceased to be a wholly owned subsidiary of AssetMark Holdings. On July 22, 2019, the Company completed its IPO, in which the Company issued and sold an aggregate of 6,250,000 shares of its common stock at a price to the public of $22.00 per share. The Company received aggregate net proceeds of $124.1 million from the IPO after deducting underwriting discounts and commissions and expenses payable by the Company. As of December 31, 2019, the Company had authorized 675,000,000 shares of common stock and 75,000,000 shares of preferred stock, both with a par value of $0.001 per share. As of December 31, 2019, 72,390,080 shares of common stock and zero shares of preferred stock were issued and outstanding.
77
AssetMark Financial Holdings, Inc.
Notes to Consolidated Financial Statements — Continued
December 31, 2019 and 2018
13. Share-Based Employee Compensation
Pre-IPO
Incentive Units
AssetMark Holdings granted share-based compensation in the form of Class C common units (or incentive units) to all officers of the Company in November 2016 pursuant to the terms of the LLC Agreement. The Company had authorized 151,188 incentive units as of December 31, 2018.
The incentive units have both service and performance vesting provisions. The incentive units are divided into two tranches: one tranche consists of “time vesting units” with a service condition while the other tranche consists of “performance vesting units” with both service and market conditions. The fair value of both time vesting units and performance vesting units is measured on grant date and remeasured to fair value at the end of each reporting period. Compensation cost for the time vesting units and performance vesting units is recognized on a straight-line basis over a 5-year requisite service period for 50% of the units and over an 8-year requisite service period for the remaining 50% of the units. An implied service period of 8 years is inferred from the performance condition of the performance vesting units because the performance conditions may be met at multiple dates (i.e. following the 4th, 5th, 6th, 7th and 8th anniversaries of the issuance date). The requisite service period is based on the longer of the derived service period, implicit or explicit service periods.
The Company recorded share-based compensation expense related to the Class C common incentive units of $11,407, $6,568 and $6,920 for the years ended December 31, 2019, 2018 and 2017, respectively. These amounts were included in employee compensation in the accompanying consolidated statements of income and comprehensive income.
For purposes of determining the fair value of the share-based payment awards on the date of the grant and at the end of each reporting period, the Company used a Monte Carlo simulation to evaluate a number of possible outcomes. While the Class C common units have no expiration date, the Company forecasted the possible value of the common units 8 years in the future.
Management will periodically evaluate the assumption and methodologies used to calculate the fair value of the share-based compensation. Circumstances may change and additional data may become available over time, which could result in changes to these assumptions and methodologies.
|
Valuation assumptions: |
|
2018 |
|
|
2017 |
|
||
|
Risk free rate |
|
|
2.49 |
% |
|
|
2.32 |
% |
|
Expected volatility |
|
|
35.0 |
% |
|
|
37.2 |
% |
|
Dividend yield |
|
|
0 |
% |
|
|
0 |
% |
|
Discount for lack of marketability |
|
|
15.2 |
% |
|
|
18.4 |
% |
Incentive unit activity during the year ended December 31, 2018 was as follows:
|
|
|
Number of units |
|
|
Weighted-average remaining contractual term (years) |
|
||
|
Balance at December 31, 2017 |
|
|
8,550.13 |
|
|
|
6.87 |
|
|
Granted |
|
|
283.37 |
|
|
|
7.47 |
|
|
Forfeited |
|
|
(16.67 |
) |
|
|
7.58 |
|
|
Balance at December 31, 2018 |
|
|
8,816.83 |
|
|
|
5.93 |
|
There were no vested units as of December 31, 2018 and 2017. There were zero and $29,051 of total unrecognized compensation cost related to unvested Class C common incentive unit awards as of December 31, 2019 and 2018, respectively. There were additional 120.02 Class C units granted in the three months ended March 31, 2019. The Class C common incentive units were cancelled and new restricted stock awards were distributed on July 17, 2019.
Post-IPO
On July 3, 2019, the Company’s Board of Directors adopted, and the Company’s sole stockholder approved, the 2019 Equity Incentive Plan (the “Plan”), which became effective on July 17, 2019, the date of effectiveness of the Company’s IPO registration
78
AssetMark Financial Holdings, Inc.
Notes to Consolidated Financial Statements — Continued
December 31, 2019 and 2018
statement on Form S-1. As of December 31, 2019, 4,801,954 shares were available for issuance under the Plan, which amount excluded the 85,737 shares of common stock subject to restricted stock units granted under the Plan immediately following the pricing of the IPO.
Restricted Stock Awards
Prior to the liquidation and dissolution of AssetMark Holdings and the IPO, the executive officers of AssetMark Holdings held Class C common units of AssetMark Holdings, which were intended to be treated as profits interests. Immediately following the pricing of the IPO, AssetMark Holdings liquidated and dissolved and distributed shares of the Company’s common stock to its members, including an aggregate number of restricted stock awards (“RSAs”) equal to 6,309,049 shares of the Company’s common stock to the holders of the Class C common units of AssetMark Holdings.
These RSAs are subject to the same vesting schedule as the Class C common units of AssetMark Holdings, with 50% of the RSAs scheduled to vest in three (3) equal installments on the third, fourth and fifth anniversaries of October 31, 2016, and 50% subject to the satisfaction of a performance-based vesting condition. The performance condition for these RSAs—an internal rate of return by AssetMark Holdings of greater than 12%—was satisfied in connection with the IPO. The time-based vesting condition for these RSAs will be satisfied upon the holder’s continued service with the Company through February 2021. In the event that the vesting conditions are not satisfied for any portion of an award, the shares covered by such RSAs will transfer automatically to the Company.
Shares underlying the RSAs are presented as outstanding on the consolidated balance sheets and consolidated statements of stockholders’ equity, as the shares have voting and dividend rights and are thus considered legally outstanding. However, 5,257,541 of these shares for the year ended December 31, 2019 have been excluded from the respective net loss per share calculations because the shares are considered contingently issuable as they are unvested.
Share-based compensation expense related to the RSAs was $23,198 for the year ended December 31, 2019.
There was $89,843 of total unrecognized compensation cost related to unvested RSAs granted under the Plan as of December 31, 2019. These costs are expected to be recognized over a weighted average period of 1.9 years as of December 31, 2019.
Stock Options
In connection with the IPO, the Company issued options to certain officers to acquire an aggregate of 918,981 shares of the Company’s common stock outside of the Plan, with an exercise price of $22 dollars per share. Each of these options is scheduled to vest and become exercisable in substantially equal installments on each of the first three anniversaries of July 18, 2019.
Share-based compensation expense related to the stock options was $1,067 for the year ended December 31, 2019.
The following weighted average assumptions were used to value options granted during the year ended December 31, 2019:
|
|
|
2019 |
|
|
|
Risk free rate |
|
|
1.9 |
% |
|
Expected volatility |
|
|
32.8 |
% |
|
Dividend yield |
|
|
0 |
% |
|
Expected terms (in years) |
|
|
6.0 |
|
Stock option activity during the year ended December 31, 2019 is as follows:
|
|
|
Number of options |
|
|
Weighted-average exercise price |
|
|
Aggregate intrinsic value |
|
|
Weighted-average remaining contractual term (years) |
|
||||
|
Balance at December 31, 2018 |
|
|
— |
|
|
|
|
|
|
|
|
|
|
|
— |
|
|
Granted |
|
|
918,981 |
|
|
$ |
22.00 |
|
|
|
|
|
|
|
|
|
|
Forfeited |
|
|
(10,206 |
) |
|
|
22.00 |
|
|
|
|
|
|
|
|
|
|
Balance at December 31, 2019 |
|
|
908,775 |
|
|
|
22.00 |
|
|
$ |
6,380 |
|
|
|
9.6 |
|
79
AssetMark Financial Holdings, Inc.
Notes to Consolidated Financial Statements — Continued
December 31, 2019 and 2018
There were zero options vested as of December 31, 2019.
The weighted average grant date fair value per share of options granted were $7.73 for the year ended December 31, 2019. There was $5,960 of total unrecognized compensation cost related to unvested stock options granted under the Plan as of December 31, 2019. These costs are expected to be recognized over a weighted-average period of 2.6 years as of December 31, 2019.
Restricted Stock Units
Also in connection with the IPO, the Company issued restricted stock units (“RSUs”) to certain officers covering an aggregate of 85,737 shares of the Company’s common stock under the Plan. Each of these RSUs is scheduled to vest in substantially equal installments on each of the first three anniversaries of July 18, 2019.
RSU activity during the year ended December 31, 2019 was as follows:
|
|
|
Number of RSUs |
|
|
Weighted-average grant-date fair value |
|
||
|
Balance at December 31, 2018 |
|
|
— |
|
|
|
|
|
|
Granted |
|
|
115,737 |
|
|
$ |
22.78 |
|
|
Forfeited |
|
|
(1,693 |
) |
|
|
22.00 |
|
|
Balance at December 31, 2019 |
|
|
114,044 |
|
|
|
22.79 |
|
Share-based compensation expense related to the RSUs was $530 for the year ended December 31, 2019.
There was $2,041 of total unrecognized compensation cost related to unvested RSUs granted under the plan as of December 31, 2019. These costs are expected to be recognized over a weighted average period of 2.6 years as of December 31, 2019. The total fair value of RSUs vested was zero during the year ended December 31, 2019.
14. Employee Benefit Plan
The Company has a tax-qualified defined contribution plan (the “Benefit Plan”). All full-time and part-time employees are eligible to participate in the Benefit Plan upon hire. The Benefit Plan provides retirement benefits, including provisions for early retirement and disability benefits, as well as a tax-deferred savings feature. Participants must attain two years of service to reach full vesting on Company matching contributions. The Company contributed $4,811, $3,334 and $2,985 to the Benefit Plan for the years ended December 31, 2019, 2018 and 2017, respectively.
15. Commitments and Contingencies
Litigation
The Company faces the risk of litigation and regulatory investigations and actions in the ordinary course of operating the Company’s businesses, including the risk of class action lawsuits. The Company’s pending legal and regulatory actions include proceedings specific to the Company and others generally applicable to business practices in the industries in which the Company operates. Plaintiffs in class action and other lawsuits against the Company may seek very large or indeterminate amounts which may remain unknown for substantial periods of time. The Company is also subject to litigation arising out of the Company’s general business activities such as the Company’s contractual and employment relationships. In addition, the Company is also subject to various regulatory inquiries, such as information requests, subpoenas, books and record examinations and market conduct and financial examinations from state, federal and other authorities. A substantial legal liability or a significant regulatory action against the Company could have an adverse effect on the Company’s business, financial condition and results of operations. Moreover, even if the Company ultimately prevails in the litigation, regulatory action or investigation, the Company could suffer significant reputational harm, which could have an adverse effect on the Company’s business, financial condition or results of operations.
The Company is subject to various other legal proceedings. In the opinion of management, after discussions with legal counsel, the ultimate resolution of these matters will not have a material effect on the consolidated financial condition, results of operations or cash flows of the Company.
80
AssetMark Financial Holdings, Inc.
Notes to Consolidated Financial Statements — Continued
December 31, 2019 and 2018
Operating Lease Obligations
The Company has various lease obligations for field offices throughout the United States. These obligations are part of a normal business function. As of December 31, 2019, aggregate minimum future rental commitments under these leases are as follows:
|
Year Ended December 31: |
|
Cash obligations |
|
|
|
|
$ |
3,267 |
|
|
|
2021 |
|
|
5,244 |
|
|
2022 |
|
|
5,701 |
|
|
2023 |
|
|
5,749 |
|
|
2024 and thereafter |
|
|
25,263 |
|
|
Total |
|
$ |
45,224 |
|
Total rental expense of $3,629, $3,126 and $2,858 under operating leases were charged to operations for the years ended December 31, 2019, 2018 and 2017, respectively, and was included in general and operating expenses in the consolidated statements of income and comprehensive income.
16. Net Capital and Minimum Capital Requirements
AssetMark Trust Company, regulated by the Arizona Department of Financial Institutions (“ADFI”) is required by state regulation 6-856 to maintain $7,750 and $5,750 in liquid capital (as defined by the ADFI) based on asset levels as of December 31, 2019 and 2018, respectively.
AssetMark Brokerage, LLC, regulated by the SEC, is required to maintain $6 and $18 in net capital (as defined by the SEC) as of December 31, 2019 and 2018, respectively.
As of December 31, 2019 and 2018, these entities have met the liquid capital requirements set forth by their respective regulatory authority.
17. Related Party Transactions
In December 2018, the Company paid cash dividends and return of capital to AssetMark Holdings, LLC totaling $233,846.
Additionally, due to the outstanding Class C common units being accounted for as a liability-classified award in 2018 and prior periods, AssetMark Holdings maintained an investment in the Company and an offsetting share-based compensation liability of $14,014 as of December 31, 2018, which represented the estimated value of the share-based employee compensation. The Company recorded these amounts as expense and an increase to paid-in capital.
See Note 13 for more detail on the share-based employee compensation.
81
AssetMark Financial Holdings, Inc.
Notes to Consolidated Financial Statements — Continued
December 31, 2019 and 2018
18. Net Income (Loss) Per Share Attributable to Common Stockholders
Basic net income (loss) per share is computed by dividing net income (loss) by the weighted average number of shares of common stock outstanding for the period. For the calculation of diluted earnings per share, the basic weighted average number of shares is increased by the dilutive effect of stock options and restricted stock units, if dilutive.
The following table provides a reconciliation of the numerators and denominators used in computing basic and diluted net income per (loss) share attributable to common stockholders:
|
|
|
Year Ended December 31, |
|
|||||||||
|
|
|
2019 |
|
|
2018 |
|
|
2017 |
|
|||
|
Basic income (loss) per share calculation: |
|
|
|
|
|
|
|
|
|
|
|
|
|
Net income (loss) |
|
$ |
(420 |
) |
|
$ |
37,426 |
|
|
$ |
98,978 |
|
|
|
|
|
|
|
|
|
|
|
|
|
|
|
|
Weighted average shares used in computing net income (loss) per share, basic and diluted |
|
|
66,298,553 |
|
|
|
66,150,000 |
|
|
|
66,150,000 |
|
|
Net income (loss) per share, basic and diluted |
|
$ |
(0.01 |
) |
|
$ |
0.57 |
|
|
$ |
1.50 |
|
Since the Company was in a loss position for the year ended 2019, basic net loss per share is the same as diluted net loss per share, as the inclusion of all potential common shares outstanding would have been anti-dilutive. Potentially dilutive securities that were not included in the diluted per share calculations because they would have been anti-dilutive were as follows:
|
|
|
As of December 31, |
|
|||||||||
|
|
|
2019 |
|
|
2018 |
|
|
2017 |
|
|||
|
RSAs |
|
|
5,247,621 |
|
|
|
— |
|
|
|
— |
|
|
Stock Options |
|
|
908,775 |
|
|
|
— |
|
|
|
— |
|
|
RSUs |
|
|
114,044 |
|
|
|
— |
|
|
|
— |
|
|
Total |
|
|
6,270,440 |
|
|
|
— |
|
|
|
— |
|
19. Subsequent Events
On September 30, 2019, the Company entered into a unit purchase agreement to acquire WBI OBS Financial, LLC, subject to closing conditions that include approval from CFIUS. On February 29, 2020, the Company closed the acquisition and paid a final purchase price of $21,496, net of working capital adjustments.
82
Item 9. Changes in and Disagreements with Accountants on Accounting and Financial Disclosure
None.
Item 9A. Controls and Procedures
Evaluation of Disclosure Controls and Procedures
Our management, with the participation of our principal executive officer and principal financial officer, evaluated the effectiveness of the design and operation of our disclosure controls and procedures (as such term is defined in Rules 13a-15(e) and 15d-15(e) under the Exchange Act) as of December 31, 2019. Our disclosure controls and procedures are designed to provide reasonable assurance that information required to be disclosed in the reports we file or submit under the Exchange Act is recorded, processed, summarized and reported within the time periods specified in the SEC’s rules and forms and that such information is accumulated and communicated to management, including the principal executive officer and principal financial officer, to allow timely decisions regarding required disclosure. Based on such evaluation, our principal executive officer and principal financial officer concluded that, as of December 31, 2019, our disclosure controls and procedures were effective, at the reasonable assurance level.
Management’s Report on Internal Control Over Financial Reporting
This Annual Report on Form 10-K does not include a report of management’s assessment regarding internal control over financial reporting or an attestation report of our independent registered public accounting firm as permitted during the transition period established by the rules of the SEC for newly public companies.
Changes in Internal Control over Financial Reporting
There was no change in our internal control over financial reporting (as defined in Rules 13a-15(f) and 15d-15(f) under the Exchange Act) that occurred during the period covered by this Annual Report on Form 10-K that has materially affected, or is reasonably likely to materially affect, our internal control over financial reporting.
Inherent Limitations on Effectiveness of Controls
Any controls and procedures, no matter how well designed and operated, can only provide reasonable assurance of achieving the desired control objective and management necessarily applies its judgment in evaluating the cost-benefit relationship of all possible controls and procedures. Further, no evaluation of controls can provide absolute assurance that misstatements due to error or fraud will not occur or that all control issues and instances of fraud, if any, within our company have been detected.
Not applicable.
83
Item 10. Directors, Executive Officers and Corporate Governance
We maintain a set of Corporate Standards applicable to all of our employees, including our Chief Executive Officer and Chief Financial Officer, which is a “Code of Ethics for Senior Financial Officers” as defined by applicable rules of the SEC. These standards are publicly available on our website at ir.assetmark.com. If we make any amendments to these standards other than technical, administrative or other non-substantive amendments, or grant any waivers, including implicit waivers, from a provision of these standards, we will disclose the nature of the amendment or waiver, its effective date and to whom it applies on our website at ir.assetmark.com or in a Current Report on Form 8-K filed with the SEC.
The remaining information required by this Item, including information about our Directors, Executive Officers and Audit Committee, is incorporated by reference to the definitive Proxy Statement for our 2020 Annual Meeting of Stockholders, which will be filed with the SEC no later than 120 days after December 31, 2019 pursuant to Regulation 14A.
Item 11. Executive Compensation
The information required by this Item is incorporated by reference to the definitive Proxy Statement for our 2020 Annual Meeting of Stockholders, which will be filed with the SEC no later than 120 days after December 31, 2019 pursuant to Regulation 14A.
Item 12. Security Ownership of Certain Beneficial Owners and Management and Related Stockholder Matters
The information required by this Item is incorporated by reference to the definitive Proxy Statement for our 2020 Annual Meeting of Stockholders, which will be filed with the SEC no later than 120 days after December 31, 2019 pursuant to Regulation 14A.
Item 13. Certain Relationships and Related Transactions, and Director Independence
The information required by this Item is incorporated by reference to the definitive Proxy Statement for our 2020 Annual Meeting of Stockholders, which will be filed with the SEC no later than 120 days after December 31, 2019 pursuant to Regulation 14A.
Item 14. Principal Accounting Fees and Services
The information required by this Item is incorporated by reference to the definitive Proxy Statement for our 2020 Annual Meeting of Stockholders, which will be filed with the SEC no later than 120 days after December 31, 2019 pursuant to Regulation 14A.
84
Item 15. Exhibits and Financial Statement Schedules
|
|
(a) |
Financial Statements |
The information concerning our financial statements and the Report of Independent Registered Public Accounting Firm required by this Item are incorporated by reference herein to the section of this Annual Report on Form 10-K in Item 8 titled “Consolidated Financial Statements and Supplementary Data.”
|
|
(b) |
Exhibits |
See the Exhibit Index immediately following the section of this Annual Report on Form 10-K in Item 16 titled “Form 10-K Summary.”
|
|
(c) |
Financial Statement Schedules |
All schedules have been omitted because the required information is not present or not present in amounts sufficient to require submission of the schedules, or because the information required is included in the section of this Annual Report on Form 10-K in Item 8 titled the “Consolidated Financial Statements and Supplementary Data.”
Not applicable.
85
|
Exhibit Number |
|
Exhibit Description |
|
Form |
|
File No. |
|
Exhibit |
|
Filing Date |
|
Filed Herewith |
|
3.1 |
|
Amended and Restated Certificate of Incorporation of the Company |
|
S-1/A |
|
333-232312 |
|
3.1 |
|
July 8, 2019 |
|
|
|
3.2 |
|
|
8-K |
|
001-38980 |
|
3.1 |
|
July 22, 2019 |
|
|
|
|
4.1 |
|
|
S-1/A |
|
333-232312 |
|
4.1 |
|
July 8, 2019 |
|
|
|
|
4.2 |
|
|
10-Q |
|
001-38980 |
|
4.1 |
|
August 28, 2019 |
|
|
|
|
4.3 |
|
|
|
|
|
|
|
|
|
|
X |
|
|
10.1 |
|
|
S-1/A |
|
333-232312 |
|
10.2 |
|
July 8, 2019 |
|
|
|
|
10.2 |
|
|
10-Q |
|
001-38980 |
|
10.2 |
|
August 28, 2019 |
|
|
|
|
10.2 |
|
|
S-1 |
|
333-232312 |
|
10.12 |
|
June 24, 2019 |
|
|
|
|
10.3# |
|
|
8-K |
|
001-38980 |
|
10.1 |
|
August 28, 2019 |
|
|
|
|
10.4# |
|
|
S-1/A |
|
333-232312 |
|
10.10 |
|
July 10, 2019 |
|
|
|
|
10.5# |
|
|
S-1/A |
|
333-232312 |
|
10.11 |
|
July 10, 2019 |
|
|
|
|
21.1 |
|
|
|
|
|
|
|
|
|
|
X |
|
|
23.1 |
|
Consent of KPMG LLP, independent registered public accounting firm |
|
|
|
|
|
|
|
|
|
X |
|
23.2 |
|
Consent of Crowe LLP, independent registered public accounting firm |
|
|
|
|
|
|
|
|
|
X |
|
31.1 |
|
|
|
|
|
|
|
|
|
|
X |
|
|
31.2 |
|
|
|
|
|
|
|
|
|
|
X |
|
|
32.1* |
|
|
|
|
|
|
|
|
|
|
X |
|
|
32.2* |
|
|
|
|
|
|
|
|
|
|
X |
|
|
101.INS |
|
XBRL Instance Document |
|
|
|
|
|
|
|
|
|
X |
|
101.SCH |
|
XBRL Taxonomy Extension Schema Document |
|
|
|
|
|
|
|
|
|
X |
|
101.CAL |
|
XBRL Taxonomy Extension Calculation Linkbase Document |
|
|
|
|
|
|
|
|
|
X |
|
101.DEF |
|
XBRL Taxonomy Extension Definition Linkbase Document |
|
|
|
|
|
|
|
|
|
X |
|
101.LAB |
|
XBRL Taxonomy Extension Label Linkbase Document |
|
|
|
|
|
|
|
|
|
X |
|
101.PRE |
|
XBRL Taxonomy Extension Presentation Linkbase Document |
|
|
|
|
|
|
|
|
|
X |
|
# |
Indicates management contract or compensatory plan, contract or agreement. |
|
* |
The certifications furnished in Exhibit 32.1 and Exhibit 32.2 hereto are deemed to accompany this Annual Report on Form 10-K and will not be deemed “filed” for purposes of Section 18 of the Securities Exchange Act of 1934, as amended, except to the extent that the registrant specifically incorporates them by reference. |
86
Pursuant to the requirements of the Securities Exchange Act of 1934, the registrant has duly caused this Annual Report on Form 10-K to be signed on its behalf by the undersigned, thereunto duly authorized, in Concord, California, on the day of March 13, 2020.
|
|
|
ASSETMARK FINANCIAL HOLDINGS, INC. |
|
|
|
|
|
|
|
|
|
By: |
/s/ Charles Goldman |
|
|
|
|
Charles Goldman |
|
|
|
|
Chief Executive Officer |
|
|
|
|
(Principal Executive Officer) |
POWER OF ATTORNEY
KNOW ALL PERSONS BY THESE PRESENTS, that each person whose signature appears below hereby constitutes and appoints Charles Goldman and Gary Zyla, and each of them, as his or her true and lawful agent, proxy and attorney-in-fact, with full power of substitution and resubstitution, for him or her and in his or her name, place and stead, in any and all capacities, to sign any and all amendments to this Annual Report on Form 10-K, and to file the same, with all exhibits thereto, and all other documents in connection therewith, with the Securities and Exchange Commission, granting unto each said attorney-in-fact and agent full power and authority to do and perform each and every act and thing requisite and necessary to be done in connection therewith, as fully to all intents and purposes as he or she might or could do in person, hereby ratifying and confirming all that said attorneys-in-fact and agents, or either of them, or their, his or her substitute or substitutes, may lawfully do or cause to be done by virtue thereof.
Pursuant to the requirements of the Securities Act, this Annual Report on Form 10-K has been signed by the following persons in the capacities and on the dates indicated.
|
Signature |
|
Title |
|
Date |
|
|
|
|
|
|
|
/s/ Charles Goldman
Charles Goldman |
|
Director and Chief Executive Officer |
|
March 13, 2020 |
|
|
|
|
|
|
|
/s/ Gary Zyla
Gary Zyla |
|
Chief Financial Officer |
|
March 13, 2020 |
|
|
|
|
|
|
|
/s/ John Hahn
John Hahn |
|
Senior Vice President, Finance |
|
March 13, 2020 |
|
|
|
|
|
|
|
/s/ Xiaodan Liu
Xiaodan Liu |
|
Chairman of the Board |
|
March 13, 2020 |
|
|
|
|
|
|
|
/s/ Rohit Bhagat
Rohit Bhagat |
|
Director |
|
March 13, 2020 |
|
|
|
|
|
|
|
/s/ Patricia Guinn
Patricia Guinn |
|
Director |
|
March 13, 2020 |
|
|
|
|
|
|
|
/s/ Bryan Lin
Bryan Lin |
|
Director |
|
March 13, 2020 |
|
|
|
|
|
|
|
/s/ Ying Sun
Ying Sun |
|
Director |
|
March 13, 2020 |
|
|
|
|
|
|
|
/s/ Yi Zhou
Yi Zhou |
|
Director |
|
March 13, 2020 |
87