Attached files
| file | filename |
|---|---|
| 8-K - FORM 8-K - Virtu Financial, Inc. | tm2119139d1_8k.htm |
Exhibit 99.1
 |
Piper Sandler Market Structure Conference June 2021 Virtu Financial Update 2021 Virtu Financial. All rights reserved. Not to be reproduced or retransmitted without permission. |
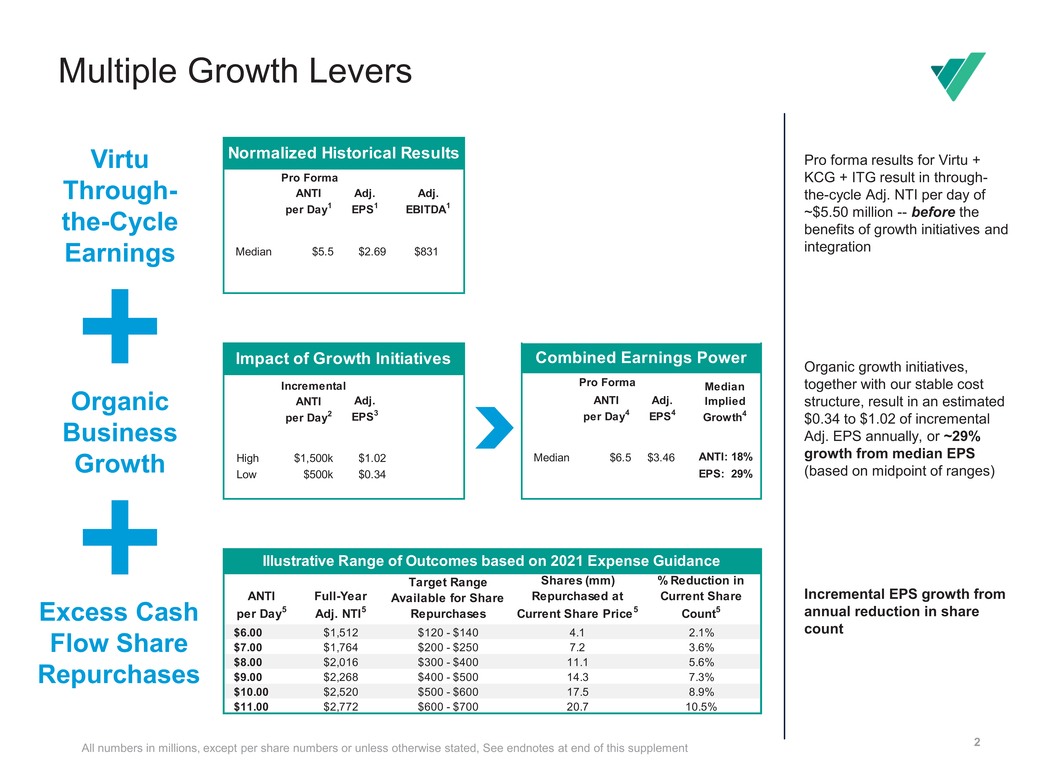 |
Multiple Growth Levers Virtu Normalized Historical Results Pro Forma Pro forma results for Virtu + KCG + ITG result in through-Through-the-Cycle ANTI per Day1 Adj. EPS1 Adj. EBITDA1 the-cycle Adj. NTI per day of ~$5.50 million --before the benefits of growth initiatives and Median$5.5$2.69$831 Impact of Growth Initiatives Combined Earnings Power integration Organic growth initiatives, Organic Business Incremental ANTI per Day2 Adj. EPS3 Pro Forma ANTI per Day4 Adj. EPS4 Median Implied Growth4 together with our stable cost structure, result in an estimated $0.34 to $1.02 of incremental Adj. EPS annually, or ~29% Growth Excess Cash Flow Share Repurchases High$1,500k$1.02 Low$500k$0.34 Median$6.5$3.46 ANTI: 18% EPS: 29% growth from median EPS (based on midpoint of ranges) Incremental EPS growth from annual reduction in share count Illustrative Range of Outcomes based on 2021 Expense Guidance ANTI per Day5 Full-Year Adj. NTI5 Target Range Available for Share Repurchases Shares (mm) Repurchased at Current Share Price5 % Reduction in Current Share Count5 $6.00 $1,512 $120 - $140 4.1 2.1% $7.00 $1,764 $200 - $250 7.2 3.6% $8.00 $2,016 $300 - $400 11.1 5.6% $9.00 $2,268 $400 - $500 14.3 7.3% $10.00 $2,520 $500 - $600 17.5 8.9% $11.00 $2,772 $600 - $700 20.7 10.5% |
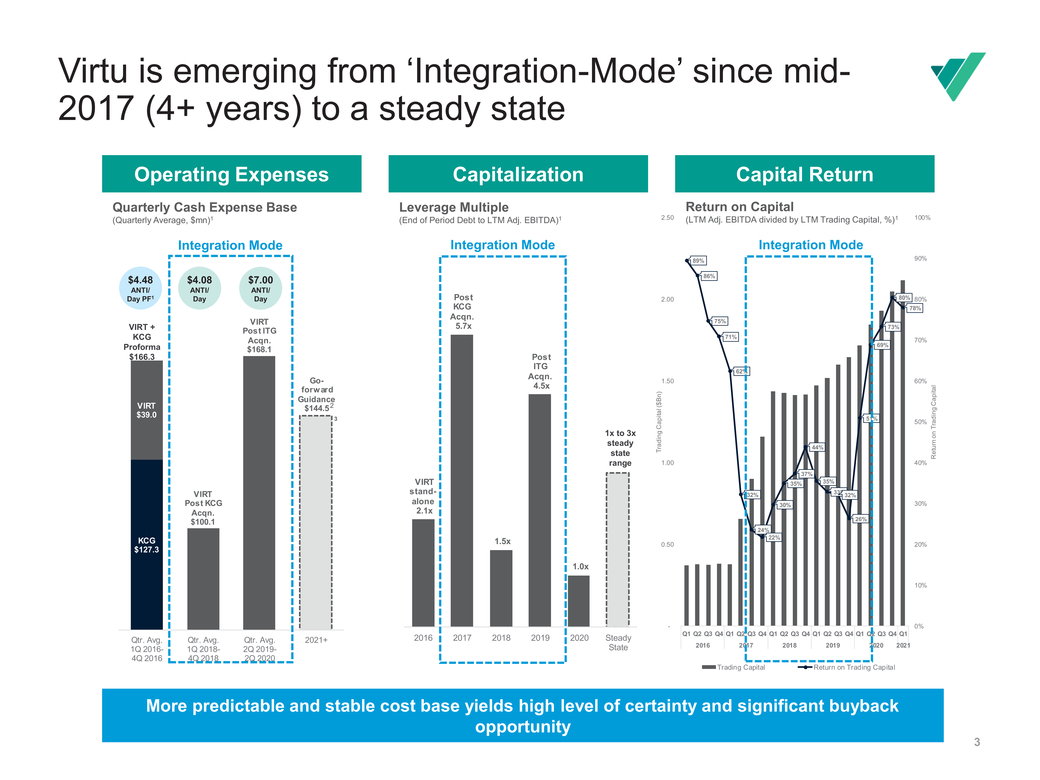 |
Virtu is emerging from ‘Integration-Mode’ since mid-2017 (4+ years) to a steady state Operating ExpensesCapitalization Capital Return Quarterly Cash Expense Base (Quarterly Average, $mn)1 Leverage Multiple (End of Period Debt to LTM Adj. EBITDA)1 2.50 Return on Capital (LTM Adj. EBITDA divided by LTM Trading Capital, %)1 100% Integration Mode Integration ModeIntegration Mode 89% 90% VIRT $39.0 Post ITG KCGAcqn. Proforma$168.1 $166.3 $144.5 2 3 Post ITG Acqn. 4.5x Trading Capital ($Bn) 71% 62% Return on Trading Capital VIRT Post KCG Acqn. $100.1 VIRT s tand-alone 2.1x 32% 24% 37% 51% 50% 1x to 3x steady state 44% range 1.00 40% 30% 35% 33%32% 26% 30% KCG $127.3 1.5x 1.0x 0.50 22% 20% 10% Qtr. Avg. 1Q 2016-4Q 2016 Qtr. Avg. 1Q 2018-4Q 2018 Qtr. Avg. 2Q 2019-2Q 2020 2021+ 20162017201820192020Steady State -0% Q1 Q2 Q3 Q4 Q1 Q2 Q3 Q4 Q1 Q2 Q3 Q4 Q1 Q2 Q3 Q4 Q1 Q2 Q3 Q4 Q1 20162017201820192020 2021 Trading CapitalReturn on Trading Capital More predictable and stable cost base yields high level of certainty and significant buyback opportunity 3 |
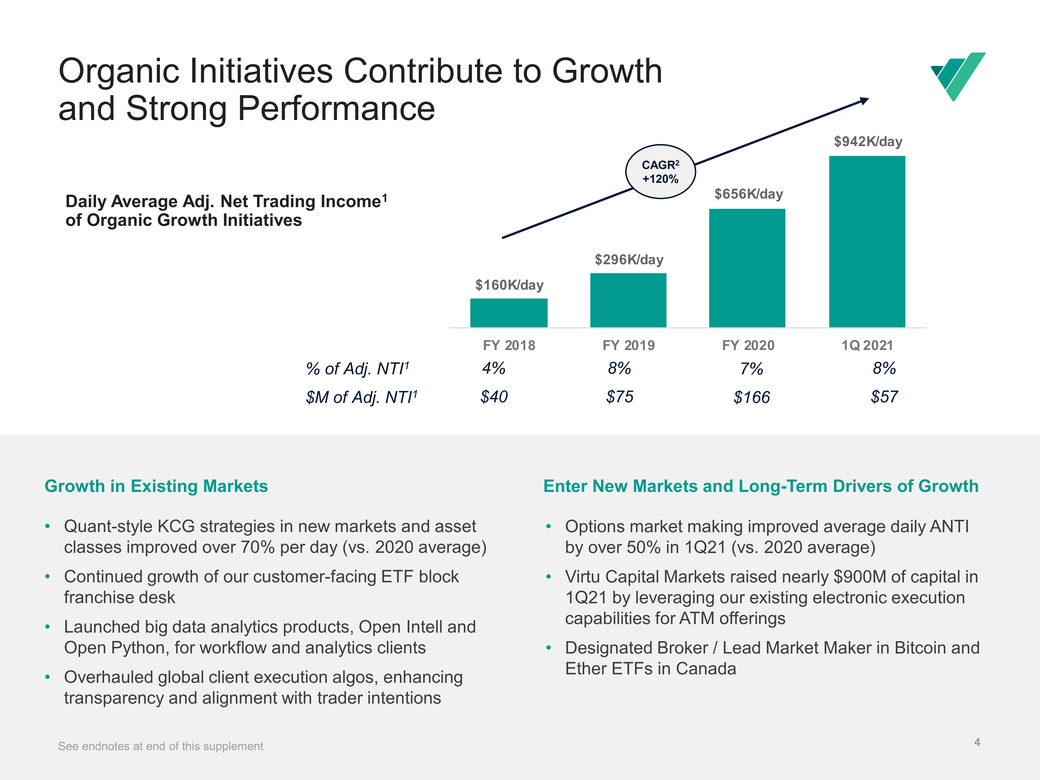 |
Organic Initiatives Contribute to Growth and Strong Performance $942K/day Daily Average Adj. Net Trading Income1 of Organic Growth Initiatives CAGR2 +120% $656K/day $160K/day $296K/day FY 2018FY 2019FY 20201Q 2021 % of Adj. NTI1 $M of Adj. NTI1 4% $40 8% $75 7% $166 8% $57 Growth in Existing Markets Enter New Markets and Long-Term Drivers of Growth Quant-style KCG strategies in new markets and asset classes improved over 70% per day (vs. 2020 average) Continued growth of our customer-facing ETF block franchise desk Launched big data analytics products, Open Intell and Open Python, for workflow and analytics clients Overhauled global client execution algos, enhancing transparency and alignment with trader intentions Options market making improved average daily ANTI by over 50% in 1Q21 (vs. 2020 average) Virtu Capital Markets raised nearly $900M of capital in 1Q21 by leveraging our existing electronic execution capabilities for ATM offerings Designated Broker / Lead Market Maker in Bitcoin and Ether ETFs in Canada See endnotes at end of this supplement See endnotes at end of this supplement4 |
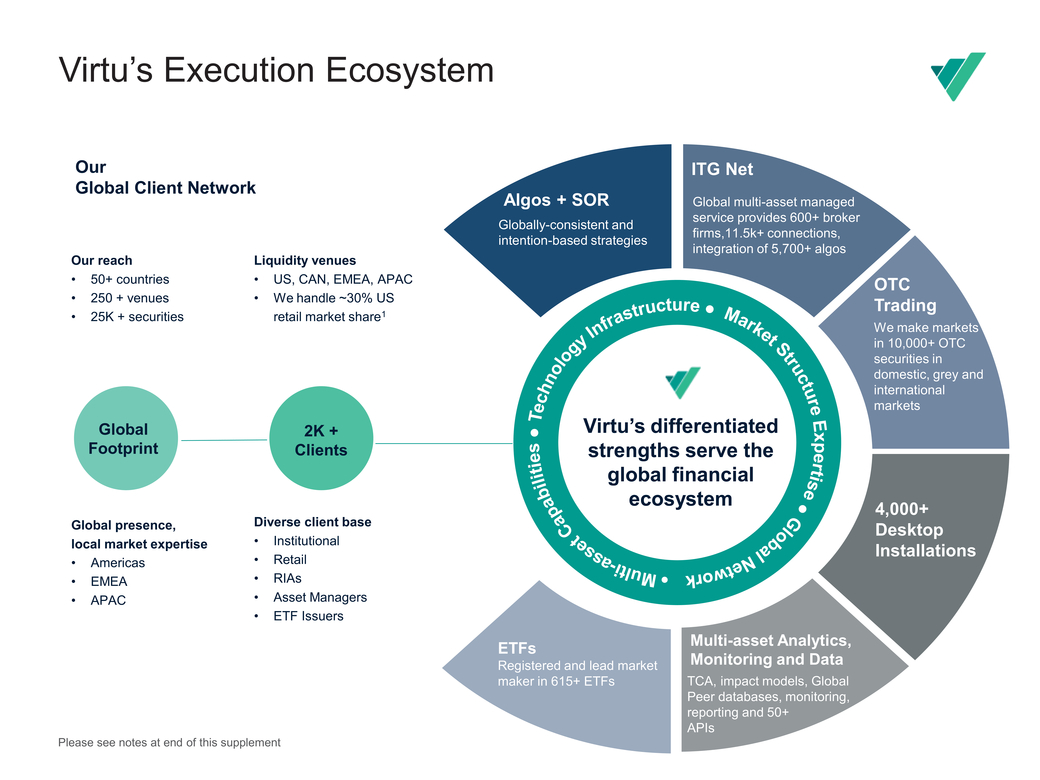 |
Our Global Client Network Algos + SOR Globally-consistent and intention-based strategies ITG Net Global multi-asset managed service provides 600+ broker firms,11.5k+ connections, integration of 5,700+ algos 12.5K Our reach 50+ countries 250 + venues 25K + securities Liquidity venues US, CAN, EMEA, APAC We handle ~30% US retail market share1 OTC Trading We make markets in 10,000+ OTC securities in domestic, grey and international markets Global Footprint 2K + Clients Virtu’s differentiated strengths serve the global financial ecosystem 4,000+ Global presence, local market expertise Americas EMEA APAC Diverse client base Institutional Retail RIAs Asset Managers ETF Issuers ETFs Registered and lead market maker in 615+ ETFs Multi-asset Analytics, Monitoring and Data TCA, impact models, Global Peer databases, monitoring, reporting and 50+ APIs Desktop Installations Please see notes at end of this supplement |
 |
Appendix and End Notes |
 |
[LOGO] |
 |
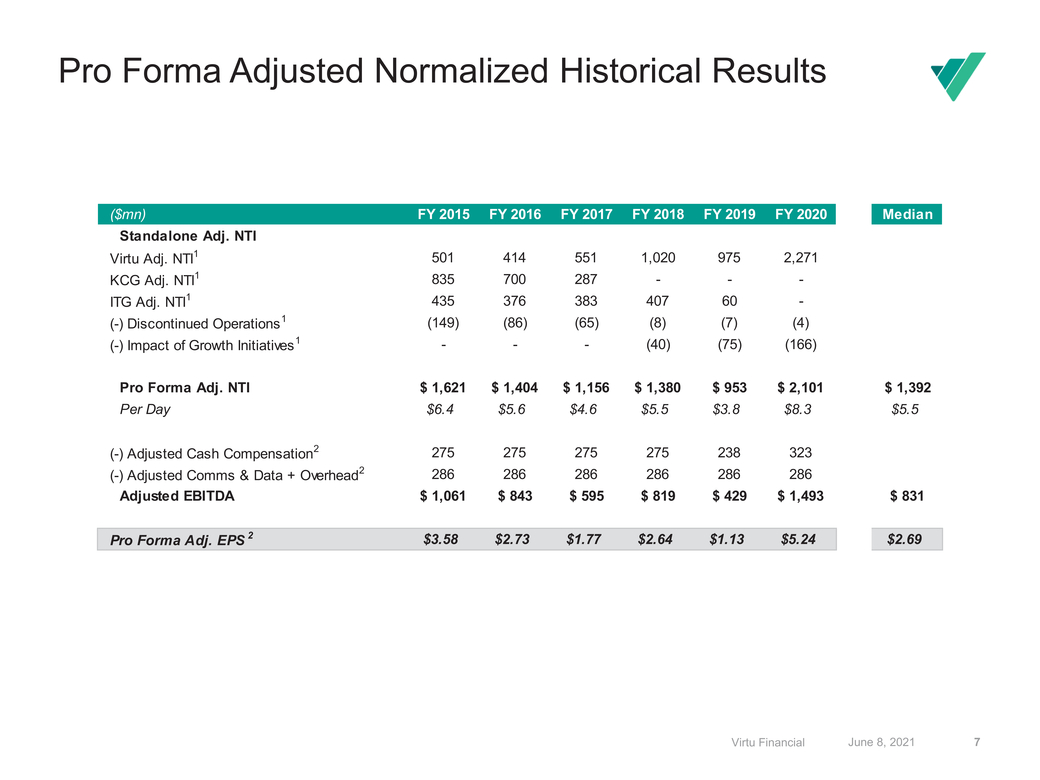
Slide 2 This reflects a non-GAAP measure. Please see a reconciliation to the corresponding GAAP measure in the Virtu filed presentations, found here: https://ir.virtu.com/events-and-presentations/default.aspx. Please see the Appendix for the pro forma build. This reflects a non-GAAP measure. Please see a reconciliation to the corresponding GAAP measure in the Virtu filed presentations, found here: https://ir.virtu.com/events-and-presentations/default.aspx. The range of Incremental ANTI per day due to growth initiatives reflects a Virtu management estimate of long term steady state ANTI from growth initiatives. Incremental EPS uses a trading day count of 252 to calculate full-year ANTI, 80% pre-tax margin and a 24% tax rate. Compares the results from the median Incremental ANTI to the median historical results. Share count used is the 1Q 2021 weighted average share count of 197mn shares. See Notes 1-4 on Slide 1 for a description of the historical and incremental results. This reflects a non-GAAP measure. Figures are shown for illustrative purposes only. Current share price used is $31.46. Current share count uses the 1Q 2021 weighted average share count of 197mn shares. Slide 3 This reflects a non-GAAP measure. Please reference VIRT filed presentations for a reconciliation to the corresponding GAAP measure found here: https://ir.virtu.com/events-and-presentations/default.aspx. Reflects the top of the range for 2021 operating expense guidance. Slide 4 This reflects a non-GAAP measure. Please reference VIRT filed presentations for a reconciliation to the corresponding GAAP measure found here: https://ir.virtu.com/events-and-presentations/default.aspx. Organic Growth Initiatives CAGR measures the annually-compounded rate of return of Organic Growth Initiatives Daily Average ANTI over the 2.25-year period from 1Q 2018 to 1Q 2021 Slide 5 1.Retail Order flow is based upon SEC Rule 605 data, Virtu Financial, April 2021. Source Virtu Financial Slide 7 This reflects a non-GAAP measure. Please see a reconciliation to the corresponding GAAP measure in the Virtu filed presentations, found here: https://ir.virtu.com/events-and-presentations/default.aspx. Pro forma ANTI reflects the actual ANTI values of Virtu, as well as of KCG pre-acquisition for the years 2015-2016 and Jan-Aug 2017, and of ITG pre-acquisition for the years 2015-2018 and Jan-Feb 2019. Pro forma ANTI excludes asset sales BondPoint and MATCHNow, as well as the wind-down of the KCG strategy GQS. Pro forma ANTI excludes the actual impact to Virtu of the Growth Initiatives. The trading day count used to derive ANTI per Day from total ANTI is 252, 252, 251, 251, 252, and 253 for the periods 2015, 2016, 2017, 2018, 2019, and 2020, respectively. This reflects a non-GAAP measure. Please see a reconciliation to the corresponding GAAP measure in the Virtu filed presentations, found here: https://ir.virtu.com/events-and-presentations/default.aspx. EBITDA for each period reflects the actual proforma ANTI reduced by the 2021 guidance cash expenses. Please reference Notes 1 of Slide 1 for a description of PF ANTI. Cash Compensation uses the 2021 midpoint guidance in each of the years 2015, 2016, 2017, and 2018. In 2019, cash compensation is 15% of ANTI due to lower performance in that period. Actual cash compensation of $323mn is used in 2020, to reflect higher compensation due to higher performance in that period. EPS for each period takes into account the 2021 midpoint guidance D&A in each period of $65mn, the financing interest reflecting the 1Q 2021 beginning debt amount of $1670mn at a 4.30% annual interest rate, and a 24% tax rate for VF LLC. The share count used to calculate EPS is the 1Q 2021 weighted average share count of 197mn shares. |