Attached files
| file | filename |
|---|---|
| EX-31.1 - EX-31.1 - Virtu Financial, Inc. | virt-20151231ex311553a51.htm |
| EX-31.2 - EX-31.2 - Virtu Financial, Inc. | virt-20151231ex312317026.htm |
| EX-32.2 - EX-32.2 - Virtu Financial, Inc. | virt-20151231ex322dfbba6.htm |
| EX-23.1 - EX-23.1 - Virtu Financial, Inc. | virt-20151231ex231a58859.htm |
| EX-32.1 - EX-32.1 - Virtu Financial, Inc. | virt-20151231ex321b36a86.htm |
| EX-21.1 - EX-21.1 - Virtu Financial, Inc. | virt-20151231ex211867833.htm |
UNITED STATES
SECURITIES AND EXCHANGE COMMISSION
Washington, D.C. 20549
FORM 10-K
(Mark One)
☒ ANNUAL REPORT PURSUANT TO SECTION 13 OR 15 (d) OF THE SECURITIES EXCHANGE ACT OF 1934
For the year ended December 31, 2015
or
☐ TRANSITION REPORT PURSUANT TO SECTION 13 OR 15 (d) OF THE SECURITIES EXCHANGE ACT OF 1934
For the transition period from to
Commission file number: 001-37352
Virtu Financial, Inc.
(Exact name of registrant as specified in its charter)
|
Delaware |
32-0420206 |
|
(State or other jurisdiction of incorporation or organization) |
(I.R.S. Employer Identification No.) |
|
900 Third Avenue, 29th Floor |
10022 |
|
(Address of principal executive offices) |
(Zip Code) |
(212) 418-0100
(Registrant’s telephone number, including area code)
(Former name, former address and former fiscal year, if changed since last report)
Indicate by check mark if the registrant is a well-known seasoned issuer, as defined in Rule 405 of the Securities Act. Yes ☐ No ☒
Indicate by check mark if the registrant is not required to file reports pursuant to Section 13 or Section 15(d) of the Exchange Act. Yes ☐ No ☒
Indicate by check mark whether the registrant (1) has filed all reports required to be filed by Section 13 or 15 (d) of the Securities Exchange Act of 1934 during the preceding 12 months (or for such shorter period that the registrant was required to file such reports), and (2) has been subject to such filing requirements for the past 90 days. Yes ☒ No ☐
Indicate by check mark whether the registrant has submitted electronically and posted on its corporate Web site, if any, every Interactive Data File required to be submitted and posted pursuant to Rule 405 of Regulation S-T (§232.405 of this chapter) during the preceding 12 months (or for such shorter period that the registrant was required to submit and post such files). Yes ☒ No ☐
Indicate by check mark if disclosure of delinquent filers pursuant to Item 405 of Regulation S-K is not contained herein, and will not be contained, to the best of registrant’s knowledge, in definitive proxy or information statements incorporated by reference in Part III of this Form 10-K or any amendment to this Form 10-K. ☐
Indicate by check mark whether the registrant is a large accelerated filer, an accelerated filer, a non-accelerated filer, or a smaller reporting company. See the definitions of “large accelerated filer,” “accelerated filer” and “smaller reporting company” in Rule 12b-2 of the Exchange Act.
|
Large accelerated filer ☐ |
Accelerated filer ☐ |
Non-accelerated filer ☒ |
Smaller reporting company ☐ |
|
|
|
(Do not check if a Smaller Reporting Company) |
|
Indicate by check mark whether the registrant is a shell company (as defined in Rule 12b-2 of the Exchange Act). Yes ☐ No ☒
The aggregate market value of voting and non-voting common stock held by non-affiliates of the registrant as of June 30, 2015 was approximately $735.6 million, based on the closing price of $23.48 per share as reported by NASDAQ on such date.
As of March 25, 2016, the Company has the following classes of common stock outstanding:
|
Class of Stock |
|
Shares Outstanding |
|
|
Class A common stock, par value $0.00001 per share |
|
38,210,209 |
|
|
Class C common stock, par value $0.00001 per share |
|
20,976,598 |
|
|
Class D common stock, par value $0.00001 per share |
|
79,610,490 |
|
Portions of Part III of this Form 10-K are incorporated by reference from the Registrant’s definitive proxy statement (the “2016 Proxy Statement”) for its 2016 annual meeting of shareholders to be filed with the Securities and Exchange Commission no later than 120 days after the end of the Registrant’s fiscal year.
VIRTU FINANCIAL, INC. AND SUBSIDIARIES
INDEX TO FORM 10-K
FOR THE YEAR ENDED DECEMBER 31, 2015
|
|
|
|
|
PAGE |
|
|
|
|
3 | |
|
|
|
4 | ||
|
|
|
16 | ||
|
|
|
37 | ||
|
|
|
37 | ||
|
|
|
37 | ||
|
|
|
37 | ||
|
|
|
|
|
|
|
|
|
|
|
|
|
|
|
38 | ||
|
|
|
40 | ||
|
|
MANAGEMENT’S DISCUSSION AND ANALYSIS OF FINANCIAL CONDITION AND RESULTS OF OPERATIONS |
|
43 | |
|
|
|
65 | ||
|
|
|
67 | ||
|
|
CHANGES IN AND DISAGREEMENTS WITH ACCOUNTANTS ON ACCOUNTING AND FINANCIAL DISCLOSURE |
|
109 | |
|
|
|
109 | ||
|
|
|
109 | ||
|
|
|
|
|
|
|
|
|
|
|
|
|
|
|
110 | ||
|
|
|
110 | ||
|
|
SECURITY OWNERSHIP OF CERTAIN BENEFICIAL OWNERS AND MANAGEMENT AND RELATED STOCKHOLDER MATTERS |
|
110 | |
|
|
CERTAIN RELATIONSHIPS AND RELATED TRANSACTIONS, AND DIRECTOR INDEPENDENCE |
|
110 | |
|
|
|
110 | ||
|
|
|
|
|
|
|
|
|
|
|
|
|
|
|
111 | ||
|
|
|
|
113 |
2
CAUTIONARY NOTE REGARDING FORWARD LOOKING STATEMENTS
This Form 10-K contains forward‑looking statements. You should not place undue reliance on forward‑looking statements because they are subject to numerous uncertainties and factors relating to our operations and business environment, all of which are difficult to predict and many of which are beyond our control. Forward‑looking statements include information concerning our possible or assumed future results of operations, including descriptions of our business strategy. These forward‑looking statements can be identified by the use of forward‑looking terminology, including the terms “may,” “will,” “should,” “believe,” “expect,” “anticipate,” “intend,” “plan,” “estimate,” “project” or, in each case, their negative, or other variations or comparable terminology and expressions. These statements are based on assumptions that we have made in light of our experience in the industry as well as our perceptions of historical trends, current conditions, expected future developments and other factors we believe are appropriate under the circumstances. As you read and consider this Form 10-K, you should understand that these statements are not guarantees of performance or results and that our actual results of operations, financial condition and liquidity, and the development of the industry in which we operate, may differ materially from those made in or suggested by the forward‑looking statements contained in this Form 10-K. By their nature, forward‑looking statements involve known and unknown risks and uncertainties because they relate to events and depend on circumstances that may or may not occur in the future. Although we believe that the forward‑looking statements contained in this Form 10-K are based on reasonable assumptions, you should be aware that many factors could affect our actual financial results or results of operations and could cause actual results to differ materially from those in such forward‑looking statements, including but not limited to:
•reduced levels of overall trading activity;
•dependence upon trading counterparties and clearing houses performing their obligations to us;
•failures of our customized trading platform;
•risks inherent to the electronic market making business and trading generally;
•increased competition in market making activities;
•dependence on continued access to sources of liquidity;
•risks associated with self‑clearing and other operational elements of our business;
•compliance with laws and regulations, including those specific to our industry;
•obligation to comply with applicable regulatory capital requirements;
•litigation or other legal and regulatory‑based liabilities;
•proposed legislation that would impose taxes on certain financial transactions in the European Union, the U.S. and other jurisdictions;
•obligation to comply with laws and regulations applicable to our international operations;
•enhanced media and regulatory scrutiny and its impact upon public perception of us or of companies in our industry;
•need to maintain and continue developing proprietary technologies;
3
•failure to maintain system security or otherwise maintain confidential and proprietary information;
•capacity constraints, system failures, and delays;
•dependence on third party infrastructure or systems;
•use of open source software;
•failure to protect or enforce our intellectual property rights in our proprietary technology;
•risks associated with international operations and expansion, including failed acquisitions or dispositions;
•fluctuations in currency exchange rates;
•risks associated with potential growth and associated corporate actions;
•inability to, or delay, in accessing the capital markets to sell shares or raise additional capital;
•loss of key executives and failure to recruit and retain qualified personnel; and
•risks associated with losing access to a significant exchange or other trading venue.
We undertake no obligation to publicly update or revise any forward-looking statements to reflect events or circumstances that may arise after the date of this Form 10-K.
BUSINESS
Overview
Virtu is a leading technology‑enabled market maker and liquidity provider to the global financial markets. We stand ready, at any time, to buy or sell a broad range of securities and other financial instruments, and we generate revenue by buying and selling securities and other financial instruments and earning small bid/ask spreads across a large volume of transactions. We make markets by providing quotations to buyers and sellers in more than 12,000 securities and other financial instruments on more than 230 unique exchanges, markets and liquidity pools in 35 countries around the world. We believe that our broad diversification, in combination with our proprietary technology platform and low‑cost structure, enables us to facilitate risk transfer between global capital markets participants by supplying liquidity and competitive pricing while at the same time earning attractive margins and returns.
We believe that market makers like us serve an important role in maintaining and improving the overall health and efficiency of the global capital markets by continuously posting bids and offers for financial instruments and thereby providing to market participants an efficient means to transfer risk. All market participants benefit from the increased liquidity, lower overall trading costs and enhanced execution certainty that we provide. While we do not have customers in a traditional sense, we make markets for global banks, brokers and other intermediaries, and indirectly provide services to retail and institutional investors, including corporations, individuals, hedge funds, mutual funds, pension funds and other investors, all of whom can access our liquidity on exchanges or venues in order to transfer risk in
4
multiple securities and asset classes for their own accounts and/or on behalf of their customers. The following table illustrates the diversification of our revenues:
|
|
|
Percentage of |
|
|
|
|
|
|
Adjusted Net Trading |
|
|
|
|
|
|
Income(1) |
|
|
|
|
Asset |
|
(Year Ended |
|
|
|
|
Classes |
|
December 31, 2015) |
|
Selected Venues in Which We Make Markets |
|
|
Americas Equities |
|
27 |
% |
Aequitas Neo, BATS, BM&F Bovespa, CME, ICE, IEX, NASDAQ, NYSE, NYSE Arca, NYSE MKT, TMX, major private liquidity pools |
|
|
EMEA Equities |
|
12 |
% |
Amsterdam, Aquis, BATS Europe, Bolsa de Madrid, Borsa Italiana, Brussels, EUREX, Euronext -Paris, ICE Futures Europe, Johannesburg Stock Exchange, Lisbon, London Stock Exchange, SIX Swiss Exchange, Turquoise Exchange, XETRA |
|
|
APAC Equities |
|
9 |
% |
OSE, SBI Japannext, SGX, TOCOM, TSE |
|
|
Global Commodities |
|
23 |
% |
CME, EBS, ICE, ICE Futures Europe, NASDAQ Energy Exchange, SGX, TOCOM |
|
|
Global Currencies |
|
22 |
% |
CME, Currenex, EBS, HotSpot, ICE, LMAX, Reuters/FXall |
|
|
Options, Fixed Income and Other Securities |
|
6 |
% |
BOX, BrokerTec, CBOE, eSpeed, NYSE Arca Options, PHLX |
|
|
(1) |
For a full description of Adjusted Net Trading Income and a reconciliation of Adjusted Net Trading Income to trading income, net, see “Item 7. Management’s Discussion and Analysis of Financial Condition and Results of Operations” |
We refer to our market making activities as being “market neutral,” which means that we are not dependent on the direction of any particular market nor do we speculate. Our market making activities are designed to minimize capital at risk at any given time by limiting the notional size of our positions. Our strategies are also designed to lock in returns through precise hedging in the primary instrument or in one or more economically equivalent instruments, as we seek to eliminate the price risk in any positions held. Our revenue generation is driven primarily by transaction volume across a broad range of securities and other financial instruments, asset classes and geographies. We avoid the risk of long or short positions in favor of seeking to earn small bid/ask spreads on large trading volumes across thousands of securities and financial instruments.
We do not engage in the types of principal investing and predictive, momentum and signal trading in which many other broker‑dealers and trading firms engage. In fact, in order to minimize the likelihood of unintended activities by our market making strategies, if our risk management system detects a trading strategy generating revenues outside of our preset limits, it will freeze, or “lockdown,” that strategy and alert risk management personnel and management. Although this approach may prevent us from maximizing potential returns in times of extreme market volatility, we believe the reduction in risk is an appropriate trade‑off that is in keeping with our aim of generating consistently strong revenue from trading.
Our market making activities employ the following three basic strategies: a “single instrument” market making strategy, a “one to one” market making strategy and a “one to many” market making strategy. The single instrument market making strategy involves actively quoting in a single instrument with the intention of profiting by capturing the spread between the bid and offer. This strategy places buy orders, or bids, and sell orders, or offers, in the market for the subject instrument at or near the inside of the market with the intention of achieving an execution. If another market participant executes against the strategy’s bid or offer by crossing the spread, the strategy will attempt to exit the position by continuing to quote on the opposite side of the market in order to execute an offsetting position. The one to one market making strategy involves continuously quoting a two‑sided market in a single instrument with the intention of
5
either capturing the spread in the primary instrument or locking in a return by hedging in a different but economically similar instrument. The one to many market making strategy involves continuously quoting a two‑sided market in a primary instrument (typically an ETF) with the intention of either capturing the spread in the primary instrument or attempting to lock in a return by hedging in a basket of instruments that represent an economically equivalent value to the primary instrument.
Technology and operational efficiency are at the core of our business, and our focus on market making technology is a key element of our success. We have developed a proprietary, multi‑asset, multi‑currency technology platform that is highly reliable, scalable and modular, and we integrate directly with exchanges and other liquidity centers. Our market data, order routing, transaction processing, risk management and market surveillance technology modules manage our market making activities in an efficient manner and enable us to scale our market making activities globally and across additional securities and other financial instruments and asset classes without significant incremental costs or third‑party licensing or processing fees.
We are a self‑clearing registered broker‑dealer in the U.S. and are registered with the Central Bank of Ireland for our European trading. We participate on more than 230 unique exchanges, markets and liquidity pools globally as of December 31, 2015, and register as a market maker or liquidity provider and/or enter into direct obligations to provide liquidity on nearly every exchange or venue that offers such programs. We engage regularly with regulators around the world on issues affecting electronic trading and have been a proponent with the SEC of affirmative market making obligations for electronic market makers in U.S. equities in an effort to enhance the transparency and liquidity provided to capital markets. In the U.S., we conduct our business from our headquarters in New York, New York and our trading center in Austin, Texas. Abroad, we conduct our business through trading centers located in Dublin and Singapore.
Our Market Making
As a leading, low‑cost market maker dedicated to providing improved efficiency and liquidity across multiple securities, asset classes and geographies, we aim to provide critical market functionality and robust price competition, leading to reduced trading costs and more efficient pricing in the securities and other financial instruments in which we provide liquidity. This contribution to the financial markets, and the scale and diversity of our market making activities, provides added liquidity and transparency, which we believe are necessary and valued components to the efficient functioning of market infrastructure and benefit all market participants. We support transparent and efficient, technologically advanced marketplaces, and advocate for legislation and regulation that promotes fair and transparent access to markets.
We make markets in a number of different assets classes, which are discussed in more detail below.
Americas Equities
Americas equities trading accounted for approximately 27% and 26% of our Adjusted Net Trading Income for the years ended December 31, 2015 and 2014, respectively. We trade approximately 6,000 Americas equity securities including, among others, equity related futures and exchange traded funds, on eleven SEC registered exchanges as well as other alternative trading systems, including the NYSE, the NASDAQ, Direct Edge, NYSE Arca, BATS and IEX, the TSX in Canada, Bovespa in Brazil and BMV in Mexico, and we connect to more than 20 private liquidity pools. In 2011, we became a DMM in over 260 stocks on the floor of the NYSE and the NYSE MKT (formerly NYSE Amex), and we are seeking to increase the number of listed NYSE stocks for which we serve as a DMM.
As exchange traded funds, or “ETFs,” and other similar products have proliferated both domestically and internationally, demand has increased for trading the underlying assets or hedging such funds. Our technology has enabled us to expand into providing liquidity to this growing area by making markets across these assets in a variety of trading venues globally. We are authorized participants and can create and/or redeem ETFs in Americas equities, EMEA equities and APAC equities.
6
EMEA Equities
EMEA equities trading accounted for approximately 12% and 12% of our Adjusted Net Trading Income for the years ended December 31, 2015 and 2014, respectively. Similar to our strategy in the Americas, we utilize direct connections to all of the registered exchanges in a particular jurisdiction including the LSE, BATS Europe and NYSE Euronext, as well as any additional pools of liquidity to which we can gain access either directly or through a broker. We are also well positioned in European ETFs, as an authorized participant in many European ETFs. In addition, after our acquisition of the ETF market making assets of Nyenburgh, we provide two‑sided liquidity to a significant number of counterparties throughout Europe.
APAC Equities
APAC equities trading accounted for approximately 9% and 7% of our Adjusted Net Trading Income for the years ended December 31, 2015 and 2014, respectively. We utilize direct connections to the ASX, TSX and SGX, among other exchanges and liquidity pools.
Global Commodities
Trading in global commodities accounted for approximately 23% and 21% of our Adjusted Net Trading Income for the years ended December, 2015 and 2014, respectively. During these periods, we were a leading participant and liquidity provider on both the CME and ICE in trading crude oil, natural gas, heating oil, gasoline futures and precious metals. We trade approximately 100 energy products and futures on the ICE, CME, TOCOM and NYSE Liffe US. We also actively trade precious metals, including gold, silver, platinum and palladium, as well as base metals such as aluminum and copper.
Global Currencies
Trading in global currencies, including spot, futures and forwards, accounted for approximately 22% and 25% of our Adjusted Net Trading Income for the years ended December 31, 2015 and 2014, respectively. During these periods, we were a leading participant in the major foreign exchange venues, including Reuters, Currenex, Hotspot FX and EBS. Currency trading has historically utilized intermediaries and large broker‑dealers, and as a result, market making opportunities in foreign exchange have been limited.
Options, Fixed Income and Other Securities
Trading in options, U.S. and foreign government fixed income products and other products accounted for approximately 6% and 10% of our Adjusted Net Trading Income for the years ended December 31, 2015 and 2014, respectively. We trade these products on a variety of specialized exchanges and other trading venues, including all of the U.S. options exchanges of which we are a member (i.e., CBOE, ISE and NYSE Arca) and through the U.S. futures exchanges. We believe that we can increase our volumes in certain of these products.
Technology
Technology is at the core of our business. Our team of in-house software engineers develops all of our software and applications, and we utilize optimized infrastructure to integrate directly with the exchanges and other trading venues on which we provide liquidity. Wherever possible, we lease commercially available rack space that is co‑located with, or in close proximity to, the exchanges and other venues where we provide liquidity. We do not pay any licensing or per‑trade processing fees to any third parties, and the engineering cycles for enhancements or new technologies are entirely within our control. Our focus on technology and our ability to leverage our technology enables us to be one of the lowest cost providers of liquidity to the global electronic trading marketplace.
We have developed and refined, in‑house, a single proprietary, scalable and modular technology platform that we directly integrate with exchanges and other trading venues through our customized infrastructure to provide continuous bid and offer quotations on a wide variety of assets traded electronically around the world. Our platform
7
incorporates market data and evaluates risk exposure on a real‑time basis to update outstanding quotes often many times per second, enabling us to offer competitive bid/ask spreads. Our high degree of automation reduces our costs, and we believe our cost per trade is as low as or lower than any other market participants. Leveraging the scalability and low costs of our platform, we are able to test and rapidly deploy new liquidity provisioning strategies, expand to new securities, asset classes and geographies and increase transaction volumes at little incremental cost. These efficiencies are central to our ability to deliver consistently positive Adjusted Net Trading Income as our profitability per trade and per instrument is not significant, particularly in U.S. equities.
Our transaction processing is automated over the full life cycle of a trade. Our platform generates and disseminates continuous bid and offer quotes on over 12,000 tradable listed products. At the moment a trade is executed, our systems capture and deliver this information back to the source, in most cases within a fraction of a second, and the trade record is written into our clearing system, where it flows through a chain of control accounts that allow us to reconcile trades, positions and payments until the final settlement occurs.
Our core software technology is developed internally, and we do not generally rely on outside vendors for software development or maintenance. To achieve optimal performance from our systems, we continuously test and upgrade our software. Our focus on cutting‑edge technology not only improves our performance but also helps us attract and retain talented developers.
Virtually all of our software has been developed and maintained with a unified purpose. We track and test new software releases with proprietary automated testing tools and are not hindered by disparate or limiting legacy systems assembled through acquisitions.
We have built and continuously refine our automated and integrated, real‑time systems for global trading, risk management, clearing and cash management, among other purposes. We have also assembled a proprietary connectivity network between us and exchanges around the world. Efficiency and speed in performing prescribed functions are always crucial requirements for our systems, and generally we focus on opportunities in markets that are sufficiently advanced to allow the seamless deployment of our automated strategies, risk management system and core technology.
Our systems are monitored 24 hours a day, five days a week by our core operations team and are substantially identical across our four offices, in New York, New York, Austin, Texas, Dublin, Ireland and Singapore. This redundancy covers our full technology platform, including our market data, order routing, transaction processing, risk management and market surveillance technology modules. Because our systems can be operated by qualified personnel in any office at any time across our globally distributed offices, we have an effective, organic disaster recovery and business continuity plan in place, allowing for seamless operation of our trading strategies in the event of disruption.
Risk Management
We are intensely focused on risk management and monitor our activities on a continuous basis using our fully integrated technology systems. Our market making strategies are designed to put minimal capital at risk at any given time by limiting the notional size of our positions. Our strategies are also designed to lock in returns through precise hedging in the primary instrument or in one or more economically equivalent instruments, as we seek to eliminate the price risk in any positions held. Our real‑time risk management system is built into our trading platform and is an integral part of our order life‑cycle, analyzing real‑time pricing data and ensuring that our order activity is conducted within strict pre‑determined trading and position limits. If our risk management system detects that a trading strategy is generating revenues or losses in excess of our preset limits, it will lockdown that strategy and alert management. In addition, our risk management system continuously reconciles our internal transaction records against the records of the exchanges and other liquidity centers with which we interact.
Risk management is at the core of our trading infrastructure. Our real‑time risk controls monitor all of our market making positions, incorporating market data and evaluating our risk exposure to continuously update our outstanding bid and offer quotes, often many times per second. Although our market making is automated, the trading process and our risk exposure are monitored by a team of individuals, including members of our senior management
8
team, who oversee our risk management processes in real-time. Our risk management system is intrinsic to our trading infrastructure that is utilized in each of our four trading centers.
Our risk management policies are set by our Risk Advisory Committee and overseen by our Chief Risk Officer. We utilize the following three‑pronged approach to managing risk:
|
· |
Strategy Lockdowns. Messages that leave our trading environment must first pass through a series of preset risk controls, or “lockdowns,” which are intended to minimize the likelihood of unintended activities by our market making algorithms, and which cannot be modified by our traders. Not only do we implement preset risk controls to limit downside risk, but we also do the same to limit upside risk — if our risk management system detects that a trading strategy is generating revenues or losses in excess of our preset limits, a lockdown will be triggered. When a lockdown is triggered, our risk management system alerts us and automatically freezes the applicable trading strategy, cancels all applicable open orders and prevents the placement of additional related orders. Following a lockdown, a trader must manually reset the applicable trading strategy. While this risk prevention layer adds a degree of latency to our trading infrastructure and can prevent us from earning outsized returns in times of extreme market volatility, we believe that this trade‑off is necessary to properly limit our downside risk. |
|
· |
Aggregate Exposure Monitoring. Pursuant to our risk management policies, our automated management information systems generate reports in real‑time, as well as on daily and periodic bases. These reports include risk profiles, profit and loss analyses and trading performance reports. Our assets and liabilities are marked‑to‑market daily for financial reporting purposes by reference to official exchange prices, and they are re‑valued continuously throughout the trading day for risk management and asset/liability management purposes. |
|
· |
Operational Controls. We have automated the full cycle of controls of our business. Key automated controls include: |
|
· |
our technical operations system continuously monitors our network and the proper functioning of each of our trading centers around the world; |
|
· |
our market making system continuously evaluates over 11,000 listed securities in which we provide bid and offer quotes and changes its bids and offers in such a way as to minimize exposure to directional price movements. The speed of communicating with exchanges and market centers is maximized through continuous software and network engineering innovation, allowing us to achieve real‑time controls over market exposure. We connect to exchanges and other electronic venues through a network of co‑location facilities around the world that are monitored 24 hours a day, five days a week, by our staff of experienced network professionals; |
|
· |
our clearing system captures trades in real-time and performs automated reconciliations of trades and positions, corporate action processing, options exercises, securities lending and inventory management, allowing us to effectively manage operational risk; and |
|
· |
software developed to support our market making systems performs daily profit and loss and position reconciliations. |
In addition, we seek to minimize our liquidity risk by focusing our trading in highly active and liquid instruments. The diversity of assets and venues in which we provide liquidity serves as a further form of portfolio risk management.
Our Risk Advisory Committee includes key personnel from each of our locations globally and is comprised of our Chief Risk Officer, members of our senior management team, senior technologists and traders, and certain senior compliance officers. Our board of directors is regularly apprised of the activities of our Risk Advisory Committee and
9
our risk management policies, procedures and controls through board updates and other communications. All of our risk controls and settings are reviewed and approved by our Risk Advisory Committee.
Competition
Historically, our competition has been registered market making firms ranging from sole proprietors with very limited resources to large, integrated broker‑dealers. Today, a range of market participants may compete with us for revenues generated by market making activities across one or more asset classes and geographies, including large broker‑dealers, such as Bank of America Merrill Lynch, Citigroup, Goldman, Sachs & Co., Morgan Stanley and UBS, and other participants, such as Citadel, DRW Holdings, Hudson River Trading, IMC, KCG Holdings, Optiver, Susquehanna, Timber Hill and Wolverine Trading. Some of our competitors in market making are larger than we are and have more captive order flow in certain assets. We believe that the high cost of developing a competitive technological framework is a significant barrier to entry by new market participants.
We believe that we must have more sophisticated, versatile and robust software than our competitors in order to maintain a competitive advantage. Technology and software innovation is a primary focus for us, rather than relying solely on the speed of our network. We believe that our scalable technology allows us to access new markets and increase volumes with limited incremental costs.
In addition, we believe our lack of direct customers and customer accounts allows us increased flexibility as we face fewer constraints in reallocating resources to pursue market opportunities as they arise. We are also a self‑clearing DTC participant, so we avoid paying clearing fees to third parties in our U.S. equities market making business.
Intellectual Property and Other Proprietary Rights
We rely primarily on trade secret, trademark, domain name, copyright and contract law to protect our intellectual property and proprietary technology. We enter into confidentiality, intellectual property invention assignment and/or non‑competition and non‑solicitation agreements or restrictions with our employees, independent contractors and business partners, and we strictly control access to, and distribution of, our intellectual property.
Employees
As of December 31, 2015, we had 148 employees, all of whom were employed on a full‑time basis. None of our employees are covered by collective bargaining agreements. We believe that our employee relations are good.
Regulation
We conduct our U.S. equities market making activities through our two SEC‑registered broker‑dealers, Virtu Financial BD LLC and Virtu Financial Capital Markets LLC. Virtu Financial BD LLC is a self‑clearing broker‑dealer, is regulated by the SEC and its designated examining authority is the Chicago Stock Exchange. Virtu Financial Capital Markets LLC is a dual‑clearing broker‑dealer (which means it self‑clears its proprietary transactions and executes on an agency basis on behalf of its 100% commonly held affiliates and non-affiliated broker dealers), is regulated by the SEC and its designated examining authority is FINRA.
Our activities in U.S. equities are almost entirely self‑cleared. We are a full clearing member of the National Securities Clearing Corporation (NSCC), and the DTC. In other asset classes, we use the services of prime brokers who provide us direct market access to markets and often cross‑margining and margin financing in return for an execution and clearing fee. We continually monitor the credit quality of our prime brokers and rely on large multinational banks for most of our execution and clearing needs globally.
Our energy, commodities and currency market making and trading activities are primarily conducted through Virtu Financial Global Markets LLC.
10
We conduct our EMEA market making and trading activities from Dublin and through our Irish subsidiaries, Virtu Financial Ireland Limited, which is authorized as an “Investment Firm” with the Central Bank of Ireland, and Virtu Financial Europe Limited.
We conduct our APAC market making and trading activities from Singapore and through our Singapore subsidiary, Virtu Financial Singapore Pte. Ltd., and our Australian subsidiary, Virtu Financial Asia Pty. Ltd. Virtu Financial Singapore Pte. Ltd. is registered with the Monetary Authority of Singapore for an investment incentive arrangement, and Virtu Financial Asia Pty. Ltd. holds a financial services license issued by, and is therefore subject to the regulatory oversight of, the Australian Securities and Investments Commission.
Most aspects of our business are subject to extensive regulation under federal, state and foreign laws and regulations, as well as the rules of the various SROs of which our subsidiaries are members. The SEC, CFTC, state securities regulators, FCA, SFC, FINRA, NFA, other SROs and other U.S. and foreign governmental regulatory bodies promulgate numerous rules and regulations that may impact our business. As a matter of public policy, regulatory bodies are charged with safeguarding the integrity of the securities and other financial markets and with protecting the interests of investors in those markets. Regulated entities are subject to regulations concerning all aspects of their business, including trading practices, order handling, best execution practices, anti‑money laundering, handling of material non‑public information, safeguarding data, securities credit, capital adequacy, reporting, record retention, market access and the conduct of officers, employees and other associated persons. We do not carry customer accounts and are therefore exempt from otherwise applicable SEC requirements relating to the protection of customer securities and the maintenance of a cash reserve account for the benefit of customers.
Rulemaking by these and other regulators (foreign and domestic), including resulting market structure changes, has had an impact on our regulated subsidiaries by directly affecting our method of operation and, at times, our profitability. Legislation can impose, and has imposed, significant obligations on broker‑dealers, including our regulated subsidiaries. These increased obligations require the implementation and maintenance of internal practices, procedures and controls which have increased our costs and may subject us to government and regulatory inquiries, claims or penalties.
Failure to comply with any laws, rules or regulations could result in administrative or court proceedings, censures, fines, penalties, disgorgement and censures, suspension or expulsion from a certain jurisdiction, SRO or market, the revocation or limitation of licenses, the issuance of cease‑and‑desist orders or injunctions or the suspension or disqualification of the entity and/or its officers, employees or other associated persons. These administrative or court proceedings, whether or not resulting in adverse findings, can require substantial expenditures of time and money and can have an adverse impact on a firm’s reputation and profitability.
The regulatory environment in which we operate is subject to constant change. Our business, financial condition and operating results may be adversely affected as a result of new or revised legislation or regulations imposed by the U.S. Congress, foreign legislative bodies, state securities regulators, U.S. and foreign governmental regulatory bodies and SROs. Additional regulations, changes in existing laws and rules, or changes in interpretations or enforcement of existing laws and rules often directly affect the method of operation and profitability of regulated broker‑dealers. Since March 2014, we and other broker‑dealers and trading firms have been the subject of requests for information and documents from the SEC and NYAG. We have cooperated and complied with the SEC’s and NYAG’s requests for information and documents. We cannot predict what effect, if any, such changes might have. However, there have been in the past, and could be in the future, significant technological, operational and compliance costs associated with the obligations which derive from compliance with such regulations.
On July 21, 2010, the Dodd‑Frank Act was enacted in the U.S. Implementation of the Dodd‑Frank Act is being be accomplished through extensive rulemaking by the SEC, the CFTC and other governmental agencies. The Dodd‑Frank Act includes the “Volcker Rule,” which significantly limits the ability of banks and their affiliates to engage in proprietary trading, and Title VII, which provides a framework for the regulation of the swap markets. The CFTC has largely finalized its rules with respect to those swaps markets and participants it regulates, while the SEC has not yet completed all of its rules relating to security‑based swaps. One of our subsidiaries is registered with the CFTC as a floor
11
trader, and is exempt from registration as a swap dealer based on its current activity. Registration as a swap dealer would subject our subsidiary to various requirements, including those related to capital, conduct, and reporting.
We have foreign subsidiaries and plan to continue to expand our international presence. The market making industry in many foreign countries is heavily regulated, much like in the U.S. The varying compliance requirements of these different regulatory jurisdictions and other factors may limit our ability to conduct business or expand internationally. For example, Markets in Financial Instruments Directive (“MiFID”), which was implemented in November 2007, is now under further review by the European Parliament. MiFID represented one of the more significant changes to take place in the operation of European capital markets. In October 2012, the European Parliament adopted, with amendments, MiFID II/MiFIR. MiFID II entered into force on July 2, 2014 with an effective date of January 3, 2017. It is widely expected that the effective date will be delayed to 2018. Some broader trends of the proposals address increased transparency and oversight of financial firms, with a focus on high frequency trading, broker liquidity private pools, crossing networks and multilateral trading facilities. For example, the current proposal would require firms like us to conduct all trading on European markets through authorized investment firms. MiFID II/MiFIR will also require certain types of firms, including us, to post firm quotes at competitive prices and will supplement current requirements with regard to investment firms’ risk controls related to the safe operation of electronic systems. MiFID II/MiFIR may also impose additional requirements on our trading platforms, such as a minimum order resting time, cancellation fees, circuit breakers and limits on the ratio of unexecuted orders to trades. Each of these proposals may impose technological and compliance costs on us. Any of these laws, rules or regulations, if adopted, as well as any regulatory or legal actions or proceedings, changes in legislation or regulation and changes in market customs and practices could have a material adverse effect on our business, financial condition and results of operations.
Certain of our subsidiaries are subject to regulatory capital rules of the SEC, FINRA, other SROs and foreign regulators. These rules, which specify minimum capital requirements for our regulated subsidiaries, are designed to measure the general financial integrity and liquidity of a broker‑dealer and require that at least a minimum part of its assets be kept in relatively liquid form. Failure to maintain required minimum capital may subject a regulated subsidiary to a fine, requirement to cease conducting business, suspension, revocation of registration or expulsion by applicable regulatory authorities, and ultimately could require the relevant entity’s liquidation. See “Risk Factors — Risks Related to Our Business — Failure to comply with applicable regulatory capital requirements could subject us to sanctions imposed by the SEC, FINRA and other SROs or regulatory bodies.”
Corporate History
We and our predecessors have been in the electronic trading and market making business for approximately 12 years. We conduct our business through Virtu Financial LLC (“Virtu Financial”) and its subsidiaries. On July 8, 2011, we completed our acquisition of Madison Tyler Holdings, which was co-founded in 2002 by Mr. Vincent Viola, our Founder and Executive Chairman. In connection with the acquisition, Virtu Financial paid approximately $536.5 million in cash and issued interests in Virtu Financial to the members of Madison Tyler Holdings and Virtu Financial Operating LLC ("Virtu East"). To finance the Madison Tyler Transactions, (i) an affiliate of Silver Lake Partners invested approximately $250.0 million in Virtu Financial, (ii) an affiliate of Mr. Viola invested approximately $19.6 million in Virtu Financial and (iii) Virtu Financial borrowed approximately $304.4 million, net of fees and expenses, under a term loan facility, which we refer to (as amended to date) as our "senior secured credit facility." The business that comprises Virtu Financial today is the result of the Madison Tyler Transactions, which combined Virtu East, our historical business, with Madison Tyler Holdings.
On December 31, 2014, through a series of transactions, Temasek Holdings (Private) Limited, whom we refer to as "Temasek," acting through two indirect wholly owned subsidiaries, acquired (i) direct interests in Virtu Financial from affiliates of Silver Lake Partners, Virtu Financial and a member of management (other than Messrs. Viola and Cifu and their affiliates) and (ii) indirect interests in Virtu Financial by acquiring an interest in an affiliate of Silver Lake Partners.
12
The Reorganization Transactions
Prior to the consummation of the reorganization transactions described below and our initial public offering, all of Virtu Financial's outstanding equity interests, including its Class A-1 interests, Class A-2 capital interests, Class A-2 profits interests and Class B interests, were owned by the following persons, whom we refer to collectively as the "Virtu Pre-IPO Members":
|
· |
three affiliates of Mr. Viola, whom we refer to collectively as the "Founder Pre-IPO Members"; |
|
· |
an affiliate of Silver Lake Partners, whom we refer to as the "Silver Lake Pre-IPO Member"; |
|
· |
an affiliate of Temasek, whom we refer to as the "Temasek Pre-IPO Member"; |
|
· |
an affiliate of Silver Lake Partners and Temasek, whom we refer to as the "SLT Pre-IPO Member" and whom we refer to collectively with the Silver Lake Pre-IPO Member and the Temasek Pre-IPO Member as the "Investor Pre-IPO Members"; |
|
· |
two entities, both of which were managed by Mr. Viola, whose equityholders included certain members of the management of Virtu Financial, whom we refer to together as the "Management Vehicles." Certain of the equity interests held by the Management Vehicles were subject to vesting restrictions; and |
|
· |
certain current and former members of the management of Virtu Financial and Madison Tyler Holdings and their affiliates, whom we refer to collectively as the "Management Members." Certain of the equity interests held by the Management Members were subject to vesting restrictions. |
Prior to the completion of our initial public offering, we completed an internal reorganization, which we refer to as the "reorganization transactions." In connection with the reorganization transactions, the following steps occurred:
|
· |
we became the sole managing member of Virtu Financial; |
|
· |
in a series of transactions, one of the Management Vehicles liquidated, with its equity interests in Virtu Financial either being distributed to its members, including certain members of management, or contributed to the other Management Vehicle (which we refer to as "Virtu Employee Holdco") and certain employees of ours based outside the United States were distributed equity interests in Virtu Financial held by Virtu Employee Holdco on behalf of such employees and such equity interests were contributed to a trust (which we refer to as the "Employee Trust"), whose trustee is one of our subsidiaries; |
|
· |
two of the Founder Pre-IPO Members liquidated and distributed their equity interests in Virtu Financial to their equityholders, one of whom was TJMT Holdings LLC, the third Founder Pre-IPO Member; |
|
· |
the SLT Pre-IPO Member distributed its equity interests in Virtu Financial to its equityholders, which consisted of investment funds and other entities affiliated with Silver Lake Partners and Temasek; |
|
· |
following a series of transactions, we acquired equity interests in Virtu Financial as a result of certain mergers involving wholly owned subsidiaries of ours, an affiliate of Silver Lake Partners and Temasek, and the Temasek Pre-IPO Member (the "Mergers"), and in exchange we issued to an affiliate of Silver Lake Partners, whom we refer to as the "Silver Lake Post-IPO Stockholder," and an affiliate of Temasek, whom we refer to as the "Temasek Post-IPO Stockholder" and whom we refer to together with the Silver Lake Post-IPO Stockholder as the "Investor Post-IPO Stockholders," shares of our Class A common stock and rights to receive payments under a tax receivable agreement described below. The number of shares of Class A common stock issued to the Investor Post-IPO Stockholders was based on the value of the Virtu Financial equity interests that we acquired, which was determined based on a hypothetical liquidation of Virtu Financial and the initial public offering price per share of our Class A common stock in our initial public offering; |
13
|
· |
all of the existing equity interests in Virtu Financial were reclassified into Virtu Financial's non-voting common interest units, which we refer to as "Virtu Financial Units." The number of Virtu Financial Units issued to each member of Virtu Financial was determined based on a hypothetical liquidation of Virtu Financial and the initial public offering price per share of our Class A common stock in our initial public offering. The Virtu Financial Units received by Virtu Employee Holdco, the Employee Trust and the Management Members have the same vesting restrictions as the equity interests that were reclassified. Vested Virtu Financial Units are entitled to receive distributions, if any, from Virtu Financial. Subject to certain exceptions, unvested Virtu Financial Units are not entitled to receive such distributions (other than tax distributions). If any unvested Virtu Financial Units are forfeited, they are cancelled by Virtu Financial for no consideration (and we cancel the related shares of Class C common stock (described below) for no consideration); |
|
· |
we amended and restated our certificate of incorporation and are authorized to issue four classes of common stock: Class A common stock, Class B common stock, Class C common stock and Class D common stock, which we refer to collectively as our "common stock." The Class A common stock and Class C common stock each provide holders with one vote on all matters submitted to a vote of stockholders, and the Class B common stock and Class D common stock each provide holders with 10 votes on all matters submitted to a vote of stockholders. The holders of Class C common stock and Class D common stock do not have any of the economic rights (including rights to dividends and distributions upon liquidation) provided to holders of Class A common stock and Class B common stock. These attributes are summarized in the following table: |
|
Class of Common Stock |
|
Votes |
|
Economic Rights |
|
Class A of common stock |
|
1 |
|
Yes |
|
Class B of common stock |
|
10 |
|
Yes |
|
Class C of common stock |
|
1 |
|
No |
|
Class D of common stock |
|
10 |
|
No |
Shares of our common stock generally vote together as a single class on all matters submitted to a vote of our stockholders;
|
· |
the remaining members of Virtu Financial after giving effect to the reorganization transactions, other than us, whom we refer to collectively as the "Virtu Post-IPO Members," subscribed for and purchased shares of our common stock as follows, in each case at a purchase price of $0.00001 per share and in an amount equal to the number of Virtu Financial Units held by each such Virtu Post-IPO Member: |
|
· |
TJMT Holdings LLC, whom we refer to as the "Founder Post-IPO Member," purchased 79,610,490 shares of our Class D common stock; and |
|
· |
affiliates of Silver Lake Partners, whom we refer to as the "Silver Lake Post-IPO Members," Virtu Employee Holdco, the Employee Trust, the Management Members and the other Virtu Post-IPO Members purchased 36,746,041 shares of our Class C common stock; and |
|
· |
the Founder Post-IPO Member was granted the right to exchange its Virtu Financial Units, together with a corresponding number of shares of our Class D common stock, for shares of our Class B common stock, and the other Virtu Post-IPO Members were granted the right to exchange their Virtu Financial Units, together with a corresponding number of shares of our Class C common stock, for shares of our Class A common stock. Each share of our Class B common stock and Class D common stock is convertible at any time, at the option of the holder, into one share of Class A common stock or Class C common stock, respectively. |
The Founder Post-IPO Member controls approximately 93.1% of the combined voting power of our outstanding common stock. As a result, the Founder Post-IPO Member controls any action requiring the general approval of our stockholders, including the election of our board of directors, the adoption of amendments to our certificate of
14
incorporation and by-laws and the approval of any merger or sale of substantially all of our assets. The Founder Post-IPO Member is controlled by family members of Mr. Viola, our Founder and Executive Chairman.
Initial Public Offering
On April 21, 2015, the Company completed its IPO of 19,012,112 shares of its Class A common stock, par value $0.00001 per share, including 2,479,840 shares of Class A common stock sold in connection with the full exercise of the option to purchase additional shares granted to the underwriters, at a price to the public of $19.00 per share. The shares began trading on NASDAQ on April 16, 2015 under the ticker symbol “VIRT.”
Upon consummation of the IPO, the total gross proceeds of the offering were approximately $361.2 million. Of the proceeds, approximately $25.2 million was used to pay underwriting discounts and commissions, approximately $277.2 million was used to purchase 3,470,724 shares of Class A common stock from affiliates of Silver Lake Partners (the “Silver Lake Post-IPO Stockholder”) and 12,214,224 Virtu Financial Units and corresponding shares of Class C common stock from certain of the Virtu Post-IPO Members, including 4,862,609 Virtu Financial Units and corresponding shares of Class C common stock from affiliates of the Silver Lake Partners (the “Silver Lake Post-IPO Members”) and 7,351,615 Virtu Financial Units from certain employees. The remaining $58.8 million of net proceeds was contributed by the Company to Virtu Financial, the operating company, which will be used for working capital and general corporate purposes. Other offering costs incurred were approximately $8.6 million and were paid by Virtu Financial.
Secondary Offering
In November 2015, the secondary offering (the “Secondary Offering”) of 6,473,371 shares of the Company’s Class A common stock was completed by the Company and certain selling stockholders affiliated with Silver Lake Partners. The selling stockholders sold 6,075,837 shares of Class A common stock and the Company sold 397,534 shares of Class A common stock at a price to the public of $22.15 per share. The selling stockholders received all of the net proceeds from the sale of shares of Class A common stock by them in the offering. The Company used its net proceeds from the offering to purchase common units in Virtu Financial (and paired shares of Class C common stock) from one of its non-executive employees at a net price equal to the price paid by the underwriters for shares of its Class A common stock. Following the Secondary Offering, Silver Lake Partners no longer holds any equity interest in us. As a result of the completion of the IPO, the reorganization transactions and the Secondary Offering, the Company holds approximately 27.5% interest in Virtu Financial at December 31, 2015.
Available Information
Our internet address is www.virtu.com and the investor relations section of our web site is located at www.ir.virtu.com. We make available free of charge, on or through the investor relations section of our web site, this Annual Report on Form 10-K, Quarterly Reports on Form 10-Q, Current Reports on Form 8-K and amendments to those reports filed or furnished pursuant to Section 13(a) or 15(d) of the Securities Exchange Act of 1934, as well as proxy statements, as soon as reasonably practicable after we electronically file such material with, or furnish it to the SEC. Also posted on our web site are our Bylaws, our Amended and Restated Certificate of Incorporation, charters for the Audit Committee, Compensation Committee and Nominating and Corporate Governance Committee of our board of directors. In addition, our web site includes information concerning purchases and sales of our equity securities by our executive officers and directors, as well as disclosure relating to certain non-GAAP financial measures (as defined in Regulation G) promulgated under the Securities Act of 1933, as amended (the ‘‘Securities Act’’) and the Securities Exchange Act of 1934, as amended (the ‘‘Exchange Act’’) that we may make public orally, telephonically, by webcast, by broadcast or by similar means from time to time. Information contained on our website is not incorporated by reference unless specifically referenced herein. We are subject to the informational requirements of the Exchange Act and therefore file periodic reports, proxy statements and other information with the SEC. Such reports may be obtained by visiting the Public Reference Room of the SEC at 100 F Street, NE, Washington, D.C. 20549, or by calling the SEC at 1-800-SEC-0330. In addition, the SEC maintains an internet site (http://www.sec.gov) that contains reports, proxy and information statements and other information regarding issuers that file electronically. To the extent required by the SEC's rules and regulations, we intend to post amendments to or waivers from, if any, provisions of our Code of Conduct and Ethics (to
15
the extent applicable to our directors, principal executive officer, principal financial officer and principal accounting officer) at this location on our website. Our stockholders may also obtain these documents in paper format free of charge upon request made to our Investor Relations department.
Our Investor Relations Department can be contacted at Virtu Financial, Inc., 900 Third Avenue, 29th Floor, New York, NY, 10022, Attn: Investor Relations, e-mail: investor_relations@virtu.com.
Our 2016 Annual Meeting of Stockholders (the “2016 Annual Meeting”) will be held on June 14, 2016 at our offices located on 900 Third Avenue, 29th Floor. Stockholder proposals intended to be included in our proxy materials pursuant to Exchange Act Rule 14a-8 and presented at the 2016 Annual Meeting of Stockholders (the “2016 Annual Meeting”) must be delivered to our Secretary at our executive office no later than the close of business on April 15, 2016. Such proposals must also comply with all applicable provisions of Exchange Act Rule 14a-8. Stockholder proposals submitted for consideration at the 2016 Annual Meeting but not submitted for inclusion in our proxy materials pursuant to Exchange Act Rule 14a-8, and stockholder nominations for candidates for election as directors, must be delivered to our Secretary at our executive office no later than April 4, 2016 (assuming the Company does not delay the date of the 2016 Annual Meeting of Stockholders by more than 30 days) and must comply with the other provisions of our amended and restated bylaws.
Investing in our Class A common stock involves substantial risks. In addition to the other information in this annual report, you should carefully consider the following factors before investing in our Class A common stock. Any of the risk factors we describe below could have a material adverse effect on our business, financial condition or results of operations. The market price of our Class A common stock could decline if one or more of these risks or uncertainties develop into actual events, causing you to lose all or part of your investment. While we believe these risks and uncertainties are especially important for you to consider, we may face other risks and uncertainties that could have a material adverse effect on our business. Certain statements contained in the risk factors described below are forward-looking statements. See "Forward-Looking Statements" for more information.
Risks Related to Our Business
Because our revenues and profitability depend on trading volume and volatility in the markets in which we operate, they are subject to factors beyond our control, are prone to significant fluctuations and are difficult to predict.
Our revenues and profitability depend in part on the level of trading activity of securities, derivatives and other financial products on exchanges and in other trading venues in the U.S. and abroad, which are directly affected by factors beyond our control, including economic and political conditions, broad trends in business and finance and changes in the markets in which such transactions occur. Weaknesses in the markets in which we operate, including economic slowdowns in recent years, have historically resulted in reduced trading volumes for us. Declines in trading volumes generally result in lower revenues from market making and transaction execution activities. Lower levels of volatility generally have the same directional impact. Declines in market values of securities or other financial instruments can also result in illiquid markets, which can also result in lower revenues and profitability from market making and transaction execution activities. Lower price levels of securities and other financial instruments, as well as compressed bid/ask spreads, which often follow lower pricing, can further result in reduced revenues and profitability. These factors can also increase the potential for losses on securities or other financial instruments held in inventory and failures of buyers and sellers to fulfill their obligations and settle their trades, as well as claims and litigation. Any of the foregoing factors could have a material adverse effect on our business, financial condition and results of operations. In the past, our revenues and operating results have varied significantly from period to period due primarily to movements and trends in the underlying markets and to fluctuations in trading volumes and volatility levels. As a result, period to period comparisons of our revenues and operating results may not be meaningful, and future revenues and profitability may be subject to significant fluctuations or declines.
16
We are dependent upon our trading counterparties and clearing houses to perform their obligations to us.
Our business consists of providing consistent two‑sided liquidity to market participants across numerous geographies and asset classes. In the event of a systemic market event, resulting from large price movements or otherwise, certain market participants may not be able to meet their obligations to their trading counterparties, who, in turn, may not be able to meet their obligations to their other trading counterparties, which could lead to major defaults by one or more market participants. Following the implementation of certain mandates under the Dodd‑Frank Act in the U.S. and similar legislation worldwide, many trades in the securities and futures markets, and an increasing number of trades in the over‑the‑counter derivatives markets, are cleared through central counterparties. These central counterparties assume, and specialize in managing, counterparty performance risk relating to such trades. However, even when trades are cleared in this manner, there can be no assurance that a clearing house’s risk management methodology will be adequate to manage one or more defaults. Given the concentration of counterparty performance risk that is concentrated in central clearing parties, any failure by a clearing house to properly manage a default could lead to a systemic market failure. If our trading counterparties do not meet their obligations to us, or if any central clearing parties fail to properly manage defaults by market participants, we could suffer a material adverse effect on our business, financial condition and results of operations.
We may incur losses in our market making activities in the event of failures of our customized trading platform.
The success of our market making business is substantially dependent on the accuracy and performance of our customized trading platform, which evaluates and monitors the risks inherent in our market making strategies, assimilates market data and reevaluates our outstanding quotes continuously throughout the trading day. Our strategies are designed to automatically rebalance our positions throughout the trading day to manage risk exposures on our positions. Flaws in our strategies, latencies or inaccuracies in the market data that we use to generate our quotes, or human error in managing risk parameters or other strategy inputs, may lead to unexpected and unprofitable trades, which may result in material trading losses and could have a material adverse effect on our business, financial condition and results of operations.
We may incur material trading losses from our market making activities.
A significant portion of our revenues are derived from our trading as principal in our role as a formal or registered market maker and liquidity provider on various exchanges and markets, including as a designated market maker (“DMM”) on the New York Stock Exchange. We may incur trading losses relating to these activities since each primarily involves the purchase, sale or short sale of securities, futures and other financial instruments for our own account. In any period, we may incur significant trading losses for a variety of reasons, including price changes, lack of liquidity in instruments in which we have positions and the required performance of our market making obligations. Furthermore, we may from time to time develop large position concentrations in securities or other financial instruments of a single issuer or issuers engaged in a specific industry, or alternatively a single future or other financial instrument, which would result in the risk of higher trading losses than if our concentration were lower.
These risks may limit or restrict, for example, our ability to either resell securities we have purchased or to repurchase securities we have sold. In addition, we may experience difficulty borrowing securities to make delivery to purchasers to whom we have sold securities short or lenders from whom we have borrowed securities.
In our role as a market maker, we attempt to derive a profit from bid/ask spreads. However, competitive forces often require us to match or improve upon the quotes that other market makers display, thereby narrowing bid/ask spreads, and to hold long or short positions in securities, futures or other financial instruments. We cannot assure you that we will be able to manage these risks successfully or that we will not experience significant losses from such activities, which could have a material adverse effect on our business, financial condition and results of operations.
Our risk management activities utilize a four‑pronged approach, consisting of strategy lockdowns, centralized strategy monitoring, aggregate exposure monitoring and operational controls. In particular, messages that leave our trading environment first must pass through a series of preset risk controls or “lockdowns” that are intended to minimize the likelihood of unintended activities. In certain cases this layer of risk management, which adds a layer of latency to
17
our process, may limit our ability to profit from acute volatility in the markets. This would be the case, for example, where a particular strategy being utilized by one of our traders is temporarily locked down for generating revenue in excess of the preset risk limit. Even if we are able to quickly and correctly identify the reasons for a lockdown and quickly resume the trading strategy, we may limit our potential upside as a result of our risk management policies.
The valuation of the securities we hold at any particular time may result in large and occasionally anomalous swings in the value of our positions and in our earnings in any period.
The market prices of our long and short positions are reflected on our books at closing prices, which are typically the last trade prices before the official close of the primary exchange on which each such security trades. Given that we manage a globally integrated portfolio, we may have large and substantially offsetting positions in securities that trade on different exchanges that close at different times of the trading day and may be denominated in different currencies. Further, there may be large and occasionally anomalous swings in the value of our positions on any particular day and in our earnings in any period. Such swings may be especially pronounced on the last business day of each calendar quarter, as the discrepancy in official closing prices resulting from the asynchronous closing times may cause us to recognize a gain or loss in one quarter which would be substantially offset by a corresponding loss or gain in the following quarter.
We are exposed to losses due to lack of perfect information.
As a market maker, we provide liquidity by consistently buying securities from sellers and selling securities to buyers. We may at times trade with others who have information that is more accurate or complete than the information we have, and as a result we may accumulate unfavorable positions preceding large price movements in a given instrument. Should the frequency or magnitude of these events increase, our losses would likely increase correspondingly, which could have a material adverse effect on our business, financial condition and results of operations.
We face competition in our market making activities.
Revenues from our market making activities depend on our ability to offer to buy and sell financial instruments at prices that are attractive and represent the best bid and/or offer in a given instrument at a given time. To attract order flow, we compete with other firms not only on our ability to provide liquidity at competitive prices, but also on other factors such as order execution speed and technology. Our competitors include other registered market makers, as well as unregulated or lesser‑regulated trading firms that also compete to provide liquidity. Our competitors range from sole proprietors with very limited resources to highly sophisticated groups, hedge funds, well‑capitalized broker‑dealers and proprietary trading firms or other market makers that have substantially greater financial and other resources than we do. These larger and better capitalized competitors may be better able to respond to changes in the market making industry, to compete for skilled professionals, to finance acquisitions, to fund internal growth, to manage costs and expenses and to compete for market share generally. Trading firms that are not registered as broker‑dealers or broker‑dealers not registered as market makers may in some instances have certain advantages over more regulated firms, including our subsidiaries, that may allow them to bypass regulatory restrictions and trade more cheaply than more regulated participants on some markets or exchanges. In addition, we may in the future face enhanced competition from new market participants that may also have substantially greater financial and other resources than we do, which may result in compressed bid/ask spreads in the marketplace that may negatively impact our financial performance. Moreover, current and potential competitors may establish cooperative relationships among themselves or with third parties or may consolidate to enhance their services and products. The trend toward increased competition in our business is expected to continue, and it is possible that our competitors may acquire increased market share. Increased competition or consolidation in the marketplace could reduce the bid/ask spreads on which our business and profitability depend. As a result, there can be no assurance that we will be able to compete effectively with current or future competitors, which could have a material adverse effect on our business, financial condition and results of operations.
18
We are subject to liquidity risk in our operations.
We require liquidity to fund various ongoing obligations, including operating expenses, capital expenditures, debt service and dividend payments. Our main sources of liquidity are cash flow from the operations of our subsidiaries, our broker‑dealer revolving credit facility (described under “Management’s Discussion and Analysis of Financial Condition and Results of Operations — Liquidity and Capital Resources — Credit Facilities”), margin financing provided by our prime brokers and cash on hand. Our liquidity could be materially impaired by a number of factors, including reduced business activity due to a market downturn, adverse regulatory action or a downgrade of our credit rating. If our business activities decrease or we are unable to borrow additional funds in the future on terms that are acceptable to us, or at all, we could suffer a material adverse effect on our business, financial condition, results of operations and cash flows.
Self‑clearing and other elements of our trade processing operations expose us to significant operational, financial and liquidity risks.
We currently self‑clear substantially all of our domestic equity trades and may expand our self‑clearing operations internationally and across product offerings and asset classes in the future. Self‑clearing exposes our business to operational risks, including business disruption, operational inefficiencies, liquidity, financing risks, counterparty performance risk and potentially increased expenses and lost revenue opportunities. While our clearing platform, operational processes, risk methodologies, enhanced infrastructure and current and future financing arrangements have been carefully designed, we may nevertheless encounter difficulties that may lead to operating inefficiencies, including delays in implementation, disruption in the infrastructure that supports the business, inadequate liquidity and financial loss. Any such delay, disruption or failure could negatively impact our ability to effect transactions and manage our exposure to risk and could have a material adverse effect on our business, financial condition and results of operations.
Rules governing designated market makers may require us to make unprofitable trades or prevent us from making profitable trades from time to time.
DMMs are granted certain rights and have certain obligations to “make a market” in a particular security. They agree to specific obligations that are designed to maintain a fair and orderly market. In acting as a DMM, we are subject to a high degree of risk by having to support an orderly market. In this role, we may at times be required to make trades that negatively impact our profitability. In addition, we may at times be unable to trade for our own account in circumstances in which it may be to our advantage to trade, and we may be obligated to act as a principal when buying and selling interest is unbalanced. In those instances, we may take a position counter to the market, buying or selling securities to support an orderly market. Additionally, the rules of the markets that govern our activities as a DMM and the interpretations of such rules are subject to change. If these rules or interpretations impose new or more stringent obligations on us, our trading revenues and profits as a DMM could be negatively impacted and we could suffer a material adverse effect on our business, financial condition and results of operations.
Regulatory and legal uncertainties could harm our business.
Securities and derivatives businesses are heavily regulated. Firms in the financial services industry have been subject to an increasingly regulated environment over recent years, and penalties and fines sought by regulatory authorities have increased considerably. In addition, following recent news media attention to electronic trading and market structure, this regulatory and enforcement environment has created uncertainty with respect to various types of transactions that historically had been entered into by financial services firms and that were generally believed to be permissible and appropriate. “High frequency” and other forms of low latency or electronic trading strategies continue to be the focus of extensive regulatory scrutiny by federal, state and foreign regulators and self‑regulatory organizations (“SROs”), and such scrutiny is likely to continue. While we do not engage in the type of principal investing or predictive, momentum or signal trading that are often associated with high frequency trading, our market making and trading activities are characterized by substantial volumes, an emphasis on technology and certain other characteristics that are also commonly associated with high frequency trading. Specifically, both the SEC and the Commodity Futures Trading Commission (“CFTC”) have issued general concept releases on market structure requesting comment from market participants on topics including, among others, high frequency trading, co‑location, dark liquidity, pre‑ and
19
post‑trade risk controls and system safeguards. The SEC has adopted rules that, among other results, have significantly limited the use of sponsored access by market participants to the U.S. equities exchanges, imposed large trader reporting requirements, restricted short sales in listed securities under certain conditions and required the planning and creation of a new comprehensive consolidated audit trail. The SEC has also approved by order a pilot proposal by the Financial Industry Regulatory Authority, Inc. (“FINRA”) and the national securities exchanges establishing a “Limit Up‑Limit Down” mechanism to address market volatility.
In addition, certain market participants, SROs, government officials and regulators have requested that the U.S. Congress, the SEC, and the CFTC propose and adopt additional laws and rules, including rules relating to additional registration requirements, restrictions on co‑location, order‑to‑execution ratios, minimum quote life for orders, incremental messaging fees to be imposed by exchanges for “excessive” order placements and/or cancellations, further transaction taxes, tick sizes and other market structure proposals. For example, the SEC recently adopted Regulation SCI, which could impose significant compliance and other costs on market centers that may have to pass such costs on to their users, including us, and could impact our future business plans of establishing a market center to avoid or reduce market center costs for certain of our transactions. Similarly, the consolidated audit trail, which the SEC has required the SROs to propose a plan for and will require them to implement, is expected to entail significant costs both on market centers, which may pass these costs along to their users, and broker‑dealers directly. In May 2015, the SEC approved a proposal by the NYSE to adopt a new rule to conduct a daily single‑priced auction at a specified time in lower volume securities (“Midday Auction”). Beginning at a specified time, the NYSE would pause trading in the Midday Auction, suspend automatic executions and publish a zero quote on both the public and proprietary data feeds. The new rule could result in reduced opportunities for liquidity providers to provide liquidity in such lower‑volume securities outside the Midday Auction while reducing spreads during the Midday Auction. The SEC also required that the SROs propose a pilot program to increase the minimum trading increment, or “tick size,” for certain securities. The proposed pilot program approved by the SEC will include a “trade at” component, requiring that certain of these transactions occur only on an exchange. If not accompanied by a reduction in the fees paid to access liquidity on exchanges, the trade at requirement may increase the costs for certain of our transactions. Finally, the SEC has recently proposed amendments to regulations that would require our registered broker‑dealer that is not currently a FINRA member to become a member of FINRA, which, if adopted as proposed, would subject the broker‑dealer to FINRA’s rules and require payment of additional fees per trade that could adversely affect our profits given that we seek to make small profits on individual trades. Additionally, the CFTC has proposed the adoption of Regulation Automated Trading, which would, among other requirements, require registration by direct market participants, mandate the use of certain types of risk controls, and require the maintenance of a source code repository in accordance with certain specifications.
Any or all of these proposals or additional proposals may be adopted by the SEC, CFTC or other U.S. or foreign legislative or regulatory bodies, and recent news media attention to electronic trading and market structure could increase the likelihood of adoption. These potential market structure and regulatory changes could cause a change in the manner in which we make markets, impose additional costs and expenses on our business or otherwise have a material adverse effect on our business, financial condition and results of operations.
In addition, the financial services industry is heavily regulated in many foreign countries, much like in the U.S. The varying compliance requirements of these different regulatory jurisdictions and other factors may limit our ability to conduct business or expand internationally. For example, MiFID, which was implemented in November 2007, is in the process of being replaced by MiFID II/Markets in Financial Investments Regulation (“MiFIR”), which was adopted by the European Parliament on April 15, 2014 and by the Council on May 13, 2014, and entered into force on July 2, 2014 with an effective date of January 3, 2017. It is widely expected that the effective date will be delayed to 2018. The MiFID II/MiFIR proposals include many changes likely to affect our business. For example, MiFID II/MiFIR will require certain types of firms, including us, to post firm quotes at competitive prices and will supplement current requirements with regard to investment firms’ risk controls related to the safe operation of electronic systems. MiFID II/MiFIR will also impose additional requirements on market structure, such as the introduction of a harmonized tick size regime, the introduction of new trading venues known as Organized Trading Facilities, new open access provisions, market making requirements and various other pre‑ and post‑trade risk management requirements. Each of these and other proposals may impose technological and compliance costs on us. Any of these laws, rules or regulations, if adopted, as well as changes in legislation or regulation and changes in market customs and practices could have a
20
material adverse effect on our business, financial condition and results of operations. These risks may be enhanced by recent scrutiny of electronic trading and market structure from regulators, lawmakers and the financial news media.
In addition, we maintain borrowing facilities with banks, prime brokers and Futures Commission Merchants (“FCMs”), and we obtain uncommitted margin financing from our prime brokers and FCMs, which are in many cases affiliated with banks. In response to the financial crisis, the Basel Committee on Banking Supervision issued a new, more stringent capital and liquidity framework known as Basel III, which national banking regulators are in the process of implementing in the various jurisdictions in which our lenders may be incorporated. As these rules are implemented and impose more stringent capital and liquidity requirements, certain of our lenders may revise the terms of our borrowing facilities or margin financing arrangements, reduce the amount of financing they provide, or cease providing us financing, each of which could have a material adverse effect on our business, financial condition and results of operations.
Non‑compliance with applicable laws or regulatory requirements could negatively impact our reputation, prospects, revenues and earnings.
Our subsidiaries are subject to regulations in the U.S., and our foreign subsidiaries are subject to regulations abroad, in each case covering all aspects of their business. Regulatory bodies that exercise or may exercise authority over us include, without limitation, in the U.S., the SEC, FINRA, the Chicago Stock Exchange, the Chicago Mercantile Exchange, the CFTC, the National Futures Association (“NFA”) and the various state securities regulators; in Ireland, the Central Bank of Ireland; in Switzerland, the Swiss Financial Market Supervisory Authority; in France, the Autorité des Marchés Financiers (“AMF”); in the United Kingdom, the Financial Conduct Authority (“FCA”); in Hong Kong, the Securities and Futures Commission (“SFC”); in Australia, the Australian Securities and Investment Commission; in Canada, the Investment Industry Regulatory Organization of Canada and various Canadian provincial securities commissions; in Singapore, the Monetary Authority of Singapore and the Singapore Exchange; and in Japan, the Financial Services Agency and the Japan Securities Dealers Association. Our mode of operation and profitability may be directly affected by additional legislation and changes in rules promulgated by various domestic and foreign government agencies and SROs that oversee our businesses, as well as by changes in the interpretation or enforcement of existing laws and rules, including the potential imposition of additional capital and margin requirements and/or transaction taxes. While we endeavor to timely deliver required annual filings in all jurisdictions, we cannot guarantee that we will meet every applicable filing deadline globally. Noncompliance with applicable laws or regulations could result in sanctions being levied against us, including fines, penalties, disgorgement and censures, suspension or expulsion from a certain jurisdiction, SRO or market or the revocation or limitation of licenses. Noncompliance with applicable laws or regulations could also negatively impact our reputation, prospects, revenues and earnings. In addition, changes in current laws or regulations or in governmental policies could negatively impact our operations, revenues and earnings.
Domestic and foreign stock exchanges, other SROs and state and foreign securities commissions can censure, fine, impose undertakings, issue cease‑and‑desist orders and suspend or expel a broker‑dealer or other market participant or any of its officers or employees. Our ability to comply with all applicable laws and rules is largely dependent on our internal systems to ensure compliance, as well as our ability to attract and retain qualified compliance personnel. We could be subject to disciplinary or other actions in the future due to claimed noncompliance, which could have a material adverse effect on our business, financial condition and results of operations. We have been, are currently, and may in the future be, the subject of one or more regulatory or SRO enforcement actions, including but not limited to targeted and routine regulatory inquiries and investigations involving Regulation NMS, Regulation SHO, market access rules, capital requirements and other domestic and foreign securities rules and regulations. We and other broker‑dealers and trading firms have also been the subject of requests for information and documents from the SEC and the State of New York Office of the Attorney General (“NYAG”). We have been cooperating and complying with the SEC’s and NYAG’s requests for information and documents. Our business or reputation could be negatively impacted if it were determined that disciplinary or other enforcement actions were required. For example, the CFTC has requested certain information from us relating to our trading during the period from July 2011 to February 2014. We do not believe that our trading activity during this time period violated any statute or CFTC regulatory provision, but we cannot predict the outcome of this inquiry. Additionally, in December 2015, the enforcement committee of the AMF fined our European subsidiary in the amount of €5.0 million (approximately $5.4 million) based on its conclusion that the subsidiary engaged in price manipulation and violations of the AMF General Regulation and Euronext Market Rules. The relevant trading activities
21
were conducted on or around 2009, prior to our acquisition of that subsidiary from Madison Tyler Holdings LLC (“MTH” or “Madison Tyler Holdings”), which acquisition was consummated in 2011. Although we believe that the relevant trading engaged in by the subsidiary of MTH was conducted in accordance with applicable French law and regulations and are pursuing our rights of appeal, we may not ultimately prevail. To continue to operate and to expand our services internationally, we will have to comply with the regulatory controls of each country in which we conduct or intend to conduct business, the requirements of which may not be clearly defined. The varying compliance requirements of these different regulatory jurisdictions, which are often unclear, may limit our ability to continue existing international operations and further expand internationally.
Failure to comply with applicable regulatory capital requirements could subject us to sanctions imposed by the SEC, FINRA and other SROs or regulatory bodies.
Certain of our subsidiaries are subject to regulatory capital rules of the SEC, FINRA, other SROs and foreign regulators. These rules, which specify minimum capital requirements for our regulated subsidiaries, are designed to measure the general financial integrity and liquidity of a broker‑dealer and require that at least a minimum part of its assets be kept in relatively liquid form. In general, net capital is defined as net worth (assets minus liabilities), plus qualifying subordinated borrowings, less certain mandatory deductions that result from, among other things, excluding assets that are not readily convertible into cash and from valuing conservatively certain other assets. Among these deductions are adjustments, commonly called haircuts, which reflect the possibility of a decline in the market value of an asset before disposition, and non‑allowable assets.
Failure to maintain the required minimum capital may subject our regulated subsidiaries to a fine, requirement to cease conducting business, suspension, revocation of registration or expulsion by the applicable regulatory authorities, and ultimately could require the relevant entity’s liquidation. Events relating to capital adequacy could give rise to regulatory actions that could limit business expansion or require business reduction. SEC and SRO net capital rules prohibit payments of dividends, redemptions of stock, prepayments of subordinated indebtedness and the making of any unsecured advances or loans to a stockholder, employee or affiliate, in certain circumstances, including if such payment would reduce the firm’s net capital below required levels. Similar issues and risks arise in connection with the capital adequacy requirements of foreign regulators.
A change in the net capital rules, the imposition of new rules or any unusually large charges against net capital could limit our operations that require the intensive use of capital and also could restrict our ability to withdraw capital from our broker‑dealer subsidiaries. A significant operating loss or any unusually large charge against net capital could negatively impact our ability to expand or even maintain our present levels of business. Similar issues and risks arise in connection with the capital adequacy requirements of foreign regulators. Any of these results could have a material adverse effect on our business, financial condition and results of operations.
We are subject to risks relating to litigation and potential securities law liability.
We are exposed to substantial risks of liability under federal and state securities laws and other federal and state laws and court decisions, as well as rules and regulations promulgated by the SEC, the CFTC, state securities regulators, SROs and foreign regulatory agencies. These risks may be enhanced by recent scrutiny of electronic trading and market structure from regulators, lawmakers and the financial news media. We are also subject to the risk of litigation and claims that may be without merit. From time to time, we, our officers, directors and employees may be named in legal actions, regulatory investigations and proceedings, arbitrations and administrative claims and be subject to claims alleging the violations of laws, rules and regulations, some of which may ultimately result in the payment of fines, awards, judgments and settlements. We could incur significant legal expenses in defending ourselves against and resolving lawsuits or claims even if we believe them to be meritless. An adverse resolution of any future lawsuits or claims against us could result in a negative perception of our Company and cause the market price of our common stock to decline or otherwise have a material adverse effect on our business, financial condition, results of operations and cash flows.
22
Proposed legislation in the European Union, the U.S. and other jurisdictions that would impose taxes on certain financial transactions could have a material adverse effect on our business and financial results.
On February 14, 2013, the European Commission tabled a proposal for a Council Directive to implement an enhanced cooperation procedure among 11 European Union Member States (Belgium, Germany, Estonia, Greece, Spain, France, Italy, Austria, Portugal, Slovenia and Slovakia) for the purposes of a financial transaction tax among those Member States. Diplomats from the 11 EU member states had initially aimed to come to an agreement on the future European tax on financial transactions by the end of 2014; however, consensus on the final terms has not yet been reached. The exact terms of the process by which such a financial transaction tax would be implemented are under consideration by the European Commission, but the envisioned tax would broadly apply to transactions in financial instruments, including equities, certain derivatives and potentially some other financial instruments. In September 2013, the European Legal Service issued an opinion questioning the legal validity of the European Commission’s proposal, creating uncertainty as to the status of the proposal’s implementation. Similarly, in 2013, U.S. Representative Peter DeFazio and former Senator Thomas Harkin introduced proposed legislation, a bill entitled the “Wall Street Trading and Speculators Tax Act,” which would have, subject to certain exceptions, imposed an excise tax on the purchase of a security, including equities, bonds, debentures, other debt and interests in derivative financial instruments, if the purchase occured or was cleared on a trading facility in the U.S. and the purchaser or seller is a U.S. person. More recently, U.S. Representative Chris Van Hollen presented an “action plan” that included a financial transaction fee. These proposed transaction taxes would apply to certain aspects of our business and transactions in which we are involved. Any such tax would increase our cost of doing business to the extent that (i) the tax is regularly applicable to transactions in the markets in which we operate, (ii) the tax does not include exceptions for market makers or market making activities that is broad enough to cover our activities or (iii) we are unable to widen our bid/ask spreads in the markets in which such a tax would be applicable to compensate for its imposition. Furthermore, the proposed taxes may reduce or negatively impact trading volume and transactions on which we are dependent for revenues. While it is difficult to assess the impact the proposed taxes could have on us, if either transaction tax is implemented or any similar tax is implemented in any other jurisdiction in which we operate, our business, financial condition, results of operations and cash flows could suffer a material adverse effect, and could be impacted to a greater degree than other market participants.
Failure to comply with laws and regulations applicable to our international operations may increase costs, reduce profits, limit growth or subject us to broader liability.
Our business operations in countries outside the U.S. are subject to a number of laws and regulations, including restrictions imposed by the Foreign Corrupt Practices Act (the “FCPA”) and trade sanctions administered by the Office of Foreign Assets Control (the “OFAC”). The FCPA is intended to prohibit bribery of foreign officials and requires companies whose securities are listed in the U.S. to keep books and records that accurately and fairly reflect those companies’ transactions and to devise and maintain an adequate system of internal accounting controls. The OFAC administers and enforces economic and trade sanctions based on U.S. foreign policy and national security goals against designated foreign states, organizations and individuals. We have policies in place reasonably designed to comply with applicable OFAC sanctions, rules and regulations. In addition, some of our operations may be subject to laws and regulations of non‑U.S. jurisdictions containing prohibitions on bribery and other corrupt business activities. If we fail to comply with these laws and regulations, we could be exposed to claims for damages, financial penalties, reputational harm, incarceration of employees and restrictions on our operations and cash flows.
We depend on our technology, and our future results may be negatively impacted if we cannot remain technologically competitive.
We believe that our success in the past has largely been attributable to our technology, which has taken many years to develop. If technology equivalent to ours becomes more widely available for any reason, our operating results may be negatively impacted. Additionally, adoption or development of similar or more advanced technologies by our competitors may require that we devote substantial resources to the development of more advanced technology to remain competitive. Regulators and exchanges may also introduce risk control and other technological requirements on our business that could result in increased costs of compliance and divert our technological resources away from their primary strategy development and maintenance duties. The markets in which we compete are characterized by rapidly changing technology, evolving industry standards and changing trading systems, practices and techniques. The widespread adoption of new internet, networking or telecommunications technologies or other technological changes
23
could require us to incur substantial expenditures to modify or adapt our services or infrastructure. We may not be able to anticipate or respond adequately or in a cost‑efficient and competitive manner to technological advancements (including advancements related to low‑latency technologies, execution and messaging speeds) or changing industry standards. If any of these risks materialize, it could have a material adverse effect on our business, financial condition, results of operations and cash flows.
Our reliance on our computer systems and software could expose us to great financial harm if any of our computer systems or software were subject to any material disruption or corruption.
We rely significantly on our computer systems and software to receive and properly process internal and external data and utilize such data to generate orders and other messages. A disruption or corruption of the proper functioning of our computer systems or software could cause us to make erroneous trades, which could result in material losses. We cannot guarantee that our efforts to maintain competitive computer systems and software will be successful. Our computer systems and software may fail or be subject to bugs or other errors, resulting in service interruptions or other unintended consequences. If any of these risks materialize, they could have a material adverse effect on our business, financial condition, results of operations and cash flows.
Our failure to protect our systems and network against cybersecurity breaches, or otherwise protect confidential and proprietary information, could damage our reputation and negatively impact our business.
Our cybersecurity measures may not detect or prevent all attempts to compromise our systems, including denial‑of‑service attacks, viruses, malicious software, break‑ins, phishing attacks, social engineering, security breaches or other attacks and similar disruptions that may jeopardize the security of information stored in and transmitted by our systems or that we otherwise maintain. Breaches of our cybersecurity measures could result in any of the following: unauthorized access to our systems; unauthorized access to and misappropriation of information or data, including confidential or proprietary information about ourselves, third parties with whom we do business or our proprietary systems; viruses, worms, spyware or other malware being placed in our systems; deletion or modification of client information; or a denial‑of‑service or other interruptions to our business operations. Because techniques used to obtain unauthorized access to or sabotage systems change frequently and may not be known until launched against us or our third‑party service providers, we may be unable to anticipate these attacks or to implement adequate preventative measures. While we have not suffered any material breach of our cybersecurity, any actual or perceived breach of our cybersecurity could damage our reputation, expose us to a risk of loss or litigation and possible liability, require us to expend significant capital and other resources to alleviate problems caused by such breaches and otherwise have a material adverse effect on our business, financial condition, results of operations and cash flows.
Capacity constraints, systems failures, malfunctions and delays could harm our business.
Our business activities are heavily dependent on the integrity and performance of the computer and communications systems supporting them. Our systems and operations are vulnerable to damage or interruption from human error, software bugs and errors, electronic and physical security breaches, natural disasters, power loss, utility or internet outages, computer viruses, intentional acts of vandalism, terrorism and other similar events. Extraordinary trading volumes or other events could cause our computer systems to operate in ways that we did not intend, at an unacceptably low speed or even fail. While we have invested significant amounts of capital to upgrade the capacity, reliability and scalability of our systems, there can be no assurance that our systems will always operate properly or be sufficient to handle such extraordinary trading volumes. Any disruption for any reason in the proper functioning or any corruption of our software or erroneous or corrupted data may cause us to make erroneous trades or suspend our services and could have a material adverse effect on our business, financial condition, results of operations and cash flows.
Although our systems and infrastructure are generally designed to accommodate additional growth without redesign or replacement, we may need to make significant investments in additional hardware and software to accommodate growth. Failure to make necessary expansions and upgrades to our systems and infrastructure could not only limit our growth and business prospects but could also cause substantial losses and have a material adverse effect on our business, financial condition, results of operations and cash flows.
24
Since the timing and impact of disasters and disruptions are unpredictable, we may not be able to respond to actual events as they occur. Business disruptions can vary in their scope and significance and can affect one or more of our facilities. Further, the severity of the disruption can also vary from minimal to severe. Although we have employed significant effort to develop, implement and maintain reasonable disaster recovery and business continuity plans, we cannot guarantee that our systems will fully recover after a significant business disruption in a timely fashion or at all. If we are prevented from using any of our current trading operations, or if our business continuity operations do not work effectively, we may not have complete business continuity, which could have a material adverse effect on our business, financial condition, results of operations and cash flows.
Failure or poor performance of third‑party software, infrastructure or systems on which we rely could adversely affect our business.
We depend on third parties to provide and maintain certain infrastructure that is critical to our business. For example, we rely on third parties to provide software, data center services and dedicated fiber optic, microwave, wireline and wireless communication infrastructure. This infrastructure may malfunction or fail due to events outside of our control, which could disrupt our operations and have a material adverse effect on our business, financial condition and results of operations. Any failure to maintain and renew our relationships with these third parties on commercially favorable terms, or to enter into similar relationships in the future, could have a material adverse effect on our business, financial condition, results of operations and cash flows.
We also rely on certain third‑party software, third‑party computer systems and third‑party service providers, including clearing systems, exchange systems, alternate trading systems, order routing systems, internet service providers, communications facilities and other facilities. Any interruption in these third‑party services or software, deterioration in their performance, or other improper operation could interfere with our trading activities, cause losses due to erroneous or delayed responses, or otherwise be disruptive to our business. If our arrangements with any third party are terminated, we may not be able to find an alternative source of software or systems support on a timely basis or on commercially reasonable terms. This could also have a material adverse effect on our business, financial condition, results of operations and cash flows.
The use of open source software may expose us to additional risks.
We use software development tools covered by open source licenses and may incorporate such open source software into our proprietary software from time to time. “Open source software” refers to any code, shareware or other software that is made generally available to the public without requiring payment of fees or royalties and/or that may require disclosure or licensing of any software that incorporates such source code, shareware or other software. Given the nature of open source software, third parties might assert contractual or copyright and other intellectual property‑related claims against us based on our use of such tools and software programs or might seek to compel the disclosure of the source code of our software or other proprietary information. If any such claims materialize, we could be required to (i) seek licenses from third parties in order to continue to use such tools and software or to continue to operate certain elements of our technology, (ii) release certain proprietary software code comprising our modifications to such open source software, (iii) make our software available under the terms of an open source license or (iv) re‑engineer all, or a portion of, that software, any of which could materially and adversely affect our business, financial condition and results of operations. While we monitor the use of all open source software in our solutions, processes and technology and try to ensure that no open source software is used (i) in such a way as to require us to disclose the source code to the related solution when we do not wish to do so nor (ii) in connection with critical or fundamental elements of our software or technology, such use may have inadvertently occurred in deploying our proprietary solutions. If a third‑party software provider has incorporated certain types of open source software into software we license from such third party for our products and solutions, we could, under certain circumstances, be required to disclose the source code to our solutions. In addition to risks related to license requirements, usage of open software can lead to greater risks than use of third‑party commercial software because open source licensors generally do not provide warranties or controls on the origin of the software. Many of the risks associated with usage of open source software cannot be eliminated and could potentially have a material adverse effect on our business, financial condition, results of operations and cash flows.
25
We may not be able to protect our intellectual property rights or may be prevented from using intellectual property necessary for our business.
We rely primarily on trade secret, trademark, domain name, copyright and contract law to protect our intellectual property and proprietary technology. It is possible that third parties may copy or otherwise obtain and use our intellectual property or proprietary technology without authorization or otherwise infringe on our rights. For example, while we have a policy of entering into confidentiality, intellectual property invention assignment and/or non‑competition and non‑solicitation agreements or restrictions with our employees, independent contractors and business partners, such agreements may not provide adequate protection or may be breached, or our proprietary technology may otherwise become available to or be independently developed by our competitors. The promulgation of laws or rules which require the maintenance of source code or other intellectual property in a repository subject to certain requirements and/or which enhance or facilitate access to such source code by regulatory authorities could inhibit our ability to protect against unauthorized dissemination or use of our intellectual property. Third parties have alleged and may in the future allege that we are infringing, misappropriating or otherwise violating their intellectual property rights. Third parties may initiate litigation against us without warning, or may send us letters or other communications that make allegations without initiating litigation. We may elect not to respond to these letters or other communications if we believe they are without merit, or we may attempt to resolve these disputes out of court by negotiating a license, but in either case it is possible that such disputes will ultimately result in litigation. Any such claims could interfere with our ability to use technology or intellectual property that is material to the operation of our business. Such claims may be made by competitors seeking to obtain a competitive advantage or by other parties, such as entities that purchase intellectual property assets for the purpose of bringing infringement claims. We also periodically employ individuals who were previously employed by our competitors or potential competitors, and we may therefore be subject to claims that such employees have used or disclosed the alleged trade secrets or other proprietary information of their former employers.
In the future, we may have to rely on litigation to enforce our intellectual property rights, protect our trade secrets, determine the validity and scope of the proprietary rights of others or defend against claims of infringement or invalidity. Any such litigation, whether successful or unsuccessful, could result in substantial costs and the diversion of resources and the attention of management. If unsuccessful, such litigation could result in the loss of important intellectual property rights, require us to pay substantial damages, subject us to injunctions that prevent us from using certain intellectual property, require us to make admissions that affect our reputation in the marketplace and require us to enter into license agreements that may not be available on favorable terms or at all. Finally, even if we prevail in any litigation, the remedy may not be commercially meaningful or fully compensate us for the harm we suffer or the costs we incur. Any of the foregoing could have a material adverse effect on our business, financial condition, results of operations and cash flows.
We are exposed to risks associated with our international operations and expansion.
We are exposed to risks and uncertainties inherent in doing business in international markets, particularly in the heavily regulated broker‑dealer industry. Such risks and uncertainties include political, economic and financial instability, unexpected changes in regulatory requirements, tariffs and other trade barriers, exchange rate fluctuations, applicable currency controls, the imposition of restrictions on currency conversion or the transfer of funds, limitations on our ability to repatriate non‑U.S. earnings in a tax efficient manner and difficulties in staffing and managing foreign operations, including reliance on local experts.
In addition, the varying compliance requirements of these different regulatory jurisdictions and other factors may limit our ability to successfully conduct or expand our business internationally and may increase our costs of investment. Expansion into international locations involves substantial operational and execution risk. We may not be able to manage these costs or risks effectively.
Fluctuations in currency exchange rates could negatively impact our earnings.
A significant portion of our international business is conducted in currencies other than the U.S. dollar, and changes in foreign exchange rates relative to the U.S. dollar can therefore affect the value of our non‑U.S. dollar net assets, revenues and expenses. Although we closely monitor potential exposures as a result of these fluctuations in currencies, and where cost‑justified we adopt strategies that are designed to reduce the impact of these fluctuations on
26
our financial performance, including the financing of non‑U.S. dollar assets with borrowings in the same currency and the use of various hedging transactions related to net assets, revenues, expenses or cash flows, there can be no assurance that we will be successful in managing our foreign exchange risk. Our exposure to currency exchange rate fluctuations will grow if the relative contribution of our operations outside the U.S. increases. Any material fluctuations in currencies could have a material effect on our financial condition, results of operations and cash flows.
We may experience risks associated with future growth or expansion of our operations or acquisitions or dispositions of businesses, and we may never realize the anticipated benefits of such activities.
As a part of our business strategy, we may make acquisitions or significant investments in and/or disposals of businesses. Any such future acquisitions, investments and/or dispositions would be accompanied by risks such as difficulties in assimilating the operations and personnel of acquired companies or businesses, diversion of our management’s attention from ongoing business concerns, our potential inability to maximize our financial and strategic position through the successful incorporation or disposition of operations, maintenance of uniform standards, controls, procedures and policies and the impairment of existing relationships with employees, contractors, suppliers and customers as a result of the integration of new management personnel and cost‑saving initiatives.
We cannot guarantee that we will be able to successfully integrate any company or business that we might acquire in the future, and our failure to do so could harm our current business.
In addition, we may not realize the anticipated benefits of any such transactions, and there may be other unanticipated or unidentified effects. While we would seek protection, for example, through warranties and indemnities in the case of acquisitions, significant liabilities may not be identified in due diligence or come to light after the expiration of warranty or indemnity periods. Additionally, while we would seek to limit our ongoing exposure, for example, through liability caps and period limits on warranties and indemnities in the case of disposals, some warranties and indemnities may give rise to unexpected and significant liabilities. If we fail to realize any such anticipated benefits, or if we experience any such unanticipated or unidentified effects in connection with any future acquisitions, investments or dispositions, we could suffer a material adverse effect on our business, financial condition, results of operations and cash flows.
Our future efforts to sell shares of our common stock or raise additional capital may be delayed or prohibited by regulations.
As certain of our subsidiaries are members of FINRA and other SROs, we are subject to certain regulations regarding changes in ownership or control and material changes in operations. For example, FINRA’s NASD Rule 1017 generally provides that FINRA approval must be obtained in connection with certain change of ownership or control transactions, such as a transaction that results in a single entity or person owning 25% or more our equity. Similarly, Virtu Financial Ireland Limited, one of our Irish subsidiaries, is subject to change in control regulations promulgated by the Central Bank of Ireland. As a result of these regulations, our future efforts to sell shares of our common stock or raise additional capital may be delayed or prohibited. We may be subject to similar restrictions in other jurisdictions in which we operate.
We are dependent on the continued service of certain key executives, the loss or diminished performance of whom could have a material adverse effect on our business.
Our performance is substantially dependent on the performance of our senior management, including Mr. Viola, our Founder and Executive Chairman, Mr. Cifu, our Chief Executive Officer and Mr. Molluso, our Chief Financial Officer. In connection with our initial public offering, we entered into employment and/or severance protection agreements with certain members of our senior management team that restrict their ability to compete with us should they decide to leave our Company. Even though we have entered into these agreements, we cannot be sure that any member of our senior management will remain with us or that they will not compete with us in the future. The loss of any member of our senior management team could impair our ability to execute our business plan and growth strategy and have a negative impact on our revenues, in addition to potentially causing employee morale problems and/or the loss of key employees. In particular, Messrs. Viola and Cifu invest in other businesses and spend time on such matters, which could divert their attention from us. Our employment agreement with Mr. Cifu specifically permits his participation in
27
and attention to certain other business activities, including but not necessarily limited to his role as the Vice Chairman and Alternate Governor of the Florida Panthers, a National Hockey League franchise, his role as a director of the Independent Bank Group, Inc., a regional bank holding company and his role as a director of Eastern Air Lines Group, Inc., a domestic airline. We cannot guarantee that these or other permitted outside activities will not impact his performance as Chief Executive Officer.
Our success depends, in part, on our ability to identify, recruit and retain skilled management and technical personnel. If we fail to recruit and retain suitable candidates or if our relationship with our employees changes or deteriorates, it could have a material adverse effect on our business.
Our future success depends, in part, upon our continued ability to identify, attract, hire and retain highly qualified personnel, including skilled technical, management, product and technology, trading, sales and marketing personnel, all of whom are in high demand and are often subject to competing offers. Competition for qualified personnel in the financial services industry is intense and we cannot assure you that we will be able to hire or retain a sufficient number of qualified personnel to meet our requirements, or that we will be able to do so at salary, benefit and other compensation costs that are acceptable to us or that would allow us to achieve operating results consistent with our historical results. A loss of qualified employees, or an inability to attract, retain and motivate additional highly skilled employees in the future, could have a material adverse effect on our business.
We could lose significant sources of revenues if we were to lose access to an important exchange or other trading venue.
Changes in applicable laws, regulations or rules promulgated by exchanges could conceivably prevent us from providing liquidity to an exchange or other trading venue where we provide liquidity today. Though our revenues are diversified across exchanges and other trading venues, asset classes and geographies, the loss of access to one or more significant exchanges and other trading venues for any reason could have a material adverse effect on our business, financial condition and results of operations.
Risks Related to Our Organization and Structure
We are a holding company and our principal asset is our 27.5% equity interest in Virtu Financial, and we are accordingly dependent upon distributions from Virtu Financial to pay dividends, if any, taxes and other expenses.
We are a holding company and our principal asset is our direct and indirect ownership of 27.5% of the outstanding non-voting common interest units in Virtu Financial (“Virtu Financial Units”). We have no independent means of generating revenue. As the sole managing member of Virtu Financial, we cause Virtu Financial to make distributions to its equityholders, including the Founder Post-IPO Member, a management vehicle that holds Virtu Financial Units on behalf of key employees (“Virtu Employee Holdco”), certain current and former members of management of the Company and their affiliates (the “Management Members”) and us, in amounts sufficient to fund dividends to our stockholders in accordance with our dividend policy and, as further described below, to cover all applicable taxes payable by us and any payments we are obligated to make under the tax receivable agreements we entered into as part of the reorganization transactions, but we are limited in our ability to cause Virtu Financial to make these and other distributions to us (including for purposes of paying corporate and other overhead expenses and dividends) under our credit agreement. In addition, certain laws and regulations may result in restrictions on Virtu Financial’s ability to make distributions to its equityholders (including us), or the ability of its subsidiaries to make distributions to it. These include:
•the SEC Net Capital Rule (Rule 15c3‑1) requires each of Virtu Financial’s registered broker‑dealer subsidiaries to maintain specified levels of net capital;
•FINRA Rule 4110 imposes a requirement of prior FINRA approval for any distribution by Virtu Financial’s FINRA member registered broker‑dealer subsidiary in excess of 10% of its excess net capital; and
•Virtu Financial’s regulated Irish subsidiary must obtain prior approval from the Central Bank of Ireland for any distribution or dividend.
28
To the extent that we need funds and Virtu Financial is restricted from making such distributions to us, under applicable law or regulation, as a result of covenants in our credit agreement or otherwise, we may not be able to obtain such funds on terms acceptable to us or at all and as a result could suffer a material adverse effect on our liquidity and financial condition.
Under the Third Amended and Restated Limited Liability Company Agreement of Virtu Financial (the “Amended and Restated Virtu Financial LLC Agreement”), we expect Virtu Financial from time to time to make pro rata distributions in cash to its equityholders, including the Founder Post‑IPO Member, the trust that holds equity interests in Virtu Financial on behalf of certain employees of ours based outside the United States, which we refer to as the “Employee Trust”, Virtu Employee Holdco and us, in amounts sufficient to cover the taxes on their allocable share of the taxable income of Virtu Financial. As a result of (i) potential differences in the amount of net taxable income allocable to us and to Virtu Financial’s other equityholders, (ii) the lower tax rate applicable to corporations than individuals and (iii) the favorable tax benefits that we anticipate from (a) the exchange of Virtu Financial Units and corresponding shares of Class C common stock or Class D common stock, (b) payments under the tax receivable agreements and (c) future deductions attributable to the prior acquisition of interests in Virtu Financial by an affiliate of Silver Lake Partners and Temasek and the Temasek Pre‑IPO Member, we expect that these tax distributions will be in amounts that exceed our tax liabilities. Our board of directors will determine the appropriate uses for any excess cash so accumulated, which may include, among other uses, the payment of obligations under the tax receivable agreements and the payment of other expenses. We will have no obligation to distribute such cash (or other available cash) to our shareholders. No adjustments to the exchange ratio for Virtu Financial Units and corresponding shares of common stock will be made as a result of any cash distribution by us or any retention of cash by us, and in any event the ratio will remain one‑to‑one.
We are controlled by the Founder Post‑IPO Member, whose interests in our business may be different than yours, and certain statutory provisions afforded to stockholders are not applicable to us.
The Founder Post‑IPO Member controls approximately 93.1% of the combined voting power of our common stock as a result of its ownership of our Class D common stock, each share of which is entitled to 10 votes on all matters submitted to a vote of our stockholders.
The Founder Post‑IPO Member has the ability to substantially control our Company, including the ability to control any action requiring the general approval of our stockholders, including the election of our board of directors, the adoption of amendments to our certificate of incorporation and by‑laws and the approval of any merger or sale of substantially all of our assets. This concentration of ownership and voting power may also delay, defer or even prevent an acquisition by a third party or other change of control of our Company and may make some transactions more difficult or impossible without the support of the Founder Post‑IPO Member, even if such events are in the best interests of minority stockholders. This concentration of voting power with the Founder Post‑IPO Member may have a negative impact on the price of our Class A common stock. In addition, because shares of our Class B common stock and Class D common stock each have 10 votes per share on matters submitted to a vote of our stockholders, the Founder Post‑IPO Member is able to control our Company as long as it owns at least 25% of our issued and outstanding common stock.
The Founder Post‑IPO Member’s interests may not be fully aligned with yours, which could lead to actions that are not in your best interest. Because the Founder Post‑IPO Member holds part of its economic interest in our business through Virtu Financial, rather than through the public company, it may have conflicting interests with holders of shares of our Class A common stock. For example, the Founder Post‑IPO Member may have a different tax position from us, which could influence its decisions regarding whether and when we should dispose of assets or incur new or refinance existing indebtedness, especially in light of the existence of the tax receivable agreements that we entered into in connection with our initial public offering, and whether and when we should undergo certain changes of control within the meaning of the tax receivable agreements or terminate the tax receivable agreements. In addition, the structuring of future transactions may take into consideration these tax or other considerations even where no similar benefit would accrue to us. See “Certain Relationships and Related Party Transactions — Tax Receivable Agreements.” In addition, pursuant to the Exchange Agreement described under “Certain Relationships and Related Party Transactions — Exchange Agreement,” the holders of Virtu Financial Units and shares of our Class C common stock or Class D common stock are not required to participate in a proposed sale of our Company that is tax‑free for our stockholders unless the transaction is also tax‑free for such holders of Virtu Financial Units and shares of our Class C common stock
29
or Class D common stock. This requirement could limit structural alternatives available to us in any such proposed transaction and could have the effect of discouraging transactions that might benefit you as a holder of shares of our Class A common stock. See “Certain Relationships and Related Party Transactions — Exchange Agreement.” In addition, the Founder Post‑IPO Member’s significant ownership in us and resulting ability to effectively control us may discourage someone from making a significant equity investment in us, or could discourage transactions involving a change in control, including transactions in which you as a holder of shares of our Class A common stock might otherwise receive a premium for your shares over the then‑current market price.
We have opted out of Section 203 of the General Corporation Law of the State of Delaware (the “Delaware General Corporation Law”), which prohibits a publicly held Delaware corporation from engaging in a business combination transaction with an interested stockholder for a period of three years after the interested stockholder became such unless the transaction fits within an applicable exemption, such as board approval of the business combination or the transaction which resulted in such stockholder becoming an interested stockholder. Therefore, the Founder Post‑IPO Member is able to transfer control of us to a third party by transferring its shares of our common stock (subject to certain restrictions and limitations), which would not require the approval of our board of directors or our other stockholders.
Our amended and restated certificate of incorporation provides that, to the fullest extent permitted by law, the doctrine of “corporate opportunity” does not apply against the Founder Post‑IPO Member, Mr. Viola, affiliates of Silver Lake Partners (the “Silver Lake Equityholders”), the Temasek Post‑IPO Stockholder, any of our non‑employee directors or any of their respective affiliates in a manner that would prohibit them from investing in competing businesses or doing business with our clients or customers. In addition, subject to the restrictions on competitive activities described below, Mr. Cifu is permitted to become engaged in, or provide services to, any other business or activity in which Mr. Viola is currently engaged or permitted to become engaged, to the extent that Mr. Cifu’s level of participation in such businesses or activities is consistent with his current participation in such businesses and activities. The Amended and Restated Virtu Financial LLC Agreement provides that Mr. Viola, in addition to our other executive officers and our employees that are Virtu Post‑IPO Members, including Mr. Cifu, may not directly or indirectly engage in certain competitive activities until the third anniversary of the date on which such person ceases to be an officer, director or employee of ours. The Silver Lake Equityholders, the Temasek Post‑IPO Stockholder and our non‑employee directors are not subject to any such restriction. See “Certain Relationships and Related Party Transactions — Amended and Restated Virtu Financial Limited Liability Company Agreement.” To the extent that the Founder Post‑IPO Member, Mr. Viola, the Silver Lake Equityholders, the Temasek Post‑IPO Stockholder, our non‑employee directors or any of their respective affiliates invests in other businesses, they may have differing interests than our other stockholders. Messrs. Viola and Cifu have business relationships outside of our business. See “Certain Relationships and Related Party Transactions — Other Transactions.”
For additional information regarding the share ownership of, and our relationship with, the Founder Post‑IPO Member, the Silver Lake Equityholders and the Temasek Post‑IPO Stockholder, you should read the information under the headings “Principal and Selling Stockholders” and “Certain Relationships and Related Party Transactions.”
We have a substantial amount of indebtedness, which could negatively impact our business and financial condition.
As of December 31, 2015, we had an aggregate of $499.8 million outstanding indebtedness under our senior secured credit facility. If we cannot generate sufficient cash flow from operations to service our debt, we may need to refinance our debt, dispose of assets or issue equity to obtain necessary funds. We do not know whether we will be able to take any of such actions on a timely basis, on terms satisfactory to us or at all.
Our substantial amount of indebtedness could limit our ability to obtain necessary additional financing for working capital, capital expenditures or other purposes in the future, plan for or react to changes in our business and the industries in which we operate, make future acquisitions or pursue other business opportunities and react in an extended economic downturn.
Despite our substantial indebtedness, we may still be able to incur significantly more debt. The incurrence of additional debt could increase the risks associated with our substantial leverage, including our ability to service our indebtedness. In addition, because borrowings under our senior secured credit facility bear interest at a variable rate, our
30
interest expense could increase, exacerbating these risks. For instance, assuming an aggregate principal balance of $499.8 million outstanding under our senior secured credit facility, which was the amount outstanding as of December 31, 2015, a 1% increase in the interest rate we are charged on our debt would increase our annual interest expense by $5.0 million.
In addition, the covenants in our credit agreement may negatively impact our ability to finance future operations or capital needs or to engage in other business activities. Our credit agreement requires us to maintain specified financial ratios and tests, including interest coverage and total leverage ratios, which may require us to take action to reduce our debt or to act in a manner contrary to our business objectives. Our credit agreement also restricts our ability to, among other things, incur additional indebtedness, dispose of assets, guarantee debt obligations, repay other indebtedness, pay dividends, pledge assets, make investments, including in certain of our operating subsidiaries, make acquisitions or consummate mergers or consolidations and engage in certain transactions with subsidiaries and affiliates.
A failure to comply with the restrictions contained in our credit agreement could lead to an event of default, which could result in an acceleration of our indebtedness. Our future operating results may not be sufficient to enable compliance with the covenants in our credit agreement or to remedy such a default. In addition, in the event of an acceleration, we may not have or be able to obtain sufficient funds to refinance our indebtedness or to make any accelerated payments. Even if we were able to obtain new financing, we would not be able to guarantee that the new financing would be on commercially reasonable terms. If we default on our indebtedness, our business, financial condition and results of operation could suffer a material adverse effect.
We are exempt from certain corporate governance requirements since we are a “controlled company” within the meaning of the NASDAQ rules, and as a result our stockholders do not have the protections afforded by these corporate governance requirements.
The Founder Post‑IPO Member controls more than 50% of our combined voting power. As a result, we are considered a “controlled company” for purposes of the NASDAQ rules and corporate governance standards, and therefore we are permitted and have elected not to, comply with certain NASDAQ corporate governance requirements, including those that would otherwise require our board of directors to have a majority of independent directors and require that we either establish a Compensation and Nominating and Corporate Governance Committees, each comprised entirely of independent directors, or otherwise ensure that the compensation of our executive officers and nominees for directors are determined or recommended to the board of directors by the independent members of the board of directors. Accordingly, holders of our Class A common stock do not have the same protections afforded to stockholders of companies that are subject to all of the NASDAQ rules and corporate governance standards, and the ability of our independent directors to influence our business policies and affairs may be reduced.
We are required to pay the Virtu Post‑IPO Members and the Investor Post‑IPO Stockholders for certain tax benefits we may claim, and the amounts we may pay could be significant.
In connection with the reorganization transactions, we acquired equity interests in Virtu Financial from an affiliate of Silver Lake Partners and the Temasek Pre‑IPO Member in the Mergers. In addition, we used a portion of the net proceeds from our IPO and our Secondary Offering to purchase Virtu Financial Units and corresponding shares of Class C common stock from certain Virtu Post‑IPO Members, including the Silver Lake Post‑IPO Members, and certain employees. These acquisitions of interests in Virtu Financial resulted in tax basis adjustments to the assets of Virtu Financial that were allocated to us and our subsidiaries. Future acquisitions of interests in Virtu Financial are expected to produce favorable tax attributes. In addition, future exchanges by the Virtu Post‑IPO Members of Virtu Financial Units and corresponding shares of Class C common stock or Class D common stock, as the case may be, for shares of our Class A common stock or Class B common stock, respectively, are expected to produce favorable tax attributes. These tax attributes would not be available to us in the absence of such transactions. Both the existing and anticipated tax basis adjustments are expected to reduce the amount of tax that we would otherwise be required to pay in the future.
We entered into three tax receivable agreements with the Virtu Post‑IPO Members and the Investor Post‑IPO Stockholders (one with the Founder Post‑IPO Member, the Employee Trust, Virtu Employee Holdco and other post‑IPO investors, other than affiliates of Silver Lake Partners and affiliates of Temasek, another with the Investor Post‑IPO
31
Stockholders and the other with the Silver Lake Post‑IPO Members) that provide for the payment by us to the Virtu Post‑IPO Members and the Investor Post‑IPO Stockholders (or their transferees of Virtu Financial Units or other assignees) of 85% of the amount of cash savings, if any, in U.S. federal, state and local income tax or franchise tax that we actually realize as a result of (i) any increase in tax basis in Virtu Financial’s assets resulting from (a) the acquisition of equity interests in Virtu Financial from an affiliate of Silver Lake Partners and Temasek, and the Temasek Pre‑IPO Member in the reorganization transactions (which represents the unamortized portion of the increase in tax basis in Virtu Financial’s assets resulting from a prior acquisition of interests in Virtu Financial by an affiliate of Silver Lake Partners and Temasek, and the Temasek Pre‑IPO Member), (b) the purchases of Virtu Financial Units (along with the corresponding shares of our Class C common stock or Class D common stock, as applicable) from certain of the Virtu Post‑IPO Members using a portion of the net proceeds from our initial public offering or in any future offering, (c) exchanges by the Virtu Post‑IPO Members of Virtu Financial Units (along with the corresponding shares of our Class C common stock or Class D common stock, as applicable) for shares of our Class A common stock or Class B common stock, as applicable, or (d) payments under the tax receivable agreements, (ii) any net operating losses available to us as a result of the Mergers and (iii) tax benefits related to imputed interest deemed arising as a result of payments made under the tax receivable agreements.
The actual increase in tax basis, as well as the amount and timing of any payments under these tax receivable agreements, will vary depending upon a number of factors, including the timing of exchanges by the Virtu Post‑IPO Members, the price of our Class A common stock at the time of the exchange, the extent to which such exchanges are taxable, the amount and timing of the taxable income we generate in the future and the tax rate then applicable and the portion of our payments under the tax receivable agreements constituting imputed interest.
The payments we are required to make under the tax receivable agreements could be substantial. We expect that, as a result of the amount of the increases in the tax basis of the tangible and intangible assets of Virtu Financial, assuming no material changes in the relevant tax law and that we earn sufficient taxable income to realize in full the potential tax benefits described above, future payments to the Virtu Post‑IPO Members and the Investor Post‑IPO Stockholders in respect of the purchases, the exchanges and the Mergers in connection with our initial public offering, and the purchases and exchanges completed in connection with our subsequent public offering will aggregate approximately $218.4 million and range from approximately $8.1 million to $16.8 million per year over the next 15 years. Future payments under the tax receivable agreements in respect of subsequent exchanges would be in addition to these amounts and are expected to be substantial. The payments under the tax receivable agreements are not conditioned upon the Virtu Post‑IPO Members’ or the Investor Post‑IPO Stockholders’ continued ownership of us.
In addition, although we are not aware of any issue that would cause the Internal Revenue Service (the “IRS”) to challenge the tax basis increases or other benefits arising under the tax receivable agreements, the Virtu Post‑IPO Members and the Investor Post‑IPO Stockholders (or their transferees or other assignees) will not reimburse us for any payments previously made if such tax basis increases or other tax benefits are subsequently disallowed, except that any excess payments made to the Virtu Post‑IPO Members and the Investor Post‑IPO Stockholders will be netted against future payments otherwise to be made under the tax receivable agreements, if any, after our determination of such excess. As a result, in such circumstances we could make payments to the Virtu Post‑IPO Members and the Investor Post‑IPO Stockholders under the tax receivable agreements that are greater than our actual cash tax savings and may not be able to recoup those payments, which could negatively impact our liquidity.
In addition, the tax receivable agreements provide that, upon certain mergers, asset sales or other forms of business combination, or certain other changes of control, our or our successor’s obligations with respect to tax benefits would be based on certain assumptions, including that we or our successor would have sufficient taxable income to fully utilize the increased tax deductions and tax basis and other benefits covered by the tax receivable agreements. As a result, upon a change of control, we could be required to make payments under a tax receivable agreement that are greater than the specified percentage of our actual cash tax savings, which could negatively impact our liquidity.
In addition, the tax receivable agreements provide that in the case of a change in control of the Company, the Virtu Post‑IPO Members and the Investor Post‑IPO Stockholders have the option to terminate the applicable tax receivable agreement, and we are required to make a payment to such electing party in an amount equal to the present value of future payments (calculated using a discount rate equal to the lesser of 6.5% or LIBOR plus 100 basis points, which may differ from our, or a potential acquirer’s, then‑current cost of capital) under the tax receivable agreement,
32
which payment would be based on certain assumptions, including those relating to our future taxable income. In these situations, our obligations under the tax receivable agreements could have a substantial negative impact on our, or a potential acquirer’s, liquidity and could have the effect of delaying, deferring, modifying or preventing certain mergers, asset sales, other forms of business combinations or other changes of control. These provisions of the tax receivable agreements may result in situations where the Virtu Post‑IPO Members and the Investor Post‑IPO Stockholder have interests that differ from or are in addition to those of our other shareholders. In addition, we could be required to make payments under the tax receivable agreements that are substantial and in excess of our, or a potential acquirer’s, actual cash savings in income tax.
Finally, because we are a holding company with no operations of our own, our ability to make payments under the tax receivable agreements are dependent on the ability of our subsidiaries to make distributions to us. Our credit agreement restricts the ability of our subsidiaries to make distributions to us, which could affect our ability to make payments under the tax receivable agreements. To the extent that we are unable to make payments under the tax receivable agreements for any reason, such payments will be deferred and will accrue interest until paid, which could negatively impact our results of operations and could also affect our liquidity in periods in which such payments are made.
Risks Related to Our Class A Common Stock
Substantial future sales of shares of our Class A common stock in the public market could cause our stock price to fall.
As of December 31, 2015, we had 38,210,209 shares of Class A common stock outstanding, excluding 11,592,956 shares of Class A common stock issuable pursuant to the 2015 Management Incentive Plan and 100,587,088 shares of Class A common stock issuable upon potential exchanges and/or conversions. Of these shares, the 25,485,483 shares sold in our initial public offering and Secondary Offering will be freely tradable without further restriction under the Securities Act. Upon the completion of this offering, the remaining 113,311,814 outstanding shares of Class A common stock, including shares issuable upon exchange and/or conversion are "restricted securities," as that term is defined under Rule 144 of the Securities Act. The holders of these remaining 113,311,814 shares of our Class A common stock, including shares issuable upon exchange or conversion as described above are entitled to dispose of their shares pursuant to (i) the applicable holding period, volume and other restrictions of Rule 144 or (ii) another exemption from registration under the Securities Act. Additional sales of a substantial number of our shares of Class A common stock in the public market, or the perception that sales could occur, could have a material adverse effect on the price of our Class A common stock.
We have filed a registration statement under the Securities Act registering 12,000,000 shares of our Class A common stock reserved for issuance under our 2015 Management Incentive Plan, 11,592,956 of which are issuable, and we entered into the Registration Rights Agreement pursuant to which we granted demand and piggyback registration rights to the Founder Post-IPO Member, the Silver Lake Equityholders (which, following the Secondary Offering, no longer hold any equity interest in us) and the Temasek Post-IPO Stockholder and piggyback registration rights to certain of the other Virtu Post-IPO Members.
Failure to establish and maintain effective internal control over financial reporting could have a material adverse effect on our business, financial condition, results of operations and stock price.
Maintaining effective internal control over financial reporting is necessary for us to produce reliable financial reports and is important in helping to prevent financial fraud. If we are unable to maintain adequate internal controls over financial reporting, our business and operating results could be harmed. We have begun to develop and implement a plan to test our internal controls over financial reporting to satisfy the requirements of Section 404 of the Sarbanes-Oxley Act of 2002 ("Sarbanes-Oxley") and the related rules of the SEC, which require, among other things, our management to assess annually the effectiveness of our internal control over financial reporting and, if we are no longer an emerging growth company under the Jumpstart Our Business Startups Act (the "JOBS Act"), our independent registered public accounting firm to issue a report on the effectiveness of internal control over financial reporting with our Annual Report on Form 10-K for the year ending December 31, 2016. The internal control assessment required by Section 404 of Sarbanes-Oxley may divert internal resources and we may experience higher operating expenses, higher independent
33
auditor and consulting fees during the implementation of these changes. During the course of this documentation and testing, we may identify deficiencies that we are unable to remediate before the reporting date. For the year ended December 31, 2013, we and our independent registered public accounting firm identified a material weakness in our internal controls over financial reporting. This material weakness related to our inability to prepare accurate financial statements, resulting from a lack of reconciliations, a lack of detailed review and insufficient resources and level of technical accounting expertise within the accounting function. To address this material weakness, we hired senior accounting and finance employees, reallocated existing internal resources and retained third-party consultants to help enhance our internal controls over financial reporting following reviews of our accounting and finance function conducted by members of senior management and by a third-party consultant. Although no material weakness was identified for the years ended December 31, 2014 and December 31, 2015, there can be no assurance that we will avoid future material weaknesses. Any future material weaknesses or any failure to implement required new or improved controls or difficulties encountered in their implementation could cause us to fail to meet our reporting obligations or result in material misstatements in our consolidated financial statements. If our management or our independent registered public accounting firm were to conclude in their reports that our internal control over financial reporting was not effective, investors could lose confidence in our reported financial information, and the trading price of our Class A common stock could drop significantly. Failure to comply with Section 404 of Sarbanes-Oxley could potentially subject us to sanctions or investigations by the SEC, FINRA or other regulatory authorities, as well as increasing the risk of liability arising from litigation based on securities law.
We intend to pay regular dividends to our stockholders, but our ability to do so may be limited by our holding company structure, contractual restrictions and regulatory requirements.
We intend to pay cash dividends on a quarterly basis. See Item 5, “Market for Registrant’s Common Equity, Related Stockholder Matters and Issuer Purchases of Equity Securities.” However, we are a holding company, with our principal asset being our direct and indirect equity interests in Virtu Financial, and we will have no independent means of generating revenue. Accordingly, as the sole managing member of Virtu Financial, we intend to cause, and will rely on, Virtu Financial to make distributions to its equityholders, including the Founder Post-IPO Member, the Employee Trust, Virtu Employee Holdco and us, to fund our dividends. When Virtu Financial makes such distributions, the other equityholders of Virtu Financial will be entitled to receive equivalent distributions pro rata based on their economic interests in Virtu Financial. In order for Virtu Financial to make distributions, it may need to receive distributions from its subsidiaries. Certain of these subsidiaries are or may in the future be subject to regulatory capital requirements that limit the size or frequency of distributions. See " — Risks Related to Our Business — Failure to comply with applicable regulatory capital requirements could subject us to sanctions imposed by the SEC, FINRA and other SROs or regulatory bodies." If Virtu Financial is unable to cause these subsidiaries to make distributions, we may not receive adequate distributions from Virtu Financial in order to fund our dividends.
Our board of directors will periodically review the cash generated from our business and the capital expenditures required to finance our global growth plans and determine whether to modify the amount of regular dividends and/or declare periodic special dividends to our stockholders. Our board of directors will take into account general economic and business conditions, including our financial condition and results of operations, capital requirements, contractual restrictions, including restrictions contained in our credit agreement, business prospects and other factors that our board of directors considers relevant. There can be no assurance that our board of directors will not reduce the amount of regular cash dividends or cause us to cease paying dividends altogether. In addition, our credit agreement limits the amount of distributions our subsidiaries, including Virtu Financial, can make to us and the purposes for which distributions could be made. Accordingly, we may not be able to pay dividends even if our board of directors would otherwise deem it appropriate. See "Management's Discussion and Analysis of Financial Condition and Results of Operations — Liquidity and Capital Resources."
Provisions in our charter documents and certain rules imposed by regulatory authorities may delay or prevent our acquisition by a third party.
Our amended and restated certificate of incorporation and by-laws contain several provisions that may make it more difficult or expensive for a third party to acquire control of us without the approval of our board of directors. These
34
provisions, which may delay, prevent or deter a merger, acquisition, tender offer, proxy contest or other transaction that stockholders may consider favorable, include the following, some of which may only become effective when the Founder Post-IPO Member or any of its affiliates or permitted transferees no longer beneficially own shares representing 25% of our issued and outstanding common stock (the "Triggering Event"):
|
· |
the 10 vote per share feature of our Class B common stock and Class D common stock; |
|
· |
the division of our board of directors into three classes and the election of each class for three-year terms; |
|
· |
the sole ability of the board of directors to fill a vacancy created by the expansion of the board of directors; |
|
· |
advance notice requirements for stockholder proposals and director nominations; |
|
· |
after the Triggering Event, provisions limiting stockholders ability to call special meetings of stockholders, to require special meetings of stockholders to be called and to take action by written consent; |
|
· |
after the Triggering Event, in certain cases, the approval of holders of at least 75% of the shares entitled to vote generally on the making, alteration, amendment or repeal of our certificate of incorporation or by-laws will be required to adopt, amend or repeal our by-laws, or amend or repeal certain provisions of our certificate of incorporation; |
|
· |
after the Triggering Event, the required approval of holders of at least 75% of the shares entitled to vote at an election of the directors to remove directors, which removal may only be for cause; and |
|
· |
the ability of our board of directors to designate the terms of and issue new series of preferred stock without stockholder approval, which could be used, among other things, to institute a rights plan that would have the effect of significantly diluting the stock ownership of a potential hostile acquirer, likely preventing acquisitions that have not been approved by our board of directors. |
These provisions of our amended and restated certificate of incorporation and by-laws could discourage potential takeover attempts and reduce the price that investors might be willing to pay for shares of our Class A common stock in the future, which could reduce the market price of our Class A common stock.
In addition, a third party attempting to acquire us or a substantial position in our Class A common stock may be delayed or ultimately prevented from doing so by change in ownership or control regulations to which certain of our regulated subsidiaries are subject. FINRA's NASD Rule 1017 generally provides that FINRA approval must be obtained in connection with any transaction resulting in a single person or entity owning, directly or indirectly, 25% or more of a member firm's equity and would include a change in control of a parent company. Similarly, Virtu Financial Ireland Limited is subject to change in control regulations promulgated by the Central Bank of Ireland. We may also be subject to similar restrictions in other jurisdictions in which we operate. These regulations could discourage potential takeover attempts and reduce the price that investors might be willing to pay for shares of our Class A common stock in the future, which could reduce the market price of our Class A common stock.
Our stock price may be volatile.
The market price of our Class A common stock is subject to significant fluctuations in response to, among other factors, variations in our operating results and market conditions specific to our business. Furthermore, in recent years the stock market has experienced significant price and volume fluctuations. This volatility has had a significant impact on the market price of securities issued by many companies, including companies in our industry. The changes frequently appear to occur without regard to the operating performance of the affected companies. As such, the price of our Class A common stock could fluctuate based upon factors that have little or nothing to do with us, and these fluctuations could materially reduce the price of our Class A common stock and materially affect the value of your investment.
35
We will incur increased costs as a result of being a public company.
We completed our initial public offering in April 2015, and therefore we have a limited history operating as a public company. As a public company, we incur significant levels of legal, accounting and other expenses that we did not incur as a privately-owned company. Sarbanes-Oxley and related rules of the SEC, together with the listing requirements of NASDAQ, impose significant requirements relating to disclosure controls and procedures and internal control over financial reporting. We have incurred increased costs as a result of compliance with these public company requirements, which require additional resources and make some activities more time consuming than they have been in the past when we were privately owned. We may experience higher than anticipated operating expenses as well as higher independent auditor and consulting fees during the implementation of these changes and thereafter and we may need to hire additional qualified personnel in order to continue to satisfy these public company requirements. We are required to expend considerable time and resources complying with public company regulations. In addition, these laws and regulations may make it more difficult or costly for us to obtain certain types of insurance, including director and officer liability insurance, and we may be forced to accept reduced policy limits and coverage or incur substantially higher costs to obtain the same or similar coverage. In addition, these laws and regulations could make it more difficult for us to attract and retain qualified persons to serve on our board of directors or as executive officers and may divert management's attention. Furthermore, if we are unable to satisfy our obligations as a public company, we could be subject to delisting of our Class A common stock, fines, sanctions and other regulatory action.
Our reliance on exemptions from certain disclosure requirements under the JOBS Act may deter trading in our Class A common stock.
We qualify as an "emerging growth company" under the JOBS Act. As a result, we are permitted to, and have relied and intend to continue to rely, on exemptions from certain disclosure requirements. For so long as we are an emerging growth company, we will not be required to:
|
· |
provide an auditor attestation and report with respect to management's assessment of the effectiveness of our internal controls over financial reporting pursuant to section 404(b) of the Sarbanes-Oxley Act |
|
· |
comply with any requirement that may be adopted by the Public Company Accounting Oversight Board regarding mandatory audit firm rotation or a supplement to the auditor's report providing additional information about the audit and the financial statements (i.e., an auditor discussion and analysis); and |
|
· |
submit certain executive compensation matters to shareholder advisory votes, such as "say-on-pay" and "say-on-frequency," and disclose certain executive compensation related items such as the correlation between executive compensation and performance and comparisons of the Chief Executive Officer's compensation to median employee compensation. |
In addition, Section 107 of the JOBS Act also provides that an emerging growth company can take advantage of the extended transition period provided in Section 7(a)(2)(B) of the Securities Act for complying with new or revised accounting standards. In other words, an emerging growth company can delay the adoption of certain accounting standards until those standards would otherwise apply to private companies. We have elected not to take advantage of the benefits of this extended transition period.
We will remain an "emerging growth company" for up to five years, or until the earliest of (i) the last day of the first fiscal year in which our total annual gross revenues exceed $1 billion, (ii) the date that we become a "large accelerated filer" as defined in Rule 12b-2 under the Securities Exchange Act of 1934, as amended (the "Exchange Act"), which would occur if the market value of our common stock that is held by non-affiliates exceeds $700 million as of the last business day of our most recently completed second fiscal quarter or (iii) the date on which we have issued more than $1 billion in non-convertible debt during the preceding three-year period.
Until such time, however, we cannot predict if investors will find our Class A common stock less attractive because we may rely on these exemptions. If some investors find our Class A common stock less attractive, there may be a less active trading market for our Class A common stock and our stock price may be more volatile.
36
If securities or industry analysts cease to publish research or publish inaccurate or unfavorable research about us or our business, or publish projections for our business that exceed our actual results, our stock price and trading volume could decline.
The trading market for our Class A common stock may be affected by the research and reports that securities or industry analysts publish about us or our business. If one or more of the analysts who covers us downgrades our Class A common stock or publishes inaccurate or unfavorable research about our business, our stock price could decline. In addition, the analysts' projections may have little or no relationship to the results we actually achieve and could cause our stock price to decline if we fail to meet their projections. If one or more of these analysts ceases coverage of us or fails to publish reports on us regularly, our stock price or trading volume could decline.
ITEM 1B. UNRESOLVED STAFF COMMENTS
Not applicable.
Our headquarters are located in leased office space at 900 Third Avenue, 29th Floor, New York, NY 10022. We also lease spaces for our offices in Austin, Dublin, and Singapore. We consider the current arrangements to be adequate for our present needs.
We are subject to various legal proceedings and claims that arise in the ordinary course of business. We also have been, are currently, and may in the future be, the subject of one or more regulatory or self-regulatory organization enforcement actions, including but not limited to targeted and routine regulatory inquiries and investigations involving Regulation NMS, Regulation SHO, capital requirements and other domestic and foreign securities rules and regulations which may from time to time result in the imposition of penalties or fines. In addition, in December 2015, the enforcement committee of the Autorité des marchés financiers (“AMF”) fined our European subsidiary in the amount of €5.0 million (approximately $5.4 million) based on its conclusion that the subsidiary engaged in price manipulation and violations of the AMF General Regulation and Euronext Market Rules. The relevant trading activities were conducted on or around 2009, prior to our acquisition of the subsidiary from MTH. We believe that the relevant trading engaged in by the subsidiary of MTH was conducted in accordance with applicable French law and regulations and we are pursuing our rights of appeal. We have also been the subject of requests for information and documents from the SEC and the State of New York Office of the Attorney General (“NYAG”).
Certain of these matters may result, or have resulted, in adverse judgments, settlements, fines, penalties, injunctions or other relief, and our business or reputation could be negatively impacted if it were determined that disciplinary or other enforcement actions were required. The ultimate effect on the Company from the pending proceedings and claims, if any, is presently unknown. Where available information indicates that it is probable a liability had been incurred at the date of the consolidated financial statements and we can reasonably estimate the amount of that loss, we accrue the estimated loss by a charge to income. In accordance with the foregoing, we have accrued an estimated loss of €5.0 million (approximately $5.4 million) in relation to the fine imposed by the AMF. Subject to the foregoing, based on information currently available, management believes it is not probable that the resolution of any known matters will result in a material adverse effect on the Company’s financial position, results of operations or cash flows although they might be material for any particular reporting period.
ITEM 4. MINE SAFETY DISCLOSURES
Not applicable.
37
ITEM 5. MARKET FOR REGISTRANT’S COMMON EQUITY, RELATED STOCKHOLDER MATTERS AND ISSUER PURCHASES OF EQUITY SECURITIES
Market Prices
The following table shows the high and low sale price for the periods indicated the Company’s common stock, as reported by NASDAQ.
|
|
|
|
Year Ended December 31, 2015 |
||||||
|
|
|
|
Sale Price |
|
|
Dividend per Share |
|||
|
|
|
|
High |
|
|
Low |
|
|
of common stock |
|
Period from January 1 through April 15 |
|
|
N/A |
|
|
N/A |
|
|
N/A |
|
Period from April 16 through June 30 |
|
$ |
24.22 |
|
$ |
21.15 |
|
$ |
— |
|
Period from July 1 through September 30 |
|
$ |
24.29 |
|
$ |
20.23 |
|
$ |
0.24 |
|
Period from October 1 through December 31 |
|
$ |
25.26 |
|
$ |
21.27 |
|
$ |
0.24 |
Holders
As of December 31, 2015, there were two stockholders of record of our Class A common stock, one of which was Cede & Co., a nominee for The Depository Trust Company. All of our Class A common stock held by brokerage firms, banks and other financial institutions as nominees for beneficial owners is considered to be held of record by Cede & Co., who is considered to be one stockholder of record. A substantially greater number of holders of our Class A common stock are “street name” or beneficial holders, whose shares of Class A common stock are held of record by banks, brokers and other financial institutions. Because such shares of Class A common stock are held on behalf of stockholders, and not by the stockholders directly, and because a stockholder can have multiple positions with different brokerage firms, banks and other financial institutions, we are unable to determine the total number of stockholders we have.
Dividend Policy
Our board of directors has adopted a policy of returning excess cash to our stockholders. Subject to the sole discretion of our board of directors and the considerations discussed below, we intend to pay dividends that will annually equal, in the aggregate, between 70% and 100% of our net income.
The Company paid cash dividends during the year ended 2015 as represented in the previous table. The Company intends to continue paying regular quarterly dividends to our Class A and Class B common stockholders and to holders of Restricted Stock Units, however, the payment of dividends will be subject to general economic and business conditions, including the Company’s financial condition and results of operations, capital requirements, contractual restrictions, including restrictions contained in our credit agreement, regulatory restrictions, business prospects and other factors that the Company’s board of directors considers relevant.
Prior to the Reorganization, the Company has regularly declared and paid cash distributions on its equity interests during the year ended December 31, 2014. The Company declared and paid the following cash distributions, by quarter, during the year ended December 31, 2014:
|
|
|
Aggregate |
|
|
|
|
|
Cash |
|
|
|
Year Ended December 31, 2014 (In millions) |
|
Distributions |
|
|
|
1rst Quarter |
|
$ |
45.0 |
|
|
2nd Quarter |
|
|
45.7 |
|
|
3rd Quarter |
|
|
35.0 |
|
|
4th Quarter |
|
|
15.0 |
|
|
Total distributions |
|
$ |
140.7 |
|
38
Stock Performance
The following performance graph and related information shall not be deemed "soliciting material" or to be "filed" with the Securities and Exchange Commission, nor shall such information be incorporated by reference into any future filing under the Securities Act of 1933, as amended, or the Exchange Act except to the extent we specifically incorporate it by reference into such filing. Our stock price performance shown in the graph below is not indicative of future stock price performance.
The stock performance graph below compares the performance of an investment in our Class A common stock, from April 16, 2015, the date of our initial public offering, through December 31, 2015, with the S&P 500 Index and the NYSE ARCA Securities Broker/Dealer Index. The graph assumes $100 was invested in our Class A common stock, the S&P 500 Index and the NYSE ARCA Securities Broker/Dealer Index. It assumes that dividends were reinvested on the date of payment without payment of any commissions or consideration of income taxes.
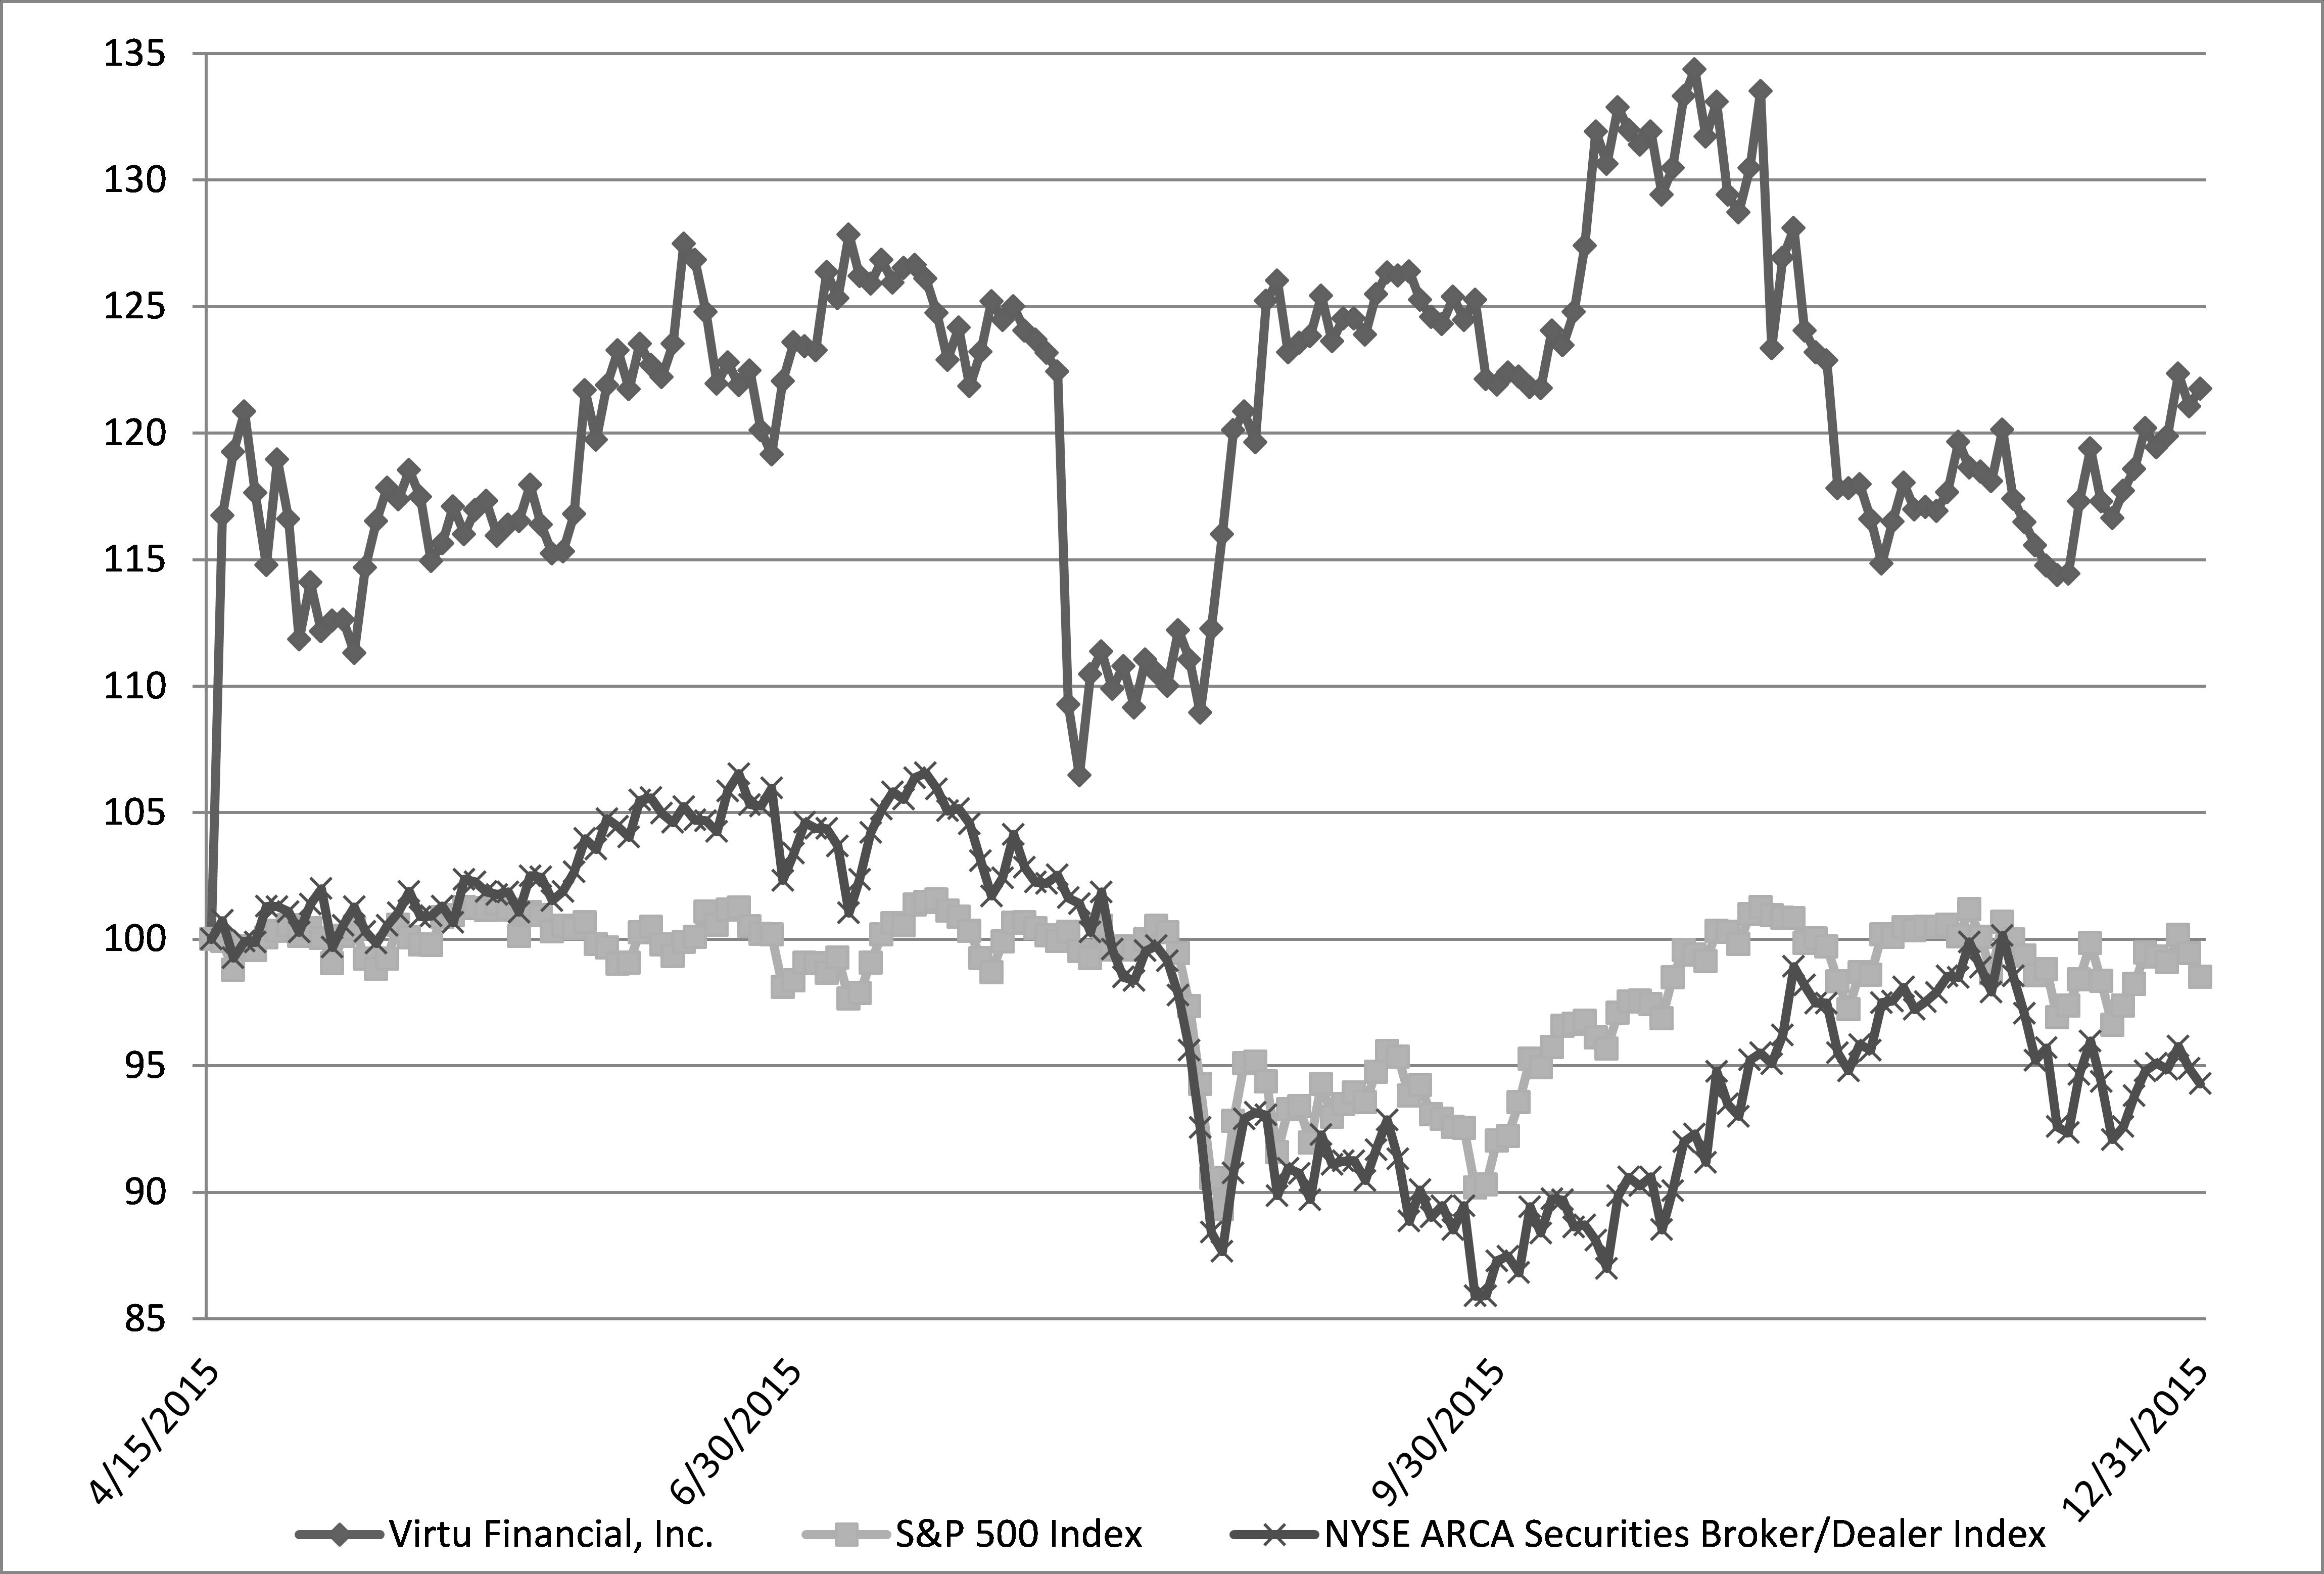
Use of proceeds from Initial Public Offering and Secondary Offering
On April 16, 2015, the Company commenced the initial public offering of 19,012,112 shares of Class A common stock. Upon consummation of the IPO, the total gross proceeds of the offering were approximately $361.2 million. Of the proceeds, approximately $25.2 million was used to pay underwriting discounts and commissions, approximately $277.2 million was used to purchase 3,470,724 shares of Class A common stock from the Silver Lake Post‑IPO Stockholder and 12,214,224 Virtu Financial Units and corresponding shares of Class C common stock from certain of the Virtu Post‑IPO Members, including 4,862,609 Virtu Financial Units and corresponding shares of Class C common stock from the Silver Lake Post‑IPO Members and 7,351,615 Virtu Financial Units and corresponding shares of Class C common stock from certain employees. The remaining $58.8 million of net proceeds was contributed by the Company to Virtu Financial, the operating company, which will be used for working capital and general corporate purposes. Other offering costs incurred were approximately $8.6 million and were paid by Virtu Financial.
On November 12, the Company commenced the Secondary Offering of 6,473,371 shares of Class A common stock which was completed by the Company and certain selling stockholders affiliated with Silver Lake Partners. The selling stockholders sold 6,075,837 shares of Class A common stock and the Company sold 397,534 shares of Class A common stock at a price to the public of $22.15 per share. The selling stockholders received all of the net proceeds from the sale of shares of Class A common stock by them in the offering. The Company used its net proceeds from the offering to purchase common units in Virtu Financial (and paired shares of Class C common stock) from one of its non-
39
executive employees at a net price equal to the price paid by the underwriters for shares of its Class A common stock. Following the Secondary Offering Silver Lake Partners no longer holds any equity interest in us.
Equity Compensation Plan Information
The following table provides information about shares of common stock available for future awards under all of the Company’s equity compensation plans as of December 31, 2015:
|
|
|
Plan Category |
|
Number of securities to be issued upon exercise of outstanding options, warrants and rights |
|
|
Weighted-average exercise price of outstanding options, warrants and rights |
|
Number of securities remaining available for future issuance under equity compensation plans |
|
Equity compensation plans approved by security holders |
|
2015 Management Incentive Plan |
|
9,978,466 |
|
$ |
19.33 |
|
1,614,490 |
|
Equity compensation plans not approved by security holders |
|
None |
|
— |
|
|
— |
|
— |
|
Total |
|
|
|
9,978,466 |
|
$ |
19.33 |
|
1,614,490 |
ITEM 6. SELECTED FINANCIAL DATA
SELECTED CONSOLIDATED FINANCIAL DATA
The following table sets forth selected historical consolidated financial data for the periods beginning on and after January 1, 2013. We were formed on October 16, 2013 and, prior to the consummation of the reorganization transactions and our initial public offering, did not conduct any activities other than those incident to our formation and our initial public offering. Our consolidated financial statements reflect, for all the periods prior to April 16, 2015 (the period prior to completion of the reorganization transactions), the operations of Virtu Financial and its consolidated subsidiaries, and for all periods on or after April 16, 2015, the operations of the Company and its consolidated subsidiaries (including Virtu Financial). The consolidated statements of comprehensive income data for the years ended December 31, 2015, 2014 and 2013 and consolidated statements of financial condition data as of December 31, 2015 and 2014 have been derived from our consolidated financial statements included elsewhere in this Form 10-K.
40
The following selected historical financial and other data should be read in conjunction with “Management’s Discussion and Analysis of Financial Condition and Results of Operations” and our respective consolidated financial statements and related notes thereto included elsewhere in this Form 10-K.
|
|
|
Years Ended Dec. 31, |
|
||||||||||
|
(In thousands, except share and per share data) |
|
2015 |
|
2014 |
|
2013 |
|
2012 |
|
||||
|
Consolidated Statements of Comprehensive Income Data: |
|
|
|
|
|
|
|
|
|
|
|
|
|
|
Revenues: |
|
|
|
|
|
|
|
|
|
|
|
|
|
|
Trading income, net |
|
$ |
757,455 |
|
$ |
685,150 |
|
$ |
623,733 |
|
$ |
581,476 |
|
|
Interest and dividends income |
|
|
28,136 |
|
|
27,923 |
|
|
31,090 |
|
|
34,152 |
|
|
Technology services |
|
|
10,622 |
|
|
9,980 |
|
|
9,682 |
|
|
— |
|
|
Total revenues |
|
|
796,213 |
|
|
723,053 |
|
|
664,505 |
|
|
615,628 |
|
|
|
|
|
|
|
|
|
|
|
|
|
|
|
|
|
Operating Expenses: |
|
|
|
|
|
|
|
|
|
|
|
|
|
|
Brokerage, exchange and clearance fees, net |
|
|
232,469 |
|
|
230,965 |
|
|
195,146 |
|
|
200,587 |
|
|
Communication and data processing |
|
|
68,647 |
|
|
68,847 |
|
|
64,689 |
|
|
55,384 |
|
|
Employee compensation and payroll taxes |
|
|
88,026 |
|
|
84,531 |
|
|
78,353 |
|
|
63,836 |
|
|
Interest and dividends expense |
|
|
52,423 |
|
|
47,083 |
|
|
45,196 |
|
|
48,735 |
|
|
Operations and administrative |
|
|
25,991 |
|
|
21,923 |
|
|
27,215 |
|
|
27,826 |
|
|
Depreciation and amortization |
|
|
33,629 |
|
|
30,441 |
|
|
23,922 |
|
|
17,975 |
|
|
Amortization of purchased intangibles and acquired capitalized software |
|
|
211 |
|
|
211 |
|
|
1,011 |
|
|
71,654 |
|
|
Acquisition cost |
|
|
— |
|
|
— |
|
|
— |
|
|
69 |
|
|
Acquisition related retention bonus |
|
|
— |
|
|
2,639 |
|
|
6,705 |
|
|
6,151 |
|
|
Impairment of intangible assets |
|
|
— |
|
|
— |
|
|
— |
|
|
1,489 |
|
|
Lease abandonment |
|
|
— |
|
|
— |
|
|
— |
|
|
6,134 |
|
|
Debt issue cost related to debt refinancing(1) |
|
|
— |
|
|
— |
|
|
10,022 |
|
|
— |
|
|
Initial public offering fees and expenses(2) |
|
|
— |
|
|
8,961 |
|
|
— |
|
|
— |
|
|
Transaction advisory fees and expenses(3) |
|
|
— |
|
|
3,000 |
|
|
— |
|
|
— |
|
|
Reserve for legal matter(4) |
|
|
5,440 |
|
|
— |
|
|
— |
|
|
— |
|
|
Charges related to share based compensation at IPO(5) |
|
|
44,194 |
|
|
— |
|
|
— |
|
|
— |
|
|
Financing interest expense on senior secured credit facility |
|
|
29,254 |
|
|
30,894 |
|
|
24,646 |
|
|
26,460 |
|
|
Total operating expenses |
|
|
580,284 |
|
|
529,495 |
|
|
476,905 |
|
|
526,300 |
|
|
Income before income taxes |
|
|
215,929 |
|
|
193,558 |
|
|
187,600 |
|
|
89,328 |
|
|
Provision for income taxes |
|
|
18,439 |
|
|
3,501 |
|
|
5,397 |
|
|
1,768 |
|
|
Net income |
|
$ |
197,490 |
|
$ |
190,057 |
|
$ |
182,203 |
|
$ |
87,560 |
|
|
Noncontrolling interest |
|
|
(176,603) |
|
|
|
|
|
|
|
|
|
|
|
Net income available for common stockholders |
|
$ |
20,887 |
|
|
|
|
|
|
|
|
|
|
|
|
|
|
|
|
|
|
|
|
|
|
|
|
|
|
Earnings per share |
|
|
|
|
|
|
|
|
|
|
|
|
|
|
Basic |
|
$ |
0.60 |
|
|
|
|
|
|
|
|
|
|
|
Diluted |
|
$ |
0.59 |
|
|
|
|
|
|
|
|
|
|
|
|
|
|
|
|
|
|
|
|
|
|
|
|
|
|
Weighted average common shares outstanding |
|
|
|
|
|
|
|
|
|
|
|
|
|
|
Basic |
|
|
34,964,312 |
|
|
|
|
|
|
|
|
|
|
|
Diluted |
|
|
35,339,585 |
|
|
|
|
|
|
|
|
|
|
|
|
|
|
|
|
|
|
|
|
|
|
|
|
|
|
Net income |
|
$ |
197,490 |
|
$ |
190,057 |
|
$ |
182,203 |
|
$ |
87,560 |
|
|
Other comprehensive income (loss) |
|
|
|
|
|
|
|
|
|
|
|
|
|
|
Foreign exchange translation adjustment |
|
|
(4,255) |
|
|
(5,032) |
|
|
1,382 |
|
|
548 |
|
|
Comprehensive income |
|
|
193,235 |
|
$ |
185,025 |
|
$ |
183,585 |
|
$ |
88,108 |
|
|
Less: Comprehensive income attributable to noncontrolling interest |
|
|
(172,249) |
|
|
|
|
|
|
|
|
|
|
|
Comprehensive income attributable to common stockholders |
|
$ |
20,986 |
|
|
|
|
|
|
|
|
|
|
41
|
|
|
As of December 31, |
|
||||||||||
|
|
|
2015 |
|
2014 |
|
2013 |
|
2012 |
|
||||
|
Consolidated Statements of Financial Condition Data: |
|
|
|
|
|
|
|
|
|
|
|
|
|
|
Cash and cash equivalents |
|
$ |
163,235 |
|
$ |
75,864 |
|
$ |
66,010 |
|
$ |
39,978 |
|
|
Total assets |
|
|
3,391,930 |
|
|
3,319,458 |
|
|
3,963,570 |
|
|
3,208,947 |
|
|
Senior secured credit facility |
|
|
493,589 |
|
|
495,724 |
|
|
500,827 |
|
|
256,309 |
|
|
Total liabilities |
|
|
2,834,060 |
|
|
2,812,760 |
|
|
3,510,282 |
|
|
2,518,712 |
|
|
Class A-1 redeemable interest(6) |
|
|
— |
|
|
294,433 |
|
|
250,000 |
|
|
250,000 |
|
|
Total stockholders' / members' equity |
|
|
130,708 |
|
|
212,265 |
|
|
203,288 |
|
|
440,235 |
|
|
Noncontrolling interest |
|
|
427,162 |
|
|
— |
|
|
— |
|
|
— |
|
|
Total equity |
|
|
557,870 |
|
|
506,698 |
|
|
453,288 |
|
|
690,235 |
|
|
(1) |
In connection with the Madison Tyler Transactions, Virtu Financial entered into a $320.0 million senior secured credit facility, which was subsequently refinanced. A portion of certain financing costs incurred in connection with the original credit facility that were scheduled to be amortized over the five‑year term of the loan, including original issue discount and underwriting and legal fees, were accelerated and recognized at the closing of the refinancing. |
|
(2) |
Initial public offering fees and expenses reflect costs directly attributable to the Company’s initial public offering process, which was postponed in April 2014. The Company accounted for such costs in accordance with ASC 340‑10, Other Assets and Deferred Costs. ASC 340 states that costs directly attributable to a successfully completed offering of equity securities may be deferred and charged against the gross proceeds of the offering as a reduction of additional paid‑in capital, but for an offering postponed for a period greater than 90 days, the offering costs must be charged as an expense in the period the offering process was postponed. |
|
(3) |
Transaction advisory fees reflect professional fees incurred by the Company in connection with the Temasek Transaction, which was consummated on December 31, 2014. |
|
(4) |
In December 2015, the enforcement committee of the Autorité des marchés financiers (“AMF”) fined the Company’s European subsidiary in the amount of €5.0 million (approximately $5.4 million) based on its allegations that the subsidiary of MTH engaged in price manipulation and violations of the AMF General Regulation and Euronext Market Rules. In accordance with the foregoing, the Company accrued an estimated loss in relation to the fine imposed by the AMF. |
|
(5) |
Represents non‑cash compensation expenses in respect of the outstanding time vested Class B interests of Virtu Financial and East MIP Class B interests recognized at the consummation of our initial public offering and through the period ended December 31, 2015, net of $9.2 million and $8.5 million in capitalization and amortization, respectively, of the costs attributable to employees incurred in development of software for internal use. |
|
(6) |
The Class A‑1 interests of Virtu Financial were convertible by the holders at any time into an equivalent number of Class A‑2 capital interests of Virtu Financial and, in a sale or other specified capital transaction, holders were entitled to receive distributions up to specified preference amounts before holders of Class A‑2 capital interests of Virtu Financial were entitled to receive distributions. In connection with the reorganization transactions, all of the existing equity interests in Virtu Financial were reclassified into Virtu Financial Units. See Note 13, “Capital Structure” within our consolidated financial statements. |
42
ITEM 7. MANAGEMENT’S DISCUSSION AND ANALYSIS OF FINANCIAL CONDITION AND RESULTS OF OPERATIONS
The following management's discussion and analysis of our financial condition and results of operations covers the years ended December 31, 2015, 2014 and 2013 and should be read in conjunction with the audited consolidated financial statements for the years ended December 31, 2015, 2014 and 2013. This discussion contains forward-looking statements that involve risks and uncertainties. Our actual results could differ materially from those discussed below. Unless otherwise stated, all amounts are presented in thousands of dollars.
Overview
We are a leading technology-enabled market maker and liquidity provider to the global financial markets. We stand ready, at any time, to buy or sell a broad range of securities, and we generate revenue by buying and selling large volumes of securities and other financial instruments and earning small bid/ask spreads. We make markets by providing quotations to buyers and sellers in more than 12,000 securities and other financial instruments on more than 230 unique exchanges, markets and liquidity pools in 35 countries around the world. We believe that our broad diversification, in combination with our proprietary technology platform and low-cost structure, enables us to facilitate risk transfer between global capital markets participants by supplying liquidity and competitive pricing while at the same time earning attractive margins and returns.
We believe that market makers like us serve an important role in maintaining and improving the overall health and efficiency of the global capital markets by continuously posting bids and offers for financial instruments and thereby providing to market participants an efficient means to transfer risk. All market participants benefit from the increased liquidity, lower overall trading costs and execution certainty that we provide.
We refer to our market making activities as being ‘‘market neutral,’’ which means that we are not dependent on the direction of a particular market and do not speculate. Our market making activities are designed to minimize capital at risk at any given time by limiting the notional size of our positions. Our strategies are also designed to lock in returns through precise hedging, as we seek to eliminate the price risk in any positions held.
Our revenue generation is driven primarily by transaction volume across a broad range of securities, asset classes and geographies. We avoid the risk of long or short positions in favor of earning small bid/ask spreads on large trading volumes across thousands of securities and financial instruments. We also generate revenue from interest and dividends on securities that we hold from time to time in connection with our market making activities and, beginning in 2013, from the sale of licensed technology and related services. Our revenues are also impacted by levels of volatility in a given period. Increases in market volatility can cause bid/ask spreads to widen as market participants are willing to incur greater costs to transact, which we benefit from.
Virtu Financial was formed as a Delaware limited liability company on April 8, 2011 in connection with our acquisition (the “Madison Tyler Transactions”) of Madison Tyler Holdings, when the members of Virtu Financial’s predecessor entity, Virtu East, which was formed and commenced operations on March 19, 2008, exchanged their interests in Virtu East for interests in Virtu Financial. On July 8, 2011, we completed our acquisition of Madison Tyler Holdings, which was co-founded by Mr. Vincent Viola, our Founder and Executive Chairman. Madison Tyler Holdings was an electronic trading firm and market maker on numerous exchanges and electronic marketplaces in equities, fixed income, currencies and commodities, and the Madison Tyler Transactions expanded our geographic and product market as well as our market penetration in existing markets. Virtu Financial is a holding company that conducts its business through its operating subsidiaries.
43
We believe the overall level of volumes in the various markets we serve has the greatest impact on our business. We believe that the most relevant asset class distinctions and venues for the markets we serve include the following:
|
Asset |
|
|
|
Classes |
|
Selected Venues in Which We Make Markets |
|
Americas Equities |
|
Aequitas Neo, BATS, BM&F Bovespa, CME, ICE, IEX, NASDAQ, NYSE, NYSE Arca, NYSE MKT, TMX, major private liquidity pools |
|
EMEA Equities |
|
Amsterdam, Aquis, BATS Europe, Bolsa de Madrid, Borsa Italiana, Brussels, EUREX, Euronext -Paris, ICE Futures Europe, Johannesburg Stock Exchange, Lisbon, London Stock Exchange, SIX Swiss Exchange, Turquoise Exchange, XETRA |
|
APAC Equities |
|
OSE, SBI Japannext, SGX, TOCOM, TSE |
|
Global Commodities |
|
CME, EBS, ICE, ICE Futures Europe, NASDAQ Energy Exchange, SGX, TOCOM |
|
Global Currencies |
|
CME, Currenex, EBS, HotSpot, ICE, LMAX, Reuters/FXall |
|
Options, Fixed Income and Other Securities |
|
BOX, BrokerTec, CBOE, eSpeed, NYSE Arca Options, PHLX |
Basis of Preparation
We were formed as a Delaware corporation on October 16, 2013 and, prior to the reorganization transactions and our initial public offering, did not conduct any activities other than those incident to our formation and our initial public offering. The consolidated statement of comprehensive income data for the period from April 16, 2015 through December 31, 2015 and statement of financial condition data as of December 31, 2015 have been derived from our consolidated financial statements included elsewhere in this document. Our consolidated financial statements reflect, for periods prior to April 16, 2015 (the period prior to completion of the reorganization transactions), the operations of Virtu Financial and its consolidated subsidiaries and for all periods on or after April 16, 2015, the operations of the Company and its consolidated subsidiaries (including Virtu Financial). The consolidated statements of comprehensive income data for the years ended December 31, 2014 and 2013 and statement of financial condition data as of December 31, 2014 has been derived from Virtu Financial's audited financial statements. As a result, our historical financial statements may not reflect our future operating results because they do not reflect the reorganization transactions on our initial public offering for all periods.
Distributions in Connection with the IPO
On June 12, 2015, September 14, 2015 and November 20, 2015, Virtu Financial made cash distributions totaling $15.0 million to certain of the holders of its outstanding equity interests prior to the consummation of the Reorganization Transactions (such holders, the Virtu Financial, “Pre-IPO Members”). Additionally, Virtu Financial intends to make further cash distributions of up to $35.0 million to the Virtu Financial Pre-IPO Members. The Company expects that these further distributions will be funded from cash on hand and excess cash held as clearing deposits with broker dealers and clearing organizations. See “Corporate History” for details on our reorganization transactions and IPO.
2015 Management Incentive Plan
The Company’s Board of Directors and stockholders adopted the 2015 Management Incentive Plan, which became effective upon consummation of the IPO. The 2015 Management Incentive Plan provides for the grant of stock options, restricted stock units, and other awards based on an aggregate of 12,000,000 shares of Class A common stock, subject to additional sublimits, including limits on the total option grant to any one participant in a single year and the total performance award to any one participant in a single year.
44
In connection with the IPO, non-qualified stock options to purchase 9,228,000 shares were granted at the IPO per share price, each of which vests in equal annual installments over a period of four years from grant date and expires not later than 10 years from the date of grant. Subsequent to the IPO and during the period ended December 31, 2015, options to purchase 234,000 shares in the aggregate were forfeited. The fair value of the stock option grants were determined through the application of the Black-Scholes-Merton model and will be recognized on a straight line basis over the vesting period. In connection with and subsequent to the IPO, 407,044 shares of immediately vested Class A common stock and 984,466 restricted stock units were granted, which vest over a period of up to 4 years and are settled in shares of Class A common stock. The fair value of the Class A common stock and restricted stock units was determined based on the volume weighted average price for the three days preceding the grant, and with respect to the restricted stock units, a projected annual forfeiture rate, and will be recognized on a straight line basis over the vesting period.
45
Components of Our Results of Operations
The table below sets forth certain components of our consolidated statements of comprehensive income as well as factors that impact such components. We present our results under one reportable segment, which is consistent with our structure and how we manage our business.
|
|
|
Years Ended December 31, |
|
|||||||
|
(in thousands, except share and per share data) |
|
2015 |
|
2014 |
|
2013 |
|
|||
|
Revenues: |
|
|
|
|
|
|
|
|
|
|
|
Trading income, net |
|
$ |
757,455 |
|
$ |
685,150 |
|
$ |
623,733 |
|
|
Interest and dividends income |
|
|
28,136 |
|
|
27,923 |
|
|
31,090 |
|
|
Technology services |
|
|
10,622 |
|
|
9,980 |
|
|
9,682 |
|
|
Total revenue |
|
|
796,213 |
|
|
723,053 |
|
|
664,505 |
|
|
|
|
|
|
|
|
|
|
|
|
|
|
Operating Expenses: |
|
|
|
|
|
|
|
|
|
|
|
Brokerage, exchange and clearance fees, net |
|
|
232,469 |
|
|
230,965 |
|
|
195,146 |
|
|
Communication and data processing |
|
|
68,647 |
|
|
68,847 |
|
|
64,689 |
|
|
Employee compensation and payroll taxes |
|
|
88,026 |
|
|
84,531 |
|
|
78,353 |
|
|
Interest and dividends expense |
|
|
52,423 |
|
|
47,083 |
|
|
45,196 |
|
|
Operations and administrative |
|
|
25,991 |
|
|
21,923 |
|
|
27,215 |
|
|
Depreciation and amortization |
|
|
33,629 |
|
|
30,441 |
|
|
23,922 |
|
|
Amortization of purchased intangibles and acquired capitalized software |
|
|
211 |
|
|
211 |
|
|
1,011 |
|
|
Acquisition related retention bonus |
|
|
— |
|
|
2,639 |
|
|
6,705 |
|
|
Debt issue cost related to debt refinancing |
|
|
— |
|
|
— |
|
|
10,022 |
|
|
Initial public offering fees and expenses |
|
|
— |
|
|
8,961 |
|
|
— |
|
|
Transaction advisory fees and expenses |
|
|
— |
|
|
3,000 |
|
|
— |
|
|
Reserve for legal matter |
|
|
5,440 |
|
|
— |
|
|
— |
|
|
Charges related to share based compensation at IPO |
|
|
44,194 |
|
|
— |
|
|
— |
|
|
Financing interest expense on senior secured credit facility |
|
|
29,254 |
|
|
30,894 |
|
|
24,646 |
|
|
Total operating expenses |
|
|
580,284 |
|
|
529,495 |
|
|
476,905 |
|
|
Income before income taxes and noncontrolling interest |
|
|
215,929 |
|
|
193,558 |
|
|
187,600 |
|
|
Provision for income taxes |
|
|
18,439 |
|
|
3,501 |
|
|
5,397 |
|
|
Net income |
|
$ |
197,490 |
|
$ |
190,057 |
|
$ |
182,203 |
|
|
Noncontrolling interest |
|
|
(176,603) |
|
|
|
|
|
|
|
|
Net income available for common stockholders |
|
$ |
20,887 |
|
|
|
|
|
|
|
|
|
|
|
|
|
|
|
|
|
|
|
|
Earnings per share |
|
|
|
|
|
|
|
|
|
|
|
Basic |
|
|
0.60 |
|
|
|
|
|
|
|
|
Diluted |
|
|
0.59 |
|
|
|
|
|
|
|
|
|
|
|
|
|
|
|
|
|
|
|
|
Weighted average common shares outstanding |
|
|
|
|
|
|
|
|
|
|
|
Basic |
|
|
34,964,312 |
|
|
|
|
|
|
|
|
Diluted |
|
|
35,339,585 |
|
|
|
|
|
|
|
|
|
|
|
|
|
|
|
|
|
|
|
|
Net income |
|
$ |
197,490 |
|
$ |
190,057 |
|
$ |
182,203 |
|
|
Other comprehensive income (loss) |
|
|
|
|
|
|
|
|
|
|
|
Foreign exchange translation adjustment, net of taxes |
|
|
(4,255) |
|
|
(5,032) |
|
|
1,382 |
|
|
Comprehensive income |
|
|
193,235 |
|
$ |
185,025 |
|
$ |
183,585 |
|
|
Less: Comprehensive income attributable to noncontrolling interest |
|
|
(172,249) |
|
|
|
|
|
|
|
|
Comprehensive income attributable to common stockholders |
|
$ |
20,986 |
|
|
|
|
|
|
|
Total Revenues
The majority of our revenues are generated through market making activities and are recorded as trading income. In addition, we generate revenues from interest and dividends income as well as the sale of licensed technology and related services.
Trading Income, Net. Trading income, net, represents revenue earned from bid/ask spreads. Trading income is generated in the normal course of our market making activities and is typically proportional to the level of trading activity, or volumes, in the asset classes we serve. Our trading income is highly diversified by asset class and geography and is comprised of small amounts earned on millions of trades on various exchanges, primarily in Americas, EMEA and
46
APAC equities, global currencies, global commodities, including energy and metals, and options, fixed income and other securities. Trading income, net, includes trading income earned from bid/ask spreads. Our trading income, net, results from gains and losses associated with economically neutral trading strategies, which are designed to capture small bid ask spreads and often involve making markets in a derivative versus a correlated instrument that is not a derivative. These transactions often result in a gain or loss on the derivative and a corresponding loss or gain on the non-derivative. Trading income, net, accounted for 95%, 95% and 94% of our total revenues for the years ended December 31, 2015, 2014, and 2013, respectively.
Interest and Dividends Income. Our market making activities require us to hold an inventory of securities on a regular basis, and we generate revenues in the form of interest and dividends income from these securities. Interest is earned on securities borrowed from other market participants pursuant to collateralized financing arrangements and on cash held by brokers. Dividends income arises from holding market making positions over dates on which dividends are paid to shareholders of record.
Technology Services. We began providing technology services to a third party in 2013 pursuant to a three-year arrangement. Technology services revenues represent fees charged for the licensing of our proprietary technology and the provision of related services, including hosting, management and support. These fees include an up-front component and a recurring fee for the relevant term. Revenue is recognized ratably for these services over the contractual term of the agreement.
Operating Expenses
Brokerage, Exchange and Clearance Fees, Net. Brokerage, exchange and clearance fees are our most significant expense and include the direct expenses of executing and clearing transactions we consummate in the course of our market making activities. Brokerage, exchange and clearance fees include fees paid to various prime brokers, exchanges and clearing firms for services such as execution of transactions, prime brokerage fees, access fees and clearing expenses. These expenses generally increase and decrease in direct correlation with our volumes and the level of trading activity in the markets we serve. Execution fees are paid primarily to exchanges and venues where we trade. Clearance fees are paid to clearing houses and clearing agents. Rebates based on volume discounts, credits or payments received from exchanges or other market places are netted against brokerage, exchange and clearance fees.
Communication and Data Processing. Communication and data processing represent primarily fixed expenses for leased equipment, equipment co-location, network lines and connectivity for our trading centers and co-location facilities. More specifically, communications expense consists primarily of the cost of voice and data telecommunication lines supporting our business, including connectivity to data centers and exchanges, markets and liquidity pools around the world, and data processing expense consists primarily of market data fees that we pay to third parties to receive price quotes and related information.
Employee Compensation and Payroll Taxes. Employee compensation and payroll taxes include employee salaries, cash and non-cash incentive compensation, employee benefits, payroll taxes, severance and other employee related costs. Non-cash compensation includes, prior to the Reorganization Transactions, the share based-incentive compensation paid to employees in the form of Class A-2 profits interests in Virtu Employee Holdco, which held corresponding Class A-2 profits interests in Virtu Financial. Additionally, after the Reorganization, it includes non-cash compensation expenses with respect to the stock options and restricted stock units granted in connection with and subsequent to the IPO pursuant to the 2015 Management Incentive Plan. We have capitalized and excluded from this calculation employee compensation and benefits related to software development of $10.1 million, $9.8 million, and $10.1 million for the years ended December 31, 2015, 2014, and 2013, respectively.
Interest and Dividends Expense. We incur interest expense from loaning certain equity securities in the general course of our market making activities pursuant to collateralized lending transactions. Typically, dividend expense is incurred when a dividend is paid on securities sold short.
Operations and Administrative. Operations and administrative expense represents occupancy, recruiting, travel and related expense, professional fees and other expenses.
47
Depreciation and Amortization. Depreciation and amortization expense results from the depreciation of fixed assets, such as computing and communications hardware, as well as amortization of leasehold improvements and capitalized in-house software development. We depreciate our computer hardware and related software, office hardware and furniture and fixtures on a straight line basis over a period of 3 to 7 years based on the estimated useful life of the underlying asset, and we amortize our capitalized software development costs on a straight line basis over a period of 1.4 to 2.5 years, which represents the estimated useful lives of the underlying software. We amortize leasehold improvements on a straight line basis over the lesser of the life of the improvement or the term of the lease.
Amortization of Purchased Intangibles and Acquired Capitalized Software. Amortization of purchased intangibles and acquired capitalized software consist primarily of the amortization of $110 million of assets purchased in the Madison Tyler Transactions and the amortization of $1.9 million of assets acquired in the Nyenburgh Holding B.V. Transaction. These assets are amortized over their useful lives, ranging from 1.4 to 9 years.
Acquisition Related Retention Bonus. In connection with the Madison Tyler Transactions, we established a $21.5 million retention bonus plan for Madison Tyler Holdings employees, to be paid out in five installments through July 8, 2014. This expense was amortized on a straight line basis and, in the absence of changes in the amounts capitalized as related to software development or accelerated recognition of certain terminated employees, the expense is consistent over equivalent periods.
Debt Issue Costs Related to Debt Refinancing. The financing of our senior secured credit facility or any other indebtedness has and, may in the future result in the acceleration of debt issue costs incurred at issuance and originally scheduled to be amortized over the life of the loan.
Initial Public Offering Fees and Expenses. IPO fees and expenses reflect costs directly attributable to the Company’s IPO process, which was postponed in April 2014. The Company accounted for such costs in accordance with ASC 340-10, Other Assets and Deferred Costs. ASC 340 states that costs directly attributable to a successfully completed offering of equity securities may be deferred and charged against the gross proceeds of the offering as a reduction of additional paid-in capital, but for an offering postponed for a period greater than 90 days, the offering costs must be charged as an expense in the period the offering process was postponed.
Transaction Advisory Fees and Expenses. Transaction advisory fees and expenses reflect professional fees incurred by the Company in connection with the Temasek Transaction, which was consummated on December 31, 2014.
Reserve for Legal Matter. In December 2015, the enforcement committee of the Autorité des marchés financiers (“AMF”) fined our European subsidiary in the amount of €5.0 million (approximately $5.4 million) based on its allegations that the subsidiary of MTH engaged in price manipulation and violations of the AMF General Regulation and Euronext Market Rules. In accordance with the foregoing, we have accrued an estimated loss in relation to the fine imposed by the AMF.
Charges Related to Share Based Compensation at IPO. At the consummation of the IPO and through the period ended December 31, 2015, the Company recognized one-time, non-cash compensation expenses of the approximately $44.2 million in respect of the outstanding time vested Class B and East MIP Class B interests, net of $9.2 million and $8.5 million in capitalization and amortization, respectively, of the costs attributable to employees incurred in development of software for internal use, as discussed in Note 13 to the notes of the consolidated financial statements.
Financing Interest Expense on Senior Secured Credit Facility. Financing interest expense reflects interest accrued on outstanding indebtedness, under our senior secured credit facility.
Provision for Income Taxes
Prior to the consummation of the Reorganization Transactions and the IPO, our business was historically operated through a limited liability company that is treated as a partnership for U.S. federal income tax purposes, and as such most of our income is not subject to U.S. federal and certain state income taxes. Our income tax expense for historical periods reflects taxes payable by certain of our non-U.S. subsidiaries. Subsequent to consummation of the
48
Reorganization Transactions and the IPO, the Company is subject to U.S. federal, state and local income tax at the rate applicable to corporations less the rate attributable to the noncontrolling interest in Virtu Financial.
Non-GAAP Financial Measures and Other Items
To supplement our consolidated financial statements presented in accordance with generally accepted accounting principles (“GAAP”), we use the following non-GAAP measures of financial performance:
|
· |
“Adjusted Net Trading Income”, which is the amount of revenue we generate from our market making activities, or trading income, net, plus interest and dividends income and expense, net, less direct costs associated with those revenues, including brokerage, exchange and clearance fees, net. Management believes that this measurement is useful for comparing general operating performance from period to period. Although we use Adjusted Net Trading Income as a financial measure to assess the performance of our business, the use of Adjusted Net Trading Income is limited because it does not include certain material costs that are necessary to operate our business. Our presentation of Adjusted Net Trading Income should not be construed as an indication that our future results will be unaffected by revenues or expenses that are not directly associated with our market making activities. |
|
· |
“Adjusted Net Income”, which measures our operating performance by adjusting net income to exclude amortization of purchased intangibles and acquired capitalized software, severance, reserve for legal matter, transaction advisory fees and expenses, termination of office leases, equipment write-off, acquisition related retention bonus, share based compensation, charges related to share based compensation at IPO, 2015 Management Incentive Plan, and charges related to share based compensation awards at IPO. |
|
· |
“EBITDA”, which measures our operating performance by adjusting net income to exclude financing interest expense on senior secured credit facility, depreciation and amortization, amortization of purchased intangibles and acquired capitalized software, equipment write-off and income tax expense, and “Adjusted EBITDA”, which measures our operating performance by further adjusting EBITDA to exclude severance, reserve for legal matter, transaction advisory fees and expenses, termination of office leases, acquisition related retention bonus, share based compensation, charges related to share based compensation at IPO, 2015 Management Incentive Plan, and charges related to share based compensation at IPO. |
Adjusted Net Trading Income, Adjusted Net Income, EBITDA and Adjusted EBITDA are non-GAAP financial measures used by management in evaluating operating performance and in making strategic decisions. In addition, these non-GAAP financial measures or similar non-GAAP measures are used by research analysts, investment bankers and lenders to assess our operating performance. Management believes that the presentation of Adjusted Net Trading Income, Adjusted Net Income, EBITDA and Adjusted EBITDA provide useful information to investors regarding our results of operations because it assists both investors and management in analyzing and benchmarking the performance and value of our business. Adjusted Net Trading Income, Adjusted Net Income, EBITDA and Adjusted EBITDA provide indicators of general economic performance that are not affected by fluctuations in certain costs or other items. Accordingly, management believes that these measurements are useful for comparing general operating performance from period to period. Furthermore, our credit agreement contains covenants and other tests based on metrics similar to Adjusted EBITDA. Other companies may define Adjusted Net Trading Income, Adjusted Net Income and Adjusted EBITDA differently, and as a result our measures of Adjusted Net Trading Income, Adjusted Net Income and Adjusted EBITDA may not be directly comparable to those of other companies. Although we use these non-GAAP financial measures as financial measures to assess the performance of our business, such use is limited because they do not include certain material costs necessary to operate our business.
Adjusted Net Trading Income, Adjusted Net Income, EBITDA and Adjusted EBITDA should be considered in addition to, and not as a substitute for, Net Income in accordance with U.S. GAAP as a measure of performance. Our presentation of Adjusted Net Trading Income, Adjusted Net Income, EBITDA and Adjusted EBITDA should not be construed as an indication that our future results will be unaffected by unusual or nonrecurring items. Adjusted Net Trading Income, Adjusted Net Income and our EBITDA-based measures have limitations as analytical tools, and you should not
49
consider them in isolation or as substitutes for analysis of our results as reported under U.S. GAAP. Some of these limitations are:
|
· |
they do not reflect every cash expenditure, future requirements for capital expenditures or contractual commitments; |
|
· |
our EBITDA-based measures do not reflect the significant interest expense or the cash requirements necessary to service interest or principal payment on our debt; |
|
· |
although depreciation and amortization are non-cash charges, the assets being depreciated and amortized will often have to be replaced or require improvements in the future, and our EBITDA-based measures do not reflect any cash requirement for such replacements or improvements; |
|
· |
they are not adjusted for all non-cash income or expense items that are reflected in our statements of cash flows; |
|
· |
they do not reflect the impact of earnings or charges resulting from matters we consider not to be indicative of our ongoing operations; and |
|
· |
they do not reflect limitations on our costs related to transferring earnings from our subsidiaries to us. |
Because of these limitations, Adjusted Net Trading Income, Adjusted Net Income, EBITDA and Adjusted EBITDA are not intended as alternatives to net income as indicators of our operating performance and should not be considered as measures of discretionary cash available to us to invest in the growth of our business or as measures of cash that will be available to us to meet our obligations. We compensate for these limitations by using Adjusted Net Trading Income, Adjusted Net Income, EBITDA and Adjusted EBITDA along with other comparative tools, together with U.S. GAAP measurements, to assist in the evaluation of operating performance. These U.S. GAAP measurements include operating income (loss), net income (loss), cash flows from operations and cash flow data. See below a reconciliation of each non-GAAP measure to the most directly comparable GAAP measure.
50
The following tables reconcile Consolidated Statements of Comprehensive Income to arrive at Adjusted Net Income, EBITDA, Adjusted EBITDA, Adjusted Net Trading Income, and selected Operating Margins.
|
|
|
For the Year Ended |
|
|||||||
|
|
|
December 31, |
|
|||||||
|
|
|
2015 |
|
2014 |
|
2013 |
|
|||
|
Reconciliation of Trading income, net to Adjusted Net Trading Income |
|
|
|
|
|
|
|
|
|
|
|
Trading income, net |
|
$ |
757,455 |
|
$ |
685,150 |
|
$ |
623,733 |
|
|
Interest and dividends income |
|
|
28,136 |
|
|
27,923 |
|
|
31,090 |
|
|
Brokerage, exchange and clearance fees, net |
|
|
(232,469) |
|
|
(230,965) |
|
|
(195,146) |
|
|
Interest and dividends expense |
|
|
(52,423) |
|
|
(47,083) |
|
|
(45,196) |
|
|
Adjusted Net Trading Income |
|
$ |
500,699 |
|
$ |
435,025 |
|
$ |
414,481 |
|
|
|
|
|
|
|
|
|
|
|
|
|
|
Reconciliation of Net Income to Adjusted Net Income |
|
|
|
|
|
|
|
|
|
|
|
Net Income |
|
$ |
197,490 |
|
$ |
190,057 |
|
$ |
182,203 |
|
|
Amortization of purchased intangibles and acquired capitalized software |
|
|
211 |
|
|
211 |
|
|
1,011 |
|
|
Debt issue cost related to debt refinancing |
|
|
— |
|
|
— |
|
|
10,022 |
|
|
Severance |
|
|
1,065 |
|
|
4,786 |
|
|
1,990 |
|
|
Reserve for legal matter |
|
|
5,440 |
|
|
— |
|
|
— |
|
|
IPO fees and expenses |
|
|
— |
|
|
8,961 |
|
|
— |
|
|
Transaction advisory fees and expenses |
|
|
— |
|
|
3,000 |
|
|
— |
|
|
Termination of office leases |
|
|
2,729 |
|
|
849 |
|
|
— |
|
|
Equipment write-off |
|
|
1,719 |
|
|
— |
|
|
— |
|
|
Acquisition related retention bonus |
|
|
— |
|
|
2,639 |
|
|
6,705 |
|
|
Share based compensation |
|
|
15,202 |
|
|
16,033 |
|
|
13,441 |
|
|
Charges related to share based compensation awards at IPO, 2015 Management Incentive Plan |
|
|
4,710 |
|
|
— |
|
|
— |
|
|
Charges related to share based compensation awards at IPO |
|
|
44,194 |
|
|
— |
|
|
— |
|
|
Adjusted Net Income |
|
$ |
272,760 |
|
$ |
226,536 |
|
$ |
215,372 |
|
|
|
|
|
|
|
|
|
|
|
|
|
|
Reconciliation of Net Income to EBITDA and Adjusted EBITDA |
|
|
|
|
|
|
|
|
|
|
|
Net Income |
|
$ |
197,490 |
|
$ |
190,057 |
|
$ |
182,203 |
|
|
Financing interest expense on senior secured credit facility |
|
|
29,254 |
|
|
30,894 |
|
|
24,646 |
|
|
Debt issue cost related to debt refinancing |
|
|
— |
|
|
— |
|
|
10,022 |
|
|
Depreciation and amortization |
|
|
33,629 |
|
|
30,441 |
|
|
23,922 |
|
|
Amortization of purchased intangibles and acquired capitalized software |
|
|
211 |
|
|
211 |
|
|
1,011 |
|
|
Provision for Income Taxes |
|
|
18,439 |
|
|
3,501 |
|
|
5,397 |
|
|
EBITDA |
|
$ |
279,023 |
|
$ |
255,104 |
|
$ |
247,201 |
|
|
|
|
|
|
|
|
|
|
|
|
|
|
Severance |
|
|
1,065 |
|
|
4,786 |
|
|
1,990 |
|
|
Reserve for legal matter |
|
|
5,440 |
|
|
— |
|
|
— |
|
|
IPO fees and expenses |
|
|
— |
|
|
8,961 |
|
|
— |
|
|
Transaction advisory fees and expenses |
|
|
— |
|
|
3,000 |
|
|
— |
|
|
Termination of office leases |
|
|
2,729 |
|
|
849 |
|
|
— |
|
|
Acquisition related retention bonus |
|
|
— |
|
|
2,639 |
|
|
6,705 |
|
|
Share based compensation |
|
|
15,202 |
|
|
16,033 |
|
|
13,441 |
|
|
Charges related to share based compensation at IPO, 2015 Management Incentive Plan |
|
|
4,710 |
|
|
— |
|
|
— |
|
|
Charges related to share based compensation awards at IPO |
|
|
44,194 |
|
|
— |
|
|
— |
|
|
Adjusted EBITDA |
|
$ |
352,363 |
|
$ |
291,372 |
|
$ |
269,337 |
|
|
|
|
|
|
|
|
|
|
|
|
|
|
Selected Operating Margins |
|
|
|
|
|
|
|
|
|
|
|
Net Income Margin(1) |
|
|
38.6 |
% |
|
42.7 |
% |
|
43.0 |
% |
|
Adjusted Net Income Margin(2) |
|
|
53.3 |
% |
|
50.9 |
% |
|
50.8 |
% |
|
EBITDA Margin(3) |
|
|
54.6 |
% |
|
57.3 |
% |
|
58.3 |
% |
|
Adjusted EBITDA Margin(4) |
|
|
68.9 |
% |
|
65.5 |
% |
|
63.5 |
% |
|
(1) |
Calculated by dividing net income by the sum of Adjusted Net Trading Income and technology services revenue. |
|
(2) |
Calculated by dividing Adjusted Net Income by the sum of Adjusted Net Trading Income and technology services revenue. |
|
(3) |
Calculated by dividing EBITDA by the sum of Adjusted Net Trading Income and technology services revenue. |
|
(4) |
Calculated by dividing Adjusted EBITDA by the sum of Adjusted Net Trading Income and technology services revenue. |
51
The following table shows our Adjusted Net Trading Income, average daily Adjusted Net Trading Income and percentage of Adjusted Net Trading Income by category for the years ended December 31, 2015, 2014, and 2013.
|
|
|
2015 |
|
2014 |
|
2013 |
|
|
||||||||||||||||||
|
|
|
|
|
|
Average |
|
|
|
|
|
|
Average |
|
|
|
|
|
|
Average |
|
|
|
|
|||
|
(In thousands, except percentages) |
|
Total |
|
Daily |
|
% |
|
Total |
|
Daily |
|
% |
|
Total |
|
Daily |
|
% |
|
|
||||||
|
Adjusted Net Trading Income: |
|
|
|
|
|
|
|
|
|
|
|
|
|
|
|
|
|
|
|
|
|
|
|
|
|
|
|
Categories |
|
|
|
|
|
|
|
|
|
|
|
|
|
|
|
|
|
|
|
|
|
|
|
|
|
|
|
Americas Equities |
|
$ |
135,662 |
|
$ |
538 |
|
27 |
% |
$ |
113,402 |
|
$ |
450 |
|
26 |
% |
$ |
111,098 |
|
$ |
441 |
|
27 |
% |
|
|
EMEA Equities |
|
|
58,568 |
|
|
232 |
|
12 |
% |
|
51,604 |
|
|
205 |
|
12 |
% |
|
44,435 |
|
|
176 |
|
11 |
% |
|
|
APAC Equities |
|
|
44,910 |
|
|
178 |
|
9 |
% |
|
29,965 |
|
|
119 |
|
7 |
% |
|
45,566 |
|
|
181 |
|
11 |
% |
|
|
Global Commodities |
|
|
112,616 |
|
|
447 |
|
23 |
% |
|
93,083 |
|
|
369 |
|
21 |
% |
|
94,934 |
|
|
377 |
|
23 |
% |
|
|
Global Currencies |
|
|
110,493 |
|
|
439 |
|
22 |
% |
|
109,693 |
|
|
435 |
|
25 |
% |
|
81,014 |
|
|
321 |
|
20 |
% |
|
|
Options, Fixed income and Other Securities |
|
|
32,020 |
|
|
127 |
|
6 |
% |
|
42,321 |
|
|
168 |
|
10 |
% |
|
38,499 |
|
|
153 |
|
9 |
% |
|
|
Unallocated (1) |
|
|
6,430 |
|
|
26 |
|
1 |
% |
|
(5,043) |
|
|
(20) |
|
(1) |
% |
|
(1,065) |
|
|
(4) |
|
(1) |
% |
|
|
Total Adjusted Net Trading Income |
|
$ |
500,699 |
|
$ |
1,987 |
|
100 |
% |
$ |
435,025 |
|
$ |
1,726 |
|
100 |
% |
$ |
414,481 |
|
$ |
1,645 |
|
100 |
% |
|
(1)Under our methodology for recording ‘‘trading income, net’’ in our consolidated statements of comprehensive income, we recognize revenues based on the exit price of assets and liabilities in accordance with applicable U.S. GAAP rules, and when we calculate Adjusted Net Trading Income for corresponding reporting periods, we start with trading income, net, so calculated. By contrast, when we calculate Adjusted Net Trading Income by category, we do so on a daily basis, and as a result prices used in recognizing revenues may differ. Because we provide liquidity on a global basis, across asset classes and time zones, the timing of any particular Adjusted Net Trading Income calculation can effectively defer or accelerate revenue from one day to another or one reporting period to another, as the case may be. We do not allocate any resulting differences based on the timing of revenue recognition.
Year Ended December 31, 2015 Compared to Year Ended December 31, 2014
Total Revenues
Our total revenues increased $73.1 million, or 10.1%, to $796.2 million for the year ended December 31, 2015, compared to $723.1 million for the year ended December 31, 2014. This increase was primarily attributable to an increase in trading income, net, of $72.3 million, and $0.6 million increase in revenues generated from our deployment and delivery of technology services.
Trading Income, Net. Trading income, net, increased $72.3 million, or 10.6%, to $757.5 million for the year ended December 31, 2015, compared to $685.2 million for the year ended December 31, 2014. The increase was primarily attributable to strong performance from Americas Equities, EMEA Equities, APAC Equities, Global Commodities and Global Currencies categories trading relative to the market benchmark volumes. Rather than analyzing trading income, net, in isolation, we generally evaluate it in the broader context of our Adjusted Net Trading Income, together with interest and dividends income, interest and dividends expense and brokerage, exchange and clearance fees, net, each of which are described below.
Interest and Dividends Income. Interest and dividends income increased $0.2 million, or 0.7%, to $28.1 million for the year ended December 31, 2015, compared to $27.9 million for the year ended December 31, 2014. This increase was primarily attributable to higher interest income earned on cash collateral posted as part of securities loaned transactions. As indicated above, rather than analyzing interest and dividends income in isolation, we generally evaluate it in the broader context of our Adjusted Net Trading Income.
Technology Services. Technology services revenues increased $0.6 million, or 6.0%, to $10.6 million for the year ended December 31, 2015, compared to $10.0 million for the year ended December 31, 2014. This increase was primarily due to a decrease in deductible third party costs.
Adjusted Net Trading Income
Adjusted Net Trading Income increased $65.7 million, or 15.1%, to $500.7 million for the year ended December 31, 2015, compared to $435.0 million for the year ended December 31, 2014. This increase compared to the
52
prior period reflects increases in Adjusted Net Trading Income from Americas equities trading of $22.3 million, $7.0 million from EMEA equities, $14.9 million from APAC equities, $19.5 million from global commodities and $0.8 million from global currencies. These increases in Adjusted Net Trading Income were partially offset by a decrease in Adjusted Net Trading Income from trading options, fixed income and other securities of $10.3 million compared to the prior period. Adjusted Net Trading Income per day increased $0.26 million, or 15.1%, to $1.99 million for the year ended December 31, 2015, compared to $1.73 million for the year ended December 31, 2014. The number of trading days for the years ended December 31, 2015 and 2014 were both 252.
Operating Expenses
Our operating expenses increased $50.8 million, or 9.6%, to $580.3 million for the year ended December 31, 2015, compared to $529.5 million for the year ended December 31, 2014. This increase was primarily due to increases in brokerage, exchange, and clearance fees of $1.5 million, employee compensation and payroll taxes of $3.5 million, interest and dividends expense of $5.3 million, operations and administrative expense of $4.1 million, depreciation and amortization expense of $3.2 million, reserve for legal matter of $5.4 million, and charges related to share based compensation at IPO of $44.2 million. These increases in operating expenses were partially offset by decreases in acquisition related retention bonus of $2.6 million, IPO fees and expenses of $9.0 million, transaction advisory fees and expense of $3.0 million, communication and data processing expense of $0.2 million, and $1.6 million decrease in financing interest expense on our senior secured facility. There was no change for the year ended December 31, 2015 compared to the year ended December 31, 2014 for amortization of purchased intangible and acquired capitalized software.
Brokerage, Exchange and Clearance Fees, Net. Brokerage exchange and clearance fees, net, increased $1.5 million, or 0.6%, to $232.5 million for the year ended December 31, 2015, compared to $231.0 million for the year ended December 31, 2014. This increase corresponds to the overall increase in Adjusted Net Trading Income and strong performance from Americas Equities, EMEA Equities, APAC Equities, Global Commodities and Global Currencies categories trading relative to the market benchmark volumes. As indicated above, rather than analyzing brokerage, exchange and clearance fees, net, in isolation, we generally evaluate it in the broader context of our Adjusted Net Trading Income.
Communication and Data Processing. Communication and data processing expense decreased $0.2 million, or 0.3%, to $68.6 million for the year ended December 31, 2015, compared to $68.8 million for the year ended December 31, 2014. This decrease was primarily attributable to expiration of contractual commitments for the use of legacy telecommunication technologies.
Employee Compensation and Payroll Taxes. Employee compensation and payroll taxes increased $3.5 million, or 4.1%, to $88.0 million for the year ended December 31, 2015, compared to $84.5 million for the year ended December 31, 2014. This increase in compensation levels was attributable to increased incentive compensation as a result of the increase in overall profitability of our business.
Interest and Dividends Expense. Interest and dividends expense increased $5.3 million, or 11.3%, to $52.4 million for the year ended December 31, 2015, compared to $47.1 million for the year ended December 31, 2014. This increase was primarily attributable to higher interest expense incurred on cash collateral received as part of securities lending transactions. As indicated above, rather than analyzing interest and dividends expense in isolation, we generally evaluate it in the broader context of our Adjusted Net Trading Income.
Operations and Administrative. Operations and administrative expense increased $4.1 million, or 18.7%, to $26.0 million for the year ended December 31, 2015, compared to $21.9 million for the year ended December 31, 2014. During the year ended December 31, 2015, we recognized an accelerated expense of approximately $2.7 million from future lease payments of one of our office locations assuming no sub-lessee could be identified during the remainder of the lease terms. During the year ended December 31, 2014, we recorded a deferred lease write-off of $0.4 million and one-time payment of $0.4 million for the termination of the lease of our London office. The remaining increase is primarily attributable to public company related expenses.
53
Depreciation and Amortization. Depreciation and amortization increased $3.2 million, or 10.5%, to $33.6 million for the year ended December 31, 2015, compared to $30.4 million for the year ended December 31, 2014. This increase was primarily attributable to recognition of approximately $1.7 million in accelerated depreciation from equipment that was deemed to be obsolete during the year ended December 31, 2015, as well as increased depreciation expense recognized as a result of capital expenditures on telecommunication, networking and other assets purchased during 2014.
Amortization of Purchased Intangibles and Acquired Capitalized Software. Amortization of purchased intangibles and acquired capitalized software did not change, from $0.2 million for the year ended December 31, 2015, compared to $0.2 million for the year ended December 31, 2014.
Acquisition Related Retention Bonus. Acquisition related retention bonus expense was $0 for the year ended December 31, 2015, compared to $2.6 million for the year ended December 31, 2014. The final installment payment under the retention plan was made on July 2014 and we no longer incurred such expenses after the final payment.
Initial Public Offering Fees and Expenses. IPO fees and expenses were $9.0 million for the year ended December 31, 2014. These costs reflect nonrecurring expenses incurred as a result of the postponement of our IPO in April 2014. We had no such expense for the year ended December 31, 2015.
Transaction Advisory Fees and Expenses. Transaction advisory fees and expenses of $3.0 million reflect professional fees incurred by the Company in connection with the Temasek Transaction, which was consummated on December 31, 2014. We had no such expense for year ended December 31, 2015.
Reserve for Legal Matter. In December 2015, the enforcement committee of the Autorité des marchés financiers (“AMF”) fined our European subsidiary in the amount of €5.0 million (approximately $5.4 million) based on its allegations that the subsidiary of MTH engaged in price manipulation and violations of the AMF General Regulation and Euronext Market Rules. In accordance with the foregoing, we have accrued an estimated loss of €5.0 million (approximately $5.4 million) in relation to the fine imposed by the AMF. We had no such expense for the year ended December 31, 2014.
Charges related to share based compensation at IPO. At the consummation of the IPO and through the period ended December 31, 2015, the Company recognized non-cash compensation expenses with additional monthly vesting charges of the approximately $44.2 million in respect the outstanding time vested Class B and East MIP Class B interests, net of $9.2 million and $8.5 million in capitalization and amortization, respectively, of the costs attributable to employees incurred in development of software for internal use, as discussed in Note 13 to the notes of the consolidated financial statements. We had no such expense for the year ended December 31, 2014.
Financing Interest Expense on Senior Secured Credit Facility. Financing interest expense on one senior secured credit facility decreased $1.6 million, or 5.2%, to $29.3 million, compared to $30.9 million for the year ended December 31, 2014. This decrease was due to the 0.50% incremental spread reduction after the amendment of our existing senior secured credit facility upon the consummation of the IPO on April 21, 2015, as discussed in Note 8 to the notes of the consolidated financial statements.
Provision for Income Taxes
Historically, as a limited liability company treated as a partnership for U.S. federal income tax purposes, most of our income has not been subject to corporate tax, but instead our members have been taxed on their proportionate share of our net income.
However, following the consummation of the Reorganization Transactions, we expect to incur corporate tax at the U.S. federal income tax rate on our taxable income, as adjusted for noncontrolling interest in Virtu Financial. Our income tax expense reflects such U.S. federal income tax as well as taxes payable by certain of our non-U.S. subsidiaries. Provision for income taxes increased $14.9 million, to $18.4 million for the year ended December 31, 2015, compared to $3.5 million for the year ended December 31, 2014. The increase was primarily attributable to the
54
consummation of Reorganization Transactions. The increase was also attributable by the increases in taxable incomes in foreign jurisdictions where we are subject to corporate level taxation, including increased profitability in our EMEA and APAC operations due to higher observed market volumes and improved performance.
Year Ended December 31, 2014 Compared to Year Ended December 31, 2013
Total Revenues
Our total revenues increased $58.6 million, or 8.8%, to $723.1 million for the year ended December 31, 2014, compared to $664.5 million for the year ended December 31, 2013. This increase was primarily attributable to an increase in trading income, net, of $61.5 million, a decrease in interest and dividends income of $3.2 million and $0.3 million increase in revenues generated from our initial deployment and delivery of technology services in February 2013.
Trading Income, Net. Trading income, net, increased $61.5 million, or 9.9%, to $685.2 million for the year ended December 31, 2014, compared to $623.7 million for the year ended December 31, 2013. This increase was primarily attributable to the diversification of our revenues despite overall decreased average daily volumes and volatility across certain asset classes, in particular APAC equities, global commodities, and global currencies. Rather than analyzing trading income, net, in isolation, we generally evaluate it in the broader context of our Adjusted Net Trading Income, together with interest and dividends income, interest and dividends expense and brokerage, exchange and clearance fees, net, each of which are described below.
Interest and Dividends Income. Interest and dividends income decreased $3.2 million, or 10.3%, to $27.9 million for the year ended December 31, 2014, compared to $31.1 million for the year ended December 31, 2013. This decrease was primarily attributable to lower interest income earned on cash collateral posted as part of securities borrowed transactions.
Technology Services. Technology services revenues increased $0.3 million, or 3.1%, to $10.0 million for the year ended December 31, 2014, compared to $9.7 million for the year ended December 31, 2013. We commenced providing technology services and recognized revenues starting in February 2013, compared to the full year of revenues for the year ended December 31, 2014.
Adjusted Net Trading Income
Adjusted Net Trading Income increased $20.5 million, or 5%, to $435.0 million for the year ended December 31, 2014, compared to $414.5 million for the year ended December 31, 2013. This increase was primarily attributable to the increased scale and diversification of our trading compared to the prior period and reflects increases in Adjusted Net Trading Income from Americas equities trading of $2.3 million, $7.2 million from EMEA equities trading, $28.7 million from global currencies trading and $3.8 million from trading options, fixed income and other securities. These increases in Adjusted Net Trading Income were partially offset by a decrease in Adjusted Net Trading Income from APAC equities trading of $15.6 million and $1.9 million from global commodities compared to the year ended December 31, 2013, which was primarily attributable to overall decreased average daily volumes and volatility across certain asset classes in these categories. Adjusted Net Trading Income per day increased $0.08 million, or 4.9%, to $1.73 million for the year ended December 31, 2014, compared to $1.60 million for the year ended December 31, 2013. The number of trading days for the years ended December 31, 2014 and 2013 was 252 and 252, respectively. See “Summary Historical and Pro Forma Consolidated Financial and Other Data” for the reconciliation between Net Income and Adjusted Net Trading Income.
Operating Expenses
Our operating expenses increased $52.6 million, or 11.0%, to $529.5 million for the year ended December 31, 2014, compared to $476.9 million for the year ended December 31, 2013. This increase was primarily due to increases in brokerage, exchange, and clearance fees of $35.9 million, interest and dividends expense of $1.9 million, communication and data processing expense of $4.1 million, employee compensation and payroll taxes of $6.1 million,
55
financing interest expense on senior secured credit facility of $6.3 million, initial public offering fees and expenses of $9.0 million, transaction advisory fees and expenses of $3.0 million and $6.5 million in depreciation and amortization expense. These increases in operating expenses were partially offset by decreases in debt issue cost related to debt refinancing of $10.0 million, operations and administrative expense of $5.3 million, $4.1 million in acquisition related retention bonus, and $0.8 million in amortization of purchased intangibles and acquired capitalized software.
Brokerage, Exchange and Clearance Fees, Net. Brokerage exchange and clearance fees, net, increased $35.9 million, or 18.4%, to $231.0 million for the year ended December 31, 2014, compared to $195.1 million for the year ended December 31, 2013. This increase was primarily attributable to the higher fees incurred in our Americas equities trading. As indicated above, rather than analyzing brokerage, exchange and clearance fees, net, in isolation, we generally evaluate it in the broader context of our Adjusted Net Trading Income.
Communication and Data Processing. Communication and data processing expense increased $4.1 million, or 6.3%, to $68.8 million for the year ended December 31, 2014, compared to $64.7 million for the year ended December 31, 2013. This increase was primarily attributable to increased costs from the use of new telecommunication and market data technologies.
Employee Compensation and Payroll Taxes. Employee compensation and payroll taxes increased $6.1 million, or 7.8%, to $84.5 million for the year ended December 31, 2014, compared to $78.4 million for the year ended December 31, 2013. This increase in compensation levels was attributable to increased incentive compensation as a result of the increase in overall profitability of our business and costs associated with a reduction in force for certain terminated employees. As of December 31, 2014, our global headcount was 148 employees as compared to 151 as of December 31, 2013.
Interest and Dividends Expense. Interest and dividends expense increased $1.9 million, or 4.2%, to $47.1 million for the year ended December 31, 2014, compared to $45.2 million for the year ended December 31, 2013. This increase was primarily attributable to greater financing and dividend costs incurred from our market making activities. As indicated above, rather than analyzing interest and dividends expense in isolation, we generally evaluate it in the broader context of our Adjusted Net Trading Income.
Operations and Administrative. Operations and administrative expense decreased $5.3 million, or 19.5%, to $21.9 million for the year ended December 31, 2014, compared to $27.2 million for the year ended December 31, 2013. The decrease was primarily attributable to the operational efficiencies achieved in our overhead expenses such as travel and entertainment, freight, and occupancy costs, resulting in part from the relocation of our Dublin trading centers following the closure of our London trading office and the consolidation of our European operations in Dublin during the year ended December 31, 2013.
Depreciation and Amortization. Depreciation and amortization increased $6.5 million, or 27.2%, to $30.4 million for the year ended December 31, 2014, compared to $23.9 million for the year ended December 31, 2013. This increase was primarily attributable to increased capital expenditures on telecommunication, networking and other assets.
Amortization of Purchased Intangibles and Acquired Capitalized Software. Amortization of purchased intangibles and acquired capitalized software decreased $0.8 million, or 80.0%, to $0.2 million for the year ended December 31, 2014, compared to $1.0 million for the year ended December 31, 2013. This decrease was primarily attributable to the full amortization of the majority of the purchased intangibles and acquired capitalized software related to the Madison Tyler Transactions, all of which was amortized by December 31, 2013.
Acquisition Related Retention Bonus. Acquisition related retention bonus expense decreased $4.1 million, or 61.2%, to $2.6 million for the year ended December 31, 2014, compared to $6.7 million for the year ended December 31, 2013. The final installment payment under the retention plan was made on July 2014, compared against the full year of expenses for the year ended December 31, 2014.
Debt Issue Costs Related to Debt Refinancing. Expense from debt issue costs related to debt refinancing was $10.0 million for the year ended December 31, 2013. These costs reflect nonrecurring expenses incurred as a result of the
56
refinancing of our senior secured credit facility in February 2013 and November 2013. We had no such expense in the year ended December 31, 2014.
Initial Public Offering Fees and Expenses. Initial public offering fees and expenses were $9.0 million for the year ended December 31, 2014. These costs reflect nonrecurring expenses incurred as a result of the Initial Public Offering postponement in April 2014. We had no such expense for the year ended December 31, 2013.
Transaction Advisory Fees and Expenses. Transaction advisory fees and expenses were $3.0 million for the year ended December 31, 2014. These costs reflect nonrecurring professional fees incurred in connection with the Temasek Transaction, which was consummated on December 31, 2014. We had no such expense for the year ended December 31, 2013.
Financing Interest Expense on Senior Secured Credit Facility. Financing interest expense on senior secured credit facility increased $6.3 million, or 25.6%, to $30.9 million for the year ended December 31, 2014, compared to $24.6 million for the year ended December 31, 2013. This increase was primarily attributable to a $150.0 million and $106.7 million increase in the principal amount outstanding under our senior secured credit facility in May and November 2013, respectively.
Provision for Income Taxes
Historically, as a limited liability company treated as a partnership for U.S. federal income tax purposes, most of our income has not been subject to corporate tax, but instead our members have been taxed on their proportionate share of our net income. Our income tax expense reflects taxes payable by certain of our non‑U.S. subsidiaries. Provision for income taxes decreased $1.9 million, or 35.2%, to $3.5 million for the year ended December 31, 2014, compared to $5.4 million for the year ended December 31, 2013. This decrease was primarily attributable to decreased profitability in foreign jurisdictions where we are subject to corporate level taxation, in particular APAC operations due to lower observed market volumes.
Liquidity and Capital Resources
General
As of December 31, 2015, we had $163.2 million in cash and cash equivalents, which included $50.3 million of remaining net proceeds received from the IPO. These balances are maintained primarily to support operating activities and for capital expenditures and for short-term access to liquidity, and other general corporate purposes. As of December 31, 2015, we had borrowings under our short-term credit facilities of approximately $219.1 million, broker dealer credit facilities of $45.0 million, and long-term debt outstanding in an aggregate principal amount of approximately $499.8 million. As of December 31, 2015, our regulatory capital requirements for domestic U.S. subsidiaries were $3.9 million, in aggregate.
The majority of our assets consist of exchange-listed marketable securities, which are marked-to-market daily, and collateralized receivables from broker-dealers and clearing organizations arising from proprietary securities transactions. Collateralized receivables consist primarily of securities borrowed, receivables from clearing houses for settlement of securities transactions and, to a lesser extent, securities purchased under agreements to resell. We actively manage our liquidity, and we maintain significant borrowing facilities through the securities lending markets and with banks and prime brokers. We have continually received the benefit of uncommitted margin financing from our prime brokers globally. These margin facilities are secured by securities in accounts held at the prime broker. For purposes of providing additional liquidity, we maintain a committed revolving credit facility for Virtu Financial BD LLC, one of our wholly owned broker-dealer subsidiaries. Effective July 20, 2015, the Company entered into an amendment to extend the term of the committed broker dealer credit facilities, to July 18, 2016, as discussed in Note 8 of the accompanying consolidated financial statements.
Based on our current level of operations, we believe our cash flows from operations, available cash and available borrowings under our broker-dealer revolving credit facility will be adequate to meet our future liquidity needs for more than the next twelve months. We anticipate that our primary upcoming cash and liquidity needs will be
57
increased margin requirements from increased trading activities in markets where we currently provide liquidity and in new markets into which we expand. We manage and monitor our margin and liquidity needs on a real-time basis and can adjust our requirements both intra-day and inter-day, as required.
We expect our principal sources of future liquidity to come from cash flows provided by operating activities and financing activities. In addition, we have broad discretion as to the application of the net proceeds received from the IPO for working capital and general corporate purposes. Certain of our cash balances are insured by the Federal Deposit Insurance Corporation, generally up to $250,000 per account but without a cap under certain conditions. From time to time these cash balances may exceed insured limits, but we select financial institutions deemed highly creditworthy to minimize risk. We consider highly liquid investments with original maturities of less than three months when acquired to be cash equivalents.
Tax Receivable Agreements
Generally, we are required under the tax receivable agreements described in the Registration Statement to make payments to both the Virtu Post-IPO Members and the Investor Post-IPO Stockholders that are generally equal to 85% of the applicable cash tax savings, if any, that we actually realize as a result of favorable tax attributes that will be available to us as a result of the Reorganization Transactions, exchanges of membership interests for Class A common stock or Class B common stock and payments made under the tax receivable agreements. We will retain the remaining 15% of these cash tax savings. We expect that future payments to the Virtu Post-IPO Members and the Investor Post-IPO Stockholders in respect of the purchases, the exchanges and the Mergers described in the Registration Statement and Note 13 of the consolidated financial statements of Virtu Financial included herein are expected to aggregate to approximately $218.4 million, ranging from approximately $8.1 million to $16.8 million per year over the next 15 years. Such payments will occur only after we have filed our U.S. federal and state income tax returns and realized the cash tax savings from the favorable tax attributes. The first payment would be due after the filing of our tax return for the year ended December 31, 2015, which was due March 15, 2016, but has been extended to September 15, 2016. Future payments under the tax receivable agreements in respect of subsequent exchanges would be in addition to these amounts. We currently expect to fund these payments from cash flow from operations generated by our subsidiaries as well as from excess tax distributions that we receive from our subsidiaries.
Under the tax receivable agreements, as a result of certain types of transactions and other factors, including a transaction resulting in a change of control, we may also be required to make payments to the Virtu Post-IPO Members and the Investor Post-IPO Stockholders in amounts equal to the present value of future payments we are obligated to make under the tax receivable agreements. If the payments under the tax receivable agreements are accelerated, we may be required to raise additional debt or equity to fund such payments. To the extent that we are unable to make payments under the tax receivable agreements for any reason (including because our credit agreement restricts the ability of our subsidiaries to make distributions to us) such payments will be deferred and will accrue interest until paid.
Regulatory Capital Requirements
Certain of our principal operating subsidiaries are subject to separate regulation and capital requirements in the United States and other jurisdictions. Virtu Financial BD LLC and Virtu Financial Capital Markets LLC are registered U.S. broker-dealers, and their primary regulators include the SEC, the Chicago Stock Exchange and FINRA. Virtu Financial Ireland Limited is a registered investment firm under the Market in Financial Instruments Directive, and its primary regulator is the Central Bank of Ireland.
The SEC and FINRA impose rules that require notification when regulatory capital falls below certain pre-defined criteria. These rules also dictate the ratio of debt-to-equity in the regulatory capital composition of a broker-dealer and constrain the ability of a broker-dealer to expand its business under certain circumstances. If a firm fails to maintain the required regulatory capital, it may be subject to suspension or revocation of registration by the applicable regulatory agency, and suspension or expulsion by these regulators could ultimately lead to the firm’s liquidation. Additionally, certain applicable rules impose requirements that may have the effect of prohibiting a broker-dealer from distributing or withdrawing capital and requiring prior notice to and/or approval from the SEC, the Chicago Stock Exchange and FINRA for certain capital withdrawals. Virtu Financial Capital Markets LLC is also subject to rules set
58
forth by NYSE MKT (formerly NYSE Amex) and is required to maintain a certain level of capital in connection with the operation of its DMM business. Virtu Financial Ireland Limited is regulated by the Central Bank of Ireland as an Investment Firm and in accordance with European Union law is required to maintain a minimum amount of regulatory capital based upon its positions, financial conditions, and other factors. In addition to periodic requirements to report its regulatory capital and submit other regulatory reports, Virtu Financial Ireland Limited is required to obtain consent prior to receiving capital contributions or making capital distributions from its regulatory capital. Failure to comply with its regulatory capital requirements could result in regulatory sanction or revocation of its regulatory license.
The following table sets forth the regulatory capital level, requirement and excess for domestic U.S. subsidiaries as of December 31, 2015.
|
|
|
|
|
|
|
|
|
|
|
|
|
|
|
Regulatory |
|
Regulatory Capital |
|
Excess Regulatory |
|
|||
|
(in thousands) |
|
Capital |
|
Requirement |
|
Capital |
|
|||
|
Virtu Financial BD LLC |
|
$ |
64,243 |
|
$ |
1,000 |
|
$ |
63,243 |
|
|
Virtu Financial Capital Markets LLC |
|
|
8,462 |
|
|
2,896 |
|
|
5,566 |
|
Broker-Dealer Credit Facilities
We are a party to two secured credit facilities with the same financial institution to finance overnight securities positions purchased as part of its ordinary course broker‑dealer market making activities. One of the facilities (the “Uncommitted Facility”), is provided on an uncommitted basis and is available for borrowings by our broker‑dealer subsidiaries up to a maximum amount of $125.0 million. In connection with this credit facility, we entered into demand promissory notes dated February 20, 2013. The loans provided under the Uncommitted Facility are collateralized by the Company’s broker‑dealer trading and deposit accounts with the same financial institution and, bear interest at a rate set by the financial institution on a daily basis (1.25% at December 31, 2015 and 1.12% at December 31, 2014). The Uncommitted Facility has a 364‑day term. We are a party to another facility (the “Committed Facility”) with the same financial institution dated July 22, 2013 and subsequently amended on March 26, 2014, July 21, 2014 and April 24, 2015, which is provided on a committed basis and is available for borrowings by one of our broker‑dealer subsidiaries up to a maximum of the lesser of $75.0 million or an amount determined based on agreed advance rates for pledged securities. Borrowings under this facility are used to finance the purchase and settlement of securities and bear interest at the adjusted LIBOR rate or base rate, plus a margin of 1.25% per annum. A commitment fee of 0.25% per annum on the average daily unused portion of this facility is payable quarterly in arrears. An upfront fee of $0.5 million was payable in four equal installments, on the closing date and on the last day of each of the three subsequent quarters. This facility requires, among other items, maintenance of minimum net worth, minimum excess net capital and a maximum total assets to equity ratio.
Short-Term Credit Facilities
We maintain short term credit facilities with various prime brokers and other financial institutions from which it receives execution or clearing services. The proceeds of these facilities are used to meet margin requirements associated with the products traded by us in the ordinary course, and amounts borrowed are collateralized by our trading accounts with the applicable financial institution. The aggregate amount available for borrowing under these facilities was $478.0 million and $440.0 million, the outstanding principal was $219.1 million and $182.9 million, and borrowings bore interest at a weighted average interest rate of 2.48% and 1.80% per annum, as of December 31, 2015 and 2014, respectively. Interest expense in relation to the facilities for the years ended December 31, 2015, 2014, and 2013 was approximately $5.5 million, $3.3 million, and $3.2 million, respectively.
Senior Secured Credit Facility
We originally entered into our senior secured credit facility with Credit Suisse AG, Cayman Islands Branch, in July 2011 in connection with the Madison Tyler Transactions. Subsequently, we refinanced our senior secured credit facility in February 2013, we obtained an incremental term loan thereunder in May 2013 and we refinanced our senior secured credit facility again in November 2013. As of December 31, 2015, our senior secured credit facility had an aggregate principal amount outstanding of $499.8 million, and it matures in November 2019. Prior to the consummation of the IPO, borrowings under our senior secured credit facility bear interest, at our election, at either (i) the greatest of
59
(a) the prime rate in effect, (b) the federal funds effective rate plus 0.5%, (c) an adjusted LIBOR rate for a Eurodollar borrowing with an interest period of one month plus 1% and (d) 2.25%, plus, in each case, 3.5%, or (ii) the greater of (x) an adjusted LIBOR rate for the interest period in effect and (y) 1.25%, plus, in each case, 4.5%. Following the consummation of the IPO, such borrowings now bear interest, at our election, at either (i) the greatest of (a) the prime rate in effect, (b) the federal funds effective rate plus 0.5%, (c) an adjusted LIBOR rate for a Eurodollar borrowing with an interest period of one month plus 1% and (d) 2.25%, plus, in each case, 3.0%, or (ii) the greater of (x) an adjusted LIBOR rate for the interest period in effect and (y) 1.25%, plus, in each case, 4.0%.
Our senior secured credit facility is subject to certain financial covenants, which require us to maintain specified financial ratios and tests, including interest coverage and total leverage ratios, which may require us to take action to reduce our debt or to act in a manner contrary to our business objectives. Our senior secured credit facility is also subject to certain negative covenants that restricts our ability to, among other things, incur additional indebtedness, dispose of assets, guarantee debt obligations, repay other indebtedness, pay dividends, pledge assets, make investments, including in certain of our operating subsidiaries, make acquisitions or consummate mergers or consolidations and engage in certain transactions with subsidiaries and affiliates. We are also subject to contingent principal payments based on excess cash flow and certain other triggering events. As of December 31, 2015, we were in compliance with all of our covenants.
Borrowings under our senior secured credit facility are secured by substantially all of our assets, other than the equity interests in and assets of our subsidiaries that are subject to, or potentially subject to, regulatory oversight, and our foreign subsidiaries, but including 100% of the non-voting stock and 65% of the voting stock of these subsidiaries.
On April 15, 2015, VFH Parent LLC, Virtu Financial’s wholly owned subsidiary, entered into the new revolving credit facility with a syndicate of lenders in the amount of $100.0 million for general corporate purposes. The new revolving credit facility became available upon the consummation of the IPO on April 21, 2015 and the payment of fees and expenses related to the new revolving credit facility. The new revolving credit facility was implemented pursuant to an amendment to its existing senior secured credit facility, is secured on a pari passu basis with the existing term loan under our senior secured credit facility and is subject to the same financial covenants and negative covenants. Borrowings under the new revolving credit facility will bear interest, at our election, at either (i) the greatest of (a) the prime rate in effect, (b) the federal funds effective rate plus 0.5% and (c) an adjusted LIBOR rate for a Eurodollar borrowing with an interest period of one month plus 1% plus, in each case, 2.0%, or (ii) an adjusted LIBOR rate for the interest period in effect plus 3.0%. A commitment fee of 0.50% per annum is applied on the average daily unused portion of the facility. In connection with the amendment described above and as discussed in Note 8, the incremental spread under the existing term loan was reduced by 0.50% upon the consummation of the IPO on April 21, 2015.
Cash Flows
Our main sources of liquidity are cash flow from the operations of our subsidiaries, our broker‑dealer revolving credit facility (described under “Management’s Discussion and Analysis of Financial Condition and Results of Operations — Liquidity and Capital Resources — Credit Facilities”), margin financing provided by our prime brokers and cash on hand.
The table below summarizes our primary sources and uses of cash for the years ended December 31, 2015, 2014 and 2013.
|
|
|
|
|
|
|
|
|
|
|
|
|
|
|
Years Ended December 31, |
|
|||||||
|
(in thousands) |
|
|
2015 |
|
2014 |
|
2013 |
|
||
|
Net cash provided by : |
|
|
|
|
|
|
|
|
|
|
|
Operating activities |
|
$ |
260,280 |
|
$ |
272,699 |
|
$ |
259,361 |
|
|
Investing activities |
|
|
(24,299) |
|
|
(36,159) |
|
|
(32,016) |
|
|
Financing activities |
|
|
(144,355) |
|
|
(221,654) |
|
|
(202,695) |
|
|
Effect of exchange rate changes on Cash and cash equivalents |
|
|
(4,255) |
|
|
(5,032) |
|
|
1,382 |
|
|
Net increase in Cash and cash equivalents |
|
$ |
87,371 |
|
$ |
9,854 |
|
$ |
26,032 |
|
60
Operating Activities
Net cash provided by operating activities was $260.3 million for the year ended December 31, 2015, compared to $272.7 million for the year ended December 31, 2014. The decrease of $12.4 million in net cash provided by operating activities was mainly due to increase in income taxes paid as a result of the Reorganization. This decrease in net cash provided is offset by the increased profitability of our business and the use of proceeds from excess funds held at prime brokers and clearinghouse.
Net cash provided by operating activities was $272.7 million for the year ended December 31, 2014, compared to $259.4 million for the year ended December 31, 2013. The increase of $13.3 million in net cash provided by operating activities is largely a reflection of the increased profitability of our business and the use of proceeds from excess funds held at prime brokers and clearinghouses towards repayment of the short term borrowings.
Investing Activities
Net cash used in investing activities was $24.3 million for the year ended December 31, 2015, compared to $36.2 million for the year ended December 31, 2014. The decrease of $11.9 million was due to an increase of $2.1 million in property and equipment purchases as a result of increased investment in networking and communication equipment for the year ended December 31, 2015.
Net cash used in investing activities was $36.2 million for the year ended December 31, 2014, compared to $32.0 million for the year ended December 31, 2013. The $4.2 million increase in net cash used in investing activities was due to a $6.2 million increase in property and equipment purchases offset by a $2.0 million decrease in capitalized software development. The property and equipment purchases in the year ended December 31, 2014 increased as a result of investments in networking and communication equipment.
Financing Activities
Net cash used in financing activities was $144.4 million for the year ended December 31, 2015 and $221.7 million for the year ended December 31, 2014. The decrease of $77.3 million was primarily due to the Company holding approximately 27.5% interest in Virtu Financial as a result of the completion of the IPO and the Reorganization Transactions and consequently participating in distributions by Virtu Financial to its members as of a date subsequent to the IPO and the Reorganization Transactions. The decrease was offset by an increase in distributions to members of Virtu Financial, including mandatory tax distribution of $120.4 million for the year ended December 31, 2015.
Net cash used in financing activities of $221.7 million for the year ended December 31, 2014, compared to $202.7 million year ended December 31, 2013. The increase of $19.0 million was primarily a result of a lower borrowing on the Company’s broker dealer credit facilities as of December 31, 2014, compared to December 31, 2013.
Contractual Obligations
The following table reflects our contractual obligations as of December 31, 2015. Amounts we pay in future periods may vary from those reflected in the table.
|
|
|
Payments due by periods |
||||||||||||
|
|
|
|
|
|
Less than |
|
|
|
|
|
|
|
|
More than |
|
(in thousands) |
|
Total |
|
|
1 year |
|
|
1-3 years |
|
|
3-5 years |
|
|
5 years |
|
Long-term debt obligations |
|
499,800 |
|
|
5,100 |
|
|
10,200 |
|
|
484,500 |
|
|
- |
|
Capital leases |
|
13,026 |
|
|
9,746 |
|
|
3,280 |
|
|
- |
|
|
- |
|
Operating leases |
|
36,823 |
|
|
9,526 |
|
|
16,016 |
|
|
10,680 |
|
|
601 |
|
Total contractual obligations |
$ |
549,649 |
|
$ |
24,372 |
|
$ |
29,496 |
|
$ |
495,180 |
|
$ |
601 |
The contractual obligation table above excludes contractual amounts owed under the tax receivable agreement as the ultimate amount and timing of the amounts due are not presently known. As of December 31, 2015, a total of $218.4 million has been recorded in amount due pursuant to tax receivable agreement in the consolidated financial
61
statements representing management’s best estimate of the amounts currently expected to be owed under the tax receivable agreement.
Off-Balance Sheet Arrangements
We do not invest in any off-balance sheet vehicles that provide liquidity, capital resources, market or credit risk support, or engage in any activities that expose us to any liability that is not reflected in our consolidated financial statements except for those described under “Contractual Obligations” above.
Inflation
We believe inflation has not had a material effect on our financial condition or results of operations for the years ended 2015, 2014 and 2013.
Critical Accounting Policies and Estimates
The preparation of financial statements in conformity with U.S. GAAP requires management to make estimates and assumptions that affect the reported amounts of assets and liabilities and disclosure of contingent assets and liabilities at the date of the consolidated financial statements, as well as the reported amounts of revenue and expenses during the applicable reporting period. Critical accounting policies are those that are the most important portrayal of our financial condition and results of operations and that require our most difficult, subjective and complex judgments as a result of the need to make estimates about the effect of matters that are inherently uncertain. While our significant accounting policies are described in more detail in the notes to our consolidated financial statements, our most critical accounting policies are discussed below. In applying such policies, we must use some amounts that are based upon our informed judgments and best estimates. Estimates, by their nature, are based upon judgments and available information. The estimates that we make are based upon historical factors, current circumstances and the experience and judgment of management. We evaluate our assumptions and estimates on an ongoing basis. Our actual results may differ from these estimates under different assumptions or conditions.
Earnings Per Share
Earnings per share (“EPS”) is computed in accordance with ASC 260, Earnings per Share. Basic EPS is computed by dividing the net income available for common stockholders by the weighted average number of shares outstanding for that period. Diluted EPS is calculated by dividing the net income available for common stockholders by the diluted weighted average shares outstanding for that period. Diluted EPS includes the determinants of the basic EPS and, in addition, reflects the dilutive effect of shares of common stock estimated to be distributed in the future under our share based compensation plans, with no adjustments to net income available for common stockholders for dilutive potential common shares.
Principles of Consolidation, including Noncontrolling Interests
The consolidated financial statements include the accounts of us and our majority and wholly owned subsidiaries. As sole managing member of Virtu Financial, we exert control over the Group’s operations. In accordance with ASC 810, Consolidation, we consolidate Virtu Financial and its subsidiaries’ consolidated financial statements and record the interests in Virtu Financial that we do not own as noncontrolling interests. All intercompany accounts and transactions have been eliminated in consolidation.
Valuation of Financial Instruments
Due to the nature of our operations, substantially all of our financial instrument assets, comprised of financial instruments owned, securities purchased under agreements to resell, and receivables from brokers, dealers and clearing organizations are carried at fair value based on published market prices and are marked to market daily, or are assets which are short-term in nature and are reflected at amounts approximating fair value. Similarly, all of our financial instrument liabilities that arise from financial instruments sold but not yet purchased, securities sold under agreements to
62
repurchase, securities loaned and payables to brokers, dealers and clearing organizations are short-term in nature and are reported at quoted market prices or at amounts approximating fair value.
Revenue Recognition
Trading Income, Net
Trading income, net, consists of trading gains and losses that are recorded on a trade date basis and reported on a net basis. Trading income, net, is comprised of changes in fair value of assets and liabilities (i.e., unrealized gains and losses) and realized gains and losses on equities, fixed income securities, currencies and commodities.
Technology Services
Technology services revenues consist of fees paid by third parties for licensing of our proprietary risk management and trading infrastructure technology and provision of associated management and hosting services. These fees include both upfront and annual recurring fees. Income from existing arrangements for technology services is recorded as a services contract in accordance with SEC Topic 13 (Staff Accounting Bulletin No. 104), SEC Topic 13.A.3 (f), with revenue being recognized once persuasive evidence of an arrangement exists, delivery has occurred, the fee is fixed or determinable, and collectability is probable.
Software Development Costs
We account for the costs of computer software developed or obtained for internal use in accordance with ASC 350-40, Internal-Use Software. We capitalize payroll and payroll related costs for employees incurred in developing internal-use software. Costs incurred during the preliminary project and post-implementation stages are charged to expense. Management’s judgment is required in determining the point when various projects enter the stages at which costs may be capitalized, in assessing the ongoing value of the capitalized costs and in determining the estimated useful lives over which the costs are amortized. Capitalization of such costs begins when a program or functionality under development has established technological feasibility and ends when the resulting program or functionality is available for release to users. Such criteria are measured through periodic surveys of employees responsible for developing internal-use software.
Capitalized software development costs and related accumulated amortization are included in property, equipment and capitalized software on the accompanying consolidated statements of financial condition and are amortized over a period of 1.4 to 2.5 years, which represents the estimated useful lives of the underlying software.
Share-Based Compensation
We account for share-based compensation transactions with employees under the provisions of ASC 718, Compensation: Stock Compensation. Share-based compensation transactions with employees are measured based on the fair value of equity instruments issued.
The fair value of awards issued for compensation prior to the Reorganization Transactions and the IPO was determined by management, with the assistance of an independent third party valuation firm, using a projected annual forfeiture rate, where applicable, on the date of grant.
Share-based awards issued for compensation in connection with or subsequent to the Reorganization Transaction and the IPO pursuant to our 2015 Management Incentive Plan (the “2015 Management Incentive Plan”) were in the form of stock options, Class A common stock and restricted stock units. The fair value of the stock option grants are determined through the application of the Black-Scholes-Merton model. The fair value of the Class A common stock and restricted stock units are determined based on the volume weighted average price for the three days preceding the grant, and with respect to the restricted stock units, a projected annual forfeiture rate. The fair value of share-based awards granted to employees is expensed based on the vesting conditions and are recognized on a straight line basis over the vesting period. We record as treasury stock shares repurchased from its employees for the purpose of settling tax
63
liabilities incurred upon the issuance of common stock, the vesting of restricted stock units or the exercise of stock options.
Income Taxes
We conduct our business globally through a number of separate legal entities. Consequently, our effective tax rate is dependent upon the geographic distribution of our earnings or losses and the tax laws and regulations of each legal jurisdiction in which we operate. We may pay taxes in some jurisdictions and not others.
Certain of our wholly owned subsidiaries are subject to income taxes in foreign jurisdictions. The provision for income tax is comprised of current tax and deferred tax. Current tax represents the tax on current year tax returns, using tax rates enacted at the balance sheet date. A deferred tax asset is recognized only to the extent that it is probable that future taxable income will be available against which the asset can be utilized.
We recognize the tax benefit from an uncertain tax position, in accordance with ASC 740, Income Taxes only if it is more likely than not that the tax position will be sustained on examination by the applicable taxing authority, including resolution of the appeals or litigation processes, based on the technical merits of the position. The tax benefits recognized in the consolidated financial statements from such a position are measured based on the largest benefit for each such position that has a greater than fifty percent likelihood of being realized upon ultimate resolution. Many factors are considered when evaluating and estimating the tax positions and tax benefits. Such estimates involve interpretations of regulations, rulings, case law, etc. and are inherently complex. Our estimates may require periodic adjustments and may not accurately anticipate actual outcomes as resolution of income tax treatments in individual jurisdictions typically would not be known for several years after completion of any fiscal year.
Goodwill and Intangible Assets
Goodwill represents the excess of the purchase price over the underlying net tangible and intangible assets of our acquisitions. Goodwill is not amortized but is tested for impairment on an annual basis and between annual tests whenever events or changes in circumstances indicate that the carrying amount may not be recoverable. Goodwill is tested at the reporting unit level, which is defined as an operating segment or one level below the operating segment. We operate in one operating segment, which is our only reporting unit.
The goodwill impairment test is a two-step process. The first step is used to identify potential impairment and compares the fair value of a reporting unit with its carrying amount, including goodwill. If the carrying amount of a reporting unit exceeds its fair value, the second step of the goodwill impairment test must be performed. The second step is used to measure the amount of impairment loss, if any, and compares the implied fair value of reporting unit goodwill with the carrying amount of that goodwill. If the carrying amount of reporting unit goodwill exceeds the implied fair value of that goodwill, an impairment loss must be recognized in an amount equal to that excess.
The Company tests goodwill for impairment on an annual basis on July 1 and on an interim basis when certain events or circumstances exist. In the impairment test as of July 1, 2015, the primary valuation method used to estimate the fair value of the Company’s reporting unit was the market capitalization approach based on the market price of its Class A Common Stock, which the management believes to be an appropriate indicator of its fair value. In the impairment test as of July 1, 2014, the primary valuation methods used to estimate the fair value of the Company’s reporting unit were the income and market approaches. In applying the income approach, projected available cash flows and the terminal value were discounted to present value to derive an indication of fair value of the business enterprise. The market approach compared the reporting unit to selected reasonably similar publicly-traded companies.
Recent Accounting Pronouncements
For a discussion of recently issued accounting developments and their impact or potential impact on our consolidated financial statements, see Note 2 – Summary of Significant Accounting Policies, of the consolidated financial statements included in this Form 10-K.
64
ITEM 7A. QUANTITATIVE AND QUALITATIVE DISCLOSURES ABOUT MARKET RISK
Interest Rate Risk, Derivative Instruments
In the normal course of business, we utilize derivative financial instruments in connection with our proprietary trading activities. We do not designate our derivative financial instruments as hedging instruments under Financial Accounting Standards Board’s Accounting Standards Codification (ASC) 815 ‘‘Derivatives and Hedging.’’ Instead, we carry our derivative instruments at fair value with gains and losses included in trading income, net, in the accompanying statements of comprehensive income. Fair value of derivatives that are freely tradable and listed on a national exchange is determined at their last sale price as of the last business day of the period. Since gains and losses are included in earnings, we have elected not to separately disclose gains and losses on derivative instruments, but instead to disclose gains and losses within trading revenue for both derivative and non-derivative instruments.
Futures Contracts. As part of our proprietary market making trading strategies, we use futures contracts to gain exposure to changes in values of various indices, commodities, interest rates or foreign currencies. A futures contract represents a commitment for the future purchase or sale of an asset at a specified price on a specified date. Upon entering into a futures contract, we are required to pledge to the broker an amount of cash, U.S. government securities or other assets equal to a certain percentage of the contract amount. Subsequent payments, known as variation margin, are made or received by us each day, depending on the daily fluctuations in the fair values of the underlying securities. We recognize a gain or loss equal to the daily variation margin.
Due from Broker Dealers and Clearing Organizations. Management periodically evaluates our counterparty credit exposures to various brokers and clearing organizations with a view to limiting potential losses resulting from counterparty insolvency.
Foreign Currency Risk
As a result of our international market making activities and accumulated earnings in our foreign subsidiaries, our income and net worth are subject to fluctuation in foreign exchange rates. While we generate revenues in several currencies, a majority of our operating expenses are denominated in U.S. dollars. Therefore, depreciation in these other currencies against the U.S. dollar would negatively impact revenue upon translation to the U.S. dollar. The impact of any translation of our foreign denominated earnings to the U.S. dollar is mitigated, however, through the impact of daily hedging practices that are employed by the company.
Assets and liabilities of subsidiaries with non-U.S. dollar functional currencies are translated into U.S. dollars at period-end exchange rates. Income, expense and cash flow items are translated at average exchange rates prevailing during the period. The resulting currency translation adjustments are recorded as foreign exchange translation adjustment in our Consolidated Statements of Comprehensive Income and Changes in Equity. Our primary currency translation exposures historically relate to net investments in subsidiaries having functional currencies denominated in the Euro.
Market Risk
The purchase and sale of futures contracts requires margin deposits with a Futures Commission Merchant (‘‘FCM’’). The Commodity Exchange Act requires an FCM to segregate all customer transactions and assets from the FCM’s proprietary activities. A customer’s cash and other equity deposited with an FCM are considered commingled with all other customer funds subject to the FCM’s segregation requirements. In the event of an FCM’s insolvency, recovery may be limited to the Company’s pro rata share of segregated customer funds available. It is possible that the recovery amount could be less than the total cash and other equity deposited.
65
Financial Instruments with Off Balance Sheet Risk
We enter into various transactions involving derivatives and other off-balance sheet financial instruments. These financial instruments include futures, forward contracts, and exchange-traded options. These derivative financial instruments are used to conduct trading activities and manage market risks and are, therefore, subject to varying degrees of market and credit risk. Derivative transactions are entered into for trading purposes or to economically hedge other positions or transactions.
Futures and forward contracts provide for delayed delivery of the underlying instrument. In situations where we write listed options, we receive a premium in exchange for giving the buyer the right to buy or sell the security at a future date at a contracted price. The contractual or notional amounts related to these financial instruments reflect the volume and activity and do not necessarily reflect the amounts at risk. Futures contracts are executed on an exchange, and cash settlement is made on a daily basis for market movements, typically with a central clearing house as the counterparty. Accordingly, futures contracts generally do not have credit risk. The credit risk for forward contracts, options, and swaps is limited to the unrealized market valuation gains recorded in the statements of financial condition. Market risk is substantially dependent upon the value of the underlying financial instruments and is affected by market forces, such as volatility and changes in interest and foreign exchange rates.
66
ITEM 8. FINANCIAL STATEMENTS AND SUPPLEMENTARY DATA
Index to Consolidated Financial Statements
67
REPORT OF INDEPENDENT REGISTERED PUBLIC ACCOUNTING FIRM
To the Board of Directors and Stockholders of Virtu Financial, Inc.:
We have audited the accompanying consolidated statements of financial condition of Virtu Financial, Inc. and Subsidiaries (the ‘‘Company’’) as of December 31, 2015 and 2014, and the related consolidated statements of comprehensive income, changes in equity, and cash flows for each of the three years in the period ended December 31, 2015. These financial statements are the responsibility of the Company’s management. Our responsibility is to express an opinion on the financial statements based on our audit.
We conducted our audit in accordance with the standards of the Public Company Accounting Oversight Board (United States). Those standards require that we plan and perform the audit to obtain reasonable assurance about whether the financial statements are free of material misstatement. The Company is not required to have, nor were we engaged to perform, an audit of its internal control over financial reporting. Our audit included consideration of internal control over financial reporting as a basis for designing audit procedures that are appropriate in the circumstances, but not for the purpose of expressing an opinion on the effectiveness of the Company’s internal control over financial reporting. Accordingly, we express no such opinion. An audit also includes examining, on a test basis, evidence supporting the amounts and disclosures in the financial statements, assessing the accounting principles used and significant estimates made by management, as well as evaluating the overall financial statement presentation. We believe that our audit provides a reasonable basis for our opinion.
In our opinion, such consolidated financial statements present fairly, in all material respects, the financial position of Virtu Financial, Inc. and Subsidiaries as of December 31, 2015 and 2014, and the results of their operations and their cash flows for each of the three years in the period ended December 31, 2015, in conformity with accounting principles generally accepted in the United States of America
As discussed in Note 1 to the consolidated financial statements, the Company completed an initial public offering in April 2015.
/s/ DELOITTE & TOUCHE LLP
New York, NY
March 25, 2016
68
Virtu Financial, Inc. and Subsidiaries
Consolidated Statements of Financial Condition
|
|
|
As of December 31, |
|
||||
|
(in thousands, except share and interest data) |
|
2015 |
|
2014 |
|
||
|
|
|
|
|
|
|
|
|
|
Assets |
|
|
|
|
|
|
|
|
Cash and cash equivalents |
|
$ |
163,235 |
|
$ |
75,864 |
|
|
Securities borrowed |
|
|
453,296 |
|
|
484,934 |
|
|
Securities purchased under agreements to resell |
|
|
14,981 |
|
|
31,463 |
|
|
Receivables from broker dealers and clearing organizations |
|
|
476,536 |
|
|
387,652 |
|
|
Trading assets, at fair value: |
|
|
|
|
|
|
|
|
Financial instruments owned |
|
|
1,038,039 |
|
|
1,307,933 |
|
|
Financial instruments owned and pledged |
|
|
259,175 |
|
|
236,375 |
|
|
Property, equipment and capitalized software (net of accumulated depreciation of $98,595 and $84,579 as of December 31, 2015 and 2014, respectively) |
|
|
37,501 |
|
|
44,644 |
|
|
Goodwill |
|
|
715,379 |
|
|
715,379 |
|
|
Intangibles (net of accumulated amortization) |
|
|
1,203 |
|
|
1,414 |
|
|
Deferred tax asset |
|
|
193,740 |
|
|
977 |
|
|
Other assets ($5,984 and $8,205, at fair value, as of December 31, 2015 and 2014, respectively |
|
|
38,845 |
|
|
32,823 |
|
|
Total assets |
|
$ |
3,391,930 |
|
$ |
3,319,458 |
|
|
|
|
|
|
|
|
|
|
|
Liabilities, redeemable membership interest and equity |
|
|
|
|
|
|
|
|
Liabilities |
|
|
|
|
|
|
|
|
Short term borrowings |
|
$ |
45,000 |
|
$ |
— |
|
|
Securities loaned |
|
|
524,603 |
|
|
497,862 |
|
|
Securities sold under agreements to repurchase |
|
|
— |
|
|
2,006 |
|
|
Payables to broker dealers and clearing organizations |
|
|
486,604 |
|
|
686,203 |
|
|
Trading liabilities, at fair value: |
|
|
|
|
|
|
|
|
Financial instruments sold, not yet purchased |
|
|
979,090 |
|
|
1,037,634 |
|
|
Tax receivable agreement obligations |
|
|
218,399 |
|
|
— |
|
|
Accounts payable and accrued expenses and other liabilities |
|
|
86,775 |
|
|
93,331 |
|
|
Senior secured credit facility |
|
|
493,589 |
|
|
495,724 |
|
|
Total liabilities |
|
$ |
2,834,060 |
|
$ |
2,812,760 |
|
|
|
|
|
|
|
|
|
|
|
Class A-1 redeemable membership interest |
|
|
— |
|
|
294,433 |
|
|
|
|
|
|
|
|
|
|
|
Stockholders' / Members' equity |
|
|
|
|
|
|
|
|
Class A-1 — Authorized and Issued — 0 and 1,964,826 interests, Outstanding — 0 and 1,964,826 interests, at December 31, 2015 and 2014, respectively |
|
|
— |
|
|
19,648 |
|
|
Class A-2 — Authorized and Issued — 0 and 101,381,332 interests, Outstanding — 0 and 99,855,666 interests, at December 31, 2015 and 2014, respectively |
|
|
— |
|
|
287,705 |
|
|
Class A common stock (par value $0.00001), Authorized — 1,000,000,000 and 0 shares, Issued — 38,379,858 and 0 shares, Outstanding — 38,210,209 and 0 shares at December 31, 2015 and 2014, respectively |
|
|
— |
|
|
— |
|
|
Class B common stock (par value $0.00001), Authorized — 175,000,000 and 0 shares, Issued and Outstanding — 0 and 0 shares at December 31, 2015 and 2014, respectively |
|
|
— |
|
|
— |
|
|
Class C common stock (par value $0.00001), Authorized — 90,000,000 and 0 shares, Issued and Outstanding — 20,976,598 and 0 shares at December 31, 2015 and 2014, respectively |
|
|
— |
|
|
— |
|
|
Class D common stock (par value $0.00001), Authorized — 175,000,000 and 0 shares, Issued and Outstanding — 79,610,490 and 0 shares at December 31, 2015 and 2014, respectively |
|
|
1 |
|
|
— |
|
|
Treasury stock, at cost, 169,649 and 0 shares at December 31, 2015 and 2014, respectively |
|
|
(3,819) |
|
|
— |
|
|
Additional paid-in capital |
|
|
130,902 |
|
|
— |
|
|
Retained Earnings (Accumulated deficit) |
|
|
3,525 |
|
|
(91,383) |
|
|
Accumulated other comprehensive income (loss) |
|
|
99 |
|
|
(3,705) |
|
|
Total stockholders' / members' equity |
|
$ |
130,708 |
|
$ |
212,265 |
|
|
Noncontrolling interest |
|
|
427,162 |
|
|
— |
|
|
Total equity |
|
$ |
557,870 |
|
$ |
212,265 |
|
|
|
|
|
|
|
|
|
|
|
Total liabilities, redeemable membership interest and equity |
|
$ |
3,391,930 |
|
$ |
3,319,458 |
|
See accompanying notes to the consolidated financial statements.
69
Virtu Financial, Inc. and Subsidiaries
Consolidated Statements of Comprehensive Income
|
|
|
December 31, |
|
|||||||
|
(in thousands, except share and per share data) |
|
2015 |
|
2014 |
|
2013 |
|
|||
|
Revenues: |
|
|
|
|
|
|
|
|
|
|
|
Trading income, net |
|
$ |
757,455 |
|
$ |
685,150 |
|
$ |
623,733 |
|
|
Interest and dividends income |
|
|
28,136 |
|
|
27,923 |
|
|
31,090 |
|
|
Technology services |
|
|
10,622 |
|
|
9,980 |
|
|
9,682 |
|
|
Total revenue |
|
|
796,213 |
|
|
723,053 |
|
|
664,505 |
|
|
|
|
|
|
|
|
|
|
|
|
|
|
Operating Expenses: |
|
|
|
|
|
|
|
|
|
|
|
Brokerage, exchange and clearance fees, net |
|
|
232,469 |
|
|
230,965 |
|
|
195,146 |
|
|
Communication and data processing |
|
|
68,647 |
|
|
68,847 |
|
|
64,689 |
|
|
Employee compensation and payroll taxes |
|
|
88,026 |
|
|
84,531 |
|
|
78,353 |
|
|
Interest and dividends expense |
|
|
52,423 |
|
|
47,083 |
|
|
45,196 |
|
|
Operations and administrative |
|
|
25,991 |
|
|
21,923 |
|
|
27,215 |
|
|
Depreciation and amortization |
|
|
33,629 |
|
|
30,441 |
|
|
23,922 |
|
|
Amortization of purchased intangibles and acquired capitalized software |
|
|
211 |
|
|
211 |
|
|
1,011 |
|
|
Acquisition related retention bonus |
|
|
— |
|
|
2,639 |
|
|
6,705 |
|
|
Debt issue cost related to debt refinancing |
|
|
— |
|
|
— |
|
|
10,022 |
|
|
Initial public offering fees and expenses |
|
|
— |
|
|
8,961 |
|
|
— |
|
|
Transaction advisory fees and expenses |
|
|
— |
|
|
3,000 |
|
|
— |
|
|
Reserve for legal matter |
|
|
5,440 |
|
|
— |
|
|
— |
|
|
Charges related to share based compensation at IPO |
|
|
44,194 |
|
|
— |
|
|
— |
|
|
Financing interest expense on senior secured credit facility |
|
|
29,254 |
|
|
30,894 |
|
|
24,646 |
|
|
Total operating expenses |
|
|
580,284 |
|
|
529,495 |
|
|
476,905 |
|
|
Income before income taxes and noncontrolling interest |
|
|
215,929 |
|
|
193,558 |
|
|
187,600 |
|
|
Provision for income taxes |
|
|
18,439 |
|
|
3,501 |
|
|
5,397 |
|
|
Net income |
|
|
197,490 |
|
$ |
190,057 |
|
$ |
182,203 |
|
|
Noncontrolling interest |
|
|
(176,603) |
|
|
|
|
|
|
|
|
Net income available for common stockholders |
|
$ |
20,887 |
|
|
|
|
|
|
|
|
|
|
|
|
|
|
|
|
|
|
|
|
Earnings per share |
|
|
|
|
|
|
|
|
|
|
|
Basic |
|
$ |
0.60 |
|
|
|
|
|
|
|
|
Diluted |
|
$ |
0.59 |
|
|
|
|
|
|
|
|
|
|
|
|
|
|
|
|
|
|
|
|
Weighted average common shares outstanding |
|
|
|
|
|
|
|
|
|
|
|
Basic |
|
|
34,964,312 |
|
|
|
|
|
|
|
|
Diluted |
|
|
35,339,585 |
|
|
|
|
|
|
|
|
|
|
|
|
|
|
|
|
|
|
|
|
Net income |
|
$ |
197,490 |
|
$ |
190,057 |
|
$ |
182,203 |
|
|
Other comprehensive income (loss) |
|
|
|
|
|
|
|
|
|
|
|
Foreign exchange translation adjustment, net of taxes |
|
|
(4,255) |
|
|
(5,032) |
|
|
1,382 |
|
|
Comprehensive income |
|
|
193,235 |
|
$ |
185,025 |
|
$ |
183,585 |
|
|
Less: Comprehensive income attributable to noncontrolling interest |
|
|
(172,249) |
|
|
|
|
|
|
|
|
Comprehensive income attributable to common stockholders |
|
$ |
20,986 |
|
|
|
|
|
|
|
See accompanying notes to the consolidated financial statements.
70
Virtu Financial, Inc. and Subsidiaries
Consolidated Statements of Changes in Equity
|
|
|
|
|
|
|
|
|
|
|
|
|
|
|
|
|
|
|
|
|
|
|
Additional |
|
|
|
|
|
|
|
|
|
|
|
Retained |
|
Accumulated |
|
Total |
|
|
|
|
|
|
|
|
||||||
|
|
|
Class A |
|
Class C |
|
Class D |
|
|
|
|
|
|
Paid-in |
|
|
|
|
|
|
|
|
|
|
|
Earnings |
|
Other |
|
Stockholders' |
|
Non- |
|
|
|
Class A-1 |
|
||||||||||||||||
|
(in thousands, except |
|
Common Stock |
|
Common Stock |
|
Common Stock |
|
Treasury Stock |
|
Capital |
|
Class A-1 |
|
Class A-2 |
|
(Accumulated |
|
Comprehensive |
|
/ Members' |
|
Controlling |
|
Total |
|
Redeemable |
|
|||||||||||||||||||||||||
|
share and interest data) |
|
Shares |
|
Amounts |
|
Shares |
|
Amounts |
|
Shares |
|
Amounts |
|
Shares |
|
Amounts |
|
Amounts |
|
Interests |
|
Amounts |
|
Interests |
|
Amounts |
|
Deficit) |
|
Income (Loss) |
|
Equity |
|
Interest |
|
Equity |
|
Interest |
|
|||||||||||||
|
Balance at December 31, 2012 |
|
— |
|
|
— |
|
— |
|
|
— |
|
— |
|
|
— |
|
— |
|
|
— |
|
|
— |
|
1,964,826 |
|
|
19,648 |
|
97,323,850 |
|
|
488,989 |
|
|
(68,347) |
|
|
(55) |
|
|
440,235 |
|
|
— |
|
|
440,235 |
|
|
250,000 |
|
|
Share based compensation |
|
— |
|
|
— |
|
— |
|
|
— |
|
— |
|
|
— |
|
— |
|
|
— |
|
|
— |
|
— |
|
|
— |
|
2,223,814 |
|
|
13,441 |
|
|
— |
|
|
— |
|
|
13,441 |
|
|
— |
|
|
13,441 |
|
|
— |
|
|
Repurchase of Class A-2 interests |
|
— |
|
|
— |
|
— |
|
|
— |
|
— |
|
|
— |
|
— |
|
|
— |
|
|
— |
|
— |
|
|
— |
|
(88,319) |
|
|
(573) |
|
|
— |
|
|
— |
|
|
(573) |
|
|
— |
|
|
(573) |
|
|
— |
|
|
Distribution to members |
|
— |
|
|
— |
|
— |
|
|
— |
|
— |
|
|
— |
|
— |
|
|
— |
|
|
— |
|
— |
|
|
— |
|
— |
|
|
(245,517) |
|
|
(187,883) |
|
|
— |
|
|
(433,400) |
|
|
— |
|
|
(433,400) |
|
|
— |
|
|
Foreign exchange translation adjustment |
|
— |
|
|
— |
|
— |
|
|
— |
|
— |
|
|
— |
|
— |
|
|
— |
|
|
— |
|
— |
|
|
— |
|
— |
|
|
— |
|
|
— |
|
|
1,382 |
|
|
1,382 |
|
|
— |
|
|
1,382 |
|
|
— |
|
|
Net income |
|
— |
|
|
— |
|
— |
|
|
— |
|
— |
|
|
— |
|
— |
|
|
— |
|
|
— |
|
— |
|
|
— |
|
— |
|
|
— |
|
|
182,203 |
|
|
— |
|
|
182,203 |
|
|
— |
|
|
182,203 |
|
|
— |
|
|
Balance at December 31, 2013 |
|
— |
|
|
— |
|
— |
|
|
— |
|
— |
|
|
— |
|
— |
|
|
— |
|
|
— |
|
1,964,826 |
|
$ |
19,648 |
|
99,459,345 |
|
$ |
256,340 |
|
$ |
(74,027) |
|
$ |
1,327 |
|
$ |
203,288 |
|
$ |
— |
|
$ |
203,288 |
|
$ |
250,000 |
|
|
Share based compensation |
|
— |
|
|
— |
|
— |
|
|
— |
|
— |
|
|
— |
|
— |
|
|
— |
|
|
— |
|
— |
|
|
— |
|
1,992,556 |
|
|
15,953 |
|
|
— |
|
|
— |
|
|
15,953 |
|
|
— |
|
|
15,953 |
|
|
— |
|
|
Repurchase of Class A-2 interests |
|
— |
|
|
— |
|
— |
|
|
— |
|
— |
|
|
— |
|
— |
|
|
— |
|
|
— |
|
— |
|
|
— |
|
(1,596,235) |
|
|
(2,295) |
|
|
(4,621) |
|
|
— |
|
|
(6,916) |
|
|
— |
|
|
(6,916) |
|
|
— |
|
|
Issuance of Class A-2 interests |
|
— |
|
|
— |
|
— |
|
|
— |
|
— |
|
|
— |
|
— |
|
|
— |
|
|
— |
|
— |
|
|
— |
|
— |
|
|
— |
|
|
— |
|
|
— |
|
|
— |
|
|
— |
|
|
— |
|
|
— |
|
|
Temasek transaction described in Note 13 |
|
— |
|
|
— |
|
— |
|
|
— |
|
— |
|
|
— |
|
— |
|
|
— |
|
|
— |
|
— |
|
|
— |
|
— |
|
|
17,707 |
|
|
(62,140) |
|
|
— |
|
|
(44,433) |
|
|
— |
|
|
(44,433) |
|
|
44,433 |
|
|
Repurchase of Class A-1 interests |
|
— |
|
|
— |
|
— |
|
|
— |
|
— |
|
|
— |
|
— |
|
|
— |
|
|
— |
|
— |
|
|
— |
|
— |
|
|
— |
|
|
— |
|
|
— |
|
|
— |
|
|
— |
|
|
— |
|
|
— |
|
|
Issuance of Class A-1 interests |
|
— |
|
|
— |
|
— |
|
|
— |
|
— |
|
|
— |
|
— |
|
|
— |
|
|
— |
|
— |
|
|
— |
|
— |
|
|
— |
|
|
— |
|
|
— |
|
|
— |
|
|
— |
|
|
— |
|
|
— |
|
|
Distribution to members |
|
— |
|
|
— |
|
— |
|
|
— |
|
— |
|
|
— |
|
— |
|
|
— |
|
|
— |
|
— |
|
|
— |
|
— |
|
|
— |
|
|
(140,652) |
|
|
— |
|
|
(140,652) |
|
|
— |
|
|
(140,652) |
|
|
— |
|
|
Foreign exchange translation adjustment |
|
— |
|
|
— |
|
— |
|
|
— |
|
— |
|
|
— |
|
— |
|
|
— |
|
|
— |
|
— |
|
|
— |
|
— |
|
|
— |
|
|
— |
|
|
(5,032) |
|
|
(5,032) |
|
|
— |
|
|
(5,032) |
|
|
— |
|
|
Net income |
|
— |
|
|
— |
|
— |
|
|
— |
|
— |
|
|
— |
|
— |
|
|
— |
|
|
— |
|
— |
|
|
— |
|
— |
|
|
— |
|
|
190,057 |
|
|
— |
|
|
190,057 |
|
|
— |
|
|
190,057 |
|
|
— |
|
|
Balance at December 31, 2014 |
|
— |
|
$ |
— |
|
— |
|
$ |
— |
|
— |
|
$ |
— |
|
— |
|
$ |
— |
|
$ |
— |
|
1,964,826 |
|
$ |
19,648 |
|
99,855,666 |
|
$ |
287,705 |
|
$ |
(91,383) |
|
$ |
(3,705) |
|
$ |
212,265 |
|
$ |
— |
|
$ |
212,265 |
|
$ |
294,433 |
|
|
Share based compensation through April 15, 2015 |
|
— |
|
|
— |
|
— |
|
|
— |
|
— |
|
|
— |
|
— |
|
|
— |
|
|
— |
|
— |
|
|
— |
|
6,418 |
|
|
438 |
|
|
— |
|
|
— |
|
|
438 |
|
|
— |
|
|
438 |
|
|
— |
|
|
Repurchase of Class A-2 interests |
|
— |
|
|
— |
|
— |
|
|
— |
|
— |
|
|
— |
|
— |
|
|
— |
|
|
— |
|
— |
|
|
— |
|
(13,495) |
|
|
(97) |
|
|
— |
|
|
— |
|
|
(97) |
|
|
— |
|
|
(97) |
|
|
— |
|
|
Distribution to members through April 15, 2015 |
|
— |
|
|
— |
|
— |
|
|
— |
|
— |
|
|
— |
|
— |
|
|
— |
|
|
— |
|
— |
|
|
— |
|
— |
|
|
— |
|
|
(130,000) |
|
|
— |
|
|
(130,000) |
|
|
— |
|
|
(130,000) |
|
|
— |
|
|
Comprehensive income through April 15, 2015: |
|
|
|
|
|
|
|
|
|
|
|
|
|
|
|
|
|
|
|
|
|
|
|
|
|
|
|
|
|
|
|
|
|
|
|
|
|
|
|
|
|
|
|
|
|
|
|
|
|
|
|
|
|
Net income |
|
— |
|
|
— |
|
— |
|
|
— |
|
— |
|
|
— |
|
— |
|
|
— |
|
|
— |
|
— |
|
|
— |
|
— |
|
|
— |
|
|
83,147 |
|
|
— |
|
|
83,147 |
|
|
— |
|
|
83,147 |
|
|
— |
|
|
Foreign exchange translation adjustment |
|
— |
|
|
— |
|
— |
|
|
— |
|
— |
|
|
— |
|
— |
|
|
— |
|
|
— |
|
— |
|
|
— |
|
— |
|
|
— |
|
|
— |
|
|
(4,633) |
|
|
(4,633) |
|
|
— |
|
|
(4,633) |
|
|
— |
|
|
Reorganization of equity structure |
|
18,763,664 |
|
|
— |
|
36,746,041 |
|
|
— |
|
79,610,490 |
|
|
1 |
|
— |
|
|
— |
|
|
63,261 |
|
(1,964,826) |
|
|
(19,648) |
|
(99,848,589) |
|
|
(288,046) |
|
|
138,236 |
|
|
8,338 |
|
|
(97,858) |
|
|
392,291 |
|
|
294,433 |
|
|
(294,433) |
|
|
Balance post-reorganization |
|
18,763,664 |
|
|
— |
|
36,746,041 |
|
|
— |
|
79,610,490 |
|
|
1 |
|
— |
|
|
— |
|
|
63,261 |
|
— |
|
|
— |
|
— |
|
|
— |
|
|
— |
|
|
— |
|
|
63,262 |
|
|
392,291 |
|
|
455,553 |
|
|
— |
|
|
Issuance of Common Stock, net of offering costs |
|
19,012,112 |
|
|
— |
|
— |
|
|
— |
|
— |
|
|
— |
|
— |
|
|
— |
|
|
327,366 |
|
— |
|
|
— |
|
— |
|
|
— |
|
|
— |
|
|
— |
|
|
327,366 |
|
|
— |
|
|
327,366 |
|
|
— |
|
|
Repurchase of Virtu Financial Units and Corresponding number of Class A and C Common Stock |
|
(3,470,724) |
|
|
— |
|
(12,214,224) |
|
|
— |
|
— |
|
|
— |
|
— |
|
|
— |
|
|
(277,153) |
|
— |
|
|
— |
|
— |
|
|
— |
|
|
— |
|
|
— |
|
|
(277,153) |
|
|
— |
|
|
(277,153) |
|
|
— |
|
|
Share based compensation vested upon the IPO |
|
— |
|
|
— |
|
— |
|
|
— |
|
— |
|
|
— |
|
— |
|
|
— |
|
|
44,908 |
|
— |
|
|
— |
|
— |
|
|
— |
|
|
— |
|
|
— |
|
|
44,908 |
|
|
— |
|
|
44,908 |
|
|
— |
|
|
Adjustments for changes in proportionate ownership in Virtu Financial |
|
— |
|
|
— |
|
— |
|
|
— |
|
— |
|
|
— |
|
— |
|
|
— |
|
|
(22,513) |
|
— |
|
|
— |
|
— |
|
|
— |
|
|
— |
|
|
— |
|
|
(22,513) |
|
|
22,513 |
|
|
— |
|
|
— |
|
|
Issuance of tax receivable agreements |
|
— |
|
|
— |
|
— |
|
|
— |
|
— |
|
|
— |
|
— |
|
|
— |
|
|
(23,041) |
|
— |
|
|
— |
|
— |
|
|
— |
|
|
— |
|
|
— |
|
|
(23,041) |
|
|
— |
|
|
(23,041) |
|
|
— |
|
|
Share based compensation after April 15, 2015 |
|
576,693 |
|
|
— |
|
— |
|
|
— |
|
— |
|
|
— |
|
— |
|
|
— |
|
|
19,278 |
|
— |
|
|
— |
|
— |
|
|
— |
|
|
— |
|
|
— |
|
|
19,278 |
|
|
— |
|
|
19,278 |
|
|
— |
|
|
Repurchase of Class C common stock |
|
— |
|
|
— |
|
(57,106) |
|
|
— |
|
— |
|
|
— |
|
— |
|
|
— |
|
|
(1,368) |
|
— |
|
|
— |
|
— |
|
|
— |
|
|
— |
|
|
— |
|
|
(1,368) |
|
|
— |
|
|
(1,368) |
|
|
— |
|
|
Treasury stock purchases |
|
— |
|
|
— |
|
— |
|
|
— |
|
— |
|
|
— |
|
(169,649) |
|
|
(3,819) |
|
|
— |
|
— |
|
|
— |
|
— |
|
|
— |
|
|
— |
|
|
— |
|
|
(3,819) |
|
|
— |
|
|
(3,819) |
|
|
— |
|
|
Comprehensive income, after April 15, 2015: |
|
— |
|
|
— |
|
— |
|
|
— |
|
— |
|
|
— |
|
— |
|
|
— |
|
|
— |
|
— |
|
|
— |
|
— |
|
|
— |
|
|
— |
|
|
— |
|
|
— |
|
|
— |
|
|
— |
|
|
— |
|
|
Net income |
|
— |
|
|
— |
|
— |
|
|
— |
|
— |
|
|
— |
|
— |
|
|
— |
|
|
— |
|
— |
|
|
— |
|
— |
|
|
— |
|
|
20,887 |
|
|
— |
|
|
20,887 |
|
|
93,456 |
|
|
114,343 |
|
|
— |
|
|
Foreign exchange translation adjustment |
|
— |
|
|
— |
|
— |
|
|
— |
|
— |
|
|
— |
|
— |
|
|
— |
|
|
— |
|
— |
|
|
— |
|
— |
|
|
— |
|
|
— |
|
|
99 |
|
|
99 |
|
|
279 |
|
|
378 |
|
|
— |
|
|
Distribution from Virtu Financial to non-controlling interest, after April 15, 2015 |
|
— |
|
|
— |
|
— |
|
|
— |
|
— |
|
|
— |
|
— |
|
|
— |
|
|
— |
|
— |
|
|
— |
|
— |
|
|
— |
|
|
— |
|
|
— |
|
|
— |
|
|
(81,377) |
|
|
(81,377) |
|
|
— |
|
|
Dividends to Class A shareholders |
|
— |
|
|
— |
|
— |
|
|
— |
|
— |
|
|
— |
|
— |
|
|
— |
|
|
— |
|
— |
|
|
— |
|
— |
|
|
— |
|
|
(17,362) |
|
|
— |
|
|
(17,362) |
|
|
— |
|
|
(17,362) |
|
|
— |
|
|
Issuance of common stock in connection with secondary offering, net of offering costs |
|
3,498,113 |
|
|
— |
|
— |
|
|
— |
|
— |
|
|
— |
|
— |
|
|
— |
|
|
7,782 |
|
— |
|
|
— |
|
— |
|
|
— |
|
|
— |
|
|
— |
|
|
7,782 |
|
|
— |
|
|
7,782 |
|
|
— |
|
|
Repurchase of Virtu Financial Units and corresponding number of Class A and C common stock in connection with secondary offering |
|
— |
|
|
— |
|
(3,498,113) |
|
|
— |
|
— |
|
|
— |
|
— |
|
|
— |
|
|
(8,805) |
|
— |
|
|
— |
|
— |
|
|
— |
|
|
— |
|
|
— |
|
|
(8,805) |
|
|
— |
|
|
(8,805) |
|
|
— |
|
|
Issuance of tax receivable agreements in connection with secondary offering |
|
— |
|
|
— |
|
— |
|
|
— |
|
— |
|
|
— |
|
— |
|
|
— |
|
|
1,187 |
|
— |
|
|
— |
|
— |
|
|
— |
|
|
— |
|
|
— |
|
|
1,187 |
|
|
— |
|
|
1,187 |
|
|
— |
|
|
Balance at December 31, 2015 |
|
38,379,858 |
|
$ |
— |
|
20,976,598 |
|
$ |
— |
|
79,610,490 |
|
$ |
1 |
|
(169,649) |
|
$ |
(3,819) |
|
$ |
130,902 |
|
— |
|
$ |
— |
|
— |
|
$ |
— |
|
$ |
3,525 |
|
$ |
99 |
|
$ |
130,708 |
|
$ |
427,162 |
|
$ |
557,870 |
|
$ |
— |
|
See accompanying notes to the consolidated financial statements.
71
Virtu Financial, Inc. and Subsidiaries
Consolidated Statements of Cash Flows
|
|
|
For the Years ended December 31, |
|
|||||||
|
(in thousands) |
|
2015 |
|
2014 |
|
2013 |
|
|||
|
Cash flows from operating activities |
|
|
|
|
|
|
|
|
|
|
|
Net Income |
|
$ |
197,490 |
|
$ |
190,057 |
|
$ |
182,203 |
|
|
|
|
|
|
|
|
|
|
|
|
|
|
Adjustments to reconcile net income to net cash provided by operating activities: |
|
|
|
|
|
|
|
|
|
|
|
Depreciation and amortization |
|
|
33,629 |
|
|
30,441 |
|
|
23,922 |
|
|
Amortization of purchased intangibles and acquired capitalized software |
|
|
211 |
|
|
211 |
|
|
1,011 |
|
|
Debt issue cost related to debt refinancing |
|
|
— |
|
|
— |
|
|
10,022 |
|
|
Amortization of debt issuance costs and deferred financing fees |
|
|
1,755 |
|
|
1,334 |
|
|
3,861 |
|
|
Termination of office leases |
|
|
1,380 |
|
|
— |
|
|
— |
|
|
Share based compensation |
|
|
61,878 |
|
|
14,234 |
|
|
13,441 |
|
|
Reserve for legal matter |
|
|
5,440 |
|
|
— |
|
|
— |
|
|
Equipment writeoff |
|
|
559 |
|
|
378 |
|
|
1,968 |
|
|
Deferred taxes |
|
|
3,985 |
|
|
— |
|
|
— |
|
|
Other |
|
|
219 |
|
|
(2,204) |
|
|
240 |
|
|
Changes in operating assets and liabilities: |
|
|
|
|
|
|
|
|
|
|
|
Securities borrowed |
|
|
31,638 |
|
|
223,169 |
|
|
(278,784) |
|
|
Securities purchased under agreements to resell |
|
|
16,482 |
|
|
131,145 |
|
|
(92,526) |
|
|
Receivables from broker dealers and clearing organizations |
|
|
(88,884) |
|
|
40,089 |
|
|
(61,598) |
|
|
Trading assets, at fair value |
|
|
247,094 |
|
|
259,105 |
|
|
(290,848) |
|
|
Other assets ($5,984, $8,205, and $0, at fair value, as of December 31, 2015, 2014, and 2013, respectively) |
|
|
(5,796) |
|
|
2,751 |
|
|
(665) |
|
|
Securities loaned |
|
|
26,741 |
|
|
(531,450) |
|
|
291,984 |
|
|
Securities sold under agreements to repurchase |
|
|
(2,006) |
|
|
(8,877) |
|
|
(4,051) |
|
|
Payables to broker dealers and clearing organizations |
|
|
(199,599) |
|
|
155,974 |
|
|
277,721 |
|
|
Trading liabilities, at fair value |
|
|
(58,544) |
|
|
(240,778) |
|
|
180,952 |
|
|
Accounts payable and accrued expenses and other liabilities |
|
|
(13,392) |
|
|
7,120 |
|
|
508 |
|
|
Net cash provided by operating activities |
|
|
260,280 |
|
|
272,699 |
|
|
259,361 |
|
|
|
|
|
|
|
|
|
|
|
|
|
|
Cash flows from investing activities |
|
|
|
|
|
|
|
|
|
|
|
Development of capitalized software |
|
|
(8,028) |
|
|
(8,039) |
|
|
(10,085) |
|
|
Acquisition of property and equipment |
|
|
(16,271) |
|
|
(28,120) |
|
|
(21,931) |
|
|
Net cash used in investing activities |
|
|
(24,299) |
|
|
(36,159) |
|
|
(32,016) |
|
|
|
|
|
|
|
|
|
|
|
|
|
|
Cash flows from financing activities |
|
|
|
|
|
|
|
|
|
|
|
Distribution to members through April 15, 2015 |
|
|
(130,000) |
|
|
(140,652) |
|
|
(433,400) |
|
|
Distribution from Virtu Financial to non-controlling interest, after April 15, 2015 |
|
|
(81,377) |
|
|
— |
|
|
— |
|
|
Dividends to Class A shareholders |
|
|
(17,362) |
|
|
— |
|
|
— |
|
|
Proceeds from issuance of Class A-2 interests in connection with the Temasek transaction described in Note 13 |
|
|
— |
|
|
3,048 |
|
|
— |
|
|
Repurchase of Class A-2 interests in connection with the Temasek transaction described in Note 13 |
|
|
— |
|
|
(3,048) |
|
|
— |
|
|
Repurchase of Class A-2 interests |
|
|
(2,097) |
|
|
(916) |
|
|
(573) |
|
|
Purchase of treasury stock |
|
|
(3,819) |
|
|
— |
|
|
— |
|
|
Proceeds from short term borrowings |
|
|
45,000 |
|
|
— |
|
|
— |
|
|
Repayments of short term borrowings |
|
|
— |
|
|
(72,800) |
|
|
(7,200) |
|
|
Proceeds from senior secured credit facility |
|
|
— |
|
|
— |
|
|
253,792 |
|
|
Repayment of senior secured credit facility |
|
|
(2,914) |
|
|
(7,286) |
|
|
(6,717) |
|
|
Debt issuance costs |
|
|
(976) |
|
|
— |
|
|
(8,597) |
|
|
Issuance of Common Stock, net of offering costs |
|
|
327,366 |
|
|
— |
|
|
— |
|
|
Repurchase of Virtu Financial Units and corresponding number of Class A and C Common Stock |
|
|
(277,153) |
|
|
— |
|
|
— |
|
|
Issuance of common stock in connection with secondary offering, net of offering costs |
|
|
7,782 |
|
|
— |
|
|
— |
|
|
Repurchase of Virtu Financial Units and corresponding number of Class A and C common stock in connection with secondary offering |
|
|
(8,805) |
|
|
— |
|
|
— |
|
|
Net cash used in financing activities |
|
|
(144,355) |
|
|
(221,654) |
|
|
(202,695) |
|
|
|
|
|
|
|
|
|
|
|
|
|
|
Effect of exchange rate changes on Cash and cash equivalents |
|
|
(4,255) |
|
|
(5,032) |
|
|
1,382 |
|
|
|
|
|
|
|
|
|
|
|
|
|
|
Net increase in Cash and cash equivalents |
|
|
87,371 |
|
|
9,854 |
|
|
26,032 |
|
72
|
Cash and cash equivalents, beginning of period |
|
|
75,864 |
|
|
66,010 |
|
|
39,978 |
|
|
Cash and cash equivalents, end of period |
|
$ |
163,235 |
|
$ |
75,864 |
|
$ |
66,010 |
|
|
|
|
|
|
|
|
|
|
|
|
|
|
Supplementary disclosure of cash flow information |
|
|
|
|
|
|
|
|
|
|
|
Cash paid for interest |
|
$ |
63,230 |
|
$ |
61,293 |
|
$ |
44,848 |
|
|
Cash paid for taxes |
|
$ |
12,875 |
|
$ |
3,764 |
|
$ |
4,559 |
|
|
|
|
|
|
|
|
|
|
|
|
|
|
Non-cash investing activities |
|
|
|
|
|
|
|
|
|
|
|
Compensation to developers subject to capitalization of software (of which $11,278, $1,719 and $1,633 were capitalized for the years ended December 31, 2015, 2014, and 2013, respectively) |
|
|
25,684 |
|
|
5,112 |
|
|
4,459 |
|
|
|
|
|
|
|
|
|
|
|
|
|
|
Non-cash financing activities |
|
|
|
|
|
|
|
|
|
|
|
Tax receivable agreement described in Note 4 |
|
$ |
(21,854) |
|
$ |
— |
|
$ |
— |
|
|
Discount on issuance of senior secured credit facility |
|
|
— |
|
|
— |
|
|
2,925 |
|
|
Secondary offering described in Note 13 |
|
|
— |
|
|
— |
|
|
— |
|
|
Temasek transaction described in Note 13 |
|
|
— |
|
|
— |
|
|
— |
|
|
Repurchase of Class A-2 interests |
|
|
— |
|
|
(6,000) |
|
|
— |
|
See accompanying notes to the consolidated financial statements.
73
Virtu Financial, Inc. and Subsidiaries
Notes to Consolidated Financial Statements
(dollars in thousands, except shares and per share amounts, unless otherwise noted)
1. Organization and Basis of Presentation
Organization
The accompanying consolidated financial statements include the accounts and operations of Virtu Financial, Inc. (“VFI” or, collectively with its wholly owned or controlled subsidiaries, the ‘‘Company’’) beginning with its initial public offering ("IPO") in April of 2015, along with the historical accounts and operations of Virtu Financial LLC (“Virtu Financial”) prior to VFI’s IPO. VFI is a Delaware corporation whose primary asset is its ownership of approximately 27.5% of the membership interests of Virtu Financial, which it acquired pursuant to and subsequent to certain reorganization transactions (the “Reorganization Transactions”) consummated in connection with its IPO. The Company is the sole managing member of Virtu Financial and operates and controls all of the businesses and affairs of Virtu Financial and, through Virtu Financial and its subsidiaries (the “Group”), continues to conduct the business now conducted by such subsidiaries.
Virtu Financial was formed as a Delaware limited liability company on April 8, 2011 in connection with a corporate reorganization and acquisition of the outstanding equity interests of Madison Tyler Holdings, LLC (“MTH”), an electronic trading firm and market maker. In connection with the reorganization, the members of Virtu Financial’s predecessor entity, Virtu Financial Operating LLC (“VFO”), a Delaware limited liability company formed on March 19, 2008, exchanged their interests in VFO for interests in Virtu Financial and the members of MTH exchanged their interests in MTH for cash and/or interests in Virtu Financial. Virtu Financial’s principal subsidiaries include Virtu Financial BD LLC (“VFBD”), a self-clearing U.S. broker-dealer, Virtu Financial Capital Markets LLC (“VFCM”), a dual-clearing U.S. broker-dealer (which means it self-clears its proprietary transactions and introduces the accounts of its affiliates and non-affiliated broker-dealers on an agency basis to other clearing firms that clear and settle transactions in those accounts) and designated market maker on the New York Stock Exchange (“NYSE”) and the NYSE MKT (formerly NYSE Amex), Virtu Financial Global Markets LLC (“VFGM”), a U.S. trading entity focused on futures and currencies, Virtu Financial Ireland Limited (“VFIL”), formed in Ireland, Virtu Financial Asia Pty Ltd (“VFAP”), formed in Australia, and Virtu Financial Singapore Pte. Ltd. (“VFSing”), formed in Singapore, each of which are trading entities focused on asset classes in their respective geographic regions.
The Company is a technology-enabled market maker and liquidity provider. The Company has developed a single, proprietary, multi-asset, multi-currency technology platform through which it provides quotations to buyers and sellers in equities, commodities, currencies, options, fixed income and other securities on numerous exchanges, markets and liquidity pools in numerous countries around the world.
The Company is managed and operated as one business. Accordingly, the Company operates under one reportable segment.
Basis of Presentation
These consolidated financial statements are presented in U.S. dollars and have been prepared pursuant to the rules and regulations of the U.S. Securities and Exchange Commission (“SEC”) regarding financial reporting with respect to Form 10-K and accounting standards generally accepted in the United States of America (“U.S. GAAP”) promulgated in the Financial Accounting Standards Board (“FASB”) Accounting Standards Codification (“ASC” or the “Codification”). The consolidated financial statements of the Company include its equity interests in Virtu Financial, and its subsidiaries. The Company operates and controls all business and affairs of Virtu Financial and its operating subsidiaries indirectly through its equity interest in Virtu Financial.
74
Principles of Consolidation, including Noncontrolling Interests
The consolidated financial statements include the accounts of VFI and its majority and wholly owned subsidiaries. As sole managing member of Virtu Financial, VFI exerts control over the Group’s operations. In accordance with ASC 810, Consolidation, the Company consolidates Virtu Financial and its subsidiaries’ consolidated financial statements and records the interests in Virtu Financial that VFI does not own as noncontrolling interests. All intercompany accounts and transactions have been eliminated in consolidation.
2. Summary of Significant Accounting Policies
Use of Estimates
The Company's consolidated financial statements are prepared in conformity with US GAAP, which require management to make estimates and assumptions regarding fair value measurements including trading assets and liabilities, goodwill and intangibles, compensation accruals, capitalized software, and other matters that affect the reported amounts of assets and liabilities and disclosure of contingent assets and liabilities at the date of the consolidated financial statements and the reported amounts of revenue and expenses during the reporting period. Accordingly, actual results could differ materially from those estimates.
Earnings Per Share
Earnings per share (“EPS”) is computed in accordance with ASC 260, Earnings per Share. Basic EPS is computed by dividing the net income available for common stockholders by the weighted average number of shares outstanding for that period. Diluted EPS is calculated by dividing the net income available for common stockholders by the diluted weighted average shares outstanding for that period. Diluted EPS includes the determinants of the basic EPS and, in addition, reflects the dilutive effect of shares of common stock estimated to be distributed in the future under the Company’s share based compensation plans, with no adjustments to net income available for common stockholders for dilutive potential common shares.
Cash and Cash Equivalents
The Company considers cash equivalents as highly liquid investments with original maturities of less than three months when acquired. The Company maintains cash in bank deposit accounts that, at times, may exceed federally insured limits.
Securities Borrowed and Securities Loaned
The Company conducts securities borrowing and lending activities with external counterparties. In connection with these transactions, the Company receives or posts collateral. These transactions are collateralized by cash or securities. In accordance with substantially all of its stock borrow agreements, the Company is permitted to sell or repledge the securities received. Securities borrowed or loaned are recorded based on the amount of cash collateral advanced or received. The initial collateral advanced or received generally approximates or is greater than 102% of the fair value of the underlying securities borrowed or loaned. The Company monitors the fair value of securities borrowed and loaned, and delivers or obtains additional collateral as appropriate. Receivables and payables with the same counterparty are not offset in the consolidated statements of financial condition. For these transactions, the interest received or paid by the Company is recorded gross on an accrual basis under interest and dividends income or interest and dividends expense in the consolidated statements of comprehensive income.
Securities Purchased Under Agreements to Resell and Securities Sold Under Agreements to Repurchase
In a repurchase agreement, securities sold under agreements to repurchase are treated as collateralized financing transactions and are recorded at contract value, plus accrued interest, which approximates fair value. It is the Company's policy that its custodian takes possession of the underlying collateral securities with a fair value approximately equal to
75
the principal amount of the repurchase transaction, including accrued interest. For reverse repurchase agreements, the Company typically requires delivery of collateral with a fair value approximately equal to the carrying value of the relevant assets in the consolidated statements of financial condition. To ensure that the fair value of the underlying collateral remains sufficient, the collateral is valued daily with additional collateral obtained or excess collateral returned, as permitted under contractual provisions.
The Company does not net securities purchased under agreements to resell transactions with securities sold under agreements to repurchase transactions entered into with the same counterparty.
Receivables from/Payables to Broker-dealers and Clearing Organizations
Amounts receivable from broker-dealers and clearing organizations may be restricted to the extent that they serve as deposits for securities sold, not yet purchased. At December 31, 2015 and 2014, receivables from and payables to broker-dealers and clearing organizations primarily represent amounts due for unsettled trades, open equity in futures transactions, securities failed to deliver or failed to receive, deposits with clearing organizations or exchanges and balances due from or due to prime brokers in relation to the Company’s trading. The Company presents its balances, including outstanding principal balances on all credit facilities, on a net basis by counterparty within receivable from and payable to broker-dealers and clearing organizations when the criteria for offsetting are met.
In the normal course of business, substantially all of the Company’s securities transactions, money balances, and security positions are transacted with several brokers. The Company is subject to credit risk to the extent any broker with whom it conducts business is unable to fulfill contractual obligations on its behalf. The Company’s management monitors the financial condition of such brokers and does not anticipate any losses from these counterparties.
Financial Instruments Owned Including Those Pledged as Collateral and Financial Instruments Sold, Not Yet Purchased
The Company carries financial instruments owned, including those pledged as collateral, and financial instruments sold, not yet purchased at fair value. Gains and losses arising from financial instrument transactions are recorded net on a trade-date basis in trading income, net, on the consolidated statements of comprehensive income.
Fair Value Measurements
At December 31, 2015 and 2014, substantially all of Company’s financial assets and liabilities, except for long-term borrowings and certain exchange memberships, were carried at fair value based on published market prices and are marked to market daily or were short-term in nature and were carried at amounts that approximate fair value.
The Company’s assets and liabilities have been categorized based upon a fair value hierarchy in accordance with ASC 820-10, Fair Value Measurements and Disclosures. ASC 820-10 defines fair value as the price that would be received to sell an asset or would be paid to transfer a liability (i.e., the exit price) in an orderly transaction between market participants at the measurement date. Fair value measurements are not adjusted for transaction costs. The recognition of ‘‘block discounts’’ for large holdings of unrestricted financial instruments where quoted prices are readily and regularly available in an active market is prohibited. ASC 820-10 requires a three level hierarchy which prioritizes the inputs to valuation techniques used to measure fair value. The hierarchy level assigned to each financial instrument is based on the assessment of the transparency and reliability of the inputs used in the valuation of such financial instruments at the measurement date based on the lowest level of input that is significant to the fair value measurement. The hierarchy gives the highest priority to unadjusted quoted prices in active markets for identical assets or liabilities (level 1 measurement) and the lowest priority to unobservable inputs (level 3 measurements).
Financial instruments measured and reported at fair value are classified and disclosed in one of the following categories based on inputs:
Level 1 — Unadjusted quoted prices in active markets that are accessible at the measurement date for identical, unrestricted assets or liabilities;
76
Level 2 — Quoted prices in markets that are not active and financial instruments for which all significant inputs are observable, either directly or indirectly;
Level 3 — Prices or valuations that require inputs that are both significant to the fair value measurement and unobservable.
Transfers in or out are recognized based on the beginning fair value of the period in which they occurred. There were no transfers of financial instruments between levels during the years ended December 31, 2015, 2014, and 2013.
Derivative Instruments
Derivative instruments used for trading purposes, including economic hedges of trading instruments, are carried at fair value. Fair values for exchange-traded derivatives, principally futures, are based on quoted market prices. Fair values for over-the-counter derivative instruments, principally forward contracts, are based on the values of the underlying financial instruments within the contract. The underlying derivative instruments are currencies which are actively traded. The Company presents its derivatives balances on a net basis by counterparty when the criteria for offsetting are met.
Derivative instruments used for economic hedging purposes include futures, forward contracts, and options. Unrealized gains or losses on these derivative instruments are recognized currently in the consolidated statements of comprehensive income as trading income, net. The Company does not apply hedge accounting as defined in ASC 815, Derivatives and Hedging, and accordingly unrealized gains or losses on these derivative instruments are recognized currently in the consolidated statements of comprehensive income as trading income, net.
Property and Equipment
Property and equipment are carried at cost, less accumulated depreciation, except for the assets acquired in connection with the acquisition of MTH which were recorded at fair value on the date of acquisition. Depreciation is provided using the straight-line method over estimated useful lives of the underlying asset. Routine maintenance, repairs and replacement costs are expensed as incurred and improvements that appreciably extend the useful life of the assets are capitalized. When property and equipment are sold or otherwise disposed of, the cost and related accumulated depreciation are removed from the accounts and any resulting gain or loss is recognized in income. Property and equipment are reviewed for impairment whenever events or changes in circumstances indicate that the related carrying amount may not be recoverable.
The useful lives of furniture, fixtures, equipment and leasehold improvements are as follows:
|
Furniture, fixtures and equipment |
|
3 |
to |
7 |
years |
|
|
Leasehold improvements |
|
7 |
years or length of lease term, whichever is shorter |
|
||
Capitalized Software
The Company accounts for the costs of computer software developed or obtained for internal use in accordance with ASC 350-40, Internal-Use Software. The Company capitalizes costs of materials, consultants, and payroll and payroll related costs for employees incurred in developing internal-use software. Costs incurred during the preliminary project and post-implementation stages are charged to expense.
Management’s judgment is required in determining the point at which various projects enter the stages at which costs may be capitalized, in assessing the ongoing value of the capitalized costs, and in determining the estimated useful lives over which the costs are amortized.
The Company’s capitalized software development costs excluding the charges recognized in relation to the IPO
77
disclosed below were approximately $10.1 million, $9.8 million, and $10.1 million for years ended December 31, 2015, 2014 and 2013, respectively. The related amortization expense was approximately $9.6 million, $10.4 million, and $11.0 million for the years ended December 31, 2015, 2014, and 2013, respectively.
Additionally, in connection with charges related to share based compensation recognized upon the IPO (Note 13), the Company capitalized and amortized costs for employees in developing internal-use software, which were included within charges related to share based compensation at IPO in the consolidated statements of comprehensive income. The Company capitalized charges related to share based compensation at IPO of approximately $9.2 million for the year ended December 31, 2015. The related amortization expense was approximately $8.5 million for the year ended December 31, 2015.
Capitalized software development costs and related accumulated amortization are included in property, equipment and capitalized software on the accompanying consolidated statements of financial condition and are amortized over a period of 1.4 to 2.5 years, which represents the estimated useful lives of the underlying software.
Goodwill
Goodwill represents the excess of the purchase price over the underlying net tangible and intangible assets of our acquisitions. Goodwill is not amortized but is tested for impairment on an annual basis and between annual tests whenever events or changes in circumstances indicate that the carrying amount may not be recoverable. Goodwill is tested at the reporting unit level, which is defined as an operating segment or one level below the operating segment. The Company operates as one operating segment, which is our only reporting unit.
The goodwill impairment test is a two-step process. The first step is used to identify potential impairment and compares the fair value of a reporting unit with its carrying amount, including goodwill. If the carrying amount of a reporting unit exceeds its fair value, the second step of the goodwill impairment test must be performed. The second step is used to measure the amount of impairment loss, if any, and compares the implied fair value of reporting unit goodwill with the carrying amount of that goodwill. If the carrying amount of reporting unit goodwill exceeds the implied fair value of that goodwill, an impairment loss must be recognized in an amount equal to that excess.
The Company tests goodwill for impairment on an annual basis on July 1 and on an interim basis when certain events or circumstances exist. In the impairment test as of July 1, 2015, the primary valuation method used to estimate the fair value of the Company’s reporting unit was the market capitalization approach based on the market price of its Class A Common Stock, which the management believes to be an appropriate indicator of its fair value. In the impairment test as of July 1, 2014, the primary valuation methods used to estimate the fair value of the Company’s reporting unit were the income and market approaches. In applying the income approach, projected available cash flows and the terminal value were discounted to present value to derive an indication of fair value of the business enterprise. The market approach compared the reporting unit to selected reasonably similar publicly-traded companies.
Based on the results of the annual impairment tests performed, no goodwill impairment was recognized during the years ended December 31, 2015, 2014, and 2013, respectively.
Intangible Assets
The Company amortizes finite-lived intangible assets over their estimated useful lives. Finite-lived intangible assets are tested for impairment annually or when impairment indicators are present, and if impaired, written down to fair value.
Exchange Memberships and Stock
Exchange memberships are recorded at cost or, if any other than temporary impairment in value has occurred, at a value that reflects management’s estimate of fair value, in accordance with ASC 940-340, Financial Services — Broker and Dealers. Exchange stock includes shares that entitles the Company to certain trading privileges. The shares are marked to market with the corresponding gain or loss recorded in the consolidated statements of comprehensive income.
78
The Company’s exchange memberships and stock are included in other assets on the consolidated statements of financial condition.
Trading Income
Trading income is comprised of changes in the fair value of trading assets and liabilities (i.e., unrealized gains and losses) and realized gains and losses on trading assets and liabilities. Trading gains and losses on financial instruments owned and financial instruments sold, not yet purchased are recorded on the trade date and reported on a net basis in the consolidated statements of comprehensive income.
Interest and Dividends Income/Interest and Dividends Expense
Interest income and interest expense are accrued in accordance with contractual rates. Interest income consists of interest earned on collateralized financing arrangements and on cash held by brokers. Interest expense includes interest expense from collateralized transactions, margin and related lines of credit. Dividends on financial instruments owned including those pledged as collateral and financial instruments sold, not yet purchased are recorded on the ex-dividend date and interest is recognized on the accrual basis.
Technology Services
Technology services revenues consist of fees paid by third parties for licensing of our proprietary risk management and trading infrastructure technology and provision of associated management and hosting services. These fees include both upfront and annual recurring fees. Revenue from technology services is recognized once persuasive evidence of an arrangement exists, delivery has occurred, the fee is fixed or determinable and collectability is probable. Revenue is recognized ratably over the contractual service period.
Rebates
Rebates consist of volume discounts, credits or payments received from exchanges or other market places related to the placement and/or removal of liquidity from the order flow in the marketplace. Rebates are recorded on an accrual basis and included net within brokerage, exchange and clearance fees in the accompanying consolidated statements of comprehensive income.
Income Taxes
Subsequent to consummation of the Reorganization Transactions and the IPO, the Company is subject to U.S. federal, state and local income taxes on its taxable income. The Company's subsidiaries are subject to income taxes in the respective jurisdictions (including foreign jurisdictions) in which they operate. Prior to the consummation of the Reorganization Transactions and the IPO, no provision for United States federal, state and local income tax was required, as Virtu Financial is a limited liability company and is treated as a pass-through entity for United States federal, state, and local income tax purposes.
The provision for income tax is comprised of current tax and deferred tax. Current tax represents the tax on current year tax returns, using tax rates enacted at the balance sheet date. The deferred tax assets are recognized in full and then reduced by a valuation allowance if it is more likely than not that some or all of the deferred tax assets will not be recognized.
The Company recognizes the tax benefit from an uncertain tax position, in accordance with ASC 740, Income Taxes only if it is more likely than not that the tax position will be sustained on examination by the applicable taxing authority, including resolution of the appeals or litigation processes, based on the technical merits of the position. The tax benefits recognized in the consolidated financial statements from such a position are measured based on the largest benefit for each such position that has a greater than fifty percent likelihood of being realized upon ultimate resolution. Many factors are considered when evaluating and estimating the tax positions and tax benefits. Such estimates involve interpretations of regulations, rulings, case law, etc. and are inherently complex. The Company’s estimates may require
79
periodic adjustments and may not accurately anticipate actual outcomes as resolution of income tax treatments in individual jurisdictions typically would not be known for several years after completion of any fiscal year. The Company has determined that there are no uncertain tax positions that would have a material impact on the Company’s financial position as of December 31, 2015 and 2014 or the results of operations or cash flows for the years ended December 31, 2015, 2014, and 2013.
Comprehensive Income and Foreign Currency Translation
The Company’s operating results are reported in the consolidated statements of comprehensive income pursuant to Accounting Standards Update 2011-05, Comprehensive Income.
Comprehensive income consists of two components: net income and other comprehensive income (“OCI”). OCI is comprised of revenues, expenses, gains and losses that are reported in the comprehensive income section of the consolidated statements of comprehensive income, but are excluded from reported net income. The Company’s OCI is comprised of foreign currency translation adjustments. Assets and liabilities of operations having non-U.S. dollar functional currencies are translated at period-end exchange rates, and income statement accounts are translated at weighted average exchange rates for the period. Gains and losses resulting from translating foreign currency financial statements, net of related tax effects, are reflected in other comprehensive income, a separate component of members’ equity.
Share-Based Compensation
The Company accounts for share-based compensation transactions with employees under the provisions of ASC 718, Compensation: Stock Compensation. Share-based compensation transactions with employees are measured based on the fair value of equity instruments issued.
The fair value of awards issued for compensation prior to the Reorganization Transactions and the IPO was determined by management, with the assistance of an independent third party valuation firm, using a projected annual forfeiture rate, where applicable, on the date of grant.
Share-based awards issued for compensation in connection with or subsequent to the Reorganization Transaction and the IPO pursuant to the VFI 2015 Management Incentive Plan (the “2015 Management Incentive Plan”) were in the form of stock options, Class A common stock and restricted stock units. The fair value of the stock option grants are determined through the application of the Black-Scholes-Merton model. The fair value of the Class A common stock and restricted stock units are determined based on the volume weighted average price for the three days preceding the grant, and with respect to the restricted stock units, a projected annual forfeiture rate. The fair value of share-based awards granted to employees is expensed based on the vesting conditions and are recognized on a straight line basis over the vesting period. The Company records as treasury stock shares repurchased from its employees for the purpose of settling tax liabilities incurred upon the issuance of common stock, the vesting of restricted stock units or the exercise of stock options.
Recent Accounting Pronouncements
Revenue - In May 2014, the FASB issued ASU No. 2014-09, Revenue from Contracts with Customers. ASU 2014-09 is a comprehensive new revenue recognition model that requires a company to recognize revenue to depict the transfer of goods or services to a customer at an amount that reflects the consideration it expects to receive in exchange for those goods or services. ASU 2014-09 also requires additional disclosure about the nature, amount, timing and uncertainty of revenue and cash flows arising from customer contracts, including significant judgments and changes in judgments and assets recognized from costs incurred to obtain or fulfill a contract. In August 2015, the FASB issued ASU No. 2015-14, Revenue from Contracts with Customers (Topic 606): Deferral of the Effective Date. ASU No. 2015-14 defers the effective date of ASU No. 2014-09 by one year for public companies. ASU 2015-14 applies to annual reporting periods beginning after December 15, 2017, including interim reporting periods within that reporting period. Early adoption is permitted only as of annual reporting periods beginning after December 15, 2016, including interim
80
reporting periods within that reporting period. The Company has not yet determined the potential effects of the adoption of ASU 2014-09 and ASU 2015-14 on its consolidated financial statements.
Repurchase Agreements - In June 2014, the FASB released ASU No. 2014-11, Repurchase-to-Maturity Transactions, Repurchase Financings, and Disclosures. The amendment changes the accounting for repurchase financing transactions and for repurchase-to-maturity transactions to secured borrowing accounting. The accounting changes were effective for the Company beginning in the first quarter of 2015. The effect of the accounting changes on transactions outstanding as of the effective date is required to be presented as a cumulative effect adjustment to retained earnings as of January 1, 2015. The amendment also requires additional disclosures for repurchase agreements and securities lending transactions regarding the class of collateral pledged and the remaining contractual maturity of the agreements, as well as a discussion on the potential risks associated with the agreements and the related collateral pledged, as well as how those risks are managed. Additional disclosures are required for repurchase agreements, securities lending transactions, sales with a total return swap, and other similar transfers of financial assets that are accounted for as a sale. The ASU did not have an impact on the Company’s consolidated financial statements except for the additional disclosures stated in Note 9.
Compensation - In June 2014, the Emerging Issues Task Force (the ‘‘EITF’’) of the FASB issued ASU 2014-12, Accounting for Share-Based Payments When the Terms of an Award Provide That a Performance Target Could Be Achieved after the Requisite Service Period. The amendment requires that a performance target that affects vesting and that could be achieved after the requisite service period be treated as a performance condition. The ASU is effective for annual periods and interim periods within those annual periods beginning after December 15, 2015 (fiscal year 2016 for the Company). Earlier adoption is permitted. This ASU is not expected to have an impact on the Company’s consolidated financial statements.
Going Concern — In August 2014, the FASB issued ASU 2014-15, Disclosure of Uncertainties about an Entity’s Ability to Continue as a Going Concern. The guidance will explicitly require management to assess an entity’s ability to continue as a going concern and to provide related footnote disclosures in certain circumstances. The new standard will be effective in the first annual period ending after December 15, 2016 (fiscal year 2017 for the Company). Earlier adoption is permitted. The Company will implement this new standard on the required effective date. This ASU is not expected to have an impact on the Company’s consolidated financial statements.
Hybrid Financial Instruments — In November 2014, the EITF of the FASB issued ASU 2014-16, Determining Whether the Host Contract in a Hybrid Financial Instrument Issued in the Form of a Share is More Akin to Debt or to Equity. The ASU requires that for hybrid financial instruments issued in the form of a share, an entity should determine the nature of the host contract by considering all stated and implied substantive terms and features of the hybrid financial instrument, weighing each term and feature on the basis of relevant facts and circumstances. An entity should use judgment based on an evaluation of all the relevant terms and features, and should consider the economic characteristics and risks of the entire hybrid financial instrument, including the embedded derivative feature that is being evaluated for separate accounting from the host contract. The ASU is effective for public business entities for fiscal years, and interim periods within those fiscal years, beginning after December 15, 2015. Early adoption, including adoption in an interim period, is permitted. This ASU did not have an impact on the Company’s consolidated financial statements.
Debt Issuance Costs — In April 2015, the FASB issued ASU 2015-03, Simplifying the Presentation of Debt Issuance Costs. The ASU requires that debt issuance costs related to a recognized debt liability be presented in the balance sheet as a direct deduction from the carrying amount of that debt liability, consistent with debt discounts, rather than as a deferred charge asset. The ASU is effective for financial statements issued for fiscal years beginning after December 15, 2015 (fiscal year 2016 for the Company), and interim periods within those fiscal years. Early adoption of the amendment is permitted and the Company has elected to early adopt this ASU effective as of March 31, 2015. The new guidance has been applied on a retrospective basis, wherein the accompanying consolidated statements of financial condition have been adjusted to reflect the period-specific effects of applying the new guidance. In August 2015, the FASB issued ASU 2015-15, Interest – Presentation and Subsequent Measurement of Debit Issuance Costs Associated with Line-of-Credit Arrangement. The ASU stated that the SEC staff would not object to an entity deferring and presenting debt issuance costs as an asset and subsequently amortizing the deferred debt issuance costs ratably over the
81
term of the line-of-credit arrangement, regardless of whether there are any outstanding borrowings on the line-of-credit arrangement. The Company reports debt issuance cost related to the senior secured credit facility as a direct deduction from the carrying amount of debt liability. Refer to Note 8 for additional information regarding the impact of ASU 2015-03 and ASU 2015-15 on the Company’s consolidated financial statements.
Leases — In February 2016, the FASB issued ASU 2016-02, Leases (Topic 842). Under the new ASU, a lessee will be required to recognize assets and liabilities for leases with lease terms of more than 12 months. The liability will be equal to the present value of lease payments. The asset, referred to as a “right-of-use asset” will be based on the liability, subject to adjustment, such as for initial direct costs. For income statement purposes, leases will be classified as either operating or finance. Operating leases will result in straight-line expense (similar to current operating leases) while finance leases will result in a front-loaded expense pattern (similar to current capital leases). Classification will be based on criteria that are largely similar to those applied in current lease accounting, but without explicit bright lines. New quantitative and qualitative disclosures, including significant judgments made by management, will be required to provide greater information regarding the extent of revenue and expense recognized and expected to be recognized from existing contracts. The standard is effective for fiscal years, and interim periods within those fiscal years, beginning after December 15, 2018. The Company is currently evaluating the potential effects of the adoption of ASU 2016-02 on the Company’s consolidated financial statements.
3. Earnings per Share
Historical earnings per share information is not applicable for reporting periods prior to the consummation of the Reorganization Transactions and the IPO because the ownership structure of the Company did not include a common unit of ownership. Net income available for common stockholders is based on the Company’s approximate 27.5% interest in Virtu Financial.
The below table contains a reconciliation of net income before noncontrolling interest to net income available for common stockholders:
|
|
|
For the Year ended December 31 |
|
|
|
(in thousands) |
|
2015 |
|
|
|
Income before income taxes and noncontrolling interest |
|
$ |
215,929 |
|
|
Provision for income taxes |
|
|
18,439 |
|
|
Net income |
|
|
197,490 |
|
|
|
|
|
|
|
|
Net income allocable to members of Virtu Financial (for the period January 1, 2015 through April 15, 2015) |
|
|
(83,147) |
|
|
|
|
|
|
|
|
Noncontrolling interest subsequent to April 15, 2015 |
|
|
(93,456) |
|
|
|
|
|
|
|
|
Net income available for common stockholders |
|
$ |
20,887 |
|
The calculation of basic and diluted earnings per share is described below:
82
Basic earnings per share are calculated utilizing net income available for common stockholders from the year ended December 31, 2015, divided by the weighted average number of shares of common stock outstanding during the same period:
|
|
|
For the Year Ended December 31 |
|
|
|
(in thousands, except for share or per share data) |
|
2015 |
|
|
|
Basic earnings per share: |
|
|
|
|
|
Net income available for common stockholders |
|
$ |
20,887 |
|
|
Weighted average shares of common stock outstanding: |
|
|
|
|
|
Class A |
|
|
34,964,312 |
|
|
|
|
|
|
|
|
Basic Earnings per share |
|
$ |
0.60 |
|
Diluted earnings per share are calculated utilizing net income available for common stockholders commencing on April 16, 2015, divided by the weighted average total number of shares of common stock outstanding during the year ended December 31, 2015 plus additional shares of common stock issued and issuable pursuant to the 2015 Management Incentive Plan (Note 13).
|
|
|
For the Year Ended December 31 |
|
|
|
(in thousands, except for share or per share data) |
|
2015 |
|
|
|
Diluted earnings per share: |
|
|
|
|
|
Net income available for common stockholders |
|
$ |
20,887 |
|
|
|
|
|
|
|
|
Weighted average shares of common stock outstanding: |
|
|
|
|
|
Class A |
|
|
|
|
|
Issued and outstanding |
|
|
34,964,312 |
|
|
Issuable pursuant to 2015 Management Incentive Plan |
|
|
375,273 |
|
|
|
|
|
35,339,585 |
|
|
|
|
|
|
|
|
Diluted Earnings per share |
|
$ |
0.59 |
|
4. Tax Receivable Agreements
In connection with the initial public offering and related reorganization transactions, the Company entered into Tax Receivable Agreements (“TRAs”) to make payments to both the Virtu Post-IPO Members and the Investor Post-IPO Stockholders, as defined in Note 13, that are generally equal to 85% of the applicable cash tax savings, if any, realized as a result of favorable tax attributes that will be available to the Company as a result of the reorganization transactions, exchanges of Virtu Financial interests for Class A common stock or Class B common stock and payments made under the TRAs. Payments will occur only after the filing of the U.S. federal and state income tax returns and realization of the cash tax savings from the favorable tax attributes. The first payment is due 120 days after the filing of the Company’s tax return for the year ended December 31, 2015, which was due March 15, 2016, but the due date has been extended until September 15, 2016. Future payments under the TRAs in respect of subsequent exchanges would be in addition to these amounts.
As a result of the exchange of units of Virtu Financial from the IPO and the secondary offering, the Company recorded a deferred tax asset of $196.5 million associated with the increase in tax basis. Future payments to the Virtu Post-IPO Members and the Investor Post-IPO Stockholders in respect of the purchases, the exchanges and the Mergers described in Note 13 are expected to aggregate to approximately $218.4 million, ranging from approximately $8.1 million to $16.8 million per year over the next 15 years. The Company recorded a corresponding reduction to additional paid-in capital of approximately $21.9 million for the difference between the TRA liability and the related deferred tax asset. At December 31, 2015, the Company’s remaining deferred tax asset and the payment liability pursuant to the TRAs were approximately $187.0 million and $218.4 million, respectively. The amounts recorded as of December 31, 2015 reflects the current estimates and are subject to change after the filing of the Company’s U.S. federal and state income tax returns for the year ended December 31, 2015.
83
For the TRAs discussed above, the cash savings realized by the Company are computed by comparing the actual income tax liability of the Company to the amount of such taxes the Company would have been required to pay had there been (i) no increase to the tax basis of the assets of Virtu Financial as a result of the purchase or exchange of Virtu Financial units, (ii) no tax benefit from the tax basis in the intangible assets of Virtu Financial on the date of the IPO and (iii) no tax benefit as a result of the Net Operating Losses (“NOLs”) and other tax attributes at Virtu Financial. Subsequent adjustments of the TRA obligations due to certain events (e.g., changes to the expected realization of NOLs or changes in tax rates) will be recognized within operating expenses in the consolidated statements of comprehensive income.
5. Goodwill and Intangible Assets
There were no changes in the carrying amount of goodwill and no goodwill impairment was recognized for the years ended December 31, 2015, 2014, and 2013.
Acquired intangible assets consisted of the following as of December 31, 2015 and December 31, 2014:
|
|
|
|
|
|
|
|
|
|
|
|
|
|
|
|
|
|
|
As of December 31, 2015 |
|
|||||||||||
|
|
|
Gross |
|
|
|
|
|
|
|
|
|
|
|
|
|
|
|
Carrying |
|
Accumulated |
|
Net Carrying |
|
Useful Lives |
|
|||||
|
(in thousands) |
|
Amount |
|
Amortization |
|
Amount |
|
(Years) |
|
|||||
|
Purchased technology |
|
$ |
110,000 |
|
$ |
110,000 |
|
$ |
— |
|
1.4 |
to |
2.5 |
|
|
ETF issuer relationships |
|
|
950 |
|
|
349 |
|
|
601 |
|
|
9 |
|
|
|
ETF buyer relationships |
|
|
950 |
|
|
348 |
|
|
602 |
|
|
9 |
|
|
|
|
|
$ |
111,900 |
|
$ |
110,697 |
|
$ |
1,203 |
|
|
|
|
|
|
|
|
|
|
|
|
|
|
|
|
|
|
|
|
|
|
|
|
As of December 31, 2014 |
|
|||||||||||
|
|
|
Gross |
|
|
|
|
|
|
|
|
|
|
|
|
|
|
|
Carrying |
|
Accumulated |
|
Net Carrying |
|
Useful Lives |
|
|||||
|
(in thousands) |
|
Amount |
|
Amortization |
|
Amount |
|
(Years) |
|
|||||
|
Purchased technology |
|
$ |
110,000 |
|
$ |
110,000 |
|
$ |
— |
|
1.4 |
to |
2.5 |
|
|
ETF issuer relationships |
|
|
950 |
|
|
243 |
|
|
707 |
|
|
9 |
|
|
|
ETF buyer relationships |
|
|
950 |
|
|
243 |
|
|
707 |
|
|
9 |
|
|
|
|
|
$ |
111,900 |
|
$ |
110,486 |
|
$ |
1,414 |
|
|
|
|
|
Amortization expense relating to finite-lived intangible assets was approximately $0.2 million, $0.2 million, and $1.0 million for the years ended December 31, 2015, 2014, and 2013, respectively. This is included in amortization of purchased intangibles and acquired capitalized software in the accompanying consolidated statements of comprehensive income.
6. Receivables from/Payables to Broker-Dealers and Clearing Organizations
The following is a summary of receivables from and payables to brokers-dealers and clearing organizations at December 31, 2015 and December 31, 2014:
|
|
|
|
|
|
|
|
|
|
|
|
December 31, |
|
||||
|
(in thousands) |
|
2015 |
|
2014 |
|
||
|
Assets |
|
|
|
|
|
|
|
|
Due from prime brokers |
|
$ |
101,372 |
|
$ |
67,556 |
|
|
Deposits with clearing organizations |
|
|
31,908 |
|
|
29,595 |
|
|
Net equity with futures commission merchants |
|
|
174,615 |
|
|
155,060 |
|
|
Unsettled trades with clearing organization |
|
|
102,890 |
|
|
55,929 |
|
|
Securities failed to deliver |
|
|
65,751 |
|
|
79,512 |
|
|
Total receivables from broker-dealers and clearing organizations |
|
$ |
476,536 |
|
$ |
387,652 |
|
|
Liabilities |
|
|
|
|
|
|
|
|
Due to prime brokers |
|
$ |
294,691 |
|
$ |
313,623 |
|
|
Net equity with futures commission merchants |
|
|
46,537 |
|
|
60,973 |
|
|
Unsettled trades with clearing organization |
|
|
145,376 |
|
|
311,322 |
|
|
Securities failed to receive |
|
|
— |
|
|
285 |
|
|
Total payables to broker-dealers and clearing organizations |
|
$ |
486,604 |
|
$ |
686,203 |
|
84
Included as a deduction from “Due from prime brokers” and “Net equity with futures commission merchants” is the outstanding principal balance on all of the Company’s short-term credit facilities of approximately $219.1 million and $182.9 million as of December 31, 2015 and 2014, respectively. The loan proceeds from the credit facilities are available only to meet the initial margin requirements associated with the Company’s ordinary course futures and other trading positions, which are held in the Company’s trading accounts with an affiliate of the respective financial institutions. The credit facilities are fully collateralized by the Company’s trading accounts and deposit accounts with these financial institutions. “Securities failed to deliver” and “Securities failed to receive” include amounts with a clearing organization and other broker-dealers.
7. Collateralized Transactions
The Company is permitted to sell or repledge securities received as collateral and use these securities to secure repurchase agreements, enter into securities lending transactions or deliver these securities to counterparties or clearing organizations to cover short positions. At December 31, 2015 and December 31, 2014, substantially all of the securities received as collateral have been repledged. The fair value of the collateralized transactions at December 31, 2015 and December 31, 2014 are summarized as follows:
|
|
|
|
|
|
|
|
|
|
|
|
December 31, |
|
||||
|
(in thousands) |
|
2015 |
|
2014 |
|
||
|
Securities received as collateral: |
|
|
|
|
|
|
|
|
Securities borrowed |
|
$ |
437,220 |
|
$ |
470,553 |
|
|
Securities purchased under agreements to resell |
|
|
14,985 |
|
|
31,472 |
|
|
|
|
$ |
452,205 |
|
$ |
502,025 |
|
In the normal course of business, the Company pledges qualified securities with clearing organizations to satisfy daily margin and clearing fund requirements.
Financial instruments owned and pledged, where the counterparty has the right to repledge, at December 31, 2015 and December 31, 2014 consisted of the following:
|
|
|
|
|
|
|
|
|
|
|
|
December 31, |
|
||||
|
(in thousands) |
|
2015 |
|
2014 |
|
||
|
Equities |
|
$ |
232,731 |
|
$ |
219,159 |
|
|
Exchange traded notes |
|
|
26,444 |
|
|
17,216 |
|
|
|
|
$ |
259,175 |
|
$ |
236,375 |
|
8. Borrowings
Broker-Dealer Credit Facilities
The Company is a party to two secured credit facilities with the same financial institution to finance overnight securities positions purchased as part of its ordinary course broker-dealer market making activities. One of the facilities (the “Uncommitted Facility"), is provided on an uncommitted basis and is available for borrowings by the Company's broker-dealer subsidiaries up to a maximum amount of $125.0 million. In connection with this credit facility, the Company has entered into demand promissory notes dated February 20, 2013. The loans provided under the Uncommitted Facility are collateralized by the Company's broker-dealer trading and deposit accounts with the same financial institution and, bear interest at a rate set by the financial institution on a daily basis (1.25% at December 31, 2015 and 1.12% at December 31, 2014). The Company is party to another facility (the "Committed Facility") with the same financial institution dated July 22, 2013 and subsequently amended on March 26, 2014, July 21, 2014 and April 24, 2015, which is provided on a committed basis and is available for borrowings by one of the Company's broker-dealer subsidiaries up to a maximum of the lesser of $75.0 million or an amount determined based on agreed advance rates for pledged securities. The Committed Facility is subject to certain financial covenants, including a minimum tangible net worth, a maximum total assets to equity ratio, and a minimum excess net capital, each as defined. The Committed Facility bears interest at a rate per annum at the Company's election equal to either an adjusted LIBOR rate or base rate, plus a margin of 1.25% per annum, and has a term of 364 days. As of December 31, 2015 and 2014, the Company had
85
$45.0 million and $0 outstanding principal balance on the Uncommitted Facility, respectively. As of December 31, 2015 and 2014, the Company did not have any outstanding principal balance on the Committed Facility. Interest expense for the year ended December 31, 2015, 2014, and 2013 was approximately $0.9 million, $0.5 million, and $0.3 million, respectively. Interest expense is included within interest and dividends expense in the accompanying consolidated statements of comprehensive income.
Short-Term Credit Facilities
The Company maintains short term credit facilities with various prime brokers and other financial institutions from which it receives execution or clearing services. The proceeds of these facilities are used to meet margin requirements associated with the products traded by the Company in the ordinary course, and amounts borrowed are collateralized by the Company’s trading accounts with the applicable financial institution. The aggregate amount available for borrowing under these facilities was $478.0 million and $440.0 million and the outstanding principal was $219.1 million and $182.9 million as of December 31, 2015 and 2014, respectively, which were included within receivables from broker-dealers and clearing organizations within the consolidated statements of financial condition. Borrowings bore interest at a weighted average interest rate of 2.48% and 1.80% per annum, as of December 31, 2015 and 2014, respectively. Interest expense in relation to the facilities for the years ended December 31, 2015, 2014, and 2013 was approximately $5.5 million, $3.3 million, and $3.2 million, respectively. Interest expense is recorded within interest and dividends expense in the accompanying consolidated statements of comprehensive income.
Senior Secured Credit Facility
On July 8, 2011, Virtu Financial, its wholly owned subsidiary, VFH Parent LLC (“VFH” or, the “Borrower”), and each of its unregulated domestic subsidiaries entered into the credit agreement (the “Credit Agreement”) among the Borrower, Virtu Financial, Credit Suisse AG, as administrative agent, and the other parties thereto. The credit facility funded a portion of the MTH acquisition with a term loan in the amount of $320.0 million to VFH. The credit facility was issued at a discount of 2.0% or $313.6 million, net of $6.4 million discount. The credit facility was initially subject to quarterly principal payments beginning on December 31, 2011 with the unpaid principal payable on maturity on July 8, 2016. Under the terms of the loan, VFH is subject to certain financial covenants, including a total net leverage ratio and an interest coverage ratio, as defined in the Credit Agreement. VFH is also subject to contingent principal payments based on excess cash flow, as defined in the Credit Agreement, and certain other triggering events. Borrowings are collateralized by substantially all the assets of the Company, other than the equity interests in and assets of its registered broker-dealer, regulated and foreign subsidiaries, but including 100% of the non-voting stock and 65% of the voting stock of Virtu Financial’s or its domestic subsidiaries’ direct foreign subsidiaries.
The Credit Agreement was amended on February 5, 2013, May 1, 2013 and November 8, 2013. The amendments resulted in a decreased interest rate, changes in certain operating covenants, and an increase in principal amount outstanding by $150.0 million on May 1, 2013 and $106.7 million on November 8, 2013, respectively. Additionally, the amendments reduced the annual amortization obligation from 15% of the original principal amount to approximately 1% of the outstanding principal amount as of November 8, 2013, which was $510.0 million. The terms of the amended credit facility are otherwise substantially similar to the original credit facility, except as set forth below.
Term loans outstanding under the Credit Agreement bear interest at a rate per annum at the Company's election equal to either (i) the greatest of (a) the prime rate in effect, (b) the federal funds effective rate (as defined in the Credit Agreement) plus 0.5% (c) the adjusted LIBOR rate (as defined in the Credit Agreement) for a Eurodollar borrowing with an interest period of one month plus 1%, and (d) 2.25% plus, in each case, 3.0%, or (ii) the greater of (x) the adjusted LIBOR rate for the interest period in effect and (y) 1.25%, plus 4.0%. Pursuant to the Amendment (as defined below), each incremental spread was reduced by 0.50% upon the consummation of the Company’s IPO. The rate at December 31, 2015 was 5.25%.
86
Aggregate future required minimum principal payments based on the terms of this loan at December 31, 2015 were as follows:
|
(in thousands) |
|
|
|
|
|
2016 |
|
$ |
5,100 |
|
|
2017 |
|
|
5,100 |
|
|
2018 |
|
|
5,100 |
|
|
2019 and thereafter |
|
|
484,500 |
|
|
Total maturities of long-term debt |
|
$ |
499,800 |
|
Net carrying amount of deferred financing fees capitalized in connection with the financing were approximately $4.7 million and $5.1 million, respectively, as of December 31, 2015 and 2014, which are included as a deduction to senior secured credit facility in the accompanying consolidated statements of financial condition. The Company retrospectively adopted ASU 2015-03, Simplifying the Presentation of Debt Issuance Costs, wherein the accompanying consolidated statements of financial condition have been adjusted to reflect the period specific effects of applying the new guidance. After retrospectively applying the new guidance, the Company reclassified approximately $5.1 million in deferred financing fees as of December 31, 2014 previously included within other assets to senior secured credit facility in the accompanying consolidated statements of financial condition. Amortization expense related to the deferred financing fees was approximately $1.0 million, $1.0 million, and $1.6 million for the years ended December 31, 2015, 2014 and 2013, respectively. Amortization expense is included within financing interest expense on senior secured credit facility in the accompanying consolidated statements of comprehensive income.
The net carrying amounts of debt discount were approximately $1.5 million and $1.9 million as of December 31, 2015 and 2014, respectively. The accreted expenses were approximately $0.4 million, $0.4 million, and $0.7 million for the years ended December 31, 2015, 2014, and 2013, respectively. The accretion is included within financing interest expense on senior secured credit facility in the accompanying consolidated statements of comprehensive income.
On April 15, 2015, the Company, Virtu Financial, and each unregulated domestic subsidiary of Virtu Financial, entered into an amendment agreement (the “Amendment”) to the Credit Agreement. The Amendment provided for a revolving credit facility with aggregate commitments by revolving lenders of $100.0 million, available upon the consummation of the IPO and the payment of relevant fees and expenses. The revolving credit facility is secured pari passu with the term loans outstanding under the Credit Agreement and is subject to the same financial covenants and negative covenants. Borrowings under the revolving facility bear interest, at our election, at either (i) the greatest of (a) the prime rate in effect, (b) the federal funds effective rate plus 0.5% (c) an adjusted LIBOR rate for a Eurodollar borrowing with an interest period of one month plus 1% and (d) 2.25%, plus, in each case, 2.0%, or (ii) the greater of (x) an adjusted LIBOR rate for the interest period in effect and (y) 1.25%, plus, in each case, 3.0%. The Company will also pay a commitment fee of 0.50% per annum on the average daily unused portion of the facility.
As of December 31, 2015, the Company did not have any outstanding principal balance on the revolving credit facility. Interest expense in relation to the facilities for the year ended December 31, 2015 was $0.2 million. The net carrying amounts for the deferred financing fees capitalized in connection with the revolving credit facility were approximately $0.7 million as of December 31, 2015, which was included as a deduction to senior secured credit facility in the accompanying consolidated statements of financial condition. Amortization expenses related to the deferred financing fees in connection with the revolving credit facility were approximately $0.2 million for the year end December 31, 2015.
9. Financial Assets and Liabilities
At December 31, 2015 and December 31, 2014, substantially all of Company's financial assets and liabilities, except for the senior secured credit facility and certain exchange memberships, were carried at fair value based on published market prices and are marked to market daily or were short-term in nature and were carried at amounts that approximate fair value. The Company determined that the carrying value of the Company's senior secured credit facility
87
approximates fair value as of December 31, 2015 and December 31, 2014 based on the quoted over-the-counter market prices provided by the issuer of the senior secured credit facility, which was categorized as Level 2.
The fair value of equities, U.S. government obligations and exchange traded notes is estimated using recently executed transactions and market price quotations in active markets and are categorized as Level 1 with the exception of inactively traded equities which are categorized as Level 2. Fair value of the Company's derivative contracts is based on the indicative prices obtained from the banks that are counterparties to these contracts, as well as management's own analyses. The indicative prices have been independently validated through the Company's risk management systems, which are designed to check prices with information independently obtained from exchanges and venues where such financial instruments are listed or to compare prices of similar instruments with similar maturities for listed financial futures in foreign exchange. At December 31, 2015 and December 31, 2014, the Company's derivative contracts and non-U.S. government obligations have been categorized as Level 2.
Transfers in or out of levels are recognized based on the beginning fair value of the period in which they occurred. There were no transfers of financial instruments between levels during the years ended December 31, 2015 and 2014.
Fair value measurements for those items measured on a recurring basis are summarized below as of December 31, 2015:
|
|
|
December 31, 2015 |
|
|||||||||||||
|
|
|
Quoted Prices |
|
Significant |
|
|
|
|
|
|
|
|
||||
|
|
|
in Active |
|
Other |
|
Significant |
|
Counterparty |
|
|
|
|
||||
|
|
|
Markets for |
|
Observable |
|
Unobservable |
|
and Cash |
|
|
|
|
||||
|
|
|
Identical Assets |
|
Inputs |
|
Inputs |
|
Collateral |
|
Total Fair |
|
|||||
|
(in thousands) |
|
(Level 1) |
|
(Level 2) |
|
(Level 3) |
|
Netting |
|
Value |
|
|||||
|
Assets |
|
|
|
|
|
|
|
|
|
|
|
|
|
|
|
|
|
Financial instruments owned, at fair value: |
|
|
|
|
|
|
|
|
|
|
|
|
|
|
|
|
|
Equity securities |
|
$ |
915,848 |
|
$ |
32,243 |
|
$ |
— |
|
$ |
— |
|
$ |
948,091 |
|
|
U.S. and Non-U.S. government obligations |
|
|
— |
|
|
10,513 |
|
|
— |
|
|
— |
|
|
10,513 |
|
|
Exchange traded notes |
|
|
69,376 |
|
|
— |
|
|
— |
|
|
— |
|
|
69,376 |
|
|
Interest rate swaps |
|
|
— |
|
|
311 |
|
|
— |
|
|
— |
|
|
311 |
|
|
Currency forwards |
|
|
— |
|
|
795,435 |
|
|
— |
|
|
(785,855) |
|
|
9,580 |
|
|
Options |
|
|
— |
|
|
168 |
|
|
— |
|
|
— |
|
|
168 |
|
|
|
|
$ |
985,224 |
|
$ |
838,670 |
|
$ |
— |
|
$ |
(785,855) |
|
$ |
1,038,039 |
|
|
Financial instruments owned, pledged as collateral: |
|
|
|
|
|
|
|
|
|
|
|
|
|
|
|
|
|
Equity securities |
|
$ |
232,731 |
|
$ |
— |
|
$ |
— |
|
$ |
— |
|
$ |
232,731 |
|
|
Exchange traded notes |
|
|
26,444 |
|
|
— |
|
|
— |
|
|
— |
|
|
26,444 |
|
|
|
|
$ |
259,175 |
|
$ |
— |
|
$ |
— |
|
$ |
— |
|
$ |
259,175 |
|
|
Other Assets |
|
|
|
|
|
|
|
|
|
|
|
|
|
|
|
|
|
Exchange stock |
|
$ |
5,984 |
|
$ |
— |
|
$ |
— |
|
$ |
— |
|
$ |
5,984 |
|
|
|
|
$ |
5,984 |
|
$ |
— |
|
$ |
— |
|
$ |
— |
|
$ |
5,984 |
|
|
Liabilities |
|
|
|
|
|
|
|
|
|
|
|
|
|
|
|
|
|
Financial instruments sold, not yet purchased, at fair value: |
|
|
|
|
|
|
|
|
|
|
|
|
|
|
|
|
|
Equity securities |
|
$ |
935,071 |
|
$ |
1,780 |
|
$ |
— |
|
$ |
— |
|
$ |
936,851 |
|
|
U.S. and Non-U.S. government obligations |
|
|
3,996 |
|
|
— |
|
|
— |
|
|
— |
|
|
3,996 |
|
|
Exchange traded notes |
|
|
37,761 |
|
|
— |
|
|
— |
|
|
— |
|
|
37,761 |
|
|
Interest rate swaps |
|
|
— |
|
|
319 |
|
|
— |
|
|
— |
|
|
319 |
|
|
Currency forwards |
|
|
— |
|
|
746,014 |
|
|
— |
|
|
(746,014) |
|
|
— |
|
|
Options |
|
|
— |
|
|
163 |
|
|
— |
|
|
— |
|
|
163 |
|
|
|
|
$ |
976,828 |
|
$ |
748,276 |
|
$ |
— |
|
$ |
(746,014) |
|
$ |
979,090 |
|
88
Fair value measurements for those items measured on a recurring basis are summarized below as of December 31, 2014:
|
|
|
December 31, 2014 |
|
|||||||||||||
|
|
|
Quoted |
|
|
|
|
|
|
|
|
|
|
|
|
|
|
|
|
|
Prices in |
|
|
|
|
|
|
|
|
|
|
|
|
|
|
|
|
|
Active |
|
Significant |
|
|
|
|
|
|
|
|
|
|
||
|
|
|
Markets for |
|
Other |
|
Significant |
|
Counterparty |
|
|
|
|
||||
|
|
|
Identical |
|
Observable |
|
Unobservable |
|
and Cash |
|
|
|
|
||||
|
|
|
Assets |
|
Inputs |
|
Inputs |
|
Collateral |
|
Total Fair |
|
|||||
|
(in thousands) |
|
(Level 1) |
|
(Level 2) |
|
(Level 3) |
|
Netting |
|
Value |
|
|||||
|
Assets |
|
|
|
|
|
|
|
|
|
|
|
|
|
|
|
|
|
Financial instruments owned, at fair value: |
|
|
|
|
|
|
|
|
|
|
|
|
|
|
|
|
|
Equity securities |
|
$ |
1,216,532 |
|
$ |
17,166 |
|
$ |
— |
|
$ |
— |
|
$ |
1,233,698 |
|
|
U.S. and non-U.S. government obligations |
|
|
— |
|
|
8,222 |
|
|
— |
|
|
— |
|
|
8,222 |
|
|
Exchange traded notes |
|
|
65,684 |
|
|
— |
|
|
— |
|
|
— |
|
|
65,684 |
|
|
Currency forwards |
|
|
— |
|
|
1,629,637 |
|
|
— |
|
|
(1,629,629) |
|
|
8 |
|
|
Options |
|
|
— |
|
|
321 |
|
|
— |
|
|
— |
|
|
321 |
|
|
|
|
$ |
1,282,216 |
|
$ |
1,655,346 |
|
$ |
— |
|
$ |
(1,629,629) |
|
$ |
1,307,933 |
|
|
Financial instruments owned, pledged as collateral: |
|
|
|
|
|
|
|
|
|
|
|
|
|
|
|
|
|
Equity securities |
|
$ |
219,159 |
|
$ |
— |
|
$ |
— |
|
$ |
— |
|
$ |
219,159 |
|
|
Exchange traded notes |
|
|
17,216 |
|
|
— |
|
|
— |
|
|
— |
|
|
17,216 |
|
|
|
|
$ |
236,375 |
|
$ |
— |
|
$ |
— |
|
$ |
— |
|
$ |
236,375 |
|
|
Other Assets |
|
|
|
|
|
|
|
|
|
|
|
|
|
|
|
|
|
Exchange stock |
|
$ |
8,205 |
|
$ |
— |
|
$ |
— |
|
$ |
— |
|
$ |
8,205 |
|
|
|
|
$ |
8,205 |
|
$ |
— |
|
$ |
— |
|
$ |
— |
|
$ |
8,205 |
|
|
Liabilities |
|
|
|
|
|
|
|
|
|
|
|
|
|
|
|
|
|
Financial instruments sold, not yet purchased, at fair value: |
|
|
|
|
|
|
|
|
|
|
|
|
|
|
|
|
|
Equity securities |
|
$ |
859,836 |
|
$ |
47,896 |
|
$ |
— |
|
$ |
— |
|
$ |
907,732 |
|
|
U.S. and non-U.S. government obligations |
|
|
21,107 |
|
|
— |
|
|
— |
|
|
— |
|
|
21,107 |
|
|
Exchange traded notes |
|
|
92,513 |
|
|
— |
|
|
— |
|
|
— |
|
|
92,513 |
|
|
Currency forwards |
|
|
— |
|
|
1,645,820 |
|
|
— |
|
|
(1,629,629) |
|
|
16,191 |
|
|
Options |
|
|
— |
|
|
79 |
|
|
— |
|
|
— |
|
|
79 |
|
|
Interest rate swaps |
|
|
— |
|
|
12 |
|
|
— |
|
|
— |
|
|
12 |
|
|
|
|
$ |
973,456 |
|
$ |
1,693,807 |
|
$ |
— |
|
$ |
(1,629,629) |
|
$ |
1,037,634 |
|
The Company does not net securities borrowed and securities loaned, or securities purchased under agreements to resell and securities sold under agreements to repurchase. These financial instruments are presented on a gross basis in the consolidated statements of financial condition. In the tables below, the amounts of financial instruments owned that are not offset in the consolidated statements of financial condition, but could be netted against financial liabilities with specific counterparties under legally enforceable master netting agreements in the event of default, are presented to provide financial statement readers with the Company’s estimate of its net exposure to counterparties for these financial instruments.
The following tables set forth the netting of certain financial assets and financial liabilities as of December 31, 2015 and 2014, pursuant to the requirements of ASU 2011-11 and ASU 2013-01.
|
|
|
December 31, 2015 |
|
||||||||||||||||
|
|
|
|
|
|
|
|
Net Amounts of |
|
|
|
|
|
|
|
|
|
|
||
|
|
|
|
|
|
Gross Amounts |
|
Assets Presented |
|
Gross Amounts Not Offset In the |
|
|
|
|
||||||
|
|
|
|
|
Offset in the |
|
in the |
|
Consolidated |
|
|
|
|
|||||||
|
|
|
Gross Amounts |
|
Consolidated |
|
Consolidated |
|
Statement of Financial Condition |
|
|
|
|
|||||||
|
|
|
of Recognized |
|
Statement of |
|
Statement of |
|
Financial |
|
Cash Collateral |
|
|
|
||||||
|
(in thousands) |
|
Assets |
|
Financial Condition |
|
Financial Condition |
|
Instruments |
|
Received |
|
Net Amount |
|
||||||
|
Offsetting of Financial Assets: |
|
|
|
|
|
|
|
|
|
|
|
|
|
|
|
|
|
|
|
|
Securities borrowed |
|
$ |
453,296 |
|
$ |
— |
|
$ |
453,296 |
|
$ |
(443,659) |
|
$ |
(281) |
|
$ |
9,356 |
|
|
Securities purchased under agreements to resell |
|
|
14,981 |
|
|
— |
|
|
14,981 |
|
|
(14,981) |
|
|
— |
|
|
— |
|
|
Trading assets, at fair value: |
|
|
|
|
|
|
|
|
|
|
|
|
|
|
|
|
|
|
|
|
Currency forwards |
|
|
795,435 |
|
|
(785,855) |
|
|
9,580 |
|
|
— |
|
|
— |
|
|
9,580 |
|
|
Options |
|
|
168 |
|
|
— |
|
|
168 |
|
|
(139) |
|
|
— |
|
|
29 |
|
|
Interest rate swaps |
|
|
311 |
|
|
— |
|
|
311 |
|
|
(311) |
|
|
— |
|
|
— |
|
|
Total |
|
$ |
1,264,191 |
|
$ |
(785,855) |
|
$ |
478,336 |
|
$ |
(459,090) |
|
$ |
(281) |
|
$ |
18,965 |
|
89
|
|
|
|
|
|
|
|
|
|
|
|
|
|
|
||||||
|
|
|
|
|
|
|
|
Net Amounts of |
|
|
|
|
|
|
|
|
|
|
||
|
|
|
|
|
|
Gross Amounts |
|
Assets Presented |
|
Gross Amounts Not Offset In the |
|
|
|
|
||||||
|
|
|
|
|
Offset in the |
|
in the |
|
Consolidated |
|
|
|
|
|||||||
|
|
|
Gross Amounts |
|
Consolidated |
|
Consolidated |
|
Statement of Financial Condition |
|
|
|
|
|||||||
|
|
|
of Recognized |
|
Statement of |
|
Statement of |
|
Financial |
|
Cash Collateral |
|
|
|
||||||
|
|
|
Assets |
|
Financial Condition |
|
Financial Condition |
|
Instruments |
|
Received |
|
Net Amount |
|
||||||
|
Offsetting of Financial Liabilities: |
|
|
|
|
|
|
|
|
|
|
|
|
|
|
|
|
|
|
|
|
Securities loaned |
|
$ |
524,603 |
|
$ |
— |
|
$ |
524,603 |
|
$ |
(521,407) |
|
$ |
— |
|
$ |
3,196 |
|
|
Securities sold under agreements to repurchase |
|
|
— |
|
|
— |
|
|
— |
|
|
— |
|
|
— |
|
|
— |
|
|
Trading liabilities, at fair value: |
|
|
|
|
|
|
|
|
|
|
|
|
|
|
|
|
|
|
|
|
Currency forwards |
|
|
746,014 |
|
|
(746,014) |
|
|
— |
|
|
— |
|
|
— |
|
|
— |
|
|
Options |
|
|
163 |
|
|
— |
|
|
163 |
|
|
(139) |
|
|
(24) |
|
|
— |
|
|
Interest rate swaps |
|
|
319 |
|
|
— |
|
|
319 |
|
|
(311) |
|
|
(8) |
|
|
— |
|
|
Total |
|
$ |
1,271,099 |
|
$ |
(746,014) |
|
$ |
525,085 |
|
$ |
(521,857) |
|
$ |
(32) |
|
$ |
3,196 |
|
|
|
|
December 31, 2014 |
|
||||||||||||||||
|
|
|
|
|
|
|
|
Net Amounts of |
|
|
|
|
|
|
|
|
|
|
||
|
|
|
|
|
|
Gross Amounts |
|
Assets Presented |
|
Gross Amounts Not Offset In the |
|
|
|
|
||||||
|
|
|
|
|
|
Offset in the |
|
in the |
|
Consolidated |
|
|
|
|
||||||
|
|
|
Gross Amounts |
|
Consolidated |
|
Consolidated |
|
Statement of Financial Condition |
|
|
|
|
|||||||
|
|
|
of Recognized |
|
Statement of |
|
Statement of |
|
Financial |
|
Cash Collateral |
|
|
|
||||||
|
(in thousands) |
|
Assets |
|
Financial Condition |
|
Financial Condition |
|
Instruments |
|
Received |
|
Net Amount |
|
||||||
|
Offsetting of Financial Assets: |
|
|
|
|
|
|
|
|
|
|
|
|
|
|
|
|
|
|
|
|
Securities borrowed |
|
$ |
484,934 |
|
$ |
— |
|
$ |
484,934 |
|
$ |
(477,559) |
|
$ |
— |
|
$ |
7,375 |
|
|
Securities purchased under agreements to resell |
|
|
31,463 |
|
|
— |
|
|
31,463 |
|
|
(31,463) |
|
|
— |
|
|
— |
|
|
Trading assets, at fair value: |
|
|
|
|
|
|
|
|
|
|
|
|
|
|
|
|
|
|
|
|
Currency forwards |
|
|
1,629,637 |
|
|
(1,629,629) |
|
|
8 |
|
|
— |
|
|
— |
|
|
8 |
|
|
Options |
|
|
321 |
|
|
— |
|
|
321 |
|
|
(76) |
|
|
— |
|
|
245 |
|
|
Total |
|
$ |
2,146,355 |
|
$ |
(1,629,629) |
|
$ |
516,726 |
|
$ |
(509,098) |
|
$ |
— |
|
$ |
7,628 |
|
|
|
|
|
|
|
|
|
|
|
|
|
|
|
|
|
|||||
|
|
|
|
|
|
|
|
Net Amounts of |
|
|
|
|
|
|
||||||
|
|
|
|
|
|
|
|
Liabilities |
|
|
|
|
|
|
|
|
|
|
||
|
|
|
|
|
|
Gross Amounts |
|
Presented |
|
Gross Amounts Not Offset In the |
|
|
|
|
||||||
|
|
|
|
|
|
Offset in the |
|
in the |
|
Consolidated |
|
|
|
|
||||||
|
|
|
Gross Amounts |
|
Consolidated |
|
Consolidated |
|
Statement of Financial Condition |
|
|
|
|
|||||||
|
|
|
of Recognized |
|
Statement of |
|
Statement of |
|
Financial |
|
Cash Collateral |
|
|
|
||||||
|
(in thousands) |
|
Liabilities |
|
Financial Condition |
|
Financial Condition |
|
Instruments |
|
Pledged |
|
Net Amount |
|
||||||
|
Offsetting of Financial Liabilities: |
|
|
|
|
|
|
|
|
|
|
|
|
|
|
|
|
|
|
|
|
Securities loaned |
|
$ |
497,862 |
|
|
— |
|
$ |
497,862 |
|
$ |
(490,768) |
|
$ |
(2,812) |
|
$ |
4,282 |
|
|
Securities sold under agreements to repurchase |
|
|
2,006 |
|
|
— |
|
|
2,006 |
|
|
(2,006) |
|
|
— |
|
|
— |
|
|
Trading liabilities, at fair value: |
|
|
|
|
|
|
|
|
|
|
|
|
|
|
|
|
|
|
|
|
Currency forwards |
|
|
1,645,820 |
|
|
(1,629,629) |
|
|
16,191 |
|
|
— |
|
|
(16,191) |
|
|
— |
|
|
Options |
|
|
79 |
|
|
— |
|
|
79 |
|
|
(79) |
|
|
— |
|
|
— |
|
|
Interest rate swaps |
|
|
12 |
|
|
— |
|
|
12 |
|
|
— |
|
|
(12) |
|
|
— |
|
|
Total |
|
$ |
2,145,779 |
|
$ |
(1,629,629) |
|
$ |
516,150 |
|
$ |
(492,853) |
|
$ |
(19,015) |
|
$ |
4,282 |
|
Excluded from the fair value and offsetting tables above is net unsettled fair value on long and short futures contracts in the amounts of $(8.1) million and $46.4 million, which are included within receivables from broker-dealers and clearing organizations as of December 31, 2015 and 2014, respectively, and $(11.7) million and $(3.6) million, which are included within payables to broker-dealers and clearing organizations as of December 31, 2015 and 2014, respectively.
90
The following table presents gross obligations for securities lending transactions by remaining contractual maturity and the class of collateral pledged.
|
|
|
|
December 31, 2015 |
||||||||||||
|
|
|
|
Remaining Contractual Maturity |
||||||||||||
|
|
|
|
Overnight and |
|
|
Less than |
|
|
30 - 90 |
|
|
Over 90 |
|
|
|
|
(in thousands) |
|
|
Continuous |
|
|
30 days |
|
|
days |
|
|
Days |
|
|
Total |
|
|
|
|
|
|
|
|
|
|
|
|
|
|
|
|
|
|
Securities lending transactions: |
|
|
|
|
|
|
|
|
|
|
|
|
|
|
|
|
Equity securities |
|
$ |
524,603 |
|
$ |
— |
|
$ |
— |
|
$ |
— |
|
$ |
524,603 |
|
Total |
|
$ |
524,603 |
|
$ |
— |
|
$ |
— |
|
$ |
— |
|
$ |
524,603 |
10. Derivative Instruments
The fair value of the Company's derivative instruments on a gross basis consisted of the following at December 31, 2015 and December 31, 2014:
|
(in thousands) |
|
|
|
2015 |
|
2014 |
|
||||||||
|
Derivatives Assets |
|
Balance Sheet Classification |
|
Fair Value |
|
Notional |
|
Fair Value |
|
Notional |
|
||||
|
Equities futures |
|
Receivables from broker dealers and clearing organizations |
|
$ |
(1,017) |
|
$ |
617,398 |
|
$ |
241 |
|
$ |
561,029 |
|
|
Commodity futures |
|
Receivables from broker dealers and clearing organizations |
|
|
(8,431) |
|
|
18,635,531 |
|
|
42,489 |
|
|
28,823,081 |
|
|
Currency futures |
|
Receivables from broker dealers and clearing organizations |
|
|
1,358 |
|
|
3,059,575 |
|
|
3,180 |
|
|
2,916,222 |
|
|
Treasury futures |
|
Receivables from broker dealers and clearing organizations |
|
|
30 |
|
|
232,473 |
|
|
504 |
|
|
857,363 |
|
|
Options |
|
Financial instruments owned |
|
|
168 |
|
|
24,453 |
|
|
321 |
|
|
39,802 |
|
|
Currency forwards |
|
Financial instruments owned |
|
|
795,435 |
|
|
69,614,513 |
|
|
1,629,637 |
|
|
127,021,198 |
|
|
Interest rate swaps |
|
Financial instruments owned |
|
|
311 |
|
|
82,010 |
|
|
— |
|
|
— |
|
|
Derivatives Liabilities |
|
Balance Sheet Classification |
|
Fair Value |
|
Notional |
|
Fair Value |
|
Notional |
|
||||
|
Equities futures |
|
Payables to broker dealers and clearing organizations |
|
$ |
202 |
|
$ |
75,428 |
|
$ |
(268) |
|
$ |
122,948 |
|
|
Commodity futures |
|
Payables to broker dealers and clearing organizations |
|
|
585 |
|
|
25,932 |
|
|
(295) |
|
|
15,727 |
|
|
Currency futures |
|
Payables to broker dealers and clearing organizations |
|
|
(12,475) |
|
|
2,570,005 |
|
|
(3,077) |
|
|
2,123,341 |
|
|
Options |
|
Financial instruments sold, not yet purchased |
|
|
163 |
|
|
25,336 |
|
|
79 |
|
|
12,913 |
|
|
Currency forwards |
|
Financial instruments sold, not yet purchased |
|
|
746,014 |
|
|
71,019,047 |
|
|
1,645,820 |
|
|
125,152,639 |
|
|
Interest rate swaps |
|
Financial instruments sold, not yet purchased |
|
|
319 |
|
|
82,010 |
|
|
12 |
|
|
164,020 |
|
Amounts included in receivables from and payables to broker-dealers and clearing organizations represent net unsettled fair value on long and short futures contracts.
The following table summarizes the gain from derivative instruments not designated as hedging instruments under ASC 815, which are recorded in trading income, net in the accompanying consolidated statements of comprehensive income for the years ended December 31, 2015, 2014, and 2013.
|
|
|
For the years ended |
|||||||
|
|
|
December 31, |
|||||||
|
(in thousands) |
|
2015 |
|
2014 |
|
2013 |
|||
|
Futures |
|
$ |
1,180,483 |
|
$ |
(78,234) |
|
$ |
191,046 |
|
Currency forwards |
|
|
(16,431) |
|
|
(32,785) |
|
|
(1,817) |
|
Options |
|
|
(1,784) |
|
|
(987) |
|
|
2,680 |
|
Interest rate swaps |
|
|
4 |
|
|
(12) |
|
|
— |
|
|
|
$ |
1,162,272 |
|
$ |
(112,018) |
|
$ |
191,909 |
91
11. Income Taxes
Income before income taxes and noncontrolling interest is as follows for the years ended December 31, 2015, 2014 and 2013:
|
|
|
For the years ended |
|
|||||||
|
|
|
December 31, |
|
|||||||
|
|
|
2015 |
|
2014 |
|
2013 |
|
|||
|
(in thousands) |
|
|
|
|
|
|
|
|
|
|
|
U.S. operations |
|
$ |
154,947 |
|
$ |
158,487 |
|
$ |
136,744 |
|
|
Non-U.S. operations |
|
|
60,982 |
|
|
35,071 |
|
|
50,856 |
|
|
|
|
$ |
215,929 |
|
$ |
193,558 |
|
$ |
187,600 |
|
The provision for income taxes consists of the following for the years ended December 31, 2015, 2014 and 2013.
|
|
|
For the years ended |
|
|||||||
|
|
|
December 31, |
|
|||||||
|
(in thousands) |
|
2015 |
|
2014 |
|
2013 |
|
|||
|
Current provision |
|
|
|
|
|
|
|
|
|
|
|
Federal |
|
$ |
7,584 |
|
$ |
— |
|
$ |
— |
|
|
State and Local |
|
|
108 |
|
|
— |
|
|
— |
|
|
Foreign |
|
|
6,762 |
|
|
4,263 |
|
|
3,660 |
|
|
Deferred provision (benefit) |
|
|
|
|
|
|
|
|
|
|
|
Federal |
|
|
3,345 |
|
|
— |
|
|
— |
|
|
State and Local |
|
|
48 |
|
|
— |
|
|
— |
|
|
Foreign |
|
|
592 |
|
|
(762) |
|
|
1,737 |
|
|
Provision for income taxes |
|
$ |
18,439 |
|
$ |
3,501 |
|
$ |
5,397 |
|
The reconciliation of the tax provision at the U.S. Federal Statutory Rate to the provision for income taxes for the years ended December 31, 2015, 2014 and 2013 is as follows:
|
|
|
December 31, |
|
||||
|
|
|
2015 |
|
2014 |
|
2013 |
|
|
(in thousands, except percentages) |
|
|
|
|
|
|
|
|
Tax provision at the U.S. federal statutory rate |
|
35.0 |
|
— |
|
— |
|
|
Less: rate attributable to noncontrolling interest |
|
(27.8) |
|
— |
|
— |
|
|
State, local and foreign taxes, net of federal benefit |
|
1.4 |
% |
1.8 |
% |
2.9 |
% |
|
Provision for income taxes |
|
8.6 |
% |
1.8 |
% |
2.9 |
% |
The components of the deferred tax assets and liabilities as of December 31, 2015 and 2014 are as follows:
|
|
|
December 31, |
|
||||
|
(in thousands) |
|
2015 |
|
2014 |
|
||
|
Deferred income tax assets |
|
|
|
|
|
|
|
|
Tax Receivable Agreement |
|
$ |
187,010 |
|
$ |
— |
|
|
Share-based compensation |
|
|
5,647 |
|
|
947 |
|
|
Fixed assets |
|
|
1,083 |
|
|
30 |
|
|
Total deferred income tax assets |
|
$ |
193,740 |
|
$ |
977 |
|
|
Deferred income tax liabilities |
|
|
|
|
|
|
|
|
Fixed assets |
|
|
202 |
|
|
— |
|
|
Total deferred income tax liabilities |
|
$ |
202 |
|
$ |
— |
|
Income tax expense for the years ended December 31, 2015, 2014, and 2013 differs from the U.S. federal statutory rate primarily due to the taxation treatment of income attributable to noncontrolling interests in Virtu Financial. These noncontrolling interests are subject to U.S. taxation as partnerships. Accordingly, the income attributable to these noncontrolling interests is reported in the consolidated statements of comprehensive income, but the related U.S. income tax expense attributable to these noncontrolling interests is not reported by the Company as it is the obligation of the
92
individual partners. Income tax expense is also affected by the differing effective tax rates in foreign, state and local jurisdictions where certain of the Company’s subsidiaries are subject to corporate taxation.
Deferred income taxes arise primarily due to the amortization of the deferred tax assets recognized in connection with the IPO (Note 13), differences in the valuation of financial assets and liabilities, and in connection with other temporary differences arising from the deductibility of compensation and depreciation expenses in different time periods for book and income tax return purposes.
There are no expiration dates on the deferred tax assets. The provisions of ASC 740 require that carrying amounts of deferred tax assets be reduced by a valuation allowance if, based on the available evidence, it is more likely than not that some portion or all of the deferred tax assets will not be realized. Accordingly, the need to establish valuation allowances for deferred tax assets is assessed periodically with appropriate consideration given to all positive and negative evidence related to the realization of the deferred tax assets. A valuation allowance against deferred tax assets at the balance sheet date is not considered necessary because it is more likely than not the deferred tax asset will be fully realized. There are no unrecognized tax benefits as of December 31, 2015 and December 31, 2014.
The Company is subject to taxation in U.S. federal, state, local and foreign jurisdictions. As of December 31, 2015, the Company’s tax years for 2012 through 2014 and 2009 through 2014 are subject to examination by U.S. and non-U.S. tax authorities, respectively.
12. Commitments, Contingencies and Guarantees
At December 31, 2015, minimum rental commitments under non-cancellable leases are
approximately as follows:
|
|
|
Minimum Rental Commitments |
|
||||
|
Year Ending December 31 |
|
Capital |
|
Operating |
|
||
|
2016 |
|
|
9,746 |
|
|
9,526 |
|
|
2017 |
|
|
2,652 |
|
|
8,532 |
|
|
2018 |
|
|
628 |
|
|
7,484 |
|
|
2019 |
|
|
— |
|
|
5,891 |
|
|
2020 |
|
|
— |
|
|
4,789 |
|
|
Thereafter |
|
|
— |
|
|
601 |
|
|
Total minimum lease payments |
|
$ |
13,026 |
|
$ |
36,823 |
|
Total operating lease expense, net of amortization expense related to landlord incentives, for the years ended December 31, 2015, 2014 and 2013 was approximately $5.3 million, $3.5 million, and $4.3 million, respectively. Occupancy lease expense for the years ended December 31, 2015, 2014 and 2013 of $3.9 million, $1.7 million and $1.9 million, respectively, is included within operations and administrative expenses in the consolidated statements of comprehensive income. Communication equipment lease expense for the years ended December 31, 2015, 2014 and 2013 of $1.4 million, $1.8 million and $2.4 million, respectively, is included within communication and data processing in the accompanying consolidated statements of comprehensive income.
Employee Retention Plan
In connection with the July 8, 2011 acquisition of MTH, the Company established an employee retention plan. Under the plan, approximately $21.5 million was paid to employees in five installments from July 8, 2011 through July 8, 2014. The Company recognized approximately $0, $2.6 million and $6.7 million, respectively, in compensation expense related to the plan, for the years ended December 31, 2015, 2014 and 2013, in acquisition related retention bonus in the accompanying consolidated statements of comprehensive income.
Litigation
The Company is subject to various legal proceedings and claims that arise in the ordinary course of business. The Company has also been, is currently, and may in the future be, the subject of one or more regulatory or self-
93
regulatory organization enforcement actions, including but not limited to targeted and routine regulatory inquiries and investigations involving Regulation NMS, Regulation SHO, capital requirements and other domestic and foreign securities rules and regulations which may from time to time result in the imposition of penalties or fines. The Company has also been the subject of requests for information and documents from the SEC and the State of New York Office of the Attorney General (‘‘NYAG’’). Certain of these matters may result, or have resulted, in adverse judgments, settlements, fines, penalties, injunctions or other relief, and the Company’s business or reputation could be negatively impacted if it were determined that disciplinary or other enforcement actions were required. The ultimate effect on the Company from the pending proceedings and claims, if any, is presently unknown. Where available information indicates that it is probable a liability had been incurred at the date of the consolidated financial statements and the Company can reasonably estimate the amount of that loss, the Company accrues the estimated loss by a charge to income. In addition, in December 2015 the enforcement committee of the Autorité des marchés financiers (“AMF”) fined our European subsidiary in the amount of €5.0 million (approximately $5.4 million) based on its allegations that the subsidiary of MTH engaged in price manipulation and violations of the AMF General Regulation and Euronext Market Rules. In accordance with the foregoing, we have accrued an estimated loss of €5.0 million (approximately $5.4 million) in relation to the fine imposed by the AMF. Subject to the foregoing, based on information currently available, management believes it is not probable that the resolution of any known matters will result in a material adverse effect on the Company’s financial position, results of operations or cash flows although they might be material for any particular reporting period. The Company’s management believes that the relevant trading engaged in by the subsidiary of MTH was conducted in accordance with applicable French law and regulations and the Company is pursuing its rights of appeal.
Indemnification Arrangements
Consistent with standard business practices in the normal course of business, the Company has provided general indemnifications to its managers, officers, employees, and agents against expenses, judgments, fines, settlements, and other amounts actually and reasonably incurred by such persons under certain circumstances as more fully disclosed in its operating agreement. The overall maximum amount of the obligations (if any) cannot reasonably be estimated as it will depend on the facts and circumstances that give rise to any future claims.
13. Capital Structure
Capital structure prior to the Company’s Reorganization completed on April 15, 2015 and IPO completed on April 16, 2015:
Virtu Financial had three classes of members interests: Class A-1 members interests; Class A-2 members interests; and Class B members interests. Class A-2 members interests included both Class A-2 capital interests and Class A-2 profits interests.
Class A-1 Interests
On July 8, 2011, 25,000,000 Class A-1 redeemable interests were issued to an affiliate of Silver Lake (“the Silver Lake Member”) and 1,964,826 Class A-1 interests were issued to an affiliate of Vincent Viola, which Class A-1 interests had an aggregate capital balance of approximately $270 million. On December 31, 2014, through a series of transactions, 5,376,603 and 12,242,173 of the Class A-1 redeemable interests previously held by the Silver Lake Member were transferred to Wilbur Investments LLC (the ‘‘Temasek Member’’), an indirect wholly owned subsidiary of Temasek Holdings (Private) Limited, (‘‘Temasek’’), and an affiliate of Silver Lake and Temasek, 57.9% of which is indirectly owned by affiliates of Silver Lake Partners and 42.1% of which is indirectly owned by an affiliate of Temasek (the “SLT Member” and together with the Silver Lake Member and the Temasek Member, the “Investor Members”), respectively, with the Silver Lake Member retaining 7,381,224 Class A-1 redeemable interests. Class A-1 interests that the holder thereof has the right to call for redemption were held by three members: (i) the Silver Lake Member, (ii) the Temasek Member and (iii) the SLT Member. The Silver Lake Member had the right to appoint one member on Virtu Financial’s board of directors and the Temasek Member had the right to either appoint one member on Virtu Financial’s board of directors (subject to obtaining certain regulatory approvals) or elect that the other members of the board of
94
directors designate one member of Virtu Financial’s board of directors in consultation with the Temasek Member. The Silver Lake Member and the Temasek Member also possessed approval rights with respect to certain board actions and corporate events. Additionally, as part of the transaction consideration, a contingent payment agreement was entered into among Temasek, Silver Lake Partners, the Employee Holdco and the Company whereby additional payments will be made from Temasek to Silver Lake Partners and the selling members of management in the aggregate maximum amount of $3.9 million if the value of the interests acquired exceeds 1.7 times the transaction price prior to December 31, 2018, or December 31, 2019, the date depending on whether certain liquidity events occur.
There were no additional Class A-1 interests granted, forfeited, distributed or redeemed during the years ended December 31, 2015, 2014, and 2013.
Class A-2 Interests
Class A-2 interests included both Class A-2 capital interests and Class A-2 profits interests. No Class A-2 capital interests were issued and outstanding as of December 31, 2015, and approximately 93,786,659 were issued and outstanding as of December 31, 2014. On December 31, 2014, through a series of transactions, 1,614,322 of the Class A-2 capital interests previously held by certain members of the Company’s management were transferred to the Temasek Member, and 214,433 new Class A-2 capital interests were issued to the Temasek Member, with the proceeds of such issuance being used to redeem the same number of Class A-2 profits interests held by Employee Holdco LLC (“Employee Holdco”). On November 4, 2014, the Company repurchased 1,452,667 Class A-2 capital interests from a member of the Company’s management with an original carrying value of approximately $1.4 million for $6.0 million. The excess of repurchase price over the carrying value of approximately $4.6 million was recorded as a reduction in accumulated deficit and the carrying value of approximately $1.4 million was recorded as a reduction in Class A-2 capital interests in the accompanying consolidated statements of financial condition.
Class A-2 profits interests were issued to Employee Holdco, a holding company which held the interests on behalf of certain key employees or stakeholders. Employee Holdco issued Class A-2 profits interests of Employee Holdco to such employees and stakeholders which corresponded to the underlying Class A-2 profits interests held by Employee Holdco. There were no Class A-2 profits interests issued and outstanding as of December 31, 2015 and 6,069,007 Class A-2 profits interests issued and outstanding as of December 31, 2014. Holders of Class A-2 profits interests shared in distributions of available cash flow based on the ratio of interests held to the total number of Class A-1 and Class A-2 interests outstanding, and also shared on a pro rata basis in the proceeds of a liquidity event, subject to a valuation hurdle determined by Virtu Financial at the time of the grant based on a valuation performed by a third party valuation firm. Holders of the Class A-2 profits interests shared in the proceeds of a liquidity event above such valuation hurdle, and received a preference on such distributions above such valuation threshold until all holders of Class A-2 profits interests subject to such valuation threshold had been allocated capital proceeds equal to the deemed capital contribution attributable to such Class A-2 profits interests as determined by the Company at the time of the grant.
Class B Interests
Virtu Financial previously approved the Virtu Financial LLC Management Incentive Plan (the “MIP”). Participants of the MIP were entitled to receive either Class B interests of Virtu Financial or Class B interests of Employee Holdco, which holds directly the corresponding Class B interests in Virtu Financial. Upon a liquidity event, Class B interests under the MIP were entitled to share proportionately in distributions in excess of the applicable profits interest valuation hurdle, which was determined by Virtu Financial based on a valuation at the time of the grant performed by a third party valuation firm. Class B interests were non-voting interests which vested over a four year period and upon a sale, IPO or certain other capital transactions of Virtu Financial. Class B interests were subject to forfeiture and repurchase provisions upon certain termination events. There were no Class B interests outstanding as of December 31, 2015 and Class B interests representing a right to share in 12.915% of capital proceeds (on a fully diluted basis) were issued and outstanding as of December 31, 2014. Class B interests of 0%, 0% and 2.65% were issued during the years ended December 31, 2015, 2014, and 2013
95
Distribution and Liquidation Rights
Holders of Class A-1 and Class A-2 interests shared in distributions of available cash flow based on the ratio of interests held to the total number of Class A-1 and Class A-2 interests outstanding. Holders of Class B interests were not entitled to share in such distributions.
Prior to the Reorganization Transactions, unless and until converted to Class A-2 members’ interests, upon occurrence of a capital transaction, Class A-1 interests were entitled to distributions of capital proceeds until Class A-1 members’ unrecovered capital balance (as defined) was reduced to zero. After distributions to Class A-1 members, capital proceeds would have been provided to Class A-2 capital members until Class A-2 capital members’ unrecovered capital balance (as defined) were reduced to zero. After distributions to Class A-1 and Class A-2 members, distributions of capital proceeds would have been provided to members in respect to their respective capital proceeds percentages (as defined), subject to the valuation hurdles and distribution preferences applicable to holders of Class A-2 profits interests. Holders of vested Class B interests would have shared in distributions of capital proceeds above the applicable valuation hurdle proportionately based on their capital proceeds percentages.
In the event of any voluntary or involuntary liquidation, dissolution, winding up, merger or company sale, distributions would have been made, first, to Class A-1 members’ unrecovered capital balance (as defined) until they have been reduced to zero. Second, to Class A-2 capital members, in proportion to their unrecovered capital balance (as defined) until reduced to zero and then to members in respect to their capital proceeds percentages (as defined), subject to the valuation hurdles and distribution preferences applicable to holders of Class A-2 profits interests.
Conversion Rights
Prior to the Reorganization Transactions, the Class A-1 interests were convertible into Class A-2 interests at any time at the option of the Class A-1 member on a one-for-one basis. The Class A-1 interests automatically converted upon a qualified IPO or qualified sale. Qualified IPO was defined as an initial public offering on the New York Stock Exchange or NASDAQ National Market in which the gross proceeds raised equal or exceed $100.0 million and the valuation of the Company implies a return to the Silver Lake Member equal to at least (after taking into account previous distributions) 1.75 times the invested amount. Qualified sale was defined as a sale of all or a majority of the assets of the Company or all or a majority of the limited liability company interests of the Company to a third party that is not an affiliate or other permitted transferee of any member as long as the sale (i) is for consideration consisting entirely of cash and/or marketable securities and would satisfy certain minimum return requirements applicable to Silver Lake Partners and Temasek or (ii) was approved by the Silver Lake Member or, in certain circumstances, the Temasek Member.
Redemption Rights
Unless and until conversion occurred, the Investor Members were entitled to a number of rights and benefits, including the right to call for redemption of their Class A-1 interests. Any time on or after November 24, 2016, the Silver Lake Member could have exercised such redemption right in order to cause the Company to purchase all of the Class A-1 interests owned directly or indirectly by affiliates of Silver Lake Partners. Any time on or after May 16, 2020, the Temasek Member could have exercised such redemption right in order to cause the Company to purchase all of the Class A-1 interests owned directly or indirectly by affiliates of Temasek.
Prior to the Reorganization Transactions, the redemption price for each unit of Class A-1 interests owned by the Investor Members was the greater of (i) a minimum purchase price and (ii) the fair market value of the Class A-1 interests on the date of redemption. The minimum purchase price with respect to the Class A-1 interests owned directly or indirectly by affiliates of Silver Lake Partners was equal to the purchase price paid by affiliates of Silver Lake Partners for such Class A-1 interests and the minimum purchase price with respect to the Class A-1 interests owned directly or indirectly by affiliates (as defined in the Second Amended and Restated Limited Liability Company Agreement of Virtu Financial) of Temasek was equal to the purchase price paid by affiliates (as defined in the Second Amended and Restated Limited Liability Company Agreement of Virtu Financial) of Temasek for such Class A-1 interests (in each case, less distributions received in respect of such Class A-1 interests). The Company could have
96
redeemed the Class A-1 interests using redemption notes provided that all available cash flow and all capital proceeds were used to pay down the redemption note.
In lieu of redemption, the Silver Lake Member or the Temasek Member could require the Company to purchase all of the equity securities of the affiliated entity or entities that directly or indirectly owned their Class A-1 interests on behalf of affiliates of Silver Lake Partners or Temasek, respectively, provided that any such entity had not conducted any business or operations since inception other than the direct or indirect ownership of the interests of the Company.
The redeemable equity instrument was classified outside of permanent equity on the consolidated statements of financial condition.
East Management Incentive Plan
On July 8, 2011, 2,625,000 Class A-2 capital interests were contributed by Class A-2 members to Virtu East MIP LLC (“East MIP”). East MIP issued Class A interests to the members who contributed the Class A-2 capital interests, and Class B interests (“East MIP Class B interests”) to certain key employees. East MIP Class B interests were non-voting interests which vested over the four year period ending July 8, 2015, but in any event no earlier than upon the occurrence of a sale, IPO or certain other capital transactions of Virtu Financial. Vested East MIP Class B interests were entitled to participate in distributions of the proceeds received in respect of the Class A-2 capital interests held by East MIP upon a sale or certain other capital transactions of Virtu Financial. East MIP Class B interests were subject to forfeiture and repurchase provisions upon certain termination events.
Capital structure after the Company’s Reorganization Completed on April 15, 2015 and IPO Commenced on April 16, 2015:
Initial Public Offering
On April 16, 2015, the Company commenced its IPO of 19,012,112 shares of its Class A common stock, par value $0.00001 per share, including 2,479,840 shares of Class A common stock sold in connection with the full exercise of the option to purchase additional shares granted to the underwriters, at a price to the public of $19.00 per share. The shares began trading on NASDAQ on April 16, 2015 under the ticker symbol “VIRT” and the offering was closed on April 21, 2015.
Reorganization Transactions
In connection with the IPO, a series of reorganization transactions was completed on April 15, 2015 (the “Reorganization Transactions”) among the Company, subsidiaries of Virtu Financial and equityholders of Virtu Financial which include the following persons (the ‘‘Virtu Pre-IPO Members’’):
|
· |
three affiliates of the founding member, (collectively the ‘‘Founder Pre-IPO Members’’); |
|
· |
the Silver Lake Member; |
|
· |
the Temasek Member; |
|
· |
the SLT Member; |
|
· |
two entities, one of which was and the other of which is managed by the founding member, whose equityholders include certain members of the management of Virtu Financial, (the ‘‘Management Vehicles’’); and |
|
· |
certain current and former members of the management of the Company. and Madison Tyler Holdings and their affiliates, (the ‘‘Management Members’’) |
97
In the Reorganization Transactions:
|
· |
the Company. became the sole managing member of Virtu Financial; |
|
· |
in a series of transactions, one of the Management Vehicles liquidated, with its equity interests in Virtu Financial either being distributed to its members, including certain members of management, or contributed to the other Management Vehicle (“Virtu Employee Holdco”) and certain employees of Virtu Financial based outside the United States were distributed equity interests in Virtu Financial held by Virtu Employee Holdco on behalf of such employees and such equity interests were contributed to a trust (the ‘‘Employee Trust’’), whose trustee is one of Virtu Financial’s subsidiaries; |
|
· |
two of the Founder Pre-IPO Members liquidated and distributed their equity interests in Virtu Financial to their equityholders, one of whom is TJMT Holdings LLC, the third Founder Pre-IPO Member; |
|
· |
the SLT Member distributed its equity interests in Virtu Financial to its equityholders, which consist of investment funds and other entities affiliated with Silver Lake Partners and Temasek; |
|
· |
following a series of transactions, the Company acquired equity interests in Virtu Financial as a result of certain mergers involving wholly owned subsidiaries of Virtu Financial, an affiliate of Silver Lake Partners and Temasek, and the Temasek Member (the ‘‘Mergers’’), and in exchange the Company issued to an affiliate of Silver Lake Partners (the ‘‘Silver Lake Post-IPO Stockholder’’) and an affiliate of Temasek (the ‘‘Temasek Post-IPO Stockholder’’, collectively with the Silver Lake Post-IPO Stockholder, the ‘‘Investor Post-IPO Stockholders’’) shares of Class A common stock and rights to receive payments under a tax receivable agreement described below. The number of shares of Class A common stock issued to the Investor Post-IPO Stockholders was based on the value of the Virtu Financial equity interests that we acquired, which was determined based on a hypothetical liquidation of Virtu Financial and the initial public offering price per share of the Company’s Class A common stock in the IPO; |
|
· |
all of the existing equity interests in Virtu Financial were reclassified into non-voting common interest units (‘‘Virtu Financial Units’’). The number of Virtu Financial Units issued to each member of Virtu Financial was determined based on a hypothetical liquidation of Virtu Financial and the IPO price of $19 per share of the Company’s Class A common stock. The Virtu Financial Units received by Virtu Employee Holdco, the Employee Trust and the Management Members have the same vesting restrictions as the equity interests which were reclassified. Vested Virtu Financial Units will be entitled to receive distributions, if any, from Virtu Financial. Subject to certain exceptions, unvested Virtu Financial Units are not entitled to receive such distributions (other than tax distributions). If any unvested Virtu Financial Units are forfeited, they will be cancelled by Virtu Financial for no consideration (and the Company will cancel the related shares of Class C common stock (described below) for no consideration); |
|
· |
the Company amended and restated its certificate of incorporation and issued four classes of common stock: Class A common stock, Class B common stock, Class C common stock and Class D common stock (‘‘common stock’’). The Class A common stock and Class C common stock each provide holders with one vote on all matters submitted to a vote of stockholders, and the Class B common stock and Class D common stock each provide holders with 10 votes on all matters submitted to a vote of stockholders. The holders of Class C common stock and Class D common stock do not have any of the economic rights (including rights to dividends and distributions upon liquidation) provided to holders of Class A common stock and Class B common stock. Shares of the Company’s common stock will generally vote together as a single class on all matters submitted to a vote of stockholders. The remaining members of Virtu Financial after giving effect to the Reorganization Transactions, other than the Company, (collectively as the ‘‘Virtu Post-IPO Members’’), subscribed for and purchased shares of the Company’s common stock as follows, in each case at a purchase price of $0.00001 per share and in an amount equal to the number of Virtu Financial Units held by each such Virtu Post-IPO Member; |
98
|
· |
TJMT Holdings LLC (‘‘Founder Post-IPO Member’’), purchased 79,610,490 shares of the Company’s Class D common stock; and |
|
· |
affiliates of Silver Lake Partners (the ‘‘Silver Lake Post-IPO Members’’), Virtu Employee Holdco, the Employee Trust, the Management Members and the other Virtu Post-IPO Members purchased 36,746,041 shares of the Company’s Class C common stock; and the Founder Post-IPO Member was granted the right to exchange its Virtu Financial Units, together with a corresponding number of shares of the Company’s Class D common stock, for shares of the Company's Class B common stock, and the other Virtu Post-IPO Members was granted the right to exchange their Virtu Financial Units, together with a corresponding number of shares of the Company's Class C common stock, for shares of the Company’s Class A common stock. Each share of VFI’s Class B common stock and Class D common stock is convertible at any time, at the option of the holder, into one share of Class A common stock or Class C common stock, respectively. |
Distributions in Connection with the IPO
On June 12, 2015, September 14, 2015 and November 20, 2015, Virtu Financial made cash distributions totaling $15.0 million to the holders of its outstanding equity interests prior to the consummation of the Reorganization Transactions (such holders, the “Virtu Financial Pre-IPO Members”) (funded from cash on hand). Additionally, Virtu Financial intends to make further cash distributions of up to $35.0 million to the Virtu Financial Pre-IPO Members. The Company expects that these further distributions will be funded from cash on hand and excess cash held as clearing deposits with broker dealers and clearing organizations.
Use of Proceeds of the IPO
Upon consummation of the IPO, the total gross proceeds of the offering were approximately $361.2 million. Of the proceeds, approximately $25.2 million was used to pay underwriting discounts and commissions, approximately $277.2 million was used to purchase 3,470,724 shares of Class A common stock from the Silver Lake Post-IPO Stockholder and 12,214,224 Virtu Financial Units and corresponding shares of Class C common stock from certain of the Virtu Post-IPO Members, including 4,862,609 Virtu Financial Units and corresponding shares of Class C common stock from the Silver Lake Post-IPO Members and 7,351,615 Virtu Financial Units and corresponding shares of Class C common stock from certain employees. The remaining $58.8 million of net proceeds was contributed by the Company to Virtu Financial, the operating company, which will be used for working capital and general corporate purposes. Other offering costs incurred were approximately $8.6 million and were paid by Virtu Financial.
Secondary Offering
In November 2015, an offering (the “Secondary Offering”) of 6,473,371 shares of the Company’s Class A common stock was completed by the Company and certain selling stockholders affiliated with Silver Lake Partners. The selling stockholders sold 6,075,837 shares of Class A common stock and the Company sold 397,534 shares of Class A common stock at a price to the public of $22.15 per share. The selling stockholders received all of the net proceeds from the sale of shares of Class A common stock by them in the offering. The Company used its net proceeds from the offering to purchase common units in Virtu Financial (and paired shares of Class C common stock) from one of its non-executive employees at a net price equal to the price paid by the underwriters for shares of its Class A common stock. As a result of the completion of the IPO, the Reorganization Transactions and the Secondary Offering, the Company holds approximately 27.5% interest in Virtu Financial at December 31, 2015.
2015 Management Incentive Plan
VFI’s Board of Directors and stockholders adopted the 2015 Management Incentive Plan, which became effective upon consummation of the IPO. The 2015 Management Incentive Plan provides for the grant of stock options, restricted stock units, and other awards based on an aggregate of 12,000,000 shares of Class A common stock, subject to additional sublimits, including limits on the total option grant to any one participant in a single year and the total performance award to any one participant in a single year.
99
14. Share-based Compensation
Share-based compensation prior to the Company’s Reorganization completed on April 15, 2015 and IPO commenced on April 16, 2015:
During the years ended December 31, 2015, 2014, and 2013, the Company recorded expense relating to non-voting members’ interests, which as described above (Note 13), were originally granted as Class A-2 profits interests and were reclassified into non-voting common interest units in connection with the Reorganization Transactions. The non-voting members’ interests are subject to the same vesting requirements as the prior Class A-2 profits interests, which vested immediately or over a period of up to four years, and in each case are subject to repurchase provisions upon certain termination events, as described above (Note 13). These awards are accounted for as equity awards and are measured at the date of grant. The Company recognized compensation expense of $1.5 million, $16.0 million, and $13.4 million for the years ended December 31, 2015, 2014, and 2013, respectively, related to the non-voting members’ interests (formerly Class A-2 profits interests). As of December 31, 2015, total unrecognized share-based compensation expense related to unvested non-voting members’ interests (formerly Class A-2 profits interests) was $2.2 million and this amount is expected to be recognized over a weighted average period of 1.6 years.
Activity in the non-voting members’ interests (formerly Class A-2 profits interests) is as follows:
|
|
|
|
|
|
|
|
Weighted |
|
|
|
|
|
|
Weighted |
|
Average |
|
|
|
|
|
Number of |
|
Average Fair |
|
Remaining |
|
|
|
|
|
Interests |
|
Value |
|
Life |
|
|
|
Outstanding December 31, 2013 |
|
4,434,452 |
|
$ |
6.82 |
|
3.40 |
|
|
Interests granted |
|
1,992,556 |
|
|
7.52 |
|
— |
|
|
Interests repurchased |
|
(358,001) |
|
|
6.51 |
|
— |
|
|
Outstanding December 31, 2014 |
|
6,069,007 |
|
$ |
6.82 |
|
2.54 |
|
|
Interests granted |
|
6,418 |
|
|
7.52 |
|
3.00 |
|
|
Interests repurchased |
|
(13,495) |
|
|
7.17 |
|
— |
|
|
Outstanding immediately prior to the Reorganization Transactions |
|
6,061,930 |
|
$ |
6.82 |
|
2.27 |
|
As indicated in Note 13, Class B and East MIP Class B interests were subject to time based vesting over four years and only fully vested upon the consummation of a qualifying capital transaction by the Company, including an IPO. Upon the consummation of the IPO, certain Class B and East MIP Class B interests became vested, resulting in a compensation expense of $41.4 million, which reflected the fair value of the outstanding time-vested Class B and East MIP Class B interests measured at the date of grant. Additional compensation expense in respect of Class B and East MIP Class B interests still subject to time vesting for the year ended December 31, 2015 was $3.5 million. The total expense for the year ended December 31, 2015 was $44.9 million. The compensation expense related to Class B and East MIP Class B interests was included within charges related to share based compensation at IPO in the consolidated statements of comprehensive income. As of December 31, 2014, a capital transaction was not considered probable, and therefore none of the Class B or East MIP Class B interests were vested, and no compensation expense was recognized relating to these awards in the prior years. As of December 31, 2015, total unrecognized share-based compensation expense related to unvested Class B interests and East MIP Class B interest was $2.1 million and this amount is expected to be recognized over a weighted average period of 1.8 years.
Additionally, in connection with the compensation charges related to Class B and East MIP Class B interests mentioned above, the Company capitalized $9.2 million for the year ended December 31, 2015. The related amortization costs were approximately $8.5 million for the year ended December 31, 2015. The costs attributable to employees incurred in development of software for internal use were included within charges related to share based compensation at IPO in the consolidated statements of comprehensive income.
The fair value of the Class A-2 profits, Class B and East MIP Class B interests was estimated by the Company using an option pricing methodology based on expected volatility, risk-free rates and expected life. Expected volatility is calculated based on companies in the same peer group as the Company. The weighted-average assumptions used by the
100
Company in estimating the grant date fair values of the Class A-2 profits, Class B and East MIP Class B interests for the years ended December 31, 2015, 2014 and 2013 are summarized below:
|
|
|
Year Ended December 31, |
|
||||
|
|
|
2015 |
|
2014 |
|
2013 |
|
|
Expected life (in years) |
|
2.7 |
|
0.5 |
|
0.5 |
|
|
Weighted average risk free interest rate |
|
0.72 |
% |
0.12 |
% |
0.10 |
% |
|
Expected stock price volatility |
|
47 |
% |
25 |
% |
25 |
% |
|
Expected dividend yield |
|
— |
|
— |
|
— |
|
In connection with the Reorganization Transactions, all Class A-2 profits interests, Class B and East MIP Class B interests were reclassified into non-voting common interest units. As of December 31, 2015, there were 15,394,426 non-voting common interest units outstanding related to the aforementioned interests.
Share-based compensation after the Company’s Reorganization completed on April 15, 2015 and IPO completed on April 16, 2015:
Stock options
Pursuant to the 2015 Management Incentive Plan as described above (Note 13) and in connection with the IPO, non-qualified stock options to purchase 9,228,000 shares of Class A Common Stock were granted, each of which vests in equal annual installments over a period of four years from grant date and expires not later than 10 years from the date of grant.
The following table summarizes activity related to stock options for the year ended December 31, 2015:
|
|
|
Options Outstanding |
|
Options Exercisable |
|
|||||||||
|
|
|
|
|
Weighted Average |
|
Weighted Average |
|
|
|
Weighted Average |
|
|||
|
|
|
Number of |
|
Exercise Price |
|
Remaining |
|
Number of |
|
Exercise Price |
|
|||
|
|
|
Options |
|
Per Share |
|
Contractual Life |
|
Options |
|
Per Share |
|
|||
|
At December 31, 2014 |
|
— |
|
$ |
— |
|
|
— |
|
— |
|
$ |
— |
|
|
Granted |
|
9,228,000 |
|
|
19.00 |
|
|
10.00 |
|
— |
|
|
— |
|
|
Exercised |
|
— |
|
|
— |
|
|
— |
|
— |
|
|
— |
|
|
Forfeited or expired |
|
(234,000) |
|
|
19.00 |
|
|
10.00 |
|
— |
|
|
— |
|
|
At December 31, 2015 |
|
8,994,000 |
|
$ |
19.00 |
|
|
9.29 |
|
— |
|
$ |
— |
|
The fair value of the stock option grants was determined through the application of the Black-Scholes-Merton model with the following assumptions:
|
|
|
|
|
|
|
|
|
|
Year Ended |
|
|
|
|
|
December 31, 2015 |
|
|
Expected life (in years) |
|
|
6.25 |
|
|
Weighted average risk free interest rate |
|
|
1.52 |
% |
|
Expected stock price volatility |
|
|
30 |
% |
|
Expected dividend yield |
|
|
5.05 |
% |
|
Weighted average fair value at grant date |
|
$ |
3.02 |
|
The expected life has been determined based on an average of vesting and contractual period. The risk-free interest rate was determined based on the yields available on U.S. Treasury zero-coupon issues. The expected stock price volatility was determined based on historical volatilities of comparable companies. The expected dividend yield was determined based on estimated future dividend payments divided by the IPO stock price.
The Company recognized $4.7 million of compensation expense in relation to the stock options issued and outstanding for the year ended December 31, 2015. As of December 31, 2015, total unrecognized share-based
101
compensation expense related to unvested stock options was $22.4 million and this amount is to be recognized over a weighted average period of 3.3 years.
Class A common stock and Restricted Stock Units
Pursuant to the 2015 Management Incentive Plan as described above (Note 13) and in connection with and subsequent to the IPO, 576,693 shares of immediately vested Class A common stock and 984,466 restricted stock units were granted, which vest over a period of up to 4 years. The fair value of the Class A common stock and restricted stock units was determined based on the volume weighted average price during the three days preceding the grant and will be recognized on a straight line basis over the vesting period.
The following table summarizes activity related to the restricted stock units for the year ended December 31, 2015:
|
|
|
|
|
Weighted |
|
|
|
|
Number of |
|
Average Fair |
|
|
|
|
Shares |
|
Value |
|
|
At December 31, 2014 |
|
— |
|
$ |
— |
|
Granted |
|
984,466 |
|
|
22.32 |
|
Forfeited |
|
— |
|
|
— |
|
Vested |
|
— |
|
|
— |
|
At December 31, 2015 |
|
984,466 |
|
$ |
22.32 |
The Company recognized $13.7 million of compensation expense in relation to the Class A common stock and restricted stock units issued for the year ended December 31, 2015. As of December 31, 2015, total unrecognized share-based compensation expense related to unvested restricted stock units was $20.9 million, and this amount is to be recognized over a weighted average period of 3.0 years.
15. Property, Equipment and Capitalized Software
Property, equipment and capitalized software consisted of the following at December 31, 2015 and 2014:
|
|
|
December 31, |
|
||||
|
(in thousands) |
|
2015 |
|
2014 |
|
||
|
Capitalized software costs |
|
$ |
66,573 |
|
$ |
47,484 |
|
|
Leasehold improvements |
|
|
3,567 |
|
|
8,799 |
|
|
Furniture and equipment |
|
|
65,879 |
|
|
72,863 |
|
|
Land |
|
|
77 |
|
|
77 |
|
|
|
|
|
136,096 |
|
|
129,223 |
|
|
Less: Accumulated depreciation and amortization |
|
|
(98,595) |
|
|
(84,579) |
|
|
Total property, equipment and capitalized software, net |
|
$ |
37,501 |
|
$ |
44,644 |
|
Depreciation expense for property and equipment for the years ended December 31, 2015, 2014, and 2013 was approximately $24.0 million, $20.0 million and $12.9 million, respectively, and is included within depreciation and amortization expense in the accompanying consolidated statements of comprehensive income. Amortization expense for capitalized software for years ended December 31, 2015, 2014 and 2013 was approximately $9.6 million, $10.4 million and $11.0 million, respectively, and is included within depreciation and amortization expense in the accompanying consolidated statements of comprehensive income.
16. Regulatory Requirement
As of December 31, 2015, two subsidiaries of the Company are subject to the SEC Uniform Net Capital Rule 15c3-1, which requires the maintenance of minimum net capital of $1.0 million for each of the two broker-dealer subsidiaries. At December 31, 2015, the subsidiaries had net capital of approximately $64.2 million and $8.5 million, which was approximately $63.2 million and $7.5 million in excess of its required net capital of $1.0 million and $1.0 million, respectively. At December 31, 2014, the subsidiaries had net capital of approximately $59.8 million and
102
$8.1 million, which was approximately $58.8 million and $7.1 million in excess of its required net capital of $1.0 million and $1.0 million, respectively.
Pursuant to NYSE and NYSE MKT (formerly NYSE Amex) rules, the Company was also required to maintain $1.9 million and $3.7 million of capital in connection with the operation of the Company's Designated Market Maker (“DMM”) business as of December 31, 2015 and 2014, respectively. The required amount is determined under the exchange rules as the greater of $1 million or 15% of the market value of 60 trading units for each symbol in which the Company is registered as the DMM.
17. Geographic Information
The Company operates its business in the U.S. and internationally, primarily in Europe and Asia. Significant transactions and balances between geographic regions occur primarily as a result of certain of our subsidiaries incurring operating expenses such as employee compensation, communications and data processing and other overhead costs, for the purpose of providing execution, clearing and other support services to affiliates. Charges for transactions between regions are designed to approximate full costs. Intra-region income and expenses and related balances have been eliminated in the geographic information presented below to accurately reflect the external business conducted in each geographical region. The revenues are attributed to countries based on the locations of the subsidiaries. The following table presents total revenues by geographic area for the years ended December 31, 2015, 2014, and 2013:
|
|
|
For the Years Ended |
|
|||||||
|
|
|
December 31, |
|
|||||||
|
(in thousands) |
|
2015 |
|
2014 |
|
2013 |
|
|||
|
Revenues: |
|
|
|
|
|
|
|
|
|
|
|
United States |
|
$ |
537,310 |
|
$ |
509,105 |
|
$ |
432,900 |
|
|
Australia |
|
|
23 |
|
|
86 |
|
|
87 |
|
|
Ireland |
|
|
166,739 |
|
|
141,793 |
|
|
129,662 |
|
|
Singapore |
|
|
91,816 |
|
|
72,069 |
|
|
98,917 |
|
|
China |
|
|
325 |
|
|
— |
|
|
— |
|
|
United Kingdom |
|
|
— |
|
|
— |
|
|
2,939 |
|
|
Total revenues |
|
$ |
796,213 |
|
$ |
723,053 |
|
$ |
664,505 |
|
18. Related Party Transactions
As of December 31, 2015, and December 31, 2014, the Company had a payable of $0.2 million and $0.4 million to its affiliates, respectively.
In the ordinary course of business, the Company purchases and leases computer equipment and maintenance and support from affiliates of Dell Inc. (“Dell”). Silver Lake and its affiliates have a significant ownership interest in Dell. During the years ended December 31, 2015, 2014, and 2013, the Company paid $3.5 million, $1.0 million, and $1.4 million, respectively, to Dell for these purchases and leases.
Similarly, in the ordinary course of business, the Company purchases market data and related services from Interactive Data Pricing and Reference Data, Inc (“Interactive Data”) and SunGard Securities Finance LLC (“SunGard”). Silver Lake and its affiliates have a significant ownership interest in Interactive Data and SunGard. During the years ended December 31, 2015, 2014, and 2013, the Company paid $0.4 million, $0.3 million, and $0.2 million, respectively, to Interactive Data for these purchases. During the years ended December 31, 2015, 2014, and 2013, the Company paid $0.2 million, $0.2 million, $0.2 million, respectively, to Sungard for these purchases. Finally, in the ordinary course of business, the Company purchases telecommunications services from Singapore Telecommunications Limited (“Singtel”). Temasek and its affiliates have a significant ownership interest in Singtel. During the years ended December 31, 2015, 2014, and 2013, the Company paid $0.1 million, $0.2 million, and $0.1 million, respectively, to Singtel for these purchases.
The Company has employed the son of the Company’s Founder and Executive Chairman, as a trader. The Company paid approximately $0.8 million, $0.6 million, and $0.5 million for the years ended 2015, 2014 and 2013,
103
respectively. This employee was also granted 60,000 stock options with respect to shares of our Class A common stock under the 2015 Management Incentive Plan.
The Company has engaged a member of the Board of Directors to provide leadership consulting services. The Company has paid approximately $0.1 million, $0.1 million and $0.2 million for such engagement for the years ended 2015, 2014 and 2013, respectively.
The Company entered into certain futures clearing transactions with a futures commission merchant owned by the Company’s Founder and Executive Chairman, in the ordinary course of business. In December 2013, Founder and Executive Chairman disposed of its interests in Pioneer Futures, Inc.
Additionally, the Company entered into a sublease arrangement with an affiliate of the Company’s Founder and Executive Chairman for office space no longer used by the Company. For the year ended December 31, 2015, the Company recognized $0.1 million pursuant to this arrangement.
19. Parent Company
VFI is a managing member of Virtu Financial, which guarantees the indebtedness of its direct subsidiary under the senior secured facility (Note 8). VFI is limited to its ability to receive distributions (including for purposes of paying corporate and other overhead expenses and dividends) from Virtu Financial under the credit agreement. The following financial statements (the “Parent Company Only Financial Statements”) should be read in conjunction with the consolidated financial statements of the Company and the foregoing.
The financial statements as of December 31, 2015 and for the year then ended relate to VFI for the period following the commencement of its IPO on April 16, and to Virtu Financial for period preceding. The condensed statement of financial condition as of December 31, 2015 reflects the financial condition of VFI and the condensed statement of financial condition as of December 31, 2014 reflects the financial condition of Virtu Financial. The condensed statements of comprehensive income and of cash flows for the year ended December 31, 2015 reflect the condensed operating results and cash flows of Virtu Financial prior to April 15, 2015 and reflect the condensed operating results and cash flows of VFI from April 16, 2015 through December 31, 2015.
104
Virtu Financial, Inc.
(Parent Company Only)
Condensed Statements of Financial Condition
|
|
|
As of December 31, |
|
||||
|
(In thousands except interest data) |
|
2015 |
|
2014 |
|
||
|
Assets |
|
|
|
|
|
|
|
|
Cash |
|
$ |
187 |
|
$ |
25,939 |
|
|
Deferred tax asset |
|
|
193,153 |
|
|
— |
|
|
Investment in subsidiary |
|
|
157,887 |
|
|
768,423 |
|
|
Other assets |
|
|
1 |
|
|
29 |
|
|
Receivable from subsidiaries |
|
|
15 |
|
|
12,865 |
|
|
Total assets |
|
$ |
351,243 |
|
$ |
807,256 |
|
|
|
|
|
|
|
|
|
|
|
Liabilities, redeemable membership interest and equity |
|
|
|
|
|
|
|
|
Liabilities |
|
|
|
|
|
|
|
|
Payable to affiliate |
|
$ |
— |
|
$ |
291,444 |
|
|
Accounts payable and accrued expenses and other liabilities |
|
|
2,136 |
|
|
9,114 |
|
|
Tax receivable agreement obligations |
|
|
218,399 |
|
|
— |
|
|
Total liabilities |
|
$ |
220,535 |
|
$ |
300,558 |
|
|
|
|
|
|
|
|
|
|
|
Class A-1 redeemable membership interest |
|
|
— |
|
|
294,433 |
|
|
|
|
|
|
|
|
|
|
|
Stockholders' / Members' equity |
|
|
|
|
|
|
|
|
Class A-1 — Authorized and Issued — 0 and 1,964,826 interests, Outstanding — 0 and 1,964,826 interests, at December 31, 2015 and 2014, respectively |
|
|
— |
|
|
19,648 |
|
|
Class A-2 — Authorized and Issued — 0 and 101,381,332 interests, Outstanding — 0 and 99,855,666 interests, at December 31, 2015 and 2014, respectively |
|
|
— |
|
|
287,705 |
|
|
Class A common stock (par value $0.00001), Authorized — 1,000,000,000 and 0 shares, Issued — 38,379,858 and 0 shares, Outstanding — 38,210,209 and 0 shares at December 31, 2015 and 2014, respectively |
|
|
— |
|
|
— |
|
|
Class B common stock (par value $0.00001), Authorized — 175,000,000 and 0 shares, Issued and Outstanding — 0 and 0 shares at December 31, 2015 and 2014, respectively |
|
|
— |
|
|
— |
|
|
Class C common stock (par value $0.00001), Authorized — 90,000,000 and 0 shares, Issued and Outstanding — 20,976,598 and 0 shares at December 31, 2015 and 2014, respectively |
|
|
— |
|
|
— |
|
|
Class D common stock (par value $0.00001), Authorized — 175,000,000 and 0 shares, Issued and Outstanding — 79,610,490 and 0 shares at December 31, 2015 and 2014, respectively |
|
|
1 |
|
|
— |
|
|
Treasury stock, at cost, 169,649 and 0 shares |
|
|
(3,819) |
|
|
— |
|
|
Additional paid-in capital |
|
|
130,902 |
|
|
— |
|
|
Retained Earnings (Accumulated deficit) |
|
|
3,525 |
|
|
(91,383) |
|
|
Accumulated other comprehensive income (loss) |
|
|
99 |
|
|
(3,705) |
|
|
Total stockholders' / members' equity |
|
$ |
130,708 |
|
$ |
212,265 |
|
|
|
|
|
|
|
|
|
|
|
Total liabilities, redeemable membership interest and equity |
|
$ |
351,243 |
|
$ |
807,256 |
|
Virtu Financial, Inc.
(Parent Company Only)
Condensed Statements of Comprehensive Income
|
|
|
For the Years Ended |
|
|||||||
|
|
|
December 31, |
|
|||||||
|
(in thousands) |
|
2015 |
|
2014 |
|
2013 |
|
|||
|
Revenues: |
|
|
|
|
|
|
|
|
|
|
|
Service fee revenue |
|
$ |
445 |
|
$ |
13,492 |
|
$ |
2,089 |
|
|
|
|
|
|
|
|
|
|
|
|
|
|
Operating Expenses: |
|
|
|
|
|
|
|
|
|
|
|
Operations and administrative |
|
|
447 |
|
|
13,492 |
|
|
2,089 |
|
|
|
|
|
|
|
|
|
|
|
|
|
|
Income (loss) before equity in income of subsidiary |
|
|
(2) |
|
|
— |
|
|
— |
|
|
Equity in income of subsidiary, net of tax |
|
|
104,036 |
|
|
190,057 |
|
|
182,203 |
|
|
Net income |
|
$ |
104,034 |
|
$ |
190,057 |
|
$ |
182,203 |
|
|
Net income attributable to common stockholders |
|
|
20,887 |
|
|
— |
|
|
— |
|
|
Other comprehensive income (loss): |
|
|
|
|
|
|
|
|
|
|
|
Foreign currency translation adjustment, net of taxes |
|
|
(4,534) |
|
|
(5,032) |
|
|
1,382 |
|
|
Comprehensive income |
|
$ |
16,353 |
|
$ |
185,025 |
|
$ |
183,585 |
|
105
Virtu Financial, Inc.
(Parent Company Only)
Condensed Statements of Cash Flows
|
|
|
For the Years Ended |
|
|||||||
|
|
|
December 31, |
|
|||||||
|
(in thousands) |
|
2015 |
|
2014 |
|
2013 |
|
|||
|
Cash flows from operating activities |
|
|
|
|
|
|
|
|
|
|
|
Net income |
|
$ |
104,034 |
|
$ |
190,057 |
|
$ |
182,203 |
|
|
|
|
|
|
|
|
|
|
|
|
|
|
Adjustments to reconcile net income to net cash provided by operating activities: |
|
|
|
|
|
|
|
|
|
|
|
Equity in income of subsidiary, net of tax |
|
|
(18,237) |
|
|
(24,469) |
|
|
244,854 |
|
|
Deferred taxes |
|
|
3,392 |
|
|
— |
|
|
— |
|
|
Changes in operating assets and liabilities: |
|
|
5,900 |
|
|
(14,056) |
|
|
(6,529) |
|
|
Net cash provided by (used in) operating activities |
|
|
95,089 |
|
|
151,532 |
|
|
420,528 |
|
|
|
|
|
|
|
|
|
|
|
|
|
|
Cash flows from investing activities |
|
|
|
|
|
|
|
|
|
|
|
Investments in subsidiaries, equity basis |
|
|
64,624 |
|
|
15,953 |
|
|
13,441 |
|
|
Net cash provided by investing activities |
|
|
64,624 |
|
|
15,953 |
|
|
13,441 |
|
|
|
|
|
|
|
|
|
|
|
|
|
|
Cash flows from financing activities |
|
|
|
|
|
|
|
|
|
|
|
Distribution to members through April 15, 2015 |
|
|
(130,000) |
|
|
(140,652) |
|
|
(433,400) |
|
|
Distribution from Virtu Financial to non-controlling interest, after April 15, 2015 |
|
|
(81,377) |
|
|
— |
|
|
— |
|
|
Dividends to Class A shareholders |
|
|
(17,362) |
|
|
— |
|
|
— |
|
|
Proceeds from issuance of Class A-2 interests in connection with the Temasek transaction described in Note 13 |
|
|
— |
|
|
3,048 |
|
|
— |
|
|
Repurchase of Class A-2 interests in connection with the Temasek transaction described in Note 13 |
|
|
— |
|
|
(3,048) |
|
|
— |
|
|
Repurchase of Class A-2 interests |
|
|
(2,097) |
|
|
(916) |
|
|
(573) |
|
|
Purchase of treasury stock |
|
|
(3,819) |
|
|
— |
|
|
— |
|
|
Issuance of common stock, net of offering costs |
|
|
327,366 |
|
|
— |
|
|
— |
|
|
Repurchase of Virtu Financial Units and corresponding number of Class A and C common stock in connections with IPO |
|
|
(277,153) |
|
|
— |
|
|
— |
|
|
Issuance of common stock in connection with secondary offering, net of offering costs |
|
|
7,782 |
|
|
— |
|
|
— |
|
|
Repurchase of Virtu Financial Units and corresponding number of Class A and C common stock in connection with secondary offering |
|
|
(8,805) |
|
|
— |
|
|
— |
|
|
Net cash used in financing activities |
|
$ |
(185,465) |
|
$ |
(141,568) |
|
$ |
(433,973) |
|
|
|
|
|
|
|
|
|
|
|
|
|
|
Net increase (decrease) in Cash |
|
$ |
(25,752) |
|
$ |
25,917 |
|
$ |
(4) |
|
|
Cash, beginning of period |
|
|
25,939 |
|
|
22 |
|
|
26 |
|
|
Cash, end of period |
|
$ |
187 |
|
$ |
25,939 |
|
$ |
22 |
|
|
|
|
|
|
|
|
|
|
|
|
|
|
Supplemental disclosure of cash flow information: |
|
|
|
|
|
|
|
|
|
|
|
Taxes paid |
|
$ |
5,615 |
|
$ |
— |
|
$ |
— |
|
|
|
|
|
|
|
|
|
|
|
|
|
|
Non-cash financing activities |
|
|
|
|
|
|
|
|
|
|
|
Tax receivable agreement described in Note 4 |
|
|
(21,854) |
|
|
- |
|
|
- |
|
|
Secondary offering described in Note 13 |
|
|
- |
|
|
- |
|
|
- |
|
|
Temasek transaction described in Note 13 |
|
|
- |
|
|
- |
|
|
- |
|
|
Repurchase of Class A-2 interests |
|
|
- |
|
|
(6,000) |
|
|
- |
|
106
20. Subsequent Events
The Company has evaluated subsequent events for adjustment to or disclosure in its consolidated financial statements through the date of this report, and has not identified any recordable or disclosable events, not otherwise reported in these consolidated financial statements or the notes thereto, except for the following:
Virtu Financial made distributions to its members, including the Company, in the amount of $55.0 million from January 1, 2016, to March 25, 2016.
The Company’s Board of Directors declared a dividend of $0.24 per share of Class A common stock and Class B common stock and per Restricted Stock Unit that was paid on March 15, 2016 to holders of record as of March 1, 2016.
In January 2016 the Company renewed its arrangement to provide technology services to a third party for an additional one year period.
107
SUPPLEMENTAL FINANCIAL INFORMATION
Consolidated Quarterly Results of Operations (Unaudited)
|
|
|
|
For the Three Months Ended |
|||||||||
|
(in thousands, except share and per share data) |
|
|
March 31, 2015 |
|
|
June 30, 2015 |
|
|
September 30, 2015 |
|
|
December 31, 2015 |
|
|
|
|
|
|
|
|
|
|
|
|
|
|
|
Total revenue |
|
$ |
221,528 |
|
$ |
181,979 |
|
$ |
215,802 |
|
$ |
176,904 |
|
Total operating expenses |
|
|
141,356 |
|
|
172,417 |
|
|
136,885 |
|
|
129,626 |
|
Operating income |
|
$ |
80,172 |
|
$ |
9,562 |
|
$ |
78,917 |
|
$ |
47,278 |
|
Net income |
|
$ |
77,444 |
|
$ |
7,565 |
|
$ |
69,539 |
|
$ |
42,942 |
|
Less: net income attributable to noncontrolling interests |
|
|
77,444 |
|
|
7,091 |
|
|
57,233 |
|
|
34,835 |
|
Net income attributable to Virtu Financial, Inc. |
|
$ |
— |
|
$ |
474 |
|
$ |
12,306 |
|
$ |
8,107 |
|
Net income per share of common stock: |
|
|
|
|
|
|
|
|
|
|
|
|
|
Basic |
|
|
N/A |
|
$ |
0.01 |
|
$ |
0.36 |
|
$ |
0.23 |
|
Diluted |
|
|
N/A |
|
$ |
0.01 |
|
$ |
0.35 |
|
$ |
0.22 |
|
|
|
|
For the Three Months Ended |
|||||||||
|
(in thousands, except share and per share data) |
|
|
March 31, 2014 |
|
|
June 30, 2014 |
|
|
September 30, 2014 |
|
|
December 31, 2014 |
|
|
|
|
|
|
|
|
|
|
|
|
|
|
|
Total revenue |
|
$ |
173,295 |
|
$ |
162,976 |
|
$ |
173,234 |
|
$ |
213,548 |
|
Total operating expenses |
|
|
123,440 |
|
|
133,450 |
|
|
130,637 |
|
|
141,968 |
|
Operating income |
|
$ |
49,855 |
|
$ |
29,526 |
|
$ |
42,597 |
|
$ |
71,580 |
|
Net income |
|
$ |
48,889 |
|
$ |
30,842 |
|
$ |
41,418 |
|
$ |
68,908 |
|
Net income per share of common stock: |
|
|
|
|
|
|
|
|
|
|
|
|
|
Basic |
|
|
N/A |
|
|
N/A |
|
|
N/A |
|
|
N/A |
|
Diluted |
|
|
N/A |
|
|
N/A |
|
|
N/A |
|
|
N/A |
108
ITEM 9. CHANGES IN AND DISAGREEMENTS WITH ACCOUNTANTS ON ACCOUNTING AND FINANCIAL DISCLOSURE
None.
ITEM 9A. CONTROLS AND PROCEDURES
Evaluation of Disclosure Controls and Procedures
Under the supervision and with the participation of our Chief Executive Officer and Chief Financial Officer, management has evaluated the effectiveness of the design and operation of our disclosure controls and procedures (as defined in Rules 13a-15(e) or 15d-15(e) of the Securities Exchange Act of 1934, (the “Exchange Act”)) as of December 31, 2015. Based upon that evaluation, our Chief Executive Officer and Chief Financial Officer concluded that, as of December 31, 2015, our disclosure controls and procedures were effective to ensure information required to be disclosed by us in the reports we file or submit under the Exchange Act is recorded, processed, summarized and reported within the periods specified in the Securities and Exchange Commission’s rules and forms and is accumulated and communicated to our management, including our Chief Executive Officer and Chief Financial Officer, as appropriate to allow timely decisions regarding required disclosure.
Our management, including our Chief Executive Officer and Chief Financial Officer, does not expect that our disclosure controls and procedures will prevent all errors and all fraud. A control system, no matter how well conceived and operated, can provide only reasonable, not absolute, assurance that the objectives of the control system are met. Further, the design of a control system must reflect the fact that there are resource constraints, and the benefits of controls must be considered relative to their costs. Because of the inherent limitations in all control systems, no evaluation of controls can provide absolute assurance that all control issues and instances of fraud, if any, with the Company have been detected. These inherent limitations include the realities that judgments in decision-making can be faulty and that breakdowns can occur because of simple error and mistake. Additionally, controls can be circumvented by the individual acts of some persons, by collusion of two or more people or by management override of controls.
The design of any system of controls also is based in part upon certain assumptions about the likelihood of future events, and there can be no assurance that any design will succeed in achieving its stated goals under all potential future conditions. Over time, a control may become inadequate because of changes in conditions or because the degree of compliance with the policies or procedures may deteriorate. Because of the inherent limitations in a cost-effective control system, misstatements due to error or fraud may occur and may not be detected.
Management’s Report on Internal Control over Financial Reporting
This Form 10-K does not include a report of management’s assessment regarding internal control over financial reporting or an attestation report of the Company’s registered public accounting firm due to a transition period established by the rules of the SEC for newly public companies.
Changes to Internal Control over Financial Reporting
No change in our internal control over financial reporting (as defined in Rule 13a-15(f) under the Exchange Act) occurred during the year ended December 31, 2015 that has or is reasonably likely to materially affect, our internal control over financial reporting.
None.
109
ITEM 10. DIRECTORS, EXECUTIVE OFFICERS, AND CORPORATE GOVERNANCE
Information with respect to this Item will be set forth in our 2016 Proxy Statement, which will be filed with the Securities and Exchange Commission no later than 120 days after December 31, 2015. For the limited purpose of providing the information necessary to comply with this Item 10, the 2016 Proxy Statement is incorporated herein by this reference. All references to the Proxy Statement in this Part III are exclusive of the information set forth under the caption “Audit Committee Report.”
Our board of directors has adopted a Code of Business Conduct and Ethics applicable to all officers, directors and employees, which is available on our website (www.virtu.com) under "Corporate Governance." We intend to satisfy the disclosure requirement under Item 5.05 of Form 8-K regarding amendment to, or waiver from, a provision of our Code of Business Conduct and Ethics by posting such information on our website at the address and location specified above.
ITEM 11. EXECUTIVE COMPENSATION
Information with respect to this Item will be set forth in our 2016 Proxy Statement, which will be filed with the Securities and Exchange Commission no later than 120 days after December 31, 2015. For the limited purpose of providing the information necessary to comply with this Item 11, the 2016 Proxy Statement is incorporated herein by this reference.
ITEM 12. SECURITY OWNERSHIP OF CERTAIN BENEFICIAL OWNERS AND MANAGEMENT AND RELATED STOCKHOLDER MATTERS
Information with respect to this Item will be set forth in our 2016 Proxy Statement, which will be filed with the Securities and Exchange Commission no later than 120 days after December 31, 2015. For the limited purpose of providing the information necessary to comply with this Item 12, the 2016 Proxy Statement is incorporated herein by this reference.
ITEM 13. CERTAIN RELATIONSHIPS AND RELATED TRANSACTIONS, AND DIRECTOR INDEPENDENCE
Information with respect to this Item will be set forth in our 2016 Proxy Statement, which will be filed with the Securities and Exchange Commission no later than 120 days after December 31, 2015. For the limited purpose of providing the information necessary to comply with this Item 13, the 2016 Proxy Statement is incorporated herein by this reference.
ITEM 14. PRINCIPAL ACCOUNTANT FEES AND SERVICES
Information with respect to this Item will be set forth in our 2016 Proxy Statement, which will be filed with the Securities and Exchange Commission no later than 120 days after December 31, 2015. For the limited purpose of providing the information necessary to comply with this Item 14, the 2016 Proxy Statement is incorporated herein by this reference.
110
ITEM 15. EXHIBITS AND FINANCIAL STATEMENT SCHEDULES
|
1. |
Consolidated Financial statements |
The consolidated financial statement required to be filed in the Form 10-K are listed in Part II, Item 8 hereof.
|
2. |
Financial Statement Schedule |
See “Index to Consolidated Financial Statements” in this Form 10-K listed in Part II, Item 8 hereof.
|
3. |
Exhibits |
111
|
Exhibit Number |
|
Description |
|
2.1* |
|
Reorganization Agreement, dated April 15, 2015, by and among Virtu Financial, Inc., Virtu Financial Merger Sub LLC, Virtu Financial Intermediate Holdings LLC, Virtu Financial Merger Sub II LLC, Virtu Financial Intermediate Holdings II LLC, Virtu Financial LLC, VFH Parent LLC, SLP Virtu Investors, LLC, SLP III EW Feeder I, L.P., SLP III EW Feeder II, L.P., Silver Lake Technology Associates III, L.P., SLP III EW Feeder LLC, Havelock Fund Investments Pte Ltd., Wilbur Investments LLC, VV Investment LLC, Virtu East MIP LLC, Virtu Employee Holdco LLC, TJMT Holdings LLC (f/k/a Virtu Holdings LLC), Virtu Financial Holdings LLC and the Other Class A Members named therein (incorporated herein by reference to Exhibit 2.1 to the Company's Quarterly Report on Form 10-Q, as amended (File No. 001-37352), filed on May 29, 2015). |
|
2.2* |
|
Merger Agreement, dated April 15, 2015, by and among Virtu Financial, Inc., Virtu Financial Merger Sub LLC, Virtu Financial Intermediate Holdings LLC, SLP III EW Feeder Corp., SLP III EW Feeder I, L.P. and Havelock Fund Investments Pte Ltd (incorporated herein by reference to Exhibit 2.2 to the Company's quarterly report on Form 10-Q, as amended (File No. 001-37352), filed on May 29, 2015). |
|
2.3* |
|
Merger Agreement, dated April 15, 2015, by and among Virtu Financial, Inc., Virtu Financial Merger Sub II LLC, Virtu Financial Intermediate Holdings II LLC and Wilbur Investments LLC (incorporated herein by reference to Exhibit 2.3 to the Company's Quarterly Report on Form 10-Q, as amended (File No. 001-37352), filed on May 29, 2015). |
|
3.1* |
|
Amended and Restated Certificate of Incorporation of the Registrant. |
|
3.2* |
|
Amended and Restated By-laws of the Registrant. |
|
10.1* |
|
Second Amended and Restated Credit Agreement, dated as of November 8, 2013, as amended by Amendment No. 1, Incremental Revolving Facility Amendment and Joinder Agreement, dated as of April 15, 2015, among Virtu Financial LLC, VFH Parent LLC, the lenders party thereto and Credit Suisse AG, Cayman Islands Branch, as administrative agent. |
|
10.2* |
|
Stockholders Agreement by and among Virtu Financial, Inc. and the stockholders named therein. |
|
10.3* |
|
Exchange Agreement. |
|
10.4* |
|
Registration Rights Agreement. |
|
10.5* |
|
Tax Receivable Agreement by and among Virtu Financial, Inc., the Founder Post-IPO Member, Virtu Employee Holdco, the Management Members and other pre-IPO investors. |
|
10.6* |
|
Tax Receivable Agreement by and between Virtu Financial, Inc. and the Investor Post-IPO Stockholders. |
|
10.7* |
|
Tax Receivable Agreement by and among Virtu Financial, Inc. and the Silver Lake Post-IPO Members. |
|
10.8* |
|
Third Amended and Restated Limited Liability Company Agreement of Virtu Financial LLC. |
|
10.9* |
|
Amended and Restated Limited Liability Company Agreement of Virtu Employee Holdco LLC. |
|
10.10* |
|
Class C Common Stock Subscription Agreement. |
|
10.11* |
|
Class D Common Stock Subscription Agreement. |
|
10.12* |
|
Class A Common Stock Purchase Agreement. |
|
10.13* |
|
Unit Purchase Agreement. |
|
10.14* |
|
Employment Agreement by and between Virtu Financial, Inc. and Mr. Vincent Viola. |
|
10.15* |
|
Employment Agreement by and between Virtu Financial, Inc. and Mr. Douglas A. Cifu. |
|
21.1 |
|
Subsidiaries of Virtu Financial, Inc. |
|
23.1 |
|
Consent of Deloite & Touche LLP. |
|
31.1 |
|
Certification of Chief Executive Officer required by Rule 13a-14(a)/15d-14(a) under the Securities Exchange Act of 1934, as amended, as adopted pursuant to Section 302 of the Sarbanes-Oxley Act of 2002 (filed herewith). |
|
31.2 |
|
Certification of Chief Financial Officer required by Rule 13a-14(a)/15d-14(a) under the Securities Exchange Act of 1934, as amended, as adopted pursuant to Section 302 of the Sarbanes-Oxley Act of 2002 (filed herewith). |
|
32.1 |
|
Certification of Chief Executive Officer pursuant to 18 U.S.C. Section 1350, as adopted pursuant to Section 906 of the Sarbanes-Oxley Act of 2002 (furnished herewith). |
|
32.2 |
|
Certification of Chief Financial Officer pursuant to 18 U.S.C. Section 1350, as adopted pursuant to Section 906 of the Sarbanes-Oxley Act of 2002 (furnished herewith). |
|
101.INS |
|
XBRL Instance Document |
|
101.SCH |
|
XBRL Taxonomy Extension Schema |
|
101.CAL |
|
XBRL Taxonomy Extension Calculation Linkbase |
|
101.LAB |
|
XBRL Taxonomy Extension Label Linkbase |
|
101.PRE |
|
XBRL Taxonomy Extension Presentation Linkbase |
|
101.DEF |
|
XBRL Taxonomy Extension Definition Document |
* These exhibits were previously included or incorporated by reference in Virtu Financial, Inc.’s Form 10-Q for the quarterly period ended March 31, 2015, filed with the Securities and Exchange Commission on May 29, 2015.
112
Pursuant to the requirements of the Securities Exchange Act of 1934, the Registrant has duly caused this report to be signed on its behalf by the undersigned thereunto duly authorized.
|
|
|
Virtu Financial, Inc. |
|
|
|
|
|
|
|
|
|
|
|
|
DATE: |
March 25, 2016 |
By: |
/s/ Douglas A. Cifu |
|
|
|
|
Douglas A. Cifu |
|
|
|
|
Chief Executive Officer |
|
|
|
|
|
|
|
|
|
|
|
DATE: |
March 25, 2016 |
By: |
/s/ Joseph Molluso |
|
|
|
|
Joseph Molluso |
|
|
|
|
Chief Financial Officer |
KNOW ALL MEN BY THESE PRESENTS, that each person whose signature appears below constitutes and appoints Douglas A. Cifu and Joseph Molluso, and each of them, his or her true and lawful attorneys-in-fact and agents, with full power of substitution and re-substitution, for him or her and in his or her name, place and stead, in any and all capacities, to sign any and all amendments to this Annual Report on Form 10-K, and to file the same, with all exhibits thereto and other documents in connection therewith the Securities and Exchange Commission, granting unto said attorneys-in-fact and agents, and each of them, full power and authority to do and perform each and every act and thing requisite and necessary to be done in and about the premises, as fully and to all intents and purposes as he or she might or could do in person hereby ratifying and confirming all that said attorneys-in-fact and agents, or his or her substitute or substitutes, may lawfully do or cause to be done by virtue hereof.
Pursuant to the requirements of the Securities and Exchange Act of 1934, the report has been signed below by the following persons on behalf of the Registrant and in the capacities indicated on March 25, 2016.
|
Signature |
Title |
||||||||||
|
|
|
||||||||||
|
/s/ Douglas A. Cifu Douglas A. Cifu |
Chief Executive Officer (Principal Executive Officer) and Director |
||||||||||
|
|
|
||||||||||
|
/s/ Joseph Molluso Joseph Molluso |
Chief Financial Officer |
||||||||||
|
|
|
||||||||||
|
/s/ Vincent Viola Vincent Viola |
Executive Chairman and Chairman of the Board of Directors |
||||||||||
|
|
|
||||||||||
|
/s/ John Philip Abizaid John Philip Abizaid |
Director |
||||||||||
|
|
|
||||||||||
|
/s/ William F. Cruger, Jr. William F. Cruger, Jr. |
Director |
||||||||||
|
|
|
||||||||||
|
/s/ John D. Nixon John D. Nixon |
Director |
||||||||||
|
|
|
||||||||||
113
|
/s/ Joseph Osnoss Joseph Osnoss |
Director |
||||||||||
|
|
|
||||||||||
|
/s/ John F. Sandner John F. Sandner |
Director |
||||||||||
114