Attached files
| file | filename |
|---|---|
| 8-K - 8-K - Ryerson Holding Corp | ryi-8k_20210609.htm |

Investor Presentation June 2021 Exhibit 99.1
31 Important Information About Ryerson Holding Corporation These materials do not constitute an offer or solicitation to purchase or sell securities of Ryerson Holding Corporation (“Ryerson” or “the Company”) or its subsidiaries and no investment decision should be made based upon the information provided herein. Ryerson strongly urges you to review its filings with the Securities and Exchange Commission, which can be found at https://ir.ryerson.com/financials/sec-filings/default.aspx. This site also provides additional information about Ryerson. Safe Harbor Provision Certain statements made in this presentation and other written or oral statements made by or on behalf of the Company constitute "forward-looking statements" within the meaning of the federal securities laws, including statements regarding our future performance, as well as management's expectations, beliefs, intentions, plans, estimates, objectives, or projections relating to the future. Such statements can be identified by the use of forward-looking terminology such as “objectives,” “goals,” “preliminary,” “range,” "believes," "expects," "may," "estimates," "will," "should," "plans," or "anticipates" or the negative thereof or other variations thereon or comparable terminology, or by discussions of strategy. The Company cautions that any such forward-looking statements are not guarantees of future performance and may involve significant risks and uncertainties, and that actual results may vary materially from those in the forward-looking statements as a result of various factors. Among the factors that significantly impact our business are: the cyclicality of our business; the highly competitive, volatile, and fragmented metals industry in which we operate; fluctuating metal prices; our substantial indebtedness and the covenants in instruments governing such indebtedness; the integration of acquired operations; regulatory and other operational risks associated with our operations located inside and outside of the United States; impacts and implications of adverse health events, including the COVID-19 pandemic; work stoppages; obligations under certain employee retirement benefit plans; the ownership of a majority of our equity securities by a single investor group; currency fluctuations; and consolidation in the metals industry. Forward-looking statements should, therefore, be considered in light of various factors, including those set forth above and those set forth under "Risk Factors" in our annual report on Form 10-K for the year ended December 31, 2020, and in our other filings with the Securities and Exchange Commission. Moreover, we caution against placing undue reliance on these statements, which speak only as of the date they were made. The Company does not undertake any obligation to publicly update or revise any forward-looking statements to reflect future events or circumstances, new information or otherwise. Additionally, Targets are based on 3 year window; Service center industry growth assumed consistent with 2018 tons shipped and average selling prices consistent with Ryerson historical average prices Non-GAAP Measures Certain measures contained in these slides or the related presentation are not measures calculated in accordance with generally accepted accounting principles (“GAAP”). They should not be considered a replacement for GAAP results. A reconciliation of these non-GAAP measures to the most directly comparable GAAP financial measures is included in the Appendix.
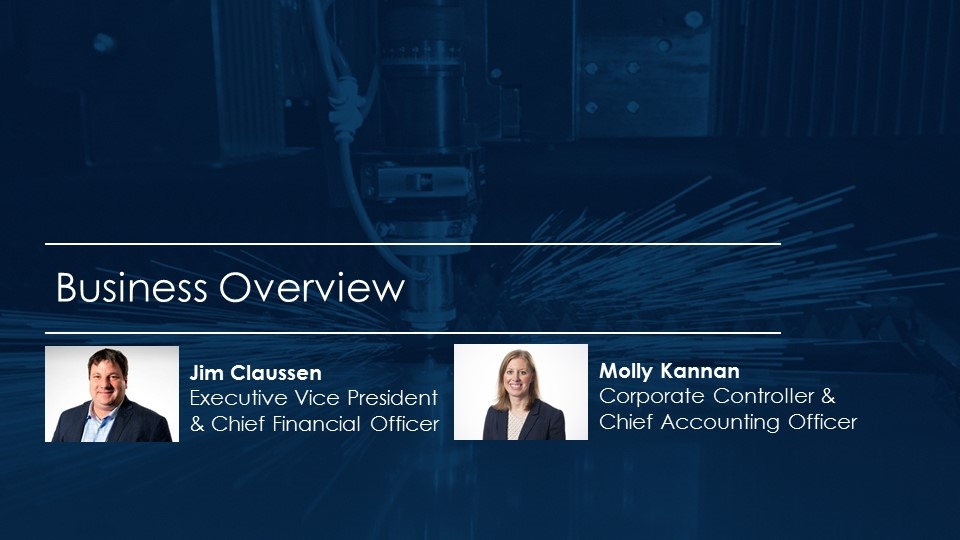
Jim Claussen Executive Vice President & Chief Financial Officer Molly Kannan Corporate Controller & Chief Accounting Officer Business Overview
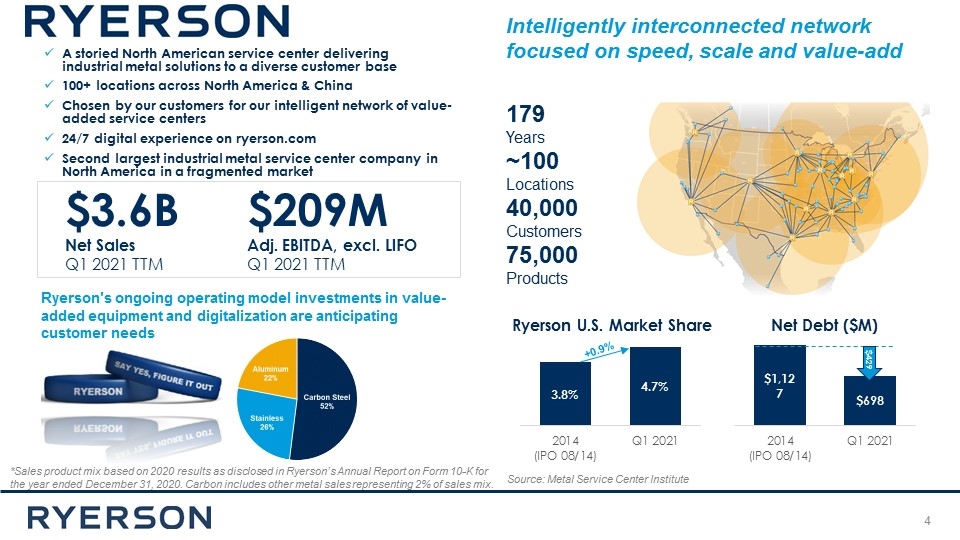
A storied North American service center delivering industrial metal solutions to a diverse customer base 100+ locations across North America & China Chosen by our customers for our intelligent network of value-added service centers 24/7 digital experience on ryerson.com Second largest industrial metal service center company in North America in a fragmented market *Sales product mix based on 2020 results as disclosed in Ryerson’s Annual Report on Form 10-K for the year ended December 31, 2020. Carbon includes other metal sales representing 2% of sales mix. Ryerson U.S. Market Share Source: Metal Service Center Institute $3.6B Net Sales Q1 2021 TTM $209M Adj. EBITDA, excl. LIFO Q1 2021 TTM Net Debt ($M) $429 Ryerson's ongoing operating model investments in value-added equipment and digitalization are anticipating customer needs Intelligently interconnected network focused on speed, scale and value-add ~100 Locations 179 Years 40,000 Customers 75,000 Products +0.9%
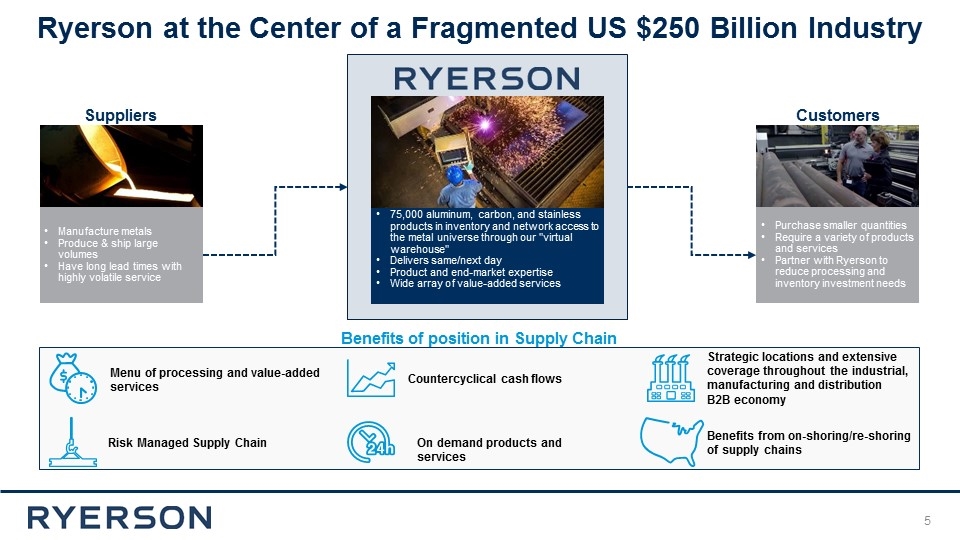
Manufacture metals Produce & ship large volumes Have long lead times with highly volatile service 75,000 aluminum, carbon, and stainless products in inventory and network access to the metal universe through our "virtual warehouse" Delivers same/next day Product and end-market expertise Wide array of value-added services Purchase smaller quantities Require a variety of products and services Partner with Ryerson to reduce processing and inventory investment needs Suppliers Customers Benefits of position in Supply Chain Menu of processing and value-added services Risk Managed Supply Chain Countercyclical cash flows Strategic locations and extensive coverage throughout the industrial, manufacturing and distribution B2B economy Benefits from on-shoring/re-shoring of supply chains On demand products and services Ryerson at the Center of a Fragmented US $250 Billion Industry
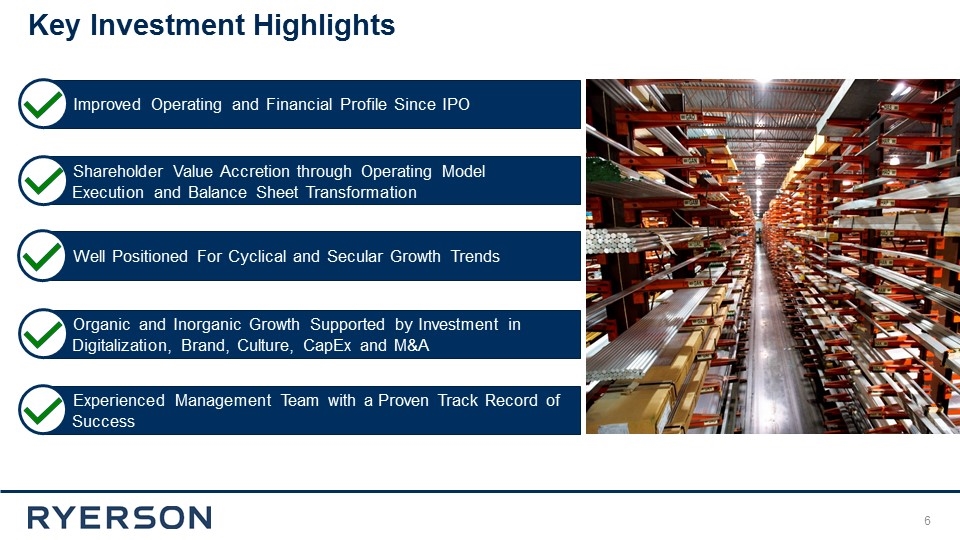
Improved Operating and Financial Profile Since IPO Well Positioned For Cyclical and Secular Growth Trends Key Investment Highlights Shareholder Value Accretion through Operating Model __Execution and Balance Sheet Transformation Organic and Inorganic Growth Supported by Investment in __Digitalization, Brand, Culture, CapEx and M&A Experienced Management Team with a Proven Track Record of __Success
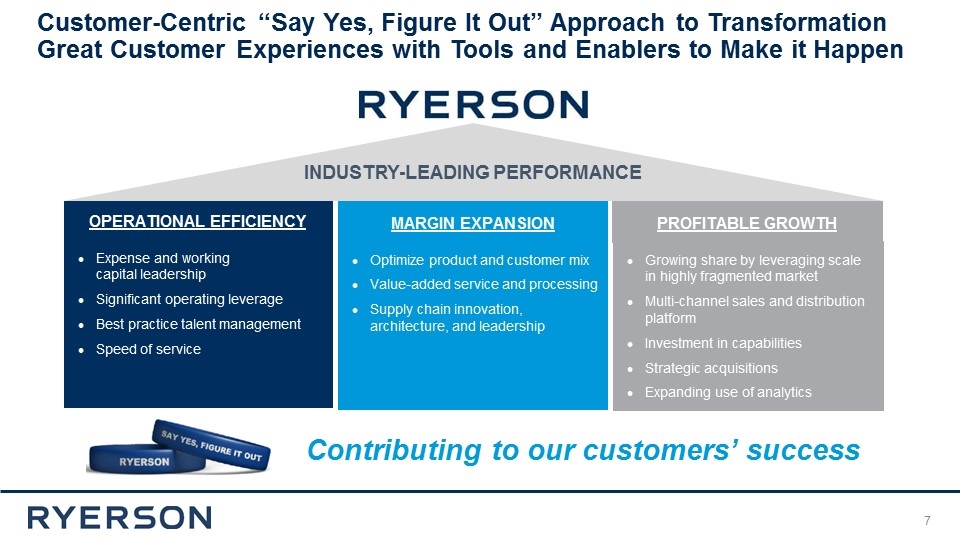
INDUSTRY-LEADING PERFORMANCE MARGIN EXPANSION OPERATIONAL EFFICIENCY Growing share by leveraging scale in highly fragmented market Multi-channel sales and distribution platform Investment in capabilities Strategic acquisitions Expanding use of analytics PROFITABLE GROWTH Optimize product and customer mix Value-added service and processing Supply chain innovation, architecture, and leadership Expense and working capital leadership Significant operating leverage Best practice talent management Speed of service Contributing to our customers’ success Customer-Centric “Say Yes, Figure It Out” Approach to Transformation Great Customer Experiences with Tools and Enablers to Make it Happen
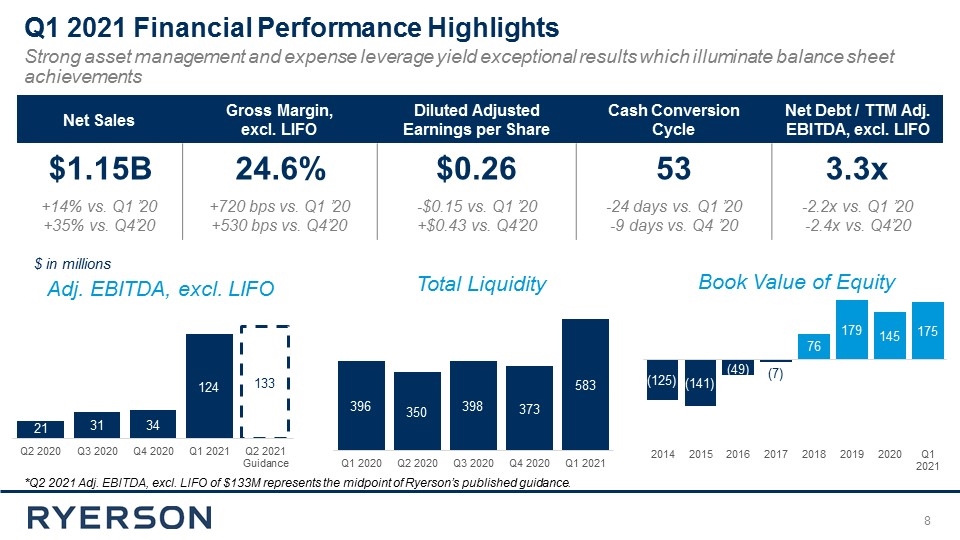
Q1 2021 Financial Performance Highlights Strong asset management and expense leverage yield exceptional results which illuminate balance sheet achievements Net Sales Gross Margin, excl. LIFO Diluted Adjusted Earnings per Share Cash Conversion Cycle Net Debt / TTM Adj. EBITDA, excl. LIFO $1.15B 24.6% $0.26 53 3.3x +14% vs. Q1 ’20 +35% vs. Q4’20 +720 bps vs. Q1 ’20 +530 bps vs. Q4’20 -$0.15 vs. Q1 ’20 +$0.43 vs. Q4’20 -24 days vs. Q1 ’20 -9 days vs. Q4 ’20 -2.2x vs. Q1 ’20 -2.4x vs. Q4’20 Book Value of Equity Total Liquidity Adj. EBITDA, excl. LIFO *Q2 2021 Adj. EBITDA, excl. LIFO of $133M represents the midpoint of Ryerson’s published guidance. $ in millions
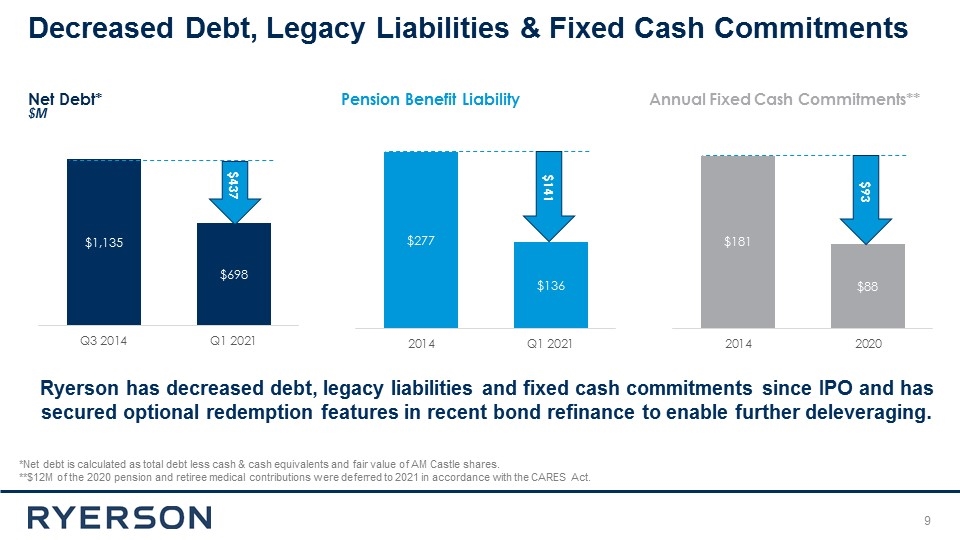
$M *Net debt is calculated as total debt less cash & cash equivalents and fair value of AM Castle shares. **$12M of the 2020 pension and retiree medical contributions were deferred to 2021 in accordance with the CARES Act. Net Debt* Pension Benefit Liability Annual Fixed Cash Commitments** $437 $141 $93 Decreased Debt, Legacy Liabilities & Fixed Cash Commitments Ryerson has decreased debt, legacy liabilities and fixed cash commitments since IPO and has secured optional redemption features in recent bond refinance to enable further deleveraging.
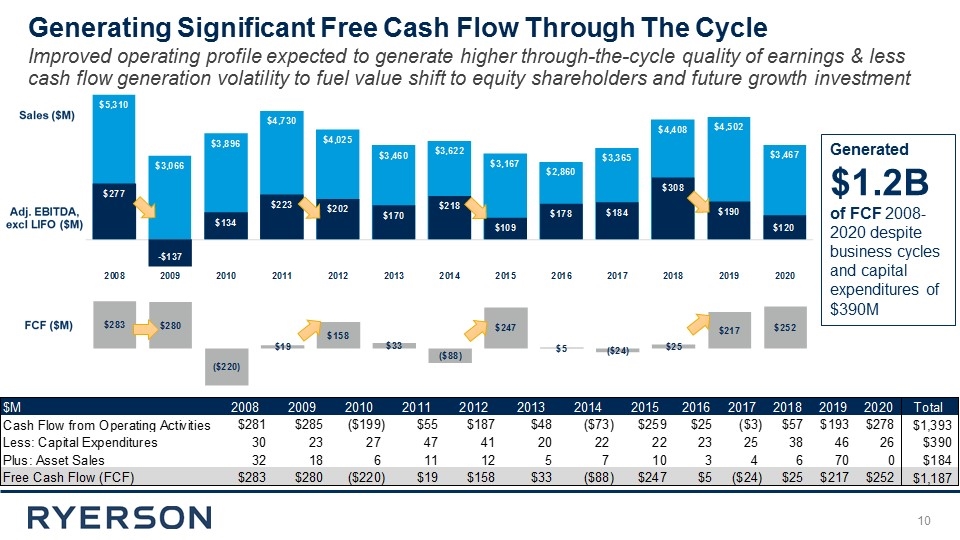
Generated $1.2B of FCF 2008-2020 despite business cycles and capital expenditures of $390M Generating Significant Free Cash Flow Through The Cycle Improved operating profile expected to generate higher through-the-cycle quality of earnings & less cash flow generation volatility to fuel value shift to equity shareholders and future growth investment
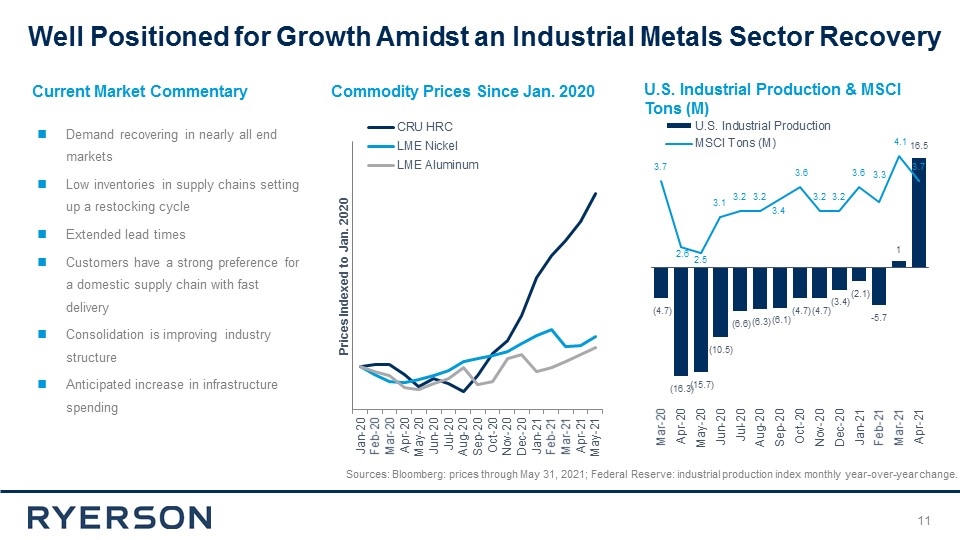
U.S. Industrial Production & MSCI Tons (M) Commodity Prices Since Jan. 2020 Sources: Bloomberg: prices through May 31, 2021; Federal Reserve: industrial production index monthly year-over-year change. Demand recovering in nearly all end markets Low inventories in supply chains setting up a restocking cycle Extended lead times Customers have a strong preference for a domestic supply chain with fast delivery Consolidation is improving industry structure Anticipated increase in infrastructure spending Current Market Commentary Well Positioned for Growth Amidst an Industrial Metals Sector Recovery
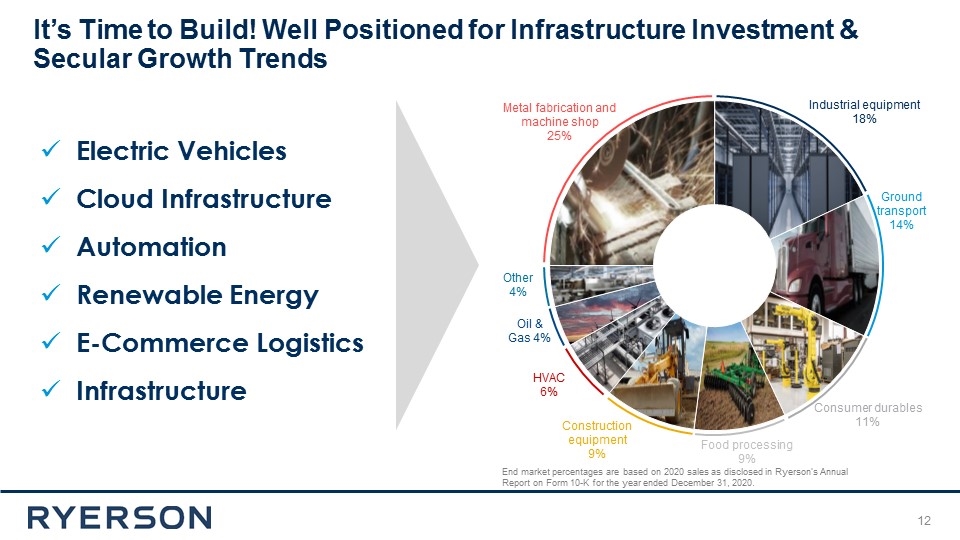
End market percentages are based on 2020 sales as disclosed in Ryerson’s Annual Report on Form 10-K for the year ended December 31, 2020. It’s Time to Build! Well Positioned for Infrastructure Investment & Secular Growth Trends Electric Vehicles Cloud Infrastructure Automation Renewable Energy E-Commerce Logistics Infrastructure
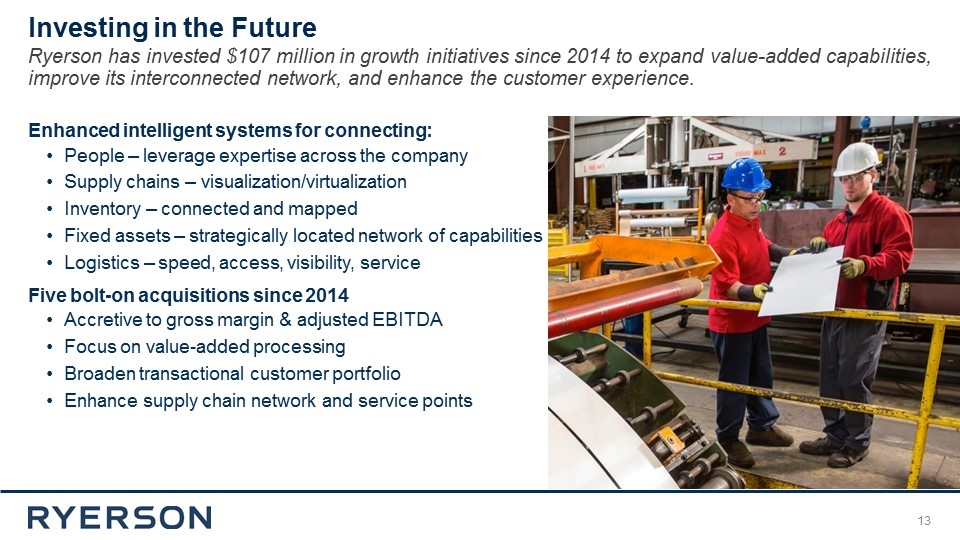
Enhanced intelligent systems for connecting: People – leverage expertise across the company Supply chains – visualization/virtualization Inventory – connected and mapped Fixed assets – strategically located network of capabilities Logistics – speed, access, visibility, service Five bolt-on acquisitions since 2014 Accretive to gross margin & adjusted EBITDA Focus on value-added processing Broaden transactional customer portfolio Enhance supply chain network and service points Investing in the Future Ryerson has invested $107 million in growth initiatives since 2014 to expand value-added capabilities, improve its interconnected network, and enhance the customer experience.
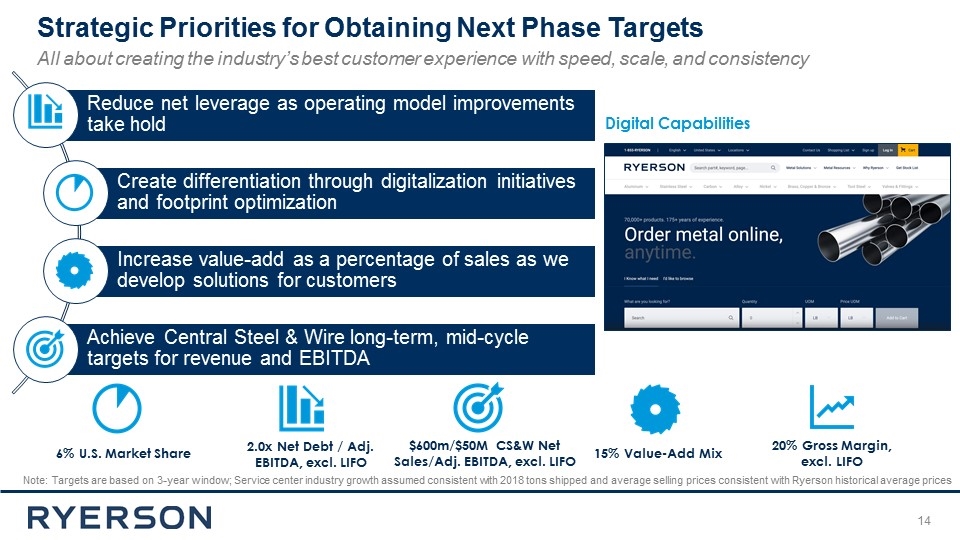
6% U.S. Market Share 15% Value-Add Mix 20% Gross Margin, excl. LIFO 2.0x Net Debt / Adj. EBITDA, excl. LIFO $600m/$50M CS&W Net Sales/Adj. EBITDA, excl. LIFO Strategic Priorities for Obtaining Next Phase Targets All about creating the industry’s best customer experience with speed, scale, and consistency Digital Capabilities Note: Targets are based on 3-year window; Service center industry growth assumed consistent with 2018 tons shipped and average selling prices consistent with Ryerson historical average prices Increase value-add as a percentage of sales as we develop solutions for customers Achieve Central Steel & Wire long-term, mid-cycle targets for revenue and EBITDA Create differentiation through digitalization initiatives and footprint optimization Reduce net leverage as operating model improvements take hold
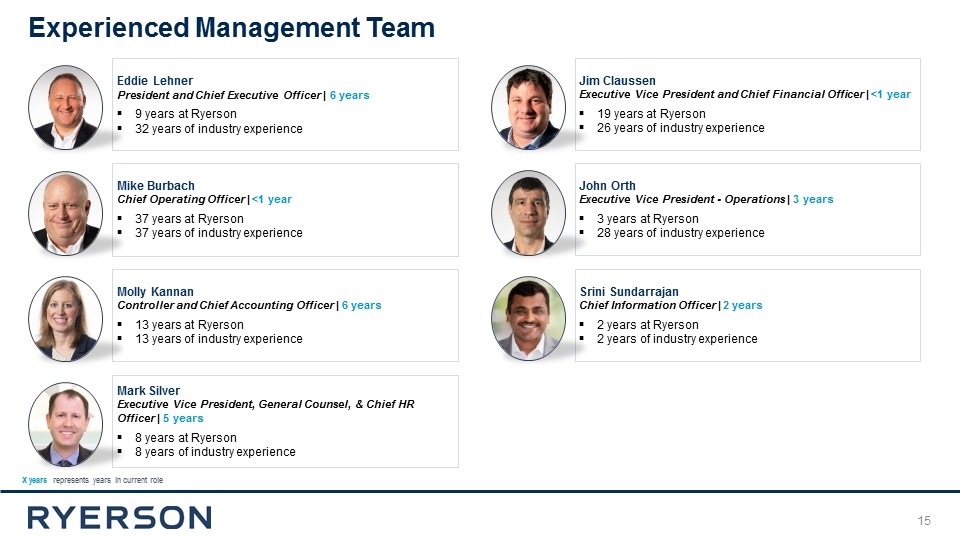
Eddie Lehner President and Chief Executive Officer | 6 years 9 years at Ryerson 32 years of industry experience Mike Burbach Chief Operating Officer | <1 year 37 years at Ryerson 37 years of industry experience Molly Kannan Controller and Chief Accounting Officer | 6 years 13 years at Ryerson 13 years of industry experience Mark Silver Executive Vice President, General Counsel, & Chief HR Officer | 5 years 8 years at Ryerson 8 years of industry experience Jim Claussen Executive Vice President and Chief Financial Officer | <1 year 19 years at Ryerson 26 years of industry experience John Orth Executive Vice President - Operations | 3 years 3 years at Ryerson 28 years of industry experience Srini Sundarrajan Chief Information Officer | 2 years 2 years at Ryerson 2 years of industry experience X years represents years in current role Experienced Management Team
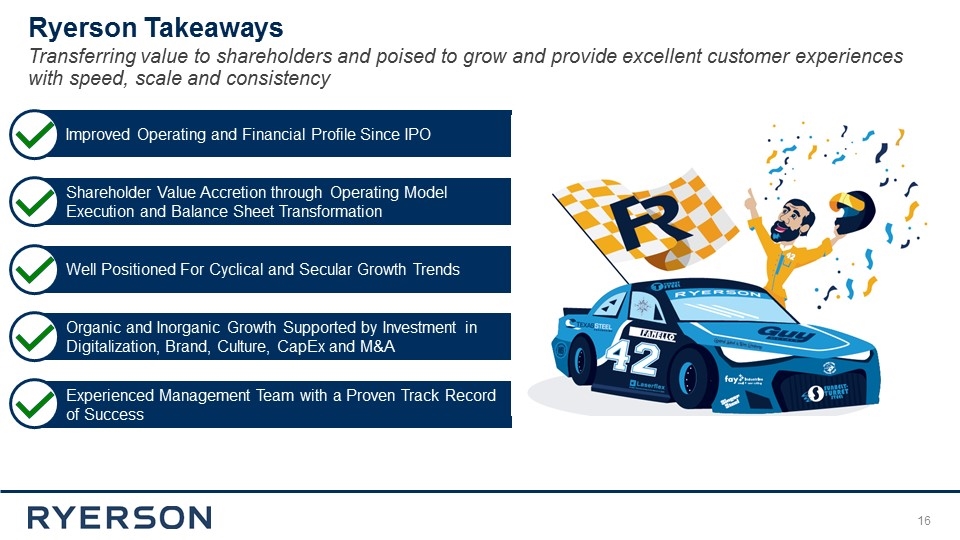
Improved Operating and Financial Profile Since IPO Shareholder Value Accretion through Operating Model Execution and Balance Sheet Transformation Well Positioned For Cyclical and Secular Growth Trends Organic and Inorganic Growth Supported by Investment in Digitalization, Brand, Culture, CapEx and M&A Experienced Management Team with a Proven Track Record of Success Ryerson Takeaways Transferring value to shareholders and poised to grow and provide excellent customer experiences with speed, scale and consistency
Appendix
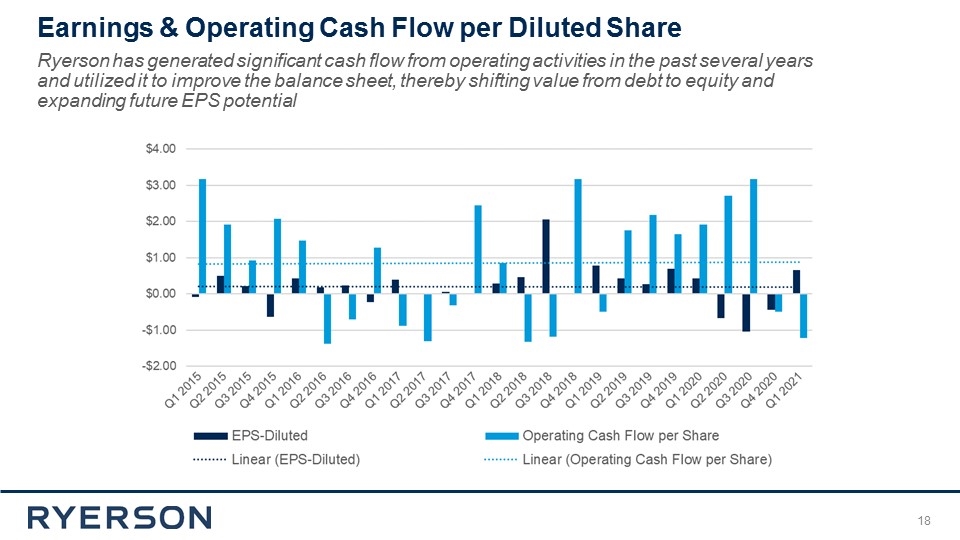
Earnings & Operating Cash Flow per Diluted Share Ryerson has generated significant cash flow from operating activities in the past several years and utilized it to improve the balance sheet, thereby shifting value from debt to equity and expanding future EPS potential
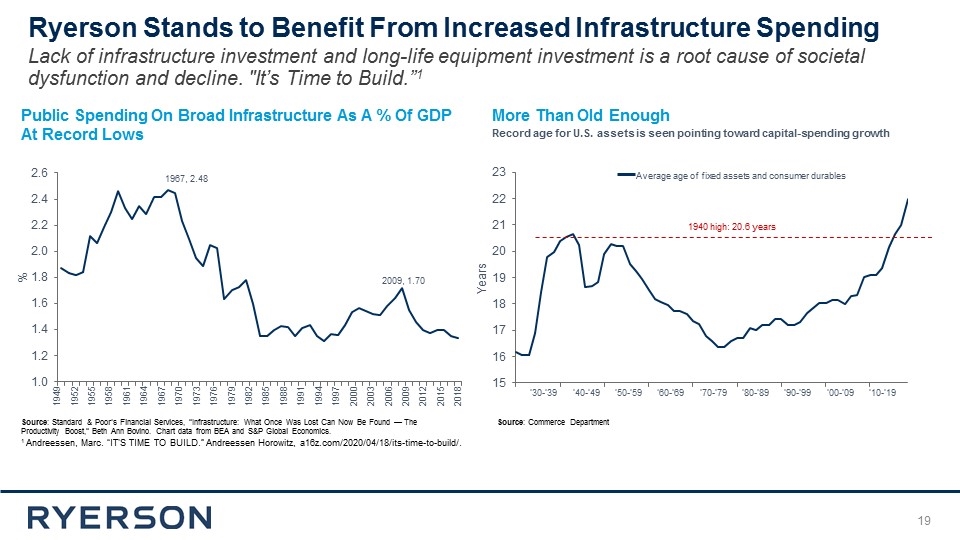
’30-’39 ’40-’49 ’50-’59 ‘60-’69 ’70-’79 ’80-’89 ’90-’99 ’00-’09 ’10-’19 Source: Standard & Poor’s Financial Services, “Infrastructure: What Once Was Lost Can Now Be Found — The Productivity Boost,” Beth Ann Bovino. Chart data from BEA and S&P Global Economics. Public Spending On Broad Infrastructure As A % Of GDP At Record Lows More Than Old Enough 1949 1952 1955 1958 1961 1964 1967 1970 1973 1976 1979 1982 1985 1988 1991 1994 1997 2000 2003 2006 2009 2012 2015 2018 Source: Commerce Department Record age for U.S. assets is seen pointing toward capital-spending growth 1940 high: 20.6 years 2009, 1.70 1967, 2.48 Average age of fixed assets and consumer durables Ryerson Stands to Benefit From Increased Infrastructure Spending Lack of infrastructure investment and long-life equipment investment is a root cause of societal dysfunction and decline. "It’s Time to Build.”1 1 Andreessen, Marc. “IT'S TIME TO BUILD.” Andreessen Horowitz, a16z.com/2020/04/18/its-time-to-build/.
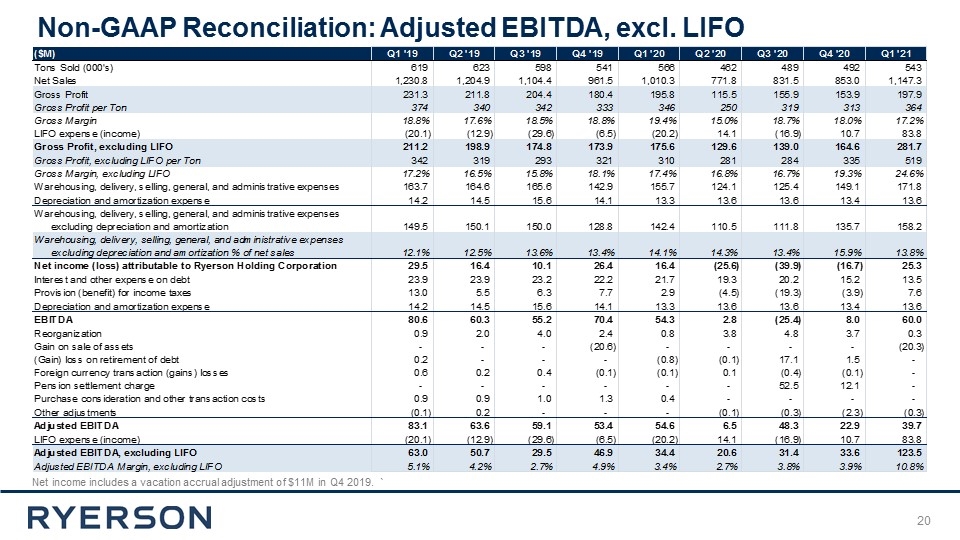
Non-GAAP Reconciliation: Adjusted EBITDA, excl. LIFO Net income includes a vacation accrual adjustment of $11M in Q4 2019. `
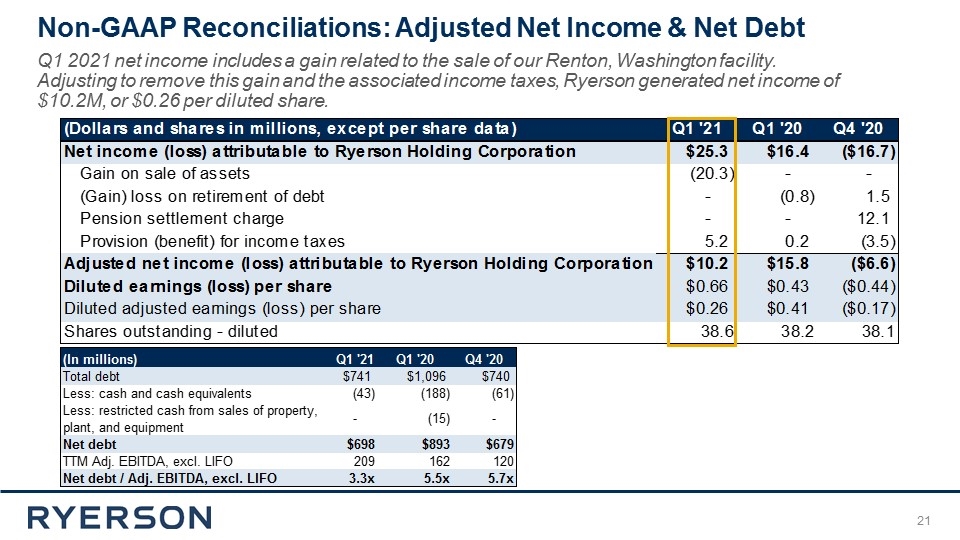
Non-GAAP Reconciliations: Adjusted Net Income & Net Debt Q1 2021 net income includes a gain related to the sale of our Renton, Washington facility. Adjusting to remove this gain and the associated income taxes, Ryerson generated net income of $10.2M, or $0.26 per diluted share.
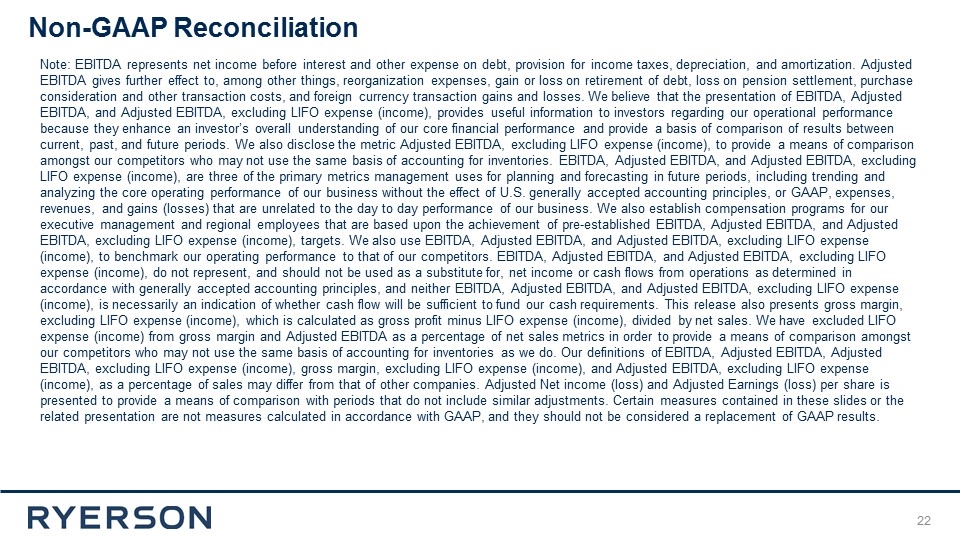
31 Note: EBITDA represents net income before interest and other expense on debt, provision for income taxes, depreciation, and amortization. Adjusted EBITDA gives further effect to, among other things, reorganization expenses, gain or loss on retirement of debt, loss on pension settlement, purchase consideration and other transaction costs, and foreign currency transaction gains and losses. We believe that the presentation of EBITDA, Adjusted EBITDA, and Adjusted EBITDA, excluding LIFO expense (income), provides useful information to investors regarding our operational performance because they enhance an investor’s overall understanding of our core financial performance and provide a basis of comparison of results between current, past, and future periods. We also disclose the metric Adjusted EBITDA, excluding LIFO expense (income), to provide a means of comparison amongst our competitors who may not use the same basis of accounting for inventories. EBITDA, Adjusted EBITDA, and Adjusted EBITDA, excluding LIFO expense (income), are three of the primary metrics management uses for planning and forecasting in future periods, including trending and analyzing the core operating performance of our business without the effect of U.S. generally accepted accounting principles, or GAAP, expenses, revenues, and gains (losses) that are unrelated to the day to day performance of our business. We also establish compensation programs for our executive management and regional employees that are based upon the achievement of pre-established EBITDA, Adjusted EBITDA, and Adjusted EBITDA, excluding LIFO expense (income), targets. We also use EBITDA, Adjusted EBITDA, and Adjusted EBITDA, excluding LIFO expense (income), to benchmark our operating performance to that of our competitors. EBITDA, Adjusted EBITDA, and Adjusted EBITDA, excluding LIFO expense (income), do not represent, and should not be used as a substitute for, net income or cash flows from operations as determined in accordance with generally accepted accounting principles, and neither EBITDA, Adjusted EBITDA, and Adjusted EBITDA, excluding LIFO expense (income), is necessarily an indication of whether cash flow will be sufficient to fund our cash requirements. This release also presents gross margin, excluding LIFO expense (income), which is calculated as gross profit minus LIFO expense (income), divided by net sales. We have excluded LIFO expense (income) from gross margin and Adjusted EBITDA as a percentage of net sales metrics in order to provide a means of comparison amongst our competitors who may not use the same basis of accounting for inventories as we do. Our definitions of EBITDA, Adjusted EBITDA, Adjusted EBITDA, excluding LIFO expense (income), gross margin, excluding LIFO expense (income), and Adjusted EBITDA, excluding LIFO expense (income), as a percentage of sales may differ from that of other companies. Adjusted Net income (loss) and Adjusted Earnings (loss) per share is presented to provide a means of comparison with periods that do not include similar adjustments. Certain measures contained in these slides or the related presentation are not measures calculated in accordance with GAAP, and they should not be considered a replacement of GAAP results. Non-GAAP Reconciliation
