Attached files
| file | filename |
|---|---|
| EX-32.2 - EX-32.2 - Ryerson Holding Corp | ryi-ex322_9.htm |
| EX-32.1 - EX-32.1 - Ryerson Holding Corp | ryi-ex321_10.htm |
| EX-31.2 - EX-31.2 - Ryerson Holding Corp | ryi-ex312_14.htm |
| EX-31.1 - EX-31.1 - Ryerson Holding Corp | ryi-ex311_8.htm |
| EX-23.1 - EX-23.1 - Ryerson Holding Corp | ryi-ex231_15.htm |
| EX-21.1 - EX-21.1 - Ryerson Holding Corp | ryi-ex211_6.htm |
SECURITIES AND EXCHANGE COMMISSION
Washington, D.C. 20549
FORM 10-K
(Mark One)
|
☒ |
ANNUAL REPORT PURSUANT TO SECTION 13 OR 15(d) OF THE SECURITIES EXCHANGE ACT OF 1934 |
For the fiscal year ended December 31, 2016
OR
|
☐ |
TRANSITION REPORT PURSUANT TO SECTION 13 OR 15(d) OF THE SECURITIES EXCHANGE ACT OF 1934 |
For the transition period from to
Commission File No. 001-34735
RYERSON HOLDING CORPORATION
(Exact name of registrant as specified in its charter)
|
DELAWARE |
|
26-1251524 |
|
(State or other jurisdiction of incorporation or organization) |
|
(I.R.S. Employer Identification No.) |
227 W. Monroe St., 27th Floor
Chicago, Illinois 60606
(Address of principal executive offices)
(312) 292-5000
(Registrant’s telephone number, including area code)
Securities registered pursuant to Section 12(b) of the Act:
|
Title of each class |
|
Name of exchange on which registered |
|
Common Stock - $0.01 par value |
|
New York Stock Exchange |
Securities registered pursuant to Section 12(g) of the Act: None
Indicate by check mark if the registrant is a well-known seasoned issuer, as defined in Rule 405 of the Securities Act. Yes ☐ No ☒
Indicate by check mark if the registrant is not required to file reports pursuant to Section 13 or Section 15(d) of the Act. Yes ☐ No ☒
Indicate by check mark whether the registrant (1) has filed all reports required to be filed by Section 13 or 15(d) of the Securities Exchange Act of 1934 during the preceding 12 months (or for such shorter period that the registrant was required to file such reports) and (2) has been subject to such filing requirements for the past 90 days. Yes ☒ No ☐
Indicate by check mark whether the registrant has submitted electronically and posted on its corporate Web site, if any, every Interactive Data File required to be submitted and posted pursuant to Rule 405 of Regulation S-T (§232.405 of this chapter) during the preceding 12 months (or for such shorter period that the registrant was required to submit and post such files). Yes ☒ No ☐
Indicate by check mark if disclosure of delinquent filers pursuant to Item 405 of Regulation S-K(§229.405 of this chapter) is not contained herein, and will not be contained, to the best of registrant’s knowledge, in definitive proxy or information statements incorporated by reference in Part III of this Form 10-K or any amendment to this Form 10-K. ☐
Indicate by check mark whether the registrant is a large accelerated filer, an accelerated filer, a non-accelerated filer, or a smaller reporting company. See the definitions of “large accelerated filer,” “accelerated filer” and “smaller reporting company” in Rule 12b-2 of the Exchange Act.
|
Large accelerated filer |
☐ |
|
|
Accelerated filer |
☒ |
|
|
|
|
|
|
|
|
Non-accelerated filer |
☐ |
|
|
Smaller reporting company |
☐ |
Indicate by check mark whether the registrant is a shell company (as defined in Rule 12b-2 of the Exchange Act). Yes ☐ No ☒
State the aggregate market value of the voting and non-voting common equity held by non-affiliates computed by reference to the price at which the common equity was last sold, or the average bid and asked price of such common equity, as of the last business day of the registrant’s most recently completed second fiscal quarter.
The aggregate market value of the voting and non-voting common equity held by non-affiliates of the registrant, based on the closing price of a share of the registrant’s common stock on June 30, 2016 as reported by the New York Stock Exchange on such date was approximately $188,377,000. Shares of the registrant’s common stock held by each executive officer, director and holder of 5% or more of the outstanding common stock have been excluded in that such persons may be deemed to be affiliates. This calculation does not reflect a determination that certain persons are affiliates of the registrant for any other purpose.
Indicate the number of shares outstanding of each of the registrant’s classes of common stock, as of the latest practicable date.
As of February 28, 2017, there were 37,132,617 shares of our Common Stock, par value $0.01 per share, outstanding.
DOCUMENTS INCORPORATED BY REFERENCE
The information required to be furnished pursuant to Part III of this Form 10-K will be set forth in, and incorporated by reference from, the registrant’s definitive proxy statement for the annual meeting of stockholders (the “2016 Proxy Statement”), which will be filed with the Securities and Exchange Commission not later than 120 days after the end of the fiscal year ended December 31, 2016.
|
|
|
|
|
Page |
|
|
|
|||
|
|
|
|
|
|
|
|
|
|
|
|
|
|
|
|
|
|
|
Item 1. |
|
|
4 |
|
|
|
|
|
|
|
|
Item 1A. |
|
|
11 |
|
|
|
|
|
|
|
|
Item 1B. |
|
|
20 |
|
|
|
|
|
|
|
|
Item 2. |
|
|
21 |
|
|
|
|
|
|
|
|
Item 3. |
|
|
23 |
|
|
|
|
|
|
|
|
Item 4. |
|
|
23 |
|
|
|
|
|
|
|
|
|
|
|
|
|
|
|
|
|
|
|
|
Item 5. |
|
|
24 |
|
|
|
|
|
|
|
|
Item 6. |
|
|
26 |
|
|
|
|
|
|
|
|
Item 7. |
|
Management’s Discussion and Analysis of Financial Condition and Results of Operations |
|
28 |
|
|
|
|
|
|
|
Item 7A. |
|
|
42 |
|
|
|
|
|
|
|
|
Item 8. |
|
|
44 |
|
|
|
|
|
|
|
|
|
|
|
46 |
|
|
|
|
|
|
|
|
|
|
|
53 |
|
|
|
|
|
|
|
|
Item 9. |
|
Changes in and Disagreements with Accountants on Accounting and Financial Disclosure |
|
90 |
|
|
|
|
|
|
|
Item 9A. |
|
|
90 |
|
|
|
|
|
|
|
|
Item 9B. |
|
|
90 |
|
|
|
|
|
|
|
|
|
|
|||
|
|
|
|
|
|
|
Item 10. |
|
|
91 |
|
|
|
|
|
|
|
|
Item 11. |
|
|
91 |
|
|
|
|
|
|
|
|
Item 12. |
|
Security Ownership of Certain Beneficial Owners and Management and Related Stockholder Matters |
|
91 |
|
|
|
|
|
|
|
Item 13. |
|
Certain Relationships and Related Transactions, and Director Independence |
|
92 |
|
|
|
|
|
|
|
Item 14. |
|
|
92 |
|
|
|
|
|
|
|
|
|
|
|||
|
|
|
|
|
|
|
Item 15. |
|
|
93 |
|
|
|
|
|
|
|
|
|
94 |
|||
2
SPECIAL NOTE REGARDING FORWARD-LOOKING STATEMENTS
This Annual Report contains “forward-looking statements.” Such statements can be identified by the use of forward-looking terminology such as “believes,” “expects,” “may,” “estimates,” “will,” “should,” “plans” or “anticipates” or the negative thereof or other variations thereon or comparable terminology, or by discussions of strategy. Readers are cautioned that any such forward-looking statements are not guarantees of future performance and may involve significant risks and uncertainties, and that actual results may vary materially from those anticipated or implied in the forward-looking statements as a result of various factors. Among the factors that significantly impact the metals distribution industry and our business are:
|
|
• |
the cyclicality of our business, due to the cyclical nature of our customers’ businesses; |
|
|
• |
the impairment of goodwill that could result from, among other things, volatility in the markets in which we operate; |
|
|
• |
remaining competitive and maintaining market share in the highly competitive and fragmented metals distribution industry; |
|
|
• |
managing the costs of purchased metals relative to the price at which we sell our products during periods of rapid price escalation; |
|
|
• |
our substantial indebtedness and the covenants in instruments governing such indebtedness; |
|
|
• |
the failure to effectively integrate newly acquired operations; |
|
|
• |
the regulatory and other operational risks associated with our operations located outside of the United States (or “U.S.”); |
|
|
• |
the management of inventory and other costs and expenses; |
|
|
• |
the adequacy of our efforts to mitigate cyber security risks and threats; |
|
|
• |
reduced production schedules, layoffs or work stoppages by our own, our suppliers’ or customers’ personnel; |
|
|
• |
certain employee retirement benefit plans are underfunded and the actual costs could exceed current estimates; |
|
|
• |
future funding for postretirement employee benefits may require substantial payments from current cash flow; |
|
|
• |
prolonged disruption of our processing centers; |
|
|
• |
the ability to retain and attract management and key personnel; |
|
|
• |
the ability of management to focus on North American and foreign operations; |
|
|
• |
the ability to comply with the terms of our asset-based credit facility and our indenture; |
|
|
• |
the incurrence of substantial costs or liabilities to comply with, or as a result of violations of, environmental laws; |
|
|
• |
the impact of new or pending litigation against us; |
|
|
• |
the risk of product liability claims; |
|
|
• |
our risk management strategies may result in losses; |
|
|
• |
currency fluctuations in the U.S. dollar versus the Canadian dollar and the Chinese renminbi; |
|
|
• |
customer, supplier and competitor consolidation, bankruptcy or insolvency; |
|
|
• |
the ownership of a majority of our equity securities by a single investor group. |
These risks and uncertainties could cause actual results to differ materially from those suggested by the forward-looking statements. Forward-looking statements should, therefore, be considered in light of various factors, including those set forth in this Annual Report under “Risk Factors” and the caption “Industry and Operating Trends” included in “Management’s Discussion and Analysis of Financial Condition and Results of Operations” and elsewhere in this Annual Report. Moreover, we caution you not to place undue reliance on these forward-looking statements, which speak only as of the date they were made. We do not undertake any obligation to revise or publicly release any revisions to these forward-looking statements to reflect events or circumstances after the date of this Annual Report or to reflect the occurrence of unanticipated events.
3
Ryerson Holding Corporation (“Ryerson Holding”), a Delaware corporation, is the parent company of Joseph T. Ryerson & Son, Inc. (“JT Ryerson”), a Delaware corporation. On December 17, 2014, Ryerson Inc., formerly a direct, wholly-owned subsidiary of Ryerson Holding, merged with and into JT Ryerson, which was previously an indirect, wholly-owned subsidiary of Ryerson Holding, with JT Ryerson as the surviving corporation. As a result of such merger, from and after December 17, 2014, JT Ryerson has been a direct, wholly-owned subsidiary of Ryerson Holding. Affiliates of Platinum Equity, LLC (“Platinum”) own approximately 21,037,500 shares of our common stock, which is approximately 57% of our issued and outstanding common stock.
We are a metals service center, with operations in the United States through JT Ryerson, in Canada through its indirect wholly-owned subsidiary Ryerson Canada, Inc., a Canadian corporation (“Ryerson Canada”) and in Mexico through our indirect wholly-owned subsidiary Ryerson Metals de Mexico, S. de R.L. de C.V., a Mexican corporation (“Ryerson Mexico”). In addition to our North American operations, we conduct materials distribution operations in China through an indirect wholly-owned subsidiary, Ryerson China Limited (“Ryerson China”). Unless the context indicates otherwise, Ryerson Holding, JT Ryerson, Ryerson Canada, Ryerson China, and Ryerson Mexico together with their subsidiaries, are collectively referred to herein as “Ryerson,” “we,” “us,” “our,” or the “Company.”
Our Company
We believe we are one of the largest value-add processors and distributors of industrial metals in North America measured in terms of sales. Our industry is highly fragmented with the largest companies accounting for only a small percentage of total market share. Our customer base ranges from local, independently owned fabricators and machine shops to large, international original equipment manufacturers. We carry a full line of over 65,000 products in stainless steel, aluminum, carbon steel and alloy steels and a limited line of nickel and red metals in various shapes and forms. More than 75% of the products we sell are processed to meet customer requirements. Specifically, we provide a wide range of flat and long metals products, we offer numerous value-added processing and fabrication services such as sawing, slitting, blanking, cutting to length, leveling, flame cutting, laser cutting, edge trimming, edge rolling, roll forming, tube manufacturing, polishing, shearing, forming, stamping, punching, rolling shell plate to radius and beveling to process materials to a specified thickness, length, width, shape and surface quality pursuant to specific customer orders. For the year ended December 31, 2016, we purchased 1.9 million tons of materials from suppliers throughout the world. Our value proposition also includes providing a superior level of customer service and responsiveness, technical services and inventory management solutions. Our range of products together with our breadth of services allows us to create long-term partnerships with our customers and enhances our profitability.
We track the processing operations, if any, performed on sold material for over 95% of our total revenues. The activities we track broadly fall into four main processing categories: (1) sheet processing (excludes fabrication activities), (2) as-is long and plate, (3) cut long and plate, and (4) fabrication. A key metric that we track is the percentage mix of revenue that comes from our fabrication capabilities. In 2010, the mix of revenue from fabrication activities was 6.7% of our sales, while in 2016, our mix of revenue from fabrication activities rose to 9.2% of our sales largely due to the strategic investments we have made in value-added processing capital expenditures.
We operate over 90 facilities across North America and five facilities in China. Our service centers are strategically located in close proximity to our customers, which allows us to quickly process and deliver our products and services, often within the next day of receiving an order. We own, lease or contract a fleet of tractors and trailers, allowing us to efficiently meet our customers’ delivery demands. In addition, our scale enables us to maintain low operating costs. Our operating expenses as a percentage of sales for the years ended December 31, 2016 and 2015 were 15.3% and 14.5%, respectively.
We serve approximately 40,000 customers across a wide range of manufacturing end markets. Our geographic network and broad range of products and services allow us to serve large, international manufacturing companies across multiple locations. We believe the diverse end markets we serve reduce the volatility of our business in the aggregate.
Industry Overview
Metals service centers serve as key intermediaries between metal producers and end users of metal products. Metal producers offer commodity products and typically sell metals in the form of standard-sized coils, sheets, plates, structurals, bars and tubes. Producers, mostly steel and aluminum mills, prefer large order quantities, longer lead times and limited inventory in order to maximize capacity utilization across their typically higher capital-intensive structure.
4
End users of metal products seek to purchase metals with customized specifications, including value-added processing. End-users in highly diverse industries such as machinery, construction and transportation often look for “one-stop” suppliers that can offer processing services along with lower order volumes, shorter lead times, and more reliable delivery.
As an intermediary, metals service centers aggregate end-users’ demand, purchase metal in bulk to take advantage of economies of scale and then process and sell metal that meets specific customer requirements.
The metals service center industry is comprised of many companies, the majority of which have limited product lines and inventories, with customers located in a specific geographic area. In general, competition is based on quality, service, price and geographic proximity.
The metals service center industry typically experiences cash flow trends that are counter-cyclical to the revenue and volume growth of the industry. Companies in the industry primarily have working capital assets. During an industry downturn, companies generally reduce working capital assets and generate cash as inventory and accounts receivable balances decline. As a result, operating cash flow and liquidity tend to increase during a downturn, which typically facilitates industry participants’ ability to cover fixed costs and repay outstanding debt.
We compete with many other metals service centers and to a lesser extent with primary metal producers. Primary metal producers typically sell to larger customers that require regular shipments of higher volumes of steel than the traditional service center customer.
Competitive Strengths
Leading Market Position in North America
We believe we are one of the largest service center companies for carbon and stainless steel as well as aluminum based on sales in the North American market where we have a broad geographic presence with over 90 facilities.
Our service centers are located near our customer locations, enabling us to provide timely delivery to customers across numerous geographic markets. Additionally, our widespread network of locations in the United States, Canada and Mexico helps us to utilize our expertise to more efficiently serve customers with complex supply chain requirements across multiple manufacturing locations. We believe this is a key differentiator for customers who need a supplier that can reliably and consistently support them. Our ability to transfer inventory among our facilities better enables us to more timely and profitably source and process specialized items at regional locations throughout our network than if we were required to maintain inventory of all products and specialized equipment at each location.
We believe with our significant footprint in the North American market, combined with our significant scale and operating leverage, a cyclical recovery of the service center industry supported by long-term growth trends in our end markets should allow us to experience higher growth rates relative to North American economic improvement. However, there can be no guarantee that we will experience such higher growth rates.
Broad Geographic Reach across Attractive End Markets.
Our operations serve a diverse range of industries, including commercial ground transportation manufacturing, metal fabrication and machine shops, industrial machinery and equipment manufacturing, consumer durable production, HVAC manufacturing, construction equipment manufacturing, food processing and agricultural equipment manufacturing and oil and gas. We believe these industries will provide demand for our products and services as the North American manufacturing economy continues to grow. In addition, we expect to benefit from continued growth in international markets that will help spur demand at domestic manufacturing facilities that sell into the global market. We believe that our ability to quickly adjust our offering based on regional and industry specific trends creates stability while also providing the opportunity to access specific growth markets.
Established Platform for Organic and Acquisition Growth.
Although there can be no guarantee of growth, we believe a number of our strategies, such as investing in value added processing capabilities, analytically targeting attractive customers and end markets with our supply chain optimization service model, expanding our large network of service centers both through capital expenditures and acquisitions, and pricing our products and services based on the value we deliver to our customers will provide us with growth opportunities.
5
Given the highly fragmented nature of the service center industry, we believe there are numerous additional opportunities to acquire businesses and incorporate them into our existing infrastructure. Given our large scale and geographic reach, we believe we can add value to these businesses in a number of ways, including providing greater purchasing power, improving expense and working capital management, access to additional end markets and broadening product mix.
Lean Operating Structure Providing Operating Leverage.
From historical significant changes to our footprint and decentralized operational management through tactical productivity and spending improvements, Ryerson has demonstrated the ability to effectively manage expenses. Even on volumes which were slightly higher than 2015, our warehousing, delivery, selling, general and administrative expenses declined by $14 million, or 3.2%. In an improving metals service center environment characterized by increases in demand and/or pricing, we believe that most additional expenses to service higher revenue and margins would come from variable expenses while further leveraging economies of scale on our existing fixed expenses.
We have also focused on process improvements in inventory management. Average inventory days excluding LIFO decreased from 80 days in 2015 to 76 days in 2016. Our average inventory days have improved on an overall basis from 100 days in 2006. This reduction has decreased our exposure to metals price movements as well as increased capacity in our facilities to devote to higher margin products and capabilities. These organizational and operating changes have improved our operating structure, working capital management and efficiency.
As a result of our initiatives, we have increased our financial flexibility and believe we have a favorable cost structure compared to many of our peers. This achievement will provide significant operating leverage if revenue improves.
Extensive Breadth of Products and Services for Diverse Customer Base.
We believe our broad product mix and marketing approach provides customers with a “one-stop shop” solution few other service center companies are able to offer. We provide a broad range of processing and fabrication services to meet the needs of our approximately 40,000 customers and typically fulfill more than 1,000,000 orders per year. We also provide supply chain solutions, including just-in-time delivery, and value-added components to many original equipment manufacturers.
For the year ended December 31, 2016, no single customer accounted for more than 2% of our sales, and our top 10 customers accounted for less than 12% of our sales.
Strong Relationships with Suppliers.
We are among the largest purchasers of metals in North America and have long-term relationships with many of our North American suppliers. We believe we are frequently one of the largest customers of our suppliers and that concentrating our orders among a core group of suppliers is an effective method for obtaining favorable pricing and service. We believe we have the opportunity to further leverage this strength through continued focus on price and volume using an analytics-driven approach to procurement. In addition, we view our strategic suppliers as supply chain partners. Our coordinated effort focused on logistics, lead times, rolling schedules, and scrap return programs ultimately results in value-based buying that is advantageous for us. Metals producers worldwide are consolidating, and large, geographically diversified customers, such as Ryerson, are desirable partners for these larger suppliers. Our relationships with suppliers often provide us with access to metals when supply is constrained. Through our knowledge of the global metals marketplace and capabilities of specific mills we believe we have developed a global purchasing strategy that allows us to secure favorable prices across our product lines.
Experienced Management Team with Deep Industry Knowledge.
Our senior management team has extensive industry and operational experience and has been instrumental in optimizing and implementing our strategy in the last four years. Our senior management has an average of more than 20 years of experience in the metals or service center industries. Our CEO, Mr. Edward Lehner, who joined the Company in August 2012 as CFO and became CEO in June 2015, has nearly 30 years of experience, predominantly in the metals industry. Mr. Erich Schnaufer, who joined the Company in 2005 and became CFO in January 2016, has over 25 years of financial and accounting experience and over 10 years with Ryerson. Under their leadership, we have increased our focus on positioning the Company for growth and enhanced profitability.
6
Industry Outlook
We believe that the United States economy has grown since the recession that began in 2008. According to the Institute for Supply Management, the Purchasing Managers’ Index (“PMI”) was above 50% for 29 of the last 36 months, which indicates that the U.S. manufacturing economy was generally expanding over the last three years. The PMI measures the economic health of the manufacturing sector and is a composite index based on five indicators: new orders, inventory levels, production, supplier deliveries and the employment environment. PMI readings can be a good indicator of industrial activity and general economic growth. That being said, another indicator of manufacturing activity, the US Federal Reserve’s Industrial Production Index, has shown monthly year-over-year contraction in dollars spent from September 2015 through November 2016.
Additionally, the overall U.S. economy is projected to continue growing as evidenced by the Federal Reserve’s midrange forecasted real GDP growth rates of 2.1%, 2.0%, and 1.9% for 2017, 2018, and 2019, respectively.
Steel demand in North America is largely dependent on growth of the automotive, industrial equipment, consumer appliance and construction end markets. One of our key end markets is within the industrial equipment sector and according to the latest Livingston Survey, published by the Federal Reserve Bank of Philadelphia, U.S. industrial production contracted by 0.9% in 2016 and is expected to grow by 1.5% in 2017 and 2.1% in 2017.
China continues to be a key driver in the growth of global metals demand. According to the International Monetary Fund, China’s GDP grew 6.7% in 2016 and is projected to grow 6.5% in 2017 and 6.0% in 2018.
Products and Services
We carry a full line of carbon steel, stainless steel, alloy steels and aluminum, and a limited line of nickel and red metals. These materials are inventoried in a number of shapes, including coils, sheets, rounds, hexagons, square and flat bars, plates, structurals and tubing.
The following table shows our percentage of sales by major product lines for 2016, 2015 and 2014:
|
Product Line |
|
2016 |
|
|
2015 |
|
|
2014 |
|
|||
|
Carbon Steel Flat |
|
|
28 |
% |
|
|
25 |
% |
|
|
25 |
% |
|
Carbon Steel Plate |
|
|
9 |
|
|
|
11 |
|
|
|
12 |
|
|
Carbon Steel Long |
|
|
13 |
|
|
|
16 |
|
|
|
15 |
|
|
Stainless Steel Flat |
|
|
17 |
|
|
|
16 |
|
|
|
16 |
|
|
Stainless Steel Plate |
|
|
4 |
|
|
|
4 |
|
|
|
4 |
|
|
Stainless Steel Long |
|
|
3 |
|
|
|
3 |
|
|
|
4 |
|
|
Aluminum Flat |
|
|
16 |
|
|
|
16 |
|
|
|
15 |
|
|
Aluminum Plate |
|
|
3 |
|
|
|
3 |
|
|
|
3 |
|
|
Aluminum Long |
|
|
5 |
|
|
|
4 |
|
|
|
4 |
|
|
Other |
|
|
2 |
|
|
|
2 |
|
|
|
2 |
|
|
Total |
|
|
100 |
% |
|
|
100 |
% |
|
|
100 |
% |
More than 75% of the materials sold by us are processed. We use processing and fabricating techniques such as sawing, slitting, blanking, cutting to length, leveling, flame cutting, laser cutting, edge trimming, edge rolling, polishing and shearing to process materials to specified thickness, length, width, shape and surface quality pursuant to specific customer orders. Among the most common processing techniques used by us are slitting, which involves cutting coiled metals to specified widths along the length of the coil, and leveling, which involves flattening metals and cutting them to exact lengths. We also use third-party fabricators to outsource certain processes that we are not able to perform internally (such as pickling, painting, forming and drilling) to enhance our value-added services.
The plate burning and fabrication processes are particularly important to us. These processes require sophisticated and expensive processing equipment. As a result, rather than making investments in such equipment, manufacturers have increasingly outsourced these processes to metals service centers.
As part of securing customer orders, we also provide services to our customers to assure cost effective material application while maintaining or improving the customers’ product quality. Our services include: just-in-time inventory programs, production of kits containing multiple products for ease of assembly by the customer, consignment arrangements and the placement of our employees at a customer’s site for inventory management and production and technical assistance. We also provide special stocking programs in which products that would not otherwise be stocked by us are held in inventory to meet certain customers’ needs. These
7
services are designed to reduce customers’ costs by minimizing their investment in inventory and improving their production efficiency.
Additional financial information is presented in Item 8. “Financial Statements and Supplementary Data” of this Form 10-K and is incorporated herein by reference.
Customers
Our customer base is diverse, numbering approximately 40,000 and includes most metal-consuming industries, most of which are cyclical. For the year ended December 31, 2016, no single customer accounted for more than 2% of our sales, and the top 10 customers accounted for less than 12% of our sales. Substantially all of our sales are attributable to our U.S. operations and substantially all of our long-lived assets are located in the United States. The following table shows the Company’s percentage of sales by metal consuming industry for 2016, 2015 and 2014:
|
|
|
Percentage of Sales |
|
|||||||||
|
Metal Consuming Industry |
|
2016 |
|
|
2015 |
|
|
2014 |
|
|||
|
Commercial ground transportation |
|
|
16 |
% |
|
|
18 |
% |
|
|
17 |
% |
|
Metal fabrication and machine shops |
|
|
18 |
|
|
|
18 |
|
|
|
18 |
|
|
Industrial machinery and equipment |
|
|
18 |
|
|
|
17 |
|
|
|
18 |
|
|
Consumer durable |
|
|
11 |
|
|
|
10 |
|
|
|
11 |
|
|
HVAC |
|
|
7 |
|
|
|
8 |
|
|
|
7 |
|
|
Construction equipment |
|
|
9 |
|
|
|
8 |
|
|
|
7 |
|
|
Food processing and agricultural equipment |
|
|
9 |
|
|
|
7 |
|
|
|
7 |
|
|
Oil & gas |
|
|
5 |
|
|
|
7 |
|
|
|
9 |
|
|
Other |
|
|
7 |
|
|
|
7 |
|
|
|
6 |
|
|
Total |
|
|
100 |
% |
|
|
100 |
% |
|
|
100 |
% |
Some of our largest customers have procurement programs with us, typically ranging from three months to one year in duration. Pricing for these contracts is generally based on a pricing formula rather than a fixed price for the program duration. However, certain customer contracts are at fixed prices; in order to minimize our financial exposure, we generally match these fixed-price sales programs with fixed-price supply programs. In general, sales to customers are priced at the time of sale based on prevailing market prices.
Suppliers
For the year ended December 31, 2016, our top 25 suppliers accounted for approximately 76% of our purchase dollars. We purchase the majority of our inventories at prevailing market prices from key suppliers with which we have established relationships to obtain improvements in price, quality, delivery and service. We are generally able to meet our materials requirements because we use many suppliers, because there is a substantial overlap of product offerings from these suppliers, and because there are a number of other suppliers able to provide identical or similar products. Because of the competitive nature of the business, when metal prices increase due to product demand, mill surcharges, supplier consolidation or other factors that in turn lead to supply constraints or longer mill lead times, we may not be able to pass our increased material costs fully to customers. In recent years, there have been significant consolidations among suppliers of carbon steel, stainless steel, and aluminum. Continued consolidation among suppliers could lead to disruptions in our ability to meet our material requirements as the sources of our products become more concentrated from fewer producers. We believe we will be able to meet our material requirements and believe we will continue to be among the largest customers of our suppliers.
Sales and Marketing
We maintain our own sales force. In addition to our office sales staff, we market and sell our products through the use of our field sales force that we believe has extensive product and customer knowledge and through a comprehensive catalog of our products. Our office and field sales staffs, which together consist of approximately 650 employees, include technical and metallurgical personnel.
A portion of our customers experience seasonal slowdowns. Our sales, as measured in terms of tonnage, in the months of July, November and December traditionally have been lower than in other months because of a reduced number of shipping days and holiday or vacation closures for some customers. Consequently, our sales in the first two quarters of the year are usually higher than in the third and fourth quarters.
8
Capital Expenditures
In recent years we have made capital expenditures to maintain, improve and expand processing capabilities. Additions by us to property, plant and equipment, together with retirements for the five years ended December 31, 2016, excluding the initial purchase price of acquisitions and the initial effect of fully consolidating a joint venture, are set forth below. The net capital change during such period aggregated to an increase of $76.0 million.
|
|
|
Additions |
|
|
Retirements or Sales |
|
|
Net |
|
|||
|
|
|
(In millions) |
|
|||||||||
|
2016 |
|
$ |
23.0 |
|
|
$ |
5.0 |
|
|
$ |
18.0 |
|
|
2015 |
|
|
22.3 |
|
|
|
9.1 |
|
|
|
13.2 |
|
|
2014 |
|
|
21.6 |
|
|
|
6.3 |
|
|
|
15.3 |
|
|
2013 |
|
|
20.2 |
|
|
|
13.5 |
|
|
|
6.7 |
|
|
2012 |
|
|
40.8 |
|
|
|
18.0 |
|
|
|
22.8 |
|
We currently anticipate capital expenditures, excluding acquisitions, of up to approximately $25 million for 2017. We expect capital expenditures will be funded from cash generated by operations and available borrowings.
Employees
As of December 31, 2016, we employed approximately 3,000 persons in North America and 325 persons in China. Our North American workforce was comprised of approximately 1,400 office employees and approximately 1,600 plant employees. Twenty-five percent of our plant employees were members of various unions, including the United Steel Workers and the International Brotherhood of Teamsters.
Three renewal contracts covering approximately 63 employees were successfully negotiated in 2016. Six contracts covering 118 employees are currently scheduled to expire in 2017.
Environmental, Health and Safety Matters
Our facilities and operations are subject to many foreign, federal, state and local laws and regulations relating to the protection of the environment and to health and safety. In particular, our operations are subject to extensive requirements relating to waste disposal, recycling, air and water emissions, the handling of regulated materials, remediation, underground storage tanks, asbestos-containing building materials, workplace exposure and other matters. We believe that our operations are currently in substantial compliance with all such laws and do not presently anticipate substantial expenditures in the foreseeable future in order to meet environmental, workplace health or safety requirements or to pay for any investigations, corrective action or claims. Claims, enforcement actions, or investigations regarding personal injury, property damage, or violation of environmental laws could result in substantial costs to us, divert our management’s attention and result in significant liabilities, fines, or the suspension or interruption of our facilities.
We continue to analyze and implement safeguards to mitigate any environmental, health and safety risks we may face. As a result, additional costs and liabilities may be incurred to comply with future requirements or to address newly discovered conditions, which costs and liabilities could have a material adverse effect on the results of operations, financial condition or cash flows. For example, there is increasing likelihood that additional regulation of greenhouse gas emissions will occur at the foreign, federal, state and local level, which could affect us, our suppliers, and our customers. While the costs of compliance could be significant, given the uncertain outcome and timing of future action by the U.S. federal government and states on this issue, we cannot accurately predict the financial impact of future greenhouse gas regulations on our operations or our customers at this time. We do not currently anticipate any new programs disproportionately impacting us compared to our competitors.
Some of the properties currently or previously owned or leased by us are located in industrial areas or have a long history of heavy industrial use. We may incur environmental liabilities with respect to these properties in the future including cost of investigations, corrective action, claims for natural resource damages, claims by third parties relating to property damages or claims relating to contamination at sites where we have sent waste for treatment or disposal. Based on currently available information we do not expect any investigation or remediation matters or claims related to properties presently or formerly owned or operated or to which we have sent waste for treatment or disposal would have a material adverse effect on our financial condition, results of operations or cash flows.
9
In October 2011, the United States Environmental Protection Agency (the “EPA”) named us as one of more than 100 businesses that may be a potentially responsible party for the Portland Harbor Superfund Site (the “PHS Site”). On January 6, 2017, the EPA issued its Record of Decision (“ROD”) regarding the site. The ROD includes a combination of dredging, capping and enhanced natural recovery that would take approximately thirteen years to construct plus additional time for monitored natural recovery, at an estimated present value cost of $1.05 billion. The EPA has not yet allocated responsibility for the contamination among the potentially responsible parties, including us. We do not currently have sufficient information available to us to determine whether the ROD will be executed as currently stated, whether and to what extent we may be held responsible for any of the identified contamination, and how much (if any) of the final plan’s costs might ultimately be allocated to us. Therefore, management cannot predict the ultimate outcome of this matter or estimate a range of potential loss at this time.
Excluding any potential additional remediation costs resulting from any corrective action for the properties described above, we expect spending for pollution control projects to remain at historical levels below $500,000 per year.
Our United States operations are also subject to the Department of Transportation Federal Motor Carrier Safety Regulations. We operate a private trucking motor fleet for making deliveries to some of our customers. Our drivers do not carry any material quantities of hazardous materials. Our foreign operations are subject to similar regulations. Future regulations could increase maintenance, replacement, and fuel costs for our fleet. These costs could have a material adverse effect on our results of operations, financial condition or cash flows.
Intellectual Property
We own several U.S. and foreign trademarks, service marks and copyrights. Certain of the trademarks are registered with the U.S. Patent and Trademark Office and, in certain circumstances, with the trademark offices of various foreign countries. We consider certain other information owned by us to be trade secrets. We protect our trade secrets by, among other things, entering into confidentiality agreements with our employees regarding such matters and implementing measures to restrict access to sensitive data and computer software source code on a need-to-know basis. We believe that these safeguards adequately protect our proprietary rights and vigorously defend these rights. While we consider all of our intellectual property rights as a whole to be important, we do not consider any single right to be essential to our operations as a whole.
Foreign Operations
Our foreign operations as a percentage of total sales for the years ended December 31, 2016, 2015 and 2014 were as follows:
|
|
|
Year Ended December 31, |
|
|||||||||
|
Foreign Location |
|
2016 |
|
|
2015 |
|
|
2014 |
|
|||
|
Canada |
|
|
8 |
% |
|
|
8 |
% |
|
|
8 |
% |
|
China |
|
|
5 |
|
|
|
4 |
|
|
|
4 |
|
|
Mexico |
|
< 1 |
|
|
< 1 |
|
|
< 1 |
|
|||
Our foreign assets as a percentage of consolidated assets at December 31, 2016, 2015 and 2014 were as follows:
|
|
|
At December 31, |
|
|||||||||
|
Foreign Location |
|
2016 |
|
|
2015 |
|
|
2014 |
|
|||
|
Canada |
|
|
10 |
% |
|
|
10 |
% |
|
|
9 |
% |
|
China |
|
|
5 |
|
|
|
5 |
|
|
|
5 |
|
|
Mexico |
|
< 1 |
|
|
< 1 |
|
|
< 1 |
|
|||
See Note 13 “Segment Information” of Part II, Item 8 "Financial Statements and Supplementary Data" for further information on U.S. and foreign revenues and long-lived assets.
Ryerson Canada
Ryerson Canada, an indirect wholly-owned Canadian subsidiary of Ryerson Holding, is a metals service center. Ryerson Canada has facilities in Calgary (AB), Edmonton (AB), Richmond (BC), Winnipeg (MB), Saint John (NB), Brampton (ON), Burlington (ON) (includes Canadian headquarters), and Vaudreuil (QC), Canada.
10
Ryerson China
In 2006, Ryerson Inc., formerly the direct subsidiary of Ryerson Holding, and VSC and its subsidiary, CAMP BVI, formed Ryerson China to enable us, through this foreign operation, to provide metals distribution services in China. We invested $28.3 million in Ryerson China for a 40% equity interest. We increased ownership of Ryerson China from 40% to 80% in the fourth quarter of 2008 for a total purchase cost of $18.5 million. We consolidated the operations of Ryerson China as of October 31, 2008. On July 12, 2010, we acquired VSC’s remaining 20% equity interest in Ryerson China for $17.5 million. As a result, Ryerson China is now an indirect wholly owned subsidiary of Ryerson. Ryerson China is based in Kunshan and operates five processing and service centers in Guangzhou, Dongguan, Kunshan and Tianjin.
Ryerson Mexico
Ryerson Mexico, an indirect wholly owned subsidiary of Ryerson Holding, operates as a metals service center. Ryerson Holding formed Ryerson Mexico in 2010 to expand operations into the Mexican market. Ryerson Mexico has service centers in Monterrey, Tijuana, Hermosillo, and Queretaro.
Available Information
All periodic and current reports and other filings that we are required to file with the Securities and Exchange Commission (“SEC”), including our annual report on Form 10-K, quarterly reports on Form 10-Q, current reports on Form 8-K, and amendments to those reports filed or furnished pursuant Section 15(d) of the Securities Exchange Act of 1934, as amended, are available free of charge from the SEC’s website (http://www.sec.gov) or public reference room at 100 F Street N.E., Washington, D.C. 20549 (1-800-SEC-0330) or through our website at http://www.ryerson.com. Such documents are available as soon as reasonably practicable after electronic filing of the material with the SEC. Copies of these reports (excluding exhibits) may also be obtained free of charge, upon written request to: Investor Relations, Ryerson Holding Corporation, 227 W. Monroe St., 27th Floor, Chicago, Illinois 60606.
The Company also posts its Code of Ethics on the website. See “Directors, Executive Officers and Corporate Governance—Code of Ethics” for more information regarding our Code of Ethics.
Our website address is included in this report for information purposes only. Our website and the information contained therein or connected thereto are not incorporated into this annual report on Form 10-K.
Our business faces many risks. You should carefully consider the risks and uncertainties described below, together with the other information in this report, including the consolidated financial statements and notes to consolidated financial statements. We cannot assure you that any of the events discussed in the risk factors below will not occur. These risks could have a material and adverse impact on our business, results of operations, financial condition and cash flows.
Risks Related to Our Business and Industry
We service industries that are highly cyclical, and any downturn in our customers’ industries could reduce our revenues and profitability.
Many of our products are sold to industries that experience significant fluctuations in demand based on economic conditions, energy prices, seasonality, consumer demand and other factors beyond our control. These industries include manufacturing, electrical production and transportation. This cyclicality can significantly affect demand of materials for us. We do not expect the cyclical nature of our industry to change and any downturn in our customers’ industries could reduce our revenues and profitability.
The volatility of the market could result in a material impairment of goodwill.
We evaluate goodwill annually on October 1 and whenever events or changes in circumstances indicate potential impairment. Events or changes in circumstances that could trigger an impairment review include significant underperformance relative to our historical or projected future operating results, significant changes in the manner or the use of our assets or the strategy for our overall business, and significant negative industry or economic trends. We test for impairment of goodwill by assessing various qualitative factors with respect to development in our business and the overall economy and calculating the fair value of a reporting unit using a combination of an income approach based on discounted future cash flows and a market approach at the date of valuation. Under the discounted cash flow method, the fair value of each reporting unit is estimated based on expected future economic benefits discounted to a present value at a rate of return commensurate with the risk associated with the investment. Projected cash flows are discounted to present value using an estimated weighted average cost of capital, which considers both returns to equity and debt investors.
11
Significant changes in any one of the assumptions made as part of our analysis, which could occur as a result of actual events, or further declines in the market conditions for our products, could significantly impact our impairment analysis. An impairment charge, if incurred, could be material.
The metals distribution business is very competitive and increased competition could reduce our revenues and gross margins.
The principal markets that we serve are highly competitive. The metals distribution industry is fragmented and competitive, consisting of a large number of small companies and a few relatively large companies. Competition is based principally on price, service, quality, production capabilities, inventory availability and timely delivery. Competition in the various markets in which we participate comes from companies of various sizes, some of which have greater financial resources than we have and some of which have more established brand names in the local markets we serve. Increased competition could reduce our market share, force us to lower our prices or to offer increased services at a higher cost, which could reduce our profitability.
Changing metals prices may have a significant impact on our liquidity, net sales, gross margins, operating income and net income.
The metals industry as a whole is cyclical and, at times, pricing and availability of metal can be volatile due to numerous factors beyond our control, including general domestic and international economic conditions, labor costs, sales levels, competition, levels of inventory held by other metals service centers, consolidation of metals producers, higher raw material costs for the producers of metals, import duties and tariffs and currency exchange rates. This volatility can significantly affect the availability and cost of materials for us.
We maintain substantial inventories of metal to accommodate the short lead times and just-in-time delivery requirements of our customers. Accordingly, we purchase metals in an effort to maintain our inventory at levels that we believe to be appropriate to satisfy the anticipated needs of our customers based upon historic buying practices, contracts with customers and market conditions. When metals prices decline, customer demands for lower prices and our competitors’ responses to those demands result in lower sale prices and, consequently, lower margins as we use existing metals inventory. Declines in prices or further reductions in sales volumes could adversely impact our ability to maintain our liquidity and to remain in compliance with certain financial covenants under our $750 million revolving credit facility (the “Ryerson Credit Facility”), as well as result in us incurring inventory or goodwill impairment charges. Changing metals prices therefore could significantly impact our liquidity, net sales, gross margins, operating income and net income.
We may not be able to successfully consummate and complete the integration of future acquisitions, and if we are unable to do so, we may be unable to increase our growth rates.
We have grown through a combination of internal expansion, acquisitions and joint ventures. We intend to continue to grow through selective acquisitions, but we may not be able to identify appropriate acquisition candidates, obtain financing on satisfactory terms, consummate acquisitions or integrate acquired businesses effectively and profitably into our existing operations. Restrictions contained in the agreements governing our notes, the Ryerson Credit Facility or our other existing or future debt may also inhibit our ability to make certain investments, including acquisitions and participations in joint ventures.
Our future success will depend on our ability to complete the integration of these future acquisitions successfully into our operations. After any acquisition, customers may choose to diversify their supply chains to reduce reliance on a single supplier for a portion of their metals needs. We may not be able to retain all of our and an acquisition’s customers, which may adversely affect our business and sales. Integrating acquisitions, particularly large acquisitions, requires us to enhance our operational and financial systems and employ additional qualified personnel, management and financial resources, and may adversely affect our business by diverting management away from day-to-day operations. Further, failure to successfully integrate acquisitions may adversely affect our profitability by creating significant operating inefficiencies that could increase our operating expenses as a percentage of sales and reduce our operating income. In addition, we may not realize expected cost savings from acquisitions.
We may not be able to retain or expand our customer base if the North American manufacturing industry continues to erode through moving offshore or through acquisition and merger or consolidation activity in our customers’ industries.
Our customer base primarily includes manufacturing and industrial firms. Some of our customers operate in industries that are undergoing consolidation through acquisition and merger activity; some are considering or have considered relocating production operations overseas or outsourcing particular functions overseas; and some customers have closed as they were unable to compete successfully with overseas competitors. Our facilities are predominately located in the United States and Canada. To the extent that our customers cease U.S. operations, relocate or move operations overseas to regions in which we do not have a presence, we could lose their business. Acquirers of manufacturing and industrial firms may have suppliers of choice that do not include us, which could impact our customer base and market share.
12
Certain of our operations are located outside of the United States, which subjects us to risks associated with international activities.
Certain of our operations are located outside of the United States, primarily in Canada, China and Mexico. We are subject to the Foreign Corrupt Practices Act (“FCPA”), which generally prohibits U.S. companies and their intermediaries from making corrupt payments or otherwise corruptly giving any other thing of value to foreign officials for the purpose of obtaining or keeping business or otherwise obtaining favorable treatment, and requires companies to maintain adequate record-keeping and internal accounting practices. The FCPA applies to covered companies, individual directors, officers, employees and agents. Under the FCPA, U.S. companies may be held liable for some actions taken by strategic or local partners or representatives. If we or our intermediaries fail to comply with the requirements of the FCPA, governmental authorities in the United States could seek to impose civil and/or criminal penalties.
We may be adversely affected by currency fluctuations in the U.S. dollar versus the Canadian dollar and the Chinese renminbi.
We have significant operations in Canada which incur the majority of their metal supply costs in U.S. dollars but earn the majority of their sales in Canadian dollars. Additionally, we have significant assets in China. We may from time to time experience losses when the value of the U.S. dollar strengthens against the Canadian dollar or the Chinese renminbi, which could have a material adverse effect on our results of operations. In addition, we will be subject to translation risk when we consolidate our Canadian and Chinese subsidiaries’ net assets into our balance sheet. Fluctuations in the value of the U.S. dollar versus the Canadian dollar or Chinese renminbi could reduce the value of these assets as reported in our financial statements, which could, as a result, reduce our stockholders’ equity.
The Chinese government exerts substantial influence over the manner in which we must conduct our business activities, particularly with regards to the land our facilities are located on.
The Chinese government has exercised and continues to exercise substantial control over the Chinese economy through regulation and state ownership. Our ability to operate in China may be harmed by changes in its laws and regulations, including those relating to taxation, import and export tariffs, environmental regulations, land use rights, property and other matters. We believe that our operations in China are in material compliance with all applicable legal and regulatory requirements. However, the central or local governments of the jurisdictions in which we operate may impose new, stricter regulations or interpretations of existing regulations that would require additional expenditures and efforts on our part to ensure our compliance with such regulations or interpretations. Moreover, the Chinese court system does not provide the same property and contract right guarantees as do courts in the United States and, accordingly, disputes may be protracted and resolution of claims may result in significant economic loss.
Additionally, there is no private ownership of land in China and all land ownership is held by the government of China, its agencies, and collectives, which issue land use rights that are generally renewable. We lease the land where our Chinese facilities are located from the Chinese government. If the Chinese government decided to terminate our land use rights agreements, our assets could become impaired and our ability to meet customer orders could be impacted.
Our revenue and operating results may fluctuate, which could result in a decline in our profitability and make it more difficult for us to grow our business.
Our revenue and operating results have historically varied from quarter to quarter. Periods of decline could result in an overall decline in profitability and make it more difficult for us to make payments on our indebtedness and grow our business. We expect our quarterly results to continue to fluctuate in the future due to a number of factors, including:
|
|
• |
changes in commodity prices, especially metals; |
|
|
• |
general economic conditions in the markets where we operate; and |
|
|
• |
the cyclical nature of our customers’ business. |
Damage to our information technology infrastructure could harm our business.
The unavailability of any of our computer-based systems for any significant period of time could have a material adverse effect on our operations. In particular, our ability to manage inventory levels successfully largely depends on the efficient operation of our computer hardware and software systems. We use management information systems to track inventory information at individual facilities, communicate customer information and aggregate daily sales, margin and promotional information. Difficulties associated with upgrades, installations of major software or hardware, and integration with new systems could have a material adverse effect on results of operations. We will be required to expend substantial resources to integrate our information systems with the systems of companies we have acquired. The integration of these systems may disrupt our business or lead to operating inefficiencies. In addition, these systems are vulnerable to, among other things, damage or interruption from fire, flood, tornado and other natural disasters,
13
power loss, computer system and network failures, operator negligence, physical and electronic loss of data, or security breaches and computer viruses.
We are subject to cybersecurity risks and may incur increasing costs in an effort to minimize those risks.
We depend on the proper functioning and availability of our information technology platform, including communications and data processing systems, in operating our business. These systems include software programs that are integral to the efficient operation of our business. We have established security measures, controls and procedures to safeguard our information technology systems and to prevent unauthorized access to such systems and any data processed or stored in such systems, and we periodically evaluate and test the adequacy of such systems, measures, controls and procedures; however, there can be no guarantee that such systems, measures, controls and procedures will be effective. Security breaches could expose us to a risk of loss or misuse of our information, litigation and potential liability. In addition, cyber incidents that impact the availability, reliability, speed, accuracy or other proper functioning of these systems could have a significant impact on our operations, and potentially on our results. We may not have the resources or technical sophistication to anticipate or prevent rapidly evolving types of cyberattacks. A significant cyber incident, including system failure, security breach, disruption by malware or other damage could interrupt or delay our operations, result in a violation of applicable privacy and other laws, damage our reputation, cause a loss of customers or give rise to monetary fines and other penalties, which could be significant.
Any significant work stoppages can harm our business.
As of December 31, 2016, we employed approximately 3,000 persons in North America and 325 persons in China. Our North American workforce was comprised of approximately 1,400 office employees and approximately 1,600 plant employees. Twenty-five percent of our plant employees were members of various unions, including the United Steel Workers and the International Brotherhood of Teamsters.
Three renewal contracts covering approximately 63 employees were successfully negotiated in 2016. Six contracts covering 118 employees are currently scheduled to expire in 2017.
Certain employee retirement benefit plans are underfunded and the actual cost of those benefits could exceed current estimates, which would require us to fund the shortfall.
As of December 31, 2016, our pension plan had an unfunded liability of $216 million. Our actual costs for benefits required to be paid may exceed those projected and future actuarial assessments to the extent that those costs exceed the current assessment. Under those circumstances, the adjustments required to be made to our recorded liability for these benefits could have a material adverse effect on our results of operations and financial condition and cash payments to fund these plans could have a material adverse effect on our cash flows. We may be required to make substantial future contributions to improve the plan’s funded status.
Future funding for postretirement employee benefits other than pensions also may require substantial payments from current cash flow.
We provide postretirement life insurance and medical benefits to eligible retired employees. Our unfunded postretirement benefit obligation as of December 31, 2016 was $74 million. Our actual costs for benefits required to be paid may exceed those projected and future actuarial assessments to the extent that those costs exceed the current assessment. Under those circumstances, adjustments will be required to be made to our recorded liability for these benefits.
Any prolonged disruption of our processing centers could harm our business.
We have dedicated processing centers that permit us to produce standardized products in large volumes while maintaining low operating costs. We may suffer prolonged disruption in the operations of any of these facilities, whether due to labor or technical difficulties, destruction or damage to any of the facilities or otherwise.
If we are unable to retain and attract management and key personnel, it may adversely affect our business.
We believe that our success is due, in part, to our experienced management team. Losing the services of one or more members of our management team such as our CEO, Edward J. Lehner, and CFO, Erich S. Schnaufer, could adversely affect our business and possibly prevent us from improving our operational, financial and information management systems and controls. In the future, we may need to retain and hire additional qualified sales, marketing, administrative, operating and technical personnel, and to train and manage new personnel. Our ability to implement our business plan is dependent on our ability to retain and hire a large number of qualified employees each year.
14
Our international operations and potential joint ventures may cause us to incur costs and risks that may distract management from effectively operating our North American business, and such operations or joint ventures may not be profitable.
We maintain foreign operations in Canada, China and Mexico. International operations are subject to certain risks inherent in conducting business in, and with, foreign countries, including price controls, exchange controls, export controls, economic sanctions, duties, tariffs, limitations on participation in local enterprises, nationalization, expropriation and other governmental action, and changes in currency exchange rates. While we believe that our current arrangements with local partners provide us with experienced business partners in foreign countries, events or issues, including disagreements with our partners, may occur that require attention of our senior executives and may result in expenses or losses that erode the profitability of our foreign operations or cause our capital investments abroad to be unprofitable.
Lead time and the cost of our products could increase if we were to lose one of our primary suppliers.
If, for any reason, our primary suppliers of aluminum, carbon steel, stainless steel or other metals should curtail or discontinue their delivery of such metals in the quantities needed and at prices that are competitive, our business could suffer. The number of available suppliers could be reduced by factors such as industry consolidation and bankruptcies affecting steel and metal producers. For the year ended December 31, 2016, our top 25 suppliers represented approximately 76% of our purchases. We could be significantly and adversely affected if delivery were disrupted from a major supplier. If, in the future, we were unable to obtain sufficient amounts of the necessary metals at competitive prices and on a timely basis from our traditional suppliers, we may not be able to obtain such metals from alternative sources at competitive prices to meet our delivery schedules, which could have a material adverse effect on our sales and profitability.
We could incur substantial costs related to environmental, health and safety laws.
Our operations are subject to increasingly stringent environmental, health and safety laws. These include laws that impose limitations on the discharge of pollutants into the air and water and establish standards for the treatment, storage and disposal of regulated materials and the investigation and remediation of contaminated soil, surface water and groundwater. Failure to maintain or achieve compliance with these laws or with the permits required for our operations could result in substantial increases in operating costs and capital expenditures. In addition, we may be subject to fines and civil or criminal sanctions, third party claims for property damage or personal injury, worker’s compensation or personal injury claims, cleanup costs or temporary or permanent discontinuance of operations. Certain of our facilities are located in industrial areas, have a history of heavy industrial use and have been in operation for many years and, over time, we and other predecessor operators of these facilities have generated, used, handled and disposed of hazardous and other regulated wastes. Environmental liabilities could exist, including cleanup obligations at these facilities or at off-site locations where materials from our operations were disposed of, which could result in future expenditures that cannot be currently quantified and which could have a material adverse effect on our financial position, results of operations or cash flows. Such liabilities may be imposed without regard to fault or the legality of a party’s conduct and may, in certain circumstances, be joint and several. Future changes to environmental, health and safety laws, including those related to climate change, could result in material liabilities and costs, constrain operations or make such operations more costly for us, our suppliers and our customers. In October 2011, the EPA named us as one of more than 100 businesses that may be a potentially responsible party for the Portland Harbor Superfund Site (the “PHS Site”), which includes in-river and upland portions. On February 9, 2016, the EPA published its Final Remedial Investigation Report. On June 8, 2016, the EPA published both the Draft Feasibility Study and associated Superfund Proposed Plan. Following a public comment period, on January 6, 2017, the EPA released its Record of Decision selecting a remedy for the in-river portion of the PHS Site that is expected to cost approximately $1.05 billion in total and take approximately 13 years to complete. The allocation of responsibility for the contamination among the potentially responsible parties, including JT Ryerson, has not yet been determined. We do not currently have sufficient information available to us to determine the total cost of any required investigation or remediation of the PHS Site and therefore, management cannot predict the ultimate outcome of this matter or estimate a range of potential loss at this time.
Regulations related to conflict-free minerals may force us to incur additional expenses and place us at a competitive disadvantage.
On August 22, 2012, under the Dodd-Frank Wall Street Reform and Consumer Protection Act of 2010 (the “Dodd-Frank Act”), the United States SEC adopted new requirements for reporting companies that use certain minerals and metals, known as “conflict minerals”, in their products, whether or not these products are manufactured by third parties. These requirements require companies to diligence, disclose and report whether or not such minerals originate from the Democratic Republic of Congo and adjoining countries. Since our supply chain is complex, we may not be able to conclusively verify the origins for all metals used in our products and we may face reputational challenges with our customers. Additionally, as there may be only a limited number of suppliers offering “conflict free” metals, we cannot be sure that we will be able to obtain necessary metals from such suppliers in sufficient quantities or at competitive prices. Accordingly, we could incur significant cost related to the compliance process, including potential difficulty or added costs in satisfying the disclosure requirements. Moreover, we may encounter challenges to satisfy those customers who require
15
that all of the components of our products be certified as conflict free which could place us at a competitive disadvantage if we are unable to do so. On January 31, 2017, the SEC’s Acting Commissioner issued a statement directing SEC staff to reconsider current positions on reporting requirements related to “conflict minerals” and at this time, we do not have sufficient information available to us to determine whether the outcome of such reconsideration may have adverse effects on our business.
We are subject to litigation that could strain our resources and distract management.
From time to time, we are involved in a variety of claims, lawsuits and other disputes arising in the ordinary course of business. These suits concern issues including product liability, contract disputes, employee-related matters and personal injury matters. It is not feasible to predict the outcome of all pending suits and claims, and the ultimate resolution of these matters as well as future lawsuits could have a material adverse effect on our business, financial condition, results of operations or cash flows or reputation.
We may face product liability claims that are costly and create adverse publicity.
If any of the products that we sell cause harm to any of our customers, we could be exposed to product liability lawsuits. If we were found liable under product liability claims, we could be required to pay substantial monetary damages. Further, even if we successfully defended ourselves against this type of claim, we could be forced to spend a substantial amount of money in litigation expenses, our management could be required to spend valuable time in the defense against these claims and our reputation could suffer.
Our risk management strategies may result in losses.
From time to time, we may use fixed-price and/or fixed-volume supplier contracts to offset contracts with customers. Additionally, we may use foreign exchange contracts and interest rate swaps to hedge Canadian dollar and floating rate debt exposures. These risk management strategies pose certain risks, including the risk that losses on a hedge position may exceed the amount invested in such instruments. Moreover, a party in a hedging transaction may be unavailable or unwilling to settle our obligations, which could cause us to suffer corresponding losses. A hedging instrument may not be effective in eliminating all of the risks inherent in any particular position. Our profitability may be adversely affected during any period as a result of use of such instruments.
Risks Related to Ownership of Our Common Stock
The market price for our common stock may be volatile.
Historically, there has been volatility in the market price for our common stock. Furthermore, the market price of our common stock could fluctuate substantially in the future in response to a number of factors, including, but not limited to, the risk factors described herein. Examples include:
|
|
• |
changes in commodity prices, especially metals; |
|
|
• |
announcement of our quarterly operating results or the operating results of other metals service centers; |
|
|
• |
changes in financial estimates or recommendations by stock market analysts regarding us or our competitors; |
|
|
• |
the operating and stock performance of other companies that investors may deem comparable; |
|
|
• |
press releases, earnings releases or publicity relating to us or our competitors or relating to trends in the metals service center industry; |
|
|
• |
inability to meet securities analysts’ and investors’ quarterly or annual estimates or targets of our performance; |
|
|
• |
sales of our common stock by large or controlling shareholders; |
|
|
• |
the amount of shares acquired for short-term investments; |
|
|
• |
general domestic or international economic, market and political conditions; and |
|
|
• |
announcements by us or our competitors of significant acquisitions, dispositions or joint ventures, or other material events impacting the domestic or global metals industry. |
In the past, the stock market has experienced significant price and volume fluctuations. This volatility has had a significant effect on the market prices of securities issued by many companies for reasons unrelated to their specific operating performance. These factors may adversely affect the trading price of our common stock, regardless of actual operating performance.
16
In addition, stock markets from time to time experience extreme price and volume fluctuations that may be unrelated or disproportionate to the operating performance of companies. In the past, some shareholders have brought securities class action lawsuits against companies following periods of volatility in the market price of their securities. We may in the future be the target of similar litigation. Securities litigation, regardless of whether our defense is ultimately successful, could result in substantial costs and divert management’s attention and resources.
We have a substantial amount of indebtedness, which could adversely affect our financial position and prevent us from fulfilling our financial obligations.
We currently have a substantial amount of indebtedness. As of December 31, 2016, our total indebtedness was approximately $963.5 million and we had approximately $225 million of unused capacity under the Ryerson Credit Facility. Our substantial indebtedness may:
|
|
• |
make it difficult for us to satisfy our financial obligations, including making scheduled principal and interest payments on our outstanding notes and our other indebtedness; |
|
|
• |
limit our ability to borrow additional funds for working capital, capital expenditures, acquisitions and general corporate and other purposes; |
|
|
• |
limit our ability to use our cash flow for future working capital, capital expenditures, acquisitions or other general corporate purposes; |
|
|
• |
require us to use a substantial portion of our cash flow from operations to make debt service payments; |
|
|
• |
limit our flexibility to plan for, or react to, changes in our business and industry; |
|
|
• |
place us at a competitive disadvantage compared to our less leveraged competitors; and |
|
|
• |
increase our vulnerability to the impact of adverse economic and industry conditions. |
We may also incur additional indebtedness in the future. The terms of the Ryerson Credit Facility and the indenture governing our outstanding notes restrict but do not prohibit us from doing so, and the indebtedness incurred in compliance with these restrictions could be substantial. If new indebtedness is added to our current debt levels, the related risks that we now face could intensify.
The covenants in the Ryerson Credit Facility and the indenture governing our notes impose, and covenants contained in agreements governing indebtedness that we incur in the future may impose, restrictions that may limit our operating and financial flexibility.
The Ryerson Credit Facility and the indenture governing our outstanding notes contain a number of significant restrictions and covenants that limit our ability and the ability of our restricted subsidiaries, including JT Ryerson, to:
|
|
• |
incur additional debt; |
|
|
• |
pay dividends on our capital stock or repurchase our capital stock; |
|
|
• |
make certain investments or other restricted payments; |
|
|
• |
create liens or use assets as security in other transactions; |
|
|
• |
merge, consolidate or transfer or dispose of substantially all of our assets; and |
|
|
• |
engage in transactions with affiliates. |
The terms of the Ryerson Credit Facility require that, in the event availability under the facility declines to a certain level, we maintain a minimum fixed charge coverage ratio at the end of each fiscal quarter. Total credit availability is limited by the amount of eligible accounts receivable, inventory, and qualified cash pledged as collateral under the agreement insofar as the Company is subject to a borrowing base comprised of the aggregate of these two amounts, less applicable reserves. As of December 31, 2016, total credit availability was $225 million.
Additionally, subject to certain exceptions, the indenture governing the outstanding notes restricts JT Ryerson’s ability to pay Ryerson Holding dividends. Our future indebtedness may contain covenants more restrictive in certain respects than the restrictions contained in the Ryerson Credit Facility and the indenture governing the notes. Operating results below current levels or other adverse factors, including a significant increase in interest rates, could result in our being unable to comply with financial covenants that are contained in the Ryerson Credit Facility or that may be contained in any future indebtedness. In addition, complying with these
17
covenants may also cause us to take actions that are not favorable to holders of our notes and may make it more difficult for us to successfully execute our business strategy and compete against companies that are not subject to such restrictions.
We may not be able to generate sufficient cash to service all of our indebtedness.
Our ability to make payments on our indebtedness depends on our ability to generate cash in the future. Our outstanding notes, the Ryerson Credit Facility and our other outstanding indebtedness are expected to account for significant cash interest expenses. Accordingly, we will have to generate significant cash flows from operations to meet our debt service requirements. If we do not generate sufficient cash flow to meet our debt service and working capital requirements, we may be required to sell assets, seek additional capital, reduce capital expenditures, restructure or refinance all or a portion of our existing indebtedness, or seek additional financing. Moreover, insufficient cash flow may make it more difficult for us to obtain financing on terms that are acceptable to us, or at all.
The right to receive payment on the 2022 Notes and the guarantees will be subordinated to the liabilities of non-guarantor subsidiaries.
The notes and related guarantees are structurally subordinated to all indebtedness of our subsidiaries that are note guarantors of the 2022 Senior Secured Notes (the “2022 Notes”). While the indenture governing the 2022 Notes limits the indebtedness and activities of these non-guarantor subsidiaries, holders of indebtedness of, and trade creditors of, non-guarantor subsidiaries, including lenders under bank financing agreements, are entitles to payments of their claims from the assets of such subsidiaries before those assets are made available for distribution to any guarantor, as direct or indirect shareholder. While the non-guarantor subsidiaries have agreed under the indenture not to pledge or encumber their assets (other than with respect to permitted liens) without equally and ratably securing the notes, they will not guarantee the 2022 Notes notwithstanding any such pledge or encumbrance in favor of the 2022 Notes.
The non-guarantor subsidiaries represented, respectively, 13.1% and 6.8% of our net sales and EBITDA for the fiscal year ended December 31, 2016. In addition, these non-guarantor subsidiaries represented respectively, 15.5% and 9.6% of our assets and liabilities, as of December 31, 2016.
Accordingly, in the even that any of the non-guarantor subsidiaries or joint venture entities become insolvent, liquidates or otherwise reorganizes:
|
|
• |
the creditors of the guarantors (including the holders of the 2022 Notes) will have no right to proceed against such subsidiary’s assets; and |
|
|
• |
the creditors of such non-guarantor subsidiary, including trade creditors, will generally be entitled to payment in full from the sale or other disposal of assets of such subsidiary, as direct or indirect shareholder, and will be entitles to receive any distributions from such subsidiary. |
Because a portion of our indebtedness bears interest at rates that fluctuate with changes in certain prevailing short-term interest rates, we are vulnerable to interest rate increases.
A portion of our indebtedness, including the Ryerson Credit Facility, bears interest at rates that fluctuate with changes in certain short-term prevailing interest rates. As of December 31, 2016, we had approximately $312.0 million of outstanding borrowings under the Ryerson Credit Facility, with an additional $225 million available for borrowing under such facility. Assuming a consistent level of debt, a 100 basis point change in the interest rate on our floating rate debt effective from the beginning of the year would increase or decrease our interest expense under the Ryerson Credit Facility by approximately $3.3 million on an annual basis. If interest rates increase dramatically, we could be unable to service our debt, which could have a material adverse effect on our business, financial condition, results of operations or cash flows.
Platinum owns a significant percentage of our stock and has the right to nominate a majority of the members of the Corporation’s board and will be able to exert control over matters subject to stockholder approval.
Platinum owns approximately 21,037,500 shares of our common stock, which is approximately 57% of our issued and outstanding common stock. Therefore, Platinum may be able to determine all matters requiring stockholder approval. For example, Platinum may be able to control elections of directors, amendments of our organizational documents, or approval of any merger, sale of assets, or other major corporate transaction. This may prevent or discourage unsolicited acquisition proposals or offers for our common stock that our stockholders may believe are in their best interest as stockholders.
The Company is party to an investor rights agreement (the “Investor Rights Agreement”) with certain affiliates of Platinum which provides, among other things, that for so long as Platinum collectively beneficially owns (i) at least 30% of the voting power of
18
the outstanding capital stock of the Company, Platinum will have the right to nominate for election to the board of directors of the Company no fewer than that number of directors that would constitute a majority of the number of directors if there were no vacancies on the board, (ii) at least 15% but less than 30% of the voting power of the outstanding capital stock of the Company, Platinum will have the right to nominate two directors and (iii) at least 5% but less than 15% of the voting power of the outstanding capital stock of the Company, Platinum will have the right to nominate one director. The agreement also provides that if the size of the board of directors is increased or decreased at any time, Platinum’s nomination rights will be proportionately increased or decreased, respectively, rounded up to the nearest whole number. As a result of Platinum’s ownership of a majority of the Company’s outstanding capital stock as well its board nomination rights pursuant to the Investor Rights Agreement, Platinum may significantly influence or effectively control our policies and operations, including the appointment of management, future issuances of our common stock or other securities and the payment of dividends. In addition, Platinum has significant control over our decisions to enter into any other corporate transaction.
The interests of Platinum may not in all cases be aligned with the interests of the other holders of our common stock. For example, a sale of a substantial number of shares of stock in the future by Platinum could cause our stock price to decline. Further, Platinum could cause us to make acquisitions that increase the amount of the indebtedness that is secured or senior to the Company’s existing debt or sell revenue-generating assets, impairing our ability to make payments under such debt. Additionally, Platinum is in the business of making investments in companies and may from time to time acquire and hold interests in businesses that compete directly or indirectly with us. Accordingly, Platinum may also pursue acquisition opportunities that may be complementary to our business, and as a result, those acquisition opportunities may not be available to us. In addition, Platinum may have an interest in pursuing acquisitions, divestitures and other transactions that, in their judgment, could enhance their equity investment, even though such transactions might involve risks to holders of our common stock.
We are exempt from certain corporate governance requirements because we are a “controlled company” within the meaning of the NYSE rules and, as a result, our stockholders do not have the protections afforded by these corporate governance requirements.
Because Platinum controls more than 50% of the voting power of our common stock, we are considered to be a “controlled company” for purposes of the New York Stock Exchange (“NYSE”) listing requirements. Under the NYSE rules, a “controlled company” may elect not to comply with certain NYSE corporate governance requirements, including (1) the requirement that a majority of our Board of Directors consist of independent directors, (2) the requirement that the nominating and corporate governance committee of our Board of Directors be composed entirely of independent directors, (3) the requirement that the compensation committee of our Board of Directors be composed entirely of independent directors and (4) the requirement for an annual performance evaluation of the nomination/corporate governance and compensation committees. Given that Platinum controls a majority of the voting power of our common stock, we are permitted, and have elected, to opt out of compliance with certain NYSE corporate governance requirements. Accordingly, holders of our common stock do not have the same protections afforded to stockholders of companies that are subject to all of the NYSE corporate governance requirements.
Our corporate documents and Delaware law contain provisions that could discourage, delay or prevent a change in control of the Company.
Our amended and restated certificate of incorporation and amended and restated bylaws contain provisions that may make the acquisition of our company more difficult without the approval of our Board of Directors. These provisions:
|
|
• |
establish a classified Board of Directors so that not all members of our Board of Directors are elected at one time; |
|
|
• |
authorize the issuance of undesignated preferred stock, the terms of which may be established and the shares of which may be issued without stockholder approval, and which may include super voting, special approval, dividend, or other rights or preferences superior to the rights of the holders of common stock; |
|
|
• |
provide that the Board of Directors is expressly authorized to make, alter, or repeal our amended and restated bylaws; |
|
|
• |
prohibit stockholders from acting by written consent if less than a majority of the voting power of our outstanding stock is controlled by Platinum; and |
|
|
• |
establish advance notice requirements for nominations for elections to our Board of Directors or for proposing matters that can be acted upon by stockholders at stockholder meetings. |
These anti-takeover provisions and other provisions under Delaware law could discourage, delay or prevent a transaction involving a change in control of our company, even if doing so would benefit our stockholders. These provisions could also discourage proxy contests and make it more difficult for our stockholders to elect directors of their choosing and to cause us to take other corporate actions they desire.
Any issuance of preferred stock could make it difficult for another company to acquire us or could otherwise adversely affect holders of our common stock, which could depress the price of our common stock.
19
Our Board of Directors will have the authority to issue preferred stock and to determine the preferences, limitations and relative rights of shares of preferred stock and to fix the number of shares constituting any series and the designation of such series, without any further vote or action by our stockholders. Our preferred stock could be issued with voting, liquidation, dividend and other rights superior to the rights of our common stock. The potential issuance of preferred stock may delay or prevent a change in control of us, discouraging bids for our common stock at a premium over the market price, and adversely affect the market price and the voting and other rights of the holders of our common stock.
We have not and do not intend to pay regular cash dividends on our stock.
We do not anticipate declaring or paying regular cash dividends on our common stock or any other equity security in the foreseeable future. The amounts that may be available to us to pay cash dividends are restricted under our debt agreements. Any payment of cash dividends on our common stock in the future will be at the discretion of our Board of Directors and will depend upon our results of operations, earnings, capital requirements, financial condition, future prospects, contractual restrictions and other factors deemed relevant by our Board of Directors. Therefore, you should not rely on dividend income from shares of our common stock. For more information, see “Dividend Policy.” Your only opportunity to achieve a return on your investment in us may be if the market price of our common stock appreciates and you sell your shares at a profit but there is no guarantee that the market price for our common stock will ever exceed the price that you pay for our common stock in this offering.
Not applicable.
20
As of December 31, 2016, the Company’s facilities are set forth below:
Operations in the United States
JT Ryerson maintains 78 operational facilities, including 5 locations that are dedicated to administration services. All of our metals service center facilities are in good condition and are adequate for JT Ryerson’s existing operations. Approximately 45% of these facilities are leased. The lease terms expire at various times through 2026. Owned properties noted as vacated below have been closed and are in the process of being sold. JT Ryerson’s properties and facilities are adequate to serve its present and anticipated needs.
|
Location |
|
Own/Lease |
|
Birmingham, AL |
|
Owned |
|
Mobile, AL |
|
Owned |
|
Fort Smith, AR |
|
Owned |
|
Hickman, AR** |
|
Leased |
|
Little Rock, AR |
|
Owned |
|
Little Rock, AR |
|
Owned/Vacated |
|
Phoenix, AZ |
|
Owned |
|
Dos Palos, CA |
|
Leased |
|
Fresno, CA |
|
Leased |
|
Livermore, CA |
|
Leased |
|
Vernon, CA |
|
Owned |
|
Commerce City, CO |
|
Owned |
|
South Windsor, CT |
|
Leased/Vacated |
|
Wilmington, DE |
|
Leased/Vacated |
|
Wilmington, DE |
|
Owned |
|
Jacksonville, FL |
|
Owned |
|
Tampa Bay, FL |
|
Owned |
|
Norcross, GA |
|
Leased |
|
Norcross, GA |
|
Owned |
|
Des Moines, IA |
|
Owned |
|
Eldridge, IA |
|
Leased |
|
Marshalltown, IA |
|
Owned |
|
Boise, ID |
|
Leased |
|
Chicago, IL (Headquarters)* |
|
Leased |
|
Chicago, IL(2) |
|
Leased |
|
Dekalb, IL |
|
Leased |
|
Elgin, IL |
|
Leased |
|
Lisle, IL* |
|
Leased |
|
Burns Harbor, IN |
|
Owned |
|
Indianapolis, IN |
|
Owned |
|
Wichita, KS |
|
Leased |
|
Shelbyville, KY** |
|
Owned |
|
Shreveport, LA |
|
Owned |
|
St. Rose, LA |
|
Owned |
|
Devens, MA |
|
Owned |
|
Grand Rapids, MI* |
|
Leased |
|
Lansing, MI |
|
Leased |
|
Minneapolis, MN |
|
Owned |
|
Plymouth, MN |
|
Owned |
|
Maryland Heights, MO |
|
Leased |
|
North Kansas City, MO |
|
Owned |
|
Jackson, MS |
|
Owned |
|
Charlotte, NC |
|
Owned |
|
Charlotte, NC |
|
Owned/Vacated |
21
|
Charlotte, NC |
|
Leased |
|
Greensboro, NC |
|
Owned |
|
Pikeville, NC |
|
Leased |
|
Youngsville, NC |
|
Leased |
|
Omaha, NE |
|
Owned |
|
Lancaster, NY |
|
Owned |
|
Columbus, OH |
|
Leased |
|
Hamilton, OH* |
|
Leased |
|
Streetsboro, OH |
|
Leased |
|
Strongsville, OH |
|
Owned |
|
Warren, OH |
|
Leased/Vacated |
|
Oklahoma City, OK |
|
Owned |
|
Tulsa, OK |
|
Owned |
|
Tigard, OR |
|
Leased |
|
Ambridge, PA** |
|
Owned |
|
Fairless Hills, PA |
|
Leased |
|
Pittsburgh, PA* |
|
Leased/Vacated |
|
Charleston, SC |
|
Owned |
|
Greenville, SC |
|
Owned |
|
Chattanooga, TN |
|
Owned |
|
Chattanooga, TN |
|
Leased |
|
Gallatin, TN |
|
Leased |
|
Knoxville, TN* |
|
Leased |
|
Memphis, TN |
|
Owned |
|
Dallas, TX |
|
Owned |
|
El Paso, TX |
|
Leased |
|
Houston, TX |
|
Owned |
|
Houston, TX(2) |
|
Leased |
|
McAllen, TX |
|
Leased |
|
Odessa, TX |
|
Leased/Vacated |
|
Salt Lake City, UT |
|
Leased |
|
Pounding Mill, VA |
|
Owned |
|
Richmond, VA |
|
Owned |
|
Renton, WA |
|
Owned |
|
Spokane, WA |
|
Owned |
|
Baldwin, WI |
|
Leased |
|
Green Bay, WI |
|
Leased |
|
Green Bay, WI |
|
Owned |
|
Milwaukee, WI |
|
Owned |
|
* |
Office space only |
|
** |
Processing centers |
22
Operations in Canada
Ryerson Canada, a wholly-owned indirect Canadian subsidiary of Ryerson Holding, has 9 operational facilities in Canada. All of the metals service center facilities are in good condition and are adequate for Ryerson Canada’s existing and anticipated operations. Four facilities are leased. The lease terms expire at various times through 2025.
|
Location |
|
Own/Lease |
|
Calgary, AB |
|
Owned |
|
Edmonton, AB |
|
Owned |
|
Richmond, BC |
|
Owned |
|
Winnipeg, MB |
|
Owned |
|
Winnipeg, MB |
|
Leased |
|
Saint John, NB |
|
Owned |
|
Brampton, ON |
|
Leased |
|
Burlington, ON (includes Canadian Headquarters) |
|
Leased |
|
Laval, QC |
|
Leased/Vacated |
|
Vaudreuil, QC |
|
Leased |
|
Saskatoon, SK |
|
Owned/Vacated |
Operations in China
Ryerson China, an indirect wholly owned subsidiary of Ryerson Holding, has five service and processing centers in China, at Guangzhou, Dongguan, Kunshan and Tianjin, performing coil processing, sheet metal fabrication and plate processing. Ryerson China’s headquarters office building is located in Kunshan. We own four buildings in China and have purchased the related land use rights. The remainder of our facilities are leased. All of the facilities are in good condition and are adequate for Ryerson China’s existing and anticipated operations.
Operations in Mexico
Ryerson Mexico, an indirect wholly owned subsidiary of Ryerson Holding, has four facilities in Mexico. We have service centers in Monterrey, Tijuana, Hermosillo, and Queretaro, all of which are leased. The facilities are in good condition and are adequate for Ryerson Mexico’s existing and anticipated operations.
In October 2011, the United States Environmental Protection Agency (the “EPA”) named us as one of more than 100 businesses that may be a potentially responsible party for the Portland Harbor Superfund Site (“Portland Harbor”). On January 6, 2017, the EPA issued its Record of Decision (“ROD”) regarding the site. The ROD includes a combination of dredging, capping and enhanced natural recovery that would take approximately thirteen years to construct plus additional time for monitored natural recovery, at an estimated present value cost of $1.05 billion. The EPA has not yet allocated responsibility for the contamination among the potentially responsible parties, including JT Ryerson. We do not currently have sufficient information available to us to determine whether the ROD will be executed as currently stated, whether and to what extent JT Ryerson may be held responsible for any of the identified contamination, and how much (if any) of the final plan’s costs might ultimately be allocated to JT Ryerson and therefore, management cannot predict the ultimate outcome of this matter or estimate a range of potential loss at this time.
There are various other claims and pending actions against the Company. The amount of liability, if any, for those other claims and actions at December 31, 2016 is not determinable but, in the opinion of management, such liability, if any, will not have a material adverse effect on the Company’s financial position, results of operations or cash flows. We maintain liability insurance coverage to assist in protecting our assets from losses arising from or related to activities associated with business operations.
Not applicable.
23
|
ITEM 5. |
MARKET FOR REGISTRANT’S COMMON EQUITY, RELATED STOCKHOLDER MATTERS AND ISSUER PURCHASES OF EQUITY SECURITIES. |
Market Information for Common Stock
Our common stock has been listed on the New York Stock Exchange (“NYSE”) and was first traded on August 13, 2014. The following table sets forth the high and low sale prices of our common stock as reported by the NYSE.
|
|
|
2016 |
|
|
2015 |
|
||||||||||
|
|
|
High |
|
|
Low |
|
|
High |
|
|
Low |
|
||||
|
First Quarter |
|
$ |
5.80 |
|
|
$ |
2.53 |
|
|
$ |
10.13 |
|
|
$ |
5.24 |
|
|
Second Quarter |
|
|
18.33 |
|
|
|
4.86 |
|
|
|
9.55 |
|
|
|
5.30 |
|
|
Third Quarter |
|
|
19.71 |
|
|
|
10.03 |
|
|
|
9.61 |
|
|
|
4.96 |
|
|
Fourth Quarter |
|
|
16.85 |
|
|
|
8.10 |
|
|
|
6.99 |
|
|
|
3.93 |
|
On February 28, 2017, the closing price of our common stock on the NYSE was $10.85 per share.
Holders
As of February 28, 2017, there were 2 stockholders of record of our common stock. Because many shares of our common stock are held by brokers and other institutions on behalf of stockholders, we are unable to estimate the total number of beneficial stockholders represented by these record holders.
Dividend Policy
We have not declared any cash dividends for the past two years and we do not anticipate declaring or paying any regular cash dividends on our common stock in the foreseeable future. Any payment of cash dividends on our common stock in the future will be at the discretion of our Board of Directors and will depend upon our results of operations, earnings, capital requirements, financial condition, future prospects, contractual restrictions, including under the Ryerson Credit Facility and our outstanding notes, and other factors deemed relevant by our Board of Directors.
24
Performance Graph
The following graph and accompanying table show the cumulative total return to stockholders of Ryerson Holding’s common stock relative to the cumulative total returns of the S&P 500 and a metals service center peer group (the “Peer Group”). The graph tracks the performance of a $100 investment in each of the indices (with reinvestment of dividends) from August 13, 2014 to December 31, 2016. As of December 31, 2016 the Peer Group consisted of Reliance Steel & Aluminum Co., and Olympic Steel Inc., each of which has securities listed for trading on the NASDAQ; A.M. Castle & Co. which has securities listed for trading on the OTCQB Venture Market; and Russel Metals Inc., which has securities listed for trading on the Toronto Stock Exchange. The returns of each member of the Peer Group are weighted according to that member’s stock market capitalization. The stock price performance included in this graph is not necessarily indicative of future stock price performance.
Comparison of 29 Month Cumulative Total Return
Assumes Initial Investment of $100
December 2016
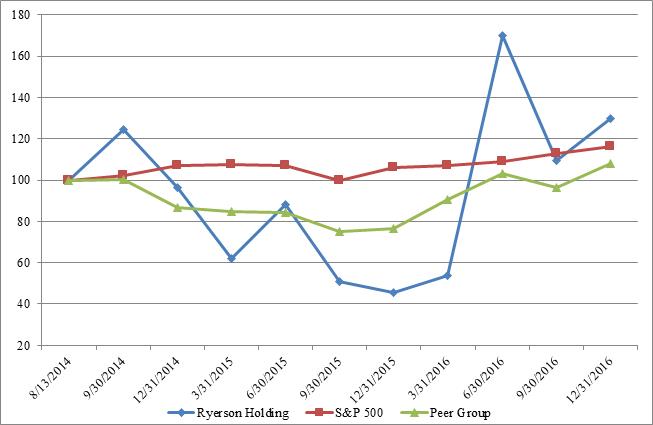
|
|
|
8/13/2014 |
|
|
9/30/2014 |
|
|
12/31/2014 |
|
|
3/31/2015 |
|
|
6/30/2015 |
|
|
9/30/2015 |
|
|
12/31/2015 |
|
|
3/31/2016 |
|
|
6/30/2016 |
|
|
9/30/2016 |
|
|
12/31/2016 |
|
|||||||||||
|
Ryerson Holding |
|
$ |
100 |
|
|
|
124.27 |
|
|
|
96.41 |
|
|
|
61.84 |
|
|
|
88.35 |
|
|
|
50.97 |
|
|
|
45.34 |
|
|
|
53.98 |
|
|
|
169.90 |
|
|
|
109.61 |
|
|
|
129.61 |
|
|
S&P 500 |
|
$ |
100 |
|
|
|
102.06 |
|
|
|
106.89 |
|
|
|
107.38 |
|
|
|
107.13 |
|
|
|
99.75 |
|
|
|
106.15 |
|
|
|
107.00 |
|
|
|
109.00 |
|
|
|
112.60 |
|
|
|
116.25 |
|
|
Peer Group |
|
$ |
100 |
|
|
|
100.10 |
|
|
|
86.39 |
|
|
|
83.10 |
|
|
|
82.90 |
|
|
|
73.23 |
|
|
|
77.14 |
|
|
|
90.34 |
|
|
|
103.16 |
|
|
|
96.43 |
|
|
|
107.93 |
|
Purchases of Equity Securities by the Issuer and Affiliated Purchasers
None.
Recent Sale of Unregistered Securities and Use of Proceeds
None.
25
The following table sets forth our selected historical consolidated financial information. Our selected historical Consolidated Statements of Operations data for the years ended December 31, 2016, 2015 and 2014 and the summary historical balance sheet data as of December 31, 2016 and 2015 have been derived from our audited consolidated financial statements included in Item 8. “Financial Statements and Supplementary Data.” The selected historical Consolidated Statements of Operations data for the years ended December 31, 2013 and 2012 and the summary historical balance sheet data as of December 31, 2014, 2013, and 2012 were derived from the audited financial statements and related notes thereto, which are not included in this Form 10-K.
The following consolidated financial information should be read together with Item 7. “Management’s Discussion and Analysis of Financial Condition and Results of Operations” and the audited Consolidated Financial Statements of Ryerson Holding Corporation and the Notes thereto included in Item 8. “Financial Statements and Supplementary Data.”
FIVE YEAR SUMMARY OF SELECTED FINANCIAL DATA AND OPERATING RESULTS
(Dollars in millions, except per ton and per share data)
|
|
|
Year Ended December 31, |
|
|||||||||||||||||
|
|
|
2016 |
|
|
2015 |
|
|
2014 |
|
|
2013 |
|
|
2012 |
|
|||||
|
Statements of Operations Data: |
|
|
|
|
|
|
|
|
|
|
|
|
|
|
|
|
|
|
|
|
|
Net sales |
|
$ |
2,859.7 |
|
|
$ |
3,167.2 |
|
|
$ |
3,622.2 |
|
|
$ |
3,460.3 |
|
|
$ |
4,024.7 |
|
|
Cost of materials sold |
|
|
2,289.1 |
|
|
|
2,599.5 |
|
|
|
3,028.4 |
|
|
|
2,843.7 |
|
|
|
3,315.1 |
|
|
Gross profit |
|
|
570.6 |
|
|
|
567.7 |
|
|
|
593.8 |
|
|
|
616.6 |
|
|
|
709.6 |
|
|
Warehousing, delivery, selling, general and administrative (1) |
|
|
436.4 |
|
|
|
450.8 |
|
|
|
509.2 |
|
|
|
480.1 |
|
|
|
508.9 |
|
|
Gain on sale of assets |
|
|
— |
|
|
|
(1.9 |
) |
|
|
(1.8 |
) |
|
|
— |
|
|
|
— |
|
|
Restructuring and other charges |
|
|
1.0 |
|
|
|
2.5 |
|
|
|
— |
|
|
|
1.9 |
|
|
|
1.1 |
|
|
Impairment charges on assets |
|
|
— |
|
|
|
7.7 |
|
|
|
— |
|
|
|
10.0 |
|
|
|
1.0 |
|
|
Pension and other postretirement benefits curtailment gain |
|
|
— |
|
|
|
— |
|
|
|
— |
|
|
|
— |
|
|
|
(1.7 |
) |
|
Operating profit |
|
|
133.2 |
|
|
|
108.6 |
|
|
|
86.4 |
|
|
|
124.6 |
|
|
|
200.3 |
|
|
Other income and (expense), net (2) |
|
|
(17.2 |
) |
|
|
(10.4 |
) |
|
|
(5.9 |
) |
|
|
(0.2 |
) |
|
|
(33.5 |
) |
|
Interest and other expense on debt (3) |
|
|
(89.9 |
) |
|
|
(96.3 |
) |
|
|
(107.4 |
) |
|
|
(110.5 |
) |
|
|
(126.5 |
) |
|
Income (loss) before income taxes |
|
|
26.1 |
|
|
|
1.9 |
|
|
|
(26.9 |
) |
|
|
13.9 |
|
|
|
40.3 |
|
|
Provision (benefit) for income taxes (4) |
|
|
7.2 |
|
|
|
3.7 |
|
|
|
(0.7 |
) |
|
|
(112.3 |
) |
|
|
(5.5 |
) |
|
Net income (loss) |
|
|
18.9 |
|
|
|
(1.8 |
) |
|
|
(26.2 |
) |
|
|
126.2 |
|
|
|
45.8 |
|
|
Less: Net income (loss) attributable to noncontrolling interest |
|
|
0.2 |
|
|
|
(1.3 |
) |
|
|
(0.5 |
) |
|
|
(1.1 |
) |
|
|
(1.3 |
) |
|
Net income (loss) attributable to Ryerson Holding Corporation |
|
$ |
18.7 |
|
|
$ |
(0.5 |
) |
|
$ |
(25.7 |
) |
|
$ |
127.3 |
|
|
$ |
47.1 |
|
|
Earnings (loss) per share of common stock: (5) |
|
|
|
|
|
|
|
|
|
|
|
|
|
|
|
|
|
|
|
|
|
Basic earnings (loss) per share |
|
$ |
0.55 |
|
|
$ |
(0.02 |
) |
|
$ |
(1.01 |
) |
|
$ |
5.99 |
|
|
$ |
2.22 |
|
|
Diluted earnings (loss) per share |
|
$ |
0.54 |
|
|
$ |
(0.02 |
) |
|
$ |
(1.01 |
) |
|
$ |
5.99 |
|
|
$ |
2.22 |
|
|
Weighted average shares outstanding — Basic |
|
|
34.3 |
|
|
|
32.1 |
|
|
|
25.4 |
|
|
|
21.3 |
|
|
|
21.3 |
|
|
Weighted average shares outstanding — Diluted |
|
|
34.4 |
|
|
|
32.1 |
|
|
|
25.4 |
|
|
|
21.3 |
|
|
|
21.3 |
|
|
Balance Sheet Data (at period end): |
|
|
|
|
|
|
|
|
|
|
|
|
|
|
|
|
|
|
|
|
|
Cash and cash equivalents |
|
$ |
80.7 |
|
|
$ |
63.2 |
|
|
$ |
60.0 |
|
|
$ |
74.4 |
|
|
$ |
71.2 |
|
|
Restricted cash |
|
|
1.0 |
|
|
|
1.2 |
|
|
|
2.0 |
|
|
|
1.8 |
|
|
|
3.9 |
|
|
Working capital |
|
|
665.4 |
|
|
|
643.0 |
|
|
|
846.0 |
|
|
|
900.9 |
|
|
|
920.3 |
|
|
Property, plant and equipment, net |
|
|
388.2 |
|
|
|
400.3 |
|
|
|
428.2 |
|
|
|
444.1 |
|
|
|
474.7 |
|
|
Total assets |
|
|
1,558.7 |
|
|
|
1,545.2 |
|
|
|
1,855.6 |
|
|
|
1,831.5 |
|
|
|
1,886.7 |
|
|
Long-term debt, including current maturities |
|
|
963.5 |
|
|
|
1,023.5 |
|
|
|
1,242.1 |
|
|
|
1,269.5 |
|
|
|
1,276.6 |
|
|
Total equity (deficit) |
|
|
(49.3 |
) |
|
|
(140.9 |
) |
|
|
(124.5 |
) |
|
|
(107.7 |
) |
|
|
(291.5 |
) |
|
Other Financial Data: |
|
|
|
|
|
|
|
|
|
|
|
|
|
|
|
|
|
|
|
|
|
Cash flows provided by (used in) operations |
|
$ |
25.4 |
|
|
$ |
259.1 |
|
|
$ |
(73.3 |
) |
|
$ |
48.1 |
|
|
$ |
186.5 |
|
|
Cash flows used in investing activities |
|
|
(20.7 |
) |
|
|
(18.0 |
) |
|
|
(34.0 |
) |
|
|
(13.5 |
) |
|
|
(35.3 |
) |
|
Cash flows provided by (used in) financing activities |
|
|
11.9 |
|
|
|
(232.2 |
) |
|
|
100.5 |
|
|
|
(26.6 |
) |
|
|
(143.4 |
) |
|
Capital expenditures |
|
|
23.0 |
|
|
|
22.3 |
|
|
|
21.6 |
|
|
|
20.2 |
|
|
|
40.8 |
|
|
Depreciation and amortization |
|
|
42.5 |
|
|
|
43.7 |
|
|
|
45.6 |
|
|
|
46.6 |
|
|
|
47.0 |
|
|
Volume and Per Ton Data: |
|
|
|
|
|
|
|
|
|
|
|
|
|
|
|
|
|
|
|
|
|
Tons shipped (000) |
|
|
1,903 |
|
|
|
1,897 |
|
|
|
2,024 |
|
|
|
2,038 |
|
|
|
2,149 |
|
|
Average selling price per ton |
|
$ |
1,503 |
|
|
$ |
1,670 |
|
|
$ |
1,790 |
|
|
$ |
1,698 |
|
|
$ |
1,873 |
|
|
Gross profit per ton |
|
|
300 |
|
|
|
299 |
|
|
|
293 |
|
|
|
302 |
|
|
|
330 |
|
|
Operating expenses per ton |
|
|
230 |
|
|
|
242 |
|
|
|
250 |
|
|
|
241 |
|
|
|
237 |
|
|
Operating profit per ton |
|
|
70 |
|
|
|
57 |
|
|
|
43 |
|
|
|
61 |
|
|
|
93 |
|
(1) The year ended December 31, 2014 includes $32.7 million of one-time IPO-related expenses.
26
(2)The year ended December 31, 2016 includes an other-than-temporary impairment charge of $4.7 million related to our investment in one available-for-sale security and a $8.7 million loss on the retirement of debt related to the purchases and retirement of our 9.0% Senior Notes due 2017 (the “2017 Notes”) and 11.25% Senior Notes due 2018 (the “2018 Notes”). The year ended December 31, 2015 includes an other-than-temporary impairment charge of $12.3 million in the first quarter of 2015 related to our investment in one available-for-sale security and a $0.3 million gain on the retirement of debt related to the purchases of a portion of our 2017 Notes and 2018 Notes. The year ended December 31, 2014 includes $11.2 million of expense related to the premium paid to redeem $99.5 million of 2018 Notes. The year ended December 31, 2012 includes a $32.8 million loss on the retirement of debt related to the redemption of our Floating Rate Senior Secured Notes due November 1, 2014, the 12% Senior Secured Notes due November 1, 2015, and the 14 1⁄2% Senior Discount Notes due 2015.
(3)The year ended December 31, 2015 includes a $2.9 million write off of debt issuance costs associated with our prior credit facility upon entering into a new revolving credit facility on July 24, 2015.
(4)The year ended December 31, 2013 includes a $124.2 million reduction in the valuation allowance recorded against deferred tax assets. The year ended December 31, 2012 includes an income tax benefit of $15.2 million related to the release of valuation allowance associated with certain state deferred tax assets.
(5) On July 23, 2014, our Board of Directors approved a 4.25 for 1.00 stock split (the “Stock Split”) of the Company’s common stock effective August 5, 2014. The following amounts related to earnings per share and shares outstanding have been adjusted for the Stock Split for all periods reported. See Note 14 of Item 8, Financial Statements and Supplementary Data for further detail on the Stock Split.”
27
The following discussion and analysis should be read in conjunction with Item 6. “Selected Financial Data” and the audited Consolidated Financial Statements of Ryerson Holding Corporation and Subsidiaries and the Notes thereto in Item 8. “Financial Statements and Supplementary Data.” This discussion contains forward-looking statements that involve risks and uncertainties. See the section entitled “Special Note Regarding Forward-Looking Statements.” Our actual results and the timing of selected events could differ materially from those discussed in these forward-looking statements as a result of certain factors, including those discussed in Item 1A. “Risk Factors” and elsewhere in this Form 10-K.
Overview
Business
Ryerson Holding Corporation (“Ryerson Holding”), a Delaware corporation, is the parent company of Joseph T. Ryerson & Son, Inc. (“JT Ryerson”), a Delaware corporation. On December 17, 2014, Ryerson Inc., formerly a direct, wholly-owned subsidiary of Ryerson Holding, merged with and into JT Ryerson, which was previously an indirect, wholly-owned subsidiary of Ryerson Holding, with JT Ryerson as the surviving corporation. As a result of such merger, from and after December 17, 2014, JT Ryerson has been a direct, wholly-owned subsidiary of Ryerson Holding. Affiliates of Platinum Equity, LLC (“Platinum”) own approximately 21,037,500 shares of our common stock, which is approximately 57% of our issued and outstanding common stock.
We are a leading distributor and value-added processor of industrial metals with operations in the United States through JT Ryerson, in Canada through its indirect wholly-owned subsidiary Ryerson Canada, Inc., a Canadian corporation (“Ryerson Canada”), and in Mexico through our indirect wholly-owned subsidiary Ryerson Metals de Mexico, S. de R.L. de C.V., a Mexican corporation (“Ryerson Mexico”). In addition to our North American operations, we conduct materials distribution operations in China through an indirect wholly-owned subsidiary, Ryerson China Limited (“Ryerson China”). Unless the context indicates otherwise, Ryerson Holding, JT Ryerson, Ryerson Canada, Ryerson China and Ryerson Mexico, together with their subsidiaries (including Ryerson Inc. prior to its dissolution through merger), are collectively referred to herein as “Ryerson,” “we,” “us,” “our,” or the “Company.”
Industry and Operating Trends
We purchase large quantities of metal products from primary producers and sell these materials in smaller quantities to a wide variety of metals-consuming industries. More than 75% of the metals products sold are processed by us by burning, sawing, slitting, blanking, cutting to length or other techniques. We sell our products and services to many industries, including commercial ground transportation manufacturing, metal fabrication and machine shops, industrial machinery and equipment manufacturing, consumer durable production, HVAC manufacturing, construction equipment manufacturing, food processing and agricultural equipment manufacturing and oil & gas. In 2016, food processing and agricultural equipment, consumer durable and construction industries grew volumes compared to 2015, offset by declines in oil & gas, HVAC and ground transportation industries. The other two general industrial sectors of our business, metal fabricators and industrial machinery and equipment, showed a slight net gain in volume.
The metals service center industry is generally considered cyclical with periods of strong demand and higher prices followed by periods of weaker demand and lower prices due to the cyclical nature of the industries in which the largest consumers of metals operate. However, domestic metals prices are volatile and remain difficult to predict. In 2016, the metals service center industry experienced weak demand and improved but volatile pricing conditions. U.S. shipment volumes as measured by the Metals Service Center Institute declined by 6.2 percent in 2016 compared to the prior year. Meanwhile, carbon prices recovered from historical lows at the end of 2015, peaking in June 2016, only to correct in October 2016, before starting an upward trajectory that continued through the end of the year. Additionally, 2016 nickel and aluminum prices each increased by double-digits compared to 2015 average prices.
Similar to other metals service centers, we maintain substantial inventories of metals to accommodate the short lead times and just-in-time delivery requirements of our customers. Accordingly, we purchase metals in an effort to maintain our inventory at levels that we believe to be appropriate to satisfy the anticipated needs of our customers based upon customer forecasts, historic buying practices, supply agreements with customers and market conditions. Our commitments to purchase metals are generally at prevailing market prices in effect at the time we place our orders. At the request of our customers, we have entered into swaps in order to mitigate our customers’ risk of volatility in the price of metals, and we have entered into metals hedges to mitigate our risk of volatility in the price of metals. We have no long-term, fixed-price metals purchase contracts. When metals prices decline, customer demands for lower prices and our competitors’ responses to those demands could result in lower sale prices and, consequently, lower gross profits and earnings as we use existing metals inventory. When metals prices increase, competitive conditions will influence how much of the price increase we can pass on to our customers.
28
Components of Results of Operations
We generate substantially all of our revenue from sales of our metals products. Revenue is recognized upon delivery of product to customers. The timing of shipment is substantially the same as the timing of delivery to customers given the proximity of our distribution sites to our customers.
Sales, cost of materials sold, gross profit and operating expense control are the principal factors that impact our profitability:
Net Sales. Our sales volume and pricing is driven by market demand, which is largely determined by overall industrial production and conditions in specific industries in which our customers operate. Sales prices are also primarily driven by market factors such as overall demand and availability of product. Our net sales include revenue from product sales, net of returns, allowances, customer discounts and incentives.
Cost of materials sold. Cost of materials sold includes metal purchase and in-bound freight costs, third-party processing costs and direct and indirect internal processing costs. The cost of materials sold fluctuates with our sales volume and our ability to purchase metals at competitive prices. Increases in sales volume generally enable us both to improve purchasing leverage with suppliers, as we buy larger quantities of metals inventories, and to reduce operating expenses per ton sold.
Gross profit. Gross profit is the difference between net sales and the cost of materials sold. Our sales prices to our customers are subject to market competition. Achieving acceptable levels of gross profit is dependent on our acquiring metals at competitive prices, our ability to manage the impact of changing prices and efficiently managing our internal and external processing costs.
Operating expenses. Optimizing business processes and asset utilization to lower fixed expenses such as employee, facility and truck fleet costs which cannot be rapidly reduced in times of declining volume, and maintaining low fixed cost structure in times of increasing sales volume, have a significant impact on our profitability. Operating expenses include costs related to warehousing and distributing our products as well as selling, general and administrative expenses.
Results of Operations
Comparison of the year ended December 31, 2016 with the year ended December 31, 2015
The following table sets forth our condensed consolidated statements of income data:
|
|
|
Year Ended December 31, 2016 |
|
|
% of Net Sales |
|
|
Year Ended December 31, 2015 |
|
|
% of Net Sales |
|
|
Year Ended December 31, 2014 |
|
|
% of Net Sales |
|
||||||
|
Net sales |
|
$ |
2,859.7 |
|
|
|
100.0 |
% |
|
$ |
3,167.2 |
|
|
|
100.0 |
% |
|
$ |
3,622.2 |
|
|
|
100.0 |
% |
|
Cost of materials sold |
|
|
2,289.1 |
|
|
|
80.0 |
|
|
|
2,599.5 |
|
|
|
82.1 |
|
|
|
3,028.4 |
|
|
|
83.6 |
|
|
Gross profit |
|
|
570.6 |
|
|
|
20.0 |
|
|
|
567.7 |
|
|
|
17.9 |
|
|
|
593.8 |
|
|
|
16.4 |
|
|
Warehousing, delivery, selling, general and administrative expenses |
|
|
436.4 |
|
|
|
15.3 |
|
|
|
450.8 |
|
|
|
14.3 |
|
|
|
509.2 |
|
|
|
14.1 |
|
|
Gain on sale of assets |
|
|
— |
|
|
|
— |
|
|
|
(1.9 |
) |
|
|
(0.1 |
) |
|
|
(1.8 |
) |
|
|
(0.1 |
) |
|
Restructuring and other charges |
|
|
1.0 |
|
|
|
— |
|
|
|
2.5 |
|
|
|
0.1 |
|
|
|
— |
|
|
|
— |
|
|
Impairment charges on assets |
|
|
— |
|
|
|
— |
|
|
|
7.7 |
|
|
|
0.2 |
|
|
|
— |
|
|
|
— |
|
|
Operating profit |
|
|
133.2 |
|
|
|
4.7 |
|
|
|
108.6 |
|
|
|
3.4 |
|
|
|
86.4 |
|
|
|
2.4 |
|
|
Other expenses |
|
|
(107.1 |
) |
|
|
(3.8 |
) |
|
|
(106.7 |
) |
|
|
(3.3 |
) |
|
|
(113.3 |
) |
|
|
(3.1 |
) |
|
Income (loss) before income taxes |
|
|
26.1 |
|
|
|
0.9 |
|
|
|
1.9 |
|
|
|
0.1 |
|
|
|
(26.9 |
) |
|
|
(0.7 |
) |
|
Provision (benefit) for income taxes |
|
|
7.2 |
|
|
|
0.2 |
|
|
|
3.7 |
|
|
|
0.2 |
|
|
|
(0.7 |
) |
|
|
— |
|
|
Net income (loss) |
|
|
18.9 |
|
|
|
0.7 |
|
|
|
(1.8 |
) |
|
|
(0.1 |
) |
|
|
(26.2 |
) |
|
|
(0.7 |
) |
|
Less: Net income (loss) attributable to noncontrolling interest |
|
|
0.2 |
|
|
|
— |
|
|
|
(1.3 |
) |
|
|
(0.1 |
) |
|
|
(0.5 |
) |
|
|
— |
|
|
Net income (loss) attributable to Ryerson Holding Corporation |
|
$ |
18.7 |
|
|
|
0.7 |
% |
|
$ |
(0.5 |
) |
|
|
— |
|
|
$ |
(25.7 |
) |
|
|
(0.7 |
)% |
|
Basic earnings (loss) per share |
|
$ |
0.55 |
|
|
|
|
|
|
$ |
(0.02 |
) |
|
|
|
|
|
$ |
(1.01 |
) |
|
|
|
|
|
Diluted earnings (loss) per share |
|
$ |
0.54 |
|
|
|
|
|
|
$ |
(0.02 |
) |
|
|
|
|
|
$ |
(1.01 |
) |
|
|
|
|
29
Net Sales
Net sales decreased 9.7% to $2.9 billion in 2016 as compared to $3.2 billion in 2015. Average selling price decreased 10.0% reflecting weaker economic conditions in the metals market in 2016 compared to 2015. The average selling price per ton decreased in 2016 to $1,503 from $1,670 in 2015. Average selling prices per ton decreased for all of our product lines in 2016 with the largest decrease in our stainless steel plate, stainless steel flat and stainless steel long product lines. Tons sold increased 0.3% in 2016 with increases in shipments of stainless steel plate and stainless steel flat product lines offset by decreases in shipments of our carbon steel plate and carbon steel long product lines. Tons sold per ship day were 7,552 in 2016 as compared to 7,528 in 2015.
Cost of Materials Sold
Cost of materials sold decreased 11.9% to $2.3 billion in 2016 compared to $2.6 billion in 2015. The decrease in cost of materials sold in 2016 compared to 2015 was primarily due to a decrease in the average cost of materials sold per ton. The average cost of materials sold per ton decreased to $1,203 in 2016 from $1,371 in 2015. The average cost of materials sold for our stainless steel plate, stainless steel flat and carbon steel plate product lines decreased more than our other products, in line with the change in average selling price per ton.
During 2016, LIFO expense was $7 million related to increases in pricing for carbon products. During 2015, LIFO income was $97 million related to decreases in pricing for all product lines. As a result of falling average selling prices, LIFO income in 2015 was partially offset by a $38 million charge to record inventory at the lower of cost or market. In 2016, we recorded income of $14 million to adjust the lower of cost or market inventory reserve.
Gross Profit
Gross profit as a percentage of sales increased to 20.0% in 2016 compared to 17.9% in 2015 due to, among other things, a decrease in cost of materials sold, as discussed above. Gross profit increased 0.5% to $570.6 million in 2016 as compared to $567.7 million in 2015.
Operating Expenses
Operating expenses as a percentage of sales increased to 15.3% in 2016 from 14.5% in 2015. Operating expenses in 2016 were $437.4 million, a decrease of $21.7 million from $459.1 million in 2015 primarily due to the following reasons:
|
|
• |
Lower employee benefit costs of $11.0 million resulting mainly from a reduction in the net periodic benefit cost for pensions, |
|
|
• |
an impairment charge on assets of $7.7 million in 2015, primarily due to fixed asset impairments, |
|
|
• |
lower salaries and wages of $6.3 million due to lower employee headcount, |
|
|
• |
lower facility expenses, primarily taxes and repair and maintenance costs, of $6.2 million, and |
|
|
• |
lower administrative expenses, primarily due to lower outside technical services, of $3.0 million. |
These changes were partially offset by:
|
|
• |
higher incentive compensation expense of $14.8 million. |
On a per ton basis, operating expenses decreased to $230 per ton in 2016 from $242 per ton in 2015.
Operating Profit
As a result of the factors above, in 2016 we reported an operating profit of $133.2 million, or 4.7% of sales, compared to an operating profit of $108.6 million, or 3.4% of sales, in 2015.
30
Other Expenses
Interest and other expense on debt decreased to $89.9 million in 2016 from $96.3 million in 2015 primarily due to a lower principal amount of debt outstanding in 2016, partially offset by an increase in the interest rate on a portion of our outstanding Notes after we redeemed the $569.9 million outstanding balance our 9.0% Senior Notes due 2017 (the “2017 Notes”), redeemed the $170.4 million outstanding balance of our 11.25% Senior Notes due 2018 (the “2018 Notes”) and issued $650.0 million of new 11.00% Senior Notes due 2022 (the “2022 Notes”) in 2016. The year 2015 also included a $2.9 million charge to write-off a portion of the issuance costs associated with the Company’s old revolving credit facility agreement upon entering into a new revolving credit facility agreement. Other income and (expense), net was expense of $17.2 million in 2016 compared to expense of $10.4 million in 2015. The year 2016 net expense is primarily related to a $8.7 million net loss on debt redemptions, a $4.7 million charge due to an other-than-temporary impairment recognized on an available-for-sale investment and foreign currency losses of $3.9 million. The year 2015 net expense primarily related to a $12.3 million charge due to an other-than-temporary impairment recognized on an available-for-sale investment, partially offset by foreign currency gains of $1.5 million.
Provision for Income Taxes
The Company recorded an income tax expense of $7.2 million in 2016 compared to an income tax expense of $3.7 million in 2015. The $7.2 million income tax expense in 2016 results predominantly from tax expense on earnings in the U.S. and the inability to benefit losses in our foreign subsidiaries due to valuation allowances. The $3.7 million income tax expense in 2015 results predominantly from tax expense on earnings in the U.S. and the inability to benefit losses in our foreign subsidiaries due to valuation allowances.
Noncontrolling Interest
In 2016, Ryerson China’s results of operations was income partially offset by a loss at our Brazil operations through Açofran Aços e Metais Ltda (“Açofran”) in which we had a 50% direct ownership percentage, until we substantially liquidated our investment in Acofran during 2016. The portion of Ryerson China and Açofran’s results attributable to the noncontrolling interest in 2016 was income of $0.2 million. In 2015, Ryerson China’s and Açofran’s results of operations was a loss. The portion of the income attributable to the noncontrolling interest in Ryerson China and Açofran was a loss of $1.3 million for 2015.
Earnings Per Share
Basic earnings (loss) per share was earnings of $0.55 in 2016 and a loss of $0.02 in 2015. Diluted earnings (loss) per share was earnings of $0.54 in 2016 and a loss of $0.02 in 2015. The changes in earnings (loss) per share are due to the results of operations discussed above as well as an increase of 2.2 million in average shares outstanding in 2016 compared to 2015 after the issuance of 5 million shares of common stock in an underwritten public offering in July 2016.
Comparison of the year ended December 31, 2015 with the year ended December 31, 2014
Net Sales
Net sales decreased 12.6% to $3.2 billion in 2015 as compared to $3.6 billion in 2014. Average selling price decreased 6.7% while tons sold decreased 6.3% reflecting weaker economic conditions in the metals market in 2015 compared to 2014. The average selling price per ton decreased in 2015 to $1,670 from $1,790 in 2014. Average selling prices per ton decreased for all of our product lines in 2015 with the largest decrease in our stainless steel plate, carbon steel flat and stainless steel flat product lines. Tons sold in 2015 decreased for most of our product lines, with the largest decrease in our carbon steel long, stainless steel long and carbon plate product lines, partially offset by increased tons sold for our aluminum plate product line. Tons sold per ship day were 7,528 in 2015 as compared to 8,032 in 2014.
Cost of Materials Sold
Cost of materials sold decreased 14.2% to $2.6 billion in 2015 compared to $3.0 billion in 2014. The decrease in cost of materials sold in 2015 compared to 2014 was primarily due to a decrease in the average cost of materials sold per ton in addition to the decrease in tons sold. The average cost of materials sold per ton decreased to $1,371 in 2015 from $1,497 in 2014. The average cost of materials sold for our stainless steel plate, carbon steel flat and carbon steel plate product lines decreased more than our other products, in line with the change in average selling price per ton.
During 2015, LIFO income was $97 million related to the increase in carbon pricing, partially offset by decreases in pricing in stainless and aluminum. As a result of falling average selling prices, LIFO income in 2015 was partially offset by a $38 million charge
31
to record inventory at the lower of cost or market. During 2014, LIFO expense was $42 million related to increases in pricing for all product lines. In 2015, we also recorded a credit to cost of materials sold of $4 million related to the settlement of litigation regarding the price of materials that we were charged.
Gross Profit
Gross profit as a percentage of sales increased to 17.9% in 2015 compared to 16.4% in 2014 due to, among other things, a decrease in cost of materials sold, as discussed above. Gross profit decreased 4.4% to $567.7 million in 2015 as compared to $593.8 million in 2014.
Operating Expenses
Operating expenses as a percentage of sales increased to 14.5% in 2015 from 14.0% in 2014. Operating expenses in 2015 were $459.1 million, a decrease of $48.3 million from $507.4 million in 2014 primarily due to the following reasons:
|
|
• |
a $25.0 million charge in 2014 to terminate the advisory service agreement with Platinum Advisors in connection with the completion of our initial public offering on August 13, 2014, which is described in Note 12, “Related Parties” of the Notes to Consolidated Financial Statements in this Annual Report on Form 10-K, |
|
|
• |
transaction-related compensation expense of $7.7 million associated with the initial public offering in 2014, |
|
|
• |
lower incentive compensation expense of $16.1 million, and |
|
|
• |
lower delivery expense of $6.9 million due to lower volume. |
These changes were partially offset by:
|
|
• |
impairment charges on assets of $7.7 million in 2015, primarily due to fixed asset impairments, and |
|
|
• |
a restructuring charge of $2.5 million in 2015. |
On a per ton basis, operating expenses decreased to $242 per ton in 2015 from $250 per ton in 2014.
Operating Profit
As a result of the factors above, in 2015 we reported an operating profit of $108.6 million, or 3.4% of sales, compared to an operating profit of $86.4 million, or 2.4% of sales, in 2014.
Other Expenses
Interest and other expense on debt decreased to $96.3 million in 2015 from $107.4 million in 2014 primarily due to a lower principal amount outstanding of our 9.0% Senior Notes due 2017 (the “2017 Notes”) and the 2018 Notes after the redemption of $99.5 million of the 2018 Notes in September of 2014 and the purchases of $30.1 million of the 2018 Notes as well as the purchases of $30.1 million of the 2017 Notes in 2015. Partially offsetting the reduction in debt was a $2.9 million charge in 2015 to write-off a portion of the issuance costs associated with the Company’s old revolving credit facility agreement upon entering into a new revolving credit facility agreement. Other income and (expense), net was expense of $10.4 million in 2015 compared to expense of $5.9 million in 2014. The year 2015 net expense is primarily related to a $12.3 million charge due to an other-than-temporary impairment recognized on an available-for-sale investment, partially offset by foreign currency gains of $1.5 million. The year 2014 net expense was primarily related to a $11.2 million loss on the early redemption premium on the redemption of the $99.5 million principal amount of the 2018 Notes, partially offset by $5.3 million of foreign currency gains.
Provision for Income Taxes
The Company recorded an income tax expense of $3.7 million in 2015 compared to an income tax benefit of $0.7 million in 2014. The $3.7 million income tax expense in 2015 results predominantly from tax expense on earnings in the U.S. and the inability to benefit losses in our foreign subsidiaries due to valuation allowances. The $0.7 million income tax benefit in 2014 results from a tax benefit in the U.S. and the impact of certain initial public offering related transactions that are recognized differently for U.S. tax purposes, offset by tax expense in foreign subsidiaries.
32
Noncontrolling Interest
Ryerson China’s and Açofran’s results of operations was a loss in 2015 and 2014. The portion of the loss attributable to the noncontrolling interest in Ryerson China and Açofran was $1.3 million for 2015 and $0.5 million for 2014.
Earnings Per Share
Basic and diluted earnings (loss) per share was a loss of $0.02 in 2015 and a loss of $1.01 in 2014. The changes in earnings (loss) per share are due to the results of operations discussed above as well as an increase of 6.7 million in average shares outstanding in 2015 compared to 2014 after the issuance of 11.0 million shares of common stock in an initial public offering on August 8, 2014.
Liquidity and Capital Resources
The Company’s primary sources of liquidity are cash and cash equivalents, cash flows from operations and borrowing availability under the $750 million revolving credit facility (the “Ryerson Credit Facility”) that matures on November 16, 2021. Its principal source of operating cash is from the sale of metals and other materials. Its principal uses of cash are for payments associated with the procurement and processing of metals and other materials inventories, costs incurred for the warehousing and delivery of inventories and the selling and administrative costs of the business, capital expenditures, and for interest payments on debt.
The following table summarizes the Company’s cash flows:
|
|
|
Year Ended December 31, |
|
|||||||||
|
|
|
2016 |
|
|
2015 |
|
|
2014 |
|
|||
|
|
|
(In millions) |
|
|||||||||
|
Net cash provided by (used in) operating activities |
|
$ |
25.4 |
|
|
$ |
259.1 |
|
|
$ |
(73.3 |
) |
|
Net cash used in investing activities |
|
|
(20.7 |
) |
|
|
(18.0 |
) |
|
|
(34.0 |
) |
|
Net cash provided by (used in) financing activities |
|
|
11.9 |
|
|
|
(232.2 |
) |
|
|
100.5 |
|
|
Effect of exchange rates on cash |
|
|
0.9 |
|
|
|
(5.7 |
) |
|
|
(7.6 |
) |
|
Net increase (decrease) in cash and cash equivalents |
|
$ |
17.5 |
|
|
$ |
3.2 |
|
|
$ |
(14.4 |
) |
The Company had cash and cash equivalents at December 31, 2016 of $80.7 million, compared to $63.2 million at December 31, 2015 and $60.0 million at December 31, 2014. The Company had $964 million, $1,024 million and $1,242 million of total debt outstanding, a debt-to-capitalization ratio of 105%, 116% and 111% and $225 million, $185 million and $245 million available under the revolving credit facility at December 31, 2016, 2015 and 2014, respectively. The Company had total liquidity (defined as cash and cash equivalents, marketable securities and availability under the Ryerson Credit Facility, the Old Credit Facility, and foreign debt facilities) of $301 million, $273 million and $328 million at December 31, 2016, 2015 and 2014, respectively. Total liquidity is not a U.S. generally accepted accounting principles (“GAAP”) financial measure. We believe that total liquidity provides additional information for measuring our ability to fund our operations. Total liquidity does not represent, and should not be used as a substitute for, net income or cash flows from operations as determined in accordance with GAAP and total liquidity is not necessarily an indication of whether cash flow will be sufficient to fund our cash requirements.
Below is a reconciliation of cash and cash equivalents to total liquidity:
|
|
|
December 31, 2016 |
|
|
December 31, 2015 |
|
|
December 31, 2014 |
|
|||
|
|
|
(In millions) |
|
|||||||||
|
Cash and cash equivalents |
|
$ |
81 |
|
|
$ |
63 |
|
|
$ |
60 |
|
|
Less: Qualified cash pledged as collateral |
|
|
(31 |
) |
|
|
— |
|
|
|
— |
|
|
Marketable securities |
|
|
— |
|
|
|
2 |
|
|
|
11 |
|
|
Availability under Ryerson Credit Facility and foreign debt facilities |
|
|
251 |
|
|
|
208 |
|
|
|
257 |
|
|
Total liquidity |
|
$ |
301 |
|
|
$ |
273 |
|
|
$ |
328 |
|
Of the total cash and cash equivalents as of December 31, 2016, $71 million was held in subsidiaries outside the United States which is deemed to be permanently reinvested. Ryerson does not currently foresee a need to repatriate funds from its non-U.S. subsidiaries. Although the Company has historically satisfied needs for more capital in the U.S. through debt or equity issuances, it could elect to repatriate funds held in foreign jurisdictions which could result in higher effective tax rates. The Company has not
33
recorded a deferred tax liability for the effect of a possible repatriation of these assets as management intends to permanently reinvest these assets outside of the U.S. Specific plans for reinvestment include funding for future international acquisitions and funding of existing international operations.
Net cash provided by operating activities was $25.4 million and $259.1 million during 2016 and 2015, respectively. Net cash used in operating activities was $73.3 million during 2014. Net income (loss) was income of $18.9 million in 2016 and a loss of $1.8 million and $26.2 million in 2015 and 2014, respectively. Cash provided by operating activities of $25.4 million during the year ended December 31, 2016 was primarily due to non-cash depreciation and amortization expense of $42.5 million, an increase in accounts payable of $20.5 million and net income of $18.9 million, partially offset by an increase in accounts receivable of $22.5 million, pension contributions of $22.1 million and premium and fees related to debt modification of $15.7 million. Cash provided by operating activities of $259.1 million during the year ended December 31, 2015 was primarily due to a decrease in inventory of $178.1 million as we reduced inventory as metal prices weakened during the year. In addition, accounts receivable declined $88.0 million reflecting lower average selling prices and tons sold in 2015, non-cash depreciation and amortization expense was $43.7 million and we recorded a non-cash charge of $12.3 million due to an other-than-temporary impairment charge recognized on an available-for-sale investment. Partially offsetting the cash inflows were pension contributions of $42.5 million and lower accrued liabilities of $20.0 million primarily due to a lower accrual for incentive compensation in 2015. Cash used in operating activities of $73.3 million during the year ended December 31, 2014 was primarily the result of pension contributions of $55.4 million, the net loss in 2014 of $26.2 million, a decrease in accounts payable of $22.4 million and an increase in accounts receivable of $19.5 million reflecting higher sales in 2014, partially offset by non-cash depreciation and amortization expense of $45.6 million.
Net cash used in investing activities was $20.7 million, $18.0 million and $34.0 million in 2016, 2015 and 2014, respectively. Capital expenditures for the years ended December 31, 2016, 2015 and 2014, were $23.0 million, $22.3 million and $21.6 million, respectively. On August 3, 2015, the Company paid $7.7 million, net of cash acquired, to acquire all of the issued and outstanding capital stock of Southern Tool Steel, Inc. On December 31, 2014, the Company paid $20.1 million to acquire all of the issued and outstanding capital stock of Fay Industries, Inc. and the membership interests of Fay Group, Ltd. In 2016 and 2015, the Company paid an additional $1.1 million in each year in deferred consideration owed to the sellers of Fay Industries, Inc. The Company sold property, plant and equipment and assets held for sale generating cash proceeds of $3.2 million, $10.4 million and $7.3 million during the years ended December 31, 2016, 2015 and 2014, respectively.
Net cash provided by financing activities was $11.9 million for the year ended December 31, 2016. In 2016, net cash provided by financing activities was primarily related to the issuance of the 2022 Notes with a principle amount of $650.0 million, net proceeds of $71.5 million from the issuance of common stock, and net proceeds of $37.0 million from credit facility borrowings, partially offset by the redemption of the $569.9 million outstanding balance of the 2017 Notes and $170.4 million of the 2018 Notes. Net cash used in financing activities was $232.2 million for the year ended December 31, 2015. In 2015, net cash used in financing activities was primarily related to the purchases of $30.1 million principal amount of the 2017 Notes repurchased for $29.4 million and the purchases of $30.1 million principal amount of the 2018 Notes repurchased for $30.5 million, and $164.4 million of repayments of credit facility borrowings with cash provided by operations discussed above. Net cash used in financing activities was $100.5 million for the year ended December 31, 2014. In 2014, we received $112.4 million in proceeds from the issuance of stock in an initial public offering and used $110.7 million of the proceeds to redeem $99.5 million principal amount of our 2018 Notes and pay a $11.2 million redemption premium. In addition, credit facility borrowings in 2014 increased $63.8 million primarily to fund cash used in operating activities as well as capital expenditures and book overdrafts increased $36.0 million.
Total Debt
Total debt at December 31, 2016 decreased $60.0 million to $963.5 million from $1,023.5 million at December 31, 2015 as a result of the net proceeds from the issuance of common stock and the net cash provided by operating activities.
Total debt outstanding as of December 31, 2016 consisted of the following amounts: $312.0 million borrowing under the Ryerson Credit Facility, $650.0 million under the 2022 Notes and $19.2 million of foreign debt, less 17.7 million of unamortized debt issuance costs. Availability under the Ryerson Credit Facility was $225 million and $185 million at December 31, 2016 and December 31, 2015, respectively. Discussion of our outstanding debt follows.
Ryerson Credit Facility
On November 16, 2016, Ryerson entered into an amendment with respect to its $1.0 billion revolving credit facility agreement (as amended, the “Ryerson Credit Facility”), to reduce the total facility size from $1.0 billion (the “Old Credit Facility”) to $750 million, reduce the interest rate on outstanding borrowings by 25 basis points, reduce commitment fees on amounts not borrowed by 2.5 basis points, and to extend the maturity date to November 16, 2021.
34
At December 31, 2016, Ryerson had $312.0 million of outstanding borrowings, $16 million of letters of credit issued and $225 million available under the Ryerson Credit Facility compared to $272.2 million of outstanding borrowings, $17 million of letters of credit issued and $185 million available at December 31, 2015 under the Old Credit Facility. Total credit availability is limited by the amount of eligible accounts receivable, inventory, and qualified cash pledged as collateral under the agreement insofar as Ryerson is subject to a borrowing base comprised of the aggregate of these three amounts, less applicable reserves. Eligible accounts receivable, at any date of determination, is comprised of the aggregate value of all accounts directly created by a borrower (and in the case of Canadian accounts, a Canadian guarantor) in the ordinary course of business arising out of the sale of goods or the rendering of services, each of which has been invoiced, with such receivables adjusted to exclude various ineligible accounts, including, among other things, those to which a borrower (or guarantor, as applicable) does not have sole and absolute title and accounts arising out of a sale to an employee, officer, director, or affiliate of a borrower (or guarantor, as applicable). Eligible inventory, at any date of determination, is comprised of the aggregate value of all inventory owned by a borrower (and in the case of Canadian accounts, a Canadian guarantor), with such inventory adjusted to exclude various ineligible inventory, including, among other things, (i) any inventory that is classified as “supplies” or is unsaleable in the ordinary course of business, (ii) 50% of the value of any inventory that (A) has not been sold or processed within a 180 day period and (B) which is calculated to have more than 365 days of supply based upon the immediately preceding 6 months consumption, and (iii) 50% of the value of inventory classified as partial inventory pieces on the basis that the inventory has been cut below sales lengths customary for such inventory. Qualified cash consists of cash in an eligible deposit account that is subject to customary restrictions and liens in favor of the lenders. The weighted average interest rate on the borrowings under the Ryerson Credit Facility was 2.2 percent and 2.1 percent at December 31, 2016 and 2015, respectively.
The Ryerson Credit Facility has an allocation of $660 million to the Company’s subsidiaries in the United States and an allocation of $90 million to Ryerson Holding’s Canadian subsidiary that is a borrower. Amounts outstanding under the Ryerson Credit Facility bear interest at (i) a rate determined by reference to (A) the base rate (the highest of the Federal Funds Rate plus 0.50%, Bank of America, N.A.’s prime rate and the one-month LIBOR rate plus 1.00%) or (B) a LIBOR rate or, (ii) for Ryerson Holding’s Canadian subsidiary that is a borrower, (A) a rate determined by reference to the Canadian base rate (the greatest of the Federal Funds Rate plus 0.50%, Bank of America-Canada Branch’s “base rate” for commercial loans in U.S. Dollars made at its “base rate” and the 30 day LIBOR rate plus 1.00%), (B) the prime rate (the greater of Bank of America-Canada Branch’s “prime rate” for commercial loans made by it in Canada in Canadian Dollars and the one-month Canadian bankers’ acceptance rate plus 1.00%) or (C) the bankers’ acceptance rate. The spread over the base rate and prime rate is between 0.25% and 0.50% and the spread over the LIBOR and for the bankers’ acceptances is between 1.25% and 1.50%, depending on the amount available to be borrowed under the Ryerson Credit Facility. Overdue amounts and all amounts owed during the existence of a default bear interest at 2% above the rate otherwise applicable thereto. Ryerson also pays commitment fees on amounts not borrowed at a rate of 0.23%.
Borrowings under the Ryerson Credit Facility are secured by first-priority liens on all of the inventory, accounts receivables, lockbox accounts and related assets of the borrowers and the guarantors.
The Ryerson Credit Facility also contains covenants that, among other things, restrict Ryerson Holding and its restricted subsidiaries with respect to the incurrence of debt, the creation of liens, transactions with affiliates, mergers and consolidations, sales of assets and acquisitions. The Ryerson Credit Facility also requires that, if availability under the Ryerson Credit Facility declines to a certain level, Ryerson maintain a minimum fixed charge coverage ratio as of the end of each fiscal quarter, and includes defaults upon (among other things) the occurrence of a change of control of Ryerson and a cross-default to other financing arrangements.
The Ryerson Credit Facility contains events of default with respect to, among other things, default in the payment of principal when due or the payment of interest, fees and other amounts due thereunder after a specified grace period, material misrepresentations, failure to perform certain specified covenants, certain bankruptcy events, the invalidity of certain security agreements or guarantees, material judgments and the occurrence of a change of control of Ryerson. If such an event of default occurs, the lenders under the Ryerson Credit Facility will be entitled to various remedies, including acceleration of amounts outstanding under the Ryerson Credit Facility and all other actions permitted to be taken by secured creditors.
The lenders under the Ryerson Credit Facility have the ability to reject a borrowing request if any event, circumstance or development has occurred that has had or could reasonably be expected to have a material adverse effect on the Company. If Ryerson Holding, JT Ryerson, any of the other borrowers or any restricted subsidiaries of JT Ryerson becomes insolvent or commences bankruptcy proceedings, all amounts borrowed under the Ryerson Credit Facility will become immediately due and payable.
35
Proceeds from borrowings under the Ryerson Credit Facility and repayments of borrowings thereunder that are reflected in the Consolidated Statements of Cash Flows represent borrowings under the Company’s revolving credit agreement with original maturities greater than three months. Net proceeds (repayments) under the Ryerson Credit Facility represent borrowings under the Ryerson Credit Facility with original maturities less than three months.
2017, 2018 and 2022 Notes
On May 24, 2016, JT Ryerson issued $650 million in aggregate principal amount of the 2022 Notes (the “2022 Notes”). The 2022 Notes bear interest at a rate of 11.00% per annum. The 2022 Notes are fully and unconditionally guaranteed on a senior secured basis by all of our existing and future domestic subsidiaries that are co-borrowers or that have guarantee obligations under the Ryerson Credit Facility.
The net proceeds from the issuance of the 2022 Notes, along with borrowings under the Ryerson Credit Facility, was used to (i) repurchase and/or redeem in full the $569.9 million balance of JT Ryerson’s 9.00% Senior Secured Notes due 2017 (the “2017 Notes”), plus accrued and unpaid interest thereon up to, but not including, the repayment date, (ii) repurchase $95.0 million of JT Ryerson’s 11.00% Senior Secured Notes due 2018 (the “2018 Notes”), and (iii) pay related fees, expenses and premiums.
The Company applied the provisions of ASC 470-50, “Modifications and Extinguishments” in accounting for the issuance of the 2022 Notes, redemption of the 2017 Notes and partial repurchase of the 2018 Notes. The evaluation of the accounting under ASC 470-50 was performed on a creditor by creditor basis in order to determine if the terms of the debt were substantially different and, as a result, whether to apply modification or extinguishment accounting. For the lenders where it was determined that the terms of the debt were not substantially different, modification accounting was applied. For the remaining lenders, extinguishment accounting was applied. In connection with this debt modification and extinguishment, the Company recorded a $16.1 million loss within other income and (expense), net on the Consolidated Statement of Operations during 2016, primarily attributed to the costs incurred with third parties for arrangement fees, legal and other services related to the modified debt, as well as redemption fees paid to the creditors and unamortized debt issuance costs written off related to the extinguished debt. Additionally, the costs incurred with third parties for arrangement fees, legal and other services related to the extinguished debt and redemption fees paid to the creditors related to the modified debt were capitalized and are being amortized over the life of the modified debt using the effective interest method.
The 2022 Notes and the related guarantees are secured by a first-priority security interest in substantially all of JT Ryerson’s and each guarantor’s present and future assets located in the United States (other than receivables, inventory, money, deposit accounts and related general intangibles, certain other assets and proceeds thereof), subject to certain exceptions and customary permitted liens. The 2022 Notes and the related guarantees are also secured on a second-priority basis by a lien on the assets that secure JT Ryerson’s and the Company’s obligations under the Ryerson Credit Facility.
The 2022 Notes will be redeemable, in whole or in part, at any time on or after May 15, 2019 at certain redemption prices. The redemption price for the 2022 Notes if redeemed during the twelve months beginning (i) May 15, 2019 is 105.50%, (ii) May 15, 2020 is 102.75%, and (iii) May 15, 2021 and thereafter is 100.00%. JT Ryerson may redeem some or all of the 2022 Notes before May 15, 2019 at a redemption price of 100.00% of the principal amount, plus accrued and unpaid interest, if any, to the redemption date, plus a “make-whole” premium. In addition, JT Ryerson may redeem up to 35% of the 2022 Notes before May 15, 2019 with respect to the 2022 Notes with the net cash proceeds from certain equity offerings at a price equal to 111.00%, with respect to the 2022 Notes, of the principal amount thereof, plus any accrued and unpaid interest, if any. JT Ryerson may be required to make an offer to purchase the 2022 Notes upon the sale of assets or upon a change of control.
The 2022 Notes contain customary covenants that, among other things, limit, subject to certain exceptions, our ability, and the ability of our restricted subsidiaries, to incur additional indebtedness, pay dividends on our capital stock or repurchase our capital stock, make investments, sell assets, engage in acquisitions, mergers or consolidations or create liens or use assets as security in other transactions. Subject to certain exceptions, JT Ryerson may only pay dividends to Ryerson Holding to the extent of 50% of future net income, once prior losses are offset.
As of December 31, 2016, zero, zero and $650.0 million of the original outstanding principal amount of the 2017 Notes, 2018 Notes and 2022 Notes remain outstanding, respectively. The Company has repurchased and in the future may repurchase long-term notes in the open market.
During the year 2016, a principal amount of $75.4 million of the 2018 Notes were repurchased for $67.9 million and retired, resulting in the recognition of an $7.4 million gain within other income and (expense), net on the Consolidated Statement of Operations. Including the $16.1 million loss on the redemption of the $569.9 million balance of the 2017 Notes and repurchase of $95.0 million of the 2018 Notes, the Company recognized a total net loss of $8.7 million within other income and (expense), net on the Consolidated Statement of Operations during year 2016.
During the year 2015, a principal amount of $30.1 million of the 2017 Notes were repurchased for $29.4 million and retired, resulting in the recognition of a $0.7 million gain within other income and (expense), net on the Consolidated Statement of Operations. During the year 2015, a principal amount of $30.1 million of the 2018 Notes were repurchased for $30.5 million and
36
retired, resulting in the recognition of a $0.4 million loss within other income and (expense), net on the Consolidated Statement of Operations.
Foreign Debt
At December 31, 2016, Ryerson China’s total foreign borrowings were $19.2 million, which were owed to banks in Asia at a weighted average interest rate of 4.4% per annum and secured by inventory and property, plant and equipment. At December 31, 2015, Ryerson China’s total foreign borrowings were $21.8 million, which were owed to banks in Asia at a weighted average interest rate of 4.3% per annum and secured by inventory and property, plant and equipment. Other foreign borrowings were zero and $0.2 million at December 31, 2016 and December 31, 2015, respectively.
Availability under the Ryerson China’s credit facility was $26 million and $23 million at December 31, 2016 and December 31, 2015, respectively. Letters of credit issued by our foreign subsidiaries totaled $1 million and $2 million at December 31, 2016 and 2015, respectively.
Pension Funding
The Company made contributions of $22.1 million in 2016, $42.5 million in 2015 and $55.4 million in 2014 to improve the Company’s pension plans funded status. At December 31, 2016, as reflected in Note 10 to the Consolidated Financial Statements, pension liabilities exceeded plan assets by $216 million. The Company anticipates that it will have a minimum required pension contribution of approximately $22 million in 2017 under the Employee Retirement Income Security Act of 1974 (“ERISA”), Pension Protection Act in the U.S and the Ontario Pension Benefits Act in Canada. Future contribution requirements depend on the investment returns on plan assets, the impact of discount rates on pension liabilities, and changes in regulatory requirements. The Company is unable to determine the amount or timing of any such contributions required by ERISA or whether any such contributions would have a material adverse effect on the Company’s financial position or cash flows. The Company believes that cash flow from operations and the Ryerson Credit Facility described above will provide sufficient funds to make the minimum required contribution in 2017.
Income Tax Payments
The Company made income tax payments of $1.8 million, $3.2 million and $1.6 million in 2016, 2015 and 2014, respectively.
Off-Balance Sheet Arrangements
In the normal course of business with customers, vendors and others, we have entered into off-balance sheet arrangements, such as letters of credit, which totaled $17 million as of December 31, 2016. Additionally, other than normal course long-term operating leases included in the following Contractual Obligations table, we do not have any material off-balance sheet financing arrangements. None of these off-balance sheet arrangements are likely to have a material effect on our current or future financial condition, results of operations, liquidity or capital resources.
37
Contractual Obligations
The following table presents contractual obligations at December 31, 2016:
|
|
|
Payments Due by Period |
|
|||||||||||||||||
|
|
|
Total |
|
|
Less than 1 year |
|
|
1 – 3 years |
|
|
4 – 5 years |
|
|
After 5 years |
|
|||||
|
Contractual Obligations(1)(2) |
|
(In millions) |
|
|||||||||||||||||
|
2022 Notes |
|
$ |
650 |
|
|
$ |
— |
|
|
$ |
— |
|
|
$ |
— |
|
|
$ |
650 |
|
|
Ryerson Credit Facility |
|
|
312 |
|
|
|
— |
|
|
|
— |
|
|
|
312 |
|
|
|
— |
|
|
Foreign Debt |
|
|
19 |
|
|
|
19 |
|
|
|
— |
|
|
|
— |
|
|
|
— |
|
|
Interest on 2022 Notes, Foreign Debt and Ryerson Credit Facility(3) |
|
|
418 |
|
|
|
78 |
|
|
|
157 |
|
|
|
156 |
|
|
|
27 |
|
|
Purchase Obligations(4) |
|
|
19 |
|
|
|
19 |
|
|
|
— |
|
|
|
— |
|
|
|
— |
|
|
Operating Leases |
|
|
103 |
|
|
|
25 |
|
|
|
36 |
|
|
|
24 |
|
|
|
18 |
|
|
Pension Withdrawal Liability |
|
|
1 |
|
|
|
— |
|
|
|
— |
|
|
|
— |
|
|
|
1 |
|
|
Capital Leases |
|
|
15 |
|
|
|
5 |
|
|
|
7 |
|
|
|
3 |
|
|
|
— |
|
|
Total |
|
$ |
1,537 |
|
|
$ |
146 |
|
|
$ |
200 |
|
|
$ |
495 |
|
|
$ |
696 |
|
|
(1) |
The contractual obligations disclosed above do not include our potential future pension funding obligations (see previous discussion under “Pension Funding” caption). |
|
(2) |
Due to uncertainty regarding the completion of tax audits and possible outcomes, we do not know the timing of when our obligations related to unrecognized tax benefits will occur, if at all. See Note 17 “Income Taxes” of the notes to our consolidated financial statements for additional detail. |
|
(3) |
Interest payments related to the variable rate debt were estimated using the weighted average interest rate for the Ryerson Credit Facility. |
|
(4) |
The purchase obligations with suppliers are entered into when we receive firm sales commitments with certain of our customers. |
Capital Expenditures
Capital expenditures during 2016, 2015 and 2014 totaled $23.0 million, $22.3 million and $21.6 million, respectively. Capital expenditures were primarily for machinery and equipment.
The Company anticipates capital expenditures, excluding acquisitions, to be approximately $25 million in 2017. The spending includes maintenance expenditures and improvements to maintain, upgrade, and add to the Company’s North American processing capabilities.
38
Restructuring
2016
In 2016, the Company recorded a charge of $1.0 million related to a facility closure, which consists of tenancy-related costs, primarily future lease payments. The Company paid $0.2 million in costs related to this facility closure and also reclassified an existing $0.2 million liability for future lease payments at this facility to the restructuring reserve. The Company also paid $0.3 million in costs related to a facility closed in 2013 and recorded an addition of $0.1 million to the reserve for tenancy-related costs, which was charged to warehousing, delivery, selling, general and administrative expense in the Consolidated Statements of Operations. The remaining $1.3 million of tenancy-related costs are expected to be paid through 2025.
During 2016, the Company paid $0.7 million in employee-related costs related to restructuring actions taken in the fourth quarter of 2015. The Company also recorded a $0.3 million reduction to the reserve for employee-related costs and credited warehousing, delivery, selling, general and administrative expense in the Consolidated Statements of Operations. The remaining $0.2 million of employee-related costs are expected to be paid in 2017.
2015
In 2015, the Company recorded a charge of $2.2 million for employee costs related to expense reduction actions taken in the fourth quarter of 2015. The charge consists primarily of severance costs for 140 employees in addition to $0.2 million of non-cash pensions and other post-retirement benefit costs. During 2015, the Company paid $0.8 million in costs related to this expense reduction initiative.
In 2015, the Company also recorded a $0.3 million charge to increase the reserve for tenancy-related costs for a facility closed in 2013. During 2015, the Company paid $0.4 million in tenancy costs related to this facility.
2014
In 2014, the Company paid $0.7 million in tenancy costs related to a facility closed in 2013. In 2014, the Company also recorded a $0.1 million reduction to the reserve for tenancy-related costs and credited warehousing, delivery, selling, general and administrative expense in the Consolidated Statements of Operations. During 2014, the Company also paid the remaining $0.1 million of employee costs related to the closure of this facility.
Deferred Tax Amounts
At December 31, 2016, the Company had a net deferred tax asset of $21 million comprised primarily of a deferred tax asset of $85 million related to pension liabilities, a deferred tax asset related to postretirement benefits other than pensions of $28 million, $30 million of Alternative Minimum Tax (“AMT”) credit carryforwards and deferred tax assets of $96 million related to federal, local and foreign tax loss carryforwards, offset by a valuation allowance of $20 million and deferred tax liabilities of $81 million related to fixed assets and $129 million related to inventory.
The Company’s deferred tax assets include $76 million related to U.S. federal net operating loss (“NOL”) carryforwards, $12 million related to state NOL carryforwards and $8 million related to foreign NOL carryforwards, available at December 31, 2016.
In accordance with FASB ASC 740, “Income Taxes,” the Company assesses the realizability of its deferred tax assets. The Company records a valuation allowance when, based upon the evaluation of all available evidence, it is more-likely-than-not that all or a portion of the deferred tax assets will not be realized. In making this determination, we analyze, among other things, our recent history of earnings, the nature and timing of reversing book-tax temporary differences, tax planning strategies and future income. After considering both the positive and negative evidence available, in the second quarter of 2009, the Company determined that it was more-likely-than-not that it would not realize a portion of its U.S. deferred tax assets. As a result, the Company established a valuation allowance against a portion of its U.S. deferred tax assets. The Company released a portion of the valuation allowance related to one of its U.S. subsidiaries, JT Ryerson, during 2012. The Company released most of the remaining U.S. related valuation allowance during 2013. As of December 31, 2015, the Company had a valuation allowance of $22.6 million. As of December 31, 2016, the Company had a valuation allowance of $20.0 million, a decrease of $2.6 million from the prior year mainly related to changes in foreign deferred tax assets.
As described in Note 1 to the Consolidated Financial Statements, the Company assesses the need for a valuation allowance considering all available positive and negative evidence, including past operating results, projections of future taxable income and the feasibility of ongoing tax planning strategies. The fourth quarter of 2013 was the first quarter in which the Company’s overall U.S.
39
operations had sustained an operating profit in both the preceding cumulative three fiscal year period and in each of its two preceding fiscal years, providing objective evidence of the Company’s ability to earn future profits. Combined with the Company’s projections of future income providing additional subjective evidence of the Company’s ability to earn future profits and management’s judgment, the Company determined that these deferred tax assets were more likely than not realizable and accordingly the valuation allowance was no longer required.
The Company will continue to maintain a valuation allowance on certain U.S. federal and state deferred tax assets until such time as in management’s judgment, considering all available positive and negative evidence, the Company determines that these deferred tax assets are more likely than not realizable.
Critical Accounting Estimates
Preparation of this Form 10-K requires us to make estimates and assumptions that affect the reported amount of assets and liabilities, disclosure of contingent assets and liabilities at the date of our financial statements, and the reported amounts of sales and expenses during the reporting period. Our critical accounting policies, including the assumptions and judgments underlying them, are disclosed in Item 8 within Note 1: Summary of Accounting and Financial Policies. These policies have been consistently applied and address such matters as revenue recognition, depreciation methods, inventory valuation, asset impairment recognition and pension and postretirement expense. While policies associated with estimates and judgments may be affected by different assumptions or conditions, we believe our estimates and judgments associated with the reported amounts are appropriate in the circumstances. Actual results may differ from those estimates.
We consider the policies discussed below as critical to an understanding of our financial statements, as application of these policies places the most significant demands on management’s judgment, with financial reporting results relying on estimation of matters that are uncertain.
Provision for allowances, claims and doubtful accounts: We perform ongoing credit evaluations of customers and set credit limits based upon review of the customers’ current credit information and payment history. We monitor customer payments and maintain a provision for estimated credit losses based on historical experience and specific customer collection issues that we have identified. Estimation of such losses requires adjusting historical loss experience for current economic conditions and judgments about the probable effects of economic conditions on certain customers. We cannot guarantee that the rate of future credit losses will be similar to past experience. Provisions for allowances and claims are based upon historical rates, expected trends and estimates of potential returns, allowances, customer discounts and incentives. We consider all available information when assessing the adequacy of the provision for allowances, claims and doubtful accounts.
Inventory valuation: Our inventories are stated at the lower of cost or market. The valuation of our inventories at the lower of cost or market could be subject to certain estimates; however the measurement is primarily based on historical purchasing and sales information rather than forecasted metals pricing. Inventory costs reflect metal and in-bound freight purchase costs, third-party processing costs and internal direct and allocated indirect processing costs. Cost is primarily determined by the LIFO method. We regularly review inventory on hand and record provisions for obsolete and slow-moving inventory based on historical and current sales trends. Changes in product demand and our customer base may affect the value of inventory on hand which may require higher provisions for obsolete inventory.
Income Taxes: Our income tax expense, deferred tax assets and liabilities and reserve for uncertain tax positions reflect our best estimate of taxes to be paid. The Company is subject to income taxes in the U.S. and several foreign jurisdictions. The determination of the consolidated income tax expense requires judgment and estimation by management. It is possible that actual results could differ from the estimates that management has used to determine its consolidated income tax expense.
We record operating loss and tax credit carryforwards and the estimated effect of temporary differences between the tax basis of assets and liabilities and the reported amounts in the Consolidated Balance Sheet. We follow detailed guidelines in each tax jurisdiction when reviewing tax assets recorded on the balance sheet and provide for valuation allowances as required. Deferred tax assets are reviewed for recoverability based on historical taxable income, the expected reversals of existing temporary differences, tax planning strategies and on forecasts of future taxable income. The forecasts of future taxable income require assumptions regarding volume, selling prices, margins, expense levels and industry cyclicality. If we are unable to generate sufficient future taxable income in certain tax jurisdictions, we may be required to record additional valuation allowances against our deferred tax assets related to those jurisdictions.
The Company’s income tax provisions are based on calculations and assumptions that are subject to examination by the IRS and other tax authorities. Although the Company believes that the positions taken on filed tax returns are reasonable, it has established tax
40
and interest reserves in recognition that various taxing authorities may challenge the positions taken. For uncertain tax positions, the Company applies the provisions of relevant authoritative guidance, which requires application of a “more likely than not” threshold to the recognition and derecognition of tax positions. The Company’s ongoing assessments of the more likely than not outcomes of tax authority examinations and related tax positions require significant judgment and can increase or decrease the Company’s effective tax rate.
Long-lived Assets and Other Intangible Assets: Long-lived assets held and used are reviewed for impairment whenever events or changes in circumstances indicate that the carrying amount of an asset may not be recoverable. We estimate the future cash flows expected to result from the use of the asset and its eventual disposition. If the sum of the expected future cash flows (undiscounted and without interest charges) is less than the carrying amount of the asset, an impairment is recognized. Determining whether an impairment has occurred typically requires various estimates and assumptions, including determining which undiscounted cash flows are directly related to the potentially impaired asset, the useful life over which cash flows will occur, their amount, and the asset’s residual value, if any. Any related impairment loss is calculated based upon comparison of the fair value to the carrying value of the asset. Separate intangible assets that have finite useful lives are amortized over their useful lives. An impaired long-lived or intangible asset would be written down to fair value, based on various available valuation techniques, including the discounted cash flow method.
Goodwill: We assess the recoverability of the carrying value of recorded goodwill annually in the fourth quarter of each year or whenever indicators of potential impairment exist. We test for impairment of goodwill by assessing various qualitative factors with respect to developments in our business and the overall economy and calculating the fair value of a reporting unit using the discounted cash flow method, as necessary. Factors that may be considered indicators of impairment include: deterioration in general economic conditions; declines in the market conditions of our products, including metals prices; a sustained significant decline in our share price and market capitalization; reduced future cash flow estimates; and slower growth rates in our industry, among others. If we determine that it is more likely than not that the fair value of a reporting unit is less than the carrying value based on our qualitative assessment, we will proceed to the two-step goodwill impairment test. In step one, we compare the fair value of the reporting unit in which goodwill resides to its carrying value. If the carrying amount exceeds the fair value, the second step of the goodwill impairment test is performed to measure the amount of the impairment loss, if any. In the second step, the implied fair value of the goodwill is estimated as the fair value of the reporting unit used in the first step less the fair value of all other net tangible and intangible assets of the reporting unit. If the carrying amount of goodwill exceeds its implied fair value, an impairment loss is recognized in an amount equal to that excess, not to exceed the carrying amount of the goodwill. The fair value of the reporting units are estimated using a combination of an income approach and a market approach as this combination is deemed to be the most indicative of our fair value in an orderly transaction between market participants. An income approach based on discounted future cash flows requires us to estimate income from operations based on projected results and discount rates based on a weighted average cost of capital of comparable companies. A market approach estimates fair value using market multiples of various financial measures of comparable public companies. If these estimates or their related assumptions for commodity prices and demand change in the future, we may be required to record impairment charges for these assets.
Based on the impairment test performed in the prior year on October 1, 2015, the reporting unit’s fair value exceeded its carrying value by more than 25%. Based on a qualitative assessment performed on October 1, 2016, the Company concluded it was not more likely than not that the fair value of the reporting unit was less than its carrying amount. Therefore, we did not perform the two-step goodwill impairment test during 2016. The discount rate for the reporting unit was estimated to be 14.0% at October 1, 2016. The Company determines a discount rate based on an estimate of a reasonable risk-adjusted return an investor would expect to realize on an investment in the reporting unit. Deterioration in market conditions in our industry or products, changes in expected future cash flows, expected growth rates or to discount rates could result in impairment charges in future periods.
Purchase Price Accounting: Business combinations are accounted for using the acquisition method of accounting. This method requires the Company to record assets and liabilities of the business acquired at their estimated fair market values as of the acquisition date. Any excess of the cost of the acquisition over the fair value of the net assets acquired is recorded as goodwill. The Company uses valuation specialists, where necessary, to perform appraisals and assist in the determination of the fair values of the assets acquired and liabilities assumed. These valuations require management to make estimates and assumptions that are critical in determining the fair values of the assets and liabilities.
Pension and postretirement benefit plan assumptions: We sponsor various benefit plans covering a portion of our employees for pension and postretirement medical costs. Statistical methods are used to anticipate future events when calculating expenses and liabilities related to the plans. The statistical methods include assumptions about, among other things, the discount rate, expected return on plan assets, rate of increase of health care costs and the rate of future compensation increases. Our actuarial consultants also use subjective factors such as withdrawal and mortality rates when estimating expenses and liabilities. The discount rate used for U.S. plans reflects the market rate for high-quality fixed-income investments on our annual measurement date (December 31) and is subject to change each year. The discount rate was determined by matching, on an approximate basis, the coupons and maturities for a
41
portfolio of corporate bonds (rated Aa or better by Moody’s Investor Services or AA or better by Standard and Poor’s) to the expected plan benefit payments defined by the projected benefit obligation. The discount rates used for plans outside the U.S. are based on a combination of relevant indices regarding corporate and government securities, the duration of the liability and appropriate judgment.
When calculating pension expense for 2016, we assumed the pension plans’ assets would generate a long-term rate of return of 7.10% for the U.S. plan, and between 5.50% and 5.75% for the Canadian plans. The expected long-term rate of return assumption was developed based on historical experience and input from the trustee managing the plans’ assets. The expected long-term rate of return on plan assets is based on a target allocation of assets, which is based on a goal of earning the highest rate of return while maintaining risk at acceptable levels. Our projected long-term rate of return for the U.S. pension plan is slightly higher than some market indices due to the active management of our plans’ assets, and is supported by the historical returns on our plans’ assets. The plans strive to have assets sufficiently diversified so that adverse or unexpected results from one security class will not have an unduly detrimental impact on the entire portfolio. We regularly review actual asset allocation and the pension plans’ investments are periodically rebalanced to the targeted allocation when considered appropriate. Pension expense increases as the expected rate of return on plan assets decreases. Lowering the expected long-term rate of return on plan assets by 50 basis points would have increased 2016 pension expense by approximately $3 million.
Future pension obligations for the U.S. plans were discounted using a rate of 4.14% at December 31, 2016. Future pension obligations for the Canadian plans were discounted using weighted average rates between 3.64% and 3.71% at December 31, 2016. Lowering the discount rate by 50 basis points would increase the pension liability at December 31, 2016 by approximately $45 million.
The calculation of other postretirement benefit expense and obligations requires the use of a number of assumptions, including the assumed discount rate for measuring future payment obligations and the health care cost trend rate. A one percentage point increase (decrease) in assumed health care trend rates would increase (decrease) our total service and interest cost for the year ended December 31, 2016 by $0.2 million and $(0.1) million, respectively. A decrease in the weighted average discount rate of 50 basis points would increase the postretirement benefit liability by approximately $3 million.
The assumptions used in the actuarial calculation of expenses and liabilities may differ materially from actual results due to changing market and economic conditions, higher or lower withdrawal rates or longer or shorter life spans of participants. These differences may result in a significant impact on the amount of pension or postretirement benefit expense we may record in the future.
Legal contingencies: We are involved in a number of legal and regulatory matters including those discussed in Note 12 in the Consolidated Financial Statements. We determine whether an estimated loss from a loss contingency should be accrued by assessing whether a loss is deemed probable and can be reasonably estimated. We analyze our legal matters based on available information to assess potential liability. We consult with outside counsel involved in our legal matters when analyzing potential outcomes. We cannot determine at this time whether any potential liability related to this litigation would materially affect our financial position, results of operations or cash flows.
Recent Accounting Pronouncements
Recent accounting pronouncements are discussed within Note 1 in the Consolidated Financial Statements.
Interest rate risk
We are exposed to market risk related to our fixed-rate and variable-rate long-term debt. Market risk is the potential loss arising from adverse changes in market rates and prices, such as interest rates. Changes in interest rates may affect the market value of our fixed-rate debt. The estimated fair value of our long-term debt and the current portions thereof using quoted market prices of Company debt securities recently traded and market-based prices of similar securities for those securities not recently traded was $1,034.2 million at December 31, 2016 and $855.3 million at December 31, 2015 as compared with the carrying value of $963.5 million and $1,023.5 million at December 31, 2016 and 2015, respectively.
A hypothetical 1% increase in interest rates on variable rate debt would have increased interest expense in 2016 by approximately $3.3 million.
42
Foreign exchange rate risk
We are subject to exposure from fluctuations in foreign currencies. We use foreign currency exchange contracts to hedge our Canadian subsidiaries’ variability in cash flows from the forecasted payment of currencies other than the functional currency. The Canadian subsidiaries’ foreign currency contracts were principally used to purchase U.S. dollars. We had foreign currency contracts with a U.S. dollar notional amount of $2.3 million outstanding at December 31, 2016 and a value of zero. We do not currently account for these contracts as hedges but rather mark these contracts to market with a corresponding offset to current earnings. For the year ended December 31, 2016, the Company recognized a loss of $0.1 million associated with its foreign currency contracts. A hypothetical strengthening or weakening of 10% in the foreign exchange rates underlying the foreign currency contracts from the market rate as of December 31, 2016 would not have a material effect to the financial statements.
The currency effects of translating the financial statements of our foreign subsidiaries are included in accumulated other comprehensive loss and will not be recognized in the statement of operations until there is a liquidation or sale of those foreign subsidiaries.
Commodity price risk
Metal prices can fluctuate significantly due to several factors including changes in foreign and domestic production capacity, raw material availability, metals consumption and foreign currency rates. Declining metal prices could reduce our revenues, gross profit and net income. From time to time, we may enter into fixed price sales contracts with our customers for certain of our inventory components. We may enter into metal commodity futures and options contracts to reduce volatility in the price of these metals.
As of December 31, 2016, we had 296 tons of nickel futures or option contracts and 11,998 tons of hot roll coil swaps outstanding with a liability value $0.1 million and an asset value of $1.2 million, respectively. As of December 31, 2016, we had 8,466 tons of aluminum price swaps with an asset value of $0.8 million and a liability value of $0.1 million. We do not currently account for these contracts as hedges, but rather mark these contracts to market with a corresponding offset to current earnings. For the year ended December 31, 2016, the Company recognized a gain of $10.0 million associated with its metal commodity derivatives.
As of December 31, 2016, we had diesel fuel price swaps with respect to the purchase of 39,000 gallons of diesel fuel in order to fix the prices at which we purchase that volume of fuel for our trucking fleet. We do not currently account for these contracts as hedges, but rather mark these contracts to market with a corresponding offset to current earnings. As of December 31, 2016, our diesel fuel hedges outstanding had a value of zero. For the year ended December 31, 2016, the Company recognized a gain of $0.1 million associated with its diesel fuel commodity derivatives.
A hypothetical strengthening or weakening of 10% in the commodity prices underlying the commodity derivative contracts from the market rate as of December 31, 2016 would increase or decrease the fair value of the commodity derivative contracts by $2.4 million.
43
Index to Consolidated Financial Statements
|
|
|
Page |
|
Financial Statements |
|
|
|
Management’s Report on Internal Control over Financial Reporting |
|
45 |
|
|
46 |
|
|
Consolidated Statements of Operations for the years ended December 31, 2016, 2015 and 2014 |
|
48 |
|
Consolidated Statements of Comprehensive Income for the years ended December 31, 2016, 2015 and 2014 |
|
49 |
|
Consolidated Statements of Cash Flows for the years ended December 31, 2016, 2015 and 2014 |
|
50 |
|
|
51 |
|
|
Consolidated Statements of Stockholders’ Equity for the years ended December 31, 2016, 2015 and 2014 |
|
52 |
|
|
53 |
|
|
Financial Statements Schedule |
|
|
|
|
84 |
|
|
|
89 |
|
|
All other schedules are omitted because they are not applicable. The required information is shown in the Financial Statements or Notes thereto. |
|
|
44
MANAGEMENT’S REPORT ON INTERNAL CONTROL OVER FINANCIAL REPORTING
The management of Ryerson Holding Corporation (“the Company”) is responsible for establishing and maintaining adequate internal control over financial reporting. The Company’s internal control system was designed to provide reasonable assurance to the Company’s management and Board of Directors regarding the reliability of financial reporting and the preparation of financial statements for external purposes in accordance with accounting principles generally accepted in the United States of America.
Because of its inherent limitations, internal control over financial reporting may not prevent or detect misstatements under all potential conditions. Therefore, effective internal control over financial reporting provides only reasonable, and not absolute, assurance with respect to the preparation and presentation of financial statements.
The Company’s management assessed the effectiveness of the Company’s internal control over financial reporting as of December 31, 2016, based on criteria established in Internal Control - Integrated Framework issued by the Committee of Sponsoring Organizations of the Treadway Commission (2013 framework) (the COSO criteria). Based on its assessment under that framework and the criteria established therein, the Company’s management concluded that the Company’s internal control over financial reporting was effective as of December 31, 2016.
Ernst & Young LLP, an independent registered public accounting firm, has audited the Company’s internal control over financial reporting as of December 31, 2016, as stated in their report, which is included herein.
45
REPORT OF INDEPENDENT REGISTERED PUBLIC ACCOUNTING FIRM
The Board of Directors and Stockholders of Ryerson Holding Corporation
We have audited the accompanying consolidated balance sheets of Ryerson Holding Corporation and Subsidiary Companies (“the Company”) as of December 31, 2016 and 2015 and the related consolidated statements of operations, comprehensive income, stockholders’ equity, and cash flows for each of the three years in the period ended December 31, 2016. Our audits also included the financial statement schedules listed in the index to the consolidated financial statements. These financial statements and schedules are the responsibility of the Company’s management. Our responsibility is to express an opinion on these financial statements and schedules based on our audits.
We conducted our audits in accordance with the standards of the Public Company Oversight Board (United States). Those standards require that we plan and perform the audit to obtain reasonable assurance about whether the financial statements are free of material misstatement. An audit also includes examining, on a test basis, evidence supporting the amounts and disclosures in the financial statements. An audit also includes assessing the accounting principles used and significant estimates made by management, as well as evaluating the overall financial statement presentation. We believe that our audits provide a reasonable basis for our opinion.
In our opinion, the financial statements referred to above present fairly, in all material respects, the consolidated financial position of the Company at December 31, 2016 and 2015, and the consolidated results of its operations and its cash flows, for each of the three years in the period ended December 31, 2016, in conformity with U.S. generally accepted accounting principles. Also, in our opinion, the related financial statement schedules, when considered in relation to the basic financial statements taken as a whole, present fairly, in all material respects, the information set forth therein.
We also have audited, in accordance with the standards of the Public Company Accounting Oversight Board (United States), the Company’s internal control over financial reporting as of December 31, 2016, based on criteria established in Internal Control - Integrated Framework issued by the Committee of Sponsoring Organizations of the Treadway Commission (2013 framework) and our report dated March 13, 2017 expressed an unqualified opinion thereon.
|
/s/ Ernst & Young LLP |
|
|
|
Chicago, Illinois |
|
March 13, 2017 |
46
REPORT OF INDEPENDENT REGISTERED PUBLIC ACCOUNTING FIRM ON INTERNAL CONTROL OVER FINANCIAL REPORTING
The Board of Directors and Stockholders of Ryerson Holding Corporation
We have audited Ryerson Holding Corporation and Subsidiary Companies’ (“the Company”) internal control over financial reporting as of December 31, 2016, based on criteria established in Internal Control - Integrated Framework issued by the Committee of Sponsoring Organizations of the Treadway Commission (2013 framework) (the COSO criteria). The Company's management is responsible for maintaining effective internal control over financial reporting, and for its assessment of the effectiveness of internal control over financial reporting included in the accompanying Management's Annual Report on Internal Control Over Financial Reporting. Our responsibility is to express an opinion on the Company's internal control over financial reporting based on our audit.
We conducted our audit in accordance with the standards of the Public Company Accounting Oversight Board (United States). Those standards require that we plan and perform the audit to obtain reasonable assurance about whether effective internal control over financial reporting was maintained in all material respects. Our audit included obtaining an understanding of internal control over financial reporting, assessing the risk that a material weakness exists, testing and evaluating the design and operating effectiveness of internal control based on the assessed risk, and performing such other procedures as we considered necessary in the circumstances. We believe that our audit provides a reasonable basis for our opinion.
A company's internal control over financial reporting is a process designed to provide reasonable assurance regarding the reliability of financial reporting and the preparation of financial statements for external purposes in accordance with generally accepted accounting principles. A company's internal control over financial reporting includes those policies and procedures that (1) pertain to the maintenance of records that, in reasonable detail, accurately and fairly reflect the transactions and dispositions of the assets of the Company; (2) provide reasonable assurance that transactions are recorded as necessary to permit preparation of financial statements in accordance with generally accepted accounting principles, and that receipts and expenditures of the Company are being made only in accordance with authorizations of management and directors of the Company; and (3) provide reasonable assurance regarding prevention or timely detection of unauthorized acquisition, use, or disposition of the Company's assets that could have a material effect on the financial statements.
Because of its inherent limitations, internal control over financial reporting may not prevent or detect misstatements. Also, projections of any evaluation of effectiveness to future periods are subject to the risk that controls may become inadequate because of changes in conditions, or that the degree of compliance with the policies or procedures may deteriorate.
In our opinion, the Company maintained, in all material respects, effective internal control over financial reporting as of December 31, 2016, based on the COSO criteria.
We also have audited, in accordance with the standards of the Public Company Accounting Oversight Board (United States), the consolidated balance sheets of the Company as of December 31, 2016 and 2015, and the related consolidated statements of operations, comprehensive income, stockholders' equity, and cash flows for each of the three years in the period ended December 31, 2016, and our report dated March 13, 2017 expressed an unqualified opinion thereon.
|
/s/ Ernst & Young LLP Chicago, Illinois |
|
March 13, 2017 |
47
RYERSON HOLDING CORPORATION AND SUBSIDIARY COMPANIES
CONSOLIDATED STATEMENTS OF OPERATIONS
(In millions, except per share data)
|
|
|
Year Ended December 31, |
|
|||||||||
|
|
|
2016 |
|
|
2015 |
|
|
2014 |
|
|||
|
Net sales |
|
$ |
2,859.7 |
|
|
$ |
3,167.2 |
|
|
$ |
3,622.2 |
|
|
Cost of materials sold |
|
|
2,289.1 |
|
|
|
2,599.5 |
|
|
|
3,028.4 |
|
|
Gross profit |
|
|
570.6 |
|
|
|
567.7 |
|
|
|
593.8 |
|
|
Warehousing, delivery, selling, general and administrative |
|
|
436.4 |
|
|
|
450.8 |
|
|
|
509.2 |
|
|
Gain on sale of assets |
|
|
— |
|
|
|
(1.9 |
) |
|
|
(1.8 |
) |
|
Restructuring and other charges |
|
|
1.0 |
|
|
|
2.5 |
|
|
|
— |
|
|
Impairment charges on assets |
|
|
— |
|
|
|
7.7 |
|
|
|
— |
|
|
Operating profit |
|
|
133.2 |
|
|
|
108.6 |
|
|
|
86.4 |
|
|
Other expense: |
|
|
|
|
|
|
|
|
|
|
|
|
|
Other income and (expense), net |
|
|
(17.2 |
) |
|
|
(10.4 |
) |
|
|
(5.9 |
) |
|
Interest and other expense on debt |
|
|
(89.9 |
) |
|
|
(96.3 |
) |
|
|
(107.4 |
) |
|
Income (loss) before income taxes |
|
|
26.1 |
|
|
|
1.9 |
|
|
|
(26.9 |
) |
|
Provision (benefit) for income taxes |
|
|
7.2 |
|
|
|
3.7 |
|
|
|
(0.7 |
) |
|
Net income (loss) |
|
|
18.9 |
|
|
|
(1.8 |
) |
|
|
(26.2 |
) |
|
Less: Net income (loss) attributable to noncontrolling interest |
|
|
0.2 |
|
|
|
(1.3 |
) |
|
|
(0.5 |
) |
|
Net income (loss) attributable to Ryerson Holding Corporation |
|
$ |
18.7 |
|
|
$ |
(0.5 |
) |
|
$ |
(25.7 |
) |
|
Basic earnings (loss) per share |
|
$ |
0.55 |
|
|
$ |
(0.02 |
) |
|
$ |
(1.01 |
) |
|
Diluted earnings (loss) per share |
|
$ |
0.54 |
|
|
$ |
(0.02 |
) |
|
$ |
(1.01 |
) |
See Notes to Consolidated Financial Statements
48
RYERSON HOLDING CORPORATION AND SUBSIDIARY COMPANIES
CONSOLIDATED STATEMENTS OF COMPREHENSIVE INCOME
(In millions)
|
|
|
Year Ended December 31, |
|
|||||||||
|
|
|
2016 |
|
|
2015 |
|
|
2014 |
|
|||
|
Net income (loss) |
|
$ |
18.9 |
|
|
$ |
(1.8 |
) |
|
$ |
(26.2 |
) |
|
Other comprehensive income (loss), before tax: |
|
|
|
|
|
|
|
|
|
|
|
|
|
Foreign currency translation adjustments |
|
|
1.1 |
|
|
|
(12.9 |
) |
|
|
(16.3 |
) |
|
Gain (loss) on intra-entity foreign currency transactions |
|
|
1.3 |
|
|
|
(8.6 |
) |
|
|
— |
|
|
Unrealized loss on available-for-sale investment |
|
|
(1.8 |
) |
|
|
(8.9 |
) |
|
|
(9.5 |
) |
|
Other-than-temporary impairment on available-for-sale investment |
|
|
4.7 |
|
|
|
12.3 |
|
|
|
— |
|
|
Liquidation of investment in foreign entity |
|
|
1.3 |
|
|
|
— |
|
|
|
— |
|
|
Changes in defined benefit pension and other post-retirement benefit plans |
|
|
(10.6 |
) |
|
|
7.8 |
|
|
|
(130.3 |
) |
|
Other comprehensive income (loss), before tax |
|
|
(4.0 |
) |
|
|
(10.3 |
) |
|
|
(156.1 |
) |
|
Income tax provision (benefit) related to items of other comprehensive income (loss) |
|
|
(3.3 |
) |
|
|
5.8 |
|
|
|
(52.8 |
) |
|
Comprehensive income (loss), after tax |
|
|
18.2 |
|
|
|
(17.9 |
) |
|
|
(129.5 |
) |
|
Less: Comprehensive income (loss) attributable to the noncontrolling interest |
|
|
0.3 |
|
|
|
(1.8 |
) |
|
|
(0.6 |
) |
|
Comprehensive income (loss) attributable to Ryerson Holding Corporation |
|
$ |
17.9 |
|
|
$ |
(16.1 |
) |
|
$ |
(128.9 |
) |
See Notes to Consolidated Financial Statements
49
RYERSON HOLDING CORPORATION AND SUBSIDIARY COMPANIES
CONSOLIDATED STATEMENTS OF CASH FLOWS
(In millions)
|
|
|
Year Ended December 31, |
|
|||||||||
|
|
|
2016 |
|
|
2015 |
|
|
2014 |
|
|||
|
Operating activities: |
|
|
|
|
|
|
|
|
|
|
|
|
|
Net income (loss) |
|
$ |
18.9 |
|
|
$ |
(1.8 |
) |
|
$ |
(26.2 |
) |
|
Adjustments to reconcile net income (loss) to net cash provided by (used in) operating activities: |
|
|
|
|
|
|
|
|
|
|
|
|
|
Depreciation and amortization |
|
|
42.5 |
|
|
|
43.7 |
|
|
|
45.6 |
|
|
Stock-based compensation |
|
|
1.4 |
|
|
|
0.7 |
|
|
|
— |
|
|
Deferred income taxes |
|
|
4.7 |
|
|
|
3.2 |
|
|
|
(3.5 |
) |
|
Provision for allowances, claims and doubtful accounts |
|
|
3.1 |
|
|
|
2.3 |
|
|
|
0.7 |
|
|
Restructuring and other charges |
|
|
1.0 |
|
|
|
2.5 |
|
|
|
— |
|
|
Gain on sale of assets |
|
|
— |
|
|
|
(1.9 |
) |
|
|
(1.8 |
) |
|
Impairment charges on assets |
|
|
— |
|
|
|
7.7 |
|
|
|
— |
|
|
Other-than-temporary impairment charge on available-for-sale investments |
|
|
4.7 |
|
|
|
12.3 |
|
|
|
— |
|
|
(Gain) loss on retirement of debt |
|
|
8.7 |
|
|
|
(0.3 |
) |
|
|
11.2 |
|
|
Premium and fees paid related to debt modification |
|
|
(15.7 |
) |
|
|
— |
|
|
|
— |
|
|
Non-cash (gain) loss from derivatives |
|
|
(5.4 |
) |
|
|
2.3 |
|
|
|
0.7 |
|
|
Liquidation of investment in foreign entity |
|
|
1.2 |
|
|
|
— |
|
|
|
— |
|
|
Other items |
|
|
0.3 |
|
|
|
(0.2 |
) |
|
|
0.1 |
|
|
Change in operating assets and liabilities, net of effects of acquisitions: |
|
|
|
|
|
|
|
|
|
|
|
|
|
Receivables |
|
|
(22.5 |
) |
|
|
88.0 |
|
|
|
(19.5 |
) |
|
Inventories |
|
|
(6.5 |
) |
|
|
178.1 |
|
|
|
(6.4 |
) |
|
Other assets |
|
|
12.7 |
|
|
|
6.8 |
|
|
|
2.1 |
|
|
Accounts payable |
|
|
20.5 |
|
|
|
(12.4 |
) |
|
|
(22.4 |
) |
|
Accrued liabilities |
|
|
(4.7 |
) |
|
|
(20.0 |
) |
|
|
10.3 |
|
|
Accrued taxes payable/receivable |
|
|
1.2 |
|
|
|
(1.7 |
) |
|
|
3.2 |
|
|
Deferred employee benefit costs |
|
|
(40.7 |
) |
|
|
(50.2 |
) |
|
|
(67.4 |
) |
|
Net adjustments |
|
|
6.5 |
|
|
|
260.9 |
|
|
|
(47.1 |
) |
|
Net cash provided by (used in) operating activities |
|
|
25.4 |
|
|
|
259.1 |
|
|
|
(73.3 |
) |
|
Investing activities: |
|
|
|
|
|
|
|
|
|
|
|
|
|
Acquisitions, net of cash acquired |
|
|
(1.1 |
) |
|
|
(8.8 |
) |
|
|
(20.1 |
) |
|
(Increase) decrease in restricted cash |
|
|
0.2 |
|
|
|
0.8 |
|
|
|
(0.2 |
) |
|
Capital expenditures |
|
|
(23.0 |
) |
|
|
(22.3 |
) |
|
|
(21.6 |
) |
|
Proceeds from sale of property, plant and equipment |
|
|
3.2 |
|
|
|
10.4 |
|
|
|
7.3 |
|
|
Proceeds from insurance settlement |
|
|
— |
|
|
|
0.6 |
|
|
|
0.6 |
|
|
Other investing activities |
|
|
— |
|
|
|
1.3 |
|
|
|
— |
|
|
Net cash used in investing activities |
|
|
(20.7 |
) |
|
|
(18.0 |
) |
|
|
(34.0 |
) |
|
Financing activities: |
|
|
|
|
|
|
|
|
|
|
|
|
|
Net proceeds from issuance of common stock |
|
|
71.5 |
|
|
|
— |
|
|
|
112.4 |
|
|
Long-term debt issued |
|
|
650.0 |
|
|
|
— |
|
|
|
— |
|
|
Repayment of debt |
|
|
(738.8 |
) |
|
|
(59.9 |
) |
|
|
(110.7 |
) |
|
Net proceeds/(repayments) of short-term borrowings |
|
|
37.0 |
|
|
|
(164.4 |
) |
|
|
63.8 |
|
|
Credit facility issuance costs |
|
|
(1.3 |
) |
|
|
(4.0 |
) |
|
|
— |
|
|
Net increase (decrease) in book overdrafts |
|
|
3.6 |
|
|
|
(3.5 |
) |
|
|
36.0 |
|
|
Long-term debt issuance costs |
|
|
(5.2 |
) |
|
|
— |
|
|
|
— |
|
|
Principal payments on capital lease obligations |
|
|
(5.3 |
) |
|
|
(2.1 |
) |
|
|
(1.0 |
) |
|
Proceeds from sale leaseback transactions |
|
|
— |
|
|
|
1.7 |
|
|
|
— |
|
|
Contributions from non-controlling interest |
|
|
0.4 |
|
|
|
— |
|
|
|
— |
|
|
Net cash provided by (used in) financing activities |
|
|
11.9 |
|
|
|
(232.2 |
) |
|
|
100.5 |
|
|
Net increase (decrease) in cash and cash equivalents |
|
|
16.6 |
|
|
|
8.9 |
|
|
|
(6.8 |
) |
|
Effect of exchange rate changes on cash and cash equivalents |
|
|
0.9 |
|
|
|
(5.7 |
) |
|
|
(7.6 |
) |
|
Net change in cash and cash equivalents |
|
|
17.5 |
|
|
|
3.2 |
|
|
|
(14.4 |
) |
|
Cash and cash equivalents—beginning of period |
|
|
63.2 |
|
|
|
60.0 |
|
|
|
74.4 |
|
|
Cash and cash equivalents—end of period |
|
$ |
80.7 |
|
|
$ |
63.2 |
|
|
$ |
60.0 |
|
|
Supplemental disclosures: |
|
|
|
|
|
|
|
|
|
|
|
|
|
Cash paid during the period for: |
|
|
|
|
|
|
|
|
|
|
|
|
|
Interest paid to third parties |
|
$ |
88.6 |
|
|
$ |
86.5 |
|
|
$ |
100.3 |
|
|
Income taxes, net |
|
|
1.8 |
|
|
|
3.2 |
|
|
|
1.6 |
|
|
Noncash investing activities: |
|
|
|
|
|
|
|
|
|
|
|
|
|
Asset additions under capital leases |
|
$ |
5.3 |
|
|
$ |
11.5 |
|
|
$ |
5.1 |
|
See Notes to Consolidated Financial Statements
50
RYERSON HOLDING CORPORATION AND SUBSIDIARY COMPANIES
(In millions, except shares)
|
|
|
At December 31, |
|
|||||
|
|
|
2016 |
|
|
2015 |
|
||
|
Assets |
|
|
|
|
|
|
|
|
|
Current assets: |
|
|
|
|
|
|
|
|
|
Cash and cash equivalents |
|
$ |
80.7 |
|
|
$ |
63.2 |
|
|
Restricted cash (Note 3) |
|
|
1.0 |
|
|
|
1.2 |
|
|
Receivables less provision for allowances, claims and doubtful accounts of $4.6 in 2016 and $5.2 in 2015 |
|
|
326.0 |
|
|
|
305.7 |
|
|
Inventories (Note 4) |
|
|
563.4 |
|
|
|
555.8 |
|
|
Prepaid expenses and other current assets |
|
|
26.7 |
|
|
|
32.8 |
|
|
Total current assets |
|
|
997.8 |
|
|
|
958.7 |
|
|
Property, plant and equipment, net of accumulated depreciation (Note 5) |
|
|
388.2 |
|
|
|
400.3 |
|
|
Deferred income taxes (Note 17) |
|
|
24.4 |
|
|
|
31.8 |
|
|
Other intangible assets (Note 6) |
|
|
40.8 |
|
|
|
46.2 |
|
|
Goodwill (Note 7) |
|
|
103.2 |
|
|
|
103.2 |
|
|
Deferred charges and other assets |
|
|
4.3 |
|
|
|
5.0 |
|
|
Total assets |
|
$ |
1,558.7 |
|
|
$ |
1,545.2 |
|
|
Liabilities |
|
|
|
|
|
|
|
|
|
Current liabilities: |
|
|
|
|
|
|
|
|
|
Accounts payable |
|
$ |
230.4 |
|
|
$ |
206.3 |
|
|
Accrued liabilities: |
|
|
|
|
|
|
|
|
|
Salaries, wages and commissions |
|
|
36.8 |
|
|
|
26.3 |
|
|
Interest on debt |
|
|
9.8 |
|
|
|
15.6 |
|
|
Other accrued liabilities |
|
|
27.9 |
|
|
|
36.4 |
|
|
Short-term debt (Note 9) |
|
|
19.2 |
|
|
|
22.0 |
|
|
Current portion of deferred employee benefits |
|
|
8.3 |
|
|
|
9.1 |
|
|
Total current liabilities |
|
|
332.4 |
|
|
|
315.7 |
|
|
Long-term debt (Note 9) |
|
|
944.3 |
|
|
|
1,001.5 |
|
|
Deferred employee benefits (Note 10) |
|
|
298.8 |
|
|
|
327.7 |
|
|
Other noncurrent liabilities |
|
|
32.5 |
|
|
|
41.1 |
|
|
Total liabilities |
|
|
1,608.0 |
|
|
|
1,686.0 |
|
|
Commitments and contingencies (Note 11) |
|
|
|
|
|
|
|
|
|
Redeemable noncontrolling interest (Note 14) |
|
|
— |
|
|
|
0.1 |
|
|
Equity |
|
|
|
|
|
|
|
|
|
Ryerson Holding Corporation stockholders’ equity (deficit): |
|
|
|
|
|
|
|
|
|
Preferred stock, $0.01 par value; 7,000,000 shares authorized and no shares issued at 2016 and 2015 |
|
|
— |
|
|
|
— |
|
|
Common stock, $0.01 par value; 100,000,000 shares authorized and 37,345,117 shares issued at 2016; 100,000,000 shares authorized and 32,312,200 issued at 2015 |
|
|
0.4 |
|
|
|
0.3 |
|
|
Capital in excess of par value |
|
|
375.4 |
|
|
|
302.6 |
|
|
Accumulated deficit |
|
|
(112.2 |
) |
|
|
(130.9 |
) |
|
Treasury stock at cost – Common stock of 212,500 shares in 2016 and 2015 |
|
|
(6.6 |
) |
|
|
(6.6 |
) |
|
Accumulated other comprehensive loss |
|
|
(307.8 |
) |
|
|
(307.0 |
) |
|
Total Ryerson Holding Corporation stockholders’ equity (deficit) |
|
|
(50.8 |
) |
|
|
(141.6 |
) |
|
Noncontrolling interest |
|
|
1.5 |
|
|
|
0.7 |
|
|
Total equity (deficit) |
|
|
(49.3 |
) |
|
|
(140.9 |
) |
|
Total liabilities and equity |
|
$ |
1,558.7 |
|
|
$ |
1,545.2 |
|
See Notes to Consolidated Financial Statements
51
RYERSON HOLDING CORPORATION AND SUBSIDIARY COMPANIES
CONSOLIDATED STATEMENTS OF STOCKHOLDERS’ EQUITY
(In millions, except shares in thousands)
|
|
|
Ryerson Holding Corporation Stockholders |
|
|
|
|
|
|
|
|
|
|
|
|
|
|||||||||||||||||||||||||||||||||
|
|
|
|
|
|
|
|
|
|
|
|
|
|
|
|
|
|
|
|
|
|
|
|
|
|
|
Accumulated Other Comprehensive Income (Loss) |
|
|
|
|
|
|
|
|
|
|
|
|
|
|||||||||
|
|
|
Common Stock |
|
|
Treasury Stock |
|
|
Capital in Excess of Par Value |
|
|
Accumulated Deficit |
|
|
Foreign Currency Translation |
|
|
Benefit Plan Liabilities |
|
|
Unrealized Gain (Loss) on Available-For- Sale Investments |
|
|
Non- controlling Interest |
|
|
Total Equity |
|
|
Redeemable Non- controlling Interest |
|
||||||||||||||||||
|
|
|
Shares |
|
|
Dollars |
|
|
Shares |
|
|
Dollars |
|
|
Dollars |
|
|
Dollars |
|
|
Dollars |
|
|
Dollars |
|
|
Dollars |
|
|
Dollars |
|
|
Dollars |
|
|
Dollars |
|
||||||||||||
|
Balance at January 1, 2014 |
|
|
21,250 |
|
|
$ |
0.2 |
|
|
|
213 |
|
|
$ |
(6.6 |
) |
|
$ |
189.7 |
|
|
$ |
(104.7 |
) |
|
$ |
(16.6 |
) |
|
$ |
(174.9 |
) |
|
$ |
3.3 |
|
|
$ |
1.9 |
|
|
$ |
(107.7 |
) |
|
$ |
1.3 |
|
|
Net income (loss) |
|
|
— |
|
|
|
— |
|
|
|
— |
|
|
|
— |
|
|
|
— |
|
|
|
(25.7 |
) |
|
|
— |
|
|
|
— |
|
|
|
— |
|
|
|
(0.3 |
) |
|
|
(26.0 |
) |
|
|
(0.2 |
) |
|
Issuance of common stock in connection with initial public offering |
|
|
11,000 |
|
|
|
0.1 |
|
|
|
— |
|
|
|
— |
|
|
|
112.3 |
|
|
|
— |
|
|
|
— |
|
|
|
— |
|
|
|
— |
|
|
|
— |
|
|
112.4 |
|
|
|
— |
|
|
|
Foreign currency translation |
|
|
— |
|
|
|
— |
|
|
|
— |
|
|
|
— |
|
|
|
— |
|
|
|
— |
|
|
|
(16.2 |
) |
|
|
— |
|
|
|
— |
|
|
|
— |
|
|
|
(16.2 |
) |
|
|
(0.1 |
) |
|
Changes in defined benefit pension and other post-retirement benefit plans, net of tax of $49.4 |
|
|
— |
|
|
|
— |
|
|
|
— |
|
|
|
— |
|
|
|
— |
|
|
|
— |
|
|
|
— |
|
|
|
(80.9 |
) |
|
|
— |
|
|
|
— |
|
|
|
(80.9 |
) |
|
|
— |
|
|
Unrealized loss on available-for-sale investment, net of tax of $3.4 |
|
|
— |
|
|
|
— |
|
|
|
— |
|
|
|
— |
|
|
|
— |
|
|
|
— |
|
|
|
— |
|
|
|
— |
|
|
|
(6.1 |
) |
|
|
— |
|
|
|
(6.1 |
) |
|
|
— |
|
|
Balance at December 31, 2014 |
|
|
32,250 |
|
|
$ |
0.3 |
|
|
|
213 |
|
|
$ |
(6.6 |
) |
|
$ |
302.0 |
|
|
$ |
(130.4 |
) |
|
$ |
(32.8 |
) |
|
$ |
(255.8 |
) |
|
$ |
(2.8 |
) |
|
$ |
1.6 |
|
|
$ |
(124.5 |
) |
|
$ |
1.0 |
|
|
Net income (loss) |
|
|
— |
|
|
|
— |
|
|
|
— |
|
|
|
— |
|
|
|
— |
|
|
|
(0.5 |
) |
|
|
— |
|
|
|
— |
|
|
|
— |
|
|
|
(0.7 |
) |
|
|
(1.2 |
) |
|
|
(0.6 |
) |
|
Foreign currency translation |
|
|
— |
|
|
|
— |
|
|
|
— |
|
|
|
— |
|
|
|
— |
|
|
|
— |
|
|
|
(12.4 |
) |
|
|
— |
|
|
|
— |
|
|
|
(0.2 |
) |
|
|
(12.6 |
) |
|
|
(0.3 |
) |
|
Loss on intra-entity foreign currency transactions |
|
|
— |
|
|
|
— |
|
|
|
— |
|
|
|
— |
|
|
|
— |
|
|
|
— |
|
|
|
(8.6 |
) |
|
|
— |
|
|
|
— |
|
|
|
— |
|
|
|
(8.6 |
) |
|
|
— |
|
|
Changes in defined benefit pension and other post-retirement benefit plans, net of tax of $4.5 |
|
|
— |
|
|
|
— |
|
|
|
— |
|
|
|
— |
|
|
|
— |
|
|
|
— |
|
|
|
— |
|
|
|
3.3 |
|
|
|
— |
|
|
|
— |
|
|
|
3.3 |
|
|
|
— |
|
|
Unrealized loss on available-for-sale investment, net of tax of $3.4 |
|
|
— |
|
|
|
— |
|
|
|
— |
|
|
|
— |
|
|
|
— |
|
|
|
— |
|
|
|
— |
|
|
|
— |
|
|
|
(5.5 |
) |
|
|
— |
|
|
|
(5.5 |
) |
|
|
— |
|
|
Other-than-temporary impairment, net of tax of $4.7 |
|
|
— |
|
|
|
— |
|
|
|
— |
|
|
|
— |
|
|
|
— |
|
|
|
— |
|
|
|
— |
|
|
|
— |
|
|
|
7.6 |
|
|
|
— |
|
|
|
7.6 |
|
|
|
— |
|
|
Stock-based compensation expense |
|
|
62 |
|
|
|
— |
|
|
|
— |
|
|
|
— |
|
|
|
0.6 |
|
|
|
— |
|
|
|
— |
|
|
|
— |
|
|
|
— |
|
|
|
— |
|
|
|
0.6 |
|
|
|
— |
|
|
Balance at December 31, 2015 |
|
|
32,312 |
|
|
$ |
0.3 |
|
|
|
213 |
|
|
$ |
(6.6 |
) |
|
$ |
302.6 |
|
|
$ |
(130.9 |
) |
|
$ |
(53.8 |
) |
|
$ |
(252.5 |
) |
|
$ |
(0.7 |
) |
|
$ |
0.7 |
|
|
$ |
(140.9 |
) |
|
$ |
0.1 |
|
|
Net income (loss) |
|
|
— |
|
|
|
— |
|
|
|
— |
|
|
|
— |
|
|
|
— |
|
|
|
18.7 |
|
|
|
— |
|
|
|
— |
|
|
|
— |
|
|
|
0.8 |
|
|
|
19.5 |
|
|
|
(0.6 |
) |
|
Foreign currency translation |
|
|
— |
|
|
|
— |
|
|
|
— |
|
|
|
— |
|
|
|
— |
|
|
|
— |
|
|
|
1.1 |
|
|
|
— |
|
|
|
— |
|
|
|
— |
|
|
|
1.1 |
|
|
|
— |
|
|
Gain on intra-entity foreign currency transactions |
|
|
— |
|
|
|
— |
|
|
|
— |
|
|
|
— |
|
|
|
— |
|
|
|
— |
|
|
|
1.3 |
|
|
|
— |
|
|
|
— |
|
|
|
— |
|
|
|
1.3 |
|
|
|
— |
|
|
Changes in defined benefit pension and other post-retirement benefit plans, net of tax of $4.4 |
|
|
— |
|
|
|
— |
|
|
|
— |
|
|
|
— |
|
|
|
— |
|
|
|
— |
|
|
|
— |
|
|
|
(6.2 |
) |
|
|
— |
|
|
|
— |
|
|
|
(6.2 |
) |
|
|
— |
|
|
Unrealized loss on available-for-sale investment, net of tax of $0.7 |
|
|
— |
|
|
|
— |
|
|
|
— |
|
|
|
— |
|
|
|
— |
|
|
|
— |
|
|
|
— |
|
|
|
— |
|
|
|
(1.1 |
) |
|
|
— |
|
|
|
(1.1 |
) |
|
|
— |
|
|
Other-than-temporary impairment, net of tax of $1.8 |
|
|
— |
|
|
|
— |
|
|
|
— |
|
|
|
— |
|
|
|
— |
|
|
|
— |
|
|
|
— |
|
|
|
— |
|
|
|
2.9 |
|
|
|
— |
|
|
|
2.9 |
|
|
|
— |
|
|
Stock-based compensation expense |
|
|
33 |
|
|
|
— |
|
|
|
— |
|
|
|
— |
|
|
|
1.4 |
|
|
|
— |
|
|
|
— |
|
|
|
— |
|
|
|
— |
|
|
|
— |
|
|
|
1.4 |
|
|
|
— |
|
|
Issuance of common stock |
|
|
5,000 |
|
|
|
0.1 |
|
|
|
— |
|
|
|
— |
|
|
|
71.4 |
|
|
|
— |
|
|
|
— |
|
|
|
— |
|
|
|
— |
|
|
|
— |
|
|
|
71.5 |
|
|
|
— |
|
|
Contributions from non-controlling interest |
|
|
— |
|
|
|
— |
|
|
|
— |
|
|
|
— |
|
|
|
— |
|
|
|
— |
|
|
|
— |
|
|
|
— |
|
|
|
— |
|
|
|
— |
|
|
|
— |
|
|
|
0.4 |
|
|
Liquidation of investment in foreign entity |
|
|
— |
|
|
|
— |
|
|
|
— |
|
|
|
— |
|
|
|
— |
|
|
|
— |
|
|
|
1.2 |
|
|
|
— |
|
|
|
— |
|
|
|
— |
|
|
|
1.2 |
|
|
|
0.1 |
|
|
Balance at December 31, 2016 |
|
|
37,345 |
|
|
$ |
0.4 |
|
|
|
213 |
|
|
$ |
(6.6 |
) |
|
$ |
375.4 |
|
|
$ |
(112.2 |
) |
|
$ |
(50.2 |
) |
|
$ |
(258.7 |
) |
|
$ |
1.1 |
|
|
$ |
1.5 |
|
|
$ |
(49.3 |
) |
|
$ |
— |
|
See Notes to Consolidated Financial Statements
52
NOTES TO CONSOLIDATED FINANCIAL STATEMENTS
Note 1: Summary of Accounting and Financial Policies
Business Description and Basis of Presentation. Ryerson Holding Corporation (“Ryerson Holding”), a Delaware corporation, is the parent company of Joseph T. Ryerson & Son, Inc. (“JT Ryerson”), a Delaware corporation. On December 17, 2014, Ryerson Inc., formerly a direct, wholly-owned subsidiary of Ryerson Holding, merged with and into JT Ryerson which was previously an indirect, wholly-owned subsidiary of Ryerson Holding, with JT Ryerson as the surviving corporation. As a result of such merger, from and after December 17, 2014, JT Ryerson has been a direct, wholly-owned subsidiary of Ryerson Holding. Affiliates of Platinum Equity, LLC (“Platinum”) own approximately 21,037,500 shares of our common stock, which is approximately 57% of our issued and outstanding common stock. We are a leading distributor and value-added processor of industrial metals, with operations in the United States through JT Ryerson, in Canada through its indirect wholly-owned subsidiary Ryerson Canada, Inc., a Canadian corporation (“Ryerson Canada”) and in Mexico through our indirect wholly-owned subsidiary Ryerson Metals de Mexico, S. de R.L. de C.V., a Mexican corporation (“Ryerson Mexico”). In addition to our North American operations, we conduct materials distribution operations in China through an indirect wholly-owned subsidiary, Ryerson China Limited (“Ryerson China”). Unless the context indicates otherwise, Ryerson Holding, JT Ryerson, Ryerson Canada, Ryerson China, and Ryerson Mexico together with their subsidiaries (including Ryerson Inc. prior to its dissolution through merger), are collectively referred to herein as “Ryerson,” “we,” “us,” “our,” or the “Company.”
Principles of Consolidation. The Company consolidates entities in which it owns or controls more than 50% of the voting shares. All significant intercompany balances and transactions have been eliminated in consolidation.
Business Segments. Financial Accounting Standards Board (“FASB”) Accounting Standards Codification (“ASC”) 280, “Segment Reporting” (“ASC 280”), establishes standards for reporting information on operating segments in interim and annual financial statements. Our Chief Executive Officer, together with our Board of Directors, serve as our Chief Operating Decision Maker (“CODM”). Our CODM reviews our financial information for purposes of making operational decisions and assessing financial performance. The CODM views our business globally as metals service centers. We have one operating and reportable segment, metal service centers, in accordance with the criteria set forth in ASC 280.
Use of Estimates. The preparation of financial statements in conformity with Generally Accepted Accounting Principles (“GAAP”) in the United States requires management to make estimates and assumptions that affect the amounts reported in the consolidated financial statements and related notes to the financial statements. Changes in such estimates may affect amounts reported in future periods.
Reclassifications. Certain amounts in the 2015 and 2014 financial statements, as previously reported, have been revised to conform to the 2016 presentation. These changes did not have a material impact on the presentation of the consolidated financial statements.
Equity Investments. Investments in affiliates in which the Company’s ownership is 20% to 50% are accounted for by the equity method. Equity income is reported in “Other income and (expense), net” in the Consolidated Statements of Operations. Equity income during the years ended December 31, 2016, 2015 and 2014 totaled $0.2 million, $0.2 million, and $0.3 million, respectively.
Revenue Recognition. Revenue is recognized in accordance with FASB ASC 605, “Revenue Recognition.” Revenue is recognized upon delivery of product to customers. Revenue is recorded net of returns, allowances, customer discounts and incentives. Sales taxes collected from customers and remitted to governmental authorities are accounted for on a net (excluded from revenues) basis.
Provision for allowances, claims and doubtful accounts. We perform ongoing credit evaluations of customers and set credit limits based upon review of the customers’ current credit information and payment history. The Company monitors customer payments and maintains a provision for estimated credit losses based on historical experience and specific customer collection issues that the Company has identified. Estimation of such losses requires adjusting historical loss experience for current economic conditions and judgments about the probable effects of economic conditions on certain customers. The Company cannot guarantee that the rate of future credit losses will be similar to past experience. Provisions for allowances and claims are based upon historical rates, expected trends and estimates of potential returns, allowances, customer discounts and incentives. The Company considers all available information when assessing the adequacy of the provision for allowances, claims and doubtful accounts.
Shipping and Handling Fees and Costs. Shipping and handling fees billed to customers are classified in “Net Sales” in our Consolidated Statement of Operations. Shipping and handling costs, primarily distribution costs, are classified in “Warehousing,
53
delivery, selling, general and administrative” expenses in our Consolidated Statement of Operations. These costs totaled $76.4 million, $77.8 million and $84.5 million for the years ended December 31, 2016, 2015 and 2014, respectively.
Benefits for Retired Employees. The Company recognizes the funded status of its defined benefit pension and other postretirement plans in the Consolidated Balance Sheets, with changes in the funded status recognized through accumulated other comprehensive income (loss), net of tax, in the year in which the changes occur. The estimated cost of the Company’s defined benefit pension plan and its postretirement medical benefits are determined annually after considering information provided by consulting actuaries. Key factors used in developing estimates of these liabilities include assumptions related to discount rates, rates of return on investments, future compensation costs, healthcare cost trends, benefit payment patterns and other factors. The cost of these benefits for retirees is accrued during their term of employment. Pensions are funded primarily in accordance with the requirements of the Employee Retirement Income Security Act (“ERISA”) of 1974 and the Pension Protection Act of 2006 into a trust established for the Ryerson Pension Plan. Costs for retired employee medical benefits are funded when claims are submitted. Certain salaried employees are covered by a defined contribution plan, for which the cost is expensed in the period earned.
Cash Equivalents. Cash equivalents reflected in the financial statements are highly liquid, short-term investments with original maturities of three months or less. Checks issued in excess of funds on deposit at the bank represent “book” overdrafts. We reclassified $69.2 million and $65.7 million to accounts payable at December 31, 2016 and 2015, respectively.
Inventory Valuation. Inventories are stated at the lower of cost or market value. We use the last-in, first-out (“LIFO”) method for valuing our domestic inventories. We use the weighted-average cost and the specific cost methods for valuing our foreign inventories.
Property, Plant and Equipment. Property, plant and equipment, including land use rights, are depreciated for financial reporting purposes using the straight-line method over the estimated useful lives of the assets. The provision for depreciation in all periods presented is based on the following estimated useful lives of the assets:
|
Land improvements |
|
20 years |
|
Buildings |
|
45 years |
|
Machinery and equipment |
|
10-15 years |
|
Furniture and fixtures |
|
10 years |
|
Transportation equipment |
|
3-6 years |
|
Land use rights |
|
50 years |
Expenditures for normal repairs and maintenance are charged against income in the period incurred.
Goodwill. In accordance with FASB ASC 350, “Intangibles – Goodwill and Other” (“ASC 350”), goodwill is reviewed at least annually for impairment or whenever indicators of potential impairment exist. We test for impairment of goodwill by assessing various qualitative factors with respect to developments in our business and the overall economy and calculating the fair value of a reporting unit using the discounted cash flow method, as necessary. If we determine that it is more likely than not that the fair value of a reporting unit is less than the carrying value based on our qualitative assessment, we will proceed to the two-step goodwill impairment test. In step one, we compare the fair value of the reporting unit in which goodwill resides to its carrying value. If the carrying amount exceeds the fair value, the second step of the goodwill impairment test is performed to measure the amount of the impairment loss, if any. In the second step, the implied fair value of the goodwill is estimated as the fair value of the reporting unit used in the first step less the fair value of all other net tangible and intangible assets of the reporting unit. If the carrying amount of goodwill exceeds its implied fair value, an impairment loss is recognized in an amount equal to that excess, not to exceed the carrying amount of the goodwill. The fair value of the reporting units are estimated using a combination of an income approach and a market approach as this combination is deemed to be the most indicative of fair value in an orderly transaction between market participants.
Long-lived Assets and Other Intangible Assets. Long-lived assets held and used by the Company are reviewed for impairment whenever events or changes in circumstances indicate that the carrying amount of an asset may not be recoverable. The Company estimates the future cash flows expected to result from the use of the asset and its eventual disposition. If the sum of the expected future cash flows (undiscounted and without interest charges) is less than the carrying amount of the asset, an impairment is recognized. Any related impairment loss is calculated based upon comparison of the fair value to the carrying value of the asset. Separate intangible assets that have finite useful lives are amortized over their useful lives. An impaired intangible asset would be written down to fair value, using the discounted cash flow method.
54
Deferred Financing Costs. Deferred financing costs associated with the issuance of debt are being amortized using the effective interest method over the life of the debt. Deferred financing costs related to a recognized debt liability are presented in the balance sheet as a direct deduction from the carrying amount of the related debt liability.
Income Taxes. Deferred tax assets or liabilities reflect temporary differences between amounts of assets and liabilities for financial and tax reporting. Such amounts are adjusted, as appropriate, to reflect changes in enacted tax rates expected to be in effect when the temporary differences reverse. A valuation allowance is established to offset any deferred tax assets if, based upon the available evidence, it is more likely than not that some or all of the deferred tax assets will not be realized. The determination of the amount of a valuation allowance to be provided on recorded deferred tax assets involves estimates regarding (1) the timing and amount of the reversal of taxable temporary differences, (2) expected future taxable income, (3) the impact of tax planning strategies and (4) the ability to carry back tax losses to offset prior taxable income. In assessing the need for a valuation allowance, the Company considers all available positive and negative evidence, including past operating results, projections of future taxable income and the feasibility of ongoing tax planning strategies. The projections of future taxable income include a number of estimates and assumptions regarding volume, pricing, costs and industry cyclicality.
Significant judgment is required in determining income tax provisions and in evaluating tax positions. In the normal course of business, the Company and its subsidiaries are examined by various federal, state and foreign tax authorities. The Company records the impact of a tax position, if that position is more likely than not to be sustained on audit, based on the technical merits of the position. The Company regularly assesses the potential outcomes of these examinations and any future examinations for the current or prior years in determining the adequacy of our provision for income taxes. The Company continually assesses the likelihood and amount of potential adjustments and adjusts the income tax provision, the current tax liability and deferred taxes in the period in which the facts that give rise to a revision become known.
The Company recognizes the benefit of tax positions when a benefit is more likely than not (i.e., greater than 50% likely) to be sustained on its technical merits. Recognized tax benefits are measured at the largest amount that is more likely than not to be sustained, based on cumulative probability, in final settlement of the position. The Company recognizes interest and penalties related to unrecognized tax benefits as a component of income tax expense.
Earnings Per Share Data. Basic earnings (loss) per share (“EPS”) is computed by dividing net earnings (loss) available to common stockholders by the weighted average number of common shares outstanding for the period. Diluted earnings (loss) per share is computed by giving effect to all dilutive potential common shares that were outstanding during the period. Basic earnings (loss) per share excludes the dilutive effect of common stock equivalents such as stock options and warrants, while diluted earnings (loss) per share, assuming dilution, includes such dilutive effects.
Foreign Currency. The Company translates assets and liabilities of its foreign subsidiaries, where the functional currency is the local currency, into U.S. dollars at the current rate of exchange on the last day of the reporting period. Revenues and expenses are translated at the average monthly exchange rates prevailing during the year.
For foreign currency transactions, the Company translates these amounts to the Company’s functional currency at the exchange rate effective on the invoice date. If the exchange rate changes between the time of purchase and the time actual payment is made, a foreign exchange transaction gain or loss results which is included in determining net income (loss) for the year. The Company recognized $4.0 million, $3.3 million, and $5.3 million of exchange gains for the years ended December 31, 2016, 2015 and 2014, respectively. These amounts are primarily classified in “Other income and (expense), net” in our Consolidated Statements of Operations.
Recent Accounting Pronouncements
Impact of Recently Issued Accounting Standard–Adopted
In August 2014, the FASB issued ASU 2014-15, “Presentation of Financial Statements – Going Concern (Subtopic 205-40), Disclosure of Uncertainties about an Entity’s Ability to Continue as a Going Concern.” The guidance in ASU 2014-15 sets forth management’s responsibility to evaluate whether there is substantial doubt about an entity’s ability to continue as a going concern as well as required disclosures. ASU 2014-15 indicates that, when preparing financial statements for interim and annual periods, management should evaluate whether conditions or events, in the aggregate, raise substantial doubt about the entity’s ability to continue as a going concern one year from the date the financial statements are issued or are available to be issued. This evaluation should include consideration of conditions and events that are either known or are reasonably knowable at the date the financial statements are issued or are available to be issued, as well as whether it is probable that management’s plans to address the substantial doubt will be implemented and, if so, whether it is probable that the plans will alleviate the substantial doubt. ASU 2014-15 is
55
effective for annual periods ending after December 15, 2016, and interim periods and annual periods thereafter. Early adoption is permitted. We adopted this guidance for our fiscal year ending December 31, 2016. The adoption of this guidance did not have an impact on our consolidated financial statements.
In April 2015, the FASB issued Accounting Standards Update (“ASU”) 2015-03, “Interest - Imputation of Interest (Subtopic 835-30): Simplifying the Presentation of Debt Issuance Costs.” The update requires debt issuance costs related to a recognized debt liability to be presented in the balance sheet as a direct deduction from the carrying amount of the related debt liability instead of being presented as an asset. Debt disclosures will include the face amount of the debt liability and the effective interest rate. The update is effective for fiscal years beginning after December 15, 2015 and represents a change in accounting principle. In addition, this update requires retrospective application, which resulted in the reclassification of $11 million of capitalized debt issuance costs from deferred charges and other assets to long-term debt at December 31, 2015.
In April 2015, the FASB issued ASU 2015-05, “Intangibles - Goodwill and Other - Internal-Use Software (Subtopic 350-40): Customer’s Accounting for Fees Paid in a Cloud Computing Arrangement.” The amendments in this update provide guidance to customers about whether a cloud computing arrangement includes a software license. If a cloud computing arrangement includes a software license, the update specifies that the customer should account for the software license element of the arrangement consistent with the acquisition of other software licenses. The update further specifies that the customer should account for a cloud computing arrangement as a service contract if the arrangement does not include a software license. ASU 2015-05 is effective for annual periods, including interim periods within those annual periods, beginning after December 15, 2015. We adopted this guidance for our fiscal year beginning January 1, 2016. The adoption of this guidance did not have an impact on our consolidated financial statements.
In September 2015, the FASB issued ASU 2015-16, “Business Combinations: Simplifying the Accounting for Measurement-Period Adjustments.” The amendment eliminates the requirement that an acquirer in a business combination account for measurement-period adjustments retrospectively. Instead the acquirer will recognize a measurement-period adjustment during the period in which it determines the amount of the adjustment. The update is effective for fiscal years beginning after December 15, 2015. We adopted this guidance for our fiscal year beginning January 1, 2016. The adoption of this guidance did not have an impact on our consolidated financial statements on prior acquisitions.
In March 2016, the FASB issued ASU 2016-09, “Compensation – Stock Compensation: Improvements to Employee Share-Based Payment Accounting.” The amendment simplifies several aspects of the accounting for share-based payment transactions, including income tax consequences, classification of awards as either equity or liabilities, and classification on the statement of cash flows. The update is effective for interim and annual periods beginning after December 15, 2016. Early adoption is permitted. We early adopted this guidance as of April 1, 2016. The adoption of this guidance did not have a material impact on our consolidated financial statements.
Impact of Recently Issued Accounting Standards—Not Yet Adopted
In May 2014, the FASB issued ASU 2014-09, “Revenue from Contracts with Customers,” which creates Accounting Standards Codification (“ASC”) 606 “Revenue from Contracts with Customers” and supersedes the revenue recognition requirements in ASC 605 “Revenue Recognition.” The guidance in ASU 2014-09 and subsequently issued amendments (including ASU 2016-08, “Revenue from Contracts with Customers: Principal versus Agent Considerations (Reporting Revenue Gross versus Net)” and ASU 2016-10, “Revenue from Contracts with Customers: Identifying Performance Obligations and Licensing” outlines a comprehensive model for all entities to use in accounting for revenue arising from contracts with customers as well as required disclosures. Entities have the option of using either a full retrospective or modified approach to adopt the new guidance. The new revenue standard is effective for interim reporting periods within annual reporting periods beginning after December 15, 2017. Early adoption is permitted. We have established a project management team to analyze the impact of this standard by reviewing our current accounting policies and practices to identify potential differences that would result from the application of this standard. We anticipate minimal changes are going to be required to our business process, systems and controls to effectively report revenue recognition and disclosures under the new standard. As such, even though we are evaluating the impact of the adoption of the new standard, we do not expect this standard to have a material impact on our consolidated financial statements. We have not yet made a decision with respect to the method of adoption of these accounting changes.
In January 2016, the FASB issued ASU 2016-01, "Financial Instruments – Overall: Recognition and Measurement of Financial Assets and Financial Liabilities." The amendments in ASU 2016-01 change the accounting for non-consolidated equity investments that are not accounted for under the equity method of accounting by requiring changes in fair value to be recognized in net income. Under current guidance, changes in fair value for investments of this nature are recognized in accumulated other comprehensive income as a component of stockholders’ equity. Additionally, ASU 2016-01 simplifies the impairment assessment of equity investments without readily determinable fair values; requires entities to use the exit price when estimating the fair value of financial instruments; and modifies various presentation disclosure requirements for financial instruments. The amendments should be applied
56
by means of a cumulative-effect adjustment to the balance sheet as of the beginning of the fiscal year of adoption. The amendments related to equity securities without readily determinable fair values (including disclosure requirements) should be applied prospectively to equity investments that exist as of the date of adoption. The update is effective for interim and annual reporting periods beginning after December 15, 2017. Early adoption is permitted. We will adopt this guidance for our fiscal year beginning January 1, 2018. We are still assessing the impact of adoption on our consolidated financial statements.
In February 2016, the FASB issued ASU 2016-02, “Leases” codified in ASC 842, “Leases.” The guidance requires that lessees will be required to recognize assets and liabilities on the balance sheet for the rights and obligations created by all leases with terms of more than 12 months. The amendment also will require disclosures designed to give financial statement users information on the amount, timing, and uncertainty of cash flows arising from leases. These disclosures include qualitative and quantitative information. The update is effective for interim and annual reporting periods beginning after December 15, 2018. Entities are required to use a modified retrospective approach for leases that exist or are entered into after the beginning of the earliest comparative period in the financial statements, and have the option to use certain relief. Full retrospective application is prohibited. Early adoption is permitted. We will adopt this guidance for our fiscal year beginning January 1, 2019. We are still assessing the impact of adoption on our consolidated financial statements.
In March 2016, the FASB issued ASU 2016-07, “Investments – Equity Method and Joint Ventures: Simplifying the Transition to the Equity Method of Accounting.” The amendment eliminates the retroactive adjustments to an investment upon it qualifying for the equity method of accounting as a result of an increase in the level of ownership interest or degree of influence by the investor. ASU 2016-07 requires that the equity method investor add the cost of acquiring the additional interest in the investee to the current basis of the investor's previously held interest and adopt the equity method of accounting as of the date the investment qualifies for equity method accounting. The update is effective for interim and annual reporting periods beginning after December 15, 2016. Early adoption is permitted. We will adopt this guidance for our fiscal year beginning January 1, 2017, including interim periods within that reporting period. The adoption of this guidance is not expected to have a material impact on our consolidated financial statements.
In June 2016, the FASB issued ASU 2016-13, “Financial Instruments – Credit Losses: Measurement of Credit Losses on Financial Instruments.” The amendment requires financial assets measured at amortized cost basis to be presented at the net amount expected to be collected, thus eliminating the probable initial recognition threshold and instead reflecting the current estimate of all expected credit losses. The amendment also requires that credit losses relating to available-for-sale debt securities be recorded through an allowance for credit losses rather than a write-down, thus enabling the ability to record reversals of credit losses in current period net income. The update is effective for interim and annual reporting periods beginning after December 15, 2019. An entity will apply the amendment through a cumulative-effect adjustment to retained earnings as of the beginning of the first reporting period in which the guidance is effective (that is, a modified-retrospective approach). A prospective transition approach is required for debt securities for which an other-than-temporary impairment had been recognized before the effective date. The effect of a prospective transition approach is to maintain the same amortized cost basis before and after the effective date of this Update. Early adoption is permitted only for fiscal years beginning after December 15, 2018, including interim periods within those fiscal years. We will adopt this guidance for our fiscal year beginning January 1, 2020. We are still assessing the impact of adoption on our consolidated financial statements.
In August 2016, the FASB issued ASU 2016-15, “Statement of Cash Flows – Classification of Certain Cash Receipts and Certain Cash Payments.” The amendments address the diversity in practice in how certain cash receipts and cash payments are presented and classified in the statement of cash flows. The update is effective for interim and annual reporting periods beginning after December 15, 2017. The amendments should be applied using a retrospective transition method to each period presented. If it is impracticable to apply the amendments retrospectively for some of the issues, the amendments for those issues would be applied prospectively as of the earliest date practicable. Early adoption is permitted. We will adopt this guidance for our fiscal year beginning January 1, 2018. The adoption of this guidance is not expected to have a material impact on our consolidated financial statements.
In October 2016, the FASB issued ASU 2016-16, “Income Taxes – Intra-Entity Transfers of Assets Other Than Inventory.” The amendment requires an entity to recognize the income tax consequences of an intra-entity transfer of an asset other than inventory when the transfer occurs. The update is effective for interim and annual reporting periods beginning after December 15, 2017. The amendments should be applied on a modified retrospective basis through a cumulative-effect adjustment directly to retained earnings as of the beginning of the period of adoption. Early adoption is permitted. We will adopt this guidance for our fiscal year beginning January 1, 2018. We are still assessing the impact of adoption on our consolidated financial statements.
In November 2016, the FASB issued ASU 2016-18 “Statement of Cash Flows – Restricted Cash.” The amendment requires entities to include in their cash and cash-equivalent balances in the statement of cash flows those amounts that are deemed to be restricted cash and restricted cash equivalents. The ASU does not define the terms “restricted cash” and “restricted cash equivalents.” The update is effective for interim and annual reporting periods beginning after December 15, 2017. The amendments should be applied using a retrospective transition method to each period presented. Early adoption is permitted. We will adopt this guidance for
57
our fiscal year beginning January 1, 2018. The adoption of this guidance is not expected to have a material impact on our consolidated financial statements.
In January 2017, the FASB issued ASU 2017-04 “Intangible—Goodwill and Other (Topic 350): Simplifying the Test for Goodwill Impairment.” This amendment eliminates Step 2 from the goodwill impairment test. This amendment also eliminates the requirements for any reporting unit with a zero or negative carrying amount to perform a qualitative assessment and, if it fails that qualitative test, to perform Step 2 of the goodwill impairment test. An entity still has the option to perform the qualitative assessment for a reporting unit to determine if the quantitative impairment test is necessary. This update is effective for interim and annual reporting periods beginning after December 15, 2019. Early adoption is permitted, including adoption in an interim period. The adoption of this guidance is not expected to have a material impact on our consolidated financial statements.
Note 2: Acquisitions
Southern Tool Steel
On August 3, 2015, the Company acquired all of the issued and outstanding capital stock of Southern Tool Steel, Inc. (“Southern Tool”). Southern Tool is a distributor of long products, predominantly processed bars and tool steel, and is based in Chattanooga, TN. The acquisition is not material to our consolidated financial statements.
Fay Industries
On December 31, 2014, the Company acquired all of the issued and outstanding capital stock of Fay Industries, Inc. and the membership interests of Fay Group, Ltd. (collectively, “Fay”). Fay is a distributor of long products, predominantly processed bars, and is based in Strongsville, Ohio. The acquisition is not material to our consolidated financial statements.
Note 3: Restricted Cash
We have cash restricted for purposes of covering letters of credit that can be presented for potential insurance claims, which totaled $1.0 million and $1.1 million as of December 31, 2016 and 2015, respectively. Certain of our derivative agreements require cash deposits until the derivative is settled. The amount of cash held related to derivative agreements was zero and $0.1 million at December 31, 2016 and 2015, respectively.
Note 4: Inventories
Inventories, at stated LIFO value, were classified at December 31, 2016 and 2015 as follows:
|
|
|
At December 31, |
|
|||||
|
|
|
2016 |
|
|
2015 |
|
||
|
|
|
(In millions) |
|
|||||
|
In process and finished products |
|
$ |
563.4 |
|
|
$ |
555.8 |
|
If current cost had been used to value inventories, such inventories would have been $115 million lower and $122 million lower than reported at December 31, 2016 and 2015, respectively. Approximately 90% and 91% of inventories are accounted for under the LIFO method at December 31, 2016 and 2015, respectively. Non-LIFO inventories consist primarily of inventory at our foreign facilities using the weighted-average cost and the specific cost methods. Substantially all of our inventories consist of finished products.
Inventories are stated at the lower of cost or market value. We record amounts required, if any, to reduce the carrying value of inventory to its lower of cost or market as a charge to cost of materials sold. The lower of cost or market reserve totaled $23.9 million and $37.9 million at December 31, 2016 and 2015, respectively.
The Company has consignment inventory at certain customer locations, which totaled $11.1 million and $9.9 million at December 31, 2016 and 2015, respectively.
58
Note 5: Property, Plant and Equipment
Property, plant and equipment consisted of the following at December 31, 2016 and 2015:
|
|
|
At December 31, |
|
|||||
|
|
|
2016 |
|
|
2015 |
|
||
|
|
|
(In millions) |
|
|||||
|
Land and land improvements |
|
$ |
89.1 |
|
|
$ |
90.8 |
|
|
Buildings and leasehold improvements |
|
|
191.2 |
|
|
|
190.8 |
|
|
Machinery, equipment and other |
|
|
361.2 |
|
|
|
349.4 |
|
|
Capital lease assets |
|
|
23.5 |
|
|
|
18.1 |
|
|
Construction in progress |
|
|
3.7 |
|
|
|
5.4 |
|
|
Total |
|
|
668.7 |
|
|
|
654.5 |
|
|
Less: Accumulated depreciation |
|
|
(280.5 |
) |
|
|
(254.2 |
) |
|
Net property, plant and equipment |
|
$ |
388.2 |
|
|
$ |
400.3 |
|
The Company recorded impairment charges related to fixed assets of $0.4 million, $7.5 million and zero for the years ended December 31, 2016, 2015 and 2014, respectively. The $0.4 million of impairment charges recorded in 2016 related to certain assets held for sale in order to recognize the assets at their fair value less cost to sell, in accordance with FASB ASC 360-10-35-43, “Property, Plant and Equipment – Other Presentation Matters.” Of the $7.5 million of impairment charges recorded in 2015, $4.6 million related to certain assets that we determined did not have a recoverable carrying value based on projected undiscounted cash flows and $2.9 million related to certain assets held for sale in order to recognize the assets at their fair value less cost to sell. The Company recognized gains on the sale of assets classified as held for sale of zero, $1.9 million and $1.8 million for the years ended December 31, 2016, 2015 and 2014 respectively. The Company had $3.6 million and $4.2 million of assets held for sale classified within “Prepaid expenses and other current assets” on the Consolidated Balances Sheets as of December 31, 2016 and 2015, respectively.
Note 6: Definite-Lived Intangible Assets
The following summarizes the components of definite-lived intangible assets at December 31, 2016 and 2015:
|
|
|
|
|
|
|
At December 31, 2016 |
|
|
At December 31, 2015 |
|
||||||||||||||||||
|
|
|
Weighted Average Amortizable Life in Years |
|
|
Gross Carrying Amount |
|
|
Accumulated Amortization |
|
|
Net |
|
|
Gross Carrying Amount |
|
|
Accumulated Amortization |
|
|
Net |
|
|||||||
|
|
|
|
|
|
|
(In millions) |
|
|||||||||||||||||||||
|
Amortizable intangible assets |
|
|
|
|
|
|
|
|
|
|
|
|
|
|
|
|
|
|
|
|
|
|
|
|
|
|
|
|
|
Customer relationships |
|
|
12.9 |
|
|
$ |
51.4 |
|
|
$ |
(25.4 |
) |
|
$ |
26.0 |
|
|
$ |
51.4 |
|
|
$ |
(21.4 |
) |
|
$ |
30.0 |
|
|
Developed technology / product know-how |
|
|
5.0 |
|
|
|
1.9 |
|
|
|
(1.9 |
) |
|
|
— |
|
|
|
1.9 |
|
|
|
(1.9 |
) |
|
|
— |
|
|
Non-compete agreements |
|
|
6.3 |
|
|
|
0.5 |
|
|
|
(0.3 |
) |
|
|
0.2 |
|
|
|
0.5 |
|
|
|
(0.2 |
) |
|
|
0.3 |
|
|
Trademarks |
|
|
17.3 |
|
|
|
21.8 |
|
|
|
(7.3 |
) |
|
|
14.5 |
|
|
|
21.8 |
|
|
|
(6.1 |
) |
|
|
15.7 |
|
|
Licenses |
|
|
7.0 |
|
|
|
0.5 |
|
|
|
(0.4 |
) |
|
|
0.1 |
|
|
|
0.5 |
|
|
|
(0.3 |
) |
|
|
0.2 |
|
|
Total definite-lived intangible assets |
|
|
|
|
|
$ |
76.1 |
|
|
$ |
(35.3 |
) |
|
$ |
40.8 |
|
|
$ |
76.1 |
|
|
$ |
(29.9 |
) |
|
$ |
46.2 |
|
Amortization expense related to intangible assets for the years ended December 31, 2016, 2015 and 2014 was $5.4 million, $6.3 million and $5.8 million, respectively. Included within the $6.3 million of amortization expense in 2015 is $0.2 million of impairment charges the Company recorded in accordance with FASB ASC 360-10, “Impairment and Disposal of Long-Lived Assets,” as the carrying amount of certain intangible assets was not recoverable and the carrying amount exceeded fair value.
59
Estimated amortization expense related to intangible assets at December 31, 2016, for each of the years in the five year period ending December 31, 2021 and thereafter is as follows:
|
|
|
Estimated Amortization Expense |
|
|
|
|
|
(In millions) |
|
|
|
For the year ended December 31, 2017 |
|
$ |
5.1 |
|
|
For the year ended December 31, 2018 |
|
|
4.9 |
|
|
For the year ended December 31, 2019 |
|
|
4.7 |
|
|
For the year ended December 31, 2020 |
|
|
4.4 |
|
|
For the year ended December 31, 2021 |
|
|
3.5 |
|
|
For the years ended thereafter |
|
|
18.2 |
|
Note 7: Goodwill
The following is a summary of changes in the carrying amount of goodwill for the years ended December 31, 2016 and 2015:
|
|
|
Cost |
|
|
Accumulated Impairment |
|
|
Carrying Amount |
|
|||
|
|
|
|
|
|
|
(In millions) |
|
|
|
|
|
|
|
Balance at January 1, 2015 |
|
$ |
111.0 |
|
|
$ |
(8.3 |
) |
|
$ |
102.7 |
|
|
Acquisitions |
|
|
1.8 |
|
|
|
— |
|
|
$ |
1.8 |
|
|
Changes in purchase price allocation |
|
|
(1.3 |
) |
|
|
— |
|
|
$ |
(1.3 |
) |
|
Balance at December 31, 2015 |
|
$ |
111.5 |
|
|
$ |
(8.3 |
) |
|
$ |
103.2 |
|
|
Acquisitions |
|
|
— |
|
|
|
— |
|
|
|
— |
|
|
Balance at December 31, 2016 |
|
$ |
111.5 |
|
|
$ |
(8.3 |
) |
|
$ |
103.2 |
|
In 2015, the Company recognized $1.8 million of goodwill related to the Southern Tool acquisition, which will be deductible for income tax purposes. In 2015, the Company made $1.3 million of adjustments related to the Fay acquisition.
Pursuant to ASC 350, “Intangibles – Goodwill and Other,” we review the recoverability of goodwill annually as of October 1 or whenever significant events or changes occur which might impair the recovery of recorded amounts. Based on our October 1, 2016 annual goodwill impairment test, we determined there was no goodwill impairment in 2016.
60
Note 8: Restructuring and Other Charges
The following summarizes restructuring accrual activity for the years ended December 31, 2016, 2015 and 2014:
|
|
|
Employee Related Costs |
|
|
Tenancy and Other Costs |
|
|
Total Restructuring Costs |
|
|||
|
|
|
(In millions) |
|
|||||||||
|
Balance at January 1, 2014 |
|
$ |
0.1 |
|
|
$ |
1.6 |
|
|
$ |
1.7 |
|
|
Reduction to reserve |
|
|
— |
|
|
|
(0.1 |
) |
|
|
(0.1 |
) |
|
Cash payments |
|
|
(0.1 |
) |
|
|
(0.7 |
) |
|
|
(0.8 |
) |
|
Changes due to foreign currency translations |
|
|
— |
|
|
|
(0.1 |
) |
|
|
(0.1 |
) |
|
Balance at December 31, 2014 |
|
$ |
— |
|
|
$ |
0.7 |
|
|
$ |
0.7 |
|
|
Restructuring charges |
|
|
2.2 |
|
|
|
0.3 |
|
|
|
2.5 |
|
|
Cash payments |
|
|
(0.8 |
) |
|
|
(0.4 |
) |
|
|
(1.2 |
) |
|
Adjustments for pension and other post-retirement termination non-cash charges |
|
|
(0.2 |
) |
|
|
— |
|
|
|
(0.2 |
) |
|
Changes due to foreign currency translations |
|
|
— |
|
|
|
(0.1 |
) |
|
|
(0.1 |
) |
|
Balance at December 31, 2015 |
|
$ |
1.2 |
|
|
$ |
0.5 |
|
|
$ |
1.7 |
|
|
Restructuring charges |
|
|
— |
|
|
|
1.0 |
|
|
|
1.0 |
|
|
Cash payments |
|
|
(0.7 |
) |
|
|
(0.5 |
) |
|
|
(1.2 |
) |
|
Reclassification |
|
|
— |
|
|
|
0.2 |
|
|
|
0.2 |
|
|
(Reduction)/addition to reserve |
|
|
(0.3 |
) |
|
|
0.1 |
|
|
|
(0.2 |
) |
|
Balance at December 31, 2016 |
|
$ |
0.2 |
|
|
$ |
1.3 |
|
|
$ |
1.5 |
|
2016
In 2016, the Company recorded a charge of $1.0 million related to a facility closure, which consists of tenancy-related costs, primarily future lease payments. The Company paid $0.2 million in costs related to this facility closure and reclassified an existing $0.2 million liability for future lease payments at this facility to the restructuring reserve. The Company also paid $0.3 million in costs related to a facility closed in 2013 and recorded an additional $0.1 million to the reserve for tenancy-related costs, which was charged to warehousing, delivery, selling, general and administrative expense in the Consolidated Statements of Operations. The remaining $1.3 million of tenancy-related costs are expected to be paid through 2025.
During 2016, the Company paid $0.7 million in employee-related costs related to restructuring actions taken in the fourth quarter of 2015. The Company also recorded a $0.3 million reduction to the reserve for employee-related costs and credited warehousing, delivery, selling, general and administrative expense in the Consolidated Statements of Operations. The remaining $0.2 million of employee-related costs are expected to be paid in 2017.
2015
In 2015, the Company recorded a charge of $2.2 million for employee costs related to expense reduction actions taken in the fourth quarter of 2015. The charge consists primarily of severance costs for 140 employees in addition to $0.2 million of non-cash pensions and other post-retirement benefit costs. During 2015, the Company paid $0.8 million in costs related to this expense reduction initiative.
In 2015, the Company also recorded a $0.3 million charge to increase the reserve for tenancy-related costs for a facility closed in 2013. During 2015, the Company paid $0.4 million in tenancy costs related to this facility.
2014
In 2014, the Company paid $0.7 million in tenancy costs related to a facility closed in 2013. In 2014, the Company also recorded a $0.1 million reduction to the reserve for tenancy-related costs and credited warehousing, delivery, selling, general and administrative expense in the Consolidated Statements of Operations. During 2014, the Company also paid the remaining $0.1 million of employee costs related to the closure of this facility.
61
Note 9: Debt
Long-term debt consisted of the following at December 31, 2016 and 2015:
|
|
|
At December 31, |
|
|||||
|
|
|
2016 |
|
|
2015 |
|
||
|
|
|
(In millions) |
|
|||||
|
Ryerson Credit Facility |
|
$ |
312.0 |
|
|
$ |
272.2 |
|
|
9% Senior Secured Notes due 2017 |
|
|
— |
|
|
|
569.9 |
|
|
11.25% Senior Notes due 2018 |
|
|
— |
|
|
|
170.4 |
|
|
11 % Senior Secured Notes due 2022 |
|
|
650.0 |
|
|
|
— |
|
|
Foreign debt |
|
|
19.2 |
|
|
|
22.0 |
|
|
Unamortized debt issuance costs and discounts |
|
|
(17.7 |
) |
|
|
(11.0 |
) |
|
Total debt |
|
|
963.5 |
|
|
|
1,023.5 |
|
|
Less: |
|
|
|
|
|
|
|
|
|
Short-term foreign debt |
|
|
19.2 |
|
|
|
22.0 |
|
|
Total long-term debt |
|
$ |
944.3 |
|
|
$ |
1,001.5 |
|
The principal payments required to be made on debt during the next five fiscal years are shown below:
|
|
|
Amount |
|
|
|
|
|
(In millions) |
|
|
|
For the year ended December 31, 2017 |
|
$ |
19.2 |
|
|
For the year ended December 31, 2018 |
|
|
— |
|
|
For the year ended December 31, 2019 |
|
|
— |
|
|
For the year ended December 31, 2020 |
|
|
— |
|
|
For the year ended December 31, 2021 |
|
|
312.0 |
|
|
For the years ended thereafter |
|
|
650.0 |
|
Ryerson Credit Facility
On November 16, 2016, Ryerson entered into an amendment with respect to its $1.0 billion revolving credit facility agreement (as amended, the “Ryerson Credit Facility”), to reduce the total facility size from $1.0 billion (the “Old Credit Facility”) to $750 million, reduce the interest rate on outstanding borrowings by 25 basis points, reduce commitment fees on amounts not borrowed by 2.5 basis points, and to extend the maturity date to November 16, 2021.
At December 31, 2016, Ryerson had $312.0 million of outstanding borrowings, $16 million of letters of credit issued and $225 million available under the Ryerson Credit Facility compared to $272.2 million of outstanding borrowings, $17 million of letters of credit issued and $185 million available at December 31, 2015 under the Old Credit Facility. Total credit availability is limited by the amount of eligible accounts receivable, inventory, and qualified cash pledged as collateral under the agreement insofar as Ryerson is subject to a borrowing base comprised of the aggregate of these three amounts, less applicable reserves. Eligible accounts receivable, at any date of determination, is comprised of the aggregate value of all accounts directly created by a borrower (and in the case of Canadian accounts, a Canadian guarantor) in the ordinary course of business arising out of the sale of goods or the rendering of services, each of which has been invoiced, with such receivables adjusted to exclude various ineligible accounts, including, among other things, those to which a borrower (or guarantor, as applicable) does not have sole and absolute title and accounts arising out of a sale to an employee, officer, director, or affiliate of a borrower (or guarantor, as applicable). Eligible inventory, at any date of determination, is comprised of the aggregate value of all inventory owned by a borrower (and in the case of Canadian accounts, a Canadian guarantor), with such inventory adjusted to exclude various ineligible inventory, including, among other things, (i) any inventory that is classified as “supplies” or is unsaleable in the ordinary course of business, (ii) 50% of the value of any inventory that (A) has not been sold or processed within a 180 day period and (B) which is calculated to have more than 365 days of supply based upon the immediately preceding 6 months consumption, and (iii) 50% of the value of inventory classified as partial inventory pieces on the basis that the inventory has been cut below sales lengths customary for such inventory. Qualified cash consists of cash in an eligible deposit account that is subject to customary restrictions and liens in favor of the lenders. The weighted average interest rate on the borrowings under the Ryerson Credit Facility was 2.2 percent and 2.1 percent at December 31, 2016 and 2015, respectively.
62
The Ryerson Credit Facility has an allocation of $660 million to the Company’s subsidiaries in the United States and an allocation of $90 million to Ryerson Holding’s Canadian subsidiary that is a borrower. Amounts outstanding under the Ryerson Credit Facility bear interest at (i) a rate determined by reference to (A) the base rate (the highest of the Federal Funds Rate plus 0.50%, Bank of America, N.A.’s prime rate and the one-month LIBOR rate plus 1.00%) or (B) a LIBOR rate or, (ii) for Ryerson Holding’s Canadian subsidiary that is a borrower, (A) a rate determined by reference to the Canadian base rate (the greatest of the Federal Funds Rate plus 0.50%, Bank of America-Canada Branch’s “base rate” for commercial loans in U.S. Dollars made at its “base rate” and the 30 day LIBOR rate plus 1.00%), (B) the prime rate (the greater of Bank of America-Canada Branch’s “prime rate” for commercial loans made by it in Canada in Canadian Dollars and the one-month Canadian bankers’ acceptance rate plus 1.00%) or (C) the bankers’ acceptance rate. The spread over the base rate and prime rate is between 0.25% and 0.50% and the spread over the LIBOR and for the bankers’ acceptances is between 1.25% and 1.50%, depending on the amount available to be borrowed under the Ryerson Credit Facility. Overdue amounts and all amounts owed during the existence of a default bear interest at 2% above the rate otherwise applicable thereto. Ryerson also pays commitment fees on amounts not borrowed at a rate of 0.23%.
Borrowings under the Ryerson Credit Facility are secured by first-priority liens on all of the inventory, accounts receivables, lockbox accounts and related assets of the borrowers and the guarantors.
The Ryerson Credit Facility also contains covenants that, among other things, restrict Ryerson Holding and its restricted subsidiaries with respect to the incurrence of debt, the creation of liens, transactions with affiliates, mergers and consolidations, sales of assets and acquisitions. The Ryerson Credit Facility also requires that, if availability under the Ryerson Credit Facility declines to a certain level, Ryerson maintain a minimum fixed charge coverage ratio as of the end of each fiscal quarter, and includes defaults upon (among other things) the occurrence of a change of control of Ryerson and a cross-default to other financing arrangements.
The Ryerson Credit Facility contains events of default with respect to, among other things, default in the payment of principal when due or the payment of interest, fees and other amounts due thereunder after a specified grace period, material misrepresentations, failure to perform certain specified covenants, certain bankruptcy events, the invalidity of certain security agreements or guarantees, material judgments and the occurrence of a change of control of Ryerson. If such an event of default occurs, the lenders under the Ryerson Credit Facility will be entitled to various remedies, including acceleration of amounts outstanding under the Ryerson Credit Facility and all other actions permitted to be taken by secured creditors.
The lenders under the Ryerson Credit Facility have the ability to reject a borrowing request if any event, circumstance or development has occurred that has had or could reasonably be expected to have a material adverse effect on the Company. If Ryerson Holding, JT Ryerson, any of the other borrowers or any restricted subsidiaries of JT Ryerson becomes insolvent or commences bankruptcy proceedings, all amounts borrowed under the Ryerson Credit Facility will become immediately due and payable.
Proceeds from borrowings under the Ryerson Credit Facility and repayments of borrowings thereunder that are reflected in the Consolidated Statements of Cash Flows represent borrowings under the Company’s revolving credit agreement with original maturities greater than three months. Net proceeds (repayments) under the Ryerson Credit Facility represent borrowings under the Ryerson Credit Facility with original maturities less than three months.
2017, 2018 and 2022 Notes
On May 24, 2016, JT Ryerson issued $650 million in aggregate principal amount of the 2022 Notes (the “2022 Notes”). The 2022 Notes bear interest at a rate of 11.00% per annum. The 2022 Notes are fully and unconditionally guaranteed on a senior secured basis by all of our existing and future domestic subsidiaries that are co-borrowers or that have guarantee obligations under the Ryerson Credit Facility.
The net proceeds from the issuance of the 2022 Notes, along with borrowings under the Ryerson Credit Facility, was used to (i) repurchase and/or redeem in full the $569.9 million balance of JT Ryerson’s 9.00% Senior Secured Notes due 2017 (the “2017 Notes”), plus accrued and unpaid interest thereon up to, but not including, the repayment date, (ii) repurchase $95.0 million of JT Ryerson’s 11.00% Senior Secured Notes due 2018 (the “2018 Notes”), and (iii) pay related fees, expenses and premiums.
The Company applied the provisions of ASC 470-50, “Modifications and Extinguishments” in accounting for the issuance of the 2022 Notes, redemption of the 2017 Notes and partial repurchase of the 2018 Notes. The evaluation of the accounting under ASC 470-50 was performed on a creditor by creditor basis in order to determine if the terms of the debt were substantially different and, as a result, whether to apply modification or extinguishment accounting. For the lenders where it was determined that the terms of the debt were not substantially different, modification accounting was applied. For the remaining lenders, extinguishment accounting was applied. In connection with this debt modification and extinguishment, the Company recorded a $16.1 million loss within other income and (expense), net on the Consolidated Statement of Operations during 2016, primarily attributed to the costs incurred with third parties for arrangement fees, legal and other services related to the modified debt, as well as redemption fees paid to the creditors and unamortized debt issuance costs written off related to the extinguished debt. Additionally, the costs incurred with third parties for
63
arrangement fees, legal and other services related to the extinguished debt and redemption fees paid to the creditors related to the modified debt were capitalized and are being amortized over the life of the modified debt using the effective interest method.
The 2022 Notes and the related guarantees are secured by a first-priority security interest in substantially all of JT Ryerson’s and each guarantor’s present and future assets located in the United States (other than receivables, inventory, money, deposit accounts and related general intangibles, certain other assets and proceeds thereof), subject to certain exceptions and customary permitted liens. The 2022 Notes and the related guarantees are also secured on a second-priority basis by a lien on the assets that secure JT Ryerson’s and the Company’s obligations under the Ryerson Credit Facility.
The 2022 Notes will be redeemable, in whole or in part, at any time on or after May 15, 2019 at certain redemption prices. The redemption price for the 2022 Notes if redeemed during the twelve months beginning (i) May 15, 2019 is 105.50%, (ii) May 15, 2020 is 102.75%, and (iii) May 15, 2021 and thereafter is 100.00%. JT Ryerson may redeem some or all of the 2022 Notes before May 15, 2019 at a redemption price of 100.00% of the principal amount, plus accrued and unpaid interest, if any, to the redemption date, plus a “make-whole” premium. In addition, JT Ryerson may redeem up to 35% of the 2022 Notes before May 15, 2019 with respect to the 2022 Notes with the net cash proceeds from certain equity offerings at a price equal to 111.00%, with respect to the 2022 Notes, of the principal amount thereof, plus any accrued and unpaid interest, if any. JT Ryerson may be required to make an offer to purchase the 2022 Notes upon the sale of assets or upon a change of control.
The 2022 Notes contain customary covenants that, among other things, limit, subject to certain exceptions, our ability, and the ability of our restricted subsidiaries, to incur additional indebtedness, pay dividends on our capital stock or repurchase our capital stock, make investments, sell assets, engage in acquisitions, mergers or consolidations or create liens or use assets as security in other transactions. Subject to certain exceptions, JT Ryerson may only pay dividends to Ryerson Holding to the extent of 50% of future net income, once prior losses are offset. As a result of these restrictions, the restricted net assets of consolidated subsidiaries exceed 25 percent of consolidated net assets as of December 31, 2016. Restricted net assets as of December 31, 2016 were $122.5 million.
As of December 31, 2016, zero, zero and $650.0 million of the original outstanding principal amount of the 2017 Notes, 2018 Notes and 2022 Notes remain outstanding, respectively. The Company has repurchased and in the future may repurchase long-term notes in the open market.
During the year 2016, a principal amount of $75.4 million of the 2018 Notes were repurchased for $68.0 million and retired, resulting in the recognition of an $7.4 million gain within other income and (expense), net on the Consolidated Statement of Operations. Including the $16.1 million loss on the redemption of the $569.9 million balance of the 2017 Notes and repurchase of $95.0 million of the 2018 Notes, the Company recognized a total net loss of $8.7 million within other income and (expense), net on the Consolidated Statement of Operations during year 2016.
During the year 2015, a principal amount of $30.1 million of the 2017 Notes were repurchased for $29.4 million and retired, resulting in the recognition of a $0.7 million gain within other income and (expense), net on the Consolidated Statement of Operations. During the year 2015, a principal amount of $30.1 million of the 2018 Notes were repurchased for $30.5 million and retired, resulting in the recognition of a $0.4 million loss within other income and (expense), net on the Consolidated Statement of Operations.
Foreign Debt
At December 31, 2016, Ryerson China’s total foreign borrowings were $19.2 million, which were owed to banks in Asia at a weighted average interest rate of 4.4% per annum and secured by inventory and property, plant and equipment. At December 31, 2015, Ryerson China’s total foreign borrowings were $21.8 million, which were owed to banks in Asia at a weighted average interest rate of 4.3% per annum and secured by inventory and property, plant and equipment. Other foreign borrowings were zero and $0.2 million at December 31, 2016 and December 31, 2015, respectively.
Availability under the Ryerson China’s credit facility was $26 million and $23 million at December 31, 2016 and December 31, 2015, respectively. Letters of credit issued by our foreign subsidiaries totaled $1 million and $2 million at December 31, 2016 and 2015, respectively.
Note 10: Employee Benefits
The Company accounts for its pension and postretirement plans in accordance with FASB ASC 715, “Compensation – Retirement Benefits” (“ASC 715”). In addition to requirements for an employer to recognize in its Consolidated Balance Sheet an asset for a plan’s overfunded status or a liability for a plan’s underfunded status and to recognize changes in the funded status of a defined benefit postretirement plan in the year in which the changes occur, ASC 715 requires an employer to measure a plan’s assets and its obligations that determine its funded status as of the end of the employer’s fiscal year.
64
Prior to January 1, 1998, the Company’s non-contributory defined benefit pension plan covered certain employees, retirees and their beneficiaries. Benefits provided to participants of the plan were based on pay and years of service for salaried employees and years of service and a fixed rate or a rate determined by job grade for all wage employees, including employees under collective bargaining agreements.
Effective January 1, 1998, the Company froze the benefits accrued under its defined benefit pension plan for certain salaried employees and instituted a defined contribution plan. Effective March 31, 2000, benefits for certain salaried employees of J. M. Tull Metals Company and AFCO Metals, subsidiaries that were merged into JT Ryerson, were similarly frozen, with the employees becoming participants in the Company’s defined contribution plan. Salaried employees who vested in their benefits accrued under the defined benefit plan at December 31, 1997 and March 31, 2000, are entitled to those benefits upon retirement. For the years ended December 31, 2016, 2015 and 2014, expense recognized for its defined contribution plans was $6.9 million, $5.9 million and $6.8 million, respectively.
In September 2014, the Company amended the plan design of one of its post-retirement medical plans for a significant number of its U.S. retirees, effectively moving a number of participants from a company-sponsored group plan to a defined contribution plan. We completed a remeasurement of the plan as of the announcement date as a result of the plan amendment. The effect of the plan amendment was a reduction of $5.1 million in the accumulated postretirement benefit obligation.
In the fourth quarter of 2015, we changed the method we use to estimate the service and interest components of net periodic benefit cost for the pension and other postretirement benefits starting in 2016. This change compared to the previous method resulted in a decrease of $8.4 million in the service and interest components for pension cost in 2016. Historically, we estimated these service and interest cost components utilizing a single weighted-average discount rate derived from the yield curve used to measure the benefit obligation at the beginning of the period. We elected to utilize a full yield curve approach in the estimation of these components by applying the specific spot rates along the yield curve used in the determination of the benefit obligation to the relevant projected cash flows. We made this change to provide a more precise measurement of service and interest costs by improving the correlation between projected benefit cash flows to the corresponding spot yield curve rates. This change did not affect the measurement of our total benefit obligations. We accounted for this change as a change in accounting estimate that was inseparable from a change in accounting principle and accordingly accounted for it prospectively.
The Company has other deferred employee benefit plans, including supplemental pension plans, the liability for which totaled $17.0 million and $17.1 million at December 31, 2016 and 2015, respectively.
Summary of Assumptions and Activity
The tables included below provide reconciliations of benefit obligations and fair value of plan assets of the Company plans as well as the funded status and components of net periodic benefit costs for each period related to each plan. The Company uses a December 31 measurement date to determine the pension and other postretirement benefit information. The Company had an additional measurement date of September 9, 2014 for our U.S. other postretirement benefit due to the plan amendment discussed above. The expected rate of return on plan assets is determined based on the market-related value of the assets, recognizing any gains or losses over a four year period. The method we have chosen for amortizing actuarial gains and losses is to recognize amounts in excess of a 10% corridor (10% of the greater of the projected benefit obligation or plan assets) and are amortized over the average expected remaining lifetime of the participants in the pension plan and over the average expected remaining service period for the other postretirement benefits.
The assumptions used to determine benefit obligations at the end of the periods and net periodic benefit costs for the Pension Benefits for U.S. plans were as follows:
|
|
|
Year Ended December 31, |
|
|||||||||
|
|
|
2016 |
|
|
2015 |
|
|
2014 |
|
|||
|
Discount rate for calculating obligations |
|
|
4.14 |
% |
|
|
4.41 |
% |
|
|
4.05 |
% |
|
Discount rate for calculating service cost |
|
|
4.80 |
|
|
|
4.05 |
|
|
|
4.80 |
|
|
Discount rate for calculating interest cost |
|
|
3.55 |
|
|
|
4.05 |
|
|
|
4.80 |
|
|
Expected rate of return on plan assets |
|
|
7.10 |
|
|
|
7.40 |
|
|
|
8.00 |
|
|
Rate of compensation increase – benefit obligations |
|
|
2.70 |
|
|
|
2.80 |
|
|
|
2.80 |
|
|
Rate of compensation increase – net periodic benefit cost |
|
|
2.80 |
|
|
|
2.80 |
|
|
|
2.80 |
|
The expected rate of return on U.S. plan assets is 6.75% for 2017.
65
The assumptions used to determine benefit obligations at the end of the periods and net periodic benefit costs for the Other Postretirement Benefits, primarily health care, for U.S. plans were as follows:
|
|
|
Year Ended December 31, 2016 |
|
|
Year Ended December 31, 2015 |
|
|
September 10 to December 31, 2014 |
|
|
January 1 to September 9, 2014 |
|
||||
|
Discount rate for calculating obligations |
|
|
3.99 |
% |
|
|
4.21 |
% |
|
|
3.80 |
% |
|
N/A |
|
|
|
Discount rate for calculating service cost |
|
|
4.59 |
|
|
|
3.80 |
|
|
|
4.00 |
|
|
|
4.35 |
% |
|
Discount rate for calculating interest cost |
|
|
3.19 |
|
|
|
3.80 |
|
|
|
4.00 |
|
|
|
4.35 |
% |
|
Rate of compensation increase – benefit obligations |
|
|
2.50 |
|
|
|
2.80 |
|
|
|
2.80 |
|
|
N/A |
|
|
|
Rate of compensation increase – net periodic benefit cost |
|
|
2.80 |
|
|
|
2.80 |
|
|
|
2.80 |
|
|
|
2.80 |
|
The assumptions used to determine benefit obligations at the end of the periods and net periodic benefit costs for the Pension Benefits for Canadian plans were as follows:
|
|
|
Year Ended December 31, |
|
|||||||||||||||
|
|
|
2016 |
|
|
2015 |
|
|
2014 |
|
|||||||||
|
|
|
|
|
|
|
|
|
|
|
|
|
|
|
|
|
|
|
|
|
|
|
Salaried |
|
Bargaining |
|
|
Salaried |
|
Bargaining |
|
|
|
|
|
||||
|
Discount rate for calculating obligations |
|
|
3.64% |
|
|
3.71% |
|
|
|
3.70% |
|
|
3.87% |
|
|
|
3.80 |
% |
|
Discount rate for calculating net periodic benefit cost |
|
|
3.70 |
|
|
3.87 |
|
|
|
3.80 |
|
|
3.80 |
|
|
|
4.60 |
|
|
Expected rate of return on plan assets |
|
|
5.75 |
|
|
5.50 |
|
|
|
6.00 |
|
|
5.75 |
|
|
|
6.50 |
|
|
Rate of compensation increase |
|
|
3.25 |
|
|
3.25 |
|
|
|
3.25 |
|
|
3.25 |
|
|
|
3.50 |
|
The expected rate of return on Canadian plan assets for 2017 is 5.50% for the Ryerson Salaried Plan (approximately 78% of total Canadian plan assets) and 5.25% for the Ryerson Bargaining Unit Plan (approximately 22% of total Canadian plan assets).
The assumptions used to determine benefit obligations at the end of the periods and net periodic benefit costs for the Other Postretirement Benefits, primarily healthcare, for Canadian plans were as follows:
|
|
|
Year Ended December 31, |
|
|||||||||
|
|
|
2016 |
|
|
2015 |
|
|
2014 |
|
|||
|
Discount rate for calculating obligations |
|
|
3.54 |
% |
|
|
3.64 |
% |
|
|
3.80 |
% |
|
Discount rate for calculating net periodic benefit cost |
|
|
3.64 |
|
|
|
3.80 |
|
|
|
4.40 |
|
|
Rate of compensation increase |
|
|
3.25 |
|
|
|
3.25 |
|
|
|
3.50 |
|
66
|
|
|
Year Ended December 31, |
|
|||||||||||||
|
|
|
Pension Benefits |
|
|
Other Benefits |
|
||||||||||
|
|
|
2016 |
|
|
2015 |
|
|
2016 |
|
|
2015 |
|
||||
|
|
|
(In millions) |
|
|||||||||||||
|
Change in Benefit Obligation |
|
|
|
|
|
|
|
|
|
|
|
|
|
|
|
|
|
Benefit obligation at beginning of year |
|
$ |
846 |
|
|
$ |
957 |
|
|
$ |
82 |
|
|
$ |
101 |
|
|
Service cost |
|
|
1 |
|
|
|
2 |
|
|
|
— |
|
|
|
— |
|
|
Interest cost |
|
|
29 |
|
|
|
37 |
|
|
|
3 |
|
|
|
4 |
|
|
Plan amendments |
|
|
— |
|
|
|
— |
|
|
|
— |
|
|
|
(3 |
) |
|
Actuarial (gain) loss |
|
|
9 |
|
|
|
(58 |
) |
|
|
(4 |
) |
|
|
(10 |
) |
|
Effect of changes in exchange rates |
|
|
1 |
|
|
|
(7 |
) |
|
|
1 |
|
|
|
(2 |
) |
|
Lump sums paid |
|
|
(28 |
) |
|
|
(29 |
) |
|
|
— |
|
|
|
— |
|
|
Benefits paid (net of participant contributions and Medicare subsidy) |
|
|
(55 |
) |
|
|
(56 |
) |
|
|
(8 |
) |
|
|
(8 |
) |
|
Benefit obligation at end of year |
|
$ |
803 |
|
|
$ |
846 |
|
|
$ |
74 |
|
|
$ |
82 |
|
|
Accumulated benefit obligation at end of year |
|
$ |
801 |
|
|
$ |
843 |
|
|
N/A |
|
|
N/A |
|
||
|
Change in Plan Assets |
|
|
|
|
|
|
|
|
|
|
|
|
|
|
|
|
|
Plan assets at fair value at beginning of year |
|
$ |
608 |
|
|
$ |
680 |
|
|
$ |
— |
|
|
$ |
— |
|
|
Actual return on plan assets |
|
|
39 |
|
|
|
(23 |
) |
|
|
— |
|
|
|
— |
|
|
Employer contributions |
|
|
22 |
|
|
|
43 |
|
|
|
8 |
|
|
|
8 |
|
|
Effect of changes in exchange rates |
|
|
1 |
|
|
|
(7 |
) |
|
|
— |
|
|
|
— |
|
|
Lump sums paid |
|
|
(28 |
) |
|
|
(29 |
) |
|
|
— |
|
|
|
— |
|
|
Benefits paid (net of participant contributions) |
|
|
(55 |
) |
|
|
(56 |
) |
|
|
(8 |
) |
|
|
(8 |
) |
|
Plan assets at fair value at end of year |
|
$ |
587 |
|
|
$ |
608 |
|
|
$ |
— |
|
|
$ |
— |
|
|
Reconciliation of Amount Recognized |
|
|
|
|
|
|
|
|
|
|
|
|
|
|
|
|
|
Funded status |
|
$ |
(216 |
) |
|
$ |
(238 |
) |
|
$ |
(74 |
) |
|
$ |
(82 |
) |
|
Amounts recognized in balance sheet consist of: |
|
|
|
|
|
|
|
|
|
|
|
|
|
|
|
|
|
Current liabilities |
|
$ |
— |
|
|
$ |
— |
|
|
$ |
(7 |
) |
|
$ |
(8 |
) |
|
Non-current liabilities |
|
|
(216 |
) |
|
|
(238 |
) |
|
|
(67 |
) |
|
|
(74 |
) |
|
Net benefit liability at the end of the year |
|
$ |
(216 |
) |
|
$ |
(238 |
) |
|
$ |
(74 |
) |
|
$ |
(82 |
) |
Canadian benefit obligations represented $44 million of the Company’s total Pension Benefits obligations at December 31, 2016 and $43 million at December 31, 2015. Canadian plan assets represented $39 million of the Company’s total plan assets at fair value at December 31, 2016 and $38 million at December 31, 2015. In addition, Canadian benefit obligations represented $11 million of the Company’s total Other Benefits obligation at December 31, 2016 and $12 million at December 31, 2015.
The pension benefit obligation decreased $11 million during the year ended December 31, 2016 due to updated mortality rates based on updated mortality tables released by the Society of Actuaries in 2016 and increased by $26 million due to a decrease in the year over year discount rate. The pension benefit obligation decreased $58 million during the year ended December 31, 2015 due to the increase in the discount rate year over year as well as updated mortality rates based on updated mortality tables released by the Society of Actuaries in 2015.
Amounts recognized in accumulated other comprehensive income (loss) at December 31, 2016 and 2015 consist of the following:
|
|
|
At December 31, |
|
|||||||||||||
|
|
|
Pension Benefits |
|
|
Other Benefits |
|
||||||||||
|
|
|
2016 |
|
|
2015 |
|
|
2016 |
|
|
2015 |
|
||||
|
|
|
(In millions) |
|
|||||||||||||
|
Amounts recognized in accumulated other comprehensive income (loss), pre–tax, consist of |
|
|
|
|
|
|
|
|
|
|
|
|
|
|
|
|
|
Net actuarial loss (gain) |
|
$ |
400 |
|
|
$ |
397 |
|
|
$ |
(64 |
) |
|
$ |
(69 |
) |
|
Prior service cost (credit) |
|
|
1 |
|
|
|
1 |
|
|
|
(12 |
) |
|
|
(15 |
) |
|
Net loss (gain) |
|
$ |
401 |
|
|
$ |
398 |
|
|
$ |
(76 |
) |
|
$ |
(84 |
) |
67
Net actuarial losses of $13.7 million and prior service costs of $0.1 million for pension benefits and net actuarial gains of $7.8 million and prior service credits of $3.1 million for other postretirement benefits are expected to be amortized from accumulated other comprehensive income (loss) into net periodic benefit cost in 2017.
Amounts recognized in other comprehensive income (loss) for the years ended December 31, 2016 and 2015 consist of the following:
|
|
|
Year Ended December 31, |
|
|||||||||||||
|
|
|
Pension Benefits |
|
|
Other Benefits |
|
||||||||||
|
|
|
2016 |
|
|
2015 |
|
|
2016 |
|
|
2015 |
|
||||
|
|
|
(In millions) |
|
|||||||||||||
|
Amounts recognized in other comprehensive income (loss), pre–tax, consist of |
|
|
|
|
|
|
|
|
|
|
|
|
|
|
|
|
|
Net actuarial loss (gain) |
|
$ |
15 |
|
|
$ |
13 |
|
|
$ |
(4 |
) |
|
$ |
(10 |
) |
|
Amortization of net actuarial loss (gain) |
|
|
(13 |
) |
|
|
(14 |
) |
|
|
8 |
|
|
|
8 |
|
|
Prior service credit |
|
|
— |
|
|
|
— |
|
|
|
— |
|
|
|
(3 |
) |
|
Amortization of prior service cost (credit) |
|
|
— |
|
|
|
(1 |
) |
|
|
3 |
|
|
|
2 |
|
|
Net loss (gain) |
|
$ |
2 |
|
|
$ |
(2 |
) |
|
$ |
7 |
|
|
$ |
(3 |
) |
For benefit obligation measurement purposes for U.S. plans at December 31, 2016, the annual rate of increase in the per capita cost of covered health care benefits for participants under 65 was 6.75 percent, grading down to 4.5 percent in 2026, the level at which it is expected to remain. At December 31, 2016, the rate for participants over 65 was 10 percent, grading down to 4.5 percent in 2026, plus a risk adjustment of 0.65 percent grading down to zero percent in 2022, the level at which it is expected to remain. For measurement purposes for U.S. plans at December 31, 2015, the annual rate of increase in the per capita cost of covered health care benefits for participants under 65 was 7.0 percent, grading down to 4.5 percent in 2026, the level at which it is expected to remain. At December 31, 2015, the rate for participants over 65 was 9.0 percent, grading down to 4.5 percent in 2026, plus a risk adjustment of 0.65 percent grading down to zero percent in 2022, the level at which it is expected to remain.
For benefit obligation measurement purposes for Canadian plans at December 31, 2016, the annual rate of increase in the per capita cost of covered health care benefits was 7.5 percent per annum, grading down to 4.5 percent in 2033, the level at which it is expected to remain. For benefit obligation measurement purposes for Canadian plans at December 31, 2015, the annual rate of increase in the per capita cost of covered health care benefits was 8.0 percent per annum, grading down to 4.5 percent in 2033, the level at which it is expected to remain.
The components of the Company’s net periodic benefit cost for the years ended December 31, 2016, 2015 and 2014 are as follows:
|
|
|
Year Ended December 31, |
|
|||||||||||||||||||||
|
|
|
Pension Benefits |
|
|
Other Benefits |
|
||||||||||||||||||
|
|
|
2016 |
|
|
2015 |
|
|
2014 |
|
|
2016 |
|
|
2015 |
|
|
2014 |
|
||||||
|
|
|
(In millions) |
|
|||||||||||||||||||||
|
Components of net periodic benefit cost |
|
|
|
|
|
|
|
|
|
|
|
|
|
|
|
|
|
|
|
|
|
|
|
|
|
Service cost |
|
$ |
1 |
|
|
$ |
2 |
|
|
$ |
2 |
|
|
$ |
— |
|
|
$ |
— |
|
|
$ |
— |
|
|
Interest cost |
|
|
29 |
|
|
|
37 |
|
|
|
39 |
|
|
|
3 |
|
|
|
4 |
|
|
|
5 |
|
|
Expected return on assets |
|
|
(45 |
) |
|
|
(48 |
) |
|
|
(48 |
) |
|
|
— |
|
|
|
— |
|
|
|
— |
|
|
Recognized actuarial loss (gain) |
|
|
13 |
|
|
|
14 |
|
|
|
10 |
|
|
|
(8 |
) |
|
|
(8 |
) |
|
|
(8 |
) |
|
Amortization of prior service credit |
|
|
— |
|
|
|
— |
|
|
|
— |
|
|
|
(3 |
) |
|
|
(2 |
) |
|
|
(2 |
) |
|
Curtailment loss |
|
|
— |
|
|
|
1 |
|
|
|
— |
|
|
|
— |
|
|
|
— |
|
|
|
— |
|
|
Net periodic benefit cost (credit) |
|
$ |
(2 |
) |
|
$ |
6 |
|
|
$ |
3 |
|
|
$ |
(8 |
) |
|
$ |
(6 |
) |
|
$ |
(5 |
) |
The assumed health care cost trend rate has an effect on the amounts reported for the health care plans. For purposes of determining net periodic benefit cost for U.S plans, the annual rate of increase in the per capital cost of covered health care benefits for participants under 65 was 7.0 percent, grading down to 4.5 percent in 2026, the level at which it is expected to remain. The rate for participants over 65 was 9.0 percent, grading down to 4.5 percent in 2026, plus a risk adjustment of 0.65 percent grading down to zero percent in 2022, the level at which it is expected to remain. For purposes of determining net periodic benefit cost for Canadian plans, the annual rate of increase in the per capita cost of covered health care benefits was 7.5 percent per annum, grading down to 4.5 percent in 2033, the level at which it is expected to remain.
68
A one-percentage-point change in the assumed health care cost trend rate would have the following effects:
|
|
|
1% increase |
|
|
1% decrease |
|
||
|
|
|
(In millions) |
|
|||||
|
Effect on service cost plus interest cost |
|
$ |
0.2 |
|
|
$ |
(0.1 |
) |
|
Effect on postretirement benefit obligation |
|
|
3.2 |
|
|
|
(2.9 |
) |
Pension Trust Assets
The expected long-term rate of return on pension trust assets is 5.25% to 6.75% based on the historical investment returns of the trust, the forecasted returns of the asset classes and a survey of comparable pension plan sponsors.
The Company’s pension trust weighted-average asset allocations at December 31, 2016 and 2015, by asset category are as follows:
|
|
|
Trust Assets at December 31, |
|
|||||
|
|
|
2016 |
|
|
2015 |
|
||
|
Equity securities |
|
|
62 |
% |
|
|
62 |
% |
|
Debt securities |
|
|
21 |
|
|
|
21 |
|
|
Real Estate |
|
|
4 |
|
|
|
4 |
|
|
Other |
|
|
13 |
|
|
|
13 |
|
|
Total |
|
|
100 |
% |
|
|
100 |
% |
The Board of Directors of JT Ryerson has general supervisory authority over the Pension Trust Fund and approves the investment policies and plan asset target allocation. An internal management committee provides on-going oversight of plan assets in accordance with the approved policies and asset allocation ranges and has the authority to appoint and dismiss investment managers. The investment policy objectives are to maximize long-term return from a diversified pool of assets while minimizing the risk of large losses, and to maintain adequate liquidity to permit timely payment of all benefits. The policies include diversification requirements and restrictions on concentration in any one single issuer or asset class. The currently approved asset investment classes are cash; fixed income; domestic equities; international equities; real estate; private equities and hedge funds of funds. Company management allocates the plan assets among the approved investment classes and provides appropriate directions to the investment managers pursuant to such allocations.
The approved target ranges and allocations as of the December 31, 2016 measurement date were as follows:
|
|
|
Range |
|
Target |
|
|
|
Equity securities |
|
33-70% |
|
|
63 |
% |
|
Debt securities |
|
15-50 |
|
|
22 |
|
|
Real estate |
|
2-8 |
|
|
7 |
|
|
Other |
|
7-19 |
|
|
8 |
|
|
Total |
|
|
|
|
100 |
% |
69
The fair value of our pension plan assets at December 31, 2016 by asset category are as follows. See Note 15 for the definitions of Level 1, 2, and 3 fair value measurements.
|
|
|
Fair Value Measurements at December 31, 2016 |
|
|||||||||||||
|
Asset Category |
|
Total |
|
|
Level 1 |
|
|
Level 2 |
|
|
Level 3 |
|
||||
|
|
|
(In millions) |
|
|||||||||||||
|
Cash and cash equivalents |
|
$ |
15 |
|
|
$ |
15 |
|
|
$ |
— |
|
|
$ |
— |
|
|
Equity securities: |
|
|
|
|
|
|
|
|
|
|
|
|
|
|
|
|
|
US large cap |
|
|
101 |
|
|
|
— |
|
|
|
101 |
|
|
|
— |
|
|
US small/mid cap |
|
|
33 |
|
|
|
— |
|
|
|
33 |
|
|
|
— |
|
|
Canadian large cap |
|
|
5 |
|
|
|
— |
|
|
|
5 |
|
|
|
— |
|
|
Canadian small cap |
|
|
1 |
|
|
|
— |
|
|
|
1 |
|
|
|
— |
|
|
International companies |
|
|
134 |
|
|
|
— |
|
|
|
134 |
|
|
|
— |
|
|
Global companies |
|
|
90 |
|
|
|
— |
|
|
|
90 |
|
|
|
— |
|
|
Fixed income securities: |
|
|
|
|
|
|
|
|
|
|
|
|
|
|
|
|
|
Investment grade debt |
|
|
122 |
|
|
|
— |
|
|
|
122 |
|
|
|
— |
|
|
Other types of investments: |
|
|
|
|
|
|
|
|
|
|
|
|
|
|
|
|
|
Commodity funds |
|
|
3 |
|
|
|
— |
|
|
|
3 |
|
|
|
— |
|
|
Multi-strategy funds |
|
|
2 |
|
|
|
— |
|
|
|
2 |
|
|
|
— |
|
|
Investments valued at net asset value |
|
|
58 |
|
|
|
— |
|
|
|
— |
|
|
|
— |
|
|
Real estate |
|
|
23 |
|
|
|
— |
|
|
|
23 |
|
|
|
— |
|
|
Total |
|
$ |
587 |
|
|
$ |
15 |
|
|
$ |
514 |
|
|
$ |
— |
|
The fair value of our pension plan assets at December 31, 2015 by asset category are as follows:
|
|
|
Fair Value Measurements at December 31, 2015 |
|
|||||||||||||
|
Asset Category |
|
Total |
|
|
Level 1 |
|
|
Level 2 |
|
|
Level 3 |
|
||||
|
|
|
(In millions) |
|
|||||||||||||
|
Cash and cash equivalents |
|
$ |
9 |
|
|
$ |
9 |
|
|
$ |
— |
|
|
$ |
— |
|
|
Equity securities: |
|
|
|
|
|
|
|
|
|
|
|
|
|
|
|
|
|
US large cap |
|
|
104 |
|
|
|
— |
|
|
|
104 |
|
|
|
— |
|
|
US small/mid cap |
|
|
32 |
|
|
|
— |
|
|
|
32 |
|
|
|
— |
|
|
Canadian large cap |
|
|
4 |
|
|
|
— |
|
|
|
4 |
|
|
|
— |
|
|
Canadian small cap |
|
|
1 |
|
|
|
— |
|
|
|
1 |
|
|
|
— |
|
|
International companies |
|
|
142 |
|
|
|
— |
|
|
|
142 |
|
|
|
— |
|
|
Global companies |
|
|
95 |
|
|
|
— |
|
|
|
95 |
|
|
|
— |
|
|
Fixed income securities: |
|
|
|
|
|
|
|
|
|
|
|
|
|
|
|
|
|
Investment grade debt |
|
|
129 |
|
|
|
— |
|
|
|
129 |
|
|
|
— |
|
|
Other types of investments: |
|
|
|
|
|
|
|
|
|
|
|
|
|
|
|
|
|
Commodity funds |
|
|
3 |
|
|
|
— |
|
|
|
3 |
|
|
|
— |
|
|
Multi-strategy funds |
|
|
3 |
|
|
|
— |
|
|
|
3 |
|
|
|
— |
|
|
Investments valued at net asset value |
|
|
62 |
|
|
|
— |
|
|
|
— |
|
|
|
— |
|
|
Real estate |
|
|
24 |
|
|
|
— |
|
|
|
24 |
|
|
|
— |
|
|
Total |
|
$ |
608 |
|
|
$ |
9 |
|
|
$ |
537 |
|
|
$ |
— |
|
70
The pension assets classified as Level 2 investments in both 2016 and 2015 are part of common collective trust investments.
Certain investments that are measured at fair value using the net asset value per share practical expedient have not been classified in the fair value hierarchy in accordance with ASU 2015-07. The fair value amounts presented above are intended to permit reconciliation of the fair value hierarchy to the amounts presented in the Consolidated Balance Sheets.
Securities listed on one or more national securities exchanges are valued at their last reported sales price on the date of valuation. If no sale occurred on the valuation date, the security is valued at the mean of the last “bid” and “ask” prices on the valuation date.
Corporate and government bonds which are not listed or admitted to trading on any securities exchanges are valued at the average mean of the last bid and ask prices on the valuation date based on quotations supplied by recognized quotation services or by reputable broker dealers.
The non-publicly traded securities, other securities or instruments for which reliable market quotations are not available are valued at each investment manager’s discretion. Valuations will depend on facts and circumstances known as of the valuation date and application of certain valuation methods.
Contributions
The Company contributed $22.1 million, $42.5 million, and $55.4 million for the years ended December 31, 2016, 2015 and 2014, respectively, to improve the funded status of the plans. The Company anticipates that it will have a minimum required pension contribution funding of approximately $22 million in 2017.
Estimated Future Benefit Payments
|
|
|
Pension Benefits |
|
|
Other Benefits |
|
||
|
|
|
(In millions) |
|
|||||
|
2017 |
|
$ |
55 |
|
|
$ |
7 |
|
|
2018 |
|
|
55 |
|
|
|
7 |
|
|
2019 |
|
|
55 |
|
|
|
6 |
|
|
2020 |
|
|
55 |
|
|
|
6 |
|
|
2021 |
|
|
54 |
|
|
|
6 |
|
|
2022-2026 |
|
|
262 |
|
|
|
24 |
|
Multiemployer Pension and Other Postretirement Plans
We participate in two multiemployer pension plans covering 63 employees at 4 locations. Total contributions to the plans were $0.4 million, $0.4 million and $0.5 million for the years ended December 31, 2016, 2015 and 2014, respectively. Our contributions represent less than 5% of the total contributions to the plans. The Company maintains positive employee relations at all locations. During 2012, the Company exited and reentered the pension plan at one of the covered locations in an effort to reduce the overall pension liability. The transaction resulted in a withdrawal liability of $1.0 million, which will be paid over a period of 25 years. The balance of the withdrawal liability as of December 31, 2016 and 2015 was $0.5 million. The Company’s participation in these plans is not material to our financial statements.
Note 11: Commitments and Contingencies
Lease Obligations & Other
The Company leases buildings and equipment under noncancellable operating leases expiring in various years through 2027. Future minimum rental commitments are estimated to total $102.8 million, including approximately $25.1 million in 2017, $19.4 million in 2018, $16.3 million in 2019, $12.9 million in 2020, $10.8 million in 2021, and $18.3 million thereafter.
71
Rental expense under operating leases totaled $30.0 million, $31.8 million, and $33.2 million for the years ended December 31, 2016, 2015 and 2014, respectively.
To fulfill contractual requirements for certain customers in 2016, the Company has entered into certain fixed-price noncancellable contractual obligations. These purchase obligations aggregated to $18.5 million at December 31, 2016 with $18.5 million to be paid in 2017.
Concentrations of Various Risks
The Company’s financial instruments consist of cash and cash equivalents, accounts receivable, available-for-sale investments, derivative instruments, accounts payable, and notes payable. In the case of cash, accounts receivable and accounts payable, the carrying amount on the balance sheet approximates the fair values due to the short-term nature of these instruments. The available-for-sale investments in common stock are adjusted to fair value each period with unrealized gains and losses recorded within accumulated other comprehensive income. The derivative instruments are marked to market each period. The fair value of notes payable is disclosed in Note 15.
The Company’s financial instruments that are exposed to concentrations of credit risk consist primarily of derivative financial instruments and trade accounts receivable. Our derivative financial instruments are contracts placed with major financial institutions. Credit is generally extended to customers based upon an evaluation of each customer’s financial condition, with terms consistent in the industry and no collateral required. Concentrations of credit risk with respect to trade accounts receivable are limited due to the large number of customers and their dispersion across geographic areas.
The Company has signed supply agreements with certain vendors which may obligate the Company to make cash deposits based on the spot price of aluminum at the end of each month. These cash deposits offset amounts payable to the vendor when inventory is received. We made no cash deposits for the year ended December 31, 2016. We have no exposure as of December 31, 2016.
Approximately 12% of our total labor force is covered by collective bargaining agreements. There are collective bargaining agreements that will expire in fiscal 2017, which covers 4% of our total labor force. We believe that our overall relationship with our employees is good.
Litigation
In October 2011, the United States Environmental Protection Agency (the “EPA”) named us as one of more than 100 businesses that may be a potentially responsible party for the Portland Harbor Superfund Site (the “PHS Site”). On January 6, 2017, the EPA issued its Record of Decision (“ROD”) regarding the site. The ROD includes a combination of dredging, capping and enhanced natural recovery that would take approximately thirteen years to construct plus additional time for monitored natural recovery, at an estimated present value cost of $1.05 billion. The EPA has not yet allocated responsibility for the contamination among the potentially responsible parties, including JT Ryerson. We do not currently have sufficient information available to us to determine whether the ROD will be executed as currently stated, whether and to what extent JT Ryerson may be held responsible for any of the identified contamination, and how much (if any) of the final plan’s costs might ultimately be allocated to JT Ryerson. Therefore, management cannot predict the ultimate outcome of this matter or estimate a range of potential loss at this time.
There are various claims and pending actions against the Company. The amount of liability, if any, for those claims and actions at December 31, 2016 is not determinable but, in the opinion of management, such liability, if any, will not have a material adverse effect on the Company’s financial position, results of operations or cash flows. We maintain liability insurance coverage to assist in protecting our assets from losses arising from or related to activities associated with business operations.
Note 12: Related Parties
JT Ryerson, one of our subsidiaries, was party to a corporate advisory services agreement with Platinum Advisors, an affiliate of Platinum, pursuant to which Platinum Advisors provided JT Ryerson certain business, management, administrative and financial advice. On July 23, 2014, JT Ryerson’s Board of Directors approved the termination of this services agreement contingent on the closing of the initial public offering of Ryerson Holding common stock, which occurred on August 13, 2014. As consideration for terminating the advisory fee payable thereunder, Platinum Advisors and its affiliates were paid $15.0 million in August 2014, with an additional $10.0 million paid in August 2015. The Company recognized the $25.0 million termination fee within Warehousing, delivery, selling, general and administrative expense during the third quarter of 2014. The total advisory fee recorded was zero, zero, and $28.3 million for the years ended December 31, 2016, 2015 and 2014, respectively.
72
Note 13: Segment Information
We have one operating and reportable segment, metals service centers.
The Company derives substantially all of its sales from the distribution of metals. The following table shows the Company’s percentage of sales by major product line:
|
|
|
Year Ended December 31, |
|
|||||||||
|
|
|
2016 |
|
|
2015 |
|
|
2014 |
|
|||
|
Product Line |
|
(Percentage of Sales) |
|
|||||||||
|
Carbon Steel Flat |
|
|
28 |
% |
|
|
25 |
% |
|
|
25 |
% |
|
Carbon Steel Plate |
|
|
9 |
|
|
|
11 |
|
|
|
12 |
|
|
Carbon Steel Long |
|
|
13 |
|
|
|
16 |
|
|
|
15 |
|
|
Stainless Steel Flat |
|
|
17 |
|
|
|
16 |
|
|
|
16 |
|
|
Stainless Steel Plate |
|
|
4 |
|
|
|
4 |
|
|
|
4 |
|
|
Stainless Steel Long |
|
|
3 |
|
|
|
3 |
|
|
|
4 |
|
|
Aluminum Flat |
|
|
16 |
|
|
|
16 |
|
|
|
15 |
|
|
Aluminum Plate |
|
|
3 |
|
|
|
3 |
|
|
|
3 |
|
|
Aluminum Long |
|
|
5 |
|
|
|
4 |
|
|
|
4 |
|
|
Other |
|
|
2 |
|
|
|
2 |
|
|
|
2 |
|
|
Total |
|
|
100 |
% |
|
|
100 |
% |
|
|
100 |
% |
No customer accounted for more than 2 percent of Company sales for the years ended December 31, 2016, 2015 and 2014. The top ten customers accounted for less than 12 percent of its sales for the year ended December 31, 2016, 2015, and 2014. A significant majority of the Company’s sales are attributable to its U.S. operations and a significant majority of its long-lived assets are located in the United States. The only operations attributed to foreign countries relate to the Company’s subsidiaries in Canada, China and Mexico, which in aggregate comprised 13 percent of the Company’s sales during the years ended December 31, 2016, 2015 and 2014. Canadian, Chinese and Mexican long-lived assets were 7 percent, 7 percent, and 10 percent of total Company long-lived assets at December 31, 2016, 2015 and 2014, respectively.
The following tables summarize consolidated financial information of our operations by geographic location based on where sales originated from:
|
|
|
Year Ended December 31, |
|
|||||||||
|
Net Sales |
|
2016 |
|
|
2015 |
|
|
2014 |
|
|||
|
|
|
(In millions) |
|
|||||||||
|
United States |
|
$ |
2,485.9 |
|
|
$ |
2,770.3 |
|
|
$ |
3,166.1 |
|
|
Foreign countries |
|
|
373.8 |
|
|
|
397.0 |
|
|
|
456.1 |
|
|
Total |
|
$ |
2,859.7 |
|
|
$ |
3,167.2 |
|
|
$ |
3,622.2 |
|
|
|
|
At December 31, |
|
|||||||||
|
Long-Lived Assets |
|
2016 |
|
|
2015 |
|
|
2014 |
|
|||
|
|
|
(In millions) |
|
|||||||||
|
United States |
|
$ |
362.5 |
|
|
$ |
373.9 |
|
|
$ |
383.7 |
|
|
Foreign countries |
|
|
25.7 |
|
|
|
26.4 |
|
|
|
44.5 |
|
|
Total |
|
$ |
388.2 |
|
|
$ |
400.3 |
|
|
$ |
428.2 |
|
Note 14: Other Matters
Equity Investment
In 2011, the Company invested $0.8 million in Automated Laser Fabrication Co., LLC (“ALF”) for a 38 percent equity interest. ALF is a steel processing company located in Streetsboro, Ohio. The Company accounts for this investment under the equity method of accounting. The Company’s investment in this joint venture is not considered material to the Company’s consolidated financial position or results of operations.
73
Liquidation of Investment in Foreign Entity
On February 17, 2012, the Company acquired 50% of the issued and outstanding capital stock of Açofran Aços e Metais Ltda (“Açofran”), a long products distributor located in São Paulo, Brazil. The Company fully consolidated Açofran based on voting control. The Company was party to a put option arrangement with respect to the securities that represent the noncontrolling interest of Açofran. The put was exercisable by the minority shareholders outside of the Company’s control by requiring the Company to redeem the minority shareholders’ equity stake in the subsidiary at a put price based on earnings before interest, income tax, depreciation and amortization expense and net debt. The redeemable noncontrolling interest was classified as mezzanine equity and measured at the greater of estimated redemption value at the end of each reporting period or the historical cost basis of the noncontrolling interest adjusted for earnings and foreign currency allocations.
As of December 31, 2016, the Company substantially liquidated its investment in Acofran. In accordance with ASC 830-30-40, “Foreign Currency Matters,” the Company reclassified the $1.2 million accumulated foreign currency translation adjustment loss on the Statement of Stockholders’ Equity to Other income and (expense), net on the Consolidated Statement of Operations during 2016.
Stock Split
On July 23, 2014, our Board of Directors approved a 4.25 for 1.00 stock split of the Company’s common stock effective August 5, 2014. Per share and share amounts presented herein have been adjusted for all periods presented to give retroactive effect to 4.25 for 1.00 stock split.
Note 15: Derivatives and Fair Value Measurements
Derivatives
The Company is exposed to certain risks relating to its ongoing business operations. The primary risks managed by using derivative instruments are interest rate risk, foreign currency risk, and commodity price risk. Interest rate swaps are entered into to manage interest rate risk associated with the Company’s floating-rate borrowings. We use foreign currency exchange contracts to hedge our Canadian subsidiaries’ variability in cash flows from the forecasted payment of currencies other than the functional currency. From time to time, we may enter into fixed price sales contracts with our customers for certain of our inventory components. We may enter into metal commodity futures and options contracts periodically to reduce volatility in the price of metals. We may also enter into natural gas and diesel fuel price swaps to manage the price risk of forecasted purchases of natural gas and diesel fuel. The Company currently does not account for its derivative contracts as hedges but rather marks them to market with a corresponding offset to current earnings. The Company regularly reviews the creditworthiness of its derivative counterparties and does not expect to incur a significant loss from the failure of any counterparties to perform under any agreements.
The following table summarizes the location and fair value amount of our derivative instruments reported in our Consolidated Balance Sheet as of December 31, 2016 and 2015:
|
|
|
Asset Derivatives |
|
|
Liability Derivatives |
|
||||||||||||||
|
|
|
|
|
Fair Value |
|
|
|
|
Fair Value |
|
||||||||||
|
Derivatives not designated as hedging instruments under ASC 815 |
|
Balance Sheet Location |
|
December 31, 2016 |
|
|
December 31, 2015 |
|
|
Balance Sheet Location |
|
December 31, 2016 |
|
|
December 31, 2015 |
|
||||
|
|
|
(In millions) |
|
|||||||||||||||||
|
Foreign exchange contracts |
|
Prepaid expenses and other current assets |
|
$ |
— |
|
|
$ |
0.1 |
|
|
Other accrued liabilities |
|
$ |
— |
|
|
$ |
— |
|
|
Commodity contracts |
|
Prepaid expenses and other current assets |
|
|
2.0 |
|
|
|
— |
|
|
Other accrued liabilities |
|
|
0.2 |
|
|
|
3.5 |
|
|
Total derivatives |
|
|
|
$ |
2.0 |
|
|
$ |
0.1 |
|
|
|
|
$ |
0.2 |
|
|
$ |
3.5 |
|
As of December 31, 2016 and 2015 the Company’s foreign currency exchange contracts had a U.S. dollar notional amount of $2.3 million and $1.6 million, respectively. As of December 31, 2016 and 2015, the Company had 296 tons and 177 tons, respectively, of nickel futures or option contracts related to forecasted purchases. As of December 31, 2016 and 2015, the Company had 11,998 tons and 15,120 tons, respectively, of hot roll coil option contracts related to forecasted purchases. The Company has aluminum price swaps related to forecasted purchases, of 8,466 tons and 13,878 tons as of December 31, 2016 and 2015, respectively. As of December 31, 2016 and 2015, the Company has 39,000 gallons and 533,000 gallons, respectively, of diesel fuel hedge contracts related to forecasted purchases.
74
The following table summarizes the location and amount of gains and losses reported in our Consolidated Statements of Operations for the years ended December 31, 2016, 2015 and 2014:
|
|
|
|
|
Amount of Gain/ (Loss) Recognized in Income on Derivatives |
|
|||||||||
|
|
|
|
|
Year Ended December 31, |
|
|||||||||
|
Derivatives not designated as hedging instruments under ASC 815 |
|
Location of Gain/(Loss) Recognized in Income on Derivatives |
|
2016 |
|
|
2015 |
|
|
2014 |
|
|||
|
|
|
|
|
(In millions) |
|
|||||||||
|
Foreign exchange contracts |
|
Other income and (expense), net |
|
$ |
(0.1 |
) |
|
$ |
0.1 |
|
|
$ |
— |
|
|
Commodity contracts |
|
Cost of materials sold |
|
|
10.0 |
|
|
|
(11.8 |
) |
|
|
(0.1 |
) |
|
Diesel fuel commodity contracts |
|
Warehousing, delivery, selling, general and administrative |
|
|
0.1 |
|
|
|
(0.4 |
) |
|
|
(0.2 |
) |
|
Total |
|
|
|
$ |
10.0 |
|
|
$ |
(12.1 |
) |
|
$ |
(0.3 |
) |
Fair Value Measurements
To increase consistency and comparability in fair value measurements, ASC 820 establishes a fair value hierarchy that prioritizes the inputs to valuation techniques used to measure fair value into three levels as follows:
|
|
1. |
Level 1—quoted prices (unadjusted) in active markets for identical assets or liabilities that the Company has the ability to access as of the reporting date. |
|
|
2. |
Level 2—inputs other than quoted prices included within Level 1 that are directly observable for the asset or liability or indirectly observable through corroboration with observable market data. |
|
|
3. |
Level 3—unobservable inputs, such as internally-developed pricing models for the asset or liability due to little or no market activity for the asset or liability. |
The following table presents assets and liabilities measured and recorded at fair value on our Consolidated Balance Sheets on a recurring basis and their level within the fair value hierarchy as of December 31, 2016:
|
|
|
At December 31, 2016 |
|
|||||||||
|
|
|
Level 1 |
|
|
Level 2 |
|
|
Level 3 |
|
|||
|
|
|
(In millions) |
|
|||||||||
|
Assets |
|
|
|
|
|
|
|
|
|
|
|
|
|
Prepaid and other current assets: |
|
|
|
|
|
|
|
|
|
|
|
|
|
Common stock – available-for-sale investment |
|
$ |
0.4 |
|
|
$ |
— |
|
|
$ |
— |
|
|
Mark-to-market derivatives: |
|
|
|
|
|
|
|
|
|
|
|
|
|
Commodity contracts |
|
$ |
— |
|
|
$ |
2.0 |
|
|
$ |
— |
|
|
Liabilities |
|
|
|
|
|
|
|
|
|
|
|
|
|
Mark-to-market derivatives: |
|
|
|
|
|
|
|
|
|
|
|
|
|
Commodity contracts |
|
$ |
— |
|
|
$ |
0.2 |
|
|
$ |
— |
|
75
The following table presents assets and liabilities measured and recorded at fair value on our Consolidated Balance Sheets on a recurring basis and their level within the fair value hierarchy as of December 31, 2015:
|
|
|
At December 31, 2015 |
|
|||||||||
|
|
|
Level 1 |
|
|
Level 2 |
|
|
Level 3 |
|
|||
|
|
|
(In millions) |
|
|||||||||
|
Assets |
|
|
|
|
|
|
|
|
|
|
|
|
|
Prepaid and other current assets: |
|
|
|
|
|
|
|
|
|
|
|
|
|
Common stock – available-for-sale investment |
|
$ |
2.2 |
|
|
$ |
— |
|
|
$ |
— |
|
|
Mark-to-market derivatives: |
|
|
|
|
|
|
|
|
|
|
|
|
|
Foreign exchange contracts |
|
$ |
— |
|
|
$ |
0.1 |
|
|
$ |
— |
|
|
Liabilities |
|
|
|
|
|
|
|
|
|
|
|
|
|
Mark-to-market derivatives: |
|
|
|
|
|
|
|
|
|
|
|
|
|
Commodity contracts |
|
$ |
— |
|
|
$ |
3.5 |
|
|
$ |
— |
|
The fair value of each derivative contract is determined using Level 2 inputs and the market approach valuation technique, as described in ASC 820. The Company has various commodity derivatives to lock in nickel prices for varying time periods. The fair value of these derivatives is determined based on the spot price each individual contract was purchased at and compared with the one-month daily average actual spot price on the London Metals Exchange for nickel on the valuation date. The Company also has commodity derivatives to lock in hot roll coil and aluminum prices for varying time periods. The fair value of hot roll coil and aluminum derivatives is determined based on the spot price each individual contract was purchased at and compared with the one-month daily average actual spot price on the New York Mercantile Exchange and the London Metals Exchange, respectively, for the commodity on the valuation date. The Company has various commodity derivatives to lock in diesel prices for varying time periods. The fair value of these derivatives is determined based on the spot price each individual contract was purchased at and compared with the one-month daily average actual spot price of the Platts Index for Gulf Coast Ultra Low Sulfur Diesel on the valuation date. In addition, the Company has numerous foreign exchange contracts to hedge our Canadian subsidiaries’ variability in cash flows from the forecasted payment of currencies other than the functional currency, the Canadian dollar. The Company defines the fair value of foreign exchange contracts as the amount of the difference between the contracted and current market value at the end of the period. The Company estimates the current market value of foreign exchange contracts by obtaining month-end market quotes of foreign exchange rates and forward rates for contracts with similar terms. The Company uses the exchange rates provided by Reuters. Each contract term varies in the number of months, but on average is between 3 to 12 months in length.
The following table presents assets and liabilities measured and recorded at fair value on the Consolidated Balance Sheets on a non-recurring basis and their level within the fair value hierarchy as of December 31, 2016:
|
|
|
At December 31, 2016 |
|
|||||||||
|
|
|
Level 1 |
|
|
Level 2 |
|
|
Level 3 |
|
|||
|
|
|
(In millions) |
|
|||||||||
|
Assets |
|
|
|
|
|
|
|
|
|
|
|
|
|
Prepaid expenses and other current assets - assets held for sale (Note 5) |
|
$ |
— |
|
|
$ |
3.6 |
|
|
$ |
— |
|
The following table presents assets and liabilities measured and recorded at fair value on the Consolidated Balance Sheets on a non-recurring basis and their level within the fair value hierarchy as of December 31, 2015:
|
|
|
At December 31, 2015 |
|
|||||||||
|
|
|
Level 1 |
|
|
Level 2 |
|
|
Level 3 |
|
|||
|
|
|
(In millions) |
|
|||||||||
|
Assets |
|
|
|
|
|
|
|
|
|
|
|
|
|
Prepaid expenses and other current assets - assets held for sale (Note 5) |
|
$ |
— |
|
|
$ |
4.2 |
|
|
$ |
— |
|
76
The carrying and estimated fair values of the Company’s financial instruments at December 31, 2016 and 2015 were as follows:
|
|
|
At December 31, 2016 |
|
|
At December 31, 2015 |
|
||||||||||
|
|
|
Carrying Amount |
|
|
Fair Value |
|
|
Carrying Amount |
|
|
Fair Value |
|
||||
|
|
|
(In millions) |
|
|||||||||||||
|
Cash and cash equivalents |
|
$ |
80.7 |
|
|
$ |
80.7 |
|
|
$ |
63.2 |
|
|
$ |
63.2 |
|
|
Restricted cash |
|
|
1.0 |
|
|
|
1.0 |
|
|
|
1.2 |
|
|
|
1.2 |
|
|
Receivables less provision for allowances, claims and doubtful accounts |
|
|
326.0 |
|
|
|
326.0 |
|
|
|
305.7 |
|
|
|
305.7 |
|
|
Accounts payable |
|
|
230.4 |
|
|
|
230.4 |
|
|
|
206.3 |
|
|
|
206.3 |
|
|
Long-term debt, including current portion |
|
|
963.5 |
|
|
|
1,034.2 |
|
|
|
1,023.5 |
|
|
|
855.3 |
|
The estimated fair value of the Company’s cash and cash equivalents, receivables less provision for allowances, claims and doubtful accounts and accounts payable approximate their carrying amounts due to the short-term nature of these financial instruments. The estimated fair value of the Company’s long-term debt and the current portions thereof is determined by using quoted market prices of Company debt securities (Level 2 inputs).
Available-For-Sale Investments
The Company has classified investments made during 2010 and 2012 as available-for-sale at the time of their purchase. Investments classified as available-for-sale are recorded at fair value with the related unrealized gains and losses included in accumulated other comprehensive income. Management evaluates investments in an unrealized loss position on whether an other-than-temporary impairment has occurred on a periodic basis. Factors considered by management in assessing whether an other-than-temporary impairment has occurred include: the nature of the investment; whether the decline in fair value is attributable to specific adverse conditions affecting the investment; the financial condition of the investee; the severity and the duration of the impairment; and whether we intend to sell the investment or will be required to sell the investment before recovery of its amortized cost basis. When it is determined that an other-than-temporary impairment has occurred, the investment is written down to its market value at the end of the period in which it is determined that an other-than-temporary decline has occurred.
As of March 31, 2015, the investment was in an unrealized loss position for twelve months. Based on the duration and severity of our unrealized loss, management determined that an other-than-temporary impairment occurred and thus recognized a $12.3 million impairment charge within other income and (expense), net in the first quarter of 2015.
As of June 30, 2016, the investment was in an unrealized loss position from its adjusted cost basis for twelve months. Based on the duration and severity of our unrealized loss, management determined that an other-than-temporary impairment occurred and thus recognized a $2.8 million impairment charge within other income and (expense), net in the second quarter of 2016.
As of December 31, 2016, the investment was in an unrealized loss position from its adjusted cost basis for six months. Based on the duration and severity of our unrealized loss, management determined that an other-than-temporary impairment occurred and thus recognized a $1.9 million impairment charge within other income and (expense), net in the fourth quarter of 2016.
As of December 31, 2016, the adjusted cost basis of the investment is $0.4 million. Management does not currently intend to sell the investment before recovery of its adjusted cost basis. Realized gains and losses are recorded within the Condensed Consolidated Statement of Comprehensive Income upon sale of the security and are based on specific identification.
The Company’s available-for-sale securities as of December 31, 2016 can be summarized as follows:
|
|
|
At December 31, 2016 |
|
|||||||||||||
|
|
|
Cost |
|
|
Gross Unrealized Gains |
|
|
Gross Unrealized Losses |
|
|
Fair Value |
|
||||
|
|
|
(In millions) |
|
|||||||||||||
|
Common stock |
|
$ |
0.4 |
|
|
$ |
— |
|
|
$ |
— |
|
|
$ |
0.4 |
|
77
The Company’s available-for-sale securities as of December 31, 2015 can be summarized as follows:
|
|
|
At December 31, 2015 |
|
|||||||||||||
|
|
|
Cost |
|
|
Gross Unrealized Gains |
|
|
Gross Unrealized Losses |
|
|
Fair Value |
|
||||
|
|
|
(In millions) |
|
|||||||||||||
|
Common stock |
|
$ |
5.1 |
|
|
$ |
— |
|
|
$ |
(2.9 |
) |
|
$ |
2.2 |
|
There is no maturity date for this investment and there have been no sales for the years ended December 31, 2016, 2015, and 2014.
Note 16: Accumulated Other Comprehensive Income
The following tables detail the changes in accumulated other comprehensive income (loss) for the years ended December 31, 2016 and December 31, 2015:
|
|
|
Changes in Accumulated Other Comprehensive Income (Loss) by Component |
|
|||||||||
|
|
|
Foreign Currency Translation |
|
|
Benefit Plan Liabilities |
|
|
Unrealized Gain (Loss) on Available- For-Sale Investments |
|
|||
|
|
|
(In millions) |
|
|||||||||
|
Balance at January 1, 2015 |
|
$ |
(32.8 |
) |
|
$ |
(255.8 |
) |
|
$ |
(2.8 |
) |
|
Other comprehensive income (loss) before reclassifications |
|
|
(21.0 |
) |
|
|
6.3 |
|
|
|
(5.5 |
) |
|
Amounts reclassified from accumulated other comprehensive income (loss) |
|
|
— |
|
|
|
(3.0 |
) |
|
|
7.6 |
|
|
Net current-period other comprehensive income (loss) |
|
|
(21.0 |
) |
|
|
3.3 |
|
|
|
2.1 |
|
|
Balance at December 31, 2015 |
|
$ |
(53.8 |
) |
|
$ |
(252.5 |
) |
|
$ |
(0.7 |
) |
|
Other comprehensive income (loss) before reclassifications |
|
|
2.4 |
|
|
|
(5.0 |
) |
|
|
(1.1 |
) |
|
Amounts reclassified from accumulated other comprehensive income (loss) |
|
|
1.2 |
|
|
|
(1.2 |
) |
|
|
2.9 |
|
|
Net current-period other comprehensive income (loss) |
|
|
3.6 |
|
|
|
(6.2 |
) |
|
|
1.8 |
|
|
Balance at December 31, 2016 |
|
$ |
(50.2 |
) |
|
$ |
(258.7 |
) |
|
$ |
1.1 |
|
78
The following tables detail the reclassifications out of accumulated other comprehensive income (loss) for the years ended December 31, 2016 and December 31, 2015:
|
|
|
Reclassifications Out of Accumulated Other Comprehensive Income (Loss) |
||||
|
Details about Accumulated Other Comprehensive Income (Loss) Components |
|
Amount reclassified from Accumulated Other Comprehensive Income (Loss) |
|
|
Affected line item in the Condensed Consolidated Statements of Comprehensive Income |
|
|
|
|
For the Year Ended December 31, 2016 |
|
|
|
|
|
|
|
(In millions) |
|
|
|
|
|
Liquidation of investment in foreign entity |
|
|
|
|
|
|
|
Foreign currency translation |
|
$ |
1.2 |
|
|
Other income and (expense) net |
|
Tax provision (benefit) |
|
|
— |
|
|
|
|
Net of tax |
|
$ |
1.2 |
|
|
|
|
Amortization of defined benefit pension and other post-retirement benefit plan items |
|
|
|
|
|
|
|
Actuarial gain |
|
$ |
(4.7 |
) |
|
Warehousing, delivery, selling, general and administrative |
|
Prior service cost |
|
|
2.9 |
|
|
Warehousing, delivery, selling, general and administrative |
|
Total before tax |
|
|
(1.8 |
) |
|
|
|
Tax provision |
|
|
0.6 |
|
|
|
|
Net of tax |
|
$ |
(1.2 |
) |
|
|
|
Other-than-temporary impairment |
|
|
|
|
|
|
|
Other-than-temporary impairment charge |
|
$ |
4.7 |
|
|
Other income and (expense) net |
|
Tax benefit |
|
|
(1.8 |
) |
|
|
|
Net of tax |
|
$ |
2.9 |
|
|
|
|
|
|
Reclassifications Out of Accumulated Other Comprehensive Income (Loss) |
||||
|
Details about Accumulated Other Comprehensive Income (Loss) Components |
|
Amount reclassified from Accumulated Other Comprehensive Income (Loss) |
|
|
Affected line item in the Condensed Consolidated Statements of Comprehensive Income (Loss) |
|
|
|
|
For the Year Ended December 31, 2015 |
|
|
|
|
|
|
|
(In millions) |
|
|
|
|
|
Amortization of defined benefit pension and other post-retirement benefit plan items |
|
|
|
|
|
|
|
Actuarial gain |
|
$ |
(6.5 |
) |
|
Warehousing, delivery, selling, general and administrative |
|
Prior service cost |
|
|
2.0 |
|
|
Warehousing, delivery, selling, general and administrative |
|
Total before tax |
|
|
(4.5 |
) |
|
|
|
Tax provision |
|
|
1.5 |
|
|
|
|
Net of tax |
|
$ |
(3.0 |
) |
|
|
|
Other-than-temporary impairment |
|
|
|
|
|
|
|
Other-than-temporary impairment charge |
|
$ |
12.3 |
|
|
Other income and (expense) net |
|
Tax benefit |
|
|
(4.7 |
) |
|
|
|
Net of tax |
|
$ |
7.6 |
|
|
|
79
Note 17: Income Taxes
The elements of the provision (benefit) for income taxes were as follows:
|
|
|
Year Ended December 31, |
|
|||||||||
|
|
|
2016 |
|
|
2015 |
|
|
2014 |
|
|||
|
|
|
(In millions) |
|
|||||||||
|
Income (loss) before income tax: |
|
|
|
|
|
|
|
|
|
|
|
|
|
U.S. |
|
$ |
20.1 |
|
|
$ |
13.2 |
|
|
$ |
(34.4 |
) |
|
Foreign |
|
|
6.0 |
|
|
|
(11.3 |
) |
|
|
7.5 |
|
|
|
|
$ |
26.1 |
|
|
$ |
1.9 |
|
|
$ |
(26.9 |
) |
|
Current income taxes: |
|
|
|
|
|
|
|
|
|
|
|
|
|
Federal |
|
$ |
(0.3 |
) |
|
$ |
(0.3 |
) |
|
$ |
(1.0 |
) |
|
Foreign |
|
|
2.8 |
|
|
|
1.2 |
|
|
|
3.3 |
|
|
State |
|
|
— |
|
|
|
(0.4 |
) |
|
|
0.5 |
|
|
|
|
|
2.5 |
|
|
|
0.5 |
|
|
|
2.8 |
|
|
Deferred income taxes |
|
|
4.7 |
|
|
|
3.2 |
|
|
|
(3.5 |
) |
|
Total income tax provision (benefit) |
|
$ |
7.2 |
|
|
$ |
3.7 |
|
|
$ |
(0.7 |
) |
Income taxes differ from the amounts computed by applying the federal tax rate as follows:
|
|
|
Year Ended December 31, |
|
|||||||||
|
|
|
2016 |
|
|
2015 |
|
|
2014 |
|
|||
|
|
|
(In millions) |
|
|||||||||
|
Federal income tax expense (benefit) computed at statutory tax rate of 35% |
|
$ |
9.1 |
|
|
$ |
0.7 |
|
|
$ |
(9.4 |
) |
|
Additional taxes or credits from: |
|
|
|
|
|
|
|
|
|
|
|
|
|
State and local income taxes, net of federal income tax effect |
|
|
(0.7 |
) |
|
|
(0.5 |
) |
|
|
(0.6 |
) |
|
Non-deductible expenses and non-taxable income (1) |
|
|
(1.2 |
) |
|
|
1.8 |
|
|
|
9.3 |
|
|
Foreign income (expense) not includable in federal taxable income |
|
|
2.8 |
|
|
|
0.8 |
|
|
|
(1.0 |
) |
|
Valuation allowance changes (net) |
|
|
(2.6 |
) |
|
|
0.1 |
|
|
|
(0.6 |
) |
|
All other, net |
|
|
(0.2 |
) |
|
|
0.8 |
|
|
|
1.6 |
|
|
Total income tax provision (benefit) |
|
$ |
7.2 |
|
|
$ |
3.7 |
|
|
$ |
(0.7 |
) |
|
(1) |
The 2014 charge includes $8.2 million related to the nonrecurring fee to terminate the advisory services agreement with Platinum Advisors (See Note 12). |
80
The components of the deferred income tax assets and liabilities arising under FASB ASC 740, “Income Taxes” (“ASC 740”) were as follows:
|
|
|
At December 31, |
|
|||||
|
|
|
2016 |
|
|
2015 |
|
||
|
|
|
(In millions) |
|
|||||
|
Deferred tax assets: |
|
|
|
|
|
|
|
|
|
AMT tax credit carryforwards |
|
$ |
30 |
|
|
$ |
30 |
|
|
Post-retirement benefits other than pensions |
|
|
28 |
|
|
|
30 |
|
|
Federal and foreign net operating loss carryforwards |
|
|
84 |
|
|
|
79 |
|
|
State net operating loss carryforwards |
|
|
12 |
|
|
|
10 |
|
|
Pension liability |
|
|
85 |
|
|
|
95 |
|
|
Other deductible temporary differences |
|
|
25 |
|
|
|
23 |
|
|
Less: valuation allowances |
|
|
(20 |
) |
|
|
(22 |
) |
|
|
|
$ |
244 |
|
|
$ |
245 |
|
|
Deferred tax liabilities: |
|
|
|
|
|
|
|
|
|
Fixed asset basis difference |
|
$ |
81 |
|
|
$ |
88 |
|
|
Inventory basis difference |
|
|
129 |
|
|
|
121 |
|
|
Other intangibles |
|
|
13 |
|
|
|
14 |
|
|
|
|
|
223 |
|
|
|
223 |
|
|
Net deferred tax asset |
|
$ |
21 |
|
|
$ |
22 |
|
The Company will continue to maintain a valuation allowance on certain U.S. federal and state deferred tax assets until such time as in management’s judgment, considering all available positive and negative evidence, the Company determines that these deferred tax assets are more likely than not realizable.
The Company had available at December 31, 2016, federal AMT credit carryforwards of approximately $30 million, which may be used indefinitely to reduce regular federal income taxes.
The Company’s deferred tax assets also include $76 million related to U.S. federal net operating loss (“NOL”) carryforwards which expire in 15 years, $12 million related to state NOL carryforwards which expire generally in 1 to 20 years and $8 million related to foreign NOL carryforwards which expire in 1 to 5 years, available at December 31, 2016.
Earnings from the Company’s foreign subsidiaries are considered to be indefinitely reinvested and, accordingly, no provision for U.S. federal and state income taxes or foreign withholding tax has been made in our consolidated financial statements related to the indefinitely reinvested earnings. At December 31, 2016, the Company had approximately $101 million of undistributed foreign earnings on which no U.S. tax expense has been recorded, predominately in Canada and China. A distribution of these non-U.S. earnings in the form of dividends or otherwise would subject the Company to both U.S. federal and state income taxes, as adjusted for tax credits and foreign withholding taxes. A determination of the amount of any unrecognized deferred income tax liability on the undistributed earnings is predominately dependent upon the availability of tax credits in the U.S., which is dependent on a number of factors including the timing of future distributions, the mix of distributions and the amount of both U.S. and non-U.S. source income in future years. Modeling of the many future potential scenarios and the related unrecognized deferred tax liability is therefore not practicable. None of the Company’s other foreign subsidiaries have a material amount of assets available for repatriation.
81
The Company accounts for uncertain income tax positions in accordance with ASC 740. A reconciliation of the beginning and ending amount of unrecognized tax benefits is as follows:
|
|
|
Unrecognized Tax Benefits |
|
|
|
|
|
(In millions) |
|
|
|
Unrecognized tax benefits balance at January 1, 2014 |
|
$ |
8.8 |
|
|
Gross increases – tax positions in current periods |
|
|
0.3 |
|
|
Settlements and closing of statute of limitations |
|
|
(1.5 |
) |
|
Unrecognized tax benefits balance at December 31, 2014 |
|
$ |
7.6 |
|
|
Gross increases – tax positions in current periods |
|
|
— |
|
|
Settlements and closing of statute of limitations |
|
|
— |
|
|
Unrecognized tax benefits balance at December 31, 2015 |
|
$ |
7.6 |
|
|
Gross increases – tax positions in current periods |
|
|
— |
|
|
Settlements and closing of statute of limitations |
|
|
(0.3 |
) |
|
Unrecognized tax benefits balance at December 31, 2016 |
|
$ |
7.3 |
|
The Company and its subsidiaries are subject to U.S. federal income tax as well as income tax of multiple state and foreign jurisdictions. The Company has substantially concluded all U.S. federal income tax matters for years through 2009. Substantially all state and local income tax matters have been concluded through 2006. The Company has substantially concluded foreign income tax matters through 2009 for all significant foreign jurisdictions.
We recognize interest and penalties related to uncertain tax positions in income tax expense. We had approximately $1.7 million and $1.5 million of accrued interest related to uncertain tax positions at December 31, 2016 and 2015, respectively. Total amount of unrecognized tax benefits that would affect our effective tax rate if recognized was $5.6 million as of December 31, 2016 and 2015.
Note 18: Earnings Per Share
On July 16, 2007, Ryerson Holding was capitalized with 21,250,000 shares of common stock by Platinum Equity, LLC. On August 13, 2014, Ryerson Holding completed an initial public offering of 11 million shares of common stock at a price to the public of $11.00 per share. On July 25, 2016, Ryerson Holding closed an underwritten public offering of 5 million shares of common stock at a price to the public of $15.25 per share. All shares outstanding are common shares and have equal voting, liquidation and preference rights.
Basic earnings (loss) per share attributable to Ryerson Holding’s common stock is determined based on earnings (loss) for the period divided by the weighted average number of common shares outstanding during the period. Diluted earnings (loss) per share attributable to Ryerson Holding’s common stock considers the effect of potential common shares, unless inclusion of the potential common shares would have an antidilutive effect. Potentially dilutive securities whose effect would have been antidilutive were not significant for 2016, 2015 and 2014.
The following table sets forth the calculation of basic and diluted earnings (loss) per share:
|
|
|
Years Ended December 31, |
|
|||||||||
|
Basic and diluted earnings (loss) per share |
|
|
2016 |
|
|
|
2015 |
|
|
|
2014 |
|
|
|
|
(In millions, except share and per share data) |
|
|||||||||
|
Numerator: |
|
|
|
|
|
|
|
|
|
|
|
|
|
Net income (loss) attributable to Ryerson Holding Corporation |
|
$ |
18.7 |
|
|
$ |
(0.5 |
) |
|
$ |
(25.7 |
) |
|
Denominator: |
|
|
|
|
|
|
|
|
|
|
|
|
|
Weighted average shares outstanding |
|
|
34,295,829 |
|
|
|
32,057,764 |
|
|
|
25,437,500 |
|
|
Dilutive effect of stock-based awards |
|
|
105,417 |
|
|
|
— |
|
|
|
— |
|
|
Weighted average shares outstanding adjusted for dilutive securities |
|
|
34,401,246 |
|
|
|
32,057,764 |
|
|
|
25,437,500 |
|
|
|
|
|
|
|
|
|
|
|
|
|
|
|
|
Earnings (loss) per share |
|
|
|
|
|
|
|
|
|
|
|
|
|
Basic |
|
$ |
0.55 |
|
|
$ |
(0.02 |
) |
|
$ |
(1.01 |
) |
|
Diluted |
|
$ |
0.54 |
|
|
$ |
(0.02 |
) |
|
$ |
(1.01 |
) |
82
Note 19: Subsequent Events
On January 19, 2017, Ryerson Holding acquired The Laserflex Corporation, a privately owned metal fabricator specializing in laser fabrication metal processing and welding with locations in Columbus, Ohio and Wellford, South Carolina. The acquisition is not material to our consolidated financial statements.
On February 15, 2017, Ryerson Holding acquired Guy Metals, Inc., a privately owned metal service center company located in Hammond, Wisconsin. The acquisition is not material to our consolidated financial statements.
RYERSON HOLDING CORPORATION AND SUBSIDIARY COMPANIES
SUPPLEMENTARY FINANCIAL DATA (UNAUDITED)
SUMMARY BY QUARTER
(In millions except per share data)
|
|
|
Net Sales |
|
|
Gross Profit |
|
|
Income (Loss) Before Income Taxes |
|
|
Net Income (Loss) |
|
|
Net Income (Loss) Attributable to Ryerson Holding Corporation |
|
|
Basic Earnings (Loss) per Share |
|
|
Diluted Earnings (Loss) per Share |
|
|||||||
|
2015 |
|
|
|
|
|
|
|
|
|
|
|
|
|
|
|
|
|
|
|
|
|
|
|
|
|
|
|
|
|
First Quarter (1) |
|
$ |
868.0 |
|
|
$ |
150.0 |
|
|
$ |
(3.0 |
) |
|
$ |
(2.8 |
) |
|
$ |
(2.5 |
) |
|
$ |
(0.08 |
) |
|
$ |
(0.08 |
) |
|
Second Quarter (2) |
|
|
840.4 |
|
|
|
165.8 |
|
|
|
25.8 |
|
|
|
15.6 |
|
|
|
15.8 |
|
|
|
0.49 |
|
|
|
0.49 |
|
|
Third Quarter (3) |
|
|
790.0 |
|
|
|
150.3 |
|
|
|
12.8 |
|
|
|
6.7 |
|
|
|
6.7 |
|
|
|
0.21 |
|
|
|
0.21 |
|
|
Fourth Quarter (4) |
|
|
668.8 |
|
|
|
101.6 |
|
|
|
(33.7 |
) |
|
|
(21.3 |
) |
|
|
(20.5 |
) |
|
|
(0.64 |
) |
|
|
(0.64 |
) |
|
Year |
|
$ |
3,167.2 |
|
|
$ |
567.7 |
|
|
$ |
1.9 |
|
|
$ |
(1.8 |
) |
|
$ |
(0.5 |
) |
|
$ |
(0.02 |
) |
|
$ |
(0.02 |
) |
|
2016 |
|
|
|
|
|
|
|
|
|
|
|
|
|
|
|
|
|
|
|
|
|
|
|
|
|
|
|
|
|
First Quarter (5) |
|
$ |
702.6 |
|
|
$ |
147.6 |
|
|
$ |
21.6 |
|
|
$ |
13.5 |
|
|
$ |
13.5 |
|
|
$ |
0.42 |
|
|
$ |
0.42 |
|
|
Second Quarter (6) |
|
|
739.8 |
|
|
|
163.0 |
|
|
|
9.7 |
|
|
|
5.4 |
|
|
|
5.6 |
|
|
|
0.17 |
|
|
|
0.17 |
|
|
Third Quarter |
|
|
735.1 |
|
|
|
145.4 |
|
|
|
10.0 |
|
|
|
8.4 |
|
|
|
8.2 |
|
|
|
0.23 |
|
|
|
0.23 |
|
|
Fourth Quarter (7) |
|
|
682.2 |
|
|
|
114.6 |
|
|
|
(15.2 |
) |
|
|
(8.4 |
) |
|
|
(8.6 |
) |
|
|
(0.23 |
) |
|
|
(0.23 |
) |
|
Year |
|
$ |
2,859.7 |
|
|
$ |
570.6 |
|
|
$ |
26.1 |
|
|
$ |
18.9 |
|
|
$ |
18.7 |
|
|
$ |
0.55 |
|
|
$ |
0.54 |
|
|
(1) |
Included in the first quarter 2015 results is a $12.3 million charge due to an other-than-temporary-impairment recognized on an available-for-sale investment. |
|
(2) |
Included in the second quarter 2015 results is a $1.4 million impairment charge on assets held for sale to recognize the assets at their fair value less cost to sell. |
|
(3) |
Included in the third quarter 2015 results is a $0.5 million impairment charge on assets held for sale to recognize the assets at their fair value less cost to sell. The third quarter of 2015 results also includes a $2.9 million charge to write-off a portion of the debt issuance costs associated with the Old Credit Facility. |
|
(4) |
Included in the fourth quarter 2015 results are: |
|
(5) |
Included in the first quarter 2016 results is an $8.2 million gain on the repurchase of debt. |
|
(6) |
Included in the second quarter 2016 results is a $15.1 million loss on the repurchase of debt. The second quarter of 2016 also included a $2.8 million charge due to an other-than-temporary-impairment recognized on an available-for-sale investment. |
|
(7) |
Included in the fourth quarter 2016 results is a $1.5 million loss on repurchase of debt. The fourth quarter of 2016 also included a $1.9 million charge due to an other-than-temporary-impairment recognized on an available-for-sale investment. |
83
SCHEDULE I—CONDENSED FINANCIAL INFORMATION OF REGISTRANT
RYERSON HOLDING CORPORATION
(Parent Company Only)
STATEMENTS OF OPERATIONS
(In millions)
|
|
|
Year ended December 31, |
|
|||||||||
|
|
|
2016 |
|
|
2015 |
|
|
2014 |
|
|||
|
Administrative and other expenses |
|
$ |
(0.8 |
) |
|
$ |
(0.9 |
) |
|
$ |
(0.2 |
) |
|
Equity in income (loss) of subsidiaries |
|
|
3.4 |
|
|
|
10.2 |
|
|
|
(17.3 |
) |
|
Income (loss) before income taxes |
|
|
2.6 |
|
|
|
9.3 |
|
|
|
(17.5 |
) |
|
Provision (benefit) for income taxes |
|
|
(16.1 |
) |
|
|
9.8 |
|
|
|
8.2 |
|
|
Net income (loss) |
|
$ |
18.7 |
|
|
$ |
(0.5 |
) |
|
$ |
(25.7 |
) |
See Notes to Condensed Financial Statements.
84
SCHEDULE I—CONDENSED FINANCIAL INFORMATION OF REGISTRANT
RYERSON HOLDING CORPORATION
(Parent Company Only)
STATEMENTS OF COMPREHENSIVE INCOME
(In millions)
|
|
|
Year Ended December 31, |
|
|||||||||
|
|
|
2016 |
|
|
2015 |
|
|
2014 |
|
|||
|
Net income (loss) |
|
$ |
18.7 |
|
|
$ |
(0.5 |
) |
|
$ |
(25.7 |
) |
|
Other comprehensive income (loss), before tax: |
|
|
|
|
|
|
|
|
|
|
|
|
|
Foreign currency translation adjustments |
|
|
1.1 |
|
|
|
(12.4 |
) |
|
|
(16.2 |
) |
|
Gain (loss) on intra-entity foreign currency transactions |
|
|
1.3 |
|
|
|
(8.6 |
) |
|
|
— |
|
|
Unrealized loss on available-for-sale investment |
|
|
(1.8 |
) |
|
|
(8.9 |
) |
|
|
(9.5 |
) |
|
Other-than-temporary impairment on available-for-sale investment |
|
|
4.7 |
|
|
|
12.3 |
|
|
|
— |
|
|
Liquidation of investment in foreign entity |
|
|
1.2 |
|
|
|
— |
|
|
|
— |
|
|
Changes in defined benefit pension and other post-retirement benefit plans |
|
|
(10.6 |
) |
|
|
7.8 |
|
|
|
(130.3 |
) |
|
Other comprehensive income (loss), before tax |
|
|
(4.1 |
) |
|
|
(9.8 |
) |
|
|
(156.0 |
) |
|
Income tax provision (benefit) related to items of other comprehensive income (loss) |
|
|
(3.3 |
) |
|
|
5.8 |
|
|
|
(52.8 |
) |
|
Comprehensive income (loss), after tax |
|
$ |
17.9 |
|
|
$ |
(16.1 |
) |
|
$ |
(128.9 |
) |
See Notes to Condensed Financial Statements.
85
SCHEDULE I—CONDENSED FINANCIAL INFORMATION OF REGISTRANT
RYERSON HOLDING CORPORATION
(Parent Company Only)
STATEMENTS OF CASH FLOWS
(In millions)
|
|
|
Year ended December 31, |
|
|||||||||
|
|
|
2016 |
|
|
2015 |
|
|
2014 |
|
|||
|
Operating Activities: |
|
|
|
|
|
|
|
|
|
|
|
|
|
Net income (loss) |
|
$ |
18.7 |
|
|
$ |
(0.5 |
) |
|
$ |
(25.7 |
) |
|
Adjustments to reconcile net income (loss) to net cash provided by operating activities: |
|
|
|
|
|
|
|
|
|
|
|
|
|
Equity in (earnings) losses of subsidiaries |
|
|
(3.4 |
) |
|
|
(10.2 |
) |
|
|
17.3 |
|
|
Deferred income taxes |
|
|
(16.1 |
) |
|
|
9.3 |
|
|
|
8.5 |
|
|
(Increase) decrease in receivables/payables from subsidiaries |
|
|
1.5 |
|
|
|
11.4 |
|
|
|
(1.0 |
) |
|
(Increase) decrease in other assets |
|
|
— |
|
|
|
0.2 |
|
|
|
(0.2 |
) |
|
Increase (decrease) in accounts payable |
|
|
— |
|
|
|
(10.0 |
) |
|
|
10.0 |
|
|
Increase (decrease) in accrued liabilities |
|
|
(0.5 |
) |
|
|
0.1 |
|
|
|
0.1 |
|
|
Net adjustments |
|
|
(18.5 |
) |
|
|
0.8 |
|
|
|
34.7 |
|
|
Net cash provided by operating activities |
|
|
0.2 |
|
|
|
0.3 |
|
|
|
9.0 |
|
|
Investing Activities: |
|
|
|
|
|
|
|
|
|
|
|
|
|
Investment in subsidiaries |
|
|
— |
|
|
|
(11.4 |
) |
|
|
(110.7 |
) |
|
Loan to related company |
|
|
(71.7 |
) |
|
|
— |
|
|
|
— |
|
|
Net cash used in investing activities |
|
|
(71.7 |
) |
|
|
(11.4 |
) |
|
|
(110.7 |
) |
|
Financing activities: |
|
|
|
|
|
|
|
|
|
|
|
|
|
Net proceeds from issuance of common stock |
|
|
71.5 |
|
|
|
— |
|
|
|
112.4 |
|
|
Net cash provided by financing activities |
|
|
71.5 |
|
|
|
— |
|
|
|
112.4 |
|
|
Net increase (decrease) in cash and cash equivalents |
|
|
— |
|
|
|
(11.1 |
) |
|
|
10.7 |
|
|
Cash and cash equivalents—beginning of period |
|
|
— |
|
|
|
11.1 |
|
|
|
0.4 |
|
|
Cash and cash equivalents—end of period |
|
$ |
— |
|
|
$ |
— |
|
|
$ |
11.1 |
|
See Notes to Condensed Financial Statements.
86
SCHEDULE I—CONDENSED FINANCIAL INFORMATION OF REGISTRANT
RYERSON HOLDING CORPORATION
(Parent Company Only)
BALANCE SHEETS
(In millions, except shares)
|
|
|
At December 31, |
|
|||||
|
|
|
2016 |
|
|
2015 |
|
||
|
Assets |
|
|
|
|
|
|
|
|
|
Long-term receivable from subsidiaries |
|
$ |
71.7 |
|
|
$ |
— |
|
|
Deferred income taxes |
|
|
46.0 |
|
|
|
29.9 |
|
|
Total assets |
|
$ |
117.7 |
|
|
$ |
29.9 |
|
|
Liabilities |
|
|
|
|
|
|
|
|
|
Accrued liabilities |
|
$ |
0.1 |
|
|
$ |
0.6 |
|
|
Payable to subsidiaries |
|
|
1.5 |
|
|
|
— |
|
|
Total current liabilities |
|
|
1.6 |
|
|
|
0.6 |
|
|
Dividends in excess of investment in subsidiaries |
|
|
166.9 |
|
|
|
170.9 |
|
|
Total liabilities |
|
|
168.5 |
|
|
|
171.5 |
|
|
Ryerson Holding Corporation Stockholders’ equity (deficit) |
|
|
|
|
|
|
|
|
|
Preferred stock, $0.01 par value; 7,000,000 shares authorized and no shares issued at 2016 and 2015 |
|
|
— |
|
|
|
— |
|
|
Common stock, $0.01 par value; 100,000,000 shares authorized and 37,345,117 shares issued at 2016; 100,000,000 shares authorized and 32,312,200 issued at 2015 |
|
|
0.4 |
|
|
|
0.3 |
|
|
Capital in excess of par value |
|
|
375.4 |
|
|
|
302.6 |
|
|
Accumulated deficit |
|
|
(112.2 |
) |
|
|
(130.9 |
) |
|
Treasury stock at cost – Common stock of 212,500 shares in 2016 and 2015 |
|
|
(6.6 |
) |
|
|
(6.6 |
) |
|
Accumulated other comprehensive loss |
|
|
(307.8 |
) |
|
|
(307.0 |
) |
|
Total Ryerson Holding Corporation stockholders’ equity (deficit) |
|
|
(50.8 |
) |
|
|
(141.6 |
) |
|
Total liabilities and stockholders’ equity |
|
$ |
117.7 |
|
|
$ |
29.9 |
|
See Notes to Condensed Financial Statements.
87
SCHEDULE I—CONDENSED FINANCIAL INFORMATION OF REGISTRANT
RYERSON HOLDING CORPORATION
(Parent Company Only)
NOTES TO FINANCIAL STATEMENTS
(In millions)
Note 1: Basis of presentation
In the parent company only financial statements, Ryerson Holding’s investment in subsidiaries is stated at cost plus equity in undistributed earnings of subsidiaries since the date of acquisition. Ryerson Holding’s share of net income (loss) of its unconsolidated subsidiaries is included in consolidated income using the equity method. The parent company only financial statements should be read in conjunction with the Company’s consolidated financial statements.
Note 2: Guarantees
On May 24, 2016, Ryerson Holding provided an unconditional guarantee of the 2022 Notes, jointly and severally with the other guarantors of the 2022 Notes. Ryerson Holding previously guaranteed the 2017 Notes and 2018 Notes until their repayment in 2016.
Note 3: Dividends from subsidiaries
There were no cash dividends paid to Ryerson Holding from its consolidated subsidiaries for the years ended December 31, 2016, 2015 and 2014.
88
RYERSON HOLDING CORPORATION AND SUBSIDIARY COMPANIES
SCHEDULE II—VALUATION AND QUALIFYING ACCOUNTS
FOR THE YEARS ENDED DECEMBER 31, 2016, 2015 AND 2014
(In millions)
|
|
|
|
|
|
|
Provision for Allowances |
|
|||||||||||||||||||
|
|
|
Balance at Beginning of Period |
|
|
Acquisition of Business |
|
|
|
Additions Charged (Credited) to Income |
|
|
Additions Charged to Other Comprehensive Income (Loss) |
|
|
Deductions from Reserves |
|
|
|
Balance at End of Period |
|
||||||
|
Year Ended December 31, 2016 |
|
|
|
|
|
|
|
|
|
|
|
|
|
|
|
|
|
|
|
|
|
|
|
|
|
|
|
Allowance for doubtful accounts |
|
$ |
5.2 |
|
|
$ |
— |
|
|
|
$ |
3.1 |
|
|
$ |
— |
|
|
$ |
(3.7 |
) |
(A) |
|
$ |
4.6 |
|
|
Valuation allowance—deferred tax assets |
|
|
22.6 |
|
|
|
— |
|
|
|
|
(2.6 |
) |
|
|
— |
|
|
|
— |
|
|
|
|
20.0 |
|
|
Year Ended December 31, 2015 |
|
|
|
|
|
|
|
|
|
|
|
|
|
|
|
|
|
|
|
|
|
|
|
|
|
|
|
Allowance for doubtful accounts |
|
$ |
5.3 |
|
|
$ |
— |
|
|
|
$ |
2.3 |
|
|
$ |
— |
|
|
$ |
(2.4 |
) |
(A) |
|
$ |
5.2 |
|
|
Valuation allowance—deferred tax assets |
|
|
22.5 |
|
|
|
— |
|
|
|
|
0.1 |
|
|
|
— |
|
|
|
— |
|
|
|
|
22.6 |
|
|
Year Ended December 31, 2014 |
|
|
|
|
|
|
|
|
|
|
|
|
|
|
|
|
|
|
|
|
|
|
|
|
|
|
|
Allowance for doubtful accounts |
|
$ |
5.4 |
|
|
$ |
— |
|
|
|
$ |
0.7 |
|
|
$ |
— |
|
|
$ |
(0.8 |
) |
(A) |
|
$ |
5.3 |
|
|
Valuation allowance—deferred tax assets |
|
|
23.1 |
|
|
|
— |
|
|
|
|
(0.6 |
) |
|
|
— |
|
|
|
— |
|
|
|
|
22.5 |
|
NOTES:
|
(A) |
Bad debts written off during the year. |
89
None.
Evaluation of Disclosure Controls and Procedures
We maintain disclosure controls and procedures that are designed to ensure that information required to be disclosed in our reports filed under the Securities Exchange Act of 1934, as amended, is recorded, processed, summarized and reported within the time periods specified in the SEC’s rules and forms and that such information is accumulated and communicated to our management, including our Chief Executive Officer and Chief Financial Officer, as appropriate, to allow for timely decisions regarding required disclosure. In designing and evaluating the disclosure controls and procedures, management recognizes that any controls and procedures, no matter how well designed and operated, can provide only reasonable assurance of achieving the desired control objectives, and management is required to apply its judgment in evaluating the cost-benefit relationship of possible controls and procedures.
As required by SEC Rule 15d-15(b), we carried out an evaluation, under the supervision and with the participation of our management, including the Chief Executive Officer and Chief Financial Officer, of the effectiveness of the design and operation of our disclosure controls and procedures pursuant to SEC Rule 13a-15 as of the end of the period covered by this report. Based on the foregoing, our Chief Executive Officer and Chief Financial Officer concluded that our disclosure controls and procedures were effective as of December 31, 2016.
Management’s Annual Report on Internal Control Over Financial Reporting and Attestation Report of Independent Registered Public Accounting Firm
The report of management on our internal control over financial reporting as of December 31, 2016 and the attestation report of our independent registered public accounting firm on our internal control over financial reporting are set forth in Part II, "Item 8. Financial Statements and Supplementary Data" in this report.
Changes in Internal Control over Financial Reporting
There have been no changes in the Company’s internal controls over financial reporting that has materially affected or is reasonably likely to materially affect the Company’s internal controls over financial reporting during the quarter ended December 31, 2016.
None.
90
The information required by this item is incorporated by reference to our Proxy Statement for the 2017 Annual Meeting of Stockholders to be filed with the Securities and Exchange Commission (SEC) within 120 days of the fiscal year ended December 31, 2016.
Our board of directors has adopted a Code of Ethics and Business Conduct applicable to all officers, directors and employees, which is available on our website (www.ryerson.com) under "Governance Documents." We intend to satisfy the disclosure requirement under Item 5.05 of Form 8-K regarding amendment to, or waiver from, a provision of our Code of Ethics and Business Conduct and by posting such information on the website address and location specified above.
Code of Ethics
Our Board of Directors has adopted a Code of Ethics that contains the ethical principles by which our chief executive officer, chief financial officer and general counsel, among others, are expected to conduct themselves when carrying out their duties and responsibilities. A copy of our Code of Ethics may be found on our website at www.ryerson.com. Our website is not incorporated by reference into this Annual Report. We will provide a copy of our Code of Ethics to any person, without charge, upon request, by writing to the Compliance Officer, Ryerson Holding Corporation, 227 West Monroe Street, 27th Floor, Chicago, Illinois 60606 (telephone number (312) 292-5000). We intend to satisfy the disclosure requirement under Item 5.05 of Form 8-K regarding an amendment to, or waiver from, a provision of our Code of Ethics by posting such information on our website at www.ryerson.com or by filing a Form 8-K with the SEC.
Information concerning compensation of our executive officers and directors for the year ended December 31, 2016, is presented under the captions “Executive Compensation,” “Compensation Tables,” and “Director Compensation” in our proxy statement. This information is incorporated herein by reference.
Information concerning compensation committee interlocks is presented under the caption “Compensation Committee—Compensation Committee Interlocks and Insider Participation” in our proxy statement and is incorporated herein by reference.
The report of our Compensation Committee can be found under the caption “Compensation Committee Report” in our proxy statement and is incorporated herein by reference.
|
ITEM 12. |
SECURITY OWNERSHIP OF CERTAIN BENEFICIAL OWNERS AND MANAGEMENT AND RELATED STOCKHOLDER MATTERS. |
Information concerning the security ownership of certain beneficial owners as of February 28, 2017, is set forth under the caption “Stock Ownership—Ownership of More Than 5% of Ryerson Stock” in our proxy statement and is incorporated herein by reference.
Information concerning the security ownership of our directors and executive officers as of February 28, 2017, is set forth under the caption “Stock Ownership—Directors and Executive Officers” in our proxy statement and is incorporated herein by reference.
Securities Authorized for Issuance under Equity Compensation Plans
Our stockholders have approved our 2014 Omnibus Incentive Plan, which is the Company’s only equity compensation plan.
91
Securities Authorized for Issuance under Equity Compensation Plans
The table below presents our equity compensation plan information as of December 31, 2016:
|
Plan Category |
|
Number of securities to be issued upon exercise of outstanding options, warrants and rights |
|
|
|
Weighted-average exercise price of outstanding options, warrants and rights |
|
|
Number of securities remaining available for future issuance under equity compensation plans (excluding securities reflected in first column) |
|
|||
|
Equity compensation plans approved by security holders (1) |
|
|
543,931 |
|
(2) |
|
$ |
— |
|
|
|
1,055,952 |
|
|
Equity compensation plans not approved by security holders |
|
|
— |
|
|
|
|
— |
|
|
|
— |
|
|
Total |
|
|
543,931 |
|
|
|
$ |
— |
|
|
|
1,055,952 |
|
|
|
(1) |
Consists of the Company’s “2014 Omnibus Incentive Plan,” which is described in Amendment No. 23 to our registration statement on Form S-1, filed on August 7, 2014. |
|
|
(2) |
Includes (i) 346,675 shares of our common stock subject to performance units, which vest depending on continued employment or service and the level of attainment of certain performance metrics and (ii) 197,256 shares of our common stock subject to restricted stock units, which vest depending on continued employment or service. |
Information concerning the independence of our directors, certain relationships and related transactions during 2016 and our policies with respect to such transactions is set forth under the captions “Board of Directors” and “Related Party Transactions” in our proxy statement and is incorporated herein by reference.
Information concerning principal accountant fees and services is set forth under the captions “Items You May Vote On—Ratification of the Appointment of Independent Registered Public Accounting Firm,” “Audit Committee—Audit, Audit-Related, and Other Non-Audit Services,” and “Audit Committee—Pre-Approval Policies” in our proxy statement and is incorporated herein by reference.
92
(a) Financial Statements and Schedules
The following financial statements and schedules listed below are included in this Form 10-K:
Financial Statements (See Item 8)
Schedule I
Schedule II
All other schedules are omitted since the required information is not present or is not present in amounts sufficient to require submission of the schedules.
(b) Exhibits
The exhibits required to be filed by Item 601 of Regulation S-K are listed in the Exhibit Index, which is attached hereto, and incorporated by reference herein.
93
Pursuant to the requirements of Section 13 or 15(d) of the Securities Exchange Act of 1934, Ryerson Holding Corporation has duly caused this report to be signed on its behalf by the undersigned, thereunto duly authorized.
|
RYERSON HOLDING CORPORATION |
||
|
|
||
|
By: |
|
/s/ Erich S. Schnaufer |
|
|
|
Erich S. Schnaufer |
|
|
|
Chief Financial Officer (duly authorized signatory and principal financial officer of the registrant) |
Date: March 13, 2017
Pursuant to the requirements of the Securities Exchange Act of 1934, this report has been signed below by the following persons on behalf of the registrant and in the capacities and on the dates indicated.
|
Signature |
|
Title |
|
Date |
|
|
|
|
|
|
|
/s/ Edward J. Lehner |
|
President and Chief Executive Officer (Principal Executive Officer) |
|
March 13, 2017 |
|
Edward J. Lehner |
|
|
|
|
|
|
|
|
|
|
|
/s/ Erich S. Schnaufer |
|
Chief Financial Officer (Principal Financial Officer and Principal Accounting Officer) |
|
March 13, 2017 |
|
Erich S. Schnaufer |
|
|
|
|
|
|
|
|
|
|
|
/s/ Kirk K. Calhoun |
|
Director |
|
March 13, 2017 |
|
Kirk K. Calhoun |
|
|
|
|
|
|
|
|
|
|
|
/s/ Court D. Carruthers |
|
Director |
|
March 13, 2017 |
|
Court D. Carruthers |
|
|
|
|
|
|
|
|
|
|
|
/s/ Eva M. Kalawski |
|
Director |
|
March 13, 2017 |
|
Eva M. Kalawski |
|
|
|
|
|
|
|
|
|
|
|
/s/ Jacob Kotzubei |
|
Director |
|
March 13, 2017 |
|
Jacob Kotzubei |
|
|
|
|
|
|
|
|
|
|
|
/s/ Stephen P. Larson |
|
Director |
|
March 13, 2017 |
|
Stephen P. Larson |
|
|
|
|
|
|
|
|
|
|
|
/s/ Philip E. Norment |
|
Director |
|
March 13, 2017 |
|
Philip E. Norment |
|
|
|
|
|
|
|
|
|
|
|
/s/ Mary Ann Sigler |
|
Director |
|
March 13, 2017 |
|
Mary Ann Sigler |
|
|
|
|
94
EXHIBIT INDEX
|
Exhibit |
|
|
|
Incorporated by Reference |
|
Filed or Furnished |
||||
|
Number |
|
Exhibit Description |
|
Form |
|
File No. |
|
Filing Date |
|
Herewith |
|
|
|
|
|
|
|
|
|
|
|
|
|
3.1 |
|
Form of Third Amended and Restated Certificate of Incorporation of Ryerson Holding Corporation. |
|
S-1/A-22 |
|
333-164484 |
|
August 6, 2014 |
|
|
|
|
|
|
|
|
|
|
|
|
|
|
|
3.2 |
|
Form of Amended and Restated Bylaws of Ryerson Holding Corporation. |
|
S-1/A-15 |
|
333-164484 |
|
May 6, 2013 |
|
|
|
|
|
|
|
|
|
|
|
|
|
|
|
4.1 |
|
Form of Common Stock Certificate of Ryerson Holding Corporation. |
|
10-K |
|
001-34735 |
|
March 9, 2016 |
|
|
|
|
|
|
|
|
|
|
|
|
|
|
|
4.2 |
|
Indenture, dated as of May 24, 2016, by and among Joseph T. Ryerson & Son, Inc., as Issuer, the Guarantors party thereto, and Wells Fargo Bank, National Association, as the Trustee, relating to the Issuer’s 11.00% Senior Secured Notes due 2022. |
|
8-K |
|
001-34735 |
|
May 24, 2016 |
|
|
|
|
|
|
|
|
|
|
|
|
|
|
|
4.3 |
|
Form of Investor Rights Agreement, by and among Ryerson Holding Corporation, Platinum Equity Capital Partners, L.P., Platinum Equity Capital Partners-PF, L.P., Platinum Equity Capital Partners-A, L.P., Platinum Equity Capital Partners II, L.P., Platinum Equity Capital Partners-PF II, L.P., Platinum Equity Capital Partners-A II, L.P. and Platinum Rhombus Principals, LLC. |
|
S-1/A-15 |
|
333-164484 |
|
May 6, 2013 |
|
|
|
|
|
|
|
|
|
|
|
|
|
|
|
10.1 |
|
General Security Agreement, dated October 19, 2007, by and between Ryerson Canada, Inc. and Bank of America, N.A., as Canadian Agent. |
|
S-4 |
|
333-152102 |
|
July 3, 2008 |
|
|
|
|
|
|
|
|
|
|
|
|
|
|
|
10.2 |
|
Ryerson Nonqualified Savings Plan. |
|
S-4/A-2 |
|
333-152102 |
|
February 24, 2009 |
|
|
|
|
|
|
|
|
|
|
|
|
|
|
|
10.3 |
|
Ryerson Holding Corporation Retention Bonus Plan. |
|
S-1/A-19 |
|
333-164484 |
|
June 24, 2014 |
|
|
|
|
|
|
|
|
|
|
|
|
|
|
|
10.4 |
|
Ryerson Annual Incentive Plan (as amended through June 14, 2007). |
|
S-1 |
|
333-164484 |
|
January 22, 2010 |
|
|
|
|
|
|
|
|
|
|
|
|
|
|
|
10.5 |
|
Ryerson Holding Corporation 2014 Omnibus Incentive Plan. |
|
S-1/A-21 |
|
333-164484 |
|
July 24, 2014 |
|
|
|
|
|
|
|
|
|
|
|
|
|
|
|
10.6 |
|
Offer Letter Agreement, dated May 7, 2015, by and between Ryerson Holding Corporation and Edward J. Lehner. |
|
8-K |
|
001-34735 |
|
May 8, 2015 |
|
|
|
|
|
|
|
|
|
|
|
|
|
|
|
10.7 |
|
Confidentiality, Non-Competition and Non-Solicitation Agreement, dated June 1, 2015, by and between Ryerson Holding Corporation and Edward J. Lehner. |
|
8-K |
|
001-34735 |
|
June 5, 2015 |
|
|
|
|
|
|
|
|
|
|
|
|
|
|
95
|
10.8 |
|
Form of 2015 Restricted Stock Unit Agreement. |
|
10-Q |
|
001-34735 |
|
August 12, 2015 |
|
|
|
|
|
|
|
|
|
|
|
|
|
|
|
10.9 |
|
Form of 2015 Performance Unit Agreement. |
|
10-Q |
|
001-34735 |
|
August 12, 2015 |
|
|
|
|
|
|
|
|
|
|
|
|
|
|
|
10.10 |
|
Form of Director and Officer Indemnification Agreement. |
|
S-1/A18 |
|
333-164484 |
|
March 27, 2014 |
|
|
|
|
|
|
|
|
|
|
|
|
|
|
|
10.11 |
|
Form of Participation Agreement for the Ryerson Holding Corporation Retention Bonus Plan. |
|
S-1/A-19 |
|
333-164484 |
|
June 24, 2014 |
|
|
|
|
|
|
|
|
|
|
|
|
|
|
|
10.12 |
|
Form of Incentive Compensation Award Agreement by and between Ryerson Holding Corporation and Michael C. Arnold. |
|
S-1/A-19 |
|
333-164484 |
|
June 24, 2014 |
|
|
|
|
|
|
|
|
|
|
|
|
|
|
|
10.13 |
|
Employment Agreement, dated December 10, 2004, between Ryerson Tull, Inc. and Kevin D. Richardson, as amended. |
|
10-Q |
|
001-34735 |
|
May 7, 2015 |
|
|
|
|
|
|
|
|
|
|
|
|
|
|
|
10.14 |
|
Employment Agreement, dated January 3, 2005, between Ryerson Tull, Inc. and Michael Burbach, as amended. |
|
10-Q |
|
001-34735 |
|
May 7, 2015 |
|
|
|
|
|
|
|
|
|
|
|
|
|
|
|
10.15 |
|
Directors Compensation Summary Sheet. |
|
10-K |
|
001-34735 |
|
March 9, 2016 |
|
|
|
|
|
|
|
|
|
|
|
|
|
|
|
10.16 |
|
Intercreditor Agreement by and between Bank of America, N.A. as ABL Collateral Agent and Wells Fargo Bank, National Association, as Notes Collateral Agent Dated as of October 10, 2012. |
|
10-K |
|
001-34735 |
|
March 9, 2016 |
|
|
|
|
|
|
|
|
|
|
|
|
|
|
|
10.17 |
|
Amendment No. 1, dated as of March 11, 2015, to the Intercreditor Agreement dated as of October 10, 2012, by and between Bank of America, N.A. as ABL Collateral Agent and Wells Fargo Bank, National Association, as Notes Collateral Agent. |
|
10-K |
|
001-34735 |
|
March 9, 2016 |
|
|
|
|
|
|
|
|
|
|
|
|
|
|
|
10.18 |
|
Joinder Agreement dated as of July 24, 2015, to Intercreditor Agreement dated as of October 10, 2012 and amended as of March 11, 2015 by and between Bank of America, N.A. as ABL Collateral Agent and Wells Fargo Bank, National Association, as Notes Collateral Agent. |
|
10-K |
|
001-34735 |
|
March 9, 2016 |
|
|
|
|
|
|
|
|
|
|
|
|
|
|
96
|
10.19 |
|
Credit Agreement, dated as of July 24, 2015, among Ryerson Holding Corporation, Joseph T. Ryerson & Son, Inc., Sunbelt-Turret Steel, Inc., Turret Steel Industries, Inc., Imperial Trucking Company, LLC, Wilcox-Turret Cold Drawn, Inc., Fay Industries, Inc., Ryerson Procurement Corporation, Ryerson Canada, Inc., and each of the other borrowers and guarantors, the lenders party thereto from time to time, and Bank of America, N.A., as the administrative agent and collateral agent. |
|
8-K |
|
001-34735 |
|
July 29, 2015 |
|
|
|
|
|
|
|
|
|
|
|
|
|
|
|
10.20 |
|
Amendment No. 1, dated as of November 16, 2016, to the Credit Agreement, dated as of July 24, 2015, by and among Ryerson Holding Corporation, Joseph T. Ryerson & Son, Inc., Ryerson Canada, Inc., and each of the other borrowers and guarantors, the lenders party thereto from time to time, and Bank of America, N.A., as the administrative agent and collateral agent. |
|
8-K |
|
001-34735 |
|
November 17, 2016 |
|
|
|
|
|
|
|
|
|
|
|
|
|
|
|
10.21 |
|
Security Agreement, dated as of July 24, 2015, Ryerson Holding Corporation, Joseph T. Ryerson & Son, Inc. (“Ryerson”), and the domestic subsidiaries of Ryerson from time to time party thereto in their capacities as pledgors, assignors and debtors thereunder in favor of Bank of America, N.A., in its capacity as collateral agent, as pledgee, assignee and secured party for the benefit of the secured parties. |
|
10-K |
|
001-34735 |
|
March 9, 2016 |
|
|
|
|
|
|
|
|
|
|
|
|
|
|
|
10.22 |
|
Canadian Security Agreement dated as of July 24, 2015 between Ryerson Canada, Inc. and Bank of America, N.A., in its capacity as collateral agent. |
|
8-K |
|
001-34735 |
|
July 29, 2015 |
|
|
|
|
|
|
|
|
|
|
|
|
|
|
|
10.23 |
|
Canadian Security Agreement dated as of July 24, 2015 between Turret Steel Canada, ULC, and Bank of America, N.A., in its capacity as collateral agent. |
|
8-K |
|
001-34735 |
|
July 29, 2015 |
|
|
|
|
|
|
|
|
|
|
|
|
|
|
|
10.24 |
|
Employment Agreement, dated September 8, 2005, between Ryerson Tull, Inc. and Erich Schnaufer, as amended. |
|
10-K |
|
001-34735 |
|
March 9, 2016 |
|
|
|
|
|
|
|
|
|
|
|
|
|
|
|
21.1 |
|
List of Subsidiaries of Ryerson Holding Corporation. |
|
|
|
|
|
|
|
X |
|
|
|
|
|
|
|
|
|
|
|
|
|
23.1 |
|
Consent of Ernst & Young LLP, Independent Registered Public Accounting Firm. |
|
|
|
|
|
|
|
X |
|
|
|
|
|
|
|
|
|
|
|
|
97
|
31.1 |
|
Certificate of the Principal Executive Officer of the Company, as adopted pursuant to Section 302 of the Sarbanes-Oxley Act of 2002. |
|
|
|
|
|
|
|
X |
|
|
|
|
|
|
|
|
|
|
|
|
|
31.2 |
|
Certificate of the Principal Financial Officer of the Company, as adopted pursuant to Section 302 of the Sarbanes-Oxley Act of 2002. |
|
|
|
|
|
|
|
X |
|
|
|
|
|
|
|
|
|
|
|
|
|
32.1 |
|
Written Statement of Edward J. Lehner, President and Chief Executive Officer of the Company pursuant to 18 U.S.C. Section 1350, as adopted pursuant to Section 906 of the Sarbanes-Oxley Act of 2002.* |
|
|
|
|
|
|
|
X |
|
|
|
|
|
|
|
|
|
|
|
|
|
32.2 |
|
Written Statement of Erich S. Schnaufer, Chief Financial Officer, of the Company pursuant to 18 U.S.C. Section 1350, as adopted pursuant to Section 906 of the Sarbanes-Oxley Act of 2002.* |
|
|
|
|
|
|
|
X |
|
|
|
|
|
|
|
|
|
|
|
|
|
101.INS |
|
XBRL Instance Document. |
|
|
|
|
|
|
|
X |
|
|
|
|
|
|
|
|
|
|
|
|
|
101.SCH |
|
XBRL Taxonomy Extension Schema Document. |
|
|
|
|
|
|
|
X |
|
|
|
|
|
|
|
|
|
|
|
|
|
101.CAL |
|
XBRL Taxonomy Extension Calculation Linkbase Document. |
|
|
|
|
|
|
|
X |
|
|
|
|
|
|
|
|
|
|
|
|
|
101.DEF |
|
XBRL Taxonomy Extension Definition Linkbase Document. |
|
|
|
|
|
|
|
X |
|
|
|
|
|
|
|
|
|
|
|
|
|
101.LAB |
|
XBRL Taxonomy Extension Label Linkbase Document. |
|
|
|
|
|
|
|
X |
|
|
|
|
|
|
|
|
|
|
|
|
|
101.PRE |
|
XBRL Taxonomy Extension Presentation Linkbase Document. |
|
|
|
|
|
|
|
X |
|
|
|
|
|
|
|
|
|
|
|
|
*Furnished herewith.
98