Attached files
| file | filename |
|---|---|
| EX-99.1 - EXHIBIT 99.1 - CMS ENERGY CORP | tm2119065d1_ex99-1.htm |
| EX-10.1 - EXHIBIT 10.1 - CMS ENERGY CORP | tm2119065d1_ex10-1.htm |
| 8-K - FORM 8-K - CMS ENERGY CORP | tm2119065d1_8k.htm |
Exhibit 99.2

Strategic Sale of EnerBank June 8, 2021

2 Enter “so what” if necessary – Century Gothic, Bold, Size 18 or smaller This presentation is made as of the date hereof and contains “forward - looking statements” as defined in Rule 3b - 6 of the Securit ies Exchange Act of 1934, Rule 175 of the Securities Act of 1933, and relevant legal decisions. The forward - looking statements are subject to risks and uncertainties. All forward - looking statements should be considered in the context of the risk and other factors detailed from time to time in CMS Energy’s and Consumers Energy’s Securities and Exchange Commi ssi on filings. Forward - looking statements should be read in conjunction with “FORWARD - LOOKING STATEMENTS AND INFORMATION” and “RISK FACTORS” sections of CMS Energy’s and Consumers Energy’s most recent Form 10 - K and as updated in reports CMS Energy and Consumers Energy file with the Securities and Exchange Commission. CMS Energy’s and Con sum ers Energy’s “FORWARD - LOOKING STATEMENTS AND INFORMATION” and “RISK FACTORS” sections are incorporated herein by reference and discuss important factors th at could cause CMS Energy’s and Consumers Energy’s results to differ materially from those anticipated in such statements. CMS Energy and Consumers Energy undertake n o o bligation to update any of the information presented herein to reflect facts, events or circumstances after the date hereof. The presentation also includes non - GAAP measures when describing CMS Energy’s results of operations and financial performance. A reconciliation of each of these measures to the most directly comparable GAAP measure is included in the appendix and posted on our website at www.cmsenergy.com . CMS Energy provides historical financial results on both a reported (GAAP) and adjusted (non - GAAP) basis and provides forward - lo oking guidance on an adjusted basis. During an oral presentation, references to “earnings” are on an adjusted basis. References to earnings per share (EPS) are on a dilute d basis and calculated based on net income available to common stockholders. Adjustments could include items such as discontinued operations, asset sales, impairments, re structuring costs, changes in accounting principles, changes in federal tax policy, regulatory items from prior years, unrealized gains or losses, recognized in net income, from mark - to - market adjustments related to CMS Enterprises’ interest expense, or other items. Management views adjusted EPS as a key measure of the company’s present op erating financial performance and uses adjusted EPS for external communications with analysts and investors. Internally, the company uses adjusted EPS to measure and assess performance. Because the company is not able to estimate the impact of specific line items, which have the potential to significantly impact, favorably or unfavorabl y, the company's reported EPS in future periods, the company is not providing reported EPS guidance nor is it providing a reconciliation for the comparable future period EPS. The a djusted EPS should be considered supplemental information to assist in understanding our business results, rather than as a substitute for the reported EPS. Investors and others should note that CMS Energy routinely posts important information on its website and considers the Inves tor Relations section, www.cmsenergy.com/investor - relations , a channel of distribution. Presentation endnotes are included after the appendix. 2

3 Garrick Rochow President and CEO Leading a World Class Energy Company

4 Transaction Overview Transaction: Sale of EnerBank Buyer: Regions Bank, a subsidiary of Regions Financial Corporation (NYSE: RF) Transaction Value: $960 MM for 100% stake • EnerBank will merge with Regions Bank; Regions Bank will assume EnerBank’s assets and liabilities, including deposits • (3.0x book equity value a ) Use of Proceeds: Eliminates planned equity issuances from 2022 to 2024 and funds ongoing utility customer investments Anticipated Closing: Q4 2021 • Subject to required regulatory approvals and other customary closing conditions Presentation endnotes are included after the appendix.
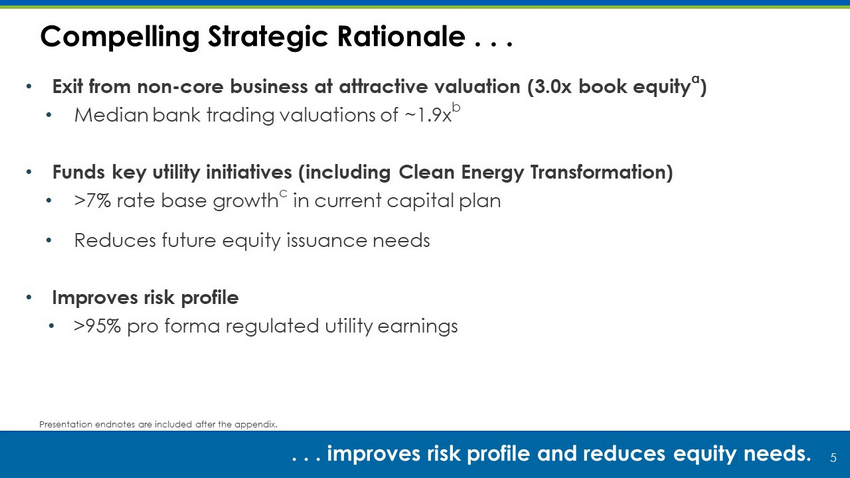
5 Compelling Strategic Rationale . . . . . . improves risk profile and reduces equity needs. Presentation endnotes are included after the appendix. • Exit from non - core business at attractive valuation (3.0x book equity a ) • Median bank trading valuations of ~1.9x b • Funds key utility initiatives (including Clean Energy Transformation) • >7% rate base growth c in current capital plan • Reduces future equity issuance needs • Improves risk profile • >95% pro forma regulated utility earnings

6 Revised 2021 Guidance . . . . . . reflects EnerBank in Discontinued Ops. Utility Enterprises EnerBank Parent and Other Continuing Operations Discontinued Operations Consolidated EPS Original Adjusted EPS +6% to +8% Revised Adjusted EPS $3.03 – $3.07 0.12 – 0.13 0.20 – 0.22 (0.52) – (0.55) $2.83 – $2.87 – – $2.83 – $2.87 Presentation endnotes are included after the appendix. $3.03 – $3.07 0.12 – 0.13 Disc. Ops (0.52) – (0.55) $2.61 – $2.65 0.22 $2.83 – $2.87 a
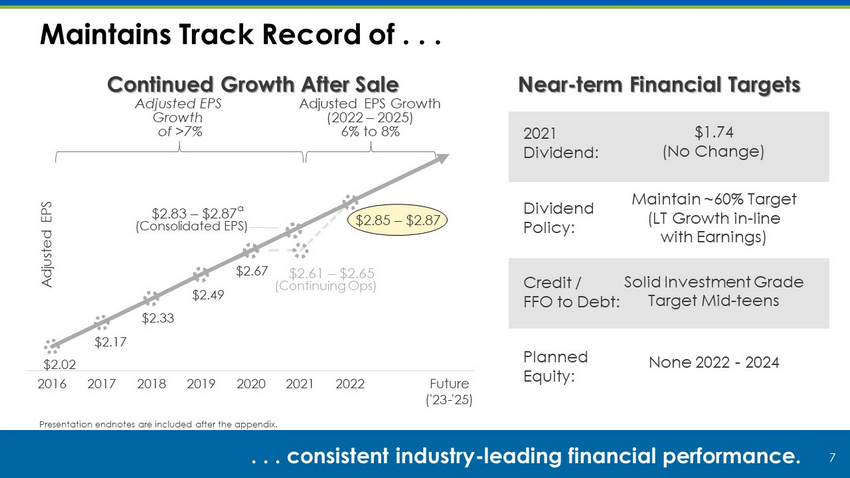
Maintains Track Record of . . . 7 . . . consistent industry - leading financial performance. Continued Growth After Sale Adjusted EPS Growth (2022 – 2025) 6% to 8% 2021 Dividend: Dividend Policy: Credit / FFO to Debt: Planned Equity: $1.74 (No Change) Maintain ~60% Target (LT Growth in - line with Earnings) Solid Investment Grade Target Mid - teens None 2022 - 2024 Near - term Financial Targets Adjusted EPS Growth of >7% 2016 2017 2018 2019 2020 2021 2022 Future ('23-'25) Adjusted EPS $2.83 – $2.87 a (Consolidated EPS) $2.61 – $2.65 (Continuing Ops) $2.49 $2.67 $2.33 $2.17 $2.02 Presentation endnotes are included after the appendix. $2.85 – $2.87
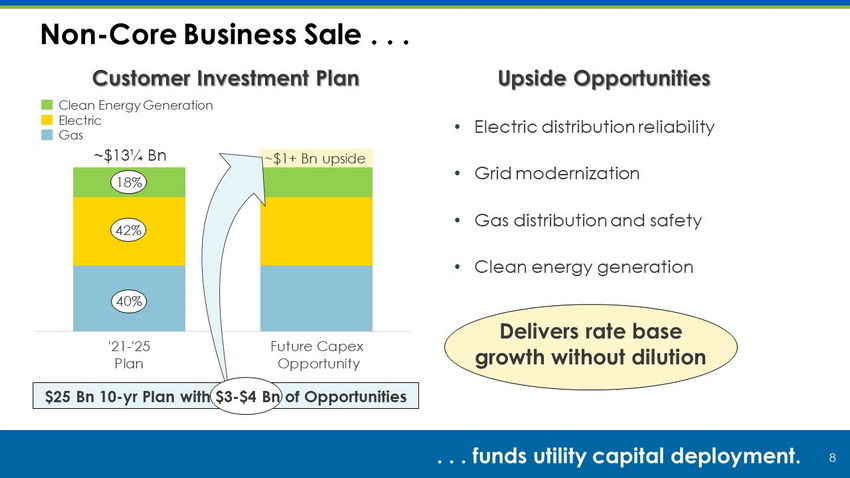
Non - Core Business Sale . . . 8 . . . funds utility capital deployment. Customer Investment Plan Upside Opportunities • Electric distribution reliability • Grid modernization • Gas distribution and safety • Clean energy generation '21-'25 Plan Future Capex Opportunity 40% 42% Clean Energy Generation Electric Gas ~$13¼ Bn 18% $25 Bn 10 - yr Plan with $3 - $4 Bn of Opportunities ~$1+ Bn upside Delivers rate base growth without dilution
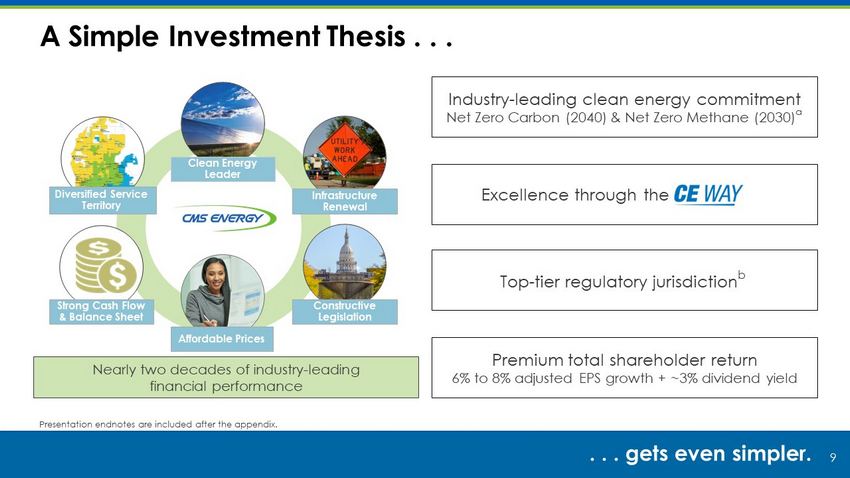
9 A Simple Investment Thesis . . . . . . gets even simpler. Infrastructure Renewal Constructive Legislation Strong Cash Flow & Balance Sheet Clean Energy Leader Diversified Service Territory Nearly two decades of industry - leading financial performance Affordable Prices Industry - leading clean energy commitment Net Zero Carbon (2040) & Net Zero Methane (2030) a Excellence through the Top - tier regulatory jurisdiction b Premium total shareholder r eturn 6% to 8% adjusted EPS growth + ~3% dividend yield Presentation endnotes are included after the appendix.

10 10 Q&A Thank You

11 11 Endnotes
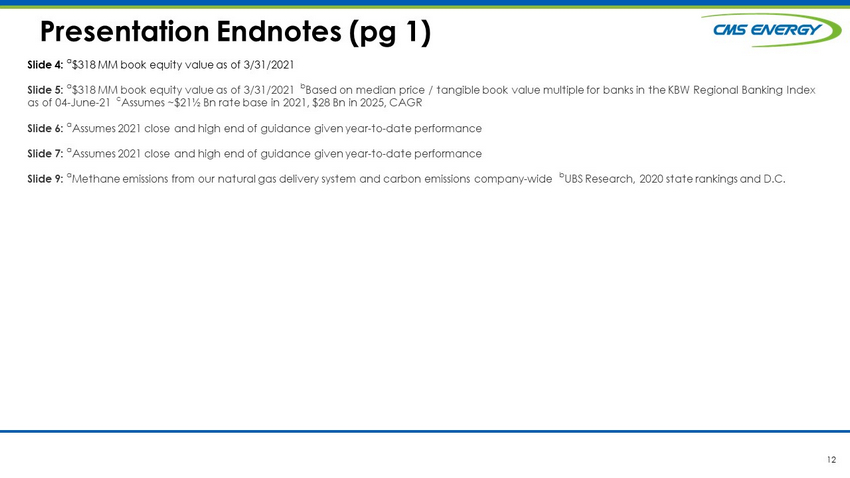
12 12 Slide 4: a $318 MM book equity value as of 3/31/2021 Slide 5: a $318 MM book equity value as of 3/31/2021 b Based on median price / tangible book value multiple for banks in the KBW Regional Banking Index as of 04 - June - 21 c Assumes ~$21½ Bn rate base in 2021, $28 Bn in 2025, CAGR Slide 6: a A ssumes 2021 close and high end of guidance given year - to - date performance Slide 7: a Assumes 2021 close and high end of guidance given year - to - date performance Slide 9: a Methane emissions from our natural gas delivery system and carbon emissions company - wide b UBS Research, 2020 state rankings and D.C. Presentation Endnotes ( pg 1)
13 13 GAAP Reconciliation
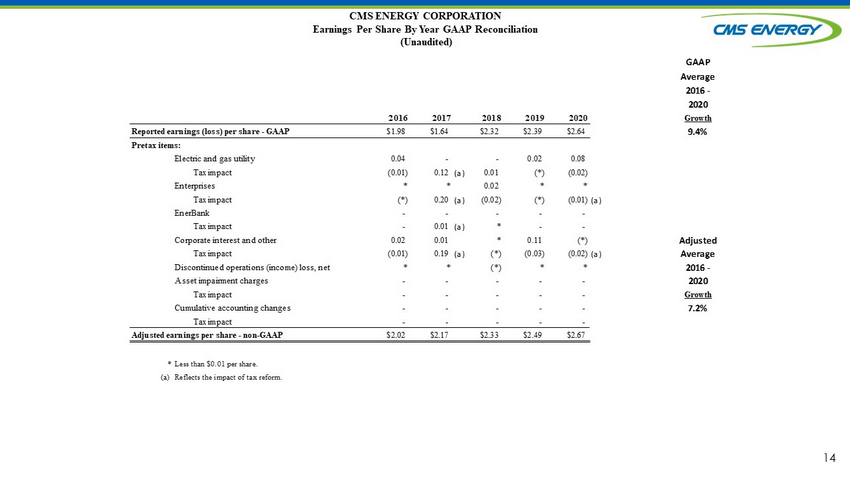
14 CMS ENERGY CORPORATION Earnings Per Share By Year GAAP Reconciliation (Unaudited) GAAP Average 2016 - 2020 2016 2017 2018 2019 2020 Growth Reported earnings (loss) per share - GAAP $1.98 $1.64 $2.32 $2.39 $2.64 9.4% Pretax items: Electric and gas utility 0.04 - - 0.02 0.08 Tax impact (0.01) 0.12 (a) 0.01 (*) (0.02) Enterprises * * 0.02 * * Tax impact (*) 0.20 (a) (0.02) (*) (0.01)(a) EnerBank - - - - - Tax impact - 0.01 (a) * - - Corporate interest and other 0.02 0.01 * 0.11 (*) Adjusted Tax impact (0.01) 0.19 (a) (*) (0.03) (0.02)(a) Average Discontinued operations (income) loss, net * * (*) * * 2016 - Asset impairment charges - - - - - 2020 Tax impact - - - - - Growth Cumulative accounting changes - - - - - 7.2% Tax impact - - - - - Adjusted earnings per share - non-GAAP $2.02 $2.17 $2.33 $2.49 $2.67 * Less than $0.01 per share. (a) Reflects the impact of tax reform.