Attached files
| file | filename |
|---|---|
| 8-K - 8-K - INDUS REALTY TRUST, INC. | indt-20210607x8k.htm |
Exhibit 99.1
| NAREIT REITWEEK CONFERENCE JUNE 2021 Exhibit 99.1 |
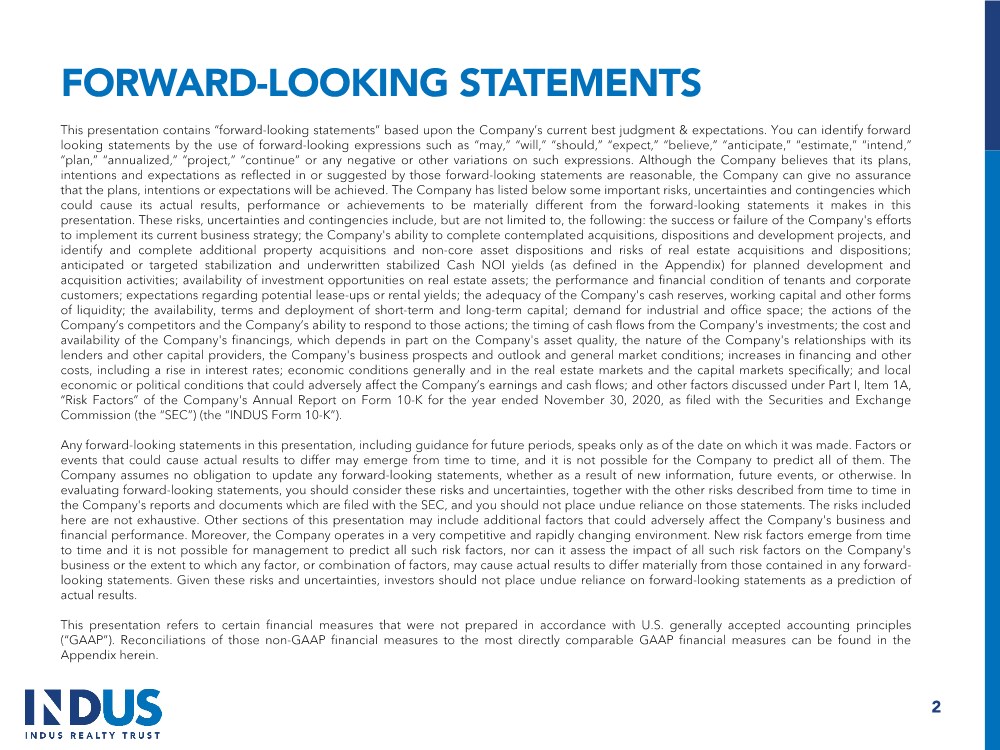
| FORWARD-LOOKING STATEMENTS 2 This presentation contains “forward-looking statements” based upon the Company’s current best judgment & expectations. You can identify forward looking statements by the use of forward-looking expressions such as “may,” “will,” “should,” “expect,” “believe,” “anticipate,” “estimate,” “intend,” “plan,” “annualized,” “project,” “continue” or any negative or other variations on such expressions. Although the Company believes that its plans, intentions and expectations as reflected in or suggested by those forward-looking statements are reasonable, the Company can give no assurance that the plans, intentions or expectations will be achieved. The Company has listed below some important risks, uncertainties and contingencies which could cause its actual results, performance or achievements to be materially different from the forward-looking statements it makes in this presentation. These risks, uncertainties and contingencies include, but are not limited to, the following: the success or failure of the Company's efforts to implement its current business strategy; the Company's ability to complete contemplated acquisitions, dispositions and development projects, and identify and complete additional property acquisitions and non-core asset dispositions and risks of real estate acquisitions and dispositions; anticipated or targeted stabilization and underwritten stabilized Cash NOI yields (as defined in the Appendix) for planned development and acquisition activities; availability of investment opportunities on real estate assets; the performance and financial condition of tenants and corporate customers; expectations regarding potential lease-ups or rental yields; the adequacy of the Company's cash reserves, working capital and other forms of liquidity; the availability, terms and deployment of short-term and long-term capital; demand for industrial and office space; the actions of the Company’s competitors and the Company’s ability to respond to those actions; the timing of cash flows from the Company's investments; the cost and availability of the Company's financings, which depends in part on the Company's asset quality, the nature of the Company's relationships with its lenders and other capital providers, the Company's business prospects and outlook and general market conditions; increases in financing and other costs, including a rise in interest rates; economic conditions generally and in the real estate markets and the capital markets specifically; and local economic or political conditions that could adversely affect the Company’s earnings and cash flows; and other factors discussed under Part I, Item 1A, “Risk Factors” of the Company's Annual Report on Form 10-K for the year ended November 30, 2020, as filed with the Securities and Exchange Commission (the “SEC”) (the “INDUS Form 10-K”). Any forward-looking statements in this presentation, including guidance for future periods, speaks only as of the date on which it was made. Factors or events that could cause actual results to differ may emerge from time to time, and it is not possible for the Company to predict all of them. The Company assumes no obligation to update any forward-looking statements, whether as a result of new information, future events, or otherwise. In evaluating forward-looking statements, you should consider these risks and uncertainties, together with the other risks described from time to time in the Company's reports and documents which are filed with the SEC, and you should not place undue reliance on those statements. The risks included here are not exhaustive. Other sections of this presentation may include additional factors that could adversely affect the Company's business and financial performance. Moreover, the Company operates in a very competitive and rapidly changing environment. New risk factors emerge from time to time and it is not possible for management to predict all such risk factors, nor can it assess the impact of all such risk factors on the Company's business or the extent to which any factor, or combination of factors, may cause actual results to differ materially from those contained in any forward- looking statements. Given these risks and uncertainties, investors should not place undue reliance on forward-looking statements as a prediction of actual results. This presentation refers to certain financial measures that were not prepared in accordance with U.S. generally accepted accounting principles (“GAAP”). Reconciliations of those non-GAAP financial measures to the most directly comparable GAAP financial measures can be found in the Appendix herein. |
| WHO IS INDUS? 3 |
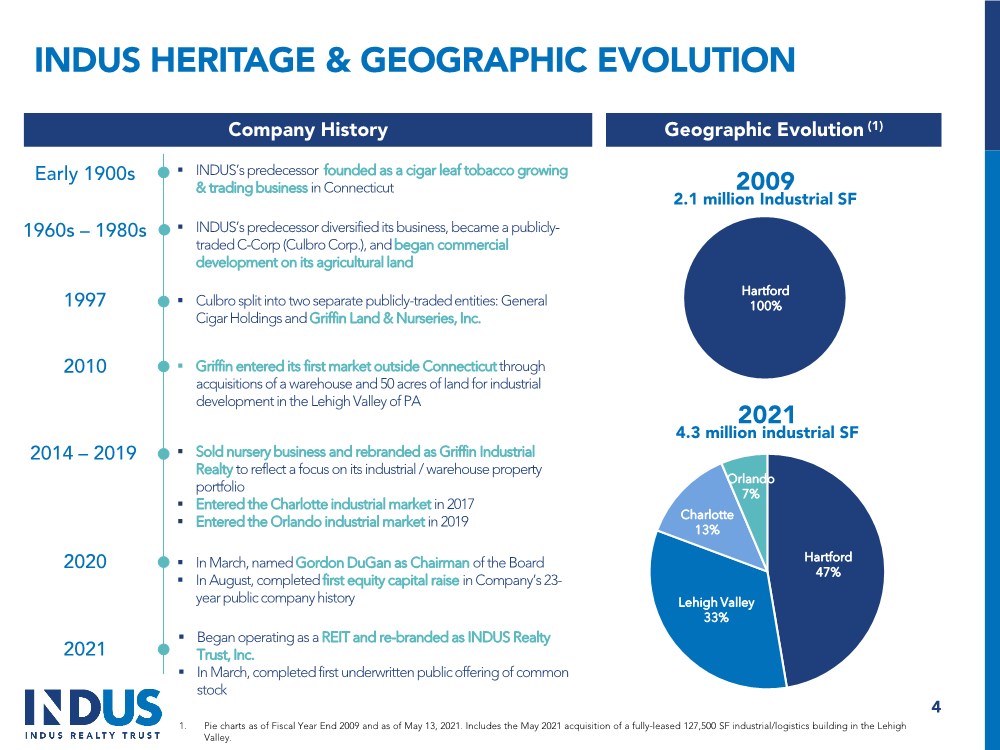
| INDUS HERITAGE & GEOGRAPHIC EVOLUTION 1997 2010 2020 . Culbro split into two separate publicly-traded entities: General Cigar Holdings and Griffin Land & Nurseries, Inc. . In March, named Gordon DuGan as Chairman of the Board . In August, completed first equity capital raise in Company’s 23- year public company history . Griffin entered its first market outside Connecticut through acquisitions of a warehouse and 50 acres of land for industrial development in the Lehigh Valley of PA . Sold nursery business and rebranded as Griffin Industrial Realty to reflect a focus on its industrial / warehouse property portfolio . Entered the Charlotte industrial market in 2017 . Entered the Orlando industrial market in 2019 2014 – 2019 . Began operating as a REIT and re-branded as INDUS Realty Trust, Inc. . In March, completed first underwritten public offering of common stock 2021 Geographic Evolution (1) Company History 2009 2.1 million Industrial SF Hartford 100% 2021 4.3 million industrial SF Hartford 47% Lehigh Valley 33% Charlotte 13% Orlando 7% 1. Pie charts as of Fiscal Year End 2009 and as of May 13, 2021. Includes the May 2021 acquisition of a fully-leased 127,500 SF industrial/logistics building in the Lehigh Valley. . INDUS’s predecessor founded as a cigar leaf tobacco growing & trading business in Connecticut Early 1900s . INDUS’s predecessor diversified its business, became a publicly- traded C-Corp (Culbro Corp.), and began commercial development on its agricultural land 1960s – 1980s 4 |
| MISSION To be a leading logistics real estate company focused on select high-growth, supply-constrained markets that can meet multiple drivers of demand within the modern supply chain, including local, regional and / or multi-market distribution. Critical supply-chain properties ranging from 75,000 to 400,000 SF Well-located, flexibly designed industrial / warehouse properties Strong local / regional economies with growing populations & logistics markets 5 |
| INVESTMENT HIGHLIGHTS High Quality Industrial Portfolio & Tenancy Disciplined & Established Investment Strategy Significant Growth Opportunities Well-Positioned in the Industrial Sector 6 1 2 3 4 5 Balance Sheet Positioned for Growth |
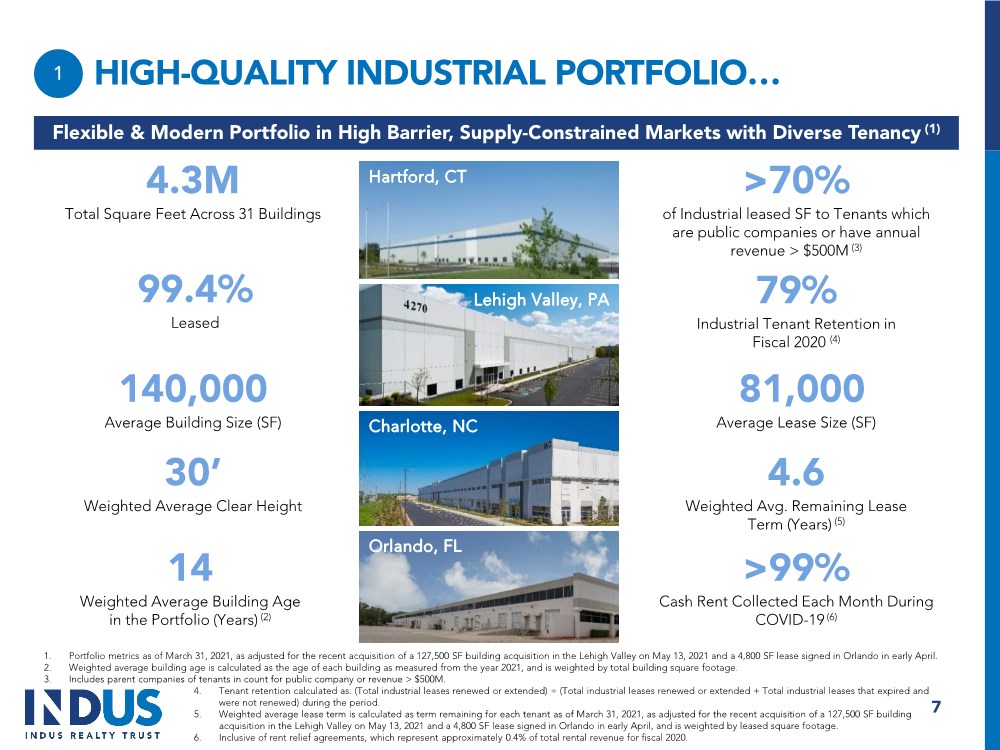
| HIGH-QUALITY INDUSTRIAL PORTFOLIO… 1. Portfolio metrics as of March 31, 2021, as adjusted for the recent acquisition of a 127,500 SF building acquisition in the Lehigh Valley on May 13, 2021 and a 4,800 SF lease signed in Orlando in early April. 2. Weighted average building age is calculated as the age of each building as measured from the year 2021, and is weighted by total building square footage. 3. Includes parent companies of tenants in count for public company or revenue > $500M. 4. Tenant retention calculated as: (Total industrial leases renewed or extended) ÷ (Total industrial leases renewed or extended + Total industrial leases that expired and were not renewed) during the period. 5. Weighted average lease term is calculated as term remaining for each tenant as of March 31, 2021, as adjusted for the recent acquisition of a 127,500 SF building acquisition in the Lehigh Valley on May 13, 2021 and a 4,800 SF lease signed in Orlando in early April, and is weighted by leased square footage. 6. Inclusive of rent relief agreements, which represent approximately 0.4% of total rental revenue for fiscal 2020. 4.3M Total Square Feet Across 31 Buildings >70% of Industrial leased SF to Tenants which are public companies or have annual revenue > $500M (3) 79% Industrial Tenant Retention in Fiscal 2020 (4) 14 Weighted Average Building Age in the Portfolio (Years) (2) 30’ Weighted Average Clear Height Flexible & Modern Portfolio in High Barrier, Supply-Constrained Markets with Diverse Tenancy (1) 140,000 Average Building Size (SF) Lehigh Valley, PA Charlotte, NC Hartford, CT Orlando, FL >99% Cash Rent Collected Each Month During COVID-19 (6) 99.4% Leased 4.6 Weighted Avg. Remaining Lease Term (Years) (5) 81,000 Average Lease Size (SF) 7 1 |
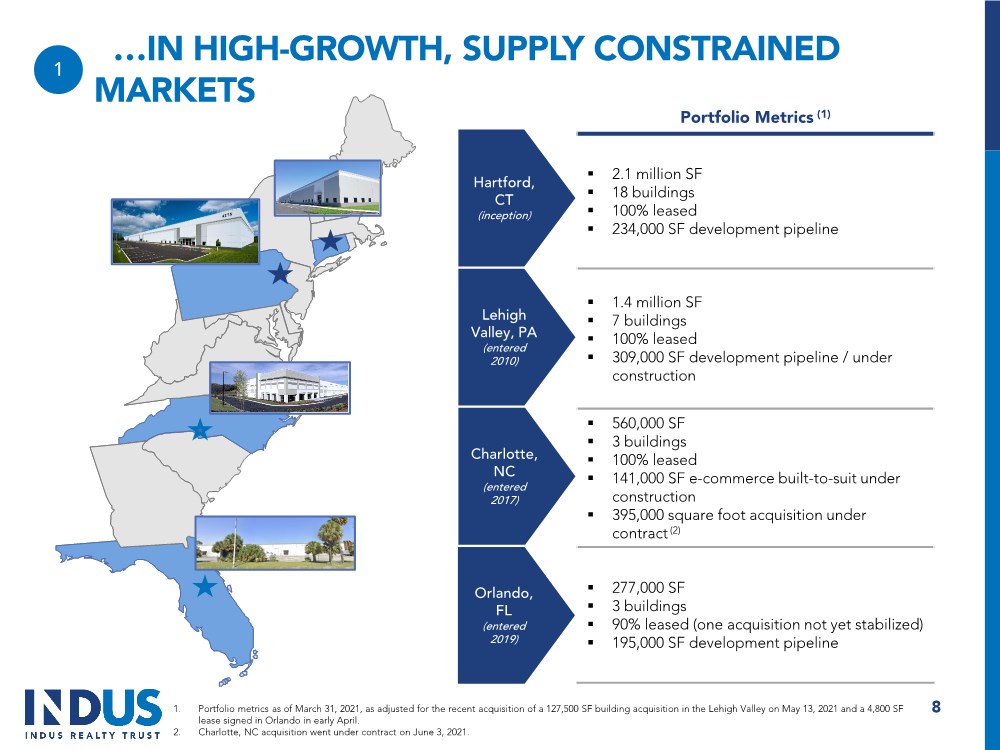
| Portfolio Metrics (1) . 2.1 million SF . 18 buildings . 100% leased . 234,000 SF development pipeline . 1.4 million SF . 7 buildings . 100% leased . 309,000 SF development pipeline / under construction . 560,000 SF . 3 buildings . 100% leased . 141,000 SF e-commerce built-to-suit under construction . 395,000 square foot acquisition under contract (2) . 277,000 SF . 3 buildings . 90% leased (one acquisition not yet stabilized) . 195,000 SF development pipeline 8 Hartford, CT (inception) Lehigh Valley, PA (entered 2010) Charlotte, NC (entered 2017) Orlando, FL (entered 2019) …IN HIGH-GROWTH, SUPPLY CONSTRAINED MARKETS 1 1. Portfolio metrics as of March 31, 2021, as adjusted for the recent acquisition of a 127,500 SF building acquisition in the Lehigh Valley on May 13, 2021 and a 4,800 SF lease signed in Orlando in early April. 2. Charlotte, NC acquisition went under contract on June 3, 2021. |
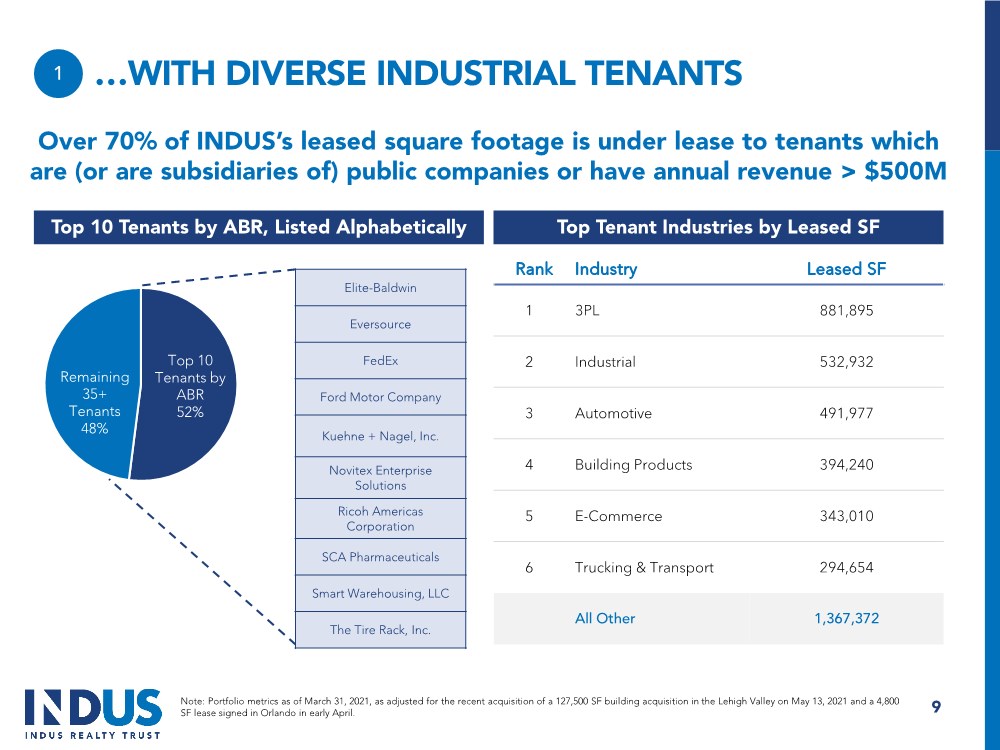
| Top 10 Tenants by ABR 52% Remaining 35+ Tenants 48% …WITH DIVERSE INDUSTRIAL TENANTS Top 10 Tenants by ABR, Listed Alphabetically Top Tenant Industries by Leased SF Rank Industry Leased SF 1 3PL 881,895 2 Industrial 532,932 3 Automotive 491,977 4 Building Products 394,240 5 E-Commerce 343,010 6 Trucking & Transport 294,654 All Other 1,367,372 Over 70% of INDUS’s leased square footage is under lease to tenants which are (or are subsidiaries of) public companies or have annual revenue > $500M Note: Portfolio metrics as of March 31, 2021, as adjusted for the recent acquisition of a 127,500 SF building acquisition in the Lehigh Valley on May 13, 2021 and a 4,800 SF lease signed in Orlando in early April. 9 1 Elite-Baldwin Eversource FedEx Ford Motor Company Kuehne + Nagel, Inc. Novitex Enterprise Solutions Ricoh Americas Corporation SCA Pharmaceuticals Smart Warehousing, LLC The Tire Rack, Inc. |
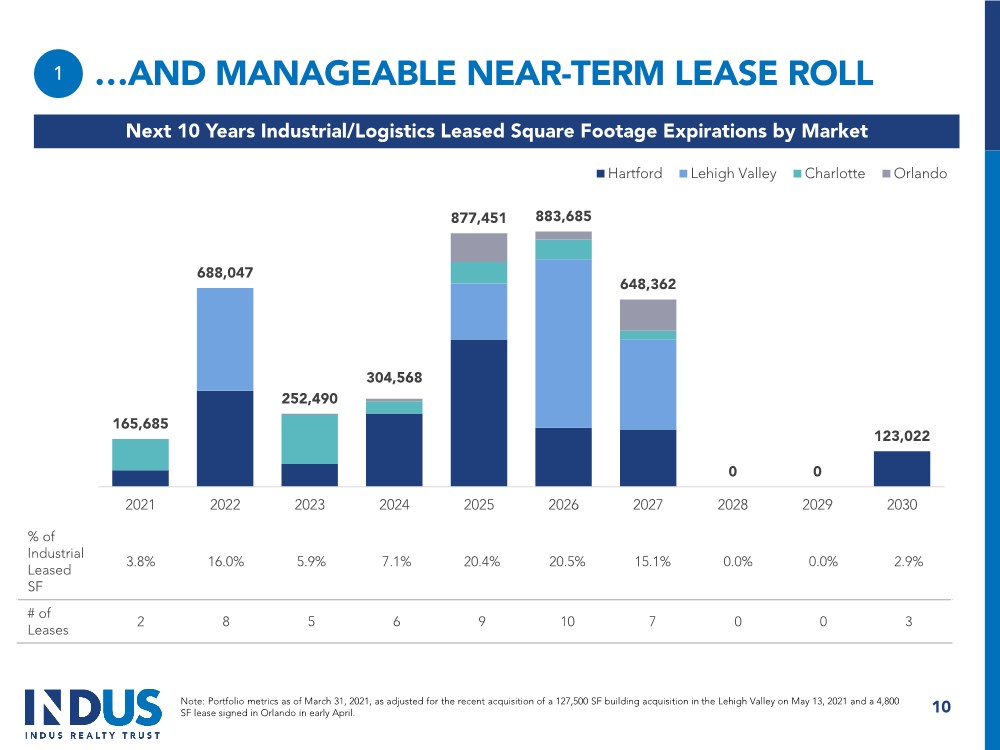
| …AND MANAGEABLE NEAR-TERM LEASE ROLL 10 1 165,685 688,047 252,490 304,568 877,451 883,685 648,362 0 0 123,022 2021 2022 2023 2024 2025 2026 2027 2028 2029 2030 Hartford Lehigh Valley Charlotte Orlando Next 10 Years Industrial/Logistics Leased Square Footage Expirations by Market % of Industrial Leased SF 3.8% 16.0% 5.9% 7.1% 20.4% 20.5% 15.1% 0.0% 0.0% 2.9% # of Leases 2 8 5 6 9 10 7 0 0 3 Note: Portfolio metrics as of March 31, 2021, as adjusted for the recent acquisition of a 127,500 SF building acquisition in the Lehigh Valley on May 13, 2021 and a 4,800 SF lease signed in Orlando in early April. |
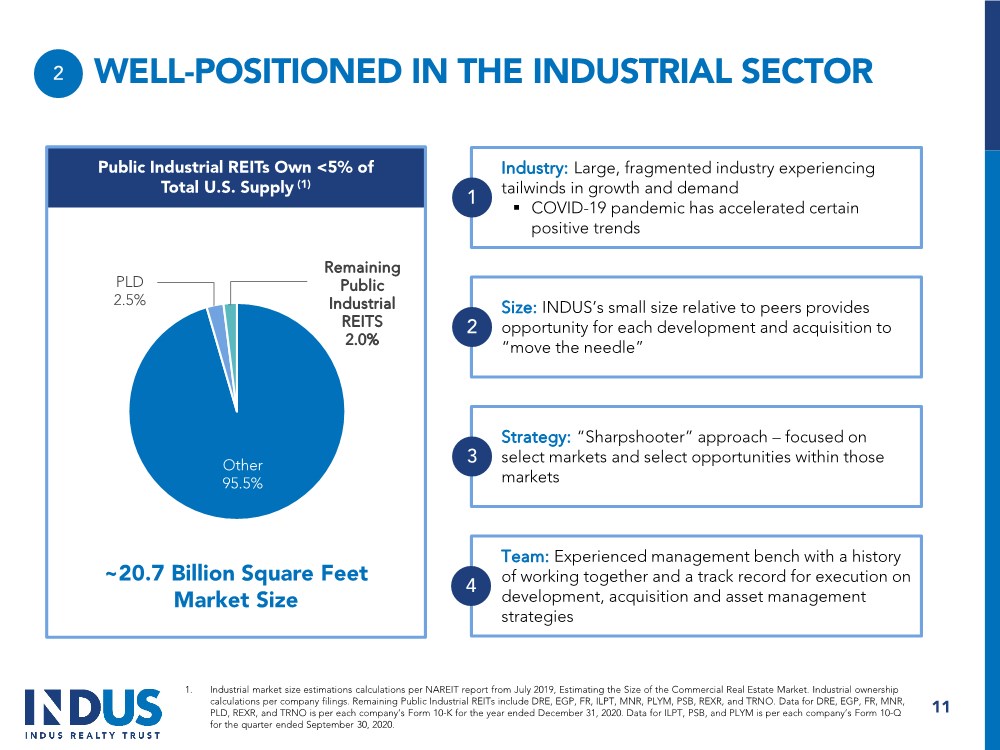
| Other 95.5% PLD 2.5% Remaining Public Industrial REITS 2.0% WELL-POSITIONED IN THE INDUSTRIAL SECTOR 1. Industrial market size estimations calculations per NAREIT report from July 2019, Estimating the Size of the Commercial Real Estate Market. Industrial ownership calculations per company filings. Remaining Public Industrial REITs include DRE, EGP, FR, ILPT, MNR, PLYM, PSB, REXR, and TRNO. Data for DRE, EGP, FR, MNR, PLD, REXR, and TRNO is per each company’s Form 10-K for the year ended December 31, 2020. Data for ILPT, PSB, and PLYM is per each company’s Form 10-Q for the quarter ended September 30, 2020. Public Industrial REITs Own <5% of Total U.S. Supply (1) 11 2 Industry: Large, fragmented industry experiencing tailwinds in growth and demand . COVID-19 pandemic has accelerated certain positive trends 1 Size: INDUS’s small size relative to peers provides opportunity for each development and acquisition to “move the needle” 2 Strategy: “Sharpshooter” approach – focused on select markets and select opportunities within those markets 3 Team: Experienced management bench with a history of working together and a track record for execution on development, acquisition and asset management strategies 4 ~20.7 Billion Square Feet Market Size |
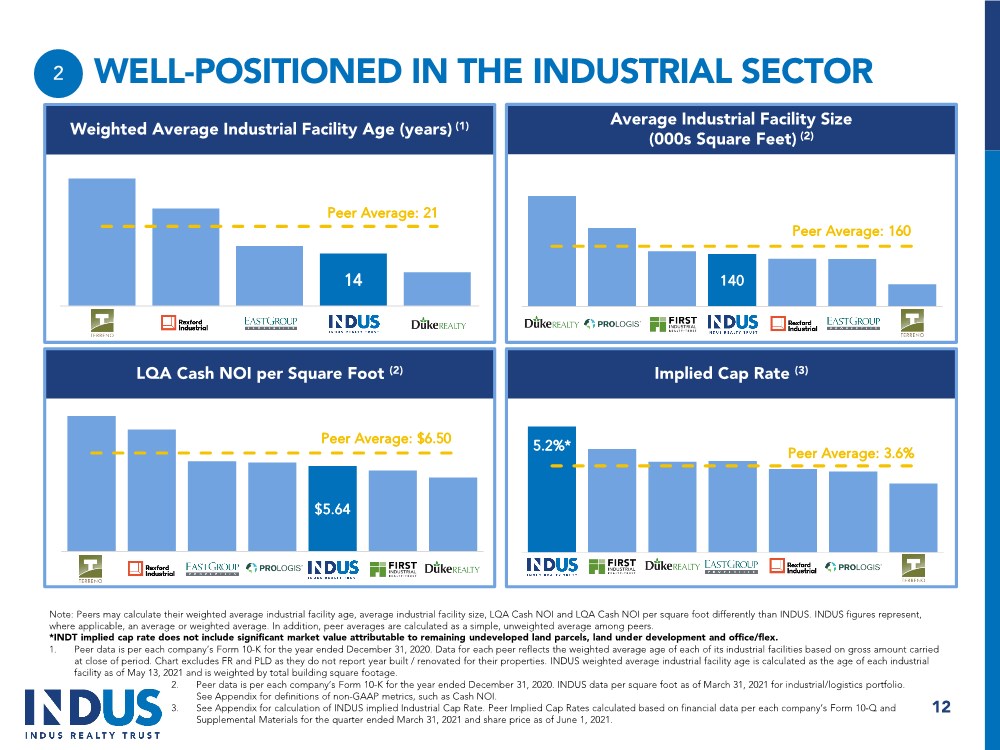
| WELL-POSITIONED IN THE INDUSTRIAL SECTOR Weighted Average Industrial Facility Age (years) (1) 14 TRNO REXR EGP INDT DRE 12 2 140 DRE PLD FR INDT REXR EGP TRNO $5.64 TRNO REXR EGP PLD INDT FR DRE LQA Cash NOI per Square Foot (2) Average Industrial Facility Size (000s Square Feet) (2) 5.2%* INDT FR EGP DRE REXR PLD TRNO Implied Cap Rate (3) Peer Average: 21 Peer Average: 160 Peer Average: $6.50 Peer Average: 3.6% Note: Peers may calculate their weighted average industrial facility age, average industrial facility size, LQA Cash NOI and LQA Cash NOI per square foot differently than INDUS. INDUS figures represent, where applicable, an average or weighted average. In addition, peer averages are calculated as a simple, unweighted average among peers. *INDT implied cap rate does not include significant market value attributable to remaining undeveloped land parcels, land under development and office/flex. 1. Peer data is per each company’s Form 10-K for the year ended December 31, 2020. Data for each peer reflects the weighted average age of each of its industrial facilities based on gross amount carried at close of period. Chart excludes FR and PLD as they do not report year built / renovated for their properties. INDUS weighted average industrial facility age is calculated as the age of each industrial facility as of May 13, 2021 and is weighted by total building square footage. 2. Peer data is per each company’s Form 10-K for the year ended December 31, 2020. INDUS data per square foot as of March 31, 2021 for industrial/logistics portfolio. See Appendix for definitions of non-GAAP metrics, such as Cash NOI. 3. See Appendix for calculation of INDUS implied Industrial Cap Rate. Peer Implied Cap Rates calculated based on financial data per each company’s Form 10-Q and Supplemental Materials for the quarter ended March 31, 2021 and share price as of June 1, 2021. |
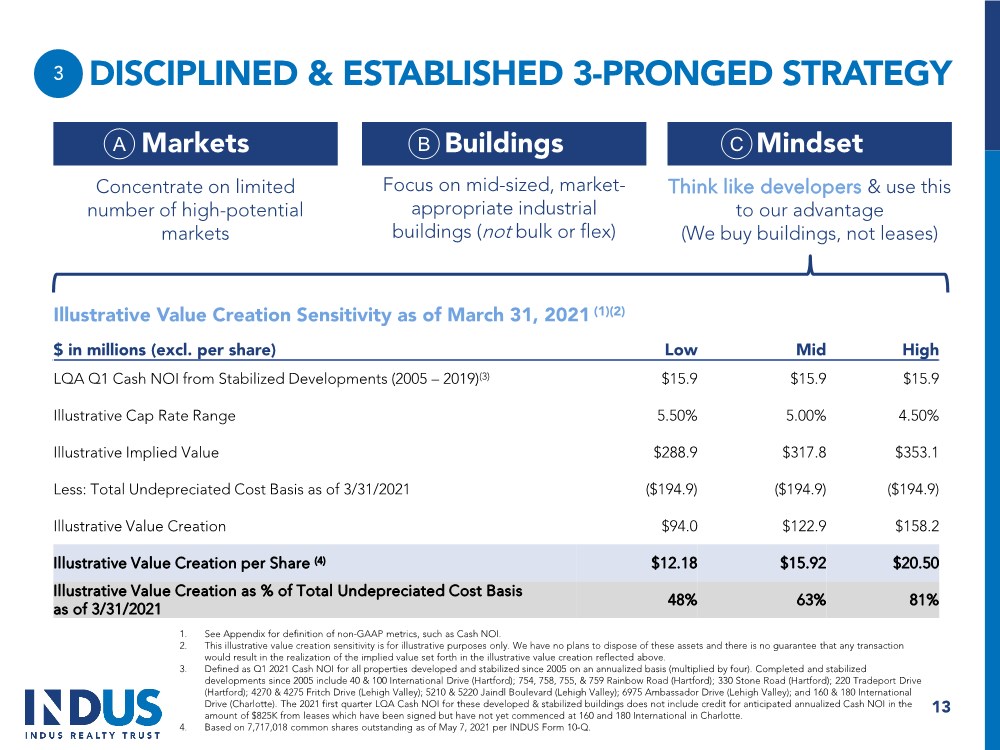
| DISCIPLINED & ESTABLISHED 3-PRONGED STRATEGY Markets Concentrate on limited number of high-potential markets Buildings Mindset Focus on mid-sized, market- appropriate industrial buildings (not bulk or flex) Think like developers & use this to our advantage (We buy buildings, not leases) 1. See Appendix for definition of non-GAAP metrics, such as Cash NOI. 2. This illustrative value creation sensitivity is for illustrative purposes only. We have no plans to dispose of these assets and there is no guarantee that any transaction would result in the realization of the implied value set forth in the illustrative value creation reflected above. 3. Defined as Q1 2021 Cash NOI for all properties developed and stabilized since 2005 on an annualized basis (multiplied by four). Completed and stabilized developments since 2005 include 40 & 100 International Drive (Hartford); 754, 758, 755, & 759 Rainbow Road (Hartford); 330 Stone Road (Hartford); 220 Tradeport Drive (Hartford); 4270 & 4275 Fritch Drive (Lehigh Valley); 5210 & 5220 Jaindl Boulevard (Lehigh Valley); 6975 Ambassador Drive (Lehigh Valley); and 160 & 180 International Drive (Charlotte). The 2021 first quarter LQA Cash NOI for these developed & stabilized buildings does not include credit for anticipated annualized Cash NOI in the amount of $825K from leases which have been signed but have not yet commenced at 160 and 180 International in Charlotte. 4. Based on 7,717,018 common shares outstanding as of May 7, 2021 per INDUS Form 10-Q. A B C $ in millions (excl. per share) Low Mid High LQA Q1 Cash NOI from Stabilized Developments (2005 – 2019)(3) $15.9 $15.9 $15.9 Illustrative Cap Rate Range 5.50% 5.00% 4.50% Illustrative Implied Value $288.9 $317.8 $353.1 Less: Total Undepreciated Cost Basis as of 3/31/2021 ($194.9) ($194.9) ($194.9) Illustrative Value Creation $94.0 $122.9 $158.2 Illustrative Value Creation per Share (4) $12.18 $15.92 $20.50 Illustrative Value Creation as % of Total Undepreciated Cost Basis as of 3/31/2021 48% 63% 81% Illustrative Value Creation Sensitivity as of March 31, 2021 (1)(2) 3 13 |
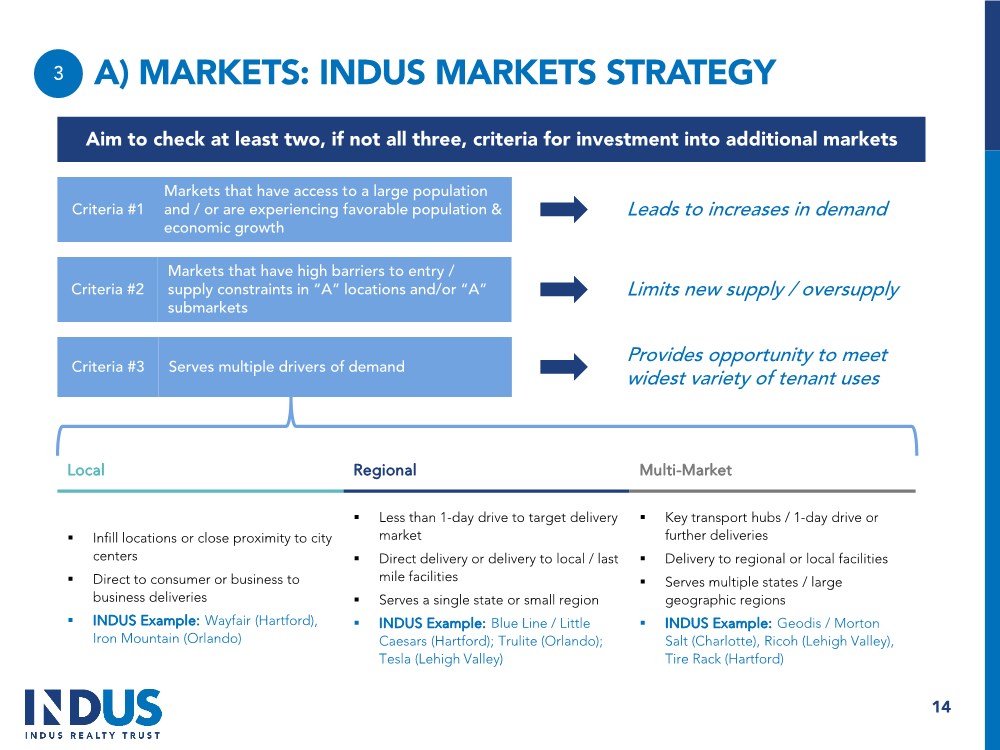
| A) MARKETS: INDUS MARKETS STRATEGY Aim to check at least two, if not all three, criteria for investment into additional markets Criteria #3 Serves multiple drivers of demand Criteria #1 Markets that have access to a large population and / or are experiencing favorable population & economic growth Criteria #2 Markets that have high barriers to entry / supply constraints in “A” locations and/or “A” submarkets Local Regional Multi-Market . Infill locations or close proximity to city centers . Direct to consumer or business to business deliveries . INDUS Example: Wayfair (Hartford), Iron Mountain (Orlando) . Less than 1-day drive to target delivery market . Direct delivery or delivery to local / last mile facilities . Serves a single state or small region . INDUS Example: Blue Line / Little Caesars (Hartford); Trulite (Orlando); Tesla (Lehigh Valley) . Key transport hubs / 1-day drive or further deliveries . Delivery to regional or local facilities . Serves multiple states / large geographic regions . INDUS Example: Geodis / Morton Salt (Charlotte), Ricoh (Lehigh Valley), Tire Rack (Hartford) 3 14 Leads to increases in demand Limits new supply / oversupply Provides opportunity to meet widest variety of tenant uses |
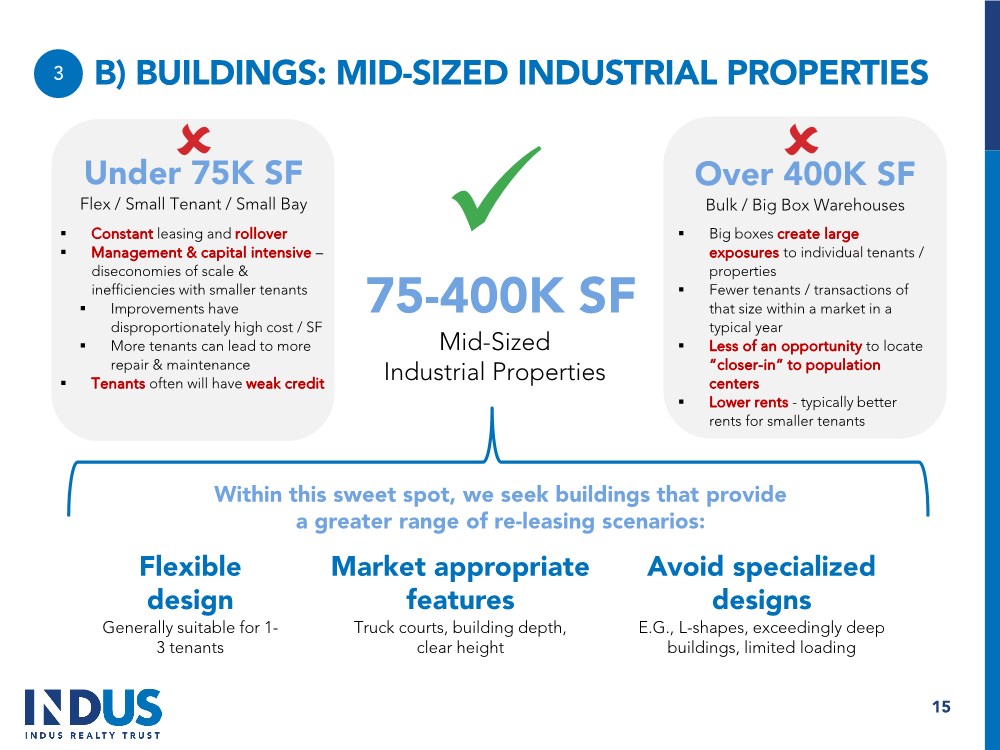
| B) BUILDINGS: MID-SIZED INDUSTRIAL PROPERTIES Under 75K SF Flex / Small Tenant / Small Bay 75-400K SF Mid-Sized Industrial Properties Over 400K SF Bulk / Big Box Warehouses . Constant leasing and rollover . Management & capital intensive – diseconomies of scale & inefficiencies with smaller tenants . Improvements have disproportionately high cost / SF . More tenants can lead to more repair & maintenance . Tenants often will have weak credit . Big boxes create large exposures to individual tenants / properties . Fewer tenants / transactions of that size within a market in a typical year . Less of an opportunity to locate “closer-in” to population centers . Lower rents - typically better rents for smaller tenants Within this sweet spot, we seek buildings that provide a greater range of re-leasing scenarios: Flexible design Generally suitable for 1- 3 tenants Market appropriate features Truck courts, building depth, clear height Avoid specialized designs E.G., L-shapes, exceedingly deep buildings, limited loading 3 15 |
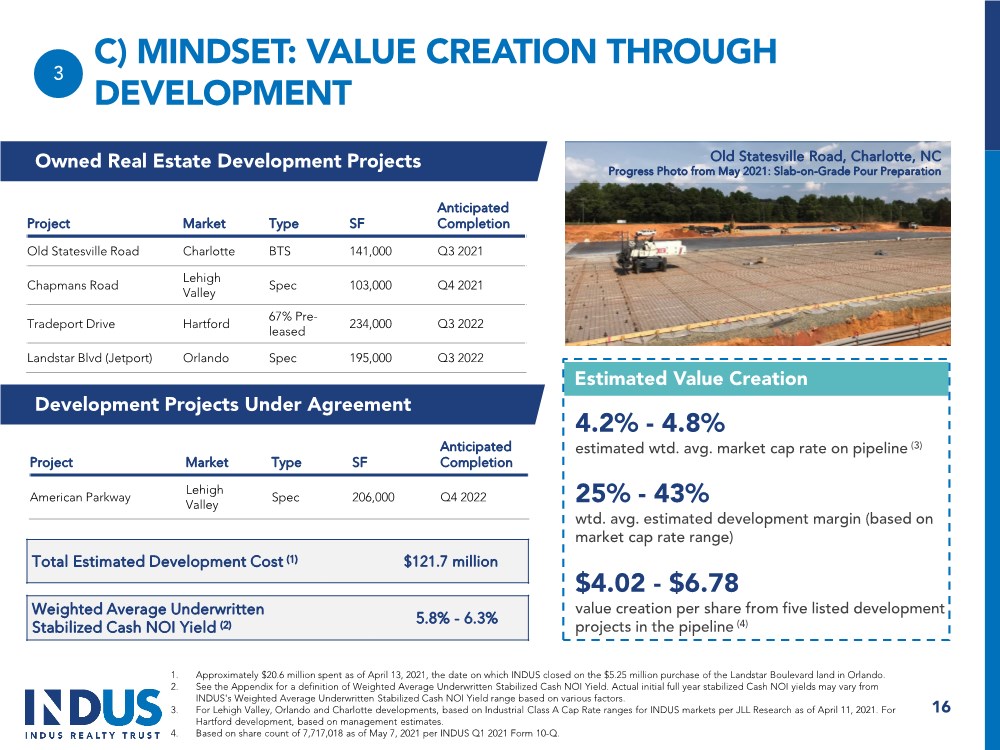
| Project Market Type SF Anticipated Completion Old Statesville Road Charlotte BTS 141,000 Q3 2021 Chapmans Road Lehigh Valley Spec 103,000 Q4 2021 Tradeport Drive Hartford 67% Pre- leased 234,000 Q3 2022 Landstar Blvd (Jetport) Orlando Spec 195,000 Q3 2022 C) MINDSET: VALUE CREATION THROUGH DEVELOPMENT Owned Real Estate Development Projects Development Projects Under Agreement 16 Project Market Type SF Anticipated Completion American Parkway Lehigh Valley Spec 206,000 Q4 2022 Total Estimated Development Cost (1) $121.7 million 1. Approximately $20.6 million spent as of April 13, 2021, the date on which INDUS closed on the $5.25 million purchase of the Landstar Boulevard land in Orlando. 2. See the Appendix for a definition of Weighted Average Underwritten Stabilized Cash NOI Yield. Actual initial full year stabilized Cash NOI yields may vary from INDUS's Weighted Average Underwritten Stabilized Cash NOI Yield range based on various factors. 3. For Lehigh Valley, Orlando and Charlotte developments, based on Industrial Class A Cap Rate ranges for INDUS markets per JLL Research as of April 11, 2021. For Hartford development, based on management estimates. 4. Based on share count of 7,717,018 as of May 7, 2021 per INDUS Q1 2021 Form 10-Q. 3 Old Statesville Road, Charlotte, NC Progress Photo from May 2021: Slab-on-Grade Pour Preparation Weighted Average Underwritten Stabilized Cash NOI Yield (2) 5.8% - 6.3% 4.2% - 4.8% estimated wtd. avg. market cap rate on pipeline (3) 25% - 43% wtd. avg. estimated development margin (based on market cap rate range) Estimated Value Creation $4.02 - $6.78 value creation per share from five listed development projects in the pipeline (4) |
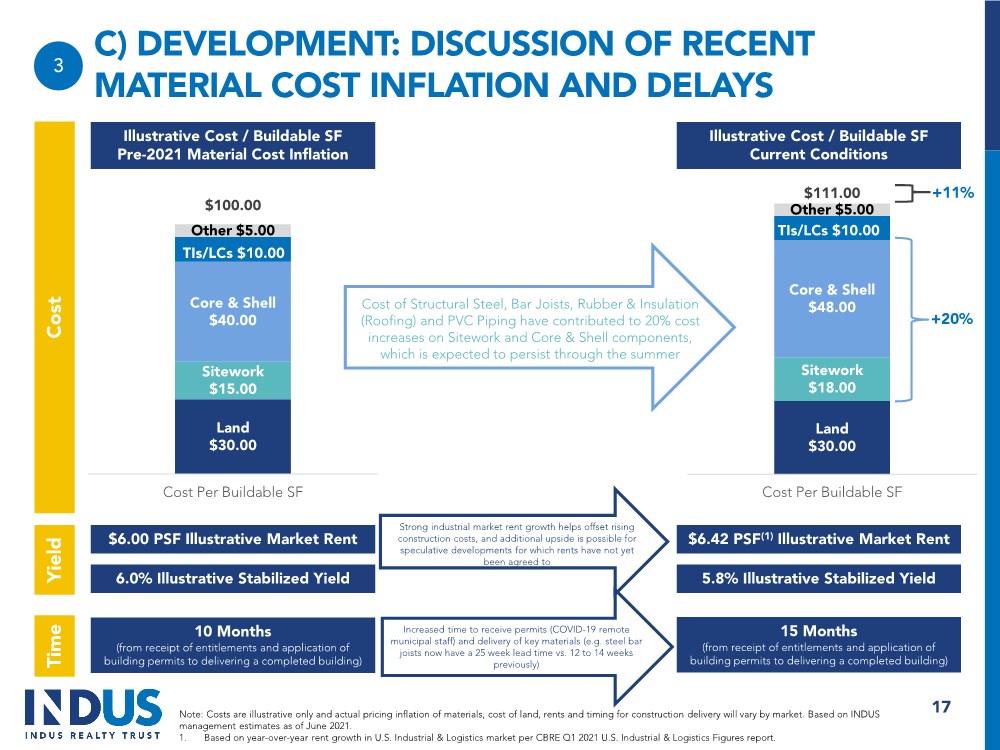
| C) DEVELOPMENT: DISCUSSION OF RECENT MATERIAL COST INFLATION AND DELAYS 17 Note: Costs are illustrative only and actual pricing inflation of materials, cost of land, rents and timing for construction delivery will vary by market. Based on INDUS management estimates as of June 2021. 1. Based on year-over-year rent growth in U.S. Industrial & Logistics market per CBRE Q1 2021 U.S. Industrial & Logistics Figures report. 3 Land $30.00 Sitework $15.00 Core & Shell $40.00 TIs/LCs $10.00 Other $5.00 $100.00 Cost Per Buildable SF Illustrative Cost / Buildable SF Pre-2021 Material Cost Inflation Land $30.00 Sitework $18.00 Core & Shell $48.00 TIs/LCs $10.00 Other $5.00 $111.00 Cost Per Buildable SF Illustrative Cost / Buildable SF Current Conditions Cost of Structural Steel, Bar Joists, Rubber & Insulation (Roofing) and PVC Piping have contributed to 20% cost increases on Sitework and Core & Shell components, which is expected to persist through the summer $6.00 PSF Illustrative Market Rent $6.42 PSF(1) Illustrative Market Rent 6.0% Illustrative Stabilized Yield 5.8% Illustrative Stabilized Yield Strong industrial market rent growth helps offset rising construction costs, and additional upside is possible for speculative developments for which rents have not yet been agreed to Cost Yield Time 10 Months (from receipt of entitlements and application of building permits to delivering a completed building) 15 Months (from receipt of entitlements and application of building permits to delivering a completed building) +11% +20% Increased time to receive permits (COVID-19 remote municipal staff) and delivery of key materials (e.g. steel bar joists now have a 25 week lead time vs. 12 to 14 weeks previously) |
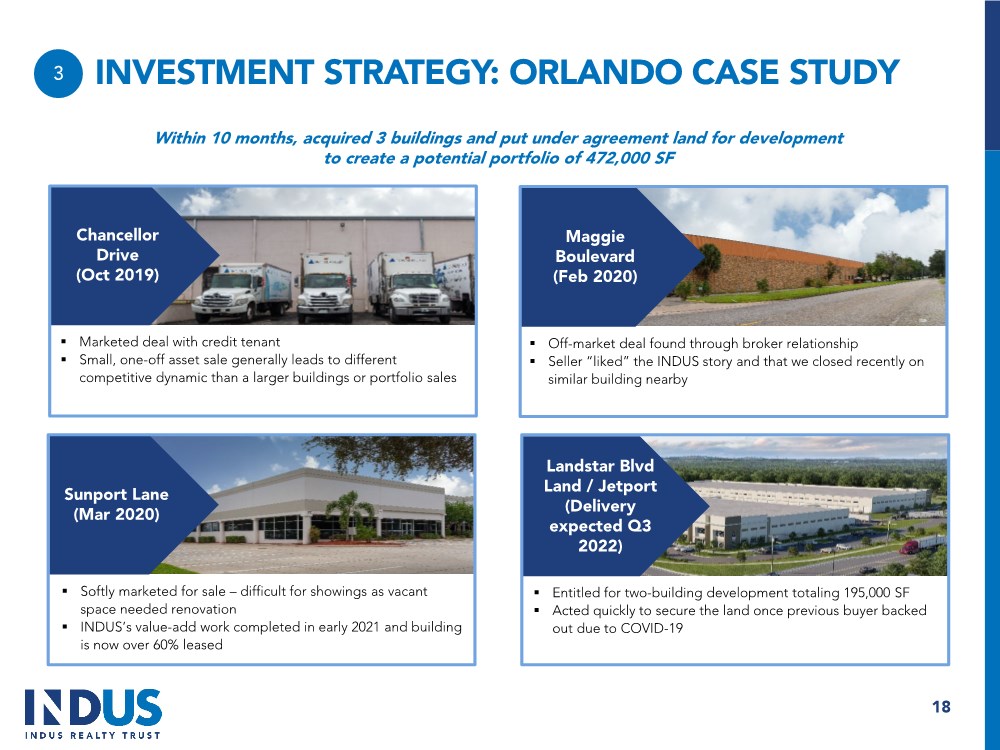
| INVESTMENT STRATEGY: ORLANDO CASE STUDY . Off-market deal found through broker relationship . Seller “liked” the INDUS story and that we closed recently on similar building nearby Within 10 months, acquired 3 buildings and put under agreement land for development to create a potential portfolio of 472,000 SF Maggie Boulevard (Feb 2020) 18 3 . Marketed deal with credit tenant . Small, one-off asset sale generally leads to different competitive dynamic than a larger buildings or portfolio sales Chancellor Drive (Oct 2019) . Softly marketed for sale – difficult for showings as vacant space needed renovation . INDUS’s value-add work completed in early 2021 and building is now over 60% leased Sunport Lane (Mar 2020) Landstar Blvd Land / Jetport (Delivery expected Q3 2022) . Entitled for two-building development totaling 195,000 SF . Acted quickly to secure the land once previous buyer backed out due to COVID-19 |
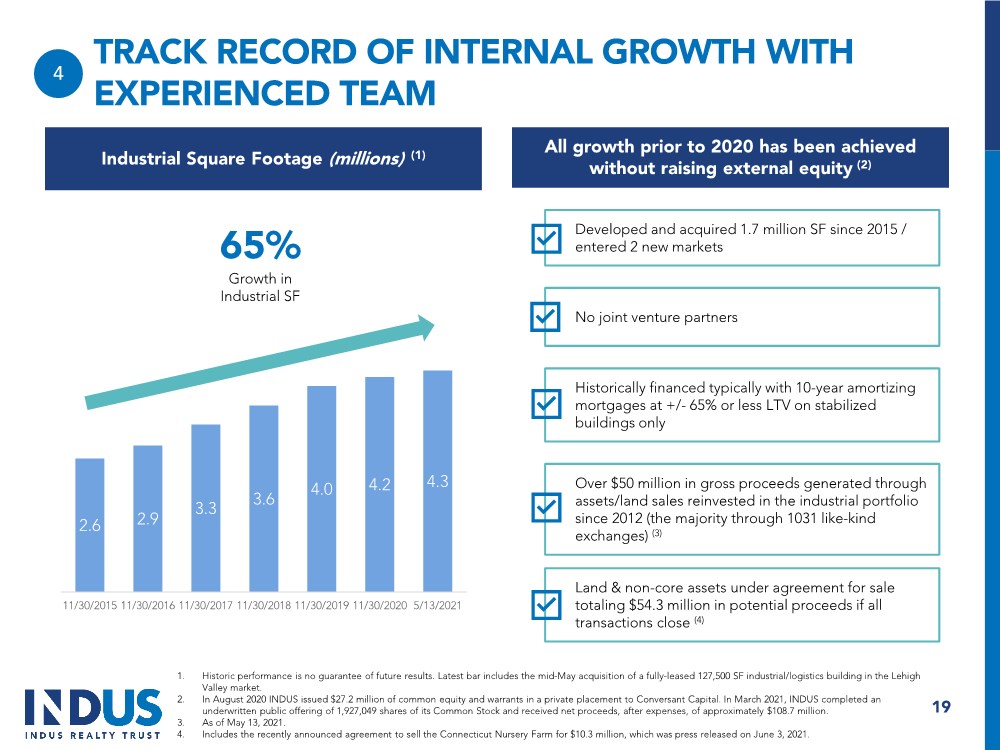
| TRACK RECORD OF INTERNAL GROWTH WITH EXPERIENCED TEAM 1. Historic performance is no guarantee of future results. Latest bar includes the mid-May acquisition of a fully-leased 127,500 SF industrial/logistics building in the Lehigh Valley market. 2. In August 2020 INDUS issued $27.2 million of common equity and warrants in a private placement to Conversant Capital. In March 2021, INDUS completed an underwritten public offering of 1,927,049 shares of its Common Stock and received net proceeds, after expenses, of approximately $108.7 million. 3. As of May 13, 2021. 4. Includes the recently announced agreement to sell the Connecticut Nursery Farm for $10.3 million, which was press released on June 3, 2021. 2.6 2.9 3.3 3.6 4.0 4.2 4.3 11/30/2015 11/30/2016 11/30/2017 11/30/2018 11/30/2019 11/30/2020 5/13/2021 All growth prior to 2020 has been achieved without raising external equity (2) Industrial Square Footage (millions) (1) 65% Growth in Industrial SF 19 4 Developed and acquired 1.7 million SF since 2015 / entered 2 new markets No joint venture partners Historically financed typically with 10-year amortizing mortgages at +/- 65% or less LTV on stabilized buildings only Over $50 million in gross proceeds generated through assets/land sales reinvested in the industrial portfolio since 2012 (the majority through 1031 like-kind exchanges) (3) Land & non-core assets under agreement for sale totaling $54.3 million in potential proceeds if all transactions close (4) |
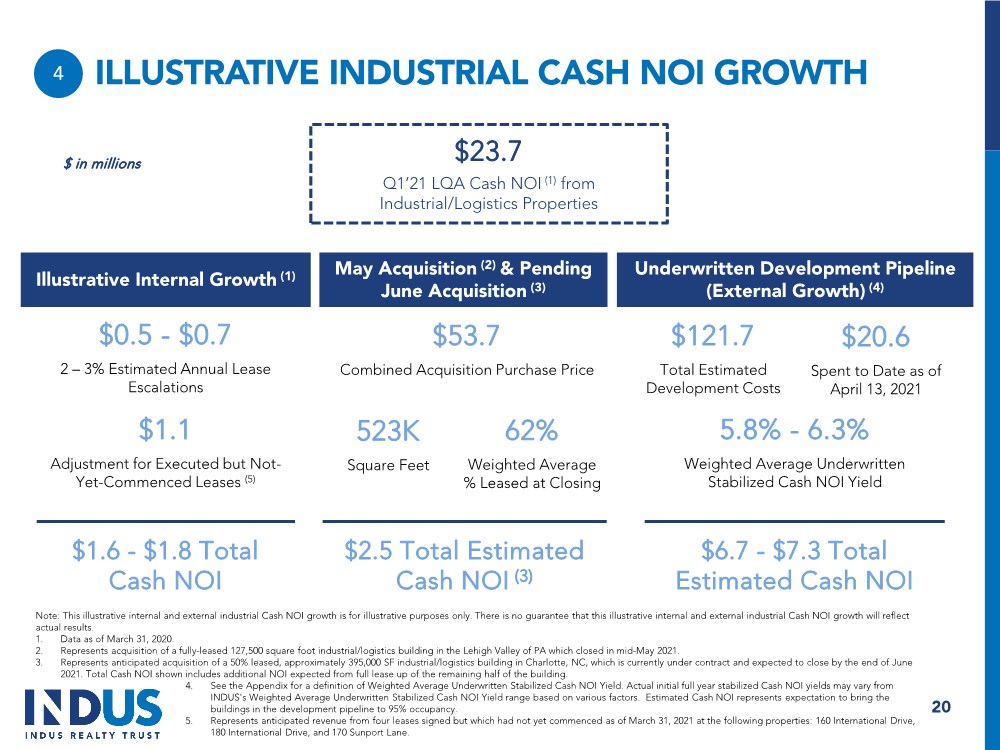
| ILLUSTRATIVE INDUSTRIAL CASH NOI GROWTH 20 4 $23.7 Q1’21 LQA Cash NOI (1) from Industrial/Logistics Properties $ in millions Illustrative Internal Growth (1) Underwritten Development Pipeline (External Growth) (4) $0.5 - $0.7 2 – 3% Estimated Annual Lease Escalations Note: This illustrative internal and external industrial Cash NOI growth is for illustrative purposes only. There is no guarantee that this illustrative internal and external industrial Cash NOI growth will reflect actual results. 1. Data as of March 31, 2020. 2. Represents acquisition of a fully-leased 127,500 square foot industrial/logistics building in the Lehigh Valley of PA which closed in mid-May 2021. 3. Represents anticipated acquisition of a 50% leased, approximately 395,000 SF industrial/logistics building in Charlotte, NC, which is currently under contract and expected to close by the end of June 2021. Total Cash NOI shown includes additional NOI expected from full lease up of the remaining half of the building. 4. See the Appendix for a definition of Weighted Average Underwritten Stabilized Cash NOI Yield. Actual initial full year stabilized Cash NOI yields may vary from INDUS's Weighted Average Underwritten Stabilized Cash NOI Yield range based on various factors. Estimated Cash NOI represents expectation to bring the buildings in the development pipeline to 95% occupancy. 5. Represents anticipated revenue from four leases signed but which had not yet commenced as of March 31, 2021 at the following properties: 160 International Drive, 180 International Drive, and 170 Sunport Lane. $1.1 Adjustment for Executed but Not- Yet-Commenced Leases (5) $121.7 Total Estimated Development Costs $20.6 Spent to Date as of April 13, 2021 5.8% - 6.3% Weighted Average Underwritten Stabilized Cash NOI Yield $1.6 - $1.8 Total Cash NOI $6.7 - $7.3 Total Estimated Cash NOI May Acquisition (2) & Pending June Acquisition (3) $53.7 Combined Acquisition Purchase Price 62% Weighted Average % Leased at Closing $2.5 Total Estimated Cash NOI (3) 523K Square Feet |
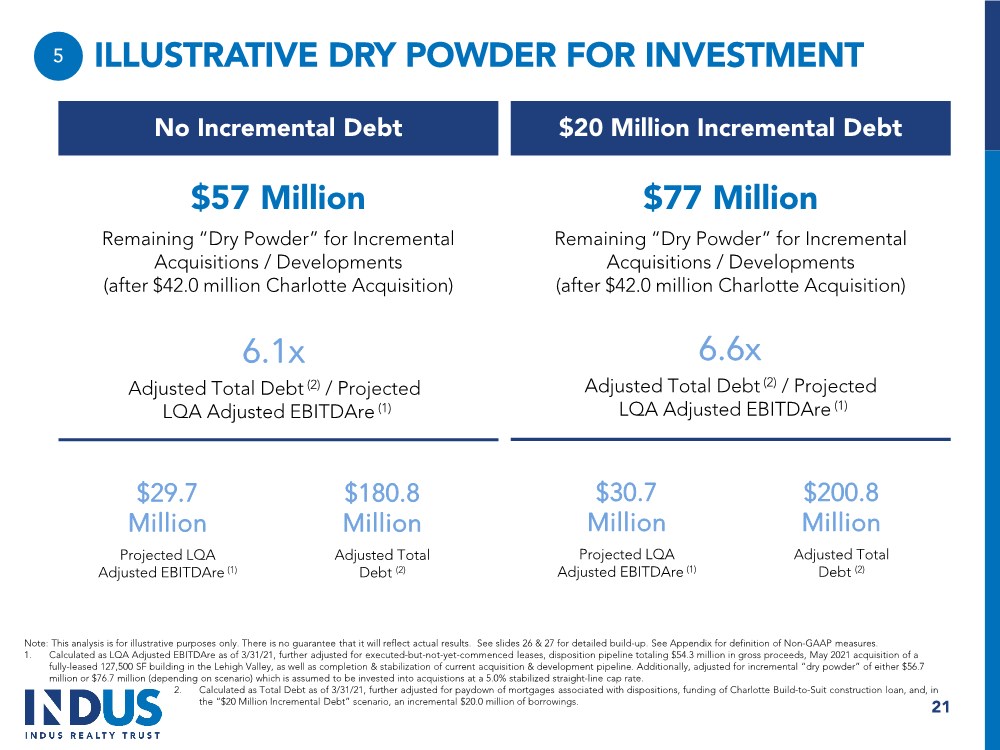
| ILLUSTRATIVE DRY POWDER FOR INVESTMENT 21 5 Note: This analysis is for illustrative purposes only. There is no guarantee that it will reflect actual results. See slides 26 & 27 for detailed build-up. See Appendix for definition of Non-GAAP measures. 1. Calculated as LQA Adjusted EBITDAre as of 3/31/21, further adjusted for executed-but-not-yet-commenced leases, disposition pipeline totaling $54.3 million in gross proceeds, May 2021 acquisition of a fully-leased 127,500 SF building in the Lehigh Valley, as well as completion & stabilization of current acquisition & development pipeline. Additionally, adjusted for incremental “dry powder” of either $56.7 million or $76.7 million (depending on scenario) which is assumed to be invested into acquistions at a 5.0% stabilized straight-line cap rate. 2. Calculated as Total Debt as of 3/31/21, further adjusted for paydown of mortgages associated with dispositions, funding of Charlotte Build-to-Suit construction loan, and, in the “$20 Million Incremental Debt” scenario, an incremental $20.0 million of borrowings. No Incremental Debt $20 Million Incremental Debt $57 Million Remaining “Dry Powder” for Incremental Acquisitions / Developments (after $42.0 million Charlotte Acquisition) $29.7 Million Projected LQA Adjusted EBITDAre (1) $77 Million Remaining “Dry Powder” for Incremental Acquisitions / Developments (after $42.0 million Charlotte Acquisition) 6.6x Adjusted Total Debt (2) / Projected LQA Adjusted EBITDAre (1) $180.8 Million Adjusted Total Debt (2) 6.1x Adjusted Total Debt (2) / Projected LQA Adjusted EBITDAre (1) $30.7 Million Projected LQA Adjusted EBITDAre (1) $200.8 Million Adjusted Total Debt (2) |
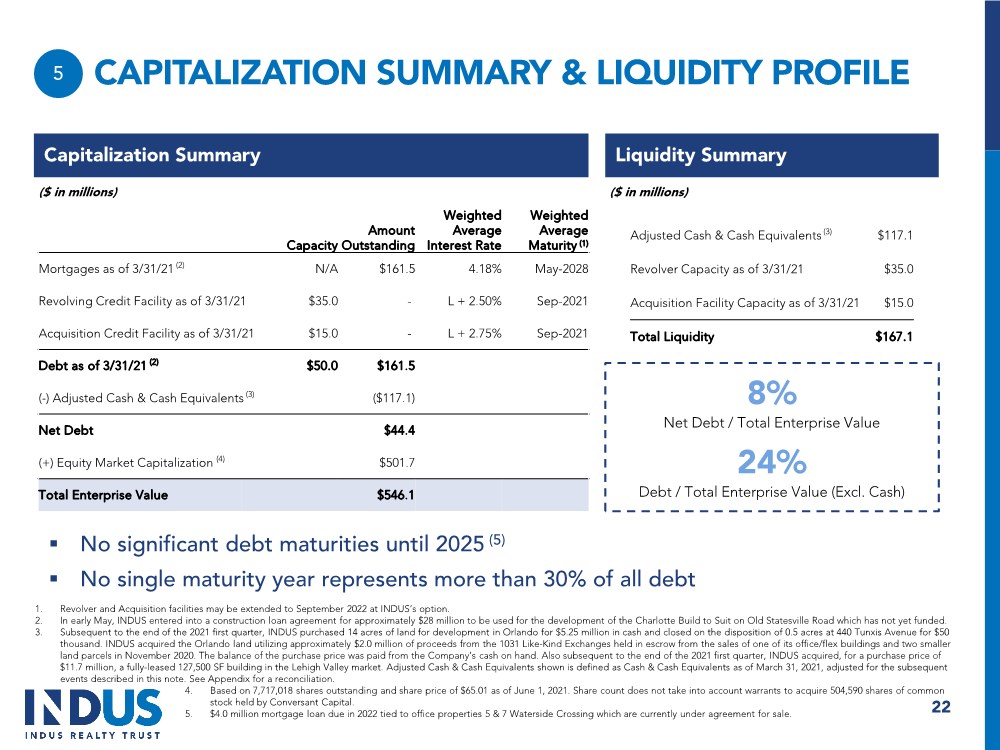
| Capacity Amount Outstanding Weighted Average Interest Rate Weighted Average Maturity (1) Mortgages as of 3/31/21 (2) N/A $161.5 4.18% May-2028 Revolving Credit Facility as of 3/31/21 $35.0 - L + 2.50% Sep-2021 Acquisition Credit Facility as of 3/31/21 $15.0 - L + 2.75% Sep-2021 Debt as of 3/31/21 (2) $50.0 $161.5 (-) Adjusted Cash & Cash Equivalents (3) ($117.1) Net Debt $44.4 (+) Equity Market Capitalization (4) $501.7 Total Enterprise Value $546.1 CAPITALIZATION SUMMARY & LIQUIDITY PROFILE Capitalization Summary Liquidity Summary 22 ($ in millions) ($ in millions) 5 8% Net Debt / Total Enterprise Value 24% Debt / Total Enterprise Value (Excl. Cash) Adjusted Cash & Cash Equivalents (3) $117.1 Revolver Capacity as of 3/31/21 $35.0 Acquisition Facility Capacity as of 3/31/21 $15.0 Total Liquidity $167.1 . No significant debt maturities until 2025 (5) . No single maturity year represents more than 30% of all debt 1. Revolver and Acquisition facilities may be extended to September 2022 at INDUS’s option. 2. In early May, INDUS entered into a construction loan agreement for approximately $28 million to be used for the development of the Charlotte Build to Suit on Old Statesville Road which has not yet funded. 3. Subsequent to the end of the 2021 first quarter, INDUS purchased 14 acres of land for development in Orlando for $5.25 million in cash and closed on the disposition of 0.5 acres at 440 Tunxis Avenue for $50 thousand. INDUS acquired the Orlando land utilizing approximately $2.0 million of proceeds from the 1031 Like-Kind Exchanges held in escrow from the sales of one of its office/flex buildings and two smaller land parcels in November 2020. The balance of the purchase price was paid from the Company’s cash on hand. Also subsequent to the end of the 2021 first quarter, INDUS acquired, for a purchase price of $11.7 million, a fully-leased 127,500 SF building in the Lehigh Valley market. Adjusted Cash & Cash Equivalents shown is defined as Cash & Cash Equivalents as of March 31, 2021, adjusted for the subsequent events described in this note. See Appendix for a reconciliation. 4. Based on 7,717,018 shares outstanding and share price of $65.01 as of June 1, 2021. Share count does not take into account warrants to acquire 504,590 shares of common stock held by Conversant Capital. 5. $4.0 million mortgage loan due in 2022 tied to office properties 5 & 7 Waterside Crossing which are currently under agreement for sale. |
| INVESTMENT HIGHLIGHTS High Quality Industrial Portfolio & Tenancy Disciplined & Established Investment Strategy Significant Growth Opportunities Well-Positioned in the Industrial Sector 23 1 2 3 4 5 Balance Sheet Positioned for Growth |

| APPENDIX 24 |
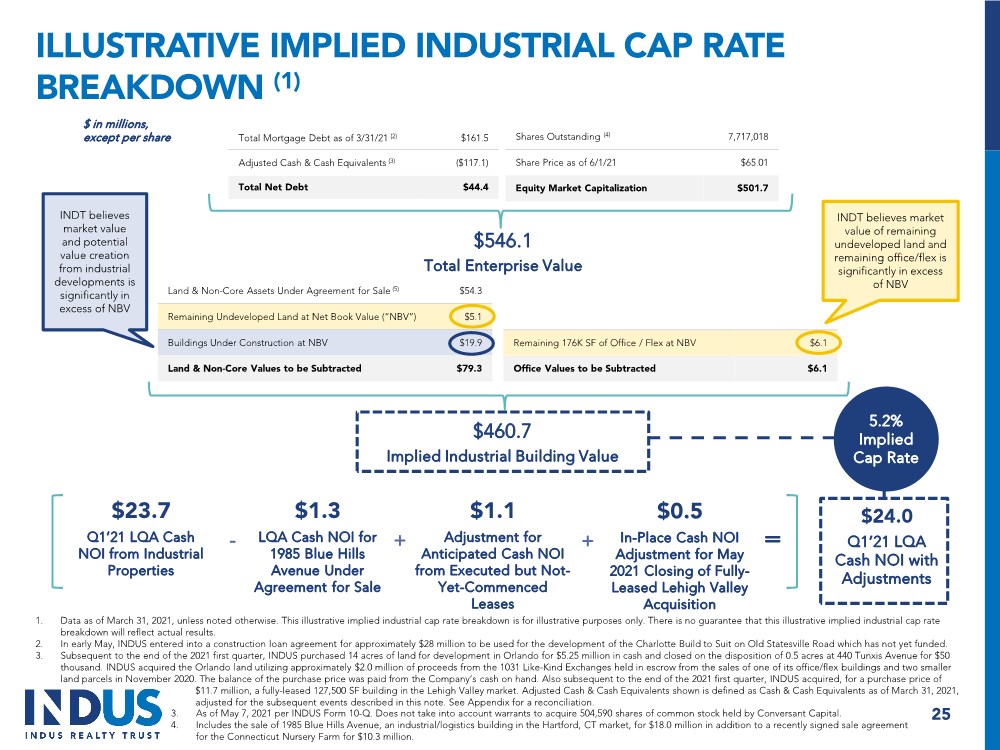
| ILLUSTRATIVE IMPLIED INDUSTRIAL CAP RATE BREAKDOWN (1) 1. Data as of March 31, 2021, unless noted otherwise. This illustrative implied industrial cap rate breakdown is for illustrative purposes only. There is no guarantee that this illustrative implied industrial cap rate breakdown will reflect actual results. 2. In early May, INDUS entered into a construction loan agreement for approximately $28 million to be used for the development of the Charlotte Build to Suit on Old Statesville Road which has not yet funded. 3. Subsequent to the end of the 2021 first quarter, INDUS purchased 14 acres of land for development in Orlando for $5.25 million in cash and closed on the disposition of 0.5 acres at 440 Tunxis Avenue for $50 thousand. INDUS acquired the Orlando land utilizing approximately $2.0 million of proceeds from the 1031 Like-Kind Exchanges held in escrow from the sales of one of its office/flex buildings and two smaller land parcels in November 2020. The balance of the purchase price was paid from the Company’s cash on hand. Also subsequent to the end of the 2021 first quarter, INDUS acquired, for a purchase price of $11.7 million, a fully-leased 127,500 SF building in the Lehigh Valley market. Adjusted Cash & Cash Equivalents shown is defined as Cash & Cash Equivalents as of March 31, 2021, adjusted for the subsequent events described in this note. See Appendix for a reconciliation. Total Mortgage Debt as of 3/31/21 (2) $161.5 Adjusted Cash & Cash Equivalents (3) ($117.1) Total Net Debt $44.4 Shares Outstanding (4) 7,717,018 Share Price as of 6/1/21 $65.01 Equity Market Capitalization $501.7 $546.1 Total Enterprise Value Land & Non-Core Assets Under Agreement for Sale (5) $54.3 Remaining Undeveloped Land at Net Book Value (“NBV”) $5.1 Buildings Under Construction at NBV $19.9 Land & Non-Core Values to be Subtracted $79.3 Remaining 176K SF of Office / Flex at NBV $6.1 Office Values to be Subtracted $6.1 $460.7 Implied Industrial Building Value $ in millions, except per share $23.7 Q1’21 LQA Cash NOI from Industrial Properties $1.3 LQA Cash NOI for 1985 Blue Hills Avenue Under Agreement for Sale $1.1 Adjustment for Anticipated Cash NOI from Executed but Not- Yet-Commenced Leases - + = $24.0 Q1’21 LQA Cash NOI with Adjustments 5.2% Implied Cap Rate 25 $0.5 In-Place Cash NOI Adjustment for May 2021 Closing of Fully- Leased Lehigh Valley Acquisition + 3. As of May 7, 2021 per INDUS Form 10-Q. Does not take into account warrants to acquire 504,590 shares of common stock held by Conversant Capital. 4. Includes the sale of 1985 Blue Hills Avenue, an industrial/logistics building in the Hartford, CT market, for $18.0 million in addition to a recently signed sale agreement for the Connecticut Nursery Farm for $10.3 million. INDT believes market value of remaining undeveloped land and remaining office/flex is significantly in excess of NBV INDT believes market value and potential value creation from industrial developments is significantly in excess of NBV |
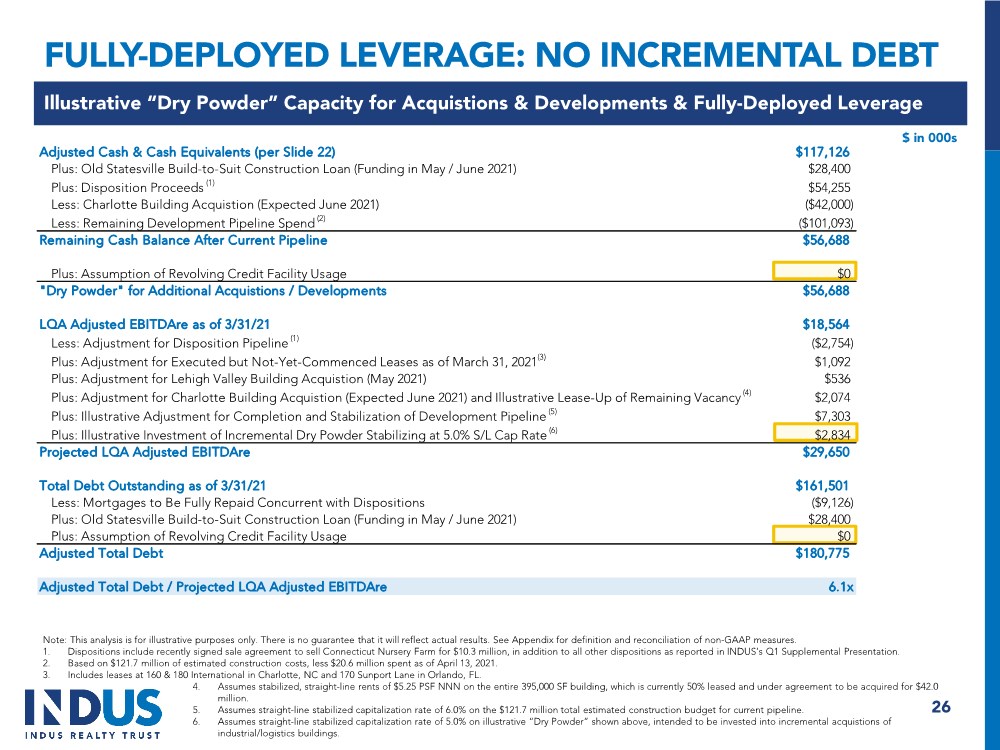
| FULLY-DEPLOYED LEVERAGE: NO INCREMENTAL DEBT 26 Illustrative “Dry Powder” Capacity for Acquistions & Developments & Fully-Deployed Leverage $ in 000s Note: This analysis is for illustrative purposes only. There is no guarantee that it will reflect actual results. See Appendix for definition and reconciliation of non-GAAP measures. 1. Dispositions include recently signed sale agreement to sell Connecticut Nursery Farm for $10.3 million, in addition to all other dispositions as reported in INDUS’s Q1 Supplemental Presentation. 2. Based on $121.7 million of estimated construction costs, less $20.6 million spent as of April 13, 2021. 3. Includes leases at 160 & 180 International in Charlotte, NC and 170 Sunport Lane in Orlando, FL. 4. Assumes stabilized, straight-line rents of $5.25 PSF NNN on the entire 395,000 SF building, which is currently 50% leased and under agreement to be acquired for $42.0 million. 5. Assumes straight-line stabilized capitalization rate of 6.0% on the $121.7 million total estimated construction budget for current pipeline. 6. Assumes straight-line stabilized capitalization rate of 5.0% on illustrative “Dry Powder” shown above, intended to be invested into incremental acquistions of industrial/logistics buildings. Adjusted Cash & Cash Equivalents (per Slide 22) $117,126 Plus: Old Statesville Build-to-Suit Construction Loan (Funding in May / June 2021) $28,400 Plus: Disposition Proceeds (1) $54,255 Less: Charlotte Building Acquistion (Expected June 2021) ($42,000) Less: Remaining Development Pipeline Spend (2) ($101,093) Remaining Cash Balance After Current Pipeline $56,688 Plus: Assumption of Revolving Credit Facility Usage $0 "Dry Powder" for Additional Acquistions / Developments $56,688 LQA Adjusted EBITDAre as of 3/31/21 $18,564 Less: Adjustment for Disposition Pipeline (1) ($2,754) Plus: Adjustment for Executed but Not-Yet-Commenced Leases as of March 31, 2021(3) $1,092 Plus: Adjustment for Lehigh Valley Building Acquistion (May 2021) $536 Plus: Adjustment for Charlotte Building Acquistion (Expected June 2021) and Illustrative Lease-Up of Remaining Vacancy (4) $2,074 Plus: Illustrative Adjustment for Completion and Stabilization of Development Pipeline (5) $7,303 Plus: Illustrative Investment of Incremental Dry Powder Stabilizing at 5.0% S/L Cap Rate (6) $2,834 Projected LQA Adjusted EBITDAre $29,650 Total Debt Outstanding as of 3/31/21 $161,501 Less: Mortgages to Be Fully Repaid Concurrent with Dispositions ($9,126) Plus: Old Statesville Build-to-Suit Construction Loan (Funding in May / June 2021) $28,400 Plus: Assumption of Revolving Credit Facility Usage $0 Adjusted Total Debt $180,775 Adjusted Total Debt / Projected LQA Adjusted EBITDAre 6.1x |
| 27 Illustrative “Dry Powder” Capacity for Acquistions & Developments & Fully-Deployed Leverage $ in 000s Note: This analysis is for illustrative purposes only. There is no guarantee that it will reflect actual results. See Appendix for definition and reconciliation of non-GAAP measures. 1. Dispositions include recently signed sale agreement to sell Connecticut Nursery Farm for $10.3 million, in addition to all other dispositions as reported in INDUS’s Q1 Supplemental Presentation. 2. Based on $121.7 million of estimated construction costs, less $20.6 million spent as of April 13, 2021. 3. Includes leases at 160 & 180 International in Charlotte, NC and 170 Sunport Lane in Orlando, FL. 4. Assumes stabilized, straight-line rents of $5.25 PSF NNN on the entire 395,000 SF building, which is currently 50% leased and under agreement to be acquired for $42.0 million. 5. Assumes straight-line stabilized capitalization rate of 6.0% on the $121.7 million total estimated construction budget for current pipeline. 6. Assumes straight-line stabilized capitalization rate of 5.0% on illustrative “Dry Powder” shown above, intended to be invested into incremental acquistions of industrial/logistics buildings. FULLY-DEPLOYED LEVERAGE: $20M INCREMENTAL DEBT Adjusted Cash & Cash Equivalents (per Slide 22) $117,126 Plus: Old Statesville Build-to-Suit Construction Loan (Funding in May / June 2021) $28,400 Plus: Disposition Proceeds (1) $54,255 Less: Charlotte Building Acquistion (Expected June 2021) ($42,000) Less: Remaining Development Pipeline Spend (2) ($101,093) Remaining Cash Balance After Current Pipeline $56,688 Plus: Assumption of Revolving Credit Facility Usage $20,000 "Dry Powder" for Additional Acquistions / Developments $76,688 LQA Adjusted EBITDAre as of 3/31/21 $18,564 Less: Adjustment for Disposition Pipeline (1) ($2,754) Plus: Adjustment for Executed but Not-Yet-Commenced Leases as of March 31, 2021(3) $1,092 Plus: Adjustment for Lehigh Valley Building Acquistion (May 2021) $536 Plus: Adjustment for Charlotte Building Acquistion (Expected June 2021) and Illustrative Lease-Up of Remaining Vacancy (4) $2,074 Plus: Illustrative Adjustment for Completion and Stabilization of Development Pipeline (5) $7,303 Plus: Illustrative Investment of Incremental Dry Powder Stabilizing at 5.0% S/L Cap Rate (6) $3,834 Projected LQA Adjusted EBITDAre $30,650 Total Debt Outstanding as of 3/31/21 $161,501 Less: Mortgages to Be Fully Repaid Concurrent with Dispositions ($9,126) Plus: Old Statesville Build-to-Suit Construction Loan (Funding in May / June 2021) $28,400 Plus: Assumption of Revolving Credit Facility Usage $20,000 Adjusted Total Debt $200,775 Adjusted Total Debt / Projected LQA Adjusted EBITDAre 6.6x |

| OUR PRIORITIES 28 |
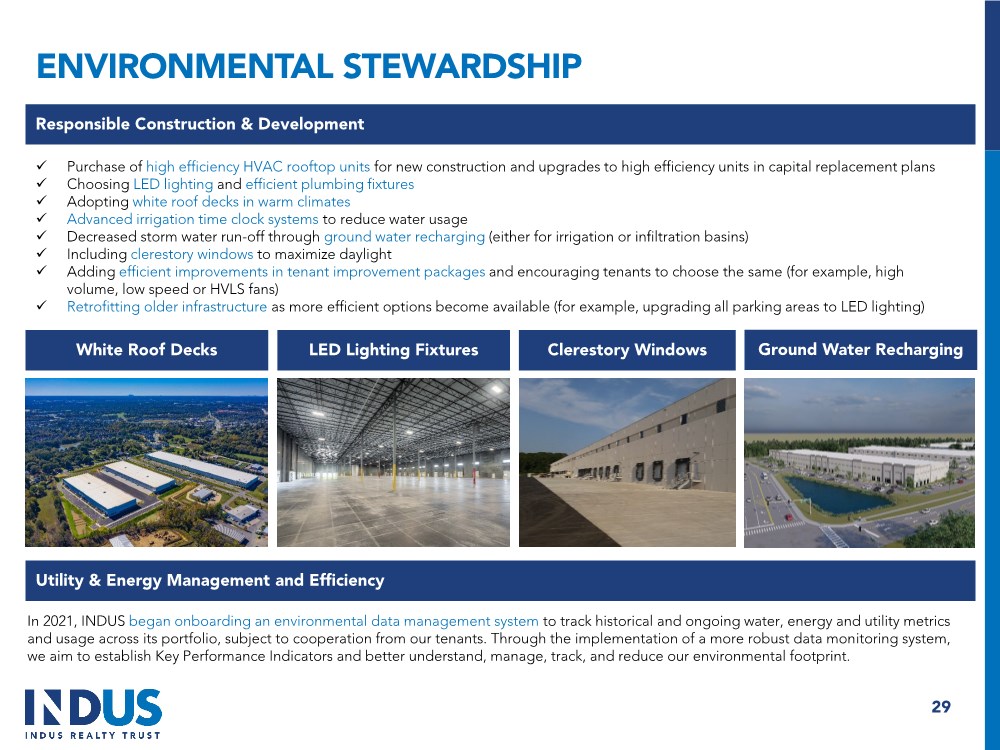
| ENVIRONMENTAL STEWARDSHIP 29 Purchase of high efficiency HVAC rooftop units for new construction and upgrades to high efficiency units in capital replacement plans Choosing LED lighting and efficient plumbing fixtures Adopting white roof decks in warm climates Advanced irrigation time clock systems to reduce water usage Decreased storm water run-off through ground water recharging (either for irrigation or infiltration basins) Including clerestory windows to maximize daylight Adding efficient improvements in tenant improvement packages and encouraging tenants to choose the same (for example, high volume, low speed or HVLS fans) Retrofitting older infrastructure as more efficient options become available (for example, upgrading all parking areas to LED lighting) Responsible Construction & Development Utility & Energy Management and Efficiency In 2021, INDUS began onboarding an environmental data management system to track historical and ongoing water, energy and utility metrics and usage across its portfolio, subject to cooperation from our tenants. Through the implementation of a more robust data monitoring system, we aim to establish Key Performance Indicators and better understand, manage, track, and reduce our environmental footprint. White Roof Decks LED Lighting Fixtures Clerestory Windows Ground Water Recharging |
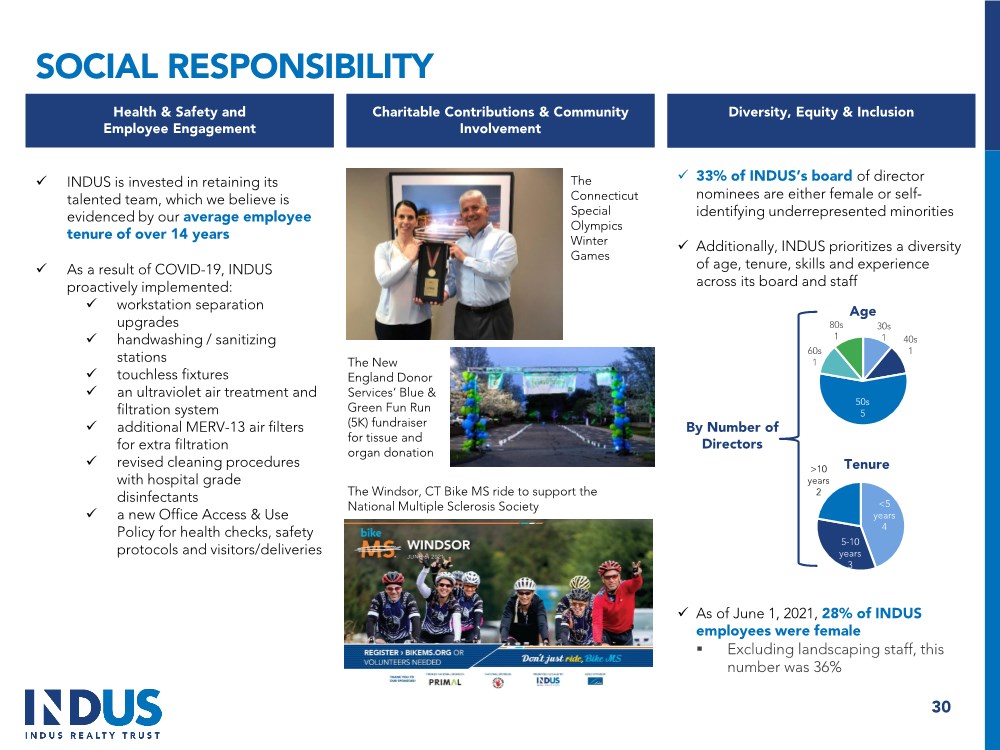
| SOCIAL RESPONSIBILITY 30 INDUS is invested in retaining its talented team, which we believe is evidenced by our average employee tenure of over 14 years As a result of COVID-19, INDUS proactively implemented: workstation separation upgrades handwashing / sanitizing stations touchless fixtures an ultraviolet air treatment and filtration system additional MERV-13 air filters for extra filtration revised cleaning procedures with hospital grade disinfectants a new Office Access & Use Policy for health checks, safety protocols and visitors/deliveries Health & Safety and Employee Engagement Charitable Contributions & Community Involvement Diversity, Equity & Inclusion The Windsor, CT Bike MS ride to support the National Multiple Sclerosis Society The Connecticut Special Olympics Winter Games The New England Donor Services’ Blue & Green Fun Run (5K) fundraiser for tissue and organ donation 33% of INDUS’s board of director nominees are either female or self- identifying underrepresented minorities Additionally, INDUS prioritizes a diversity of age, tenure, skills and experience across its board and staff As of June 1, 2021, 28% of INDUS employees were female . Excluding landscaping staff, this number was 36% 30s 1 40s 1 50s 5 60s 1 80s 1 Age <5 years 4 5-10 years 3 >10 years 2 Tenure By Number of Directors |
| DEFINITIONS & RECONCILIATIONS 31 |
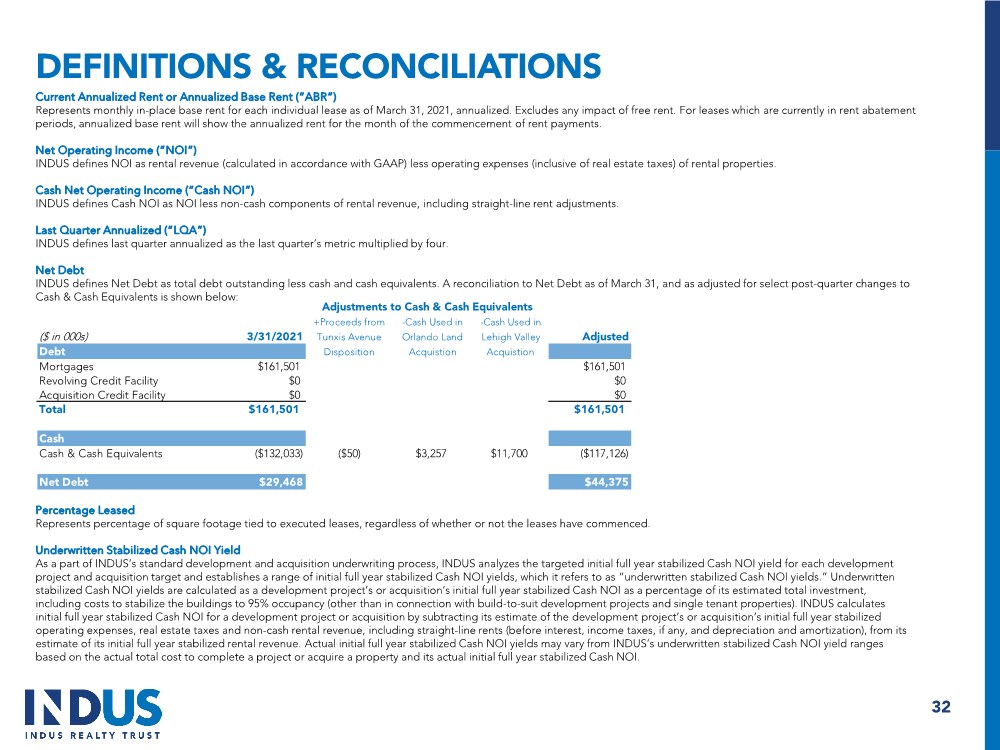
| DEFINITIONS & RECONCILIATIONS 32 Current Annualized Rent or Annualized Base Rent (“ABR”) Represents monthly in-place base rent for each individual lease as of March 31, 2021, annualized. Excludes any impact of free rent. For leases which are currently in rent abatement periods, annualized base rent will show the annualized rent for the month of the commencement of rent payments. Net Operating Income (“NOI”) INDUS defines NOI as rental revenue (calculated in accordance with GAAP) less operating expenses (inclusive of real estate taxes) of rental properties. Cash Net Operating Income (“Cash NOI”) INDUS defines Cash NOI as NOI less non-cash components of rental revenue, including straight-line rent adjustments. Last Quarter Annualized (“LQA”) INDUS defines last quarter annualized as the last quarter’s metric multiplied by four. Net Debt INDUS defines Net Debt as total debt outstanding less cash and cash equivalents. A reconciliation to Net Debt as of March 31, and as adjusted for select post-quarter changes to Cash & Cash Equivalents is shown below: Percentage Leased Represents percentage of square footage tied to executed leases, regardless of whether or not the leases have commenced. Underwritten Stabilized Cash NOI Yield As a part of INDUS’s standard development and acquisition underwriting process, INDUS analyzes the targeted initial full year stabilized Cash NOI yield for each development project and acquisition target and establishes a range of initial full year stabilized Cash NOI yields, which it refers to as “underwritten stabilized Cash NOI yields.” Underwritten stabilized Cash NOI yields are calculated as a development project’s or acquisition’s initial full year stabilized Cash NOI as a percentage of its estimated total investment, including costs to stabilize the buildings to 95% occupancy (other than in connection with build-to-suit development projects and single tenant properties). INDUS calculates initial full year stabilized Cash NOI for a development project or acquisition by subtracting its estimate of the development project’s or acquisition’s initial full year stabilized operating expenses, real estate taxes and non-cash rental revenue, including straight-line rents (before interest, income taxes, if any, and depreciation and amortization), from its estimate of its initial full year stabilized rental revenue. Actual initial full year stabilized Cash NOI yields may vary from INDUS’s underwritten stabilized Cash NOI yield ranges based on the actual total cost to complete a project or acquire a property and its actual initial full year stabilized Cash NOI. Adjustments to Cash & Cash Equivalents +Proceeds from -Cash Used in -Cash Used in ($ in 000s) 3/31/2021 Tunxis Avenue Orlando Land Lehigh Valley Adjusted Debt Disposition Acquistion Acquistion Mortgages $161,501 $161,501 Revolving Credit Facility $0 $0 Acquisition Credit Facility $0 $0 Total $161,501 $161,501 Cash Cash & Cash Equivalents ($132,033) ($50) $3,257 $11,700 ($117,126) Net Debt $29,468 $44,375 |
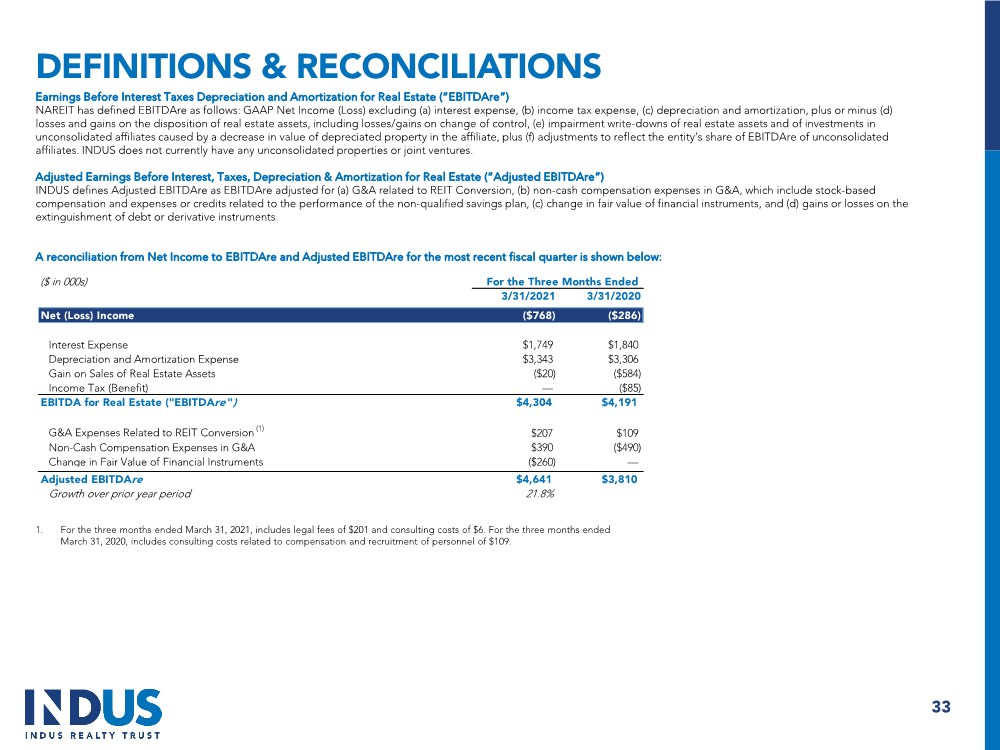
| DEFINITIONS & RECONCILIATIONS 33 Earnings Before Interest Taxes Depreciation and Amortization for Real Estate (“EBITDAre”) NAREIT has defined EBITDAre as follows: GAAP Net Income (Loss) excluding (a) interest expense, (b) income tax expense, (c) depreciation and amortization, plus or minus (d) losses and gains on the disposition of real estate assets, including losses/gains on change of control, (e) impairment write-downs of real estate assets and of investments in unconsolidated affiliates caused by a decrease in value of depreciated property in the affiliate, plus (f) adjustments to reflect the entity’s share of EBITDAre of unconsolidated affiliates. INDUS does not currently have any unconsolidated properties or joint ventures. Adjusted Earnings Before Interest, Taxes, Depreciation & Amortization for Real Estate (“Adjusted EBITDAre”) INDUS defines Adjusted EBITDAre as EBITDAre adjusted for (a) G&A related to REIT Conversion, (b) non-cash compensation expenses in G&A, which include stock-based compensation and expenses or credits related to the performance of the non-qualified savings plan, (c) change in fair value of financial instruments, and (d) gains or losses on the extinguishment of debt or derivative instruments. A reconciliation from Net Income to EBITDAre and Adjusted EBITDAre for the most recent fiscal quarter is shown below: 1. For the three months ended March 31, 2021, includes legal fees of $201 and consulting costs of $6. For the three months ended March 31, 2020, includes consulting costs related to compensation and recruitment of personnel of $109. ($ in 000s) For the Three Months Ended 3/31/2021 3/31/2020 Net (Loss) Income ($768) ($286) Interest Expense $1,749 $1,840 Depreciation and Amortization Expense $3,343 $3,306 Gain on Sales of Real Estate Assets ($20) ($584) Income Tax (Benefit) — ($85) EBITDA for Real Estate ("EBITDAre ") $4,304 $4,191 G&A Expenses Related to REIT Conversion (1) $207 $109 Non-Cash Compensation Expenses in G&A $390 ($490) Change in Fair Value of Financial Instruments ($260) — p Adjusted EBITDAre $4,641 $3,810 Growth over prior year period 21.8% |