Attached files
| file | filename |
|---|---|
| EX-31.1 - EX-31.1 - INDUS REALTY TRUST, INC. | grif-20171130ex311f53a38.htm |
| EX-32.2 - EX-32.2 - INDUS REALTY TRUST, INC. | grif-20171130ex3225db876.htm |
| EX-32.1 - EX-32.1 - INDUS REALTY TRUST, INC. | grif-20171130ex3213480de.htm |
| EX-31.2 - EX-31.2 - INDUS REALTY TRUST, INC. | grif-20171130ex312ff4b2f.htm |
| EX-23.1 - EX-23.1 - INDUS REALTY TRUST, INC. | grif-20171130ex231106ffa.htm |
| EX-21 - EX-21 - INDUS REALTY TRUST, INC. | grif-20171130ex21a59c234.htm |
| EX-10.61 - EX-10.61 - INDUS REALTY TRUST, INC. | grif-20171130ex1061a67be.htm |
| EX-10.60 - EX-10.60 - INDUS REALTY TRUST, INC. | grif-20171130ex10603bc7f.htm |
UNITED STATES
SECURITIES AND EXCHANGE COMMISSION
WASHINGTON, D.C. 20549
FORM 10-K
|
☒ |
ANNUAL REPORT PURSUANT TO SECTION 13 or 15(d) OF THE SECURITIES EXCHANGE ACT OF 1934 |
|
|
|
|
For the fiscal year ended November 30, 2017 |
|
|
|
|
|
OR |
|
|
|
|
|
☐ |
TRANSITION REPORT PURSUANT TO SECTION 13 or 15(d) OF THE SECURITIES EXCHANGE ACT OF 1934 |
Commission file number 1-12879
GRIFFIN INDUSTRIAL REALTY, INC.
(Exact name of registrant as specified in its charter)
|
Delaware |
06-0868496 |
|
|
|
|
641 Lexington Avenue |
10022 (Zip Code) |
(212) 218-7910
(Registrant’s telephone number, including area code)
SECURITIES REGISTERED PURSUANT TO SECTION 12 (b) OF THE ACT:
|
Title of Each Class |
Name of Each Exchange on Which Registered |
|
Common Stock $0.01 par value per share |
The Nasdaq Stock Market LLC |
SECURITIES REGISTERED PURSUANT TO SECTION 12 (g) OF THE ACT: None
Indicate by check mark if the registrant is a well-known seasoned issuer, as defined by Rule 405 of the Securities Act. Yes ☐ No ☒
Indicate by check mark if the registrant is not required to file reports pursuant to Section 13 or Section 15(d) of the Act. Yes ☐ No ☒
Indicate by check mark whether the registrant (1) has filed all reports required to be filed by Section 13 or 15(d) of the Securities Exchange Act of 1934 during the preceding 12 months (or for such shorter period that the registrant was required to file such reports), and (2) has been subject to such filing requirements for the past 90 days. Yes ☒ No ☐
Indicate by check mark whether the registrant has submitted electronically and posted on its corporate Web site, if any, every Interactive Data File required to be submitted and posted pursuant to Rule 405 of Regulation S-T during the preceding 12 months (or for such shorter period that the registrant was required to submit and post such files). Yes ☒ No ☐
Indicate by check mark if disclosure of delinquent filers pursuant to Item 405 of Regulation S-K is not contained herein, and will not be contained, to the best of registrant’s knowledge, in definitive proxy or information statements incorporated by reference in Part III of this Form 10-K or any amendment to this Form 10-K. ☒
Indicate by check mark whether the registrant is a large accelerated filer, an accelerated filer, a non-accelerated filer, smaller reporting company, or an emerging growth company. See the definitions of “large accelerated filer,” “accelerated filer,” “smaller reporting company,” and “emerging growth company” in Rule 12b-2 of the Exchange Act.
|
Large accelerated filer ☐ |
|
Accelerated filer ☒ |
|
|||
|
Non-accelerated filer ☐ |
|
Smaller reporting company ☐ |
Emerging growth company ☐ |
|||
If an emerging growth company, indicate by check mark if the registrant has elected not to use the extended transition period for complying with any new or revised financial accounting standards provided pursuant to Section 13(a) of the Exchange Act. ☐
Indicate by check mark whether the registrant is a shell company (as defined in Rule 12b-2 of the Act). Yes ☐ No ☒
The aggregate market value of the Common Stock held by non-affiliates of the registrant was approximately $81,533,000 based on the closing sales price on The Nasdaq Stock Market LLC on May 31, 2017, the last business day of the registrant’s most recently completed second quarter. Shares of Common Stock held by each executive officer, director and persons or entities known to the registrant to be affiliates of the foregoing have been excluded in that such persons may be deemed to be affiliates. This assumption regarding affiliate status is not necessarily a conclusive determination for other purposes.
As of January 31, 2018, 5,001,006 shares of common stock were outstanding.
FORWARD‑LOOKING STATEMENTS
This Annual Report on Form 10‑K (the “Annual Report”) contains forward‑looking statements within the meaning of Section 21E of the Securities Exchange Act of 1934, as amended (the “Exchange Act”). For this purpose, any statements contained in this Annual Report that relate to future events or conditions, including without limitation, the statements in Part I, Item 1. “Business” and Item 1A. “Risk Factors” and in Part II Item 7. “Management’s Discussion and Analysis of Financial Condition and Results of Operations” as well as located elsewhere in this Annual Report regarding industry prospects or Griffin Industrial Realty, Inc.’s (“Griffin”) plans, expectations, or prospective results of operations or financial position, may be deemed to be forward‑looking statements. Without limiting the foregoing, the words “believes,” “anticipates,” “plans,” “expects,” and similar expressions are intended to identify forward‑looking statements. Such forward‑looking statements represent management’s current expectations and are inherently uncertain. There are a number of important factors that could materially impact the value of Griffin’s common stock or cause actual results to differ materially from those indicated by such forward‑looking statements. Such factors include: adverse economic conditions and credit markets; a downturn in the commercial and residential real estate markets; risks associated with concentration of real estate holdings; risks associated with entering new real estate markets; risks associated with competition with other parties for acquisition of properties; risks associated with the use of third-party managers for day-to-day property management; risks relating to reliance on lease revenues; risks associated with nonrecourse mortgage loans; risks of financing arrangements that include balloon payment obligations; risks associated with failure to effectively hedge against interest rate changes; risks associated with volatility in the capital markets; risks associated with increased operating expenses; potential environmental liabilities; governmental regulations; inadequate insurance coverage; risks of environmental factors; risks associated with the cost of raw materials or energy costs; risks associated with deficiencies in disclosure controls and procedures or internal control over financial reporting; risks associated with information technology security breaches; litigation risks; and the concentrated ownership of Griffin common stock by members of the Cullman and Ernst families. These and the important factors discussed under the caption “Risk Factors” in Part I, Item 1A of this Annual Report for the fiscal year ended November 30, 2017, among others, could cause actual results to differ materially from those indicated by forward‑looking statements made in this Annual Report and presented elsewhere by management from time to time. Any such forward‑looking statements represent management’s estimates as of the date of this Annual Report. While Griffin may elect to update such forward‑looking statements at some point in the future, Griffin disclaims any obligation to do so, even if subsequent events cause Griffin’s views to change. These forward‑looking statements should not be relied upon as representing Griffin’s views as of any date subsequent to the date of this Annual Report.
2
GRIFFIN INDUSTRIAL REALTY, INC.
FORM 10-K
|
|
|
|
|
|
|
|
|
|
|
|
4 | ||
|
|
|
|
|
|
|
13 | ||
|
|
|
|
|
|
|
22 | ||
|
|
|
|
|
|
|
23 | ||
|
|
|
|
|
|
|
25 | ||
|
|
|
|
|
|
|
25 | ||
|
|
|
|
|
|
|
|
|
|
|
|
|
|
|
|
|
26 | ||
|
|
|
|
|
|
|
28 | ||
|
|
|
|
|
|
|
MANAGEMENT’S DISCUSSION AND ANALYSIS OF FINANCIAL CONDITION AND RESULTS OF OPERATIONS |
29 | |
|
|
|
|
|
|
|
44 | ||
|
|
|
|
|
|
|
|
||
|
|
|
|
|
|
|
|
45 | |
|
|
|
|
|
|
|
|
46 | |
|
|
|
|
|
|
|
|
47 | |
|
|
|
|
|
|
|
|
48 | |
|
|
|
|
|
|
|
|
49 | |
|
|
|
|
|
|
|
|
50 | |
|
- |
|
|
|
|
|
CHANGES IN AND DISAGREEMENTS WITH ACCOUNTANTS ON ACCOUNTING AND FINANCIAL DISCLOSURE |
78 | |
|
|
|
|
|
|
|
78 | ||
|
|
|
|
|
|
|
79 | ||
|
|
|
|
|
|
|
|
|
|
|
|
|
|
|
|
|
80 | ||
|
|
|
|
|
|
|
83 | ||
|
|
|
|
|
|
|
SECURITY OWNERSHIP OF CERTAIN BENEFICIAL OWNERS AND MANAGEMENT AND RELATED STOCKHOLDER MATTERS |
96 | |
|
|
|
|
|
|
|
CERTAIN RELATIONSHIPS AND RELATED TRANSACTIONS AND DIRECTOR INDEPENDENCE |
98 | |
|
|
|
|
|
|
|
99 | ||
|
|
|
|
|
|
|
|
|
|
|
|
|
|
|
|
|
100 | ||
|
|
|
|
|
|
|
|
101 | |
|
|
|
|
|
|
|
|
106 |
3
ITEM 1. BUSINESS.
Griffin Industrial Realty, Inc. (“Griffin”) is a real estate business principally engaged in developing, managing and leasing industrial/warehouse properties, and to a lesser extent, office/flex properties. Griffin seeks to add to its property portfolio through the acquisition and development of land or the purchase of buildings in select markets targeted by Griffin. Periodically, Griffin may sell certain portions of its undeveloped land that it has owned for an extended time period and the use of which is not consistent with Griffin’s core development and leasing strategy. Prior to May 13, 2015, Griffin was known as Griffin Land & Nurseries, Inc. On May 13, 2015, Griffin changed its name to better reflect its ongoing real estate business and focus on industrial/warehouse properties after the sale in fiscal 2014 of the landscape nursery business that Griffin had operated through its wholly owned subsidiary, Imperial Nurseries, Inc.
As of November 30, 2017, Griffin owned thirty‑five buildings comprising approximately 3,710,000 square feet that was 95% leased. Approximately 88% of Griffin’s currently owned square footage is industrial/warehouse space, with the balance principally being office/flex space. As of November 30, 2017, approximately 98% of Griffin’s industrial/warehouse space was leased and approximately 71% of Griffin’s office/flex space was leased. As stated in “Item 2. Properties” below, Griffin uses nonrecourse mortgage loans to finance some of its real estate development activities, and as of November 30, 2017, approximately $131.0 million was outstanding under such loans. In fiscal 2017, profit from leasing activities (which Griffin defines as rental revenue less operating expenses of rental properties) was approximately $21.1 million, while debt service on nonrecourse mortgage loans was approximately $8.7 million.
Through fiscal 2009, all of Griffin’s buildings were located in the north submarket of Hartford, Connecticut. In fiscal 2010, Griffin started the expansion of its real estate holdings to areas outside of Hartford by purchasing an industrial/warehouse building and undeveloped land in the Lehigh Valley of Pennsylvania (see “Lehigh Valley, Pennsylvania” on page 8). In fiscal 2017, Griffin expanded its real estate holdings into the southeast United States by acquiring 215 International Drive (“215 International”), an approximately 277,000 square foot industrial/warehouse building in Concord, North Carolina, which is in the greater Charlotte area (see “Charlotte, North Carolina” on page 9). 215 International was 74% leased at the time of acquisition. Subsequently, an existing tenant in that building leased all of the remaining vacant space. Griffin expects to continue to seek to acquire and develop properties that are consistent with its core strategy of developing and leasing industrial/warehouse properties. Griffin targets properties that are in close proximity to transportation infrastructure (highways, airports, railways and sea ports) that can accommodate single and multiple tenants in flexible layouts. Griffin expects that most of such potential acquisitions of either undeveloped land or land and buildings will likely be located outside of the Hartford area in select markets targeted by Griffin.
The Q4 2017 CBRE|New England Marketview Report (the “Q4 2017 CBRE|New England Report”) from CBRE Group, Inc. (“CBRE”), a national real estate services company, stated that as of December 31, 2017, the overall vacancy rate in the greater Hartford industrial market decreased to 8.8% at the end of 2017 from 12.3% at the end of 2014, with approximately 0.8 million square feet of net absorption in the greater Hartford industrial market in 2017. The greater Hartford industrial market had been stagnant in the years 2012 through 2014, but improved during the past three years. Griffin believes that it benefits from its reputation as a stable landlord with sufficient resources to meet its obligations and deliver space to tenants timely and in accordance with the terms of their lease agreements.
CBRE’s Q4 2017 Market Snapshot Report on Lehigh Valley PA Industrial stated that as of December 31, 2017, the vacancy rate in that market was 6.9%, with a net absorption of approximately 2.2 million square feet in 2017. CBRE’s Q4 2017 Marketview Charlotte Industrial Report stated a vacancy rate of 4.6% for warehouse space at the end of 2017, with absorption of 3.1 million square feet of warehouse space in 2017.
All of Griffin’s office/flex space is in the north submarket of Hartford. The Q4 2017 CBRE|New England Report stated that as of December 31, 2017, the overall vacancy rate in the greater Hartford office market was approximately 17.9%, as compared to 16% at the end of the two previous years, and the vacancy rate for office space in the north submarket increased to 30.9% at December 31, 2017 from 21% a year earlier. As of November 30, 2017, square footage of office/flex buildings comprised approximately 12% of Griffin’s total square footage. Griffin expects
4
that its office/flex space will continue to become a smaller percentage of its total space as Griffin expects to focus on the growth of its industrial/warehouse building portfolio either through the acquisition of fully or partially leased buildings, development of buildings on land currently owned or to be acquired, or both.
Additional capacity or an increase in vacancies in either the industrial or office markets could adversely affect Griffin’s operating results by potentially resulting in longer times to lease vacant space, eroding lease rates in Griffin’s properties or hindering renewals by existing tenants. There can be no assurances as to the directions of the Hartford, Lehigh Valley or Charlotte real estate markets in the near future.
In fiscal 2017, in addition to the acquisition of 215 International, Griffin completed construction, on speculation, of an approximately 137,000 square foot industrial/warehouse building (“330 Stone”) in New England Tradeport (“NE Tradeport”), Griffin’s master‑planned industrial park near Bradley International Airport and Interstate 91, located in Windsor and East Granby, Connecticut. As of November 30, 2017, Griffin had leased approximately 74,000 square feet of 330 Stone to a tenant that relocated from approximately 39,000 square feet in another of Griffin’s NE Tradeport industrial/warehouse buildings. Griffin was able to backfill the vacated space with a new tenant that is expected to take occupancy in the fiscal 2018 first quarter. In fiscal 2017, Griffin also leased approximately 104,000 square feet of previously vacant NE Tradeport industrial/warehouse space, including a ten and one-half year lease for approximately 89,000 square feet. Griffin extended leases aggregating approximately 387,000 square feet in fiscal 2017, including a full building lease of 100 International Drive (“100 International”) an approximately 304,000 square foot industrial/warehouse building in NE Tradeport. That lease extension, done in connection with refinancing the mortgage loan on 100 International, resulted in an additional six years of lease term beyond the original lease expiration date of July 31, 2019. Also in fiscal 2017, Griffin completed a full building lease of approximately 23,000 square feet of office/flex space, replacing the tenant that did not extend its lease of that building. The net effect of Griffin’s construction, acquisition and leasing transactions in fiscal 2017 was an increase of approximately 461,000 square feet of industrial/warehouse space under lease as of November 30, 2017 as compared to November 30, 2016 and a decrease of approximately 11,000 square feet in office/flex space under lease as of November 30, 2017 as compared to November 30, 2016. A lease of approximately 11,000 square feet of office/flex space was entered into subsequent to November 30, 2017.
In fiscal 2016, Griffin completed and placed in service an approximately 252,000 square foot industrial building (“5210 Jaindl”) in the Lehigh Valley of Pennsylvania, thus completing the development of an approximately 50 acre parcel of undeveloped land acquired in December 2013. As of November 30, 2016, Griffin had entered into two leases for 5210 Jaindl resulting in that building being fully leased. Both of those leases became effective in the fiscal 2017 first quarter. In addition to the two leases at 5210 Jaindl, Griffin entered into several other leases aggregating approximately 240,000 square feet in fiscal 2016, all but approximately 21,000 square feet of which was for industrial/warehouse space. Included in the fiscal 2016 leasing activity was a lease for approximately 101,000 square feet in 4270 Fritch Drive (“4270 Fritch”), an approximately 303,000 square foot industrial/warehouse building in the Lehigh Valley built in fiscal 2014. As of November 30, 2016, Griffin’s five Lehigh Valley industrial/warehouse buildings aggregating approximately 1,183,000 square feet were fully leased. In addition to the Lehigh Valley leasing, Griffin completed several leases aggregating approximately 139,000 square feet for its Connecticut properties, including approximately 118,000 square feet of industrial/warehouse space, mostly in NE Tradeport. In fiscal 2016, Griffin also extended leases aggregating approximately 248,000 square feet, most of which was NE Tradeport industrial/warehouse space. Also in fiscal 2016, leases for approximately 132,000 square feet expired, which included a lease for an entire approximately 57,000 square foot NE Tradeport industrial/warehouse building that was subsequently re-leased during the year. The net effect of these transactions was an increase of approximately 410,000 square feet in industrial/warehouse space under lease as of November 30, 2016 as compared to November 30, 2015 and a decrease of approximately 51,000 square feet in office/flex space under lease as of November 30, 2016 as compared to November 30, 2015.
In fiscal 2015, Griffin completed and placed in service an approximately 280,000 square foot industrial building (“5220 Jaindl”) in the Lehigh Valley of Pennsylvania. The tenant that initially leased approximately 196,000 square feet in 5220 Jaindl when the building was placed in service subsequently exercised its option under the lease to lease the balance of the building. Rental revenue on the additional space commenced in fiscal 2016. In addition to fully leasing 5220 Jaindl in fiscal 2015, Griffin completed several other leases aggregating approximately 191,000 square feet, of which approximately 90% was for industrial/warehouse space and approximately 10% was for office/flex space. In fiscal 2015, several leases aggregating approximately 52,000 square feet of office/flex space expired and were not renewed and
5
a lease of approximately 31,000 square feet of industrial/warehouse space was terminated early for which Griffin received a lease termination fee.
Periodically, Griffin may sell certain portions of its undeveloped land that it has owned for an extended time period and the use of which does not fit into Griffin’s core strategy of developing and leasing industrial and commercial properties. Such sale transactions may take place either before or after obtaining development approvals and building basic infrastructure.
In fiscal 2017, Griffin completed several land sales, the largest being the sale of approximately 67 acres of undeveloped land in Phoenix Crossing (the “2017 Phoenix Crossing Land Sale”) for approximately $10.3 million. The land sold under the 2017 Phoenix Crossing Land Sale is part of an approximately 268 acre parcel of land in Bloomfield and Windsor, Connecticut known as Phoenix Crossing. The proceeds from the 2017 Phoenix Crossing Land Sale were placed in escrow at closing and subsequently used in the acquisition of 215 International as part of a like-kind exchange (a “1031 Like-Kind Exchange”) under Section 1031 of the Internal Revenue Code of 1986, as amended. The Like-Kind Exchange enables Griffin to defer the gain on the 2017 Phoenix Crossing Land Sale for income tax purposes. In addition to the 2017 Phoenix Crossing Land Sale, Griffin also sold approximately 76 acres of undeveloped land in Southwick, Massachusetts (the “Southwick Land Sale”) for approximately $2.1 million. The proceeds from the Southwick Land Sale were also placed in escrow at closing and subsequently used for the purchase of approximately 14 acres of undeveloped land in the Lehigh Valley under a 1031 Like-Kind Exchange. In the fiscal 2017 fourth quarter, Griffin started site work for an approximately 134,000 square foot industrial building to be built on the Lehigh Valley land acquired. Construction is expected to begin in the fiscal 2018 first quarter, with completion anticipated during the fiscal 2018 third quarter.
In fiscal 2017, Griffin also completed two smaller sales of undeveloped land in Phoenix Crossing for a total of approximately $1.3 million and the sale of two small residential lots for a total of approximately $0.2 million. Griffin also recognized the remaining $0.1 million of revenue from the fiscal 2013 sale of approximately 90 acres of undeveloped land in Phoenix Crossing (the “2013 Phoenix Crossing Land Sale”). Under the terms of the 2013 Phoenix Crossing Land Sale, Griffin and the buyer each were required to construct roadways connecting the land parcel that was sold to existing town roads. As a result of Griffin’s continuing involvement with the land sold, the 2013 Phoenix Crossing Land Sale was accounted for under the percentage of completion method, whereby revenue and gain were recognized as costs related to the 2013 Phoenix Crossing Land Sale were incurred. From the closing of the 2013 Phoenix Crossing Land Sale through fiscal 2017, when Griffin completed its required roadwork, Griffin recognized total revenue of approximately $9.0 million and a total pretax gain of approximately $6.7 million from the 2013 Phoenix Crossing Land Sale.
In fiscal 2016, Griffin completed one land sale for approximately $3.8 million and recognized revenue of approximately $0.6 million related to the 2103 Phoenix Crossing Land Sale. In fiscal 2015, Griffin completed one land sale for approximately $0.6 million and recognized revenue of $2.5 million related to the 2013 Phoenix Crossing Land Sale.
A portion of Griffin’s landholdings in Connecticut is zoned for residential use. The weakness in the residential real estate market has adversely affected Griffin’s residential real estate development activities. The continued weakness of the residential real estate market could result in lower selling prices for Griffin’s land intended for residential use or delay the sale of such land.
Griffin’s development of its land is affected by regulatory and other constraints. Subdivision and other residential development may also be affected by the potential adoption of initiatives meant to limit or concentrate residential growth. Industrial/warehouse development activities on Griffin’s undeveloped land may also be affected by traffic considerations, potential environmental issues, community opposition and other restrictions to development imposed by governmental agencies.
Industrial/Warehouse Properties
Connecticut
A significant portion of Griffin’s industrial development in Connecticut has been focused on NE Tradeport, where Griffin has built and currently owns fourteen industrial/warehouse buildings aggregating approximately 1,603,000 square feet. NE Tradeport was approximately 96% leased as of November 30, 2017. Griffin’s total portfolio of approximately 1,818,000 square feet of industrial/warehouse space in Connecticut was 96% leased as of November 30, 2017. In NE Tradeport, Griffin holds the rights to 658,000 square feet available for development under the State Traffic
6
Certificate (“STC”) which relates to three approved building sites on approximately 70 acres and an approved addition to one of Griffin’s existing buildings. Construction of 220 Tradeport Drive (see below) would use two of the three approved building sites on the 70 acre parcel and reduce the square footage available for development under the STC in NE Tradeport by approximately 234,000 square feet. Griffin owns an additional 95 acres of undeveloped land within NE Tradeport, 60 acres of which are located in Windsor and the abutting 35 acres of which are located in East Granby. There are no STC or other approvals currently in place (other than zoning in the case of Windsor) for the development of this remaining land for industrial use. Griffin believes that additional infrastructure improvements, which may be significant, may be required to obtain approvals to develop portions of this land, particularly the portions in East Granby. Griffin expects to continue to direct much of its real estate efforts in Connecticut on the construction and leasing of its industrial/warehouse facilities at NE Tradeport.
On October 18, 2017, Griffin entered into a full building lease (the “220 Tradeport Lease”) for an approximately 234,000 square foot industrial/warehouse building (“220 Tradeport Drive”) to be built on two of the remaining three approved building sites in NE Tradeport. Construction of 220 Tradeport Drive would reduce the square feet available for development rights in NE Tradeport to approximately 370,000 square feet. The tenant is an investment grade company that intends to use 220 Tradeport Drive for the distribution of automotive parts. The 220 Tradeport Lease, which would commence upon completion of construction of 220 Tradeport Drive, has a term of twelve years and six months with the tenant having several five year renewal options. Provided the tenant meets certain conditions, the tenant has an option (the “Expansion Option”) to cause Griffin to construct an approximately 54,000 square foot addition to 220 Tradeport Drive. If the tenant exercises the Expansion Option, the term for the 220 Tradeport Lease would be extended for at least ten years upon the tenant occupying the additional space. Griffin expects to commence construction of 220 Tradeport Drive in the fiscal 2018 first quarter and complete 220 Tradeport Drive in the second half of fiscal 2018. Griffin expects to spend approximately $17.5 million related to development of 220 Tradeport Drive, including all related site work, building construction, tenant improvements, leasing and financing costs. Griffin has agreed to terms with State Farm Life Insurance Company (“State Farm”) on a construction to permanent mortgage loan for up to $13.8 million. The loan would provide financing during the construction period and, if 220 Tradeport Drive is completed and rent payments under the 220 Tradeport Lease commence, would convert to a fifteen year nonrecourse permanent mortgage loan. There is no guarantee that the construction to permanent mortgage loan with State Farm will be completed under its current terms, or at all.
In fiscal 2017, Griffin leased approximately 216,000 square feet in NE Tradeport, including approximately 74,000 square feet in 330 Stone, a new industrial/warehouse building that was completed and placed in service in the fiscal 2017 fourth quarter. The approximately 74,000 square feet in 330 Stone was leased to a tenant that relocated from approximately 39,000 square feet in another of Griffin’s NE Tradeport industrial/warehouse buildings. The space vacated was subsequently leased to a new tenant in fiscal 2017. Also in fiscal 2017, Griffin renewed several leases aggregating approximately 361,000 square feet, including the approximately 304,000 square feet at 100 International. The rental rates for leases in NE Tradeport that were renewed in fiscal 2017 were, on average, essentially unchanged from the rental rates of the expiring leases. Management believes that the rental rates on three of the four NE Tradeport leases aggregating approximately 58,000 square feet that are scheduled to expire in fiscal 2018 are essentially at the market rates for similar space, and one lease of approximately 48,000 square feet (see below) that is scheduled to expire in fiscal 2018 is above market rates due to the significant amount of tenant improvement work done to that space to meet the tenant’s requirements. Griffin has entered into an agreement with the tenant that will be vacating the approximately 48,000 square feet whereby the tenant has agreed to pay Griffin approximately $0.2 million in connection with a termination of the lease earlier than the original lease expiration.
In addition to its industrial/warehouse buildings in NE Tradeport, Griffin owns a 165,000 square foot industrial building (“1985 Blue Hills”) in Griffin Center, Griffin’s office park in Windsor and Bloomfield, Connecticut, that is being used principally as a data center and call center, an approximately 31,000 square foot industrial/warehouse building (“131 Phoenix”) in Bloomfield, Connecticut that is being used principally as a research and development facility and an approximately 18,000 square foot industrial/warehouse building (“210 West Newberry”) in Griffin Center South, Griffin’s office/flex park in Bloomfield, Connecticut. 131 Phoenix is on an approximately 5 acre site that is part of Phoenix Crossing. As of November 30, 2017, Griffin owns approximately 76 acres of undeveloped land in Phoenix Crossing that is zoned for industrial and commercial development.
As of November 30, 2017, approximately $74.1 million was invested (net book value) by Griffin in its Connecticut industrial/warehouse buildings, approximately $3.7 million was invested (net book value) by Griffin in the
7
undeveloped NE Tradeport land and approximately $1.5 million was invested in the undeveloped Phoenix Crossing land. As of November 30, 2017, fourteen of Griffin’s Connecticut industrial/warehouse buildings were mortgaged for an aggregate of approximately $64.7 million and 210 West Newberry was included in the collateral for Griffin’s $15.0 million revolving line of credit. Subsequent to November 30, 2017, a subsidiary of Griffin closed on the refinancing of an existing mortgage loan that was collateralized by two NE Tradeport industrial/warehouse buildings. The refinancing generated additional mortgage proceeds of $7.0 million and added 330 Stone to the collateral.
A summary of Griffin’s Connecticut industrial/warehouse square footage owned and leased at the end of each of the past three fiscal years and leases in Griffin’s Connecticut industrial/warehouse buildings scheduled to expire during each of the next three fiscal years are as follows:
|
Connecticut industrial/warehouse space |
|
Square |
|
Square |
|
|
|
|
|
|
Footage |
|
Footage |
|
Percentage |
|
|
|
|
Owned |
|
Leased |
|
Leased |
|
|
November 30, 2015 |
|
1,681,000 |
|
1,507,000 |
|
90 |
% |
|
November 30, 2016 |
|
1,681,000 |
|
1,564,000 |
|
93 |
% |
|
November 30, 2017 |
|
1,817,000 |
|
1,748,000 |
|
96 |
% |
|
|
|
2018 |
|
2019 |
|
2020 |
|
|||
|
Square footage of leases expiring |
|
|
106,000 |
|
|
172,000 |
|
|
66,000 |
|
|
Percentage of total leased space at November 30, 2017 |
|
|
3 |
% |
|
5 |
% |
|
2 |
% |
|
Number of tenants with leases expiring |
|
|
4 |
|
|
4 |
|
|
2 |
|
|
Annual rental revenue of expiring leases |
|
$ |
1,003,000 |
|
$ |
1,336,000 |
|
$ |
530,000 |
|
|
Annual rental revenue of expiring leases as a percentage of Griffin’s total fiscal 2017 rental revenue |
|
|
3 |
% |
|
4 |
% |
|
2 |
% |
Lehigh Valley, Pennsylvania
In fiscal 2010, Griffin completed its first acquisitions of property outside of the Hartford, Connecticut area, when it acquired a fully leased approximately 120,000 square foot industrial building and approximately 51 acres of undeveloped land in the Lehigh Valley of Pennsylvania. Subsequently, Griffin acquired an approximately 49 acre parcel of undeveloped land in the Lehigh Valley. Over the past five years, Griffin has built, on speculation, four additional industrial/warehouse buildings aggregating approximately 1,063,000 square feet on those two land parcels. As of November 30, 2017, Griffin owned five fully leased industrial/warehouse buildings in the Lehigh Valley aggregating approximately 1,183,000 square feet. Approximately $65.2 million was invested (net book value) in these buildings as of November 30, 2017. All five Lehigh Valley industrial/warehouse buildings are mortgaged under three separate nonrecourse mortgage loans for a total of approximately $49.8 million as of November 30, 2017.
In the fiscal 2017 fourth quarter, Griffin purchased approximately 14 acres of undeveloped land in the Lehigh Valley that had been under agreement. The closing on this purchase took place after Griffin received all governmental approvals for its planned development, on speculation, of an approximately 134,000 square foot industrial/warehouse building on the land acquired. Griffin started site work in the fiscal 2017 fourth quarter with building construction anticipated to begin in the fiscal 2018 first quarter. Griffin expects to spend approximately $7.8 million for site work and construction of the building shell and complete construction in the fiscal 2018 third quarter.
On January 11, 2018, Griffin entered into an agreement to purchase an approximately 14 acre parcel of undeveloped land in the Lehigh Valley for $3.6 million in cash. If the transaction closes, Griffin plans to construct an industrial/warehouse building on the land to be purchased, the size of which will be based upon findings during due diligence. The closing of this purchase, anticipated to take place in late fiscal 2018 or early fiscal 2019, is subject to several conditions, including the satisfactory outcome of due diligence and obtaining all governmental approvals for
8
Griffin’s development plans for the land to be purchased. There is no guarantee that this transaction will be completed under its current terms, or at all.
A summary of Griffin’s Lehigh Valley industrial/warehouse square footage owned and leased at the end of each of the past three fiscal years and leases in Griffin’s Lehigh Valley industrial/warehouse buildings scheduled to expire during each of the next three fiscal years are as follows:
|
Lehigh Valley industrial/warehouse space |
|
Square |
|
Square |
|
|
|
|
|
|
Footage |
|
Footage |
|
Percentage |
|
|
|
|
Owned |
|
Leased |
|
Leased |
|
|
November 30, 2015 |
|
931,000 |
|
829,000 |
|
89 |
% |
|
November 30, 2016 |
|
1,183,000 |
|
1,183,000 |
|
100 |
% |
|
November 30, 2017 |
|
1,183,000 |
|
1,183,000 |
|
100 |
% |
|
|
|
2018 |
|
2019 |
|
2020 |
|
|||
|
Square footage of leases expiring |
|
|
228,000 |
|
|
— |
|
|
201,000 |
|
|
Percentage of total leased space at November 30, 2017 |
|
|
6 |
% |
|
— |
% |
|
6 |
% |
|
Number of tenants with leases expiring |
|
|
1 |
|
|
— |
|
|
1 |
|
|
Annual rental revenue of expiring leases |
|
$ |
1,501,000 |
|
$ |
— |
|
$ |
1,330,000 |
|
|
Annual rental revenue of expiring leases as a percentage of Griffin’s total fiscal 2017 rental revenue |
|
|
5 |
% |
|
— |
% |
|
4 |
% |
Charlotte, North Carolina
On June 9, 2017, Griffin closed on the acquisition of 215 International, Griffin’s first property in the Charlotte area. 215 International was constructed in 2015 and was 74% leased at the time it was acquired. Subsequent to the closing, one of the tenants in 215 International leased all of the remaining approximately 73,000 square feet that had been vacant at the time the building was acquired. None of the leases for 215 International expire within the next three years. On August 30, 2017, Griffin closed on a $12.15 million nonrecourse mortgage loan collateralized by 215 International.
On October 4, 2017, Griffin entered into an agreement to purchase an approximately 22 acre parcel of undeveloped land in Concord, North Carolina (the “Concord Land”) for $2.6 million in cash. If the transaction closes, Griffin plans to construct an industrial/warehouse development on the Concord Land, which is located near 215 International. The amount of industrial/warehouse space to be developed there will be based upon findings during due diligence. The closing of this purchase, anticipated to take place in fiscal 2018, is subject to several conditions, including the satisfactory outcome of due diligence and obtaining all governmental approvals for Griffin’s development plans for the Concord Land. There is no guarantee that this transaction will be completed under its current terms, or at all.
Griffin may seek to acquire additional properties and/or undeveloped land parcels to expand the industrial/warehouse portion of its real estate business. Griffin continues to examine potential properties for acquisition in the Middle Atlantic, Northeast and Southeast states and selected markets targeted by Griffin.
Office/Flex Properties
Griffin’s office/flex properties are located in Griffin Center in Windsor and Bloomfield, Connecticut and Griffin Center South in Bloomfield. In Griffin Center, Griffin currently owns two multi‑story office buildings that have an aggregate of approximately 161,000 square feet, a single story office building of approximately 48,000 square feet and a small restaurant building of approximately 7,000 square feet. In Griffin Center South, Griffin currently owns eight office/flex buildings with an aggregate of approximately 217,000 square feet of single story office/flex space. As of November 30, 2017, Griffin’s total office/flex space of approximately 433,000 square feet comprised approximately 12% of Griffin’s total real estate portfolio. Griffin’s office/flex square footage was approximately 71% leased as of November 30, 2017.
In fiscal 2017, Griffin entered into a ten year full building lease for the approximately 23,000 square feet at 206 West Newberry Road in Griffin Center South to replace the tenant in that building that did not renew its lease. The full
9
building tenant there had previously informed Griffin that it would not be renewing its lease when it expired in fiscal 2017. In addition, Griffin renewed two leases aggregating approximately 25,000 square feet of office/flex space in fiscal 2017 and a lease for approximately 12,000 square feet of office/flex space expired and was not renewed.
In fiscal 2016, Griffin entered into two new leases for office/flex space aggregating approximately 21,000 square feet, including a lease for approximately 16,000 square feet in the single story Griffin Center office building that resulted in that building becoming fully leased. Also in fiscal 2016, two leases of office/flex space aggregating approximately 26,000 square feet were renewed, while leases aggregating approximately 72,000 square feet of office/flex space expired. The tenant of one of the expired office/flex leases (approximately 21,000 square feet) did not renew because they entered into a full building lease for 131 Phoenix, Griffin’s approximately 31,000 square foot industrial/warehouse building in Phoenix Crossing. The rental rates for office/flex leases that were renewed in fiscal 2016 were, on average, approximately 5% lower than the rental rates of the expiring leases. Currently there are approximately 156 acres of undeveloped land in Griffin Center and approximately 75 acres of undeveloped land in Griffin Center South that are owned by Griffin. As of November 30, 2017, approximately $18.7 million was invested (net book value) in Griffin’s office/flex buildings and approximately $1.6 million was invested by Griffin in the undeveloped land in Griffin Center and Griffin Center South. Griffin’s two multi‑story office buildings in Griffin Center are mortgaged for approximately $4.4 million as of November 30, 2017, and Griffin’s single story office building in Griffin Center and the eight single-story office/flex buildings and industrial/warehouse building in Griffin Center South are the collateral for Griffin’s $15.0 million revolving line of credit. There were no borrowings under the revolving line of credit as of November 30, 2017.
A summary of Griffin’s office/flex square footage owned and leased at the end of each of the past three fiscal years and leases in Griffin’s office/flex buildings scheduled to expire (excluding the space where a replacement lease has been secured) during each of the next three fiscal years are as follows:
|
Connecticut office/flex space |
|
Square |
|
Square |
|
|
|
|
|
|
Footage |
|
Footage |
|
Percentage |
|
|
|
|
Owned |
|
Leased |
|
Leased |
|
|
November 30, 2015 |
|
433,000 |
|
370,000 |
|
85 |
% |
|
November 30, 2016 |
|
433,000 |
|
319,000 |
|
74 |
% |
|
November 30, 2017 |
|
433,000 |
|
308,000 |
|
71 |
% |
|
|
|
2018 |
|
2019 |
|
2020 |
|
|||
|
Square footage of leases expiring |
|
|
15,000 |
|
|
62,000 |
|
|
62,000 |
|
|
Percentage of total leased space at November 30, 2017 |
|
|
— |
% |
|
2 |
% |
|
2 |
% |
|
Number of tenants with leases expiring |
|
|
2 |
|
|
4 |
|
|
5 |
|
|
Annual rental revenue of expiring leases |
|
$ |
316,000 |
|
$ |
1,003,000 |
|
$ |
1,083,000 |
|
|
Annual rental revenue of expiring leases as a percentage of Griffin’s total fiscal 2017 rental revenue |
|
|
1 |
% |
|
3 |
% |
|
4 |
% |
Residential Developments
Simsbury, Connecticut
Several years ago, Griffin filed plans for the creation of a residential community, called Meadowood, on a 363 acre site in the Town of Simsbury, Connecticut (“Simsbury”). After several years of litigation with the town regarding this proposed residential development, a settlement was reached. The settlement terms included, among other things, approval for up to 296 homes, certain remediation measures and offsite road improvements to be performed by Griffin and the purchase by Simsbury of a portion of the Meadowood land for open space. The sale of land to Simsbury closed in fiscal 2008. In fiscal 2012, Griffin performed a portion of the required remediation work on the site and completed the required offsite road improvements. In fiscal 2014, Griffin completed the required remediation work. As of November 30, 2017, the book value of the land for this development, including design, development and legal costs, was approximately $8.5 million. Griffin is continuing to evaluate its plans for Meadowood.
10
Suffield, Connecticut
In fiscal 2006, Griffin completed the infrastructure for a fifty lot residential subdivision in Suffield, Connecticut called Stratton Farms. Griffin sold twenty‑five residential lots in Stratton Farms to a local homebuilder in fiscal 2006 and fiscal 2007. Griffin subsequently sold five additional lots. As of November 30, 2017, Griffin held twenty Stratton Farms residential lots. The book value for Griffin’s Stratton Farms holdings was approximately $1.1 million at November 30, 2017. Subsequent to November 30, 2017, Griffin sold an additional Stratton Farms residential lot.
Other
Concurrently with the sale of the landscape nursery business in fiscal 2014, Imperial Nurseries, Inc. (“Imperial”), Griffin and Monrovia Connecticut LLC (“Monrovia”) entered into a Lease and Option Agreement, which was amended in fiscal 2016 (as amended, the “Imperial Lease”) pursuant to which Monrovia leased Imperial’s production nursery located in Granby and East Granby, Connecticut (the “Connecticut Farm”) for a ten year period, with options to extend for up to an additional fifteen years exercisable by Monrovia. The Imperial Lease also grants Monrovia an option to purchase the land, land improvements and other operating assets that were used by Imperial on the Connecticut Farm during the first thirteen years of the lease period for $9.5 million, or $7.0 million if only a certain portion of the Connecticut Farm is purchased, subject in each case to certain adjustments as provided for in the Imperial Lease.
Prior to the fiscal 2009 third quarter, Imperial operated a production nursery in Quincy, Florida (the “Florida Farm”). In fiscal 2009, Imperial shut down its growing operations on the Florida Farm and leased that facility to a grower of landscape nursery plants. In fiscal 2015, the tenant exercised its option to acquire the Florida Farm, but subsequently informed Imperial that it would not close on the acquisition. As a result, Griffin retained the tenant’s deposit of $400,000 and the Florida Farm lease was extended through April 30, 2016. After the expiration of that lease, Griffin then entered into a new lease of the Florida Farm with another grower of landscape nursery plants that started July 1, 2016. The new lease of the Florida Farm has a three year term and contains an option for the tenant to purchase the Florida Farm at any time during the lease period for a purchase price between $3.4 million and $3.9 million depending upon the date of sale. On December 18, 2017, the tenant leasing the Florida Farm declared bankruptcy under Chapter 11 of the U.S. Bankruptcy Code. Griffin has yet to determine the impact, if any, this will have on their lease of the Florida Farm, which expires on June 30, 2019.
In fiscal 2017, Griffin leased approximately 560 acres of undeveloped land in Connecticut and Massachusetts to local farmers. Approximately 650 acres and 550 acres were leased to local farmers in fiscal 2016 and fiscal 2015, respectively. The revenue generated from the leasing of farmland is not material to Griffin’s total revenue.
On January 25, 2016, Griffin entered into an Option Purchase Agreement (the “Simsbury Option Agreement”) whereby Griffin granted the buyer an exclusive three month option, in exchange for a nominal fee, to purchase approximately 280 acres of undeveloped land in Simsbury, Connecticut for approximately $7.7 million. The buyer may extend the option period for up to three years upon payment of additional option fees. Through November 30, 2017, the buyer paid approximately $0.1 million of additional option fees, and subsequent to November 30, 2017 the buyer paid an additional $0.1 million to extend its option period through January 2019. Subsequent to November 30, 2017, the buyer received approval from the state regulatory authority for the buyer’s planned use of the land, which is to generate solar electricity. A closing on the land sale contemplated by the Simsbury Option Agreement is subject to several significant contingencies, including the potential appeal of the approvals recently granted by the state regulatory authority. Griffin expects the decision of the state regulatory authority to be appealed. There is no guarantee that the sale of land as contemplated under the Simsbury Option Agreement will be completed under its current terms, or at all.
On May 5, 2017, Griffin entered into an Option Purchase Agreement (the “EGW Option Agreement”) whereby Griffin granted the buyer an exclusive three month option, in exchange for a nominal fee, to purchase approximately 288 acres of undeveloped land in East Granby and Windsor, Connecticut for approximately $7.8 million. The buyer may extend the option period for up to three years upon payment of additional option fees. The land subject to the EGW Option Agreement does not have any of the approvals that would be required for the buyer’s planned use of the land, which is to generate solar electricity. A closing on the land sale contemplated by the EGW Option Agreement is subject to several significant contingencies, including the buyer procuring electrical utility supply contracts, approval by the state public utility regulatory authorities and governmental approvals for the planned use of the land. There is no
11
guarantee that the sale of land as contemplated under the EGW Option Agreement will be completed under its current terms, or at all.
Griffin is evaluating its other land holdings for development or sale in the future. Griffin anticipates that obtaining subdivision approvals for residential development in many of the towns where it owns residentially‑zoned land will be an extended process.
Investments
Centaur Media plc
In fiscal 2017, Griffin sold all of its 1,952,462 shares of Centaur Media plc (“Centaur Media”), a publicly traded company listed on the London Stock Exchange, for cash proceeds of approximately $1.2 million and a pretax gain of approximately $0.3 million. Griffin had reflected its investment in Centaur Media as an available‑for‑sale security. Accordingly, prior to the sale of the shares of Centaur Media, changes in the fair value of Griffin’s investment in Centaur Media, including both changes in the stock price and changes in the foreign currency exchange rate, were not included in Griffin’s net income but were included in Griffin’s other comprehensive income. Upon the sale of its investment in Centaur, all amounts that had been reflected in other comprehensive income were reclassified into net income on Griffin’s consolidated statement of operations.
Employees
As of November 30, 2017, Griffin employed 30 people on a full‑time basis and two employees on a part-time basis. Presently, none of Griffin’s employees are represented by a union. Griffin believes that relations with its employees are satisfactory.
Competition
The market for leasing industrial/warehouse space and office/flex space is highly competitive. Griffin competes for tenants with owners of numerous properties located in the portions of Connecticut, Massachusetts, the Lehigh Valley of Pennsylvania and Charlotte, North Carolina in which Griffin’s real estate holdings are located. Some of these competitors have greater financial resources than Griffin. Griffin’s real estate business competes on the bases of location, price, availability of space, convenience and amenities.
There is a great amount of competition for the acquisition of industrial/warehouse buildings and for the acquisition of undeveloped land for construction of such buildings. Griffin competes for the acquisition of industrial/warehouse properties with real estate investment trusts (“REITs”) and institutional investors, such as pension funds, private real estate investment funds, insurance company investment accounts, public and private investment companies, individuals and other entities engaged in real estate investment activities. Some of these competitors have greater financial resources than Griffin, and may be able to accept more risk, including risk related to the creditworthiness of tenants or the degree of leverage they may be willing to take on. Competitors for acquisitions may also have advantages from a lower cost of capital or greater operating efficiencies associated with being a larger entity.
Regulation: Environmental Matters
Under various federal, state and local laws, ordinances and regulations, an owner or operator of real estate may be required to investigate and clean up hazardous or toxic substances or petroleum product releases at such property and may be held liable to a governmental entity or to third parties for property damage and for investigation and cleanup costs incurred by such parties in connection with contamination. The cost of investigation, remediation or removal of such substances may be substantial, and the presence of such substances, or the failure to remediate properly such substances, may adversely affect the owner’s ability to sell or rent such property or to borrow using such property as collateral. In connection with the ownership (direct or indirect), operation, management and development of real estate properties, Griffin may be considered an owner or operator of such properties or as having arranged for the disposal or treatment of hazardous or toxic substances and, therefore, potentially liable for removal or remediation costs, as well as certain other related costs, including governmental fines and injuries to persons and property. The value of Griffin’s land may be affected by the presence of residual chemicals from the prior use of the land for farming, principally on a portion of the land that is intended for residential use. In the event that Griffin is unable to remediate adequately any of its land
12
intended for residential use, Griffin’s ability to develop such property for its intended purposes would be materially affected.
Griffin periodically reviews its properties for the purpose of evaluating such properties’ compliance with applicable state and federal environmental laws. In connection with the sale of Imperial, Griffin has incurred a small amount of costs to remediate a small area of the Connecticut Farm that is leased to Monrovia under the Imperial Lease. As of the date of this Annual Report on Form 10‑K, Griffin is in discussions with the Connecticut Department of Energy and Environmental Protection (“DEEP”) regarding the recent findings of exceedances of certain residual pesticides on a limited portion of the Connecticut Farm being leased to Monrovia. At this time, Griffin does not anticipate experiencing, in the next twelve months, any material expense in complying with such laws. Griffin may incur remediation costs in the future in connection with its development operations. Such costs are not expected to be significant as compared to expected proceeds from development projects or property sales.
Griffin maintains a corporate website at www.griffinindustrial.com. Griffin’s Annual Report on Form 10‑K, quarterly reports on Form 10‑Q, current reports on Form 8‑K and the proxy statement for Griffin’s Annual Meeting of Stockholders can be accessed through Griffin’s website or through the SEC website at www.sec.gov. Griffin will provide electronic or paper copies of its foregoing filings free of charge upon request. Griffin was incorporated in 1970.
ITEM 1A. RISK FACTORS.
Griffin’s real estate business is subject to a number of risks. The risk factors discussed below are those that management deems to be material, but they may not be the only risks facing Griffin. Additional risks not currently known or currently deemed not to be material may also impact Griffin. If any of the following risks occur, Griffin’s business, financial condition, operating results and cash flows could be adversely affected. Investors should also refer to Griffin’s quarterly reports on Form 10-Q for any material updates to these risk factors.
Risks Related to Griffin’s Business and Properties
Griffin’s real estate portfolio is concentrated in the industrial real estate sector, and its business would be adversely affected by an economic downturn in that sector.
88% of Griffin’s buildings are warehouse/distribution facilities and light manufacturing facilities in the industrial real estate sector. This level of concentration exposes Griffin to the risk of economic downturns in the industrial real estate sector to a greater extent than if its properties were more diversified across other sectors of the real estate industry. In particular, an economic downturn affecting the leasing market for industrial properties could have a material adverse effect on Griffin’s results of operations, cash flows, financial condition, ability to satisfy debt obligations and ability to pay dividends to stockholders.
Griffin’s real estate portfolio is geographically concentrated, which causes it to be especially susceptible to adverse developments in those markets.
In addition to general, regional, national and international economic conditions, Griffin’s operating performance is impacted by the economic conditions of the specific geographic markets in which it has concentrations of properties. The portfolio includes holdings in Connecticut, the Lehigh Valley of Pennsylvania and Concord, North Carolina, which represented 61%, 32% and 7% of Griffin’s portfolio by square footage, respectively, as of November 30, 2017. This geographic concentration could adversely affect Griffin’s operating performance if conditions become less favorable in any of the states or regions in which it has a concentration of properties. Griffin cannot assure that any of its markets will grow or that underlying real estate fundamentals will be favorable to owners and operators of properties. Griffin’s operations may also be adversely affected if competing properties are built in its target markets. The construction of new facilities by competitors would increase capacity in the marketplace, and an increase in the amount of vacancies in competitors’ properties and negative absorption of space could result in Griffin experiencing longer times to lease vacant space, eroding lease rates or hindering renewals by existing tenants. Any adverse economic or real estate developments in Griffin’s target markets, or any decrease in demand for industrial space resulting from the regulatory environment, business climate or energy or fiscal problems in these markets, could materially and adversely impact Griffin’s results of operations, cash flows, financial condition, ability to satisfy debt obligations and ability to pay dividends to stockholders.
13
Griffin’s ability to grow its portfolio partially depends on its ability to develop properties, which may suffer under certain circumstances.
Griffin intends to continue to develop properties when warranted by its assessment of market conditions. Griffin’s general construction and development activities include the risks that:
|
§ |
Griffin’s assessment of market conditions may be inaccurate; |
|
§ |
development activities may require the acquisition of undeveloped land. Competition from other real estate investors may significantly increase the purchase price of that land; |
|
§ |
Griffin may be unable to obtain, or may face delays in obtaining required zoning, land-use, building, occupancy, and other governmental permits and authorizations, which could result in increased costs and could require Griffin to abandon its activities entirely with respect to a project; |
|
§ |
construction and leasing of a property may not be completed on schedule, which could result in increased expenses and construction costs, and would result in reduced profitability; |
|
§ |
construction costs (including required offsite infrastructure costs) may exceed Griffin’s original estimates due to increases in interest rates and increased materials, labor or other costs, possibly making the property less profitable than projected or unprofitable because Griffin may not be able to increase rents to compensate for the increase in construction costs; |
|
§ |
Griffin may abandon development opportunities after it begins to explore them and as a result, Griffin may fail to recover costs already incurred. If Griffin alters or discontinues its development efforts, costs of the investment may need to be expensed rather than capitalized and Griffin may determine the investment is impaired, resulting in a loss; |
|
§ |
Griffin may expend funds on and devote management's time to projects that it does not complete; |
|
§ |
occupancy rates and rents at newly completed properties may not meet Griffin’s expectations. This may result in lower than projected occupancy and rental rates resulting in an investment that is less profitable than projected or unprofitable; and |
|
§ |
Griffin may incur losses under construction warranties, guaranties and delay damages under Griffin’s contracts with tenants and other customers. |
Griffin’s ability to achieve growth in its portfolio partially depends in part on Griffin’s ability to acquire properties, which may suffer under certain circumstances.
Griffin acquires individual properties and in the future, may acquire portfolios of properties. Griffin’s acquisition activities and their success are generally subject to the following risks:
|
§ |
when Griffin is able to locate a desirable property, competition from other real estate investors may significantly increase the purchase price; |
|
§ |
acquired properties may fail to perform as expected; |
|
§ |
the actual costs of repositioning or redeveloping acquired properties may be higher than Griffin’s estimates; |
|
§ |
acquired properties may be located in new markets where Griffin faces risks associated with an incomplete knowledge or understanding of the local market, a limited number of established business relationships in the area and a relative unfamiliarity with local governmental and permitting procedures; and |
|
§ |
Griffin may be unable to quickly and efficiently integrate new acquisitions, particularly acquisitions of portfolios of properties and operating entities, into its existing operations, and as a result, Griffin’s results of operations and financial condition could be adversely affected. |
14
Griffin may acquire properties subject to liabilities and without any recourse, or with only limited recourse, with respect to unknown liabilities. As a result, if a liability were asserted against Griffin based upon ownership of those properties, Griffin might have to pay substantial sums to settle it, which could adversely affect its cash flow.
Weakness in Griffin’s office/flex portfolio could negatively impact its business.
Griffin’s office/flex portfolio, which comprises 12% of its total square footage and was 71% occupied as of November 30, 2017, is concentrated in the north submarket of Hartford. The demand for office/flex space in this market is weak and competitive, with market vacancy in excess of 30% as of December 31, 2017, according to the Q4 2017 CBRE|New England Report. There is no certainty that Griffin will retain existing tenants or attract new tenants to its office/flex buildings. Re-leasing Griffin’s office/flex properties typically requires greater investment per square foot than for Griffin’s industrial/warehouse properties and could negatively impact Griffin’s results of operations and cash flow.
Griffin may experience increased operating costs, which could adversely affect Griffin’s results of operations.
Griffin’s properties are subject to increases in operating expenses such as real estate taxes, fuel, utilities, labor, repairs and maintenance, building materials and insurance. While many of Griffin’s current tenants generally are obligated to pay a significant portion of these costs, there are no assurances that existing or new tenants will agree to or make such payments. If operating expenses increase, Griffin may not be able to pass these costs on to its tenants and, therefore, any such increases could have an adverse effect on Griffin’s results of operations and cash flow.
Griffin relies on third party managers for day-to-day property management of certain of its properties.
Griffin relies on local third party managers for the day-to-day management of its Lehigh Valley and Concord, North Carolina properties. To the extent that Griffin uses a third party manager, the cash flows from its Lehigh Valley and Concord properties may be adversely affected if the property manager fails to provide quality services. These third party managers may fail to manage Griffin’s properties effectively or in accordance with their agreements with Griffin, may be negligent in their performance and may engage in criminal or fraudulent activity. If any of these events occur, Griffin could incur losses or face liabilities from the loss or injury to its property or to persons at its properties. In addition, disputes may arise between Griffin and these third party managers, and Griffin may incur significant expenses to resolve those disputes or terminate the relevant agreement with these third parties and locate and engage competent and cost-effective alternative service providers to manage the relevant properties. Additionally, third party managers may manage and own other properties that may compete with Griffin’s properties, which may result in conflicts of interest and decisions regarding the operation of Griffin’s properties that are not in Griffin’s best interests. Griffin likely would rely on third-party managers in any new markets it enters through its acquisition activities.
Unfavorable events affecting Griffin’s existing and potential tenants and its properties, or negative market conditions that may affect Griffin’s existing and potential tenants, could have an adverse impact on Griffin’s ability to attract new tenants, re-let space, collect rent and renew leases, and thus could have a negative effect on Griffin’s results of operations and cash flow.
The substantial majority of Griffin’s revenue is derived from lease revenue from its industrial/warehouse and office/flex buildings. Griffin’s results of operations and cash flows depend on its ability to lease space to tenants on economically favorable terms. Therefore, Griffin could be adversely affected by various factors and events over which Griffin has limited control, such as:
|
· |
inability to retain existing tenants and attract new tenants; |
|
· |
oversupply of or reduced demand for space and changes in market rental rates in the areas where Griffin’s properties are located; |
|
· |
defaults by Griffin’s tenants due to bankruptcy or other factors or their failure to pay rent on a timely basis; |
|
· |
physical damage to Griffin’s properties and the need to repair such damage; |
|
· |
economic or physical decline of the areas where Griffin’s properties are located; and |
15
|
· |
potential risk of functional obsolescence of Griffin’s properties over time. |
If a tenant is unable to pay rent due to Griffin, Griffin may be forced to evict the tenant, or engage in other remedies, which may be expensive and time consuming and may adversely affect Griffin’s results of operation and cash flows.
If Griffin’s tenants do not renew their leases as they expire, Griffin may not be able to re-lease the space. Furthermore, leases that are renewed, or new leases for space that is re-let, may have terms that are less economically favorable to Griffin than current lease terms, or may require Griffin to incur significant costs, such as for renovations, tenant improvements or lease transaction costs.
Any of these events could adversely affect Griffin’s results of operations and cash flows and its ability to make dividend payments and service its indebtedness.
A significant portion of Griffin’s costs, such as real estate taxes, insurance costs, and debt service payments, are fixed, which means that they generally are not reduced when circumstances cause a decrease in cash flow from its properties.
Declining real estate valuations and any related impairment charges could materially adversely affect Griffin’s financial condition, results of operations, cash flows, ability to satisfy debt obligations and ability to pay dividends on, and the per share trading price of, its common stock.
Griffin reviews the carrying value of its properties when circumstances, such as adverse market conditions, indicate a potential impairment may exist. Griffin bases its review on an estimate of the future cash flows (excluding interest charges) expected to result from the property’s use and eventual disposition on an undiscounted basis. Griffin considers factors such as future operating income, trends and prospects, as well as the effects of leasing demand, competition and other factors. With respect to undeveloped land, Griffin evaluates the cash flow to be generated from the potential use or sale of such land as compared to the costs, including entitlement and infrastructure costs for the intended use or costs required to prepare the land for sale. If Griffin’s evaluation indicates that it may be unable to recover the carrying value of a real estate investment, an impairment loss would be recorded to the extent that the carrying value exceeds the estimated fair value of the property.
Impairment losses have a direct impact on Griffin’s results of operations because recording an impairment loss results in an immediate negative adjustment to Griffin’s operating results. The evaluation of anticipated cash flows is highly subjective and is based in part on assumptions regarding future occupancy, rental rates and capital requirements that could differ materially from actual results in future periods. A worsening real estate market may cause Griffin to reevaluate the assumptions used in its impairment analysis. Impairment charges could materially adversely affect Griffin’s financial condition, results of operations, cash flows and ability to pay dividends on, and the per share trading price of, its common stock.
Griffin’s use of nonrecourse mortgage loans could have a material adverse effect on its financial condition.
As of November 30, 2017, Griffin had indebtedness under nonrecourse mortgage loans of approximately $131.0 million, collateralized by approximately 88% of the total square footage of its industrial/warehouse and office/flex buildings. If a significant number of Griffin’s tenants were unable to meet their obligations to Griffin or if Griffin were unable to lease a significant amount of space in its properties on economically favorable lease terms, there would be a risk that Griffin would not have sufficient cash flow from operations for payments of required principal and interest on these loans. If Griffin was unable to make such payments and was to default, the property collateralizing the mortgage loan could be foreclosed upon, and Griffin’s financial condition and results of operations would be adversely affected. In addition, two of Griffin’s nonrecourse mortgage loans contain cross default provisions. A default under a mortgage loan that has cross default provisions may cause Griffin to automatically default on another loan.
Griffin’s use of financing arrangements that include balloon payment obligations could have a material adverse effect on its financial condition.
Approximately 91% of Griffin’s nonrecourse mortgage loans as of November 30, 2017 require a lump-sum or “balloon” payment at maturity. Griffin’s ability to make a balloon payment at maturity may be uncertain and may depend upon its ability to obtain additional financing. At the time the balloon payment is due, Griffin may or may not be
16
able to refinance the balloon payment on terms as favorable as the original mortgage terms. If Griffin were to be unable to refinance the balloon payment, then it may be forced to sell the property or pay the balloon payment using its existing cash on hand or other liquidity sources, or the property could be foreclosed. Any balloon payments that Griffin makes out of its existing cash or liquidity may have a material adverse effect on its financial condition and leave it with insufficient cash to invest in other properties, pay dividends to stockholders or meet its other obligations.
Griffin’s failure to effectively hedge against interest rate fluctuation could have a material adverse effect on its financial condition.
Griffin has entered into several interest rate swap agreements to hedge its interest rate exposures related to its variable rate nonrecourse mortgages on certain of its industrial/warehouse and office/flex buildings. These agreements have costs and involve the risks that these arrangements may not be effective in reducing Griffin’s exposure to interest rate fluctuations and that a court could rule that such agreements are not legally enforceable. The failure to hedge effectively against interest rate fluctuations may materially adversely affect Griffin’s results of operations if interest rates were to rise materially. Additionally, any settlement charges incurred to terminate an interest rate swap agreement may result in increased interest expense, which may also have an adverse effect on Griffin’s results of operations.
Griffin may suffer adverse effects as a result of the terms of and covenants relating to its revolving credit facility.
Griffin’s continued ability to borrow under its $15 million revolving credit facility is subject to compliance with financial and other covenants. Griffin’s failure to comply with such covenants could cause a default under this credit facility, and Griffin may then be required to repay amounts outstanding, if any, under the facility with capital from other sources. Under those circumstances, other sources of capital may not be available to Griffin, or may be available only on unattractive terms.
Griffin relies on key personnel.
Griffin’s success depends to a significant degree upon the contribution of certain key personnel, including but not limited to Griffin’s Executive Chairman, President and Chief Executive Officer, Griffin Industrial, LLC’s Senior Vice President and Griffin Industrial, LLC’s Vice President of Construction. If any of Griffin’s key personnel were to cease employment, Griffin’s operating results could suffer. Griffin’s ability to retain its senior management group or attract suitable replacements should any members of the senior management group leave is dependent on the competitive nature of the employment market. The loss of services from key members of the management group or a limitation on their availability could adversely affect Griffin’s results of operations and cash flows. Griffin has not obtained and does not expect to obtain key man life insurance on any of its key personnel.
Risks Related to the Real Estate Industry
Changing or adverse political and economic conditions and credit markets may impact Griffin’s results of operations and financial condition.
Griffin’s real estate business may be affected by market conditions and political and economic uncertainty experienced by the U.S. economy as a whole, conditions in the credit markets or by local economic conditions in the markets in which its properties are located. Such conditions may impact Griffin’s results of operations, financial condition or ability to expand its operations and pay dividends to stockholders as a result of the following:
|
· |
The financial condition of Griffin’s tenants may be adversely affected, which may result in tenant defaults under leases due to bankruptcy, lack of liquidity, operational failures or for other reasons; |
|
· |
A decrease in investment spending, the curtailment of expansion plans or significant job losses may decrease demand for Griffin’s industrial/warehouse and office/flex space, causing market rental rates and property values to be negatively impacted; |
|
· |
Griffin’s ability to borrow on terms and conditions that it finds acceptable, or at all, may be limited, which could reduce its ability to pursue acquisition and development opportunities, refinance existing debt, and/or increase future interest expense; |
17
|
· |
Reduced values of Griffin’s properties may limit its ability to obtain debt financing collateralized by its properties or may limit the proceeds from such potential financings; |
|
· |
A weak economy may limit sales of land intended for commercial, industrial and residential use; |
|
· |
Changes in supply or demand for similar or competing properties in an area where Griffin’s properties are located may adversely affect Griffin’s competitive position and market rental rates in that area; and |
|
· |
Long periods of time may elapse between the commencement and the completion of Griffin’s projects. |
An increase in interest rates could adversely impact Griffin’s ability to refinance existing debt or to finance new developments and acquisitions.
Rising interest rates could limit Griffin’s ability to refinance existing debt on favorable terms, or at all, when it matures. Interest rates have been in recent years, and currently remain, low by historical standards. However, the Federal Reserve raised its benchmark interest rate multiple times in 2017, and further interest rate increases may occur. If interest rates increase, so will Griffin’s interest costs, which would adversely affect Griffin’s cash flow and ability to pay principal and interest on its debt.
From time to time, Griffin enters into interest rate swap agreements and other interest rate hedging contracts, including swaps, caps and floors. These agreements, which are intended to lessen the impact of rising interest rates on Griffin, expose Griffin to the risks that the other parties to the agreements might not perform, or that Griffin could incur significant costs associated with the settlement of the agreements, or that the agreements might be unenforceable and the underlying transactions would fail to qualify as highly-effective cash flow hedges under relevant accounting guidance.
In addition, an increase in interest rates could decrease the amounts third parties are willing to lend to Griffin for use towards potential acquisitions or development costs, thereby limiting its ability to grow its property portfolio.
Griffin may not be able to compete successfully with other entities that operate in its industry.
Griffin experiences a great amount of competition for the acquisition of industrial/warehouse buildings, for the acquisition of undeveloped land for construction of such buildings and for attracting tenants for its properties. Griffin competes with well-capitalized real estate investors such as pension funds and their advisors, private real estate investment funds, bank and insurance company investment accounts, public and private investment companies, including REITs, individuals and other entities engaged in real estate investment activities. Some of these competitors have greater financial resources than Griffin, and may be able to accept more risk, including risk related to the creditworthiness of tenants or the degree of leverage they may be willing to take on. Competitors for acquisitions may also have advantages from a lower cost of capital or greater operating efficiencies associated with being a larger entity. Some of these competitors may be able to offer prospective tenants more attractive financial or other terms than Griffin is able to offer.
Griffin may experience increased costs of raw materials and energy, which could adversely affect its operations.
Griffin’s construction activities and maintenance of its current portfolio could be adversely affected by increases in raw materials or energy costs. As petroleum and other energy costs increase, products used in the construction of Griffin’s facilities, such as steel, masonry, asphalt, cement and building products may increase. An increase in the cost of building new facilities could negatively impact Griffin’s future operating results through increased depreciation expense. An increase in construction costs would also require increased investment in Griffin’s real estate assets, which may lower the return on investment in new facilities. An increase in energy costs could increase Griffin’s building operating expenses and thereby lower Griffin’s operating results.
Real estate investments are illiquid, and Griffin may not be able to sell its properties when Griffin determines it is appropriate to do so.
Real estate properties are not as liquid as other types of investments and this lack of liquidity could limit Griffin’s ability to react promptly to changes in economic, financial, investment or other conditions. In addition, provisions of the Internal Revenue Code of 1986, as amended, provide for the ability to exchange “like-kind” property to
18
defer income taxes related to a gain on sale. The illiquidity of real estate properties may limit Griffin’s ability to find a replacement property to effectuate such an exchange.
Potential environmental liabilities could result in substantial costs.
Griffin has properties in Connecticut, the Lehigh Valley of Pennsylvania and Concord, North Carolina in addition to extensive land holdings in Connecticut, Massachusetts and Florida. Under federal, state and local environmental laws, ordinances and regulations, Griffin may be required to investigate and clean up the effects of releases of hazardous substances or petroleum products at its properties because of its current or past ownership or operation of the real estate. If previously unidentified environmental problems arise, Griffin may have to make substantial payments, which could adversely affect its cash flow. As an owner or operator of properties, Griffin may have to pay for property damage and for investigation and clean‑up costs incurred in connection with a contamination. The law typically imposes cleanup responsibility and liability regardless of whether the owner or operator knew of or caused the contamination. Changes in environmental regulations may impact the development potential of Griffin’s undeveloped land or could increase operating costs due to the cost of complying with new regulations.
Compliance with the Americans with Disabilities Act and fire, safety and other regulations may require Griffin to make expenditures that adversely impact Griffin’s operating results.
All of Griffin’s properties are required to comply with the Americans with Disabilities Act ("ADA"). The ADA generally requires that places of public accommodation comply with federal requirements related to access and use by people with disabilities. Compliance with the ADA requirements could require removal of access barriers, and non-compliance could result in imposition of fines by the United States government or an award of damages to private litigants, or both. Expenditures related to complying with the provisions of the ADA could adversely affect Griffin’s results of operations and financial condition. In addition, Griffin is required to operate its properties in compliance with fire and safety regulations, building codes and other land use regulations, as they may be adopted by governmental agencies and bodies and become applicable to Griffin’s properties. Griffin may be required to make substantial capital expenditures to comply with those requirements and these expenditures could have a material adverse effect on Griffin’s operating results and financial condition and Griffin’s ability to satisfy debt obligations and issue dividends to stockholders.
Governmental regulations and control could adversely affect Griffin’s real estate development activities.
Griffin’s operations are subject to governmental regulations that affect real estate development, such as local zoning ordinances. Any changes in such regulations may impact the ability of Griffin to develop its properties or increase Griffin’s costs of development. Subdivision and other residential development may also be affected by the potential adoption of initiatives meant to limit or concentrate residential growth. Commercial and industrial development activities of Griffin’s undeveloped land may also be affected by traffic considerations, potential environmental issues, community opposition and other restrictions to development imposed by governmental agencies.
Uninsured losses or a loss in excess of insured limits could adversely affect Griffin’s business, results of operations and financial condition.
Griffin carries comprehensive insurance coverage, including property, fire, terrorism and loss of rental revenue. The insurance coverage contains policy specifications and insured limits. However, there are certain losses that are not generally insured against or that are not fully insured against. If an uninsured loss or a loss in excess of insured limits occurs with respect to one or more of Griffin’s properties, Griffin could experience a significant loss of capital invested and potential revenue from the properties affected.
Volatility in the capital and credit markets could materially adversely impact Griffin.
Volatility and disruption in the capital and credit markets could make it more difficult to borrow money. Market volatility could hinder Griffin’s ability to obtain new debt financing or refinance maturing debt on favorable terms, or at all. Any financing or refinancing issues could materially adversely affect Griffin. Market turmoil and the tightening of credit can lead to an increased lack of consumer confidence and widespread reduction of business activity in general, which also could materially adversely impact Griffin, including its ability to acquire and dispose of assets on favorable terms, or at all.
19
If Griffin fails to maintain appropriate internal controls in the future, it may not be able to report its financial results accurately, which may adversely affect the per share trading price of its common stock and its business.
Griffin’s efforts to comply with Section 404 of the Sarbanes-Oxley Act of 2002, as amended, and the related regulations regarding its required assessment of internal control over financial reporting and its external auditors’ audit of that assessment requires the commitment of significant financial and managerial resources. Griffin’s system of internal controls may not prevent all errors, misstatements or misrepresentations, and there can be no guarantee that its internal control over financial reporting will be effective in accomplishing all control objectives all of the time. Deficiencies, including any material weakness or significant deficiency, in Griffin’s internal control over financial reporting that may occur in the future could result in misstatements of its results of operations, restatements of its financial statements and a decline in its stock price, or otherwise materially adversely affect Griffin’s business, reputation, results of operations, financial condition or liquidity.
Information technology (“IT”) security breaches and other incidents could disrupt Griffin’s operations, compromise confidential information maintained by Griffin, and damage Griffin’s reputation, all of which could negatively impact Griffin’s business, results of operations and the per share trading price of its common stock.
As part of Griffin’s normal business activities, it uses information technology and other computer resources to carry out important operational activities and to maintain its business records. Griffin’s computer systems, including its backup systems, are subject to interruption or damage from power outages, computer and telecommunications failures, computer viruses, security breaches (including through cyber-attack and data theft), usage errors and catastrophic events, such as fires, floods, tornadoes and hurricanes. If Griffin’s computer systems and its backup systems are compromised, degraded, damaged or breached, or otherwise cease to function properly, Griffin could suffer interruptions in its operations or unintentionally allow misappropriation of proprietary or confidential information, which could damage its reputation and require Griffin to incur significant costs to remediate or otherwise resolve these issues. There can be no assurance that the security efforts and measures Griffin has implemented will be effective or that attempted security breaches or disruptions would not be successful or damaging.
Griffin is subject to litigation that may adversely impact operating results.
From time to time, Griffin may be a party to legal proceedings and claims arising in the ordinary course of business which could become significant. Given the inherent uncertainty of litigation, Griffin can offer no assurance that a future adverse development related to existing litigation or any future litigation will not have a material adverse impact on its business, consolidated financial position, results of operations or cash flows.
Griffin is exposed to the potential impacts of future climate change and climate-change related risks.
Griffin is exposed to potential physical risks from possible future changes in climate. Griffin’s properties may be exposed to rare catastrophic weather events, such as severe storms and/or floods. If the frequency of extreme weather events increases due to climate change, Griffin’s exposure to these events could increase.
As a real estate owner and developer, Griffin may be adversely impacted in the future by stricter energy efficiency standards for buildings. Griffin may be required to make improvements to its existing properties to meet such standards and the costs to meet these standards may increase Griffin’s costs for new construction.
Griffin’s properties may contain or develop harmful mold or suffer from other air quality issues, which could lead to liability for adverse health effects and costs of remediation.
When excessive moisture accumulates in buildings or on building materials, mold growth may occur, particularly if the moisture problem remains undiscovered or is not addressed. Some molds may produce airborne toxins or irritants. Indoor air quality issues can also stem from inadequate ventilation, chemical contamination from indoor or outdoor sources, and other biological contaminants such as pollen, viruses and bacteria. Indoor exposure to airborne toxins or irritants above certain levels can be alleged to cause a variety of adverse health effects and symptoms, including allergic or other reactions. As a result, the presence of significant mold or other airborne contaminants at any of Griffin’s properties could require Griffin to undertake a costly remediation program to contain or remove the mold or other airborne contaminants from the affected property or increase indoor ventilation. In addition, the presence of significant
20
mold or other airborne contaminants could expose Griffin to liability from its tenants, employees of its tenants or others if property damage or personal injury is alleged to have occurred.
Risks Related to Griffin’s Organization and Structure
The concentrated ownership of Griffin common stock by members of the Cullman and Ernst families may limit other Griffin stockholders’ ability to influence Griffin’s corporate and management policies.
Members of the Cullman and Ernst families (the “Cullman and Ernst Group”), which include Frederick M. Danziger, Griffin’s Executive Chairman, Michael S. Gamzon, a director and Griffin’s President and Chief Executive Officer and Edgar M. Cullman, Jr., a director of Griffin, members of their families and trusts for their benefit, partnerships in which they own substantial interests and charitable foundations on whose boards of directors they sit, owned, directly or indirectly, approximately 45.6% of the outstanding common stock of Griffin as of November 30, 2017. There is an informal understanding that the persons and entities included in the Cullman and Ernst Group will vote together the shares owned by each of them. As a result, the Cullman and Ernst Group may effectively control the determination of Griffin’s corporate and management policies and may limit other Griffin stockholders’ ability to influence Griffin’s corporate and management policies.
Griffin’s board of directors may change its investment and financing policies without stockholder approval and Griffin may become more highly leveraged, which may increase Griffin’s risk of default under its debt obligations.
Griffin’s investment and financing policies are exclusively determined by its board of directors. Accordingly, Griffin’s stockholders do not control these policies. Further, Griffin’s charter and bylaws do not limit the amount or percentage of indebtedness, funded or otherwise, that Griffin may incur. Griffin’s board of directors may alter or eliminate its current policy on borrowing at any time without stockholder approval. If this policy changed, Griffin could become more highly leveraged which could result in an increase in its debt service. Higher leverage also increases the risk of default on Griffin’s obligations. In addition, a change in Griffin’s investment policies, including the manner in which Griffin allocates its resources across the portfolio or the types of assets in which Griffin seeks to invest, may increase its exposure to interest rate risk, real estate market fluctuations and liquidity risk. Changes to Griffin’s policies with regard to the foregoing could adversely affect Griffin’s financial condition, results of operations, cash flows and its ability to pay dividends on, and the per share trading price of, its common stock.
Changes to the U.S. federal income tax laws, including the recent comprehensive tax reform legislation, could have an adverse impact on Griffin’s business and financial results.
The United States recently enacted the Tax Cuts and Jobs Act (“TCJA”) that includes significant changes to the U.S. federal income taxation of business entities. These changes include, among others, a permanent reduction to the corporate income tax rate, an expansion of the bonus depreciation provisions relating to the deductibility of certain eligible capital expenses, a limitation on the utilization of net operating losses to offset taxable income, and a partial limitation on the deductibility of business interest expense. Griffin is currently evaluating the potential impact of the TCJA on its operations. The impact of the TCJA could be material to Griffin’s results of operations in future periods.
Risks Related to Griffin’s Common Stock
Issuances of Griffin’s common stock or the perception that such issuances might occur could adversely affect the per share trading price of Griffin’s common stock.
The issuance of Griffin common stock in connection with future property, portfolio or business acquisitions, to repay indebtedness or for general corporate purposes could have an adverse effect on the per share trading price of Griffin’s common stock and would be dilutive to existing stockholders. Griffin’s Board of Directors can authorize the issuance of additional securities without stockholder approval. Griffin’s ability to develop and acquire proprieties in part depends on Griffin’s access to capital which may in the future include the issuance of common equity.
The market price and trading volume of Griffin’s common stock may be volatile.
The trading volume in Griffin’s common stock may fluctuate and cause significant price variations to occur. If the per share trading price of Griffin’s common stock declines significantly, stockholders may be unable to resell their
21
shares at or above the price paid for them. Griffin cannot assure stockholders that the per share trading price of its common stock will not fluctuate or decline significantly in the future.
Some of the factors that could negatively affect Griffin’s share price or result in fluctuations in the price or trading volume of its common stock include:
|
|
• |
actual or anticipated variations in Griffin’s quarterly operating results or dividends; |
|
|
• |
changes in Griffin’s results of operations or cash flows; |
|
|
• |
publication of research reports about Griffin or the real estate industry; |
|
|
• |
changes in market valuations of similar companies; |
|
|
• |
adverse market reaction to any additional debt Griffin incurs in the future; |
|
|
• |
additions or departures of key management personnel; |
|
|
• |
actions by institutional stockholders; |
|
|
• |
speculation in the press or investment community; |
|
|
• |
the realization of any of the other risk factors presented in this annual report; |
|
|
• |
the extent of investor interest in Griffin’s securities; |
|
|
• |
Griffin’s underlying asset value; |
|
|
• |
investor confidence in the stock and bond markets, generally; |
|
|
• |
changes in tax laws; |
|
|
• |
future equity issuances; and |
|
|
• |
general market and economic conditions. |
In the past, securities class action litigation has often been instituted against companies following periods of volatility in the price of their common stock. This type of litigation could result in substantial costs and divert Griffin’s management’s attention and resources, which could have an adverse effect on Griffin’s financial condition, results of operations, cash flows and Griffin’s ability to pay dividends on, and the per share trading price of, its common stock.
ITEM 1B. UNRESOLVED STAFF COMMENTS.
22
ITEM 2. PROPERTIES.
Land Holdings
Griffin is a major landholder in the state of Connecticut, owning approximately 2,791 acres. Griffin also owns approximately 346 acres of land in Massachusetts, approximately 131 acres of land in Pennsylvania, approximately 18 acres in North Carolina and approximately 1,066 acres in northern Florida. Griffin believes the fair market value of its land in Connecticut and Massachusetts is substantially in excess of its book value.
Listings of the locations of Griffin’s land holdings, a portion of which, principally in Bloomfield, East Granby and Windsor, Connecticut, Breinigsville, Lower Nazareth Township and Hanover Township, Pennsylvania and Concord, North Carolina have been developed, are as follows:
|
Location |
|
Land Area |
|
|
|
|
(in acres) |
|
|
Connecticut |
|
|
|
|
Bloomfield |
|
185 |
|
|
East Granby |
|
540 |
(a) (b) |
|
East Windsor |
|
116 |
|
|
Granby |
|
333 |
(b) |
|
Simsbury |
|
774 |
(a) |
|
Suffield |
|
34 |
|
|
Windsor |
|
809 |
(a) |
|
Florida |
|
|
|
|
Quincy |
|
1,066 |
(c) |
|
Massachusetts |
|
|
|
|
Southwick |
|
346 |
|
|
North Carolina |
|
|
|
|
Concord |
|
18 |
|
|
Pennsylvania |
|
|
|
|
Lower Nazareth Township |
|
51 |
|
|
Hanover Township |
|
49 |
|
|
Breinigsville |
|
17 |
|
|
Lehigh Valley Township |
|
14 |
|
|
(a) |
Includes approximately 280 acres of land in Simsbury under the Simsbury Option Agreement and approximately 288 acres in East Granby and Windsor under the EGW Option Agreement. |
|
(b) |
Includes approximately 424 acres of land in East Granby and 305 acres of land in Granby being leased to Monrovia under the Imperial Lease. |
|
(c) |
The acreage in Florida was used in Imperial’s landscape nursery business prior to fiscal 2009. Imperial shut down that facility in fiscal 2009 and now leases that facility to another grower of containerized nursery plants. |
23
Developed Properties
As of November 30, 2017, Griffin owned thirty‑five buildings, comprised of twenty-three industrial/warehouse buildings, eleven office/flex buildings and a small restaurant building. A listing of those facilities is as follows:
|
Connecticut Industrial/Warehouse Properties |
|
|
|
|
100 International Drive, Windsor, CT* |
|
304,200 sq. ft. |
|
|
1985 Blue Hills Avenue, Windsor, CT* |
|
165,000 sq. ft. |
|
|
755 Rainbow Road, Windsor, CT* |
|
148,500 sq. ft. |
|
|
758 Rainbow Road, Windsor, CT* |
|
138,400 sq. ft. |
|
|
754 Rainbow Road, Windsor, CT* |
|
136,900 sq. ft. |
|
|
330 Stone Road, Windsor, CT** |
|
136,600 sq. ft. |
|
|
759 Rainbow Road, Windsor, CT* |
|
126,900 sq. ft. |
|
|
75 International Drive, Windsor, CT* |
|
117,000 sq. ft. |
|
|
20 International Drive, Windsor, CT* |
|
99,800 sq. ft. |
|
|
40 International Drive, Windsor, CT* |
|
99,800 sq. ft. |
|
|
35 International Drive, Windsor, CT* |
|
97,600 sq. ft. |
|
|
16 International Drive, East Granby, CT* |
|
58,400 sq. ft. |
|
|
25 International Drive, Windsor, CT* |
|
57,200 sq. ft. |
|
|
15 International Drive, East Granby, CT* |
|
41,600 sq. ft. |
|
|
14 International Drive, East Granby, CT* |
|
40,100 sq. ft. |
|
|
131 Phoenix Crossing, Bloomfield, CT |
|
31,200 sq. ft. |
|
|
210 West Newberry Road, Bloomfield, CT* |
|
18,400 sq. ft. |
|
|
Pennsylvania Industrial/Warehouse Properties |
|
|
|
|
4270 Fritch Drive, Lower Nazareth, PA* |
|
302,600 sq. ft. |
|
|
5220 Jaindl Blvd., Hanover Township, PA* |
|
280,000 sq. ft. |
|
|
5210 Jaindl Blvd., Hanover Township, PA* |
|
252,000 sq. ft. |
|
|
4275 Fritch Drive, Lower Nazareth, PA* |
|
228,000 sq. ft. |
|
|
871 Nestle Way, Breinigsville, PA* |
|
119,900 sq. ft. |
|
|
North Carolina Industrial/Warehouse Property |
|
|
|
215 International Drive, Concord, NC* |
|
277,300 sq. ft. |
|
Connecticut Office/Flex Properties |
|
|
|
|
5 Waterside Crossing, Windsor, CT* |
|
80,500 sq. ft. |
|
|
7 Waterside Crossing, Windsor, CT* |
|
80,500 sq. ft. |
|
|
29 - 35 Griffin Road South, Bloomfield, CT* |
|
57,500 sq. ft. |
|
|
21 Griffin Road North, Windsor, CT* |
|
48,300 sq. ft. |
|
|
55 Griffin Road South, Bloomfield, CT* |
|
40,300 sq. ft. |
|
|
340 West Newberry Road, Bloomfield, CT* |
|
39,000 sq. ft. |
|
|
206 West Newberry Road, Bloomfield, CT* |
|
22,800 sq. ft. |
|
|
204 West Newberry Road, Bloomfield, CT* |
|
22,300 sq. ft. |
|
|
330 West Newberry Road, Bloomfield, CT* |
|
11,900 sq. ft. |
|
|
310 West Newberry Road, Bloomfield, CT* |
|
11,400 sq. ft. |
|
|
320 West Newberry Road, Bloomfield, CT* |
|
11,100 sq. ft. |
|
|
1936 Blue Hills Avenue, Windsor, CT |
|
7,200 sq. ft. |
|
* Included as collateral under one of Griffin’s nonrecourse mortgage loans or Griffin’s revolving line of credit as of November 30, 2017.
** Subsequent to November 30, 2017, Griffin added this building as collateral to one of its nonrecourse mortgage loans and received additional mortgage proceeds of $7.0 million.
24
Griffin subleases approximately 1,920 square feet in New York City for its executive offices from Bloomingdale Properties, Inc. (“Bloomingdale Properties”), an entity that is controlled by certain members of the Cullman and Ernst Group. The sublease with Bloomingdale Properties was approved by Griffin’s Audit Committee and the lease rates under the sublease were at market rate at the time the sublease was signed.
As with many companies engaged in real estate investment and development, Griffin holds its real estate portfolio subject to mortgage debt. See Note 5 to Griffin’s consolidated financial statements for information concerning the mortgage debt associated with Griffin’s properties.
From time to time, Griffin is involved, as a defendant, in various litigation matters arising in the ordinary course of business. In the opinion of management, based on the advice of legal counsel, the ultimate liability, if any, with respect to these matters is not expected to be material to Griffin’s financial position, results of operations or cash flows.
ITEM 4. MINE SAFETY DISCLOSURES.
25
ITEM 5. MARKET FOR THE REGISTRANT’S COMMON EQUITY, RELATED STOCKHOLDER MATTERS AND ISSUER PURCHASES OF EQUITY SECURITIES.
The following are the high and low prices of Griffin’s common stock as traded on The Nasdaq Stock Market LLC:
|
|
|
1st Quarter |
|
2nd Quarter |
|
3rd Quarter |
|
4th Quarter |
|
||||||||||||||||
|
|
|
High |
|
Low |
|
High |
|
Low |
|
High |
|
Low |
|
High |
|
Low |
|
||||||||
|
2017 |
|
$ |
32.20 |
|
$ |
30.13 |
|
$ |
32.13 |
|
$ |
29.61 |
|
$ |
34.40 |
|
$ |
30.98 |
|
$ |
37.16 |
|
$ |
34.50 |
|
|
2016 |
|
$ |
26.99 |
|
$ |
22.50 |
|
$ |
32.50 |
|
$ |
22.00 |
|
$ |
32.60 |
|
$ |
25.75 |
|
$ |
32.00 |
|
$ |
28.94 |
|
On January 31, 2018, the number of record holders of common stock of Griffin was approximately 162 which does not include beneficial owners whose shares are held of record in the names of brokers or nominees. The closing market price as quoted on The Nasdaq Stock Market LLC on such date was $37.10 per share.
Dividend Policy
Griffin’s dividend policy is to consider the payment of an annual dividend at the end of its fiscal year, which enables the Board of Directors to evaluate both Griffin’s prior full year results and its cash needs for the succeeding year when determining whether to declare an annual dividend and the amount thereof, if any. In fiscal 2017 and fiscal 2016, Griffin declared an annual dividend of $0.40 and $0.30 per share, respectively.
Issuer Purchases of Equity Securities
On March 31, 2016, Griffin’s Board of Directors authorized a stock repurchase program whereby Griffin could have repurchased up to $5.0 million in outstanding shares of its common stock in privately negotiated transactions. The stock repurchase program expired on May 10, 2017, and therefore no repurchases were made during the fiscal 2017 fourth quarter. Griffin repurchased a total of 152,173 shares for approximately $4.8 million under the stock repurchase program.
26
Stock Performance Graph
The following graph compares the total percentage changes in the cumulative total stockholder return (assuming the reinvestment of dividends) on Griffin’s common stock with the cumulative total return of the Russell 2000 Index and the Russell Microcap Index from December 1, 2012 to November 30, 2017. It is assumed in the graph that the value of each investment was $100 at December 1, 2012. Griffin has selected an index of companies with a similar market capitalization because, for the period from December 1, 2012 to January 8, 2014, when Griffin sold its landscape nursery business, Griffin is not aware of any other company that substantially participated in both the landscape nursery and real estate businesses, and would therefore be suitable for comparison to Griffin as a “peer issuer” within Griffin’s lines of business. In addition, following the sale of the landscape nursery business, Griffin has not been able to identify issuers in the real estate business that are comparable peers, as most of those companies are significantly larger in size or have real estate holdings that either differ geographically or by type of property from Griffin’s holdings. Accordingly, Griffin selected an index of companies with a similar market capitalization.
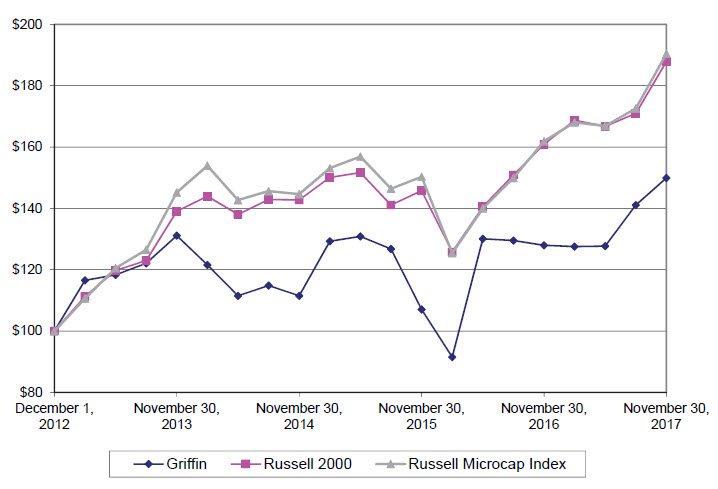
27
ITEM 6. SELECTED FINANCIAL DATA.
The following table sets forth selected statement of operations data for fiscal years 2013 through 2017 and balance sheet data as of the end of each fiscal year. The selected statement of operations data for fiscal 2015, fiscal 2016 and fiscal 2017 and the selected balance sheet data for fiscal 2016 and fiscal 2017 are derived from the audited consolidated financial statements included in Item 8 of this Annual Report. The selected statement of operations data for fiscal 2013 and fiscal 2014 and the balance sheet data for fiscal 2013, fiscal 2014 and fiscal 2015 were derived from the audited consolidated financial statements for those years. This selected financial data should be read in conjunction with the consolidated financial statements and accompanying notes, “Management’s Discussion and Analysis of Financial Condition and Results of Operations” and other financial information included elsewhere in this Annual Report. Historical results are not necessarily indicative of future performance.
|
|
|
2017 |
|
2016 |
|
2015 |
|
2014 |
|
2013 |
|
|||||
|
|
|
(dollars in thousands, except per share data) |
|
|||||||||||||
|
Statement of Operations Data: |
|
|
|
|
|
|
|
|
|
|
|
|
|
|
|
|
|
Total revenue |
|
$ |
43,884 |
|
$ |
30,851 |
|
$ |
28,088 |
|
$ |
24,219 |
|
$ |
25,526 |
|
|
Depreciation and amortization expense |
|
|
10,064 |
|
|
8,797 |
|
|
7,668 |
|
|
6,729 |
|
|
6,673 |
|
|
Operating income |
|
|
12,622 |
|
|
5,627 |
|
|
4,314 |
|
|
1,809 |
|
|
2,436 |
|
|
Income (loss) from continuing operations |
|
|
4,627 |
|
|
576 |
|
|
425 |
|
|
(1,248) |
|
|
1,910 |
|
|
Income (loss) from discontinued operations (1) |
|
|
— |
|
|
— |
|
|
— |
|
|
144 |
|
|
(7,731) |
|
|
Net income (loss) |
|
|
4,627 |
|
|
576 |
|
|
425 |
|
|
(1,104) |
|
|
(5,821) |
|
|
Basic income (loss) per share from continuing operations |
|
|
0.92 |
|
|
0.11 |
|
|
0.08 |
|
|
(0.24) |
|
|
0.37 |
|
|
Basic income (loss) per share from discontinued operations (1) |
|
|
— |
|
|
— |
|
|
— |
|
|
0.03 |
|
|
(1.50) |
|
|
Basic net income (loss) per share |
|
|
0.92 |
|
|
0.11 |
|
|
0.08 |
|
|
(0.21) |
|
|
(1.13) |
|
|
Diluted income (loss) per share from continuing operations |
|
|
0.92 |
|
|
0.11 |
|
|
0.08 |
|
|
(0.24) |
|
|
0.37 |
|
|
Diluted income (loss) per share from discontinued operations (1) |
|
|
— |
|
|
— |
|
|
— |
|
|
0.03 |
|
|
(1.50) |
|
|
Diluted net income (loss) per share |
|
|
0.92 |
|
|
0.11 |
|
|
0.08 |
|
|
(0.21) |
|
|
(1.13) |
|
|
Balance Sheet Data: |
|
|
|
|
|
|
|
|
|
|
|
|
|
|
|
|
|
Total assets |
|
|
249,037 |
|
|
223,623 |
|
|
208,050 |
|
|
185,690 |
|
|
183,958 |
|
|
Mortgage loans, net of debt issuance costs |
|
|
129,203 |
|
|
109,697 |
|
|
89,185 |
|
|
69,481 |
|
|
65,939 |
|
|
Stockholders’ equity |
|
|
93,053 |
|
|
90,803 |
|
|
94,809 |
|
|
95,879 |
|
|
98,115 |
|
|
Cash dividends declared per common share |
|
|
0.40 |
|
|
0.30 |
|
|
0.30 |
|
|
0.20 |
|
|
0.20 |
|
|
(1) |
Fiscal years 2013 and 2014 include the results from the growing operations of the landscape nursery business, which was sold on January 8, 2014. |
28
ITEM 7. MANAGEMENT’S DISCUSSION AND ANALYSIS OF FINANCIAL CONDITION AND RESULTS OF OPERATIONS.
Overview
Griffin Industrial Realty, Inc. (“Griffin”) is a real estate business principally engaged in developing, managing and leasing industrial/warehouse properties, and to a lesser extent, office/flex properties. Griffin seeks to add to its property portfolio through the acquisition and development of land or the purchase of buildings in select markets targeted by Griffin. Periodically, Griffin may sell certain portions of its undeveloped land that it has owned for an extended time period and the use of which is not consistent with Griffin’s core development and leasing strategy. Prior to May 13, 2015, Griffin was known as Griffin Land & Nurseries, Inc. On May 13, 2015, Griffin changed its name to better reflect its ongoing real estate business and focus on industrial/warehouse properties after the sale in fiscal 2014 of the landscape nursery business that Griffin had operated through its wholly owned subsidiary, Imperial Nurseries, Inc. (“Imperial”).
The notes to Griffin’s consolidated financial statements included in Item 8 of this Annual Report contain a summary of the significant accounting policies and methods used in the preparation of Griffin’s consolidated financial statements. In the opinion of management, because of the relative magnitude of Griffin’s real estate assets, accounting methods and estimates related to those assets are critical to the preparation of Griffin’s consolidated financial statements. Griffin uses accounting policies and methods under accounting principles generally accepted in the United States of America (“U.S. GAAP”). The following are the critical accounting estimates and methods used by Griffin:
Revenue and gain recognition: Revenue includes rental revenue from Griffin’s industrial and commercial properties and proceeds from property sales. Rental revenue is accounted for on a straight‑line basis over the applicable lease term in accordance with the Financial Accounting Standards Board (“FASB”) ASC 840, “Leases.” Gains on property sales are recognized in accordance with FASB ASC 360‑20 “Property, Plant and Equipment‑Real Estate Sales” based on the specific terms of each sale. When the percentage of completion method is used to account for a sale of real estate, costs included in determining the percentage of completion include the costs of the land sold, allocated master planning costs, selling and transaction costs and estimated future costs related to the land sold.
Impairment of long‑lived assets: Griffin reviews annually, as well as when conditions may indicate, its long‑lived assets to determine if there are any indications of impairment, such as a prolonged vacancy in one of Griffin’s rental properties. If indications of impairment are present, Griffin evaluates the carrying value of the assets in relation to undiscounted cash flows or the estimated fair value of the underlying assets. Development costs that have been capitalized are reviewed periodically for future recoverability.
Stock based compensation: Griffin determines stock based compensation based on the estimated fair values of stock options as determined on their grant dates using the Black‑Scholes option‑pricing model. In determining the estimated fair values of stock options issued, Griffin makes assumptions on expected volatility, risk free interest rates, expected option terms and dividend yields.
Derivative instruments: Griffin evaluates each interest rate swap agreement to determine if it qualifies as an effective cash flow hedge. Changes in the fair value of each interest rate swap agreement that management determines to be an effective cash flow hedge are recorded as a component of other comprehensive income. The fair value of each interest rate swap agreement is determined based on observable market participant data, such as yield curves, as of the fair value measurement date.
Income taxes: In accounting for income taxes under FASB ASC 740, “Income Taxes,” management estimates future taxable income from operations, the sale of appreciated assets, the remaining years before the expiration of loss credit carryforwards, future reversals of existing temporary differences and tax planning strategies in determining if it is more likely than not that Griffin will realize the benefits of its deferred tax assets. Deferred tax assets and deferred tax liabilities are measured using the enacted tax rates expected to apply to taxable income in the years in which those temporary differences are expected to be recovered or settled. The effect on deferred tax assets and deferred tax liabilities of a change in tax rates on income is recognized in the period that the tax rate change is enacted.
29
Summary
In the fiscal year ended November 30, 2017 (“fiscal 2017”), Griffin had net income of approximately $4.6 million as compared to net income of approximately $0.6 million in the fiscal year ended November 30, 2016 (“fiscal 2016”). The increase in net income in fiscal 2017, as compared to fiscal 2016, principally reflected an increase of approximately $7.0 million in operating income in fiscal 2017 as compared to fiscal 2016, partially offset by increases of approximately $1.1 million in interest expense and approximately $1.9 million in income tax expense in fiscal 2017 as compared to fiscal 2016.
The approximately $7.0 million increase in operating income in fiscal 2017, as compared to fiscal 2016, principally reflected increases of approximately $6.6 million in gain from property sales (revenue from property sales less costs related to property sales) and approximately $2.8 million in profit from leasing activities (which Griffin defines as rental revenue less operating expenses of rental properties), partially offset by increases in depreciation and amortization expense and general and administrative expenses of approximately $1.3 million and approximately $1.2 million, respectively. The higher gain from property sales in fiscal 2017, as compared to fiscal 2016, was driven by gains of approximately $8.0 million from the sale of approximately 67 acres of undeveloped land in Phoenix Crossing, the approximately 268 acre business park master planned by Griffin that straddles the town line between Windsor and Bloomfield, Connecticut (the “2017 Phoenix Crossing Land Sale”) and approximately $1.9 million from the sale of approximately 76 acres of undeveloped land in Southwick, Massachusetts (the “Southwick Land Sale”). As of November 30, 2017, Griffin owns approximately 76 acres of undeveloped land in Phoenix Crossing that is zoned for industrial and commercial development. The gain from property sales in fiscal 2016 principally reflected a gain of approximately $3.2 million from the sale of approximately 29 acres of undeveloped land in Griffin Center (the “Griffin Center Land Sale”). The increase in profit from leasing activities in fiscal 2017, as compared to fiscal 2016, was driven by an increase in rental revenue as a result of more space leased in fiscal 2017 than fiscal 2016, including the impact of the fiscal 2017 acquisition of 215 International Drive (“215 International”), an approximately 277,000 square foot industrial/warehouse building in the Charlotte, North Carolina area. The increase in depreciation and amortization expense in fiscal 2017, as compared to fiscal 2016, principally reflected depreciation and amortization expense on 215 International and a full year of depreciation expense, as compared to a partial year in fiscal 2016, on 5210 Jaindl Boulevard (“5210 Jaindl”), an approximately 252,000 square foot industrial/warehouse building in the Lehigh Valley of Pennsylvania that was completed and placed in service in the 2016 third quarter. The increase in general and administrative expenses in fiscal 2017, as compared to fiscal 2016, principally reflected an increase in compensation expense (mostly due to incentive compensation), the write-off of costs incurred for a potential purchase of undeveloped land that was not completed and higher expenses related to Griffin’s non-qualified deferred compensation plan.
The higher interest expense in fiscal 2017, as compared to fiscal 2016, principally reflected an increase in the amount outstanding under Griffin’s mortgage loans in fiscal 2017 as compared to fiscal 2016 and less capitalized interest in fiscal 2017 than fiscal 2016. The higher income tax expense in fiscal 2017, as compared to fiscal 2016, principally reflected the higher pretax income in fiscal 2017, as compared to fiscal 2016.
Results of Operations
Fiscal 2017 Compared to Fiscal 2016
Total revenue increased to approximately $43.9 million in fiscal 2017 from approximately $30.9 million in fiscal 2016, reflecting increases of approximately $9.6 million in revenue from property sales and approximately $3.4 million in rental revenue. Rental revenue increased to approximately $29.9 million in fiscal 2017 from approximately $26.5 million in fiscal 2016. The approximately $3.4 million increase in rental revenue in fiscal 2017 over fiscal 2016 was principally due to: (a) an increase of approximately $1.9 million from leasing previously vacant space; (b) an increase of approximately $1.8 million from 5210 Jaindl, which was placed in service and fully leased in fiscal 2016 with tenants taking occupancy and generating rental revenue starting in fiscal 2017; and (c) approximately $0.7 million of rental revenue from 215 International, the industrial/warehouse building acquired on June 9, 2017; partially offset by (d) a decrease of approximately $1.0 million from leases that expired.
30
A summary of the total square footage and leased square footage of the buildings in Griffin’s real estate portfolio is as follows:
|
|
|
Total |
|
Square |
|
|
|
|
|
|
Square |
|
Footage |
|
Percentage |
|
|
|
|
Footage |
|
Leased |
|
Leased |
|
|
As of November 30, 2017 |
|
3,710,000 |
|
3,515,000 |
|
95% |
|
|
As of November 30, 2016 |
|
3,297,000 |
|
3,066,000 |
|
93% |
|
The approximately 413,000 square foot increase in total square footage as of November 30, 2017, as compared to November 30, 2016, was due to: (a) the acquisition of 215 International, the approximately 277,000 square foot industrial/warehouse building in Concord, North Carolina, Griffin’s first property in the greater Charlotte area; and (b) the completion of construction and placing into service of 330 Stone Road (“330 Stone”), an approximately 137,000 square foot industrial/warehouse building in New England Tradeport (“NE Tradeport”), Griffin’s industrial park located in Windsor and East Granby, Connecticut. 330 Stone, built on speculation and completed just prior to the end of fiscal 2017, was approximately 54% leased as of November 30, 2017.
The approximately 449,000 square foot net increase in space leased as of November 30, 2017, as compared to November 30, 2016, was principally due to: (a) approximately 277,000 square feet at 215 International, which was 74% leased when acquired and subsequently became fully leased; (b) approximately 74,000 square feet being leased in 330 Stone; and (c) two new leases of industrial/warehouse space aggregating approximately 104,000 square feet in NE Tradeport; partially offset by (d) the expiration of an approximately 12,000 square foot lease of office/flex space in Griffin Center South in Bloomfield, Connecticut.
All of Griffin’s Connecticut industrial/warehouse and office/flex buildings are located in the north submarket of Hartford. The real estate market for industrial/warehouse space in the Hartford, Connecticut area has improved over the last three years. The Q4 2017 CBRE|New England Marketview Report (“Q4 2017 CBRE|New England Report”) from CBRE Group, Inc. (“CBRE”), a national real estate services company, stated that the overall vacancy rate in the greater Hartford industrial market decreased to 8.8% at the end of 2017 from 12.3% at the end of 2014, and net absorption in the greater Hartford industrial market in 2017 was approximately 0.8 million square feet. The Hartford office/flex market remained weak in 2017. According to the Q4 2017 CBRE|New England Report, the overall vacancy rate of office/flex space increased to 17.9% at the end of 2017 from 16.0% at the end of the two previous years, with vacancy in the north submarket of Hartford at approximately 30.9% at the end of 2017. Griffin’s office/flex space was approximately 12% of Griffin’s total square footage as of November 30, 2017. Griffin expects that its office/flex buildings will continue to become a smaller percentage of its total real estate portfolio as Griffin intends to focus on the growth of its industrial/warehouse building portfolio either through the acquisition of fully or partially leased buildings, development of buildings on land currently owned or to be acquired or both.
The real estate market for industrial/warehouse space in the Lehigh Valley has experienced strong growth and leasing activity during the past two years. The vacancy rate of Lehigh Valley industrial/warehouse properties as reported in the Q4 2017 CBRE Market Snapshot Report on Lehigh Valley PA Industrial (the “Q4 2017 CBRE Lehigh Valley Report”) was 6.9% at the end of 2017, with a net absorption of approximately 2.2 million square feet in 2017. The Charlotte, North Carolina industrial real estate market is strong. CBRE’s Q4 2017 Marketview Charlotte Industrial Report stated a vacancy rate of 4.46% for warehouse space at the end of 2017, with absorption of 3.1 million square feet of warehouse space in 2017. There is no guarantee that an active or strong real estate market or an increase in inquiries from prospective tenants will result in leasing space that was vacant as of November 30, 2017.
Revenue from property sales increased to approximately $14.0 million in fiscal 2017 from approximately $4.4 million in fiscal 2016. Property sales revenue in fiscal 2017 included: (a) approximately $10.3 million from the 2017 Phoenix Crossing Land Sale; (b) approximately $2.1 million from the Southwick Land Sale; and (c) approximately $1.3 million from the sale of two smaller parcels of undeveloped land in Phoenix Crossing. In addition, Griffin sold two small residential lots for total revenue of approximately $0.2 million and recognized approximately $0.1 million of revenue from a prior year land sale (see below). The costs related to the 2017 Phoenix Crossing Land Sale, the Southwick Land Sale and the sale of two smaller Phoenix Crossing parcels of undeveloped land were approximately $2.3 million, $0.2 million and $1.2 million, respectively, resulting in pretax gains of approximately $8.0 million,
31
$1.9 million and $0.1 million, respectively. The costs of the two smaller Phoenix Crossing parcels were relatively higher than the costs of other Phoenix Crossing land sold because those parcels were acquired more recently than the other Phoenix Crossing land, which had been held for many years and had a low cost basis.
Revenue from property sales in fiscal 2017 included recognition of the remaining approximately $0.1 million from the sale of approximately 90 acres of undeveloped land in Phoenix Crossing (the “2013 Phoenix Crossing Land Sale”) that closed in the fiscal year ended November 30, 2013 (“fiscal 2013”) and has been accounted for under the percentage of completion method whereby revenue and gain were recognized as costs related to the 2013 Phoenix Crossing Land Sale were incurred. Under the terms of the 2013 Phoenix Crossing Land Sale, Griffin constructed roads to connect the land sold to existing town roads. Such construction was completed in fiscal 2017. Accordingly, because of Griffin’s continued involvement with the land that was sold, the 2013 Phoenix Crossing Land Sale was accounted for under the percentage of completion method. From the closing of the 2013 Phoenix Crossing Land Sale through fiscal 2017, Griffin has recognized total revenue of approximately $9.0 million and a total pretax gain of approximately $6.7 million from the 2013 Phoenix Crossing Land Sale. Property sales occur periodically and changes in revenue from year to year from property sales may not be indicative of any trends in Griffin’s real estate business.
Griffin’s revenue from property sales of approximately $4.4 million in fiscal 2016 reflected approximately $3.8 million from the sale of approximately 29 acres of undeveloped land in Griffin Center (the “Griffin Center Land Sale”) that resulted in a pretax gain of approximately $3.2 million and the recognition of approximately $0.6 million of revenue from the 2013 Phoenix Crossing Land Sale that resulted in a pretax gain of approximately $0.4 million.
Operating expenses of rental properties increased to approximately $8.9 million in fiscal 2017 from approximately $8.3 million in fiscal 2016. The increase of approximately $0.6 million in operating expenses of rental properties in fiscal 2017, as compared to fiscal 2016, principally reflected: (a) an increase of approximately $0.4 million at 5210 Jaindl, which was in service for the entire year in fiscal 2017 versus five months in fiscal 2016; (b) approximately $0.1 million at 215 International, acquired in fiscal 2017; and (c) increases aggregating approximately $0.1 million across all other properties.
Depreciation and amortization expense increased to approximately $10.1 million in fiscal 2017 from approximately $8.8 million in fiscal 2016. The increase of approximately $1.3 million in depreciation and amortization expense in fiscal 2017, as compared to fiscal 2016, principally reflected: (a) an increase of approximately $0.6 million related to 5210 Jaindl, which was in service for the entire year in fiscal 2017 versus five months in fiscal 2016; (b) approximately $0.5 million related to 215 International, acquired in fiscal 2017; and (c) an increase of approximately $0.2 million related to all other properties.
Griffin’s general and administrative expenses increased to approximately $8.6 million in fiscal 2017 from approximately $7.4 million in fiscal 2016. The increase of approximately $1.2 million in general and administrative expenses in fiscal 2017, as compared to fiscal 2016, principally reflected: (a) an increase of approximately $0.6 million in compensation expense, which includes increases of approximately $0.4 million of incentive compensation expense and approximately $0.2 million of salary expense; (b) an increase of approximately $0.3 million related to Griffin’s non-qualified deferred compensation plan; and (c) approximately $0.3 million for the write-off of costs incurred for a potential purchase of a parcel of undeveloped land in the Lehigh Valley that was not completed. The increase in incentive compensation expense in fiscal 2017, as compared to fiscal 2016, reflected Griffin’s improved results of operations in fiscal 2017, as compared to fiscal 2016, that led to the achievement of certain objectives of Griffin’s incentive compensation plan. The increase in salary expense in fiscal 2017, as compared to fiscal 2016, principally reflected the addition of the Director of Acquisitions position in fiscal 2017. The expense increase related to the non-qualified deferred compensation plan reflected the effect of higher stock market performance on participant balances in fiscal 2017, as compared to fiscal 2016, which resulted in a greater increase in Griffin’s non-qualified deferred compensation plan liability in fiscal 2017, as compared to fiscal 2016.
Griffin’s interest expense increased to approximately $5.7 million in fiscal 2017 from approximately $4.5 million in fiscal 2016. The increase of approximately $1.2 million in interest expense in fiscal 2017, as compared to fiscal 2016, principally reflected: (a) approximately $0.5 million from financing 5210 Jaindl, which closed just prior to the end of fiscal 2016; (b) approximately $0.4 million from financing two previously unleveraged NE Tradeport industrial/warehouse buildings in fiscal 2017; (c) approximately $0.2 million less interest capitalized in fiscal 2017 as compared to fiscal 2016; and (d) approximately $0.1 million from financing 215 International in fiscal 2017.
32
In fiscal 2017, Griffin sold its remaining holdings of the common stock of Centaur Media plc (“Centaur Media”) for cash proceeds of approximately $1.2 million and a pretax gain of approximately $0.3 million. The approximately $0.1 million gain on the sale of assets in fiscal 2016 was from the disposition of certain fully depreciated equipment.
Griffin’s income tax provision increased to approximately $2.7 million in fiscal 2017 from approximately $0.7 million in fiscal 2016. The income tax provision in fiscal 2017 reflected an effective tax rate of 36.7% on pretax income of approximately $7.3 million as compared to an effective tax rate of 56.1% on pretax income of approximately $1.3 million in fiscal 2016. The approximately $2.0 million increase in the income tax provision in fiscal 2017, as compared to fiscal 2016, reflected approximately $2.2 million as a result of the higher pretax income in fiscal 2017 than fiscal 2016, partially offset by the inclusion in fiscal 2016 of a charge of approximately $0.2 million related to the reduction of the expected realization rate of tax benefits from Connecticut state net operating loss carryforwards as a result of a change in Connecticut tax law, effective for Griffin in fiscal 2016, that limits the future usage of loss carryforwards to 50% of taxable income. The charge for the reduction of the expected realization rate of tax benefits from Connecticut state net operating loss carryforwards increased the fiscal 2016 effective tax rate by approximately 12%.
Fiscal 2016 Compared to Fiscal 2015
Total revenue increased to approximately $30.9 million in fiscal 2016 from approximately $28.1 million in fiscal 2015, reflecting an increase of approximately $1.9 million in rental revenue and approximately $0.9 million in revenue from property sales. Rental revenue increased to approximately $26.5 million in fiscal 2016 from approximately $24.6 million in fiscal 2015 principally reflecting: (a) an increase of approximately $1.9 million from leasing previously vacant space; and (b) an increase of approximately $1.6 million from leasing space in 5220 Jaindl Boulevard (“5220 Jaindl”), which was completed and placed in service at the start of the fiscal 2015 fourth quarter; partially offset by (c) a decrease of approximately $1.5 million from leases that expired; and (d) a decrease of approximately $0.2 million of rental revenue from lower expense reimbursements, as a result of lower expenses, from tenants and other changes.
A summary of the total square footage and leased square footage of the buildings in Griffin’s real estate portfolio is as follows:
|
|
|
Total |
|
Square |
|
|
|
|
|
|
Square |
|
Footage |
|
Percentage |
|
|
|
|
Footage |
|
Leased |
|
Leased |
|
|
As of November 30, 2016 |
|
3,297,000 |
|
3,066,000 |
|
93% |
|
|
As of November 30, 2015 |
|
3,045,000 |
|
2,706,000 |
|
89% |
|
The approximately 252,000 square foot increase in total square footage as of November 30, 2016, as compared to November 30, 2015, reflected the construction in fiscal 2016 of 5210 Jaindl, the approximately 252,000 square foot industrial/warehouse building which was the second of the two buildings built on an approximately 49 acre parcel of land known as Lehigh Valley Tradeport II. 5210 Jaindl was completed in the 2016 third quarter and Griffin entered into two leases for that building, resulting in 5210 Jaindl being fully leased as of November 30, 2016. Both of the new leases at 5210 Jaindl became effective in the 2017 first quarter upon completion of tenant improvements.
The approximately 360,000 square foot net increase in space leased as of November 30, 2016, as compared to November 30, 2015, reflected the approximately 252,000 square feet leased at 5210 Jaindl and several new leases aggregating approximately 240,000 square feet in other buildings, partially offset by several leases aggregating approximately 132,000 square feet that expired. Included in the approximately 240,000 square feet of new leasing in fiscal 2016 was a lease of approximately 101,000 square feet in 4270 Fritch Drive (“4270 Fritch”), one of Griffin’s other industrial/warehouse buildings in the Lehigh Valley, a full building lease of 25 International Drive (“25 International”), an approximately 57,000 square foot industrial/warehouse building in NE Tradeport, a full building lease of an approximately 31,000 square foot industrial/warehouse building in Bloomfield, Connecticut, and a lease of approximately 16,000 square feet in a single story office building in Griffin Center. The new lease of 25 International replaced a lease that expired earlier in the year. The tenant of the expired lease had, in fiscal 2014, entered into a ten year full building lease of 758 Rainbow Road (“758 Rainbow”), an approximately 138,000 square foot building in NE Tradeport, while remaining in 25 International during its period of transition to the larger facility.
33
Also in the third quarter of fiscal 2016, Griffin entered into a new three year lease of its production nursery in Quincy, Florida (the “Florida Farm”). The Florida Farm had been leased to a nursery grower since fiscal 2009, but that lease ended in the fiscal 2016 second quarter. The new lease contains an option for the tenant to purchase the Florida Farm for a purchase price between $3.4 million and $3.9 million depending upon the date of sale. Subsequent to November 30, 2017, the tenant of the Florida Farm lease filed for protection under Chapter 11 of the U. S. Bankruptcy Code. Griffin has yet to determine the impact, if any, this will have on the Florida Farm Lease, which expires on June 30, 2019.
Griffin’s revenue from property sales increased to approximately $4.4 million in fiscal 2016 from approximately $3.5 million in fiscal 2015. In fiscal 2016, Griffin completed the Griffin Center Land Sale for approximately $3.8 million in cash and a pretax gain of approximately $3.2 million. In fiscal 2016, in addition to the Griffin Center Land Sale, Griffin recognized revenue of approximately $0.6 million and a gain of approximately $0.4 million from the 2013 Phoenix Crossing Land Sale. From the closing of the 2013 Phoenix Crossing Land Sale through November 30, 2016, Griffin had recognized approximately $8.8 million of revenue from the 2013 Phoenix Crossing Land Sale, reflecting approximately 99% of the total revenue to be recognized from such sale. The balance of the revenue from the 2013 Phoenix Crossing Land Sale, approximately $0.1 million, was subsequently recognized in fiscal 2017.
The approximately $3.5 million of revenue from property sales in fiscal 2015 reflected: (a) approximately $2.5 million from the recognition of revenue related to the 2013 Phoenix Crossing Land Sale; (b) approximately $0.6 million from the sale of land that had been part of the Connecticut farm used by Imperial and (c) $0.4 million from the retention of a deposit (the “Florida Farm Deposit”) related to the sale of the Florida Farm, which did not close. Griffin received the Florida Farm Deposit in fiscal 2015 from the tenant that leased the Florida Farm at that time in connection with that tenant giving notice to Griffin that it was exercising its option under the lease to purchase the Florida Farm. The tenant subsequently notified Griffin that it would not close on the purchase and Griffin retained the Florida Farm Deposit and entered into an agreement with the tenant to extend its lease through April 30, 2016. Property sales occur periodically, and changes in revenue from year to year from those transactions may not be indicative of any trends in Griffin’s real estate business.
Operating expenses of rental properties decreased to approximately $8.2 million in fiscal 2016 from approximately $8.4 million in fiscal 2015. The slight decrease of approximately $0.2 million in operating expenses of rental properties in fiscal 2016, as compared to fiscal 2015, principally reflected decreases of approximately $0.4 million in snow removal expenses, due to less severe winter weather in fiscal 2016 than fiscal 2015, and approximately $0.3 million in utility expenses, partially offset by operating expense increases of approximately $0.3 million at 5220 Jaindl, which was in service for the entire year in fiscal 2016 versus three months in fiscal 2015, approximately $0.1 million of operating expenses at 5210 Jaindl, which was placed in service in fiscal 2016, and approximately $0.1 million for real estate taxes.
Depreciation and amortization expense increased to approximately $8.8 million in fiscal 2016 from approximately $7.7 million in fiscal 2015. The increase of approximately $1.1 million in depreciation and amortization expense in fiscal 2016, as compared to fiscal 2015, reflected increases of approximately $0.6 million related to 5220 Jaindl, which was in service for the entire year in fiscal 2016 versus three months in fiscal 2015, approximately $0.2 million related to 5210 Jaindl, which was placed in service in fiscal 2016, and approximately $0.5 million for tenant improvements related to new leases, offset by lower depreciation expense of approximately $0.2 million due to assets becoming fully depreciated.
Griffin’s general and administrative expenses increased to approximately $7.4 million in fiscal 2016 from approximately $7.1 million in fiscal 2015. The increase of approximately $0.3 million in general and administrative expenses in fiscal 2016, as compared to fiscal 2015, principally reflected an increase of approximately $0.2 million related to Griffin’s non-qualified deferred compensation plan and approximately $0.1 million for an increase in incentive compensation expense. The expense increase related to the non-qualified deferred compensation plan reflected the effect of higher stock market performance on participant balances in fiscal 2016, as compared to fiscal 2015, which resulted in a greater increase in Griffin’s non-qualified deferred compensation plan liability in fiscal 2016 as compared to fiscal 2015. The increase in incentive compensation expense reflected Griffin’s improved results in fiscal 2016 with regard to profit from leasing activities and gain on property sales as measured under Griffin’s incentive compensation plan.
34
Griffin’s interest expense increased to approximately $4.5 million in fiscal 2016 from approximately $3.7 million in fiscal 2015. The increase of approximately $0.8 million in interest expense in fiscal 2016, as compared to fiscal 2015, principally reflected approximately $0.5 million less interest capitalized in fiscal 2016 than fiscal 2015 and an increase in interest expense of approximately $0.4 million due to the increase in the amount outstanding under mortgage loans in fiscal 2016 as compared to fiscal 2015. The lower amount of capitalized interest in fiscal 2016, as compared to fiscal 2015, reflected the higher amount of construction activity in fiscal 2015 than fiscal 2016. The increase in the amount outstanding under mortgage loans in fiscal 2016, as compared to fiscal 2015, reflected borrowings completed in the fiscal 2015 fourth quarter that were outstanding for the entire year in fiscal 2016, a new borrowing in fiscal 2016 on 5210 Jaindl, and adding a previously unleveraged NE Tradeport building to a mortgage on several other NE Tradeport buildings in fiscal 2016.
Griffin’s income tax provision increased to approximately $0.7 million in fiscal 2016 from approximately $0.4 million in fiscal 2015. The increase of approximately $0.3 million reflected approximately $0.2 million as a result of the higher pretax income in fiscal 2016 than fiscal 2015 and approximately $0.1 million related to decreases in the valuation of certain state income tax benefits in fiscal 2016. In fiscal 2016, Griffin’s income tax provision included a charge of approximately $0.2 million for the reduction of the expected realization rate of tax benefits from Connecticut state net operating loss carryforwards as a result of a change in Connecticut tax law, effective for Griffin beginning in fiscal 2016, that limits the future usage of loss carryforwards to 50% of taxable income. In fiscal 2015, Griffin’s income tax provision included a charge of approximately $0.1 million for the reduction of the expected realization rate of tax benefits from certain state net operating loss carryforwards and other temporary differences as a result of changes in the expected utilization of such benefits. Griffin’s effective income tax rate increased to 56.1% in fiscal 2016 from 47.2% in fiscal 2015. The higher effective tax rate in fiscal 2016, as compared to fiscal 2015, principally reflected the effect in fiscal 2016 of a higher charge related to the reduction of certain state tax benefits.
Off Balance Sheet Arrangements
Griffin does not have any off balance sheet arrangements.
Liquidity and Capital Resources
Net cash provided by operating activities was approximately $9.4 million in fiscal 2017 as compared to approximately $7.2 million in fiscal 2016. The approximately $2.2 million increase in net cash provided by operating activities in fiscal 2017, as compared to fiscal 2016, principally reflected an increase of approximately $1.6 million of cash provided by changes in assets and liabilities in fiscal 2017, as compared to fiscal 2016, and an increase of approximately $0.6 million of cash provided by net income as adjusted for gains on property sales and noncash expenses and credits in fiscal 2017, as compared to fiscal 2016. The increase in net income as adjusted for gains on property sales and noncash expenses and credits reflects the approximately $2.8 million increase in profit from leasing activities (which Griffin defines as rental revenue less operating expenses of rental properties) in fiscal 2017, partially offset by the approximately $1.1 million increase in interest expense and the approximately $1.2 million increase in general and administrative expenses, a portion of which were noncash and reflected in the favorable changes in assets and liabilities.
The approximately $1.6 million increase in cash from changes in assets and liabilities in fiscal 2017, as compared to fiscal 2016, principally reflected: (a) an increase in deferred revenue of approximately $2.4 million in fiscal 2017 as compared to a decrease of approximately $0.7 million in fiscal 2016; and (b) an increase in other liabilities of approximately $1.1 million in fiscal 2017 as compared to an increase of approximately $0.4 million in fiscal 2016; partially offset by (c) an increase in other assets of approximately $2.1 million in fiscal 2017 as compared to a decrease of approximately $0.1 million in fiscal 2016. The favorable change in deferred revenue in fiscal 2017, as compared to fiscal 2016, principally reflected cash received from tenants for tenant and building improvements that will be recognized as rental revenue over the tenants’ respective lease terms. The favorable change in other liabilities in fiscal 2017 principally reflected the increase of Griffin’s non-qualified deferred compensation plan liability, reflected in general and administrative expenses, as a result of the increase in participant balances in fiscal 2017. The unfavorable change in other assets principally reflected differences in reported rental revenue and cash received from tenants due to the effect of rent abatements given to tenants primarily at the start of leases and an increase in amounts due from tenants,
35
principally for timing of receiving payments from tenants for additional tenant and building improvements related to new leases.
In fiscal 2016, net cash provided by operating activities decreased to approximately $7.2 million from approximately $13.0 million in fiscal 2015. The approximately $5.8 million decrease in net cash provided by operating activities in fiscal 2016, as compared to fiscal 2015, principally reflected a decrease of approximately $6.8 million of cash from changes in assets and liabilities in fiscal 2016 as compared to fiscal 2015, partially offset by an increase of approximately $1.1 million in cash generated from the increase in net income as adjusted for gains on property sales and noncash expenses and credits in fiscal 2016, as compared to fiscal 2015, which principally reflected the increase in profit from leasing activities in fiscal 2016, as compared to fiscal 2015, driven by the increase in rental revenue.
The decrease in cash from changes in assets and liabilities in fiscal 2016, as compared to fiscal 2015, principally reflected: (a) fiscal 2016 having an approximately $0.7 million decrease in cash from the change in deferred revenue as compared to an approximately $4.9 million increase in cash from the change in deferred revenue in fiscal 2015; and (b) fiscal 2016 having an approximately $0.1 million increase in cash from the change in other assets as compared to an approximately $1.1 million increase in cash from the change in other assets in fiscal 2015. The change in deferred revenue of approximately $0.7 million in fiscal 2016 principally reflected the recognition of revenue from the 2013 Phoenix Crossing Land Sale. The change in deferred revenue in fiscal 2015 principally reflected approximately $6.4 million of cash received from a tenant related to building and tenant improvements in connection with a ten year full building lease of 758 Rainbow that is being recognized as additional rental revenue over the lease term, offset by a reduction of deferred revenue from the recognition of approximately $2.5 million of revenue from the 2013 Phoenix Crossing Land Sale. The increase in cash from the change in other assets in fiscal 2015 principally reflected approximately $0.9 million from a reduction in lease receivables.
Net cash used in investing activities was approximately $19.9 million in fiscal 2017 as compared to approximately $16.6 million in fiscal 2016 and approximately $29.7 million in fiscal 2015. The net cash used in investing activities in fiscal 2017 reflected: (a) cash payments of approximately $18.4 million for the acquisition of 215 International; (b) cash payments of approximately $17.6 million for additions to real estate assets; and (c) cash payments of approximately $1.6 million for deferred leasing costs and other uses; partially offset by (d) cash proceeds of approximately $13.0 million from property sales; (e) approximately $3.4 million of net cash proceeds from property sales returned from escrow; and (f) cash proceeds of approximately $1.2 million from the sale of Centaur Media common stock. The approximately $13.0 million of cash proceeds from property sales reflected approximately $9.7 million from the 2017 Phoenix Crossing Land Sale, approximately $1.9 million from the Southwick Land Sale, approximately $1.2 million from the sale of two smaller parcels of undeveloped land in Phoenix Crossing and approximately $0.2 million from the sale of two small residential lots. The approximately $3.4 million of net cash proceeds from property sales returned from escrow reflects approximately $3.5 million from the Griffin Center Land Sale, offset by approximately $0.1 million of cash that remained in escrow from the Southwick Land Sale. The cash proceeds from the Griffin Center Land Sale were deposited into escrow at closing for the potential purchase of a replacement property in a like-kind exchange (a “1031 Like-Kind Exchange”) under Section 1031 of the Internal Revenue Code of 1986, as amended (the “IRC”). The net cash proceeds from the Griffin Center Land Sale were returned to Griffin in fiscal 2017 because a replacement property was not purchased in the time period required for a 1031 Like-Kind Exchange. The cash proceeds of approximately $1.9 million from the Southwick Land Sale were deposited into escrow at closing and subsequently, approximately $1.8 million of such proceeds were used to purchase approximately 14 acres of undeveloped land in the Lehigh Valley of Pennsylvania (see below). The remaining approximately $0.1 million of proceeds from the Southwick Land Sale that remained in escrow was returned to Griffin in the fiscal 2018 first quarter.
On June 9, 2017, Griffin paid cash of approximately $18.4 million (net of allowances) for the acquisition of 215 International, using the approximately $9.7 million of proceeds from the 2017 Phoenix Crossing Land Sale that were deposited in escrow at the closing of that transaction for the purchase of a replacement property for a 1031 Like-Kind Exchange, with the balance of approximately $8.7 million paid from cash on hand. Subsequent to the acquisition, Griffin closed on a nonrecourse mortgage loan of $12.15 million collateralized by 215 International (see below).
36
Cash payments of approximately $17.6 million for additions to real estate assets in fiscal 2017 reflected the following:
|
Tenant and building improvements related to leasing |
|
$ |
7.9 million |
|
|
New building construction (including site work) |
|
$ |
7.0 million |
|
|
Purchase of undeveloped land |
|
$ |
2.4 million |
|
|
Other |
|
$ |
0.3 million |
|
Cash payments for tenant and building improvements in fiscal 2017 related to new leases signed in the latter part of fiscal 2016 and fiscal 2017. Cash of approximately $2.4 million (including acquisition expenses) was paid for the purchase of approximately 14 acres of undeveloped land in the Lehigh Valley that had been under agreement. The closing on this purchase took place after Griffin received all governmental approvals for its planned development, on speculation, of an approximately 134,000 square foot industrial/warehouse building on the land acquired. Griffin started site work in the fiscal 2017 fourth quarter with building construction anticipated to begin in the fiscal 2018 first quarter. Griffin expects to spend approximately $7.8 million for site work and construction of the building shell and expects to complete construction in the fiscal 2018 third quarter. Cash payments for new building construction in fiscal 2017 were for 330 Stone, the approximately 137,000 square foot industrial/warehouse building in NE Tradeport that was built on speculation in fiscal 2017. 330 Stone was 54% leased as of November 30, 2017 as a result of a lease for approximately 74,000 square feet with a tenant that had leased approximately 39,000 square feet in one of Griffin’s other NE Tradeport industrial/warehouse buildings.
Cash payments of approximately $1.6 million in fiscal 2017 for deferred leasing costs and other uses reflected approximately $1.5 million for lease commissions and other costs related to new and renewed leases and approximately $0.1 million for purchases of property and equipment.
In fiscal 2016, the net cash used in investing activities of approximately $16.6 million reflected cash payments of approximately $15.7 million for additions to real estate assets and approximately $0.9 million for deferred leasing costs and other uses. The cash spent on deferred leasing costs and other in fiscal 2016 principally reflected lease commissions paid to real estate brokers for new leases. The approximately $3.5 million of proceeds, net of transaction expenses, received from the Griffin Center Land Sale were placed in escrow for potential acquisition of a replacement property in a like-kind exchange under a 1031 Like-Kind Exchange. As a replacement property was not purchased in the time period required for a 1031 Like-Kind Exchange, the proceeds from the Griffin Center Land Sale were returned to Griffin in fiscal 2017.
Cash payments for additions to real estate assets in fiscal 2016 reflected the following:
|
New building construction (including site work) |
|
$ |
9.2 million |
|
|
Tenant and building improvements related to leasing |
|
$ |
5.4 million |
|
|
Development costs and infrastructure improvements |
|
$ |
0.6 million |
|
|
Other |
|
$ |
0.5 million |
|
Cash payments in fiscal 2016 for new building construction reflected the construction, on speculation, of 5210 Jaindl, which was started in the fiscal 2015 fourth quarter and completed in fiscal 2016. Through November 30, 2016, Griffin made total cash payments of approximately $12.0 million for the direct site work and building shell for 5210 Jaindl. Cash payments in fiscal 2016 for tenant and building improvements principally reflected tenant improvement work related to leases signed in the latter part of fiscal 2015 and fiscal 2016. The cash spent on development costs and infrastructure improvements in fiscal 2016 principally reflected road improvements related to the 2013 Phoenix Crossing Land Sale.
In fiscal 2015, the net cash used in investing activities of approximately $29.7 million reflected cash payments of approximately $31.2 million for additions to real estate assets and approximately $1.0 million for deferred leasing costs and other uses, partially offset by $1.5 million of cash received from the second and final payment under the note receivable from Monrovia Connecticut, LLC (“Monrovia”), the buyer of Imperial, and approximately $1.0 million of cash proceeds from property sales.
37
Cash payments for additions to real estate assets in fiscal 2015 reflect the following:
|
New building construction (including site work) |
|
$ |
14.5 million |
|
|
Tenant and building improvements related to leasing |
|
$ |
14.4 million |
|
|
Development costs and infrastructure improvements |
|
$ |
2.1 million |
|
|
Other |
|
$ |
0.2 million |
|
Fiscal 2015 cash payments for new building construction, including site work, principally reflected the construction, on speculation, of 5220 Jaindl and the start of site work for 5210 Jaindl. The fiscal 2015 cash payments for tenant and building improvements related to leasing included approximately $7.8 million for improvements in connection with the ten year full building lease of 758 Rainbow and approximately $2.9 million of improvements at 5220 Jaindl. The cash payments for development costs and infrastructure improvements primarily reflected ongoing road construction and other offsite improvements required under the terms of the 2013 Phoenix Crossing Land Sale.
Proceeds from property sales in fiscal 2015 reflected approximately $0.6 million from the sale of land that had been part of the Connecticut farm used by Imperial but not part of the long-term lease to Monrovia and approximately $0.4 million from the deposit retained on the sale of the Florida Farm that did not close.
Net cash provided by financing activities was approximately $15.9 million in fiscal 2017 as compared to approximately $15.8 million in fiscal 2016 and approximately $18.0 million in fiscal 2015. The net cash provided by financing activities in fiscal 2017 reflected proceeds of approximately $39.1 million from new mortgage loans (see below); partially offset by: (a) approximately $19.3 million of principal payments on mortgage loans; (b) a payment of approximately $1.5 million for a dividend on Griffin’s common stock that was declared in the fiscal 2016 fourth quarter and paid in fiscal 2017; (c) approximately $1.5 million paid for the repurchase of common stock; (d) approximately $0.6 million of payments for debt issuance costs; and (e) a payment of approximately $0.3 million for the termination of an interest rate swap agreement. The principal payments on mortgage loans include approximately $16.0 million for the repayment of two mortgage loans that were refinanced (see below), and approximately $3.3 million of recurring principal payments.
In fiscal 2016, net cash provided by financing activities of approximately $15.8 million reflected $45.5 million of proceeds from new mortgage debt (see below) and $0.6 million of mortgage proceeds released from escrow, partially offset by: (a) approximately $24.8 million of principal payments on mortgage loans; (b) approximately $3.4 million paid for the repurchase of common stock (see below); (c) a payment of approximately $1.5 million for a dividend on Griffin’s common stock that was declared in the fiscal 2015 fourth quarter and paid in fiscal 2016; and (d) approximately $0.6 million of payments for debt issuance costs. The principal payments on mortgage loans included approximately $21.1 million for the repayment of two mortgage loans that were refinanced (see below), approximately $2.7 million of recurring principal payments and a $1.0 million principal repayment from mortgage proceeds that had been held in escrow.
The net cash provided by financing activities of approximately $18.0 million in fiscal 2015 reflected net proceeds of approximately $40.4 million from three mortgage loans (see below) and approximately $0.1 million received from the exercise of stock options, partially offset by: (a) approximately $20.1 million of payments of principal on Griffin’s mortgage loans; (b) a payment of approximately $1.0 million for a dividend on Griffin’s common stock that was declared in the fiscal 2014 fourth quarter and paid in fiscal 2015; (c) approximately $0.8 million of payments for debt issuance costs; and (d) approximately $0.6 million of mortgage proceeds placed in escrow. The principal payments on mortgage loans included approximately $17.9 million for the repayment of a mortgage loan that was refinanced (see below) and approximately $2.2 million of recurring principal payments.
On September 22, 2017, two subsidiaries of Griffin closed on the refinancing of a nonrecourse mortgage (the “2012 Webster Mortgage”) with Webster Bank, N. A. (“Webster Bank”) that was collateralized by 5 and 7 Waterside Crossing, two multi-story office buildings aggregating approximately 161,000 square feet in Griffin Center in Windsor, Connecticut. Immediately prior to the refinancing, the 2012 Webster Mortgage had a balance of approximately $5.9 million with a maturity date of October 2, 2017. The refinanced nonrecourse mortgage loan (the “2017 Webster Mortgage”) was for approximately $4.4 million, has a five year term with monthly principal payments based on a twenty-five year amortization schedule and is collateralized by the same properties that collateralized the 2012 Webster Mortgage. The 2017 Webster Mortgage has a variable interest rate consisting of the one-month LIBOR rate plus 2.75%, but Griffin entered into an interest rate swap agreement with Webster Bank that effectively fixes the interest rate on the
38
2017 Webster Mortgage at 4.72% over the term of the 2017 Webster Mortgage. The 2012 Webster Mortgage had a variable interest rate that was effectively fixed at 3.86% through an interest rate swap agreement with Webster Bank. Griffin used cash on hand of approximately $1.0 million and approximately $0.5 million of cash that had been held in escrow by Webster Bank to repay a portion of the 2012 Webster Mortgage in connection with the refinancing.
On August 30, 2017, a subsidiary of Griffin closed on a $12.15 million nonrecourse mortgage (the “2017 40|86 Mortgage”) with 40|86 Mortgage Capital, Inc. The 2017 40|86 Mortgage is collateralized by 215 International, which Griffin acquired on June 9, 2017. The 2017 40|86 Mortgage has an interest rate of 3.97% and a ten year term with monthly principal payments based on a thirty year amortization schedule.
On July 14, 2017, a subsidiary of Griffin closed on a $10.6 million nonrecourse mortgage loan (the “2017 Berkshire Mortgage”) with Berkshire Bank. The 2017 Berkshire Mortgage refinanced an existing mortgage loan (the “2009 Berkshire Mortgage”) with Berkshire Bank that was due on February 1, 2019 and was collateralized by 100 International Drive (“100 International”), an approximately 304,000 square foot industrial/warehouse building in NE Tradeport. The 2009 Berkshire Mortgage had a balance of approximately $10.1 million at the time of the refinancing and a variable interest rate consisting of the one month LIBOR rate plus 2.75%. At the time Griffin closed on the 2009 Berkshire Mortgage, Griffin entered into an interest rate swap agreement with Berkshire Bank (the “2009 Berkshire Swap”) to effectively fix the interest rate on the 2009 Berkshire Mortgage at 6.35% for the term of that loan. The 2017 Berkshire Mortgage is collateralized by the same property that collateralized the 2009 Berkshire Mortgage. Just prior to the closing on the 2017 Berkshire Mortgage, Griffin completed a lease amendment with the full building tenant in 100 International to extend the lease from its scheduled expiration date of July 31, 2019 to July 31, 2025. Under the terms of the 2017 Berkshire Mortgage, Griffin entered into a master lease of 100 International that would become effective if the tenant in 100 International does not renew its lease when it expires. The 2017 Berkshire Mortgage has a ten year term with monthly principal payments based on a twenty-five year amortization schedule. The interest rate for the 2017 Berkshire Loan is a variable rate consisting of the one month LIBOR rate plus 2.05%. At the time the 2017 Berkshire Mortgage closed, Griffin terminated the 2009 Berkshire Swap and entered into a new interest rate swap agreement with Berkshire Bank that effectively fixes the interest rate of the 2017 Berkshire Mortgage at 4.39% over the loan term. Griffin paid approximately $0.3 million in connection with the termination of the 2009 Berkshire Swap.
On March 15, 2017, a subsidiary of Griffin closed on a $12.0 million nonrecourse mortgage loan (the “2017 People's Mortgage”) with People’s United Bank, N.A. (“People’s Bank”). The 2017 People’s Mortgage is collateralized by two industrial/warehouse buildings (755 and 759 Rainbow Road) in NE Tradeport aggregating approximately 275,000 square feet. The 2017 People’s Mortgage has a ten year term with monthly principal payments based on a twenty-five year amortization schedule. The interest rate for the 2017 People’s Mortgage is a variable rate consisting of the one month LIBOR rate plus 1.95%. At the time the 2017 People’s Mortgage closed, Griffin also entered into an interest rate swap agreement with People’s Bank that effectively fixes the interest rate at 4.45% for the full loan term. In accordance with the terms of the 2017 People’s Mortgage, Griffin entered into a master lease for 759 Rainbow Road that would only become effective if the full building tenant in that building does not renew its lease, which is scheduled to expire in fiscal 2019. The master lease would be in effect until the earlier to occur of the space being re-leased to a new tenant or the due date of the 2017 People’s Mortgage. Subsequent to November 30, 2017, Griffin closed on the refinancing of the 2017 People’s Mortgage, adding 330 Stone to the collateral and receiving $7.0 million of additional mortgage proceeds (see below).
On November 17, 2016, Griffin closed on a nonrecourse mortgage (the “2016 Webster Mortgage”) for approximately $26.7 million. The 2016 Webster Mortgage refinanced an existing mortgage with Webster Bank, which was due on September 1, 2025 and was collateralized by 5220 Jaindl (see below). The 2016 Webster Mortgage is collateralized by the approximately 280,000 square foot industrial/warehouse building, 5220 Jaindl, along with 5210 Jaindl, the adjacent approximately 252,000 square foot industrial/warehouse building. Griffin received net proceeds of $13.0 million (before transaction costs), net of approximately $13.7 million used to refinance the existing mortgage with Webster Bank. The 2016 Webster Mortgage has a ten year term with monthly principal payments based on a twenty-five year amortization schedule. The interest rate for the 2016 Webster Mortgage is a variable rate of the one month LIBOR rate plus 1.70%. At the time the 2016 Webster Mortgage closed, Griffin entered into an interest rate swap agreement with Webster Bank that, combined with two existing swap agreements with Webster Bank, effectively fixes the rate of the 2016 Webster Mortgage at 3.79% over the mortgage loan’s ten year term.
39
On September 1, 2015, Griffin closed on a $14.1 million nonrecourse mortgage loan (the “2015 Webster Mortgage”) with Webster Bank. The 2015 Webster Mortgage was collateralized by 5220 Jaindl. At closing, Griffin received cash proceeds from the 2015 Webster Mortgage (before transaction costs) of $11.5 million. Subsequent to the closing of this loan, the tenant that was leasing approximately 196,000 square feet in 5220 Jaindl exercised its option to lease the balance of the building and Webster Bank advanced the balance of the mortgage loan proceeds ($2.6 million) to Griffin on December 10, 2015. The 2015 Webster Mortgage had a variable interest rate of the one month LIBOR rate plus 1.65%, but Griffin entered into an interest rate swap agreement with Webster Bank at closing that effectively fixes the interest rate at 3.77% over the loan term on the loan proceeds received at closing. At the time Griffin received the additional proceeds of $2.6 million, Griffin entered into a second interest rate swap agreement with Webster Bank to effectively fix the interest rate on those loan proceeds at 3.67% for the balance of the term of the loan.
On April 26, 2016, Griffin closed on a nonrecourse mortgage (the “2016 People’s Mortgage”) with People’s Bank and received mortgage proceeds of $14.35 million, before transaction costs. The 2016 People’s Mortgage refinanced an existing mortgage (the “2009 People’s Mortgage”) with People’s Bank that was due on August 1, 2019 and was collateralized by four of Griffin’s NE Tradeport industrial/warehouse buildings totaling approximately 240,000 square feet (14, 15, 16 and 40 International Drive). The 2009 People’s Mortgage had a balance of approximately $7.4 million at the time of the refinancing and a variable interest rate of the one month LIBOR rate plus 3.08%. Griffin had entered into an interest rate swap agreement with People’s Bank to effectively fix the rate on the 2009 People’s Mortgage at 6.58% for the term of that loan. The 2016 People’s Mortgage is collateralized by the same four properties as the 2009 People’s Mortgage along with another approximately 98,000 square foot industrial/warehouse building (35 International Drive) in NE Tradeport. At the closing of the 2016 People’s Mortgage, Griffin used a portion of the proceeds to repay the 2009 People’s Mortgage. The 2016 People’s Mortgage has a ten year term with monthly principal payments based on a twenty-five year amortization schedule. The interest rate for the 2016 People’s Mortgage is a variable rate of the one month LIBOR rate plus 2.0%. At the time the 2016 People’s Mortgage closed, Griffin entered into a second interest rate swap agreement with People’s Bank that, combined with the existing interest rate swap agreement with People’s Bank, effectively fixes the interest rate of the 2016 People’s Mortgage at 4.17% over the loan term. The terms of the 2016 People’s Mortgage require that if either the tenant that leases approximately 58,000 square feet in 40 International Drive or the tenant that leases approximately 40,000 square feet in 14 International Drive does not extend its respective lease when it expires in fiscal 2021, a subsidiary of Griffin will enter into a master lease of the vacated space. The master lease would be guaranteed by Griffin and be in effect until either the space is re-leased to a new tenant or the due date of the 2016 People’s Mortgage Loan, whichever occurs first.
On December 31, 2014, Griffin closed on a nonrecourse mortgage loan (the “2014 KeyBank Mortgage”) on 4275 Fritch Drive (“4275 Fritch”) with First Niagara Bank, which was subsequently acquired by KeyBank. The 2014 KeyBank Mortgage refinanced an existing mortgage loan on 4275 Fritch and added 4270 Fritch to the collateral. Griffin received mortgage proceeds of approximately $10.9 million (before transaction costs) in addition to approximately $8.9 million used to refinance the existing mortgage on 4275 Fritch. The 2014 KeyBank Mortgage is collateralized by 4270 Fritch, an approximately 303,000 square foot industrial/warehouse building, and 4275 Fritch, an adjacent approximately 228,000 square foot industrial/warehouse building. At the time of the mortgage closing, approximately 201,000 square feet of 4270 Fritch was leased. On December 11, 2015, Griffin received additional mortgage proceeds of $1.85 million (the “KeyBank Earn-Out”) when the remaining vacant space of approximately 102,000 square feet was leased. Griffin agreed that it would enter into a master lease with its subsidiaries that own 4270 Fritch and 4275 Fritch in order to maintain a minimum net rent equal to the debt service on the 2014 KeyBank Mortgage. The master lease would be co-terminus with the 2014 KeyBank Mortgage. The 2014 KeyBank Mortgage has a ten year term with monthly principal payments based on a twenty-five year amortization schedule. The interest rate for the 2014 KeyBank Mortgage is a variable rate of the one month LIBOR rate plus 1.95%. At the time the 2014 KeyBank Mortgage closed, Griffin entered into an interest rate swap agreement that, combined with an existing interest rate swap agreement, effectively fixed the rate of the 2014 KeyBank Mortgage at 4.43% over the mortgage loan’s ten year term. At the time the KeyBank Earn-Out was received, Griffin entered into another interest rate swap agreement with KeyBank for a notional principal amount of $1.85 million to fix the interest rate on the KeyBank Earn-Out at 3.88%. The combination of the three interest rate swap agreements effectively fixes the interest rate on the 2014 KeyBank Mortgage at 4.39% over the remainder of the mortgage loan’s ten year term.
On July 29, 2015, a subsidiary of Griffin closed on an $18.0 million nonrecourse mortgage loan (the “2015 40|86 Mortgage”) with 40|86 Mortgage Capital, Inc. The 2015 40|86 Mortgage Loan is collateralized by three
40
industrial/warehouse buildings in NE Tradeport (75 International Drive, 754 and 758 Rainbow Road) aggregating approximately 392,000 square feet, has a fixed interest rate of 4.33% and a fifteen year term, with payments based on a thirty year amortization schedule. At closing, Griffin received cash proceeds from the 2015 40|86 Mortgage (before financing costs) of approximately $14.9 million, which were used to refinance the maturing mortgage that had a principal balance of approximately $17.9 million and an interest rate of 5.73%. The remaining approximately $3.1 million of mortgage proceeds were deposited into escrow. As per the terms of the 2015 40|86 Mortgage, $2.5 million of the escrowed proceeds were released to Griffin in fiscal 2015 when the tenant that was leasing approximately 88,000 square feet on a month‑to‑month basis in 754 Rainbow Road entered into a long‑term lease for that space and the remaining $0.6 million of escrowed proceeds were released to Griffin in fiscal 2016 when tenant improvements for the full building tenant in 758 Rainbow Road were completed.
On July 22, 2016, Griffin entered into a two-year extension to its revolving credit line with Webster Bank (the “Webster Credit Line”) that was scheduled to expire on August 1, 2016. The terms of the extension increased the amount of the credit line from $12.5 million to $15.0 million and Griffin has the option to further extend the credit line for an additional year provided there is no default at the time such extension is requested. The interest rate on the credit line extension remained at the one month LIBOR rate plus 2.75% and the collateral for the Webster Credit Line, Griffin’s eight single-story office/flex buildings aggregating approximately 217,000 square feet in Griffin Center South, an approximately 48,000 square foot single-story office building in Griffin Center, and an approximately 18,000 square foot industrial/warehouse building in Griffin Center South also remained the same. There have been no borrowings under the Webster Credit Line since its inception, however, the Webster Credit Line does secure certain unused standby letters of credit aggregating approximately $2.2 million that are related to Griffin's development activities.
In fiscal 2016, Griffin’s Board of Directors authorized a stock repurchase program whereby, effective May 11, 2016, Griffin could repurchase up to $5.0 million of its outstanding common stock over a twelve month period in privately negotiated transactions. The stock repurchase program did not obligate Griffin to repurchase any specific amount of stock. In fiscal 2016, Griffin repurchased 105,000 shares of its common stock for approximately $3.4 million. In fiscal 2017, Griffin repurchased 47,173 shares of its outstanding common stock for approximately $1.5 million before the repurchase program expired on May 10, 2017. Under the stock repurchase program, Griffin repurchased a total of 152,173 shares of its outstanding common stock for approximately $4.8 million.
Griffin’s payments (including principal and interest) under contractual obligations as of November 30, 2017 are as follows:
|
|
|
|
|
|
Due Within |
|
Due From |
|
Due From |
|
Due in More |
|
||||
|
|
|
Total |
|
One Year |
|
1 - 3 Years |
|
3 - 5 Years |
|
Than 5 Years |
|
|||||
|
|
|
(in millions) |
|
|||||||||||||
|
Mortgage Loans |
|
$ |
174.7 |
|
$ |
9.3 |
|
$ |
21.3 |
|
$ |
21.5 |
|
$ |
122.6 |
|
|
Revolving Line of Credit |
|
|
— |
|
|
— |
|
|
— |
|
|
— |
|
|
— |
|
|
Operating Lease Obligations |
|
|
1.1 |
|
|
0.1 |
|
|
0.2 |
|
|
0.3 |
|
|
0.5 |
|
|
Purchase Obligations (1) |
|
|
3.0 |
|
|
3.0 |
|
|
— |
|
|
— |
|
|
— |
|
|
Other (2) |
|
|
5.0 |
|
|
— |
|
|
— |
|
|
— |
|
|
5.0 |
|
|
|
|
$ |
183.8 |
|
$ |
12.4 |
|
$ |
21.5 |
|
$ |
21.8 |
|
$ |
128.1 |
|
|
(1) |
Includes obligations principally related to the development of Griffin’s real estate assets. |
|
(2) |
Reflects the liability for Griffin’s non‑qualified deferred compensation plan. The timing on the payment of participant balances in the non‑qualified deferred compensation plan is not determinable. |
On January 25, 2016, Griffin entered into an Option Purchase Agreement (the “Simsbury Option Agreement”) whereby Griffin granted the buyer an exclusive three month option, in exchange for a nominal fee, to purchase approximately 280 acres of undeveloped land in Simsbury, Connecticut for approximately $7.7 million. The buyer may extend the option period for up to three years upon payment of additional option fees. Through November 30, 2017, the buyer paid approximately $0.1 million of option fees, and subsequent to November 30, 2017, the buyer paid an additional approximately $0.1 million to extend its option period through January 2019. Subsequent to November 30, 2017, the buyer received approval from the state regulatory authority for the buyer’s planned use of the land, which is to generate solar electricity. A closing on the land sale contemplated by the Simsbury Option Agreement is subject to
41
several significant contingencies, including the potential appeal of the approvals recently granted by the state regulatory authority. Griffin expects the decision of the state regulatory authority to be appealed. There is no guarantee that the sale of land as contemplated under the Simsbury Option Agreement will be completed under its current terms, or at all.
On May 5, 2017, Griffin entered into an Option Purchase Agreement (the “EGW Option Agreement”) whereby Griffin granted the buyer an exclusive three month option, in exchange for a nominal fee, to purchase approximately 288 acres of undeveloped land in East Granby and Windsor, Connecticut for approximately $7.8 million. The buyer may extend the option period for up to three years upon payment of additional option fees. The land subject to the EGW Option Agreement does not have any of the approvals that would be required for the buyer’s planned use of the land, which is to generate solar electricity. A closing on the land sale contemplated by the EGW Option Agreement is subject to several significant contingencies, including the buyer procuring electrical utility supply contracts, approval by the state public utility regulatory authorities and governmental approvals for the planned use of the land. There is no guarantee that the sale of land as contemplated under the EGW Option Agreement will be completed under its current terms, or at all.
On October 4, 2017, Griffin entered into an agreement to purchase an approximately 22 acre parcel of undeveloped land in Concord, North Carolina (the “Concord Land”) for $2.6 million in cash. If the transaction closes, Griffin plans to construct an industrial/warehouse development on the Concord Land, which is located near 215 International. The amount of industrial/warehouse space to be developed there will be based upon findings during due diligence. The closing of this purchase, anticipated to take place in fiscal 2018, is subject to several conditions, including the satisfactory outcome of due diligence and obtaining all governmental approvals for Griffin’s development plans for the Concord Land. There is no guarantee that this transaction will be completed under its current terms, or at all.
On October 18, 2017, Griffin entered into a full building lease (the “220 Tradeport Lease”) for an approximately 234,000 square foot industrial/warehouse building (“220 Tradeport Drive”) to be built in NE Tradeport. The tenant is an investment grade company that intends to use 220 Tradeport Drive for the distribution of automotive parts. The Lease, which would commence upon completion of construction of the 220 Tradeport Drive, has a term of twelve years and six months with the tenant having several five year renewal options. Provided the tenant meets certain conditions, the tenant has an option (the “Expansion Option”) to cause Griffin to construct an approximately 54,000 square foot addition to 220 Tradeport Drive. If the tenant exercises the Expansion Option, the term of the 220 Tradeport Lease would be extended for at least ten years upon the tenant occupying the additional space. Griffin expects to commence construction of 220 Tradeport Drive in the fiscal 2018 first quarter, with completion expected in the second half of fiscal 2018. Griffin expects to spend approximately $17.5 million related to development of 220 Tradeport Drive, including all related site work, building construction, tenant improvements, leasing expenses and financing costs. Griffin has agreed to terms with State Farm Life Insurance Company (“State Farm”) on a construction to permanent mortgage loan for up to $13.8 million. The loan would provide financing during the construction period and, upon completion of 220 Tradeport Drive and commencement of rent payments under the 220 Tradeport Lease, would convert to a fifteen year nonrecourse permanent mortgage loan. The interest rate on the loan is 4.51%. During the construction period, only interest payments would be made. Monthly principal payments, which will begin after conversion to a nonrecourse permanent mortgage loan, will be based on a twenty-five year amortization schedule. There is no guarantee that the construction to permanent mortgage loan with State Farm will be completed under its current terms, or at all.
On January 11, 2018, Griffin entered into an agreement to purchase an approximately 14 acre parcel of undeveloped land in the Lehigh Valley of Pennsylvania (the “Lehigh Valley Land”) for $3.6 million in cash. If the transaction closes, Griffin plans to construct an industrial/warehouse building on the Lehigh Valley Land, the size of which will be based upon findings during due diligence. The closing of this purchase, anticipated to take place in late fiscal 2018 or early fiscal 2019, is subject to several conditions, including the satisfactory outcome of due diligence and obtaining all governmental approvals for Griffin’s development plans for the Lehigh Valley Land. There is no guarantee that this transaction will be completed under its current terms, or at all.
On January 30, 2018, one of Griffin’s subsidiaries closed on the refinancing (the “Refinanced Loan”) of the 2017 People’s Mortgage with People’s Bank, adding 330 Stone to the collateral and receiving $7.0 million of additional mortgage proceeds. The 2017 People’s Mortgage had a balance of approximately $11.8 million at the time of the refinancing. The Refinanced Loan has a new ten year term with monthly principal payments based on a twenty-five year amortization schedule. The Refinanced Loan has a variable interest rate based on the one month LIBOR rate plus 1.95%, but Griffin entered into an interest rate swap agreement with People’s Bank that, combined with an existing interest rate
42
swap agreement with People’s Bank, effectively fixes the interest rate on the Refinanced Loan at 4.57% over the term of the Refinanced Loan.
In the near-term, Griffin plans to continue to invest in its real estate business, including construction of 220 Tradeport Drive, construction, on speculation, of a building in the Lehigh Valley on land recently purchased and construction of additional buildings on its undeveloped land, expenditures for tenant improvements as new leases are signed, infrastructure improvements required for future development of its real estate holdings and the potential acquisition of additional properties and/or undeveloped land parcels in the Middle Atlantic, Northeast and Southeast regions to expand the industrial/warehouse portion of its real estate portfolio. Real estate acquisitions may or may not occur based on many factors, including real estate pricing. Griffin may commence speculative construction projects on its undeveloped land that is either currently owned or acquired in the future if it believes market conditions are favorable for such development. Griffin may also construct build‑to‑suit facilities on its undeveloped land if lease terms are favorable.
As of November 30, 2017, Griffin had cash and cash equivalents of approximately $30.1 million. Management believes that its cash and cash equivalents as of November 30, 2017, proceeds from the Refinanced Loan, cash generated from operations, and borrowing capacity under the Webster Credit Line will be sufficient to meet its working capital requirements, the continued investment in real estate assets, construction of buildings currently planned to be built in fiscal 2018, completion of the acquisitions of the Concord Land and the Lehigh Valley Land, and the payment of dividends on its common stock, when and if declared by the Board of Directors, for at least the next twelve months. Griffin may also continue to seek additional financing secured by nonrecourse mortgage loans on its properties.
On December 22, 2017, the Tax Cuts and Jobs Act (“TCJA”) was enacted and became effective for Grifin on January 1, 2018. The TCJA reduces the U.S. federal corporate statutory income tax rate from 35% to 21%, which is expected to result in a blended fiscal 2018 federal corporate statutory rate for Griffin of approximately 22.2%. The impact of the lower statutory rate applied to Griffin’s deferred tax assets and deferred tax liabilities is expected to be recorded as a discrete item in Griffin’s income tax expense in the fiscal 2018 first quarter. Based on the TCJA, Griffin expects to record income tax expense of between approximately $1.0 million and $1.1 million, due to the re-measurement of its net deferred tax assets on its consolidated balance sheet in the fiscal 2018 first quarter. Griffin is currently evaluating the potential impact of the TCJA on its operations.
The above information in Management’s Discussion and Analysis of Financial Condition and Results of Operations includes “forward‑looking statements” within the meaning of Section 27A of the Securities Act of 1933, as amended, and Section 21E of the Exchange Act of 1934, as amended. These forward‑looking statements include, but are not limited to, Griffin’s expectations regarding the leasing of currently vacant space, the acquisition of additional properties and/or undeveloped land parcels, the commencement of speculative construction, the completion of 220 Tradeport Drive, closing on the construction to permanent loan with State Farm, the ability to obtain mortgage financing on Griffin’s unleveraged properties, completion of the acquisitions of the Concord Land and the Lehigh Valley Land, completion of the land sales contemplated under the Simsbury Option Agreement and the EGW Option Agreement, Griffin’s anticipated future liquidity, anticipated impacts of the Tax Cuts and Jobs Act, and other statements with the words “believes,” “anticipates,” “plans,” “expects” or similar expressions. Although Griffin believes that its plans, intentions and expectations reflected in such forward‑looking statements are reasonable, it can give no assurance that such plans, intentions or expectations will be achieved. The forward‑looking statements made herein are based on assumptions and estimates that, while considered reasonable by Griffin as of the date hereof, are inherently subject to significant business, economic, competitive and regulatory uncertainties and contingencies, many of which are beyond the control of Griffin. Griffin’s actual results could differ materially from those anticipated in these forward‑looking statements as a result of various important factors, including those set forth under the heading Item 1A “Risk Factors” and elsewhere in this Annual Report.
43
ITEM 7A. QUANTITATIVE AND QUALITATIVE DISCLOSURES ABOUT MARKET RISK.
Market risk represents the risk of changes in the value of a financial instrument, derivative or non‑derivative, caused by fluctuations in interest rates, foreign exchange rates and equity prices. Changes in these factors could cause fluctuations in earnings and cash flows.
For fixed rate mortgage debt, changes in interest rates generally affect the fair market value of the debt instrument, but not earnings or cash flows. Griffin does not have an obligation to prepay any fixed rate debt prior to maturity and, therefore, interest rate risk and changes in the fair market value of fixed rate debt should not have a significant impact on earnings or cash flows until such debt is refinanced, if necessary. Griffin’s mortgage interest rates and related principal payment requirements are described in Note 5 to the consolidated financial statements included in Item 8. “Financial Statements and Supplementary Data.”
For variable rate debt, changes in interest rates generally do not impact the fair market value of the debt instrument, but do affect future earnings and cash flows. As of November 30, 2017, Griffin had a total of approximately $90.3 million of variable rate debt outstanding, for which Griffin has entered into interest rate swap agreements which effectively fix the interest rates on that debt. There were no other variable rate borrowings outstanding as of November 30, 2017.
Griffin is exposed to market risks from fluctuations in interest rates and the effects of those fluctuations on the market values of Griffin’s cash equivalents. These investments generally consist of overnight investments that are not significantly exposed to interest rate risk.
44
ITEM 8. FINANCIAL STATEMENTS AND SUPPLEMENTARY DATA.
GRIFFIN INDUSTRIAL REALTY, INC.
(dollars in thousands, except per share data)
|
|
|
Nov. 30, 2017 |
|
Nov. 30, 2016 |
|
||
|
ASSETS |
|
|
|
|
|
|
|
|
Real estate assets at cost, net |
|
$ |
196,740 |
|
$ |
172,260 |
|
|
Cash and cash equivalents |
|
|
30,068 |
|
|
24,689 |
|
|
Real estate held for sale |
|
|
1,932 |
|
|
2,992 |
|
|
Deferred income taxes |
|
|
1,904 |
|
|
4,984 |
|
|
Other assets |
|
|
18,393 |
|
|
18,698 |
|
|
Total assets |
|
$ |
249,037 |
|
$ |
223,623 |
|
|
|
|
|
|
|
|
|
|
|
LIABILITIES AND STOCKHOLDERS' EQUITY |
|
|
|
|
|
|
|
|
Mortgage loans, net of debt issuance costs |
|
$ |
129,203 |
|
$ |
109,697 |
|
|
Deferred revenue |
|
|
11,818 |
|
|
9,526 |
|
|
Accounts payable and accrued liabilities |
|
|
4,991 |
|
|
4,140 |
|
|
Dividend payable |
|
|
2,000 |
|
|
1,514 |
|
|
Other liabilities |
|
|
7,972 |
|
|
7,943 |
|
|
Total liabilities |
|
|
155,984 |
|
|
132,820 |
|
|
Commitments and Contingencies (Note 11) |
|
|
|
|
|
|
|
|
Stockholders' Equity |
|
|
|
|
|
|
|
|
Common stock, par value $0.01 per share, 10,000,000 shares authorized, 5,541,029 shares issued and 5,000,535 and 5,047,708 shares outstanding, respectively |
|
|
55 |
|
|
55 |
|
|
Additional paid-in capital |
|
|
108,770 |
|
|
108,438 |
|
|
Retained earnings |
|
|
2,806 |
|
|
179 |
|
|
Accumulated other comprehensive loss, net of tax |
|
|
(284) |
|
|
(1,049) |
|
|
Treasury stock, at cost, 540,494 and 493,321 shares, respectively |
|
|
(18,294) |
|
|
(16,820) |
|
|
Total stockholders' equity |
|
|
93,053 |
|
|
90,803 |
|
|
Total liabilities and stockholders' equity |
|
$ |
249,037 |
|
$ |
223,623 |
|
See Notes to Consolidated Financial Statements.
45
GRIFFIN INDUSTRIAL REALTY, INC.
Consolidated Statements of Operations
(dollars in thousands, except per share data)
|
|
|
For the Fiscal Years Ended |
|
|||||||
|
|
|
Nov. 30, 2017 |
|
Nov. 30, 2016 |
|
Nov. 30, 2015 |
|
|||
|
Rental revenue |
|
$ |
29,939 |
|
$ |
26,487 |
|
$ |
24,605 |
|
|
Revenue from property sales |
|
|
13,945 |
|
|
4,364 |
|
|
3,483 |
|
|
Total revenue |
|
|
43,884 |
|
|
30,851 |
|
|
28,088 |
|
|
|
|
|
|
|
|
|
|
|
|
|
|
Depreciation and amortization expense |
|
|
10,064 |
|
|
8,797 |
|
|
7,668 |
|
|
Operating expenses of rental properties |
|
|
8,866 |
|
|
8,250 |
|
|
8,415 |
|
|
Costs related to property sales |
|
|
3,780 |
|
|
810 |
|
|
634 |
|
|
General and administrative expenses |
|
|
8,552 |
|
|
7,367 |
|
|
7,057 |
|
|
Total expenses |
|
|
31,262 |
|
|
25,224 |
|
|
23,774 |
|
|
|
|
|
|
|
|
|
|
|
|
|
|
Operating income |
|
|
12,622 |
|
|
5,627 |
|
|
4,314 |
|
|
|
|
|
|
|
|
|
|
|
|
|
|
Interest expense |
|
|
(5,690) |
|
|
(4,545) |
|
|
(3,670) |
|
|
Gain on sale of common stock of Centaur Media plc |
|
|
275 |
|
|
— |
|
|
— |
|
|
Gain on sale of assets |
|
|
— |
|
|
122 |
|
|
— |
|
|
Investment income |
|
|
93 |
|
|
107 |
|
|
161 |
|
|
Income before income tax provision |
|
|
7,300 |
|
|
1,311 |
|
|
805 |
|
|
Income tax provision |
|
|
(2,673) |
|
|
(735) |
|
|
(380) |
|
|
Net income |
|
$ |
4,627 |
|
$ |
576 |
|
$ |
425 |
|
|
|
|
|
|
|
|
|
|
|
|
|
|
|
|
|
|
|
|
|
|
|
|
|
|
Basic net income per common share |
|
$ |
0.92 |
|
$ |
0.11 |
|
$ |
0.08 |
|
|
|
|
|
|
|
|
|
|
|
|
|
|
Diluted net income per common share |
|
$ |
0.92 |
|
$ |
0.11 |
|
$ |
0.08 |
|
See Notes to Consolidated Financial Statements.
46
GRIFFIN INDUSTRIAL REALTY, INC.
Consolidated Statements of Comprehensive Income (Loss)
(dollars in thousands)
|
|
|
For the Fiscal Years Ended |
|
|||||||
|
|
|
Nov. 30, 2017 |
|
Nov. 30, 2016 |
|
Nov. 30, 2015 |
|
|||
|
Net income |
|
$ |
4,627 |
|
$ |
576 |
|
$ |
425 |
|
|
|
|
|
|
|
|
|
|
|
|
|
|
Other comprehensive income (loss), net of tax: |
|
|
|
|
|
|
|
|
|
|
|
Reclassifications included in net income |
|
|
651 |
|
|
856 |
|
|
778 |
|
|
Increase (decrease) in fair value of Centaur Media plc |
|
|
159 |
|
|
(646) |
|
|
30 |
|
|
Unrealized loss on cash flow hedges |
|
|
(45) |
|
|
(174) |
|
|
(1,058) |
|
|
Total other comprehensive income (loss), net of tax |
|
|
765 |
|
|
36 |
|
|
(250) |
|
|
Total comprehensive income |
|
$ |
5,392 |
|
$ |
612 |
|
$ |
175 |
|
See Notes to Consolidated Financial Statements.
47
GRIFFIN INDUSTRIAL REALTY, INC.
Consolidated Statements of Changes in Stockholders’ Equity
For the Fiscal Years Ended November 30, 2017, 2016 and 2015
(dollars in thousands)
|
|
|
Shares of |
|
|
|
|
Additional |
|
|
|
|
Accumulated Other |
|
|
|
|
|
|
|
||
|
|
|
Common Stock |
|
Common |
|
Paid-in |
|
Retained |
|
Comprehensive |
|
Treasury |
|
|
|
|
|||||
|
|
|
Issued |
|
Stock |
|
Capital |
|
Earnings |
|
Income (Loss) |
|
Stock |
|
Total |
|
||||||
|
Balance at November 30, 2014 |
|
5,537,895 |
|
$ |
55 |
|
$ |
107,887 |
|
$ |
2,238 |
|
$ |
(835) |
|
$ |
(13,466) |
|
$ |
95,879 |
|
|
Exercise of stock options, net of reversal of tax benefit on exercised stock options of $9 |
|
3,134 |
|
|
— |
|
|
71 |
|
|
— |
|
|
— |
|
|
— |
|
|
71 |
|
|
Stock-based compensation |
|
— |
|
|
— |
|
|
230 |
|
|
— |
|
|
— |
|
|
— |
|
|
230 |
|
|
Dividend declared, $0.30 per share |
|
— |
|
|
— |
|
|
— |
|
|
(1,546) |
|
|
— |
|
|
— |
|
|
(1,546) |
|
|
Total other comprehensive loss, net of tax |
|
— |
|
|
— |
|
|
— |
|
|
— |
|
|
(250) |
|
|
— |
|
|
(250) |
|
|
Net income |
|
— |
|
|
— |
|
|
— |
|
|
425 |
|
|
— |
|
|
— |
|
|
425 |
|
|
Balance at November 30, 2015 |
5,541,029 |
55 |
108,188 |
1,117 |
(1,085) |
(13,466) |
94,809 |
||||||||||||||
|
Repurchase of common stock |
|
— |
|
|
— |
|
|
— |
|
|
— |
|
|
— |
|
|
(3,354) |
|
|
(3,354) |
|
|
Reversal of tax benefit on forfeited stock options |
|
— |
|
|
— |
|
|
(17) |
|
|
— |
|
|
— |
|
|
— |
|
|
(17) |
|
|
Stock-based compensation |
|
— |
|
|
— |
|
|
267 |
|
|
— |
|
|
— |
|
|
— |
|
|
267 |
|
|
Dividend declared, $0.30 per share |
|
— |
|
|
— |
|
|
— |
|
|
(1,514) |
|
|
— |
|
|
— |
|
|
(1,514) |
|
|
Total other comprehensive income, net of tax |
|
— |
|
|
— |
|
|
— |
|
|
— |
|
|
36 |
|
|
— |
|
|
36 |
|
|
Net income |
|
— |
|
|
— |
|
|
— |
|
|
576 |
|
|
— |
|
|
— |
|
|
576 |
|
|
Balance at November 30, 2016 |
|
5,541,029 |
|
|
55 |
|
|
108,438 |
|
|
179 |
|
|
(1,049) |
|
|
(16,820) |
|
|
90,803 |
|
|
Repurchase of common stock |
|
— |
|
|
— |
|
|
— |
|
|
— |
|
|
— |
|
|
(1,474) |
|
|
(1,474) |
|
|
Reversal of tax benefit on forfeited stock options |
|
— |
|
|
— |
|
|
(17) |
|
|
— |
|
|
— |
|
|
— |
|
|
(17) |
|
|
Stock-based compensation |
|
— |
|
|
— |
|
|
349 |
|
|
— |
|
|
— |
|
|
— |
|
|
349 |
|
|
Dividend declared, $0.40 per share |
|
— |
|
|
— |
|
|
— |
|
|
(2,000) |
|
|
— |
|
|
— |
|
|
(2,000) |
|
|
Total other comprehensive income, net of tax |
|
— |
|
|
— |
|
|
— |
|
|
— |
|
|
765 |
|
|
— |
|
|
765 |
|
|
Net income |
|
— |
|
|
— |
|
|
— |
|
|
4,627 |
|
|
— |
|
|
— |
|
|
4,627 |
|
|
Balance at November 30, 2017 |
|
5,541,029 |
|
$ |
55 |
|
$ |
108,770 |
|
$ |
2,806 |
|
$ |
(284) |
|
$ |
(18,294) |
|
$ |
93,053 |
|
See Notes to Consolidated Financial Statements.
48
GRIFFIN INDUSTRIAL REALTY, INC.
Consolidated Statements of Cash Flows
(dollars in thousands)
|
|
|
For the Fiscal Years Ended |
|
|||||||
|
|
|
Nov. 30, 2017 |
|
Nov. 30, 2016 |
|
Nov. 30, 2015 |
|
|||
|
Operating activities: |
|
|
|
|
|
|
|
|
|
|
|
Net income |
|
$ |
4,627 |
|
$ |
576 |
|
$ |
425 |
|
|
Adjustments to reconcile net income to net cash provided by operating activities: |
|
|
|
|
|
|
|
|
|
|
|
Gain on sales of properties |
|
|
(10,165) |
|
|
(3,554) |
|
|
(2,849) |
|
|
Depreciation and amortization |
|
|
10,064 |
|
|
8,797 |
|
|
7,668 |
|
|
Deferred income taxes |
|
|
2,623 |
|
|
785 |
|
|
297 |
|
|
Stock-based compensation expense |
|
|
349 |
|
|
267 |
|
|
230 |
|
|
Amortization of debt issuance costs |
|
|
333 |
|
|
283 |
|
|
226 |
|
|
Gain on sale of common stock of Centaur Media plc |
|
|
(275) |
|
|
— |
|
|
— |
|
|
Amortization of terminated swap agreement |
|
|
98 |
|
|
— |
|
|
— |
|
|
Gain on sale of assets |
|
|
— |
|
|
(122) |
|
|
— |
|
|
Accretion of discount on note receivable |
|
|
— |
|
|
— |
|
|
(49) |
|
|
Changes in assets and liabilities: |
|
|
|
|
|
|
|
|
|
|
|
Other assets |
|
|
(2,050) |
|
|
59 |
|
|
1,124 |
|
|
Accounts payable and accrued liabilities |
|
|
303 |
|
|
337 |
|
|
475 |
|
|
Deferred revenue |
|
|
2,396 |
|
|
(656) |
|
|
4,924 |
|
|
Other liabilities |
|
|
1,076 |
|
|
445 |
|
|
490 |
|
|
Net cash provided by operating activities |
|
|
9,379 |
|
|
7,217 |
|
|
12,961 |
|
|
|
|
|
|
|
|
|
|
|
|
|
|
Investing activities: |
|
|
|
|
|
|
|
|
|
|
|
Acquisition of building |
|
|
(18,440) |
|
|
— |
|
|
— |
|
|
Additions to real estate assets |
|
|
(17,605) |
|
|
(15,734) |
|
|
(31,188) |
|
|
Proceeds from sales of properties, net of expenses |
|
|
13,027 |
|
|
3,536 |
|
|
994 |
|
|
Proceeds from property sales returned from (deposited in) escrow, net |
|
|
3,444 |
|
|
(3,536) |
|
|
— |
|
|
Deferred leasing costs and other |
|
|
(1,556) |
|
|
(890) |
|
|
(1,011) |
|
|
Proceeds from sales of common stock of Centaur Media plc |
|
|
1,216 |
|
|
— |
|
|
— |
|
|
Proceeds from collection of note receivable |
|
|
— |
|
|
— |
|
|
1,500 |
|
|
Net cash used in investing activities |
|
|
(19,914) |
|
|
(16,624) |
|
|
(29,705) |
|
|
|
|
|
|
|
|
|
|
|
|
|
|
Financing activities: |
|
|
|
|
|
|
|
|
|
|
|
Proceeds from mortgage loans |
|
|
39,125 |
|
|
45,525 |
|
|
40,391 |
|
|
Principal payments on mortgage loans |
|
|
(19,287) |
|
|
(24,822) |
|
|
(20,123) |
|
|
Dividends paid to stockholders |
|
|
(1,514) |
|
|
(1,546) |
|
|
(1,030) |
|
|
Repurchase of common stock |
|
|
(1,474) |
|
|
(3,354) |
|
|
— |
|
|
Payment of debt issuance costs |
|
|
(595) |
|
|
(578) |
|
|
(762) |
|
|
Payment for termination of interest rate swap agreement |
|
|
(341) |
|
|
— |
|
|
— |
|
|
Mortgage proceeds returned from (deposited in) escrow |
|
|
— |
|
|
600 |
|
|
(600) |
|
|
Proceeds from exercise of stock options |
|
|
— |
|
|
— |
|
|
80 |
|
|
Net cash provided by financing activities |
|
|
15,914 |
|
|
15,825 |
|
|
17,956 |
|
|
Net increase in cash and cash equivalents |
|
|
5,379 |
|
|
6,418 |
|
|
1,212 |
|
|
Cash and cash equivalents at beginning of period |
|
|
24,689 |
|
|
18,271 |
|
|
17,059 |
|
|
Cash and cash equivalents at end of period |
|
$ |
30,068 |
|
$ |
24,689 |
|
$ |
18,271 |
|
See Notes to Consolidated Financial Statements.
49
GRIFFIN INDUSTRIAL REALTY, INC.
Notes to Consolidated Financial Statements
(dollars in thousands unless otherwise noted, except per share data)
1. Summary of Significant Accounting Policies
Griffin Industrial Realty, Inc. (“Griffin”) is a real estate business principally engaged in developing, managing and leasing industrial/warehouse properties and, to a lesser extent, office/flex properties. Griffin also seeks to add to its property portfolio through the acquisition and development of land or the purchase of buildings in select markets targeted by Griffin. Periodically, Griffin may sell certain portions of its undeveloped land that it has owned for an extended time period and the use of which is not consistent with Griffin’s core development and leasing strategy. Prior to May 13, 2015, Griffin was known as Griffin Land & Nurseries, Inc. On May 13, 2015, Griffin changed its name to better reflect its ongoing real estate business and focus on industrial/warehouse properties after the sale in fiscal 2014 of the landscape nursery business that Griffin had operated through its wholly owned subsidiary, Imperial Nurseries, Inc. (“Imperial”).
Fiscal Year
Griffin reports on a twelve month fiscal year that ends on November 30.
Real Estate Assets
Real estate assets are recorded at cost, except when real estate assets are acquired that meet the definition of a business combination in accordance with Financial Accounting Standards Board (“FASB”) ASC 805-10, “Business Combinations,” and are recorded at fair value. Interest, property taxes, insurance and other incremental costs directly related to a project are capitalized during the construction period of major facilities and land improvements. The capitalization period begins when activities to develop the parcel commence and ends when the asset constructed is completed. The capitalized costs are recorded as part of the asset to which they relate and are amortized over the asset's estimated useful life. Depreciation is determined on a straight-line basis over the estimated useful asset lives for financial reporting purposes and principally on accelerated methods for tax purposes. Repair and maintenance costs are expensed as incurred.
Griffin classifies a property as “held for sale” when all of the following criteria for a plan of sale have been met: (1) management, having the authority to approve the action, commits to a plan to sell the property; (2) the property is available for immediate sale in its present condition, subject only to terms that are usual and customary; (3) an active program to locate a buyer and other actions required to complete the plan to sell, have been initiated; (4) the sale of the property is probable and is expected to be completed within one year or the property is under a contract to be sold; (5) the property is being actively marketed for sale at a price that is reasonable in relation to its current fair value; and (6) actions necessary to complete the plan of sale indicate that it is unlikely that significant changes to the plan will be made or that the plan will be withdrawn. When all of these criteria have been met, the property is classified as “held for sale.” Depreciation of assets ceases upon designation of a property as “held for sale.”
Cash and Cash Equivalents
Griffin considers all highly liquid investments with an initial maturity of three months or less at the date of purchase to be cash equivalents. At November 30, 2017 and 2016, $29,432 and $22,409, respectively, of the cash and cash equivalents included on Griffin's consolidated balance sheets were held in cash equivalents.
Investments
In fiscal 2017, Griffin sold all remaining shares of its investment in the common stock of Centaur Media plc (“Centaur Media”) (see Note 9). Centaur Media had been accounted for as an available-for-sale security under FASB ASC 320-10, “Investments – Debt and Equity Securities,” whereby increases or decreases in its fair value, net of income taxes, along with the effect of changes in the foreign currency exchange rate, net of income taxes, were recorded as a component of other comprehensive income (loss). Realized gains and losses on sales of available-for-sale securities were determined based on the average cost method.
GRIFFIN INDUSTRIAL REALTY, INC.
Notes to Consolidated Financial Statements (Continued)
(dollars in thousands unless otherwise noted, except per share data)
Stock‑Based Compensation
Griffin accounts for stock options at fair value in accordance with FASB ASC 718, “Compensation - Stock Compensation” and FASB ASC 505-50, “Equity – Equity-Based Payments to Non-Employees.” For stock options that have graded vesting features, Griffin recognizes compensation cost over the requisite service period separately for each tranche of the award as though they were, in substance, multiple awards. Griffin determines its accumulated windfall tax benefits using the short-cut method.
Impairment of Investments in Long‑Lived Assets
Griffin reviews annually, as well as when conditions may indicate, its long-lived assets to determine if there are indicators of impairment, such as a prolonged vacancy in one of its properties. If indicators of impairment are present, Griffin evaluates the carrying value of the assets in relation to the operating performance and expected future undiscounted cash flows or the estimated fair value based on expected future cash flows of the underlying assets. If the undiscounted cash flows are less than the carrying value of an asset, Griffin would reduce the carrying value of a long-lived asset to its fair value if that asset’s fair value is determined to be less than its carrying value.
Griffin also reviews annually, as well as when conditions may indicate, the recoverability of its development costs, including expected remediation costs on projects that are included in real estate assets and real estate assets held for sale. To the extent that the carrying value exceeds the fair value of a project, including development costs, an impairment loss would be recorded.
There were no impairment losses recorded in the fiscal years ended November 30, 2017, 2016 and 2015.
Revenue and Gain Recognition
Revenue includes rental revenue from Griffin's industrial and commercial properties and proceeds from property sales. Rental revenue is accounted for on a straight line basis over the applicable lease term in accordance with FASB ASC 840-10, “Leases.” Gains on property sales are recognized in accordance with FASB ASC 360-20, “Property, Plant, and Equipment – Real Estate Sales,” based on the specific terms of each sale. When the percentage of completion method is used to account for a sale of real estate, costs included in determining the percentage of completion include the costs of the land sold, allocated master planning costs, selling and transaction costs and estimated future costs related to the land sold.
Income Taxes
Griffin provides for income taxes utilizing the asset and liability method, and records deferred tax assets and liabilities based on the difference between the financial statement and tax bases of assets and liabilities as measured by the tax rates that are anticipated to be in effect when these differences reverse. The effect on deferred tax assets and liabilities of a change in tax rates is recognized in the results of operations in the period that includes the enactment date. A valuation allowance is established when it is necessary to reduce deferred tax assets to amounts for which realization is more likely than not. Griffin and its subsidiaries file a consolidated federal income tax return.
Griffin evaluates each tax position taken in its tax returns and recognizes a liability for any tax position deemed less likely than not to be sustained under examination by the relevant taxing authorities. Griffin has analyzed its federal and significant state filing positions with respect to FASB ASC 740-10, “Income Taxes” (“ASC 740-10”). Griffin believes that its income tax filing positions will be sustained on examination and does not anticipate any adjustments that would result in a material change on its financial statements. As a result, no accrual for uncertain income tax positions has been recorded pursuant to ASC 740-10.
Griffin’s policy for recording interest and penalties, related to uncertain tax positions, is to record such items as part of its provision for federal and state income taxes.
51
GRIFFIN INDUSTRIAL REALTY, INC.
Notes to Consolidated Financial Statements (Continued)
(dollars in thousands unless otherwise noted, except per share data)
Intangible Assets
Griffin accounts for intangible assets in accordance with FASB ASC 350-10 “Intangibles - Goodwill and Other.” Griffin's intangible assets consist of: (i) the value of in-place leases; and (ii) the value of the associated relationships with tenants. These intangible assets were recorded in connection with Griffin’s acquisitions of real estate assets. Amortization of the value of in-place leases, included in depreciation and amortization expense, is on a straight-line basis over the lease terms. Amortization of the value of relationships with tenants, included in depreciation and amortization expense, is on a straight-line basis over the lease terms and anticipated renewal periods.
Environmental Matters
Environmental expenditures related to land and buildings are expensed or capitalized as appropriate, depending upon their future economic benefit. Expenditures that relate to an existing condition caused by past operations, and that do not have future economic benefit, are expensed. Expenditures that create future benefit or contribute to future revenue generation are capitalized. Liabilities related to future remediation costs are recorded when environmental assessments and/or cleanups are probable, and the costs can be reasonably estimated.
Interest Rate Swap Agreements
As of November 30, 2017, Griffin was a party to several interest rate swap agreements to hedge its interest rate exposures. Griffin does not use derivatives for speculative purposes. Griffin applies FASB ASC 815-10, “Derivatives and Hedging,” (“ASC 815-10”) as amended, which establishes accounting and reporting standards for derivative instruments and hedging activities. ASC 815-10 requires Griffin to recognize all derivatives as either assets or liabilities on its consolidated balance sheet and measure those instruments at fair value. The changes in the fair values of the interest rate swap agreements are measured in accordance with ASC 815-10 and reflected in the carrying values of the interest rate swap agreements on Griffin’s consolidated balance sheet. The estimated fair values are based primarily on projected future swap rates.
Griffin applies cash flow hedge accounting to its interest rate swap agreements that are designated as hedges of the variability of future cash flows from floating rate liabilities based on benchmark interest rates. The changes in the fair values of Griffin’s interest rate swap agreements are recorded as components of accumulated other comprehensive income (loss) (“AOCI”) in stockholders’ equity, to the extent they are effective. Any ineffective portions of the changes in the fair values of these instruments would be recorded as interest expense or interest income.
Conditional Asset Retirement Obligations
Griffin accounts for its conditional asset retirement obligations in accordance with FASB ASC 410-10, “Asset Retirement and Environmental Obligations,” which requires an entity to recognize a liability for the fair value of a conditional asset retirement obligation if the fair value can be reasonably estimated even though uncertainty exists about the timing and/or method of settlement. The conditional asset retirement obligations relate principally to tobacco barns and other structures on Griffin’s land holdings that contain asbestos, primarily in roofing materials. These structures remain from the tobacco growing operations of former affiliates of Griffin, are not material to Griffin’s operations and do not have any book value.
Treasury Stock
Treasury stock is recorded at cost as a reduction of stockholders’ equity on Griffin’s consolidated balance sheets.
52
GRIFFIN INDUSTRIAL REALTY, INC.
Notes to Consolidated Financial Statements (Continued)
(dollars in thousands unless otherwise noted, except per share data)
Income (Loss) Per Share
Basic net income (loss) per common share is calculated by dividing net income (loss) by the weighted average number of common shares outstanding during the year. The calculation of diluted net income (loss) per common share reflects adjusting Griffin’s outstanding shares assuming the exercise of all potentially dilutive Griffin stock options.
Risks and Uncertainties
Griffin’s future results of operations involve a number of risks and uncertainties. Factors that could affect Griffin’s future operating results and cause actual results to vary materially from historical results include, but are not limited to, the geographical concentration of Griffin’s real estate holdings, credit risk and market risk.
Griffin's real estate holdings are concentrated in the Hartford, Connecticut area, the Lehigh Valley of Pennsylvania and the greater Charlotte, North Carolina area. The market and economic challenges experienced by the U.S. economy as a whole or the local economic conditions in the markets in which Griffin holds properties may affect Griffin’s real estate business. Griffin’s results of operations, financial condition or ability to expand may be adversely affected as a result of: (i) poor economic conditions or unfavorable financial changes to Griffin’s tenants, which may lead to a curtailment of expansion plans or may result in tenant defaults under leases; (ii) significant job losses, which could adversely affect the demand for rental space causing market rental rates and property values to be negatively impacted; (iii) the ability of Griffin to borrow on terms and conditions that it finds acceptable; and (iv) possibly reduced values of Griffin’s properties potentially limiting the proceeds from a sale of its properties or from debt financing collateralized by its properties.
Griffin conducts business based on evaluations of its prospective tenants’ financial condition and generally does not require collateral. These evaluations require significant judgment and are based on multiple sources of information.
Griffin does not use derivatives for speculative purposes. Griffin applies ASC 815-10, which established accounting and reporting standards for derivative instruments and hedging activities. This accounting guidance requires Griffin to recognize all derivatives as either assets or liabilities on its consolidated balance sheet and to measure those instruments at fair value. The estimated fair value is based primarily on projected future swap rates.
Griffin applies cash flow hedge accounting to its interest rate swap agreements designated as hedges of the variability of future cash flows from floating rate liabilities due to the benchmark interest rates. Changes in the fair value of these interest rate swaps are recorded as a component of AOCI in stockholders’ equity to the extent they are effective. Amounts recorded to AOCI are then reclassified to interest expense as interest on the hedged borrowing is recognized. Any ineffective portion of the change in fair value of these instruments would be recorded to interest expense.
Griffin’s cash equivalents consist of overnight investments that are not significantly exposed to interest rate risk.
Reclassifications
Certain prior year balances have been reclassified to conform to the current year’s presentation.
Use of Estimates
The preparation of financial statements in conformity with accounting principles generally accepted in the United States of America requires management to make estimates and assumptions that affect the reported amount of assets and liabilities and disclosure of contingent assets and liabilities at the dates of the financial statements and revenue and expenses during the periods reported. Actual results could differ from those estimates. Griffin’s significant estimates include the impairment evaluation of long-lived assets, deferred income taxes, derivative financial instruments, revenue
53
GRIFFIN INDUSTRIAL REALTY, INC.
Notes to Consolidated Financial Statements (Continued)
(dollars in thousands unless otherwise noted, except per share data)
and gain recognition including the estimated costs to complete required offsite improvements related to land sold and assumptions used in determining stock compensation.
Recent Accounting Pronouncements
In August 2017, the FASB issued Accounting Standards Update (“ASU”) No. 2017-12, “Derivatives and Hedging (Topic 815): Targeted Improvements to Accounting for Hedging Activities,” which is intended to improve the financial reporting for hedging relationships to better represent the economic results of a company’s risk management activities in its financial statements and make certain targeted improvements to simplify the application of the hedge accounting guidance. This Update will make more financial and nonfinancial hedging strategies eligible for hedge accounting, amend the presentation and disclosure requirements and change how entities assess effectiveness. This Update will become effective for Griffin in fiscal 2020. Griffin is evaluating the impact that the application of this Update will have on its consolidated financial statements.
In May 2017, the FASB issued Accounting Standards Update (“ASU”) No. 2017-09, “Compensation – Stock Compensation: Scope of Modification Accounting,” which clarifies when to account for a change to the terms or conditions of a share-based payment award as a modification. This Update requires modification only if the fair value, vesting conditions or the classification of the award changes as a result of the change in terms or conditions. This Update will become effective for Griffin in fiscal 2018 and the Update is required to be applied on a prospective basis. The adoption of ASU No. 2017-09 is not expected to have a material impact on Griffin’s consolidated financial statements.
In January 2017, the FASB issued ASU No. 2017-01, “Business Combinations (Topic 805) – Clarifying the Definition of a Business,” which provides a more robust framework to use in determining when a set of assets and activities is a business. This Update also provides greater consistency in applying the guidance by making the definition of a business more operable. This Update would become effective for Griffin in fiscal 2019. Early adoption is allowed for acquisition or deconsolidation transactions occurring before the issuance date or effective date and only when the transactions have not been reported in financial statements that have been issued or made available for issuance. Griffin plans to adopt this Update in the fiscal 2018 first quarter.
In March 2016, the FASB issued ASU No. 2016-09, “Compensation – Stock Compensation: Improvements to Employee Share-Based Payment Accounting,” which relates to the accounting for employee share-based payments. This Update addresses several aspects of the accounting for share-based payment award transactions, including: (a) income tax consequences; (b) classification of awards as either equity or liabilities; and (c) classification on the statement of cash flows. This Update will become effective for Griffin in the first quarter of fiscal 2018 and Griffin expects to record a deferred tax asset of approximately $900 with a corresponding increase in retained earnings upon adoption. The adoption of this Update will not affect the classification of any current awards and will not have a retrospective impact on Griffin’s cash flows as no tax benefit from stock options was recognized in the fiscal years presented.
In February 2016, the FASB issued ASU No. 2016-02, “Leases,” which establishes a right-of-use (“ROU”) model that requires a lessee to record a ROU asset and a lease liability on the balance sheet for all leases with terms longer than twelve months. The accounting applied by lessors under this Update is largely unchanged from that applied under current U.S. GAAP. Leases will be either classified as finance or operating, with classification affecting the pattern of expense recognition in the income statement. This Update also requires significant additional disclosures about the amount, timing and uncertainty of cash flows from leases. This Update will become effective for Griffin in fiscal 2020 using a modified restatement approach for leases in effect as of and after the date of adoption. Early adoption and practical expedients to measure the effect of adoption will also be allowed. Griffin is evaluating the impact that the application of this Update will have on its consolidated financial statements.
In May 2014, the FASB issued ASU No. 2014-09, “Revenue from Contracts with Customers.” This Update outlines a single comprehensive model for entities to use in accounting for revenue arising from contracts with customers. This Update is not applicable to revenue from leases. This Update supersedes most current revenue recognition guidance, including industry specific guidance, and requires an entity to recognize the amount of revenue to which it expects to be entitled for the transfer of promised goods or services to customers. Additionally, the Update
54
GRIFFIN INDUSTRIAL REALTY, INC.
Notes to Consolidated Financial Statements (Continued)
(dollars in thousands unless otherwise noted, except per share data)
requires improved disclosures to help users of financial statements better understand the nature, amount, timing and uncertainty of revenue that is recognized. The Update permits the use of either the retrospective or cumulative effect transition method. This Update will be effective for Griffin in fiscal 2019 and early adoption is not permitted. Certain aspects of this standard may affect Griffin’s revenue recognition relating to property sales, however, Griffin does not anticipate a significant impact on its consolidated financial statements from the application of this Update for lease revenue because revenue from leases are not subject to this Update. Griffin is evaluating the impact that the application of this Update will have on its consolidated financial statements.
2. Fair Value
Griffin applies the provisions of FASB ASC 820, “Fair Value Measurement” (“ASC 820”), which establishes a fair value hierarchy that requires an entity to maximize the use of observable inputs and minimize the use of unobservable inputs when measuring fair value. An asset or liability’s categorization within the fair value hierarchy is based upon the lowest level of input that is significant to the fair value measurement. ASC 820 establishes three levels of inputs that may be used to measure fair value, as follows:
Level 1 applies to assets or liabilities for which there are quoted market prices in active markets for identical assets or liabilities. Griffin’s available-for-sale securities were considered Level 1 within the fair value hierarchy prior to their sale in fiscal 2017 (see Note 9).
Level 2 applies to assets or liabilities for which there are inputs other than quoted prices included within Level 1 that are observable for the asset or liability, such as quoted prices for similar assets or liabilities in active markets; quoted prices for assets or liabilities in markets with insufficient volume or infrequent transactions (less active markets); or model-derived valuations in which significant inputs are observable or can be derived principally from, or corroborated by, observable market data. Level 2 assets and liabilities include Griffin's interest rate swap agreements (see Note 5). These inputs are readily available in public markets or can be derived from information available in publicly quoted markets, therefore, Griffin has categorized these derivative instruments as Level 2 within the fair value hierarchy.
On June 9, 2017, Griffin closed on the acquisition of 215 International Drive (“215 International”) (see Note 3). The acquisition was accounted for in accordance with FASB ASC 805-10, “Business Combinations,” whereby the assets acquired were recorded at their fair values. The fair value of the real estate assets acquired was based upon publicly available data for similar properties. Therefore, Griffin has categorized the real estate assets acquired as Level 2 within the fair value hierarchy.
Level 3 applies to assets or liabilities for which there are unobservable inputs to the valuation methodology that are significant to the measurement of the fair value of the assets or liabilities. As of November 30, 2017, Griffin’s consolidated balance sheet includes acquired intangible assets related to the acquisition of 215 International. These intangible assets are comprised of the values of the in-place leases and the associated tenant relationships. Griffin derived these values based on a discounted cash flow analysis using assumptions that included the rental rate of the in-place leases, the commission percentage expected to be paid on the subsequent leasing of the vacant space and the likelihood that tenants will renew their leases. Therefore, Griffin recognized the acquired intangible assets related to this transaction as Level 3 within the fair value hierarchy.
55
GRIFFIN INDUSTRIAL REALTY, INC.
Notes to Consolidated Financial Statements (Continued)
(dollars in thousands unless otherwise noted, except per share data)
During fiscal 2017, Griffin did not transfer any assets or liabilities in or out of Levels 1 and 2. The following are Griffin’s financial assets and liabilities carried at fair value and measured at fair value on a recurring basis:
|
|
|
November 30, 2017 |
|
|||||||
|
|
|
Quoted Prices in |
|
Significant |
|
Significant |
|
|||
|
|
|
Active Markets for |
|
Observable |
|
Unobservable |
|
|||
|
|
|
Identical Assets |
|
Inputs |
|
Inputs |
|
|||
|
|
|
(Level 1) |
|
(Level 2) |
|
(Level 3) |
|
|||
|
Interest rate swap assets |
|
$ |
— |
|
$ |
644 |
|
$ |
— |
|
|
Interest rate swap liabilities |
|
$ |
— |
|
$ |
845 |
|
$ |
— |
|
|
|
|
November 30, 2016 |
|
|||||||
|
|
|
Quoted Prices in |
|
Significant |
|
Significant |
|
|||
|
|
|
Active Markets for |
|
Observable |
|
Unobservable |
|
|||
|
|
|
Identical Assets |
|
Inputs |
|
Inputs |
|
|||
|
|
|
(Level 1) |
|
(Level 2) |
|
(Level 3) |
|
|||
|
Marketable equity securities |
|
$ |
977 |
|
$ |
— |
|
$ |
— |
|
|
Interest rate swap asset |
|
$ |
— |
|
$ |
207 |
|
$ |
— |
|
|
Interest rate swap liabilities |
|
$ |
— |
|
$ |
1,892 |
|
$ |
— |
|
The carrying and estimated fair values of Griffin’s financial instruments are as follows:
|
|
|
Fair Value |
|
November 30, 2017 |
|
November 30, 2016 |
|
||||||||
|
|
|
Hierarchy |
|
Carrying |
|
Estimated |
|
Carrying |
|
Estimated |
|
||||
|
|
|
Level |
|
Value |
|
Fair Value |
|
Value |
|
Fair Value |
|
||||
|
Financial assets: |
|
|
|
|
|
|
|
|
|
|
|
|
|
|
|
|
Cash and cash equivalents |
|
1 |
|
$ |
30,068 |
|
$ |
30,068 |
|
$ |
24,689 |
|
$ |
24,689 |
|
|
Proceeds held in escrow |
|
1 |
|
$ |
91 |
|
$ |
91 |
|
$ |
3,535 |
|
$ |
3,535 |
|
|
Marketable equity securities |
|
1 |
|
$ |
— |
|
$ |
— |
|
$ |
977 |
|
$ |
977 |
|
|
Interest rate swaps |
|
2 |
|
$ |
644 |
|
$ |
644 |
|
$ |
207 |
|
$ |
207 |
|
|
Financial liabilities: |
|
|
|
|
|
|
|
|
|
|
|
|
|
|
|
|
Mortgage loans, net of debt issuance costs |
|
2 |
|
$ |
129,203 |
|
$ |
128,999 |
|
$ |
109,697 |
|
$ |
111,103 |
|
|
Interest rate swaps |
|
2 |
|
$ |
845 |
|
$ |
845 |
|
$ |
1,892 |
|
$ |
1,892 |
|
The amounts included in the financial statements for cash and cash equivalents, proceeds held in escrow, leasing receivables from tenants and accounts payable and accrued liabilities approximate their fair values because of the short-term maturities of these instruments. The fair values of the available-for-sale securities were based on quoted market prices. The fair values of the mortgage loans, net of debt issuance costs, are estimated based on current rates offered to Griffin for similar debt of the same remaining maturities and, additionally, Griffin considers its credit worthiness in determining the fair value of its mortgage loans. The fair values of the interest rate swaps (used for purposes other than trading) are determined based on discounted cash flow models that incorporate the cash flows of the derivatives as well as the current Overnight Index Swap rate and swap curve along with other market data, taking into account current interest rates and the credit worthiness of the counterparty for assets and the credit worthiness of Griffin for liabilities.
The fair values of Griffin’s nonfinancial assets related to the acquisition of 215 International are listed below. There were no liabilities assumed in connection with this acquisition. These assets were initially recorded at fair value but will not be re-measured at fair value on a recurring basis.
56
GRIFFIN INDUSTRIAL REALTY, INC.
Notes to Consolidated Financial Statements (Continued)
(dollars in thousands unless otherwise noted, except per share data)
|
|
|
Quoted Prices in |
|
Significant |
|
Significant |
|||
|
|
|
Active Markets for |
|
Observable |
|
Unobservable |
|||
|
|
|
Identical Assets |
|
Inputs |
|
Inputs |
|||
|
|
|
(Level 1) |
|
(Level 2) |
|
(Level 3) |
|||
|
Real estate assets |
|
$ |
— |
|
$ |
16,789 |
|
$ |
— |
|
Intangible assets |
|
$ |
— |
|
$ |
— |
|
$ |
1,651 |
3. Real Estate Assets
Real estate assets consist of:
|
|
|
Estimated |
|
|
|
|
|
||
|
|
|
Useful Lives |
|
Nov. 30, 2017 |
|
Nov. 30, 2016 |
|
||
|
Land |
|
|
|
$ |
20,403 |
|
$ |
17,895 |
|
|
Land improvements |
|
10 to 30 years |
|
|
30,833 |
|
|
27,592 |
|
|
Buildings and improvements |
|
10 to 40 years |
|
|
187,116 |
|
|
164,353 |
|
|
Tenant improvements |
|
Shorter of useful life or terms of related lease |
|
|
27,924 |
|
|
21,925 |
|
|
Machinery and equipment |
|
3 to 20 years |
|
|
10,958 |
|
|
11,022 |
|
|
Construction in progress |
|
|
|
|
486 |
|
|
1,659 |
|
|
Development costs |
|
|
|
|
14,132 |
|
|
14,615 |
|
|
|
|
|
|
|
291,852 |
|
|
259,061 |
|
|
Accumulated depreciation |
|
|
|
|
(95,112) |
|
|
(86,801) |
|
|
$ |
196,740 |
$ |
172,260 |
||||||
Total depreciation expense and capitalized interest related to real estate assets were as follows:
|
|
|
For the Fiscal Years Ended |
|
|||||||
|
|
|
Nov. 30, 2017 |
|
Nov. 30, 2016 |
|
Nov. 30, 2015 |
|
|||
|
Depreciation expense |
|
$ |
8,831 |
|
$ |
7,768 |
|
$ |
6,539 |
|
|
|
|
|
|
|
|
|
|
|
|
|
|
Capitalized interest |
|
$ |
103 |
|
$ |
274 |
|
$ |
777 |
|
On April 28, 2017, Griffin closed on the sale of approximately 67 acres (the “2017 Phoenix Crossing Land Sale”) of undeveloped land in Phoenix Crossing, the approximately 268 acre business park master planned by Griffin that straddles the town line between Windsor and Bloomfield, Connecticut. Griffin received cash proceeds of $10,250 before transaction costs and recorded a pretax gain of $7,975 on the 2017 Phoenix Crossing Land Sale. The net cash proceeds of $9,711 from the 2017 Phoenix Crossing Land Sale were placed in escrow and subsequently used for the acquisition of a replacement property, 215 International, in a like-kind exchange (a “1031 Like-Kind Exchange”) under Section 1031 of the Internal Revenue Code of 1986 (the “IRC”), as amended (see below).
On June 9, 2017, Griffin closed on the acquisition of 215 International, an approximately 277,000 square foot industrial/warehouse building in Concord, North Carolina, for $18,440. 215 International is Griffin’s first property in the Charlotte area. The purchase price was paid in cash at closing using the proceeds held in escrow from the 2017 Phoenix Crossing Land Sale (see above) of $9,711 with the balance paid from Griffin’s cash on hand. Griffin incurred approximately $71 of acquisition costs on the purchase of 215 International which are included in general and administrative expenses on Griffin’s fiscal 2017 consolidated statement of operations. 215 International was constructed in 2015 and was 74% leased at the time it was acquired. Subsequent to the closing, one of the tenants in 215 International leased the approximately 73,000 square feet that had been vacant at the time the building was acquired. Rental revenue of $722 and operating income of $112 from 215 International are included in Griffin’s fiscal 2017 consolidated statement of operations. Griffin determined that the fair value of the assets acquired approximated the purchase price. Of
57
GRIFFIN INDUSTRIAL REALTY, INC.
Notes to Consolidated Financial Statements (Continued)
(dollars in thousands unless otherwise noted, except per share data)
the $18,440 purchase price, $16,789 represented the fair value of the real estate assets and $1,651 represented the fair value of the acquired intangible assets, comprised of the value of in-place leases at the time of acquisition and the tenant relationship intangible assets (see Notes 2 and 9). The intangible assets are included in other assets on Griffin’s consolidated balance sheet. The value of the real estate assets primarily represents the value given to the building and land improvements that will be depreciated over forty years. Other building and tenant improvements will be depreciated over a period of five to eighteen years. The value of the intangible assets will primarily be amortized over five to ten years.
Consolidated unaudited pro forma results of operations for Griffin are presented below assuming that the acquisition of 215 International had occurred at the beginning of fiscal 2017. Pro forma results are not presented for fiscal 2016 as the lease for the first tenant did not commence until October 2016 and such pro forma results would not be meaningful. Pro forma financial information is not necessarily indicative of Griffin’s actual results of operations if the acquisition had been completed at the beginning of fiscal 2017, nor is it necessarily an indication of future operating results.
|
|
For the Fiscal Year Ended November 30, 2017 |
|||||||
|
|
As reported |
|
|
Adjustments (a) |
|
Pro forma |
||
|
Rental revenue |
$ |
29,939 |
|
$ |
370 |
|
$ |
30,309 |
|
Revenue from property sales |
|
13,945 |
|
|
— |
|
|
13,945 |
|
Total revenue |
|
43,884 |
|
|
370 |
|
|
44,254 |
|
|
|
|
|
|
|
|
|
|
|
Operating expenses of rental properties |
|
8,866 |
|
|
39 |
|
|
8,905 |
|
Depreciation and amortization expense |
|
10,064 |
|
|
470 |
|
|
10,534 |
|
Costs related to property sales |
|
3,780 |
|
|
— |
|
|
3,780 |
|
General and administrative expenses |
|
8,552 |
|
|
— |
|
|
8,552 |
|
Total expenses |
|
31,262 |
|
|
509 |
|
|
31,771 |
|
|
|
|
|
|
|
|
|
|
|
Operating income |
|
12,622 |
|
|
(139) |
|
|
12,483 |
|
|
|
|
|
|
|
|
|
|
|
Interest expense |
|
(5,690) |
|
|
— |
|
|
(5,690) |
|
Other non-operating income |
|
368 |
|
|
— |
|
|
368 |
|
Income before income tax (provision) benefit |
|
7,300 |
|
|
(139) |
|
|
7,161 |
|
Income tax (provision) benefit |
|
(2,673) |
|
|
51 |
|
|
(2,622) |
|
Net income |
$ |
4,627 |
|
$ |
(88) |
|
$ |
4,539 |
|
|
|
|
|
|
|
|
|
|
|
Earnings per share: |
|
|
|
|
|
|
|
|
|
Basic |
$ |
0.92 |
|
|
|
|
$ |
0.91 |
|
Diluted |
$ |
0.92 |
|
|
|
|
$ |
0.90 |
|
(a) |
Adjustments do not reflect revenue from leasing, subsequent to the date of acquisition, the approximately 73,000 square feet that was vacant at the time 215 International was acquired and interest expense from financing of 215 International subsequent to the date of the acquisition (see Note 5). |
On August 4, 2017, Griffin completed the sale of approximately 76 acres (the “Southwick Land Sale”) of undeveloped land in Southwick, Massachusetts. Griffin received cash proceeds of $2,100 before transaction costs and recorded a pretax gain of $1,890 on the Southwick Land Sale. The net cash proceeds of $1,943 from the Southwick Land Sale were placed in escrow and subsequently used for the acquisition of a replacement property in a 1031 Like-Kind Exchange (see below). The remaining amount of $91 in escrow was returned in the 2018 first quarter.
58
GRIFFIN INDUSTRIAL REALTY, INC.
Notes to Consolidated Financial Statements (Continued)
(dollars in thousands unless otherwise noted, except per share data)
On August 24, 2017, Griffin closed on the purchase of approximately 14 acres of undeveloped land in the Lehigh Valley of Pennsylvania. The purchase price of $1,800 (excluding costs related to the purchase) was paid in cash at closing using the proceeds from the Southwick Land Sale that had been held in escrow (see above). The land acquired had all governmental approvals in place for Griffin’s planned development of an approximately 134,000 square foot industrial/warehouse building. Griffin began construction, on speculation, on this building in the fourth quarter of fiscal 2017 and expects to complete construction in the third quarter of fiscal 2018.
On September 22, 2016, Griffin closed on the sale of approximately 29 acres of an approximately 45 acre land parcel in Griffin Center in Bloomfield, Connecticut for cash proceeds of $3,756 and a pretax gain of $3,174. An additional approximately 15 acres of that land parcel, much of which is wetlands with very limited development potential, was donated to an affiliate of the purchaser at the time of the closing. Griffin retained approximately one acre, which is adjacent to other undeveloped land owned by Griffin. The net cash proceeds from the sale of $3,536 were placed in escrow for the potential acquisition of a replacement property as part of a 1031 Like-Kind Exchange. A replacement property was not purchased within the time frame required under IRC regulations regarding 1031 Like-Kind Exchanges, therefore, the proceeds placed in escrow were returned to Griffin in fiscal 2017 (see Note 9).
The farm in Quincy, Florida (the “Florida Farm”) that had been used by Imperial prior to being shut down in fiscal 2009 was leased to a private company grower of landscape nursery products from fiscal 2009 until April 30, 2016. In the 2015 second quarter, that tenant gave notice of its intent to exercise the purchase option for the Florida Farm under the terms of its lease for approximately $4,100. On June 1, 2015, Griffin received a deposit of $400 as required under the terms of the lease agreement. In August 2015, that tenant informed Griffin that it would not close on the purchase of the Florida Farm. Imperial and the tenant subsequently entered into a Holdover and Settlement Agreement (the “Agreement”) which permitted the tenant to continue to lease the Florida Farm at an agreed upon rental rate through April 30, 2016. The Agreement also stipulated that Imperial was entitled to retain the deposit against the purchase price made by the tenant when it exercised its option to purchase the Florida Farm; therefore, the $400 deposit is reflected as revenue from property sales in Griffin's fiscal 2015 consolidated statement of operations. Subsequent to that lease expiration, Griffin entered into a three year lease of the Florida Farm with a new tenant that includes an option for the new tenant to purchase the Florida Farm for a purchase price between $3,400 and $3,900 depending upon the date of sale. Subsequent to November 30, 2017, the tenant currently leasing the Florida Farm declared bankruptcy under Chapter 11 of the U.S. Bankruptcy Code (see Note 12). Griffin has not determined the impact, if any, this will have on its lease, which expires in June 30, 2019.
In the 2013 fourth quarter, Griffin closed on the sale of approximately 90 acres of undeveloped land in Phoenix Crossing for $8,968 in cash, before transaction costs (the “2013 Phoenix Crossing Land Sale”). Under the terms of the 2013 Phoenix Crossing Land Sale, Griffin and the buyer each were required to construct roadways connecting the land parcel sold with existing town roads. Once completed, the roads constructed by the buyer and by Griffin became new town roads, thereby providing public access to the remaining acreage in Griffin’s land parcel. As a result of Griffin's continuing involvement with the land sold, the 2013 Phoenix Crossing Land Sale was accounted for under the percentage of completion method. Accordingly, the revenue and pretax gain on the sale were recognized on a pro rata basis in a ratio equal to the percentage of the total costs incurred to the total anticipated costs of sale, including the costs of the required roadwork. Costs included in determining the percentage of completion include the cost of the land sold, allocated master planning costs and the cost of road construction.
59
GRIFFIN INDUSTRIAL REALTY, INC.
Notes to Consolidated Financial Statements (Continued)
(dollars in thousands unless otherwise noted, except per share data)
As of November 30, 2017, Griffin had completed the required improvements related to the 2013 Phoenix Crossing Land Sale; accordingly, all of the remaining revenue and pretax gain on the sale were recognized in Griffin’s fiscal 2017 consolidated statement of operations. The revenue and pretax gain recognized by Griffin from the closing of the 2013 Phoenix Crossing Land Sale in fiscal 2013 through fiscal 2017 are as follows:
|
|
|
For the Fiscal Years Ended |
||||||||||||||||
|
|
|
Nov. 30, 2017 |
|
Nov. 30, 2016 |
|
Nov. 30, 2015 |
|
Nov. 30, 2014 |
|
Nov. 30, 2013 |
|
Total |
||||||
|
Revenue |
|
$ |
104 |
|
$ |
608 |
|
$ |
2,483 |
|
$ |
3,105 |
|
$ |
2,668 |
|
$ |
8,968 |
|
|
|
|
|
|
|
|
|
|
|
|
|
|
|
|
|
|
|
|
|
Pretax gain |
|
$ |
66 |
|
$ |
380 |
|
$ |
1,880 |
|
$ |
2,358 |
|
$ |
1,990 |
|
$ |
6,674 |
On March 29, 2017, the full building tenant in an approximately 100,000 square foot industrial/warehouse building in New England Tradeport (“NE Tradeport”), Griffin’s industrial park located in Windsor and East Granby, Connecticut, filed for protection under Chapter 11 of the U.S. Bankruptcy Code. Subsequent to the Chapter 11 filing, Griffin entered into an Amendment to Lease (the “Amendment”) with this tenant which was approved by the U.S. Bankruptcy Court. Under the terms of the Amendment, the tenant’s premises will be reduced to approximately 52,000 square feet prior to June 1, 2018, however, the per square foot rental rates and lease expiration date of March 31, 2024 under the existing lease remain the same. The tenant has also agreed to pay a termination fee of $243 in monthly installments over the balance of the lease term. Rental revenue from this tenant was $1,142 in fiscal 2017.
Real estate assets held for sale consist of:
|
|
|
Nov. 30, 2017 |
|
Nov. 30, 2016 |
|
||
|
Land |
|
$ |
504 |
|
$ |
264 |
|
|
Land improvements |
|
|
354 |
|
|
— |
|
|
Development costs |
|
|
1,074 |
|
|
2,728 |
|
|
|
|
$ |
1,932 |
|
$ |
2,992 |
|
In fiscal 2017, $1,757 was reclassified from real estate assets to real estate assets held for sale related to sales agreements currently under contract (see Note 11). Real estate assets held for sale were reduced in fiscal 2017 by $2,817 for property sales that closed.
4. Income Taxes
The income tax provision for fiscal 2017, fiscal 2016 and fiscal 2015 is summarized as follows:
|
|
|
For the Fiscal Years Ended |
|
|||||||
|
|
|
Nov. 30, |
|
Nov. 30, |
|
Nov. 30, |
|
|||
|
|
|
2017 |
|
2016 |
|
2015 |
|
|||
|
Current federal |
|
$ |
(43) |
|
$ |
50 |
|
$ |
(83) |
|
|
Current state and local |
|
|
(7) |
|
|
— |
|
|
— |
|
|
Deferred federal |
|
|
(2,610) |
|
|
(580) |
|
|
(217) |
|
|
Deferred state and local |
|
|
(13) |
|
|
(205) |
|
|
(80) |
|
|
Total income tax provision |
$ |
(2,673) |
$ |
(735) |
$ |
(380) |
||||
The income tax provision for fiscal 2016 included a charge of $180 for the effect of a change in Connecticut tax law, effective for Griffin in fiscal 2016, whereby, the usage of state net operating loss carryforwards in future years will be limited to 50% of taxable income. Therefore, in fiscal 2016, Griffin decreased its expected realization of the tax benefit related to its Connecticut state net operating loss carryforwards. The decrease of the realization rate is based on management's current projections of taxable income in Connecticut in future years that would generate income taxes in excess of capital based taxes.
60
GRIFFIN INDUSTRIAL REALTY, INC.
Notes to Consolidated Financial Statements (Continued)
(dollars in thousands unless otherwise noted, except per share data)
In fiscal 2015, Griffin decreased its expected realization of the tax benefit related to its Connecticut state net operating loss carryforwards and other Connecticut state temporary differences. This decrease was based on management's projection in that year of taxable income attributable to the state of Connecticut in future years that would generate income taxes in excess of capital based taxes. A charge of $87 is included in the fiscal 2015 tax provision for state taxes to reflect the expected lower realization of certain state tax benefits.
Griffin did not recognize a current tax benefit in fiscal 2017, fiscal 2016 or fiscal 2015 from the exercise of employee stock options. In fiscal 2017 and fiscal 2015, Griffin utilized net operating loss carryforwards to offset taxable income. A benefit was not recorded in fiscal 2016 because Griffin did not have taxable income. As of November 30, 2017, Griffin had an unrecognized tax benefit of approximately $900 for the effect of employee stock options exercised in fiscal years 2006 through 2015. In the first quarter of fiscal 2018, Griffin plans to adopt ASC 2016-09 (see Note 1), which requires recognition on the consolidated balance sheet of the tax benefit of options exercised regardless if there is taxable income or loss. Griffin expects to record a deferred tax asset of approximately $900 upon adoption, with a corresponding increase to retained earnings. In fiscal 2017, fiscal 2016 and fiscal 2015, the deferred tax asset related to non‑qualified stock options was reduced by $17, $17 and $9, respectively, as a result of exercises and forfeitures of those options.
The income tax provisions in fiscal 2017 and fiscal 2015 are net of the effect of recording benefits related to valuation allowances on certain state deferred tax assets (principally Connecticut) of $238 and $76, respectively, less federal income tax expense of $87 and $26, respectively. The income tax provision in fiscal 2016 is net of the effect of recording a charge related to valuation allowances on certain state deferred tax assets (principally Connecticut) of $1,798, less a federal income tax benefit of $629. The establishment of the valuation allowances reflects management’s determination that it is more likely than not that Griffin will not generate sufficient taxable income in the future to fully utilize certain state net operating loss carryforwards.
Other comprehensive loss includes deferred tax (expense) benefit as follows:
|
|
|
For the Fiscal Years Ended |
|
|||||||
|
|
|
Nov. 30, |
|
Nov. 30, |
|
Nov. 30, |
|
|||
|
|
|
2017 |
|
2016 |
|
2015 |
|
|||
|
Fair value adjustment of Griffin's cash flow hedges |
|
$ |
(463) |
|
$ |
(399) |
|
$ |
164 |
|
|
Mark to market adjustment on Centaur Media plc |
|
|
23 |
|
|
347 |
|
|
(16) |
|
|
Total income tax (expense) benefit included in other comprehensive income (loss) |
|
$ |
(440) |
|
$ |
(52) |
|
$ |
148 |
|
The differences between the income tax provision at the United States statutory income tax rate and the actual income tax provision for fiscal 2017, fiscal 2016 and fiscal 2015 are as follows:
|
|
|
For the Fiscal Years Ended |
|
|||||||
|
|
|
Nov. 30, |
|
Nov. 30, |
|
Nov. 30, |
|
|||
|
|
|
2017 |
|
2016 |
|
2015 |
|
|||
|
Tax provision at statutory rate |
|
$ |
(2,555) |
|
$ |
(459) |
|
$ |
(282) |
|
|
State and local taxes, including valuation allowance, net of federal tax effect |
|
|
(18) |
|
|
(205) |
|
|
(80) |
|
|
Permanent items |
|
|
(41) |
|
|
(35) |
|
|
(23) |
|
|
Other |
|
|
(59) |
|
|
(36) |
|
|
5 |
|
|
Total income tax provision |
$ |
(2,673) |
$ |
(735) |
$ |
(380) |
||||
The state and local income tax expense, net of federal tax effect, principally reflects a decrease in the realization of the tax benefit related to Connecticut state net operating loss carryforwards and expected Connecticut state other temporary differences for fiscal 2016 and fiscal 2015.
61
GRIFFIN INDUSTRIAL REALTY, INC.
Notes to Consolidated Financial Statements (Continued)
(dollars in thousands unless otherwise noted, except per share data)
The significant components of Griffin’s deferred tax assets and deferred tax liabilities are as follows:
|
|
|
Nov. 30, |
|
Nov. 30, |
|
||
|
|
|
2017 |
|
2016 |
|
||
|
Deferred tax assets: |
|
|
|
|
|
|
|
|
Deferred revenue |
|
$ |
3,841 |
|
$ |
3,068 |
|
|
Federal net operating loss carryforwards |
|
|
3,797 |
|
|
4,037 |
|
|
Retirement benefit plans |
|
|
1,936 |
|
|
1,675 |
|
|
State net operating loss carryforwards |
|
|
1,366 |
|
|
1,537 |
|
|
Non-qualified stock options |
|
|
970 |
|
|
892 |
|
|
Cash flow hedges |
|
|
159 |
|
|
623 |
|
|
Investment in Centaur Media plc |
|
|
— |
|
|
309 |
|
|
Other |
|
|
226 |
|
|
285 |
|
|
Total deferred tax assets |
|
|
12,295 |
|
|
12,426 |
|
|
Valuation allowances |
|
|
(1,363) |
|
|
(1,514) |
|
|
Net deferred tax assets |
|
|
10,932 |
|
|
10,912 |
|
|
Deferred tax liabilities: |
|
|
|
|
|
|
|
|
Real estate assets |
|
|
(7,199) |
|
|
(4,244) |
|
|
Deferred rent |
|
|
(1,291) |
|
|
(1,095) |
|
|
Other |
|
|
(538) |
|
|
(589) |
|
|
Total deferred tax liabilities |
|
|
(9,028) |
|
|
(5,928) |
|
|
Net total deferred tax assets |
|
$ |
1,904 |
|
$ |
4,984 |
|
At November 30, 2017, Griffin had federal net operating loss carryforwards of approximately $10,850 with expirations ranging from sixteen to nineteen years and state net operating loss carryforwards of approximately $100 with expirations ranging from fourteen to nineteen years. Management has determined that a valuation allowance is required for net operating loss carryforwards in Connecticut related to Griffin and Imperial and for certain other states related to Imperial. Griffin has evaluated the likelihood that it will realize the benefits of its deferred tax assets. Based on a significant number of appreciated assets, primarily real estate, held by Griffin and the significant length of time expected before Griffin’s deferred tax assets would expire, Griffin believes that it is more likely than not that it will utilize the benefit of its remaining deferred tax assets.
Griffin evaluates each tax position taken in its tax returns and recognizes a liability for any tax position deemed less likely than not to be sustained under examination by the relevant taxing authorities. Griffin believes that its income tax filing positions will be sustained on examination and does not anticipate any adjustments that would result in a material change on its financial statements. As a result, no accrual for uncertain income tax positions has been recorded pursuant to ASC 740‑10.
Federal income tax returns for fiscal 2012 through fiscal 2016 are open to examination by the Internal Revenue Service (“IRS”). An IRS examination of the fiscal 2015 federal tax return was opened subsequent to November 30, 2017. The remaining periods subject to examination for Griffin’s significant state return, which is Connecticut, are fiscal 2008 through fiscal 2016.
On December 22, 2017, the Tax Cuts and Jobs Act (“TCJA”) was enacted and became effective for Griffin on January 1, 2018 (see Note 12). The TCJA reduces the U.S. federal corporate statutory income tax rate from 35% to 21%, which Griffin expects will result in a blended fiscal 2018 federal statutory rate for Griffin of approximately 22.2%. The impact of the lower statutory rate applied to Griffin’s deferred tax assets and deferred tax liabilities is expected to be included in Griffin’s income tax provision/benefit in the fiscal 2018 first quarter. Griffin expects to record income tax expense between approximately $1,000 and $1,100, due to the re-measurement of its net deferred tax assets on its consolidated balance sheet in the fiscal 2018 first quarter.
62
GRIFFIN INDUSTRIAL REALTY, INC.
Notes to Consolidated Financial Statements (Continued)
(dollars in thousands unless otherwise noted, except per share data)
5. Mortgage Loans
Griffin's mortgage loans, which are nonrecourse, consist of:
|
|
|
Nov. 30, 2017 |
|
Nov. 30, 2016 |
|
||
|
Variable rate, due January 27, 2020 * |
|
$ |
3,478 |
|
$ |
3,606 |
|
|
Variable rate, due October 3, 2022 * |
|
|
4,367 |
|
|
— |
|
|
Variable rate, due January 2, 2025 * |
|
|
20,221 |
|
|
20,744 |
|
|
Variable rate, due May 1, 2026 * |
|
|
13,844 |
|
|
14,187 |
|
|
Variable rate, due November 17, 2026 * |
|
|
26,076 |
|
|
26,725 |
|
|
Variable rate, due March 1, 2027 * |
|
|
11,826 |
|
|
— |
|
|
Variable rate, due August 1, 2027 * |
|
|
10,523 |
|
|
— |
|
|
3.97%, due September 1, 2027 |
|
|
12,115 |
|
|
— |
|
|
5.09%, due July 1, 2029 |
|
|
6,597 |
|
|
7,001 |
|
|
5.09%, due July 1, 2029 |
|
|
4,622 |
|
|
4,905 |
|
|
4.33%, due August 1, 2030 |
|
|
17,308 |
|
|
17,624 |
|
|
Variable rate, due October 2, 2017 * |
|
|
— |
|
|
6,034 |
|
|
Variable rate, due February 1, 2019 * |
|
|
— |
|
|
10,313 |
|
|
Nonrecourse mortgage loans prior to debt issuance costs |
|
|
130,977 |
|
|
111,139 |
|
|
Debt issuance costs, net |
|
|
(1,774) |
|
|
(1,442) |
|
|
Nonrecourse mortgage loans, net |
$ |
129,203 |
$ |
109,697 |
|||
|
* |
Griffin entered into interest rate swap agreements to effectively fix the interest rates on these loans (see below). |
The aggregate annual principal payment requirements under the terms of the nonrecourse mortgage loans for the fiscal years 2018 through 2022 are $3,590, $3,751, $6,976, $3,945 and $7,970, respectively. The aggregate book value of land and buildings that are collateral for the nonrecourse mortgage loans was $151,472 at November 30, 2017.
On September 22, 2017, two wholly-owned subsidiaries of Griffin entered into the Fourth Modification Agreement (the “Modification Agreement”) to the mortgage loan previously due on October 2, 2017 with Webster Bank N.A. (“Webster Bank”) (the “Webster Mortgage”). At the time Griffin entered into the Fourth Modification, the Webster Mortgage had a principal balance of $5,876 and a variable interest rate of the one month LIBOR rate plus 2.75%. Griffin had previously entered into an interest rate swap agreement to effectively fix the interest rate of the Webster Mortgage at 3.86%. The Modification Agreement reduced the principal amount of the loan to $4,375 and extended the maturity of the Webster Mortgage to October 3, 2022 with monthly principal payments based on a twenty-five year amortization schedule. Griffin made a payment of $1,501 against the principal balance utilizing $501 that had been held in escrow with Webster Bank and $1,000 from its cash on hand. The Fourth Modification maintained the interest rate on the Webster Mortgage at the one month LIBOR rate plus 2.75%. At the time Griffin completed the Fourth Modification, Griffin entered into an interest rate swap agreement to effectively fix the Webster Mortgage at a new rate of 4.72%. The Webster Mortgage is collateralized by Griffin’s two multi-story office buildings in Windsor, Connecticut. The Modification Agreement did not alter the collateral for the Webster Mortgage.
On August 30, 2017, a subsidiary of Griffin closed on a $12,150 nonrecourse mortgage loan (the “2017 40|86 Mortgage”) with 40|86 Mortgage Capital, Inc. The 2017 40|86 Mortgage is collateralized by 215 International which Griffin acquired on June 9, 2017 (see Note 3) and has a ten year term with monthly principal payments based on a thirty year amortization schedule. The interest rate for the 2017 40|86 Mortgage is 3.97%.
On July 14, 2017, a subsidiary of Griffin closed on a $10,600 nonrecourse mortgage loan (the “2017 Berkshire Mortgage”) with Berkshire Bank. The 2017 Berkshire Mortgage refinanced an existing mortgage loan (the “2009 Berkshire Mortgage”) with Berkshire Bank that was due on February 1, 2019 and was collateralized by 100 International Drive (“100 International”), an approximately 304,000 square foot industrial/warehouse building in NE Tradeport. The 2009 Berkshire Mortgage had a balance of $10,120 at the time of refinancing and a variable interest rate of the one
63
GRIFFIN INDUSTRIAL REALTY, INC.
Notes to Consolidated Financial Statements (Continued)
(dollars in thousands unless otherwise noted, except per share data)
month LIBOR rate plus 2.75%. At the time Griffin completed the 2009 Berkshire Mortgage, Griffin entered into an interest rate swap agreement with Berkshire Bank (the “2009 Berkshire Swap”) to effectively fix the interest rate on the 2009 Berkshire Mortgage at 6.35% for the term of that loan. The 2017 Berkshire Mortgage is collateralized by the same property that collateralized the 2009 Berkshire Mortgage. The 2017 Berkshire Mortgage has a ten year term with monthly principal payments based on a twenty-five year amortization schedule. The interest rate for the 2017 Berkshire Mortgage is a variable rate consisting of the one month LIBOR rate plus 2.05%. At the time the 2017 Berkshire Mortgage closed, Griffin terminated the 2009 Berkshire Swap and entered into a new interest rate swap agreement with Berkshire Bank that effectively fixes the interest rate of the 2017 Berkshire Mortgage at 4.39% over the loan term. The terms of the 2017 Berkshire Mortgage require that if the full building tenant at 100 International does not extend its lease when it expires in fiscal 2025, Griffin will enter into a master lease of the vacated space that would then be in effect until the due date of the 2017 Berkshire Mortgage.
Griffin paid $341 in connection with the termination of the 2009 Berkshire Swap. Amounts remaining in accumulated other comprehensive income and deferred tax assets of $218 and $123, respectively, at the time of the termination are being amortized over the original term of that interest rate swap agreement. Accordingly, Griffin recorded interest expense of $98 in fiscal 2017 related to the termination of the 2009 Berkshire Swap. Griffin expects to record interest expense of approximately $211 and $32 in fiscal 2018 and fiscal 2019, respectively, related to the 2009 Berkshire Swap.
On March 15, 2017, a subsidiary of Griffin closed on a $12,000 nonrecourse mortgage loan (the “2017 People’s Mortgage”) with People’s United Bank, N.A. (“People’s Bank”). The 2017 People’s Mortgage is collateralized by two industrial/warehouse buildings in NE Tradeport aggregating approximately 275,000 square feet. The 2017 People’s Mortgage has a ten year term with monthly principal payments based on a twenty-five year amortization schedule. The interest rate for the 2017 People’s Mortgage is a variable rate consisting of the one month LIBOR rate plus 1.95%. At the time the 2017 People’s Mortgage closed, Griffin also entered into an interest rate swap agreement with People’s Bank for a notional principal amount of $12,000 at inception to effectively fix the interest rate at 4.45% for its full term. Under the terms of the 2017 People’s Mortgage, Griffin entered into a master lease for 759 Rainbow Road (“759 Rainbow”), one of two buildings that collateralize the 2017 People’s Mortgage. The master lease would only become effective if the full building tenant in 759 Rainbow does not renew its lease when it is scheduled to expire in fiscal 2019. The master lease would be in effect until the earlier of the space being re-leased to a new tenant or the due date of the 2017 People’s Mortgage.
On January 30, 2018, Griffin’s subsidiary that completed the 2017 People’s Mortgage closed on the refinancing (the “Refinanced Loan”) of the 2017 People’s Mortgage with People’s Bank, adding 330 Stone Road, an approximately 137,000 square foot industrial/warehouse building in NE Tradeport, to the collateral and received additional mortgage proceeds of $7,000. The 2017 People’s Mortgage had a balance of $11,781 at the time of the refinancing. The Refinanced Loan has a new ten year term with monthly principal payments based on a twenty-five year amortization schedule. The interest rate on the Refinanced Loan has a variable interest rate based on the one month LIBOR rate plus 1.95%, but Griffin entered into an interest rate swap agreement with People’s Bank that, combined with an existing interest rate swap agreement with People’s Bank, effectively fixes the interest rate on the Refinanced Loan at 4.57% over the term of the Refinanced Loan.
On November 17, 2016, Griffin closed on a nonrecourse mortgage (the “2016 Webster Mortgage”) for $26,725. The 2016 Webster Mortgage refinanced an existing mortgage with Webster Bank which was due on September 1, 2025 and was collateralized by an approximately 280,000 square foot industrial building (“5220 Jaindl”) in the Lehigh Valley of Pennsylvania (see below). The 2016 Webster Mortgage is collateralized by 5220 Jaindl along with an adjacent approximately 252,000 square foot industrial building (“5210 Jaindl”). Griffin received net proceeds of $13,000 (before transaction costs), net of $13,725 used to refinance the existing mortgage with Webster Bank. The 2016 Webster Mortgage has a ten year term with monthly principal payments based on a twenty-five year amortization schedule. The interest rate for the 2016 Webster Mortgage is a floating rate of the one month LIBOR rate plus 1.70%. At the time the 2016 Webster Mortgage closed, Griffin entered into an interest rate swap agreement with Webster Bank that, combined
64
GRIFFIN INDUSTRIAL REALTY, INC.
Notes to Consolidated Financial Statements (Continued)
(dollars in thousands unless otherwise noted, except per share data)
with two existing swap agreements with Webster Bank, effectively fixes the rate of the 2016 Webster Mortgage at 3.79% over the balance of the mortgage loan’s ten year term.
On April 26, 2016, Griffin closed on a nonrecourse mortgage (“the 2016 People’s Mortgage”) with People’s Bank for $14,350, before transaction costs. The 2016 People’s Mortgage refinanced an existing mortgage (the “2009 People’s Mortgage”) with People’s Bank that was due on August 1, 2019 and was collateralized by four industrial/warehouse buildings totaling approximately 240,000 square feet (14, 15, 16 and 40 International Drive) in New England Tradeport (“NE Tradeport”), Griffin’s industrial park located in Windsor and East Granby, Connecticut. The 2009 People’s Mortgage had a balance of $7,418 at the time of the refinancing and a variable interest rate of the one month LIBOR rate plus 3.08%. At the time Griffin completed the 2009 People’s Mortgage, Griffin entered into an interest rate swap agreement with People’s Bank to effectively fix the rate on the 2009 People’s Mortgage at 6.58% for the term of that loan. The 2016 People’s Mortgage is collateralized by the same four properties that collateralized the 2009 People’s Mortgage along with another approximately 98,000 square foot NE Tradeport industrial/warehouse building. At the closing of the 2016 People’s Mortgage, Griffin received net mortgage proceeds of $6,932 (before transaction costs), which was net of the $7,418 used to repay the 2009 People’s Mortgage. The 2016 People’s Mortgage has a ten year term with monthly principal payments based on a twenty-five year amortization schedule. The interest rate for the 2016 People’s Mortgage is a floating rate of the one month LIBOR rate plus 2.0%. At the time the 2016 People’s Mortgage closed, Griffin entered into another interest rate swap agreement with People’s Bank that, combined with the existing interest rate swap agreement with People’s Bank, effectively fixes the interest rate of the 2016 People’s Mortgage at 4.17% over the term of the loan. The terms of the 2016 People’s Mortgage require that if either the tenant that leases approximately 58,000 square feet in 40 International Drive or the tenant that leases approximately 40,000 square feet in 14 International Drive does not extend its respective lease when it expires in fiscal 2021, a subsidiary of Griffin will enter into a master lease of the vacated space. The master lease would be guaranteed by Griffin and be in effect until either the vacated space is re-leased to a new tenant or the due date of the 2016 People’s Mortgage Loan, whichever occurs first.
On December 10, 2015, Griffin received additional mortgage proceeds of $2,600 (the “Webster Earn-Out”) related to the mortgage (the “2015 Webster Mortgage”) obtained by one of its subsidiaries with Webster Bank on its property at 5220 Jaindl. The 2015 Webster Mortgage closed on September 1, 2015, at which time initial proceeds of $11,500 (before transaction costs) were received. At the time of the mortgage closing, Griffin had leased approximately 196,000 square feet of 5220 Jaindl. The Webster Earn-Out was subsequently received by Griffin when the tenant that leased that space exercised its option to lease the balance of the building. The 2015 Webster Mortgage had a ten year term with monthly principal payments based on a twenty-five year amortization schedule. The interest rate for the 2015 Webster Mortgage was a floating rate of the one month LIBOR rate plus 1.65%. At the time the 2015 Webster Mortgage closed, Griffin also entered into an interest rate swap agreement with Webster Bank for a notional principal amount of $11,500 at inception to fix the interest rate at 3.77% on the initial funds advanced under the 2015 Webster Mortgage. At the time the Webster Earn-Out was received, Griffin entered into another interest rate swap agreement with Webster Bank for a notional principal amount of $2,600 to fix the interest rate on the Webster Earn-Out at 3.67%.
On December 11, 2015, Griffin received additional mortgage proceeds of $1,850 (the “KeyBank Earn-Out”) related to the mortgage obtained by two of its subsidiaries with KeyBank (formerly First Niagara Bank) (the “2014 KeyBank Mortgage”) on its properties at 4270 Fritch Drive (“4270 Fritch”) and 4275 Fritch Drive (“4275 Fritch”) in the Lehigh Valley of Pennsylvania. The 2014 KeyBank Mortgage closed on December 31, 2014, at which time proceeds of $10,891 (before transaction costs) were received, in addition to $8,859 used to refinance the existing mortgage on 4275 Fritch with KeyBank. The 2014 KeyBank Mortgage is collateralized by 4270 Fritch, an approximately 303,000 square foot industrial/warehouse building, and 4275 Fritch, an adjacent approximately 228,000 square foot industrial/warehouse building. At the time of the mortgage closing, approximately 201,000 square feet of 4270 Fritch was leased. The KeyBank Earn-Out was subsequently received by Griffin when the remaining vacant space of approximately 102,000 square feet was leased. Griffin agreed to enter into a master lease with its subsidiaries that own 4270 Fritch and 4275 Fritch in order to maintain a minimum net rent equal to the debt service on the 2014 KeyBank Mortgage. The master lease would be co-terminus with the 2014 KeyBank Mortgage. The 2014 KeyBank Mortgage has a ten year term with monthly principal payments based on a twenty-five year amortization schedule. The interest rate for the 2014 KeyBank
65
GRIFFIN INDUSTRIAL REALTY, INC.
Notes to Consolidated Financial Statements (Continued)
(dollars in thousands unless otherwise noted, except per share data)
Mortgage is a floating rate of the one month LIBOR rate plus 1.95%. At the time the 2014 KeyBank Mortgage closed, Griffin entered into an interest rate swap agreement with KeyBank that, combined with an existing interest rate swap agreement with KeyBank, effectively fixed the rate of the 2014 KeyBank Mortgage at 4.43% over the mortgage loan’s ten year term. At the time the KeyBank Earn-Out was received, Griffin entered into another interest rate swap agreement with KeyBank for a notional principal amount of $1,850 to fix the interest rate on the KeyBank Earn-Out at 3.88%. The combination of the three interest rate swap agreements effectively fixes the interest rate on the 2014 KeyBank Mortgage at 4.39% over the remainder of the mortgage loan’s ten year term.
On July 29, 2015, a subsidiary of Griffin closed on a new nonrecourse mortgage with 40|86 Mortgage Capital, Inc. (“the 2015 40|86 Mortgage”) for $18,000. The 2015 40|86 Mortgage refinanced an existing 5.73% nonrecourse mortgage which was due on August 1, 2015 and was collateralized by three industrial/warehouse buildings totaling approximately 392,000 square feet (“75 International,” “754 Rainbow” and “758 Rainbow”) in NE Tradeport. The 2015 40|86 Mortgage is collateralized by the same three properties. Griffin received proceeds of $14,875 at closing (before transaction costs), which were used for the payoff of the maturing 5.73% nonrecourse mortgage of $17,891. The remaining $3,125 of loan proceeds were placed in escrow at closing. In the 2015 fourth quarter, as per the terms of the 2015 40|86 Mortgage, $2,500 of the escrowed proceeds was released to Griffin when the tenant that was leasing approximately 88,000 square feet on a month-to-month basis in 754 Rainbow extended into a long-term lease for that space and $25 of the escrowed proceeds was also released to Griffin upon renewal of insurance coverage on the mortgaged properties. The remaining $600 of mortgage proceeds in escrow was released to Griffin in the fiscal 2016 second quarter when tenant improvement work for the full building tenant in 758 Rainbow was completed. The 2015 40|86 Mortgage has a fifteen year term with monthly payments based on a thirty year amortization schedule. The interest rate for the 2015 40|86 Mortgage is 4.33%.
As of November 30, 2017, Griffin was a party to several interest rate swap agreements related to its variable rate nonrecourse mortgages on certain of its real estate assets. Griffin accounts for its interest rate swap agreements as effective cash flow hedges (see Note 2). No ineffectiveness on the cash flow hedges was recognized as of November 30, 2017 and none is anticipated over the term of the agreements. Amounts in accumulated other comprehensive income (loss) will be reclassified into interest expense over the term of the swap agreements to achieve fixed rates on each mortgage. None of the interest rate swap agreements contain any credit risk related contingent features. In fiscal 2017 and fiscal 2016, Griffin recognized net gains before taxes, included in other comprehensive income, of $949 and $1,081, respectively, on its interest rate swap agreements. In fiscal 2015, Griffin recognized a net loss before taxes, included in other comprehensive loss, of $444 on its interest rate swap agreements.
As of November 30, 2017, $786 is expected to be reclassified over the next twelve months from accumulated other comprehensive loss to interest expense. As of November 30, 2017, the net fair value of Griffin’s interest rate swap agreements was $201, with $644 included in other assets and $845 included in other liabilities on Griffin’s consolidated balance sheet. As of November 30, 2016, the fair value of Griffin’s interest rate swap agreements was $1,685, with $207 included in other assets and $1,892 included in other liabilities on Griffin’s consolidated balance sheet.
66
GRIFFIN INDUSTRIAL REALTY, INC.
Notes to Consolidated Financial Statements (Continued)
(dollars in thousands unless otherwise noted, except per share data)
6. Revolving Credit Agreement
On July 22, 2016, Griffin entered into an amendment (the “Amendment”) to its revolving credit line (the “Webster Credit Line”) with Webster Bank that extends the Webster Credit Line for two years through July 31, 2018. The Amendment increased the amount of the Webster Credit Line from $12,500 to $15,000 and enables Griffin to further extend the term of the Webster Credit Line for an additional year through July 31, 2019, provided there is no default at the time such extension is requested. Per the terms of the Amendment, the interest rate on the Webster Credit Line will remain at the one month LIBOR rate plus 2.75%.
The Webster Credit Line is collateralized by Griffin’s properties in Griffin Center South, aggregating approximately 235,000 square feet, and an approximately 48,000 square foot single-story office building in Griffin Center. The aggregate book value of land and buildings that are collateral for the Webster Credit Line was $11,064 at November 30, 2017. There have been no borrowings under the Webster Credit Line since its inception in fiscal 2013. As of November 30, 2017, the Webster Credit Line secured certain standby letters of credit aggregating $2,214 that are related to Griffin's development activities.
7. Stockholders’ Equity
Per Share Results
Basic and diluted results per share were based on the following:
|
|
|
For the Fiscal Years Ended |
|
|||||||
|
|
|
Nov. 30, |
|
Nov. 30, |
|
Nov. 30, |
|
|||
|
|
|
2017 |
|
2016 |
|
2015 |
|
|||
|
Net income |
|
$ |
4,627 |
|
$ |
576 |
|
$ |
425 |
|
|
|
|
|
|
|
|
|
|
|
|
|
|
Weighted average shares outstanding for computation of basic per share results |
|
|
5,010,000 |
|
|
5,117,000 |
|
|
5,151,000 |
|
|
Incremental shares from assumed exercise of Griffin stock options |
|
|
28,000 |
|
|
6,000 |
|
|
17,000 |
|
|
Adjusted weighted average shares for computation of diluted per share results |
|
|
5,038,000 |
|
|
5,123,000 |
|
|
5,168,000 |
|
Griffin Stock Option Plan
The Griffin Industrial Realty, Inc. 2009 Stock Option Plan (the “2009 Stock Option Plan”) makes available options to purchase 386,926 shares of Griffin common stock. The Compensation Committee of Griffin’s Board of Directors administers the 2009 Stock Option Plan. Options granted under the 2009 Stock Option Plan may be either incentive stock options or non‑qualified stock options granted at fair market value on the date approved by Griffin’s Compensation Committee. Vesting of all of Griffin’s stock options is solely based upon service requirements and does not contain market or performance conditions.
Stock options granted expire ten years from the grant date. In accordance with the 2009 Stock Option Plan, stock options granted to non‑employee directors upon their initial election to the board of directors are fully exercisable immediately upon the date of the option grant. Stock options granted to non‑employee directors upon their reelection to the board of directors vest on the second anniversary from the date of grant. Stock options granted to employees vest in equal installments on the third, fourth and fifth anniversaries from the date of grant. None of the stock options outstanding at November 30, 2017 may be exercised as stock appreciation rights.
67
GRIFFIN INDUSTRIAL REALTY, INC.
Notes to Consolidated Financial Statements (Continued)
(dollars in thousands unless otherwise noted, except per share data)
The following options were granted by Griffin under the 2009 Stock Option Plan to employees and non-employee directors either upon their initial election or their reelection to Griffin’s Board of Directors:
|
|
|
|
For the Fiscal Years Ended |
|
|||||||||||||
|
|
|
|
Nov. 30, 2017 |
|
Nov. 30, 2016 |
|
Nov. 30, 2015 |
|
|||||||||
|
|
|
|
|
|
Fair Value per |
|
|
|
Fair Value per |
|
|
|
Fair Value per |
|
|||
|
|
|
|
Number of |
|
Option at |
|
Number of |
|
Option at |
|
Number of |
|
Option at |
|
|||
|
|
|
|
Shares |
|
Grant Date |
|
Shares |
|
Grant Date |
|
Shares |
|
Grant Date |
|
|||
|
|
Employees |
|
5,000 |
|
$ |
11.13 |
|
101,450 |
|
$ |
7.51 - 11.65 |
|
- |
|
$ |
- |
|
|
|
Non-employee directors |
|
6,570 |
|
$ |
13.49 |
|
8,409 |
|
$ |
11.30 |
|
8,282 |
|
$ |
14.39 |
|
|
|
|
|
11,570 |
|
|
|
|
109,859 |
|
|
|
|
8,282 |
|
|
|
|
The fair values were estimated as of the date of each grant using the Black-Scholes option-pricing model. The following assumptions were used in determining the fair value of each option:
|
|
|
For the Fiscal Years Ended |
|
||||
|
|
|
Nov. 30, 2017 |
|
Nov. 30, 2016 |
|
Nov. 30, 2015 |
|
|
Expected volatility |
|
32.7 to 39.6 |
% |
32.9 to 41.1 |
% |
40.8 |
% |
|
Risk free interest rates |
|
2.1 to 2.2 |
% |
1.2 to 1.5 |
% |
2.0 |
% |
|
Expected option term (in years) |
|
7.5 to 8.5 |
|
5 to 8.5 |
|
8.5 |
|
|
Annual dividend yield |
|
0.8 to 0.9 |
% |
0.9 |
% |
0.7 |
% |
|
Number of option holders at November 30, 2017 |
|
31 |
|
|
Compensation expense and related tax benefits for stock options were as follows:
|
|
|
For the Fiscal Years Ended |
|
|||||||
|
|
|
Nov. 30, 2017 |
|
Nov. 30, 2016 |
|
Nov. 30, 2015 |
|
|||
|
|
|
|
|
|
|
|
|
|
|
|
|
Compensation expense |
|
$ |
349 |
|
$ |
267 |
|
$ |
230 |
|
|
|
|
|
|
|
|
|
|
|
|
|
|
Related tax benefit |
|
$ |
86 |
|
$ |
62 |
|
$ |
61 |
|
For all years presented, forfeiture rates used for directors were 0%, forfeiture rates used for executives ranged from 17.9% to 22.6% and forfeiture rates used for employees ranged from 38.3% to 41.1%. These rates were utilized based on the historical activity of the grantees.
As of November 30, 2017, the unrecognized compensation expense related to nonvested stock options that will be recognized during future periods is as follows:
|
Fiscal 2018 |
|
$ |
340 |
|
|
Fiscal 2019 |
|
$ |
234 |
|
|
Fiscal 2020 |
|
$ |
112 |
|
|
Fiscal 2021 |
|
$ |
34 |
|
The total grant date fair value of options vested during fiscal 2017, fiscal 2016 and fiscal 2015 was $55, $457 and $492, respectively. There were no options exercised in fiscal 2017 and fiscal 2016. The intrinsic value of options exercised in fiscal 2015 was $18.
68
GRIFFIN INDUSTRIAL REALTY, INC.
Notes to Consolidated Financial Statements (Continued)
(dollars in thousands unless otherwise noted, except per share data)
A summary of the activity under the 2009 Griffin Stock Option Plan is as follows:
|
|
|
|
|
Weighted Avg. |
|
|
|
|
Options |
|
Exercise Price |
|
|
Outstanding at November 30, 2014 |
|
222,001 |
|
$ |
30.35 |
|
Granted |
|
8,282 |
|
$ |
31.38 |
|
Exercised |
|
(3,134) |
|
$ |
25.53 |
|
Forfeited |
|
(1,422) |
|
$ |
28.12 |
|
Outstanding at November 30, 2015 |
|
225,727 |
|
$ |
30.47 |
|
Granted |
|
109,859 |
|
$ |
26.83 |
|
Forfeited |
|
(11,040) |
|
$ |
30.73 |
|
Outstanding at November 30, 2016 |
|
324,546 |
|
$ |
29.23 |
|
Granted |
|
11,570 |
|
$ |
30.59 |
|
Forfeited |
|
(2,354) |
|
$ |
36.82 |
|
Outstanding at November 30, 2017 |
|
333,762 |
|
$ |
29.22 |
|
|
|
|
|
|
|
|
Weighted Avg. |
|
|
|
|
|
|
|
|
|
|
|
|
Remaining |
|
|
|
|
|
Range of Exercise Prices for |
|
Outstanding at |
|
Weighted Avg. |
|
Contractual Life |
|
Total Intrinsic |
|
||
|
Vested and Nonvested Options |
|
November 30, 2017 |
|
Exercise Price |
|
(in years) |
|
Value |
|
||
|
$23.00 - $28.00 |
|
124,543 |
|
$ |
26.67 |
|
7.9 |
|
$ |
1,225 |
|
|
$28.00 - $32.00 |
|
128,248 |
|
$ |
29.07 |
|
4.1 |
|
|
953 |
|
|
$32.00 - $39.00 |
|
80,971 |
|
$ |
33.40 |
|
0.9 |
|
|
251 |
|
|
|
|
333,762 |
|
$ |
29.22 |
|
4.7 |
|
$ |
2,429 |
|
Accumulated Other Comprehensive Loss
As of November 30, 2017, Griffin no longer held any shares of Centaur Media plc (“Centaur Media”) as Griffin sold its remaining 1,952,462 shares of Centaur Media in fiscal 2017 (see Note 9). As of November 30, 2016, Griffin held 1,952,462 shares of common stock in Centaur Media and accounted for its investment in Centaur Media as an available-for-sale security under ASC 320-10. Accordingly, the investment in Centaur Media was carried at its fair value on Griffin’s consolidated balance sheet, with increases or decreases recorded, net of tax, as a component of other comprehensive income (loss). Upon the sale of shares in Centaur Media, the change, net of tax, in the value of the shares of Centaur Media that were sold during the time Griffin held those shares was reclassified from accumulated other comprehensive income (loss) and included in Griffin’s consolidated statement of operations. In fiscal 2017, $172 was reclassified from accumulated other comprehensive loss as a result of the sale of the 1,952,462 shares of Centaur Media common stock. There were no sales of Centaur Media common stock in fiscal 2016 and fiscal 2015.
69
GRIFFIN INDUSTRIAL REALTY, INC.
Notes to Consolidated Financial Statements (Continued)
(dollars in thousands unless otherwise noted, except per share data)
Accumulated other comprehensive loss, and activity for fiscal 2017, fiscal 2016 and fiscal 2015, is comprised of the following:
|
|
|
Unrealized Gain |
|
Unrealized Gain |
|
|
|
|
||
|
|
|
(Loss) on Cash |
|
(Loss) on Investment |
|
|
|
|
||
|
|
|
Flow Hedges |
|
in Centaur Media |
|
Total |
|
|||
|
Balance at November 30, 2014 |
|
$ |
(1,464) |
|
$ |
629 |
|
$ |
(835) |
|
|
Other comprehensive (loss) income before reclassifications |
|
|
(1,058) |
|
|
30 |
|
|
(1,028) |
|
|
Amounts reclassified |
|
|
778 |
|
|
— |
|
|
778 |
|
|
Net activity for other comprehensive loss |
|
|
(280) |
|
|
30 |
|
|
(250) |
|
|
Balance at November 30, 2015 |
|
|
(1,744) |
|
|
659 |
|
|
(1,085) |
|
|
Other comprehensive loss before reclassifications |
|
|
(174) |
|
|
(646) |
|
|
(820) |
|
|
Amounts reclassified |
|
|
856 |
|
|
— |
|
|
856 |
|
|
Net activity for other comprehensive income |
|
|
682 |
|
|
(646) |
|
|
36 |
|
|
Balance at November 30, 2016 |
|
|
(1,062) |
|
|
13 |
|
|
(1,049) |
|
|
Other comprehensive (loss) income before reclassifications |
|
|
(45) |
|
|
159 |
|
|
114 |
|
|
Amounts reclassified |
|
|
823 |
|
|
(172) |
|
|
651 |
|
|
Net activity for other comprehensive income |
|
|
778 |
|
|
(13) |
|
|
765 |
|
|
Balance at November 30, 2017 |
|
$ |
(284) |
|
$ |
— |
|
$ |
(284) |
|
Changes in accumulated other comprehensive income (loss) are as follows:
|
|
|
For the Fiscal Years Ended |
|
|||||||||||||||||||||||||
|
|
|
November 30, 2017 |
|
November 30, 2016 |
|
November 30, 2015 |
|
|||||||||||||||||||||
|
|
|
|
|
|
Tax |
|
|
|
|
|
|
|
Tax |
|
|
|
|
|
|
|
Tax |
|
|
|
|
|||
|
|
|
|
|
|
(Expense) |
|
|
|
|
|
|
|
(Expense) |
|
|
|
|
|
|
|
(Expense) |
|
|
|
|
|||
|
|
|
Pre-Tax |
|
Benefit |
|
Net-of-Tax |
|
Pre-Tax |
|
Benefit |
|
Net-of-Tax |
|
Pre-Tax |
|
Benefit |
|
Net-of-Tax |
|
|||||||||
|
Reclassifications included in net income: |
|
|
|
|
|
|
|
|
|
|
|
|
|
|
|
|
|
|
|
|
|
|
|
|
|
|
|
|
|
Loss on cash flow hedges (interest expense) |
|
$ |
1,299 |
|
$ |
(476) |
|
$ |
823 |
|
$ |
1,358 |
|
$ |
(502) |
|
$ |
856 |
|
$ |
1,234 |
|
$ |
(456) |
|
$ |
778 |
|
|
Realized gain on sale of Centaur Media (gain on sale) |
|
|
(281) |
|
|
109 |
|
|
(172) |
|
|
— |
|
|
— |
|
|
— |
|
|
— |
|
|
— |
|
|
— |
|
|
Total reclassifications included in net income |
|
|
1,018 |
|
|
(367) |
|
|
651 |
|
|
1,358 |
|
|
(502) |
|
|
856 |
|
|
1,234 |
|
|
(456) |
|
|
778 |
|
|
Mark to market adjustment on Centaur Media for an increase (decrease) in fair value |
|
|
220 |
|
|
(77) |
|
|
143 |
|
|
(763) |
|
|
267 |
|
|
(496) |
|
|
123 |
|
|
(43) |
|
|
80 |
|
|
Mark to market adjustment on Centaur Media for an increase (decrease) in the foreign currency exchange rate |
|
|
25 |
|
|
(9) |
|
|
16 |
|
|
(230) |
|
|
80 |
|
|
(150) |
|
|
(77) |
|
|
27 |
|
|
(50) |
|
|
Decrease in fair value adjustment on Griffin's cash flow hedges |
|
|
(58) |
|
|
13 |
|
|
(45) |
|
|
(277) |
|
|
103 |
|
|
(174) |
|
|
(1,678) |
|
|
620 |
|
|
(1,058) |
|
|
Total change in other comprehensive loss |
|
|
187 |
|
|
(73) |
|
|
114 |
|
|
(1,270) |
|
|
450 |
|
|
(820) |
|
|
(1,632) |
|
|
604 |
|
|
(1,028) |
|
|
Total other comprehensive income (loss) |
|
$ |
1,205 |
|
$ |
(440) |
|
$ |
765 |
|
$ |
88 |
|
$ |
(52) |
|
$ |
36 |
|
$ |
(398) |
|
$ |
148 |
|
$ |
(250) |
|
Cash Dividends
In fiscal 2017, Griffin declared an annual cash dividend of $0.40 per common share, which was paid in the first quarter of fiscal 2018.
In fiscal 2016 and fiscal 2015, Griffin declared annual cash dividends of $0.30 per common share in each year, which were paid in the first quarter of fiscal 2017 and fiscal 2016, respectively.
70
GRIFFIN INDUSTRIAL REALTY, INC.
Notes to Consolidated Financial Statements (Continued)
(dollars in thousands unless otherwise noted, except per share data)
Stock Repurchases
In fiscal 2016, Griffin’s Board of Directors authorized a stock repurchase program whereby, starting on May 11, 2016, Griffin could repurchase up to $5,000 of its outstanding common stock over a twelve month period in privately negotiated transactions. The stock repurchase program expired on May 10, 2017. In fiscal 2017, prior to the expiration of the stock repurchase program, Griffin repurchased 47,173 shares of its outstanding common stock for $1,474. Including the stock repurchased in fiscal 2016, Griffin repurchased a total of 152,173 shares for $4,828 under the stock repurchase program.
8. Operating Leases
Griffin's rental revenue reflects the leasing of industrial, flex and office space and the lease of the nursery growing facilities in Connecticut and Florida previously used by Imperial. Future minimum rental payments, including expected tenant reimbursements, to be received under noncancelable leases as of November 30, 2017 were:
|
2018 |
|
$ |
29,532 |
|
|
2019 |
|
|
25,983 |
|
|
2020 |
|
|
24,007 |
|
|
2021 |
|
|
17,849 |
|
|
2022 |
|
|
13,599 |
|
|
Later years |
|
|
28,794 |
|
|
|
|
$ |
139,764 |
|
All future minimum rental payments, principally for Griffin’s corporate headquarters, under noncancelable leases, as lessee, as of November 30, 2017 were:
|
2018 |
|
$ |
126 |
|
|
2019 |
|
|
125 |
|
|
2020 |
|
|
121 |
|
|
2021 |
|
|
122 |
|
|
2022 |
|
|
131 |
|
|
Later years |
|
|
511 |
|
|
|
|
$ |
1,136 |
|
Total rental expense for all operating leases, as lessee, in fiscal 2017, fiscal 2016 and fiscal 2015 was $156, $194 and $201, respectively.
Effective October 1, 2016, Griffin entered into a ten year sublease for approximately 1,920 square feet in New York City for its executive offices. The sublease is with Bloomingdale Properties, Inc. (“Bloomingdale Properties”), an entity that is controlled by certain members of the Cullman and Ernst Group, which is considered a related party to Griffin. The sublease with Bloomingdale Properties was approved by Griffin’s Audit Committee and the lease rates under the sublease were at market rate at the time the sublease was signed. Rental expense for this lease in fiscal 2017 and fiscal 2016 was $124 and $10, respectively, which is included in general and administrative expenses.
9. Supplemental Financial Statement Information
Available-for-Sale Securities
In fiscal 2017, Griffin sold its remaining 1,952,462 shares of common stock of Centaur Media for cash proceeds of $1,216, after transaction costs, which resulted in a pretax gain of $275. Accordingly, Griffin no longer owned any shares of common stock in Centaur Media as of November 30, 2017. Griffin did not sell any of its Centaur Media common stock in fiscal 2016 or fiscal 2015.
71
GRIFFIN INDUSTRIAL REALTY, INC.
Notes to Consolidated Financial Statements (Continued)
(dollars in thousands unless otherwise noted, except per share data)
Griffin’s investment in the common stock of Centaur Media was accounted for as an available-for-sale security under ASC 320-10. Accordingly, changes in the fair value of Centaur Media, reflecting both changes in the stock price and changes in the foreign currency exchange rate, were included, net of income taxes, in accumulated other comprehensive income (see Note 7). Griffin's investment income includes dividend income from Centaur Media of $38, $79 and $83 in fiscal 2017, fiscal 2016 and fiscal 2015, respectively.
Griffin’s investment in Centaur Media was included in other assets on Griffin’s consolidated balance sheet in fiscal 2016. The fair value, cost and unrealized gain of Griffin’s investment in Centaur Media as of November 30, 2016 were as follows:
|
Fair value |
$ |
977 |
|
|
Cost |
|
1,014 |
|
|
Unrealized loss |
$ |
(37) |
|
Other Assets
Griffin's other assets are comprised of the following:
|
|
|
Nov. 30, 2017 |
|
Nov. 30, 2016 |
|
||
|
Deferred rent receivable |
|
$ |
5,351 |
|
$ |
4,474 |
|
|
Deferred leasing costs |
|
|
5,113 |
|
|
4,746 |
|
|
Prepaid expenses |
|
|
2,774 |
|
|
2,333 |
|
|
Intangible assets, net |
|
|
1,695 |
|
|
247 |
|
|
Lease receivables from tenants |
|
|
1,097 |
|
|
369 |
|
|
Deposits |
|
|
713 |
|
|
449 |
|
|
Interest rate swap assets |
|
|
644 |
|
|
207 |
|
|
Mortgage escrows |
|
|
448 |
|
|
717 |
|
|
Furniture, fixtures and equipment, net |
|
|
251 |
|
|
280 |
|
|
Sale proceeds held in escrow |
|
|
91 |
|
|
3,535 |
|
|
Deferred financing costs related to the Webster Credit Line |
|
|
47 |
|
|
117 |
|
|
Available-for-sale securities |
|
|
— |
|
|
977 |
|
|
Other |
|
|
169 |
|
|
247 |
|
|
Total other assets |
$ |
18,393 |
$ |
18,698 |
|||
Griffin’s intangible assets relate to the fiscal 2017 acquisition of an industrial building (see Note 3) and the fiscal 2010 acquisition of an industrial building and consist of: (i) the value of in-place leases; and (ii) the value of the associated relationships with tenants. Intangible assets are shown net of amortization of $975 and $772 as of November 30, 2017 and November 30, 2016, respectively.
Amortization expense of intangible assets is as follows:
|
|
|
For the Fiscal Years Ended |
|
|||||||
|
|
|
Nov. 30, 2017 |
|
Nov. 30, 2016 |
|
Nov. 30, 2015 |
|
|||
|
Amortization expense |
|
$ |
203 |
|
$ |
58 |
|
$ |
201 |
|
72
GRIFFIN INDUSTRIAL REALTY, INC.
Notes to Consolidated Financial Statements (Continued)
(dollars in thousands unless otherwise noted, except per share data)
Estimated amortization expense of intangible assets over each of the next five fiscal years is:
|
2018 |
|
$ |
378 |
|
|
2019 |
|
|
378 |
|
|
2020 |
|
|
378 |
|
|
2021 |
|
|
378 |
|
|
2022 |
|
|
104 |
|
Furniture, fixtures and equipment, net reflects accumulated depreciation of $902 and $844 as of November 30, 2017 and November 30, 2016, respectively. Total depreciation expense related to furniture, fixtures and equipment in fiscal 2017, fiscal 2016 and fiscal 2015 was $84, $90 and $86, respectively.
Accounts Payable and Accrued Liabilities
Griffin's accounts payable and accrued liabilities are comprised of the following:
|
|
|
Nov. 30, 2017 |
|
Nov. 30, 2016 |
|
||
|
Accrued construction costs and retainage |
|
$ |
1,894 |
|
$ |
1,252 |
|
|
Accrued salaries, wages and other compensation |
|
|
1,154 |
|
|
725 |
|
|
Accrued interest payable |
|
|
482 |
|
|
390 |
|
|
Trade payables |
|
|
432 |
|
|
573 |
|
|
Accrued lease commissions |
|
|
393 |
|
|
487 |
|
|
Other |
|
|
636 |
|
|
713 |
|
|
Total accounts payable and accrued liabilities |
|
$ |
4,991 |
|
$ |
4,140 |
|
Other Liabilities
Griffin's other liabilities are comprised of the following:
|
|
|
Nov. 30, 2017 |
|
Nov. 30, 2016 |
|
||
|
Deferred compensation plan |
|
$ |
5,005 |
|
$ |
4,334 |
|
|
Prepaid rent from tenants |
|
|
1,041 |
|
|
938 |
|
|
Interest rate swap liabilities |
|
|
845 |
|
|
1,892 |
|
|
Security deposits of tenants |
|
|
583 |
|
|
413 |
|
|
Conditional asset retirement obligations |
|
|
204 |
|
|
288 |
|
|
Land sale deposits |
|
|
195 |
|
|
— |
|
|
Other |
|
|
99 |
|
|
78 |
|
|
Total other liabilities |
|
$ |
7,972 |
|
$ |
7,943 |
|
Supplemental Cash Flow Information
In fiscal 2017, Griffin received $3,535 of cash, after transaction costs, from the fiscal 2016 sale of approximately 29 acres of undeveloped land in Griffin Center (the “Griffin Center Land Sale”). The proceeds from the Griffin Center Land Sale were deposited into escrow at the time the sale closed for the potential purchase of a replacement property in a 1031 Like-Kind Exchange. As a replacement property was not acquired in the time period required under the applicable tax code, the sale proceeds were returned to Griffin (see Note 3).
An increase of $245 in fiscal 2017 (prior to the sale of the remaining shares), a decrease of $993 in fiscal 2016 and an increase of $46 in fiscal 2015 in the fair value of Griffin’s Investment in Centaur Media reflects the mark to market adjustment of this investment and did not affect Griffin’s cash. Accounts payable and accrued liabilities related to additions to real estate assets increased by $642 in fiscal 2017 and decreased by $32 in fiscal 2016.
73
GRIFFIN INDUSTRIAL REALTY, INC.
Notes to Consolidated Financial Statements (Continued)
(dollars in thousands unless otherwise noted, except per share data)
Griffin did not receive any income tax refunds in fiscal 2017, fiscal 2016 or fiscal 2015. Interest payments in fiscal 2017, fiscal 2016 and fiscal 2015 were $5,368, $4,507 and $4,180, respectively, including capitalized interest of $103, $274 and $777 in fiscal 2017, fiscal 2016 and fiscal 2015, respectively.
Savings Plan
Griffin maintains the Griffin Industrial Realty, Inc. 401(k) Savings Plan (the “Griffin Savings Plan”) for its employees, a defined contribution plan whereby Griffin matches 60% of each employee’s contribution, up to a maximum of 5% of base salary. Griffin’s contributions to the Griffin Savings Plan in fiscal 2017, fiscal 2016 and fiscal 2015 were $65, $64 and $60, respectively.
Deferred Compensation Plan
Griffin maintains a non-qualified deferred compensation plan (the “Deferred Compensation Plan”) for certain of its employees who, due to IRC regulations, cannot take full advantage of the Griffin Savings Plan. Griffin’s liability under its Deferred Compensation Plan at November 30, 2017 and 2016 was $5,005 and $4,334, respectively. These amounts are included in other liabilities on Griffin’s consolidated balance sheets. The expense for Griffin’s matching benefit to the Deferred Compensation Plan in fiscal 2017, fiscal 2016 and fiscal 2015 was $11, $7 and $22, respectively.
The Deferred Compensation Plan is unfunded, with benefits to be paid from Griffin’s assets. The liability for the Deferred Compensation Plan reflects the amounts withheld from employees, Griffin’s matching benefit and any gains or losses on participant account balances based on the assumed investment of amounts credited to participants’ accounts in certain mutual funds. Participant balances are tracked and any gain or loss is determined based on the performance of the mutual funds as selected by the participants and included in general and administrative expenses on Griffin’s consolidated statement of operations.
10. Quarterly Results of Operations (Unaudited)
Summarized quarterly financial data are presented below:
|
Fiscal 2017 Quarters |
|
1st |
|
2nd |
|
3rd |
|
4th |
|
Total |
|
|||||
|
Total revenue |
|
$ |
6,979 |
|
$ |
18,087 |
|
$ |
9,954 |
|
$ |
8,864 |
|
$ |
43,884 |
|
|
Operating income (loss) |
|
|
(86) |
|
|
8,671 |
|
|
3,194 |
|
|
843 |
|
|
12,622 |
|
|
Net income (loss) |
|
|
(939) |
|
|
4,727 |
|
|
1,329 |
|
|
(490) |
|
|
4,627 |
|
|
Basic net income (loss) per common share |
|
|
(0.19) |
|
|
0.95 |
|
|
0.27 |
|
|
(0.10) |
|
|
0.92 |
|
|
Diluted net income (loss) per common share |
|
|
(0.19) |
|
|
0.94 |
|
|
0.26 |
|
|
(0.10) |
|
|
0.92 |
|
|
Fiscal 2016 Quarters |
|
1st |
|
2nd |
|
3rd |
|
4th |
|
Total |
|
|||||
|
Total revenue |
|
$ |
6,682 |
|
$ |
6,524 |
|
$ |
7,265 |
|
$ |
10,380 |
|
$ |
30,851 |
|
|
Operating income |
|
|
804 |
|
|
270 |
|
|
1,089 |
|
|
3,464 |
|
|
5,627 |
|
|
Net income (loss) |
|
|
(335) |
|
|
(379) |
|
|
(49) |
|
|
1,339 |
|
|
576 |
|
|
Basic net income (loss) per common share |
|
|
(0.07) |
|
|
(0.07) |
|
|
(0.01) |
|
|
0.26 |
|
|
0.11 |
|
|
Diluted net income (loss) per common share |
|
|
(0.07) |
|
|
(0.07) |
|
|
(0.01) |
|
|
0.26 |
|
|
0.11 |
|
Total revenue in Griffin's fiscal 2017 fourth quarter consolidated statement of operations includes revenue from property sales of $900 from the sale of a land parcel in Bloomfield, Connecticut.
Total revenue in Griffin’s fiscal 2016 fourth quarter consolidated statement of operations includes revenue from property sales of $3,756 from the sale of a land parcel in Bloomfield, Connecticut.
The sum of the four quarters earnings per share data may not equal the annual earnings per share data due to the requirement that each period be calculated separately.
74
GRIFFIN INDUSTRIAL REALTY, INC.
Notes to Consolidated Financial Statements (Continued)
(dollars in thousands unless otherwise noted, except per share data)
11. Commitments and Contingencies
As of November 30, 2017, Griffin had committed purchase obligations of approximately $3,037, principally related to the construction of an approximately 134,000 square foot industrial/warehouse building in Lehigh County, Pennsylvania and the development of other Griffin properties.
On October 18, 2017, Griffin entered into a full building lease (the “220 Tradeport Lease”) for an approximately 234,000 square foot industrial/warehouse building (“220 Tradeport Drive”) to be built in NE Tradeport. The tenant is an investment grade company that intends to use 220 Tradeport Drive for the distribution of automotive parts. The 220 Tradeport Lease, which would commence upon completion of construction of 220 Tradeport Drive, has a term of twelve years and six months with the tenant having several five year renewal options. Provided the tenant meets certain conditions, the tenant has an option (the “Expansion Option”) to cause Griffin to construct an approximately 54,000 square foot addition to 220 Tradeport Drive. If the tenant exercises the Expansion Option, the term of the 220 Tradeport Lease for 220 Tradeport Drive would be extended for at least ten years upon the tenant occupying the additional space. Griffin expects to commence construction of 220 Tradeport Drive in the fiscal 2018 first quarter with completion expected in the second half of fiscal 2018. Griffin expects to spend approximately $17,500 for development of 220 Tradeport Drive, including all related site work, building construction, tenant improvements, leasing expenses and financing costs. Griffin has agreed to terms with State Farm Life Insurance Company (“State Farm”) on a construction to permanent mortgage loan for up to $13,800. The loan would provide financing during the construction period and, upon completion of 220 Tradeport Drive and commencement of rent payments under the 220 Tradeport Lease, would convert to a fifteen year nonrecourse permanent mortgage loan. The interest rate on the loan is 4.51%. During the construction period, only interest payments would be made. Monthly principal payments, which will begin after conversion to a nonrecourse permanent mortgage loan, will be based on a twenty-five year amortization schedule. There is no guarantee that the construction to permanent mortgage loan with State Farm will be completed under its current terms, or at all.
On October 4, 2017, Griffin entered into an agreement to purchase an approximately 22 acre parcel of undeveloped land in Concord, North Carolina (the “Concord Land”) for $2,600 in cash. If the transaction closes, Griffin plans to construct an industrial/warehouse development on the Concord Land, which is located near 215 International. The amount of industrial/warehouse space to be developed there will be based upon findings during due diligence. Closing of this purchase, anticipated to take place in fiscal 2018, is subject to several conditions, including the satisfactory outcome of due diligence and obtaining all governmental approvals for Griffin’s development plans for the Concord Land. There is no guarantee that this transaction will be completed under its current terms, or at all.
On May 5, 2017, Griffin entered into an Option Purchase Agreement (the “EGW Option Agreement”) whereby Griffin granted the buyer an exclusive three month option, in exchange for a nominal fee, to purchase approximately 288 acres of undeveloped land in East Granby and Windsor, Connecticut for approximately $7,800. The buyer may extend the option period for up to three years upon payment of additional option fees. In fiscal 2017, the buyer paid $35 of additional option fees to extend its option period through May 2018. The land subject to the EGW Option Agreement does not have any of the approvals that would be required for the buyer’s planned use of the land, which is to generate solar electricity. A closing on the land sale contemplated by the EGW Option Agreement is subject to several significant contingencies, including the buyer procuring electrical utility supply contracts, approval by the state public utility regulatory authorities and governmental approvals for the planned use of the land. There is no guarantee that the sale of land as contemplated under the EGW Option Agreement will be completed under its current terms, or at all.
On January 25, 2016, Griffin entered into an Option Purchase Agreement (the “Simsbury Option Agreement”) whereby Griffin granted the buyer an exclusive three month option, in exchange for a nominal fee, to purchase approximately 280 acres of undeveloped land in Simsbury, Connecticut for approximately $7,700. The buyer may extend the option period for up to three years upon payment of additional option fees. Through November 30, 2017, the buyer paid $140 of option fees, and subsequent to November 30, 2017, the buyer paid an additional $120 to extend its option period through January 2019. Subsequent to November 30, 2017, the buyer received approval from the state regulatory authority for the buyer’s planned use of the land, which is to generate solar electricity. A closing on the land sale contemplated by the Simsbury Option Agreement is subject to several significant contingencies, including the potential
75
GRIFFIN INDUSTRIAL REALTY, INC.
Notes to Consolidated Financial Statements (Continued)
(dollars in thousands unless otherwise noted, except per share data)
appeal of the approvals recently granted by the state regulatory authority. Griffin expects the decision of the state regulatory authority to be appealed. There is no guarantee that the sale of land as contemplated under the Simsbury Option Agreement will be completed under its current terms, or at all.
From time to time, Griffin is involved, as a defendant, in various litigation matters arising in the ordinary course of business. In the opinion of management, based on the advice of legal counsel, the ultimate liability, if any, with respect to these matters is not expected to be material, individually or in the aggregate, to Griffin's consolidated financial position, results of operations or cash flows.
In accordance with FASB ASC 855, “Subsequent Events,” Griffin has evaluated all events or transactions occurring after November 30, 2017, the balance sheet date, and noted that there have been no such events or transactions which would require recognition or disclosure in the consolidated financial statements as of and for the year ended November 30, 2017, other than the disclosures herein.
On December 18, 2017, the tenant leasing the Florida Farm declared bankruptcy under Chapter 11 of the U.S. Bankruptcy Code (see Note 3). Griffin has yet to determine the impact, if any, this will have on its lease of the Florida Farm, which expires on June 30, 2019.
On December 22, 2017, the Tax Cuts and Jobs Act (“TCJA”) was enacted and became effective for Griffin on January 1, 2018 (see Note 4). The TCJA reduces the U.S. federal corporate statutory income tax rate from 35% to 21%, which is expected to result in a blended fiscal 2018 federal corporate statutory rate for Griffin of approximately 22.2%. The impact of the lower statutory rate applied to Griffin’s deferred tax assets and deferred tax liabilities is expected to be recorded as a discrete item in Griffin’s income tax expense in the fiscal 2018 first quarter. Based on the TCJA, Griffin expects to record income tax expense of between approximately $1,000 and $1,100, due to the re-measurement of its net deferred tax assets on its consolidated balance sheet in the fiscal 2018 first quarter.
On January 11, 2018, Griffin entered into an agreement to purchase an approximately 14 acre parcel of undeveloped land in the Lehigh Valley of Pennsylvania (the “Lehigh Valley Land”) for $3,600 in cash. If the transaction closes, Griffin plans to construct an industrial/warehouse building on the Lehigh Valley Land, the size of which will be based upon findings during due diligence. The closing of this purchase, anticipated to take place in late fiscal 2018 or early fiscal 2019, is subject to several conditions, including the satisfactory outcome of due diligence and obtaining all governmental approvals for Griffin’s development plans for the Lehigh Valley Land. There is no guarantee that this transaction will be completed under its current terms, or at all.
See Note 5 for disclosure of the subsequent event related to refinancing the 2017 People’s Mortgage.
76
Report of Independent Registered Public Accounting Firm
To the Board of Directors and Stockholders
Griffin Industrial Realty, Inc.
We have audited the consolidated financial statements of Griffin Industrial Realty, Inc. and subsidiaries as of November 30, 2017 and 2016, and for each of the three fiscal years in the period ended November 30, 2017, listed in the index appearing under Item 15(a)(1). Our audits also included the financial statement schedules of Griffin Industrial Realty, Inc. listed in Item 15(a)(2). These financial statements and financial statement schedules are the responsibility of the Company's management. Our responsibility is to express an opinion on these financial statements and schedules based on our audits.
We conducted our audits in accordance with the standards of the Public Company Accounting Oversight Board (United States). Those standards require that we plan and perform the audit to obtain reasonable assurance about whether the financial statements are free of material misstatement. An audit includes examining, on a test basis, evidence supporting the amounts and disclosures in the financial statements. An audit also includes assessing the accounting principles used and significant estimates made by management, as well as evaluating the overall financial statement presentation. We believe that our audits provide a reasonable basis for our opinion.
In our opinion, the consolidated financial statements referred to above present fairly, in all material respects, the financial position of Griffin Industrial Realty, Inc. and subsidiaries as of November 30, 2017 and 2016, and the results of their operations and their cash flows for each of the three fiscal years in the period ended November 30, 2017, in conformity with U.S. generally accepted accounting principles. Also, in our opinion, the related financial statement schedules, when considered in relation to the basic consolidated financial statements taken as a whole, present fairly in all material respects the information set forth therein.
We have also audited, in accordance with the standards of the Public Company Accounting Oversight Board (United States), Griffin Industrial Realty, Inc. and subsidiaries’ internal control over financial reporting as of November 30, 2017, based on criteria established in Internal Control — Integrated Framework issued by the Committee of Sponsoring Organizations of the Treadway Commission in 2013, and our report dated February 8, 2018, expressed an unqualified opinion on the effectiveness of Griffin Industrial Realty, Inc.’s internal control over financial reporting.

New Haven, Connecticut
February 8, 2018
77
ITEM 9. CHANGES IN AND DISAGREEMENTS WITH ACCOUNTANTS ON ACCOUNTING AND FINANCIAL DISCLOSURE.
None.
ITEM 9A. CONTROLS AND PROCEDURES.
Changes in Internal Control Over Financial Reporting: There have been no changes in Griffin Industrial Realty, Inc.’s (“Griffin” or the “Company”) internal control over financial reporting that occurred during the Company’s most recent fiscal quarter ended November 30, 2017 that have materially affected, or are reasonably likely to materially affect, the Company’s internal control over financial reporting.
Disclosure Controls and Procedures: The Company maintains disclosure controls and procedures designed to ensure that the information the Company must disclose in its filings with the Securities and Exchange Commission (“SEC”) is recorded, processed, summarized and reported within the time periods specified in the SEC’s rules and forms, and such information is accumulated and communicated to management, as appropriate, to allow timely decisions regarding required disclosure. The Company’s principal executive officer and principal financial officer have reviewed and evaluated, with the participation of the Company’s management, the Company’s disclosure controls and procedures as defined in Rules 13a‑15(e) and 15d‑15(e) under the Securities Exchange Act of 1934, as amended (the “Exchange Act”) as of the end of the period covered by this Annual Report (the “Evaluation Date”). Based on such evaluation, such officers have concluded that, as of the Evaluation Date, the Company’s disclosure controls and procedures are effective.
Management’s Report on Internal Control Over Financial Reporting: Management of the Company is responsible for establishing and maintaining adequate internal control over financial reporting, as such term is defined in Exchange Act Rule 13a‑15(f). Management of the Company, including its chief executive officer and chief financial officer, has assessed the effectiveness of its internal control over financial reporting as of November 30, 2017, based on the criteria established in the “2013 Internal Control—Integrated Framework” issued by the Committee of Sponsoring Organizations of the Treadway Commission (“COSO”) in 2013. Based on its assessment and those criteria, management of the Company has concluded that, as of November 30, 2017, the Company’s internal control over financial reporting was effective.
The Company’s independent registered public accounting firm, RSM US LLP, has audited the effectiveness of the Company’s internal control over financial reporting as of November 30, 2017, as stated in their attestation report appearing below.
Because of its inherent limitations, internal control over financial reporting may not prevent or detect misstatements. Also, projections of any evaluation of the effectiveness to future periods are subject to the risk that the controls may become inadequate because of changes in conditions, or that the degree of compliance with the policies and procedures may deteriorate.
78
Report of Independent Registered Public Accounting Firm
To the Board of Directors and Stockholders
Griffin Industrial Realty, Inc.
We have audited Griffin Industrial Realty, Inc. and subsidiaries’ (the Company) internal control over financial reporting as of November 30, 2017, based on criteria established in Internal Control — Integrated Framework issued by the Committee of Sponsoring Organizations of the Treadway Commission in 2013. The Company’s management is responsible for maintaining effective internal control over financial reporting and for its assessment of the effectiveness of internal control over financial reporting included in the accompanying Management’s Report on Internal Control Over Financial Reporting appearing under Item 9A. Our responsibility is to express an opinion on the Company's internal control over financial reporting based on our audit.
We conducted our audit in accordance with the standards of the Public Company Accounting Oversight Board (United States). Those standards require that we plan and perform the audit to obtain reasonable assurance about whether effective internal control over financial reporting was maintained in all material respects. Our audit included obtaining an understanding of internal control over financial reporting, assessing the risk that a material weakness exists, and testing and evaluating the design and operating effectiveness of internal control based on the assessed risk. Our audit also included performing such other procedures as we considered necessary in the circumstances. We believe that our audit provides a reasonable basis for our opinion.
A company's internal control over financial reporting is a process designed to provide reasonable assurance regarding the reliability of financial reporting and the preparation of financial statements for external purposes in accordance with generally accepted accounting principles. A company's internal control over financial reporting includes those policies and procedures that (a) pertain to the maintenance of records that, in reasonable detail, accurately and fairly reflect the transactions and dispositions of the assets of the company; (b) provide reasonable assurance that transactions are recorded as necessary to permit preparation of financial statements in accordance with generally accepted accounting principles, and that receipts and expenditures of the company are being made only in accordance with authorizations of management and directors of the company; and (c) provide reasonable assurance regarding prevention or timely detection of unauthorized acquisition, use, or disposition of the company's assets that could have a material effect on the financial statements.
Because of its inherent limitations, internal control over financial reporting may not prevent or detect misstatements. Also, projections of any evaluation of effectiveness to future periods are subject to the risk that controls may become inadequate because of changes in conditions, or that the degree of compliance with the policies or procedures may deteriorate.
In our opinion, Griffin Industrial Realty, Inc. and subsidiaries maintained, in all material respects, effective internal control over financial reporting as of November 30, 2017, based on criteria established in Internal Control — Integrated Framework issued by the Committee of Sponsoring Organizations of the Treadway Commission in 2013.
We have also audited, in accordance with the standards of the Public Company Accounting Oversight Board (United States), the consolidated financial statements of Griffin Industrial Realty, Inc. and subsidiaries as of November 30, 2017 and 2016, and for each of the three fiscal years in the period ended November 30, 2017, listed in the index appearing under Item 15(a)(1) and our report dated February 8, 2018, expressed an unqualified opinion.
New Haven, Connecticut
None.
79
ITEM 10. DIRECTORS AND EXECUTIVE OFFICERS AND CORPORATE GOVERNANCE.
The following table sets forth the information called for in this Item 10:
|
Name |
|
Age |
|
Position |
|
|
Frederick M. Danziger |
|
77 |
|
Executive Chairman of the Board of Directors |
|
|
Michael S. Gamzon |
|
48 |
|
Director and President and Chief Executive Officer |
|
|
David R. Bechtel |
|
50 |
|
Director |
|
|
Edgar M. Cullman, Jr. |
|
71 |
|
Director |
|
|
Thomas C. Israel |
|
73 |
|
Director |
|
|
Jonathan P. May |
|
51 |
|
Director |
|
|
Albert H. Small, Jr. |
|
61 |
|
Director |
|
|
Scott Bosco |
|
51 |
|
Vice President of Construction, Griffin Industrial, LLC |
|
|
Anthony J. Galici |
|
60 |
|
Vice President, Chief Financial Officer and Secretary |
|
|
Thomas M. Lescalleet |
|
55 |
|
Senior Vice President, Griffin Industrial, LLC |
|
Griffin’s directors are each elected for a term of one year.
Frederick M. Danziger has been the Chairman of the Board of Directors of Griffin since May 2012 and has served in the Executive Chairman capacity since January 2016. Mr. Danziger was the Chief Executive Officer of Griffin from April 1997 to January 2016; was a Director and the President of Griffin from April 1997 to May 2012; and was a Director of Culbro Corporation (“Culbro’) from 1975 until 1997. He was previously involved in the real estate operations of Griffin in the early 1980s. Mr. Danziger was Of Counsel to the law firm of Latham & Watkins LLP from 1995 until 1997. From 1974 until 1995, Mr. Danziger was a Member of the law firm of Mudge Rose Guthrie Alexander & Ferdon. Mr. Danziger also is a Director of Monro Muffler Brake, Inc. and Bloomingdale Properties, Inc. Mr. Danziger is the father‑in‑law of Michael S. Gamzon and the brother-in-law of Mr. Edgar M. Cullman, Jr. We believe that Mr. Danziger’s background as a lawyer and his extensive experience and knowledge with respect to real estate and real estate financing provides a unique perspective to the Board.
Michael S. Gamzon is a Director and the President and Chief Executive Officer of Griffin. Mr. Gamzon was appointed as a Director on January 19, 2016 to replace Mr. David M. Danziger, who resigned from the Board effective on that date. Mr. Gamzon succeeded Mr. Frederick M. Danziger as Griffin’s Chief Executive Officer effective January 1, 2016 and has been President of Griffin since May 2012. Mr. Gamzon was the Chief Operating Officer of Griffin from September 2010 to January 2016; was Executive Vice President from September 2010 to May 2012; and was a Vice President of Griffin from January 2008 through August 2010. Mr. Gamzon was an investment analyst with Alson Capital Partners, LLC from April 2005 until January 2008 and an investment analyst with Cobalt Capital Management, LLC from March 2002 until March 2005. Mr. Gamzon is the son‑in‑law of Frederick M. Danziger. We believe that Mr. Gamzon’s experience and knowledge, with respect to real estate activities in his capacity as an executive of Griffin, including leading Griffin’s efforts in expanding Griffin’s operations outside of Connecticut, provides a unique perspective to the Board.
David R. Bechtel has been a Director of Griffin since May 2016. Mr. Bechtel has been a principal of Barrow Street Holdings LLC since 2012; founder and managing member of Outpost Capital Management LLC since 2001; and founder and manager of GP Management LLC since 2011. Mr. Bechtel has many years of general business experience and expertise as a managing member, principal, and CFO of financial service and natural resource companies.
Edgar M. Cullman, Jr. has been a Director of Griffin since May 2015. Mr. Cullman, Jr. has been a managing member of Culbro LLC, a private equity investment firm, since 2005 and was previously the President and Chief Executive Officer of General Cigar Holdings from 1996 through April 2005. Mr. Cullman, Jr. is the brother‑in‑law of Frederick M. Danziger. Mr. Cullman, Jr. has many years of general business experience and expertise as an executive of a public company. Mr. Cullman, Jr. is familiar with Griffin’s real estate business from his experience as President and Chief Executive Officer of Culbro when Griffin’s real estate operations were part of Culbro prior to the spinoff of Griffin from Culbro in 1997.
80
Thomas C. Israel has been a Director of Griffin since July 2000. Mr. Israel was a Director of Culbro from 1989 until 1997 and a Director of General Cigar Holdings, Inc. from December 1996 until May 2000. Since 1966, Mr. Israel has been Chairman of A.C. Israel Enterprises, Inc., an investment company. Mr. Israel has significant experience as a member of Griffin’s Board of Directors, many years of general business experience, finance experience, and expertise as an executive and board member of public companies.
Jonathan P. May has been a Director of Griffin since September 2012. Mr. May is the founder and has been the co-managing partner of Floresta Ventures, LLC since March 2016, the Executive Director of Natural Capital Partners (formerly known as The CarbonNeutral Company) a private company that is a leading provider of carbon reduction programs for corporations since September 2015, and the Chief Operating Officer and Chief Financial Officer and a Director of The CarbonNeutral Company from 2008 to September 2015. Mr. May was the founder and managing Director of Catalytic Capital, LLC from 2004 to 2008. Mr. May has significant general business experience, finance experience, and expertise as an executive.
Albert H. Small, Jr. has been a Director of Griffin since January 2009. Mr. Small, Jr. was President of Renaissance Housing Corporation, a private company involved in residential real estate development from 1984 through March 2005, and President of WCI Communities Mid‑Atlantic Division from March 2005 through March 2008. Since March 2008, Mr. Small, Jr. has been active in the development and management of several commercial and office developments in Washington D.C. Mr. Small, Jr. has significant experience in real estate development and management that gives him unique insights into Griffin’s challenges, opportunities and operations.
Scott Bosco has been the Vice President of Construction of Griffin Industrial, LLC, a subsidiary of Griffin, since July 2005.
Anthony J. Galici has been the Vice President, Chief Financial Officer and Secretary of Griffin since April 1997.
Thomas M. Lescalleet has been the Senior Vice President of Griffin Industrial, LLC, a subsidiary of Griffin, since March 2002.
Code of Ethics
Griffin’s board of directors has adopted a Code of Ethics that applies to all of its directors, officers and employees, which is available on its website at www.griffinindustrial.com in the “Investors” section under “Corporate Governance.” Griffin intends to satisfy the disclosure requirement under Item 5.05 of Form 8-K regarding amendment to, or waiver from, a provision of our Code of Ethics, as well as Nasdaq’s requirement to disclose waivers with respect to directors and executive officers, by posting such information on its website at the address and location specified above.
Audit Committee
Griffin’s Audit Committee consists of David R. Bechtel, Thomas C. Israel and Jonathan P. May with Mr. Israel serving as Chairman. The Audit Committee meets the Nasdaq composition requirements, including the requirements regarding financial literacy. The Board has determined that each member of the Audit Committee is independent under the listing standards of Nasdaq and the rules of the SEC regarding audit committee membership. In addition, Mr. Israel qualifies as a financially sophisticated Audit Committee member under the Nasdaq rules based on his employment experience in finance. None of the members of the Audit Committee are considered a financial expert as defined by Item 407(d)(5) of Regulation S‑K of the Securities and Exchange Act of 1934 (an “audit committee financial expert”). Griffin does not have an audit committee financial expert because it believes the members of its Audit Committee have sufficient financial expertise and experience to provide effective oversight of Griffin’s accounting and financial reporting processes and the audits of Griffin’s financial statements in accordance with generally accepted accounting principles and Nasdaq rules. In addition, since January 31, 2012, the Audit Committee has engaged directly a former audit partner in a public accounting firm who is a certified public accountant with extensive experience in auditing the financial statements of public and private companies. The Audit Committee had previously engaged the public accounting firm of which he was a partner as an advisor to the Audit Committee. The Audit Committee believes that this engagement provides it with additional expertise comparable to what would be provided by an audit committee financial expert.
81
The Audit Committee approves all auditing and non‑auditing services, reviews audit reports and the scope of audit by Griffin’s independent registered public accountants and related matters pertaining to the preparation and examination of Griffin’s financial statements. From time to time, the Audit Committee makes recommendations to the Board of Directors with respect to the foregoing matters. The Audit Committee held four meetings in fiscal 2017.
Board of Directors’ Role in Oversight of Risk
Management is responsible for Griffin’s day‑to‑day risk management activities, and the Board’s role is to engage in informed risk oversight. In fulfilling this oversight role, Griffin’s Board of Directors focuses on understanding the nature of Griffin’s enterprise risks, including operations and strategic direction, as well as the adequacy of Griffin’s overall risk management system. There are a number of ways the Board performs this function, including the following:
|
· |
at its regularly scheduled meetings, the Board receives management updates on Griffin’s business operations, financial results and strategy, and discusses risks related to its businesses; |
|
· |
the Audit Committee assists the Board in its oversight of risk management by discussing with management, particularly the Chief Executive Officer and the Chief Financial Officer, Griffin’s major risk exposures and the steps management has taken to monitor and control such exposures; and |
|
· |
through management updates and committee reports, the Board monitors Griffin’s risk management activities, including the risk management process, risks relating to Griffin’s compensation programs, and financial and operational risks being managed by Griffin. |
The Board does not believe that its role in the oversight of Griffin’s risk affects the Board’s leadership structure.
Compensation Risk
The Compensation Committee reviews compensation policies and practices affecting employees in addition to those applicable to executive officers. The Compensation Committee has determined that it is not reasonably likely that Griffin’s compensation policies and practices for its employees would have a material adverse effect on Griffin.
Nominating Committee
Griffin’s Nominating Committee consists of David R. Bechtel, Thomas C. Israel, Jonathan P. May and Albert H. Small, Jr. with Mr. May serving as Chairman. All four members of the Nominating Committee are independent directors. The Nominating Committee reviews candidates for appointment to the Griffin Board of Directors. In searching for qualified director candidates, the Board may solicit current directors and ask them to pursue their own business contacts for the names of potentially qualified candidates. The Nominating Committee may consult with outside advisors or retain search firms to assist in the search for qualified candidates. The Nominating Committee will also consider suggestions from stockholders for nominees for election as directors. The Nominating Committee does not have a policy on the consideration of board nominees recommended by stockholders. The Board believes such a policy is unnecessary, as the Nominating Committee will consider a nominee based on his or her qualifications, regardless of whether the nominee is recommended by stockholders. Any stockholder who wishes to recommend a candidate to the Nominating Committee for consideration as a director nominee should submit the recommendation in writing to the Secretary of Griffin in accordance with the procedures in Griffin’s Amended and Restated By‑Laws for stockholder nominations of directors to permit the Nominating Committee to complete its review in a timely fashion. The Nominating Committee operates under a written charter adopted by the Board of Directors in 2014, which is publicly available in the “Corporate Governance” section of the “Investors” section of Griffin’s website located at www.griffinindustrial.com. The Nominating Committee held one meeting in fiscal 2017.
Board Diversity; Selection and Evaluation of Director Candidates
The Board does not have a formal policy with respect to Board nominee diversity. There are no specific minimum qualifications that the Nominating Committee believes must be met for a person to serve on the Board. When identifying nominees for director, the Nominating Committee focuses on relevant subject matter expertise, depth of knowledge in key areas that are important to Griffin, and the background, perspective and experience of the nominee. The Nominating Committee is charged with building and maintaining a board that has an ideal mix of talent and experience to achieve Griffin’s business objectives in the current environment.
82
Board Leadership Structure
The Board believes that there is no single, generally accepted approach to providing Board leadership, and that each of the possible leadership structures for a board must be considered in the context of the individuals involved and the specific circumstances facing a company at any given time. Accordingly, the optimal board leadership structure for Griffin may vary as circumstances change. Griffin’s Board was led by a Non‑Executive Chairman through 2011, as separate individuals held the positions of Chairman of the Board and Chief Executive Officer, and the Chairman of the Board was not an employee. In May 2012, the Board appointed Mr. Frederick M. Danziger as Chairman of the Board. Mr. Danziger had been Chief Executive Officer since 1997. In making that appointment, the Board concluded that Griffin and its stockholders were best served by having Mr. Danziger serve as Chairman of the Board and Chief Executive Officer. The Board believed that Mr. Danziger’s combined role as Chairman of the Board and Chief Executive Officer promoted unified leadership and a single, clear focus and direction for management to execute Griffin’s strategy and business plans. Effective January 1, 2016, the positions of Chairman of the Board and Chief Executive Officer have been held by separate individuals, Mr. Frederick M. Danziger and Mr. Michael S. Gamzon, respectively. The Board determined that Mr. Danziger should continue to serve as Executive Chairman to continue to provide Board leadership continuity.
Communication with the Board of Directors or Nominating Committee
Stockholders who wish to communicate with the Board of Directors or the Nominating Committee should address their communications to Jonathan P. May, Chairman of the Nominating Committee, via first class mail, at Griffin Industrial Realty, Inc., 641 Lexington Avenue, 26th Floor, New York, New York, 10022. Such communication will be distributed to the specific director(s) requested by the stockholders, or if generally to the Board of Directors, to other members of the Board of Directors as may be appropriate depending on the material outlined in the stockholder communication.
Section 16(a) Beneficial Ownership Reporting Compliance
Section 16(a) of the Securities Exchange Act requires Griffin’s officers and directors, and persons who own more than ten percent of its common stock, to file reports of ownership and changes in ownership with the Securities and Exchange Commission. Such persons are required by regulation to furnish Griffin with copies of all Section 16(a) forms they file. Based on its involvement in the preparation of certain such forms, and a review of copies of other such forms received by it, Griffin believes that with respect to fiscal 2017, all such Section 16(a) filing requirements were satisfied.
ITEM 11. EXECUTIVE COMPENSATION
COMPENSATION DISCUSSION AND ANALYSIS
This Compensation Discussion and Analysis describes the material elements of compensation awarded to, earned by, or paid to each of Griffin’s named executive officers (the “Named Executive Officers”) during the last completed fiscal year. The Named Executive Officers for the fiscal year ended November 30, 2017 were as follows:
|
Frederick M. Danziger |
|
Executive Chairman of the Board (“Executive Chairman”) of Griffin |
|
Michael S. Gamzon |
|
Director, President and Chief Executive Officer (“CEO”) of Griffin |
|
Anthony J. Galici |
|
Vice President, Chief Financial Officer and Secretary of Griffin |
|
Thomas M. Lescalleet |
|
Senior Vice President of Griffin Industrial, LLC |
|
Scott Bosco |
|
Vice President of Construction, Griffin Industrial, LLC |
Compensation Philosophy and Overview
Griffin’s compensation programs are designed to attract, motivate and retain the management talent that Griffin believes is necessary to achieve its financial and strategic goals. Griffin’s Compensation Committee strives to pay for performance by rewarding each of its Named Executive Officers for team results and their individual contributions to Griffin’s success. In this way, Griffin believes that the interests of its executives align with the interests of its stockholders.
83
Design and Implementation
With these objectives in mind, Griffin’s Compensation Committee has built an executive compensation program that consists of three principal elements:
|
1. |
Base Salary |
|
2. |
Annual Incentive Compensation Programs |
|
3. |
Long‑Term Incentive Program |
Griffin also contributes to a 401(k) savings plan and a non‑qualified deferred compensation plan on behalf of its Named Executive Officers. These contributions, however, comprise a relatively minor portion of Griffin’s Named Executive Officers’ compensation packages. Griffin’s Compensation Committee reviews the Named Executive Officers’ compensation packages each year and makes decisions on each component thereof in order to better align with its compensation philosophy.
Elements of Compensation
Base Salary
Griffin pays base salaries to its Named Executive Officers in order to provide a consistent, minimum level of pay that sustained individual performance warrants. Griffin also believes that a competitive annual base salary is important to attract and retain an appropriate caliber of talent for each position over time.
The annual base salaries of Griffin’s Named Executive Officers are determined by the Executive Chairman and the CEO (except with regard to their salaries) and approved annually by the Compensation Committee. The annual base salaries of the Executive Chairman and the CEO are determined by the Compensation Committee. All salary decisions are based on each Named Executive Officer’s level of responsibility, experience and recent and past performance, as determined by the Executive Chairman, the CEO and the Compensation Committee, as applicable. Griffin does not benchmark its base salaries in any way, nor does Griffin employ the services of a compensation consultant.
Annual Incentive Compensation Programs
Griffin’s annual incentive programs are designed to recognize short‑term performance against established annual performance goals, as explained below. These performance goals and target amounts for fiscal 2017 were developed by the Executive Chairman and the CEO and approved or modified, as necessary, by the Compensation Committee. Additionally, the Compensation Committee retains the discretion to adjust any awards made to Griffin’s executives, including making awards in the absence of the attainment of any of the performance goals under Griffin’s annual incentive compensation plans. Griffin makes annual incentive payments, if any, in the year following the year in which they are earned.
84
Griffin Incentive Plan
Under the Griffin Industrial Realty, Inc. Incentive Compensation Plan for fiscal year 2017 (the “Griffin Incentive Plan”), incentive compensation was awarded based on certain defined components as described below:
|
Incentive Compensation Component |
Incentive Compensation Pool Eligibility |
|
(i)Achieving Adjusted Funds from Operations (“FFO”) targets (as defined in the Griffin Incentive Plan). Target FFO reflects operating income excluding revenue and costs from property sales, depreciation and amortization expense, incentive compensation expense, noncash rental revenue, certain noncash general and administrative expenses (stock option expense, expenses related to the non-qualified deferred compensation plan, write-off of debt issuance costs and write-offs of certain project costs), acquisition expenses and operating income related to building acquisitions during the fiscal year. |
$125,000 to $562,500 of incentive compensation will be accrued into this incentive compensation pool if FFO is between 90% and 105% of the FFO target, which equaled $12,000,000. For every 1% below the FFO target, the incentive compensation under this component will decrease by 7.5% from the target component bonus of $500,000. For every 1% above the FFO target, the incentive compensation under this component will increase by 2.5% from the target component bonus, with a maximum component bonus of $562,500. |
|
(ii)Property Sales (as defined in the Griffin Incentive Plan) |
Property sales are segregated into three groups: 1) Property sales where Griffin has done subdivision work, invested in infrastructure or other development activities to enable the property to be sold (excluding property sales that would be in Group 3 below). 10% of the pretax gain from property sales in this group shall be accrued into this incentive compensation pool. 2) Property sales of land where no improvements have been made or no development activities have taken place (excluding property sales that would be in Group 3 below). 5% of the pretax gain from property sales in this group shall be accrued into this incentive compensation pool. 3) Large property sales (“Group 3 Property Sales”). A portion of gain from such large property sales as determined by Griffin senior management and the Compensation Committee. A maximum of $250,000 in total of incentive compensation for Group 1 and Group 2 property sales may be accrued into this pool; however, no more than $100,000 of incentive compensation may be accrued into this pool from any one transaction. Incentive compensation for Group 3 Property Sales are not subject to the $250,000 cap that applies to the incentive compensation for Group 1 and Group 2 property sales. |
|
(iii)Build-to-Suit Projects |
|
|
a.for build-to-suit projects in Connecticut completed in fiscal 2017 |
10% of the incremental net present value created, as defined in the Griffin Incentive Plan, shall be accrued into this incentive compensation pool with a maximum of $125,000 of incentive compensation that may be accrued under this component. |
|
b.for build-to-suit projects outside Connecticut completed in fiscal 2017 |
10% of the incremental net present value created, as defined in the Griffin Incentive Plan, shall be accrued into this incentive compensation pool with a maximum of $125,000 of incentive compensation that may be accrued under this component. |
85
|
(iv)Buildings Built on Speculation |
|
|
a.for buildings built on speculation in Connecticut |
10% of the incremental net present value created, as defined in the Griffin Incentive Plan, shall be accrued into this incentive compensation pool with a maximum of $125,000 of incentive compensation that may accrued under this component. |
|
b.for buildings built on speculation outside Connecticut |
10% of the incremental net present value created, as defined in the Griffin Incentive Plan, shall be accrued into this incentive compensation pool with a maximum of $125,000 of incentive compensation that may be accrued under this component. |
|
(v)Leasing |
|
|
a.leasing of vacant space in Connecticut |
4% of the net present value related to new leases, as defined in the Griffin Incentive Plan, shall be accrued into this incentive compensation pool with a maximum of $150,000 of incentive compensation that may be accrued under this component. |
|
b.lease renewal or extension |
2.5% of the net present value related to lease renewals or extensions, shall be accrued into this incentive compensation pool as defined in the Griffin Incentive Plan, with a maximum of $75,000 of incentive compensation that may be accrued under this component. |
|
(vi)Acquisitions (as defined in the Griffin Incentive Plan) |
10% of the incremental net present value created, as defined in the Griffin Incentive Plan, shall be accrued into this incentive compensation pool with a maximum of $150,000 of incentive compensation that may be accrued under this component. |
Each Named Executive Officer is entitled to a specific percentage of each incentive compensation pool under the Griffin Incentive Plan based upon their responsibilities as determined by senior management and approved by the Compensation Committee.
Griffin Incentive Plan Results
The foregoing objectives are designed to reward management for increasing Griffin’s operating cash flow and increase in value of Griffin’s real estate assets. Over the past three years, achievement of the components of the Griffin Incentive Plan has been as follows:
|
Incentive Plan Component |
|
Fiscal 2017 |
|
Fiscal 2016 |
|
Fiscal 2015 |
|
|
Adjusted Funds From Operations |
|
Achieved |
|
Achieved |
|
Achieved |
|
|
Profit from property sales |
|
Achieved |
|
Achieved |
|
Achieved |
|
|
Value generated from build-to-suit projects |
|
Not Achieved |
|
Not Achieved |
|
Not Achieved |
|
|
Value generated from buildings built on speculation |
|
Not Achieved |
|
Achieved |
|
Achieved |
|
|
Leasing |
|
Achieved |
|
Achieved |
|
Achieved |
|
|
Acquisitions |
|
Achieved |
|
Not Applicable |
|
Not Applicable |
|
Amounts earned under each objective are accrued into the Griffin Incentive Plan up to a maximum incentive compensation amount, which in fiscal 2017 was $1,687,500 (excluding any amount related to Group 3 Property Sales for which there was no maximum). The maximum compensation amounts and amounts accrued under each objective for fiscal 2017, based on the level of achievement of each incentive plan component for Griffin is shown in the following table. The amounts in the table below reflect performance against each incentive plan component, calculated pursuant to the formulas described above, and Griffin’s Compensation Committee did not exercise any discretion to modify bonuses from the formulaic results under each incentive plan component (except with respect to Group 3 Property Sales, for which there was no specific formula).
86
Griffin Incentive Compensation Plan
|
|
|
|
|
|
|
|
|
|
|
|
|
|
Maximum |
|
Amount Accrued |
|
||
|
|
|
|
Compensation |
|
Based on Level of |
|
||
|
Incentive Plan Component |
|
Amount |
|
Achievement |
|
|||
|
(i) |
Adjusted Funds from Operations |
|
$ |
562,500 |
|
$ |
537,604 |
|
|
(ii) |
Property Sales |
|
|
|
|
|
|
|
|
|
a. Group 1 and 2 Property Sales |
|
|
250,000 |
(1) |
|
117,857 |
|
|
|
b. Group 3 Property Sales |
|
|
— |
(2) |
|
200,000 |
|
|
(iii) |
Build-to-Suit Projects |
|
|
|
|
|
|
|
|
|
a. Connecticut Properties |
|
|
125,000 |
|
|
— |
|
|
|
b. Non-CT Properties |
|
|
125,000 |
|
|
— |
|
|
(iv) |
Buildings Built on Speculation |
|
|
|
|
|
|
|
|
|
a. Connecticut Properties |
|
|
125,000 |
|
|
— |
|
|
|
b. Non-CT Properties |
|
|
125,000 |
|
|
— |
|
|
(v) |
Leasing |
|
|
|
|
|
|
|
|
|
a. Leasing of Vacant Space |
|
|
150,000 |
|
|
105,714 |
|
|
|
b. Lease Renewal or Extension |
|
|
75,000 |
|
|
75,000 |
|
|
(vi) |
Acquisitions |
|
|
150,000 |
|
|
138,048 |
|
|
|
|
|
$ |
1,687,500 |
|
$ |
1,174,223 |
|
|
(1) |
Amount reflects the aggregate maximum compensation amount with respect to Group 1 and Group 2 property sales. |
|
(2) |
There is no maximum compensation amount for purposes of Group 3 Property Sales. |
Long‑Term Incentive Program—Equity Awards
Griffin believes that equity ownership in Griffin is important to provide its Named Executive Officers with long‑term incentives to build value for Griffin’s stockholders. In addition, the equity program is designed to attract and retain the executive management team. The Griffin equity program consists entirely of stock option awards. Stock options have value only if the stock price increases over time and, therefore, provide executives with an incentive to build Griffin’s value. This characteristic ensures that the Named Executive Officers may have a meaningful portion of their compensation tied to future stock price increases. If Griffin’s stock price increases, stock options have the potential to provide high returns to its executives, thus helping Griffin to attract and retain management. However, the realizable value of the stock options can fall to zero if the stock price is lower than the exercise price established on the date of grant.
Stock option awards to Named Executive Officers are entirely discretionary. The Executive Chairman and the CEO recommend whether and how many stock options should be awarded to the other Named Executive Officers or others, and the Compensation Committee approves or, if necessary, modifies their recommendations. The Compensation Committee solely determines whether and how many stock options should be awarded to the Executive Chairman and the CEO. In making stock option award determinations, the Executive Chairman and the CEO and the Compensation Committee consider the prior contribution of participants and their expected future contributions to the growth of Griffin. In fiscal 2017, no stock options were awarded to any of the Named Executive Officers.
The Griffin Industrial Realty, Inc. 2009 Stock Option Plan (the “2009 Stock Option Plan”) makes available options to purchase 386,926 shares of Griffin common stock, plus any additional shares subject to the forfeited options under Griffin’s prior stock option plan. The Compensation Committee of Griffin’s Board of Directors or, with respect to awards to non‑employee directors, the Board of Directors, administers the 2009 Stock Option Plan. Options granted under the 2009 Stock Option Plan may be either incentive stock options or non‑qualified stock options issued at the fair market value of a share of common stock on the date the award is approved by Griffin’s Compensation Committee. Vesting of all of Griffin’s previously issued stock options is solely based upon service requirements and does not contain market or performance conditions.
87
Stock options granted expire no later than ten years from the grant date. In accordance with the 2009 Stock Option Plan, stock options granted to non‑employee directors upon their initial election to the board of directors are fully exercisable immediately upon the date of the option grant. Stock options granted to non‑employee directors upon their reelection to the board of directors vest on the second anniversary from the date of grant. Stock options granted to employees vest in equal installments on the third, fourth and fifth anniversaries from the date of grant.
Of the shares of common stock reserved for issuance under the 2009 Stock Option Plan, as of November 30, 2017, 254,661 shares were subject to outstanding options and 159,318 shares were available for future awards (which includes certain shares that again became available following the forfeiture of outstanding options). In addition to options outstanding under the 2009 Stock Option Plan, as of November 30, 2017, 79,101 shares remain subject to outstanding options granted under Griffin’s prior stock option plan. For more information on stock options, see the Summary Compensation Table, the Grants of Plan‑Based Awards Table, the Outstanding Equity Awards Table, and the Equity Compensation Plan Information Table and their footnotes.
Perquisites and Other Benefits
Griffin’s Named Executive Officers are eligible for the same health and welfare programs and benefits as the rest of its employees. In addition, Griffin’s Vice President, Chief Financial Officer and Secretary receives an automobile allowance of $8,000 per year and Griffin Industrial, LLC’s Senior Vice President receives a medical insurance allowance of $3,300 per year.
Griffin’s Named Executive Officers are entitled to participate in and receive employer contributions to Griffin’s 401(k) Savings Plan. In addition, Griffin has established a non‑qualified deferred compensation plan (the “Deferred Compensation Plan”) that allows eligible participants, including the Named Executive Officers, to defer portions of their annual base salary, as well as receive employer matching contributions with respect to deferrals, that would exceed IRS limits under the Griffin 401(k) Savings Plan. For more information on employer contributions to the Griffin 401(k) Savings Plan and the Deferred Compensation Plan, see the Summary Compensation Table and its footnotes.
Analysis
Base Salary
The following table presents the base salaries for Griffin’s Named Executive Officers in 2017 and the percentage increase over their 2016 base salaries:
|
|
|
Annual Salary |
|
% Increase |
|
|
|
Mr. Danziger |
|
$ |
350,000 |
|
— |
% |
|
Mr. Gamzon |
|
$ |
510,000 |
|
2 |
% |
|
Mr. Galici |
|
$ |
302,000 |
|
2 |
% |
|
Mr. Lescalleet |
|
$ |
264,198 |
|
2 |
% |
|
Mr. Bosco |
|
$ |
171,666 |
|
2 |
% |
Annual Incentive Compensation Program
The Griffin Incentive Plan for 2017 was designed to reward Griffin’s employees, including Griffin’s Named Executive Officers, based on the results of Griffin’s operations, consistent with Griffin’s goal to award for performance through team results. Each Named Executive Officer is entitled to a specific percentage of each incentive compensation pool under the Griffin Incentive Plan as described above. The amounts earned by Griffin’s employees under the incentive compensation pools of the Griffin Incentive Plan may, however, be adjusted at the discretion of the Compensation Committee.
As a result of the achievement of certain of the incentive plan components noted above, and in accordance with the Griffin Incentive Plan, the total incentive compensation accrued for fiscal 2017 was $1,174,223, which included $200,000 added to the Group 3 Property Sales incentive compensation pool for a large property sale.
The following table presents the total annual incentive payments made to the Named Executive Officers for fiscal 2017, which consisted solely of amounts of annual incentive compensation awarded under the Griffin Incentive
88
Plan (allocated as described above). No discretionary payments outside of the Griffin Incentive Plan were awarded to the Named Executive Officers in fiscal 2017:
|
|
|
Incentive Plan |
|
|
Discretionary |
|
Total Annual Incentive |
|
||
|
|
|
Payments |
|
|
Bonus Payments |
|
Payments |
|
||
|
Mr. Danziger |
|
$ |
77,600 |
|
$ |
— |
|
$ |
77,600 |
|
|
Mr. Gamzon |
|
$ |
174,863 |
|
$ |
— |
|
$ |
174,863 |
|
|
Mr. Galici |
|
$ |
84,502 |
|
$ |
— |
|
$ |
84,502 |
|
|
Mr. Lescalleet |
|
$ |
217,136 |
|
$ |
— |
|
$ |
217,136 |
|
|
Mr. Bosco |
|
$ |
97,102 |
|
$ |
— |
|
$ |
97,102 |
|
The Compensation Committee did not exercise its discretion to alter the amounts earned by each Named Executive Officer from their respective allocation of incentive compensation accruals under the Griffin Incentive Plan. The Named Executive Officers received no additional discretionary allocation from the Compensation Committee.
Long-Term Incentive Program – Equity Awards Compensation Plan
During fiscal 2017, no stock options were granted to any of the Named Executive Officers.
Shareholder Say‑on‑Pay Votes
At Griffin’s 2017 annual meeting of stockholders, Griffin’s stockholders were given the opportunity to cast an advisory vote on Griffin’s executive compensation. Approximately 99.7% of the votes cast on this “2017 say‑on‑pay vote” were voted in favor of the proposal. Griffin has considered the 2017 say‑on‑pay vote and believes that the support for the 2017 say‑on‑pay vote proposal indicates that Griffin’s stockholders casting votes are supportive of the approach to executive compensation. Thus, Griffin did not make changes to its executive compensation arrangements in response to the 2017 say‑on‑pay vote. In the future, Griffin will continue to consider the outcome of the say‑on‑pay votes when making compensation decisions regarding its Named Executive Officers.
Accounting and Tax Considerations
Section 162(m) of the Internal Revenue Code (the “Code”) generally disallows a tax deduction to public corporations for compensation over $1,000,000 paid for any fiscal year to certain executive officers. The Tax Cuts and Jobs Act (“TCJA”), which was signed into law on December 22, 2017, has limited the “performance-based compensation” exception to the $1,000,000 deduction cap of Section 162(m) of the Code and may adversely affect the tax deductibility of certain compensation paid to Griffin’s executive officers. However, Griffin does not believe it need now adopt any policy with respect to the $1,000,000 deduction cap of Section 162(m) of the Code. While the Compensation Committee will give due consideration to the deductibility of compensation payments on compensation arrangements with Griffin’s executive officers (including with respect to the TCJA), the Compensation Committee will make its compensation decisions based on an overall determination of what it believes to be in the best interests of Griffin and its stockholders, and deductibility will be only one among a number of factors used by the Compensation Committee in making its compensation decisions.
Section 4999 and Section 280G of the Code provide that certain executives could be subject to significant excise taxes if they receive payments or benefits that exceed certain limits in connection with a change in ownership or change in effective control of Griffin and that Griffin or its successors could lose an income tax deduction with respect to the payments subject to the excise tax. Griffin has not entered into any agreements with any executives that provide for a tax “gross up” or other reimbursement for taxes the executive might be required to pay pursuant to Section 4999 of the Code.
Section 409A of the Code imposes significant additional taxes and interest on underpayments of taxes in the event an employee or other service provider defers compensation under a plan or agreement that does not meet the requirements of Section 409A of the Code. Griffin has generally structured its programs and individual arrangements in a manner intended to be exempt from or comply with the requirements of Section 409A of the Code.
89
COMPENSATION COMMITTEE REPORT
The Compensation Committee has reviewed and discussed with management Griffin’s Compensation Discussion and Analysis, and based upon this review and discussion, has recommended to the Board of Directors that the Compensation Discussion and Analysis be included in this Form 10‑K and Griffin’s Proxy Statement for its 2018 Annual Meeting of Stockholders to be filed with the Securities and Exchange Commission.
|
|
Albert H. Small, Jr. (Chairman) Thomas C. Israel Jonathan P. May |
EXECUTIVE COMPENSATION
Summary Compensation Table
The following table presents information regarding compensation of each of Griffin’s Named Executive Officers for services rendered during fiscal years 2017, 2016 and 2015:
|
|
|
|
|
|
|
|
|
|
|
|
|
|
Non-Equity |
|
|
|
|
|
|
|
|
|
|
|
|
|
|
|
|
|
|
|
|
Option |
|
Incentive Plan |
|
All Other |
|
|
|
|
|
|||
|
|
|
|
|
Salary |
|
Bonus |
|
Awards (1) |
|
Compensation |
|
Compensation |
|
|
Total |
|
||||||
|
Name and Principal Position |
|
Year |
|
($) |
|
($) |
|
($) |
|
($) |
|
($) |
|
|
($) |
|
||||||
|
Frederick M. Danziger |
|
2017 |
|
$ |
350,000 |
|
$ |
— |
|
$ |
— |
|
$ |
77,600 |
|
$ |
137 |
(2) |
|
$ |
427,737 |
|
|
Executive Chairman |
|
2016 |
|
$ |
369,308 |
|
$ |
— |
|
$ |
— |
|
$ |
58,207 |
|
$ |
2,893 |
|
|
$ |
430,408 |
|
|
of Griffin |
|
2015 |
|
$ |
549,762 |
|
$ |
— |
|
$ |
— |
|
$ |
81,500 |
|
$ |
17,546 |
|
|
$ |
648,808 |
|
|
Michael S. Gamzon |
|
2017 |
|
$ |
509,039 |
|
$ |
— |
|
$ |
— |
|
$ |
174,863 |
|
$ |
15,437 |
(3) |
|
$ |
699,339 |
|
|
President and Chief |
|
2016 |
|
$ |
485,760 |
|
$ |
— |
|
$ |
640,750 |
|
$ |
116,413 |
|
$ |
13,781 |
|
|
$ |
1,256,704 |
|
|
Executive Officer of Griffin |
|
2015 |
|
$ |
351,237 |
|
$ |
— |
|
$ |
— |
|
$ |
100,000 |
|
$ |
11,725 |
|
|
$ |
462,962 |
|
|
Anthony J. Galici |
|
2017 |
|
$ |
301,423 |
|
$ |
— |
|
$ |
— |
|
$ |
84,502 |
|
$ |
17,399 |
(4) |
|
$ |
403,324 |
|
|
Vice President, Chief |
|
2016 |
|
$ |
295,442 |
|
$ |
— |
|
$ |
135,375 |
|
$ |
58,207 |
|
$ |
16,948 |
|
|
$ |
505,972 |
|
|
Financial Officer and |
|
2015 |
|
$ |
289,652 |
|
$ |
— |
|
$ |
— |
|
$ |
40,750 |
|
$ |
17,942 |
|
|
$ |
348,344 |
|
|
Secretary of Griffin |
|
|
|
|
|
|
|
|
|
|
|
|
|
|
|
|
|
|
|
|
|
|
|
Thomas M. Lescalleet |
|
2017 |
|
$ |
263,700 |
|
$ |
— |
|
$ |
— |
|
$ |
217,136 |
|
$ |
11,440 |
(5) |
|
$ |
492,276 |
|
|
Senior Vice President, |
|
2016 |
|
$ |
258,530 |
|
$ |
— |
|
$ |
135,375 |
|
$ |
133,175 |
|
$ |
12,213 |
|
|
$ |
539,293 |
|
|
Griffin Industrial, LLC |
|
2015 |
|
$ |
253,460 |
|
$ |
— |
|
$ |
— |
|
$ |
118,400 |
|
$ |
10,671 |
|
|
$ |
382,531 |
|
|
Scott Bosco |
|
2017 |
|
$ |
171,342 |
|
$ |
— |
|
$ |
— |
|
$ |
97,102 |
|
$ |
5,333 |
(6) |
|
$ |
273,777 |
|
|
Vice President of Construction, |
|
2016 |
|
$ |
167,983 |
|
$ |
— |
|
$ |
75,810 |
|
$ |
65,490 |
|
$ |
5,819 |
|
|
$ |
315,102 |
|
|
Griffin Industrial, LLC |
|
2015 |
|
$ |
162,870 |
|
$ |
— |
|
$ |
— |
|
$ |
59,350 |
|
$ |
4,889 |
|
|
$ |
227,109 |
|
|
(1) |
The amounts shown for Option Awards reflect the grant date fair value of options granted in fiscal 2016. For a discussion of the assumptions and methodologies used to calculate the amounts referred to above, please see the discussion of stock option awards contained in Part II, Item 8, “Financial Statements and Supplementary Data” of this Form 10-K in Note 7 of the Notes to Consolidated Financial Statements. |
|
(2) |
Represents life insurance premium. |
|
(3) |
Represents life insurance premium of $228, matching contributions related to the Griffin 401(k) Savings Plan of $7,187 and matching contributions related to the Deferred Compensation Plan of $8,022. |
|
(4) |
Represents life insurance premium of $401, matching contributions related to the Griffin 401(k) Savings Plan of $6,725, matching contributions related to the Deferred Compensation Plan of $2,273 and an automobile allowance of $8,000. |
|
(5) |
Represents life insurance premium of $228, matching contributions related to the Griffin 401(k) Savings Plan of $7,912 and a medical insurance allowance of $3,300. |
|
(6) |
Represents life insurance premium of $228, matching contributions related to the Griffin 401(k) Savings Plan of $5,082 and matching contributions related to the Deferred Compensation Plan of $23. |
90
Grants of Plan‑Based Awards
The following table presents information regarding the incentive awards granted to Griffin’s Named Executive Officers for fiscal 2017:
|
|
|
|
|
|
|
|
|
|
|
|
|
Option |
|
|
|
|
|
|
|
|
|
|
|
|
|
|
|
Estimated |
|
Awards: |
|
|
|
|
Grant Date |
|
||||
|
|
|
|
|
|
|
|
Future Payouts |
|
Number of |
|
Exercise |
|
Fair Value of |
|
|||||
|
|
|
|
|
|
|
|
Under Non-Equity |
|
Securities |
|
Price of |
|
Stock and |
|
|||||
|
|
|
|
|
|
|
|
Incentive Plan Awards |
|
Underlying |
|
Option |
|
Option |
|
|||||
|
|
|
Grant |
|
Approval |
|
Target |
|
Maximum |
|
Options |
|
Awards |
|
Awards |
|
||||
|
Name |
|
Date |
|
Date |
|
($) (1) |
|
($) (2) |
|
(#) |
|
($/sh) |
|
($) |
|
||||
|
Frederick M. Danziger |
|
— |
|
— |
|
$ |
77,600 |
|
$ |
90,000 |
|
— |
|
|
— |
|
|
— |
|
|
Michael S. Gamzon |
|
— |
|
— |
|
$ |
174,863 |
|
$ |
267,500 |
|
— |
|
|
— |
|
|
— |
|
|
Anthony J. Galici |
|
— |
|
— |
|
$ |
84,502 |
|
$ |
125,625 |
|
— |
|
|
— |
|
|
— |
|
|
Thomas M. Lescalleet |
|
— |
|
— |
|
$ |
217,136 |
|
$ |
398,750 |
|
— |
|
|
— |
|
|
— |
|
|
Scott Bosco |
|
— |
|
— |
|
$ |
97,102 |
|
$ |
177,813 |
|
— |
|
|
— |
|
|
— |
|
|
(1) |
The Griffin Incentive Plan has no threshold or target levels; however, there is an aggregate maximum amount payable to the Named Executive Officers under the Griffin Incentive Plan (excluding the incentive compensation component corresponding to Group 3 Property Sales, which is not subject to a maximum). The amounts shown for the Named Executive Officers in the Target column reflect the actual amounts payable to the Named Executive Officers under the Griffin Incentive Plan (including the incentive compensation component corresponding to Group 3 Property Sales) based on Griffin’s performance in fiscal 2017. The Compensation Committee did not exercise its discretion to award the Named Executive Officers any additional incentive compensation outside of the Griffin Incentive Plan for fiscal 2017. |
|
(2) |
The maximum amount payable to Messrs. Danziger, Gamzon, Galici, Lescalleet and Bosco under the Griffin Incentive Plan (excluding the incentive compensation component corresponding to Group 3 Property Sales, which is not subject to a maximum) equaled $75,000, $242,500, $110,625, $338,750 and $162,813, respectively, calculated assuming all incentive compensation components of the Griffin Incentive Plan are met at the maximum level of each, which would result in an accrual of $1,687,500 into the Griffin Incentive Plan (excluding in any accruals with respect to the incentive compensation component corresponding to Group 3 Property Sales). The amounts shown for the Named Executive Officers in the Maximum column reflect the sum of (a) the maximums for all incentive compensation components (other than Group 3 Property Sales) assuming all such incentive compensation components are met at the maximum level of each, and (b) the actual amounts paid with respect to the incentive compensation component corresponding to Group 3 Property Sales. The actual amounts paid with respect to incentive compensation component corresponding to Group 3 Property Sales equaled $25,000 and $60,000 for Messrs. Gamzon and Lescalleet, respectively, and $15,000 each to Messrs. Danziger, Galici and Bosco. |
91
Outstanding Equity Awards at Fiscal Year‑End
The following table presents information with respect to each unexercised stock option held by Griffin’s Named Executive Officers as of November 30, 2017. There are no restricted stock awards.
|
|
|
Option Awards (1) |
|
|||||||||||||
|
|
|
|
|
|
|
|
|
|
|
|
Value of |
|
Value of |
|
||
|
|
|
Number of |
|
Number of |
|
|
|
|
|
|
Unexercised |
|
Unexercised |
|
||
|
|
|
Securities |
|
Securities |
|
|
|
|
|
|
In-the-Money |
|
In-the-Money |
|
||
|
|
|
Underlying |
|
Underlying |
|
|
|
|
|
|
Options at |
|
Options at |
|
||
|
|
|
Unexercised |
|
Unexercised |
|
Option |
|
|
|
Fiscal Year |
|
Fiscal Year |
|
|||
|
|
|
Options |
|
Options |
|
Exercise |
|
Option |
|
End (2) |
|
End (2) |
|
|||
|
|
|
(#) |
|
(#) |
|
Price |
|
Expiration |
|
($) |
|
($) |
|
|||
|
Name |
|
Exercisable |
|
Unexercisable |
|
($) |
|
Date |
|
Exercisable |
|
Unexercisable |
|
|||
|
Frederick M. Danziger |
|
15,000 |
|
— |
|
$ |
33.07 |
|
1/20/2019 |
|
$ |
51,450 |
|
$ |
— |
|
|
|
|
25,000 |
|
— |
|
$ |
28.77 |
|
1/19/2021 |
|
$ |
193,250 |
|
$ |
— |
|
|
|
|
40,000 |
|
— |
|
|
|
|
|
|
$ |
244,700 |
|
$ |
— |
|
|
Michael S. Gamzon |
|
25,000 |
|
— |
|
$ |
34.04 |
|
1/9/2018 |
|
$ |
61,500 |
|
$ |
— |
|
|
|
|
7,500 |
|
— |
|
$ |
33.07 |
|
1/20/2019 |
|
$ |
25,725 |
|
$ |
— |
|
|
|
|
25,000 |
|
— |
|
$ |
28.77 |
|
1/19/2021 |
|
$ |
193,250 |
|
$ |
— |
|
|
|
|
— |
|
55,000 |
|
$ |
26.89 |
|
5/13/2026 |
|
$ |
— |
|
$ |
528,550 |
|
|
|
|
57,500 |
|
55,000 |
|
|
|
|
|
|
$ |
280,475 |
|
$ |
528,550 |
|
|
Anthony J. Galici |
|
7,500 |
|
— |
|
$ |
33.07 |
|
1/20/2019 |
|
$ |
25,725 |
|
$ |
— |
|
|
|
|
12,500 |
|
— |
|
$ |
28.77 |
|
1/19/2021 |
|
$ |
96,625 |
|
$ |
— |
|
|
|
|
— |
|
12,500 |
|
$ |
26.89 |
|
5/13/2026 |
|
$ |
— |
|
$ |
120,125 |
|
|
|
|
20,000 |
|
12,500 |
|
|
|
|
|
|
$ |
122,350 |
|
$ |
120,125 |
|
|
Thomas M. Lescalleet |
|
7,500 |
|
— |
|
$ |
33.07 |
|
1/20/2019 |
|
$ |
25,725 |
|
$ |
— |
|
|
|
|
12,500 |
|
— |
|
$ |
28.77 |
|
1/19/2021 |
|
$ |
96,625 |
|
$ |
— |
|
|
|
|
— |
|
12,500 |
|
$ |
26.89 |
|
5/13/2026 |
|
$ |
— |
|
$ |
120,125 |
|
|
|
|
20,000 |
|
12,500 |
|
|
|
|
|
|
$ |
122,350 |
|
$ |
120,125 |
|
|
Scott Bosco |
|
5,000 |
|
— |
|
$ |
33.07 |
|
1/20/2019 |
|
$ |
17,150 |
|
$ |
— |
|
|
|
|
5,000 |
|
— |
|
$ |
28.77 |
|
1/19/2021 |
|
$ |
38,650 |
|
$ |
— |
|
|
|
|
— |
|
7,000 |
|
$ |
26.89 |
|
5/13/2026 |
|
$ |
— |
|
$ |
67,270 |
|
|
|
|
10,000 |
|
7,000 |
|
|
|
|
|
|
$ |
55,800 |
|
$ |
67,270 |
|
|
(1) |
Stock options issued to employees vest in equal installments on the third, fourth and fifth anniversaries from the date of grant (which is ten years prior to the applicable option expiration date). |
|
(2) |
The amounts presented in these columns have been calculated based upon the difference between the fair market value of $36.50 per share (the closing price of Griffin’s common stock on November 30, 2017) and the exercise price of each stock option. |
92
Non‑Qualified Deferred Compensation
Griffin maintains a Deferred Compensation Plan for certain of its employees who, due to Internal Revenue Service regulations, cannot take full advantage of the Griffin 401(k) Savings Plan. A portion of an eligible employee’s salary may be deferred under the Deferred Compensation Plan. The investment options in the Deferred Compensation Plan currently mirror those of the Griffin 401(k) Savings Plan. The Deferred Compensation Plan is unfunded, with benefits to be paid from Griffin’s assets. Performance results of an employee’s balance in the Deferred Compensation Plan are based on the returns of the mutual funds and one common collective trust fund that may be selected by the employee as if the amounts deferred were invested in the selected mutual funds and the common collective trust fund. Distributions from the Deferred Compensation Plan generally may occur at termination of employment, change in control and/or at the time of qualifying hardship events. The following table presents information with respect to the Deferred Compensation Plan for Griffin’s Named Executive Officers as of November 30, 2017:
|
|
|
Executive |
|
Griffin |
|
Aggregate |
|
Aggregate |
|
||||
|
|
|
Contributions |
|
Contributions |
|
Earnings in |
|
Balance as of |
|
||||
|
|
|
for FYE |
|
for FYE |
|
FYE |
|
FYE |
|
||||
|
Name |
|
11/30/2017 |
|
11/30/2017 (1) |
|
11/30/2017 |
|
11/30/2017 |
|
||||
|
Frederick M. Danziger |
|
$ |
— |
|
$ |
— |
|
$ |
138,898 |
|
$ |
1,870,027 |
|
|
Michael S. Gamzon |
|
$ |
31,126 |
|
$ |
8,022 |
|
$ |
69,239 |
|
$ |
412,237 |
|
|
Anthony J. Galici |
|
$ |
46,344 |
|
$ |
2,273 |
|
$ |
168,804 |
|
$ |
1,095,355 |
|
|
Thomas M. Lescalleet |
|
$ |
— |
|
$ |
— |
|
$ |
23,282 |
|
$ |
140,721 |
|
|
Scott Bosco |
|
$ |
2,458 |
|
$ |
23 |
|
$ |
18,618 |
|
$ |
103,230 |
|
|
(1) |
Griffin’s contributions to the Deferred Compensation Plan are included in the “All Other Compensation” column of the Summary Compensation Table. No earnings from the Deferred Compensation Plan are included in the “All Other Compensation” column of the Summary Compensation Table. |
Potential Payments Upon a Termination or Change in Control
As of November 30, 2017, Griffin was not a party to any employment, change in control or other agreement with any Named Executive Officers that was expected to obligate Griffin to provide for payments at, following, or in connection with a termination of employment, change in control or change in the Named Executive Officer’s responsibilities. However, participants of Griffin’s Deferred Compensation Plan may elect to have their balances paid out in lump sum or annual installments upon termination of employment or a change in control of Griffin. The deferred compensation balance for each such Named Executive Officer, as of November 30, 2017, is set forth in the “Non‑Qualified Deferred Compensation” table above. Additionally, pursuant to the 2009 Stock Option Plan, if option grants are assumed by a successor corporation (or a parent or subsidiary thereof) in connection with a change in control, the vesting of such grants will be accelerated upon termination of a Named Executive Officer’s employment upon or within twelve months following such change in control. As of November 30, 2017, the exercise price for 234,500 of the outstanding options held by Named Executive Officers exceeded the closing market price of $36.50 per share of Griffin common stock. The aggregate value of such options (based on the excess of the November 30, 2017 closing price of Griffin’s common stock over the exercise price) is $1,661,745. The following table presents information regarding the
93
value of such options to each of Griffin’s Named Executive Officers following a termination of employment upon or within twelve months following such change in control (assuming such termination occurred on November 30, 2017):
|
|
|
Estimated Value of |
|
|
|
|
In-the-Money |
|
|
|
|
Options Following |
|
|
|
|
Termination Upon or |
|
|
|
|
Within Twelve Months |
|
|
|
|
Following a |
|
|
Name |
|
Change In Control (1) |
|
|
Frederick M. Danziger |
|
$ |
244,700 |
|
Michael S. Gamzon |
|
$ |
809,025 |
|
Anthony J. Galici |
|
$ |
242,475 |
|
Thomas M. Lescalleet |
|
$ |
242,475 |
|
Scott Bosco |
|
$ |
123,070 |
|
(1) |
Stock option values are calculated based on the difference between $36.50, the November 30, 2017 closing price of Griffin’s common stock, and the option exercise price, multiplied by the total number of stock options. |
Director Compensation
The following table represents information regarding the compensation paid during fiscal 2017 to members of Griffin’s Board of Directors who are not also employees (the “Non‑Employee Directors”). The compensation paid to Messrs. Frederick M. Danziger and Michael S. Gamzon is presented above in the Summary Compensation Table and the related explanatory notes. Messrs. Frederick M. Danziger and Michael S. Gamzon did not receive compensation related to their activities as members of the Board of Directors.
|
|
|
Fees |
|
|
|
|
|
|
|
|
|
|
|
Earned or |
|
Option |
|
|
|
|
||
|
|
|
Paid in Cash |
|
Awards |
|
Total |
|
|||
|
Name |
|
($) |
|
($) |
|
($) |
|
|||
|
David R. Bechtel |
|
$ |
51,500 |
|
$ |
17,726 |
(1) |
$ |
69,226 |
|
|
Edgar M. Cullman, Jr. |
|
$ |
39,000 |
|
$ |
17,726 |
(1) |
$ |
56,726 |
|
|
Thomas C. Israel |
|
$ |
61,000 |
|
$ |
17,726 |
(1) |
$ |
78,726 |
|
|
Jonathan P. May |
|
$ |
60,000 |
|
$ |
17,726 |
(1) |
$ |
77,726 |
|
|
Albert H. Small, Jr. |
|
$ |
52,000 |
|
$ |
17,726 |
(1) |
$ |
69,726 |
|
|
(1) |
The amount shown for Option Awards reflects the grant date fair value of options granted in fiscal 2017. For a discussion of the assumptions and methodologies used to calculate the amounts referred to above, please see the discussion of stock option awards contained in Part II, Item 8, “Financial Statements and Supplementary Data” of this Form 10‑K in Note 7 of the Notes to Consolidated Financial Statements. |
The following table represents the number of outstanding and unexercised stock option awards held by each of the Non‑Employee Directors as of November 30, 2017:
|
|
|
Number of Shares |
|
|
|
|
Subject to |
|
|
|
|
Outstanding Options |
|
|
Director |
|
as of 11/30/17 |
|
|
David R. Bechtel |
|
3,607 |
|
|
Edgar M. Cullman, Jr. |
|
4,755 |
|
|
Thomas C. Israel |
|
13,992 |
|
|
Jonathan P. May |
|
8,761 |
|
|
Albert H. Small, Jr. |
|
14,565 |
|
Members of the Board of Directors who are not employees of Griffin receive $30,000 per year, $1,500 for each board meeting they attend and $1,000 for each committee meeting they attend. A non‑employee Chairman of the Board of Directors receives an annual fee of $15,000. The Chairmen of the Audit and Compensation Committees each receive an annual fee of $10,000 per year. The Nominating Committee Chairman receives an annual fee of $5,000 per year.
94
Audit and Compensation Committee members, excluding the Chairmen, each receive $5,000 per year for their service on those Committees. Members of the Nominating Committee, excluding the Chairman, each receive $2,500 per year for their service on that Committee. Annual fees are paid in quarterly installments. Upon the initial election of a Non‑Employee Director to the Board of Directors, the Non‑Employee Director is granted options exercisable for shares of common stock at an exercise price that is the fair market value of a share of common stock at the time of the grant. The number of shares subject to options granted to Non‑Employee Directors at the time of initial election to the Board of Directors is equal to $60,000 divided by the fair market value per share of Griffin common stock at the time of grant. Stock options granted to Non-Employee Directors upon their initial election to the Board vest immediately upon issuance. The 2009 Stock Option Plan also provides that Non‑Employee Directors annually receive options exercisable for shares of common stock at an exercise price that is the fair market value of a share of common stock at the time of grant. Under the 2009 Stock Option Plan, the number of shares, subject to options, granted to Non‑Employee Directors upon their reelection to the Board of Directors, is equal to $40,000 divided by the fair market value per share of Griffin common stock at the time of grant. Stock options granted to Non-Employee Directors upon their re-election to the Board of Directors vest on the second anniversary of the date of grant. In 2017, Griffin granted each of the Non-Employee Directors an option exercisable for 1,314 shares of common stock upon their reelection to the Board of Directors.
Compensation Committee Interlocks and Insider Participation
During fiscal 2017, Messrs. Israel, May and Small, Jr. served as members of Griffin’s Compensation Committee. No member of the Compensation Committee has been an officer or employee of Griffin. None of Griffin’s executive officers have served as a director or member of the compensation committee of any entity whose executive officers served as a director of Griffin or as a member of Griffin’s Compensation Committee.
95
ITEM 12. SECURITY OWNERSHIP OF CERTAIN BENEFICIAL OWNERS AND MANAGEMENT AND RELATED STOCKHOLDER MATTERS.
The following table lists the number of shares and options to purchase shares of common stock of Griffin beneficially owned or held by: (i) each person known by Griffin to beneficially own more than 5% of the outstanding shares of common stock; (ii) each director; (iii) the Named Executive Officers (as defined in Item 11); and (iv) all directors and executive officers of Griffin, collectively. Unless otherwise indicated, information is provided as of January 31, 2018.
|
|
|
Shares |
|
|
|
|
|
|
Beneficially |
|
Percent |
|
|
Name and Address (1) |
|
Owned (2) |
|
of Total |
|
|
Cullman and Ernst Group (3) |
|
2,363,437 |
|
46.5 |
|
|
Edgar M. Cullman, Jr. (3) |
|
884,947 |
|
17.7 |
|
|
Frederick M. Danziger (3) |
|
308,289 |
|
6.1 |
|
|
Michael S. Gamzon (3) |
|
119,127 |
|
2.4 |
|
|
David R. Bechtel |
|
3,387 |
|
* |
|
|
4 Brookside Park |
|
|
|
|
|
|
Greenwich, CT 06831 |
|
|
|
|
|
|
Thomas C. Israel |
|
35,369 |
|
* |
|
|
Ingleside Investors |
|
|
|
|
|
|
12 East 49th Street |
|
|
|
|
|
|
New York, NY 10017 |
|
|
|
|
|
|
Jonathan P. May |
|
5,918 |
|
* |
|
|
116 East 95th Street |
|
|
|
|
|
|
New York, NY 10128 |
|
|
|
|
|
|
Albert H. Small, Jr. |
|
11,722 |
|
* |
|
|
7311 Arrowood Road |
|
|
|
|
|
|
Bethesda, MD 20817 |
|
|
|
|
|
|
Anthony J. Galici |
|
41,023 |
|
* |
|
|
Griffin Industrial Realty, Inc. |
|
|
|
|
|
|
204 West Newberry Road |
|
|
|
|
|
|
Bloomfield, CT 06002 |
|
|
|
|
|
|
Thomas M. Lescalleet |
|
20,000 |
|
* |
|
|
Griffin Industrial, LLC |
|
|
|
|
|
|
204 West Newberry Road |
|
|
|
|
|
|
Bloomfield, CT 06002 |
|
|
|
|
|
|
Scott Bosco |
|
10,000 |
|
* |
|
|
Griffin Industrial, LLC |
|
|
|
|
|
|
204 West Newberry Road |
|
|
|
|
|
|
Bloomfield, CT 06002 |
|
|
|
|
|
|
Gabelli Funds, LLC et al (4) |
|
1,678,401 |
|
33.6 |
|
|
Gabelli Funds, LLC |
|
|
|
|
|
|
One Corporate Center |
|
|
|
|
|
|
Rye, NY 10580 |
|
|
|
|
|
|
All directors and executive officers collectively, consisting of 10 persons (5) |
|
1,439,782 |
|
27.9 |
|
* Less than 1%
|
(1) |
Unless otherwise indicated, the address of each person named in the table is 641 Lexington Avenue, New York, NY 10022. |
|
(2) |
This information reflects the definition of beneficial ownership adopted by the Securities and Exchange Commission (the “Commission”). Beneficial ownership reflects sole investment and voting power, unless otherwise indicated in the footnotes to this table. Where more than one person shares investment and voting power in the same shares, such shares may be shown more than once. Such shares are reflected only once, however, in the total for all directors and executive officers. Includes stock options granted pursuant to the 2009 Stock Option Plan, as amended, that are exercisable within 60 days of January 31, 2018 as follows: |
96
|
|
|
Options Exercisable |
|
|
|
Within 60 Days of |
|
Name |
|
January 31, 2018 |
|
Edgar M. Cullman, Jr. |
|
1,912 |
|
Frederick M. Danziger |
|
40,000 |
|
Michael S. Gamzon |
|
32,500 |
|
David R. Bechtel |
|
2,293 |
|
Thomas C. Israel |
|
11,149 |
|
Jonathan P. May |
|
5,918 |
|
Albert H. Small, Jr. |
|
11,722 |
|
Anthony J. Galici |
|
20,000 |
|
Thomas M. Lescalleet |
|
20,000 |
|
Scott Bosco |
|
10,000 |
|
(3) |
Based on Schedule 13D/A filed with the Commission on April 27, 2017 on behalf of the Cullman and Ernst Group and Griffin’s records. Included in the shares held by the Cullman and Ernst Group are the following: |
|
|
|
|
|
Shares with |
|
Shares with |
|
|
|
|
Shares |
|
Sole Voting and |
|
Shared Voting |
|
|
|
|
Benefically |
|
Dispositive |
|
and Dispositive |
|
|
Name |
|
Owned (c) |
|
Power |
|
Power |
|
|
Cullman Jr., Edgar M. |
|
884,947 |
|
59,748 |
|
825,199 |
|
|
Cullman, Susan R. |
|
785,121 |
|
42,760 |
|
742,361 |
|
|
Danziger, Lucy C. |
|
584,103 |
|
85,286 |
|
498,817 |
|
|
Danziger, David M. |
|
507,659 |
|
59,402 |
|
448,257 |
|
|
Gamzon, Rebecca D. |
|
426,283 |
|
10,550 |
|
415,733 |
|
|
Ernst, John L. |
|
380,955 |
|
7,349 |
|
373,606 |
|
|
Sicher, Carolyn B. |
|
344,029 |
|
21,422 |
|
322,607 |
|
|
Cullman, Georgina D. |
|
340,149 |
|
9,550 |
|
330,599 |
|
|
Cullman, Elissa F. |
|
325,449 |
|
14,850 |
|
310,599 |
|
|
Cullman, Samuel B. |
|
324,193 |
|
13,594 |
|
310,599 |
|
|
Cullman III, Edgar M. |
|
321,858 |
|
11,259 |
|
310,599 |
|
|
Danziger, Frederick M. |
|
308,289 |
|
103,534 |
|
204,755 |
|
|
B Bros. Realty LLC (a) |
|
233,792 |
|
233,792 |
|
— |
|
|
Kirby, John J. |
|
152,223 |
|
4,730 |
|
147,493 |
|
|
Gamzon, Michael S. |
|
119,127 |
|
69,127 |
|
50,000 |
|
|
Fabrici, Carolyn S. |
|
116,037 |
|
— |
|
116,037 |
|
|
Ernst, Alexandra |
|
94,428 |
|
1,748 |
|
92,680 |
|
|
Danziger, Sheena S. |
|
50,000 |
|
— |
|
50,000 |
|
|
Kerns, Jessica P. |
|
45,134 |
|
1,250 |
|
43,884 |
|
|
Estate of Louise B. Cullman (b) |
|
39,548 |
|
39,548 |
|
— |
|
|
Ernst, Margot P. |
|
21,777 |
|
— |
|
21,777 |
|
|
Ernst, Matthew L. |
|
5,176 |
|
1,650 |
|
3,526 |
|
|
(a) |
Susan R. Cullman and John Ernst are managing members. |
|
(b) |
Edgar M. Cullman, Jr., Susan R. Cullman and Lucy C. Danziger are executors. |
The Schedule 13D/A states that there is no formal agreement governing the Cullman and Ernst Group’s holding and voting of shares held by members of the Cullman and Ernst Group but that there is an informal understanding that the persons and entities included in the group will hold and vote together with respect to shares owned by each of them in each case subject to any applicable fiduciary responsibilities. None of the shares held by members of the Cullman and Ernst Group are pledged.
|
(4) |
Griffin has received a copy of Schedule 13D/A as filed with the Commission by Gabelli Funds, LLC et al, reporting ownership of these shares as of December 7, 2017. As reported in said Schedule 13D/A, Gabelli Funds, LLC reports sole dispositive power with respect to 573,150 shares, GAMCO Asset Management Inc. (“GAMCO”) reports sole |
97
voting power with respect to 794,059 of these shares and sole dispositive power with respect to 849,604 of these shares and Teton Advisors, Inc. (“Teton Advisors”) reports sole voting and dispositive power with respect to 255,647 of these shares. The securities have been acquired by GGCP, Inc. (“GGCP”), and certain of its direct and indirect subsidiaries, including GAMCO Investors, Inc. (“GBL”), on behalf of their investment advisory clients. Mario Gabelli, as the controlling stockholder, Chief Executive Officer and a director of GGCP, Chairman and Chief Executive Officer of GBL, and the controlling shareholder of Teton Advisors, is deemed to have beneficial ownership of the shares owned beneficially by Gabelli Funds, LLC, GAMCO and Teton Advisors. GBL and GGCP are deemed to have beneficial ownership of the shares beneficially owned by each of the foregoing persons other than Mario Gabelli and the Gabelli Foundation, Inc. For the shares held by Gabelli Funds, LLC, with respect to the 45,000 shares held by the Gabelli Capital Asset Fund, the 56,000 shares held by the Gabelli Equity Trust, the 104,000 shares held by the Gabelli Asset Fund, the 63,600 shares held by the Gabelli Value 25 Fund, Inc., the 268,800 shares held by the Gabelli Small Cap Growth Fund, the 10,049 shares held by the Gabelli Equity Income Fund, the 15,500 shares held by the Gabelli Go Anywhere Fund, and the 11,001 shares held by the Gabelli Global Small and Mid Cap Value Trust, the proxy voting committee of each such fund has taken and exercises in its sole discretion the entire voting power with respect to the shares held by such funds. |
|
(5) |
Excluding shares held by certain charitable foundations, the officers and/or directors of which include certain officers and directors of Griffin. |
Equity Compensation Plan Information
|
|
|
Number of |
|
|
|
|
Number of securities |
|
|
|
|
securities to be |
|
Weighted |
|
remaining available for future |
|
|
|
|
|
issued upon |
|
average |
|
issuance under the equity |
|
|
|
|
|
exercise of |
|
exercise price |
|
compensation plan (excluding |
|
|
|
|
|
outstanding |
|
of outstanding |
|
securities reflected in |
|
|
|
|
|
options |
|
options |
|
column (a)) |
|
|
|
Plan Category |
|
(a) |
|
(b) |
|
(c) |
|
|
|
Equity compensation plan approved by security holders |
|
333,762 |
|
$ |
29.22 |
|
178,847 |
|
Note: There are no equity compensation plans that were not approved by security holders.
ITEM 13. CERTAIN RELATIONSHIPS AND RELATED TRANSACTIONS AND DIRECTOR INDEPENDENCE.
Review and Approval of Related Person Transactions
Griffin reviews any relationships and transactions in which Griffin and its directors and executive officers or their immediate family members are participants to determine whether such persons have a direct or indirect material interest. Griffin’s corporate staff is primarily responsible for the development and implementation of processes and controls to obtain information from the directors and executive officers with respect to related person transactions and for then determining, based on the facts and circumstances, whether a related person has a direct or indirect material interest in the transaction. As required under SEC rules, transactions that are determined to be directly or indirectly material to a related person are disclosed in Griffin’s Annual Report on Form 10‑K and proxy statement.
On November 24, 2015, the Audit Committee approved a proposed transaction whereby Griffin entered into a ten year sublease of approximately 1,920 square feet of office space for its New York City corporate headquarters from Bloomingdale Properties, Inc. (“Bloomingdale Properties”), an entity controlled by certain members of the Cullman and Ernst Group (see “Item 12, Security Ownership of Certain Beneficial Owners and Management and Related Stockholder Matters”). The sublease with Bloomingdale Properties is at market rates for such space and enables either Griffin or Bloomingdale Properties to terminate the sublease agreement upon a change in control (as defined) of either Griffin or Bloomingdale Properties. The sublease of office space from Bloomingdale Properties reduced the occupancy costs for Griffin’s corporate headquarters.
Board Independence
Under Nasdaq rules, an “independent director” of a company means a person who is not an officer or employee of the company or its subsidiaries and, in the opinion of the company’s board of directors, does not have a relationship
98
with the company that would interfere with the exercise of independent judgment in carrying out the responsibilities of a director. The Board has determined that Messrs. Bechtel, Israel, May and Small, Jr. qualify as independent directors under Nasdaq rules. All of the members of the Audit, Compensation and Nominating Committees are independent directors under the applicable Nasdaq and SEC rules.
ITEM 14. PRINCIPAL ACCOUNTING FEES AND SERVICES.
The following is a summary of the fees incurred by Griffin for professional services rendered by RSM US LLP (“RSM US”) for fiscal 2017 and fiscal 2016:
|
|
|
Fiscal |
|
Fiscal |
|
||
|
|
|
2017 Fees |
|
2016 Fees |
|
||
|
Audit fees |
|
$ |
430,781 |
|
$ |
423,682 |
|
|
Audit-related fees |
|
|
20,585 |
|
|
20,200 |
|
|
Tax fees |
|
|
50,675 |
|
|
45,380 |
|
|
All other |
|
|
— |
|
|
— |
|
|
|
|
$ |
502,041 |
|
$ |
489,262 |
|
Audit fees consist of fees incurred for professional services rendered for the audit of Griffin’s consolidated financial statements and for the review of Griffin’s interim consolidated financial statements. Audit‑related fees include fees incurred for professional services rendered for the audit of the Griffin 401(k) Savings Plan by RSM US. Tax fees consist of fees incurred for professional services performed by RSM US relating to tax compliance, tax reporting and tax planning. There were no consulting fees paid to RSM US in fiscal 2017 or fiscal 2016.
The Audit Committee’s policy is to pre‑approve all audit, audit‑related and tax services to be provided by the independent registered public accountants. During fiscal 2017, Griffin’s Audit Committee pre‑approved all audit, audit‑related and tax services. The Audit Committee has considered the non‑audit services provided by RSM US and determined that the services provided were compatible with maintaining the independence of RSM US.
99
ITEM 15. EXHIBITS AND FINANCIAL STATEMENT SCHEDULES.
|
(a)(1) |
Financial Statements of Griffin Industrial Realty, Inc. See Item 8. |
|
|
|
|
|
Consolidated Balance Sheets as of November 30, 2017 and November 30, 2016 |
45 |
|
|
|
46 |
|
|
|
|
47 |
|
|
|
|
48 |
|
|
|
|
49 |
|
|
|
|
50 |
|
|
(a)(2) |
Financial Statement Schedules |
|
|
|
|
|
S‑1 |
|
|
|
|
S‑2/S‑3 |
|
|
(a)(3) |
Exhibits |
|
|
100
|
|
|
|
|
Incorporated by Reference |
|
|
||||||
|
Exhibit |
|
Exhibit Description |
|
Form |
|
File No. |
|
Exhibit |
|
Filing |
|
Filed/ |
| 2.1 |
|
|
8‑K |
|
001‑12879 |
|
2.1 |
|
1/14/14 |
|
|
|
| 2.2 |
|
|
8‑K |
|
001‑12879 |
|
2.2 |
|
1/14/14 |
|
|
|
| 3.1 |
|
|
10‑Q |
|
001‑12879 |
|
3.1 |
|
10/10/13 |
|
|
|
| 3.2 |
|
|
8‑K |
|
001‑12879 |
|
3.1 |
|
5/13/15 |
|
|
|
| 3.3 |
|
Amended and Restated By‑laws of Griffin Industrial Realty, Inc. |
|
8‑K |
|
001‑12879 |
|
3.2 |
|
5/13/15 |
|
|
|
10.2† |
|
Griffin Industrial Realty, Inc. (f/k/a Griffin Land & Nurseries, Inc.) 2009 Stock Option Plan |
|
10‑K |
|
001‑12879 |
|
10.2 |
|
2/13/14 |
|
|
|
10.3† |
|
|
10‑K |
|
001‑12879 |
|
10.3 |
|
2/13/14 |
|
|
|
| 10.4 |
|
|
10‑Q |
|
001‑12879 |
|
10.21 |
|
10/11/02 |
|
|
|
| 10.5 |
|
|
10‑K |
|
001‑12879 |
|
10.24 |
|
2/28/03 |
|
|
|
| 10.6 |
|
|
10‑Q |
|
001‑12879 |
|
10.28 |
|
7/13/04 |
|
|
|
| 10.7 |
|
|
10‑Q |
|
001‑12879 |
|
10.29 |
|
11/3/05 |
|
|
|
| 10.8 |
|
|
10‑Q |
|
001‑12879 |
|
10.30 |
|
11/3/05 |
|
|
|
| 10.9 |
|
|
10‑Q |
|
001‑12879 |
|
10.31 |
|
11/3/05 |
|
|
|
101
|
|
|
|
|
Incorporated by Reference |
|
|
||||||
|
Exhibit |
|
Exhibit Description |
|
Form |
|
File No. |
|
Exhibit |
|
Filing |
|
Filed/ |
| 10.10 |
|
|
10‑K |
|
001‑12879 |
|
10.32 |
|
2/15/07 |
|
|
|
| 10.11 |
|
Amended and Restated Promissory Note dated November 16, 2006 |
|
10‑K |
|
001‑12879 |
|
10.33 |
|
2/15/07 |
|
|
| 10.12 |
|
|
10‑K |
|
001‑12879 |
|
10.34 |
|
2/15/07 |
|
|
|
| 10.13 |
|
|
10‑Q |
|
001‑12879 |
|
10.36 |
|
10/6/10 |
|
|
|
| 10.14 |
|
|
10‑Q |
|
001‑12879 |
|
10.37 |
|
4/9/09 |
|
|
|
| 10.15 |
|
|
10‑Q |
|
001‑12879 |
|
10.40 |
|
10/8/09 |
|
|
|
| 10.16 |
|
|
10‑Q |
|
001‑12879 |
|
10.41 |
|
10/8/09 |
|
|
|
| 10.17 |
|
|
10‑Q |
|
001‑12879 |
|
10.42 |
|
10/6/10 |
|
|
|
| 10.18 |
|
|
10‑Q |
|
001‑12879 |
|
10.43 |
|
4/8/10 |
|
|
|
| 10.19 |
|
|
10‑K |
|
001‑12879 |
|
10.44 |
|
2/10/11 |
|
|
|
| 10.24 |
|
|
10‑Q |
|
001‑12879 |
|
10.49 |
|
7/11/13 |
|
|
|
| 10.25 |
|
|
10‑Q |
|
001‑12879 |
|
10.50 |
|
7/11/13 |
|
|
|
| 10.26 |
|
Revolving Line of Credit Loan Agreement with Webster Bank, N.A. dated April 24, 2013 |
|
10‑Q |
|
001‑12879 |
|
10.51 |
|
7/11/13 |
|
|
| 10.28 |
|
|
10‑Q |
|
001‑12879 |
|
10.53 |
|
10/10/13 |
|
|
|
| 10.29 |
|
|
10‑Q |
|
001‑12879 |
|
10.54 |
|
10/10/13 |
|
|
|
| 10.31 |
|
|
8‑K |
|
001‑12879 |
|
10.1 |
|
6/9/14 |
|
|
|
| 10.32 |
|
|
8‑K |
|
001‑12879 |
|
10.2 |
|
6/9/14 |
|
|
|
102
|
|
|
|
|
Incorporated by Reference |
|
|
||||||
|
Exhibit |
|
Exhibit Description |
|
Form |
|
File No. |
|
Exhibit |
|
Filing |
|
Filed/ |
| 10.33 |
|
|
8‑K |
|
001‑12879 |
|
10.3 |
|
6/9/14 |
|
|
|
| 10.34 |
|
|
8‑K |
|
001‑12879 |
|
10.4 |
|
6/9/14 |
|
|
|
| 10.35 |
|
|
10‑K |
|
001‑12879 |
|
10.35 |
|
2/13/15 |
|
|
|
| 10.36 |
|
|
10‑K |
|
001‑12879 |
|
10.36 |
|
2/13/15 |
|
|
|
| 10.37 |
|
|
10‑K |
|
001‑12879 |
|
10.37 |
|
2/13/15 |
|
|
|
| 10.38 |
|
|
10‑Q |
|
001‑12879 |
|
10.38 |
|
10/9/15 |
|
|
|
| 10.39 |
|
|
10‑Q |
|
001‑12879 |
|
10.39 |
|
10/9/15 |
|
|
|
| 10.40 |
|
|
10‑Q |
|
001‑12879 |
|
10.40 |
|
10/9/15 |
|
|
|
| 10.41 |
|
|
10‑Q |
|
001‑12879 |
|
10.41 |
|
10/9/15 |
|
|
|
|
10.42† |
|
|
10-K |
|
001-12879 |
|
10.41 |
|
2/12/16 |
|
|
|
|
10.43† |
|
|
10-Q |
|
001-12879 |
|
10.42 |
|
4/8/16 |
|
|
|
|
10.44† |
|
|
10-Q |
|
001-12879 |
|
10.43 |
|
7/8/16 |
|
|
|
| 10.45 |
|
|
10-Q |
|
001-12879 |
|
10.44 |
|
7/8/16 |
|
|
|
| 10.46 |
|
|
10-Q |
|
001-12879 |
|
10.45 |
|
7/8/16 |
|
|
|
| 10.48 |
|
|
10-Q |
|
001-12879 |
|
10.47 |
|
10/7/16 |
|
|
|
| 10.49 |
|
Amended and Restated Revolving Line of Credit Note with Webster Bank, N.A. dated July 22, 2016 |
|
10-Q |
|
001-12879 |
|
10.48 |
|
10/7/16 |
|
|
| 10.50 |
|
|
10‑K |
|
001-12879 |
|
10.49 |
|
2/10/17 |
|
|
|
103
|
|
|
|
|
Incorporated by Reference |
|
|
||||||
|
Exhibit |
|
Exhibit Description |
|
Form |
|
File No. |
|
Exhibit |
|
Filing |
|
Filed/ |
| 10.51 |
|
|
10‑K |
|
001-12879 |
|
10.50 |
|
2/10/17 |
|
|
|
| 10.52 |
|
|
10‑K |
|
001-12879 |
|
10.51 |
|
2/10/17 |
|
|
|
|
10.53† |
|
|
10-Q |
|
001-12879 |
|
10.52 |
|
4/7/17 |
|
|
|
| 10.54 |
|
|
10-Q |
|
001-12879 |
|
10.53 |
|
4/7/17 |
|
|
|
| 10.55 |
|
|
10-Q |
|
001-12879 |
|
10.54 |
|
4/7/17 |
|
|
|
| 10.56 |
|
|
10-Q |
|
001-12879 |
|
10.56 |
|
10/10/17 |
|
|
|
| 10.57 |
|
|
10-Q |
|
001-12879 |
|
10.57 |
|
10/10/17 |
|
|
|
| 10.58 |
|
|
10-Q |
|
001-12879 |
|
10.58 |
|
10/10/17 |
|
|
|
| 10.59 |
|
|
10-Q |
|
001-12879 |
|
10.59 |
|
10/10/17 |
|
|
|
| 10.60 |
|
|
|
|
|
|
|
|
|
|
* |
|
| 10.61 |
|
|
|
|
|
|
|
|
|
|
* |
|
| 21 |
|
|
|
|
|
|
|
|
|
|
* |
|
| 23.1 |
|
|
|
|
|
|
|
|
|
|
* |
|
| 31.1 |
|
|
|
|
|
|
|
|
|
|
* |
|
| 31.2 |
|
|
|
|
|
|
|
|
|
|
* |
|
| 32.1 |
|
Certifications of Chief Executive Officer Pursuant to 18 U.S.C. Section 1350 |
|
|
|
|
|
|
|
|
|
** |
| 32.2 |
|
Certifications of Chief Financial Officer Pursuant to 18 U.S.C. Section 1350 |
|
|
|
|
|
|
|
|
|
** |
104
|
|
|
|
|
Incorporated by Reference |
|
|
||||||
|
Exhibit |
|
Exhibit Description |
|
Form |
|
File No. |
|
Exhibit |
|
Filing |
|
Filed/ |
|
101.INS |
|
XBRL Instance Document |
|
|
|
|
|
|
|
|
|
* |
|
101.SCH |
|
XBRL Taxonomy Extension Schema Document |
|
|
|
|
|
|
|
|
|
* |
|
101.CAL |
|
XBRL Taxonomy Calculation Linkbase Document |
|
|
|
|
|
|
|
|
|
* |
|
101.LAB |
|
XBRL Taxonomy Label Linkbase Document |
|
|
|
|
|
|
|
|
|
* |
|
101.PRE |
|
XBRL Taxonomy Presentation Linkbase Document |
|
|
|
|
|
|
|
|
|
* |
|
101.DEF |
|
XBRL Taxonomy Extension Definition Linkbase Document |
|
|
|
|
|
|
|
|
|
* |
† A management contract or compensatory plan or arrangement required to be filed as an exhibit pursuant to Item 15(a)(3) of Form 10‑K.
* Filed herewith.
ITEM 16. FORM 10-K SUMMARY.
N/A
105
Pursuant to the requirements of Section 13 or 15(d) of the Securities Exchange Act of 1934, the registrant has duly caused this report to be signed on its behalf by the undersigned, thereunto duly authorized.
|
|
GRIFFIN INDUSTRIAL REALTY, INC. |
|
|
|
|
|
|
Date: February 8, 2018 |
BY: |
/s/ Michael S. Gamzon
Michael S. Gamzon |
|
|
|
|
|
Date: February 8, 2018 |
BY: |
/s/ Anthony J. Galici
Anthony J. Galici |
Pursuant to the requirements of the Securities Exchange Act of 1934, this report has been signed below by the following persons on behalf of the registrant and in the capacities and on the dates indicated.
|
|
|
Date |
|
|
|
|
Name |
|
|
Title |
|
|
|
|
|
|
|
|
|
|
|
|
||||||||||||||||
|
February 8, 2018 |
/s/ david R. Bechtel David R. Bechtel |
Director |
||||||||||||||||
|
February 8, 2018 |
/s/ Edgar M. Cullman, Jr. Edgar M. Cullman, Jr. |
Director |
||||||||||||||||
|
|
|
|
||||||||||||||||
|
February 8, 2018 |
/s/ Frederick M. Danziger Frederick M. Danziger |
Executive Chairman of the Board of Directors |
||||||||||||||||
|
|
|
|
||||||||||||||||
|
February 8, 2018 |
/s/ Anthony J. Galici Anthony J. Galici |
Vice President, Chief Financial Officer and Secretary, Principal Accounting Officer |
||||||||||||||||
|
|
|
|
||||||||||||||||
|
February 8, 2018 |
/s/ Michael S. Gamzon Michael S. Gamzon |
Director and President and Chief Executive Officer |
||||||||||||||||
|
|
|
|
||||||||||||||||
|
February 8, 2018 |
/s/ Thomas C. Israel Thomas C. Israel |
Director |
||||||||||||||||
|
|
|
|
||||||||||||||||
|
February 8, 2018 |
/s/ Jonathan P. May Jonathan P. May |
Director |
||||||||||||||||
|
|
|
|
||||||||||||||||
|
February 8, 2018 |
/s/ Albert H. Small, Jr. Albert H. Small, Jr. |
Director |
||||||||||||||||
106
Schedule II – Valuation and Qualifying Accounts and Reserves
(dollars in thousands)
|
Description |
|
|
Balance at Beginning of Year |
|
Charged to Cost and Expenses |
|
Charged to Other Accounts |
|
Deductions From Reserves |
|
|
Balance at End of Year |
|
|
For the fiscal year ended November 30, 2017 |
|
|
|
|
|
|
|
|
|
|
|
|
|
|
Reserves: |
|
|
|
|
|
|
|
|
|
|
|
|
|
|
Uncollectible accounts—trade |
|
$ |
— |
|
— |
|
— |
|
— |
|
$ |
— |
|
|
Valuation allowance on deferred tax asset |
|
$ |
1,514 |
|
(151) |
|
— |
|
— |
|
$ |
1,363 |
|
|
|
|
|
|
|
|
|
|
|
|
|
|
|
|
|
For the fiscal year ended November 30, 2016 |
|
|
|
|
|
|
|
|
|
|
|
|
|
|
Reserves: |
|
|
|
|
|
|
|
|
|
|
|
|
|
|
Uncollectible accounts—trade |
|
$ |
— |
|
— |
|
— |
|
— |
|
$ |
— |
|
|
Valuation allowance on deferred tax asset |
|
$ |
345 |
|
180 |
|
989 |
|
— |
|
$ |
1,514 |
|
|
|
|
|
|
|
|
|
|
|
|
|
|
|
|
|
For the fiscal year ended November 30, 2015 |
|
|
|
|
|
|
|
|
|
|
|
|
|
|
Reserves: |
|
|
|
|
|
|
|
|
|
|
|
|
|
|
Uncollectible accounts—trade |
|
$ |
— |
|
— |
|
— |
|
— |
|
$ |
— |
|
|
Valuation allowance on deferred tax asset |
|
$ |
395 |
|
(50) |
|
— |
|
— |
|
$ |
345 |
|
S-1
Schedule III – Real Estate and Accumulated Depreciation
November 30, 2017
(dollars in thousands)
|
|
|
|
|
|
|
|
|
|
|
|
Cost |
|
|
|
|
|
|
|
|
|
|
|
|
|
|
|
|
|
|
|
|
|
|
|
|
|
|
|
|
|
|
|
|
|
|
|
|
|
|
|
|
|
|
|
|
Capitalized |
|
Gross Amount |
|
|
|
|
|
|
|
|||||||||||||||||||||||
|
|
|
|
|
|
Initial Cost |
|
Subsequent |
|
at November 30, 2017 |
|
|
|
|
|
|
|
|||||||||||||||||||||||||||
|
|
|
|
|
|
|
|
|
Bldg. & |
|
to Acquisition |
|
|
|
|
Land |
|
Bldg. & Bldg. |
|
Tenant |
|
Construction |
|
Development |
|
|
|
|
Accumulated |
|
Date of |
|
Date of |
|
Depr. |
|||||||||
|
Description |
|
Encumbrances |
|
Land |
|
Improve. |
|
Improvements |
|
Land |
|
Improvements |
|
Improvements |
|
Improvements |
|
in Progress |
|
Costs |
|
Total |
|
Depreciation |
|
Construction |
|
Acquisition |
|
Life |
|||||||||||||
|
|
|
|
|
|
|
|
|
|
|
|
|
|
|
|
|
|
|
|
|
|
|
|
|
|
|
|
|
|
|
|
|
|
|
|
|
|
|
|
|
|
|
|
|
|
CT Industrial/Warehouse Properties |
|
|
|
|
|
|
|
|
|
|
|
|
|
|
|
|
|
|
|
|
|
|
|
|
|
|
|
|
|
|
|
|
|
|
|
|
|
|
|
|
|
|
|
|
Industrial/Warehouse Building - Bloomfield |
|
$ |
- |
(b) |
$ |
1 |
|
$ |
- |
|
$ |
782 |
|
$ |
1 |
|
$ |
92 |
|
$ |
690 |
|
$ |
- |
|
$ |
- |
|
$ |
- |
|
$ |
783 |
|
$ |
(618) |
|
1988 |
|
|
|
40 |
yrs. |
|
Industrial/Warehouse Building - Bloomfield |
|
|
- |
|
|
251 |
|
|
1,198 |
|
|
1,580 |
|
|
251 |
|
|
321 |
|
|
1,740 |
|
|
717 |
|
|
- |
|
|
- |
|
|
3,029 |
|
|
(546) |
|
1997 |
|
2007 |
|
40 |
yrs. |
|
Industrial/Warehouse Building - East Granby |
|
|
13,844 |
|
|
4 |
|
|
1,722 |
|
|
922 |
|
|
4 |
|
|
774 |
|
|
1,843 |
|
|
27 |
|
|
- |
|
|
- |
|
|
2,648 |
|
|
(1,881) |
|
1982 |
|
1989 |
|
40 |
yrs. |
|
Industrial/Warehouse Building - East Granby |
|
|
- |
(a) |
|
4 |
|
|
- |
|
|
1,943 |
|
|
4 |
|
|
212 |
|
|
1,578 |
|
|
153 |
|
|
- |
|
|
- |
|
|
1,947 |
|
|
(1,425) |
|
1978 |
|
|
|
40 |
yrs. |
|
Industrial/Warehouse Building - East Granby |
|
|
- |
(a) |
|
4 |
|
|
- |
|
|
3,162 |
|
|
4 |
|
|
310 |
|
|
2,317 |
|
|
535 |
|
|
- |
|
|
- |
|
|
3,166 |
|
|
(2,131) |
|
1980 |
|
|
|
40 |
yrs. |
|
Industrial/Warehouse Building - Windsor |
|
|
- |
(a) |
|
259 |
|
|
- |
|
|
4,434 |
|
|
259 |
|
|
356 |
|
|
3,650 |
|
|
394 |
|
|
34 |
|
|
- |
|
|
4,693 |
|
|
(2,371) |
|
1998 |
|
|
|
40 |
yrs. |
|
Industrial/Warehouse Building - Windsor |
|
|
- |
(a) |
|
13 |
|
|
- |
|
|
7,494 |
|
|
13 |
|
|
525 |
|
|
5,605 |
|
|
1,364 |
|
|
- |
|
|
- |
|
|
7,507 |
|
|
(2,541) |
|
2008 |
|
|
|
40 |
yrs. |
|
Industrial/Warehouse Building - Windsor |
|
|
4,622 |
|
|
12 |
|
|
- |
|
|
8,220 |
|
|
12 |
|
|
363 |
|
|
5,145 |
|
|
2,712 |
|
|
- |
|
|
- |
|
|
8,232 |
|
|
(6,022) |
|
1999 |
|
|
|
40 |
yrs. |
|
Industrial/Warehouse Building - Windsor |
|
|
- |
(a) |
|
7 |
|
|
- |
|
|
3,381 |
|
|
7 |
|
|
20 |
|
|
3,175 |
|
|
186 |
|
|
- |
|
|
- |
|
|
3,388 |
|
|
(1,497) |
|
2001 |
|
|
|
40 |
yrs. |
|
Industrial/Warehouse Building - Windsor |
|
|
17,308 |
|
|
13 |
|
|
- |
|
|
5,650 |
|
|
13 |
|
|
35 |
|
|
5,044 |
|
|
571 |
|
|
- |
|
|
- |
|
|
5,663 |
|
|
(2,586) |
|
2003 |
|
|
|
40 |
yrs. |
|
Industrial/Warehouse Building - Windsor |
|
|
- |
(a) |
|
16 |
|
|
- |
|
|
7,605 |
|
|
16 |
|
|
80 |
|
|
6,903 |
|
|
622 |
|
|
- |
|
|
- |
|
|
7,621 |
|
|
(3,236) |
|
2006 |
|
|
|
40 |
yrs. |
|
Industrial/Warehouse Building - Windsor |
|
|
- |
(a) |
|
15 |
|
|
- |
|
|
17,203 |
|
|
15 |
|
|
154 |
|
|
13,876 |
|
|
3,173 |
|
|
- |
|
|
- |
|
|
17,218 |
|
|
(4,604) |
|
2005 |
|
|
|
40 |
yrs. |
|
Industrial/Warehouse Building - Windsor |
|
|
10,523 |
|
|
57 |
|
|
- |
|
|
16,014 |
|
|
57 |
|
|
1,031 |
|
|
13,886 |
|
|
1,097 |
|
|
- |
|
|
- |
|
|
16,071 |
|
|
(4,304) |
|
2009 |
|
|
|
40 |
yrs. |
|
Industrial/Warehouse Building - Windsor |
|
|
11,826 |
|
|
20 |
|
|
- |
|
|
10,026 |
|
|
20 |
|
|
578 |
|
|
8,165 |
|
|
1,283 |
|
|
- |
|
|
- |
|
|
10,046 |
|
|
(2,682) |
|
2007 |
|
|
|
40 |
yrs. |
|
Industrial/Warehouse Building - Windsor |
|
|
- |
(a) |
|
12 |
|
|
- |
|
|
6,962 |
|
|
12 |
|
|
448 |
|
|
6,297 |
|
|
217 |
|
|
- |
|
|
- |
|
|
6,974 |
|
|
(2,344) |
|
2007 |
|
|
|
40 |
yrs. |
|
Industrial/Warehouse Building - Windsor |
|
|
- |
|
|
16 |
|
|
- |
|
|
9,149 |
|
|
16 |
|
|
2,249 |
|
|
6,249 |
|
|
651 |
|
|
- |
|
|
- |
|
|
9,165 |
|
|
(41) |
|
2017 |
|
|
|
40 |
yrs. |
|
Industrial/Warehouse Building - Windsor |
|
|
6,597 |
|
|
19 |
|
|
- |
|
|
8,229 |
|
|
19 |
|
|
164 |
|
|
8,065 |
|
|
- |
|
|
- |
|
|
- |
|
|
8,248 |
|
|
(3,478) |
|
2001 |
|
|
|
40 |
yrs. |
|
|
|
|
|
|
|
|
|
|
|
|
|
|
|
|
|
|
|
|
|
|
|
|
|
|
|
|
|
|
|
|
|
|
|
|
|
|
|
|
|
|
|
|
|
|
PA Industrial/Warehouse Properties |
|
|
|
|
|
|
|
|
|
|
|
|
|
|
|
|
|
|
|
|
|
|
|
|
|
|
|
|
|
|
|
|
|
|
|
|
|
|
|
|
|
|
|
|
Industrial/Warehouse Building - Breinigsville |
|
|
3,478 |
|
|
832 |
|
|
4,599 |
|
|
- |
|
|
832 |
|
|
349 |
|
|
4,029 |
|
|
221 |
|
|
- |
|
|
- |
|
|
5,431 |
|
|
(1,356) |
|
|
|
2010 |
|
40 |
yrs. |
|
Industrial/Warehouse Building - Lower Nazareth Township |
|
|
20,221 |
|
|
1,351 |
|
|
- |
|
|
15,490 |
|
|
1,351 |
|
|
1,366 |
|
|
12,874 |
|
|
1,250 |
|
|
- |
|
|
- |
|
|
16,841 |
|
|
(2,078) |
|
2014 |
|
|
|
40 |
yrs. |
|
Industrial/Warehouse Building - Lower Nazareth Township |
|
|
- |
(a) |
|
721 |
|
|
- |
|
|
11,148 |
|
|
721 |
|
|
1,359 |
|
|
8,968 |
|
|
821 |
|
|
- |
|
|
- |
|
|
11,869 |
|
|
(2,447) |
|
2012 |
|
|
|
40 |
yrs. |
|
Industrial/Warehouse Building - Hanover Township |
|
|
26,076 |
|
|
4,022 |
|
|
- |
|
|
16,279 |
|
|
4,022 |
|
|
3,989 |
|
|
11,076 |
|
|
1,214 |
|
|
- |
|
|
- |
|
|
20,301 |
|
|
(1,669) |
|
2015 |
|
|
|
40 |
yrs. |
|
Industrial/Warehouse Building - Hanover Township |
|
|
- |
(a) |
|
3,620 |
|
|
- |
|
|
15,542 |
|
|
3,620 |
|
|
4,468 |
|
|
9,134 |
|
|
1,940 |
|
|
- |
|
|
- |
|
|
19,162 |
|
|
(873) |
|
2016 |
|
|
|
40 |
yrs. |
|
|
|
|
|
|
|
|
|
|
|
|
|
|
|
|
|
|
|
|
|
|
|
|
|
|
|
|
|
|
|
|
|
|
|
|
|
|
|
|
|
|
|
|
|
|
NC Industrial/Warehouse Property |
|
|
|
|
|
|
|
|
|
|
|
|
|
|
|
|
|
|
|
|
|
|
|
|
|
|
|
|
|
|
|
|
|
|
|
|
|
|
|
|
|
|
|
|
Industrial/Warehouse Building - Concord |
|
|
12,115 |
|
|
1,600 |
|
|
15,189 |
|
|
180 |
|
|
1,600 |
|
|
1,573 |
|
|
12,910 |
|
|
846 |
|
|
40 |
|
|
- |
|
|
16,969 |
|
|
(313) |
|
|
|
2017 |
|
40 |
yrs. |
|
|
|
|
|
|
|
|
|
|
|
|
|
|
|
|
|
|
|
|
|
|
|
|
|
|
|
|
|
|
|
|
|
|
|
|
|
|
|
|
|
|
|
|
|
|
Office/Flex Properties |
|
|
|
|
|
|
|
|
|
|
|
|
|
|
|
|
|
|
|
|
|
|
|
|
|
|
|
|
|
|
|
|
|
|
|
|
|
|
|
|
|
|
|
|
Office/Flex Building - Bloomfield |
|
|
- |
(b) |
|
5 |
|
|
- |
|
|
4,307 |
|
|
5 |
|
|
594 |
|
|
2,961 |
|
|
752 |
|
|
- |
|
|
- |
|
|
4,312 |
|
|
(3,681) |
|
1977 |
|
|
|
40 |
yrs. |
|
Office/Flex Building - Bloomfield |
|
|
- |
(b) |
|
4 |
|
|
- |
|
|
2,777 |
|
|
4 |
|
|
269 |
|
|
1,962 |
|
|
546 |
|
|
- |
|
|
- |
|
|
2,781 |
|
|
(2,321) |
|
1985 |
|
|
|
40 |
yrs. |
|
Office/Flex Building - Bloomfield |
|
|
- |
(b) |
|
2 |
|
|
- |
|
|
2,332 |
|
|
2 |
|
|
384 |
|
|
1,723 |
|
|
225 |
|
|
- |
|
|
- |
|
|
2,334 |
|
|
(1,599) |
|
1988 |
|
|
|
40 |
yrs. |
|
Office/Flex Building - Bloomfield |
|
|
- |
(b) |
|
2 |
|
|
- |
|
|
3,126 |
|
|
2 |
|
|
195 |
|
|
2,248 |
|
|
683 |
|
|
- |
|
|
- |
|
|
3,128 |
|
|
(1,128) |
|
1989 |
|
|
|
40 |
yrs. |
|
Office/Flex Building - Bloomfield |
|
|
- |
(b) |
|
3 |
|
|
- |
|
|
1,743 |
|
|
3 |
|
|
140 |
|
|
1,354 |
|
|
249 |
|
|
- |
|
|
- |
|
|
1,746 |
|
|
(1,094) |
|
1990 |
|
|
|
40 |
yrs. |
|
Office/Flex Building - Bloomfield |
|
|
- |
(b) |
|
3 |
|
|
- |
|
|
1,540 |
|
|
3 |
|
|
62 |
|
|
1,347 |
|
|
131 |
|
|
- |
|
|
- |
|
|
1,543 |
|
|
(1,047) |
|
1991 |
|
|
|
40 |
yrs. |
|
Office/Flex Building - Bloomfield |
|
|
- |
(b) |
|
3 |
|
|
- |
|
|
847 |
|
|
3 |
|
|
65 |
|
|
667 |
|
|
115 |
|
|
- |
|
|
- |
|
|
850 |
|
|
(611) |
|
1991 |
|
|
|
40 |
yrs. |
|
Office/Flex Building - Bloomfield |
|
|
- |
(b) |
|
9 |
|
|
- |
|
|
4,564 |
|
|
9 |
|
|
28 |
|
|
3,690 |
|
|
846 |
|
|
- |
|
|
- |
|
|
4,573 |
|
|
(1,822) |
|
2001 |
|
|
|
40 |
yrs. |
|
Office/Flex Building - Windsor |
|
|
- |
(b) |
|
17 |
|
|
- |
|
|
6,052 |
|
|
17 |
|
|
434 |
|
|
4,470 |
|
|
1,148 |
|
|
- |
|
|
- |
|
|
6,069 |
|
|
(3,134) |
|
2002 |
|
|
|
40 |
yrs. |
|
Office/Flex Building - Windsor |
|
|
4,367 |
|
|
616 |
|
|
3,954 |
|
|
2,762 |
|
|
616 |
|
|
375 |
|
|
4,841 |
|
|
1,500 |
|
|
- |
|
|
- |
|
|
7,332 |
|
|
(3,057) |
|
1982 |
|
2003 |
|
40 |
yrs. |
|
Office/Flex Building - Windsor |
|
|
- |
(a) |
|
577 |
|
|
4,004 |
|
|
1,758 |
|
|
577 |
|
|
381 |
|
|
4,147 |
|
|
1,226 |
|
|
8 |
|
|
- |
|
|
6,339 |
|
|
(3,299) |
|
1987 |
|
2003 |
|
40 |
yrs. |
|
Restaurant Building - Windsor |
|
|
- |
|
|
1 |
|
|
- |
|
|
2,196 |
|
|
1 |
|
|
266 |
|
|
1,414 |
|
|
509 |
|
|
7 |
|
|
- |
|
|
2,197 |
|
|
(1,697) |
|
1983 |
|
|
|
40 |
yrs. |
|
|
|
|
|
|
|
|
|
|
|
|
|
|
|
|
|
|
|
|
|
|
|
|
|
|
|
|
|
|
|
|
|
|
|
|
|
|
|
|
|
|
|
|
|
|
Other |
|
|
|
|
|
|
|
|
|
|
|
|
|
|
|
|
|
|
|
|
|
|
|
|
|
|
|
|
|
|
|
|
|
|
|
|
|
|
|
|
|
|
|
|
Nursery Farm - Granby, CT |
|
|
- |
|
|
405 |
|
|
- |
|
|
10,988 |
|
|
405 |
|
|
1,565 |
|
|
9,423 |
|
|
- |
|
|
- |
|
|
- |
|
|
11,393 |
|
|
(10,475) |
|
|
|
1959 |
|
20 |
yrs. |
|
Nursery Farm - Quincy, FL |
|
|
- |
|
|
279 |
|
|
- |
|
|
8,697 |
|
|
279 |
|
|
4,089 |
|
|
4,608 |
|
|
- |
|
|
- |
|
|
- |
|
|
8,976 |
|
|
(7,971) |
|
|
|
1959 |
|
20 |
yrs. |
|
Undeveloped land - New England Tradeport |
|
|
- |
|
|
738 |
|
|
- |
|
|
2,977 |
|
|
738 |
|
|
90 |
|
|
- |
|
|
- |
|
|
84 |
|
|
2,803 |
|
|
3,715 |
|
|
(62) |
|
|
|
|
|
|
|
|
Undeveloped land - Griffin Center/Griffin Center South |
|
|
- |
|
|
435 |
|
|
- |
|
|
1,572 |
|
|
435 |
|
|
451 |
|
|
- |
|
|
- |
|
|
- |
|
|
1,121 |
|
|
2,007 |
|
|
(442) |
|
|
|
|
|
|
|
|
Undeveloped land - Phoenix Crossing |
|
|
- |
|
|
60 |
|
|
- |
|
|
1,464 |
|
|
60 |
|
|
- |
|
|
- |
|
|
- |
|
|
- |
|
|
1,464 |
|
|
1,524 |
|
|
- |
|
|
|
|
|
|
|
|
Undeveloped land - Lehigh Valley, PA |
|
|
- |
|
|
2,344 |
|
|
- |
|
|
313 |
|
|
2,344 |
|
|
- |
|
|
- |
|
|
- |
|
|
313 |
|
|
- |
|
|
2,657 |
|
|
- |
|
|
|
|
|
|
|
|
Undeveloped land - Other |
|
|
- |
|
|
1,830 |
|
|
- |
|
|
1,036 |
|
|
1,830 |
|
|
629 |
|
|
- |
|
|
- |
|
|
- |
|
|
407 |
|
|
2,866 |
|
|
(629) |
|
|
|
|
|
|
|
|
Residential Development - Simsbury, CT |
|
|
- |
|
|
201 |
|
|
- |
|
|
8,337 |
|
|
201 |
|
|
- |
|
|
- |
|
|
- |
|
|
- |
|
|
8,337 |
|
|
8,538 |
|
|
- |
|
|
|
|
|
|
|
|
|
|
$ |
130,977 |
|
$ |
20,403 |
|
$ |
30,666 |
|
$ |
240,783 |
|
$ |
20,403 |
|
$ |
30,833 |
|
$ |
198,074 |
|
$ |
27,924 |
|
$ |
486 |
|
$ |
14,132 |
|
$ |
291,852 |
(c) |
$ |
(95,112) |
|
|
|
|
|
|
|
|
(a) |
Building included in mortgage listed on line above. |
|
(b) |
Buildings included as collateral for a $15,000 revolving line of credit. |
S-2
Schedule III – Real Estate and Accumulated Depreciation (Continued)
(dollars in thousands)
Fiscal year ended November 30, 2017
|
|
|
Cost |
|
Reserve |
|
||
|
Balance at beginning of year |
|
$ |
259,061 |
|
$ |
(86,801) |
|
|
Changes during the year: |
|
|
|
|
|
|
|
|
Additions to real estate assets |
|
|
35,036 |
|
|
— |
|
|
Additions to reserve charged to costs and expense |
|
|
— |
|
|
(8,831) |
|
|
Reclassification to real estate held for sale |
|
|
(2,047) |
|
|
322 |
|
|
Writeoff of fully depreciated assets |
|
|
(198) |
|
|
198 |
|
|
Balance at end of year |
|
$ |
291,852 |
|
$ |
(95,112) |
|
Fiscal year ended November 30, 2016
|
|
|
Cost |
|
Reserve |
|
||
|
Balance at beginning of year |
|
$ |
247,239 |
|
$ |
(80,784) |
|
|
Changes during the year: |
|
|
|
|
|
|
|
|
Additions to real estate assets |
|
|
15,702 |
|
|
— |
|
|
Additions to reserve charged to costs and expense |
|
|
— |
|
|
(7,768) |
|
|
Reclassification to real estate held for sale |
|
|
(2,129) |
|
|
— |
|
|
Writeoff of fully depreciated assets |
|
|
(1,751) |
|
|
1,751 |
|
|
Balance at end of year |
|
$ |
259,061 |
|
$ |
(86,801) |
|
Fiscal year ended November 30, 2015
|
|
|
Cost |
|
Reserve |
|
||
|
Balance at beginning of year |
|
$ |
209,284 |
|
$ |
(74,762) |
|
|
Changes during the year: |
|
|
|
|
|
|
|
|
Additions to real estate assets |
|
|
30,556 |
|
|
— |
|
|
Additions to reserve charged to costs and expense |
|
|
— |
|
|
(6,539) |
|
|
Reclassification to real estate held for sale |
|
|
7,916 |
|
|
— |
|
|
Writeoff of fully depreciated assets |
|
|
(517) |
|
|
517 |
|
|
Balance at end of year |
|
$ |
247,239 |
|
$ |
(80,784) |
|
S-3