Attached files
| file | filename |
|---|---|
| 8-K - FORM 8-K - DELTA AIR LINES, INC. | delta_i8k.htm |
Exhibit 99.1
Delta Air Lines Bernstein Strategic Decisions Conference Ed Bastian – CEO June 3, 2021

1 Forward - looking Statement Disclaimer The statements in this presentation that are not historical facts, including statements regarding our estimates, expectation s, beliefs, intentions, projections, goals, aspirations, commitments or strategies for the future, should be considered “forward - looking sta tements” under the Securities Act of 1933, as amended, the Securities Exchange Act of 1934, as amended, and the Private Securities Li tig ation Reform Act of 1995. Such statements are not guarantees or promised outcomes and should not be construed as such. All forward - loo king statements involve a number of risks and uncertainties that could cause actual results to differ materially from the estimate s, expectations, beliefs, intentions, projections, goals, aspirations, commitments and strategies reflected in or suggested by the forward - lookin g statements. These risks and uncertainties include, but are not limited to, the material adverse effect that the COVID - 19 pandemic is having on our business; the impact of incurring significant debt in response to the pandemic; failure to comply with the financial and othe r c ovenants in our financing agreements; the possible effects of accidents involving our aircraft; breaches or security lapses in our inform ati on technology systems; breaches or lapses in the security of technology systems on which we rely; disruptions in our information technology infrastructure; our dependence on technology in our operations; our commercial relationships with airlines in other parts of the world and the investments we have in certain of those airlines; the effects of a significant disruption in the operations or performanc e o f third parties on which we rely; failure to realize the full value of intangible or long - lived assets; labor issues; the effects of weather, na tural disasters and seasonality on our business; the cost of aircraft fuel; the availability of aircraft fuel; failure or inability of insurance to cover a significant liability at Monroe’s Trainer refinery; the impact of environmental regulation on the Trainer refinery, including costs relat ed to renewable fuel standard regulations; our ability to retain senior management, key employees and our culture; significant damage to our rep utation and brand, including from exposure to significant adverse publicity; the effects of terrorist attacks or geopolitical conflict; c omp etitive conditions in the airline industry; interruptions or disruptions in service at major airports at which we operate or significant problem s a ssociated with types of aircraft or engines we operate; the effects of extensive government regulation on our business; the impact of enviro nme ntal regulation and climate change risks on our business; and unfavorable economic or political conditions in the markets in which we operate. Additional information concerning risks and uncertainties that could cause differences between actual results and forward - lookin g statements is contained in our Securities and Exchange Commission filings, including our Annual Report on Form 10 - K for the fisc al year ended December 31, 2020 and our Quarterly Report on Form 10 - Q for the quarterly period ended March 31, 2021. Caution should be taken not to place undue reliance on our forward - looking statements, which represent our views only as of June 3, 2021, except a s otherwise indicated, and which we have no current intention to update except to the extent required by law.

2 Continued Steady Demand Recovery in the June Quarter • Domestic leisure travel expected to be more than 100% restored in June month, up from 60% in March • Forward premium revenue growth is outpacing main cabin and upsell rates are improving • Continued leisure , growing corporate , and initial Transatlantic demand drive next leg of recovery in the second half of 2021, with remaining long - haul international expected to recover in 2022 Mar 21 Month Jun 21E Month Load Factor & Yield Improving Through the Quarter ~25 pts System Load Factor Mar 21 Month Jun 21E Month ~5 - 10% System Yield
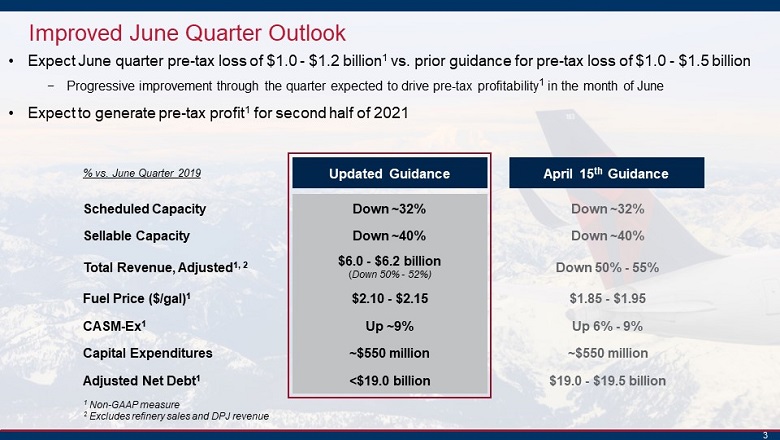
3 % vs. June Quarter 2019 Updated Guidance April 15 th Guidance Improved June Quarter Outlook • Expect June quarter pre - tax loss of $1.0 - $1.2 billion 1 vs. prior guidance for pre - tax loss of $1.0 - $1.5 billion − Progressive improvement through the quarter expected to drive pre - tax profitability 1 in the month of June • Confident in our ability to generate pre - tax profit 1 for second half of 2021 Scheduled Capacity Down ~32% Down ~32% Sellable Capacity Down ~40% Down ~40% Total Revenue, Adjusted 1, 2 $6.0 - $6.2 billion ( Down 50% - 52%) Down 50% - 55% Fuel Price ($/gal) 1 $2.10 - $2.15 $1.85 - $1.95 CASM - Ex 1 Up ~9% Up 6% - 9% Capital Expenditures ~$550 million ~$550 million Adjusted Net Debt 1 <$19.0 billion $19.0 - $19.5 billion 1 Non - GAAP measure 2 Excludes refinery sales and DPJ revenue
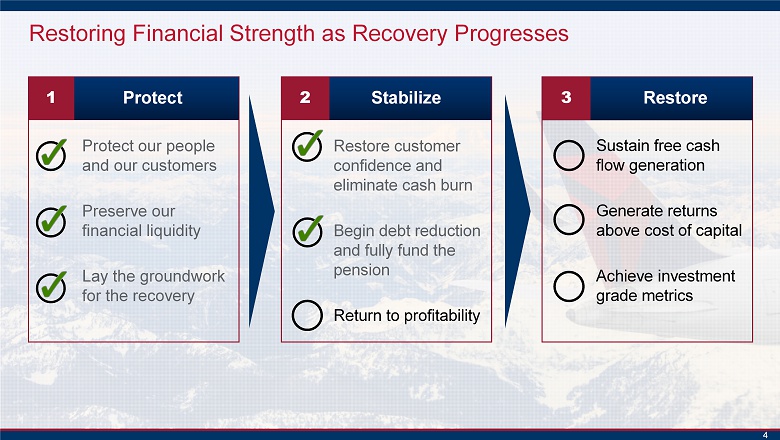
4 Restoring Financial Strength as Recovery Progresses 1 Protect Stabilize 2 Restore 3 Protect our people and our customers Preserve our financial liquidity Lay the groundwork for the recovery Restore customer confidence and eliminate cash burn Begin debt reduction and fully fund the pension Return to profitability Sustain free cash flow generation Generate returns above cost of capital Achieve investment grade metrics

5 Our Recovery Path is Underpinned by Key Focus Areas Leveraging Brand Loyalty Restoring our Balance Sheet Driving Efficiency Targeting non - fuel CASM below 2019 by December quarter and accelerated fleet renewal efforts Positioned to achieve 2019 revenues no later than 2023 on more efficient cost structure Enhancing customer trust and increasing value proposition enhances brand and product affinity Initial phase of debt reduction completed, evaluating additional opportunities to de - lever

6 Our Journey to Reclaim Investment Grade Metrics Has Begun Paying down debt Fully funding our pension on a PPA 1 basis Rebuilding our unencumbered asset base Reduction in non - op expense Elimination of future material pension contributions Protection of equity holder upside during recovery Delta’s Chg. in Financial Obligations (Chg. from end of 3Q20 to end of 2Q21E) ($9B) ($9B) ($1.5B) $2B Debt Paydown Pension Contributions Debt Issuance Net Chg. In Financial Obligations 2 Significantly improved pension funding position reduces overall debt, lowers risk and is expected to eliminate future material cash contributions 1 Pension Protection Act, 2 Largely from loan components of PSP2 and PSP3

7 Unit Cost Trajectory Improving as We Return to Scale 13.3% 1Q21 2Q21E 4Q21E ~9% Expected CASM - Ex 1 Progression to 2019 Levels ~4 pts of rebuild 64% ~68% ~85% ASMs vs. 2019 Rebuild Expense Volume/Mix Expense Headwinds Tailwinds • Scale – return to scale and asset utilization • Mix – progressive return of long - haul international • Fleet – simplification and upgauging • Customer - facing products and services • Selling costs as revenue recovers • Aircraft maintenance • Frontline hiring • Crew training • Driving volume leverage and productivity to preserve structural cost reductions achieved in 2020 • Continue to target non - fuel unit costs below 2019 in December quarter 2021 1.0 - 1.5 pt of employee recognition 1 Non - GAAP measure

8 Fleet Renewal Builds a Simpler, More Sustainable Fleet • Preserving optionality with levers to flex our capacity restoration depending on the shape of the recovery Fleet Simplification and Gauge Growth 13 Fleet Families 9 Fleet Families 2019 2025 Aircraft gauge estimated to increase 10+ points by 2025 Fleet Strategy Guideposts Creates a younger mainline fleet with an improved customer experience through renewal efforts Scale Simplification Sustainability Reduces mainline pilot categories from 10 to 7 Gauge Leveraging larger gauge 1 aircraft to drive greater seat cost efficiency Replacing older aircraft with aircraft that are 25% or more efficient 1 Average seats per aircraft

9 Competitive Advantages Demonstrated Resiliency Through Crisis People Network Operational Reliability Balance Sheet Customer Loyalty At the core of Delta’s culture are passionate and determined professionals with an innate sense of caring for our customers America’s best - run airline, consistently delivering industry - leading operational results and driving further improvement and efficiencies through innovation Best domestic connecting hub complex – including the world’s most efficient hub in Atlanta – and a premier network of international partners with strong global coverage Delta’s ascending brand and strong partnership with American Express combine to produce high - value loyalty program Strength of our balance sheet enabled us to manage through the worst crisis in our history without issuing equity. Journey of restoring our balance sheet to investment grade metrics has begun

10 Strong Brand and Competitive Advantages Enable Value Creation Powerful Brand Drives Revenue Premium Strong Partner Portfolio and Global Scale Resilient Competitive Advantages Proven Track Record of Execution & Reinvestment Commitment to Carbon Neutrality and Environmental Sustainability

Non - GAAP Financial Measures Delta sometimes uses information ("non - GAAP financial measures") that is derived from the Consolidated Financial Statements, but that is not presented in accordance with accounting principles generally accepted in the U.S. (“GAAP”). Under the U.S. Securities and Exc han ge Commission rules, non - GAAP financial measures may be considered in addition to results prepared in accordance with GAAP, but sho uld not be considered a substitute for or superior to GAAP results. The tables below show reconciliations of non - GAAP financial measures used in this update to the most directly comparable GAAP financial measures. Reconciliations may not calculate due to rounding. Delta is not able to reconcile forward looking non - GAAP financial measures because the adjusting items such as those used in the reconciliations below will not be known until the end of the period and could be significant.
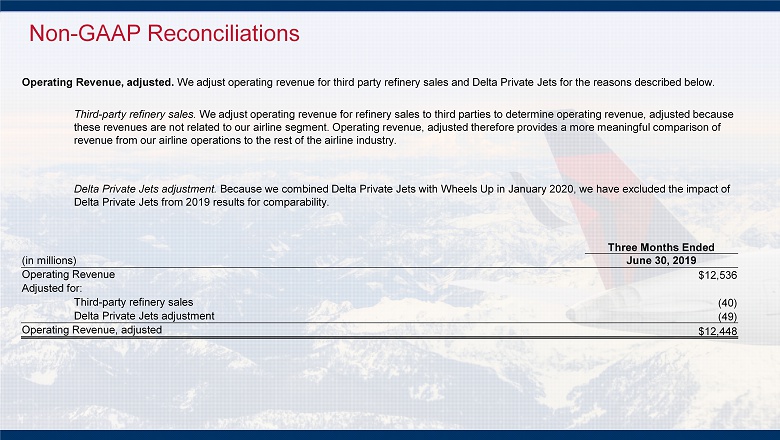
Non - GAAP Reconciliations Operating Revenue, adjusted. We adjust operating revenue for third party refinery sales and Delta Private Jets for the reasons described below. Third - party refinery sales. We adjust operating revenue for refinery sales to third parties to determine operating revenue, adjusted because these revenues are not related to our airline segment. Operating revenue, adjusted therefore provides a more meaningful compa ris on of revenue from our airline operations to the rest of the airline industry. Delta Private Jets adjustment. Because we combined Delta Private Jets with Wheels Up in January 2020, we have excluded the impact of Delta Private Jets from 2019 results for comparability. Three Months Ended (in millions) June 30, 2019 Operating Revenue $12,536 Adjusted for: Third - party refinery sales (40) Delta Private Jets adjustment (49) Operating Revenue, adjusted $12,448

Non - GAAP Reconciliations Non - Fuel Unit Cost or Cost per Available Seat Mile, ("CASM - Ex"). In the 2021 period, CASM - Ex excludes the following items directly related to the impact of COVID - 19 and our response: Restructuring charges. During 2020, we recorded restructuring charges, including certain accruals, following strategic business decisions in respons e to the COVID - 19 pandemic. In the March quarter 2021, we recognized $44 million of adjustments to certain of those restructuring charges, representing changes in our estimates. Government grant recognition. We recognized $1.2 billion of the grant proceeds from the first payroll support program extension as a contra - expense. We are re cognizing the grant proceeds as contra - expense based on the periods that the funds are intended to compensate and expect to use all proceeds from the first payroll sup port program extension by the end of the June quarter 2021. We adjust for refinery sales and Delta Private Jets for the same reason described above under the heading operating revenue, adj usted. We also adjust CASM for the following items to determine CASM - Ex for the reasons described below. Aircraft fuel and related taxes. The volatility in fuel prices impacts the comparability of year - over - year financial performance. The adjustment for aircraft fue l and related taxes allows investors to understand and analyze our non - fuel costs and year - over - year financial performance. Profit sharing. We adjust for profit sharing because this adjustment allows investors to better understand and analyze our recurring cost per for mance and provides a more meaningful comparison of our core operating costs to the airline industry. Three Months Ended Three Months Ended Year Ended Three Months Ended Three Months Ended (in cents) March 31, 2021 December 31, 2019 December 31, 2019 June 30, 2019 March 31, 2019 CASM 13.83 15.34 14.67 14.51 15.14 Adjusted for: Restructuring charges 0.11 - - - - Government grant recognition 2.96 - - - - Aircraft fuel and related taxes (2.54) (3.08) (3.10) (3.19) (3.17) Third - party refinery sales (1.35) - (0.04) (0.06) (0.08) Profit Sharing - (0.59) (0.60) (0.72) (0.35) Delta Private Jets adjustment - (0.07) (0.06) (0.06) (0.05) Operating Revenue, adjusted 13.01 11.59 10.88 10.47 11.49