Attached files
| file | filename |
|---|---|
| 8-K - FORM 8-K - COMMUNITY FINANCIAL CORP /MD/ | f8k_052721.htm |
Exhibit 99.1
1 Investor Presentation First Quarter 2021 Financial Update May 27, 2021 (NASDAQ: “TCFC”)
Disclaimer 2 This investor presentation contains, and future oral and written statements of The Community Financial Corporation (the “Company” or “TCFC”) and its wholly - owned banking subsidiary, Community Bank of the Chesapeake (the “Bank”), and its management may contain, statements about future events that constitute forward - looking statements within the meaning of the Private Securities Litigation Reform Act of 1995 . Forward - looking statements can generally be identified by the fact that they do not relate strictly to historical or current facts . They often include words like “believe,” “expect,” “anticipate,” “estimate,” and “intend” or future or conditional verbs such as “will,” “would,” “should,” “could,” or “may . ” Statements in this investor presentation that are not strictly historical are forward - looking and are based upon current expectations that may differ materially from actual results . These forward - looking statements include without limitation, those relating to the Company’s and the Bank’s future growth and management’s outlook or expectations for revenue, asset quality, profitability, business prospects, net interest margin, non - interest revenue, allowance for loan losses, the level of credit losses from lending, liquidity levels, capital levels, or future financial or business performance strategies or expectations, and any statements of the plans and objectives of management for future operations, products or services, including the expected benefits from and/or the execution of integration plans relating to any acquisition we have undertaken or that we undertake in the future ; plans and cost savings regarding branch closings or consolidation ; any statement of expectation or belief ; projections related to certain financial metrics ; and any statement of assumptions underlying the foregoing . These forward - looking statements express management’s current expectations or forecasts of future events, results and conditions, and by their nature are subject to and involve risks and uncertainties that could cause actual results to differ materially from those anticipated by the statements made herein . Factors that might cause actual results to differ materially from those made in such statements include, but are not limited to : risks, uncertainties and other factors relating to the COVID - 19 pandemic, (including the length of time that the pandemic continues, the ability of states and local governments to successfully implement the lifting of restrictions on movement and the potential imposition of further restrictions on movement and travel in the future, the effect of the pandemic on the general economy and on the businesses of our borrowers and their ability to make payments on their obligations ; the remedial actions and stimulus measures adopted by federal, state and local governments, and the inability of employees to work due to illness, quarantine, or government mandates) ; the synergies and other expected financial benefits from any acquisition that we have undertaken or may undertake in the future, may or may not be realized within the expected time frames ; changes in the Company’s or Bank’s strategy ; costs or difficulties related to integration matters might be greater than expected ; availability of and costs associated with obtaining adequate and timely sources of liquidity ; the ability to maintain credit quality ; general economic trends ; changes in interest rates ; loss of deposits and loan demand to other financial institutions ; substantial changes in financial markets ; changes in real estate value and the real estate market ; the impact of government shutdowns or sequestration ; the possibility of unforeseen events affecting the industry generally ; the uncertainties associated with newly developed or acquired operations ; the outcome of pending or threatened litigation, or of matters before regulatory agencies, whether currently existing or commencing in the future ; market disruptions and other effects of terrorist activities ; and the matters described in “Item 1 A Risk Factors” in the Company’s Annual Report on Form 10 - K for the Year Ended December 31 , 2020 and in its other Reports filed with the Securities and Exchange Commission (the “SEC”) . The Company’s forward - looking statements may also be subject to other risks and uncertainties, including those that it may discuss elsewhere in this news release or in its filings with the SEC, accessible on the SEC’s Web site at www . sec . gov . The Company undertakes no obligation to update these forward - looking statements to reflect events or circumstances after the date hereof or to reflect the occurrence of unforeseen events, except as required under the rules and regulations of the SEC . This investor presentation has been prepared by the Company solely for informational purposes based on its own information, as well as information from public sources . Certain of the information contained herein may be derived from information provided by industry sources . The Company believes such information is accurate and that the sources from which it has been obtained are reliable . However, the Company has not independently verified such information and cannot guarantee the accuracy of such information . This investor presentation has been prepared to assist interested parties in making their own evaluation of the Company and does not purport to contain all of the information that may be relevant . In all cases, interested parties should conduct their own investigation and analysis of the Company and the data set forth in the investor presentation and other information provided by or on behalf of the Company . This investor presentation is not an offer to sell securities and it is not soliciting an offer to buy securities in any state where the offer or sale is not permitted . Neither the SEC nor any other regulatory body has approved or disapproved of the securities of the Company or passed upon the accuracy or adequacy of this presentation . Any representation to the contrary is a criminal offense . Pro Forma and Projected Information This investor presentation contains certain pro forma and projected information, including projected pro forma information that reflects the Company’s current expectations and assumptions . This pro forma information does not purport to present the results that the Company will ultimately realize . Non - GAAP Financials This investor presentation includes certain non - GAAP financial measures intended to supplement, not substitute for, comparable GAAP measures and the Company’s reported results prepared in accordance with GAAP . Reconciliations of non - GAAP financial measures to GAAP financial measures are provided at the end of the presentation . Numbers in this presentation may not sum due to rounding .
Company Overview 3
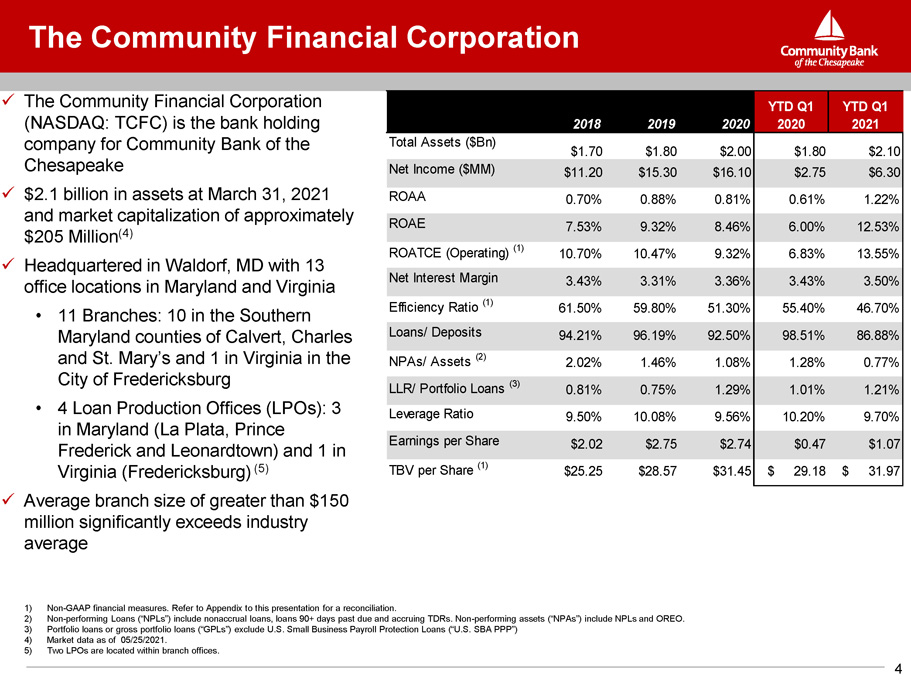
The Community Financial Corporation x The Community Financial Corporation (NASDAQ: TCFC) is the bank holding company for Community Bank of the Chesapeake x $2.1 billion in assets at March 31, 2021 and market capitalization of approximately $205 Million (4) x Headquartered in Waldorf, MD with 13 office locations in Maryland and Virginia • 11 Branches: 10 in the Southern Maryland counties of Calvert, Charles and St. Mary’s and 1 in Virginia in the City of Fredericksburg • 4 Loan Production Offices (LPOs): 3 in Maryland (La Plata, Prince Frederick and Leonardtown) and 1 in Virgini a (Fredericksb u r g ) (5) x Average branch size of greater than $150 million significantly exceeds industry average 1) Non - GAAP financial measures. Refer to Appendix to this presentation for a reconciliation. 2) Non - performing Loans (“NPLs”) include nonaccrual loans, loans 90+ days past due and accruing TDRs. Non - performing assets (“NPAs”) include NPLs and OREO. 3) Portfolio loans or gross portfolio loans (“GPLs”) exclude U.S. Small Business Payroll Protection Loans (“U.S. SBA PPP”) 4) Market data as of 05/25/2021. 5) Two LPOs are located within branch offices. 2018 2019 2020 Y TD Q 1 2020 Y TD Q 1 2021 Total Assets ($Bn) $1.70 $1.80 $2.00 $1.80 $2.10 Net Income ($MM) $11.20 $15.30 $16.10 $2.75 $6.30 ROAA 0.70% 0.88% 0.81% 0.61% 1.22% ROAE 7.53% 9.32% 8.46% 6.00% 12.53% ROATCE (Operating) (1) 10.70% 10.47% 9.32% 6.83% 13.55% Net Interest Margin 3.43% 3.31% 3.36% 3.43% 3.50% Efficiency Ratio (1) 61.50% 59.80% 51.30% 55.40% 46.70% Loans/ Deposits 94.21% 96.19% 92.50% 98.51% 86.88% NPAs/ Assets (2) 2.02% 1.46% 1.08% 1.28% 0.77% LLR/ Portfolio Loans (3) 0.81% 0.75% 1.29% 1.01% 1.21% Le v e r ag e R a t i o 9.50% 10.08% 9.56% 10.20% 9.70% Earnings per Share $2.02 $2.75 $2.74 $0.47 $1.07 TBV per Share (1) $25.25 $28.57 $31.45 $ 29.18 $ 31.97 4
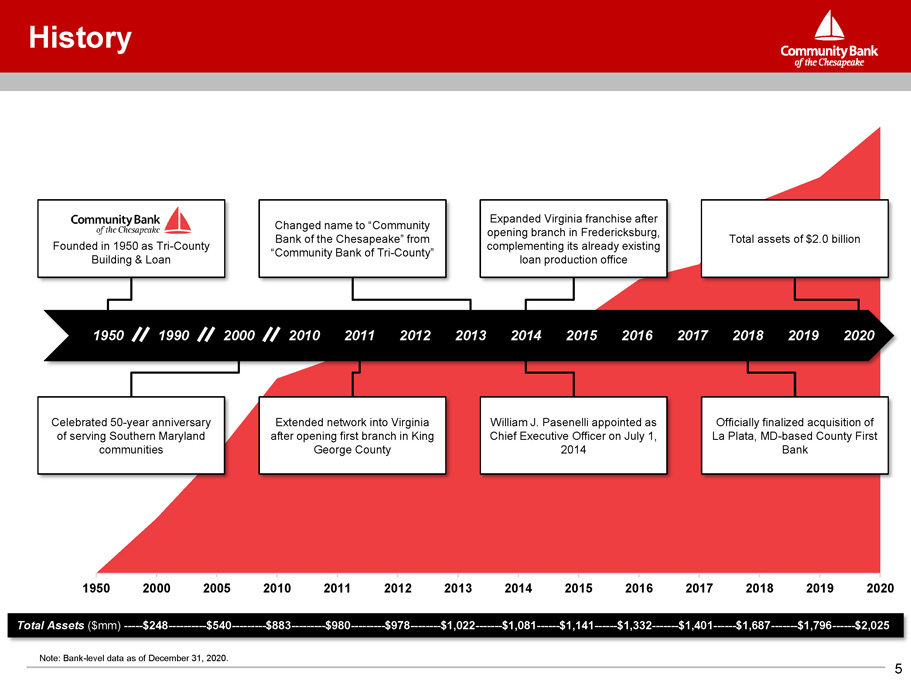
History 1950 2000 2005 2010 2011 2012 2013 2014 2015 2016 2017 2018 2019 2020 Total Assets ($mm) ----- $248 ---------- $540 --------- $883 --------- $980 --------- $978 -------- $1,022 ------- $1,081 ------ $1,141 ------ $1,332 ------- $1,401 -- ---- $1,687 ------- $1,796 ------ $2,025 Changed name to “Community Bank of the Chesapeake” from “Community Bank of Tri - County” Expanded Virginia franchise after opening branch in Fredericksburg, complementing its already existing loan production office Total assets of $2.0 billion Note: Bank - level data as of December 31, 2020. Founded in 1950 as Tri - County Building & Loan 1950 2000 1990 Celebrated 50 - year anniversary of serving Southern Maryland communities William J. Pasenelli appointed as Chief Executive Officer on July 1, 2014 Officially finalized acquisition of La Plata, MD - based County First Bank Extended network into Virginia after opening first branch in King George County 5 201 0 201 1 201 2 201 3 201 4 201 5 201 6 201 7 201 8 201 9 2020
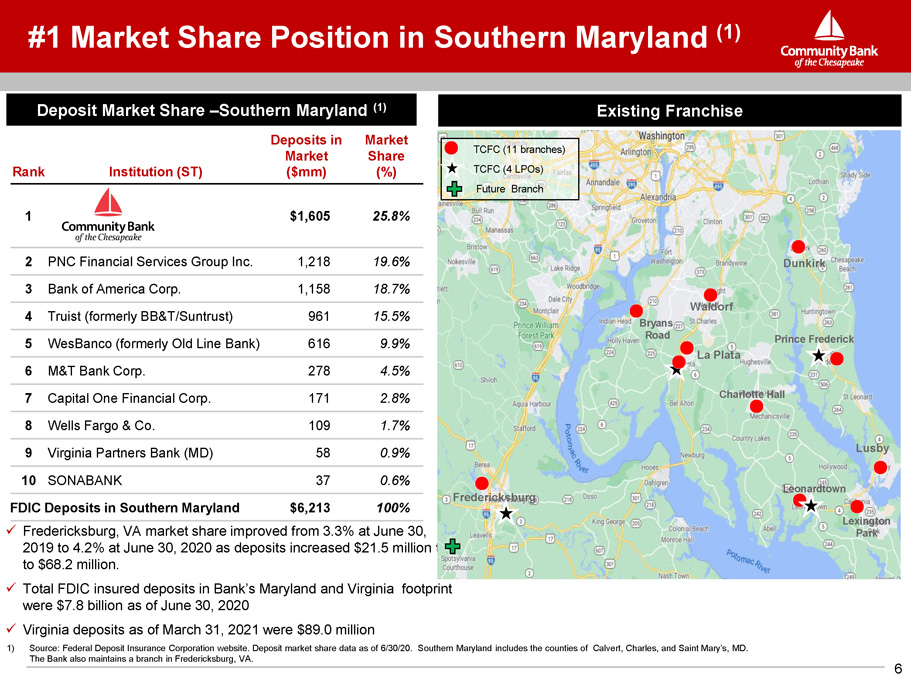
Southern Maryland (1) Existing Franchise #1 De Rank Market Share posit Market Share – Southe Institution (ST) Positio rn Marylan Depos i t s i n Market ($mm) n in d (1) M arket Share (%) 1 $1,605 25.8% 2 PNC Financial Services Group Inc. 1,218 19.6% 3 Bank of America Corp. 1,158 18.7% 4 Truist (formerly BB&T/Suntrust) 961 15.5% 5 WesBanco (formerly Old Line Bank) 616 9.9% 6 M&T Bank Corp. 278 4.5% 7 Capital One Financial Corp. 171 2.8% 8 Wells Fargo & Co. 109 1.7% 9 Virginia Partners Bank (MD) 58 0.9% 10 SONABANK 37 0.6% FDIC Deposits in Southern Maryland x Fredericksburg, VA market share improv $6,213 ed f rom 3.3% 100% at June 30 , 2019 to 4.2% at June 30, 2020 as deposits increased $21.5 million to to $68.2 million. x Total FDIC insured deposits in Bank’s Maryland and Virginia footprint were $7.8 billion as of June 30, 2020 x Virginia deposits as of March 31, 2021 were $89.0 million 1) Source: Federal Deposit Insurance Corporation website. Deposit market share data as of 6/30/20. Southern Maryland includes the counties of Calvert, Charles, and Saint Mary’s, MD. The Bank also maintains a branch in Fredericksburg, VA. TCFC (11 branches) TCFC (4 LPOs) Future Branch Leon a rd t own Prince Fr e de r i c k Dunkirk Waldorf Le x ington Park B r y a ns Road Lu s by Frederic ks burg La Plata Charlotte Hall 6
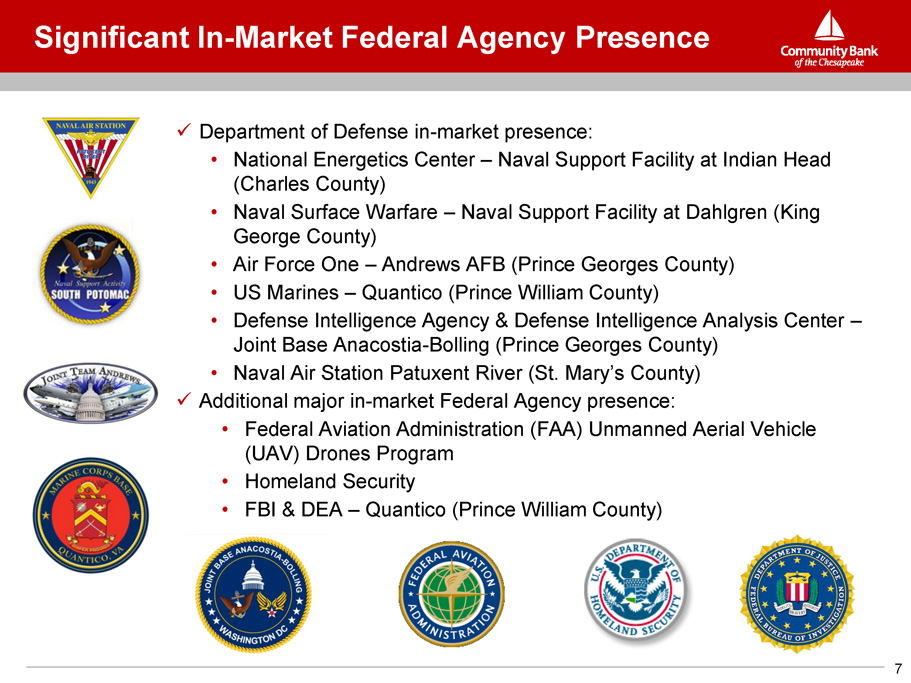
Significant In - Market Federal Agency Presence x Department of Defense in - market presence: • National Energetics Center – Naval Support Facility at Indian Head (Charles County) • Naval Surface Warfare – Naval Support Facility at Dahlgren (King George County) • Air Force One – Andrews AFB (Prince Georges County) • US Marines – Quantico (Prince William County) • Defense Intelligence Agency & Defense Intelligence Analysis Center – Joint Base Anacostia - Bolling (Prince Georges County) • Naval Air Station Patuxent River (St. Mary’s County) x Additional major in - market Federal Agency presence: • Federal Aviation Administration (FAA) Unmanned Aerial Vehicle (UAV) Drones Program • Homeland Security • FBI & DEA – Quantico (Prince William County) 7
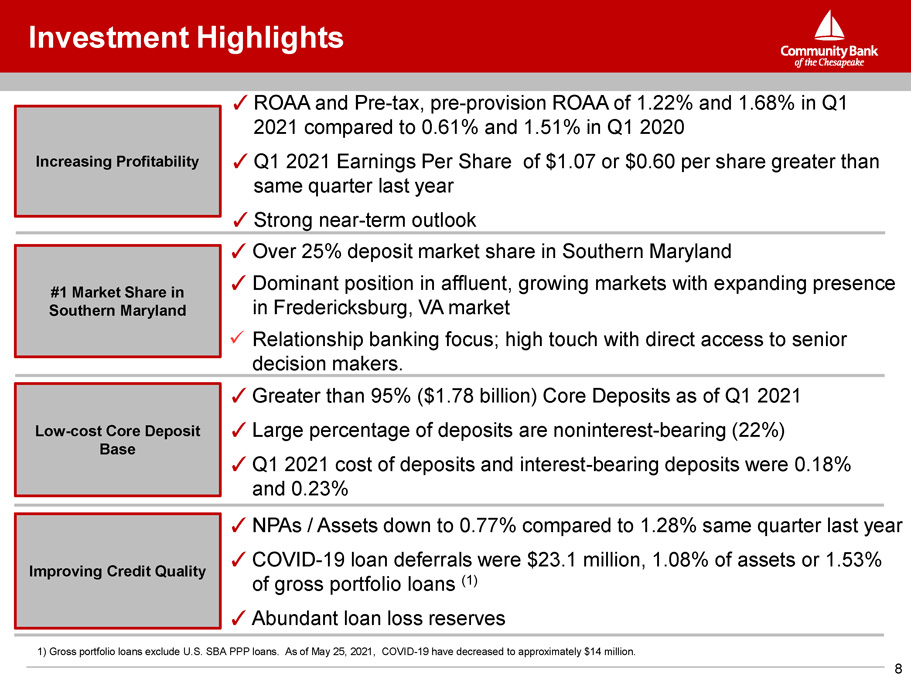
Investment Highlights ✓ ROAA and Pre - tax, pre - provision ROAA of 1.22% and 1.68% in Q1 2021 compared to 0.61% and 1.51% in Q1 2020 ✓ Q1 2021 Earnings Per Share of $1.07 or $0.60 per share greater than same quarter last year 俵 Strong nea r - term out l ook Increasing Profitability #1 Market Share in Southern Maryland Low - cost Core Deposit Base Improving Credit Quality ✓ Over 25% deposit market share in Southern Maryland ✓ Dominant position in affluent, growing markets with expanding presence in F r ede r ick s b u r g , V A market x Relationship banking focus; high touch with direct access to senior decision makers. ✓ Greater than 95% ($1.78 billion) Core Deposits as of Q1 2021 ✓ Large percentage of deposits are noninterest - bearing (22%) ✓ Q1 2021 cost of deposits and interest - bearing deposits were 0.18% and 0.23% ✓ NPAs / Assets down to 0.77% compared to 1.28% same quarter last year ✓ COVID - 19 loan deferrals were $23.1 million, 1.08% of assets or 1.53% of gross portfolio loans (1) ✓ Abundant loan loss reserves 1) Gross portfolio loans exclude U.S. SBA PPP loans. As of May 25, 2021, COVID - 19 have decreased to approximately $14 million. 8
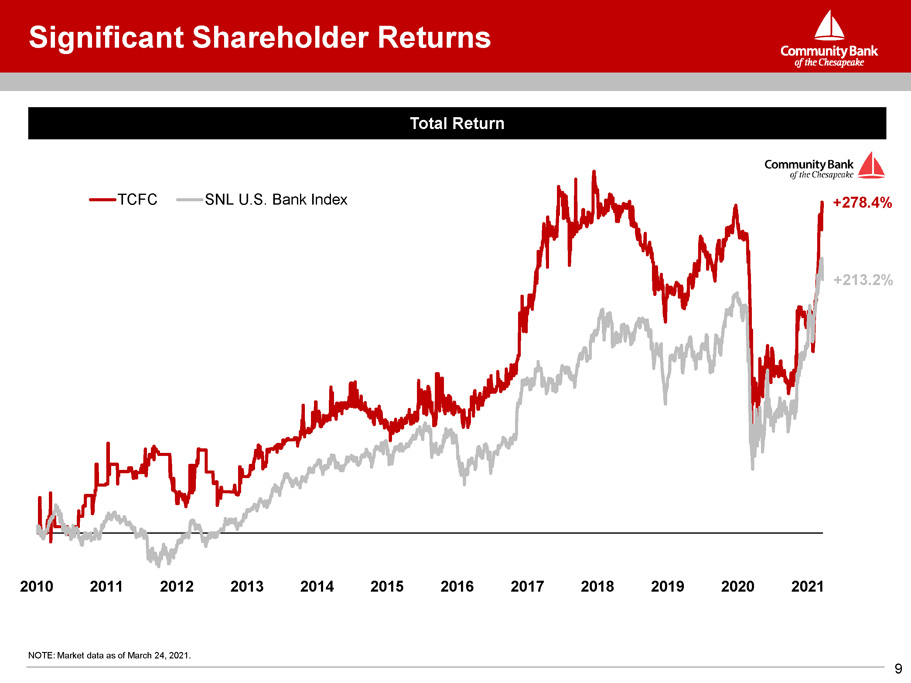
Significant Shareholder Returns NOTE: Market data as of March 24, 2021. Total Return +278.4% + 2 1 3.2% 2 0 10 2 0 11 2 0 12 2 0 13 2 0 14 2 0 15 2 0 16 2 0 17 2 0 18 2 0 19 2 0 20 2 0 21 T C FC SNL U.S. Bank Index 9
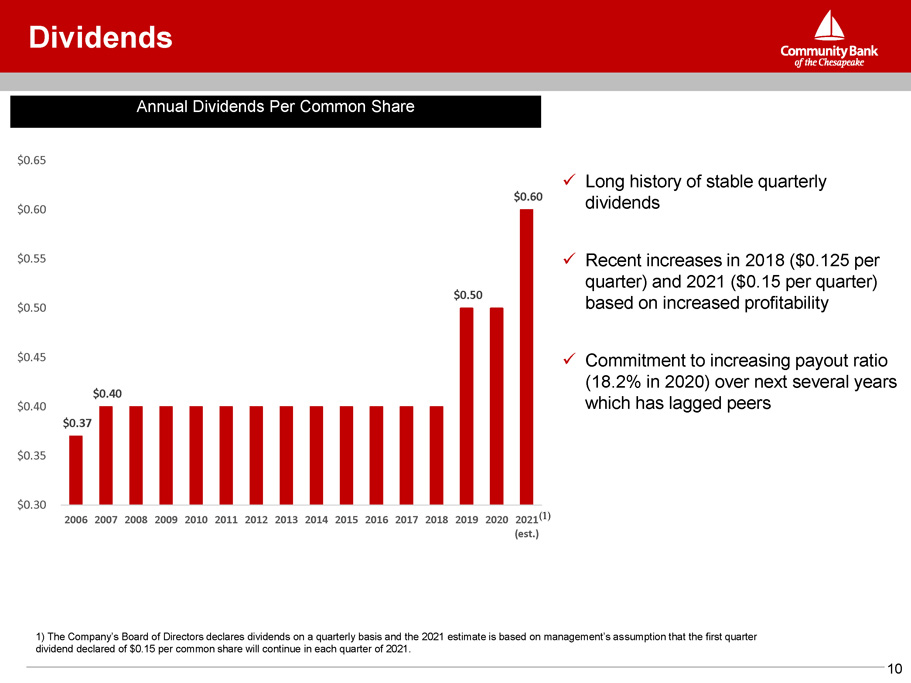
Dividends Annual Dividends Per Common Share 0.37 10 $ $0.40 $0.50 $0.60 $0.35 $0.30 2006 2007 2008 2009 2010 2011 2012 2013 2014 2015 2016 2017 2018 2019 2020 2021 (1) (est.) $0. 4 0 $0. 4 5 $0. 5 0 $0. 5 5 $0. 6 0 $0. 6 5 x Long history of stable quarterly dividends x Recent increases in 2018 ( $ 0 . 125 per quarter) and 2021 ( $ 0 . 15 per quarter) based on increased profitability x Commitment to increasing payout ratio (18.2% in 2020) over next several years which has lagged peers 1) The Company’s Board of Directors declares dividends on a quarterly basis and the 2021 estimate is based on management’s assumption that the first quarter dividend declared of $0.15 per common share will continue in each quarter of 2021.
Future Growth 11 x Current digital platform(s) have capacity to support future growth x New branch in Spotsylvania, Virginia to open in fall of 2021 x Management is focused on: • Maintaining low - cost funding • Driving operating efficiency by optimizing branch structure, virtual banking operations and automation • Opportunistic growth from market disruption (e.g., WesBanco – Old Line acquisition) • Increasing market share in Fredericksburg, VA and the Greater Fredericksburg Area ▪ As of March 31, 2021, loans in the greater Fredericksburg, Virginia area accounted for approximately 40% of the Bank's outstanding portfolio loans, and Fredericksburg branch deposits were $89 million with an average cost of deposits of six basis points. • Additional new products and services to increase non - interest income ▪ In March 2021, the Bank launched a new residential mortgage program and retail and commercial credit card program. The Bank’s business development team partnered with two proven FinTech firms.
Financial Results 12
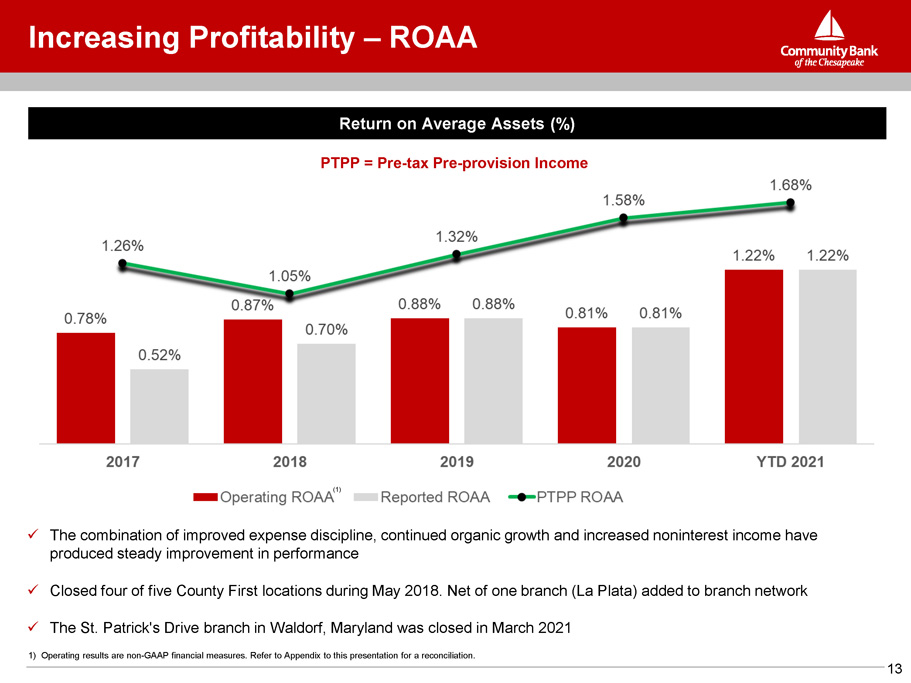
x The combination of improved expense discipline, continued organic growth and increased noninterest income have produced steady improvement in performance x Closed four of five County First locations during May 2018. Net of one branch (La Plata) added to branch network x The St. Patrick's Drive branch in Waldorf, Maryland was closed in March 2021 1) Operating results are non - GAAP financial measures. Refer to Appendix to this presentation for a reconciliation. Return on Average Assets (%) PTPP = Pre - tax Pre - provision Income (1) Increasing Profitability – ROAA 13
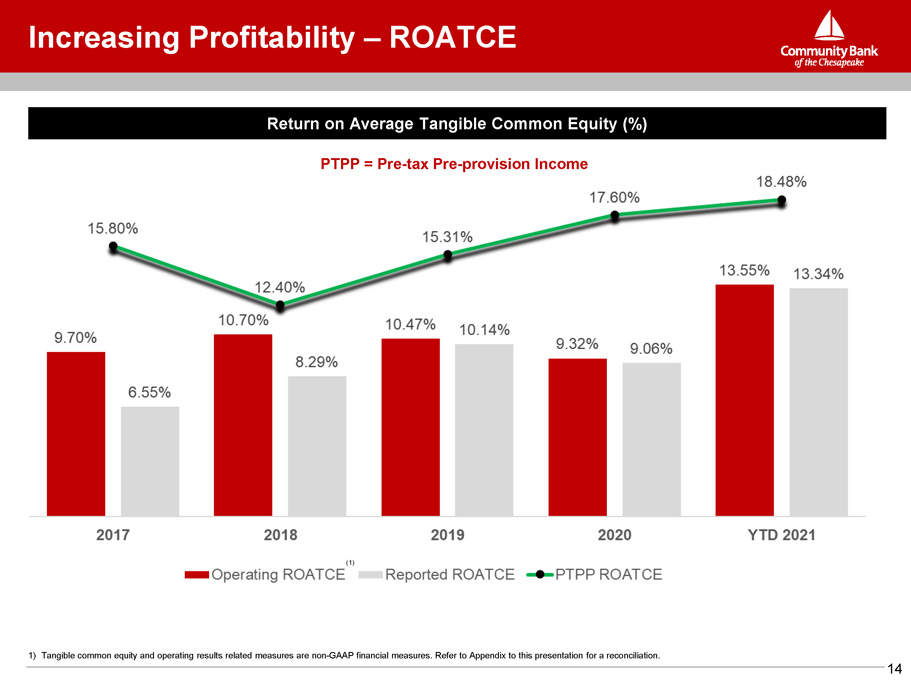
Return on Average Tangible Common Equity (%) PTPP = Pre - tax Pre - provision Income Increasing Profitability – ROATCE 1) Tangible common equity and operating results related measures are non - GAAP financial measures. Refer to Appendix to this presentation for a reconciliation. (1) 14
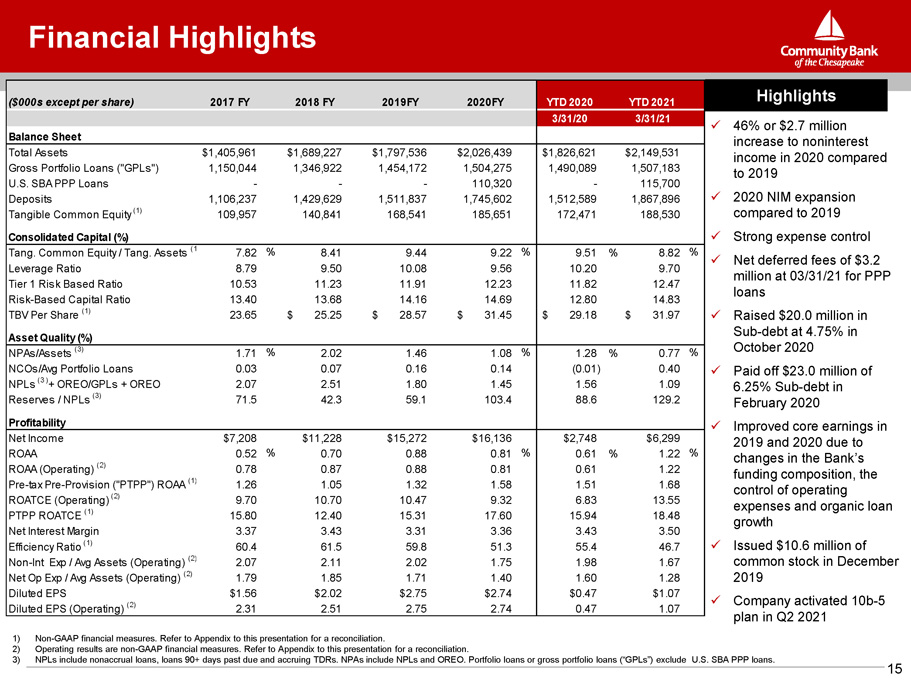
Financial Highlights 1) Non - GAAP financial measures. Refer to Appendix to this presentation for a reconciliation. 2) Operating results are non - GAAP financial measures. Refer to Appendix to this presentation for a reconciliation. 3) NPLs include nonaccrual loans, loans 90+ days past due and accruing TDRs. NPAs include NPLs and OREO. Portfolio loans or gross portfolio loans (“GPLs”) exclude U.S. SBA PPP loans. ($000s except per share) 201 7 F Y 201 8 F Y 2019 F Y 2020 F Y Y T D 202 0 Y T D 202 1 3/31/20 3/31/21 Balance Sheet Total Assets $1,405,961 $1,689,227 $1,797,536 $2,026,439 $1,826,621 $2,149,531 Gross Portfolio Loans ("GPLs") 1,150,044 1,346,922 1,454,172 1,504,275 1,490,089 1,507,183 U . S. S B A P P P Loan s - - - 110,320 - 115,700 Deposits 1,106,237 1,429,629 1,511,837 1,745,602 1,512,589 1,867,896 T angibl e Co mm o n E q ui t y ( 1 ) 109,957 140,841 168,541 185,651 172,471 188,530 C on s olid a t e d C a pi t a l ( % ) T ang . Co mm o n E q ui t y / T ang . A ss e t s ( 1 7.82 % 8.41 9.44 9.22 % 9.51 % 8.82 % Leverage Ratio 8.79 9.50 10.08 9.56 10.20 9.70 Tier 1 Risk Based Ratio 10.53 11.23 11.91 12.23 11.82 12.47 Risk - Based Capital Ratio 13.40 13.68 14.16 14.69 12.80 14.83 % % % Ne t I n c o m e ROAA R O A A ( O pe r a t i ng ) ( 2 ) Pr e - t a x Pr e - P r o v i s i o n ( " P T P P " ) R O A A ( 1 ) R O A T C E ( O pe r a t i ng ) ( 2 ) P T PP R O A T C E ( 1 ) Ne t I n t e r e s t M a r g i n E f f i c ien cy Ra t i o ( 1 ) Non - Int Exp / Avg Assets (Operating) (2) Net Op Exp / Avg Assets (Operating) (2) $7 , 20 8 0 . 5 2 0 . 7 8 1 . 2 6 9 . 7 0 15 . 8 0 3 . 3 7 60 . 4 2 . 0 7 1 . 7 9 $11 , 22 8 0.70 0.87 1.05 10.70 12.40 3.43 61.5 2.11 1.85 $15 , 27 2 0.88 0.88 1.32 10.47 15.31 3.31 59.8 2.02 1.71 $16 , 13 6 0.81 0.81 1.58 9.32 17.60 3.36 51.3 1.75 1.40 $2,748 0.61 % 0.61 1.51 6.83 15.94 3.43 55.4 1.98 1.60 $6 , 29 9 1 . 2 2 1 . 2 2 1 . 6 8 13 . 5 5 18 . 4 8 3 . 5 0 46 . 7 1 . 6 7 1 . 2 8 Diluted EPS $1.56 $2.02 $2.75 $2.74 $0.47 $1.07 Diluted EPS (Operating) (2) 2.31 2.51 2.75 2.74 0.47 1.07 x 46% or $2.7 million increase to noninterest income in 2020 compared to 2019 x 2020 NIM expansion compared to 2019 x Strong expense control x Net deferred fees of $3.2 million at 03/31/21 for PPP loans T BV P e r S h a re ( 1 ) A sse t Q u a li ty ( % ) 23.65 $ 25.25 $ 28.57 $ 31.45 $ 29.18 $ 31.97 x Raised $20.0 million in Sub - debt at 4.75% in NPAs/Assets (3) 1.71 % 2.02 1.46 1.08 % 1.28 % 0.77 % October 2020 NCOs/Avg Portfolio Loans 0.03 0.07 0.16 0.14 (0.01) 0.40 x Paid off $23.0 million of N P L s ( 3 ) + O R E O / G P L s + O R EO 2.07 2.51 1.80 1.45 1.56 1.09 6.25% Sub - debt in Reserves / NPLs (3) 71.5 42.3 59.1 103.4 Profitability 88.6 129.2 February 2020 x Improved core earnings in 2019 and 2020 due to changes in the Bank’s funding composition, the control of operating expenses and organic loan growth x Issued $10.6 million of common stock in December 2019 x Company activated 10b - 5 plan in Q2 2021 Highlights 15
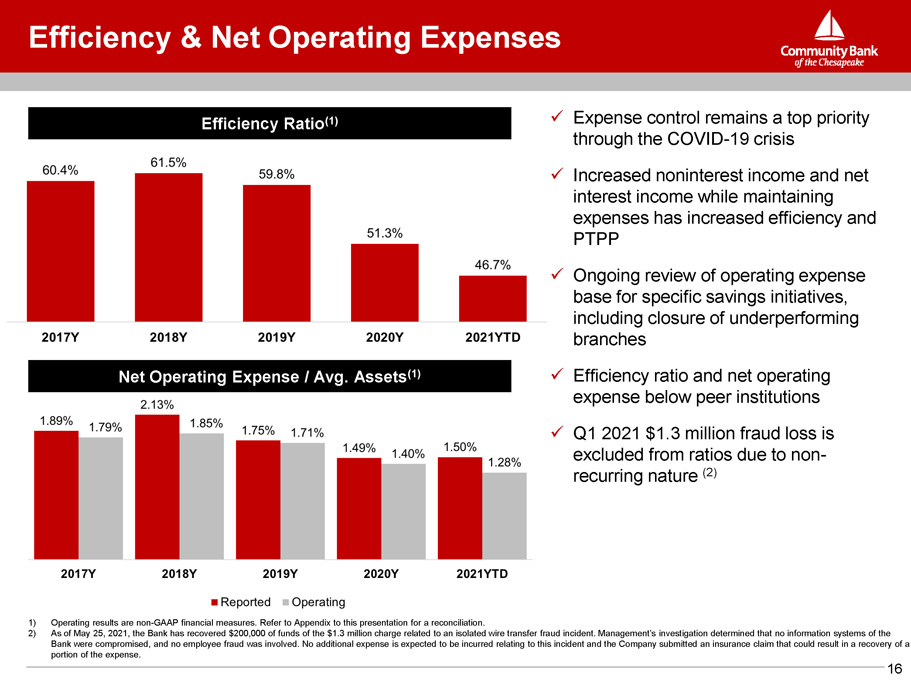
x Expense control remains a top priority through the COVID - 19 crisis x Increased noninterest income and net interest income while maintaining expenses has increased efficiency and PTPP x Ongoing review of operating expense base for specific savings initiatives, including closure of underperforming branches x Efficiency ratio and net operating expense below peer institutions x Q1 2021 $1.3 million fraud loss is excluded from ratios due to non - recurring nature (2) Efficiency & Net Operating Expenses Efficiency Ratio (1) 1) Operating results are non - GAAP financial measures. Refer to Appendix to this presentation for a reconciliation. 2) As of May 25, 2021, the Bank has recovered $200,000 of funds of the $1.3 million charge related to an isolated wire transfer fraud incident. Management’s investigation determined that no information systems of the Bank were compromised, and no employee fraud was involved. No additional expense is expected to be incurred relating to this incident and the Company submitted an insurance claim that could result in a recovery of a portion of the expense. Net Operating Expense / Avg. Assets (1) 16
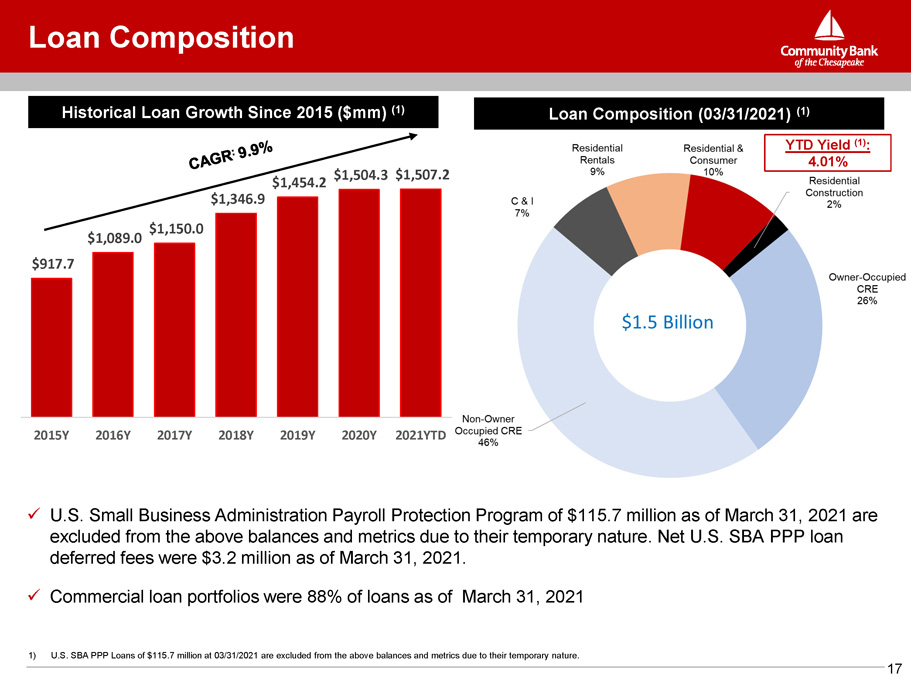
x U.S. Small Business Administration Payroll Protection Program of $115.7 million as of March 31, 2021 are excluded from the above balances and metrics due to their temporary nature. Net U.S. SBA PPP loan deferred fees were $3.2 million as of March 31, 2021. x Commercial loan portfolios were 88% of loans as of March 31, 2021 Historical Loan Growth Since 2015 ($mm) (1) Loan Composition (03/31/2021) (1) YTD Yield (1) : 4.01% Loan Composition 1) U.S. SBA PPP Loans of $115.7 million at 03/31/2021 are excluded from the above balances and metrics due to their temporary nature. $1,089.0 $1,150.0 $917.7 17 $1,454.2 $1,504.3 $1,507.2 $1,346.9 2 0 1 5Y 2 0 1 6Y 2 0 1 7Y 2 0 1 8Y 2 0 1 9Y 2 0 2 0Y 2021YTD
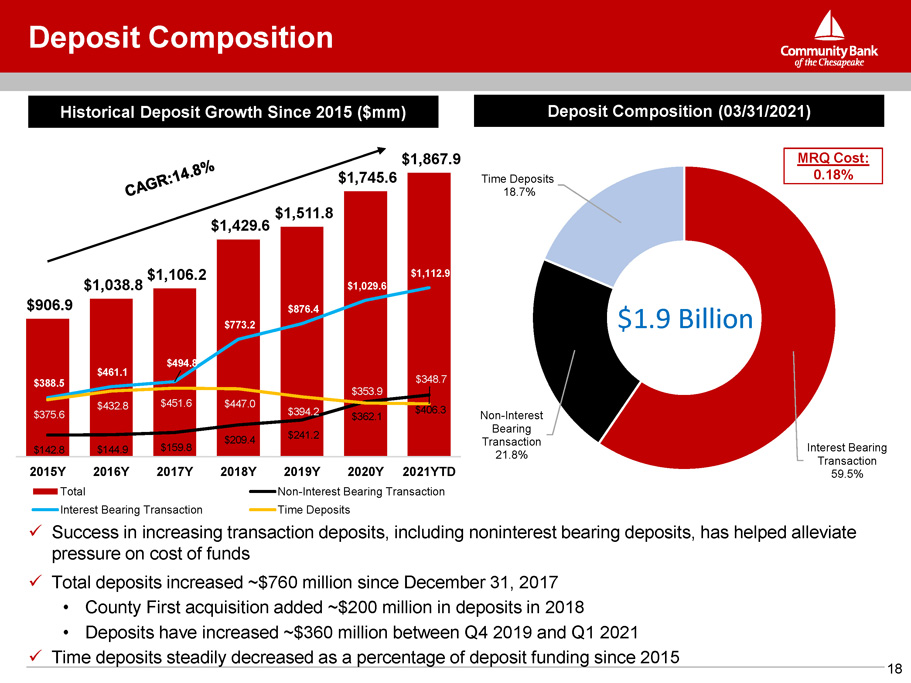
x Success in increasing transaction deposits, including noninterest bearing deposits, has helped alleviate pressure on cost of funds x Total deposits increased ~$760 million since December 31, 2017 • County First acquisition added ~$200 million in deposits in 2018 • Deposits have increased ~$360 million between Q4 2019 and Q1 2021 x Time deposits steadily decreased as a percentage of deposit funding since 2015 Historical Deposit Growth Since 2015 ($mm) Deposit Composition (03/31/2021) MRQ Cost: 0.18% Deposit Composition $906.9 $1,038.8 $1,106.2 $1,511.8 $1,429.6 $1 , 7 45 .6 $1 , 8 67 .9 $144 .9 $159 .8 $494 .8 $773 .2 $876 .4 $1,029.6 $1,112.9 $388.5 $375.6 $142.8 $461 .1 $432.8 $451 .6 $447 .0 $209.4 $394 .2 $241 .2 $353 .9 $362 .1 $348 .7 $406.3 2 0 1 8 Y 2015Y 2016Y 2017Y Total Interest Bearing Transaction 2 0 1 9 Y 2 0 2 0 Y 2 0 2 1 Y TD Non - Interest Bearing Transaction Time Deposits Inte re s t Bearing Transaction 59.5% 18 No n - Inte re s t Bearing Transaction 21.8% T i m e Depo s i ts 18.7% $1.9 Billion
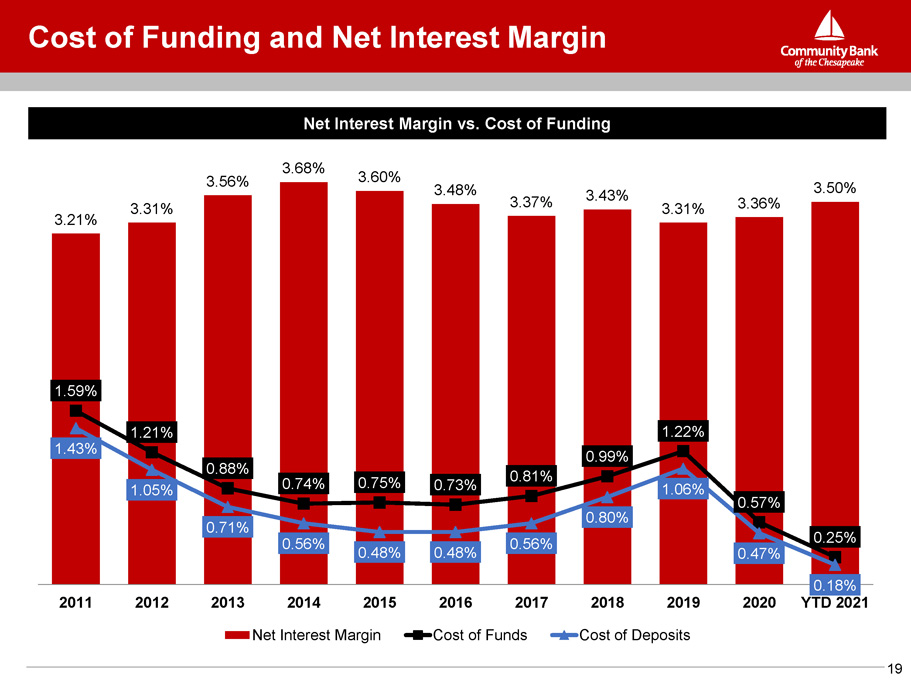
Net Interest Margin vs. Cost of Funding Cost of Funding and Net Interest Margin 3 . 2 1% 3 . 3 1% 3 . 5 6% 3 . 6 8% 3 . 6 0% 3 . 4 8% 3.3 7 % 3 . 4 3% 3 . 3 1% 3.3 6 % 3 . 5 0% 1 . 5 9% 1 . 2 1% 0 . 8 8% 0 . 7 4% 0 . 7 5% 0 . 7 3% 0 . 8 1% 0 . 9 9% 1 . 2 2% 0 . 5 7% 0 . 2 5% 1 . 4 3% 1.0 5 % 0 . 7 1% 0 . 5 6% 0 . 4 8% 0 . 4 8% 0 . 5 6% 0 . 8 0% 1 . 0 6% 0 . 4 7% 0 . 1 8% 2 0 11 2 0 12 2 0 13 2020 YTD 2021 2 0 14 2 0 15 Net Interest Margin 2 0 16 2 0 17 Cost of Funds 2 0 18 2 0 19 Cost of Deposits 19
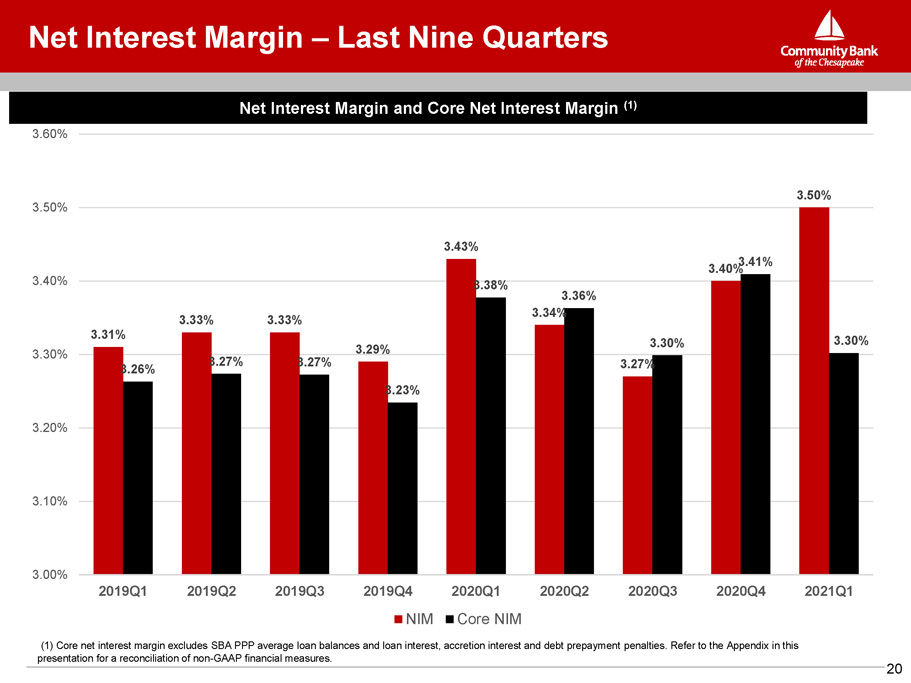
Net Interest Margin and Core Net Interest Margin (1) Net Interest Margin – Last Nine Quarters (1) Core net interest margin excludes SBA PPP average loan balances and loan interest, accretion interest and debt prepayment penalties. Refer to the Appendix in this presentation for a reconciliation of non - GAAP financial measures. 3.31% 3.33% 3.33% 3.29% 3.43% 3.34% 3.27% 3.50% 3.26% 3.27% 3.27% 3. 23% 3.38% 3.36% 3.30% 3.40% 3.41% 3.30% 3 . 0 0 % 3 . 1 0 % 3 . 2 0 % 3 . 3 0 % 3 . 4 0 % 3 . 5 0 % 3 . 6 0 % 2 0 1 9 Q 1 2 0 1 9 Q 2 2 0 1 9 Q 3 2 0 2 0 Q 2 2 0 2 0 Q 3 2 0 2 0 Q 4 2 0 2 1 Q 1 2019Q4 NIM 2020Q1 Core NIM 20
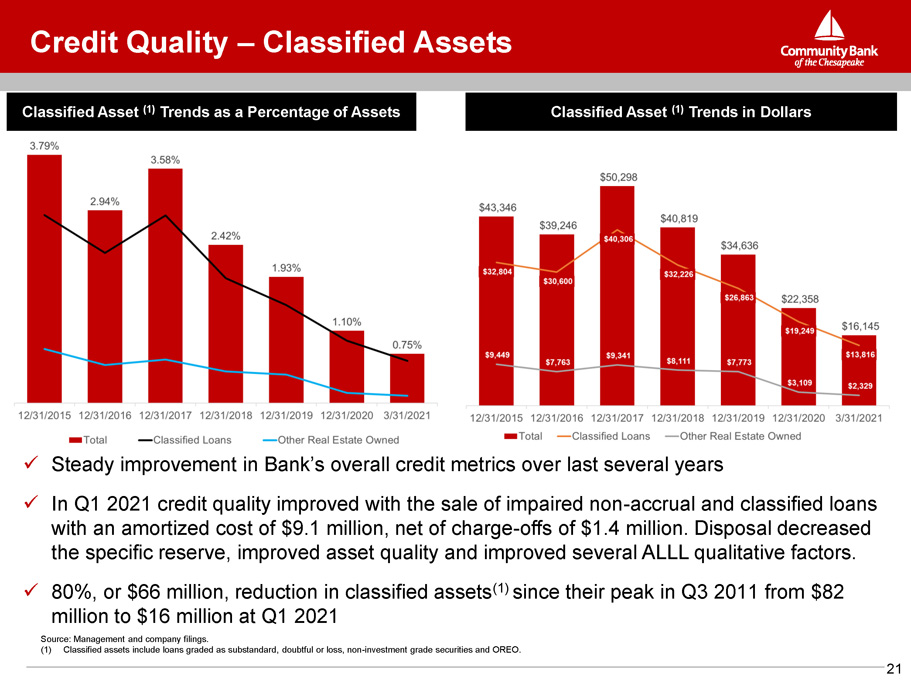
Credit Quality – Classified Assets x Steady improvement in Bank’s overall credit metrics over last several years x In Q 1 2021 credit quality improved with the sale of impaired non - accrual and classified loans with an amortized cost of $ 9 . 1 million, net of charge - offs of $ 1 . 4 million . Disposal decreased the specific reserve, improved asset quality and improved several ALLL qualitative factors . x 80%, or $66 million, reduction in classified assets (1) since their peak in Q3 2011 from $82 million to $16 million at Q1 2021 Source: Management and company filings. (1) Classified assets include loans graded as substandard, doubtful or loss, non - investment grade securities and OREO. Classified Asset (1) Trends as a Percentage of Assets Classified Asset (1) Trends in Dollars 21
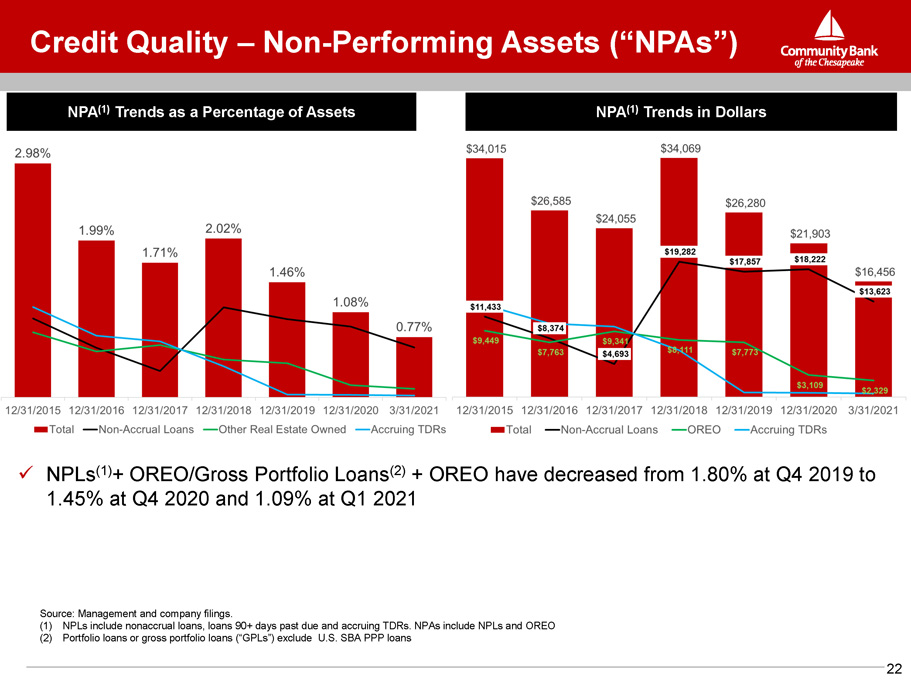
Credit Quality – Non - Performing Assets (“NPAs”) Source: Management and company filings. (1) NPLs include nonaccrual loans, loans 90+ days past due and accruing TDRs. NPAs include NPLs and OREO (2) Portfolio loans or gross portfolio loans (“GPLs”) exclude U.S. SBA PPP loans NPA (1) Trends as a Percentage of Assets NPA (1) Trends in Dollars x NPLs (1) + OREO/Gross Portfolio Loans (2) + OREO have decreased from 1.80% at Q4 2019 to 1.45% at Q4 2020 and 1.09% at Q1 2021 22
COVID - 19 Update 23 Customer and Employee Impacts x Minimal disruption in customer service levels - branch lobbies re - opened in June 2020 x Shifted workforce to remote work as needed and implemented HR related aspects of CARES Act to ensure employee wellness x Investments in technology platforms during last several years performed well in challenging operating environment US SBA PPP Loans x Balances of $110.3 million and $115.7 million as of December 31, 2020 and March 31, 2021 x Community Bank participated in both U.S. SBA PPP loan programs and processed over 960 loans totaling $130 million in the first round of funding and over 540 loans totaling $59 million in the second round x The Company has no Federal Reserve PPLF facility balances as of March 31, 2021 COVID - 19 Deferred Loans x Deferred loans decreased from $35.4 million as of December 31, 2020 to $23.1 million, 1.08% of assets or 1.53% of gross portfolio loans as of March 31, 2021 (1) x Overall improvement has been driven by the resilience of our local economy which is tied to the federal government x Deferrals that remain are to customers in industries that continue to require support to weather the pandemic 1) Gross portfolio loans exclude U.S. SBA PPP loans. As of May 25, 2021, COVID - 19 have decreased to approximately $14 million.
Appe n dix 24
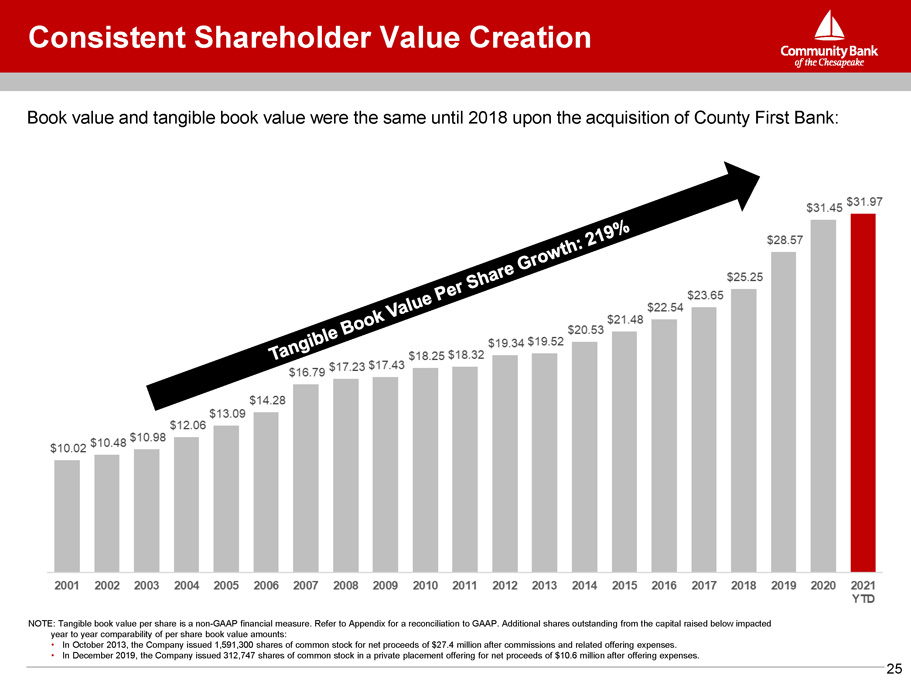
Consistent Shareholder Value Creation NOTE: Tangible book value per share is a non - GAAP financial measure. Refer to Appendix for a reconciliation to GAAP. Additional shares outstanding from the capital raised below impacted year to year comparability of per share book value amounts: • In October 2013, the Company issued 1,591,300 shares of common stock for net proceeds of $27.4 million after commissions and related offering expenses. • In December 2019, the Company issued 312,747 shares of common stock in a private placement offering for net proceeds of $10.6 million after offering expenses. Book value and tangible book value were the same until 2018 upon the acquisition of County First Bank: 25
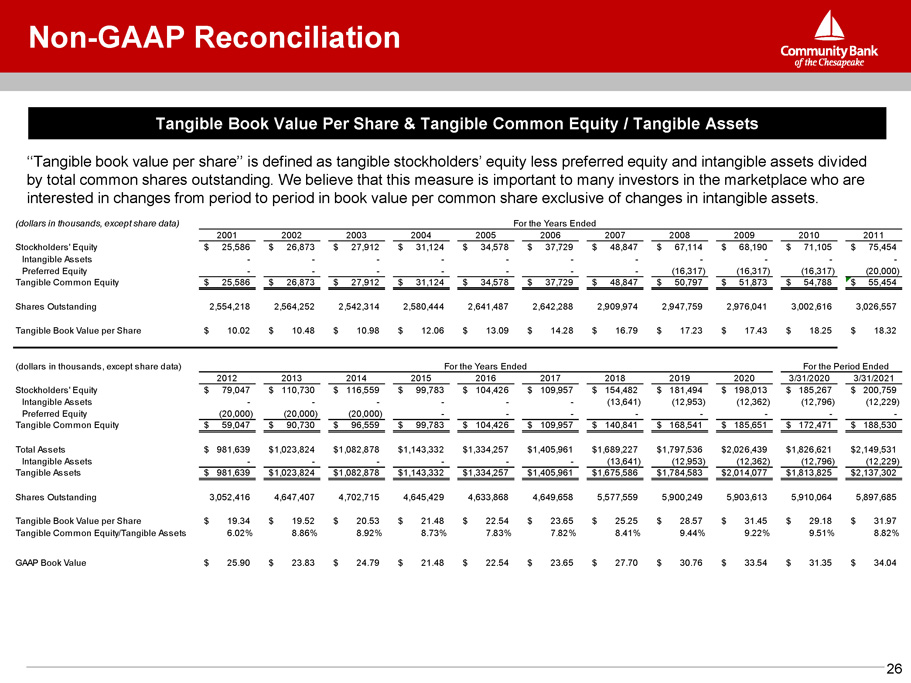
Non - GAAP Reconciliation 26 Tangible Book Value Per Share & Tangible Common Equity / Tangible Assets ‘‘Tangible book value per share’’ is defined as tangible stockholders’ equity less preferred equity and intangible assets divided by total common shares outstanding . We believe that this measure is important to many investors in the marketplace who are interested in changes from period to period in book value per common share exclusive of changes in intangible assets . (dollars in thousands, except share data) For the Years Ended 2001 2002 2003 2004 2005 2006 2007 2008 2009 2010 2011 S t o ck holde r s ' E qui t y $ 25,586 $ 26,873 $ 27,912 $ 31,124 $ 34,578 $ 37,729 $ 48,847 $ 67,114 $ 68,190 $ 71,105 $ 75,454 Intangible Assets - - - - - - - - - - - Preferred Equity - - - - - - - (16,317) (16,317) (16,317) (20,000) Tangible Common Equity $ 25,586 $ 26,873 $ 27,912 $ 31,124 $ 34,578 $ 37,729 $ 48,847 $ 50,797 $ 51,873 $ 54,788 $ 55,454 Shares Outstanding 2,554,218 2,564,252 2,542,314 2,580,444 2,641,487 2,642,288 2,909,974 2,947,759 2,976,041 3,002,616 3,026,557 Tangible Book Value per Share $ 10.02 $ 10.48 $ 10.98 $ 12.06 $ 13.09 $ 14.28 $ 16.79 $ 17.23 $ 17.43 $ 18.25 $ 18.32 (dollars in thousands, except share data) For the Years Ended For the Period Ended 2012 2013 2014 2015 2016 2017 2018 2019 2020 3/31/2020 3/31/2021 S t o ck holde r s ' E qui t y $ 79,047 $ 110,730 $ 116,559 $ 99,783 $ 104,426 $ 109,957 $ 154,482 $ 181,494 $ 198,013 $ 185,267 $ 200,759 Intangible Assets - - - - - - (13,641) (12,953) (12,362) (12,796) (12,229) Preferred Equity (20,000) (20,000) (20,000) - - - - - - - - Tangible Common Equity $ 59,047 $ 90,730 $ 96,559 $ 99,783 $ 104,426 $ 109,957 $ 140,841 $ 168,541 $ 185,651 $ 172,471 $ 188,530 Total Assets $ 981,639 $1,023,824 $1,082,878 $1,143,332 $1,334,257 $1,405,961 $1,689,227 $1,797,536 $2,026,439 $1,826,621 $2,149,531 Intangible Assets - - - - - - (13,641) (12,953) (12,362) (12,796) (12,229) Tangible Assets $ 981,639 $1,023,824 $1,082,878 $1,143,332 $1,334,257 $1,405,961 $1,675,586 $1,784,583 $2,014,077 $1,813,825 $2,137,302 Shares Outstanding 3,052,416 4,647,407 4,702,715 4,645,429 4,633,868 4,649,658 5,577,559 5,900,249 5,903,613 5,910,064 5,897,685 Tangible Book Value per Share $ 19.34 $ 19.52 $ 20.53 $ 21.48 $ 22.54 $ 23.65 $ 25.25 $ 28.57 $ 31.45 $ 29.18 $ 31.97 Tangible Common Equity/Tangible Assets 6.02% 8.86% 8.92% 8.73% 7.83% 7.82% 8.41% 9.44% 9.22% 9.51% 8.82% G AA P B oo k V alu e $ 25.90 $ 23.83 $ 24.79 $ 21.48 $ 22.54 $ 23.65 $ 27.70 $ 30.76 $ 33.54 $ 31.35 $ 34.04
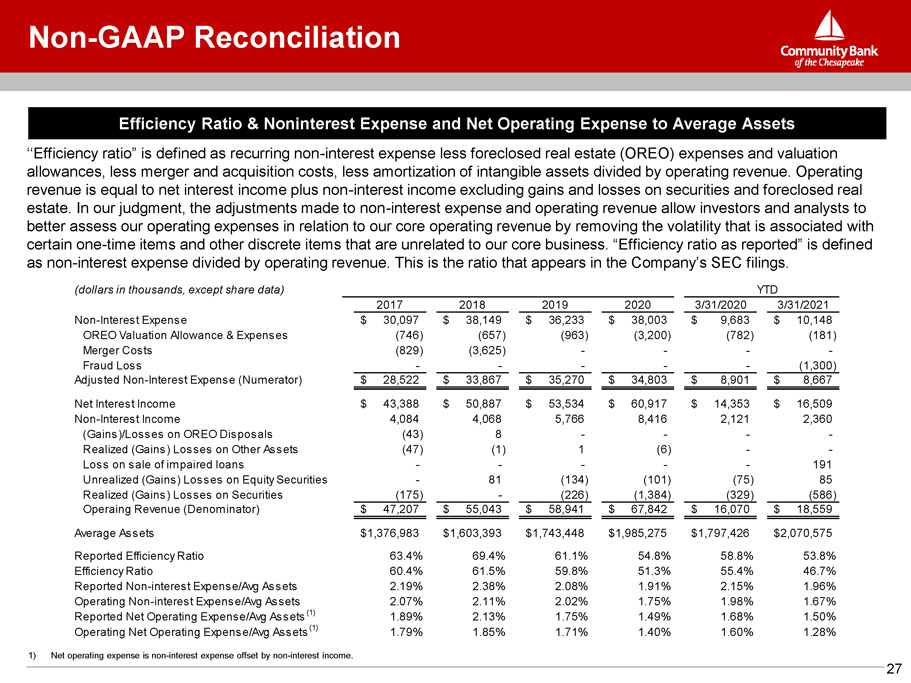
Non - GAAP Reconciliation 27 Efficiency Ratio & Noninterest Expense and Net Operating Expense to Average Assets 1) Net operating expense is non - interest expense offset by non - interest income. ‘‘Efficiency ratio” is defined as recurring non - interest expense less foreclosed real estate (OREO) expenses and valuation allowances, less merger and acquisition costs, less amortization of intangible assets divided by operating revenue. Operating revenue is equal to net interest income plus non - interest income excluding gains and losses on securities and foreclosed real estate. In our judgment, the adjustments made to non - interest expense and operating revenue allow investors and analysts to better assess our operating expenses in relation to our core operating revenue by removing the volatility that is associated with certain one - time items and other discrete items that are unrelated to our core business. “Efficiency ratio as reported” is defined as non - interest expense divided by operating revenue. This is the ratio that appears in the Company’s SEC filings. (dollars in thousands, except share data) YTD 2017 2018 2019 2020 3/31/2020 3/31/2021 Non - I n t e r e s t E x pen s e $ 30,097 $ 38,149 $ 36,233 $ 38,003 $ 9,683 $ 10,148 O R EO V alua t io n A llowan ce & E x pen s e s (746) (657) (963) (3,200) (782) (181) M e r ge r Co s t s (829) (3,625) - - - - Fraud Loss - - - - - (1,300) Adjusted Non - Interest Expense (Numerator) $ 28,522 $ 33,867 $ 35,270 $ 34,803 $ 8,901 $ 8,667 Net Interest Income $ 43,388 $ 50,887 $ 53,534 $ 60,917 $ 14,353 $ 16,509 Non - I n t e r e s t I n c o m e 4,084 4,068 5,766 8,416 2,121 2,360 ( G ain s ) / Lo ss e s o n O R EO Di s po s al s (43) 8 - - - - Realized (Gains) Losses on Other Assets (47) (1) 1 (6) - - Loss on sale of impaired loans - - - - - 191 Un r eali z e d ( G ain s ) Lo ss e s o n E qui t y S e c u r i t ie s - 81 (134) (101) (75) 85 Realized (Gains) Losses on Securities (175) - (226) (1,384) (329) (586) Operaing Revenue (Denominator) $ 47,207 $ 55,043 $ 58,941 $ 67,842 $ 16,070 $ 18,559 Average Assets $1,376,983 $1,603,393 $1,743,448 $1,985,275 $1,797,426 $2,070,575 Repo r t e d E ff i c ien cy Ra t i o 63.4% 69.4% 61.1% 54.8% 58.8% 53.8% E ff i c ien cy Ra t i o 60.4% 61.5% 59.8% 51.3% 55.4% 46.7% Reported Non - interest Expense/Avg Assets 2.19% 2.38% 2.08% 1.91% 2.15% 1.96% O pe r a t in g Non - in t e r e s t E x pen s e / Av g A ss e t s 2.07% 2.11% 2.02% 1.75% 1.98% 1.67% Repo r t e d Ne t O pe r a t in g E x pen s e / Av g A ss e t s ( 1 ) 1.89% 2.13% 1.75% 1.49% 1.68% 1.50% O pe r a t in g Ne t O pe r a t in g E x pen s e / Av g A ss e t s ( 1 ) 1.79% 1.85% 1.71% 1.40% 1.60% 1.28%
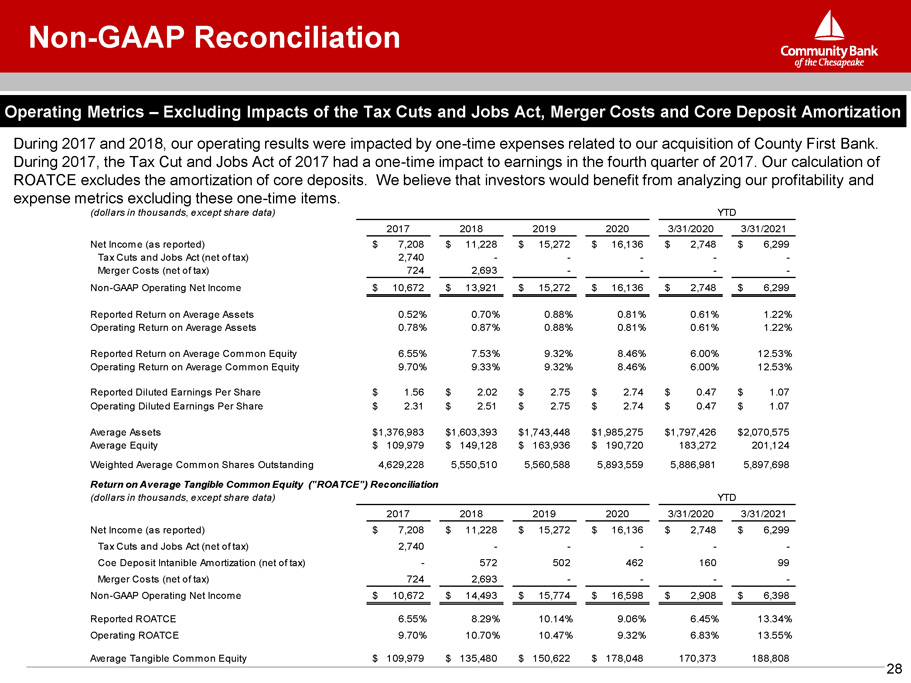
Non - GAAP Reconciliation Operating Metrics – Excluding Impacts of the Tax Cuts and Jobs Act, Merger Costs and Core Deposit Amortization During 2017 and 2018, our operating results were impacted by one - time expenses related to our acquisition of County First Bank. During 2017, the Tax Cut and Jobs Act of 2017 had a one - time impact to earnings in the fourth quarter of 2017. Our calculation of ROATCE excludes the amortization of core deposits. We believe that investors would benefit from analyzing our profitability and expense metrics excluding these one - time items. (dollars in thousands, except share data) Y T D 2017 2018 2019 2020 3/31/2020 3/31/2021 Net Income (as reported) $ 7,208 $ 11,228 $ 15,272 $ 16,136 $ 2,748 $ 6,299 T a x Cu t s an d J ob s A ct ( ne t o f t a x ) 2,740 - - - - - Merger Costs (net of tax) 724 2,693 - - - - Non - GAAP Operating Net Income $ 10,672 $ 13,921 $ 15,272 $ 16,136 $ 2,748 $ 6,299 Reported Return on Average Assets 0.52% 0.70% 0.88% 0.81% 0.61% 1.22% Operating Return on Average Assets 0.78% 0.87% 0.88% 0.81% 0.61% 1.22% Reported Return on Average Common Equity 6.55% 7.53% 9.32% 8.46% 6.00% 12.53% Operating Return on Average Common Equity 9.70% 9.33% 9.32% 8.46% 6.00% 12.53% Reported Diluted Earnings Per Share $ 1.56 $ 2.02 $ 2.75 $ 2.74 $ 0.47 $ 1.07 Operating Diluted Earnings Per Share $ 2.31 $ 2.51 $ 2.75 $ 2.74 $ 0.47 $ 1.07 Average Assets $1,376,983 $1,603,393 $1,743,448 $1,985,275 $1,797,426 $2,070,575 Average Equity $ 109,979 $ 149,128 $ 163,936 $ 190,720 183,272 201,124 Weighted Average Common Shares Outstanding 4,629,228 5,550,510 5,560,588 5,893,559 5,886,981 5,897,698 Return on Average Tangible Common Equity ("ROATCE") (dollars in thousands, except share data) Reconciliation Y T D 2017 2018 2019 2020 3/31/2020 3/31/2021 Net Income (as reported) $ 7,208 $ 11,228 $ 15,272 $ 16,136 $ 2,748 $ 6,299 T a x Cu t s an d J ob s A ct ( ne t o f t a x ) 2,740 - - - - - Coe Deposit Intanible Amortization (net of tax) - 572 502 462 160 99 Merger Costs (net of tax) 724 2,693 - - - - Non - GAAP Operating Net Income $ 10,672 $ 14,493 $ 15,774 $ 16,598 $ 2,908 $ 6,398 Reported ROATCE 6.55% 8.29% 10.14% 9.06% 6.45% 13.34% Operating ROATCE 9.70% 10.70% 10.47% 9.32% 6.83% 13.55% Average Tangible Common Equity $ 109,979 $ 135,480 $ 150,622 $ 178,048 170,373 188,808 28
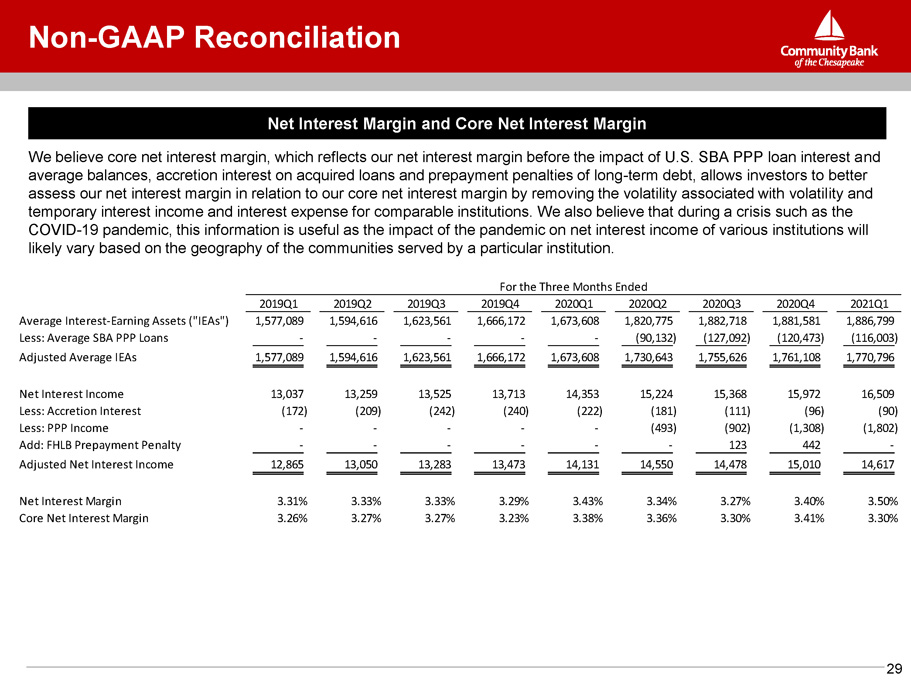
Non - GAAP Reconciliation 29 Net Interest Margin and Core Net Interest Margin We believe core net interest margin, which reflects our net interest margin before the impact of U.S. SBA PPP loan interest and average balances, accretion interest on acquired loans and prepayment penalties of long - term debt, allows investors to better assess our net interest margin in relation to our core net interest margin by removing the volatility associated with volatility and temporary interest income and interest expense for comparable institutions. We also believe that during a crisis such as the COVID - 19 pandemic, this information is useful as the impact of the pandemic on net interest income of various institutions will likely vary based on the geography of the communities served by a particular institution. For the Three Months Ended 2019Q1 2019Q2 2019Q3 2019Q4 2020Q1 2020Q2 2020Q3 2020Q4 2021Q1 Average Interest - Earning Assets ("IEAs") 1,577,089 1,594,616 1,623,561 1,666,172 1,673,608 1,820,775 1,882,718 1,881,581 1,886,799 Less: Average SBA PPP Loans - - - - - (90,132 ) (127,092 ) (120,473 ) (116,003 ) Adjusted Average IEAs 1,577,089 1,594,616 1,623,561 1,666,172 1,673,608 1,730,643 1,755,626 1,761,108 1,770,796 Net Interest Income 13,037 13,259 13,525 13,713 14,353 15,224 15,368 15,972 16,509 Less: Accretion Interest (172) (209) (242) (240) (222) (181) (111) (96) (90) Less: PPP Income - - - - - (493) (902) (1,308) (1,802) A dd: F H L B P r e p a y m e nt P e n a l t y - - - - - - 123 442 - Adjusted Net Interest Income 12,865 13,050 13,283 13,473 14,131 14,550 14,478 15,010 14,617 Net Interest Margin 3.31% 3.33% 3.33% 3.29% 3.43% 3.34% 3.27% 3.40% 3.50% Core Net Interest Margin 3.26% 3.27% 3.27% 3.23% 3.38% 3.36% 3.30% 3.41% 3.30%
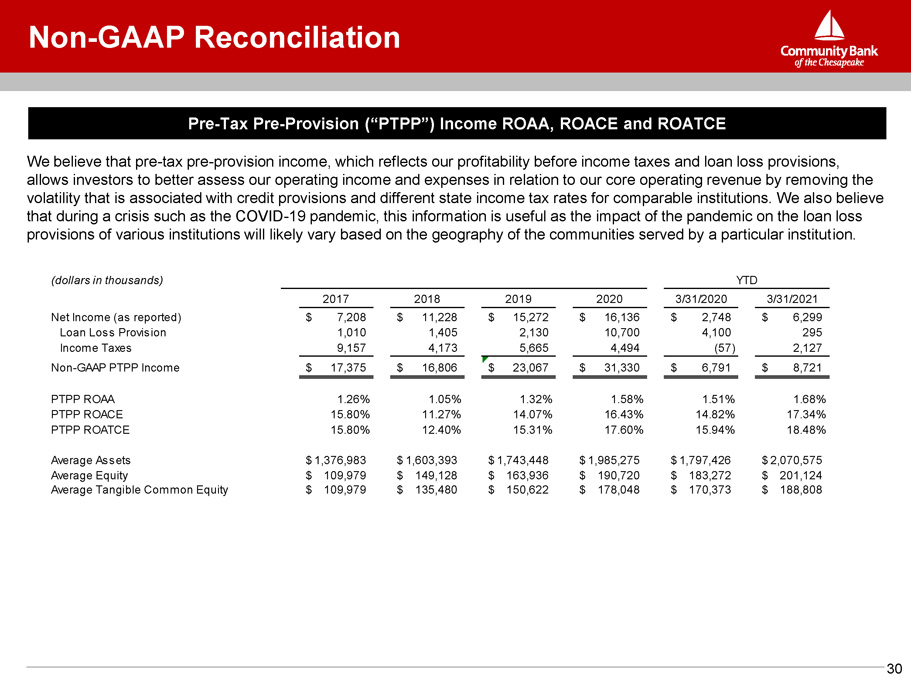
Non - GAAP Reconciliation Pre - Tax Pre - Provision (“PTPP”) Income ROAA, ROACE and ROATCE We believe that pre - tax pre - provision income, which reflects our profitability before income taxes and loan loss provisions, allows investors to better assess our operating income and expenses in relation to our core operating revenue by removing the volatility that is associated with credit provisions and different state income tax rates for comparable institutions. We also believe that during a crisis such as the COVID - 19 pandemic, this information is useful as the impact of the pandemic on the loan loss provisions of various institutions will likely vary based on the geography of the communities served by a particular institution. (dollars in thousands) Y T D 2017 2018 2019 2020 3/31/2020 3/31/2021 Ne t I n c o m e ( a s r e po r t ed ) $ 7,208 $ 11,228 $ 15,272 $ 16,136 $ 2,748 $ 6,299 Loan Loss Provision 1,010 1,405 2,130 10,700 4,100 295 Income Taxes 9,157 4,173 5,665 4,494 (57) 2,127 Non - GAAP PTPP Income $ 17,375 $ 16,806 $ 23,067 $ 31,330 $ 6,791 $ 8,721 P T P P R O A A 1.26% 1.05% 1.32% 1.58% 1 . 51 % 1.68% P T P P R O A C E 15.80% 11.27% 14.07% 16.43% 14 . 82 % 17.34% P T P P R O A T C E 15.80% 12.40% 15.31% 17.60% 15 . 94 % 18.48% Average Assets $ 1 , 376 , 98 3 $ 1 , 603 , 39 3 $ 1 , 743 , 44 8 $ 1 , 985 , 27 5 $ 1 , 797 , 42 6 $ 2 , 070 , 57 5 Average Equity $ 109,979 $ 149,128 $ 163,936 $ 190,720 $ 183,272 $ 201,124 Average Tangible Common Equity $ 109,979 $ 135,480 $ 150,622 $ 178,048 $ 170,373 $ 188,808 30
3 3 1 1