Attached files
| file | filename |
|---|---|
| 8-K - 8-K - VALVOLINE INC | vvv-20210519.htm |
| EX-99.2 - RECAST FINANCIAL INFORMATION BY OPERATING SEGMENT - VALVOLINE INC | badgerexhibit992.htm |
| EX-99.1 - PRESS RELEASE ANNOUNCING SEGMENT REALIGNMENT AND SHARE REPURCHASE AUTHORIZATION - VALVOLINE INC | badgerpressrelease.htm |
1 Business Update May 19, 2021 Exhibit 99.3
2 Forward-Looking Statements Certain statements in this presentation, other than statements of historical fact, including estimates, projections and statements related to Valvoline’s business plans and operating results, are forward- looking statements within the meaning of the Private Securities Litigation Reform Act of 1995. Valvoline has identified some of these forward-looking statements with words such as “anticipates,” “believes,” “expects,” “estimates,” “is likely,” “predicts,” “projects,” “forecasts,” “may,” “will,” “should” and “intends” and the negative of these words or other comparable terminology. These forward-looking statements are based on Valvoline’s current expectations, estimates, projections and assumptions as of the date such statements are made and are subject to risks and uncertainties that may cause results to differ materially from those expressed or implied in the forward-looking statements. Additional information regarding these risks and uncertainties are described in the company’s filings with the Securities and Exchange Commission (the “SEC”), including in the “Risk Factors,” “Management’s Discussion and Analysis of Financial Condition and Results of Operations” and "Quantitative and Qualitative Disclosures about Market Risk" sections of Valvoline’s most recently filed periodic reports on Form 10-K and 10-Q, which are available on Valvoline’s website at http://investors.valvoline.com/sec-filings or on the SEC’s website at http://sec.gov. Valvoline assumes no obligation to update or revise these forward-looking statements for any reason, even if new information becomes available in the future, unless required by law. Regulation G: Adjusted Results Information regarding Valvoline’s definitions, calculations and reconciliation of non-GAAP measures can be found in the Appendix. SAFE HARBOR
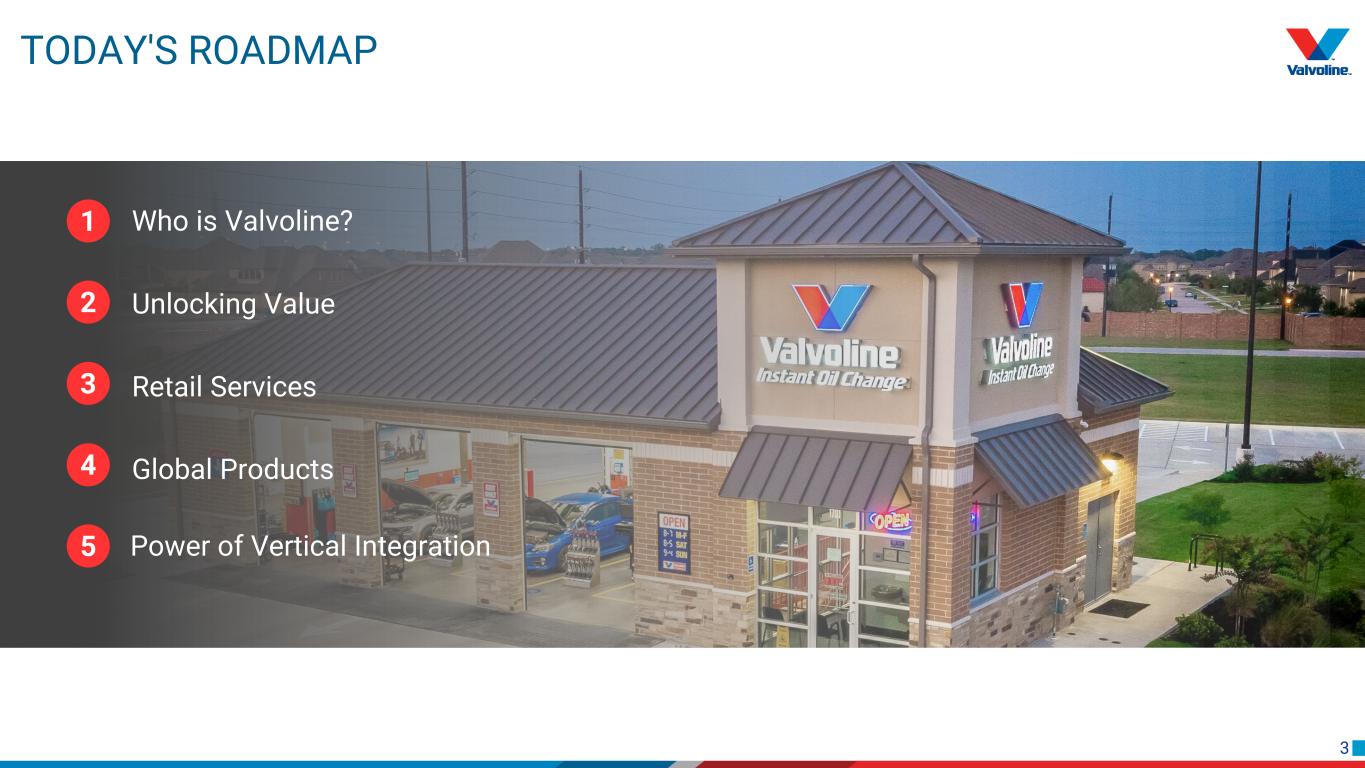
3 TODAY'S ROADMAP Who is Valvoline?1 Unlocking Value2 Retail Services3 Global Products4 Power of Vertical Integration5

4
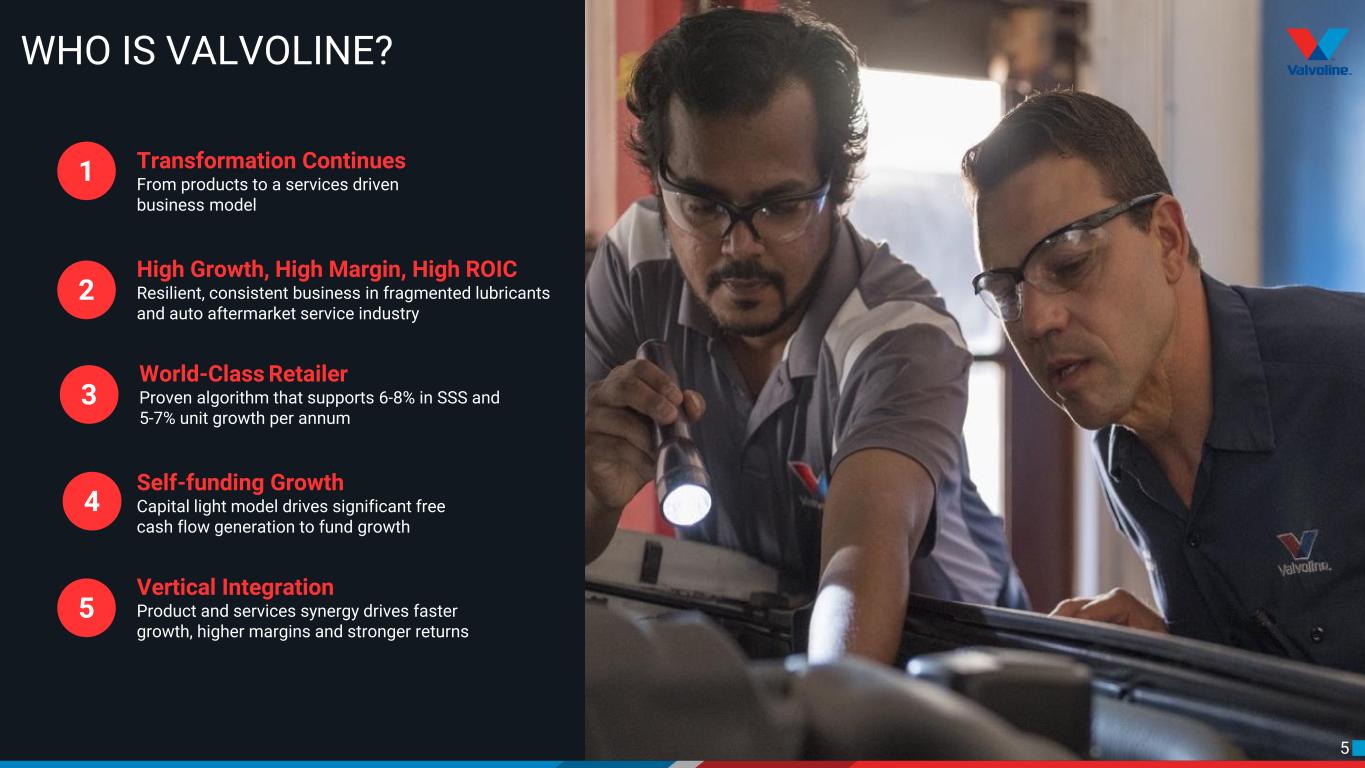
5 WHO IS VALVOLINE? Transformation Continues From products to a services driven business model 1 High Growth, High Margin, High ROIC Resilient, consistent business in fragmented lubricants and auto aftermarket service industry 2 World-Class Retailer Proven algorithm that supports 6-8% in SSS and 5-7% unit growth per annum 3 Self-funding Growth Capital light model drives significant free cash flow generation to fund growth 4 Vertical Integration Product and services synergy drives faster growth, higher margins and stronger returns 5

6 Strong FCF, High ROIC, Low Capital Intensity Global Products (Core NA & International) OUR TRUSTED BRAND IS A KEY COMPETITIVE ADVANTAGE Quick, Easy, Trusted Valvoline brand has 150+ years of history Retail Services (Quick Lubes) High Growth, High Margin, High ROIC Trust Convenience Loyalty
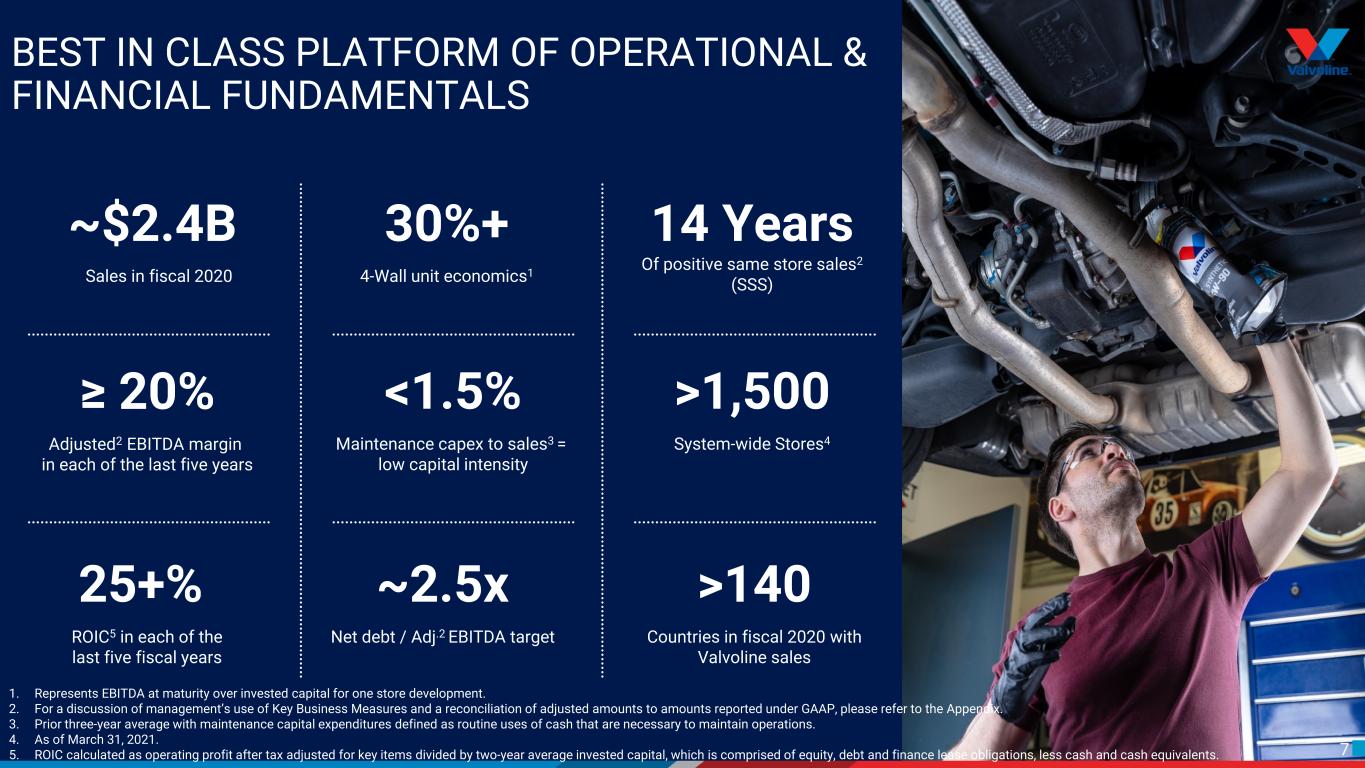
7 BEST IN CLASS PLATFORM OF OPERATIONAL & FINANCIAL FUNDAMENTALS ~$2.4B Sales in fiscal 2020 ≥ 20% Adjusted2 EBITDA margin in each of the last five years 25+% ROIC5 in each of the last five fiscal years >1,500 System-wide Stores4 14 Years Of positive same store sales2 (SSS) >140 Countries in fiscal 2020 with Valvoline sales 30%+ 4-Wall unit economics1 <1.5% Maintenance capex to sales3 = low capital intensity ~2.5x Net debt / Adj.2 EBITDA target 1. Represents EBITDA at maturity over invested capital for one store development. 2. For a discussion of management’s use of Key Business Measures and a reconciliation of adjusted amounts to amounts reported under GAAP, please refer to the Appendix. 3. Prior three-year average with maintenance capital expenditures defined as routine uses of cash that are necessary to maintain operations. 4. As of March 31, 2021. 5. ROIC calculated as operating profit after tax adjusted for key items divided by two-year average invested capital, which is comprised of equity, debt and finance lease obligations, less cash and cash equivalents.
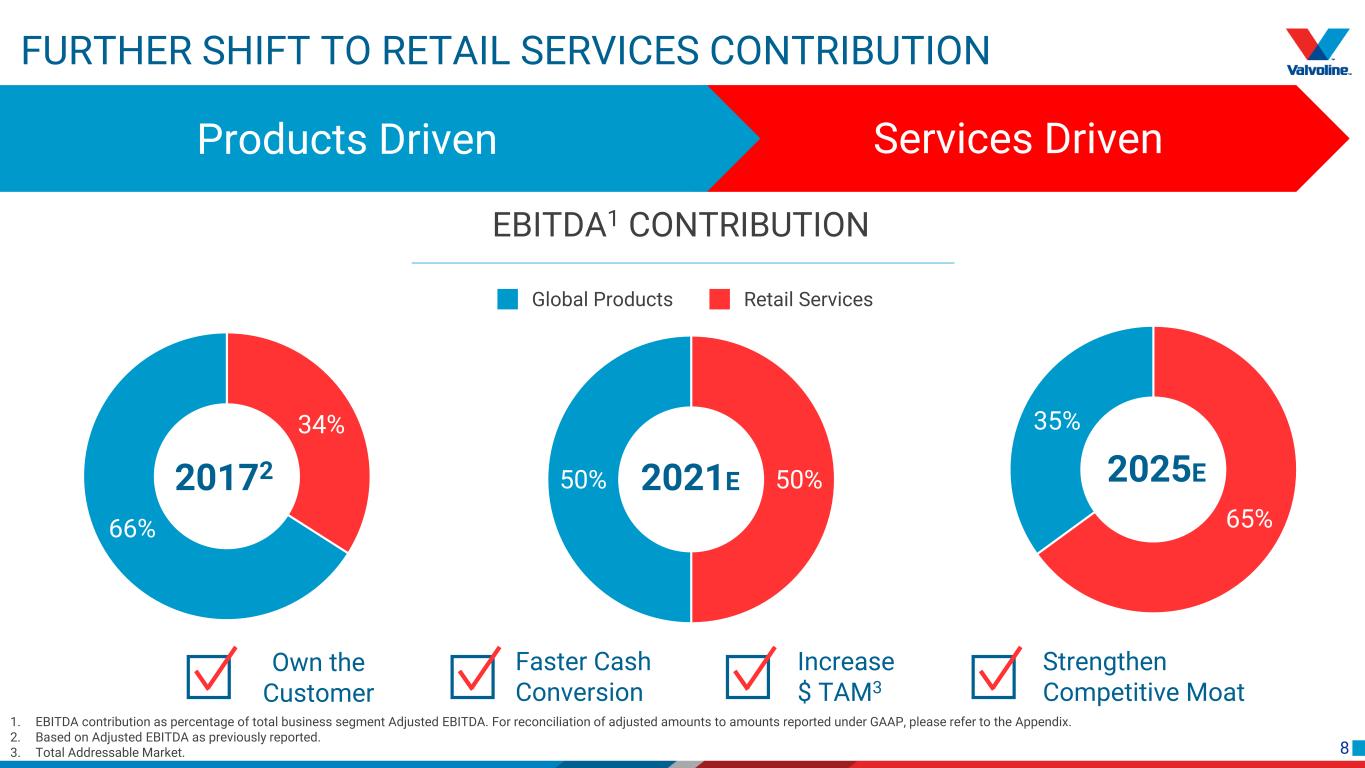
8 FURTHER SHIFT TO RETAIL SERVICES CONTRIBUTION 50%50% 65% 35%34% 66% 20172 2021E 2025E Global Products Retail Services EBITDA1 CONTRIBUTION Own the Customer Faster Cash Conversion Increase $ TAM3 Strengthen Competitive Moat Services DrivenProducts Driven 1. EBITDA contribution as percentage of total business segment Adjusted EBITDA. For reconciliation of adjusted amounts to amounts reported under GAAP, please refer to the Appendix. 2. Based on Adjusted EBITDA as previously reported. 3. Total Addressable Market.
9
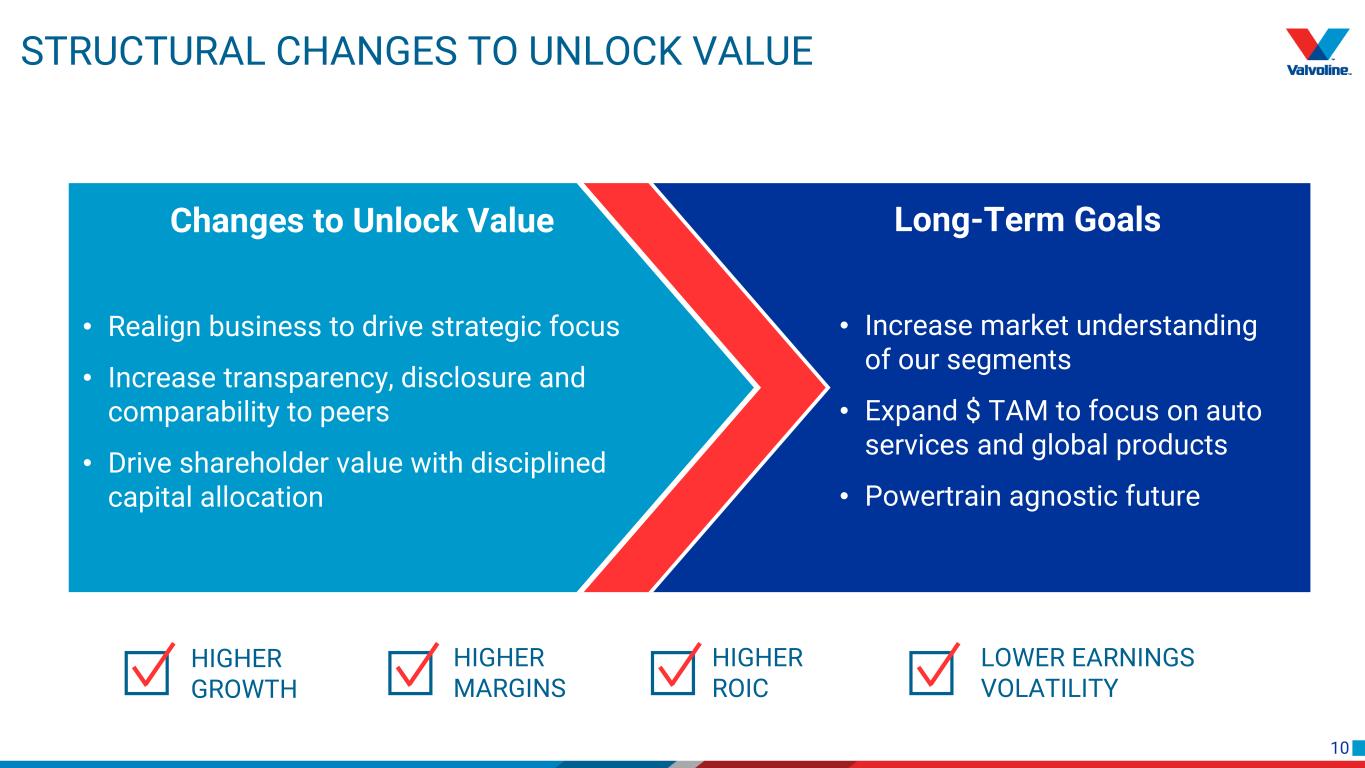
10 STRUCTURAL CHANGES TO UNLOCK VALUE Long-Term Goals • Increase market understanding of our segments • Expand $ TAM to focus on auto services and global products • Powertrain agnostic future Changes to Unlock Value • Realign business to drive strategic focus • Increase transparency, disclosure and comparability to peers • Drive shareholder value with disciplined capital allocation HIGHER GROWTH HIGHER MARGINS HIGHER ROIC LOWER EARNINGS VOLATILITY
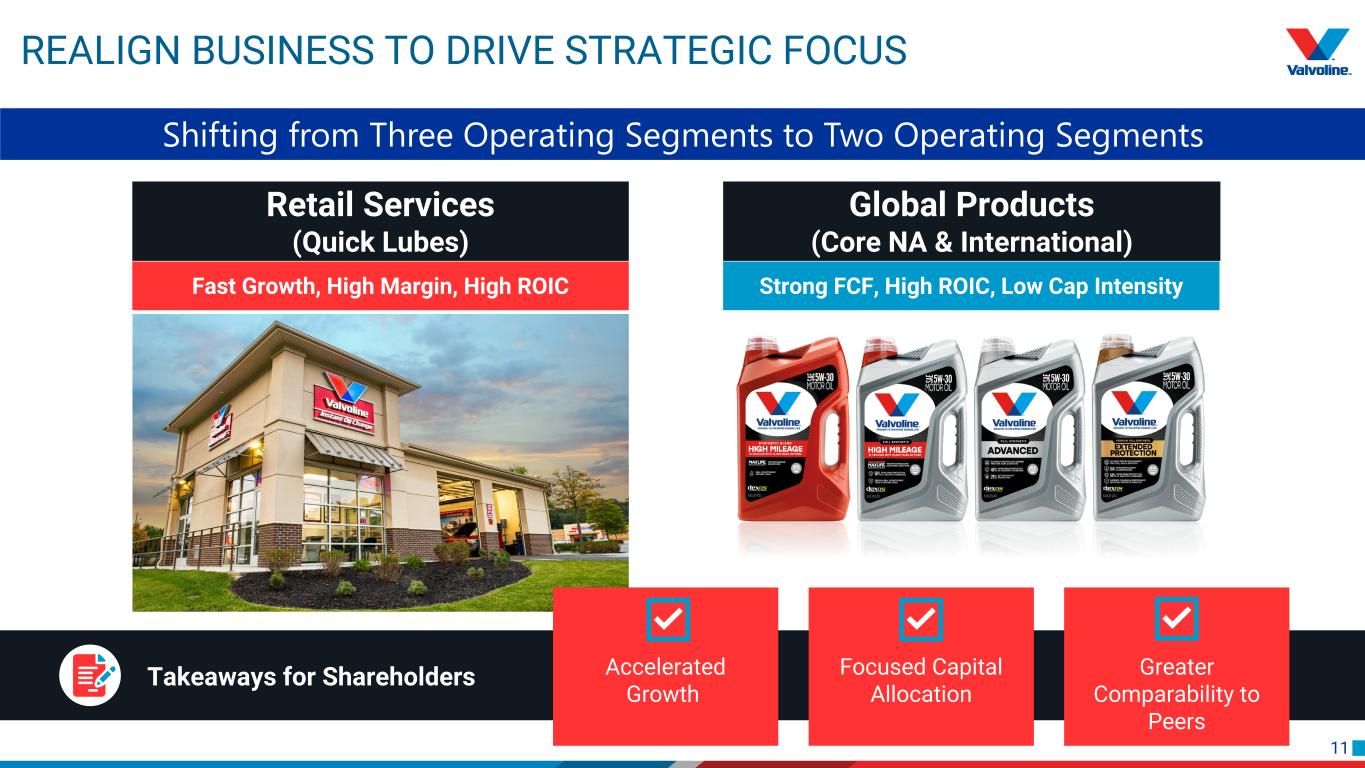
11 REALIGN BUSINESS TO DRIVE STRATEGIC FOCUS Retail Services (Quick Lubes) Global Products (Core NA & International) Fast Growth, High Margin, High ROIC Strong FCF, High ROIC, Low Cap Intensity Shifting from Three Operating Segments to Two Operating Segments Takeaways for Shareholders Accelerated Growth Focused Capital Allocation Greater Comparability to Peers
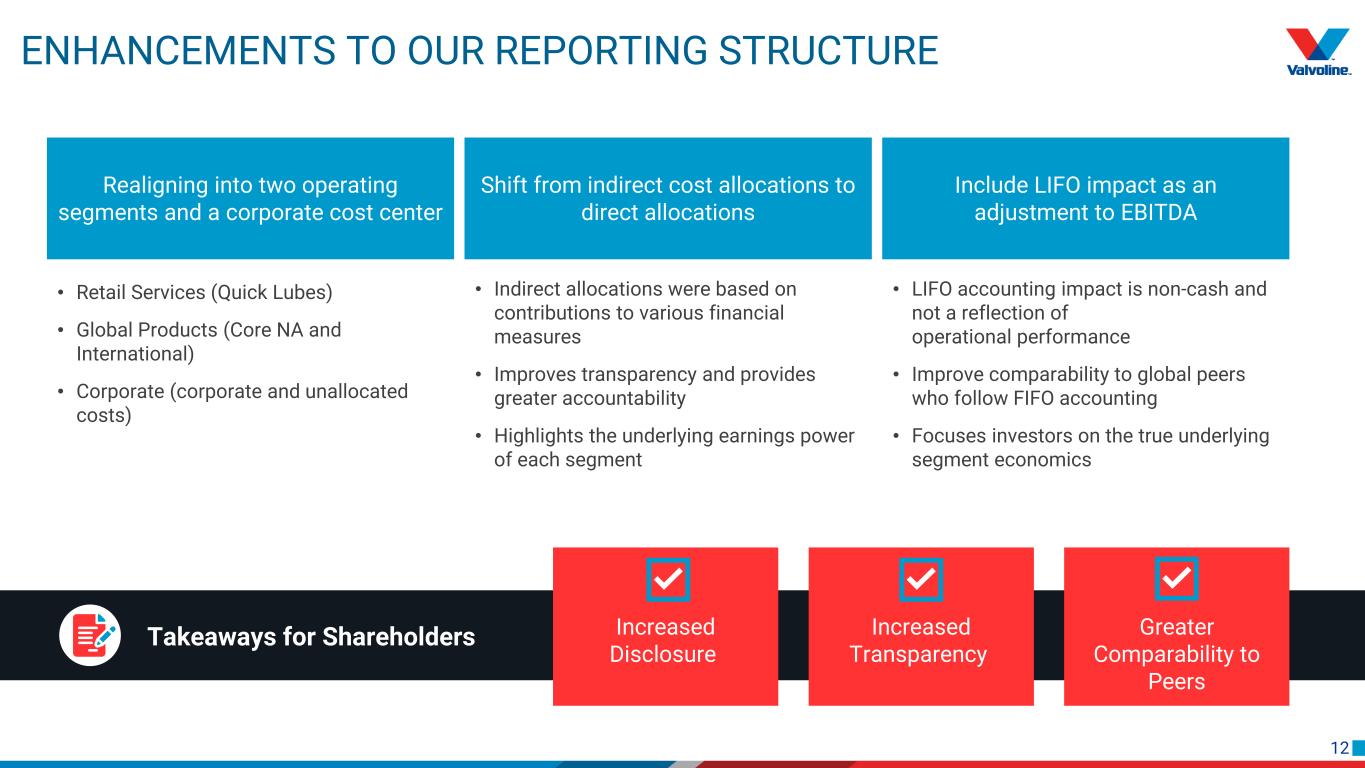
12 Takeaways for Shareholders ENHANCEMENTS TO OUR REPORTING STRUCTURE Realigning into two operating segments and a corporate cost center • Indirect allocations were based on contributions to various financial measures • Improves transparency and provides greater accountability • Highlights the underlying earnings power of each segment • LIFO accounting impact is non-cash and not a reflection of operational performance • Improve comparability to global peers who follow FIFO accounting • Focuses investors on the true underlying segment economics • Retail Services (Quick Lubes) • Global Products (Core NA and International) • Corporate (corporate and unallocated costs) Shift from indirect cost allocations to direct allocations Include LIFO impact as an adjustment to EBITDA Increased Disclosure Increased Transparency Greater Comparability to Peers
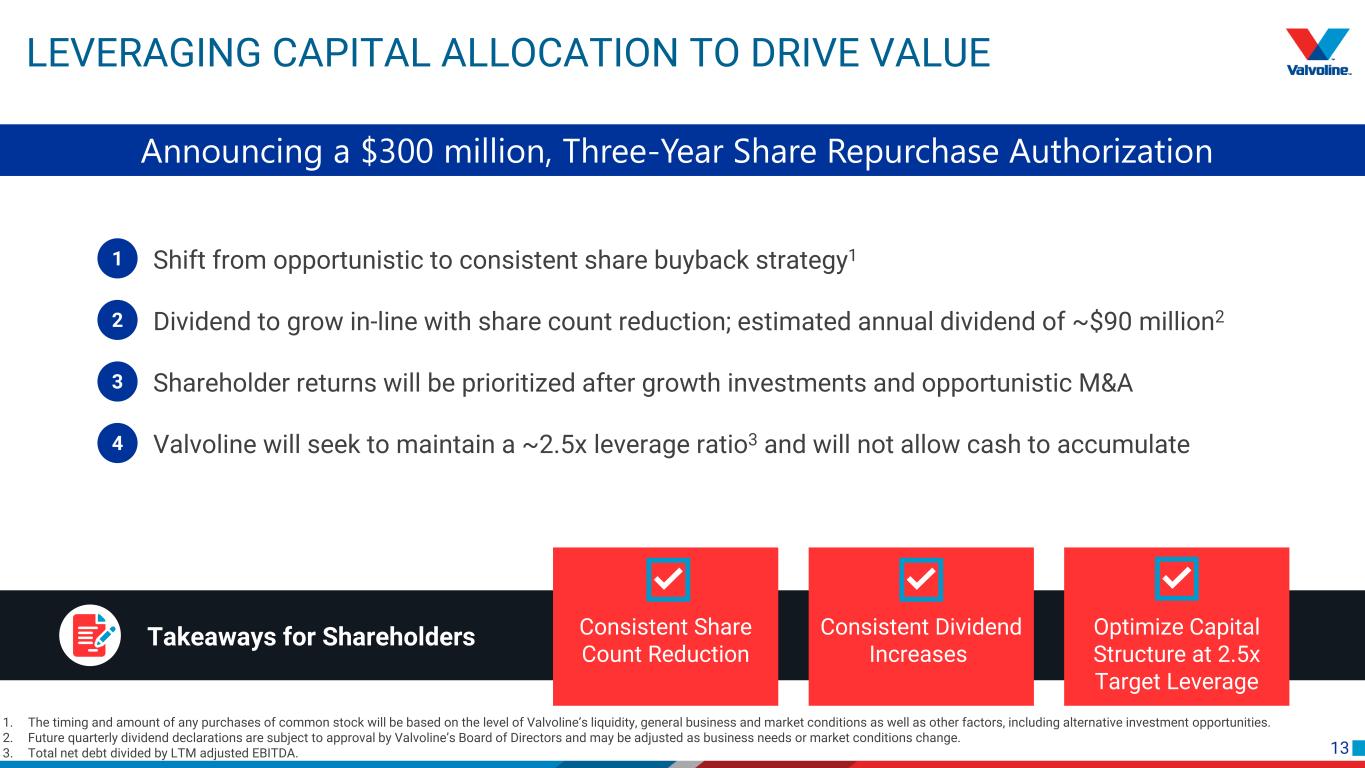
13 LEVERAGING CAPITAL ALLOCATION TO DRIVE VALUE Announcing a $300 million, Three-Year Share Repurchase Authorization Takeaways for Shareholders Consistent Share Count Reduction Consistent Dividend Increases Optimize Capital Structure at 2.5x Target Leverage Shift from opportunistic to consistent share buyback strategy1 Dividend to grow in-line with share count reduction; estimated annual dividend of ~$90 million2 Shareholder returns will be prioritized after growth investments and opportunistic M&A Valvoline will seek to maintain a ~2.5x leverage ratio3 and will not allow cash to accumulate 1 2 3 4 1. The timing and amount of any purchases of common stock will be based on the level of Valvoline’s liquidity, general business and market conditions as well as other factors, including alternative investment opportunities. 2. Future quarterly dividend declarations are subject to approval by Valvoline’s Board of Directors and may be adjusted as business needs or market conditions change. 3. Total net debt divided by LTM adjusted EBITDA.
14
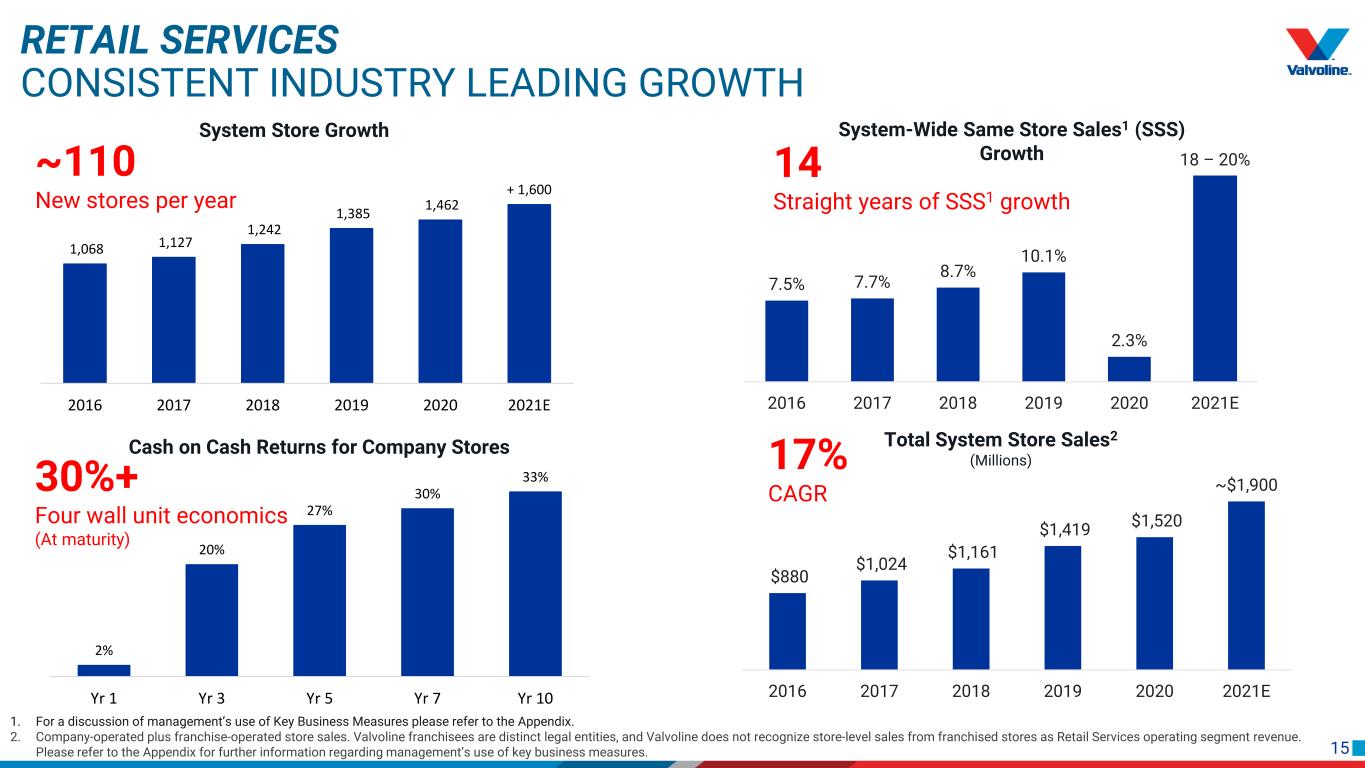
15 17% CAGR 1,068 1,127 1,242 1,385 1,462 + 1,600 2016 2017 2018 2019 2020 2021E RETAIL SERVICES CONSISTENT INDUSTRY LEADING GROWTH 1. For a discussion of management’s use of Key Business Measures please refer to the Appendix. 2. Company-operated plus franchise-operated store sales. Valvoline franchisees are distinct legal entities, and Valvoline does not recognize store-level sales from franchised stores as Retail Services operating segment revenue. Please refer to the Appendix for further information regarding management’s use of key business measures. System Store Growth ~110 New stores per year 7.5% 7.7% 8.7% 10.1% 2.3% 18 – 20% 2016 2017 2018 2019 2020 2021E $880 $1,024 $1,161 $1,419 $1,520 ~$1,900 2016 2017 2018 2019 2020 2021E Total System Store Sales2 (Millions) 2% 20% 27% 30% 33% Yr 1 Yr 3 Yr 5 Yr 7 Yr 10 Cash on Cash Returns for Company Stores System-Wide Same Store Sales1 (SSS) Growth14 Straight years of SSS1 growth 30%+ Four wall unit economics (At maturity)
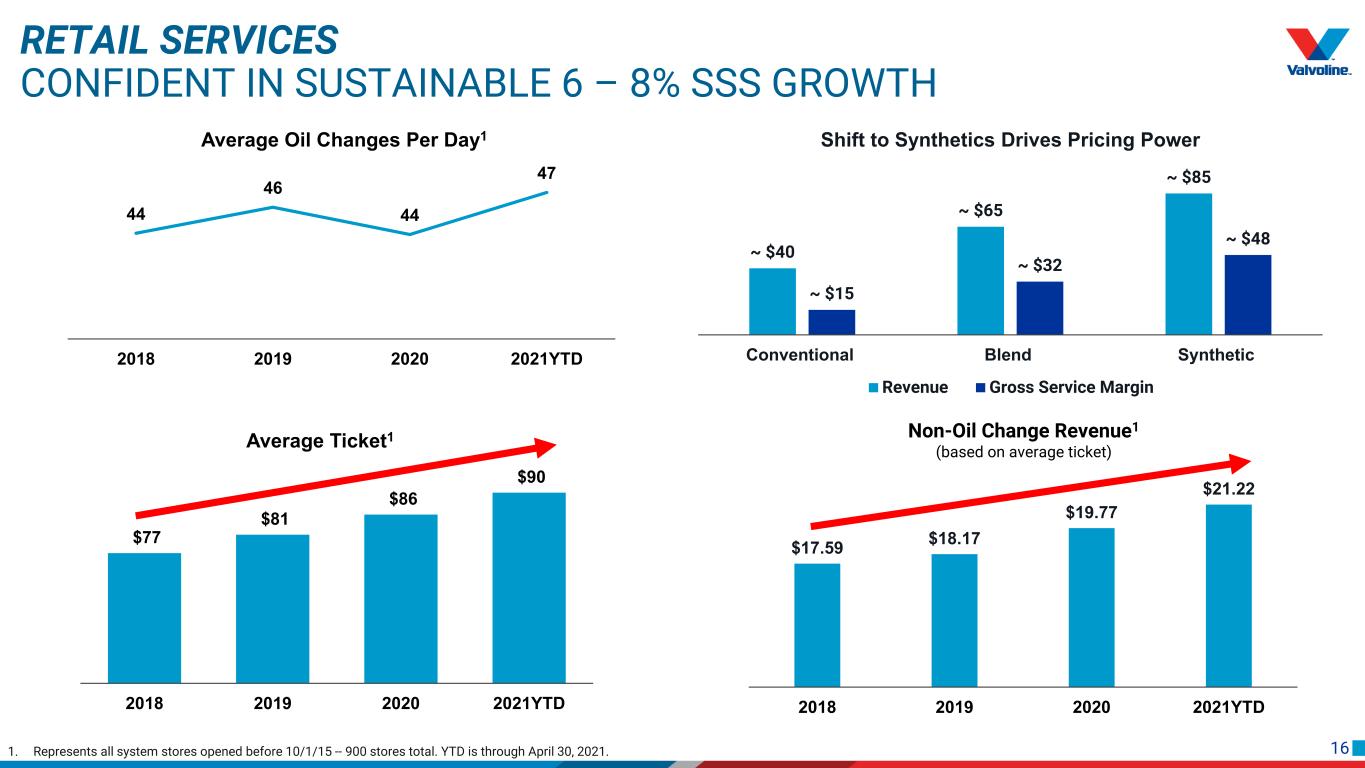
16 RETAIL SERVICES CONFIDENT IN SUSTAINABLE 6 – 8% SSS GROWTH Transaction Growth 1. Represents all system stores opened before 10/1/15 -- 900 stores total. YTD is through April 30, 2021. 44 46 44 47 2018 2019 2020 2021YTD Average Oil Changes Per Day1 $77 $81 $86 $90 $50 $55 $60 $65 $70 $75 $80 $85 $90 $95 2018 2019 2020 2021YTD Average Ticket1 ~ $40 ~ $65 ~ $85 ~ $15 ~ $32 ~ $48 Conventional Blend Synthetic Shift to Synthetics Drives Pricing Power Revenue Gross Service Margin $17.59 $18.17 $19.77 $21.22 2018 2019 2020 2021YTD Non-Oil Change Revenue1 (based on average ticket) Transaction Growth

17 RETAIL SERVICES LONG RUNWAY FOR TARGETED UNIT GROWTH: 5 – 7% ANNUAL GROWTH Less than 15% Household1 Penetration Company Franchise 1,548 Locations3 (673 Company, 875 Franchise) +1 %Industry leading three-pronged unit growth strategy of company stores, franchise stores, and M&A >6,000 Non-Independent Quick Lubes ~4,000 Independent Quick Lubes >10,000 Quick Lubes (US/Canada) North American Quick Lubes Industry2 1. Households (HHs) are based upon HHs within a 5-minute drive of store location; penetration based upon HHs within 5 minutes divided by estimated total US and Canadian HHs. 2. Autocare Association Factbook based on estimates as of March 31, 2021. 3. As of March 31, 2021.

18 $202 $239 $247 $370 - $380 2018 2019 2020 2021E Adjusted1 EBITDA (Millions) RETAIL SERVICES EXPECTED GROWTH CONTINUES TO ACCELERATE 2021E - 2024E Adj. EBITDA margin increase3 400 - 500 bps Revenue CAGR 14 - 16% Adj. EBITDA margin 30 - 32% Key Changes • Segment name change from Quick Lubes to Retail Services • Reclassification of indirect cost allocations and LIFO adjustments from operating segments to Corporate2 • Increased disclosure and transparency 1. For reconciliation of adjusted amounts to amounts reported under GAAP, please refer to the Appendix. 2. Reallocation of indirect costs based on estimated resource utilization, including reclassification of costs of indirect corporate functions. 3. Increase due to reallocation of indirect expenses and LIFO adjustments. 29.1% 28.0% ~30%EBITDA Margin 30.6%

19
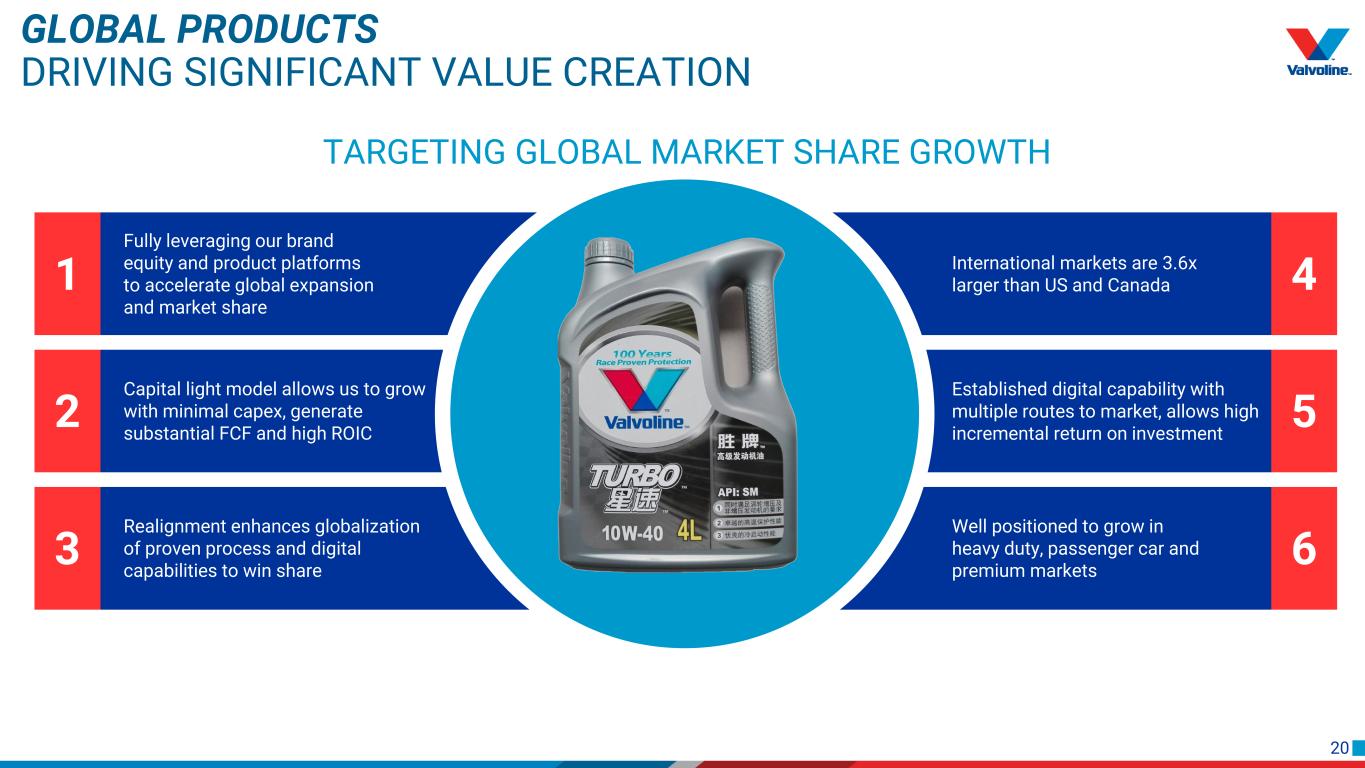
20 3 6 2 5 GLOBAL PRODUCTS DRIVING SIGNIFICANT VALUE CREATION Fully leveraging our brand equity and product platforms to accelerate global expansion and market share International markets are 3.6x larger than US and Canada Established digital capability with multiple routes to market, allows high incremental return on investment Capital light model allows us to grow with minimal capex, generate substantial FCF and high ROIC Realignment enhances globalization of proven process and digital capabilities to win share Well positioned to grow in heavy duty, passenger car and premium markets 1 4 TARGETING GLOBAL MARKET SHARE GROWTH
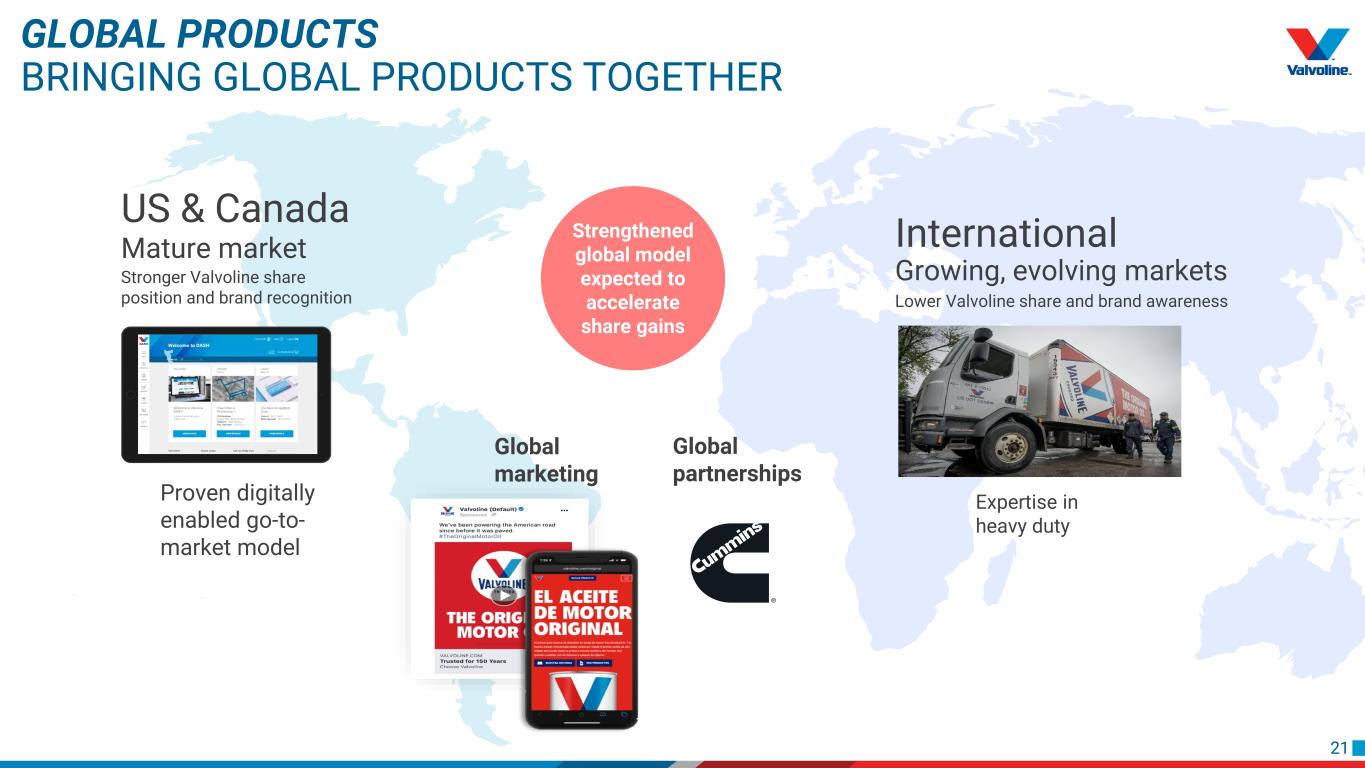
21 Proven digitally enabled go-to- market model Expertise in heavy duty International Growing, evolving markets Lower Valvoline share and brand awareness Global marketing US & Canada Mature market Stronger Valvoline share position and brand recognition Global partnerships Strengthened global model expected to accelerate share gains GLOBAL PRODUCTS BRINGING GLOBAL PRODUCTS TOGETHER
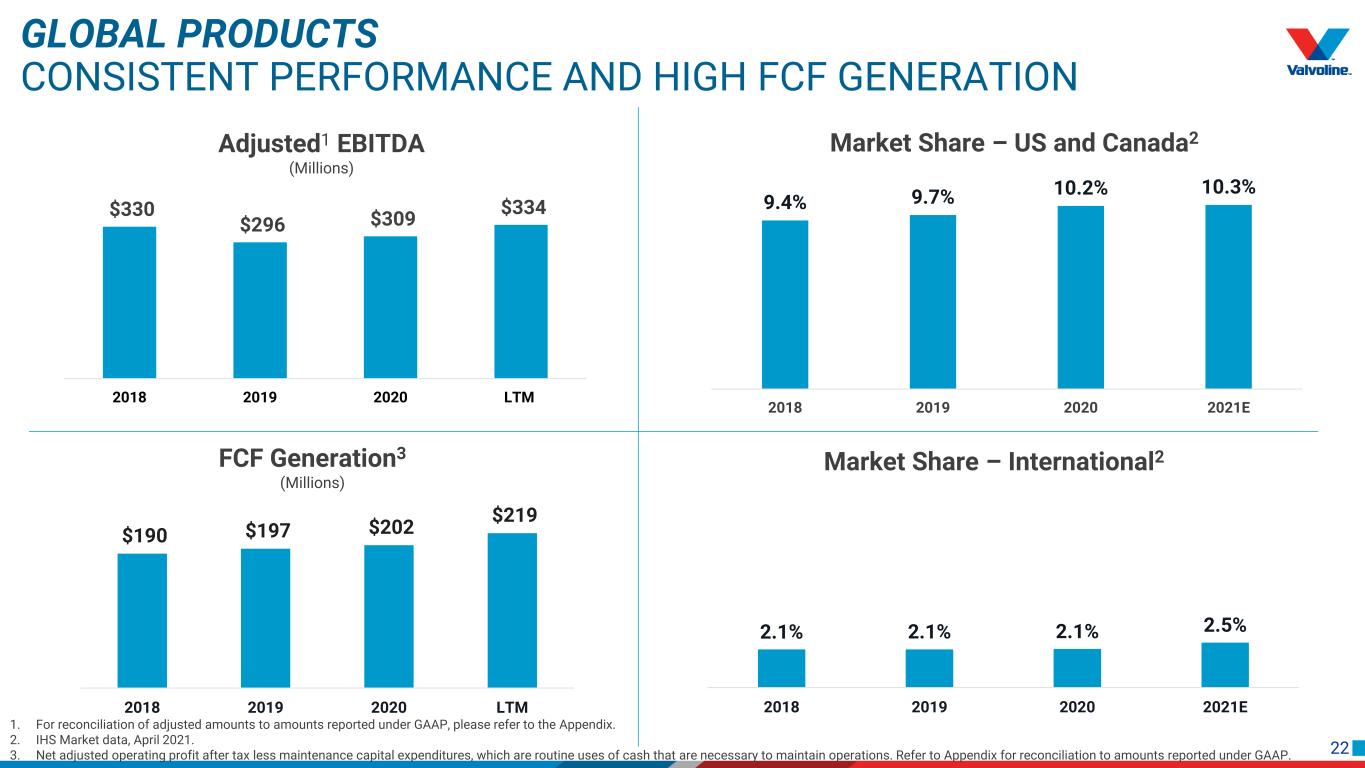
22 2.1% 2.1% 2.1% 2.5% 2018 2019 2020 2021E $190 $197 $202 $219 2018 2019 2020 LTM GLOBAL PRODUCTS CONSISTENT PERFORMANCE AND HIGH FCF GENERATION Market Share – US and Canada2 Market Share – International2FCF Generation3 (Millions) $330 $296 $309 $334 10% 12% 14% 16% 18% 20% 22% 24% 26% $- $50 $100 $150 $200 $250 $300 $350 $400 2018 2019 2020 LTM Adjusted1 EBITDA (Millions) 1. For reconciliation of adjusted amounts to amounts reported under GAAP, please refer to the Appendix. 2. IHS Market data, April 2021. 3. Net adjusted operating profit after tax less maintenance capital expenditures, which are routine uses of cash that are necessary to maintain operations. Refer to Appendix for reconciliation to amounts reported under GAAP. 9.4% 9.7% 10.2% 10.3% 2018 2019 2020 2021E
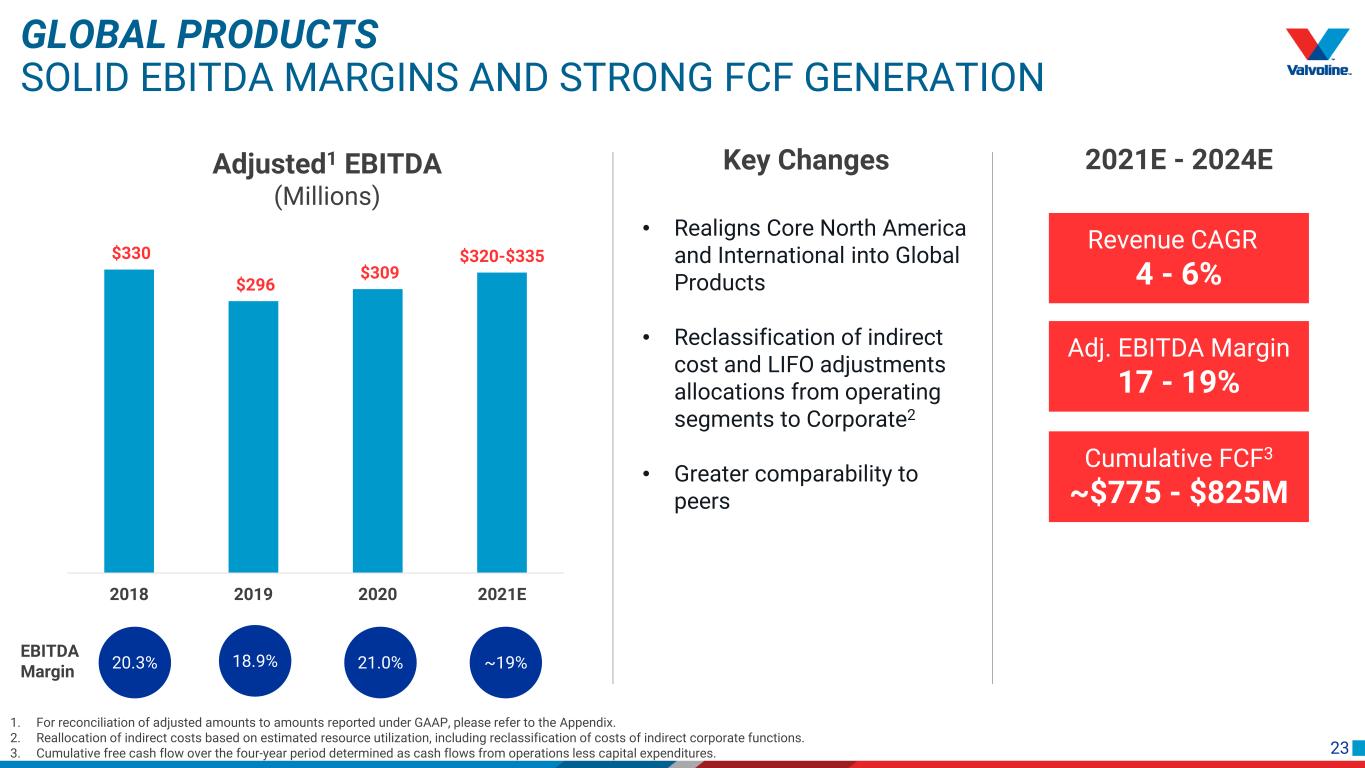
23 $330 $296 $309 $320-$335 $- $50 $100 $150 $200 $250 $300 $350 $400 2018 2019 2020 2021E Adjusted1 EBITDA (Millions) GLOBAL PRODUCTS SOLID EBITDA MARGINS AND STRONG FCF GENERATION 2021E - 2024E Revenue CAGR 4 - 6% Adj. EBITDA Margin 17 - 19% Cumulative FCF3 ~$775 - $825M Key Changes • Realigns Core North America and International into Global Products • Reclassification of indirect cost and LIFO adjustments allocations from operating segments to Corporate2 • Greater comparability to peers 1. For reconciliation of adjusted amounts to amounts reported under GAAP, please refer to the Appendix. 2. Reallocation of indirect costs based on estimated resource utilization, including reclassification of costs of indirect corporate functions. 3. Cumulative free cash flow over the four-year period determined as cash flows from operations less capital expenditures. 18.9% 21.0% ~19% EBITDA Margin 20.3%

24
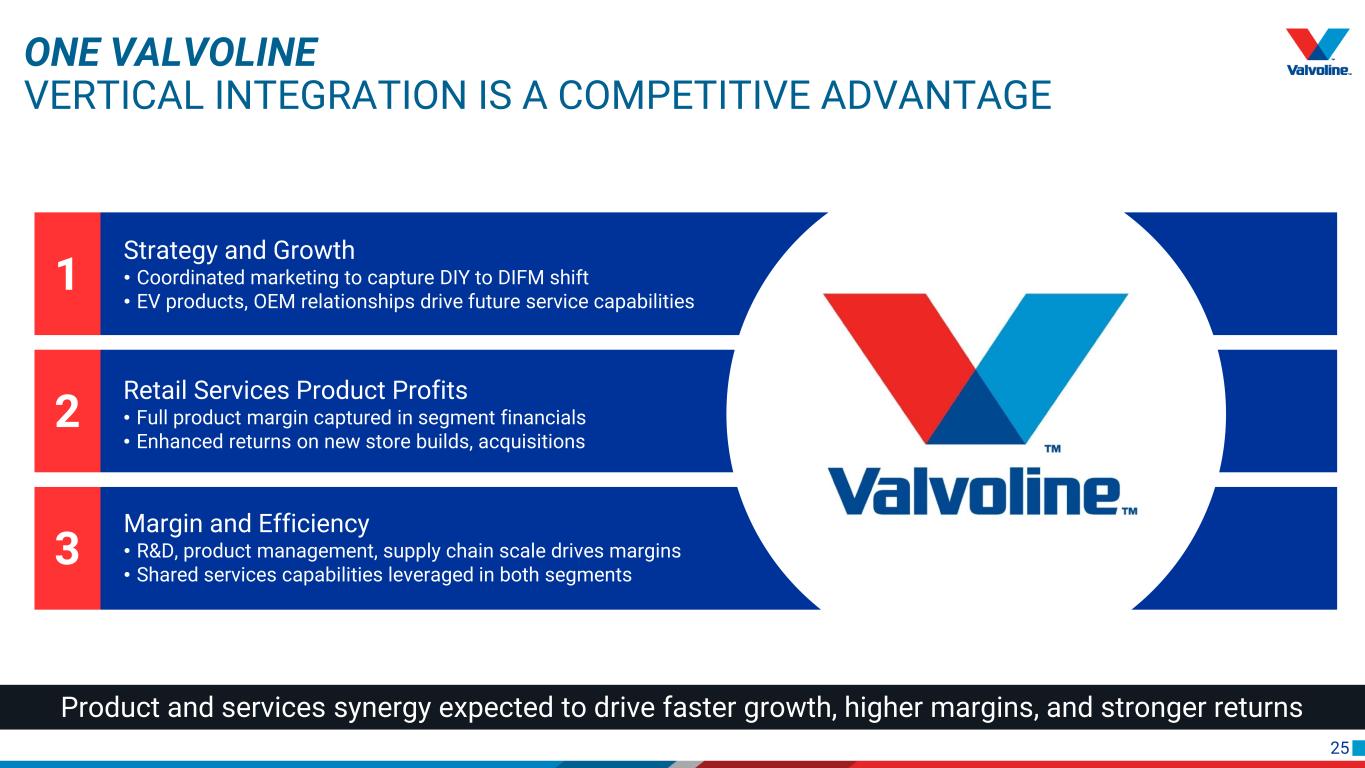
25 3 2 Strategy and Growth • Coordinated marketing to capture DIY to DIFM shift • EV products, OEM relationships drive future service capabilities 1 Product and services synergy expected to drive faster growth, higher margins, and stronger returns Retail Services Product Profits • Full product margin captured in segment financials • Enhanced returns on new store builds, acquisitions Margin and Efficiency • R&D, product management, supply chain scale drives margins • Shared services capabilities leveraged in both segments ONE VALVOLINE VERTICAL INTEGRATION IS A COMPETITIVE ADVANTAGE
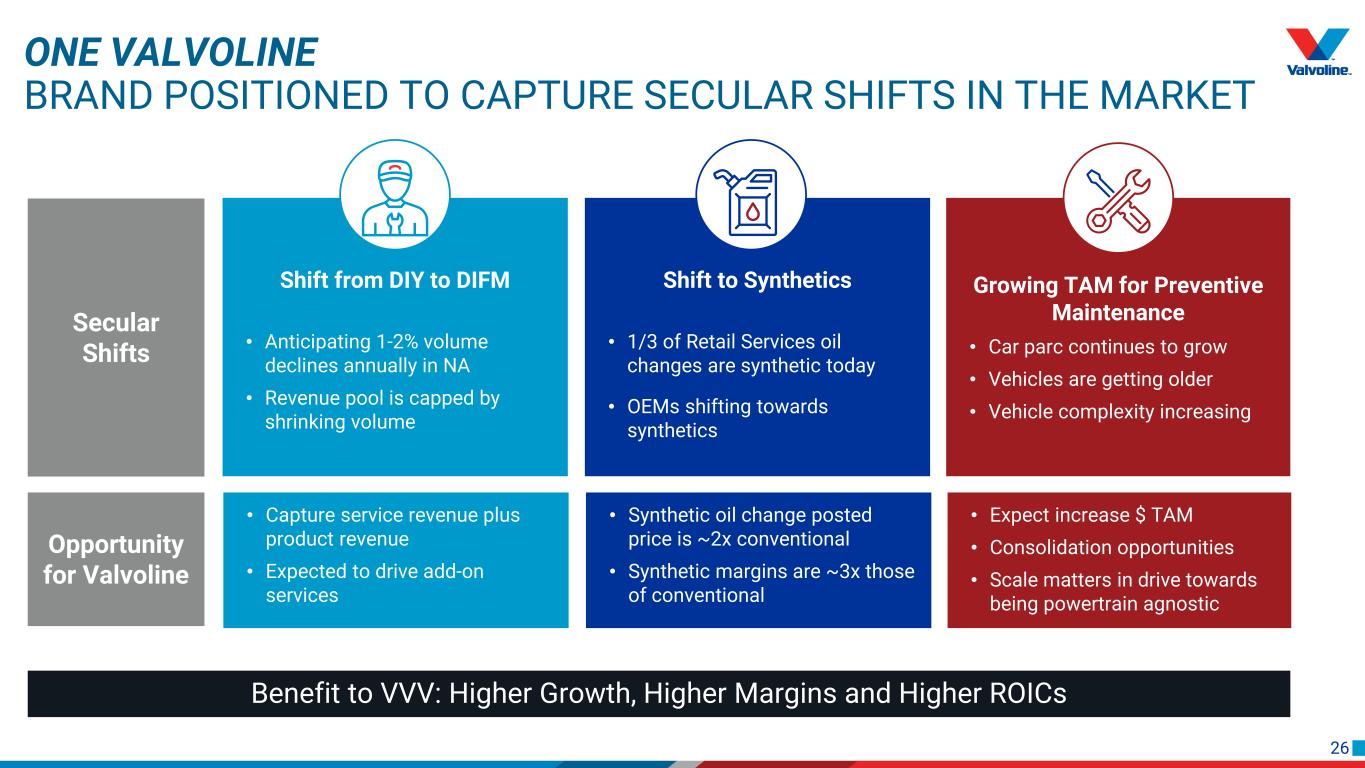
26 • Capture service revenue plus product revenue • Expected to drive add-on services ONE VALVOLINE BRAND POSITIONED TO CAPTURE SECULAR SHIFTS IN THE MARKET Shift from DIY to DIFM • Anticipating 1-2% volume declines annually in NA • Revenue pool is capped by shrinking volume Shift to Synthetics • 1/3 of Retail Services oil changes are synthetic today • OEMs shifting towards synthetics • Synthetic oil change posted price is ~2x conventional • Synthetic margins are ~3x those of conventional Growing TAM for Preventive Maintenance • Car parc continues to grow • Vehicles are getting older • Vehicle complexity increasing • Expect increase $ TAM • Consolidation opportunities • Scale matters in drive towards being powertrain agnostic Benefit to VVV: Higher Growth, Higher Margins and Higher ROICs Opportunity for Valvoline Secular Shifts
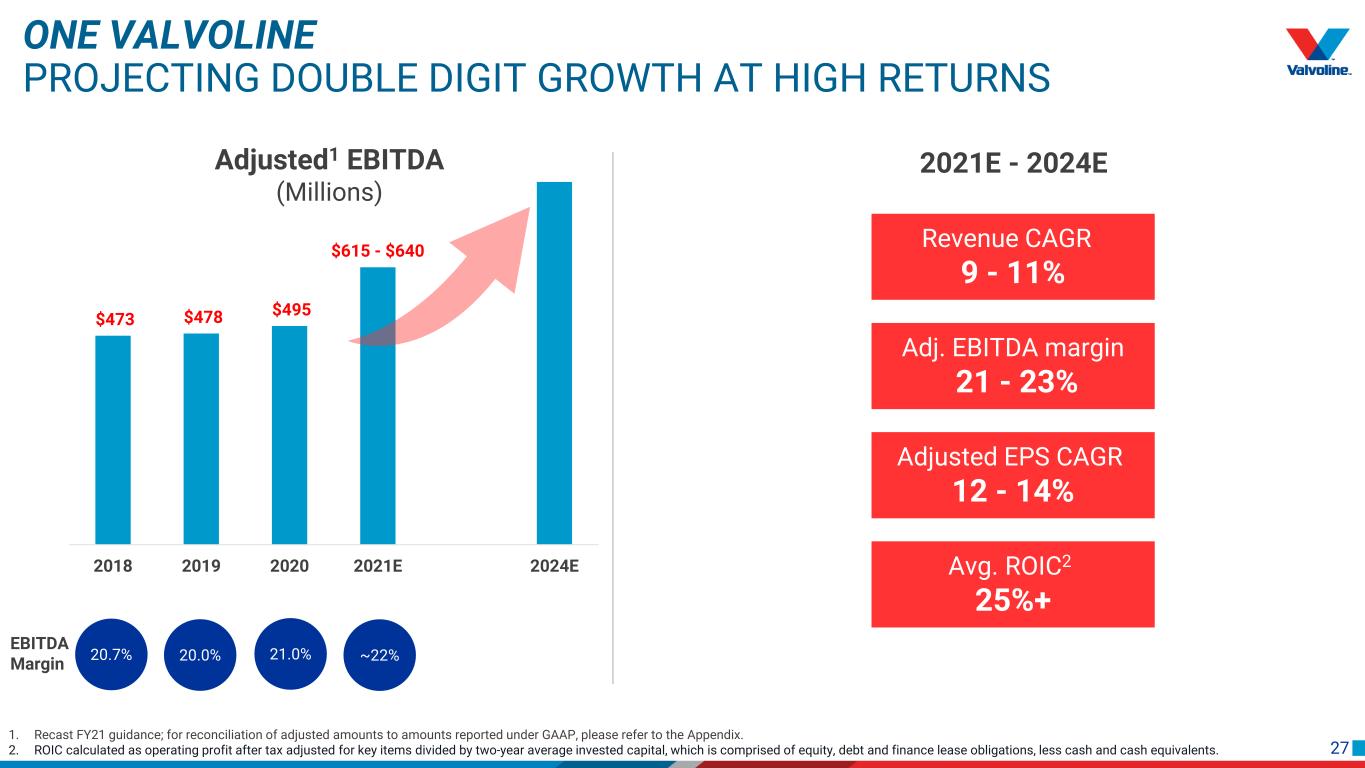
27 ONE VALVOLINE PROJECTING DOUBLE DIGIT GROWTH AT HIGH RETURNS 2021E - 2024E Revenue CAGR 9 - 11% Adj. EBITDA margin 21 - 23% Adjusted EPS CAGR 12 - 14% Avg. ROIC2 25%+ $473 $478 $495 $615 - $640 $(50) $50 $150 $250 $350 $450 $550 $650 $750 $850 $950 2018 2019 2020 2021E 2024E Adjusted1 EBITDA (Millions) 1. Recast FY21 guidance; for reconciliation of adjusted amounts to amounts reported under GAAP, please refer to the Appendix. 2. ROIC calculated as operating profit after tax adjusted for key items divided by two-year average invested capital, which is comprised of equity, debt and finance lease obligations, less cash and cash equivalents. 20.0% 21.0% ~22% EBITDA Margin 20.7%

28 Historical Performance Consensus Estimates VALVOLINE OUTPERFORMS AUTO AFTERMARKET PEERS CY2019 – CY2021E EBITDA Growth 9.6% 8.4% Average SSS Over Last 3 Fiscal Years 6.9% CY2019A – CY2021E Revenue Growth 15.0% 12.5% CY2020A – CY2022E EBITDA Growth4,5 19.9% CY2020A – CY2022E Revenue Growth3 CY2021E EBITDA Margin 1. Market data as of May 13, 2021. 2. Represents median of auto aftermarket companies including O’Reilly Auto Parts, Advance Auto Parts, AutoZone, Monro, The Boyd Group and Driven Brands. 3. Revenue median excludes Driven Brands due to acquisition of International Car Wash Group in 2020. 4. EBITDA median includes 2020 Acquisition Adjusted EBITDA for Driven Brands. 5. Boyd excludes impact of IFRS-16; excludes impact of lease liability in aggregate value and lease expenses in EBITDA for projection periods; lease expense adjustments in projected periods are forecasted based on pre-IFRS16 lease standard 2019 historical figures as percent of sales. Source: Capital IQ Auto Aftermarket1,2 7.5%1.8% 6.5% 12.7%5.9% 18.6% Average ROIC Over Last 3 Calendar Years 27.7% 10.0%
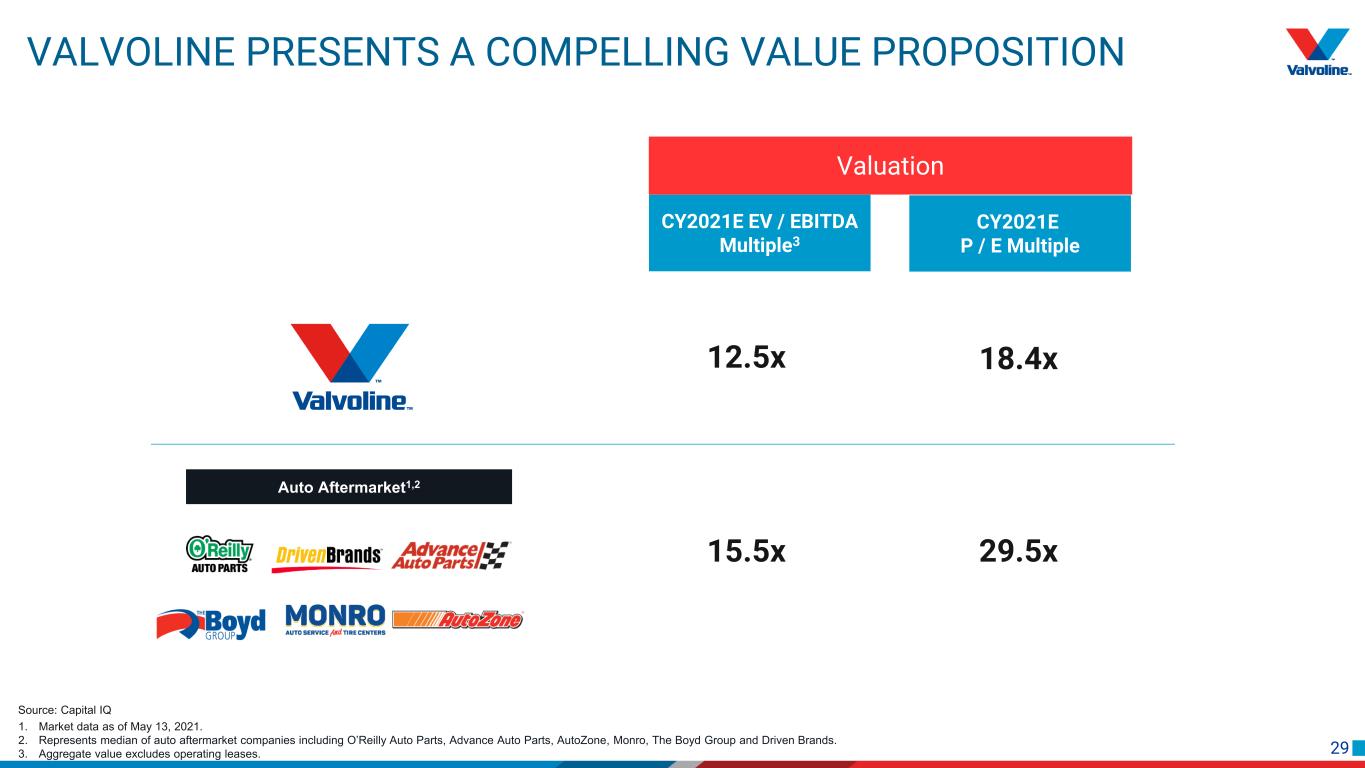
29 VALVOLINE PRESENTS A COMPELLING VALUE PROPOSITION 1. Market data as of May 13, 2021. 2. Represents median of auto aftermarket companies including O’Reilly Auto Parts, Advance Auto Parts, AutoZone, Monro, The Boyd Group and Driven Brands. 3. Aggregate value excludes operating leases. Source: Capital IQ Auto Aftermarket1,2 Valuation CY2021E EV / EBITDA Multiple3 CY2021E P / E Multiple 12.5x 18.4x 15.5x 29.5x
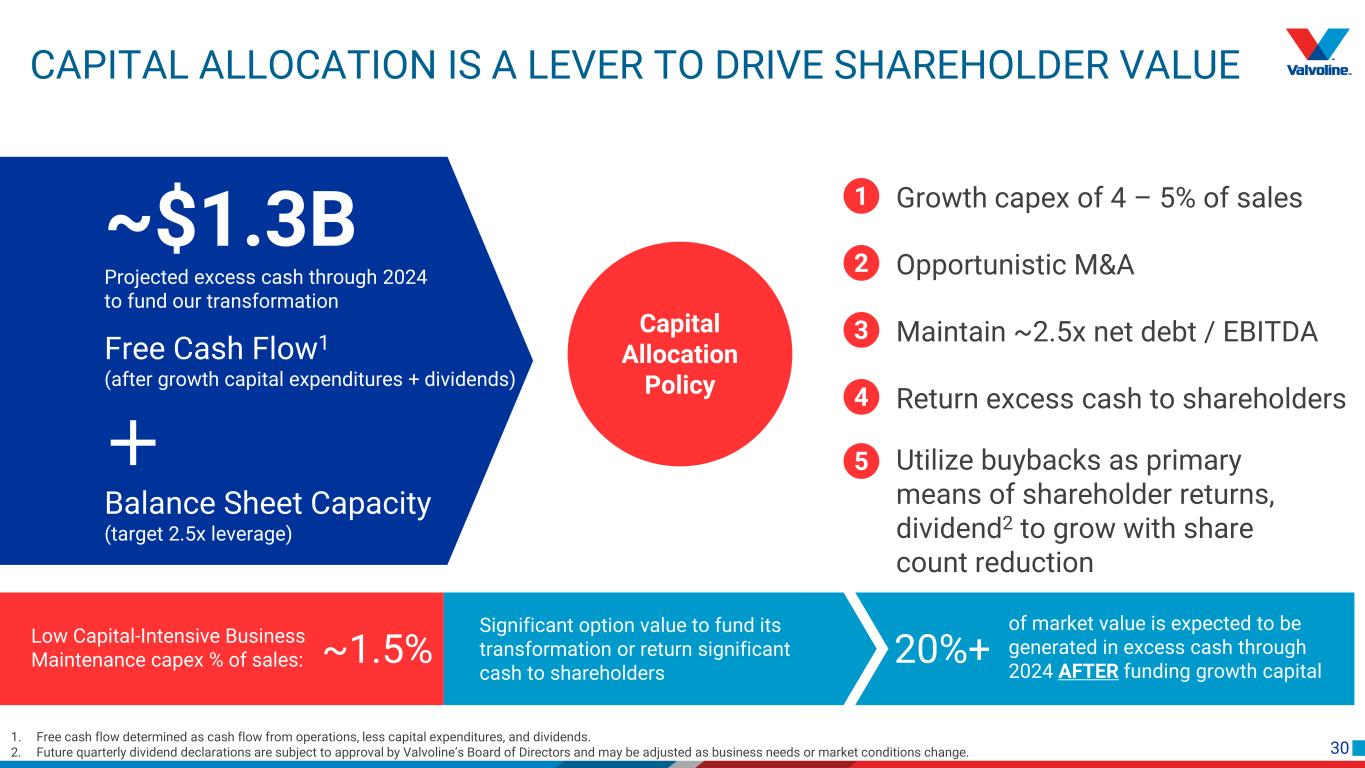
30 CAPITAL ALLOCATION IS A LEVER TO DRIVE SHAREHOLDER VALUE ~1.5% ~$1.3B Projected excess cash through 2024 to fund our transformation Balance Sheet Capacity (target 2.5x leverage) Free Cash Flow1 (after growth capital expenditures + dividends) 20%+ Significant option value to fund its transformation or return significant cash to shareholders Low Capital-Intensive Business Maintenance capex % of sales: of market value is expected to be generated in excess cash through 2024 AFTER funding growth capital Capital Allocation Policy 1 Growth capex of 4 – 5% of sales 2 Opportunistic M&A 3 Maintain ~2.5x net debt / EBITDA 4 Return excess cash to shareholders 5 Utilize buybacks as primary means of shareholder returns, dividend2 to grow with share count reduction 1. Free cash flow determined as cash flow from operations, less capital expenditures, and dividends. 2. Future quarterly dividend declarations are subject to approval by Valvoline’s Board of Directors and may be adjusted as business needs or market conditions change.
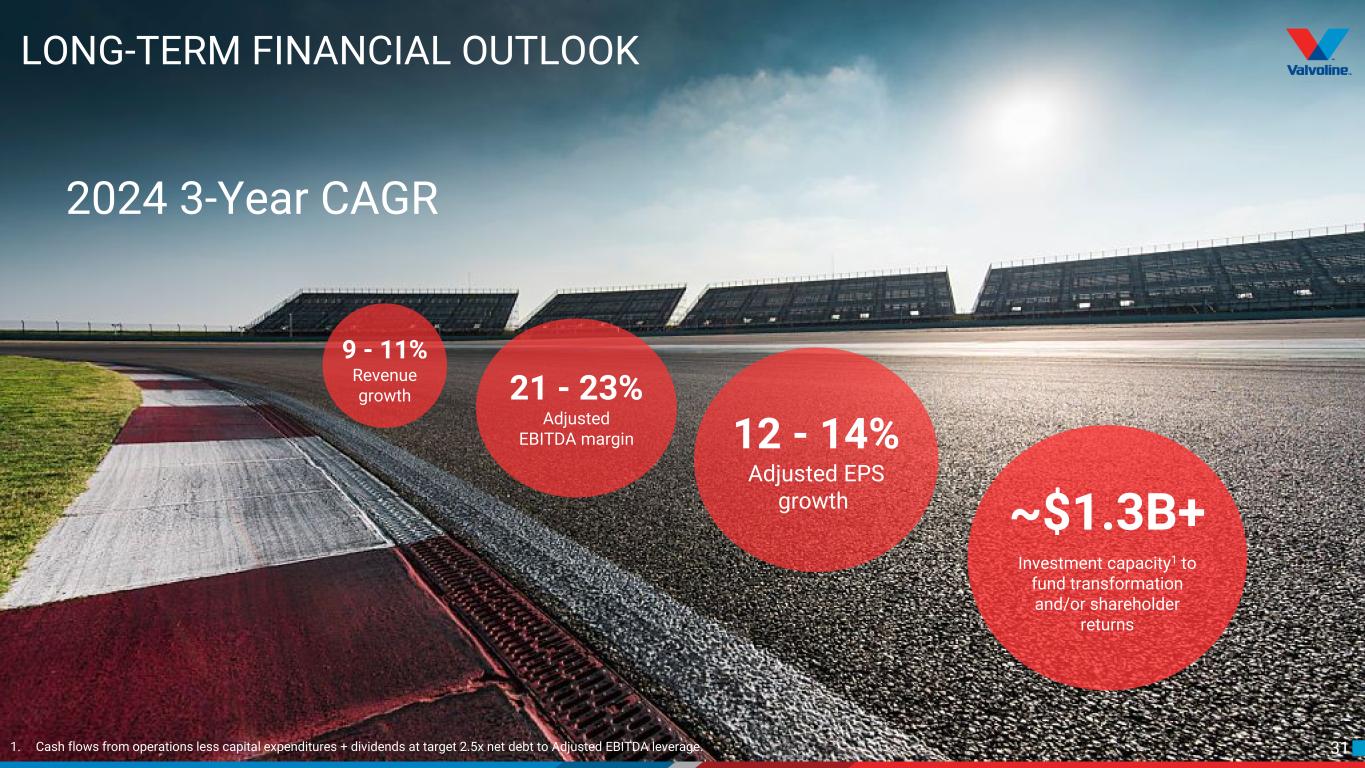
31 LONG-TERM FINANCIAL OUTLOOK 2024 3-Year CAGR 9 - 11% Revenue growth 21 - 23% Adjusted EBITDA margin 12 - 14% Adjusted EPS growth 1. Cash flows from operations less capital expenditures + dividends at target 2.5x net debt to Adjusted EBITDA leverage. ~$1.3B+ Investment capacity1 to fund transformation and/or shareholder returns
32
33 USE OF NON-GAAP MEASURES To aid in the understanding of Valvoline’s ongoing business performance, certain items within this presentation are presented on an adjusted basis. These non-GAAP measures, presented on both a consolidated and operating segment basis, are not defined within U.S. GAAP and do not purport to be alternatives to net or operating income/loss as a measure of operating performance. For a reconciliation of non-GAAP measures, refer to the tables in this Appendix. Adjusted EBITDA non-GAAP measures have been included herein, which management defines as: net income/loss, plus income tax expense/benefit, net interest and other financing expenses, and depreciation and amortization, adjusted for certain non-operational items, including net pension and other postretirement plan expense/income; changes in the LIFO inventory reserve; impairment of equity investment; and other items (which can include activity related to the separation from Ashland, impact of significant acquisitions or divestitures, restructuring costs, or other non-operational income/costs not directly attributable to the underlying business). Adjusted EBITDA is not prepared in accordance with U.S. GAAP and contains management’s best estimates of cost allocations and shared resource costs. Management believes the use of non-GAAP measures on a consolidated and operating segment basis assists investors in understanding the ongoing operating performance of Valvoline’s business by presenting comparable financial results between periods. The non-GAAP information provided is used by Valvoline’s management and may not be comparable to similar measures disclosed by other companies, because of differing methods used by other companies in calculating Adjusted EBITDA. These non-GAAP measures provide a supplemental presentation of Valvoline’s operating performance. Due to depreciable assets associated with the nature of the Company’s operations and interest costs related to Valvoline’s capital structure, management believes Adjusted EBITDA is an important supplemental measure to evaluate the Company’s operating results between periods on a comparable basis. In addition, Adjusted EBITDA generally includes adjustments for unusual, non-operational or restructuring-related activities, which impact the comparability of results between periods. Management believes this non-GAAP measure provides investors with a meaningful supplemental presentation of Valvoline’s operating performance. Adjusted EBITDA does not include changes in the Company’s LIFO inventory reserve, which are the charges or credits recognized in Cost of sales to value certain lubricant inventories at the lower of cost or market using the LIFO method. In inflationary or deflationary pricing environments, the application of LIFO can result in variability of the cost of sales recognized each period as the most recent costs are matched against current sales, while preceding costs are retained in inventories. LIFO adjustments are determined based on published prices, which are difficult to predict and largely dependent on future events. Management believes evaluating results without changes in the LIFO reserve provides an important view of Valvoline’s operational performance as the application of LIFO can impact comparability and enhance the lag period effects between changes in inventory costs and related pricing adjustments. Adjusted EBITDA also includes adjustments for net pension and other postretirement plan expense/income, which includes several elements impacted by changes in plan assets and obligations that are primarily driven by changes in the debt and equity markets, as well as those that are predominantly legacy in nature and related to prior service to the Company from employees (e.g., retirees, former employees, current employees with frozen benefits). These elements include (i) interest cost, (ii) expected return on plan assets, (iii) actuarial gains/losses, and (iv) amortization of prior service cost/credit. Significant factors that can contribute to changes in these elements include changes in discount rates used to remeasure pension and other postretirement obligations on an annual basis or upon a qualifying remeasurement, differences between actual and expected returns on plan assets, and other changes in actuarial assumptions, such as the life expectancy of plan participants. Accordingly, management considers that these elements are more reflective of changes in current conditions in global financial markets (in particular, interest rates) and are outside the operational performance of the business and are also primarily legacy amounts that are not directly related to the underlying business and do not have an immediate, corresponding impact on the compensation and benefits provided to eligible employees for current service. These measures include pension and other postretirement service costs related to current employee service as well as the costs of other benefits provided to employees. Valvoline’s results of operations are presented based on Valvoline’s management structure and internal accounting practices. The structure and practices are specific to Valvoline; therefore, Valvoline’s financial results, Adjusted EBITDA is not necessarily comparable with similar information for other comparable companies. Adjusted EBITDA has limitations as an analytical tool and should not be considered in isolation from, or as an alternative to, or more meaningful than, net and operating income as determined in accordance with U.S. GAAP. Because of these limitations, one should rely primarily on net and operating income as determined in accordance with U.S. GAAP and use Adjusted EBITDA only as supplemental information. In evaluating Adjusted EBITDA, one should be aware that in the future Valvoline may incur expenses/income similar to those for which adjustments are made in calculating Adjusted EBITDA. Valvoline’s presentation of Adjusted EBITDA should not be construed as a basis to infer that Valvoline’s future results will be unaffected by unusual or nonrecurring items Valvoline’s outlook for adjusted EBITDA is a non-GAAP financial measure that excludes or will otherwise be adjusted for items impacting comparability. Valvoline is unable to reconcile this forward-looking non-GAAP financial measure to GAAP net income without unreasonable efforts, as the Company is currently unable to predict with a reasonable degree of certainty the type and extent of certain items that would be expected to impact GAAP net income but would not impact non-GAAP adjusted results.
34 KEY BUSINESS MEASURES Valvoline tracks its operating performance and manages its business using certain key measures, including system-wide, company-owned and franchised store counts, sales and same- store sales. Management believes these measures are useful to evaluating and understanding Valvoline’s operating performance and should be considered as supplements to, not substitutes for, Valvoline's sales and operating income, as determined in accordance with U.S. GAAP. Sales in the Quick Lubes reportable segment are influenced by the number of service center stores and the business performance of those stores. Stores are considered open upon acquisition or opening for business. Temporary store closings remain in the respective store counts with only permanent store closures reflected in the activity and end of period store counts. SSS is defined as sales by U.S. Quick Lubes service center stores (company-owned, franchised and the combination of these for system-wide SSS), with new stores, including franchised conversions, excluded from the metric until the completion of their first full fiscal year in operation as this period is generally required for new store sales levels to begin to normalize. Quick Lubes revenue is limited to sales at company-owned stores, sales of lubricants and other products to independent franchisees and Express Care operators and royalties and other fees from franchised stores. Although Valvoline does not recognize store-level sales from franchised as revenue in its Statements of Consolidated Income, management believes system-wide and franchised SSS comparisons, sales and store counts are useful to assess the operating performance of the Quick Lubes reportable segment and the operating performance of an average Quick Lubes store.
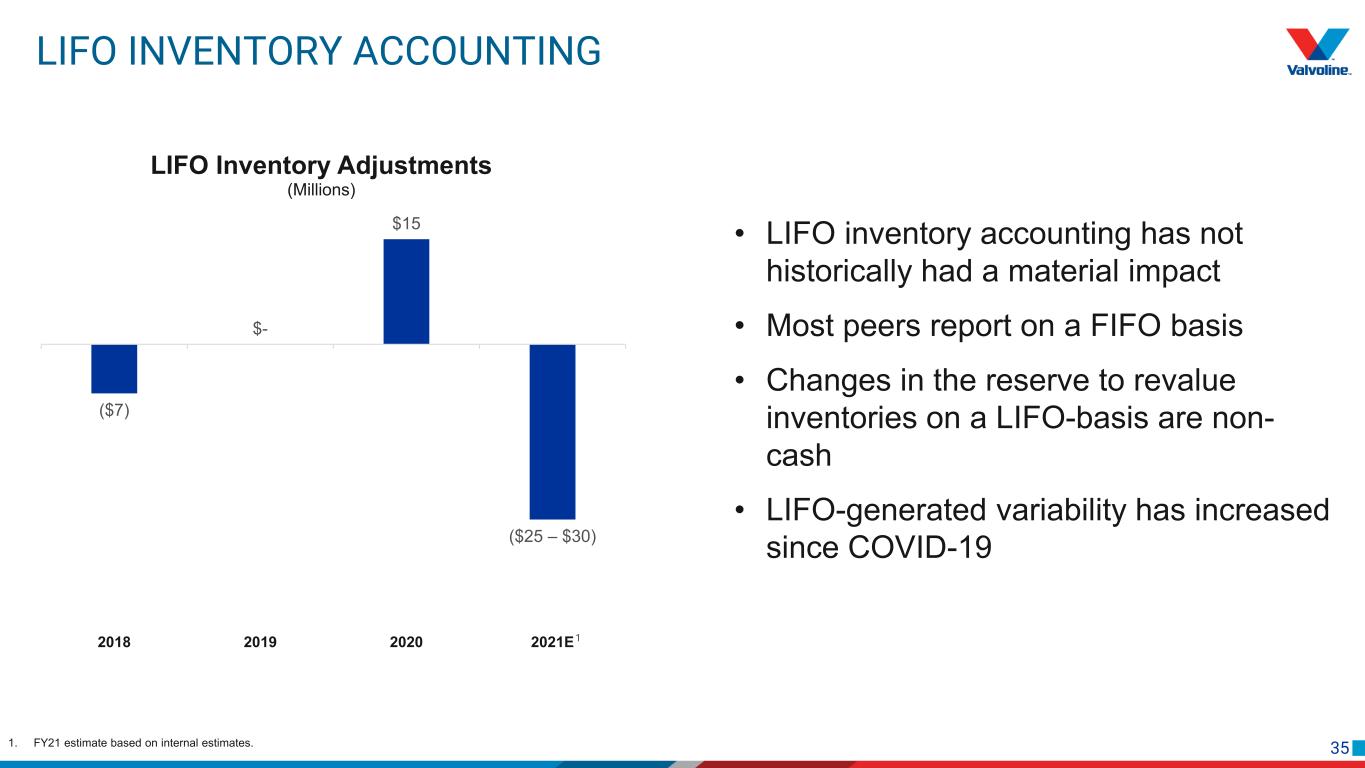
35 LIFO INVENTORY ACCOUNTING • LIFO inventory accounting has not historically had a material impact • Most peers report on a FIFO basis • Changes in the reserve to revalue inventories on a LIFO-basis are non- cash • LIFO-generated variability has increased since COVID-19 ($7) $- $15 ($25 – $30) 2018 2019 2020 2021E LIFO Inventory Adjustments (Millions) 1. FY21 estimate based on internal estimates. 1
36 SUMMARY OF INDIRECT EXPENSE ALLOCATION CHANGES • Valvoline is implementing changes to its allocation methodology for corporate and other SG&A not directly attributable to a particular segment • Indirect costs were previously fully allocated generally based on each segment’s proportional contribution to various financial measures (e.g., revenues and profits) • Valvoline’s indirect costs include a variety of functional areas: IT, finance, human resources, legal, research & development, and other administrative expenses • Most comparable global products and retail services businesses maintain certain costs in a corporate function Allocation change will begin in Q3 FY21 and prior periods revised for consistency
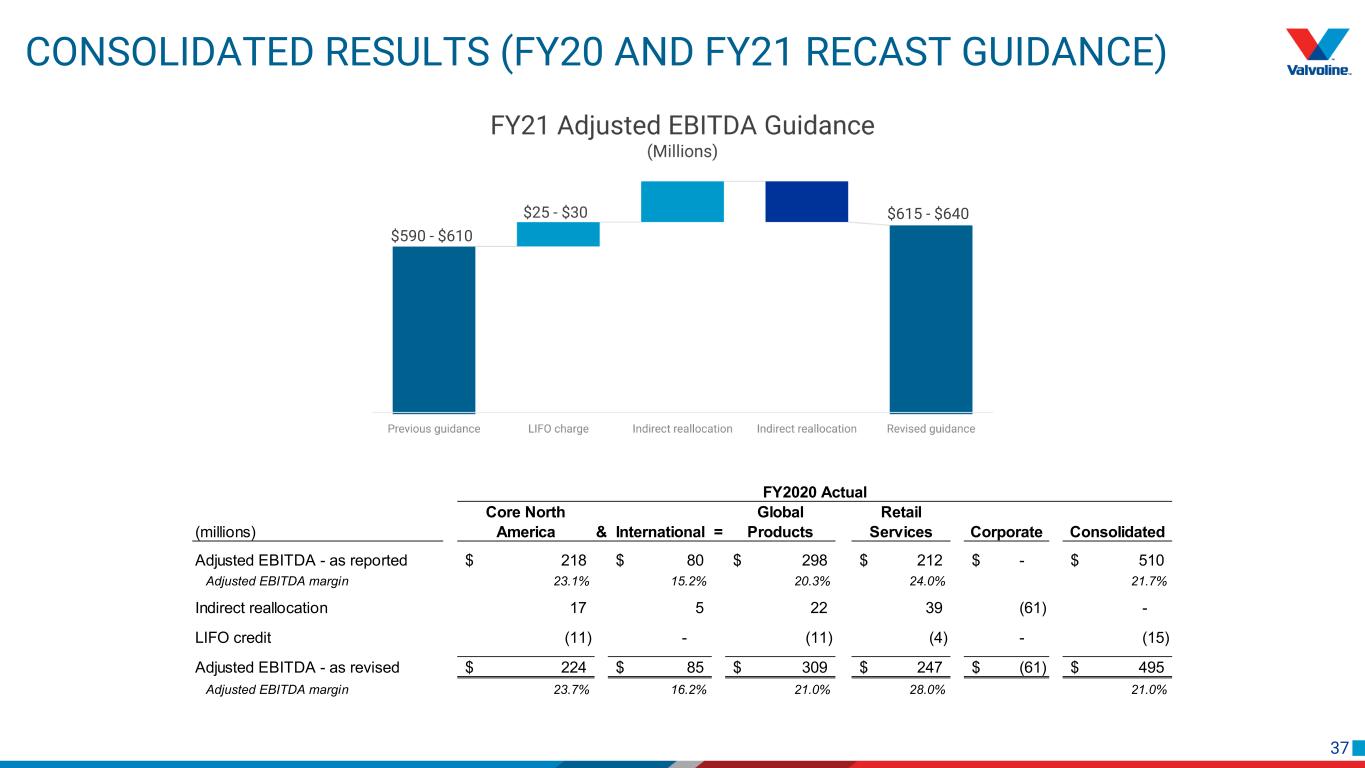
37 CONSOLIDATED RESULTS (FY20 AND FY21 RECAST GUIDANCE) (millions) Core North America & International = Global Products Retail Services Corporate Consolidated Adjusted EBITDA - as reported 218$ 80$ 298$ 212$ -$ 510$ Adjusted EBITDA margin 23.1% 15.2% 20.3% 24.0% 21.7% Indirect reallocation 17 5 22 39 (61) - LIFO credit (11) - (11) (4) - (15) Adjusted EBITDA - as revised 224$ 85$ 309$ 247$ (61)$ 495$ Adjusted EBITDA margin 23.7% 16.2% 21.0% 28.0% 21.0% FY2020 Actual $590 - $610 $615 - $640$25 - $30

38 RETAIL SERVICES RESULTS (FY20 AND FY21 YTD) 1. FY21 YTD through March 31, 2021.
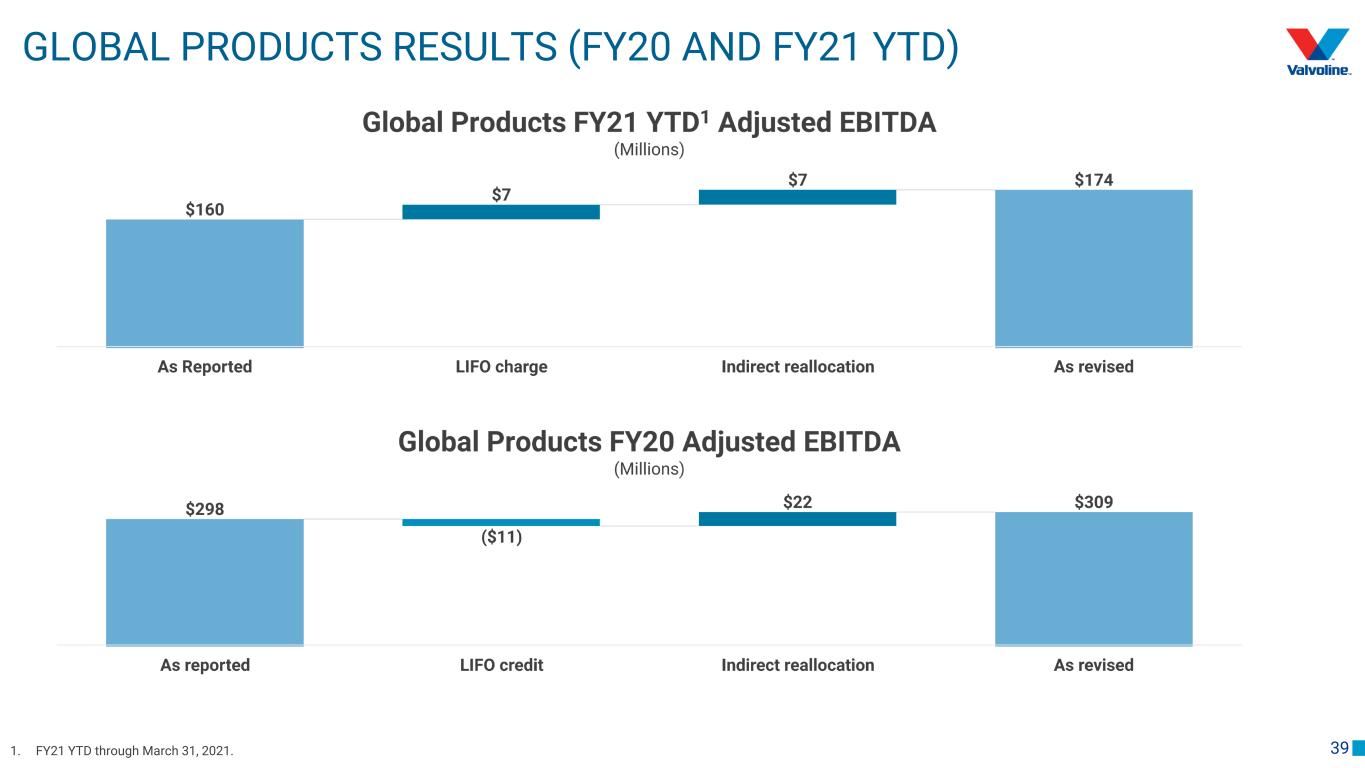
39 GLOBAL PRODUCTS RESULTS (FY20 AND FY21 YTD) 1. FY21 YTD through March 31, 2021.

40 RECONCILIATION OF RECAST ADJUSTED EBITDA For the six months ended (In millions) 2016 2017 2018 2019 2020 March 31, 2021 Net income 273$ 304$ 166$ 208$ 317$ 155$ Income tax expense 148 186 166 57 134 52 Net interest and other financing expenses 9 42 63 73 93 75 Depreciation and amortization 38 42 54 61 66 44 EBITDA 468 574 449 399 610 326 Net pension and other postretirement plan (income) expenses (35) (138) - 60 (59) (27) Net legacy and separation-related expenses (income) 6 11 14 3 (30) 1 LIFO (credit) charge (3) 5 7 - (15) 9 Compensated absences and benefits change - - - - (11) - Business interruption expenses (recovery) - - - 6 (2) (3) Acquisition and divestiture-related costs (income) 1 - 3 (4) 2 - Restructuring and related expenses - - - 14 - - Adjusted EBITDA 437$ 452$ 473$ 478$ 495$ 306$ For the years ended September 30
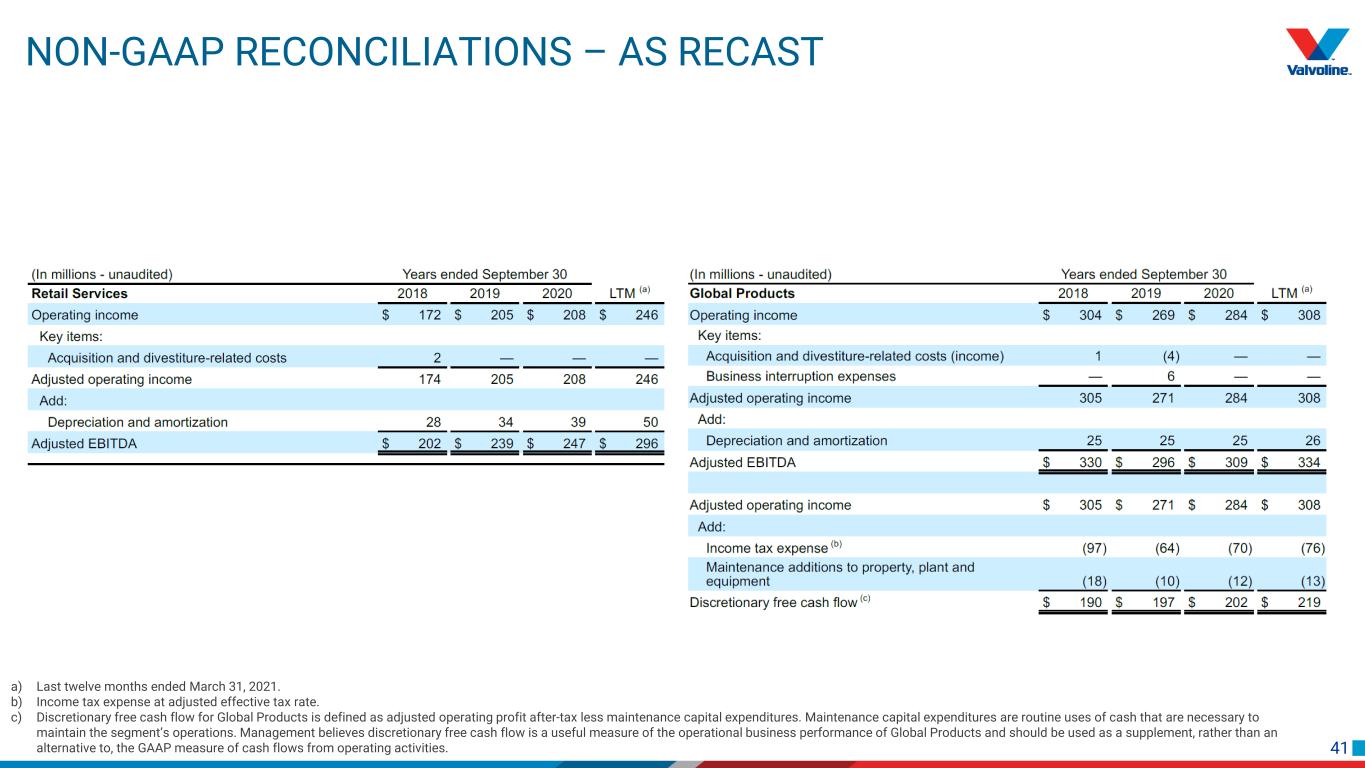
41 NON-GAAP RECONCILIATIONS – AS RECAST a) Last twelve months ended March 31, 2021. b) Income tax expense at adjusted effective tax rate. c) Discretionary free cash flow for Global Products is defined as adjusted operating profit after-tax less maintenance capital expenditures. Maintenance capital expenditures are routine uses of cash that are necessary to maintain the segment’s operations. Management believes discretionary free cash flow is a useful measure of the operational business performance of Global Products and should be used as a supplement, rather than an alternative to, the GAAP measure of cash flows from operating activities.
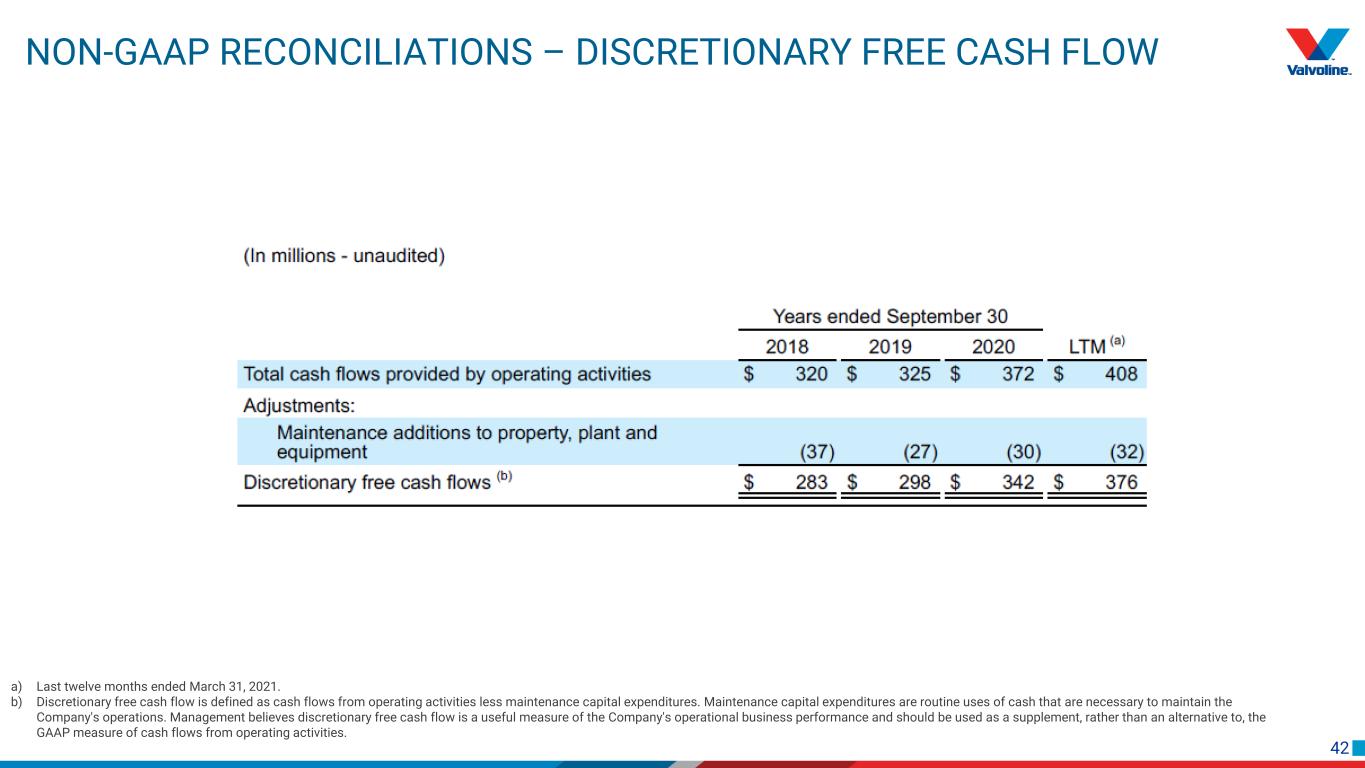
42 NON-GAAP RECONCILIATIONS – DISCRETIONARY FREE CASH FLOW a) Last twelve months ended March 31, 2021. b) Discretionary free cash flow is defined as cash flows from operating activities less maintenance capital expenditures. Maintenance capital expenditures are routine uses of cash that are necessary to maintain the Company's operations. Management believes discretionary free cash flow is a useful measure of the Company's operational business performance and should be used as a supplement, rather than an alternative to, the GAAP measure of cash flows from operating activities.
43
