Attached files
| file | filename |
|---|---|
| 8-K - GSE SYSTEMS INVESTOR PRESENTATION 05-19-2021 - GSE SYSTEMS INC | form8-k_irpres051921.htm |
Exhibit 99.1

Investor PresentationGSE Systems, Inc. (“GSE Solutions”)NASDAQ: GVPMay 19, 2021
Forward Looking Statements and Non-GAAP Financial Measures This presentation, our remarks, and answers to
questions contain statements that are considered forward-looking statements within the meaning of Section 27A of the Securities Act of 1933, as amended, and Section 21E of the Securities Exchange Act of 1934. These statements reflect our current
expectations concerning future events and results. We use words such as "expect," "intend," "believe," "may," "will," "should," "could," "anticipate," and similar expressions to identify forward-looking statements, but their absence does not mean
a statement is not forward-looking. These statements are not guarantees of our future performance and are subject to risks, uncertainties, and other important factors that could cause our actual performance or achievements to be materially
different from those we project. For a full discussion of these risks, uncertainties, and factors, we encourage you to read our documents on file with the Securities and Exchange Commission, including those set forth in our periodic reports under
the forward-looking statements and risk factors sections. We do not intend to update or revise any forward-looking statements, whether as a result of new information, future events, or otherwise.This presentation, our remarks, and answers to
questions include references to Adjusted EBITDA, adjusted net income, and adjusted earnings per share (“adjusted EPS”), which do not adhere to generally accepted accounting principles (“GAAP”). We define EBITDA as earnings before interest, taxes,
depreciation and amortization (“EBITDA”). “Adjusted EBITDA” excludes from EBITDA certain non-recurring gains and expense including non-cash loss on impairment, impact of the change in fair value of contingent consideration, restructuring charges,
stock-based compensation expense, impact of the change in fair value of derivative instruments, and acquisition-related expense. References to “Adjusted net income” excludes from net income non-cash loss on impairment, impact of the change in
fair value of contingent consideration, restructuring charges, stock-based compensation expense, impact of the change in fair value of derivative instruments, acquisition-related expense, and amortization of intangible assets related to
acquisitions. We define adjusted EPS as adjusted net income divided by fully diluted shares of common stock issued and outstanding. EBITDA, Adjusted EBITDA, Adjusted net income, and adjusted EPS are reconciled to net income, the most directly
comparable GAAP measure, in the financial tables included in the Appendix to this presentation. We believe that this additional information and the reconciliation we provide may be useful to help evaluate our operations. This information
supplements our results as reported in accordance with GAAP and should not be viewed in isolation from, or as a substitute for, our GAAP results.We undertake no duty to update or revise the information in light of new information, future events
or otherwise, although we may do so from time to time as management believes is appropriate. Any such updating may be made through the filing of reports or documents with the Securities and Exchange Commission, through press releases or through
other public disclosures.

GSE: Future of Power Operations Our mission is to deliver advanced engineering and flexible workforce
solutions that support clean energy production and the decarbonization of the power industry.

Corporate Overview
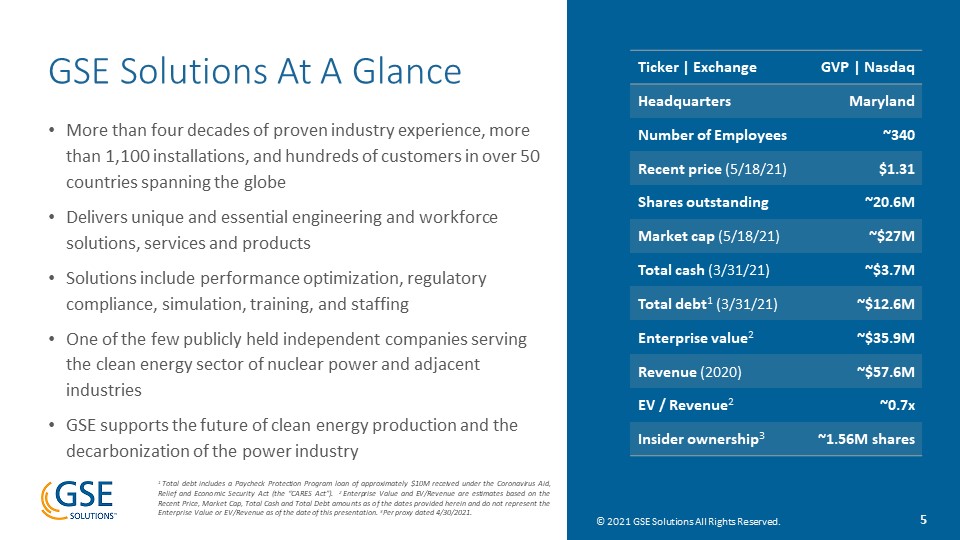
GSE Solutions At A Glance More than four decades of proven industry experience, more than 1,100
installations, and hundreds of customers in over 50 countries spanning the globeDelivers unique and essential engineering and workforce solutions, services and products Solutions include performance optimization, regulatory compliance,
simulation, training, and staffing One of the few publicly held independent companies serving the clean energy sector of nuclear power and adjacent industriesGSE supports the future of clean energy production and the decarbonization of the power
industry Ticker | Exchange GVP | Nasdaq Headquarters Maryland Number of Employees ~340 Recent price (5/18/21) $1.31 Shares outstanding ~20.6M Market cap (5/18/21) ~$27M Total cash (3/31/21) ~$3.7M Total debt1
(3/31/21) ~$12.6M Enterprise value2 ~$35.9M Revenue (2020) ~$57.6M EV / Revenue2 ~0.7x Insider ownership3 ~1.56M shares 1 Total debt includes a Paycheck Protection Program loan of approximately $10M received under the Coronavirus Aid,
Relief and Economic Security Act (the “CARES Act”). 2 Enterprise Value and EV/Revenue are estimates based on the Recent Price, Market Cap, Total Cash and Total Debt amounts as of the dates provided herein and do not represent the Enterprise Value
or EV/Revenue as of the date of this presentation. 3Per proxy dated 4/30/2021.
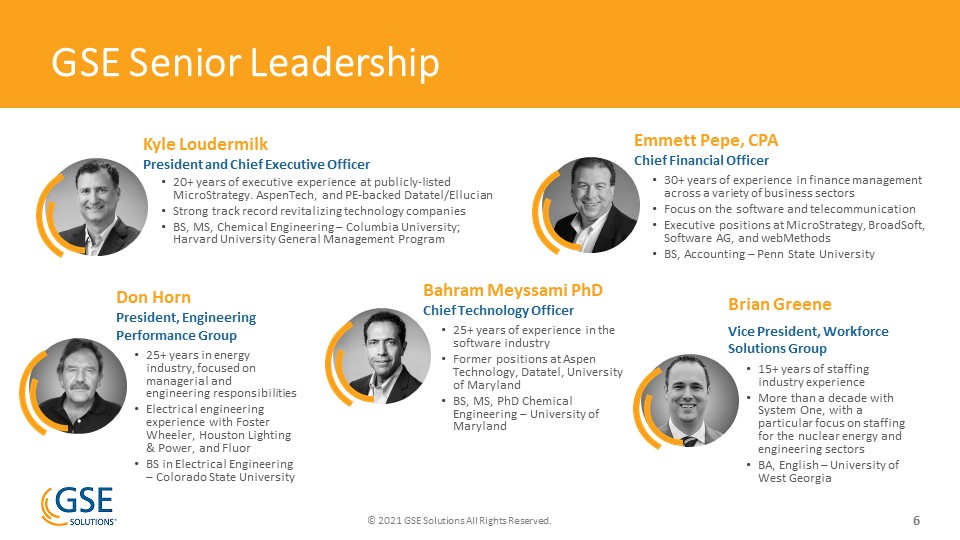
GSE Senior Leadership Kyle Loudermilk President and Chief Executive Officer20+ years of executive
experience at publicly-listed MicroStrategy. AspenTech, and PE-backed Datatel/Ellucian Strong track record revitalizing technology companiesBS, MS, Chemical Engineering – Columbia University; Harvard University General Management Program Emmett
Pepe, CPA Chief Financial Officer30+ years of experience in finance management across a variety of business sectors Focus on the software and telecommunicationExecutive positions at MicroStrategy, BroadSoft, Software AG, and webMethodsBS,
Accounting – Penn State University Bahram Meyssami PhD Chief Technology Officer25+ years of experience in the software industryFormer positions at Aspen Technology, Datatel, University of MarylandBS, MS, PhD Chemical Engineering – University of
Maryland Don Horn President, Engineering Performance Group 25+ years in energy industry, focused on managerial and engineering responsibilitiesElectrical engineering experience with Foster Wheeler, Houston Lighting & Power, and FluorBS in
Electrical Engineering – Colorado State University Brian Greene Vice President, Workforce Solutions Group 15+ years of staffing industry experience More than a decade with System One, with a particular focus on staffing for the nuclear energy
and engineering sectorsBA, English – University of West Georgia
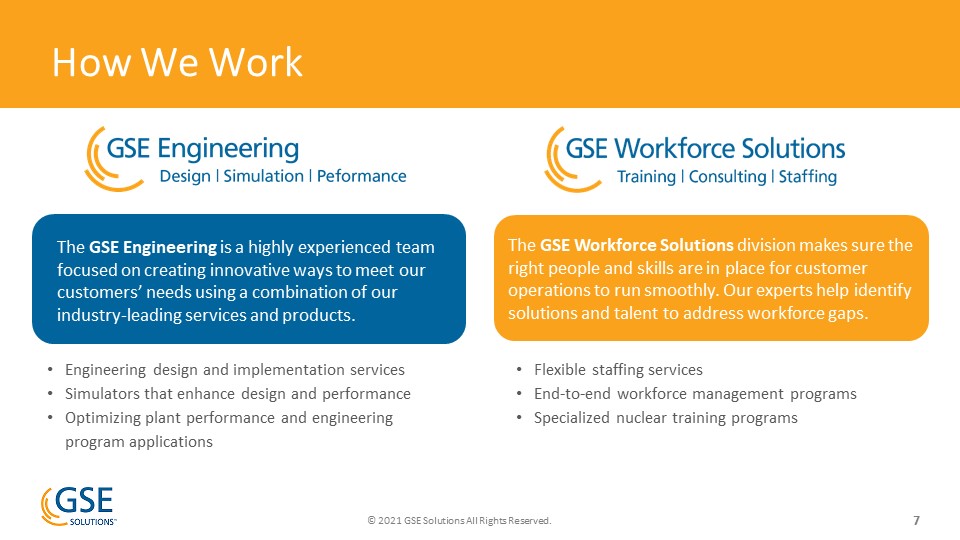
The GSE Workforce Solutions division makes sure the right people and skills are in place for customer
operations to run smoothly. Our experts help identify solutions and talent to address workforce gaps. How We Work Engineering design and implementation services Simulators that enhance design and performanceOptimizing plant performance and
engineering program applications The GSE Engineering is a highly experienced team focused on creating innovative ways to meet our customers’ needs using a combination of our industry-leading services and products. Flexible staffing services
End-to-end workforce management programsSpecialized nuclear training programs
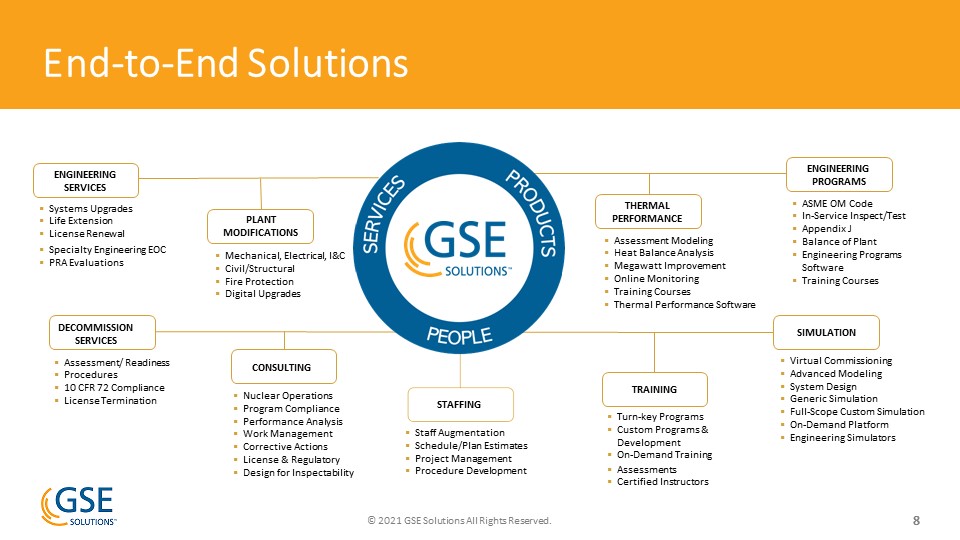
CONSULTING SIMULATION Virtual CommissioningAdvanced ModelingSystem DesignGeneric
SimulationFull-Scope Custom SimulationOn-Demand PlatformEngineering Simulators PLANT MODIFICATIONSMechanical, Electrical, I&CCivil/StructuralFire ProtectionDigital Upgrades DECOMMISSION SERVICESAssessment/ ReadinessProcedures10 CFR 72
ComplianceLicense Termination Staff AugmentationSchedule/Plan EstimatesProject ManagementProcedure Development TRAINING Turn-key ProgramsCustom Programs & DevelopmentOn-Demand TrainingAssessmentsCertified Instructors ENGINEERING
PROGRAMSASME OM CodeIn-Service Inspect/TestAppendix JBalance of PlantEngineering Programs SoftwareTraining Courses THERMAL PERFORMANCEAssessment ModelingHeat Balance AnalysisMegawatt ImprovementOnline MonitoringTraining CoursesThermal
Performance Software ENGINEERINGSERVICESSystems UpgradesLife ExtensionLicense Renewal Specialty Engineering EOCPRA Evaluations End-to-End Solutions STAFFING Nuclear OperationsProgram CompliancePerformance Analysis Work ManagementCorrective
ActionsLicense & RegulatoryDesign for Inspectability
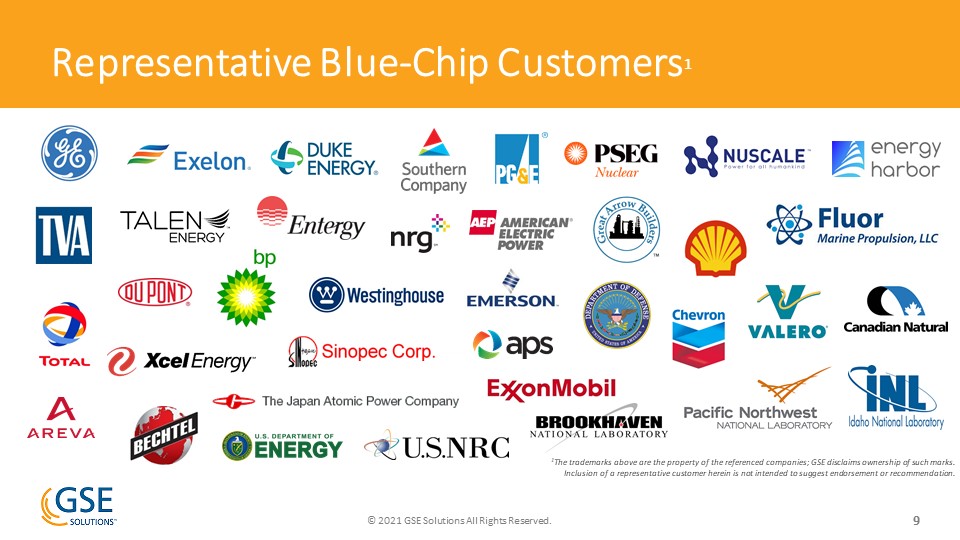
Representative Blue-Chip Customers1 1The trademarks above are the property of the referenced companies;
GSE disclaims ownership of such marks. Inclusion of a representative customer herein is not intended to suggest endorsement or recommendation.
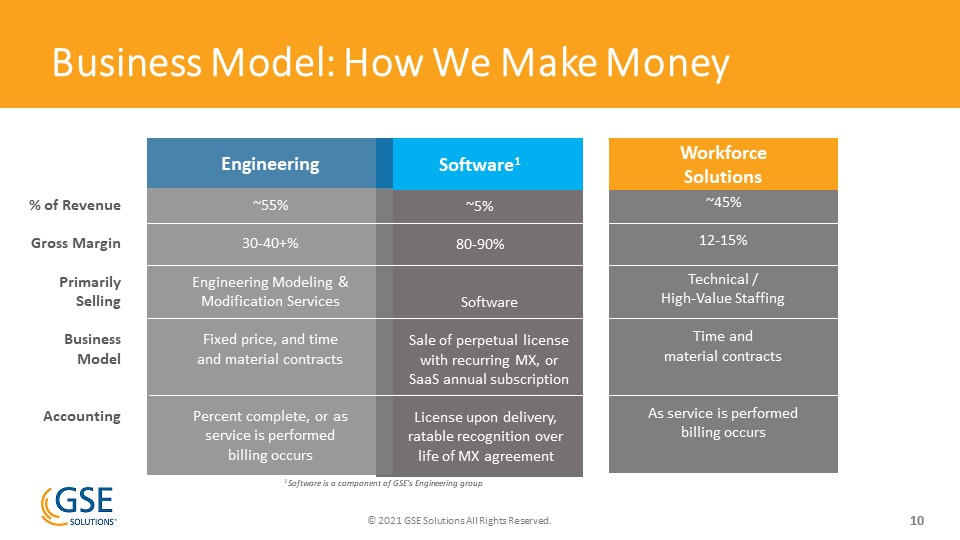
Business Model: How We Make Money ~45%12-15%Technical / High-Value StaffingTime and material contractsAs
service is performed billing occurs ~5%80-90%SoftwareSale of perpetual license with recurring MX, or SaaS annual subscriptionLicense upon delivery, ratable recognition over life of MX agreement Workforce Solutions Software1 % of RevenueGross
MarginPrimarily SellingBusiness ModelAccounting 1 Software is a component of GSE’s Engineering group Engineering ~55%30-40+%Engineering Modeling & Modification ServicesFixed price, and time and material contractsPercent complete, or as
service is performed billing occurs
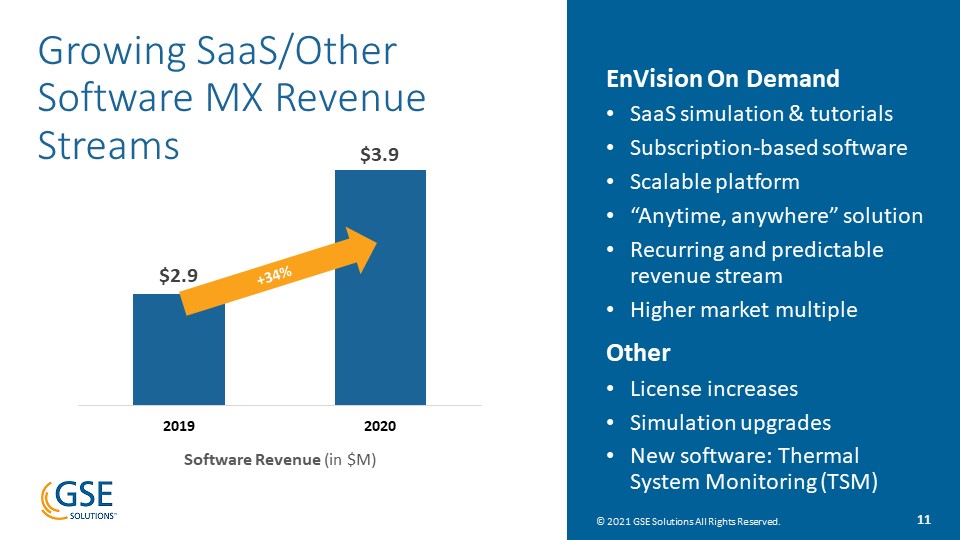
Growing SaaS/Other Software MX Revenue Streams EnVision On Demand SaaS simulation & tutorials
Subscription-based softwareScalable platform“Anytime, anywhere” solutionRecurring and predictable revenue streamHigher market multipleOther License increasesSimulation upgradesNew software: Thermal System Monitoring (TSM) +34% Software
Revenue (in $M)
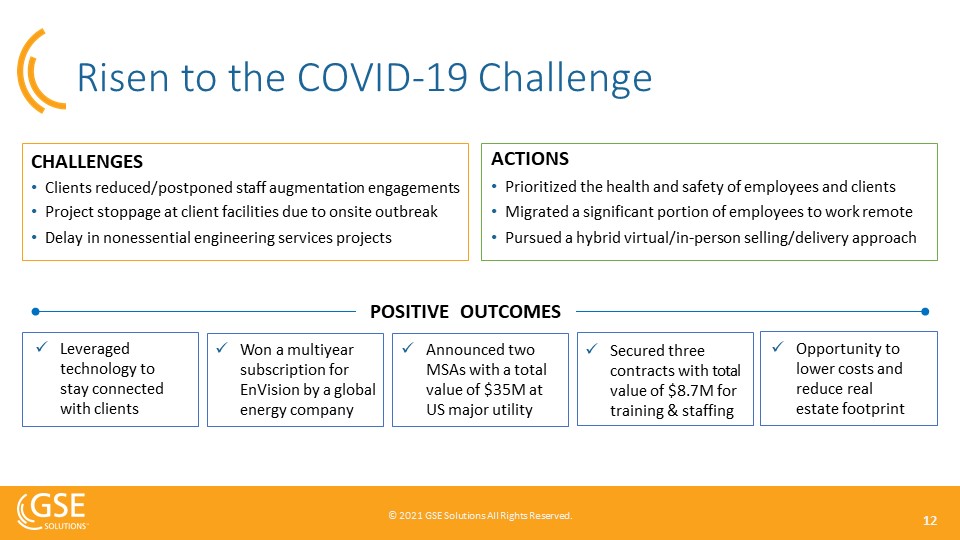
Announced two MSAs with a total value of $35M at US major utility Risen to the COVID-19
Challenge CHALLENGESClients reduced/postponed staff augmentation engagementsProject stoppage at client facilities due to onsite outbreakDelay in nonessential engineering services projects Leveraged technology to stay connected with
clients ACTIONSPrioritized the health and safety of employees and clientsMigrated a significant portion of employees to work remotePursued a hybrid virtual/in-person selling/delivery approach Won a multiyear subscription for EnVision by a
global energy company Opportunity to lower costs and reduce real estate footprint Secured three contracts with total value of $8.7M for training & staffing POSITIVE OUTCOMES

Industry Growth Drivers
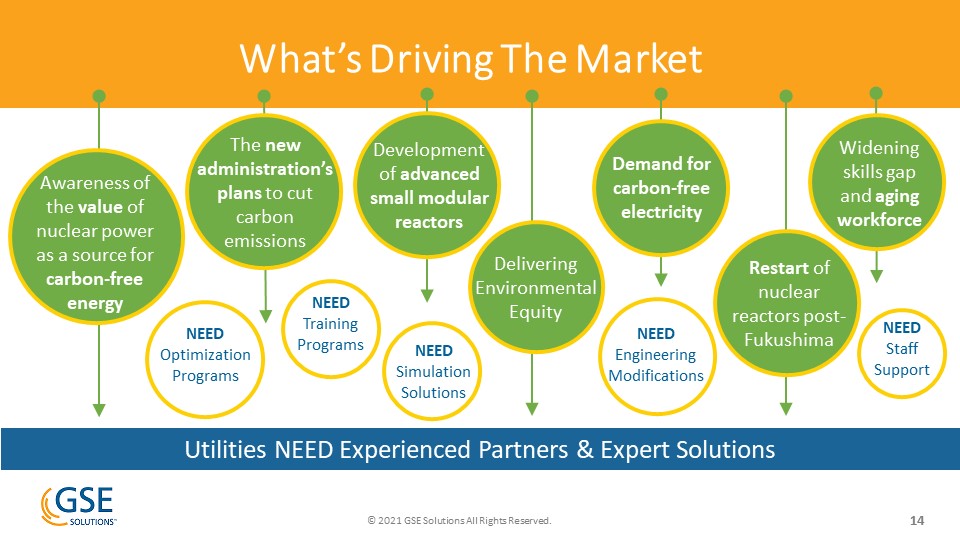
Utilities NEED Experienced Partners & Expert Solutions What’s Driving The
Market Delivering Environmental Equity Widening skills gap and aging workforce Awareness of the value of nuclear power as a source for carbon-free energy Demand for carbon-free electricity Restart of nuclear reactors
post-Fukushima Development of advanced small modular reactors The new administration’s plans to cut carbon emissions NEEDStaff Support NEEDTraining Programs NEEDOptimization Programs NEEDEngineeringModifications NEEDSimulationSolutions

Investing in Environmental Equity New Executive Actions: Clean EnergyCharged to create a carbon-free power
sector by 2035 US on a path to a net-zero economy by 2050Re-establish the President’s Council of Advisors on Science and TechnologyCreation of jobs and skilled-trades to accelerate clean energy and transmission projects Plan to increase the
resilience of facilities and operationsLikely phaseout and elimination of fossil fuel subsidies GSE is positioned as an essential enabler of US decarbonization.

Nuclear Leads the Way in Reducing CO2 Emissions Million Metric Tons, 2019 2019 US Emissions-Free
Electricity Fuel CO2 Emissions Avoided by the US Power Industry “Nuclear energy is America’s top source of carbon-free electricity and avoids more than 1/2 billion tons of carbon emissions each year.” Source: Nuclear Energy Institute Inc.,
Nuclear By The Numbers (August 2020)
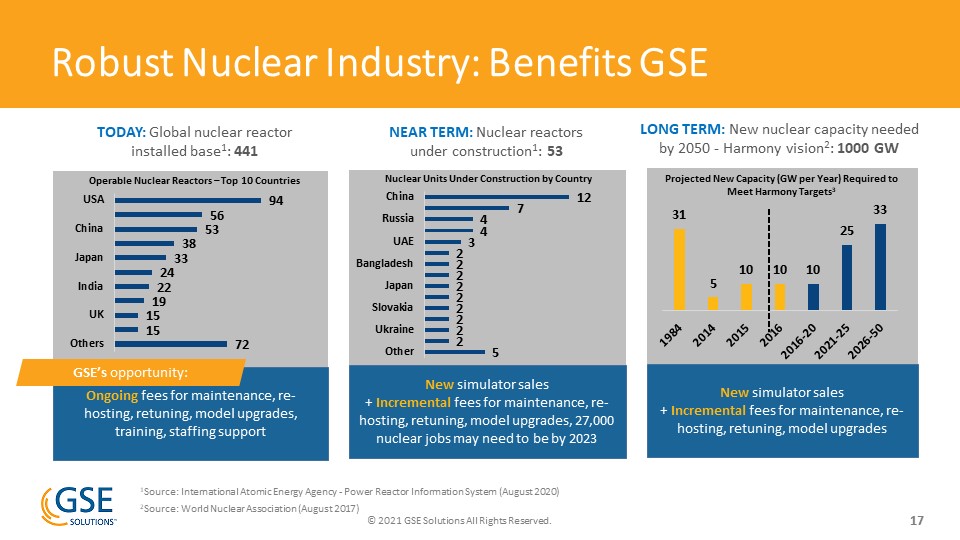
Robust Nuclear Industry: Benefits GSE TODAY: Global nuclear reactor installed base1: 441 Ongoing fees
for maintenance, re-hosting, retuning, model upgrades, training, staffing support NEAR TERM: Nuclear reactors under construction1: 53 LONG TERM: New nuclear capacity needed by 2050 - Harmony vision2: 1000 GW New simulator sales + Incremental
fees for maintenance, re-hosting, retuning, model upgrades, 27,000 nuclear jobs may need to be by 2023 New simulator sales+ Incremental fees for maintenance, re-hosting, retuning, model upgrades Nuclear Units Under Construction by
Country Operable Nuclear Reactors – Top 10 Countries Projected New Capacity (GW per Year) Required to Meet Harmony Targets3 GSE’s opportunity: 1Source: International Atomic Energy Agency - Power Reactor Information System (August
2020)2Source: World Nuclear Association (August 2017)
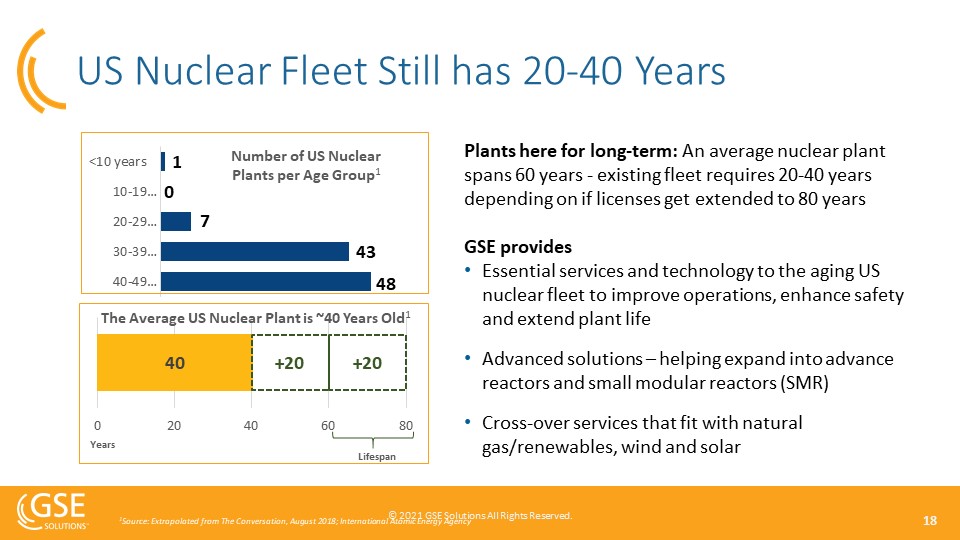
US Nuclear Fleet Still has 20-40 Years 1Source: Extrapolated from The Conversation, August 2018;
International Atomic Energy Agency Number of US Nuclear Plants per Age Group1 Plants here for long-term: An average nuclear plant spans 60 years - existing fleet requires 20-40 years depending on if licenses get extended to 80 yearsGSE
providesEssential services and technology to the aging US nuclear fleet to improve operations, enhance safety and extend plant lifeAdvanced solutions – helping expand into advance reactors and small modular reactors (SMR)Cross-over services that
fit with natural gas/renewables, wind and solar Years Lifespan The Average US Nuclear Plant is ~40 Years Old1

Small Modular Reactors (SMR) Gain Traction in 2020 * “A promising new non-emitting technology that has the
potential to produce reliable electricity in Canada, supporting the country’s transition to net-zero emissions by 2050.” 1December 2020 - Natural Resources Canada press release outlines next steps for progress on small modular reactor
technology.2 www.spglobal.com/platts/en/market-insights/latest-news/electric-power/021221-montana-senate-panel-oks-study-to-convert-colstrip-coal-plant-to-nuclear3
www.eenews.net/eedaily/2021/02/08/stories/1063724579?utm_campaign=edition&utm_medium=email&utm_source=eenews%3Aeedaily SEPT ‘20 US Nuclear Regulatory Commission approved the first SMR design by NuScale OCT ‘20 US DOE awarded $160M
to build working models of smaller scale advanced nuclear reactor designs NOV ‘20 UK announces ten-point plan for a green industrial revolution, including supporting the UK SMR program with a £215 million investment DEC ‘20 DOE announced
$30M in initial funding under its new Advanced Reactor Demonstration Program (ARDP), selecting five teams to receive funding DEC ‘20 Canada outlines next steps for progress on SMR technology1 FEB ‘21 Montana Senate Committee votes to pass a
feasibility study for replacing coal-fired boilers at a coal plant with SMRs2 FEB ‘21 US Rep Mike Simpson calls for breaching four Snake River dams and replacing energy with sources such as SMRs3 *Photo courteous of NuScale
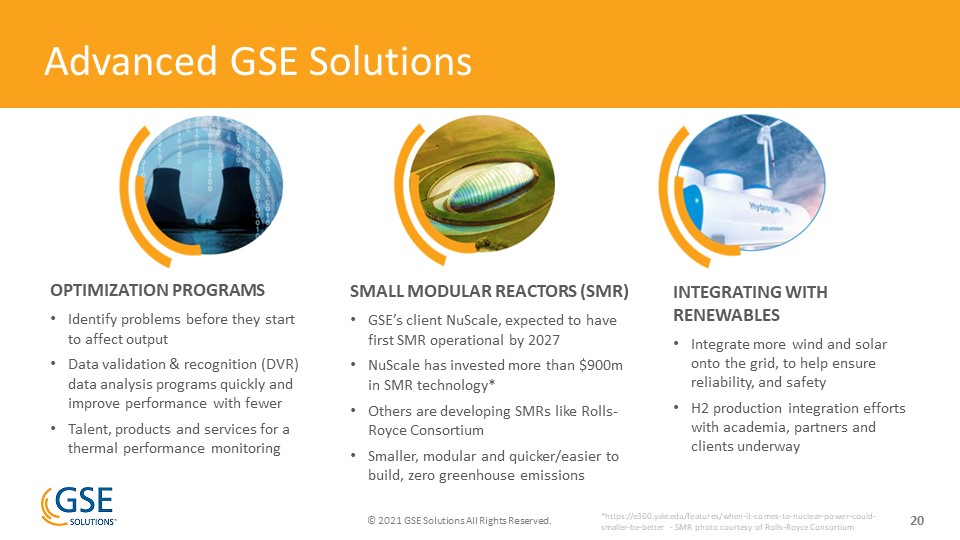
Advanced GSE Solutions OPTIMIZATION PROGRAMSIdentify problems before they start to affect outputData
validation & recognition (DVR) data analysis programs quickly and improve performance with fewer Talent, products and services for a thermal performance monitoring SMALL MODULAR REACTORS (SMR)GSE’s client NuScale, expected to have first SMR
operational by 2027NuScale has invested more than $900m in SMR technology*Others are developing SMRs like Rolls-Royce Consortium Smaller, modular and quicker/easier to build, zero greenhouse emissions INTEGRATING WITH RENEWABLESIntegrate more
wind and solar onto the grid, to help ensure reliability, and safetyH2 production integration efforts with academia, partners and clients underway *https://e360.yale.edu/features/when-it-comes-to-nuclear-power-could-smaller-be-better - SMR photo
courtesy of Rolls-Royce Consortium

Financials
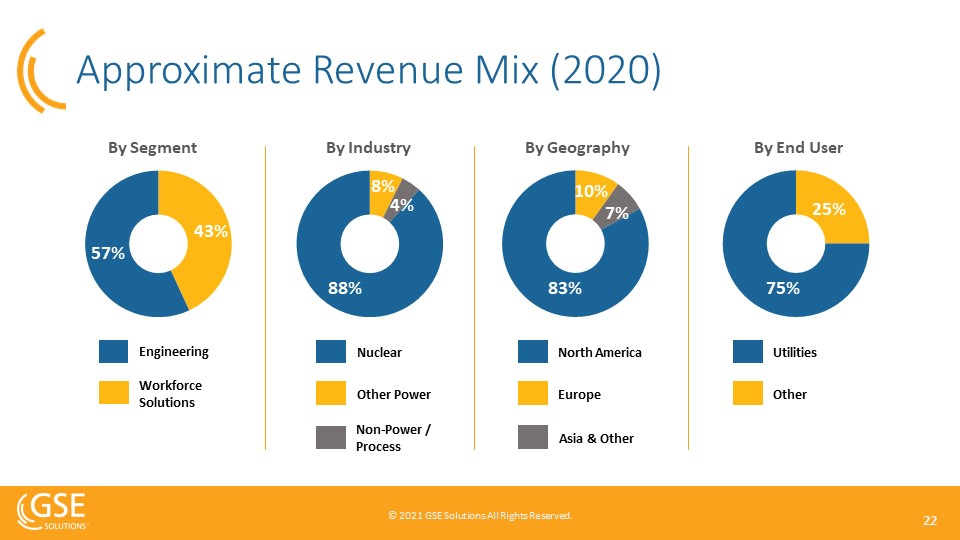
Approximate Revenue Mix (2020) Engineering Workforce Solutions By Segment By
Industry Nuclear Other Power North America Europe By Geography Utilities Other By End User Asia & Other Non-Power / Process
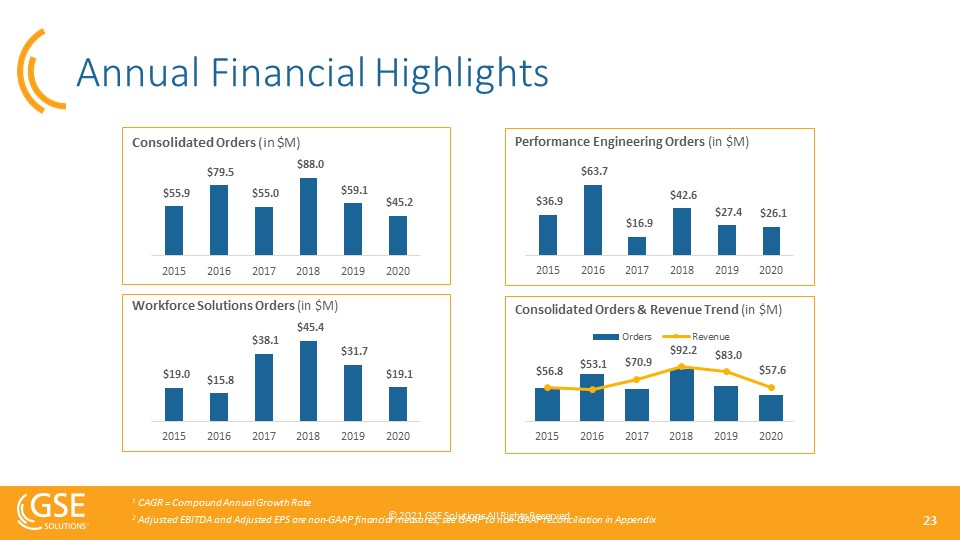
Annual Financial Highlights Consolidated Orders (in $M) Performance Engineering Orders (in
$M) Consolidated Orders & Revenue Trend (in $M) Workforce Solutions Orders (in $M) 1 CAGR = Compound Annual Growth Rate2 Adjusted EBITDA and Adjusted EPS are non-GAAP financial measures; see GAAP to non-GAAP reconciliation in
Appendix
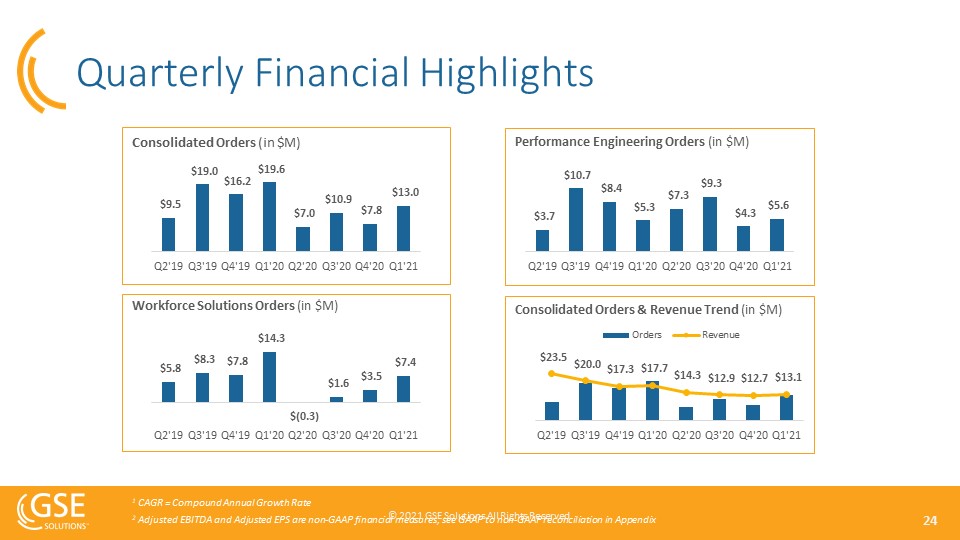
Quarterly Financial Highlights Consolidated Orders (in $M) Performance Engineering Orders (in
$M) Consolidated Orders & Revenue Trend (in $M) Workforce Solutions Orders (in $M) 1 CAGR = Compound Annual Growth Rate2 Adjusted EBITDA and Adjusted EPS are non-GAAP financial measures; see GAAP to non-GAAP reconciliation in
Appendix
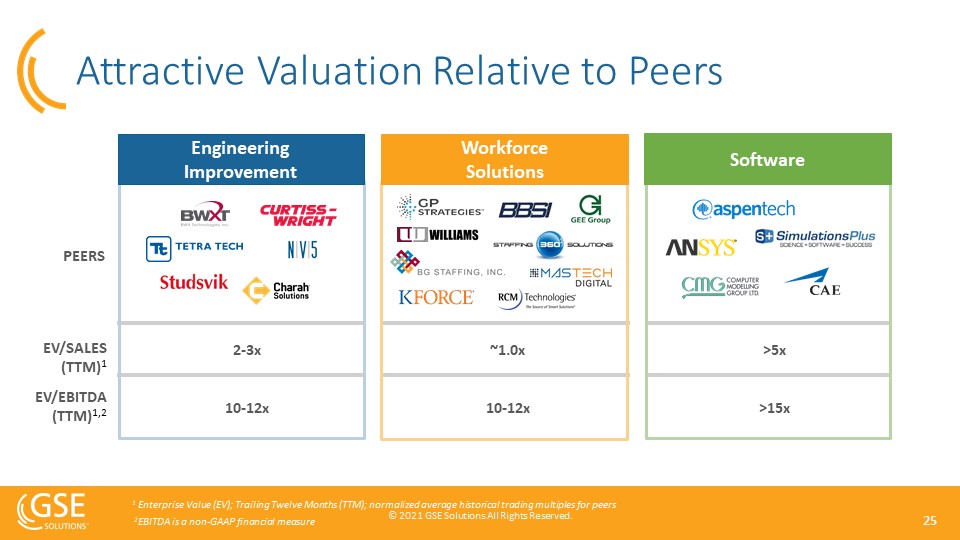
Attractive Valuation Relative to Peers PEERS 2-3x ~1.0x >5x 10-12x 10-12x >15x 1
Enterprise Value (EV); Trailing Twelve Months (TTM); normalized average historical trading multiples for peers 2EBITDA is a non-GAAP financial measure EV/SALES (TTM)1 EV/EBITDA (TTM)1,2 Workforce Solutions Engineering
Improvement Software

Looking to the Future
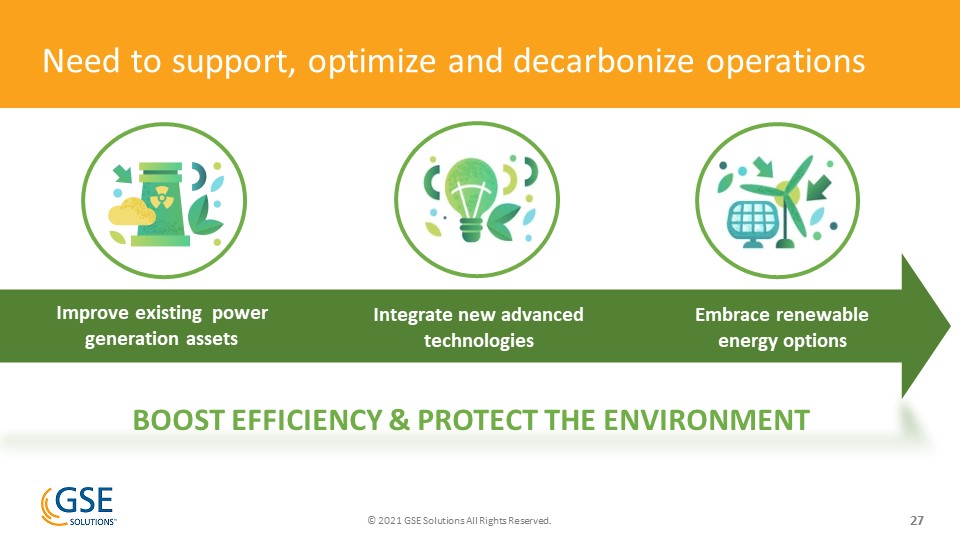
BOOST EFFICIENCY & PROTECT THE ENVIRONMENT Need to support, optimize and decarbonize
operations Improve existing power generation assets Integrate new advanced technologies Embrace renewable energy options
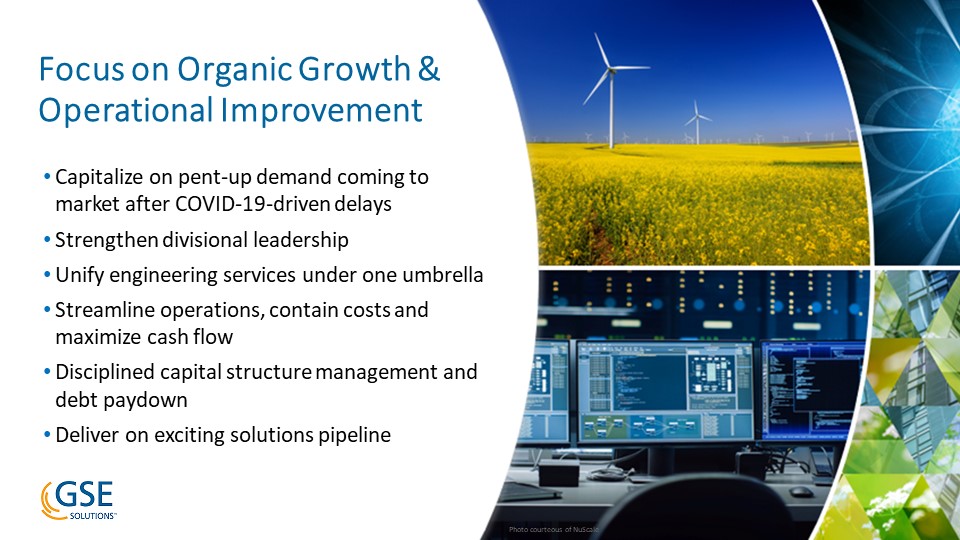
Photo courteous of NuScale Capitalize on pent-up demand coming to market after COVID-19-driven
delaysStrengthen divisional leadershipUnify engineering services under one umbrellaStreamline operations, contain costs and maximize cash flow Disciplined capital structure management and debt paydownDeliver on exciting solutions pipeline Focus
on Organic Growth & Operational Improvement
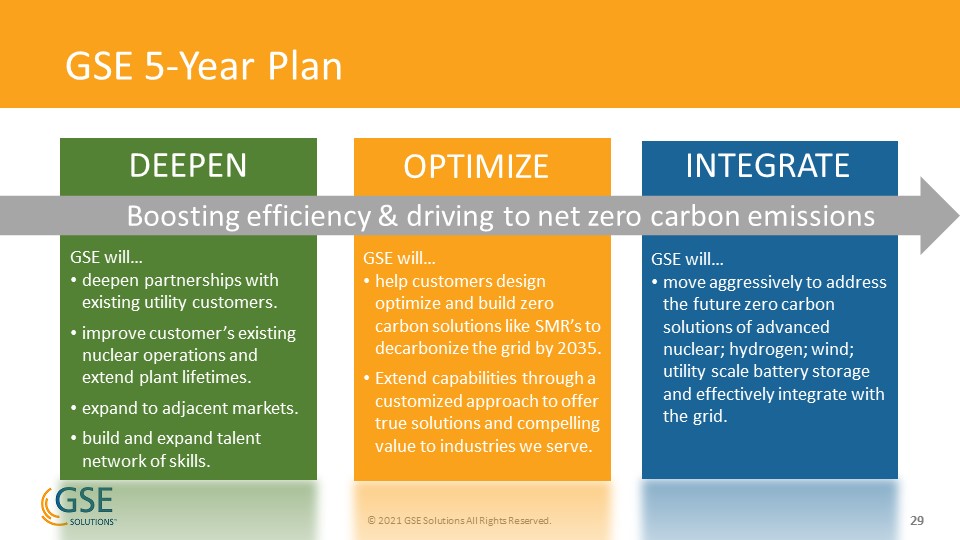
GSE 5-Year Plan GSE will…help customers design optimize and build zero carbon solutions like SMR’s
to decarbonize the grid by 2035.Extend capabilities through a customized approach to offer true solutions and compelling value to industries we serve. GSE will…move aggressively to address the future zero carbon solutions of advanced nuclear;
hydrogen; wind; utility scale battery storage and effectively integrate with the grid. DEEPEN INTEGRATE GSE will…deepen partnerships with existing utility customers.improve customer’s existing nuclear operations and extend plant
lifetimes.expand to adjacent markets.build and expand talent network of skills. OPTIMIZE Boosting efficiency & driving to net zero carbon emissions
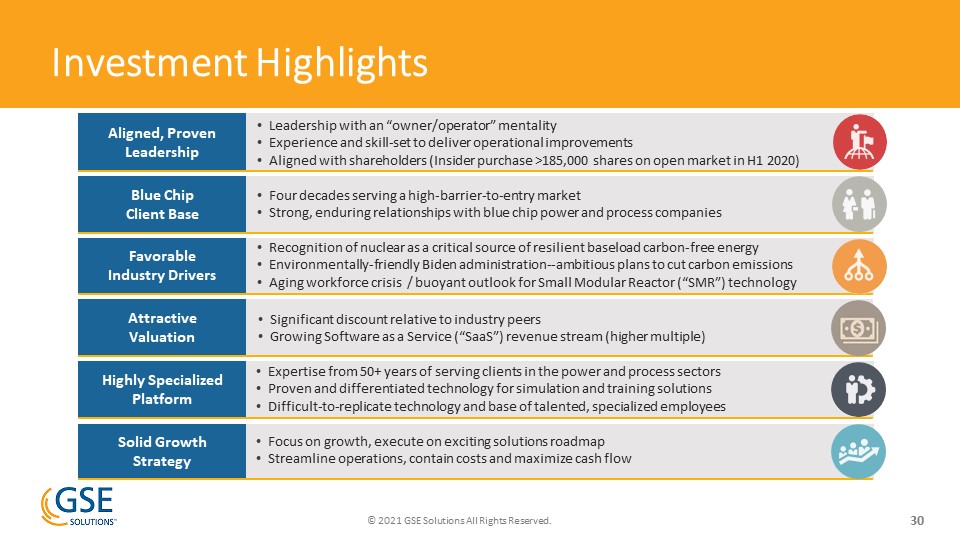
Leadership with an “owner/operator” mentality Experience and skill-set to deliver operational
improvementsAligned with shareholders (Insider purchase >185,000 shares on open market in H1 2020) Investment Highlights Four decades serving a high-barrier-to-entry market Strong, enduring relationships with blue chip power and process
companies Blue Chip Client Base Four decades serving a high-barrier-to-entry market Strong, enduring relationships with blue chip power and process companies Aligned, ProvenLeadership Recognition of nuclear as a critical source of
resilient baseload carbon-free energy Environmentally-friendly Biden administration--ambitious plans to cut carbon emissionsAging workforce crisis / buoyant outlook for Small Modular Reactor (“SMR”) technology Favorable Industry
Drivers Significant discount relative to industry peersGrowing Software as a Service (“SaaS”) revenue stream (higher multiple) Attractive Valuation Expertise from 50+ years of serving clients in the power and process sectorsProven and
differentiated technology for simulation and training solutionsDifficult-to-replicate technology and base of talented, specialized employees Highly Specialized Platform Focus on growth, execute on exciting solutions roadmap Streamline
operations, contain costs and maximize cash flow Solid Growth Strategy

GSE SolutionsKyle LoudermilkPresident and CEOkyle.loudermilk@gses.com+1 410.970.7800 Connect With
Us Lytham PartnersAdam LowensteinerVice Presidentgvp@lythampartners.com+ 1 646.829.9702 www.linkedin.com/company/gse-solutions/ www.gses.com investor@gses.com

Appendix

GSE Solutions Financial History1,2 and Balance Sheet Data 1 Excludes DP Engineering for periods prior to
February 15, 2019; excludes True North prior to May 11, 2018 and excludes Absolute Consulting prior to September 20, 2017 2 EBITDA, Adjusted EBITDA, Adjusted net income and adjusted EPS are non-GAAP financial measures; see GAAP to non-GAAP
reconciliation on pages 26 and 27 in the Appendix of this presentation. Financial Summary1 Fiscal Year Ended 3 Months Ended (in $ millions, except shares amounts) 2017 2018 2019 2020 Mar. 31, 2020 Mar. 31,
2021 Revenue 70.9 92.2 83.0 57.6 17.7 13.1 Gross Profit 18.5 23.1 20.3 14.8 4.1 2.9 Gross margin 26% 25% 24% 26% 23% 22% Operating (loss) income 0.2 1.4 (7.4) (9.5) (6.1) (2.2) Operating
margin 0% 1% (9%) (17%) (35%) (17%) Net (loss) income 6.6 (0.4) (12.1) (10.5) (6.3) (2.2) Diluted EPS $0.33 ($0.02) ($0.60) ($0.52) ($0.31) ($0.11) Diluted
shares 19,605,427 19,704,999 20,062,021 20,439,157 20,342,933 20,628,669 EBITDA 1.5 3.7 (2.2) (6.9) (5.3) (1.7) Adjusted EBITDA 5.7 7.4 4.8 (0.3) (0.6) (0.8) Adjusted net (loss) income 3.0 (3.6) 8.0 0.0
(0.9) (1.0) Adjusted EPS - diluted $0.15 ($0.18) $0.39 $0.00 ($0.04) ($0.05) Balance Sheet (in $ millions) Mar. 31, 2021 Cash and cash equivalents 3.7 Current
assets 17.0 Total assets 37.0 Current liabilities 24.5 Total debt 12.6 Total stockholders' equity 9.4
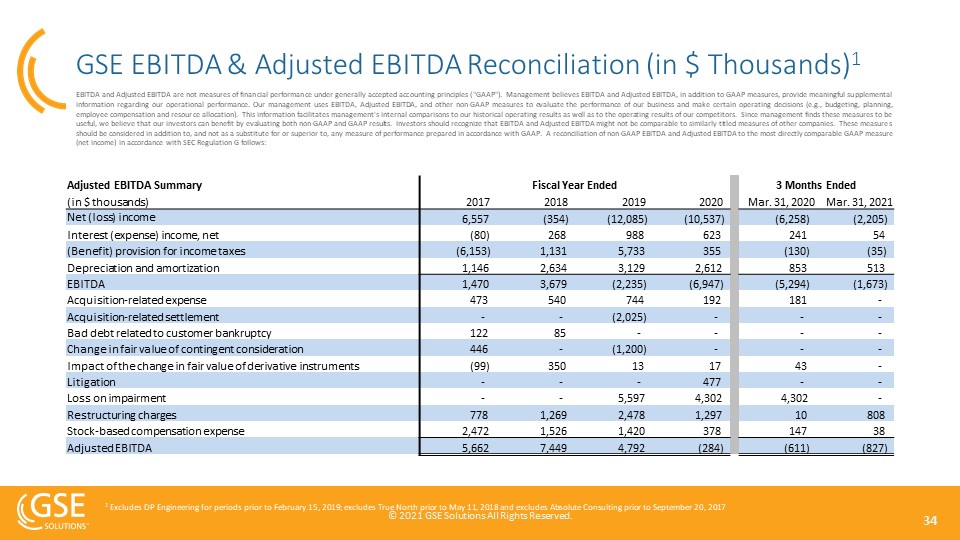
GSE EBITDA & Adjusted EBITDA Reconciliation (in $ Thousands)1 EBITDA and Adjusted EBITDA are not
measures of financial performance under generally accepted accounting principles ("GAAP"). Management believes EBITDA and Adjusted EBITDA, in addition to GAAP measures, provide meaningful supplemental information regarding our operational
performance. Our management uses EBITDA, Adjusted EBITDA, and other non-GAAP measures to evaluate the performance of our business and make certain operating decisions (e.g., budgeting, planning, employee compensation and resource allocation).
This information facilitates management's internal comparisons to our historical operating results as well as to the operating results of our competitors. Since management finds these measures to be useful, we believe that our investors can
benefit by evaluating both non-GAAP and GAAP results. Investors should recognize that EBITDA and Adjusted EBITDA might not be comparable to similarly-titled measures of other companies. These measures should be considered in addition to, and not
as a substitute for or superior to, any measure of performance prepared in accordance with GAAP. A reconciliation of non-GAAP EBITDA and Adjusted EBITDA to the most directly comparable GAAP measure (net income) in accordance with SEC Regulation G
follows: 1 Excludes DP Engineering for periods prior to February 15, 2019; excludes True North prior to May 11, 2018 and excludes Absolute Consulting prior to September 20, 2017 Adjusted EBITDA Summary Fiscal Year Ended 3 Months
Ended (in $ thousands) 2017 2018 2019 2020 Mar. 31, 2020 Mar. 31, 2021 Net (loss) income 6,557 (354) (12,085) (10,537) (6,258) (2,205) Interest (expense) income, net (80) 268 988 623 241 54
(Benefit) provision for income taxes (6,153) 1,131 5,733 355 (130) (35) Depreciation and amortization 1,146 2,634 3,129 2,612 853 513 EBITDA 1,470 3,679 (2,235) (6,947) (5,294)
(1,673) Acquisition-related expense 473 540 744 192 181 - Acquisition-related settlement - - (2,025) - - - Bad debt related to customer bankruptcy 122 85 - - - - Change in fair
value of contingent consideration 446 - (1,200) - - - Impact of the change in fair value of derivative instruments (99) 350 13 17 43 - Litigation - - - 477 - - Loss on impairment -
- 5,597 4,302 4,302 - Restructuring charges 778 1,269 2,478 1,297 10 808 Stock-based compensation expense 2,472 1,526 1,420 378 147 38 Adjusted EBITDA 5,662 7,449 4,792
(284) (611) (827)
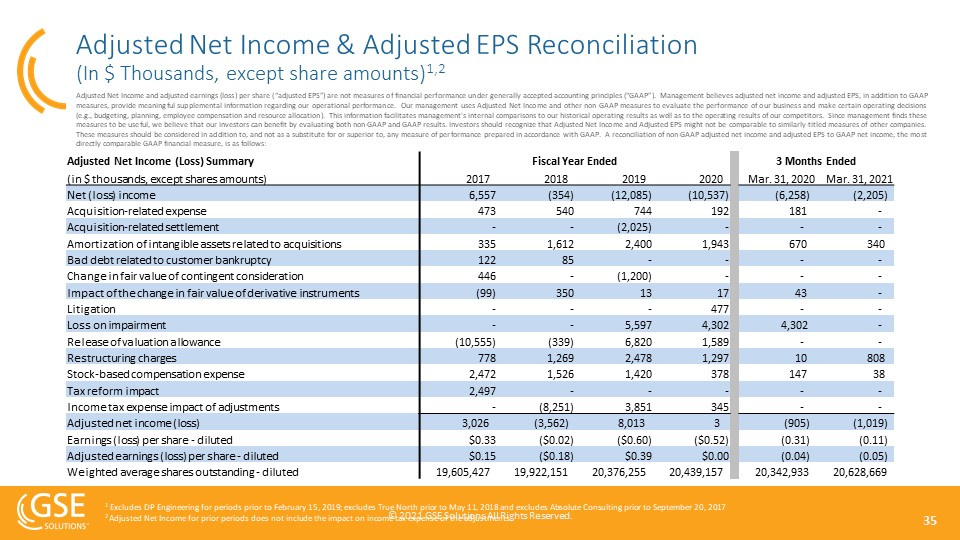
Adjusted Net Income & Adjusted EPS Reconciliation (In $ Thousands, except share amounts)1,2 Adjusted
Net Income and adjusted earnings (loss) per share (“adjusted EPS”) are not measures of financial performance under generally accepted accounting principles (“GAAP”). Management believes adjusted net income and adjusted EPS, in addition to GAAP
measures, provide meaningful supplemental information regarding our operational performance. Our management uses Adjusted Net Income and other non-GAAP measures to evaluate the performance of our business and make certain operating decisions
(e.g., budgeting, planning, employee compensation and resource allocation). This information facilitates management's internal comparisons to our historical operating results as well as to the operating results of our competitors. Since
management finds these measures to be useful, we believe that our investors can benefit by evaluating both non-GAAP and GAAP results. Investors should recognize that Adjusted Net Income and Adjusted EPS might not be comparable to similarly-titled
measures of other companies. These measures should be considered in addition to, and not as a substitute for or superior to, any measure of performance prepared in accordance with GAAP. A reconciliation of non-GAAP adjusted net income and
adjusted EPS to GAAP net income, the most directly comparable GAAP financial measure, is as follows: 1 Excludes DP Engineering for periods prior to February 15, 2019; excludes True North prior to May 11, 2018 and excludes Absolute Consulting
prior to September 20, 20172 Adjusted Net Income for prior periods does not include the impact on income tax expense of the adjustments Adjusted Net Income (Loss) Summary Fiscal Year Ended 3 Months Ended (in $ thousands, except
shares amounts) 2017 2018 2019 2020 Mar. 31, 2020 Mar. 31, 2021 Net (loss) income 6,557 (354) (12,085) (10,537) (6,258) (2,205) Acquisition-related expense 473 540 744 192 181 - Acquisition-related
settlement - - (2,025) - - - Amortization of intangible assets related to acquisitions 335 1,612 2,400 1,943 670 340 Bad debt related to customer bankruptcy 122 85 - - - - Change in
fair value of contingent consideration 446 - (1,200) - - - Impact of the change in fair value of derivative instruments (99) 350 13 17 43 - Litigation - - - 477 - - Loss on
impairment - - 5,597 4,302 4,302 - Release of valuation allowance (10,555) (339) 6,820 1,589 - - Restructuring charges 778 1,269 2,478 1,297 10 808 Stock-based compensation expense
2,472 1,526 1,420 378 147 38 Tax reform impact 2,497 - - - - - Income tax expense impact of adjustments - (8,251) 3,851 345 - - Adjusted net income (loss) 3,026 (3,562) 8,013
3 (905) (1,019) Earnings (loss) per share - diluted $0.33 ($0.02) ($0.60) ($0.52) (0.31) (0.11) Adjusted earnings (loss) per share - diluted $0.15 ($0.18) $0.39 $0.00 (0.04) (0.05) Weighted average shares
outstanding - diluted 19,605,427 19,922,151 20,376,255 20,439,157 20,342,933 20,628,669