Attached files
| file | filename |
|---|---|
| EX-31.1 - EXHIBIT 31.1 CERT CEO - GSE SYSTEMS INC | exh31_1.htm |
| EX-31.2 - EXHIBIT 31.2 CERT CFO - GSE SYSTEMS INC | exh31_2.htm |
| EX-24.1 - EXHIBIT 24.1-POA - GSE SYSTEMS INC | exh24_1.htm |
| EX-32.1 - EXHIBIT 32.1 906 - GSE SYSTEMS INC | exh32_1.htm |
| EX-10.30 - EXHIBIT10.30 - GSE SYSTEMS INC | exh10_30.htm |
| EX-21.1 - EXHIBIT 21.1 SUBSIDIARIES - GSE SYSTEMS INC | exh21-1subs.htm |
| EX-23.1 - EXHIBIT 23.1 KPMG CONSENT - GSE SYSTEMS INC | exh23_1consent.htm |
Conformed
SECURITIES
AND EXCHANGE COMMISSION
Washington,
D.C. 20549
FORM
10-K
|
(Mark
One)
|
|
|
[ X ]
|
ANNUAL
REPORT PURSUANT TO SECTION 13 OR 15(d)
OF
THE SECURITIES EXCHANGE ACT OF 1934
For
the fiscal year ended December 31, 2009
|
|
OR
|
|
|
[ ]
|
TRANSITION
REPORT PURSUANT TO SECTION 13 OR 15(d)
OF
THE SECURITIES EXCHANGE ACT OF 1934
For
the transition period from to
____
|
Commission
File Number 001-14785
|
GSE
Systems, Inc.
|
||
|
(Exact
name of registrant as specified in its charter)
|
|
Delaware
|
52-1868008
|
|
|
(State
of incorporation)
|
(I.R.S.
Employer Identification Number)
|
|
|
1332
Londontown Blvd., Suite 200, Sykesville MD
|
21784
|
|
|
(Address
of principal executive offices)
|
(Zip
Code)
|
Registrant's
telephone number, including area code: (410) 970-7800
SECURITIES
REGISTERED PURSUANT TO SECTION 12(b) OF THE ACT:
|
Title
of each class
|
Name
of each exchange on which registered
|
|
|
Common
Stock, $.01 par value
|
NYSE
Amex Stock Exchange
|
SECURITIES
REGISTERED PURSUANT TO SECTION 12(g) OF THE ACT: NONE
Indicate by check mark if the
registrant is a well-known seasoned issuer, as defined in Rule 405 of the
Securities Act. Yes [ ] No [X]
Indicate by check mark if the
registrant is not required to file reports pursuant to Section 13 or 15(d) of
the Act. Yes [ ] No [X]
Indicate by check mark whether the
registrant (1) has filed all reports required to be filed by Section 13 or 15(d)
of the Securities Exchange Act of 1934 during the preceding 12 months (or for
such shorter period that the registrant was required to file such reports), and
(2) has been subject to such filing requirements for the past 90 days. Yes [ X ]
No [ ]
Indicate by check mark whether the
registrant has submitted electronically and posted on its corporate Web site, if
any, every Interactive Data File required to be submitted and posted pursuant to
Rule 405 of Regulation S-T (§ 232.405 of this chapter) during the preceding 12
months (or for such shorter period that the registrant was required to submit
and post such files). Yes [ X ] No [ ]
Indicate by check mark if disclosure of
delinquent filers pursuant to Item 405 of Regulation S-K is not contained
herein, and will not be contained, to the best of registrant's knowledge, in
definitive proxy or information statements incorporated by reference in Part III
of this Form 10-K or any amendment to this Form 10-K. [ ]
Indicate
by check mark whether the registrant is a large accelerated filer, an
accelerated filer, a non-accelerated filer or a smaller reporting
company. See the definitions of “large accelerated filer”,
“accelerated filer” and “smaller reporting company” in Rule 12b-2 of the
Exchange Act. (Check one):
|
Large
accelerated filer [ ]
|
Accelerated
filer [ X ]
|
Non-accelerated
filer [ ]
|
Smaller
reporting company [ ]
|
|
(Do
not check if a smaller reporting company)
|
Indicate
by check mark whether the registrant is a shell company (as defined in rule
12(b)-2 of the Exchange
Act). Yes [ ] No
[X]
The aggregate market value of Common
Stock held by non-affiliates of the Registrant was $103,059,776 on June 30,
2009, the last business day of the Registrant’s most recently completed second
fiscal quarter, based on the closing price of such stock on that date of
$6.75.
The
number of shares outstanding of the registrant’s Common Stock as of March 10,
2010 was 18,933,700 shares.
DOCUMENTS
INCORPORATED BY REFERENCE
Portions of the registrant's Proxy
Statement for the 2010 Annual Meeting of Stockholders to be filed pursuant to
Regulation 14A under the Securities Exchange Act of 1934, as amended, are
incorporated by reference into Part III.
1
TABLE
OF CONTENTS
|
PART
I
|
Page
|
|
|
Item
1.
|
Business
|
4
|
|
Item
1A.
|
Risk
Factors
|
19
|
|
Item
1B.
|
Unresolved
Staff Comments
|
24
|
|
Item
2.
|
Properties
|
24
|
|
Item
3.
|
Legal
Proceedings
|
24
|
|
Item
4.
|
Submission
of Matters to a Vote of Security Holders
|
24
|
|
PART
II
|
||
|
Item
5.
|
Market
for Registrant’s Common Equity, Related
Stockholder
Matters, and Issuer Purchases of Equity Securities
|
25
|
|
Item
6.
|
Selected
Financial Data
|
29
|
|
Item
7.
|
Management’s
Discussion and Analysis of Financial Condition
and
Results of Operations
|
30
|
|
Item
7A.
|
Quantitative
and Qualitative Disclosures About Market Risk
|
48
|
|
Item
8.
|
Financial
Statements and Supplementary Data
|
50
|
|
Item
9.
|
Changes
in and Disagreements with Accountants
on
Accounting and Financial Disclosure
|
51
|
|
Item
9A.
|
Controls
and Procedures
|
51
|
|
Item
9B.
|
Other
Information
|
52
|
|
PART
III
|
||
|
Item
10.
|
Directors,
Executive Officers and Corporate Governance*
|
52
|
|
Item
11.
|
Executive
Compensation*
|
52
|
|
Item
12.
|
Security
Ownership of Certain Beneficial Owners
and
Management and Related Stockholder Matters*
|
53
|
|
Item
13.
|
Certain
Relationships and Related Transactions, and Director
Independence*
|
53
|
|
Item
14.
|
Principal
Accountant Fees and Services*
|
53
|
|
PART
IV
|
||
|
Item
15.
|
Exhibits
and Financial Statement Schedules.
|
53
|
|
SIGNATURES
|
55
|
|
|
Exhibits
Index
|
56
|
|
|
*
|
to
be incorporated by reference from the Proxy Statement for the registrant’s
2010 Annual Meeting of
Shareholders.
|
2
GSE
SYSTEMS, INC.
FORM
10-K
For
the Year Ended December 31, 2009
CAUTIONARY
STATEMENT REGARDING FORWARD-LOOKING STATEMENTS.
This
report and the documents incorporated by reference herein contain
“forward-looking” statements within the meaning of Section 27A of the Securities
Act and Section 21E of the Exchange Act that are based on
management’s assumptions, expectations and projections about us, and the
industry within which we operate, that have been made pursuant to the
Private Securities Litigation Reform Act of 1995 which reflect our expectations
regarding our future growth, results of operations, performance and business
prospects and opportunities. Wherever possible, words such as
“anticipate”, “believe”, “continue”, “estimate”, “intend”, “may”, “plan”,
“potential”, “predict”, “expect”, “should”, “will” and similar expressions, or
the negative of these terms or other comparable terminology, have been used to
identify these forward-looking statements. These forward-looking
statements may also use different
phrases. These statements regarding our expectations
reflect our
current beliefs and are based on information currently available to
us. Accordingly, these statements by their nature are subject to
risks and uncertainties, including those listed under Item 1A Risk Factors,
which could cause our actual growth, results, performance and business prospects
and opportunities to differ from those expressed in, or implied by, these
statements. We may not actually achieve the plans, intentions or
expectations disclosed in our forward-looking statements and you should not
place undue reliance on our forward-looking statements. Actual results or events
could differ materially from the plans, intentions and expectations disclosed in
the forward-looking statements we make. Except as otherwise required
by federal securities law, we
are not obligated to update or revise these
forward-looking statements to reflect new events or circumstances. We
caution you that a variety of factors, including but not limited to the factors
described below under Item 1A Risk Factors and the following, could cause our
business conditions and results to differ materially from what is contained in
forward-looking statements:
|
-
|
changes
in the rate of economic growth in the United States and other
major
|
international
economies;
|
-
|
changes
in investment by the nuclear and fossil electric utility industry, the
chemical and petrochemical industries and the U.S.
military;
|
|
-
|
changes
in the financial condition of our
customers;
|
|
-
|
changes
in regulatory environment;
|
|
-
|
changes
in project design or schedules;
|
|
-
|
contract
cancellations;
|
|
-
|
changes
in our estimates of costs to complete
projects;
|
|
-
|
changes
in trade, monetary and fiscal policies
worldwide;
|
|
-
|
currency
fluctuations;
|
|
-
|
war
and/or terrorist attacks on facilities either owned or where equipment or
services are or may be provided;
|
|
-
|
outcomes
of future litigation;
|
|
-
|
protection
and validity of our trademarks and other intellectual property
rights;
|
|
-
|
increasing
competition by foreign and domestic
companies;
|
|
-
|
compliance
with our debt covenants;
|
|
-
|
recoverability
of claims against our customers and others;
and
|
|
-
|
changes
in estimates used in our critical accounting
policies.
|
Other factors and assumptions not
identified above were also involved in the formation of these forward-looking
statements and the failure of such other assumptions to be realized, as well as
other factors, may also cause actual results to differ materially from those
projected. Most of these factors are difficult to predict accurately and are
generally beyond our control. You should consider the areas of risk described
above in connection with any forward-looking statements that may be made by
us. You should not
place undue reliance on any forward-looking statements. New factors emerge from
time to time, and it is not possible for us to predict which factors will
arise.
3
We undertake no obligation to publicly
update any forward-looking statements, whether as a result of new information,
future events or otherwise. You are advised, however, to consult any additional
disclosures we make in proxy statements, quarterly reports on Form 10-Q and
current reports on Form 8-K filed with the SEC.
PART
I
|
ITEM
1.
|
BUSINESS.
|
GSE Systems, Inc. (“GSE Systems”,
“GSE”, the “Company”, “our”, “we” or “us”), a Delaware corporation organized in
March 1994, is a world leader in real-time, high fidelity
simulation. The Company provides simulation and educational solutions
and services to the nuclear and fossil electric utility industry and the
chemical and petrochemical industries. In addition, the Company provides plant
monitoring, signal analysis monitoring and optimization software primarily to
the power industry. GSE is the parent company of GSE Power Systems,
Inc., a Delaware corporation; GSE Power Systems, AB, a Swedish corporation; GSE
Engineering Systems (Beijing) Co. Ltd., a Chinese limited liability company; GSE
Systems Ltd., a British limited liability company; and has a 10% minority
interest in Emirates Simulation Academy, LLC, a United Arab Emirates limited
liability company.
The Company’s annual report on
Form 10-K, quarterly reports on Form 10-Q, current reports on
Form 8-K, and all amendments to those reports filed or furnished pursuant
to Section 13(a) or 15(d) of the Exchange Act (15 U.S.C. 78m(a) or 78o(d) will
be made available free of charge through the Investor Relations section of the
Company’s Internet website (http://www.gses.com) as soon as practicable after
such material is electronically filed with, or furnished to, the
SEC. In addition, the public may read and copy any materials we file
with the SEC at the SEC’s Public Reference Room at 100 F Street, NE, Washington,
DC 20549. The public may obtain information on the operation of the
Public Reference Room by calling the SEC at 1-800-SEC-0330. The SEC
maintains an Internet site that contains reports, proxy and information
statements, and other information regarding issuers that file electronically
with the SEC at http://www.sec.gov.
Recent
Developments.
On
September 4, 2009, the Company raised $15.0 million through the sale of 2.5
million shares of its common stock, $.01 par value per share. The
shares were sold under a shelf registration statement which was declared
effective by the Securities and Exchange Commission on August 21,
2009. On September 23, 2009, the Company raised an additional
$2,250,000 when the Company’s underwriter exercised an over-allotment option in
full to purchase an additional 375,000 shares of the Company’s common stock at
the public offering price of $6.00 per share. The aggregate net
proceeds received by the Company from the two transactions was approximately
$15.9 million. The Company paid the underwriter a fee in the amount
of 6% of the gross proceeds received by the Company from the offering
($1,035,000) and paid $339,000 in other transaction fees. The Company
intends to use the net proceeds for general working capital purposes and to fund
acquisitions and other strategic opportunities.
4
GSE is a
10% owner of the Emirates Simulation Academy LLC in the United Arab
Emirates. Although ESA was formed in late 2005, it had its
grand opening on January 14, 2009 and signed its first customer training
contract on the same day. Despite ESA’s promotional efforts, 2009
revenue totaled only AED 209,000 ($57,000), and they incurred a net loss of AED
22.6 million ($6.1 million). Per ESA’s latest financial projections,
ESA would not become profitable until 2016 and would not become cash positive
until 2017.
At
December 31, 2009, ESA had borrowed a total of AED 36.4 million ($9.9 million)
from its credit facility with Union National Bank, including accrued interest
payable. ESA was delinquent in paying both principal and interest (a
total of AED 5.3 million or $1.5 million) and in January 2010, UNB drew upon the
guarantees of the three partners to pay off the delinquency, withdrawing
$145,000 from GSE’s restricted cash account. In February 2010, GSE
was notified that ESA had missed another loan payment and that 10% of the amount
due ($24,000) would be withdrawn from the Company’s restricted cash
account.
At a
meeting of ESA’s three shareholders held at ESA on February 17, 2010, the
shareholders reached agreement to siginificantly reduce costs and begin to
explore options up to and including the selling of
ESA.
Accordingly,
based upon these events, the Company has determined that its remaining
investment in ESA has been impaired and has established reserves for the trade
receivable due from ESA at December 31, 2009 and the cash that GSE
has on deposit with UNB as a partial guarantee for ESA’s credit
facility. Partially offsetting these charges is the reversal of the
remaining deferred profit related to the Company’s sale of five simulators to
ESA in prior years and the remaining agent fee that was due upon payment of the
final outstanding receivable. The charges recorded and the
presentation in the statement of operations for the year ended December 31, 2009
are as follows:
|
Year
ended
|
||||
|
(in
thousands)
|
December
31, 2009
|
|||
|
Trade
receivable
|
$ | 1,604 | ||
|
Accrued
agent fee
|
(96 | ) | ||
|
Operating
expense
|
1,508 | |||
|
Restricted
cash- bank guarantee and
|
||||
|
accrued
interest income
|
1,291 | |||
|
Investment
in ESA
|
117 | |||
|
Deferred
profit
|
(543 | ) | ||
|
Other
expense, net
|
865 | |||
|
Total
|
$ | 2,373 | ||
5
The
nuclear power industry has been largely dormant for the last thirty years with
few opportunities to provide new full scope simulators. The Company’s
nuclear simulation business has concentrated mainly on providing services to the
installed base of nuclear simulators worldwide. These services are
primarily related to upgrading antiquated simulation software and hardware
systems, providing new and improved plant and system simulation models, and
modifying the simulator to reflect changes in the physical
plant. However, over the last several years, the nuclear power
industry has experienced a dramatic change, and most energy experts believe the
industry is on the verge of a “renaissance”, driven by the gap between the
energy that the world is projected to need versus the current capacity, the
instability in the cost of oil, and growing environmental concerns over the
usage of fossil fuels. According to the U.S. Energy Information Administration,
U.S. energy consumption alone will increase somewhere between 1-2% per year,
even if the American economy grows at a fairly modest rate. Government and
industry sources and trade journals report that up to 252 new nuclear plants
could be built worldwide over the next 20 years. In the U.S.
alone, there are proposals for over twenty new reactors and the first 17
combined construction and operating licenses for these have been applied
for. Each new plant will be required to have a full scope simulator
ready for operator training and certification about two years prior to plant
operation. In February 2010, President Obama announced that the
federal government will provide $8.33 billion in loan guarantees for a pair of
nuclear reactors to be built in Georgia at the Alvin W. Vogtle Electric
Generating Plant by Georgia Power, a subsidiary of Southern Company. Georgia
Power received an early site permit from the U.S. Nuclear Regulatory Commission
for the two additional units in 2009 and preliminary site work has
begun. Westinghouse Electric Company LLC (“Westinghouse”) and its
consortium team member The Shaw Group are under contract to provide two
Westinghouse AP1000™ nuclear power plants at the Vogtle site.
In 2005, the Company completed an
agreement with Westinghouse to become their preferred vendor for the development
of simulators for their AP1000 reactor design. As a result of this
agreement, GSE is working closely with Westinghouse to cooperate in the
development of simulators for the AP1000 design and assist Westinghouse in the
verification and validation of the AP1000 Human Machine
Interface. The Company’s simulation models have been used to help
Westinghouse successfully complete several phases of Human Machine Interface
testing with U.S. regulators. In addition to the contract with
Georgia Power, Westinghouse and its consortium partners have received definitive
multi-million dollar contracts to provide four AP1000 nuclear power plants in
China. The four plants are being constructed in pairs on China’s
eastern coast at Sanmen in Zhejiang province and Haiyang in Shandong
province. In September 2007, Westinghouse authorized GSE to proceed
on the Sanmen full scope AP1000 simulator project in China. The Sanmen plant is
expected to begin commercial operations in late 2013. In April 2008,
Westinghouse authorized GSE to proceed on a second full scope AP1000 simulator
at the Haiyang site in China.
In July
2009, the Company announced the award of a multi-million dollar contract from
Westinghouse to build an AP1000 nuclear power plant simulator based upon
Westinghouse’s design for domestic customers. This award covers an
initial phase of work that will focus on building high fidelity simulation
models for the AP1000 nuclear systems. These models will help Westinghouse
demonstrate the plant design and control room human factors. The
models that will be built in this current phase will be largely common to all
future U.S.-based AP1000 plants and hence highly reusable from plant to
plant. GSE anticipates future awards that will address the remaining
plant systems. These future systems are expected to be different from
plant to plant, and, therefore, the Company expects these contracts to be issued
on a plant specific basis in the future. In addition to the Vogtle
Plant, the Westinghouse consortium has been selected to provide no
less than 12 additional AP1000s in the U.S. including four for which
Engineering, Procurement and Construction contracts have been signed with the
Westinghouse consortium. Providing a plant simulator at each site is included
within the scope of work between the Westinghouse consortium and these U.S.
customers.
In the
first quarter 2009, the Company was awarded a contract valued at over $18
million to build a new nuclear power plant simulator for a two unit reactor
plant in Slovakia. The contract includes approximately $12 million of hardware
that the customer has requested be a part of the contract in addition to
approximately $6 million related specifically to the simulator. Margins on the
hardware portion of the contract are minimal, while margins on the more
traditional simulation portions are consistent with those in the past. The
utility customer in Slovakia is constructing two new Russian designed VVER-440
nuclear reactors at the site that will incorporate Siemens / Areva control
systems. Work on this contract commenced in the first quarter 2009 and is
scheduled for completion by the end of 2011. GSE, in partnership with Siemens,
built the first full scope simulator at the same site in 1997.
6
In the
fourth quarter 2009, the Company completed a full scope simulator for the
American Electric Power Donald C. Cook Nuclear Generating Station in
Michigan. This project was unique as it was the first simulator of
its kind to fully integrate both control rooms of a dual site plant and
therefore set a new standard for nuclear facilities with more than one unit
occupying the same site.
A new
generation of small reactors also promises to make nuclear power more
affordable. For example, NuScale Power, Inc. (“NuScale”), is commercializing, a
modular, scalable 45 Megawatt Electric Light Water Reactor nuclear power
plant. Each NuScale module has its own combined containment vessel
and reactor system, and its own designated turbine-generator
set. NuScale power plants are scalable, allowing for a single
facility to have just one or up to 24 units. In November 2008,
the Company was awarded a contract from NuScale to develop simulation models for
its nuclear power plant which will be used in NuScale’s design certification
process, including design analysis, and control system strategy and plant
procedure development. Eventually the simulation models will form the
basis for a full scope operator training system to license the operators of
these plants.
In 2009,
the Company introduced its VPanel™ interactive visual training
simulator. The advantage of the VPanel simulator is its scalability
and ease of configuration for both team and individual training, plant specific
or cross training. The VPanel allows customers to utilize their
existing simulator load while bringing many full scope simulator capabilities
directly into the classroom for a fraction of the cost. The Company’s
“Operator Jump Start” training program, which utilizes the VPanel simulator,
helps customers screen and train new operator candidates. This
training program is designed to provide essential knowledge and skills to
potential nuclear plant operators and to determine if candidates have the
ability to successfully complete the customer’s own control operator training
programs. The program includes instruction on fundamental sciences
(including GFES), plant systems and operations.
Most U.S.
nuclear electric utilities have applied for license extensions and/or power
upgrades. These license extensions will lead to significant upgrades
to the physical equipment and control room technology which will result in the
need to modify or replace the existing plant control room simulators. The
Company, having what it believes is the largest installed base of existing
simulators, over 60% on a global basis, is well positioned to capture a large
portion of this business, although no assurance can be given that it will be
successful in doing so. The Company logged approximately $47.5
million, $26.5 million and $21.5 million in nuclear simulation orders in the
years ended December 31, 2009, 2008 and 2007, respectively.
The
Company also provides simulators to the fossil fueled power product
industry. The Company logged approximately $5.6 million, $13.6
million, and $11.2 million of fossil fueled simulation orders for the years
ended December 31, 2009, 2008 and 2007, respectively. The
global recession and financial credit crisis along with confusing and sometimes
conflicting federal, state, and local regulatory procedures have impacted this
portion of our business. However, the transition from obsolete analog
control systems to modern digital control systems and the new requirements for
complex emission control systems continues to provide opportunities for the
Company in this business. GSE’s high-fidelity simulation models
can be used to validate these control schemes and logic for new designs before
the control systems are deployed to the field. GSE builds the plant
models based upon design specifications supplied by its customers, and the
models then drive the actual digital control systems in the
factory. This testing can uncover numerous control system
discrepancies. By correcting these problems at the factory versus in
the field, GSE’s customers can save millions in reduced down time and reduced
commissioning time.
GSE’s
process industries simulation business customers include primarily oil and gas
production facilities, oil refining plants, chemical plants and petro-chemical
facilities. As in the power industry, there is increasing focus on
regular, periodic and systematic training of plant operator personnel which may
reduce the risk of operator errors and potentially catastrophic environment
disasters and/or loss of life. The Company logged approximately
$1.2 million, $1.2 million, and $3.4 million of process industry simulation
orders for the years ended December 31, 2009, 2008 and 2007,
respectively.
7
The
Company continues to develop its concept of integrating simulation with broader
training programs and educational initiatives giving customers a turnkey
alternative to traditional on-site operator and maintenance
training. In the fourth quarter 2008, the Company was awarded a
nuclear power plant operator training program contract with Georgia Power, a
subsidiary of Southern Company, one of the largest U.S. nuclear
utilities. The scope of the award included the development of course
materials for a licensed operator preparation course which includes modules on
nuclear plant fundamentals, introduction to nuclear plant systems, human
performance principles and team building, and an introduction to integrated
nuclear plant operations. The first 20-week class for new nuclear
plant instructor and operator candidates was completed in December 2009. Two
classes are scheduled for 2010.
Background.
GSE
Systems was formed on March 30, 1994 to consolidate the simulation and related
businesses of S3 Technologies, General Physics International Engineering &
Simulation and EuroSim, each separately owned and operated by ManTech
International Corporation, GP Strategies Corporation and Vattenfall AB,
respectively.
In
December 1997, the Company acquired 100% of the outstanding common stock of J.L.
Ryan, Inc. (“Ryan”), a provider of engineering modifications and upgrade
services to the power plant simulation market. The combination of the
Company’s pre-existing technology with the technical staff of the acquired Ryan
business positioned the Company to be more competitive for modifications and
upgrade service projects within the nuclear simulation market.
In
October 2002, GSE purchased the stock of ManTech Automation Systems (Beijing)
Company Ltd, from ManTech International Corp. The Chinese company,
which has sixteen employees, was renamed GSE Systems Engineering (Beijing)
Company Ltd. This acquisition gave the Company a base in China to pursue and
implement simulation projects in that emerging market.
In 2007,
the Company formed a subsidiary, GSE Systems Ltd., in the United
Kingdom. The British subsidiary was established to provide training
solutions to the nuclear power industry.
Simulation
Business.
I. Nuclear and Fossil Fuel
Power Simulation.
Industry History
The
real-time simulation industry grew from the need to train people on complex and
potentially dangerous operations, without placing life or capital assets at
risk. Real-time simulation has been used for the training of plant
operators for the power industry, including both nuclear power plants and
conventional fossil fuel power plants (i.e., coal, oil, and natural gas), since
the early 1970s. Real-time simulation usage has traditionally
centered on initial training of operators and follow-on training of operators in
emergency conditions that can best be achieved through simulation replicating
actual plant operations.
8
In the
nuclear power industry, use of a simulator that accurately reflects the current
actual plant design is mandated by the U.S. Nuclear Regulatory Commission
(“NRC”). This mandate resulted from the investigation of the accident
at the Three Mile Island nuclear plant in 1979, which was attributed, at least
in part, to operator error. The NRC requires nuclear plant operators
to earn their licenses through simulator testing. Each nuclear plant
simulator must pass a certification program to ensure that the initial plant
design and all subsequent changes made to the actual plant control room or plant
operations are accurately reflected in the simulator. Plant operating
licenses are tied to simulator certification.
Full
scope power plant simulators are a physical representation of the entire plant
control room. For older plants, the control panels are connected to
an input/output (I/O) system, which converts analog electrical signals to
digital signals understood by the simulation computer. For newer
plants, the control rooms consist mainly of digital control systems and a series
of computer screens used by the operator to control the plant. The
simulation computer houses the mathematical models, which simulate the physical
performance of the power plant’s systems such as the reactor core, steam boiler,
cooling water, steam turbine, electrical generator, plant system controls and
electrical distribution systems. Partial scope simulators can be
viewed as a subset of a full scope simulator. Instead of simulating
the entire performance of the power plant, a partial scope simulator might
represent one or two critical systems such as the steam turbine and/or
electrical generator operation.
In the
past, training simulators had to strike a delicate balance between providing an
accurate engineering representation of the plant, while still operating in
“real-time” in order to provide effective training. As computing
power has increased, so too has the capacity of simulators to provide more
accurate plant representations in real-time based upon simulation models
developed from engineering design codes. The more sophisticated and
accurate engineering codes allows customers to use the simulator to help
validate plant design, control system strategies, control system displays, and
develop plant operating procedures and training material.
Simulation
also is used to validate proposed plant equipment changes and to confirm the
results of such changes, prior to making the change in the plant, which can save
time and money, as well as reduce the risk of unsafe designs, for the
utility.
The
importance of nuclear power to the U.S. energy supply is resulting in the
extension of the useful lives of U.S. nuclear power plants. Any
service life extension of a nuclear power plant is likely to require major
upgrades to the plant's equipment and technology, including its
simulator.
Fossil
fuel plant simulators are not required by law or regulation, but are justified
as a cost-effective approach to train operators on new digital control systems
being implemented at many fossil fuel power plants. The size,
complexity and price of a fossil plant simulator are much lower than for
simulators used for nuclear plants. Fossil plant simulators have
traditionally used lower fidelity (less sophisticated) mathematical models to
provide an approximate representation of plant performance. The
demand for highly accurate models did not exist in the early market for fossil
simulators since the main use of the simulator was to train operators on the
functionality of distributed control systems for plant start-up
activities.
The
deregulation of the power industry has forced utilities to view their assets
differently. Power plants are profit centers, and gaining the maximum
efficiency from the plant to become, or remain, competitive is a paramount
issue. The mindset of the operator has shifted, as plant operators
now must perform within narrower and narrower performance margins while still
maintaining safe operations. GSE believes its fossil fuel plant
customers are recognizing the benefits of high fidelity simulation models that
provide highly accurate representations of plant operations to help plant
operators and management determine optimal performance conditions.
9
Beyond
traditional operator training uses, the Company sees a significant shift in the
use of its simulators to test plant automation systems before they are deployed
in the actual plant. Control strategies and equipment set points are
validated on the simulator prior to plant start up to ensure the control schemes
work properly and the expected plant performance is
achieved. Performing these tests on a high fidelity simulator saves
days or weeks in the plant start up, thereby reducing cost and ensuring quicker
revenue generation by the utility.
Industry Future
The
Company sees a renaissance in nuclear power generation both domestically and
internationally that will provide significant opportunities for expansion of the
Company’s business. In 2002, the U.S Department of Energy initiated
the Nuclear Power 2010 (“NP 2010”) program, a government-industry, 50-50
cost-shared initiative that had two main goals: removing the
technical, regulatory and institutional barriers to building new nuclear power
plants in the U.S. and securing industry decisions to construct and operate
those plants. Per the DOE’s office of Nuclear Energy, NP 2010 program
has worked to 1) demonstrate untested regulatory processes, 2) identify sites
for new nuclear power plants, 3) develop and bring to market advanced,
standardized nuclear plant technologies, and 4) evaluate the business case for
building new nuclear power plants. In February 2010, President Obama
announced that the Department of Energy will provide $8.33 billion in loan
guarantees for a pair of nuclear reactors to be built in Georgia at the Alvin W.
Vogtle Electric Generating Plant by Georgia Power, a subsidiary of Southern
Company. Georgia Power received an early site permit from the U.S.
NRC for the two additional units in 2009 and preliminary site work
has begun. Westinghouse Electric Company LLC (“Westinghouse”) and its
consortium team member The Shaw Group are under contract to provide two
Westinghouse AP1000™ nuclear power plants at the Vogtle site. The new
units are expected to begin commercial operation in 2016 and 2017. In
addition to the Vogtle plant, the Westinghouse consortium has signed
Engineering, Procurement and Construction contracts with Progress Energy
Florida, a subsidiary of Progress Energy, to provide two AP1000 nuclear power
units at Progress’s Levy County, Florida site and with South Carolina Electric
& Gas Company, principal subsidiary of SCANA Corporation, and Santee Cooper
to provide two AP1000 nuclear power units at the V.C. Summer Nuclear Station in
Jenkinsville, S.C.
Internationally,
there are currently over 50 nuclear reactors under construction in 13
countries. Per the World Nuclear Association (“WNA”), China has 11
nuclear power reactors in commercial operation, 20 under construction and
another 27 units are planned, with construction due to start within three years.
China’s aim is to have a sixfold increase in nuclear capacity or more by
2020. In Russia, six large reactors are under active
construction, seven further reactors are then planned to replace some existing
plants, and by 2016 ten new reactors should be operating. Further
reactors are planned to add new capacity by 2020. New plants are on
the drawing board or under construction in Argentina, Canada, Bulgaria, Finland,
France, Japan, India, Pakistan, Romania, Slovakia and South Korea.
Beyond
new construction, numerous U.S. utilities are extending the useful life of their
current assets. These license extension processes in the nuclear
industry will result in significant changes in plant equipment and control room
technology. Based upon U.S. NRC regulations, each training simulator is required
to reflect all changes that are made in the actual plant, thus when changes in
plant equipment and control room technology are made, the nuclear power plants
must either upgrade existing simulators or purchase brand new
simulators.
The
second phenomena affecting the industry is the aging of the nuclear and fossil
plant operator workforce which will result in the need for simulation to train
the next generation of plant operators. Per the U.S. Bureau of Labor
Statistics’ Current Population Survey, 2008, 53% of the utilities industry
workforce was age 45 or older in 2008; 15.9% was over age 55. Thus,
the industry is faced with an aging workforce at the same time new capacity is
needed, thereby placing significant pressure on the industry to find and train
the next generation of operations and maintenance personnel. In their
employment outlook for the utilities industry, the Bureau of Labor Statistics
states “Because on-the-job training is very intensive in many utilities industry
occupations, preparing a new workforce will be one of the industry’s highest
priorities during the next decade”.
10
Therefore,
the Company believes that these trends, if they come to fruition in whole or
even in part, represent a market opportunity for its real-time simulation, plant
optimization, asset management and condition monitoring products and
services.
GSE’s Solution
The
Company’s Power Simulation business is a leader in the development, marketing
and support of high fidelity, real-time, dynamic simulation software for the
electric utility industry. The Company has built or modified about 65
of the approximately 75 full-scope simulators serving about 103 operating
nuclear power plants in the United States. Outside the United States,
GSE has built or modified about 73 of the approximately 167 full-scope
simulators serving approximately 329 operating nuclear power
plants.
The
Company has developed integrated training solutions which combine the power of
the Company’s simulation technology with training content to provide turn-key
training for the power and process industries. These training centers
will help industry bridge the gap between college and university level training
and real world experience through simulation.
In
addition to operator training, the Company’s simulation products and services
permit plant owners and operators to simulate the effects of changes in plant
configuration and performance conditions to optimize plant
operation. These features allow the Company’s customers to understand
the cost implications of replacing a piece of equipment, installing new
technology or holding out-of-service assets. GSE has also developed a
suite of tools based on sophisticated signal analysis and simulation techniques
to help its customers manage their assets by determining equipment degradation
before it severely impacts plant performance.
The
Company has also focused on upgrading older technology used in power plants to
new technology upgrades for plant process computers and safety parameter display
systems. As nuclear plants in the U.S. continue to age, the Company
will seek more business in this upgrade market.
GSE
provides both turn-key solutions, including simulated hardware and proprietary
software, to match a specific plant, and discrete simulation technology for
specific uses throughout a plant. Its substantial investment in
simulation technology has led to the development of proprietary software
tools. These tools significantly reduce the cost and time to
implement simulation solutions and support long-term maintenance. The
Company’s high fidelity, real-time simulation technology for power plant fluid,
logic and control, electrical systems and associated real-time support software,
JADE, is available for use primarily on UNIX, Linux and Windows computer
platforms. The Company’s Xtreme tools were designed for the Windows
environment. Both technologies were specifically designed to provide
user friendly graphic interfaces to the Company’s high fidelity
simulator.
In
addition to the simulator market, the Company offers products aimed at improving
performance of existing plants by reducing the number of unplanned outages due
to equipment failure. Using advanced signal analysis techniques, the
Company’s tools can predict when certain plant equipment needs to be
replaced. Replacement of critical equipment prior to failure permits
effective planning and efficient use of maintenance time during scheduled
off-line periods.
11
Products of the Power Simulation
business include:
|
¨
|
Java Applications &
Development Environment (JADE™), a Java-based application that
provides a window into the simulation instructor station and takes
advantage of the web capabilities of Java, allowing customers to access
the simulator and run simulation scenarios from anywhere they have access
to the web. JADE includes the following software modeling
tools:
|
|
¨
|
JFlow™, a modeling tool
that generates dynamic models for flow and pressure
networks.
|
|
¨
|
JControl™, a modeling
tool that generates control logic models from logic
diagrams.
|
|
¨
|
JLogic™, a modeling
tool that generates control logic models from schematic diagrams.
|
|
¨
|
JElectric™, a modeling
tool that generates electric system models from schematic and one-line
diagrams.
|
|
¨
|
JTopmeret™, a modeling
tool that generates two phase network dynamic models.
|
|
¨
|
JDesigner™, a JADE
based intuitive graphic editor for all JADE tools.
|
|
¨
|
JStation™, a JADE based
web-enabled Instructor Station.
|
|
¨
|
Xtreme Tools™, a suite
of software modeling tools developed under the Microsoft Windows
environment. It
includes:
|
|
¨
|
Xtreme Flow™, a modeling tool
that generates dynamic models for flow and pressure
networks.
|
|
¨
|
Xtreme Control™, a modeling tool
that generates control logic models from logic
diagrams.
|
|
¨
|
Xtreme Logic™, a
modeling tool that generates control logic models from schematic
diagrams.
|
|
¨
|
Xtreme Electric™, a modeling tool that generates electric system
models from schematic and one-line
diagrams.
|
|
¨
|
RELAP5 R/T
HD™,
a real-time version
of the safety analysis code RELAP5 developed by the Idaho National
Laboratory. The Company’s HD (High Definition) version of
RELAP5 R/T enables the engineers to understand and control all of the
internal functions of RELAP5, making this solution unique in the market.
|
|
¨
|
SimExec® and OpenSim®, real-time
simulation executive systems that control all real-time simulation
activities and allow for an off-line software development environment in
parallel with the training environment. OpenSim is targeted for
users of Microsoft Windows operating systems, while SimExec is targeted for
users of Microsoft Windows, UNIX and Linux operating
systems.
|
|
¨
|
SmartTutor®,
complementary software for instructor stations. It provides new
capabilities to help improve training methodologies and
productivity. Using Microsoft Smart Tag technology, SmartTutor
allows the control of the simulator software directly from Microsoft
Office products. The user can run training scenarios directly
from a Microsoft Word document, or he can plot and show transients live
within a Microsoft PowerPoint
slide.
|
|
¨
|
Xtreme I/S™, a
Microsoft Windows based Instructor Station that allows the use of
Microsoft Word and PowerPoint to control the real-time simulation
environment. Xtreme I/S is a user-friendly tool for classroom training and
electronic report generation. It provides real-time plant
performance directly from the simulator during classroom training, which
drastically increases learning
efficiency.
|
|
¨
|
Pegasus Surveillance and
Diagnosis System™, a software package for semi-automatic plant
surveillance and diagnostics, incorporates sophisticated signal processing
and simulation techniques to help operators evaluate the condition and
performance of plant components. Pegasus permits plant
management to identify degraded performance and replace components before
they fail.
|
12
|
¨
|
SIMON™, a computer
workstation system used for monitoring stability of boiling water reactor
plants. SIMON assists the operator in determining potential instability
events, enabling corrective action to be taken to prevent unnecessary
plant shutdowns.
|
|
¨
|
VPanel™, an interactive
visual training solution. For customers that already have a
full scope ANS 3.5 Certified simulator, the VPanel provides a second
hardware platform that will run the ASN 3.5 Simulator software model at a
fraction of the cost of building a second full scope simulator. The
VPanel Simulator provides the same fidelity of operation as their existing
simulator but the VPanel offers portability and versatility at a very
affordable price. All of the features and functions of the full
scope ANS 3.5 Simulator are duplicated in the VPanel simulator but the
VPanel can be used in a classroom setting or as a second simulator to
alleviate many of the time pressures our customers are experiencing with
their current simulators. For nations considering entry into the
nuclear power industry the VPanel is the ideal tool to help build a base
of experienced nuclear workers either at a university or industrial
training facility. Since the VPanel uses a software load from an ANS
3.5 Certified simulator it will accurately reflect the operations and
response of an operating nuclear power plant. The VPanel provides
nations entering the nuclear power industry with realistic hands on
experience of the operation of a nuclear facility long before they begin
construction on their facilities.
|
The Simulation business also provides
consulting and engineering services to help users plan, design, implement, and
manage/support simulation and control systems. Services include application
engineering, project management, training, site services, maintenance contracts
and repair.
Strategy
The goal of the Power Simulation
business is to expand its business on three fronts:
|
¨
|
Continue
serving its traditional customer
base.
|
|
¨
|
Combine
its simulation capability with training content to provide totally
integrated training solutions.
|
|
¨
|
Expand
the use of high fidelity simulation beyond training to help validate plant
design.
|
Traditional Simulation
Market. Nuclear power currently accounts for about 20% of the
total electrical output in the United States and this percentage will likely
remain the same even as total capacity increases. Any new nuclear
power plants will likely be of the advanced reactor designs created by
Westinghouse, General Electric and Areva. These new designs require
new simulators and training programs, as they are different from the nuclear
power plant designs currently in operation. In addition to new power plants,
existing nuclear power plants will likely be required to remain on-line for a
longer period than originally expected. In order to stay in
operation, many plants will require life extension
modifications. Since all existing U.S. nuclear power plants went
on-line before 1979, their designs and technology can also benefit from the
substantial advances in plant design and technology developed over the past 30
years. For example, several of the Company’s U.S. utility customers
have been replacing their existing hard panel control rooms with modern
distributed control systems (DCS) as are common in fossil fuel plants and which
have been implemented in Europe for several years. Significant
changes to control room instrumentation and overall control strategy from hard
panel to DCS generally require modification or replacement of the plant
simulator. With the largest installed base of nuclear plant simulators in the
world, the Company believes it is uniquely positioned to serve this market
segment with new simulation products and services. GSE has received
several projects in the last few years for implementing digital turbine control
systems in U.S. plants.
As plants extend their useful life,
many plan to “up-rate” the existing capacity to increase electrical
yield. By changing the capacity of certain equipment in a plant, the
utility can gain upwards of a 10%-15% increase in output. Again, any
such changes must be reflected in the control room simulator, and operators must
be trained on the new equipment before implementation.
13
In addition to the United States
markets, several emerging regions of the world are expanding their electrical
capacity with both nuclear and fossil fuel power plants. This is particularly
the case in China and India.
Classroom
Simulation. In recent years the Company has upgraded numerous
training simulators to utilize standard PC technology. As an
extension of the PC-based simulator technology, the Company has developed tools
which will allow the training simulator to be used in a classroom setting,
replacing the actual control room panels with “soft-panel”
graphics.
Increased training requirements and
demands for performance improvement have resulted in simulator training time
becoming scarce. By providing the actual training simulator models in
a classroom setting, the value of the simulator is increased by allowing more
personnel the training advantages of interactive, dynamic real-time
simulation.
The Company pioneered the technology to
run a simulator on a PC several years ago. However, the technology
remains complex, which prevented wide deployment of the simulator in
classrooms. The Company has developed unique software which allows
simulator-based training lessons to be easily developed and deployed in a
classroom setting.
Simulation Beyond
Training. In addition to operator training, the Company’s
simulation products can meet this increased need for efficiency by assisting
plant operators in understanding the cost implications of replacing equipment,
installing new technology and maintaining out-of-service assets. In
order to exploit this potential, the Company has increased the fidelity of its
simulation products and is marketing its services to increase the fidelity of
simulators that are already in operation.
As computing power and networking
technologies improve, several of the Company’s customers have started to migrate
simulation technology from the training organization to the engineering
organization. The same full scope simulation software that drives the
simulated control room panels in a simulator can be used with graphical
representations of the panels so engineers can test design changes and see how
the balance of the plant will react to such changes. GSE has developed a
Java-based application to allow customers easier access to, and use of, the
simulation capabilities across the organization through network
communication.
Optimize Existing Engineering
Resources. GSE’s Power domestic service organization focuses
on simulator upgrades and retrofits. In addition to domestic
resources, GSE has developed a network of trained engineers in Russia, Ukraine,
Czech Republic, Bulgaria, and China. These foreign resources provide
low cost engineering and software development capabilities and are readily
available to supplement the United States engineering staff as
necessary.
Strategic Alliances
Power’s strategic alliances
have enabled the Company to penetrate regions outside the United States by
combining the Company’s technological expertise with the regional presence and
knowledge of local market participants. These strategic alliances
have also permitted the reduction of research and development and marketing
costs by sharing such costs with other companies.
14
In recent
years, a significant amount of the Company’s international business has come
from contracts in Eastern Europe, including the republics of the former Soviet
Union, and the Pacific Rim. In order to acquire and perform these
contracts, the Company entered into strategic alliances with various entities
including: All Russian Research Institute for Nuclear Power Plant Operation
(Russia); Kurchatov Institute (Russia); Risk Engineering Ltd. (Bulgaria);
Samsung Electronics (Korea); Toyo Engineering Corporation (Japan); and
Westinghouse Electric Company LLC (U.S.).
Competition
The Power
Simulation business encounters intense competition. In the nuclear
simulation market, GSE competes directly with larger firms primarily from Canada
and Germany, such as MAPPS Inc., a subsidiary of L-3 Communications, CORYS
T.E.S.S and Western Services Corp. The fossil simulation market is
represented by smaller companies in the U.S. and overseas. Several of
the Company’s competitors have greater capital and other resources than it has,
including, among other advantages, more personnel and greater marketing,
financial, technical and research and development
capabilities. Customer purchasing decisions are generally based upon
price, the quality of the technology, experience in related projects, and the
financial stability of the supplier.
Customers
The Power
Simulation business has provided approximately 200 simulation systems to an
installed base of over 75 customers worldwide. In 2009, approximately
65% of the Company’s revenue was generated from end users outside the United
States. Customers include, among others, ABB Inc., American
Electric Power, Bernische Kraftwerke AG (Switzerland), British Energy Generation
Ltd. (UK), Comisión Federal De Electricidad (Mexico), Concern Titan-2 (Russia),
Emerson Process Management, Georgia Power, Kärnkraftsäkerhet och
Utbildning AB (Sweden), Kraftwerks–Simulator-Gesellschaft mbH (Germany), Nuclear
Engineering Ltd. (Japan), PSEG Nuclear, Inc., Slovenské elektrárne, a.s.
(Slovakia), and Westinghouse Electric Co.
The following Power Simulation
customers have provided more than 10% of the Company’s consolidated revenue for
the indicated periods:
|
Years
ended December 31,
|
|||||
|
2009
|
2008
|
2007
|
|||
|
Slovenské
elektrárne, a.s.
|
13.5%
|
0.0%
|
0.0%
|
||
|
Emerson
Process Management
|
12.1%
|
16.2%
|
7.9%
|
||
|
Titan-2
Concern
|
10.7%
|
0%
|
0%
|
||
|
American
Electric Power
|
6.8%
|
10.5%
|
0.5%
|
||
|
Emirates
Simulation Academy LLC
|
0.0%
|
4.2%
|
31.1%
|
||
Sales and Marketing
The Company markets its Power
Simulation products and services through a network of direct sales staff, agents
and representatives, systems integrators and strategic alliance partners.
Market-oriented business and customer development teams define and implement
specific campaigns to pursue opportunities in the power
marketplace.
15
The
Company’s ability to support its multi-facility, international and/or
multinational Power Simulation clients is facilitated by its network of offices
and strategic partners in the U.S. and overseas. Power Simulation offices are
maintained in Maryland and Georgia, and outside the U.S., in Sweden and
China. In addition to the offices located overseas, the Company’s
ability to conduct international business is enhanced by its multilingual and
multicultural work force. GSE has strategic relationships with systems
integrators and agents representing its interests in the Czech Republic,
Bulgaria, Japan, Mexico, People’s Republic of China, South Africa, Spain, South
Korea, Taiwan, Ukraine and the United Kingdom.
II. Process Industries
Simulation.
Industry
Throughout the process industries there
is continuing competitive pressure, reduction of technical resources, and an
aging workforce which is forcing process manufacturers to turn to advanced
technologies for real-time optimization, training, and advanced process
control. Operational efficiency is vital for companies to remain
competitive where many of the manufacturing industries operate on very thin
margins. There are only one or two advanced technology companies that offer
services fully across this spectrum, and GSE offers dynamic real-time simulation
capabilities for operator training and plant design validation and verification
into this segment.
GSE’s Solution
The
SimSuite Pro™ product was developed by GSE specifically for dynamic real-time
simulation for operator training and validating the plant design logic and
control. The GSE culture and expertise is one of customized project execution
and delivery. This marketplace places a high value on experience,
both company-wide and for the individuals on the project teams, so GSE promotes
its long history in training simulators, while also seeking new applications.
The SimSuite Pro package continues to be enhanced with features applicable not
just to the execution of professional training techniques and design validation,
but also to the recording and validating of process operator performance for
potential certification.
Strategy
GSE is
uniquely positioned in the process simulation market to provide total training
solutions which combine the development of the plant simulator with the training
infrastructure and course material to enable the customer to truly benefit from
the simulator investment. The core concepts of process simulation
make the technology a basis for other potential process improvement activities,
such as Advanced Process Control and Process Optimization, which is where some
of the major GSE competition has more business focus than for operator training.
GSE will continue to emphasize its operator training focus and strengths, as
well as the application of the process simulator for change management, where
changes in the process, control strategy, or operating procedures can be
evaluated in real time before they are applied to the actual process units.
On-stream time is an important economic factor, and there is recognizable value
in avoiding the risk of unplanned process disturbances from invalidated
changes.
An
emerging energy market is developing for Integrated Gasification Combined Cycle
(“IGCC”) power plants. These new plants produce electricity more
efficiently than traditional power plants by first converting existing refinery
waste materials into synthetic gas that is used to power a gas
turbine. The gas is then burned to create steam to turn a steam
turbine. The unique nature of these plants requires expertise both in
chemical process simulation and power simulation. GSE is one of the
few simulator companies in the world with expertise in both areas.
16
Customers
Hydrocarbon
and chemical process customers include numerous large oil refineries and
chemical plants such as Statoil ASA (Norway), Bayernoil (Germany), Emerson
Process Management, Saudi Basic Industries Corporation (Saudi Arabia), Sinopec
Ningbo Engineering Company (China), and Savannah River Nuclear Solutions,
LLC.
Competition
GSE’s
process simulation competitors are a varied group. There are major corporations
offering a wide range of products and services that include operator training
simulators. There are also companies focused on Process Technology
and manufacturing enhancement, such as Invensys and Honeywell who are
Distributed Control System (“DCS”) distributors to the refining industry and
provide operator simulation as part of their DCS offering. There is a
collection of companies with specific industry niches that enables them to
compete in operator training simulation, such as Invensys and RSI Simcon. There
are also the smaller training companies that compete at the lower cost levels of
Computer Based Training (“CBT”) or simple simulations close to CBT.
The GSE
focus on dynamic simulation for training and design validation is a business
strength, and its vendor independence, with the ability to integrate to
different vendor’s process control systems, is also a value which is appreciated
by customers. GSE can be seen as a best-of-breed type of supplier because it is
not tied to a major control system, nor is it providing simulation software for
engineering and business management with high annual license fees.
Sales and Marketing
The
Company will market its Process Simulation technologies through a combination of
techniques including its existing direct sales channel, sales agents, and
strategic alliance partners.
Competitive
Advantages.
The
Company believes that it is in a strong position to compete in the Simulation
markets based upon the following strengths:
|
¨
|
Technical and Applications
Expertise. GSE is a leading innovator and developer of
real-time software with more than 38 years of experience producing high
fidelity real-time simulators. As a result, the Company has
acquired substantial applications expertise in the energy and industrial
process industries. The Company employs a highly educated and
experienced multinational workforce of 201 employees, including
approximately 152 engineers and scientists. Approximately 49%
of these engineers and scientists have advanced science and technical
degrees in fields such as chemical, mechanical and electrical engineering,
applied mathematics and computer
sciences.
|
|
¨
|
Proprietary Software
Tools. GSE has developed a library of proprietary
software tools including auto-code generators and system models that
substantially facilitate and expedite the design, production and
integration, testing and modification of software and
systems. These tools are used to automatically generate the
computer code and systems models required for specific functions commonly
used in simulation applications, thereby enabling it or its customers to
develop high fidelity real-time software quickly, accurately and at lower
costs.
|
17
|
¨
|
Open System
Architecture. GSE’s software products and tools are
executed on standard operating systems with third-party off-the-shelf
hardware. The hardware and operating system independence of its
software enhances the value of its products by permitting customers to
acquire less expensive hardware and operating systems. The
Company’s products work in the increasingly popular Microsoft operating
environment, allowing full utilization and integration of numerous
off-the-shelf products for improved
performance.
|
|
¨
|
Training
Curricula. The Company has developed detailed
course material in nuclear power plant fundamental sciences and specific
industrial applications.
|
|
¨
|
International
Strengths. Approximately 65% of the Company’s 2009
revenue was derived from international sales of its products and
services. GSE has a multinational sales force with offices
located in Beijing, China, and Nyköping, Sweden and agents,
representatives and partners in 20 other countries. To capitalize on
international opportunities and penetrate foreign markets, the Company has
established strategic alliances and partnerships with several foreign
entities and universities.
|
Intellectual Property.
The
Company depends upon its intellectual property rights in its proprietary
technology and information. GSE maintains a portfolio of trademarks
(both registered and unregistered), copyrights (both registered and
unregistered), and licenses. While such trademarks, copyrights and
licenses as a group are of material importance to the Company, it does not
consider any one trademark, copyright, or license to be of such importance that
the loss or expiration thereof would materially affect the
Company. The Company relies upon a combination of trade
secrets, copyright, and trademark law, contractual arrangements and technical
means to protect its intellectual property rights. GSE distributes
its software products under software license agreements that grant customers
nonexclusive licenses for the use of its products, which are
nontransferable. Use of the licensed software is restricted to
designated computers at specified sites, unless the customer obtains a site
license of its use of the software. Software and hardware security
measures are also employed to prevent unauthorized use of the Company’s
software, and the licensed software is subject to terms and conditions
prohibiting unauthorized reproduction of the software.
The
Company does not own any patents. The Company believes that all of
the Company’s trademarks (especially those that use the phrase "GSE Systems")
are valid and will have an unlimited duration as long as they are adequately
protected and sufficiently used. The Company’s licenses are perpetual
in nature and will have an unlimited duration as long as they are adequately
protected and the parties adhere to the material terms and
conditions.
GSE has
eleven registered U.S. trademarks: RETACT®, GSE Systems®, THOR®,
OpenSim®, SmartTutor®, SimSuite Pro®, ESmart®, GAARDS®, Openexec®,
REMITS-Real-Time Emergency Management Interactive Training System® and
SimExec®. Some of these trademarks have also been registered in
foreign countries. The Company also claims trademark rights to BRUS™,
GCONTROL+™, GFLOW+™, GLOGIC+™, GPower+™, Java Application and Development
Enviroment (JADE)™, PEGASUS Plant Surveillance and Diagnosis System™, RACS™,
Sens Base™, SIMON™, SimSuite Power™, V-Panel ™, Vista PIN™, and Xtreme
I/S™.
18
In
addition, the Company maintains federal statutory copyright protection with
respect to its software programs and products, has registered copyrights for
some of the documentation and manuals related to these programs, and maintains
trade secret protection on its software products.
Despite
these protections, the Company cannot be sure that it has protected or will be
able to protect its intellectual property adequately, that the unauthorized
disclosure or use of its intellectual property will be prevented, that others
have not or will not develop similar technology independently, or, to the extent
it owns any patents in the future, that others have not or will not be able to
design around those patents. Furthermore, the laws of certain
countries in which the Company’s products are sold do not protect its products
and intellectual property rights to the same extent as the laws of the United
States.
Industries
Served.
The
following chart illustrates the approximate percentage of the Company's 2009,
2008, and 2007 consolidated revenue by industries served:
| 2009 | 2008 | 2007 | |||||
| Nuclear power industry | 73% | 54% | 45% | ||||
| Fossil fuel power industry | 21% | 31% | 20% | ||||
| Process industry | 4% | 9% | 4% | ||||
| Training and education industry | 2% | 6% | 31% | ||||
| Total | 100% | 100% | 100% | ||||
Contract
Backlog.
The
Company does not reflect an order in backlog until it has received a contract
that specifies the terms and milestone delivery dates. As of December 31, 2009,
the Company’s aggregate contract backlog totaled approximately $53.9 million of
which approximately $29.5 million or 55% is expected to be converted to revenue
by December 31, 2010. As of December 31, 2008, the Company’s
aggregate contract backlog totaled approximately $38.1 million.
Employees.
As of
December 31, 2009, the Company had 201 employees as compared to 178 employees at
December 31, 2008.
ITEM
1A. RISK
FACTORS.
The
following discussion of risk factors contains “forward-looking statements,” as
discussed on pages 3 and 4 of this Annual Report on Form 10-K. These
risk factors may be important to understanding any statement in this Annual
Report on Form 10-K or elsewhere. The Company believes that the
following risk factors may cause the market price for its common stock to
fluctuate, perhaps significantly. In addition, in recent years the stock market
in general, and the shares of technology companies in particular, have
experienced extreme price fluctuations. The Company’s common stock
has also experienced a relatively low trading volume, making it further
susceptible to extreme price fluctuations. The following information should be
read in conjunction with Item 7 Management’s Discussion and Analysis of
Financial Condition and Results of Operations and the consolidated financial
statements and related notes under Item 8 Financial Statements and Supplementary
Data.
19
We
routinely encounter and address risks, some of which may cause our future
results to be different, sometimes materially, than we presently
anticipate. Discussion about important operational risks that we
encounter can be found in Item 1, Business and Item 7, Management’s Discussion
and Analysis of Financial Condition and Results of Operations. We
have described certain important strategic risks below. Our reactions
as well as our competitors’ reactions to material future developments may affect
our future results.
The
Company’s global growth is subject to a number of economic and political
risks.
The
Company conducts its operations in North America, Europe, Asia and the Middle
East. Global economic developments affect businesses such as GSE, and
the Company’s operations are subject to the effects of global competition. The
Company’s global business is affected by local economic environments, including
inflation, recession and currency volatility. Political changes, some
of which may be disruptive, can interfere with the Company’s supply chain, its
customers and all of its activities in a particular location. While some of
these risks can be hedged using derivatives or other financial instruments and
some are insurable, such attempts to mitigate these risks are costly and not
always successful. The current global recession has not yet had
a material impact on the Company’s business. The Company’s backlog as
of December 31, 2009 totaled $53.9 million, a 41.5% increase over the Company’s
backlog at December 31, 2008. The Company has seen no significant delays or
cancellations to the projects it is currently working on and is unaware of any
significant delays or cancellations to projects that the Company expects to
secure in 2010. However, as the recession continues, we may see an
impact on the Company’s operations.
The
Company’s expense levels are based upon its expectations as to future revenue,
so it may be unable to adjust spending to compensate for a revenue
shortfall. Accordingly, any revenue shortfall would likely have a
disproportionate effect on the Company’s operating results.
The
Company’s revenue was $40.1 million, $29.0 million, and $31.9 million for the
years ended December 31, 2009, 2008 and 2007, respectively. The
Company’s operating income (loss) was $563,000, $(12,000), and $2.2 million for
the years ended December 31, 2009, 2008, and 2007, respectively. The
Company’s operating results have fluctuated in the past and may fluctuate
significantly in the future as a result of a variety of factors, including
purchasing patterns, timing of new products and enhancements by the Company and
its competitors, and fluctuating global economic conditions. Since
the Company’s expense levels are based in part on its expectations as to future
revenue and includes certain fixed costs, the Company may be unable to adjust
spending in a timely manner to compensate for any revenue shortfall and such
revenue shortfalls would likely have a disproportionate adverse effect on
operating results.
Risk
of International Sales and Operations.
Sales of
products and services to end users outside the United States accounted for
approximately 65% of the Company’s consolidated revenue in 2009, 63% of
consolidated revenue in 2008, and 71% of consolidated revenue in
2007. The Company anticipates that international sales and services
will continue to account for a significant portion of its revenue in the
foreseeable future. As a result, the Company may be subject to
certain risks, including risks associated with the application and imposition of
protective legislation and regulations relating to import or export (including
export of high technology products) or otherwise resulting from trade or foreign
policy and risks associated with exchange rate
fluctuations. Additional risks include potentially adverse tax
consequences, tariffs, quotas and other barriers, potential difficulties
involving the Company’s strategic alliances and managing foreign sales agents or
representatives and potential difficulties in accounts receivable
collection. The Company currently sells products and provides
services to customers in emerging market economies. The following
emerging markets have provided more than 10% of the Company’s revenue for the
indicated period:
20
|
Years
ended December 31,
|
|||||
|
2009
|
2008
|
2007
|
|||
|
Slovenské
elektrárne, a.s.
|
13.5%
|
0.0%
|
0.0%
|
||
|
Emerson
Process Management
|
12.1%
|
16.2%
|
7.9%
|
||
|
Titan-2
Concern
|
10.7%
|
0%
|
0%
|
||
|
American
Electric Power
|
6.8%
|
10.5%
|
0.5%
|
||
|
Emirates
Simulation Academy LLC
|
0.0%
|
4.2%
|
31.1%
|
||
The
Company has taken steps designed to reduce the additional risks associated with
doing business in these countries, but the Company believes that such risks may
still exist and include, among others, general political and economic
instability, lack of currency convertibility, as well as uncertainty with
respect to the efficacy of applicable legal systems. There can be no
assurance that these and other factors will not have a material adverse effect
on the Company’s business, financial condition or results of
operations.
The
Company’s business is largely dependent on sales to the nuclear power
industry. Any disruption in this industry would have a material
adverse effect upon the Company’s revenue.
In 2009,
73% of GSE’s revenue was from customers in the nuclear power industry (54% in
2008 and 45% in 2007). The Company expects to derive a significant
portion of its revenue from customers in the nuclear power industry for the
foreseeable future. The Company’s ability to supply nuclear power
plant simulators and related products and services is dependent on the continued
operation of nuclear power plants and, to a lesser extent, on the construction
of new nuclear power plants. A wide range of factors affect the
continued operation and construction of nuclear power plants, including the
political and regulatory environment, the availability and cost of alternative
means of power generation, the occurrence of future nuclear incidents, and
general economic conditions.
The
Company’s line of credit agreement imposes operating and financial restrictions
on the Company which may prevent it from capitalizing on business
opportunities.
GSE’s
line of credit agreements with Bank of America (BOA) impose operating and
financial restrictions. These restrictions affect, and in certain cases limit,
among other things, the Company’s ability to:
|
¨
|
incur
additional indebtedness and liens;
|
|
¨
|
make
investments and acquisitions;
|
|
¨
|
consolidate,
merge or sell all or substantially all of its
assets.
|
There can
be no assurance that these restrictions will not adversely affect the Company’s
ability to finance its future operations or capital needs or to engage in other
business activities that may be in the interest of stockholders. At
December 31, 2009, the Company was in default on two of its financial
covenants. The financial covenant calculations at December 31, 2009
are shown below:
21
| As of | ||||
| Covenant | Dec. 31, 2009 | |||
| Tangible net worth | Must Exceed $15.0 million | $33.5 million | ||
| Debt service coverage ratio | Must Exceed 1.25 : 1.00 | (1,582) : 1.00 | ||
| Funded debt to EBITDA ratio | Not to Exceed 2.50 : 1.00 | 2.74 : 1.00 |
At
December 31, 2009 and throughout all of 2009, the Company had no outstanding
borrowings against its lines of credit. Accordingly, we did not incur
any bank interest expense in 2009. However, the Company did incur
approximately $1,000 of interest expense related to late payments to
vendors. This, in conjunction with the Company’s net loss for the
year ended December 31, 2009, has resulted in a negative debt service coverage
ratio. For the funded debt to EBITDA ratio calculation, the
amount of outstanding letters of credit and bank guarantees that are not cash
collateralized are included as funded debt. The Company has received
a written waiver from BOA and is in the process of negotiating a revision to the
financial covenants for 2010. The Company’s available borrowing base
under the two lines of credit was $6.0 million at December 31, 2009, of which
$2.4 million had been utilized to collateralize three standby letters of
credit.
The
Company is dependent on product innovation and research and development, which
costs are incurred prior to revenue for new products and
improvements.
The
Company believes that its success will depend in large part on its ability to
maintain and enhance its current product line, develop new products, maintain
technological competitiveness and meet an expanding range of customer
needs. The Company's product development activities are aimed at the
development and expansion of its library of software modeling tools, the
improvement of its display systems and workstation technologies, and the
advancement and upgrading of its simulation technology. The life cycles for
software modeling tools, graphical user interfaces, and simulation technology
are variable and largely determined by competitive pressures. Consequently, the
Company will need to continue to make significant investments in research and
development to enhance and expand its capabilities in these areas and to
maintain its competitive advantage.
The
Company relies upon its intellectual property rights for the success of its
business; however, the steps it has taken to protect its intellectual property
may be inadequate.
Although
the Company believes that factors such as the technological and creative skills
of its personnel, new product developments, frequent product enhancements and
reliable product maintenance are important to establishing and maintaining a
technological leadership position, the Company's business depends, in part, on
its intellectual property rights in its proprietary technology and
information. The Company relies upon a combination of trade secret,
copyright, and trademark law, contractual arrangements and technical means to
protect its intellectual property rights. The Company enters into
confidentiality agreements with its employees, consultants, joint venture and
alliance partners, customers and other third parties that are granted access to
its proprietary information, and limits access to and distribution of its
proprietary information. There can be no assurance, however, that the
Company has protected or will be able to protect its proprietary technology and
information adequately, that the unauthorized disclosure or use of the Company's
proprietary information will be prevented, that others have not or will not
develop similar technology or information independently, or, to the extent the
Company owns any patents in the future, that others have not or will not be able
to design around those future patents. Furthermore, the laws of certain
countries in which the Company's products are sold do not protect the Company's
products and intellectual property rights to the same extent as the laws of the
United States.
22
The
industries in which GSE operates are highly competitive. This
competition may prevent the Company from raising prices at the same pace as its
costs increase.
The
Company's businesses operate in highly competitive environments with both
domestic and foreign competitors, many of whom have substantially greater
financial, marketing and other resources than the Company. The principal factors
affecting competition include price, technological proficiency, ease of system
configuration, product reliability, applications expertise, engineering support,
local presence and financial stability. The Company believes that competition in
the simulation fields may further intensify in the future as a result of
advances in technology, consolidations and/or strategic alliances among
competitors, increased costs required to develop new technology and the
increasing importance of software content in systems and products. As
the Company’s business has a significant international component, changes in the
value of the dollar could adversely affect the Company's ability to compete
internationally.
GSE
may pursue acquisitions and joint ventures, and any of these transactions could
adversely affect its operating results or result in increased costs or related
issues.
The
Company intends to pursue acquisitions and joint ventures, a pursuit which could
consume substantial time and resources. Identifying appropriate acquisition
candidates and negotiating and consummating acquisitions can be a lengthy and
costly process. The Company may also encounter substantial unanticipated costs
or other related issues such as compliance with new regulations and regulatory
schemes, additional oversight, elimination of redundancy, and increased employee
benefit costs associated with the acquired businesses. The risks inherent in
this strategy could have an adverse impact on the Company’s results of operation
or financial condition.
The
nuclear power industry, the Company’s largest customer group, is associated with
a number of hazards which could create significant liabilities for the
Company.
The
Company’s business could expose it to third party claims with respect to
product, environmental and other similar liabilities. Although the Company has
sought to protect itself from these potential liabilities through a variety of
legal and contractual provisions as well as through liability insurance, the
effectiveness of such protections has not been fully tested. Certain of the
Company’s products and services are used by the nuclear power industry primarily
in operator training. Although the Company’s contracts for such
products and services typically contain provisions designed to protect the
Company from potential liabilities associated with such use, there can be no
assurance that the Company would not be materially adversely affected by claims
or actions which may potentially arise.
The
use of derivative instruments by the Company in the normal course of business
could result in financial losses that negatively impact the Company’s net
income.
GSE
periodically enters into forward foreign exchange contracts to manage market
risks associated with the fluctuations in foreign currency exchange rates on
foreign-denominated trade receivables. The Company could recognize financial
losses as a result of volatility in the market values of these contracts or if a
counterparty fails to perform. The Company minimizes credit exposure
by limiting counterparties to internationally recognized financial
institutions.
The
issuance of performance bonds and bid bonds by the Company in the normal course
of business could result in financial losses that negatively impact the
Company’s net income.
23
The
Company is often required to issue performance bonds to its customers as a
normal part of its business activities. The Company’s customers may
have the ability to draw upon these performance bonds in the event the Company
fails to cure a material breach of the contract within 30 days of receiving
notice from the customer regarding the nature of the
breach. As of December 31, 2009, the Company has issued
performance bonds on eight contracts totaling $3.5 million; the largest of these
performance bonds was for $2.0 million. Although the Company expects
no material breaches to occur on these contracts, if such a breach were to occur
and the Company failed to cure such breach, the Company could incur a loss of up
to $3.5 million.
The
Company is subject to a wide variety of laws and regulations.
The
Company’s businesses are subject to regulation by U.S. federal and state laws
and foreign laws, regulations and policies. Changes to laws or regulations may
require the Company to modify its business objectives if existing practices
become more restricted, subject to escalating costs or prohibited outright.
Particular risks include regulatory risks arising from federal laws, such as
laws regarding export of sensitive technologies or technical
information. The Company’s business and the industries in which it
operates are also at times being reviewed or investigated by regulators, which
could lead to enforcement actions, fines and penalties or the assertion of
private litigation claims and damages.
ITEM
1B. UNRESOLVED STAFF
COMMENTS.
None.
ITEM
2. PROPERTIES.
The
Company is headquartered in a facility in Eldersburg, Maryland (approximately
36,000 square feet). The lease for this facility expires on June 30,
2018.
In
addition, the Company leases office space domestically in St. Marys and Augusta,
Georgia and Tarrytown, New York and internationally in Beijing, China and
Nyköping, Sweden. The Company leases these facilities for terms
ending between 2010 and 2012.
ITEM
3. LEGAL
PROCEEDINGS.
The
Company and its subsidiaries are from time to time involved in ordinary routine
litigation incidental to the conduct of its business. The Company and its
subsidiaries are not a party to, and its property is not the subject of, any
material pending legal proceedings that, in the opinion of management, are
likely to have a material adverse effect on the Company’s business, financial
condition or results of operations.
ITEM
4. SUBMISSION OF MATTERS TO A
VOTE OF SECURITY HOLDERS.
No matter
was submitted to a vote of security holders during the quarter ended December
31, 2009.
24
PART
II
ITEM
5. MARKET FOR REGISTRANT'S
COMMON EQUITY, RELATED STOCKHOLDER MATTERS, AND ISSUER PURCHASES OF EQUITY
SECURITIES.
The Company’s common stock is
listed on the NYSE Amex Stock Exchange, where it trades under the symbol
“GVP”. The following table sets forth, for the periods indicated, the
high and low sale prices for the Company’s common stock reported by the NYSE
Amex Stock Exchange for each full quarterly period within the two most recent
fiscal years:
|
2009
|
||||
| Quarter | High | Low | ||
| First | $ 6.88 | $ 4.67 | ||
| Second | $ 6.75 | $ 4.96 | ||
| Third | $ 8.09 | $ 5.85 | ||
| Fourth | $ 6.28 | $ 4.35 | ||
| 2008 | ||||
| Quarter | High | Low | ||
| First | $ 10.75 | $ 7.66 | ||
| Second | $ 9.22 | $ 7.08 | ||
| Third | $ 9.20 | $ 6.90 | ||
| Fourth | $ 6.99 | $ 4.71 | ||
25
The
following table sets forth the equity compensation plan information for the year
ended December 31, 2009:
| Number of Securities | |||
| Number of Securities to | Weighted Average | Remaining Available for | |
| be Issued Upon Exercise | Exercise Price of | Future Issuance Under Equity | |
| of Outstanding Options, | Outstanding Options, | Compensation Plans (Excluding | |
| Warrants and Rights | Warrants and Rights | Securities Reflected in Column (a) | |
| Plan category | (a) | (b) | (c) |
| Equity compensation plans approved by security holders | 1,758,902 | $4.44 | 463,603 |
| Equity compensation plans not approved by security holders | -- | $ -- | -- |
| Total | 1,758,902 | $4.44 | 463,603 |
There
were approximately 70 holders of record of the common stock as of December 31,
2009. The Company has never declared or paid a cash dividend on its common
stock. The Company currently intends to retain future earnings to
finance the growth and development of its business and, therefore, does not
anticipate paying any cash dividends in the foreseeable future on its common
stock.
At a
special shareholder’s meeting on December 13, 2007, the Company’s shareholders
approved an amendment to the Certificate of Incorporation increasing GSE’s
authorized common stock by 12 million shares to a total of 30 million
shares.
The
Company believes factors such as quarterly fluctuations in results of operations
and announcements of new products by the Company or by its competitors may cause
the market price of the common stock to fluctuate, perhaps
significantly. In addition, in recent years the stock market in
general, and the shares of technology companies in particular, have experienced
extreme price fluctuations. The Company’s common stock has also
experienced a relatively low trading volume, making it further susceptible to
extreme price fluctuations. These factors may adversely affect the
market price of the Company's common stock.
On June
22, 2007, the Company raised $9.2 million, net of associated fees of $768,000,
through the sale of 1,666,667 shares (the “Shares”) of its common stock, $.01
par value per share, by means of a private placement to selected institutional
investors. Each investor received a five-year warrant to purchase GSE
common stock (the “Warrant Shares”) equal to 10% of the shares of common stock
that each investor purchased at an exercise price of $6.00 per share (the
“Warrants”). In aggregate, the Company issued Warrants to purchase a
total of 166,667 shares of GSE common stock.
26
The
Company filed its registration statement on Form S-3 with the Securities and
Exchange Commission (the “Commission”) on July 16, 2007 covering the offer and
sale, from time to time, of the Shares, the Warrant Shares and shares of common
stock issuable upon exercise of warrants that may be issued as liquidated
damages under the terms of a certain registration rights agreement entered into
between the Company and the investors (the “Registration Rights Agreement”) in
connection with the private placement. The Registration Statement
became effective on August 8, 2007 and, pursuant to the provisions of the
Registration Rights Agreement, the Company is obligated to use commercially
reasonable efforts to, after the date on which the Registration Statement
becomes effective, cause the Registration Statement to remain continuously
effective as to all Shares and Warrant Shares, other than for an aggregate of
more than 30 consecutive trading days or for more than an aggregate of 60
trading days in any 12-month period. In the event of a default of the foregoing
obligation, the Company will be required to issue to the investors, as
liquidated damages, on the date the foregoing default occurs and each monthly
anniversary thereafter, a number of warrants (on the same terms as the Warrants)
equal to 2% of the number of Shares then held by such investor, not to exceed
10% of the total number of Shares then held by such investor, and thereafter
cash, in an amount equal to 2% of the aggregate purchase price paid by the
investors, not to exceed 30% of the aggregate purchase price paid by the
investors.
At the
date of issuance, the fair value of the Warrants was $510,000 and the fair value
of the Shares was $9.5 million. The fair value of the Warrants
and the Shares was determined by the use of the relative fair value method, in
which the $10.0 million gross proceeds was allocated based upon the fair values
of the Warrants, as determined by using the Black-Scholes Model, and the Shares,
as determined by the closing price of the common stock on the American Stock
Exchange on the date the transaction was closed.
The
Company paid the placement agent for the Shares and Warrants 6% of the gross
proceeds received by the Company from the offering ($600,000). In
addition to the placement agent fee, the Company paid $168,000 of other
transaction fees related to the offering.
The
proceeds were used to pay down the Company’s line of credit and for other
working capital purposes.
On
September 4, 2009, the Company raised $15.0 million through the sale of 2.5
million shares of its common stock, $.01 par value per share. The
shares were sold under a shelf registration statement which was declared
effective by the Securities and Exchange Commission on August 21,
2009. On September 23, 2009, the Company raised an additional
$2,250,000 when the Company’s underwriter, exercised an over-allotment option in
full to purchase an additional 375,000 shares of the Company’s common stock at
the public offering price of $6.00 per share. The aggregate net
proceeds received by the Company from the two transactions were approximately
$15.9 million. The Company paid the underwriter a fee in the amount
of 6% of the gross proceeds received by the Company from the offering
($1,035,000) and paid $339,000 in other transaction fees.
The
following graph compares the Company’s cumulative total shareholder return since
January 1, 2005 through December 31, 2009 with that of the American Stock
Exchange- US & Foreign Index and a peer group index. The Peer
Group consists of companies selected on a line-of-business basis and includes
Aspen Technology, Inc., L-3 Communications Holdings and Honeywell
International. The graph assumes an initial investment of $100 on
January 1, 2005 in the Company’s common stock and each index. There
were no dividends declared or paid by the Company during the five year
period. The Company has never paid a dividend on its common
stock. The indices are re-weighted daily, using the market
capitalization on the previous tracking day. The comparisons shown in
the graph below are based upon historical data. The stock price
performance shown in the graph below is not necessarily indicative of, or
intended to forecast, the potential future performance of the Company’s common
stock. The graph was prepared for the Company by Research Data Group,
Inc.
27
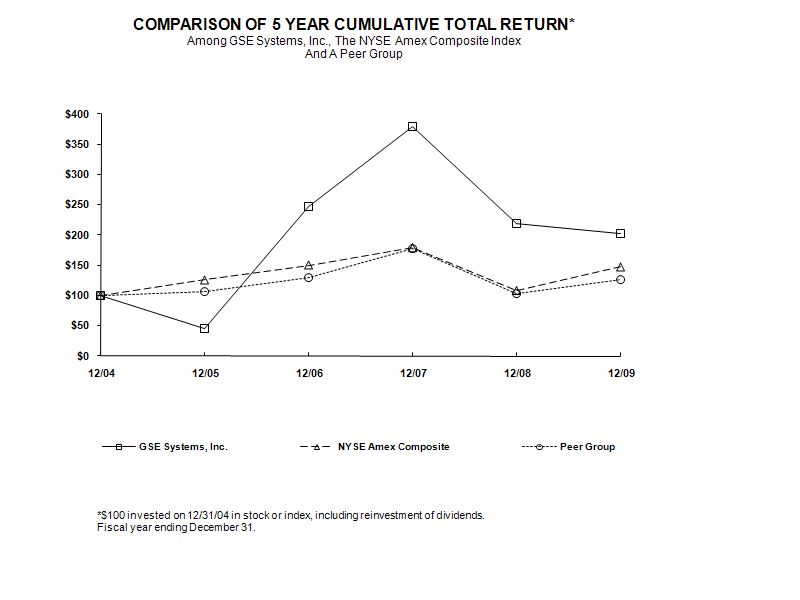
|
12/31/2004
|
12/31/2005
|
12/31/2006
|
12/31/2007
|
12/31/2008
|
12/31/2009
|
|
|
GSE
Systems, Inc.
|
100.00
|
45.93
|
246.33
|
379.26
|
218.52
|
202.96
|
|
Peer
Group Index
|
100.00
|
125.80
|
150.40
|
178.95
|
108.56
|
147.27
|
|
Amex
Market Index
|
100.00
|
106.50
|
129.30
|
177.26
|
102.71
|
126.22
|
Sales
of Unregistered Securities
The
Company’s sales of unregistered securities during the past three years are
described in Item 5 above.
28
ITEM
6. SELECTED FINANCIAL
DATA.
Historical
consolidated results of operations and balance sheet data presented below have
been derived from the historical financial statements of the
Company. This information should be read in connection with the
Company’s consolidated financial statements.
|
(in
thousands, except per share data)
|
Years
ended December 31,
|
|||||||||||
|
2009
|
2008
|
2007
|
2006
|
2005
|
||||||||
|
Consolidated
Statements of Operations:
|
||||||||||||
|
Contract
revenue
|
$ 40,060
|
$ 29,004
|
$ 31,900
|
$ 27,502
|
$ 21,950
|
|||||||
|
Cost
of revenue
|
29,736
|
21,187
|
22,217
|
19,602
|
18,603
|
|||||||
|
Gross
profit
|
10,324
|
7,817
|
9,683
|
7,900
|
3,347
|
|||||||
|
Operating
expenses:
|
||||||||||||
|
Selling,
general and administrative
|
7,749
|
7,383
|
7,214
|
4,929
|
6,958
|
|||||||
|
ESA
related charges
|
1,508
|
-
|
-
|
-
|
-
|
|||||||
|
Administrative
charges from GP Strategies
|
-
|
-
|
-
|
685
|
685
|
|||||||
|
Depreciation
|
504
|
446
|
258
|
186
|
431
|
|||||||
|
Total
operating expenses
|
9,761
|
7,829
|
7,472
|
5,800
|
8,074
|
|||||||
|
Operating
income (loss)
|
563
|
(12)
|
2,211
|
2,100
|
(4,727)
|
|||||||
|
Interest
income (expense), net
|
56
|
130
|
(433)
|
(764)
|
(416)
|
|||||||
|
ESA
related charges
|
(865)
|
-
|
-
|
-
|
-
|
|||||||
|
Loss
on extinguishment of debt
|
-
|
-
|
-
|
(1,428)
|
-
|
|||||||
|
Gain
(loss) on derivative instruments
|
763
|
(453)
|
(11)
|
(24)
|
(170)
|
|||||||
|
Other
income (expense), net
|
(397)
|
(226)
|
(555)
|
(81)
|
667
|
|||||||
|
Income
(loss) before income taxes
|
120
|
(561)
|
1,212
|
(197)
|
(4,646)
|
|||||||
|
Provision
for income taxes
|
917
|
129
|
43
|
149
|
149
|
|||||||
|
Net
income (loss)
|
$ (797)
|
$ (690)
|
$ 1,169
|
$ (346)
|
$ (4,795)
|
|||||||
|
Basic
income (loss) per common share (1)
|
$ (0.05)
|
$ (0.04)
|
$ 0.09
|
$ (0.07)
|
$ (0.53)
|
|||||||
|
Diluted
income (loss) per common share (1)
|
$ (0.05)
|
$ (0.04)
|
$ 0.08
|
$ (0.07)
|
$ (0.53)
|
|||||||
|
Weighted
average common shares outstanding:
|
||||||||||||
|
-Basic
|
16,938
|
15,747
|
12,927
|
9,539
|
8,999
|
|||||||
|
-Diluted
|
16,938
|
15,747
|
14,818
|
9,539
|
8,999
|
|||||||
|
As
of December 31,
|
||||||||||||
|
2009
|
2008
|
2007
|
2006
|
2005
|
||||||||
|
Balance
Sheet data:
|
||||||||||||
|
Working
capital (deficit)
|
$ 31,469
|
$ 13,888
|
$ 14,711
|
$ 1,463
|
$ (925)
|
|||||||
|
Total
assets
|
49,520
|
31,015
|
28,364
|
18,448
|
11,982
|
|||||||
|
Long-term
liabilities
|
206
|
906
|
695
|
251
|
1,567
|
|||||||
|
Stockholders'
equity
|
37,143
|
20,700
|
20,365
|
7,361
|
897
|
|||||||
|
(1) In
2006, $279,000 preferred stock dividends were added to net loss to arrive
at net loss attributed to common shareholders.
|
||||||||||||
|
In
2007, $49,000 preferred stock dividends were deducted from net income to
arrive at net income attributed to common
shareholders.
|
||||||||||||
29
ITEM
7. MANAGEMENT'S DISCUSSION AND
ANALYSIS OF FINANCIAL CONDITION AND RESULTS OF OPERATIONS.
On September 4, 2009, the Company
raised $15.0 million through the sale of 2.5 million shares of its common stock,
$.01 par value per share. The shares were sold under a shelf
registration statement which was declared effective by the Securities and
Exchange Commission on August 21, 2009. On September 23, 2009, the
Company raised an additional $2,250,000 when the Company’s underwriter exercised
an over-allotment option in full to purchase an additional 375,000 shares of the
Company’s common stock at the public offering price of $6.00 per
share. The aggregate net proceeds received by the Company from the
two transactions was approximately $15.9 million. The Company paid
the underwriter a fee in the amount of 6% of the gross proceeds received by the
Company from the offering ($1,035,000) and paid $339,000 in other transaction
fees. The Company intends to use the net proceeds for general working
capital purposes and to fund acquisitions and other strategic
opportunities.
GSE is a
10% owner of the Emirates Simulation Academy, LLC in the United Arab
Emirates. Although ESA was formed in late 2005, it had its
grand opening on January 14, 2009 and signed its first customer training
contract on the same day. Despite ESA’s promotional efforts, 2009
revenue totaled only AED 209,000 ($57,000), and they incurred a net loss of AED
22.6 million ($6.1 million). Per ESA’s latest financial projections,
ESA would not become profitable until 2016 and would not become cash positive
until 2017.
At
December 31, 2009, ESA had borrowed a total of AED 36.4 million ($9.9 million)
from its credit facility with Union National Bank, including accrued interest
payable. ESA was delinquent in paying both principal and interest (a
total of AED 5.3 million or $1.5 million) and in January 2010, UNB drew upon the
guarantees of the three partners to pay off the delinquency, withdrawing
$145,000 from GSE’s restricted cash account. In February 2010, GSE
was notified that ESA had missed another loan payment and that 10% of the amount
due ($24,000) would be withdrawn from the Company’s restricted cash
account.
At a
meeting of ESA’s three shareholders held at ESA on February 17, 2010, the
shareholders reached agreement to siginificantly reduce costs and begin to
explore options up to and including the selling of ESA.
Accordingly,
based upon these events, the Company has determined that its remaining
investment in ESA has been impaired and has established reserves for the trade
receivable due from ESA at December 31, 2009 and the cash that GSE
has on deposit with UNB as a partial guarantee for ESA’s credit
facility. Partially offsetting these charges is the reversal of the
remaining deferred profit related to the Company’s sale of five simulators to
ESA in prior years and the remaining agent fee that was due upon payment of the
final outstanding receivable. The charges recorded and the
presentation in the statement of operations for the year ended December 31, 2009
are as follows:
30
|
Year
ended
|
|||
|
(in
thousands)
|
December
31, 2009
|
||
|
Trade
receivable
|
$ 1,604
|
||
|
Accrued
agent fee
|
(96)
|
||
|
Operating
expense
|
1,508
|
||
|
Restricted
cash- bank guarantee and
|
|||
|
accrued
interest income
|
1,291
|
||
|
Investment
in ESA
|
117
|
||
|
Deferred
profit
|
(543)
|
||
|
Other
expense, net
|
865
|
||
|
Total
|
$ 2,373
|
||
Critical
Accounting Policies and Estimates.
As
further discussed in Note 2 to the consolidated financial statements, in
preparing the Company’s financial statements, management makes several estimates
and assumptions that affect the Company’s reported amounts of assets,
liabilities, revenues and expenses. Those accounting estimates that
have the most significant impact on the Company’s operating results and place
the most significant demands on management's judgment are discussed below. For
all of these policies, management cautions that future events rarely develop
exactly as forecast, and the best estimates may require adjustment.
Revenue Recognition on Long-Term
Contracts. The
majority of the Company’s revenue is derived through the sale of uniquely
designed systems containing hardware, software and other materials under
fixed-price contracts. In accordance with U.S. generally accepted
accounting principles, the revenue under these fixed-price contracts is
accounted for on the percentage-of-completion method. This methodology
recognizes revenue and earnings as work progresses on the
contract and is based on an estimate of the revenue and earnings earned to date,
less amounts recognized in prior periods. The Company bases its
estimate of the degree of completion of the contract by reviewing the
relationship of costs incurred to date to the expected total costs that will be
incurred on the project. Estimated contract earnings are reviewed and revised
periodically as the work progresses, and the cumulative effect of any change in
estimate is recognized in the period in which the change is identified.
Estimated losses are charged against earnings in the period such losses are
identified. The Company recognizes revenue arising from contract
claims either as income or as an offset against a potential loss only when the
amount of the claim can be estimated reliably and realization is probable and
there is a legal basis of the claim. There were no probable claims outstanding
as of December 31, 2009.
Uncertainties
inherent in the performance of contracts include labor availability and
productivity, material costs, change order scope and pricing, software
modification and customer acceptance issues. The reliability of these cost
estimates is critical to the Company’s revenue recognition as a significant
change in the estimates can cause the Company’s revenue and related margins to
change significantly from the amounts estimated in the early stages of the
project.
31
As the
Company recognizes revenue under the percentage-of-completion method, it
provides an accrual for estimated future warranty costs based on historical and
projected claims experience. The Company’s long-term contracts
generally provide for a one-year warranty on parts, labor and any bug fixes as
it relates to software embedded in the systems.
The
Company’s system design contracts do not normally provide for “post customer
support service” (PCS) in terms of software upgrades, software enhancements or
telephone support. In order to obtain PCS, the customers normally
must purchase a separate contract. Such PCS arrangements are
generally for a one-year period renewable annually and include customer support,
unspecified software upgrades, and maintenance releases. The Company
recognizes revenue from these contracts ratably over the life of the
agreements.
Revenue
from the sale of software licenses which do not require significant
modifications or customization for the Company’s modeling tools are recognized
when the license agreement is signed, the license fee is fixed and determinable,
delivery has occurred, and collection is considered probable.
Revenue
for contracts with multiple elements is recognized in accordance with ASC
605-25 Revenue Recognition-
Multiple Element Arrangements.
Revenue
from certain consulting or training contracts is recognized on a
time-and-material basis. For time-and-material type contracts,
revenue is recognized based on hours incurred at a contracted labor rate plus
expenses.
Capitalization of Computer Software
Development Costs. In accordance with U.S. generally accepted
accounting principles, the Company capitalizes computer software development
costs incurred after technological feasibility has been established, but prior
to the release of the software product for sale to
customers. Once the product is available to be sold, the
Company amortizes the costs, on a straight line method, over the three year
estimated useful life of the product. As of December 31, 2009, the
Company has net capitalized software development costs of $1.9
million. On an annual basis, and more frequently as conditions
indicate, the Company assesses the recovery of the unamortized software computer
costs by estimating the net undiscounted cash flows expected to be generated by
the sale of the product. If the undiscounted cash flows are not sufficient to
recover the unamortized software costs the Company will write-down the
investment to its estimated fair value based on future discounted cash flows.
The excess of any unamortized computer software costs over the related net
realizable value is written down and charged to
operations. Significant changes in the sales projections could result
in impairment with respect to the capitalized software that is reported on the
Company’s consolidated balance sheet.
Deferred Income Tax Valuation
Allowance. Deferred income taxes arise from temporary
differences between the tax bases of assets and liabilities and their reported
amounts in the financial statements. Management makes a regular assessment of
the realizability of the Company’s deferred tax assets. In making
this assessment, management considers whether it is more likely than not that
some or all of the deferred tax assets will not be realized. The
ultimate realization of deferred tax assets is dependent upon the generation of
future taxable income during the periods in which those temporary differences
become deductible. Management considers the scheduled reversal of
deferred tax liabilities and projected future taxable income of the Company in
making this assessment. A valuation allowance is recorded to reduce
the total deferred income tax asset to its realizable value. As of
December 31, 2009, the Company’s largest deferred tax asset related to a U.S.
net operating loss carryforward of $15.4 million which expires in various
amounts between 2017 and 2028. The amount of U.S. loss carryforward which can be
used by the Company each year is limited due to changes in the Company’s
ownership which occurred in 2003. Thus, a portion of the Company’s
loss carryforward may expire unutilized. We believe that the Company will
achieve profitable operations in future years that will enable the Company to
recover the benefit of its net deferred tax assets. However, other
than a portion of the net deferred tax assets that are related to the Company’s
Swedish subsidiary, the recovery of the net deferred tax assets could not be
substantiated by currently available objective evidence. Accordingly,
the Company has established an $8.4 million valuation allowance for its net
deferred tax assets.
32
Results of Operations.
The
following table sets forth the results of operations for the periods presented
expressed in thousands of dollars and as a percentage of contract
revenue.
|
($
in thousands)
|
Years
ended December 31,
|
|||||||||||
|
2009
|
%
|
2008
|
%
|
2007
|
%
|
|||||||
|
Contract
revenue
|
$
40,060
|
100.0
%
|
$
29,004
|
100.0
%
|
$ 31,900
|
100.0
%
|
||||||
|
Cost
of revenue
|
29,736
|
74.2
%
|
21,187
|
73.1
%
|
22,217
|
69.6
%
|
||||||
|
Gross
profit
|
10,324
|
25.8
%
|
7,817
|
26.9
%
|
9,683
|
30.4
%
|
||||||
|
Operating
expenses:
|
||||||||||||
|
Selling,
general and administrative
|
7,749
|
19.3
%
|
7,383
|
25.4
%
|
7,214
|
22.6
%
|
||||||
|
ESA
related charges
|
1,508
|
3.8
%
|
-
|
0.0
%
|
-
|
0.0
%
|
||||||
|
Depreciation
|
504
|
1.3
%
|
446
|
1.5
%
|
258
|
0.8
%
|
||||||
|
Total
operating expenses
|
9,761
|
24.4
%
|
7,829
|
26.9
%
|
7,472
|
23.4
%
|
||||||
|
Operating
income (loss)
|
563
|
1.4
%
|
(12)
|
(0.0)%
|
2,211
|
7.0
%
|
||||||
|
Interest
income (expense), net
|
56
|
0.1
%
|
130
|
0.4
%
|
(433)
|
(1.4)%
|
||||||
|
ESA
related charges
|
(865)
|
(2.2)%
|
-
|
0.0
%
|
-
|
0.0
%
|
||||||
|
Gain
(loss) on derivative instruments
|
763
|
1.9
%
|
(453)
|
(1.6)%
|
(11)
|
(0.0)%
|
||||||
|
Other
expense, net
|
(397)
|
(0.9)%
|
(226)
|
(0.8)%
|
(555)
|
(1.8)%
|
||||||
|
Income
(loss) before income taxes
|
120
|
0.3
%
|
(561)
|
(2.0)%
|
1,212
|
3.8
%
|
||||||
|
Provision
for income taxes
|
917
|
2.3
%
|
129
|
0.4
%
|
43
|
0.1
%
|
||||||
|
Net
income (loss)
|
$ (797)
|
(2.0)%
|
$ (690)
|
(2.4)%
|
$ 1,169
|
3.7
%
|
||||||
Comparison
of the Years Ended December 31, 2009 to December 31, 2008.
Contract
Revenue. Contract revenue for the year ended December 31, 2009
totaled $40.1 million, which was 38.1% higher than the $29.0 million total
revenue for the year ended December 31, 2008. The Company recorded total orders
of $54.4 million in the year ended December 31, 2009 versus $44.0 million in the
year ended December 31, 2008. Included in the 2009 orders was an
$18.4 million contract to build a new nuclear power plant simulator for a two
unit reactor plant in Slovakia. The contract includes approximately
$12.0 million for hardware, the largest portion being a distributed control
system from Siemens, that the customer requested be a part of the contract in
addition to approximately $6.0 million related specifically to the
simulator. Due to the significant hardware portion of the project,
the overall margin on the project is lower than the Company’s normal gross
margin. In the year ended December 31, 2009, the Company recognized
$5.4 million of contract revenue on this project using the
percentage-of-completion method, which accounted for 13.5% of the Company’s
consolidated revenue. At December 31, 2009, the Company’s backlog was
$53.9 million, of which $13.0 million related to this
contract. The Company’s backlog increased 41.5% from December
31, 2008 when the Company’s backlog totaled $38.1 million.
33
Gross
Profit. Gross profit totaled $10.3 million for the year ended
December 31, 2009 versus $7.8 million for the year ended December 31,
2008. As a percentage of revenue, gross profit decreased from 26.9%
for the twelve months ended December 31, 2008 to 25.8% for the twelve months
ended December, 31 2009. The decrease in gross margin
mainly reflects the impact of the lower margin on the $18.4 million full scope
simulator and digital control system order received in the first quarter 2009
from a Slovak utility.
Selling, General and Administrative
Expenses. Selling, general and administrative (“SG&A”)
expenses totaled $7.7 million and $7.4 million for the years ended December 31,
2009 and 2008, respectively. Fluctuations in the components of
SG&A spending were as follows:
|
¨
|
Business
development and marketing costs increased from $2.9 million for the year
ended December 31, 2008 to $3.1 million in the year ended December 31,
2009. The spending increase mainly reflects a $352,000 increase
of bidding and proposal costs, which are the costs of operations personnel
in assisting with the preparation of contract proposals and a $104,000
increase in business development labor and benefit costs. In
2009 the Company hired business development managers for both its process
simulation business and its education and training
business. These increases were partially offset by
a $137,000 decrease in business development travel expenses. In addition,
the Company did not have a Simworld user’s conference in 2009, but spent
approximately $75,000 in 2008 for its bi-annual Simworld
conference in Beijing, China.
|
|
¨
|
The
Company’s general and administrative expenses were virtually unchanged at
$4.2 million for the year ended December 31, 2009 and $4.2 million for the
year ended December 31, 2008.
|
|
¨
|
Gross
spending on software product development (“development”) totaled $1.3
million in the year ended December 31, 2009 as compared to $907,000 for
the same period in 2008. For the year ended December 31, 2009,
the Company expensed $425,000 and capitalized $861,000 of its development
spending and expensed $316,000 and capitalized $591,000 of its development
spending in the year ended December 31, 2008. The Company’s
capitalized development expenditures in 2009 were mainly related to the
customization of RELAP5-RT software (which simulates transient fluid
dynamics, neutronics and heat transfer in nuclear power plants) to run on
the Company’s real-time executive software; the replacement of the current
Graphic User Interface of SimSuite Pro with JADE Designer; the development
of generic simulation models for three oil and gas refining processes:
continuous catalytic reformer, hydrotreater, and amine treatment; and a
generic combined cycle gas turbine simulator. The Company
anticipates that its total gross development spending in 2010 will
approximate $900,000.
|
ESA related
charges. GSE is a 10% owner of the Emirates Simulation Academy
LLC in the United Arab Emirates. Although ESA was formed in
late 2005, it had its grand opening on January 14, 2009 and signed its first
customer training contract on the same day. Despite ESA’s promotional
efforts, 2009 revenue totaled only AED 209,000 ($57,000), and they incurred a
net loss of AED 22.6 million ($6.1 million). Per ESA’s latest
financial projections, ESA would not become profitable until 2016 and would not
become cash positive until 2017.
At
December 31, 2009, ESA had borrowed a total of AED 36.4 million ($9.9 million)
from its credit facility with Union National Bank, including accrued interest
payable. ESA was delinquent in paying both principal and interest (a
total of AED 5.3 million or $1.5 million) and in January 2010, UNB drew upon the
guarantees of the three partners to pay off the delinquency, withdrawing
$145,000 from GSE’s restricted cash account. In February 2010, GSE
was notified that ESA had missed another loan payment and that 10% of the amount
due ($24,000) would be withdrawn from the Company’s restricted cash
account.
34
At a
meeting of ESA’s three shareholders held at ESA on February 17, 2010, the
shareholders reached agreement to siginificantly reduce costs and begin to
explore options up to and including the selling of ESA.
Accordingly,
based upon these events, the Company has determined that its remaining
investment in ESA has been impaired and has established reserves for the trade
receivable due from ESA at December 31, 2009 and the cash that GSE has on
deposit with UNB as a partial guarantee for ESA’s credit
facility. Partially offsetting these charges is the reversal of the
remaining deferred profit related to the Company’s sale of five simulators to
ESA in prior years and the remaining agent fee that was due upon payment of the
final outstanding receivable. The charges recorded and the
presentation in the statement of operations for the year ended December 31, 2009
are as follows:
|
Year
ended
|
|||
|
(in
thousands)
|
December
31, 2009
|
||
|
Trade
receivable
|
$ 1,604
|
||
|
Accrued
agent fee
|
(96)
|
||
|
Operating
expense
|
1,508
|
||
|
Restricted
cash-bank guarantee and
|
|||
|
accrued
interest income
|
1,291
|
||
|
Investment
in ESA
|
117
|
||
|
Deferred
profit
|
(543)
|
||
|
Other
expense, net
|
865
|
||
|
Total
|
$ 2,373
|
||
Depreciation. Depreciation expense totaled $504,000 and $446,000 for the years ended December 31, 2009 and 2008, respectively. The higher 2009 depreciation expense is a result of the Company’s 2008 capital purchases related to the Company’s move to its Sykesville, Maryland headquarters in 2008 and the purchase of new computers for new hires.
Operating Income
(Loss). The Company had operating income of $563,000 (1.4% of
revenue) in the year ended December 31, 2009, as compared with operating loss of
$12,000 (0.0% of revenue) for the year ended December 31, 2008. The
variances were due to the factors outlined above.
Interest Income (Expense),
Net. The Company’s interest income, net totaled $56,000 and
$130,000 for the years ended December 31, 2009 and 2008,
respectively.
On March 28, 2008, the Company entered
into two separate revolving line of credit agreements for two-year revolving
lines of credit with Bank of America (“BOA”), replacing the Company’s credit
facility with Laurus Master Fund. One line of credit is in the
principal amount of up to $3.5 million and is guaranteed by the U.S.
Export-Import Bank. The second line of credit was originally in the
principal amount of up to $1.5 million, however, on May 5, 2009, the credit
agreement was amended to increase the principal amount to $2.5
million. The Company has not borrowed any funds against either BOA
line of credit. However, at December 31, 2009, $2.4 million of the
credit facility was utilized as collateral for three standby letters of
credit.
35
The
deferred financing costs incurred in conjunction with the Laurus Master Fund
line of credit were amortized over the two-year period of the line of credit,
with the final amortization expense recorded in February
2008. Amortization expense totaled $89,000 in the year ended December
31, 2008. The deferred financing costs incurred in conjunction with
the BOA lines of credit are being amortized over the two-year period of the
lines of credit. Amortization began in April 2008 and totaled $46,000
and $53,000 for the years ended December 31, 2009 and 2008,
respectively.
Interest
income earned on short-term investments of the Company’s operating cash totaled
$4,000 for the year ended December 31, 2009 versus $67,000 in the year ended
December 31, 2008. The lower interest income in 2009 mainly reflects
the termination of the Company’s commercial automated investment account with
BOA in the second quarter of 2009.
At
December 31, 2009 and 2008, the Company had approximately $336,000 and $2.9
million, respectively, of cash in Certificates of Deposit with BOA that were
being used as collateral for various performance bonds. At December
31, 2009, the Company also had a $600,000 Certificate of Deposit which was
issued as additional collateral for one of the BOA lines of
credit. The Company earned approximately $61,000 and $132,000 in
interest income on the Certificates of Deposit in the years ended December 31,
2009 and 2008, respectively.
In May
2007, the Company deposited $1.2 million into a restricted, interest-bearing
account at the Union National Bank in the United Arab Emirates as a partial
guarantee for the $11.8 million credit facility that UNB has extended to
ESA. GSE recorded approximately $26,000 and $48,000 interest income
in the years ended December 31, 2009 and 2008, respectively. The reduction in
interest income reflects lower interest rates in 2009.
The
Company had other interest income in the year ended December 31, 2009 of $11,000
and $25,000 in the year ended December 31, 2008.
Gain (Loss) on Derivative
Instruments. The Company periodically enters into forward
foreign exchange contracts to manage market risks associated with the
fluctuations in foreign currency exchange rates on foreign-denominated trade
receivables. As of December 31, 2009, the Company had foreign
exchange contracts for sale of approximately 2 million Pounds Sterling, 3
million Euro, and 759 million Japanese Yen at fixed rates. The contracts expire
on various dates through February 2014. The Company had not
designated the contracts as hedges and has recognized a gain on the change in
the estimated fair value of the contracts of $851,000 for the twelve months
ended December 31, 2009.
At
December 31, 2008, the Company had foreign exchange contracts for sale of
approximately 2 million Pounds Sterling, 4 million Euro, and 68 million Japanese
Yen at fixed rates. The contracts expire on various dates through February
2014. The Company had not designated the contracts as hedges and had
recognized a loss on the change in the estimated fair value of the contracts of
$174,000 for the twelve months ended December 31, 2008.
The
estimated fair value of the contracts at December 31, 2009 and 2008 was a net
asset of $812,000 and a net liability of $58,000, respectively, and were
recorded on the balance sheets as follows:
36
|
December
31,
|
||||||||
|
(in
thousands)
|
2009
|
2008
|
||||||
|
Asset
derivatives
|
||||||||
|
Prepaid
expenses and other current assets
|
$ | 515 | $ | 14 | ||||
|
Other
assets
|
396 | 537 | ||||||
| 911 | 551 | |||||||
|
Liability
derivatives
|
||||||||
|
Other
current liabilities
|
(34 | ) | (426 | ) | ||||
|
Other
liabilities
|
(65 | ) | (183 | ) | ||||
| (99 | ) | (609 | ) | |||||
|
Net
fair value
|
$ | 812 | $ | (58 | ) | |||
The foreign currency denominated trade receivables and unbilled receivables that are related to the outstanding foreign exchange contracts at December 31, 2009 are remeasured at the end of each period into the functional currency using the current exchange rate at the end of the period. For the years ended December 31, 2009 and 2008, the Company incurred an $88,000 loss and $279,000 loss, respectively, from the remeasurement of such trade and unbilled receivables.
Other Expense,
Net. For the years ended December 31, 2009 and 2008, other
expense, net was $397,000 and $226,000, respectively. The major
components of other expense, net include the following items:
The
Company accounts for its investment in ESA using the equity
method. In accordance with the equity method, the Company eliminated
10% of the profit from this contract as the training simulators are assets that
have been recorded on the books of ESA, and the Company was thus required to
eliminate its proportionate share of the profit included in the asset
value. The profit elimination totaled $28,000 for the year ended
December 31, 2008. ESA began to amortize the training simulators
effective January 1, 2009 over a four year life; accordingly, GSE began to
amortize the deferred profit in January 2009 and recognized income of $181,000
for the year ended December 31, 2009. However, in conjunction
with the Company’s determination that its investment in ESA was impaired as of
December 31, 2009, GSE wrote off the balance of the deferred profit, recognizing
additional income of $543,000. See the discussion above in ESA related
charges.
For the
years ended December 31, 2009 and 2008, the Company recognized a $615,000 and
$213,000 equity loss, respectively, on its investment in
ESA. However, in conjunction with the Company’s determination that
its investment in ESA was impaired as of December 31, 2009, it wrote off the
balance of its investment in ESA, recognizing an additional equity loss of
$117,000. See the discussion above in ESA related
charges.
The
Company had other miscellaneous income in the years ended December 31, 2009 and
2008 of $37,000 and of $15,000, respectively.
Provision for
Income Taxes.
The
Company files in the United States federal jurisdiction and in several state and
foreign jurisdictions. Because of the net operating loss carryforwards, the
Company is subject to U.S. federal and state income tax examinations from years
1997 and forward and is subject to foreign tax examinations by tax authorities
for years 2004 and forward. Open tax years related to state and
foreign jurisdictions remain subject to examination but are not considered
material to our financial position, results of operations or cash
flows.
37
As of
December 31, 2009, there have been no material changes to the liability for
uncertain tax positions. Furthermore, the Company is not aware of any tax
positions for which it is reasonably possible that the total amounts of
unrecognized tax benefits would significantly decrease or increase within the
next twelve months.
The
Company’s tax provision in 2009 was $917,000 and consisted of $29,000 U.S.
federal income taxes, $80,000 state income taxes, $239,000 foreign income tax
withholding on several non-U.S. contracts, and $569,000 foreign income taxes
incurred by the Company’s foreign subsidiaries.
The
Company’s tax provision in 2008 was $129,000 and consisted of $10,000 state
income taxes, $226,000 foreign income tax withholding on several non-U.S.
contracts, and $19,000 foreign income taxes incurred by the Company’s foreign
subsidiaries. The income tax expense was partially offset by a
$126,000 credit from the reduction of the valuation allowance against the net
deferred tax assets of the Company’s Swedish subsidiary.
The
Company has a full valuation allowance on its U.S. net deferred tax assets at
December 31, 2009.
Comparison
of the Years Ended December 31, 2008 to December 31, 2007.
Contract
Revenue. Contract revenue for the year ended December 31, 2008
totaled $29.0 million, which was 9.1% lower than the $31.9 million total revenue
for the year ended December 31, 2007. The decrease mainly reflected
the completion of the $16.9 million ESA contract in 2008. For the
years ended December 31, 2008 and 2007, the Company recognized $1.2 million and
$9.9 million, respectively of contract revenue on the ESA project, which
accounted for 4.2% and 31.2%, respectively, of the Company’s consolidated
revenue. The decrease in revenue from the ESA project was partially
offset by an increase in the Company’s fossil fueled power simulation revenue,
which totaled $9.2 million in the year ended December 31, 2008 versus $6.5
million in the year ended December 31, 2007. In the year ended
December 31, 2008, the Company recorded total orders of $44.0 million versus
$37.8 million in the year ended December 31, 2007. At December
31, 2008, the Company’s backlog was $38.1 million, a 54.9% increase from the
Company’s backlog at December 31, 2007.
Gross
Profit. Gross profit totaled $7.8 million for the year ended
December 31, 2008 versus $9.7 million for the year ended December 31,
2007. As a percentage of revenue, gross profit decreased from 30.4%
for the twelve months ended December 31, 2007 to 26.9% for the twelve months
ended December, 31 2008. The decrease in gross margin
reflects the lower revenue generated by the Company’s higher margined ESA
contract and the lower revenue base to recover the Company’s relatively fixed
overhead.
Selling, General and Administrative
Expenses. Selling, general and administrative (“SG&A”)
expenses totaled $7.4 million and $7.2 million for the years ended December 31,
2008 and 2007, respectively. Fluctuations in the components of
SG&A spending were as follows:
|
¨
|
Business
development and marketing costs increased from $2.6 million for the year
ended December 31, 2007 to $2.9 million in the year ended December 31,
2008. The spending increase mainly reflects a $120,000 increase
in business development labor and benefit costs, a $115,000 increase in
business development travel expenses, the cost of participating in the
first quarter 2008 Society in Computer Simulation trade show ($27,000) and
the cost of the Company’s September 2008 Simworld user’s conference in
Beijing, China ($75,000). These increases were partially offset
by a $51,000 decrease in bidding and proposal costs, which are the costs
of operations personnel in assisting with the preparation of contract
proposals.
|
38
|
¨
|
The
Company’s general and administrative expenses totaled $4.2 million for the
year ended December 31, 2008 versus $4.1 million for the year ended
December 31, 2007. The increase mainly reflects the relocation expenses
incurred in the move of the Company’s headquarters to Eldersburg, Maryland
in July 2008 and increased utility costs due to the additional space in
the new headquarters.
|
|
¨
|
Gross
spending on software product development (“development”) totaled $907,000
in the year ended December 31, 2008 as compared to $1.2 million in the
same period of 2007. For the year ended December 31, 2008, the
Company expensed $316,000 and capitalized $591,000 of its development
spending and expensed $514,000 and capitalized $673,000 of its development
spending in the year ended December 31, 2007. The Company’s
capitalized development expenditures in 2008 were mainly related to the
customization of RELAP5-RT software (which simulates transient fluid
dynamics, neutronics and heat transfer in nuclear power plants) to run on
the Company’s real-time executive software and the enhancement to JCAD to
add the capability to convert AutoCAD Control Logic Diagrams to the
Company’s JControl modeling tool.
|
Depreciation. Depreciation
expense totaled $446,000 and $258,000 for the years ended December 31, 2008 and
2007, respectively. The higher 2008 depreciation expense reflected
the increase in 2007 capital spending which totaled $778,000, a 320% increase as
compared to the capital spending in 2006. Approximately 50% of
the capital spending in 2007 was for furniture and computer equipment for the
training centers that the Company established at Georgia Tech University and
Strathclyde University; the balance was for computers, printers, servers and
software. Capital spending in the year ended December 31, 2008
totaled $706,000. Of the 2008 capital spending, $355,000 was related
to the Company’s move to its new headquarters in Sykesville,
Maryland.
Operating Income
(Loss). The Company had operating loss of $12,000 (0.0% of
revenue) in the year ended December 31, 2008, as compared with operating income
of $2.2 million (7.0% of revenue) for the year ended December 31,
2007. The variances were due to the factors outlined
above.
Interest Income (Expense),
Net. For the year ended December 31, 2008, the Company’s
interest income, net totaled $130,000 while for the year ended December 31,
2007, the Company had net interest expense of $433,000.
In June
2007, using a portion of the proceeds from the Company’s June 2007 common stock
and warrant transaction, the Company paid off the outstanding balance of its
Laurus Master Fund Ltd. line of credit and did not borrow against this line of
credit in 2008. On March 6, 2008, the Laurus line of credit
expired. The Company incurred interest expense of $0 and $107,000 on
borrowings from the Laurus line of credit in the years ended December 31, 2008
and 2007, respectively.
On March
28, 2008, the Company entered into two separate revolving line of credit
agreements for two-year revolving lines of credit with Bank of America (“BOA”)
in an aggregate amount of up to $5.0 million. One line of credit is
in the principal amount of up to $3.5 million and is guaranteed by the U.S.
Export-Import Bank. The other line of credit is in the principal
amount of up to $1.5 million. The Company had not borrowed any funds
against either BOA line of credit since the closing and incurred no interest
expense from the credit facility in 2008. However, at December 31,
2008, $105,000 of the credit facility was utilized as collateral for a standby
letter of credit.
39
The
deferred financing costs incurred in conjunction with the Laurus Master Fund
line of credit were amortized over the two-year period of the line of credit,
with the final amortization expense recorded in February 2008. Such
amortization expense totaled $89,000 in the year ended December 31, 2008. This
compared to amortization expense of $533,000 in the year ended December 31,
2007. Amortization of the deferred financing costs incurred in
conjunction with the BOA lines of credit began in April 2008; amortization
expense totaled $53,000 in the year ended December 31, 2008.
Interest
income earned on short-term investments of the Company’s operating cash totaled
$67,000 for the year ended December 31, 2008 versus $96,000 in the year ended
December 31, 2007.
At
December 31, 2008, the Company had approximately $2.9 million of cash in
Certificates of Deposit with BOA that were being used as collateral for four
performance bonds. At December 31, 2007, the Company had
approximately $2.9 million of cash in Certificates of Deposit being used as
collateral for six performance bonds. The Company earned
approximately $132,000 and $104,000 in interest income on the Certificates of
Deposit in the years ended December 31, 2008 and 2007,
respectively.
In May
2007, the Company deposited $1.2 million into a restricted, interest-bearing
account at the Union National Bank in the United Arab Emirates as a partial
guarantee for the $11.8 million credit facility that UNB has extended to
ESA. GSE recorded approximately $48,000 and $36,000 interest income
in the years ended December 31, 2008 and 2007, respectively.
The
Company had other interest income in the year ended December 31, 2008 of $25,000
and other interest expense of $29,000 in the year ended December 31,
2007.
Gain (Loss) on Derivative
Instruments. The Company periodically enters into forward
foreign exchange contracts to manage market risks associated with the
fluctuations in foreign currency exchange rates on foreign-denominated trade
receivables. As of December 31, 2008, the Company had foreign
exchange contracts for sale of approximately 2 million Pounds Sterling, 4
million Euro, and 68 million Japanese Yen at fixed rates. The contracts expire
on various dates through February 2014. The Company had not
designated the contracts as hedges and has recognized a loss on the change in
the estimated fair value of the contracts of $174,000 for the twelve months
ended December 31, 2008.
At
December 31, 2007, the Company had foreign exchange contracts for the sale of
approximately 36 million Japanese Yen and 125,000 Pounds Sterling at fixed
rates. The contracts expired on various dates through January
2008. The Company had not designated the contracts as hedges and
recognized a loss on the change in the estimated fair value of the contracts of
$11,000 for the twelve months ended December 31, 2007.
The
estimated fair value of the contracts at December 31, 2008 and 2007 was a net
liability of $58,000 and a net asset of $1,000, respectively, and was recorded
on the balance sheet as follows:
40
|
December
31,
|
||||||||
|
(in
thousands)
|
2008
|
2007
|
||||||
|
Prepaid
expenses and other current assets
|
$ | 14 | $ | 1 | ||||
|
Other
assets
|
537 | - | ||||||
|
Other
current liabilities
|
(426 | ) | - | |||||
|
Other
liabilities
|
(183 | ) | - | |||||
|
Net
fair value
|
$ | (58 | ) | $ | 1 | |||
The
foreign currency denominated trade receivables, unbilled receivables, and
subcontractor accruals that are related to the outstanding foreign exchange
contracts are remeasured at the end of each period into the functional currency
using the current exchange rate at the end of the period. For
the twelve months ended December 31, 2008, the Company incurred a $279,000 loss
from the remeasurement of such trade and unbilled receivables.
Other Expense,
Net. For the years ended December 31, 2008 and 2007, other
expense, net was $226,000 and $555,000, respectively. The major
components of other expense, net included the following items:
The
Company accounts for its investment in ESA using the equity
method. In accordance with the equity method, the Company had
eliminated 10% of the profit from this contract as the training simulators are
assets that have been recorded on the books of ESA, and the Company was thus
required to eliminate its proportionate share of the profit included in the
asset value. The profit elimination totaled $28,000 and $444,000 for
the years ended December 31, 2008 and 2007, respectively.
For the
years ended December 31, 2008 and 2007, the Company recognized a $213,000 and
$54,000 equity loss, respectively, on its investment in ESA.
The
Company had other miscellaneous income in the year ended December 31, 2008 of
$15,000 and other miscellaneous expense of $57,000 in the year ended December
31, 2007.
Provision for
Income Taxes. The Company files
in the United States federal jurisdiction and in several state and foreign
jurisdictions.
The
Company’s tax provision in 2008 was $129,000 and consisted of $226,000 foreign
income tax withholding on several non-U.S. contracts, $10,000 state income
taxes, and $19,000 foreign income taxes incurred by the Company’s foreign
subsidiaries. The income tax expense was partially offset by a $126,000 credit
from the reduction of the valuation allowance against the net deferred tax
assets of the Company’s Swedish subsidiary.
41
The
Company had a full valuation allowance on its net deferred tax assets at
December 31, 2008, with the exception of the net deferred tax assets of its
Swedish subsidiary which were expected to be realized in 2009.
Liquidity
and Capital Resources.
As of
December 31, 2009, GSE had cash and cash equivalents of $25.3 million versus
$8.3 million at December 31, 2008.
Cash From Operating
Activities. For the year ended December 31, 2009, net cash
provided by operating activities totaled $326,000 which was a decrease of $1.9
million as compared to the year ended December 31, 2008.
The
Company has provided a partial guarantee of 10% of ESA’s credit facility with
Union National Bank; $1.2 million was deposited into a restricted
interest-bearing account with UNB in 2006. The interest earned on the
restricted cash is part of the pledged deposit. In January 2010, the
Company was notified by UNB that ESA was delinquent in making principal and
interest payments on the outstanding borrowings from their credit facility and
that UNB had drawn upon the guarantees of the three partners to pay off the
delinquency, withdrawing $145,000 from GSE’s restricted cash
account. In February 2010, GSE was notified that ESA had missed
another loan payment and that 10% of the amount due ($24,000) would be withdrawn
from the Company’s restricted cash account. The Company established a full
reserve against the $1.3 million restricted cash account as of December 31,
2009.
Significant
changes in the Company’s assets and liabilities in the year ended December 31,
2009 included:
|
¨
|
A
$5.1 million increase in the Company’s contracts
receivable. The Company’s trade receivables increased
from $7.3 million (including $1.6 million due from ESA) at December 31,
2008 to $8.2 million at December 31, 2009 (including the same $1.6 million
due from ESA). The Company’s unbilled receivables increased by
$5.5 million to $9.5 million at December 31, 2009. The increase in the
unbilled receivables is due to the timing of contracted billing milestones
of the Company’s current projects. In January and February
2010, the Company invoiced $1.3 million of the unbilled amounts; the
balance of the unbilled amounts is expected to be invoiced and collected
within one year. At December 31, 2009, trade receivables
outstanding for more than 90 days totaled $3.0 million versus $2.3 million
at December 31, 2008; $1.6 million of the overdue amount was due from ESA
at both dates. Approximately $300,000 of the over 90 day
balance at December 31, 2009 has been received as of the end of February
2010. At a meeting of ESA’s three shareholders held at ESA
on February 17, 2010, the shareholders reached agreement to siginificantly
reduce costs and begin to explore options up to and including the
selling of ESA. Accordingly, the Company increased its bad debt
reserve from $2,000 at December 31, 2008 to $1.7 million at December 31,
2009 mainly to reserve the overdue receivable from
ESA.
|
|
¨
|
A
$4.1 million increase in accounts payable, accrued compensation and
accrued expenses. The Company’s accounts payable and accrued
liabilities have increased due to material purchases and the utilization
of subcontractors on several of the Company’s current
projects.
|
|
¨
|
A
$1.4 million decrease in billings in excess of revenue
earned. The decrease is due to the timing of contracted billing
milestones of the Company’s current
projects.
|
For the
year ended December 31, 2008, net cash provided by operating activities totaled
$2.3 million and increased $385,000 as compared to 2007. Significant
changes in the Company’s assets and liabilities in 2008 included:
42
|
¨
|
A
$527,000 increase in the Company’s contracts
receivable. The Company’s trade receivables increased
from $4.2 million at December 31, 2007 (including $1.0 million due from
ESA) to $7.3 million at December 31, 2008 (including $1.6 million due from
ESA) while the Company’s unbilled receivables decreased by $3.0 million to
$3.6 million at December 31, 2008. At December 31, 2008, trade
receivables outstanding for more than 90 days totaled $2.3 million
(including $1.6 million from ESA) versus $2,000 at December 31,
2007. Despite the increase in overdue receivables, the Company
believed the entire balance would be received and did not increase its bad
debt reserve.
|
|
¨
|
A
$1.0 million reduction in accounts payable, accrued compensation and
accrued expenses. The decrease mainly reflected a reduction in
outstanding trade payables at December 31, 2008 as compared to the prior
year and a payout in early 2008 of accrued vacation to U.S. employees in
excess of the annual carryover allowance in accordance with the Company’s
vacation policy.
|
|
¨
|
A
$1.8 million increase in billings in excess of revenue
earned. The increase is due to the timing of contracted billing
milestones of the Company’s current
projects.
|
Net cash
provided by operating activities was $1.9 million for the year ended December
31, 2007. The most significant change in the Company’s assets and
liabilities in 2007 was a $1.5 million reduction in the Company’s accounts
payable, accrued compensation and accrued expenses. After the
completion of the Company’s June 2007 common stock transaction, the Company paid
$405,000 to ManTech for the preferred stock dividends that had been payable
since 2003 and the related accrued interest. The balance of the
reduction was mainly due to the paydown of the Company’s trade payable
balance.
Cash Provided by (Used in) Investing
Activities. For the year ended December 31, 2009, net cash
provided by investing activities was $1.2 million. The Company made
capital expenditures of $361,000, increased its investment in ESA by $14,000,
and capitalized software development costs of $861,000. $2.5 million
of cash used as collateral for letters of credit, bank guarantees and foreign
currency contracts was released in 2009, $2.1 of which related to a performance
bond for ESA which expired in October 2009.
Net cash
used in investing activities was $2.6 million for the year ended December 31,
2008. The Company made capital expenditures of $705,000, increased
its investment in ESA by $486,000 and capitalized software development costs of
$591,000. The Company also restricted an additional $836,000 of cash
as collateral for performance bonds issued by the Company and backed by standby
letters of credit.
Net cash
used in investing activities was $3.5 million for the year ended December 31,
2007. The Company made capital expenditures of $778,000, capitalized
software development costs of $673,000, and made an additional investment in ESA
of $261,000. The Company deposited $1.2 million into a restricted,
interest-bearing account at the Union National Bank in the United Arab Emirates
as a partial guarantee for the $11.8 million credit facility that the bank
extended to ESA. The Company also restricted $700,000 of cash as
collateral for performance bonds issued by the Company and backed by standby
letters of credit.
Cash Provided by Financing
Activities. For
the year ended December 31, 2009, net cash provided by financing activities
totaled $15.4 million. On September 4, 2009, the Company raised $15.0
million through the sale of 2.5 million shares of its common stock, $.01 par
value per share. The shares were sold under a shelf registration
statement which was declared effective by the Securities and Exchange Commission
on August 21, 2009. On September 23, 2009, the Company raised an
additional $2,250,000 when the Company’s underwriter exercised an over-allotment
option in full to purchase an additional 375,000 shares of the Company’s common
stock at the public offering price of $6.00 per share. The aggregate
net proceeds received by the Company from the two transactions was approximately
$15.9 million. The Company received $121,000 from the issuance of
common stock for employee stock options and warrants exercised during the year
ended December 31, 2009. In accordance with the amendment to the
Company’s $2.5 million BOA line of credit effective May 5, 2009, the Company
placed $600,000 in a restricted certificate of deposit. This
certificate of deposit is included in the borrowing base calculation to
determine the amount of funds that the Company can utilize under its $2.5
million line of credit. In the year ended December 31, 2009, the
Company spent $20,000 on deferred financing costs in conjunction with the Bank
of America lines of credit.
43
The
Company generated $483,000 from financing activities in the year ended December
31, 2008. The Company received $571,000 from the issuance of common
stock from the exercise of warrants and employee stock options and spent $88,000
on deferred financing costs in conjunction with the new Bank of America lines of
credit.
In the
year ended December 31, 2007, the Company generated $8.7 million from financing
activities. The Company generated net proceeds of $9.2 million from
the issuance of 1,666,667 shares of common stock and warrants which was used to
pay down the Laurus Master Fund, Ltd. line of credit. The Company
generated $2.1 million from the exercise of warrants and employee stock
options. The Company reversed a tax benefit of $115,000 related to
employee stock option exercises that had been recognized in 2006. The
Company paid dividends of $49,000 to the Series A Cumulative Convertible
Preferred stockholders and paid the $316,000 preferred stock dividend that was
due to ManTech since 2003.
Credit
Facilities
On March
28, 2008, the Company entered into two separate revolving line of credit
agreements for two-year revolving lines of credit with Bank of America, N.A.
(“BOA”). The Company and its subsidiary, GSE Power Systems, Inc., are
jointly and severally liable as co-borrowers. The credit facilities
enable the Company to borrow funds to support working capital needs and standby
letters of credit. The first line of credit in the principal amount
of up to $3.5 million enables the Company to borrow funds up to 90% of eligible
foreign accounts receivable, plus 75% of eligible unbilled foreign receivables
and 100% of cash collateral pledged to BOA on outstanding warranty standby
letters of credit. This line of credit is 90% guaranteed by the Export-Import
Bank of the United States. The interest rate on this line of credit
is based on the daily LIBOR rate plus 150 basis points, with interest only
payments due monthly. The second line of credit was originally in the
principal amount of up to $1.5 million, however, on May 5, 2009, the credit
agreement was amended to increase the principal amount to $2.5
million. This line of credit enables the Company to borrow funds up
to 80% of domestic accounts receivable, 30% of domestic unbilled receivables and
100% of the principal balance of a $600,000 certificate of deposit issued by
BOA. The interest rate on this line of credit is based on the daily
LIBOR rate plus 225 basis points, with interest only payments due
monthly. The credit agreements contain certain restrictive covenants
regarding future acquisitions, incurrence of debt and the payment of
dividends. In addition, both credit agreements contain financial
covenants with respect to the Company’s minimum tangible net worth, debt service
coverage ratio, and funded debt to EBITDA ratio. At December 31,
2009, the Company was in default on two of the financial
covenants. The financial covenant calculations at December 31, 2009
are shown below:
|
As
of
|
||||
|
Covenant
|
Dec.
31, 2009
|
|||
|
Tangible
net worth
|
Must
Exceed $15.0 million
|
$33.5
million
|
||
|
Debt
service coverage ratio
|
Must
Exceed 1.25 : 1.00
|
(1,582)
: 1.00
|
||
|
Funded
debt to EBITDA ratio
|
Not
to Exceed 2.50 : 1.00
|
2.74
: 1.00
|
At
December 31, 2009 and throughout all of 2009, the Company had no outstanding
borrowings against its lines of credit. Accordingly, we did not incur
any bank interest expense in 2009. However, the Company did incur
approximately $1,000 of interest expense related to late payments to
vendors. This, in conjunction with the Company’s net loss for the
year ended December 31, 2009, has resulted in a negative debt service coverage
ratio. For the funded debt to EBITDA ratio calculation, the
amount of outstanding letters of credit and bank guarantees that are not cash
collateralized are included as funded debt. The Company has received
a written waiver from BOA.
44
At
December 31, 2009, the Company’s available borrowing base under the two lines of
credit was $6.0 million of which $2.4 million had been utilized as collateral
for three standby letters of credit.
Common
Stock Offering
On
September 4, 2009, the Company raised $15.0 million through the sale of 2.5
million shares of its common stock, $.01 par value per share. The
shares were sold under a shelf registration statement which was declared
effective by the Securities and Exchange Commission on August 21,
2009. On September 23, 2009, the Company raised an additional
$2,250,000 when the Company’s underwriter, exercised an over-allotment option in
full to purchase an additional 375,000 shares of the Company’s common stock at
the public offering price of $6.00 per share. The aggregate net
proceeds received by the Company from the two transactions was approximately
$15.9 million. The Company paid the underwriter a fee in the amount
of 6% of the gross proceeds received by the Company from the offering
($1,035,000) and paid 339,000 in other transaction fees.
Common
Stock and Warrant Transaction
On June
22, 2007, the Company raised $9.2 million, net of associated fees of $768,000,
through the sale of 1,666,667 shares (the “Shares”) of its common stock, $.01
par value per share, by means of a private placement to selected institutional
investors. Each investor received a five-year warrant to purchase GSE
common stock (the “Warrant Shares”) equal to 10% of the shares of common stock
that they had purchased at an exercise price of $6.00 per share (the
“Warrants”). In aggregate, the Company issued Warrants to purchase a
total of 166,667 shares of GSE common stock.
The
Company filed its registration statement on Form S-3 (the “Registration
Statement”) with the Securities and Exchange Commission (the “Commission”) on
July 16, 2007 covering the offer and sale, from time to time, of the Shares, the
Warrant Shares and shares of common stock issuable upon exercise of warrants
that may be issued as liquidated damages under the terms of a certain
registration rights agreement entered into between the Company and the investors
(the “Registration Rights Agreement”) in connection with the private
placement. The Registration Statement became effective on August 8,
2007 and, pursuant to the provisions of the Registration Rights Agreement, the
Company is obligated to use commercially reasonable efforts to, after the date
on which the Registration Statement becomes effective, cause the Registration
Statement to remain continuously effective as to all Shares and Warrant Shares,
other than for an aggregate of more than 30 consecutive trading days or for more
than an aggregate of 60 trading days in any 12-month period. In the event of a
default of the foregoing obligation, the Company will be required to issue to
the investors, as liquidated damages, on the date the foregoing default occurs
and each monthly anniversary thereafter, a number of warrants (on the same terms
as the Warrants) equal to 2% of the number of Shares then held by such investor,
not to exceed 10% of the total number of Shares then held by such investor, and
thereafter cash, in an amount equal to 2% of the aggregate purchase price paid
by the investors, not to exceed 30% of the aggregate purchase price paid by the
investors.
At the
date of issuance, the fair value of the Warrants was $510,000 and the fair value
of the Shares was $9.5 million. The fair value of the Warrants and
the Shares was determined by the use of the relative fair value method, in which
the $10.0 million gross proceeds was allocated based upon the fair values of the
Warrants, as determined by using the Black-Scholes Model, and the Shares, as
determined by the closing price of the common stock on the American Stock
Exchange on the date the transaction was closed.
45
The
Company paid the placement agent a fee in the amount of 6% of the gross proceeds
received by the Company from the offering ($600,000). In addition to
the placement agent fee, the Company paid $168,000 of other transaction fees
related to the offering.
The
proceeds were used to pay down the Company’s line of credit and for other
working capital purposes.
Series
A Cumulative Preferred Stock
On
February 28, 2006, the Company raised $3.9 million, net of associated fees of
$395,000, through the sale of 42,500 shares of Series A Cumulative Convertible
Preferred Stock and Warrants by means of a private placement to “accredited
investors”, as that term is used in rules and regulations of the Securities and
Exchange Commission. The Convertible Preferred Stock was convertible
at any time into a total of 2,401,133 shares of GSE common stock at a conversion
price of $1.77 per share. The conversion price was equal to 110% of the closing
price of the Company’s Common Stock on February 28, 2006, the date the sale of
the Convertible Preferred Stock was completed. Each investor received
a five-year warrant to purchase GSE common stock equal to 20% of the shares they
would receive from the conversion of the Convertible Preferred Stock, at an
exercise price of $1.77. In aggregate, the Company issued warrants to
purchase a total of 480,226 shares of GSE common stock. The
Convertible Preferred Stock holders were entitled to an 8% cumulative dividend,
payable on a semiannual basis every June 30 and December 30. In 2006,
the Company paid dividends totaling $279,000 to the preferred stockholders; in
the nine months ended September 30, 2007 the Company paid dividends totaling
$49,000. At the date of issuance, the fair value of the warrants was
$342,000 and the fair value of the preferred stock was $3.9 million. The fair
value of the warrants and the preferred stock was determined by the use of the
relative fair value method, in which the $4.25 million gross proceeds was
allocated based upon the fair values of the warrants, as determined by using the
Black-Scholes Model, and the preferred stock, as determined by an independent
appraisal. At any time after March 1, 2007, the Company had the right
to convert the Preferred Stock into shares of GSE common stock when the average
of the current stock price during the twenty trading days immediately prior to
the date of such conversion exceeded 200% of the Series A Conversion
Price. On March 7, 2007, the Company sent notice to the holders of
the remaining 20,000 outstanding shares of its Preferred Stock that the average
current stock price for the prior twenty trading days had exceeded 200% of the
Conversion Price, and that the Company was converting the outstanding Preferred
Stock into common stock. The 20,000 shares of Preferred Stock
converted to 1,129,946 shares of GSE common stock. Prior to March 7,
2007, the holders of 22,500 shares of Preferred Stock had already elected to
convert their Preferred Stock into a total of 1,271,187 shares of Common Stock;
8,580 shares of Preferred Stock were converted in 2006 and 13,920 shares of
Preferred Stock were converted in 2007.
The
Company paid the placement agent for the Convertible Preferred Stock and
Warrants 6% of the gross proceeds received by the Company from the offering
($255,000) plus five-year warrants to purchase 150,000 shares of the Company’s
common stock at an exercise price of $1.77 per share. In addition to the
placement agent fee, the Company paid $140,000 of other transaction fees related
to the offering. At the date of issuance, the fair value of the
placement agent warrants was $128,000, as established using the Black-Scholes
Model, and was recorded in paid-in capital, with the offset recognized as a
reduction of the preferred stock proceeds.
Contractual
Cash Commitments
The
following summarizes the Company’s contractual cash obligations as of December
31, 2009, and the effect
these obligations are expected to have on its liquidity and cash flow in future
periods:
46
|
Payments
Due by Period
|
|||||
|
(in
thousands)
|
|||||
|
Contractual
Cash Obligations
|
Total
|
Less
than 1 year
|
1-3
Years
|
4-5
Years
|
After
5 Years
|
|
Long
Term Debt
|
$ -
|
$ -
|
$ -
|
$ -
|
$ -
|
|
Subcontractor
and Purchase Commitments
|
$ 14,625
|
$ 10,561
|
$ 3,902
|
$ 162
|
$ -
|
|
Net
Future Minimum Lease Payments
|
$ 4,405
|
$ 801
|
$ 1,527
|
$ 873
|
$ 1,204
|
|
Total
|
$ 19,030
|
$ 11,362
|
$ 5,429
|
$ 1,035
|
$ 1,204
|
As of December 31, 2009, the Company was contingently liable for five standby letters of credit, one bank guarantee and two surety bonds totaling $3.5 million which represent performance bonds on eight contracts. Two of the letters of credit and the bank guarantee have been cash collateralized and three of the letters of credit have been collateralized using the Company’s line of credit. In addition, the Company has provided $88,000 to one customer as collateral for a bid bond.
The
Company has $1.3 million in a restricted, interest-bearing account at the Union
National Bank (“UNB”) in the United Arab Emirates as a partial guarantee for the
$11.8 million credit facility that UNB has extended to ESA. In
January 2010, the Company was notified by UNB that ESA was delinquent in making
principal and interest payments on their outstanding borrowings from their
credit facility and that UNB had drawn upon the guarantees of the three partners
to pay off the delinquency, withdrawing $145,000 from GSE’s restricted cash
account. In February 2010, GSE was notified that ESA had missed
another loan payment and that 10% of the amount due ($24,000) would be withdrawn
from the Company’s restricted cash account. The Company established a full
reserve against the $1.3 million restricted cash account as of December 31,
2009.
2010
Liquidity Outlook
At
December 31, 2009, the Company had cash and cash equivalents of $25.3 million
and another $3.6 million available under its line of credit. Although the
Company was in default on two of its financial covenants under its line of
credit agreement, the Company has received a written waiver from its
bank. In addition, the Company’s backlog of unissued project
milestone invoices totaled $44.8 million at December 31, 2009. The
Company anticipates that its normal operations and the utilization of its credit
facility will generate all of the funds necessary to fund its consolidated
operations during the next twelve months. The Company believes that
it will have sufficient liquidity and working capital without additional
financing.
47
Foreign
Exchange.
A portion
of the Company's international sales revenue has been and may be received in a
currency other than the currency in which the expenses relating to such revenue
are paid. Accordingly, the Company periodically enters into forward
foreign exchange contracts to manage the market risks associated with the
fluctuations in foreign currency exchange rates.
Off-balance Sheet
Obligations.
The
Company has no off-balance sheet obligations as of December 31, 2009, except for
its operating lease commitments and outstanding letters of credit, bank
guarantees and surety bonds. See Contractual Cash Commitments
above.
New
Accounting Standards.
In June
2009, the Financial Accounting Standards Board (“FASB”) issued Accounting Standards Codification
(“ASC” or “the Codification”) as the source of authoritative generally
accepted accounting principles recognized by the FASB for non-governmental
entities. The Codification is effective for financial statements
issued for reporting periods that end after September 15, 2009, which for GSE
was September 30, 2009. The Codification superseded all then-existing
non-SEC accounting and reporting standards. The Codification did not
change rules and interpretations of the SEC which are also sources of
authoritative GAAP for SEC registrants. There were no changes to the
Company’s consolidated financial statements upon adoption.
In
October 2009, the FASB issued Accounting Standards Update (“ASU”) 2009-13, Revenue Recognition (Topic 605),
Multiple-Deliverable Arrangements. ASU 2009-13 amends the
guidance that in the absence of vendor-specific objective and third-party
evidence for deliverables in multiple-deliverable arrangements, companies will
be required to develop a best estimate of the selling price to separate
deliverables and allocate arrangements consideration using the relative selling
price method. ASU 2009-13 expands the disclosure requirements for
multiple-deliverable revenue arrangements. The guidance will be
effective for financial statements issued for fiscal years beginning after June
15, 2010. Early adoption is permitted. The Company is
currently evaluating the potential impact on its financial
statements.
In
October 2009, the FASB issued ASU 2009-14, Software (Topic 985), Certain
Revenue Arrangements that Include Software Elements. ASU
2009-14 amends the guidance to exclude for the scope of software revenue
accounting requirements tangible products if the product contains both software
and non-software components that function together to deliver a product’s
essential functionality and factors to consider in determining whether a product
is within the scope of the guidance. The guidance will be effective
for financial statements issued for fiscal years beginning after June 15,
2010. Early adoption is permitted. The Company is
currently evaluating the potential impact on its financial
statements.
Other
Matters.
Management
believes inflation has not had a material impact on the Company's
operations.
ITEM
7A. QUANTITATIVE AND QUALITATIVE
DISCLOSURES ABOUT MARKET RISK.
The
Company’s market risk is principally confined to changes in foreign currency
exchange rates. During the year ended December 31, 2009, 33% of the Company’s
revenue was from contracts which required payments in a currency other than U.S.
Dollars, principally Euros (18%), Japanese Yen (6%) and British
Pounds Sterling (5%). For the years ended December 31, 2008 and 2007,
27% and 16%, respectively, of the Company’s revenue was from contracts which
required payments in a currency other than U.S. Dollars, principally Swedish
Krona, British Pounds Sterling and Japanese Yen.
48
In
addition, during the years ended December 31, 2009, 2008 and 2007, 13%, 14% and
11%, respectively, of the Company’s expenses were incurred in Swedish
Krona. The Company’s exposure to foreign exchange rate fluctuations
arises in part from inter-company accounts in which costs incurred in one entity
are charged to other entities in different foreign jurisdictions. The
Company is also exposed to foreign exchange rate fluctuations as the financial
results of all foreign subsidiaries are translated into U.S. dollars in
consolidation. As exchange rates vary, those results when translated
may vary from expectations and adversely impact overall expected
profitability.
The
Company utilizes forward foreign currency exchange contracts to manage market
risks associated with the fluctuations in foreign currency exchange rates. The
principal currencies for which such forward exchange contracts are entered into
are the Pound Sterling, the Euro and the Japanese Yen. It is the
Company's policy to use such derivative financial instruments to protect against
market risk arising in the normal course of business in order to reduce the
impact of these exposures. The Company minimizes credit exposure by limiting
counterparties to nationally recognized financial institutions.
As of
December 31, 2009, the Company had foreign exchange contracts for sale of
approximately 2 million Pounds Sterling, 3 million Euro, and 759 million
Japanese Yen at fixed rates. The contracts expire on various dates
through February 2014. The Company had not designated the contracts
as hedges and has recorded a gain on the change in the estimated fair value of
the contracts of $851,000 for the year ended December 31,
2009. The estimated fair value of the contracts was a net asset
of $812,000 at December 31, 2009. The Company recognized losses of
approximately $174,000 and $11,000 in 2008 and 2007, respectively, on the
changes in fair value of its forward currency exchange contracts. A
10% fluctuation in the foreign currency exchange rates up or down as of December
31, 2009 would have increased/decreased the change in estimated fair value of
the contracts by $81,000.
The Company is also subject to market
risk related to the interest rate on its two existing lines of
credit. As of December 31, 2009, the interest rate on one line of
credit is based on LIBOR plus 150 basis-points and the interest rate on the
other line of credit is based on LIBOR plus 225 basis-points. The
Company had no outstanding borrowings against either line of credit in
2009.
49
ITEM
8. FINANCIAL STATEMENTS AND
SUPPLEMENTARY DATA.
INDEX
TO FINANCIAL STATEMENTS
|
Page
|
|
|
GSE
Systems, Inc. and Subsidiaries
|
|
|
Report
of Independent Registered Public Accounting Firm-- Internal Control over
Financial Reporting
|
F-1
|
|
Report
of Independent Registered Public Accounting Firm -- Consolidated Financial
Statements
|
F-3
|
|
Consolidated
Balance Sheets as of December 31, 2009 and 2008
|
F-4
|
|
Consolidated
Statements of Operations for the years ended December
31, 2009, 2008, and 2007
|
F-5
|
|
Consolidated
Statements of Comprehensive Income (Loss) for the years ended December
31, 2009, 2008, and 2007
|
F-6
|
|
Consolidated
Statements of Changes in Stockholders’ Equity for the years ended
December
31, 2009, 2008, and 2007
|
F-7
|
|
Consolidated
Statements of Cash Flows for the years ended December
31, 2009, 2008, and 2007
|
F-8
|
|
Notes
to Consolidated Financial Statements
|
F-9
|
50
Report
of Independent Registered Public Accounting Firm – Internal Control over
Financial Reporting
The Board
of Directors and Stockholders
GSE
Systems, Inc.:
We have
audited GSE Systems, Inc. and subsidiaries’ (the “Company”) internal control
over financial reporting as of December 31, 2009, based on criteria established
in Internal Control –
Integrated Framework issued by the Committee of Sponsoring Organizations
of the Treadway Commission (COSO). The Company's management is responsible for
maintaining effective internal control over financial reporting and for its
assessment of the effectiveness of internal control over financial reporting,
included in the accompanying Management’s Report on Internal Control over
Financial Reporting Item 9A(b). Our responsibility is to express an opinion on
the Company's internal control over financial reporting based on our
audit.
We
conducted our audit in accordance with the standards of the Public Company
Accounting Oversight Board (United States). Those standards require that we plan
and perform the audit to obtain reasonable assurance about whether effective
internal control over financial reporting was maintained in all material
respects. Our audit included obtaining an understanding of internal control over
financial reporting, assessing the risk that a material weakness exists, and
testing and evaluating the design and operating effectiveness of internal
control based on the assessed risk. Our audit also included performing such
other procedures as we considered necessary in the circumstances. We believe
that our audit provides a reasonable basis for our opinion.
A
company's internal control over financial reporting is a process designed to
provide reasonable assurance regarding the reliability of financial reporting
and the preparation of financial statements for external purposes in accordance
with generally accepted accounting principles. A company's internal control over
financial reporting includes those policies and procedures that (1) pertain to
the maintenance of records that, in reasonable detail, accurately and fairly
reflect the transactions and dispositions of the assets of the company; (2)
provide reasonable assurance that transactions are recorded as necessary to
permit preparation of financial statements in accordance with generally accepted
accounting principles, and that receipts and expenditures of the company are
being made only in accordance with authorizations of management and directors of
the company; and (3) provide reasonable assurance regarding prevention or timely
detection of unauthorized acquisition, use, or disposition of the company's
assets that could have a material effect on the financial
statements.
Because
of its inherent limitations, internal control over financial reporting may not
prevent or detect misstatements. Also, projections of any evaluation of
effectiveness to future periods are subject to the risk that controls may become
inadequate because of changes in conditions, or that the degree of compliance
with the policies or procedures may deteriorate.
F-1
In our
opinion, the Company maintained, in all material respects, effective internal
control over financial reporting as of December 31, 2009, based on criteria
established in Internal
Control – Integrated Framework issued by the Committee of Sponsoring
Organizations of the Treadway Commission (COSO). We also have
audited, in accordance with the standards of the Public Company Accounting
Oversight Board (United States), the consolidated balance sheets of the Company
as of December 31, 2009 and 2008 and the related consolidated statements of
operations, comprehensive income (loss), changes in stockholders’ equity and
cash flows for each of the years in the three-year period ended December 31,
2009, and our report dated March 11, 2010 expressed an unqualified opinion on
those consolidated financial statements.
/s/ KPMG
LLP
Baltimore,
Maryland
March 11,
2010
F-2
Report
of Independent Registered Public Accounting Firm – Consolidated Financial
Statements
The Board
of Directors and Stockholders
GSE
Systems, Inc.:
We have
audited the accompanying consolidated balance sheets of GSE Systems, Inc. and
subsidiaries as of December 31, 2009 and 2008, and the related consolidated
statements of operations, comprehensive income (loss), changes in stockholders’
equity and cash flows for each of the years in the three-year period ended
December 31, 2009. These consolidated financial statements are the
responsibility of the Company’s management. Our responsibility is to
express an opinion on these consolidated financial statements based on our
audits.
We
conducted our audits in accordance with the standards of the Public Company
Accounting Oversight Board (United States). Those standards require that we plan
and perform the audit to obtain reasonable assurance about whether the financial
statements are free of material misstatement. An audit includes
examining, on a test basis, evidence supporting the amounts and disclosures in
the financial statements. An audit also includes assessing the
accounting principles used and significant estimates made by management, as well
as evaluating the overall financial statement presentation. We
believe that our audits provide a reasonable basis for our opinion.
In our
opinion, the consolidated financial statements referred to above present fairly,
in all material respects, the financial position of GSE Systems, Inc. and
subsidiaries as of December 31, 2009 and 2008, and the results of their
operations and their cash flows for each of the years in the three-year period
ended December 31, 2009 in conformity with U.S. generally accepted accounting
principles.
We also
have audited, in accordance with the standards of the Public Company Accounting
Oversight Board (United States), the Company’s internal control over financial
reporting as of December 31, 2009, based on criteria established in Internal Control—Integrated
Framework issued by the Committee of Sponsoring Organizations of the
Treadway Commission (COSO), and our report dated March 11, 2010 expressed an
unqualified opinion on the effectiveness of the Company’s internal control over
financial reporting.
/s/ KPMG
LLP
Baltimore,
Maryland
March 11,
2010
F-3
|
PART
I - FINANCIAL INFORMATION
|
||||||||
|
Item
1. Financial Statements
|
||||||||
|
GSE
SYSTEMS, INC. AND SUBSIDIARIES
|
||||||||
|
CONSOLIDATED
BALANCE SHEETS
|
||||||||
|
(in
thousands, except share data)
|
||||||||
|
December
31,
|
||||||||
|
2009
|
2008
|
|||||||
|
ASSETS
|
||||||||
|
Current
assets:
|
||||||||
|
Cash
and cash equivalents
|
$ | 25,270 | $ | 8,274 | ||||
|
Restricted
cash
|
938 | 2,962 | ||||||
|
Contract
receivables, net
|
15,941 | 10,951 | ||||||
|
Prepaid
expenses and other current assets
|
1,491 | 1,110 | ||||||
|
Total
current assets
|
43,640 | 23,297 | ||||||
|
Equipment
and leasehold improvements, net
|
989 | 1,133 | ||||||
|
Software
development costs, net
|
1,865 | 1,487 | ||||||
|
Goodwill
|
1,739 | 1,739 | ||||||
|
Long-term
restricted cash
|
876 | 2,027 | ||||||
|
Other
assets
|
411 | 1,332 | ||||||
|
Total
assets
|
$ | 49,520 | $ | 31,015 | ||||
|
LIABILITIES
AND STOCKHOLDERS' EQUITY
|
||||||||
|
Current
liabilities:
|
||||||||
|
Accounts
payable
|
$ | 5,009 | $ | 1,655 | ||||
|
Accrued
expenses
|
852 | 685 | ||||||
|
Accrued
compensation and payroll taxes
|
1,747 | 1,234 | ||||||
|
Billings
in excess of revenue earned
|
2,579 | 4,020 | ||||||
|
Accrued
warranty
|
1,273 | 1,066 | ||||||
|
Other
current liabilities
|
711 | 749 | ||||||
|
Total
current liabilities
|
12,171 | 9,409 | ||||||
|
Other
liabilities
|
206 | 906 | ||||||
|
Total
liabilities
|
12,377 | 10,315 | ||||||
|
Commitments
and contingencies
|
- | - | ||||||
|
Stockholders'
equity:
|
||||||||
|
Preferred
stock $.01 par value, 2,000,000 shares authorized, shares
issued and
|
||||||||
|
outstanding
none in 2009 and 2008
|
- | - | ||||||
|
Common
stock $.01 par value, 30,000,000 shares authorized, shares issued
and
|
||||||||
|
outstanding
18,930,368 in 2009 and 15,968,122 in 2008
|
189 | 160 | ||||||
|
Additional
paid-in capital
|
67,559 | 50,572 | ||||||
|
Accumulated
deficit
|
(29,615 | ) | (28,818 | ) | ||||
|
Accumulated
other comprehensive loss
|
(990 | ) | (1,214 | ) | ||||
|
Total
stockholders' equity
|
37,143 | 20,700 | ||||||
|
Total
liabilities and stockholders' equity
|
$ | 49,520 | $ | 31,015 | ||||
|
The
accompanying notes are an integral part of these consolidated financial
statements.
|
||||||||
F-4
|
GSE
SYSTEMS, INC. AND SUBSIDIARIES
|
||||||||||||
|
CONSOLIDATED
STATEMENTS OF OPERATIONS
|
||||||||||||
|
(in
thousands, except per share data)
|
||||||||||||
|
Years
ended December 31,
|
||||||||||||
|
2009
|
2008
|
2007
|
||||||||||
|
Contract
revenue
|
$ | 40,060 | $ | 29,004 | $ | 31,900 | ||||||
|
Cost
of revenue
|
29,736 | 21,187 | 22,217 | |||||||||
|
Gross
profit
|
10,324 | 7,817 | 9,683 | |||||||||
|
Operating
expenses
|
||||||||||||
|
Selling,
general and administrative
|
7,749 | 7,383 | 7,214 | |||||||||
|
ESA
related charges
|
1,508 | - | - | |||||||||
|
Depreciation
|
504 | 446 | 258 | |||||||||
|
Total
operating expenses
|
9,761 | 7,829 | 7,472 | |||||||||
|
Operating
income (loss)
|
563 | (12 | ) | 2,211 | ||||||||
|
Interest
income (expense), net
|
56 | 130 | (433 | ) | ||||||||
|
ESA
related charges
|
(865 | ) | - | - | ||||||||
|
Gain
(loss) on derivative instruments
|
763 | (453 | ) | (11 | ) | |||||||
|
Other
expense, net
|
(397 | ) | (226 | ) | (555 | ) | ||||||
|
Income
(loss) before income taxes
|
120 | (561 | ) | 1,212 | ||||||||
|
Provision
for income taxes
|
917 | 129 | 43 | |||||||||
|
Net
income (loss)
|
(797 | ) | (690 | ) | 1,169 | |||||||
|
Preferred
stock dividends
|
- | - | (49 | ) | ||||||||
|
Net
income (loss) attributed to common shareholders
|
$ | (797 | ) | $ | (690 | ) | $ | 1,120 | ||||
|
Basic
income (loss) per common share
|
$ | (0.05 | ) | $ | (0.04 | ) | $ | 0.09 | ||||
|
Diluted
income (loss) per common share
|
$ | (0.05 | ) | $ | (0.04 | ) | $ | 0.08 | ||||
|
The
accompanying notes are an integral part of these consolidated financial
statements.
|
||||||||||||
F-5
|
GSE
SYSTEMS, INC. AND SUBSIDIARIES
|
||||||||||||
|
CONSOLIDATED
STATEMENTS OF COMPREHENSIVE INCOME (LOSS)
|
||||||||||||
|
(in
thousands)
|
||||||||||||
|
Years
ended December 31,
|
||||||||||||
|
2009
|
2008
|
2007
|
||||||||||
|
Net
income (loss)
|
$ | (797 | ) | $ | (690 | ) | $ | 1,169 | ||||
|
Foreign
currency translation adjustment
|
224 | (327 | ) | 69 | ||||||||
|
Comprehensive
income (loss)
|
$ | (573 | ) | $ | (1,017 | ) | $ | 1,238 | ||||
|
The
accompanying notes are an integral part of these consolidated financial
statements.
|
||||||||||||
F-6
|
GSE
SYSTEMS, INC, AND SUBSIDIARIES
|
||||||||||||||||||||
|
CONSOLIDATED
STATEMENTS OF CHANGES IN STOCKHOLDERS' EQUITY
|
||||||||||||||||||||
|
(in
thousands)
|
||||||||||||||||||||
|
Accumulated
|
||||||||||||||||||||
|
Preferred
|
Common
|
Additional
|
Other
|
|||||||||||||||||
|
Stock
|
Stock
|
Paid-in
|
Accumulated
|
Comprehensive
|
||||||||||||||||
|
Shares
|
Amount
|
Shares
|
Amount
|
Capital
|
Deficit
|
Loss
|
Total
|
|||||||||||||
|
Balance,
January 1, 2007
|
34
|
$ -
|
11,014
|
$ 110
|
$37,504
|
$ (29,297)
|
$ (956)
|
$ 7,361
|
||||||||||||
|
Issuance
of preferred stock
|
-
|
-
|
1,667
|
17
|
8,705
|
-
|
-
|
8,722
|
||||||||||||
|
Conversion
of preferred
|
-
|
|||||||||||||||||||
|
stock
to common stock
|
(34)
|
-
|
1,916
|
19
|
(19)
|
-
|
-
|
-
|
||||||||||||
|
Preferred
stock dividends paid
|
-
|
-
|
-
|
-
|
(49)
|
-
|
-
|
(49)
|
||||||||||||
|
Stock-based
compensation
|
-
|
|||||||||||||||||||
|
expense
|
-
|
-
|
-
|
-
|
344
|
-
|
-
|
344
|
||||||||||||
|
Common
stock issued for
|
-
|
|||||||||||||||||||
|
options
exercised
|
-
|
-
|
617
|
6
|
1,677
|
-
|
-
|
1,683
|
||||||||||||
|
Adjustment
of tax benefit of
|
||||||||||||||||||||
|
options
exercised
|
-
|
-
|
-
|
-
|
(115)
|
-
|
-
|
(115)
|
||||||||||||
|
Common
stock issued for
|
||||||||||||||||||||
|
services
provided
|
-
|
-
|
30
|
-
|
229
|
-
|
-
|
229
|
||||||||||||
|
Issuance
of warrants
|
-
|
-
|
-
|
-
|
510
|
-
|
-
|
510
|
||||||||||||
|
Common
stock issued for
|
||||||||||||||||||||
|
warrants
exercised
|
-
|
-
|
264
|
3
|
439
|
-
|
-
|
442
|
||||||||||||
|
Foreign
currency translation
|
-
|
|||||||||||||||||||
|
adjustment
|
-
|
-
|
-
|
-
|
-
|
-
|
69
|
69
|
||||||||||||
|
Net
income
|
-
|
-
|
-
|
-
|
-
|
1,169
|
-
|
1,169
|
||||||||||||
|
Balance,
December 31, 2007
|
-
|
-
|
15,508
|
155
|
49,225
|
(28,128)
|
(887)
|
20,365
|
||||||||||||
|
Stock-based
compensation
|
||||||||||||||||||||
|
expense
|
-
|
-
|
-
|
-
|
650
|
-
|
-
|
650
|
||||||||||||
|
Common
stock issued for
|
||||||||||||||||||||
|
options
exercised, net of
|
||||||||||||||||||||
|
30,645
shares returned to
|
||||||||||||||||||||
|
GSE
to pay for employee's
|
||||||||||||||||||||
|
income
tax liabilities of
|
||||||||||||||||||||
|
$251
|
-
|
-
|
194
|
2
|
29
|
-
|
-
|
31
|
||||||||||||
|
Common
stock issued for
|
||||||||||||||||||||
|
services
provided
|
-
|
-
|
17
|
-
|
131
|
-
|
-
|
131
|
||||||||||||
|
Common
stock issued for
|
||||||||||||||||||||
|
warrants
exercised
|
-
|
-
|
249
|
3
|
537
|
-
|
-
|
540
|
||||||||||||
|
Foreign
currency translation
|
||||||||||||||||||||
|
adjustment
|
-
|
-
|
-
|
-
|
-
|
-
|
(327)
|
(327)
|
||||||||||||
|
Net
loss
|
-
|
-
|
-
|
-
|
-
|
(690)
|
-
|
(690)
|
||||||||||||
|
Balance,
December 31, 2008
|
-
|
-
|
15,968
|
160
|
50,572
|
(28,818)
|
(1,214)
|
20,700
|
||||||||||||
|
Stock-based
compensation
|
||||||||||||||||||||
|
expense
|
|
-
|
-
|
-
|
-
|
906
|
-
|
-
|
906
|
|||||||||||
|
Issuance
of common stock
|
-
|
-
|
2,875
|
29
|
15,847
|
-
|
-
|
15,876
|
||||||||||||
|
Common
stock issued for
|
||||||||||||||||||||
|
options
exercised
|
-
|
-
|
58
|
-
|
103
|
-
|
-
|
103
|
||||||||||||
|
Common
stock issued for
|
||||||||||||||||||||
|
services
provided
|
|
-
|
-
|
19
|
-
|
113
|
-
|
-
|
113
|
|||||||||||
|
Common
stock issued for
|
||||||||||||||||||||
|
warrants
exercised
|
|
-
|
-
|
10
|
-
|
18
|
-
|
-
|
18
|
|||||||||||
|
Foreign
currency translation
|
||||||||||||||||||||
|
adjustment
|
|
-
|
-
|
-
|
-
|
-
|
-
|
224
|
224
|
|||||||||||
|
Net
loss
|
|
-
|
-
|
-
|
-
|
-
|
(797)
|
-
|
(797)
|
|||||||||||
|
Balance,
December 31, 2009
|
-
|
$ -
|
18,930
|
$ 189
|
$67,559
|
$ (29,615)
|
$ (990)
|
$
37,143
|
||||||||||||
|
The
accompanying notes are an integral part of these consolidated financial
statements.
|
||||||||||||||||||||
F-7
|
GSE
SYSTEMS, INC. AND SUBSIDIARIES
|
|||||||||||||
|
CONSOLIDATED
STATEMENTS OF CASH FLOWS
|
|||||||||||||
|
(in
thousands)
|
|||||||||||||
|
Years
ended December 31,
|
|||||||||||||
|
2009
|
2008
|
2007
|
|||||||||||
|
Cash
flows from operating activities:
|
|||||||||||||
|
Net
income (loss)
|
$ (797)
|
$ (690)
|
$ 1,169
|
||||||||||
|
Adjustments
to reconcile net income (loss) to net cash
|
|||||||||||||
|
provided
by operating activities:
|
|||||||||||||
|
Depreciation
|
504
|
446
|
258
|
||||||||||
|
Capitalized
software amortization
|
483
|
274
|
323
|
||||||||||
|
Amortization
of deferred financing costs
|
46
|
142
|
533
|
||||||||||
|
Stock-based
compensation expense
|
1,019
|
781
|
573
|
||||||||||
|
Elimination
of profit on Emirates Simulation Academy, LLC contract
|
-
|
28
|
444
|
||||||||||
|
Amortization
of deferred profit on Emirates Simulation Academy, LLC
contract
|
(724)
|
-
|
-
|
||||||||||
|
Equity
loss on investment in Emirates Simulation Academy, LLC
|
732
|
213
|
54
|
||||||||||
|
Reserve
on cash collateral for Emirates Simulation Academy, LLC line of
credit
|
1,291
|
-
|
-
|
||||||||||
|
(Gain)/loss
on derivative instruments
|
(763)
|
453
|
11
|
||||||||||
|
Changes
in assets and liabilities:
|
|||||||||||||
|
Contract
receivables
|
(5,100)
|
(527)
|
(63)
|
||||||||||
|
Prepaid
expenses and other assets
|
155
|
(143)
|
(416)
|
||||||||||
|
Accounts
payable, accrued compensation and accrued expenses
|
4,148
|
(1,033)
|
(1,499)
|
||||||||||
|
Billings
in excess of revenues earned
|
(1,421)
|
1,750
|
403
|
||||||||||
|
Accrued
warranty reserves
|
207
|
342
|
(22)
|
||||||||||
|
Other
liabilities
|
546
|
220
|
103
|
||||||||||
|
Net
cash provided by operating activities
|
326
|
2,256
|
1,871
|
||||||||||
|
Cash
flows from investing activities:
|
|||||||||||||
|
Release
(restriction) of cash as collateral for letters of credit, bank
guarantees,
|
|||||||||||||
|
and
foreign currency contracts
|
2,484
|
(836)
|
(1,799)
|
||||||||||
|
Capital
expenditures
|
(361)
|
(705)
|
(778)
|
||||||||||
|
Capitalized
software development costs
|
(861)
|
(591)
|
(673)
|
||||||||||
|
Investment
in Emirates Simulation Academy, LLC
|
(14)
|
(486)
|
(261)
|
||||||||||
|
Net
cash provided by (used in) investing activities
|
1,248
|
(2,618)
|
(3,511)
|
||||||||||
|
Cash
flows from financing activities:
|
|||||||||||||
|
Proceeds
from issuance of common stock
|
15,997
|
571
|
2,125
|
||||||||||
|
Restriction
of cash for credit facility collateral
|
(600)
|
-
|
-
|
||||||||||
|
Net
proceeds from issuance of common stock and warrants
|
-
|
-
|
9,232
|
||||||||||
|
Decrease
in borrowings under lines of credit
|
-
|
-
|
(2,155)
|
||||||||||
|
Payment
of ManTech preferred stock dividends
|
-
|
-
|
(316)
|
||||||||||
|
Tax
benefit from option exercises
|
-
|
-
|
(115)
|
||||||||||
|
Payment
of preferred stock dividends
|
-
|
-
|
(49)
|
||||||||||
|
Deferred
financing costs
|
(20)
|
(88)
|
-
|
||||||||||
|
Net
cash provided by financing activities
|
15,377
|
483
|
8,722
|
||||||||||
|
Effect
of exchange rate changes on cash
|
45
|
(19)
|
17
|
||||||||||
|
Net
increase in cash and cash equivalents
|
16,996
|
102
|
7,099
|
||||||||||
|
Cash
and cash equivalents at beginning of year
|
8,274
|
8,172
|
1,073
|
||||||||||
|
Cash
and cash equivalents at end of period
|
$ 25,270
|
$ 8,274
|
$ 8,172
|
||||||||||
|
The
accompanying notes are an integral part of these consolidated financial
statements.
|
|||||||||||||
F-8
GSE
SYSTEMS, INC. AND SUBSIDIARIES
NOTES
TO CONSOLIDATED FINANCIAL STATEMENTS
December
31, 2009, 2008, and 2007
1. Business
and basis of presentation
GSE
Systems, Inc. ("GSE Systems", “GSE” or the "Company") provides training
simulators and educational solutions to the energy, process, manufacturing and
government sectors.
The
Company’s operations are subject to certain risks and uncertainties including,
among others, rapid technological changes, success of the Company’s product
development, marketing and distribution strategies, the need to manage growth,
the need to retain key personnel and protect intellectual property, and the
availability of additional financing on terms acceptable to the
Company.
At
December 31, 2009, the Company had cash and cash equivalents of $25.3 million
and another $3.6 million available under its lines of
credit. Although the Company was in default on two of its financial
covenants under its line of credit agreements, the Company has received a
written waiver from its bank. The Company anticipates that its cash
on hand and its normal operations will provide all of the funds necessary to
fund its consolidated operations during the next twelve months. The
Company believes that it will have sufficient liquidity and working capital
without additional financing.
2. Summary
of significant accounting policies
Principles
of consolidation
The
accompanying consolidated financial statements include the accounts of the
Company and its wholly-owned subsidiaries. All intercompany balances and
transactions have been eliminated.
Accounting
estimates
The
preparation of financial statements in conformity with accounting principles
generally accepted in the United States of America requires management to make
estimates and assumptions that affect the reported amounts of assets and
liabilities and disclosure of contingent assets and liabilities at the date of
the financial statements and the reported amounts of revenues and expenses
during the reporting period. The Company’s most significant estimates
relate to revenue recognition, capitalization of software development costs, the
accrual for estimated future warranty costs, and the recoverability of net
deferred tax assets. Actual results could differ from those
estimates.
F-9
Revenue
recognition
The
majority of the Company’s revenue is derived through the sale of uniquely
designed systems containing hardware, software and other materials under
fixed-price contracts. In accordance with U.S. generally accepted
accounting principles, the revenue under these fixed-price contracts is
accounted for on the percentage-of-completion method. This methodology
recognizes revenue and earnings as work progresses on the
contract and is based on an estimate of the revenue and earnings earned to date,
less amounts recognized in prior periods. The Company bases its
estimate of the degree of completion of the contract by reviewing the
relationship of costs incurred to date to the expected total costs that will be
incurred on the project. Estimated contract earnings are reviewed and revised
periodically as the work progresses, and the cumulative effect of any change in
estimate is recognized in the period in which the change is identified.
Estimated losses are charged against earnings in the period such losses are
identified. The Company recognizes revenue arising from contract
claims either as income or as an offset against a potential loss only when the
amount of the claim can be estimated reliably and realization is probable and
there is a legal basis of the claim. There are no probable claims
outstanding as of December 31, 2009.
As the
Company recognizes revenue under the percentage-of-completion method, it
provides an accrual for estimated future warranty costs based on historical and
projected claims experience. The Company’s long-term contracts
generally provide for a one-year warranty on parts, labor and any bug fixes as
it relates to software embedded in the systems.
The
Company’s system design contracts do not normally provide for “post customer
support service” (PCS) in terms of software upgrades, software enhancements or
telephone support. In order to obtain PCS, the customers must
normally purchase a separate contract. Such PCS arrangements are
generally for a one-year period renewable annually and include customer support,
unspecified software upgrades, and maintenance releases. The Company
recognizes revenue from these contracts ratably over the life of the
agreements.
Revenue
from the sale of software licenses which do not require significant
modifications or customization for the Company’s modeling tools are recognized
when the license agreement is signed, the license fee is fixed and determinable,
delivery has occurred, and collection is considered probable.
Revenue
for contracts with multiple elements is recognized in accordance with ASC
605-25 Revenue Recognition-
Multiple Element Arrangements.
Revenues
from certain consulting or training contracts are recognized on a
time-and-material basis. For time-and-material type contracts,
revenue is recognized based on hours incurred at a contracted labor rate plus
expenses.
Cash
and cash equivalents
Cash and
cash equivalents consist of cash on hand, overnight sweep investments, and
highly liquid investments with maturities of three months or less at the date of
purchase.
At
December 31, 2009, the Company had $150,000 in a money market account with Bank
of America (“BOA”). There were no other cash
equivalents.
At
December 31, 2008, the Company had a commercial automated investment account
with BOA under which, at the end of each business day, the funds in the
Company’s operating account were swept into a money market fund. The
funds were returned to the Company’s operating account at the beginning of the
next business day. At December 31, 2008, the Company had $7.5 million
in this money market account.
F-10
Contract
receivables
Contract
receivables include recoverable costs and accrued profit not billed which
represents revenue recognized in excess of amounts billed. The
liability “Billings in excess of revenue earned” represents billings in excess
of revenue recognized.
Billed
receivables are recorded at invoiced amounts. The allowance for
doubtful accounts is based on historical trends of past due accounts,
write-offs, and specific identification and review of past due
accounts. The activity in the allowance for doubtful accounts is as
follows:
|
(in
thousands)
|
As
of and for the
|
|||||||||||
|
Years
ended December 31,
|
||||||||||||
|
2009
|
2008
|
2007
|
||||||||||
|
Beginning
balance
|
$ | 2 | $ | 2 | $ | 3 | ||||||
|
Current
year provision
|
1,744 | - | - | |||||||||
|
Current
year write-offs
|
- | - | (1 | ) | ||||||||
|
Ending
balance
|
$ | 1,746 | $ | 2 | $ | 2 | ||||||
At a
meeting of ESA’s three shareholders held at ESA on February 17, 2010, the
shareholders reached agreement to siginificantly reduce costs and begin to
explore options up to and including the selling of ESA. Accordingly, the
Company increased its allowance for doubtful accounts by $1.6 million for the
outstanding trade receivable from ESA as of December 31, 2009. See
Note 7 Investment in Emirates Simulation Academy, LLC.
Equipment
and leasehold improvements, net
Equipment
is recorded at cost and depreciated using the straight-line method with
estimated useful lives ranging from three to ten years. Leasehold
improvements are amortized over the life of the lease or the estimated useful
life, whichever is shorter, using the straight-line method. Upon sale
or retirement, the cost and related amortization are eliminated from the
respective accounts and any resulting gain or loss is included in operations.
Maintenance and repairs are charged to expense as incurred.
Software
development costs
Certain
computer software development costs are capitalized in the accompanying
consolidated balance sheets in accordance with U.S. generally accepted
accounting principles. Capitalization of computer software
development costs begins upon the establishment of technological feasibility.
Capitalization ceases and amortization of capitalized costs begins when the
software product is commercially available for general release to
customers. Amortization of capitalized computer software development
costs is included in cost of revenue and is determined using the straight-line
method over the remaining estimated economic life of the product, not to exceed
three years.
F-11
Development
expenditures
Development
expenditures incurred to meet customer specifications under contracts are
charged to contract costs. Company sponsored development expenditures
are charged to operations as incurred and are included in selling, general and
administrative expenses. The amounts incurred for Company sponsored development
activities relating to the development of new products and services or the
improvement of existing products and services, were approximately $1.3 million,
$907,000, and $1.2 million, for the years ended December 31, 2009, 2008, and
2007, respectively. Certain of these expenditures were capitalized as
software development costs. See Note 6, Software development
costs.
Impairment
of long-lived assets
Property
and equipment are reviewed for impairment whenever events or changes in
circumstances indicate that the carrying amount of an asset may not be
recoverable. Recoverability of assets to be held and used is measured
by a comparison of the carrying amount of an asset to estimated undiscounted
future cash flows; an impairment charge is recognized by the amount by which the
carrying amount of the asset exceeds the fair value of the
asset. Assets to be disposed of would be separately presented in the
balance sheet and reported at the lower of the carrying amount or fair value
less costs to sell, and are no longer depreciated. The assets and
liabilities of a disposal group classified as held for sale would be presented
separately in the appropriate asset and liability sections of the balance
sheet.
On an
annual basis, and more frequently as conditions indicate, the Company assesses
the recovery of the unamortized capitalized software computer costs by
estimating the net undiscounted cash flows expected to be generated by the sale
of the product. If the undiscounted cash flows are not sufficient to
recover the unamortized software costs the Company will write-down the
investment to its estimated fair value based on future discounted cash
flows. The excess of any unamortized computer software costs over the
related net realizable value is written down and charged to
operations.
Goodwill
is tested annually, on November 30, for impairment, or more frequently if events
and circumstances indicate that the asset might be impaired. An
impairment loss is recognized to the extent that the carrying amount exceeds the
asset’s fair value. For goodwill, the impairment determination is
made at the reporting unit level and consists of two steps. First,
the Company determines the fair value of a reporting unit and compares it to its
carrying amount. Second, if the carrying amount of a reporting unit
exceeds its fair value, an impairment loss is recognized for any excess of the
carrying amount of the reporting unit’s goodwill over the implied fair value of
that goodwill. The implied fair value of goodwill is determined by
allocating the fair value of the reporting unit in a manner similar to a
purchase price allocation.
The residual fair value after this allocation is the implied fair value
of the reporting unit goodwill. No impairment losses were recognized
in 2009, 2008 or 2007.
Foreign
currency translation
Balance
sheet accounts for foreign operations are translated at the exchange rate at the
balance sheet date, and income statement accounts are translated at the average
exchange rate for the period. The resulting translation adjustments
are included in other comprehensive income (loss). Transaction gains
and losses, resulting from changes in exchange rates, are recorded in operating
income in the period in which they occur. For the years ended
December 31, 2009, 2008, and 2007, foreign currency transaction gains (losses)
were approximately $29,000, $41,000, and ($60,000), respectively.
F-12
Warranty
As the
Company recognizes revenue under the percentage-of-completion method, it
provides an accrual for estimated future warranty costs based on historical
experience and projected claims. The activity in the warranty
accounts is as follows:
|
(in
thousands)
|
As
of and for the
|
|||||||||||
|
Years
ended December 31,
|
||||||||||||
|
2009
|
2008
|
2007
|
||||||||||
|
Beginning
balance
|
$ | 1,066 | $ | 724 | $ | 746 | ||||||
|
Current
year provision
|
605 | 799 | 458 | |||||||||
|
Current
year claims
|
(407 | ) | (448 | ) | (483 | ) | ||||||
|
Currency
adjustment
|
10 | (9 | ) | 3 | ||||||||
|
Ending
balance
|
$ | 1,273 | $ | 1,066 | $ | 724 | ||||||
Income
taxes
Income
taxes are provided under the asset and liability method. Under this
method, deferred income taxes are determined based on the differences between
the financial statement and tax bases of assets and liabilities using enacted
tax rates in effect for the year in which the differences are expected to
reverse. Valuation allowances are established, when necessary, to
reduce deferred tax assets to the amounts expected to be realized. Provision is
made for the Company's current liability for federal, state and foreign income
taxes and the change in the Company's deferred income tax assets and
liabilities.
Stock-based
compensation
Compensation
expense related to share based awards is recognized on a pro rata straight-line
basis based on the value of share awards that are scheduled to vest during the
requisite service period. During the twelve months ended December 31,
2009 and 2008, the Company recognized $906,000 and $650,000, respectively, of
pre-tax stock-based compensation expense under the fair value
method. As of December 31, 2009, the Company had $3.2 million of
unrecognized compensation related to the unvested portion of outstanding stock
option awards expected to be recognized through October 2015.
Income
(loss) per share
Basic
income (loss) per share is based on the weighted average number of outstanding
common shares for the period. Diluted income (loss) per share adjusts
the weighted average shares outstanding for the potential dilution that could
occur if stock options, warrants or convertible preferred stock were exercised
or converted into common stock. The number of common shares and
common share equivalents used in the determination of basic and diluted income
(loss) per share was as follows:
F-13
[
|
(in
thousands, except for share and per share amounts)
|
||||||||||||
|
Years
ended December 31,
|
||||||||||||
|
2009
|
2008
|
2007
|
||||||||||
|
Numerator:
|
||||||||||||
|
Net
income (loss)
|
$ | (797 | ) | $ | (690 | ) | $ | 1,169 | ||||
|
Preferred stock dividends
|
- | - | (49 | ) | ||||||||
|
Net
income (loss) attributed to
|
||||||||||||
|
common
stockholders
|
$ | (797 | ) | $ | (690 | ) | $ | 1,120 | ||||
|
Denominator:
|
||||||||||||
|
Weighted-average shares outstanding for basic
|
||||||||||||
|
earnings
per share
|
16,938,392 | 15,746,616 | 12,927,128 | |||||||||
|
Effect
of dilutive securities:
|
||||||||||||
|
Employee
stock options, warrants and
|
||||||||||||
|
convertible
preferred stock
|
- | - | 1,890,525 | |||||||||
|
Adjusted weighted-average shares outstanding
|
||||||||||||
|
and
assumed conversions for diluted
|
||||||||||||
|
earnings
per share
|
16,938,392 | 15,746,616 | 14,817,653 | |||||||||
|
Shares related to dilutive securities excluded
|
||||||||||||
|
because
inclusion would be anti-dilutive
|
1,791,757 | 1,196,746 | 74,808 | |||||||||
Conversion of outstanding stock
options and warrants was not assumed for the years ended December 31, 2009 and
2008, because the impact was anti-dilutive. Included in the 1,791,757 shares and
the 1,196,746 shares related to dilutive securities excluded from the diluted
earnings per share calculation for the years ended December 31, 2009 and 2008,
respectively, were in-the-money options and warrants totaling 641,631 shares and
910,480 shares, respectively. The difference between the basic and diluted
number of weighted average shares outstanding for the year ended December 31,
2007, represents dilutive stock options and warrants to purchase shares of
common stock computed under the treasury stock method, using the average market
price during the period. The net income for the year ended December
31, 2007, was decreased by preferred stock dividends of $49,000 in calculating
the per share amounts.
Concentration
of credit risk
The
Company is subject to concentration of credit risk with respect to contract
receivables. Credit risk on contract receivables is mitigated by the nature of
the Company's worldwide customer base and its credit policies. The
Company's customers are not concentrated in any specific geographic region, but
are concentrated in the energy industry. The following customers have provided
more than 10% of the Company’s revenue for the indicated period:
F-14
|
Years
ended December 31,
|
|||||
|
2009
|
2008
|
2007
|
|||
|
Slovenské
elektrárne, a.s.
|
13.5%
|
0.0%
|
0.0%
|
||
|
Emerson
Process Management
|
12.1%
|
16.2%
|
7.9%
|
||
|
Titan-2
Concern
|
10.7%
|
0%
|
0%
|
||
|
American
Electric Power
|
6.8%
|
10.5%
|
0.5%
|
||
|
Emirates
Simulation Academy LLC
|
0.0%
|
4.2%
|
31.1%
|
||
Fair
values of financial instruments
The
carrying amounts of current assets and current liabilities reported in the
Consolidated Balance Sheets approximate fair value due to their short term
duration.
Deferred
financing fees
The
Company amortizes the cost incurred to obtain debt financing over the term of
the underlying obligations. The amortization of deferred financing
costs is included in interest expense. Unamortized deferred financing
costs are classified within other assets in the consolidated balance
sheets.
Derivative
instruments
The
Company adopted ASC 815, Derivatives and Hedging, on
January 1, 2009. ASC 815 enhances the disclosure requirements about
an entity’s derivative instruments and hedging activities.
The
Company utilizes forward foreign currency exchange contracts to manage market
risks associated with the fluctuations in foreign currency exchange rates. It is
the Company's policy to use such derivative financial instruments to protect
against market risk arising in the normal course of business in order to reduce
the impact of these exposures. The Company minimizes credit exposure by limiting
counterparties to nationally recognized financial institutions.
As of
December 31, 2009, the Company had foreign exchange contracts for sale of
approximately 2 million Pounds Sterling, 3 million Euro, and 759 million
Japanese Yen at fixed rates. At December 31, 2008, the Company had
foreign exchange contracts for sale of approximately 2 million Pounds Sterling,
4 million Euro, and 68 million Japanese Yen at fixed rates. The contracts expire
on various dates through February 2014. The Company had not
designated the foreign exchange contracts as hedges and had recorded the
estimated fair value of the contracts in the consolidated balance sheet as
follows:
F-15
|
December
31,
|
||||||||
|
(in
thousands)
|
2009
|
2008
|
||||||
|
Asset
derivatives
|
||||||||
|
Prepaid
expenses and other current assets
|
$ | 515 | $ | 14 | ||||
|
Other assets
|
396 | 537 | ||||||
| 911 | 551 | |||||||
|
Liability
derivatives
|
||||||||
|
Other
current liabilities
|
(34 | ) | (426 | ) | ||||
|
Other
liabilities
|
(65 | ) | (183 | ) | ||||
| (99 | ) | (609 | ) | |||||
|
Net
fair value
|
$ | 812 | $ | (58 | ) | |||
The
changes in the fair value of the foreign exchange contracts are included in gain
(loss) on derivative instruments in the consolidated statement of
operations.
The
foreign currency denominated trade receivables, unbilled receivables, billings
in excess of revenue earned and subcontractor accruals that are related to the
outstanding foreign exchange contracts are remeasured at the end of each period
into the functional currency using the current exchange rate at the end of the
period. The gain or loss resulting from such remeasurement is
also included in gain (loss) on derivative instruments in the consolidated
statement of operations
For the
years ended December 31, 2009, 2008 and 2007, the Company recognized a net gain
(loss) on its derivative instruments as outlined below:
|
Year
ended December 31,
|
|||||
|
(in
thousands)
|
2009
|
2008
|
2007
|
||
|
Foreign
exchange contracts- change
|
$ 851
|
$ (174)
|
$ (11)
|
||
|
in
fair value
|
|||||
|
Remeasurement
of related contract
|
|||||
|
receivables
and billings in excess
|
|||||
|
of
revenue earned
|
(88)
|
(279)
|
-
|
||
|
$ 763
|
$ (453)
|
$ (11)
|
|||
New
accounting standards
In June
2009, the Financial Accounting Standards Board (“FASB”) issued Accounting
Standards Codification (“ASC” or “the Codification”) as the source of
authoritative generally accepted accounting principles ("GAAP") recognized by
the FASB for non-governmental entities. The Codification is effective
for financial statements issued for reporting periods that end after September
15, 2009, which for GSE was September 30, 2009. The Codification
superseded all then-existing non-SEC accounting and reporting
standards. The Codification did not change rules and interpretations
of the SEC which are also sources of authoritative GAAP for SEC
registrants. There were no changes to the Company’s consolidated
financial statements upon adoption.
F-16
In
October 2009, the FASB issued Accounting Standards Update (“ASU”) 2009-13,
Revenue Recognition (Topic 605), Multiple-Deliverable
Arrangements. ASU 2009-13 amends the guidance that in the absence of
vendor-specific objective and third-party evidence for deliverables in
multiple-deliverable arrangements, companies will be required to develop a best
estimate of the selling price to separate deliverables and allocate arrangements
consideration using the relative selling price method. ASU 2009-13
expands the disclosure requirements for multiple-deliverable revenue
arrangements. The guidance will be effective for financial statements
issued for fiscal years beginning after June 15, 2010. Early adoption
is permitted. The Company is currently evaluating the potential
impact on its financial statements.
In
October 2009, the FASB issued ASU 2009-14, Software (Topic 985), Certain Revenue
Arrangements that Include Software Elements. ASU 2009-14 amends the
guidance to exclude for the scope of software revenue accounting requirements
tangible products if the product contains both software and non-software
components that function together to deliver a product’s essential functionality
and factors to consider in determining whether a product is within the scope of
the guidance. The guidance will be effective for financial statements
issued for fiscal years beginning after June 15, 2010. Early adoption
is permitted. The Company is currently evaluating the potential
impact on its financial statements.
3. Contract
receivables
Contract
receivables represent balances due from a broad base of both domestic and
international customers. All contract receivables are considered to be
collectible within twelve months. Recoverable costs and accrued profit not
billed represent costs incurred and associated profit accrued on contracts that
will become billable upon future milestones or completion of
contracts. The components of contract receivables are as
follows:
|
(in
thousands)
|
December
31,
|
||||||||
|
2009
|
2008
|
||||||||
|
Billed
receivables
|
$ 8,183
|
$ 7,320
|
|||||||
|
Recoverable
costs and accrued profit not billed
|
9,504
|
3,633
|
|||||||
|
Allowance
for doubtful accounts
|
(1,746)
|
(2)
|
|||||||
|
Total
contract receivables, net
|
$ 15,941
|
$ 10,951
|
|||||||
4. Prepaid
expenses and other current assets
Prepaid
expenses and other current assets consist of the following:
|
(in
thousands)
|
December
31,
|
|||||||
|
2009
|
2008
|
|||||||
|
Prepaid
expenses
|
$ 348
|
$ 701
|
||||||
|
Employee
advances
|
-
|
19
|
||||||
|
Deferred
income taxes- current
|
-
|
126
|
||||||
|
Other
current assets
|
1,143
|
264
|
||||||
|
Total
|
$ 1,491
|
$ 1,110
|
||||||
F-17
5. Equipment
and leasehold improvements
Equipment
and leasehold improvements consist of the following:
|
(in
thousands)
|
December
31,
|
||||||||
|
2009
|
2008
|
||||||||
|
Computer
equipment
|
$ 2,954
|
$ 2,965
|
|||||||
|
Leasehold
improvements
|
166
|
113
|
|||||||
|
Furniture
and fixtures
|
944
|
916
|
|||||||
|
4,064
|
3,994
|
||||||||
|
Accumulated
depreciation
|
(3,075)
|
(2,861)
|
|
||||||
|
Equipment
and leasehold improvements, net
|
$ 989
|
$ 1,133
|
|||||||
Depreciation
expense was approximately $504,000, $446,000, and $258,000 for the years ended
December 31, 2009, 2008, and 2007, respectively.
6. Software
development costs
Software
development costs, net, consist of the following:
|
(in
thousands)
|
December
31,
|
|||||||
|
2009
|
2008
|
|||||||
|
Capitalized
software development costs
|
$ 2,318
|
$ 1,878
|
||||||
|
Accumulated
amortization
|
(453)
|
(391)
|
||||||
|
Software
development costs, net
|
$ 1,865
|
$ 1,487
|
||||||
Software
development costs capitalized were approximately $861,000, $591,000, and
$673,000 for the years ended December 31, 2009, 2008, and 2007,
respectively. Amortization of software development costs capitalized
was approximately $483,000, $274,000, and $323,000, for the years ended December
31, 2009, 2008, and 2007, respectively, and was included in cost of
revenue.
7. Investment
in Emirates Simulation Academy, LLC
On
November 8, 2005, the Emirates Simulation Academy, LLC (“ESA”), headquartered in
Abu Dhabi, United Arab Emirates, was formed to build and operate
simulation training academies in the Arab Gulf Region. The members of
the limited liability company include Al Qudra Holding PJSC of the United Arab
Emirates (60% ownership), the Centre of Excellence for Applied Research and
Training of the United Arab Emirates (30% ownership) and GSE (10%
ownership). Prior to the charges taken in the fourth quarter as
described below, GSE’s investment in ESA totaled $117,000 and $718,000 at
December 31, 2009 and 2008, respectively, and was included on the consolidated
balance sheet in other assets. The Company accounts for its
investment in ESA using the equity method. For the years ended
December 31, 2009 and 2008, the Company recognized a $615,000 and $213,000
equity loss, respectively, on its investment in ESA. The equity loss
was recorded in other expense, net.
F-18
In
January 2006, GSE received a $15.1 million contract from ESA (the “ESA
Contract”) to supply five simulators and an integrated training program. The
Company received change orders totaling $1.8 million from ESA which increased
the total order value to $16.9 million. For the years ended December 31, 2008
and 2007, the Company recognized $1.2 million and $9.9 million, respectively, of
contract revenue on this project using the percentage-of-completion method,
which accounted for 4.2% and 31.2% of the Company’s consolidated
revenue. In accordance with the equity method of accounting, the
Company eliminated 10% of the profit from the ESA Contract as the training
simulators are assets that have been recorded on the books of ESA, and the
Company was thus required to eliminate its proportionate share of the profit
included in the asset value. The profit elimination totaled $28,000
and $444,000 for the years ended December 31, 2008 and 2007, respectively, and
was recorded as an other liability on the balance sheet. ESA
assigned a four year life to the simulators and began to amortize the training
simulators on their books effective January 1, 2009. Accordingly, on
January 1, 2009, GSE began to amortize the deferred profit to other income over
a four year period, recognizing income of $181,000 in the year ended December
31, 2009.
Under the
terms of the ESA Contract, the Company provided a $2.1 million performance bond
to ESA, this performance bond expired on September 30, 2009 and the restricted
cash that had collateralized the performance bond was released by BOA in early
October 2009.
The
Company has provided a partial guarantee of 10% of ESA’s credit facility with
Union National Bank; $1.2 million was deposited into a restricted
interest-bearing account with UNB in 2006. The interest earned on the
restricted cash is part of the pledged deposit.
At
December 31, 2009, ESA had borrowed a total of AED 36.4 million ($9.9 million)
from its credit facility with Union National Bank, including accrued interest
payable. ESA was delinquent in paying both principal and interest (a
total of AED 5.3 million or $1.5 million) and in January 2010, UNB drew upon the
guarantees of the three partners to pay off the delinquency, withdrawing
$145,000 from GSE’s restricted cash account. In February 2010, GSE
was notified that ESA had missed another loan payment and that 10% of the amount
due ($24,000) would be withdrawn from the Company’s restricted cash
account.
At a
meeting of ESA’s three shareholders held at ESA on February 17, 2010, the
shareholders reached agreement to siginificantly reduce costs and begin to
explore options up to and including the selling of ESA.
Accordingly,
based upon these events, the Company has determined that its remaining
investment in ESA at December 31, 2009 has been impaired and has established
reserves for the $1.6 million trade receivable due from ESA at December 31, 2009
and for the cash that GSE has on deposit with UNB as a partial guarantee for
ESA’s credit facility. Partially offsetting these charges is the
reversal of the remaining deferred profit related to the Company’s sale of five
simulators to ESA in prior years and the remaining agent fee that was due upon
payment of the final outstanding receivable. The charges recorded and
the presentation in the statement of operations for the year ended December 31,
2009 are as follows:
F-19
|
Year
ended
|
|||
|
(in
thousands)
|
December
31, 2009
|
||
|
Trade
receivable
|
$ 1,604
|
||
|
Accrued
agent fee
|
(96)
|
||
|
Operating
expense
|
1,508
|
||
|
Restricted
cash- bank guarantee and
|
|||
|
accrued
interest income
|
1,291
|
||
|
Investment
in ESA
|
117
|
||
|
Deferred
profit
|
(543)
|
||
|
Other
expense, net
|
865
|
||
|
Total
|
$ 2,373
|
||
8. Fair
Value of Financial Instruments
The
Company adopted ASC 820, Fair Value Measurements and Disclosures for
nonfinancial assets and nonfinancial liabilities measured on a nonrecurring
basis in the first quarter of fiscal 2009, and such adoption did not have a
material impact on the Company’s financial statement disclosures.
ASC 820
defines fair value as the exchange price that would be received for an asset or
paid to transfer a liability (an exit price) in the principle or most
advantageous market for the asset or liability in an orderly transaction between
market participants on the measurement date. ASC 820 also establishes a fair
value hierarchy which requires an entity to maximize the use of observable
inputs and minimize the use of unobservable inputs when measuring fair
value.
The
levels of the fair value hierarchy established by ASC 820 are:
Level
1: inputs are quoted prices, unadjusted, in active markets for
identical assets or liabilities that the reporting entity has the ability to
access at the measurement date.
Level
2: inputs are other than quoted prices included within Level 1 that
are observable for the asset or liability, either directly or
indirectly. A Level 2 input must be observable for substantially the
full term of the asset or liability.
Level
3: inputs are unobservable and reflect the reporting entity’s own
assumptions about the assumptions that market participants would use in pricing
the asset or liability.
The
Company considers the recorded value of certain of its financial assets and
liabilities, which consist primarily of cash and cash equivalents, accounts
receivable and accounts payable, to approximate the fair value of the respective
assets and liabilities at December 31, 2009 and December 31, 2008 based upon the
short-term nature of the assets and liabilities.
F-20
At
December 31, 2009, the Company had $150,000 deposited in a money market account
with BOA. At December 31, 2008, the Company had a commercial
automated investment account under which, at the end of each business day, the
funds in the Company’s operating account were swept into a money market
fund. The funds were returned to the operating account at the
beginning of the next business day. At December 31, 2008, the balance
in this fund was $7.5 million and was included on the balance sheet under cash
and cash equivalents. The Company terminated this automated
investment account in the second quarter 2009.
As of
December 31, 2009, the Company was contingently liable for five standby letters
of credit, one bank guarantee and two surety bonds totaling $3.5 million which
represent performance bonds on eight contracts. The Company has
deposited the full value of two of the standby letters of credit in certificates
of deposit ($336,000) which have been restricted in that the Company does not
have access to these funds until the related letters of credit have
expired. The cash has been recorded on the Company’s balance sheet at
December 31, 2009 as restricted cash and long-term restricted cash depending on
the expiration date of the certificate of deposit.
On May 5,
2009, one of the Company’s two credit agreements with Bank of America was
amended to increase the principal amount of the line from $1.5 million to $2.5
million. In addition, the agreement was amended to include a $600,000
certificate of deposit issued by Bank of America in the borrowing base
calculation to determine the maximum amount of available funds that the Company
could borrow from the line. The cash deposited in this certificate of
deposit has been recorded on the Company’s balance sheet at December 31, 2009 as
restricted cash.
The
following table presents assets and liabilities measured at fair value at
December 31, 2009:
|
Quoted
Prices
|
Significant
|
|||||||||||||||
|
in
Active
|
Other
|
Significant
|
||||||||||||||
|
Markets
for
|
Observable
|
Unobservable
|
||||||||||||||
|
Identical
Assets
|
Inputs
|
Inputs
|
||||||||||||||
|
(in
thousands)
|
(Level
1)
|
(Level
2)
|
(Level
3)
|
Total
|
||||||||||||
|
Money
market fund
|
$ | 150 | $ | - | $ | - | $ | 150 | ||||||||
|
Certificates
of deposit
|
936 | - | - | 936 | ||||||||||||
|
Foreign
exchange contracts
|
- | 911 | - | 911 | ||||||||||||
|
Total
assets
|
$ | 1,086 | $ | 911 | $ | - | $ | 1,997 | ||||||||
|
Foreign
exchange contracts
|
$ | - | $ | (99 | ) | $ | - | $ | (99 | ) | ||||||
|
Total
liabilities
|
$ | - | $ | (99 | ) | $ | - | $ | (99 | ) | ||||||
F-21
9. Long-term
debt
At
December 31, 2009 and 2008, the Company had no long-term debt.
Line
of Credit
On March
28, 2008, the Company entered into two separate revolving line of credit
agreements for two-year revolving lines of credit with Bank of America, N.A.
(“BOA”). The Company and its subsidiary, GSE Power Systems, Inc., are
jointly and severally liable as co-borrowers. The credit facilities
enable the Company to borrow funds to support working capital needs and standby
letters of credit. The first line of credit in the principal amount
of up to $3.5 million enables the Company to borrow funds up to 90% of eligible
foreign accounts receivable, plus 75% of eligible unbilled foreign receivables
and 100% of cash collateral pledged to BOA on outstanding warranty standby
letters of credit. This line of credit is 90% guaranteed by the Export-Import
Bank of the United States. The interest rate on this line of credit
is based on the daily LIBOR rate plus 150 basis points, with interest only
payments due monthly. The second line of credit was originally in the
principal amount of up to $1.5 million, however, on May 5, 2009, the credit
agreement was amended to increase the principal amount to $2.5
million. This line of credit enables the Company to borrow funds up
to 80% of domestic accounts receivable, 30% of domestic unbilled receivables and
100% of the principal balance of a $600,000 certificate of deposit issued by
BOA. The interest rate on this line of credit is based on the daily
LIBOR rate plus 225 basis points, with interest only payments due monthly. The
credit agreements contain certain restrictive covenants regarding future
acquisitions, incurrence of debt and the payment of dividends. In
addition, both credit agreements contain financial covenants with respect to the
Company’s minimum tangible net worth, debt service coverage ratio, and funded
debt to EBITDA ratio. At December 31, 2009, the Company was in
default on two of the financial covenants. The financial covenant
calculations at December 31, 2009 are shown below:
|
As
of
|
||||
|
Covenant
|
Dec.
31, 2009
|
|||
|
Tangible
net worth
|
Must
Exceed $15.0 million
|
$33.5
million
|
||
|
Debt
service coverage ratio
|
Must
Exceed 1.25 : 1.00
|
(1,582)
: 1.00
|
||
|
Funded
debt to EBITDA ratio
|
Not
to Exceed 2.50 : 1.00
|
2.74
: 1.00
|
At
December 31, 2009 and throughout all of 2009, the Company had no outstanding
borrowings against its lines of credit. Accordingly, the Company did
not incur any bank interest expense in 2009. However, the Company did
incur approximately $1,000 of interest expense related to late payments to
vendors. This, in conjunction with the Company’s net loss for the
year ended December 31, 2009, has resulted in a negative debt service coverage
ratio. For the funded debt to EBITDA ratio calculation, the
amount of outstanding letters of credit and bank guarantees that are not cash
collateralized are included as funded debt. The Company has received
a written waiver from BOA.
At
December 31, 2009, the Company’s available borrowing base under the two lines of
credit was $6.0 million of which $2.4 million had been utilized as collateral
for three standby letters of credit.
F-22
10. Income
taxes
The
consolidated income (loss) before income taxes, by domestic and foreign sources,
is as follows:
|
(in
thousands)
|
Years
ended December 31,
|
|||||||
|
2009
|
2008
|
2007
|
||||||
|
Domestic
|
$ (2,115)
|
$ (674)
|
$ 1,496
|
|||||
|
Foreign
|
2,235
|
113
|
(284)
|
|||||
|
Total
|
$ 120
|
$ (561)
|
$ 1,212
|
|||||
The provision for income taxes is as follows:
|
Years
ended December 31,
|
||||||||
|
2009
|
2008
|
2007
|
||||||
|
Federal
|
$ 29
|
$ -
|
$ (111)
|
|||||
|
State
|
80
|
10
|
7
|
|||||
|
Foreign
|
512
|
245
|
147
|
|||||
|
Subtotal
|
621
|
255
|
43
|
|||||
|
Federal
and state
|
-
|
-
|
-
|
|||||
|
Foreign
|
296
|
(126)
|
-
|
|||||
|
Subtotal
|
296
|
(126)
|
-
|
|||||
|
Total
|
$ 917
|
$ 129
|
$ 43
|
|||||
The
Company is entitled to a deduction for federal and state tax purposes with
respect to employees’ stock option activity. The net reduction in
taxes otherwise payable in excess of any amount credited to income tax benefit
has been credited to additional paid-in capital. As of December 31,
2009, the Company had $5.5 million of unrecognized excess tax deductions related
to compensation for stock option exercises which will be recognized when the net
operating loss carryforwards are fully utilized and those excess tax benefits
result in a reduction to income taxes payable.
The
effective income tax rate differed from the statutory federal income tax rate
due to the following:
F-23
|
Effective
Tax Rate Percentage (%)
|
||||||||||
|
Years
ended December 31,
|
||||||||||
|
2009
|
2008
|
2007
|
||||||||
|
Statutory
federal income tax rate
|
34.0
|
%
|
(34.0)
|
%
|
34.0
|
%
|
||||
|
State
income taxes, net of federal tax benefit
|
44.0
|
1.2
|
0.4
|
|||||||
|
Effect
of foreign operations
|
282.9
|
0.2
|
16.2
|
|||||||
|
Change
in valuation allowance
|
96.7
|
39.6
|
(42.0)
|
|||||||
|
Other,
principally permanent differences
|
306.6
|
16.0
|
(5.1)
|
|||||||
|
Effective
tax rate
|
764.2
|
%
|
23.0
|
%
|
3.5
|
%
|
||||
Deferred income taxes arise from
temporary differences between the tax bases of assets and liabilities and their
reported amounts in the financial statements. A summary of the tax
effect of the significant components of the deferred income tax assets
(liabilities) is as follows:
|
(in
thousands)
|
December
31,
|
|||||||||
|
2009
|
2008
|
2007
|
||||||||
|
Deferred
tax assets:
|
||||||||||
|
Net
operating loss carryforwards
|
$ 5,650
|
$ 6,691
|
$ 6,799
|
|||||||
|
Capital
loss carryforwards
|
2,443
|
1,675
|
1,584
|
|||||||
|
Accruals
and reserves
|
251
|
61
|
31
|
|||||||
|
Expenses
not currently deductible for tax purposes
|
1,153
|
412
|
264
|
|||||||
|
Alternative
minimum tax credit carryforwards
|
166
|
162
|
162
|
|||||||
|
Other
|
660
|
654
|
479
|
|||||||
|
Total
deferred tax asset
|
10,323
|
9,655
|
9,319
|
|||||||
|
Valuation
allowance
|
(8,375)
|
(8,259)
|
(8,868)
|
|||||||
|
Total
deferred tax asset less valuation allowance
|
1,948
|
1,396
|
451
|
|||||||
|
Deferred
tax liabilities:
|
||||||||||
|
Tax
in excess of book depreciation
|
-
|
(8)
|
-
|
|||||||
|
Undistributed
earnings of foreign subsidiary
|
(1,313)
|
(683)
|
-
|
|||||||
|
Software
development costs
|
(724)
|
(579)
|
(451)
|
|||||||
|
Other
|
(87)
|
-
|
-
|
|||||||
|
Total
deferred tax liability
|
(2,124)
|
(1,270)
|
(451)
|
|||||||
|
Net
deferred tax asset (liability)
|
$ (176)
|
$ 126
|
$ -
|
|||||||
In assessing the realizability of deferred tax assets, management considers whether it is more likely than not that some or all of the deferred tax assets will not be realized. The ultimate realization of deferred tax assets is dependent upon the generation of future taxable income during the periods in which those temporary differences become deductible. Management considers the scheduled reversal of deferred tax liabilities and projected future income in making this assessment. Management believes that the Company will achieve profitable operations in future years that will enable the Company to recover the benefit of its deferred tax assets. However, other than for a portion of the deferred tax assets that are related to the Company’s Swedish subsidiary, the Company presently does not have sufficient objective evidence to substantiate the recovery of the deferred tax assets. Accordingly, the Company has established a full $8.4 million valuation allowance on its deferred tax assets at December 31, 2009. The valuation allowance for deferred tax assets increased by $116,000 in 2009, decreased by $609,000 in 2008 and decreased by $1.3 million in 2007.
F-24
At
December 31, 2009, the Company’s largest deferred tax asset related to a U.S.
net operating loss carryforward of $15.4 million which expires in various
amounts between 2017 and 2028. The amount of U.S. loss carryforward
which can be used by the Company each year is limited due to changes in the
Company’s ownership which occurred in 2003. Thus, a portion of the
Company’s loss carryforward may expire unutilized.
The
Company is not aware of any tax positions for which it is reasonably possible
that the total amounts of unrecognized tax benefits would significantly decrease
or increase within the next twelve months.
The
Company’s policy for recording interest and penalties associated with uncertain
tax positions is to record such items as a component of income tax
expense. As of December 31, 2009, the Company has no accrued interest
or penalties.
11. Capital
stock
The Company’s Board of Directors has
authorized 32,000,000 total shares of capital stock, of which 30,000,000 are
designated as common stock and 2,000,000 are designated as preferred stock. The
Board of Directors has the authority to establish one or more classes of
preferred stock and to determine, within any class of preferred stock, the
preferences, rights and other terms of such class.
On June
22, 2007, the Company raised $9.2 million, net of associated fees of $768,000,
through the sale of 1,666,667 shares (the “Shares”) of its common stock, $.01
par value per share, by means of a private placement to selected institutional
investors. Each investor received a five-year warrant to purchase GSE
common stock (the “Warrant Shares”) equal to 10% of the shares of common stock
that they had purchased at an exercise price of $6.00 per share (the
“Warrants”). In aggregate, the Company issued Warrants to purchase a
total of 166,667 shares of GSE common stock.
The
Company filed its registration statement on Form S-3 (the “Registration
Statement”) with the Securities and Exchange Commission (the “Commission”) on
July 16, 2007 covering the offer and sale, from time to time, of the Shares, the
Warrant Shares and shares of common stock issuable upon exercise of warrants
that may be issued as liquidated damages under the terms of a certain
registration rights agreement entered into between the Company and the investors
(the “Registration Rights Agreement”) in connection with the private
placement. The Registration Statement became effective on August 8,
2007 and, pursuant to the provisions of the Registration Rights Agreement, the
Company is obligated to use commercially reasonable efforts to, after the date
on which the Registration Statement becomes effective, cause the Registration
Statement to remain continuously effective as to all Shares and Warrant Shares,
other than for an aggregate of more than 30 consecutive trading days or for more
than an aggregate of 60 trading days in any 12-month period. In the event of a
default of the foregoing obligation, the Company will be required to issue to
the investors, as liquidated damages, on the date the foregoing default occurs
and each monthly anniversary thereafter, a number of warrants (on the same terms
as the Warrants) equal to 2% of the number of Shares then held by such investor,
not to exceed 10% of the total number of Shares then held by such investor, and
thereafter cash, in an amount equal to 2% of the aggregate purchase price paid
by the investors, not to exceed 30% of the aggregate purchase price paid by the
investors.
F-25
At the
date of issuance, the fair value of the Warrants was $510,000 and the fair value
of the Shares was $9.5 million. The fair value of the Warrants
and the Shares was determined by the use of the relative fair value method, in
which the $10.0 million gross proceeds was allocated based upon the fair values
of the Warrants, as determined by using the Black-Scholes Model, and the Shares,
as determined by the closing price of the common stock on the NYSE Amex Stock
Exchange on the date the transaction was closed.
The
Company paid the placement agent a fee in the amount of 6% of the gross proceeds
received by the Company from the offering ($600,000). In addition to
the placement agent fee, the Company paid $168,000 of other transaction fees
related to the offering.
The
proceeds were used to pay down the Company’s line of credit and for other
working capital purposes.
On
September 4, 2009, the Company raised $15.0 million through the sale of 2.5
million shares of its common stock, $.01 par value per share. The
shares were sold under a shelf registration statement which was declared
effective by the Securities and Exchange Commission on August 21,
2009. On September 23, 2009, the Company raised an additional
$2,250,000 when the Company’s underwriter, exercised an over-allotment option in
full to purchase an additional 375,000 shares of the Company’s common stock at
the public offering price of $6.00 per share. The aggregate net
proceeds received by the Company from the two transactions was approximately
$15.9 million. The Company paid the underwriter a fee in the amount
of 6% of the gross proceeds received by the Company from the offering
($1,035,000) and paid 339,000 in other transaction fees.
As of
December 31, 2009, the Company has reserved 2,708,553 shares of common stock for
issuance: 1,758,902 shares upon exercise of outstanding stock options; 302,709
shares upon exercise of outstanding warrants; 463,603 shares for future grants
under the Company’s 1995 Long-Term Incentive Plan; 16,672 shares to be issued in
accordance with the Company’s investor relations consulting agreement; and
166,667 shares upon exercise of warrants that the Company is obligated to issue
in the event of a default under its June 2007 common stock sale as discussed
above.
12. Series
A Convertible Preferred Stock
On
February 28, 2006, the Company raised $3.9 million, net of associated fees of
$395,000, through the sale of 42,500 shares of Series A Cumulative Convertible
Preferred Stock and Warrants by means of a private placement to “accredited
investors”, as that term is used in rules and regulations of the Securities and
Exchange Commission. The Convertible Preferred Stock was convertible
at any time into a total of 2,401,133 shares of GSE common stock at a conversion
price of $1.77 per share. The conversion price was equal to 110% of the closing
price of the Company’s Common Stock on February 28, 2006, the date the sale of
the Convertible Preferred Stock was completed.
F-26
Each
investor received a five-year warrant to purchase GSE common stock equal to 20%
of the shares they would receive from the conversion of the Convertible
Preferred Stock, at an exercise price of $1.77. In aggregate, the
Company issued warrants to purchase a total of 480,226 shares of GSE common
stock. The Convertible Preferred Stockholders were entitled to an 8%
cumulative dividend, payable on a semiannual basis every June 30 and December
30. In 2007, the Company paid dividends totaling $49,000 to the
preferred stockholders
At any
time after March 1, 2007, the Company had the right to convert the Preferred
Stock into shares of GSE common stock when the average of the current stock
price during the twenty trading days immediately prior to the date of such
conversion exceeded 200% of the Series A Conversion Price. On March
7, 2007, the Company sent notice to the holders of the remaining 20,000
outstanding shares of its Preferred Stock that the average current stock price
for the prior twenty trading days had exceeded 200% of the Conversion Price, and
that the Company was converting the outstanding Preferred Stock into common
stock. The 20,000 shares of Preferred Stock converted to 1,129,946
shares of GSE common stock. In 2007, the Preferred Stockholders
exercised 62,147 warrants; no warrants were exercised in 2009 or
2008.
The
Company paid the placement agent, as part of its fee for assisting the Company
with the offering, 6% of the gross proceeds received by the Company from the
offering ($255,000) plus five-year warrants to purchase 150,000 shares of the
Company’s common stock at an exercise price of $1.77 per share. In addition to
the placement agent fee, the Company paid $140,000 of other transaction fees
related to the offering. At the date of issuance, the fair value of
the placement agent warrants was $128,000, as established using the
Black-Scholes Model, and was recorded in paid-in capital, with the offset
recognized as a reduction of the preferred stock proceeds. In the
years ended December 31, 2009, 2008 and 2007, 10,000, 0, and 97,000,
respectively, of the placement agent warrants were exercised.
13. Stock-based
compensation
|
|
Long-term
incentive plan
|
During
1995, the Company established the 1995 Long-Term Incentive Stock Option Plan
(the “Plan”), which permits the granting of stock options (including incentive
stock options and nonqualified stock options) stock appreciation rights,
restricted or unrestricted stock awards, phantom stock, performance awards or
any combination of these to employees, directors or
consultants. Options to purchase shares of the Company’s common stock
under the Plan expire in either seven or ten years from the date of grant and
generally become exercisable in three installments with 40% vesting on the first
anniversary of the grant date and 30% vesting on each of the second and third
anniversaries of the grant date, subject to acceleration under certain
circumstances. At the Special Meeting of Stockholders held on December 31, 2007,
the shareholders approved amendments to the Plan which extended the life of the
plan ten years to June 30, 2018 and increased the number of shares that could be
issued under the Plan to 3,500,000 from 2,500,000. As of December 31,
2009, the Company had 463,603 shares of common stock reserved for future grants
under the Plan.
The
Company recognizes compensation expense on a pro rata straight-line basis over
the requisite service period for stock-based compensation awards with both
graded and cliff vesting terms. The Company recognizes the cumulative
effect of a change in the number of awards expected to vest in compensation
expense in the period of change. The Company has not capitalized any
portion of its stock-based compensation.
F-27
During
the years ended December 31, 2009, 2008, and 2007, the Company recognized
$906,000, $650,000 and $344,000, respectively of pre-tax stock-based
compensation expense under the fair value method.
Stock
option and warrant activity
During
the year ended December 31, 2009, the Company granted stock options to purchase
115,000 shares of common stock to GSE directors, officers, and
employees. No warrants to purchase shares of common stock were issued
in 2009.
Information
with respect to stock option and warrant activity as of and for the year ended
December 31, 2009, is as follows:
|
Weighted
|
||||||||||||||||
|
Aggregate
|
Average
|
|||||||||||||||
|
Number
|
Weighted
|
Intrinsic
|
Remaining
|
|||||||||||||
|
of
|
Average
|
Value
|
Contractual
Life
|
|||||||||||||
|
Shares
|
Exercise
Price
|
(in
thousands)
|
(Years)
|
|||||||||||||
|
Shares
under option and warrant, December 31, 2008
|
2,018,676 | $ | 4.16 | |||||||||||||
|
Options
granted
|
115,000 | 5.89 | ||||||||||||||
|
Options
exercised
|
(68,350 | ) | 4.30 | |||||||||||||
|
Options
forfeited
|
(3,715 | ) | 5.95 | |||||||||||||
|
Shares
under option and warrant, December 31, 2009
|
2,061,611 | 4.33 | $ | 3,337 | 5.238 | |||||||||||
|
Options
expected to vest
|
827,723 | 6.18 | $ | - | 8.154 | |||||||||||
|
Options
and warrants exercisable at December 31, 2009
|
1,233,888 | $ | 3.09 | $ | 3,337 | 3.281 | ||||||||||
A summary of the status of the Company’s nonvested options as of and for the year ended December 31, 2009, is presented below. All outstanding warrants were vested prior to 2009.
F-28
|
Weighted
|
||||||
|
Number
|
Average
|
|||||
|
of
Shares
|
Fair
Value
|
|||||
|
Nonvested
options at December 31, 2008
|
1,055,163
|
$ 4.16
|
||||
|
Options
granted
|
115,000
|
3.69
|
||||
|
Options
vested during the period
|
(338,725)
|
2.88
|
||||
|
Options forfeited
|
(3,715)
|
4.49
|
||||
|
Nonvested
options at December 31, 2009
|
827,723
|
$ 4.35
|
||||
The fair value of the options and warrants granted in 2009, 2008, and 2007, were estimated on the date of grant using a Black-Scholes option-pricing model with the following assumptions:
|
Years
ended December 31,
|
||||
|
2009
|
2008
|
2007
|
||
|
Risk-free
interest rates
|
1.71%
- 3.04%
|
2.75%
- 3.05%
|
4.77%
- 5.02%
|
|
|
Dividend
yield
|
0%
|
0%
|
0%
|
|
|
Expected
life
|
5.5
- 7.0 years
|
4.9
- 8.5 years
|
3.2
- 5.4 years
|
|
|
Volatility
|
65.9%
- 78.22%
|
68.8%
- 78.22%
|
70.54%
- 71.99%
|
|
|
Weighted
average volatility
|
67.85%
|
77.40%
|
71.02%
|
|
As of December 31, 2009, the Company had $3.2 million of unrecognized compensation expense related to the unvested portion of outstanding stock options expected to be recognized on a pro-rata straight line basis over a weighted average remaining service period of approximately 5.8 years.
The
Company received cash for the exercise price associated with stock options
exercised of $103,000, $282,000, and $1,683,000 during the years ended December
31, 2009, 2008, and 2007, respectively. The total intrinsic
value realized by participants on stock options exercised was $213,000, $1.4
million and $3.6 million during the years ended December 31, 2009, 2008, and
2007, respectively.
Common
stock issued for services provided
In April
2006, the Company entered into a consulting agreement with an investor relations
firm. As partial compensation for services rendered pursuant to the
consulting agreement, the Company agreed to issue 50,000 shares of common
stock. The shares vested in monthly increments of 2,778 shares
commencing May 2006 and ending October 2007. The Company delivered
the 50,000 common shares to the investor relations firm in October
2007.
The
consulting agreement was extended for an additional eighteen months from
November 2007 through April 2009 and an additional 25,000 shares of common stock
was issued as partial compensation for services rendered, with the shares
vesting in monthly increments of 1,388 shares. The Company delivered
the 25,000 common shares to the investor relations firm in April
2009.
F-29
The
consulting agreement was extended again for an additional eighteen months from
May 2009 through October 2010 and an additional 30,000 shares of common stock
will be issued as partial compensation for services rendered, with the shares
vesting in monthly increments of 1,666.
Compensation
expense is determined based on the price per share on the last day of each
month. For the year ended December 31, 2009, the average price
per share was $5.96 and the total compensation expense recognized by the Company
was $113,000. For the year ended December 31, 2008, the average price
per share was $7.87 and the total compensation expense recognized by the Company
was $131,000. For the year ended December 31, 2007, the average price
per share was $7.79 and the total compensation expense recognized by the Company
was $229,000.
14. Commitments
and contingencies
Leases
The
Company is obligated under certain noncancelable operating leases for office
facilities and equipment. Future minimum lease payments under
noncancelable operating leases as of December 31, 2009 are as
follows:
|
(in
thousands)
|
Gross
Future
|
|||
|
Minimum
Lease
|
||||
|
Payments
|
||||
|
2010
|
$ | 801 | ||
|
2011
|
592 | |||
|
2012
|
491 | |||
|
2013
|
444 | |||
|
2014
|
430 | |||
|
Thereafter
|
1,647 | |||
|
Total
|
$ | 4,405 | ||
Total rent expense under operating leases for the years ended December 31, 2009, 2008, and 2007 was approximately $867,000, $921,000, and $930,000, respectively.
Standby
Letters of credit, bank guarantees, surety bonds and performance
bonds
As of
December 31, 2009, the Company was contingently liable for five standby letters
of credit, one bank guarantee and two surety bonds totaling $3.5 million which
represent performance bonds on eight contracts. Two
of the letters of credit and the bank guarantee have been cash collateralized
and three of the letters of credit have been collateralized using the Company’s
line of credit
F-30
The
Company has provided a partial guarantee of 10% of ESA’s credit facility with
Union National Bank; $1.2 million was deposited into a restricted
interest-bearing account with UNB in 2006. The interest earned on the
restricted cash is part of the pledged deposit. In January 2010, the
Company was notified by UNB that ESA was delinquent in making principal and
interest payments on the outstanding borrowings from their credit facility and
that UNB had drawn upon the guarantees of the three partners to pay off the
delinquency, withdrawing $145,000 from GSE’s restricted cash
account. In February 2010, GSE was notified that ESA had missed
another loan payment and that 10% of the amount due ($24,000) would be withdrawn
from the Company’s restricted cash account. The Company established a full
reserve against the $1.3 million restricted cash account as of December 31,
2009.
Contingencies
Various
actions and proceedings are presently pending to which the Company is a party.
In the opinion of management, the aggregate liabilities, if any, arising from
such actions are not expected to have a material adverse effect on the financial
position, results of operations or cash flows of the Company.
15. Employee
benefits
The
Company has a qualified defined contribution plan that covers substantially all
U.S. employees under Section 401(k) of the Internal Revenue Code. Under this
plan, the Company's stipulated basic contribution matches a portion of the
participants' contributions based upon a defined schedule. The Company's
contributions to the plan were approximately $197,000, $171,000, and $136,000
for the years ended December 31, 2009, 2008, and 2007,
respectively.
16. Segment
information
The
Company has one reportable business segment that provides simulation solutions
and services to the nuclear and fossil fuel power industry, and to the chemical
and petrochemical industries. Contracts typically range from 10
months to three years.
For the
years ended December 31, 2009, 2008, and 2007, 73%, 54%, and 45% of the
Company’s consolidated revenue was from customers in the nuclear power industry,
respectively. The Company designs, develops and delivers business and technology
solutions to the energy industry worldwide. Revenue, operating income
(loss) and total assets for the Company’s United States, European, and Asian
subsidiaries as of and for the years ended December 31, 2009, 2008, and 2007 are
as follows:
F-31
|
(in
thousands)
|
Year
ended December 31, 2009
|
|||||||||||||||||||
|
United
States
|
Europe
|
Asia
|
Eliminations
|
Consolidated
|
||||||||||||||||
|
Contract
revenue
|
$ | 34,056 | $ | 6,004 | $ | - | $ | - | $ | 40,060 | ||||||||||
|
Transfers
between geographic locations
|
323 | 30 | 604 | (957 | ) | - | ||||||||||||||
|
Total
contract revenue
|
$ | 34,379 | $ | 6,034 | $ | 604 | $ | (957 | ) | $ | 40,060 | |||||||||
|
Operating
income (loss)
|
$ | (536 | ) | $ | 1,018 | $ | 81 | $ | - | $ | 563 | |||||||||
|
Total
assets, at December 31
|
$ | 71,216 | $ | 5,710 | $ | 231 | $ | (27,637 | ) | $ | 49,520 | |||||||||
|
(in
thousands)
|
Year
ended December 31, 2008
|
|||||||||||||||||||
|
United
States
|
Europe
|
Asia
|
Eliminations
|
Consolidated
|
||||||||||||||||
|
Contract
revenue
|
$ | 24,483 | $ | 4,521 | $ | - | $ | - | $ | 29,004 | ||||||||||
|
Transfers
between geographic locations
|
177 | 23 | 407 | (607 | ) | - | ||||||||||||||
|
Total
contract revenue
|
$ | 24,660 | $ | 4,544 | $ | 407 | $ | (607 | ) | $ | 29,004 | |||||||||
|
Operating
income (loss)
|
$ | (682 | ) | $ | 641 | $ | 29 | $ | - | $ | (12 | ) | ||||||||
|
Total
assets, at December 31
|
$ | 55,460 | $ | 3,110 | $ | 82 | $ | (27,637 | ) | $ | 31,015 | |||||||||
|
Year
ended December 31, 2007
|
||||||||||||||||||||
|
United
States
|
Europe
|
Asia
|
Eliminations
|
Consolidated
|
||||||||||||||||
|
Contract
revenue
|
$ | 28,530 | $ | 3,370 | $ | - | $ | - | $ | 31,900 | ||||||||||
|
Transfers
between geographic locations
|
268 | 89 | 180 | (537 | ) | - | ||||||||||||||
|
Total
contract revenue
|
$ | 28,798 | $ | 3,459 | $ | 180 | $ | (537 | ) | $ | 31,900 | |||||||||
|
Operating
income (loss)
|
$ | 2,453 | $ | (182 | ) | $ | (60 | ) | $ | - | $ | 2,211 | ||||||||
|
Total
assets, at December 31
|
$ | 48,251 | $ | 2,061 | $ | 86 | $ | (22,034 | ) | $ | 28,364 | |||||||||
Approximately
65%, 63%, and 71% of the Company’s 2009, 2008, and 2007 revenue, respectively,
was derived from international sales of its products and services from all of
its subsidiaries.
17. Supplemental disclosure of cash flow information
|
(in
thousands)
|
Year ended December 31,
|
||||||||
|
2009
|
2008
|
2007
|
|||||||
|
Cash
paid:
|
|
|
|
||||||
|
Interest
|
$ 1
|
$ 2
|
$ 252
|
||||||
|
Income
taxes
|
$ 206
|
$ 68
|
$ 172
|
||||||
18. Quarterly
financial data (unaudited)
The
Company’s quarterly financial information has not been audited but, in
management’s opinion, includes all adjustments necessary for a fair
presentation.
F-32
|
(in
thousands, except per share data)
|
||||||||||||||||
|
Year
ended December 31, 2009 Quarterly Data
|
||||||||||||||||
|
First
|
Second
|
Third
|
Fourth
|
|||||||||||||
|
Quarter
|
Quarter
|
Quarter
|
Quarter
|
|||||||||||||
|
Contract
revenue
|
$ | 8,128 | $ | 10,650 | $ | 10,217 | $ | 11,065 | ||||||||
|
Operating
income (loss)
|
531 | 658 | 428 | (1,054 | ) | |||||||||||
|
Net
income (loss)
|
333 | 571 | 458 | (2,159 | ) | |||||||||||
|
Basic
income (loss)
|
||||||||||||||||
|
per
common share
|
$ | 0.02 | $ | 0.04 | $ | 0.03 | $ | (0.11 | ) | |||||||
|
Diluted
income (loss)
|
||||||||||||||||
|
per
common share
|
$ | 0.02 | $ | 0.03 | $ | 0.03 | $ | (0.11 | ) | |||||||
|
Year
ended December 31, 2008 Quarterly Data
|
||||||||||||||||
|
First
|
Second
|
Third
|
Fourth
|
|||||||||||||
|
Quarter
|
Quarter
|
Quarter
|
Quarter
|
|||||||||||||
|
Contract
revenue
|
$ | 7,083 | $ | 6,555 | $ | 7,001 | $ | 8,365 | ||||||||
|
Operating
income
|
(174 | ) | (148 | ) | 170 | 140 | ||||||||||
|
Net
income
|
(293 | ) | (270 | ) | (58 | ) | (69 | ) | ||||||||
|
Basic
loss per common share
|
$ | (0.02 | ) | $ | (0.02 | ) | $ | - | $ | - | ||||||
|
Diluted
loss per common share
|
$ | (0.02 | ) | $ | (0.02 | ) | $ | - | $ | - | ||||||
19. Subsequent
Events
In May
2009, the FASB issued ASC 855, Subsequent Events (“ASC 855”), setting forth
principles and requirements to be applied to the accounting for and disclosure
of subsequent events. The statement sets forth the period after the balance
sheet date during which management shall evaluate events or transactions that
may occur for potential recognition or disclosure in the financial statements,
the circumstances under which events or transactions occurring after the balance
sheet date shall be recognized in the financial statements and the required
disclosures about events or transactions that occurred after the balance sheet
date. ASC 855 became effective for interim or annual reporting periods ending
after June 15, 2009. The Company has evaluated the period subsequent to
December 31, 2009 and through March 11, 2011 (the date the financial statements
were available to be issued) for events that did not exist at the balance sheet
date but arose after that date.
F-33
GSE
SYSTEMS, INC.
FORM
10-K
For
the Year Ended December 31, 2009
ITEM
9. CHANGES IN AND DISAGREEMENTS
WITH ACCOUNTANTS ON ACCOUNTING AND FINANCIAL DISCLOSURE.
None.
ITEM
9A. CONTROLS AND
PROCEDURES.
(a)
Evaluation of Disclosure Controls and Procedures
The
Company maintains disclosure controls and procedures that are designed to ensure
that information required to be disclosed by it in its reports filed or
submitted pursuant to the Securities Exchange Act of 1934, as amended (the
“Exchange Act”), is recorded, processed, summarized and reported within the time
periods specified in the Securities and Exchange Commission’s rules and forms
and that information required to be disclosed by the Company in its Exchange Act
reports is accumulated and communicated to management, including the Company’s
Chief Executive Officer (“CEO”), who is its principal executive officer, and
Chief Financial Officer (“CFO”), who is its principal financial officer, to
allow timely decisions regarding required disclosure. At the end of
the period covered by this report, an evaluation was performed under the
supervision and with the participation of our management including our CEO and
our CFO, of the effectiveness of the design and operation of our disclosure
controls and procedures pursuant to Rule 13-15(e) of the Exchange
Act. Based on their evaluation, the Company’s Chief Executive Officer
and its Chief Financial Officer have concluded that, as of December 31, 2008,
such disclosure controls and procedures were not effective because of the
material weakness identified as described below.
(b) Management’s Annual
Report on Internal Control over Financial Reporting
Our
management is responsible for establishing and maintaining adequate internal
control over financial reporting as defined in Exchange Act rule
13a-15(f). Our internal control processes and procedures are designed
to provide reasonable assurance regarding the reliability of financial reporting
and the preparation of our consolidated financial statements in accordance with
United States generally accepted accounting principles.
Under the
supervision and with the participation of management, including our CEO and CFO,
we conducted an evaluation of internal control over financial reporting as of
December 31, 2009 based on the criteria set forth by the Committee of Sponsoring
Organizations of the Treadway Commission in Internal Control—Integrated
Framework. Based upon our evaluation, we concluded that our
internal control over financial reporting was effective as of December 31,
2009.
The
effectiveness of the Company’s internal control over financial reporting as of
December 31, 2009 has been audited by KPMG LLP, an independent registered public
accounting firm, whose report appears in Item 8 of this Annual Report on Form
10-K.
51
(c) Changes
in Internal Control over Financial Reporting
The
Company has made no changes in its internal controls over financial reporting
during the quarter ended December 31, 2009 that have materially affected or are
reasonably likely to materially affect our internal control over financial
reporting.
(d) Limitation
of Effectiveness of Controls
Internal
control over financial reporting has inherent limitations. Internal
control over financial reporting is a process that involves human diligence and
compliance and is subject to lapses in judgment and breakdowns resulting from
human failures. Internal control over financial reporting also can be
circumvented by collusion or improper management override. Because of such
limitations, there is a risk that material misstatements will not be prevented
or detected on a timely basis by internal control over financial
reporting. However, these inherent limitations are known features of
the financial reporting process. Therefore, it is possible to design into the
process safeguards to reduce, though not eliminate this risk.
ITEM
9B. OTHER
INFORMATION.
None.
PART
III
ITEM
10. DIRECTORS, EXECUTIVE
OFFICERS AND CORPORATE GOVERNANCE.
The
information required by this item, including items 401, 405 406 and 407 of
Regulation S-K, is incorporated by reference to the sections captioned “Directors and Executive
Officers” and “Section
16(A) Beneficial Ownership Reporting Compliance” in the definitive Proxy
Statement for the Company’s 2010 Annual Meeting of Shareholders and incorporated
herein by reference or will be provided in an amendment to this Annual Report on
Form 10-K.
The
Company has adopted a Conduct of Business Policy that applies to its directors,
officers and employees, including its principal executive officer, and principal
financial officer. The Conduct of Business Policy is available on the
Company’s website at www.gses.com. In
addition, the Company has adopted a Code of Ethics for its principal executive
officer and senior financial officers which is also available on the Company’s
website. The Company will post on its website information about any
amendment to, or waiver from, any provision of the Code of Ethics that applies
to its principal executive officer, principal financial officer, or principal
accounting officer.
ITEM
11. EXECUTIVE
COMPENSATION.
The
information required by this item will either be set forth under the “Compensation of Directors and
Executive Officers” section in the definitive Proxy Statement for the
2010 Annual Meeting of Shareholders and incorporated herein by reference or will
be provided in an amendment to this Annual Report on Form 10-K.
52
ITEM
12. SECURITY OWNERSHIP OF
CERTAIN BENEFICIAL OWNERS AND MANAGEMENT AND RELATED STOCKHOLDER
MATTERS.
The
information required by this item will be either set forth under the sections
captioned “Voting Securities
and Principal Holders Thereof,” and “Compensation of Directors and
Executive Officers” in the definitive Proxy Statement for the 2010 Annual
Meeting of Shareholders and incorporated herein by reference or will be provided
in an amendment to this Annual Report on Form 10-K.
ITEM
13.
CERTAIN RELATIONSHIPS AND
RELATED TRANSACTIONS AND DIRECTOR INDEPENDENCE.
The
information required by this item will be either set forth under the “Directors and Executive
Officers” section in the definitive Proxy Statement for the 2010 Annual
Meeting of Shareholders and incorporated herein by reference or will be provided
in an amendment to this Annual Report on Form 10-K.
ITEM
14. PRINCIPAL ACCOUNTING FEES
AND SERVICES.
The
information required by this item will be either set forth under the “Audit Committee Pre-Approval of
Audit and Non-Audit Services” section in the definitive Proxy Statement
for the 2010 Annual Meeting of Shareholders and incorporated herein by reference
or will be provided in an amendment to this Annual Report on Form
10-K.
PART
IV
|
ITEM
15.
|
EXHIBITS AND FINANCIAL
STATEMENT SCHEDULES
|
(a)
(1) List of Financial Statements
The
following financial statements are included in Item 8:
|
GSE
Systems, Inc. and Subsidiaries
|
|
Report
of Independent Registered Public Accounting Firm – Internal Control over
Financial Reporting
|
|
Report
of Independent Registered Public Accounting Firm – Consolidated Financial
Statements
|
|
Consolidated
Balance Sheets as of December 31, 2009 and 2008
|
|
Consolidated
Statements of Operations for the years ended December 31, 2009, 2008, and
2007
|
|
Consolidated
Statements of Comprehensive Income (Loss) for the years ended December 31,
2009,
2008, and
2007
|
|
Consolidated
Statements of Changes in Stockholders' Equity for the years ended December
31, 2009,
2008,
and 2007
|
|
Consolidated
Statements of Cash Flows for the years ended December 31, 2009, 2008, and
2007
|
|
Notes
to Consolidated Financial
Statements
|
53
(a)
(2) List of Schedules
All other
schedules to the consolidated financial statements are omitted as the required
information is either inapplicable or presented in the consolidated financial
statements or related notes.
(a)
(3) List of Exhibits
The
Exhibits which are filed with this report or which are incorporated by reference
are set forth in the Exhibit Index hereto.
54
SIGNATURES
Pursuant
to the requirements of Section 13 or 15(d) of the Securities Exchange Act of
1934, the registrant has duly caused this report to be signed on its behalf by
the undersigned, thereunto duly authorized.
GSE Systems, Inc.
By: /
s /
JOHN
MORAN
John Moran
Chief
Executive Officer
Pursuant
to the requirements of the Securities Act, this report has been signed by the
following persons in the capacities and on the dates indicated.
Date: March
11,
2010 /
s /
JOHN
MORAN
John
Moran, Chief Executive Officer
(Principal Executive
Officer)
Date:
March 11,
2010 /
s / JEFFERY G.
HOUGH
Jeffery G. Hough, Senior Vice
President
and Chief Financial
Officer
(Principal
Financial and Accounting Officer)
Date:
March 11,
2010 (Jerome I.
Feldman, Chairman of the Board
) By: /
s / JEFFERY G.
HOUGH
(Michael D. Feldman,
Director
) Jeffery
G. Hough
(Dr. Sheldon L. Glashow,
Director
)Attorney-in-Fact
(Jane Bryant Quinn,
Director
)
(Dr. Roger Hagengruber,
Director
)
(Joseph W. Lewis,
Director )
(George J. Pedersen,
Director
)
(Orrie Lee Tawes III,
Director
)
A Power
of Attorney, dated March 2, 2010 authorizing Jeffery G. Hough to sign this
Annual Report on Form 10-K for the fiscal year ended December 31, 2009 on behalf
of certain of the directors of the Registrant is filed as Exhibit 24.1 to this
Annual Report.
55
|
Exhibit
|
Description
of Exhibit
|
|
1
|
Underwriting
Agreement
|
|
1.1
|
Underwriting
Agreement, dated August 31, 2009 between the Company and Roth Capital
Partners, LLC. Previously filed in connection with Form 8-K as
filed with the Securities and Exchange Commission on September 1, 2009 and
incorporated herein by reference.
|
|
3
|
Articles
of Incorporation and Bylaws
|
|
3(i)
|
Fourth
Amended and Restated Certificate of Incorporation of the
Company. Previously filed in connection with the GSE
Systems, Inc. Form DEF 14A as filed with the Securities and Exchange
Commission on November 20, 2007 and incorporated herein by
reference.
|
|
3(ii)
|
Amended
and Restated Bylaws of the Company. Previously filed in
connection with Form DEF 4A as filed with the Securities and Exchange
Commission on November 20, 2007 and incorporated herein by
reference.
|
|
4.
|
Instruments Defining Rights of
Security Holders, including Indenture.
|
|
4.1
|
Specimen
Common Stock Certificate of the Company. Previously filed in connection
with Amendment No. 3 to the GSE Systems, Inc. Form S-1 Registration
Statement as filed with the Securities and Exchange Commission on July 24,
1995 and incorporated herein by reference.
|
|
4.2
|
Form
of Warrant to Purchase 380,952 shares of Common Stock of GSE Systems, Inc.
dated as of May 26, 2005. Previously filed in connection with
the GSE Systems, Inc. Form 8-K filed with the Securities and Exchange
Commission on March 6, 2006 and incorporated herein by
reference.
|
|
4.3
|
Form
of Warrant to Purchase 150,000 shares of Common Stock of GSE Systems, Inc.
dated as of February 28, 2006. Previously filed in connection
with the GSE Systems, Inc. Form 8-K filed with the Securities and Exchange
Commission on March 6, 2006 and incorporated herein by
reference.
|
56
|
Exhibit
|
Description
of Exhibit
|
|
4.4
|
Securities
Purchase Agreement, dated as of June 15, 2007 by and between GSE Systems,
Inc. and each of the Investors to sell a total of 1,666,667 shares of GSE
Common Stock. Previously filed in connection with the GSE
Systems, Inc. Form 8-K filed with the Securities and Exchange Commission
on June 18, 2007 and incorporated herein by reference.
|
|
4.6
|
Registration
Rights Agreement, dated as of June 15, 2007 by and between GSE Systems,
Inc. and each of the Investors. Previously filed in connection
with the GSE Systems, Inc. Form 8-K filed with the Securities and Exchange
Commission on June 18, 2007 and incorporated herein by
reference.
|
|
4.
7
|
Consent
and Waiver, dated as of June 15, 2007, among GSE Systems, Inc., GSE Power
Systems, Inc. and Laurus Master Fund Ltd. Previously filed in connection
with the GSE Systems, Inc. Form 8-K filed with the Securities and Exchange
Commission on June 18, 2007 and incorporated herein by
reference.
|
|
10.
|
Material
Contracts
|
|
10.1
|
Agreement
among ManTech International Corporation, National Patent Development
Corporation, GPS Technologies, Inc., General Physics Corporation,
Vattenfall Engineering AB and GSE Systems, Inc. (dated as of April 13,
1994). Previously filed in connection with the GSE Systems, Inc. Form S-1
Registration Statement as filed with the Securities and Exchange
Commission on April 24, 1995 and incorporated herein by
reference.
|
|
10.2
|
GSE
Systems, Inc. 1995 Long-Term Incentive Plan, amended as of September 25,
2007. Previously filed in connection with the GSE Systems, Inc. Form DEF
14A as filed with the Securities and Exchange Commission on November 20,
2007 and incorporated herein by reference. *
|
|
10.3
|
Form
of Option Agreement Under the GSE Systems, Inc. 1995 Long-Term Incentive
Plan. Previously filed in connection with the GSE Systems, Inc.
Form 10-K as filed with the Securities and Exchange Commission on March
22, 1996 and incorporated herein by reference. *
|
57
|
Exhibit
|
Description
of Exhibit
|
|
10.5
|
Memorandum
of Association of Limited Liability Company dated November 8, 2005 by and
between Al Qudra Holding PJSC, Centre of Excellence for Applied Research
and Training, and GSE Systems, Inc. Previously filed in
connection with the GSE Systems, Inc. Form 10-Q/A filed with the
Securities and Exchange Commission on October 4, 2006 and incorporated
herein by reference.
|
|
10.6
|
Supply
Agreement Contract by and between Emirates Simulation Academy, LLC and GSE
Power Systems, Inc. dated January 3, 2006. Previously filed in
connection with the GSE Systems, Inc. Form 10-Q/A filed with the
Securities and Exchange Commission on October 4, 2006 and incorporated
herein by reference.
|
|
10.7
|
License
and Technology Transfer Agreement by and Between GSE Power Systems, Inc.
and Emirates Simulation Academy, LLC dated January 3,
2006. Previously filed in connection with the GSE Systems, Inc.
Form 10-Q/A filed with the Securities and Exchange Commission on October
4, 2006 and incorporated herein by reference.
|
|
10.8
|
Office
Lease Agreement between 1332 Londontown, LLC and GSE Systems, Inc. (dated
as of February 27, 2008). Previously filed in connection
with the GSE Systems, Inc. Form 8-K as filed with the Securities and
Exchange Commission on March 11, 2008 and incorporated herein by
reference.
|
|
10.9
|
$3,500,000
Ex-Im Bank-Guaranteed Transaction Specific Revolving Line of Credit, dated
as of march 28, 2008. Previously filed in connection with the
GSE Systems, Inc. Form 8-K as filed with the Securities and Exchange
Commission on April 3, 2008 and incorporated herein by
reference.
|
|
10.10
|
Security
Agreement by and among GSE Systems, Inc., GSE Power Systems, Inc and Bank
of America, N.A. dated March 28, 2008. Previously filed in
connection with the GSE Systems, Inc. Form 8-K as filed with the
Securities and Exchange Commission on April 3, 2008 and incorporated
herein by reference.
|
|
10.11
|
Borrower
Agreement by and among GSE Systems, Inc., GSE Power Systems, Inc. and Bank
of America, N.A. dated March 28, 2008. Previously filed in
connection with the GSE Systems, Inc. Form 8-K as filed with the
Securities and Exchange Commission on April 3, 2008 and incorporated
herein by reference.
|
58
|
Exhibit
|
Description
of Exhibit
|
|
10.12
|
Continuing
and Unconditional Guaranty by GSE Process Solutions, Inc. and Bank of
America, N.A. dated as of March 28, 2008. Previously filed in
connection with the GSE Systems, Inc. Form 8-K as filed with the
Securities and Exchange Commission on April 3, 2008 and incorporated
herein by reference.
|
|
10.13
|
Continuing
and Unconditional Guaranty by MSHI, Inc. and Bank of America, N.A. dated
as of March 28, 2008. Previously filed in connection with the
GSE Systems, Inc. Form 8-K as filed with the Securities and Exchange
Commission on April 3, 2008 and incorporated herein by
reference.
|
|
10.14
|
$1,500,000
Domestic Revolving Line of Credit dated as of March 28,
2008. Previously filed in connection with the GSE Systems, Inc.
Form 8-K as filed with the Securities and Exchange Commission on April 3,
2008 and incorporated herein by reference.
|
|
10.15
|
Security
Agreement by and among GSE Systems, Inc., GSE Power Systems, Inc. and Bank
of America, N.A. dated as of March 28, 2008 (Domestic Revolving Line of
Credit). Previously filed in connection with the GSE Systems,
Inc. Form 8-K as filed with the Securities and Exchange Commission on
April 3, 2008 and incorporated herein by reference.
|
|
10.16
|
Continuing
and Unconditional Guaranty by GSE Process Solutions, Inc. and Bank of
America, N.A. dated as of March 28, 2008. Previously filed in
connection with the GSE Systems, Inc. Form 8-K as filed with the
Securities and Exchange Commission on April 3, 2008 and incorporated
herein by reference.
|
|
10.17
|
Continuing
and Unconditional Guaranty by MSHI, Inc. and Bank of America, N.A. dated
as of March 28, 2008. Previously filed in connection with the
GSE Systems, Inc. Form 8-K as filed with the Securities and Exchange
Commission on April 3, 2008 and incorporated herein by
reference.
|
|
10.18
|
Pledge
Agreement by and among the Company, MSHI, Inc., GSE Power Systems, Inc.,
GSE Process Solutions, Inc. and Bank of America, N.A. dated as of March
28, 2008. Previously filed in connection with the GSE Systems,
Inc. Form 8-K as filed with the Securities and Exchange Commission on
April 3, 2008 and incorporated herein by reference.
|
| 10.19 | Control
Agreement Regarding Limited Liability Company Interests by and among GSE
Systems, Inc., Bank of America, N.A. and GSE Services Company LLC dated as
of March 28, 2008. Previously filed in connection with the GSE
Systems, Inc. Form 8-K as filed with the Securities and Exchange
Commission on April 3, 2008 and incorporated herein by
reference. |
59
|
Exhibit
|
Description
of Exhibit
|
|
10.20
|
First
Amendment to $1,500,000 Domestic Revolving Line of Credit, dated May 5,
2009. Previously filed in connection with the GSE Systems, Inc.
Form 10-Q as filed with the Securities and Exchange Commission on May 11,
2009 and incorporated herein by reference.
|
|
10.21
|
First
Amendment to $3,500,000 Ex-Im Bank-Guaranteed Transaction Specific
Revolving Line of Credit, dated as of May 5, 2009. Previously
filed in connection with the GSE Systems, Inc. Form 10-Q as filed with the
Securities and Exchange Commission on May 11, 2009 and incorporated herein
by reference.
|
|
10.22
|
First
Amendment to Security Agreement by and among GSE Systems, Inc., GSE Power
Systems, Inc. and Bank of America N.A (Domestic Revolving Line of Credit),
dated as of May 5, 2009. Previously filed in connection with
the GSE Systems, Inc. Form 10-Q as filed with the Securities and Exchange
Commission on May 11, 2009 and incorporated herein by
reference.
|
|
10.23
|
Ratification
of Guarantee by GSE Process Solutions, Inc. and MSHI, Inc. (Domestic
Revolving Line of Credit), dated May 5, 2009. Previously filed
in connection with the GSE Systems, Inc. Form 10-Q as filed with the
Securities and Exchange Commission on May 11, 2009 and incorporated herein
by reference.
|
|
10.24
|
Ratification
of Guarantee by GSE Process Solutions, Inc. and MSHI, Inc. (Ex-Im
Bank-Guaranteed Transaction Specific Revolving Line of Credit), dated May
5, 2009. Previously filed in connection with the GSE Systems,
Inc. Form 10-Q as filed with the Securities and Exchange Commission on May
11, 2009 and incorporated herein by reference.
|
|
10.25
|
Employment
Agreement dated as of May 1, 2008 between GSE Systems, Inc. and John V.
Moran. Previously filed in connection with the GSE Systems,
Inc. Form 8-K filed with the Securities and Exchange Commission on May 7,
2008 and incorporated herein by reference.*
|
|
10.26
|
Employment
Agreement dated as of January 1, 2009 between GSE Systems, Inc. and
Chin-our Jerry Jen. Previously filed in connection with the GSE
Systems, Inc. Form 8-K filed with the Securities and Exchange Commission
on January 7, 2009 and incorporated herein by
reference.*
|
|
10.27
|
Employment
Agreement dated as of January 1, 2009 between GSE Systems, Inc. and
Jeffery G. Hough. Previously filed in connection with the GSE
Systems, Inc. Form 8-K filed with the Securities and Exchange Commission
on January 7, 2009 and incorporated herein by
reference.*
|
60
|
Exhibit
|
Description
of Exhibit
|
|
10.28
|
Employment
Agreement dated as of January 1, 2009 between GSE Systems, Inc. and
Michael D. Feldman. Previously filed in connection with the GSE
Systems, Inc. Form 8-K filed with the Securities and Exchange Commission
on January 7, 2009 and incorporated herein by
reference.*
|
|
10.29
|
Employment
Agreement dated as of January 1, 2009 between GSE Systems, Inc. and Gill
R. Grady. Previously filed in connection with the GSE Systems,
Inc. Form 8-K filed with the Securities and Exchange Commission on January
7, 2009 and incorporated herein by reference.*
|
| 10.30 | Waiver of Certain Financial Covenant Violations dated March 10, 2010, filed herewith. |
|
14.
|
Code
of Ethics
|
|
14.1
|
Code
of Ethics for the Principal Executive Officer and Senior Financial
Officers. Previously filed in connection with the GSE Systems,
Inc. Form 10-K filed with the Securities and Exchange Commission on March
31, 2006 and incorporated herein by reference.
|
|
21.
|
Subsidiaries.
|
|
21.1
|
List
of Subsidiaries of Registrant at December 31, 2009, filed
herewith.
|
|
23.
|
Consents
of Experts and Counsel
|
|
23.1.
|
Consent
of KPMG LLP, filed herewith.
|
|
24.
|
Power
of Attorney
|
|
24.1
|
Power
of Attorney for Directors’ and Officers’ Signatures on SEC Form 10-K,
filed herewith.
|
|
31.
|
Certifications
|
|
31.1
|
Certification
of Chief Executive Officer of the Company pursuant to Securities and
Exchange Act Rule 13d-14(a)/15(d-14(a), as adopted pursuant to Section 302
and 404 of the Sarbanes-Oxley Act of 2002, filed
herewith.
|
|
31.2
|
Certification
of Chief Financial Officer of the Company pursuant to Securities and
Exchange Act Rule 13d-14(a)/15(d-14(a), as adopted pursuant to Section 302
and 404 of the Sarbanes-Oxley Act of 2002, filed herewith.
|
61
|
Exhibit
|
Description
of Exhibit
|
|
32.
|
Section
1350 Certifications
|
|
32.1
|
Certification
of Chief Executive Officer and Chief Financial Officer of the Company
pursuant to 18 U.S.C. Section 1350 as adopted pursuant to Section 906 of
the Sarbanes-Oxley Act of 2002, file herewith.
|
|
* Management
contracts or compensatory plans required to be filed as exhibits pursuant
to Item 14 (c) of this report.
|
62