Attached files
| file | filename |
|---|---|
| 8-K - 8-K - OGLETHORPE POWER CORP | a8kq121investorbriefing.htm |
First Quarter 2021 Investor Briefing First Quarter 2021 Investor Briefing May 18, 2021
First Quarter 2021 Investor Briefing Notice to Recipients Certain of the information contained in this presentation, including certain of the statements made by representatives of Oglethorpe Power Corporation (An Electric Membership Corporation) (“Oglethorpe” or “OPC”), that are not historical facts are forward-looking statements. Although Oglethorpe believes that in making these forward-looking statements its expectations are based on reasonable assumptions, Oglethorpe cautions the reader not to put undue reliance on these forward-looking statements, which are not guarantees of future performance. Forward- looking statements involve uncertainties and there are important factors, many of which are outside management’s control, which could cause actual results to differ materially from those expressed or implied by these forward-looking statements. Some of the risks, uncertainties and assumptions that may cause actual results to differ from these forward-looking statements are described under the headings “CAUTIONARY STATEMENT REGARDING FORWARD-LOOKING INFORMATION” in our Quarterly Report on Form 10-Q for the fiscal quarter ended March 31, 2021, filed with the Securities and Exchange Commission on May 12, 2021, and “RISK FACTORS” in our Annual Report on Form 10-K for the fiscal year ended December 31, 2020, filed with the Securities and Exchange Commission on March 19, 2021. This electronic presentation is provided as of May 18, 2021. If you are viewing this presentation after that date, there may have been events that occurred subsequent to such date that could have a material adverse effect on the information that was presented. Oglethorpe undertakes no obligation to publicly update any forward-looking statements. 2
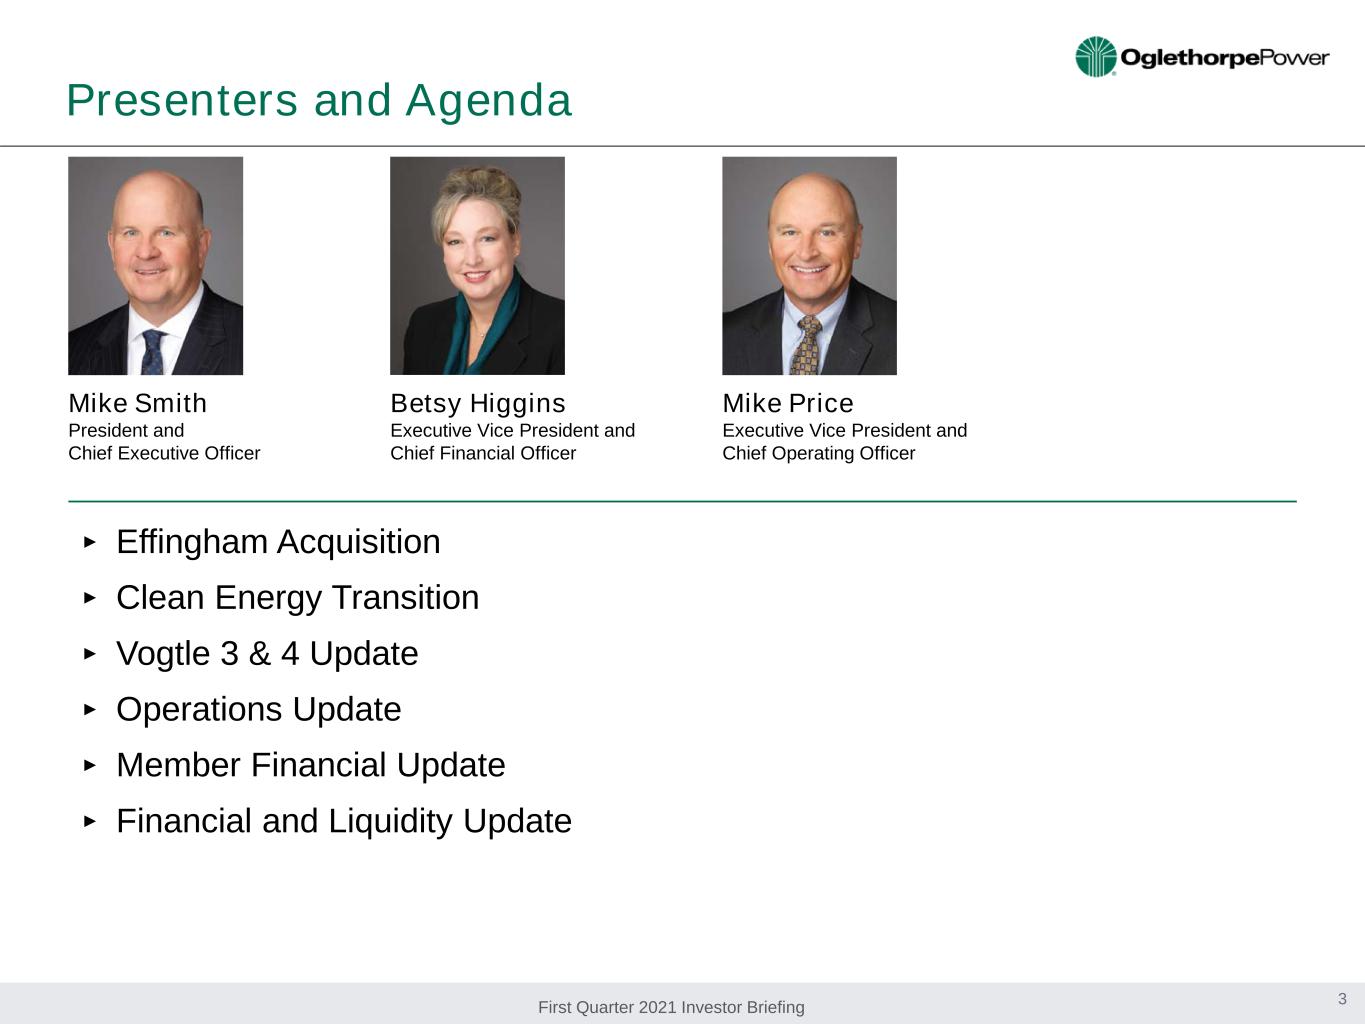
First Quarter 2021 Investor Briefing ‣ Effingham Acquisition ‣ Clean Energy Transition ‣ Vogtle 3 & 4 Update ‣ Operations Update ‣ Member Financial Update ‣ Financial and Liquidity Update Presenters and Agenda Mike Price Executive Vice President and Chief Operating Officer Betsy Higgins Executive Vice President and Chief Financial Officer Mike Smith President and Chief Executive Officer 3
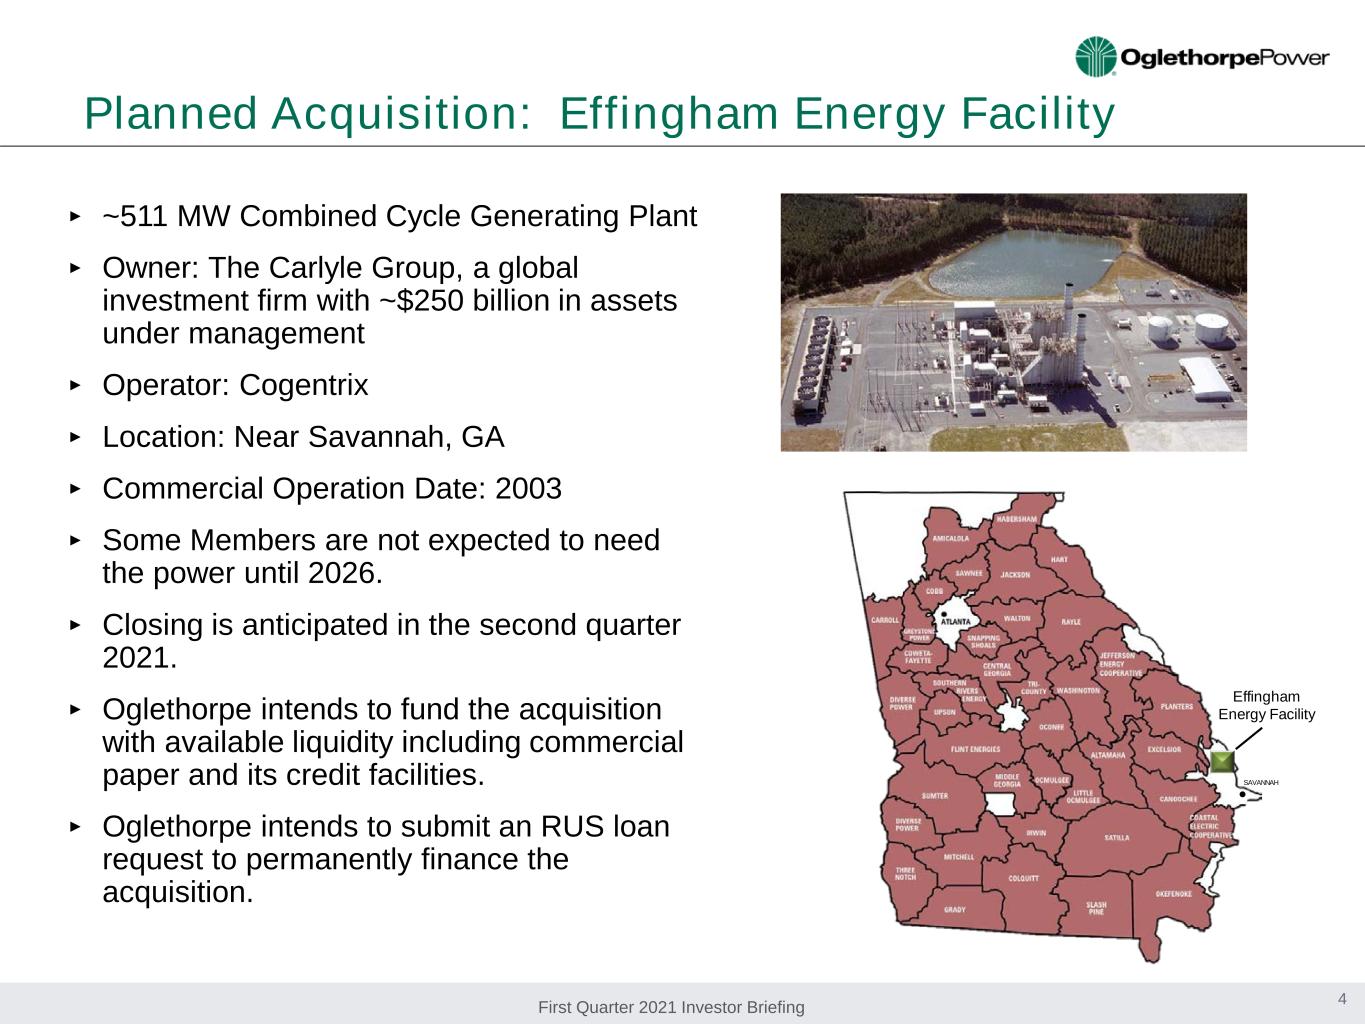
First Quarter 2021 Investor Briefing Planned Acquisition: Effingham Energy Facility 4 ‣ ~511 MW Combined Cycle Generating Plant ‣ Owner: The Carlyle Group, a global investment firm with ~$250 billion in assets under management ‣ Operator: Cogentrix ‣ Location: Near Savannah, GA ‣ Commercial Operation Date: 2003 ‣ Some Members are not expected to need the power until 2026. ‣ Closing is anticipated in the second quarter 2021. ‣ Oglethorpe intends to fund the acquisition with available liquidity including commercial paper and its credit facilities. ‣ Oglethorpe intends to submit an RUS loan request to permanently finance the acquisition. Effingham Energy Facility SAVANNAH
First Quarter 2021 Investor Briefing Wansley Early Retirement ‣ Plant Wansley consists of two ~850 MW coal units and one ~50 MW oil CT (which doesn’t run). ‣ Oglethorpe is a 30% owner; Georgia Power (operator) owns 53.5%, MEAG owns 15.1%, and Dalton owns 1.4%. ‣ Oglethorpe’s capacity at Plant Wansley is ~514 MW of coal and ~15 MW of the oil CT. ‣ Due to very low gas prices, Wansley’s dispatch price has not been competitive. ‣ Wansley’s capacity factor for the last several years has averaged below 10%; Wansley ran only for testing in 2020. ‣ Georgia Power has indicated that it may request PSC approval in their 2022 IRP filing (in January) to retire Wansley as early as Fall 2022. ‣ This plan is supported by all co-owners. 5
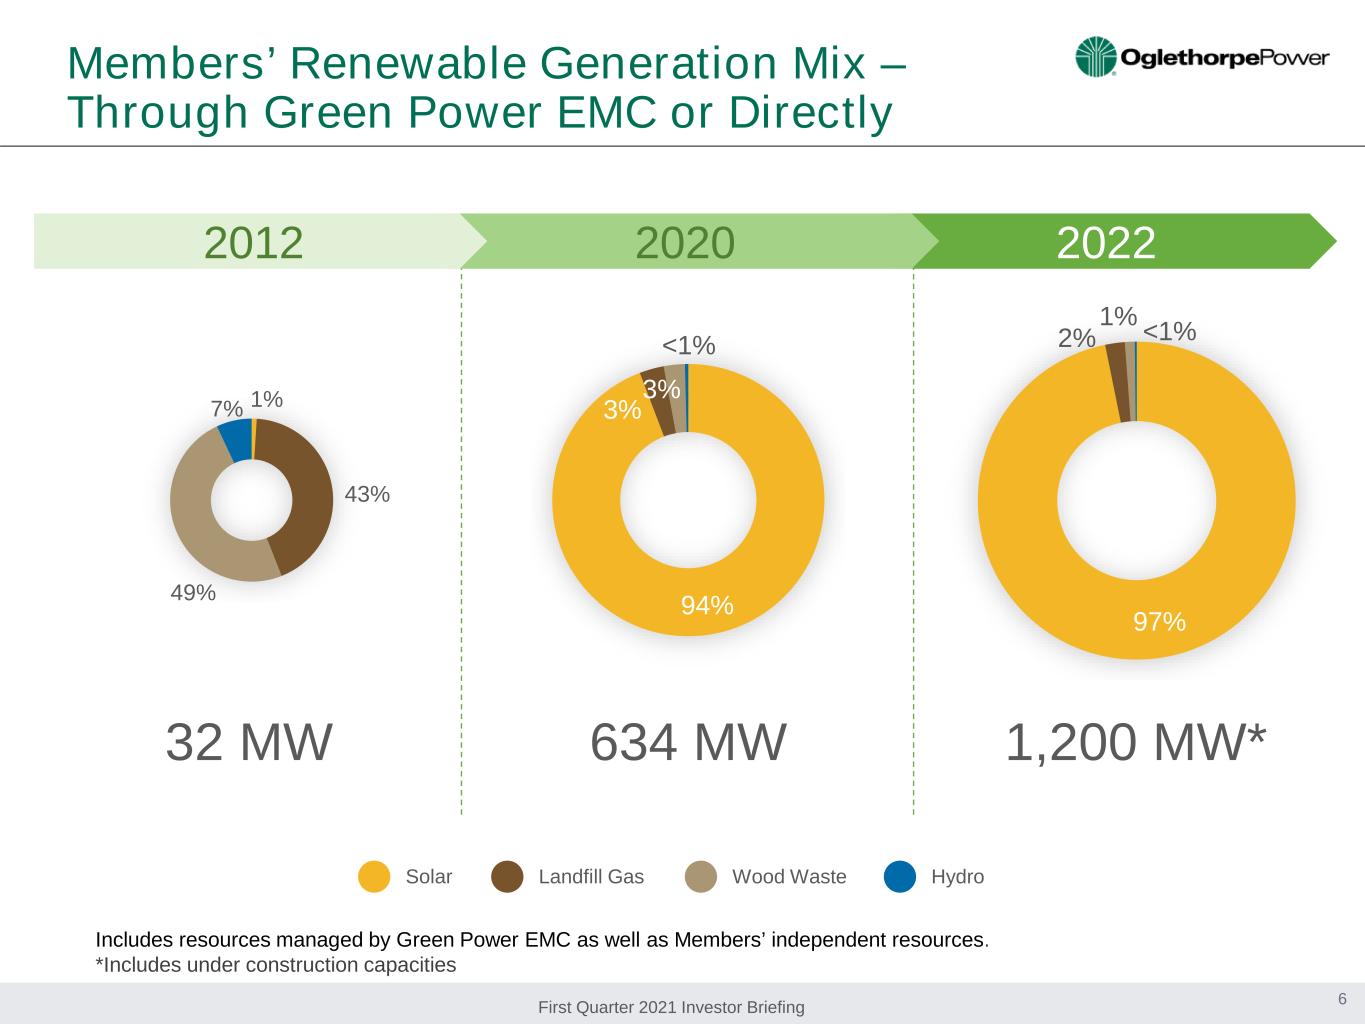
First Quarter 2021 Investor Briefing Members’ Renewable Generation Mix – Through Green Power EMC or Directly 6 20222020 634 MW 2012 32 MW 97% 1% 2% <1% 1,200 MW* Solar Landfill Gas Wood Waste Hydro 49% 43% 7% 1% 94% 3% 3% <1% Includes resources managed by Green Power EMC as well as Members’ independent resources. *Includes under construction capacities
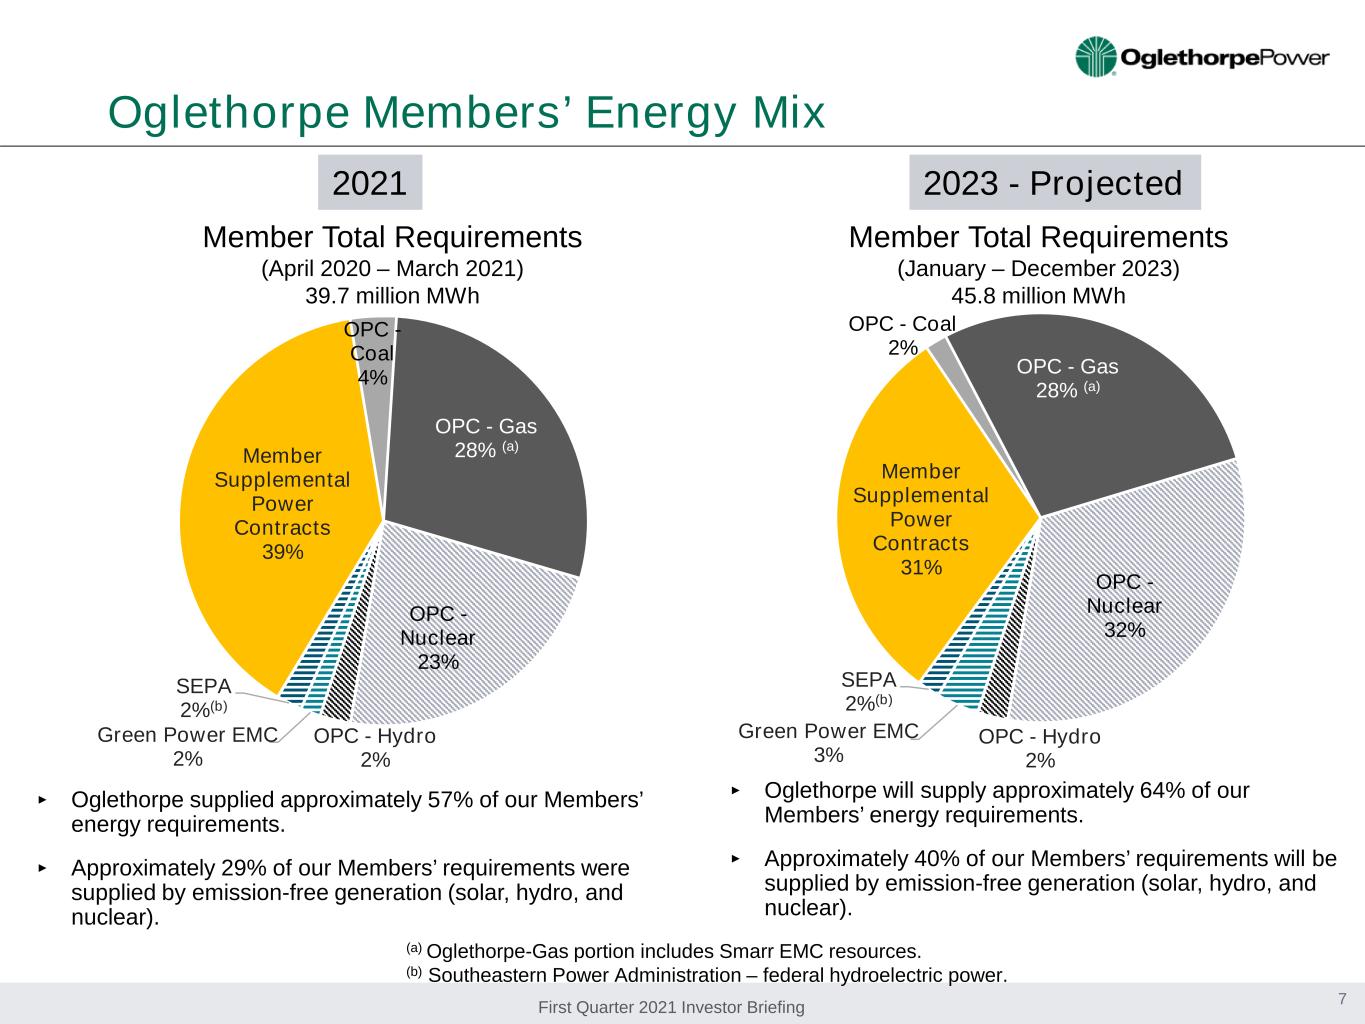
First Quarter 2021 Investor Briefing Green Power EMC 2% SEPA 2%(b) Member Supplemental Power Contracts 39% OPC - Coal 4% OPC - Gas 28% (a) OPC - Nuclear 23% OPC - Hydro 2% Oglethorpe Members’ Energy Mix 7 Member Total Requirements (April 2020 – March 2021) 39.7 million MWh (a) Oglethorpe-Gas portion includes Smarr EMC resources. (b) Southeastern Power Administration – federal hydroelectric power. ‣ Oglethorpe supplied approximately 57% of our Members’ energy requirements. ‣ Approximately 29% of our Members’ requirements were supplied by emission-free generation (solar, hydro, and nuclear). (a)(a) Member Total Requirements (January – December 2023) 45.8 million MWh 2021 2023 - Projected Green Power EMC 3% SEPA 2%(b) Member Supplemental Power Contracts 31% OPC - Coal 2% OPC - Gas 28% (a) OPC - Nuclear 32% OPC - Hydro 2% ‣ Oglethorpe will supply approximately 64% of our Members’ energy requirements. ‣ Approximately 40% of our Members’ requirements will be supplied by emission-free generation (solar, hydro, and nuclear).
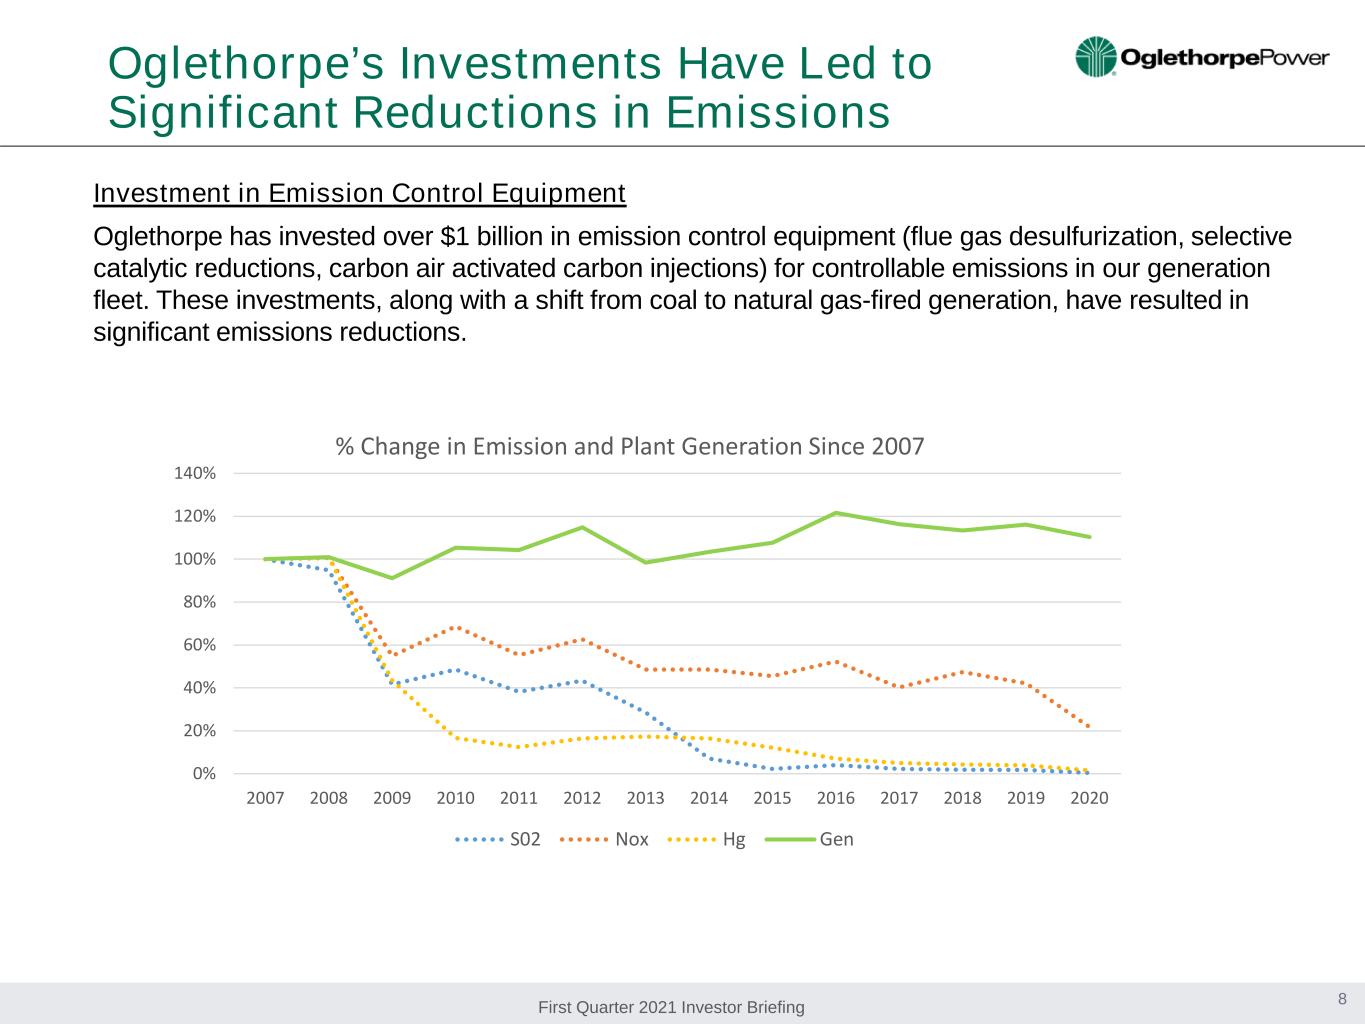
First Quarter 2021 Investor Briefing Oglethorpe’s Investments Have Led to Significant Reductions in Emissions 8 Investment in Emission Control Equipment Oglethorpe has invested over $1 billion in emission control equipment (flue gas desulfurization, selective catalytic reductions, carbon air activated carbon injections) for controllable emissions in our generation fleet. These investments, along with a shift from coal to natural gas-fired generation, have resulted in significant emissions reductions. 0% 20% 40% 60% 80% 100% 120% 140% 2007 2008 2009 2010 2011 2012 2013 2014 2015 2016 2017 2018 2019 2020 % Change in Emission and Plant Generation Since 2007 S02 Nox Hg Gen
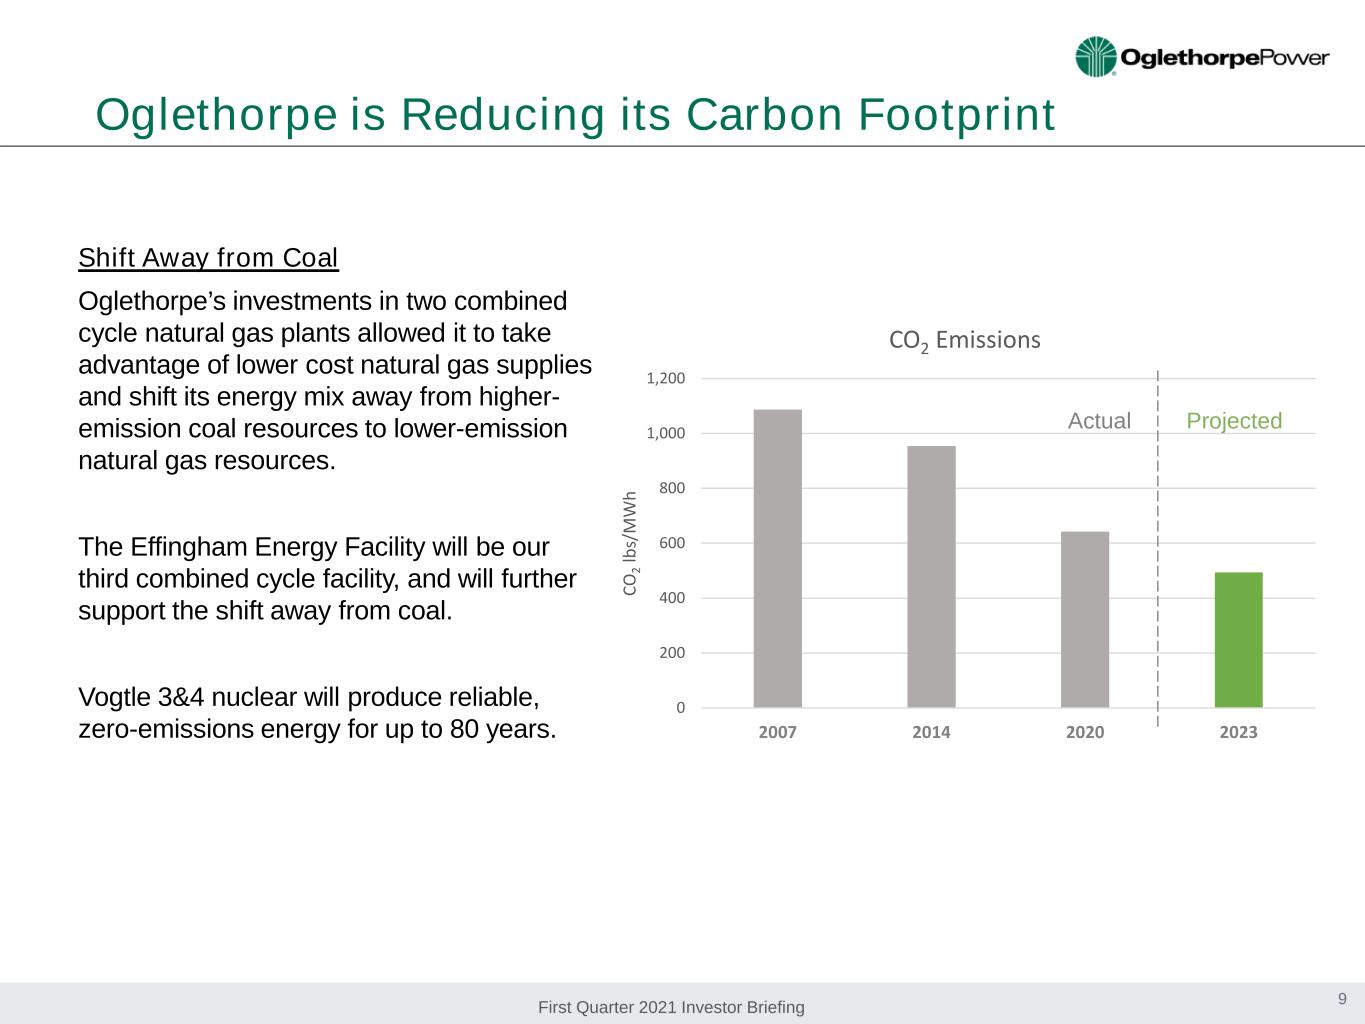
First Quarter 2021 Investor Briefing Oglethorpe is Reducing its Carbon Footprint 9 Shift Away from Coal Oglethorpe’s investments in two combined cycle natural gas plants allowed it to take advantage of lower cost natural gas supplies and shift its energy mix away from higher- emission coal resources to lower-emission natural gas resources. The Effingham Energy Facility will be our third combined cycle facility, and will further support the shift away from coal. Vogtle 3&4 nuclear will produce reliable, zero-emissions energy for up to 80 years. 0 200 400 600 800 1,000 1,200 2007 2014 2020 2023 CO 2 lb s/ M W h CO2 Emissions Actual Projected
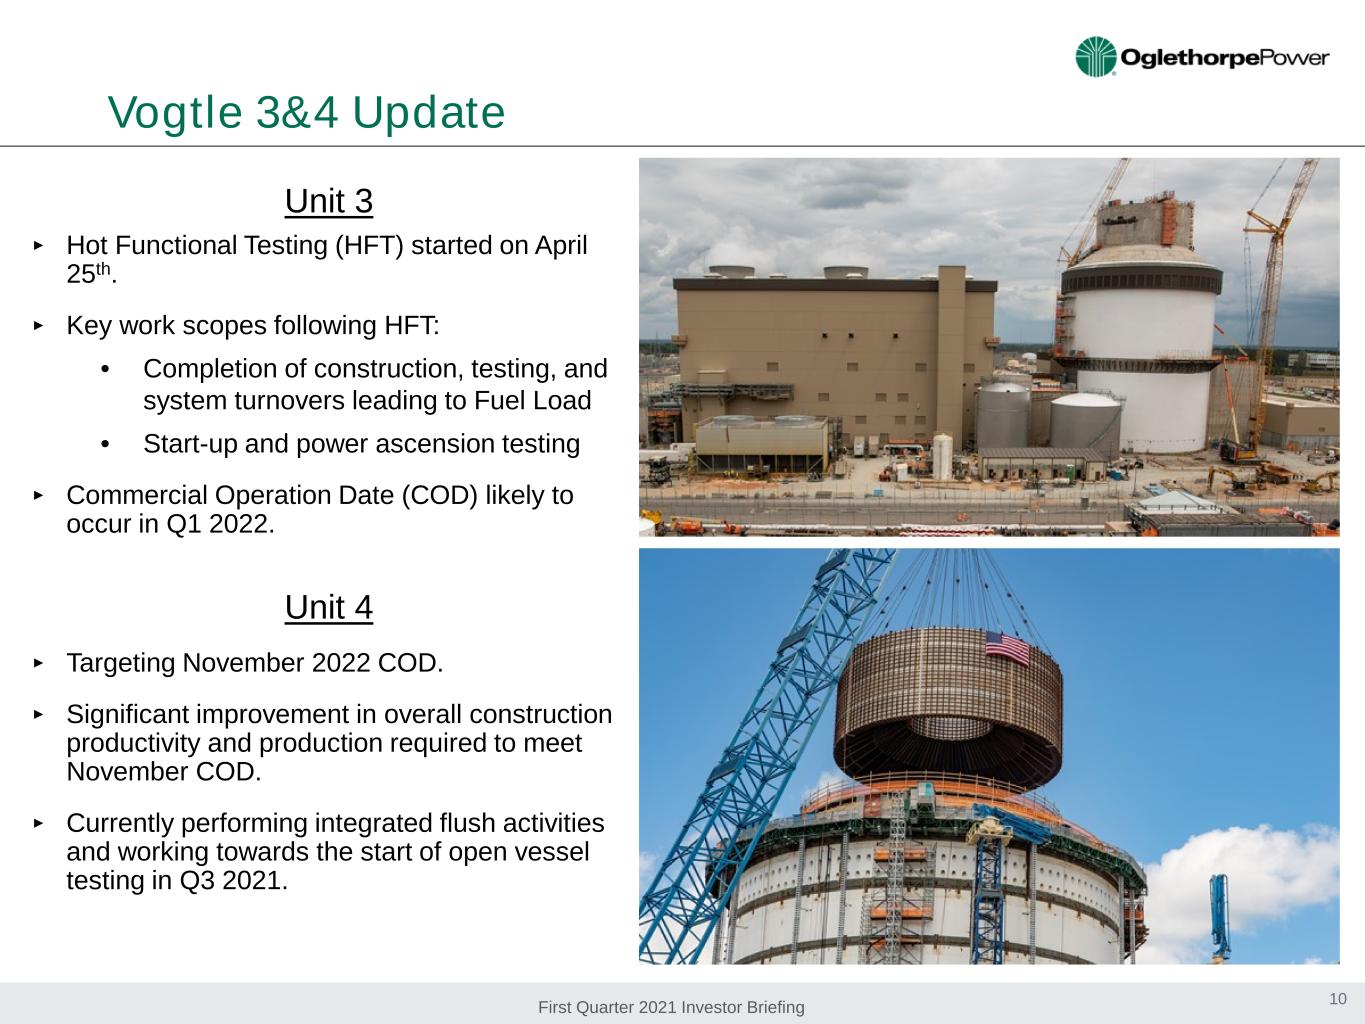
First Quarter 2021 Investor Briefing Vogtle 3&4 Update 10 Unit 3 ‣ Hot Functional Testing (HFT) started on April 25th. ‣ Key work scopes following HFT: • Completion of construction, testing, and system turnovers leading to Fuel Load • Start-up and power ascension testing ‣ Commercial Operation Date (COD) likely to occur in Q1 2022. Unit 4 ‣ Targeting November 2022 COD. ‣ Significant improvement in overall construction productivity and production required to meet November COD. ‣ Currently performing integrated flush activities and working towards the start of open vessel testing in Q3 2021.
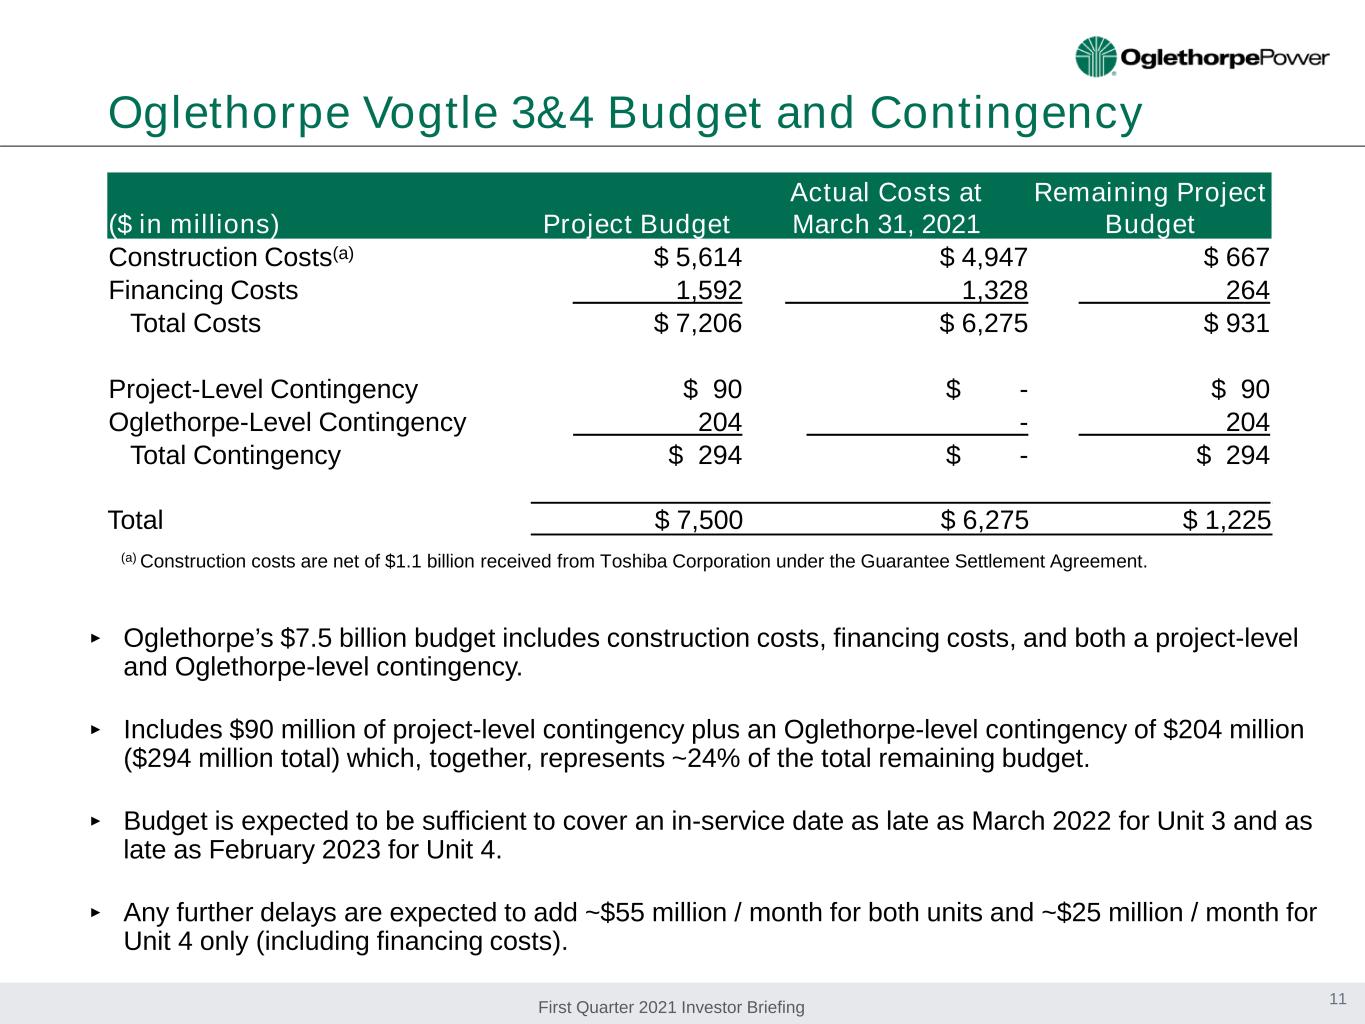
First Quarter 2021 Investor Briefing Oglethorpe Vogtle 3&4 Budget and Contingency ‣ Oglethorpe’s $7.5 billion budget includes construction costs, financing costs, and both a project-level and Oglethorpe-level contingency. ‣ Includes $90 million of project-level contingency plus an Oglethorpe-level contingency of $204 million ($294 million total) which, together, represents ~24% of the total remaining budget. ‣ Budget is expected to be sufficient to cover an in-service date as late as March 2022 for Unit 3 and as late as February 2023 for Unit 4. ‣ Any further delays are expected to add ~$55 million / month for both units and ~$25 million / month for Unit 4 only (including financing costs). 11 (a) Construction costs are net of $1.1 billion received from Toshiba Corporation under the Guarantee Settlement Agreement. ($ in millions) Project Budget Actual Costs at March 31, 2021 Remaining Project Budget Construction Costs(a) $ 5,614 $ 4,947 $ 667 Financing Costs 1,592 1,328 264 Total Costs $ 7,206 $ 6,275 $ 931 Project-Level Contingency $ 90 $ - $ 90 Oglethorpe-Level Contingency 204 - 204 Total Contingency $ 294 $ - $ 294 Total $ 7,500 $ 6,275 $ 1,225
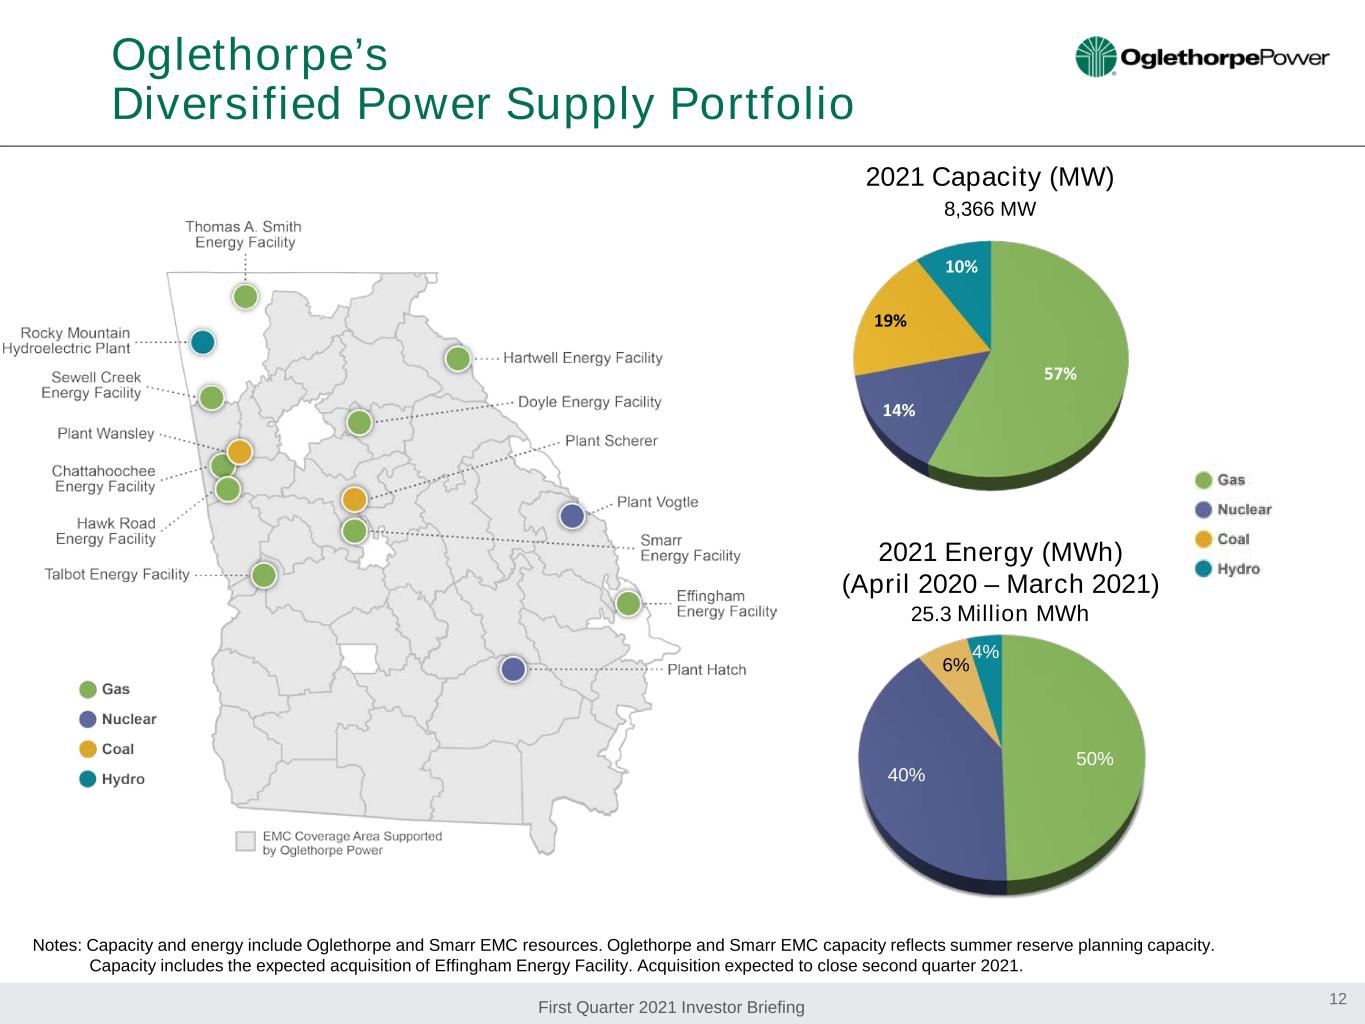
First Quarter 2021 Investor Briefing Oglethorpe’s Diversified Power Supply Portfolio Notes: Capacity and energy include Oglethorpe and Smarr EMC resources. Oglethorpe and Smarr EMC capacity reflects summer reserve planning capacity. Capacity includes the expected acquisition of Effingham Energy Facility. Acquisition expected to close second quarter 2021. 2021 Capacity (MW) 8,366 MW 12 50% 40% 6% 4% 2021 Energy (MWh) (April 2020 – March 2021) 25.3 Million MWh 57% 14% 19% 10%
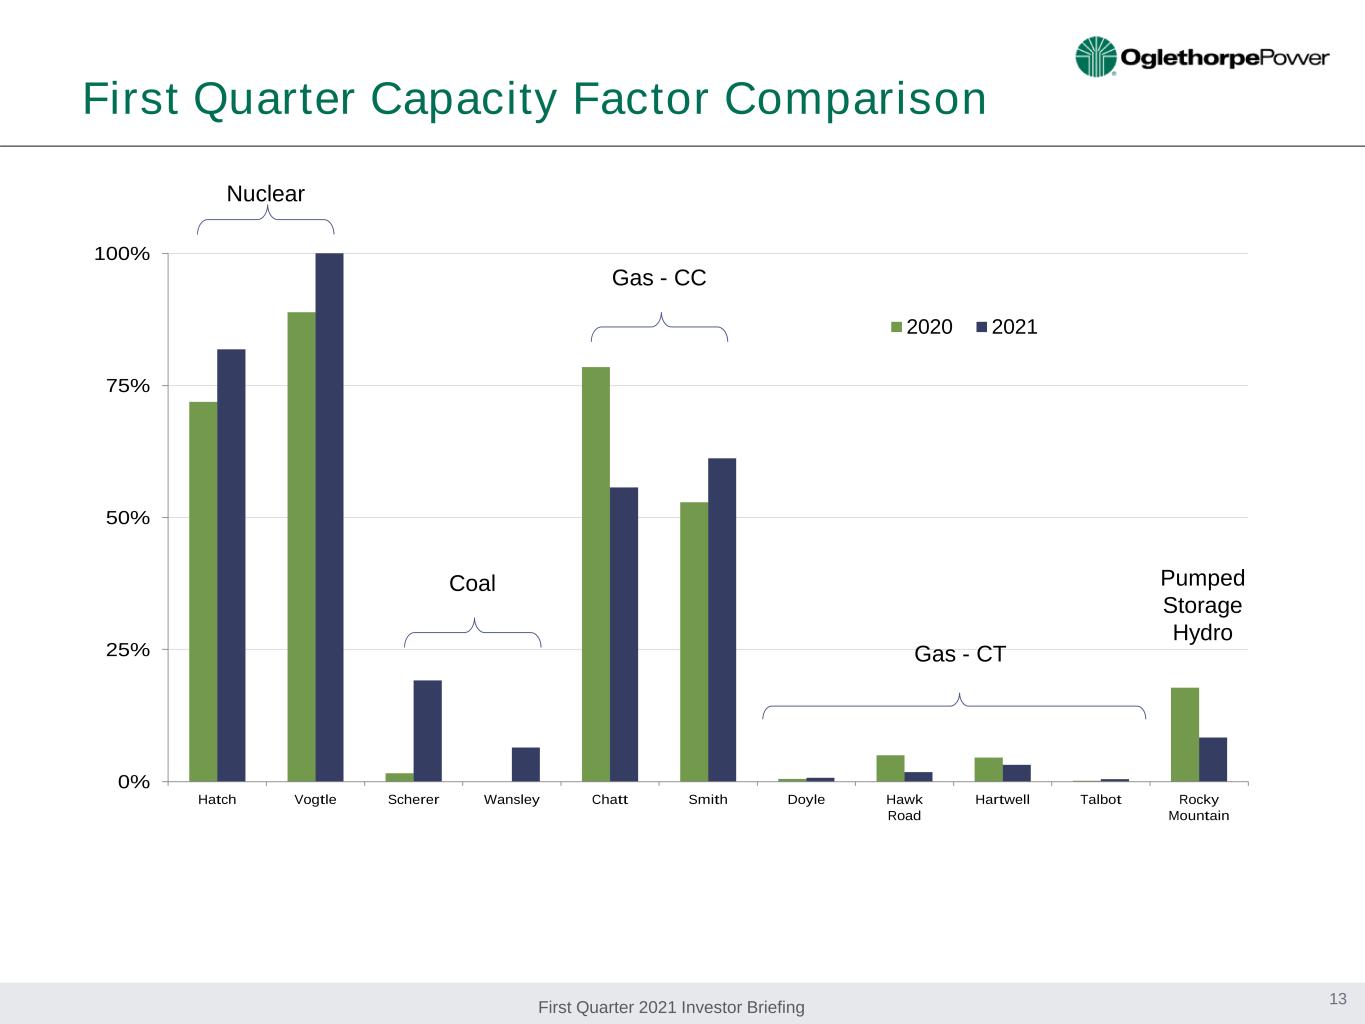
First Quarter 2021 Investor Briefing 0% 25% 50% 75% 100% Hatch Vogtle Scherer Wansley Chatt Smith Doyle Hawk Road Hartwell Talbot Rocky Mountain 2020 2021 First Quarter Capacity Factor Comparison Nuclear Coal Gas - CC Gas - CT Pumped Storage Hydro 13
First Quarter 2021 Investor Briefing Oglethorpe’s Cybersecurity Program ‣ Have implemented a multi-layered defense strategy leveraging best-practice cybersecurity frameworks. ‣ Comply with mandatory North American Electric Reliability Corporation Critical Infrastructure Protection (NERC CIP) cybersecurity standards. ‣ Invest in people, processes, technology, and relationships including with government partners. ‣ Regularly evaluate our program and test our incident response plans. ‣ Plan, build, and operate plants and systems with an emphasis on reliability and resiliency. 14

First Quarter 2021 Investor Briefing Members’ Load ‣ MWh Sales of 39 million in 2020. ‣ Average Residential Revenue of 11.65 cents/kWh in 2020. ‣ 67% of MWh sales were to residential class. ‣ Serve 2.0 million meters, representing approximately 4.3 million people. • Covers 38,000 square miles, or 65% of Georgia. • Includes 151 out of 159 counties in Georgia. ‣ No residential competition. ‣ Exclusive right to provide retail service in designated service territories. ‣ Competition only at inception for C&I loads in excess of 900kW. Member Systems at a Glance = Oglethorpe’s 38 Members Members’ Service Territory and Competition Revenue Contribution to Oglethorpe ‣ In 2020, Jackson EMC and Cobb EMC accounted for 15% and 13% of our total revenues, respectively. ‣ No other Member over 10%. 15 Residential Service 67% Commercial & Industrial 29% Other 4% 2020 Member Customer Base by MWh Sales
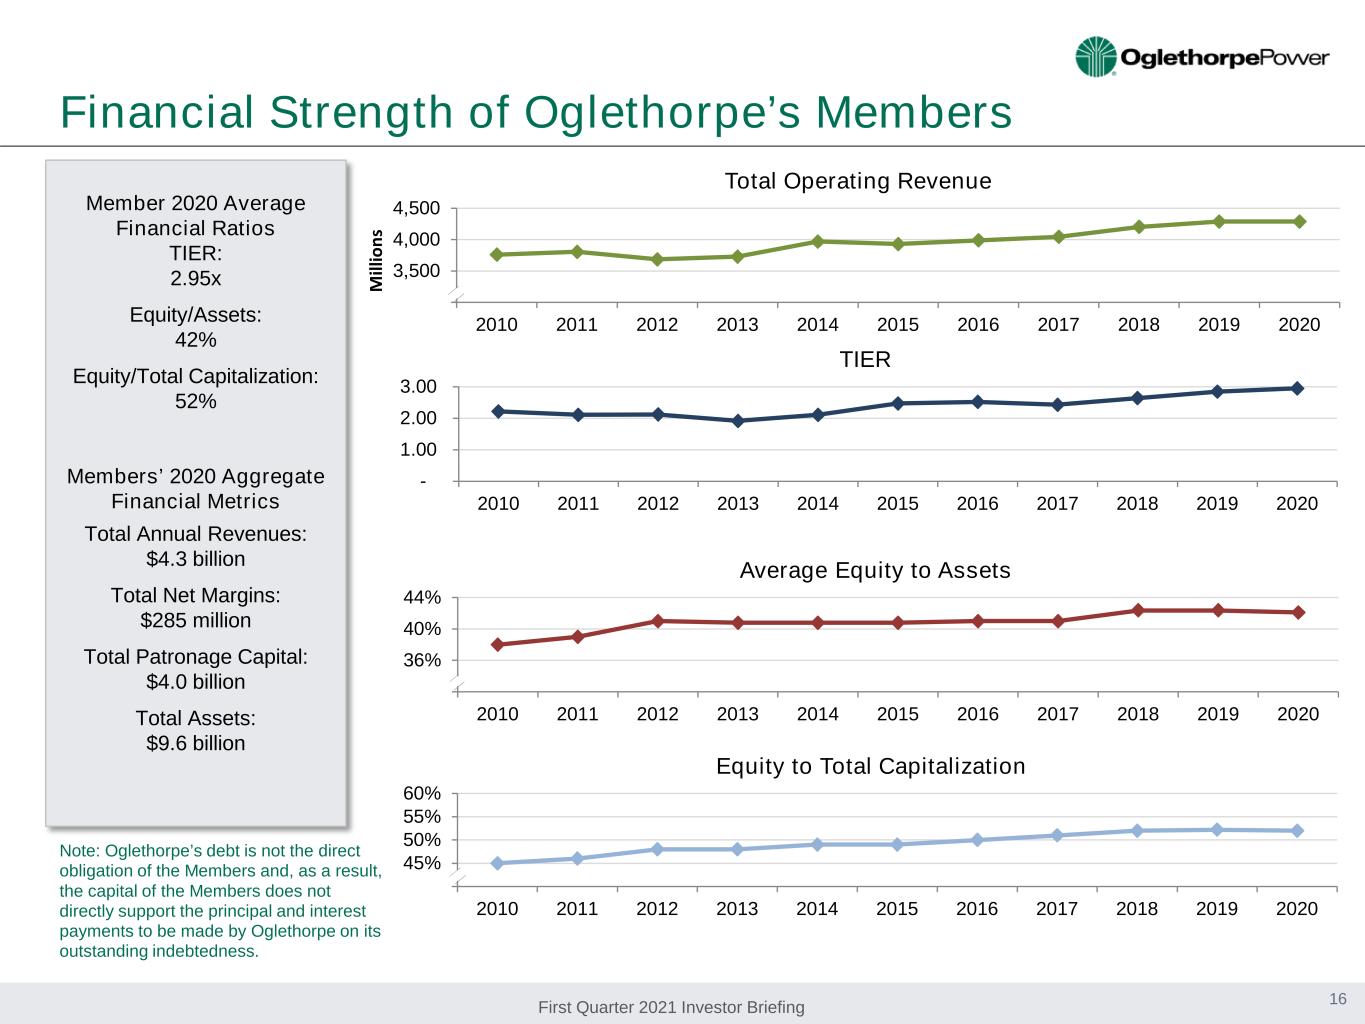
First Quarter 2021 Investor Briefing Financial Strength of Oglethorpe’s Members Recovery of All Costs + Margin 16 Member 2020 Average Financial Ratios TIER: 2.95x Equity/Assets: 42% Equity/Total Capitalization: 52% Members’ 2020 Aggregate Financial Metrics Total Annual Revenues: $4.3 billion Total Net Margins: $285 million Total Patronage Capital: $4.0 billion Total Assets: $9.6 billion Note: Oglethorpe’s debt is not the direct obligation of the Members and, as a result, the capital of the Members does not directly support the principal and interest payments to be made by Oglethorpe on its outstanding indebtedness. 3,000 3,500 4,000 4,500 2010 2011 2012 2013 2014 2015 2016 2017 2018 2019 2020 M ill io ns Total Operating Revenue - 1.00 2.00 3.00 2010 2011 2012 2013 2014 2015 2016 2017 2018 2019 2020 TIER 32% 36% 40% 44% 2010 2011 2012 2013 2014 2015 2016 2017 2018 2019 2020 Average Equity to Assets 40% 45% 50% 55% 60% 2010 2011 2012 2013 2014 2015 2016 2017 2018 2019 2020 Equity to Total Capitalization
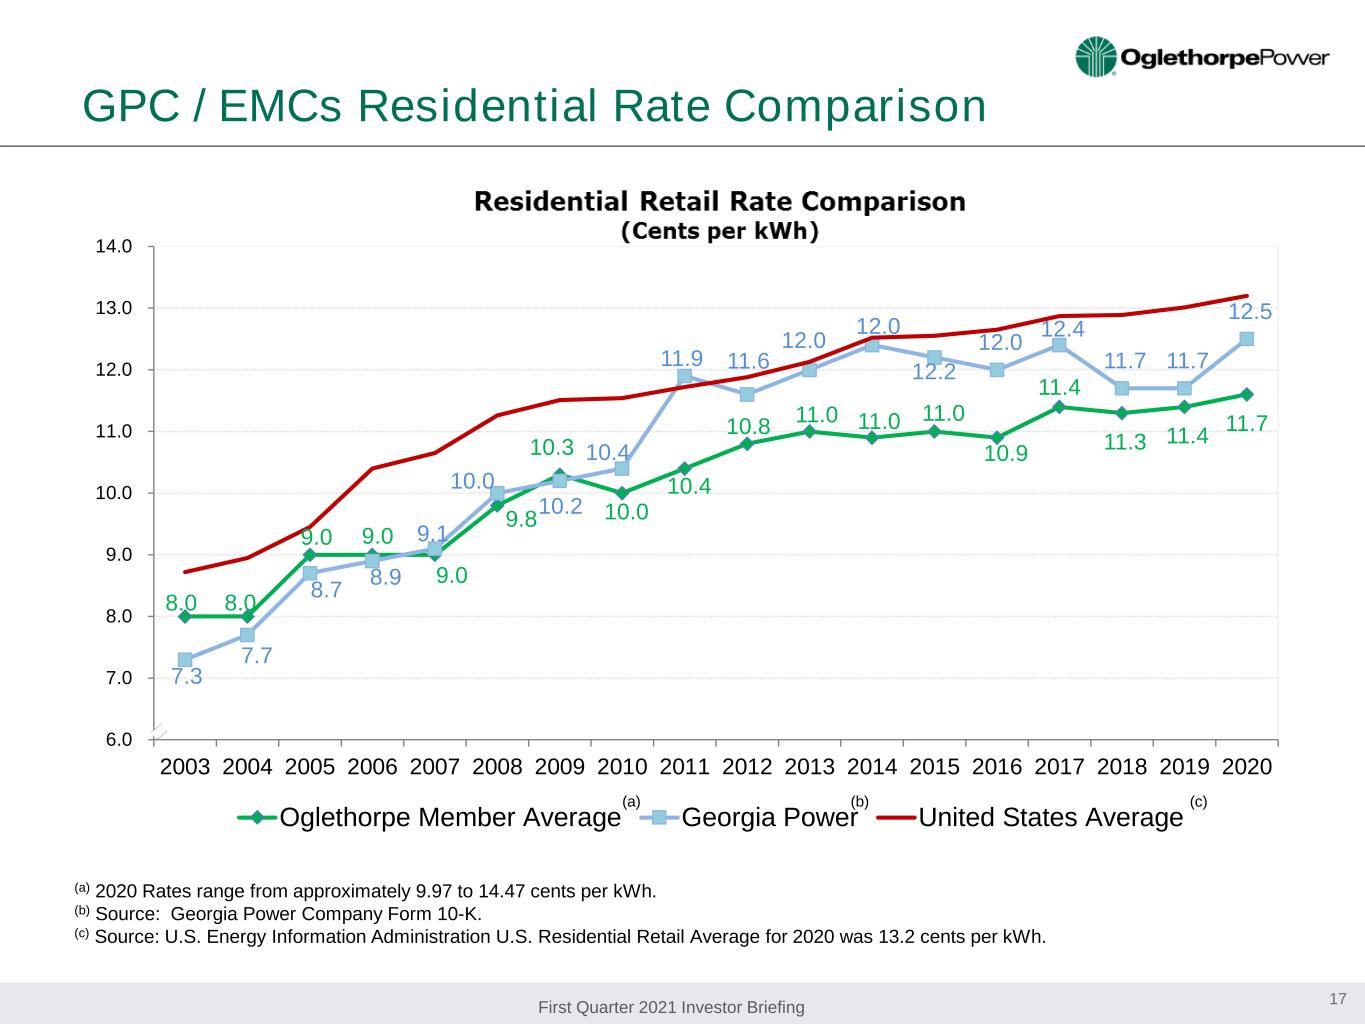
First Quarter 2021 Investor Briefing GPC / EMCs Residential Rate Comparison 17 (a) 2020 Rates range from approximately 9.97 to 14.47 cents per kWh. (b) Source: Georgia Power Company Form 10-K. (c) Source: U.S. Energy Information Administration U.S. Residential Retail Average for 2020 was 13.2 cents per kWh. (a) (b) (c) 8.0 8.0 9.0 9.0 9.0 9.8 10.3 10.0 10.4 10.8 11.0 11.0 11.0 10.9 11.4 11.3 11.4 11.7 7.3 7.7 8.7 8.9 9.1 10.0 10.2 10.4 11.9 11.6 12.0 12.0 12.2 12.0 12.4 11.7 11.7 12.5 6.0 7.0 8.0 9.0 10.0 11.0 12.0 13.0 14.0 2003 2004 2005 2006 2007 2008 2009 2010 2011 2012 2013 2014 2015 2016 2017 2018 2019 2020 Oglethorpe Member Average Georgia Power United States Average

First Quarter 2021 Investor Briefing - 2 4 6 8 10 12 14 1998 2000 2002 2004 2006 2008 2010 2012 2014 2016 2018 2020 2022 2024 2026 2028 C en ts / K W h Oglethorpe Average Power Cost vs. Oglethorpe Average Member Residential Rate Oglethorpe Avg. Power Cost Oglethorpe Member Avg. Residential Rate Oglethorpe Average Wholesale Power Cost (Historical & Projected) 18 Projected Oglethorpe Avg. Power Cost Average Annual Growth Rate Historical 2005 - 2020: 1.7% (the post LEM / MS power marketing deal era) Oglethorpe Avg. Power Cost Average Annual Growth Rate Projected 2020 - 2028: 2.2%
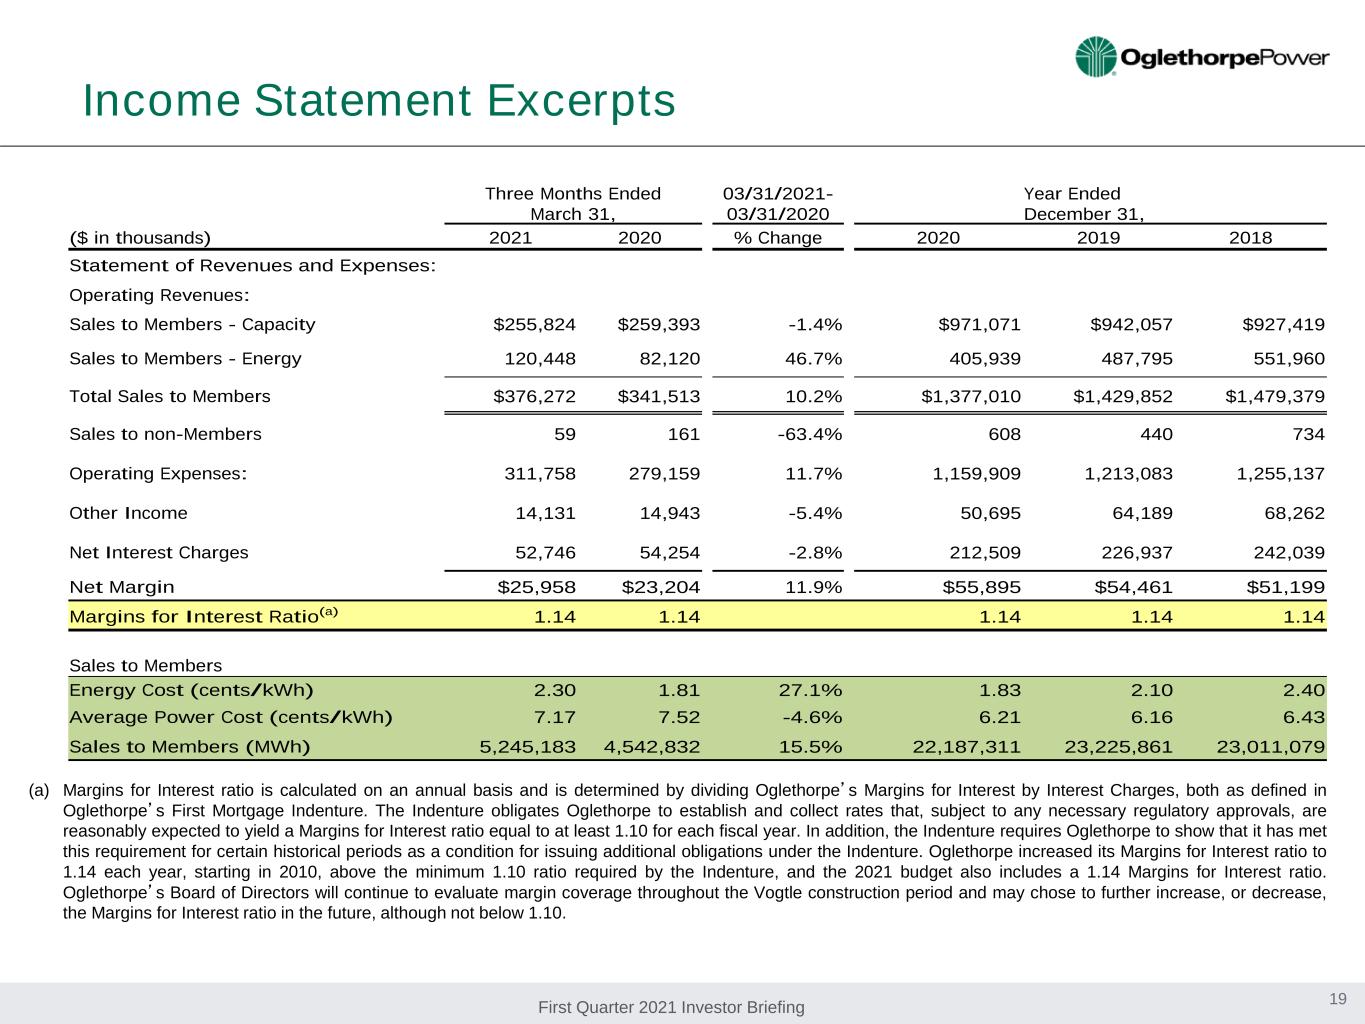
First Quarter 2021 Investor Briefing Income Statement Excerpts 19 (a) Margins for Interest ratio is calculated on an annual basis and is determined by dividing Oglethorpe’s Margins for Interest by Interest Charges, both as defined in Oglethorpe’s First Mortgage Indenture. The Indenture obligates Oglethorpe to establish and collect rates that, subject to any necessary regulatory approvals, are reasonably expected to yield a Margins for Interest ratio equal to at least 1.10 for each fiscal year. In addition, the Indenture requires Oglethorpe to show that it has met this requirement for certain historical periods as a condition for issuing additional obligations under the Indenture. Oglethorpe increased its Margins for Interest ratio to 1.14 each year, starting in 2010, above the minimum 1.10 ratio required by the Indenture, and the 2021 budget also includes a 1.14 Margins for Interest ratio. Oglethorpe’s Board of Directors will continue to evaluate margin coverage throughout the Vogtle construction period and may chose to further increase, or decrease, the Margins for Interest ratio in the future, although not below 1.10. Three Months Ended March 31, 03/31/2021- 03/31/2020 Year Ended December 31, ($ in thousands) 2021 2020 % Change 2020 2019 2018 Statement of Revenues and Expenses: Operating Revenues: Sales to Members - Capacity $255,824 $259,393 -1.4% $971,071 $942,057 $927,419 Sales to Members - Energy 120,448 82,120 46.7% 405,939 487,795 551,960 Total Sales to Members $376,272 $341,513 10.2% $1,377,010 $1,429,852 $1,479,379 Sales to non-Members 59 161 -63.4% 608 440 734 Operating Expenses: 311,758 279,159 11.7% 1,159,909 1,213,083 1,255,137 Other Income 14,131 14,943 -5.4% 50,695 64,189 68,262 Net Interest Charges 52,746 54,254 -2.8% 212,509 226,937 242,039 Net Margin $25,958 $23,204 11.9% $55,895 $54,461 $51,199 Margins for Interest Ratio(a) 1.14 1.14 1.14 1.14 1.14 Sales to Members Energy Cost (cents/kWh) 2.30 1.81 27.1% 1.83 2.10 2.40 Average Power Cost (cents/kWh) 7.17 7.52 -4.6% 6.21 6.16 6.43 Sales to Members (MWh) 5,245,183 4,542,832 15.5% 22,187,311 23,225,861 23,011,079
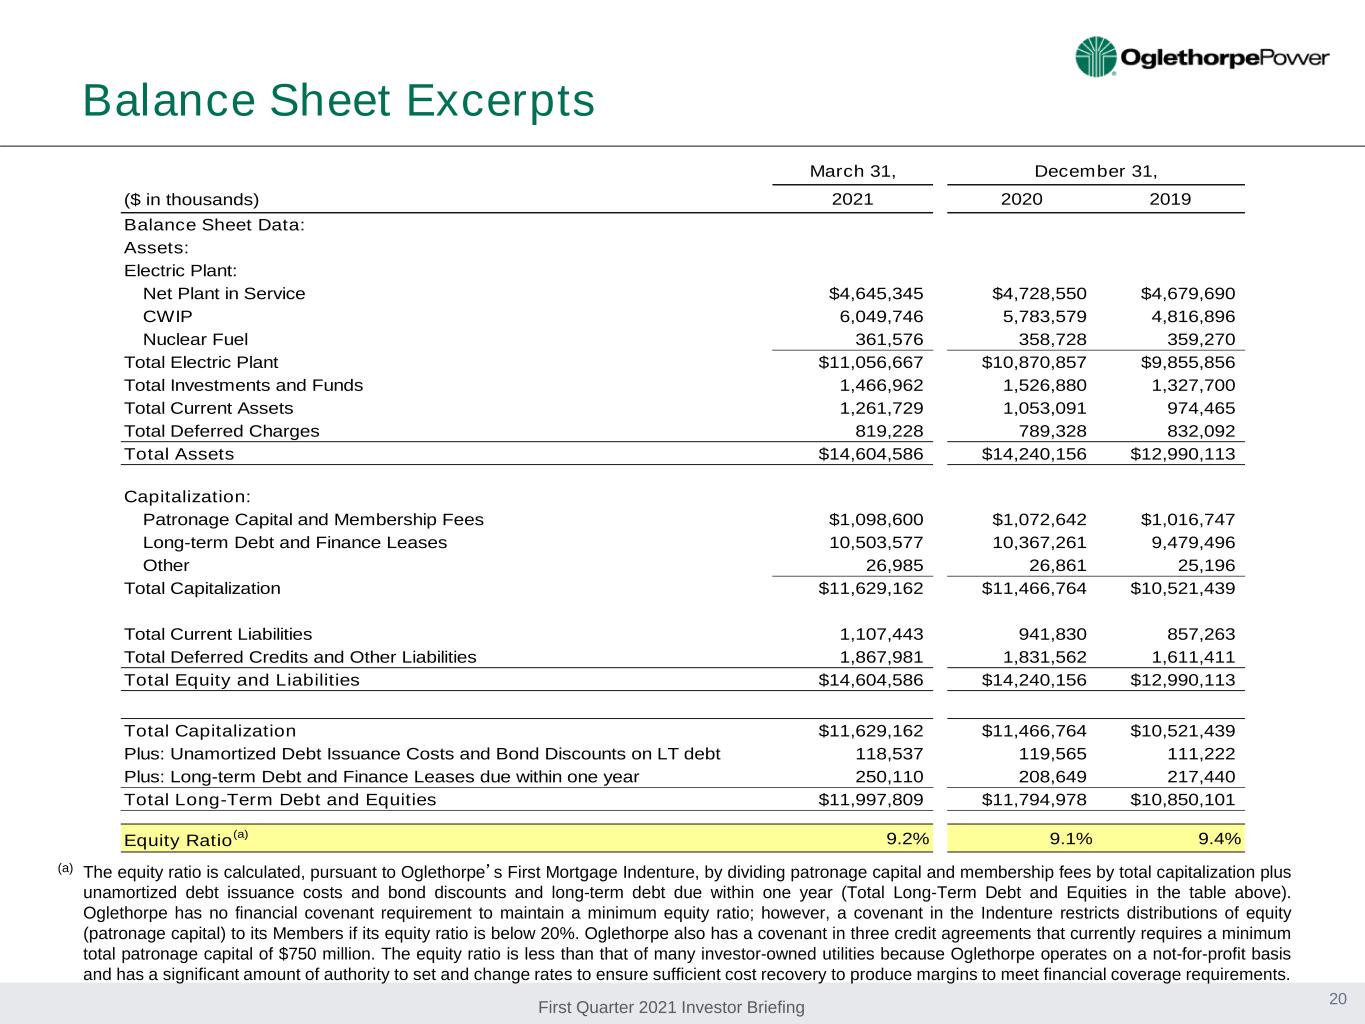
First Quarter 2021 Investor Briefing Balance Sheet Excerpts (a) The equity ratio is calculated, pursuant to Oglethorpe’s First Mortgage Indenture, by dividing patronage capital and membership fees by total capitalization plus unamortized debt issuance costs and bond discounts and long-term debt due within one year (Total Long-Term Debt and Equities in the table above). Oglethorpe has no financial covenant requirement to maintain a minimum equity ratio; however, a covenant in the Indenture restricts distributions of equity (patronage capital) to its Members if its equity ratio is below 20%. Oglethorpe also has a covenant in three credit agreements that currently requires a minimum total patronage capital of $750 million. The equity ratio is less than that of many investor-owned utilities because Oglethorpe operates on a not-for-profit basis and has a significant amount of authority to set and change rates to ensure sufficient cost recovery to produce margins to meet financial coverage requirements. 20 March 31, ($ in thousands) 2021 2020 2019 Balance Sheet Data: Assets: Electric Plant: Net Plant in Service $4,645,345 $4,728,550 $4,679,690 CWIP 6,049,746 5,783,579 4,816,896 Nuclear Fuel 361,576 358,728 359,270 Total Electric Plant $11,056,667 $10,870,857 $9,855,856 Total Investments and Funds 1,466,962 1,526,880 1,327,700 Total Current Assets 1,261,729 1,053,091 974,465 Total Deferred Charges 819,228 789,328 832,092 Total Assets $14,604,586 $14,240,156 $12,990,113 Capitalization: Patronage Capital and Membership Fees $1,098,600 $1,072,642 $1,016,747 Long-term Debt and Finance Leases 10,503,577 10,367,261 9,479,496 Other 26,985 26,861 25,196 Total Capitalization $11,629,162 $11,466,764 $10,521,439 Total Current Liabilities 1,107,443 941,830 857,263 Total Deferred Credits and Other Liabilities 1,867,981 1,831,562 1,611,411 Total Equity and Liabilities $14,604,586 $14,240,156 $12,990,113 Total Capitalization $11,629,162 $11,466,764 $10,521,439 Plus: Unamortized Debt Issuance Costs and Bond Discounts on LT debt 118,537 119,565 111,222 Plus: Long-term Debt and Finance Leases due within one year 250,110 208,649 217,440 Total Long-Term Debt and Equities $11,997,809 $11,794,978 $10,850,101 Equity Ratio(a) 9.2% 9.1% 9.4% December 31,
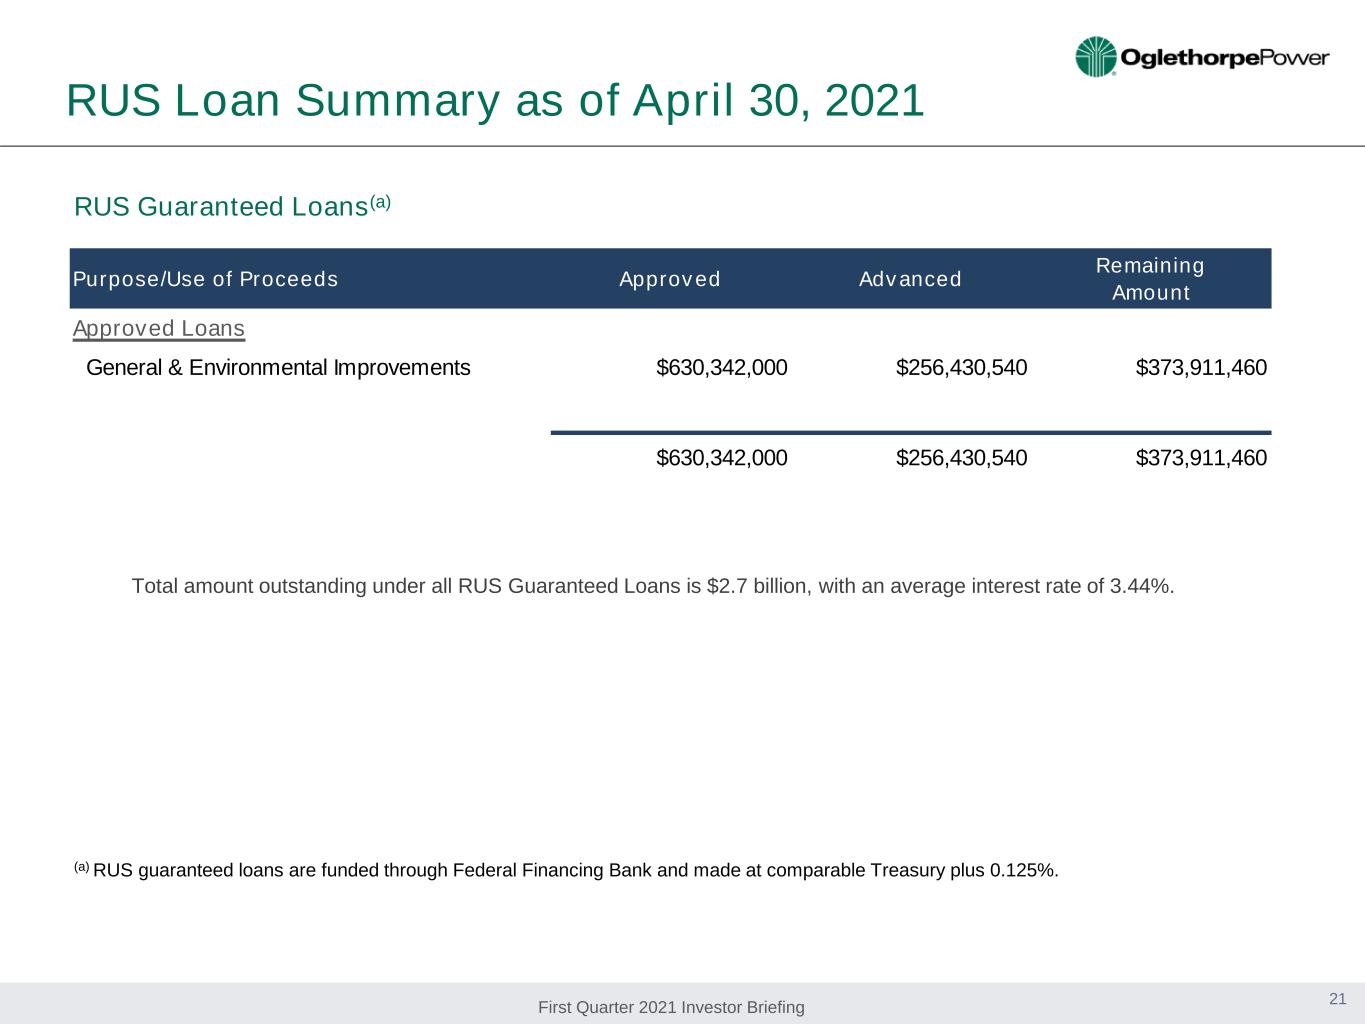
First Quarter 2021 Investor Briefing Total amount outstanding under all RUS Guaranteed Loans is $2.7 billion, with an average interest rate of 3.44%. RUS Guaranteed Loans(a) (a) RUS guaranteed loans are funded through Federal Financing Bank and made at comparable Treasury plus 0.125%. 21 RUS Loan Summary as of April 30, 2021 Purpose/Use of Proceeds Approved Advanced Remaining Amount Approved Loans General & Environmental Improvements $630,342,000 $256,430,540 $373,911,460 $630,342,000 $256,430,540 $373,911,460
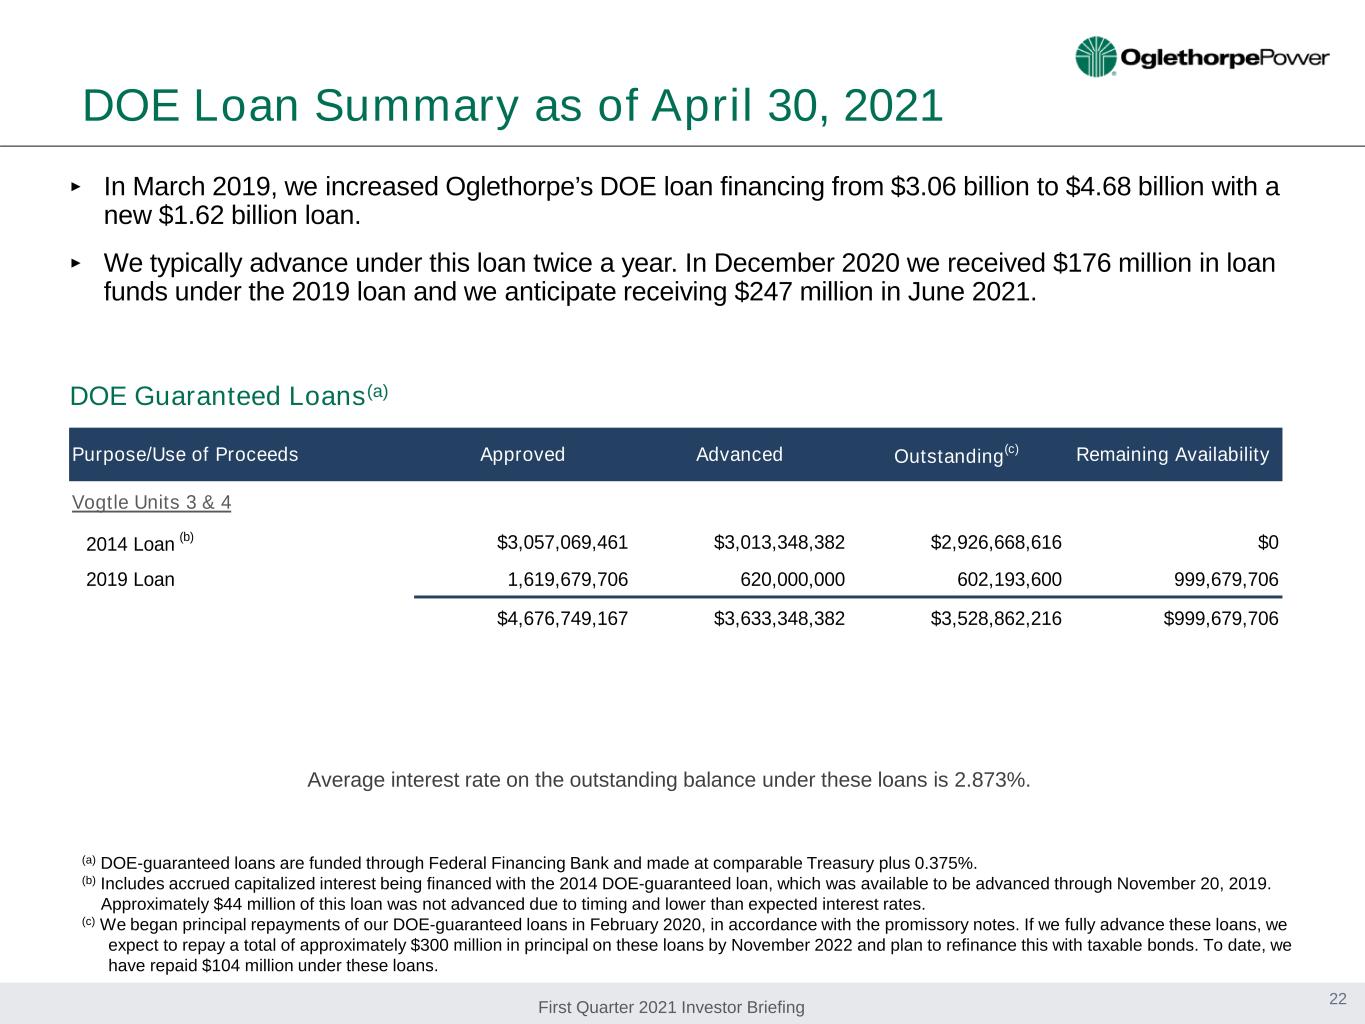
First Quarter 2021 Investor Briefing ‣ In March 2019, we increased Oglethorpe’s DOE loan financing from $3.06 billion to $4.68 billion with a new $1.62 billion loan. ‣ We typically advance under this loan twice a year. In December 2020 we received $176 million in loan funds under the 2019 loan and we anticipate receiving $247 million in June 2021. DOE Loan Summary as of April 30, 2021 DOE Guaranteed Loans(a) Average interest rate on the outstanding balance under these loans is 2.873%. (a) DOE-guaranteed loans are funded through Federal Financing Bank and made at comparable Treasury plus 0.375%. (b) Includes accrued capitalized interest being financed with the 2014 DOE-guaranteed loan, which was available to be advanced through November 20, 2019. Approximately $44 million of this loan was not advanced due to timing and lower than expected interest rates. (c) We began principal repayments of our DOE-guaranteed loans in February 2020, in accordance with the promissory notes. If we fully advance these loans, we expect to repay a total of approximately $300 million in principal on these loans by November 2022 and plan to refinance this with taxable bonds. To date, we have repaid $104 million under these loans. 22 Purpose/Use of Proceeds Approved Advanced Outstanding(c) Remaining Availability Vogtle Units 3 & 4 2014 Loan (b) $3,057,069,461 $3,013,348,382 $2,926,668,616 $0 2019 Loan 1,619,679,706 620,000,000 602,193,600 999,679,706 $4,676,749,167 $3,633,348,382 $3,528,862,216 $999,679,706
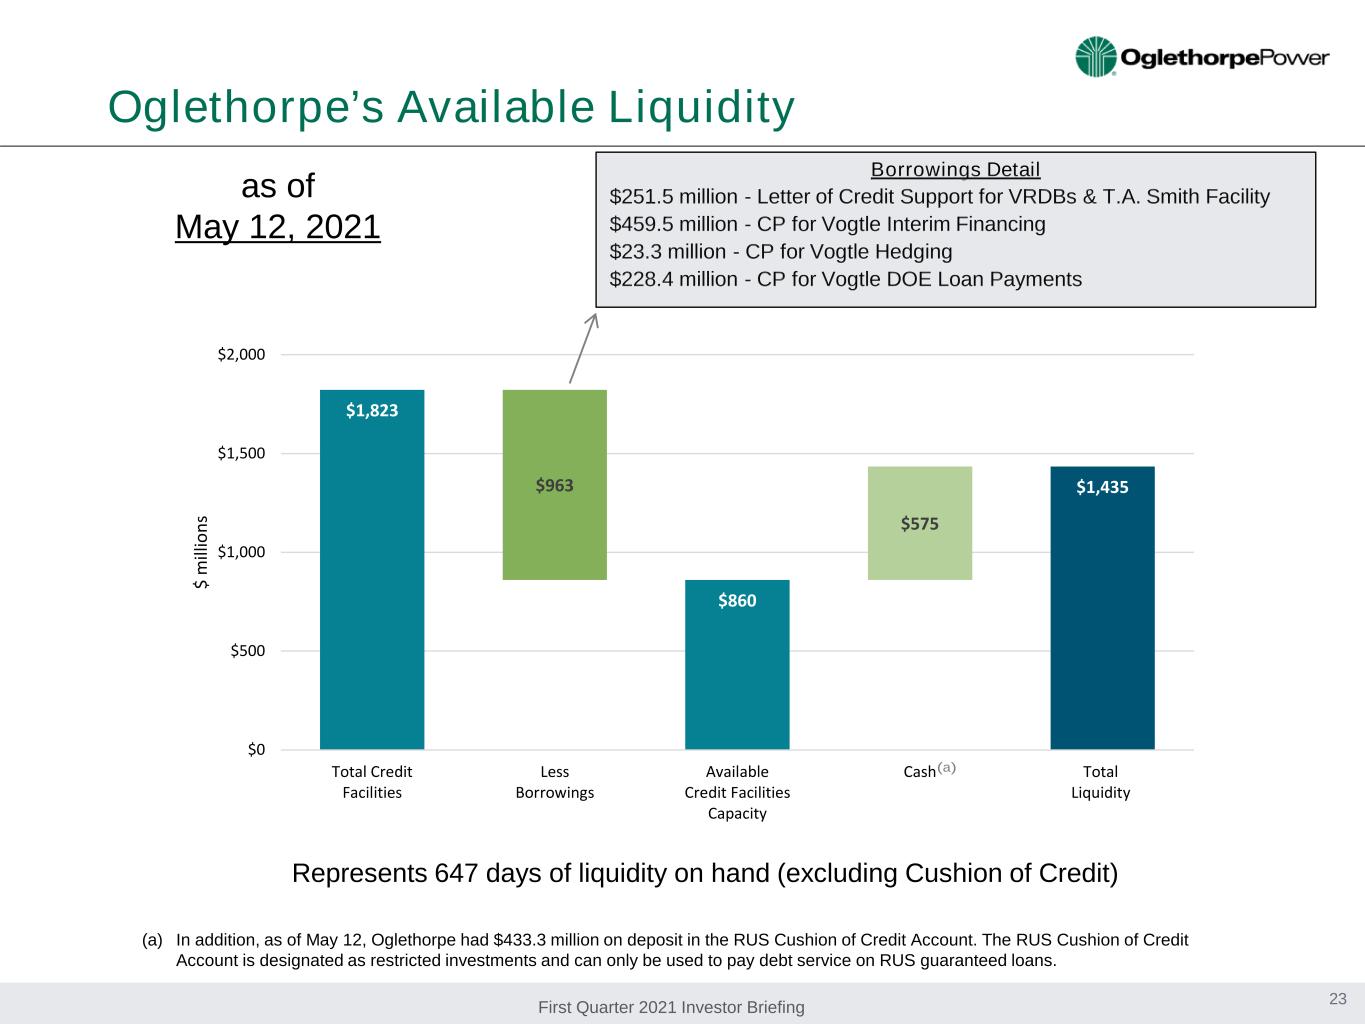
First Quarter 2021 Investor Briefing $1,823 $963 $860 $575 $1,435 $0 $500 $1,000 $1,500 $2,000 Total Credit Facilities Less Borrowings Available Credit Facilities Capacity Cash Total Liquidity $ m ill io ns Oglethorpe’s Available Liquidity as of May 12, 2021 Borrowings Detail $251.5 million - Letter of Credit Support for VRDBs & T.A. Smith Facility $459.5 million - CP for Vogtle Interim Financing $23.3 million - CP for Vogtle Hedging $228.4 million - CP for Vogtle DOE Loan Payments Represents 647 days of liquidity on hand (excluding Cushion of Credit) (a) In addition, as of May 12, Oglethorpe had $433.3 million on deposit in the RUS Cushion of Credit Account. The RUS Cushion of Credit Account is designated as restricted investments and can only be used to pay debt service on RUS guaranteed loans. (a) 23
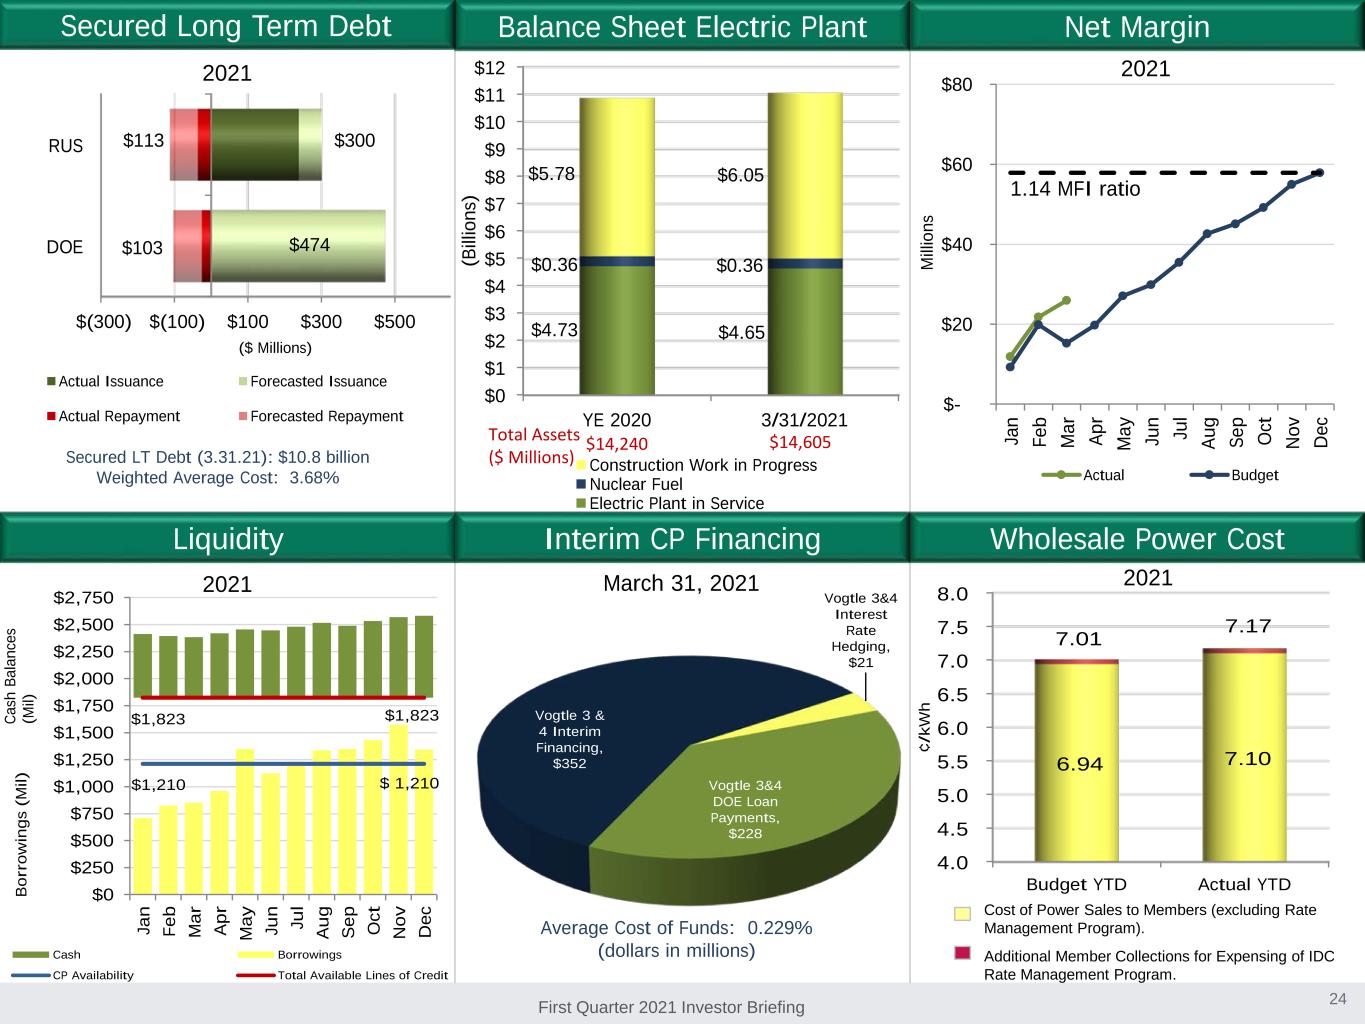
First Quarter 2021 Investor Briefing $(300) $(100) $100 $300 $500 DOE RUS $103 ($ Millions) Actual Issuance Forecasted Issuance Actual Repayment Forecasted Repayment $474 $300$113 Net Margin Liquidity Wholesale Power CostInterim CP Financing Balance Sheet Electric Plant Average Cost of Funds: 0.229% (dollars in millions) Secured LT Debt (3.31.21): $10.8 billion Weighted Average Cost: 3.68% 2021 March 31, 2021 2021 Cost of Power Sales to Members (excluding Rate Management Program). Additional Member Collections for Expensing of IDC Rate Management Program. 2021 2021 Secured Long Term Debt 24 1.14 MFI ratio $- $20 $40 $60 $80 Ja n Fe b M ar Ap r M ay Ju n Ju l Au g Se p O ct N ov D ec M ill io ns Actual Budget $0 $1 $2 $3 $4 $5 $6 $7 $8 $9 $10 $11 $12 YE 2020 3/31/2021 $4.73 $4.65 $0.36 $0.36 $5.78 $6.05 (B ill io ns ) Construction Work in Progress Nuclear Fuel Electric Plant in Service Total Assets ($ Millions) $14,240 $14,605 4.0 4.5 5.0 5.5 6.0 6.5 7.0 7.5 8.0 Budget YTD Actual YTD 6.94 7.10 7.01 7.17 ¢ /k W h Vogtle 3&4 Interest Rate Hedging, $21 Vogtle 3&4 DOE Loan Payments, $228 Vogtle 3 & 4 Interim Financing, $352 $1,210 $ 1,210 $1,823 $1,823 $0 $250 $500 $750 $1,000 $1,250 $1,500 $1,750 $2,000 $2,250 $2,500 $2,750 Ja n Fe b M ar A p r M ay Ju n Ju l A u g S ep O ct N o v D ec B o rr o w in g s (M il) Cash Borrowings CP Availability Total Available Lines of Credit Ca sh B al an ce s (M il)
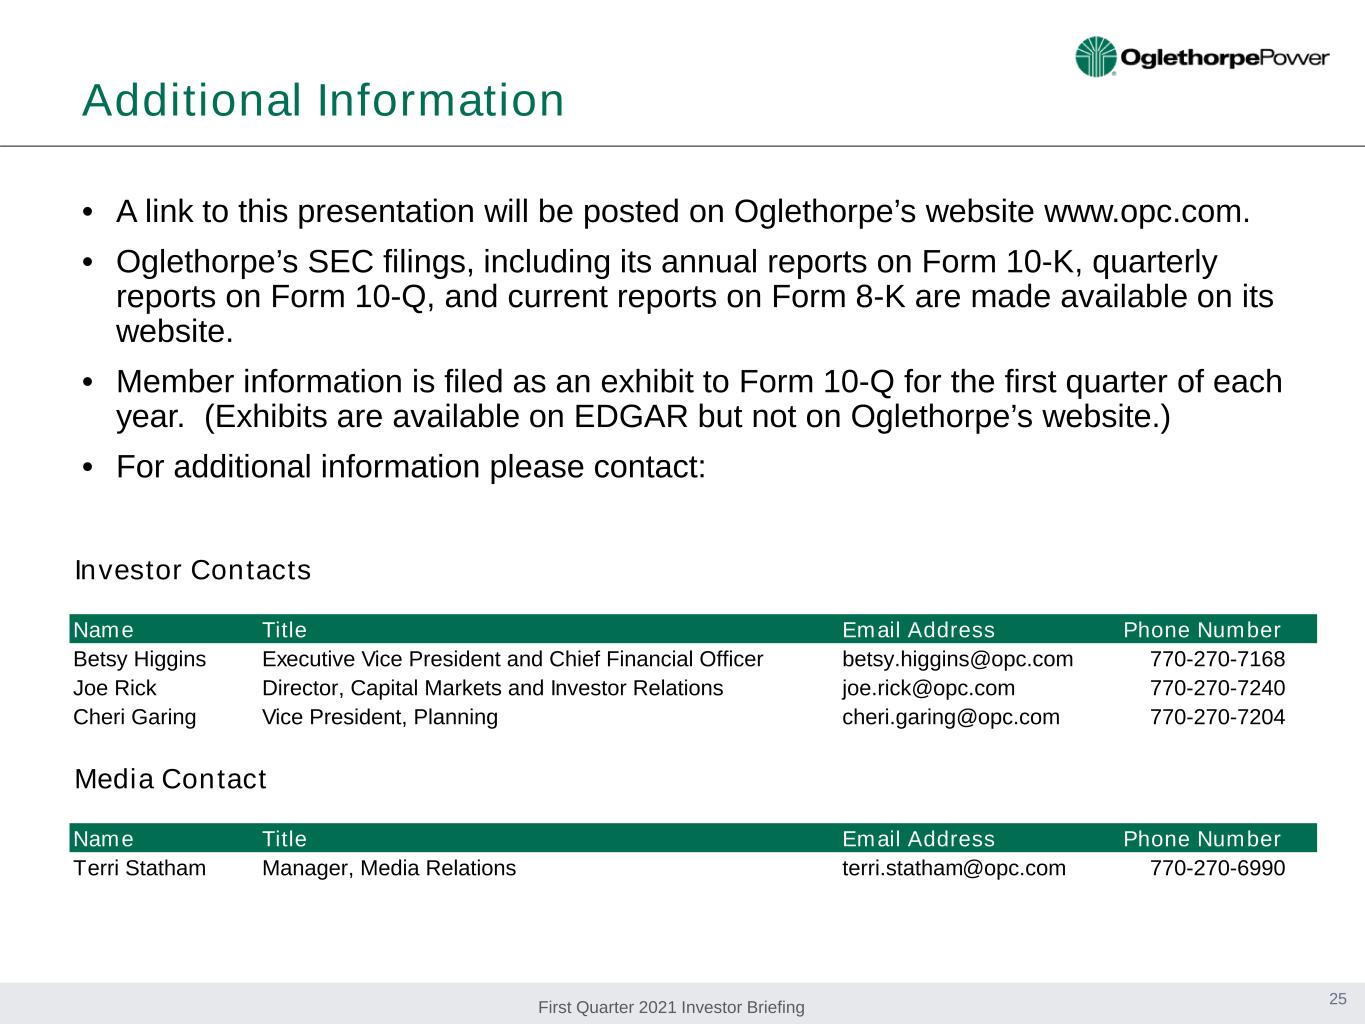
First Quarter 2021 Investor Briefing • A link to this presentation will be posted on Oglethorpe’s website www.opc.com. • Oglethorpe’s SEC filings, including its annual reports on Form 10-K, quarterly reports on Form 10-Q, and current reports on Form 8-K are made available on its website. • Member information is filed as an exhibit to Form 10-Q for the first quarter of each year. (Exhibits are available on EDGAR but not on Oglethorpe’s website.) • For additional information please contact: Additional Information 25 Investor Contacts Name Title Email Address Phone Number Betsy Higgins Executive Vice President and Chief Financial Officer betsy.higgins@opc.com 770-270-7168 Joe Rick Director, Capital Markets and Investor Relations joe.rick@opc.com 770-270-7240 Cheri Garing Vice President, Planning cheri.garing@opc.com 770-270-7204 Media Contact Name Title Email Address Phone Number Terri Statham Manager, Media Relations terri.statham@opc.com 770-270-6990
