Attached files
| file | filename |
|---|---|
| 8-K - 8-K - Gannett Co., Inc. | brhc10024748_8k.htm |
Exhibit 99.1

Needham 16th Annual Technology & Media Conference May 18, 2021 1
2 Disclaimer and Notes In General. This disclaimer applies to this document and the verbal or written
comments of any person presenting it. This document, taken together with any such verbal or written comments, is referred to herein as the “Presentation.” Prior to November 19, 2019, our corporate name was New Media Investment Group Inc. ("New
Media" or "Legacy New Media"), and Gannett Co., Inc. ("Legacy Gannett") was a separate publicly traded company. On November 19, 2019, New Media acquired Legacy Gannett (the "Acquisition"). In connection with the Acquisition, Legacy Gannett
became a wholly owned subsidiary of New Media, and New Media's name was changed to Gannett Co., Inc. (also referred to as “Gannett,” “we,” “us,” “our” or the “Company”).Cautionary Statement Regarding Forward-Looking Statements. Certain
statements in this Presentation may constitute forward-looking statements within the meaning of the Private Securities Litigation Reform Act of 1995, including, but not limited to, statements regarding our operating priorities, our ability to
grow Adjusted EBITDA, measures expected to result in annualized cash interest savings, our ability to achieve our operating priorities, our digital revenue performance, shifts in our revenue mix and the timing of realizing such shifts, the
potential sales of non-core assets, including the anticipated use of any proceeds from such sales, integration of our acquisitions, our ability, in terms of both amount and timing, to surpass $300 million of annualized synergies, our
expectations, in terms of both amount and timing, with respect to debt repayment, real estate sales and debt refinancing, growth of and demand for our digital-only subscriptions and digital marketing and advertising services, our strategy, and
future revenue trends, and our ability to influence trends. These statements are based on management’s current expectations and beliefs and are subject to a number of risks and uncertainties, which could cause actual results to differ
materially from those described in the forward-looking statements. Many of these risks and uncertainties are beyond our control. The Company can give no assurance its expectations will be attained. Accordingly, you should not place undue
reliance on any forward-looking statements contained in this Presentation. For a discussion of some of the risks and important factors that could cause actual results to differ from such forward-looking statements, see the risks and other
factors detailed from time to time in the Company’s Annual Report on Form 10-K, Quarterly Reports on Form 10-Q, and other filings with the Securities and Exchange Commission. Furthermore, new risks and uncertainties emerge from time to time,
and it is not possible for the Company to predict or assess the impact of every factor that may cause its actual results to differ from those contained in any forward-looking statements. Such forward-looking statements speak only as of the date
of this Presentation. The Company expressly disclaims any obligation to release publicly any updates or revisions to any forward-looking statements contained herein to reflect any change in the Company’s expectations with regard thereto or
change in events, conditions or circumstances on which any statement is based, except as required by law.Past Performance. In all cases where historical performance is presented, please note that past performance is not a reliable indicator of
future results and should not be relied upon as the basis for making an investment decision. This Presentation is not an offer to sell, nor a solicitation of an offer to buy any securities.Non-GAAP Measures. This Presentation includes non-GAAP
measures, such as Adjusted EBITDA, Adjusted EBITDA Margin, Free Cash Flow, Adjusted Net Income (loss) attributable to Gannett and same store revenue. Year-over-year same store revenue changes are calculated based on GAAP revenue for Gannett for
the current period, excluding (1) exited operations, (2) currency impacts, and (3) deferred revenue impacts related to the Acquisition. See the “Appendix” in this presentation for information regarding these non-GAAP measures, including
reconciliations to the most directly comparable GAAP financial measure.

3 Today’s Presenters Michael ReedChairman & Chief Executive OfficerMayur GuptaChief Marketing &
Strategy Officer Doug HorneChief Financial OfficerKris BartonChief Product Officer

Gannett is a subscription-led and digitally focused media and marketing solutions company committed to
empowering communities to thrive. Our strategy is focused on driving audience growth and engagement by delivering deeper content experiences to our consumers, while offering the products and marketing expertise our business partners
desire. 4

Company HistoryNew Media’s acquisition of Gannett in November 2019 created the largest local-to-national
media network in the U.S. 2015 Gannett separates from its broadcasting and digital businesses (now TEGNA) 2019 New Media acquires Gannett for $2.1 billion in a cash and stock transaction in November (1) 2014 New Media launches as a
public company 2020 Achieved annualized synergies of $245 millionRefinanced $497 million of debt into 6% convertible notes due 2027 2021 Refinanced remaining $1.0 billion of debt into Term Loan B due 2025Achieved annualized
synergy target of $300 million Includes debt and pension assumed with purchase
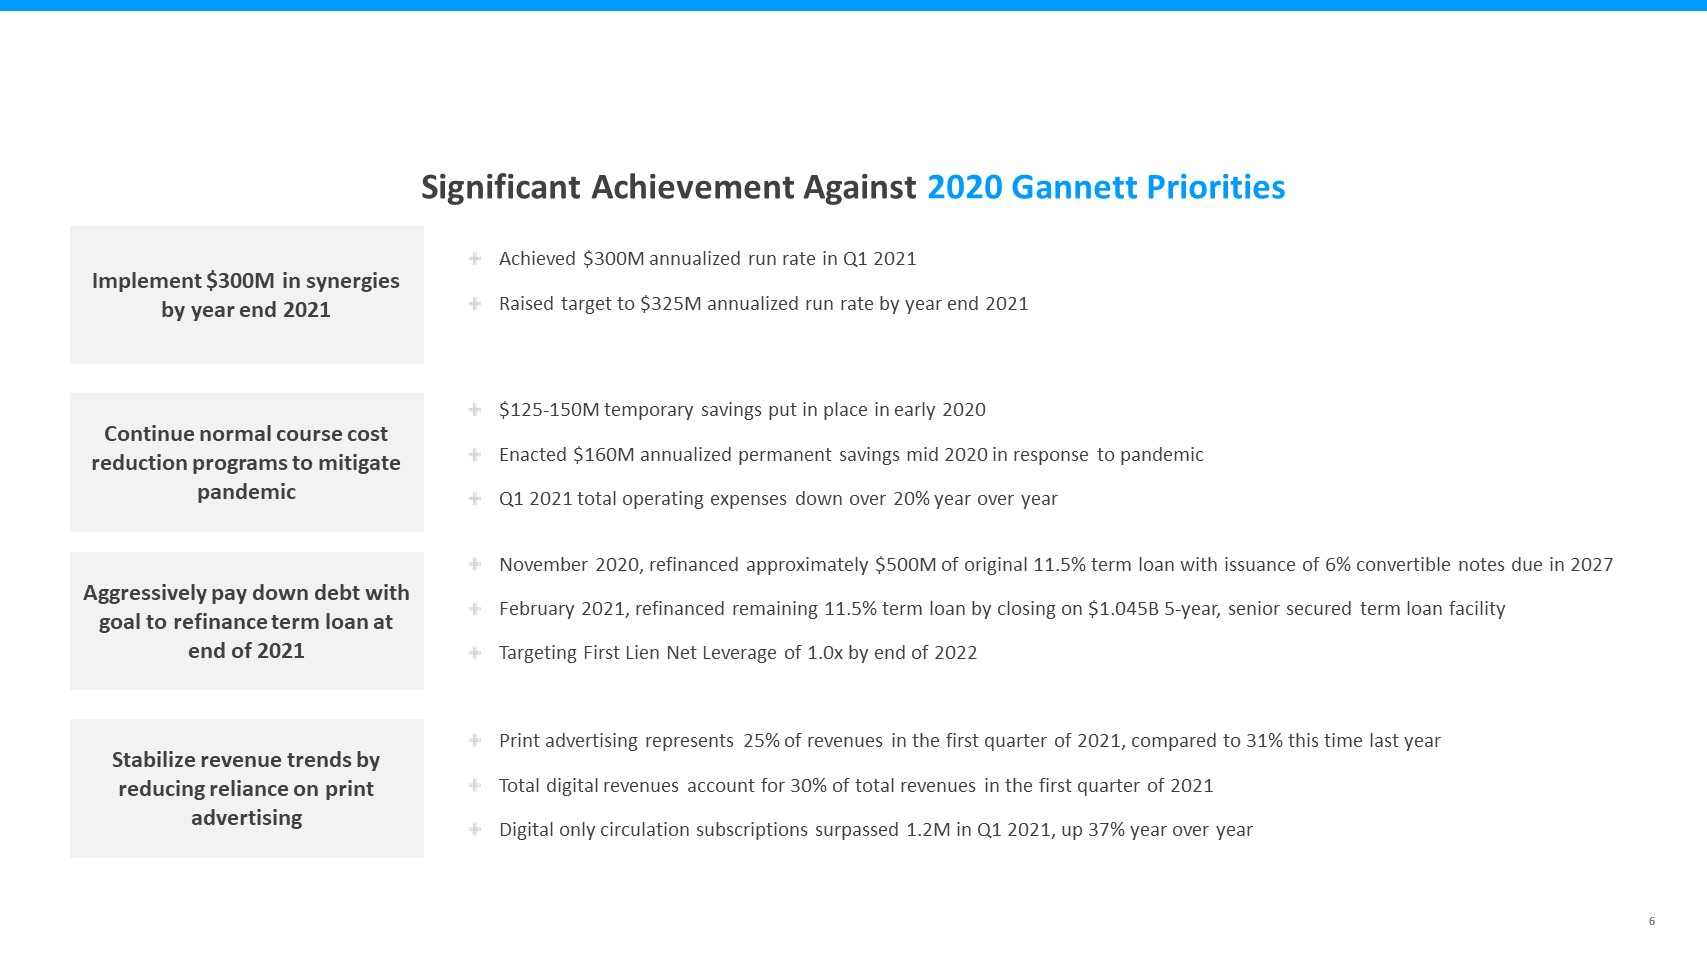
6 Significant Achievement Against 2020 Gannett Priorities Implement $300M in synergies by year end
2021 Continue normal course cost reduction programs to mitigate pandemic Aggressively pay down debt with goal to refinance term loan at end of 2021 Stabilize revenue trends by reducing reliance on print advertising $125-150M temporary
savings put in place in early 2020Enacted $160M annualized permanent savings mid 2020 in response to pandemicQ1 2021 total operating expenses down over 20% year over year Achieved $300M annualized run rate in Q1 2021Raised target to $325M
annualized run rate by year end 2021 November 2020, refinanced approximately $500M of original 11.5% term loan with issuance of 6% convertible notes due in 2027February 2021, refinanced remaining 11.5% term loan by closing on $1.045B 5-year,
senior secured term loan facilityTargeting First Lien Net Leverage of 1.0x by end of 2022 Print advertising represents 25% of revenues in the first quarter of 2021, compared to 31% this time last yearTotal digital revenues account for 30% of
total revenues in the first quarter of 2021Digital only circulation subscriptions surpassed 1.2M in Q1 2021, up 37% year over year

7 Key Operating Pillarsstrong opportunity for creating stakeholder value Accelerate digital
subscriber growth Drive digital marketing services (DMS) growth Optimize traditional print business Prioritize investments in growth businesses Build on inclusive & diverse culture Significant digital scaleLeverage integrated sales
structure and lead generation strategy to grow client baseData and insights inform new and dynamic marketing products and services Optimizing our pricing and improving customer service for our print subscribersPrint advertising continues to
offer a compelling branding opportunity across our U.S. and U.K. operations Progress toward stated 2025 workforce diversity goals Align our culture around empowering our communities to thrive and putting our customers at the center of
everything we do Identify, test, and invest in opportunities for growthExamples include: USA TODAY NETWORK Ventures (Events + Promotions)Reviewed.comUSA TODAY Sports Media Group Online sports betting / gaming Expect to reach 10 million
digital-only subscriptions in the next 5 years, inclusive of new offerings tailored to specific usersAnchored on high-quality, original, impactful journalism and premium content experiences
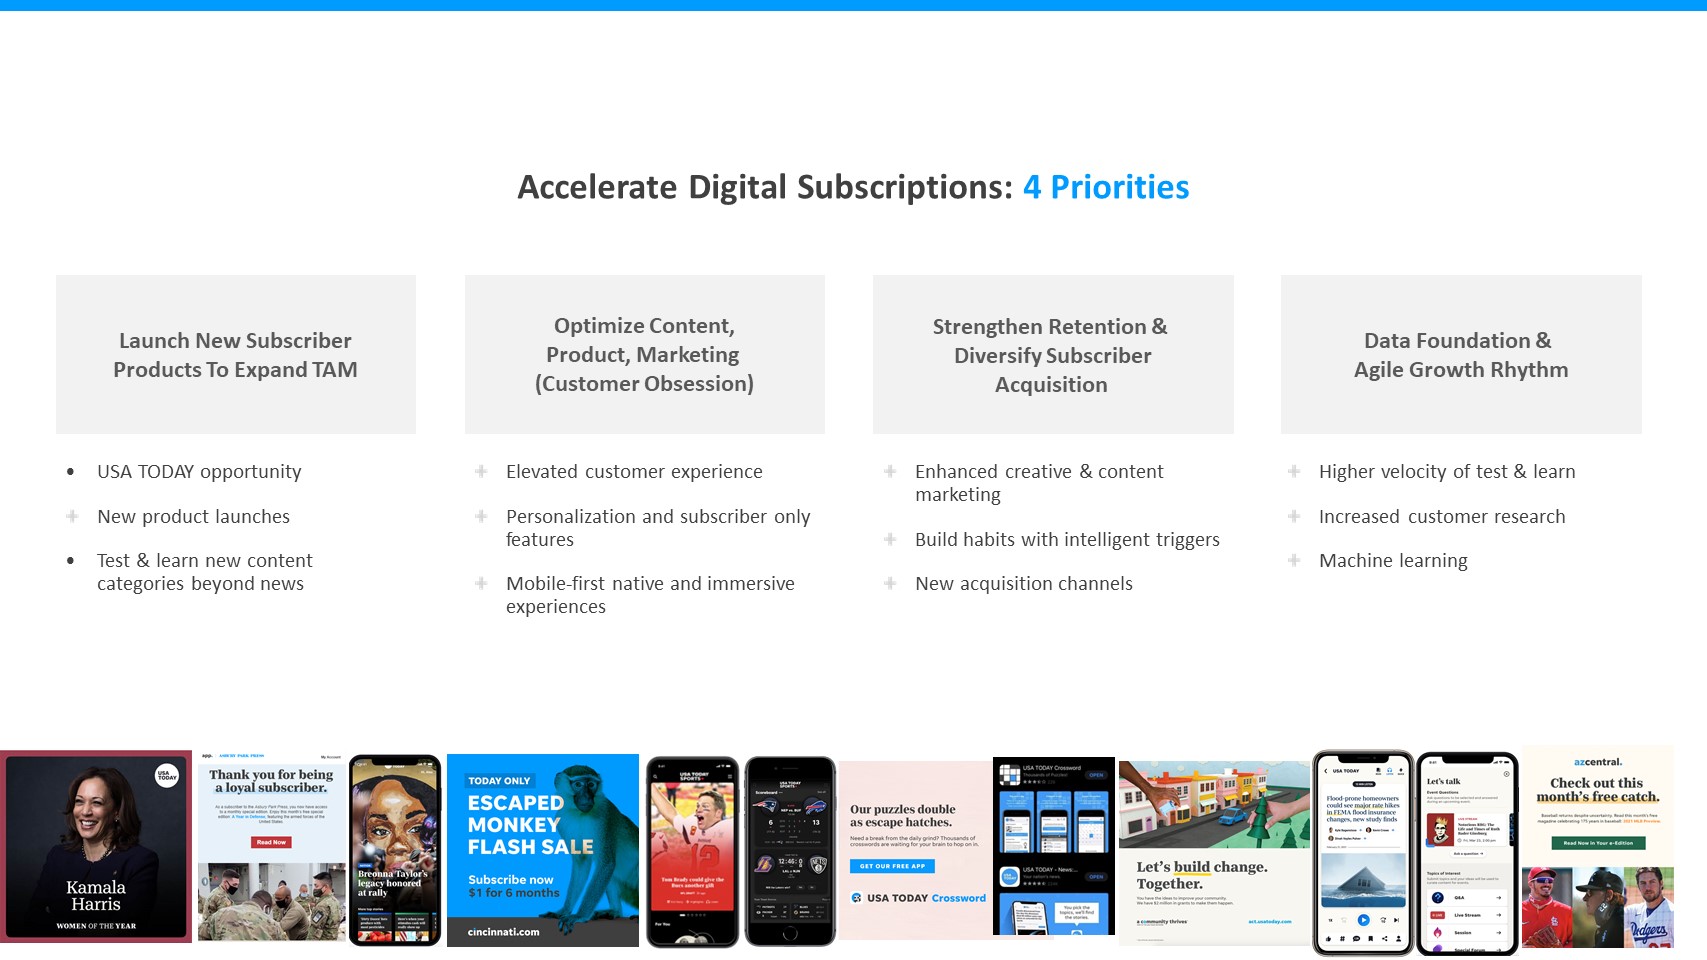
Launch New Subscriber Products To Expand TAM Strengthen Retention & Diversify Subscriber
Acquisition Optimize Content, Product, Marketing (Customer Obsession) Data Foundation & Agile Growth Rhythm Accelerate Digital Subscriptions: 4 Priorities USA TODAY opportunityNew product launchesTest & learn new content categories
beyond news Elevated customer experiencePersonalization and subscriber only features Mobile-first native and immersive experiences Enhanced creative & content marketing Build habits with intelligent triggersNew acquisition
channels Higher velocity of test & learnIncreased customer researchMachine learning
9 Drive DMS Growth: Opportunity & Value Creation Significant local community footprint, trusted
brands, in-market sales teams create unique opportunity to help local businesses thriveAccess and reach national brands do not haveAlready one of the largest DMS players in the marketNational competitors have seen significant growth, but are
also not profitableValuation based on revenue multiple

Client Experience Go-to-Market Channel Expansion Product Expansion Drive DMS Growth: 3
Priorities Client Engagement with the LOCALiQ platformImproved customer service experiences Fully managed, one-stop shop integrated solutions forBuilding digital presenceDriving awareness & leadsManage & nurturing leadsKnowing what
worksTiered product offerings with differentiated features Multi-channel approachEnhancing creative to drive on- and off-platform engagementTest & learn from data Our DMS business helps SMBs 1) Build their online presence 2) Drive
awareness & leads 3) Manage & nurture leads 4) Measure what works
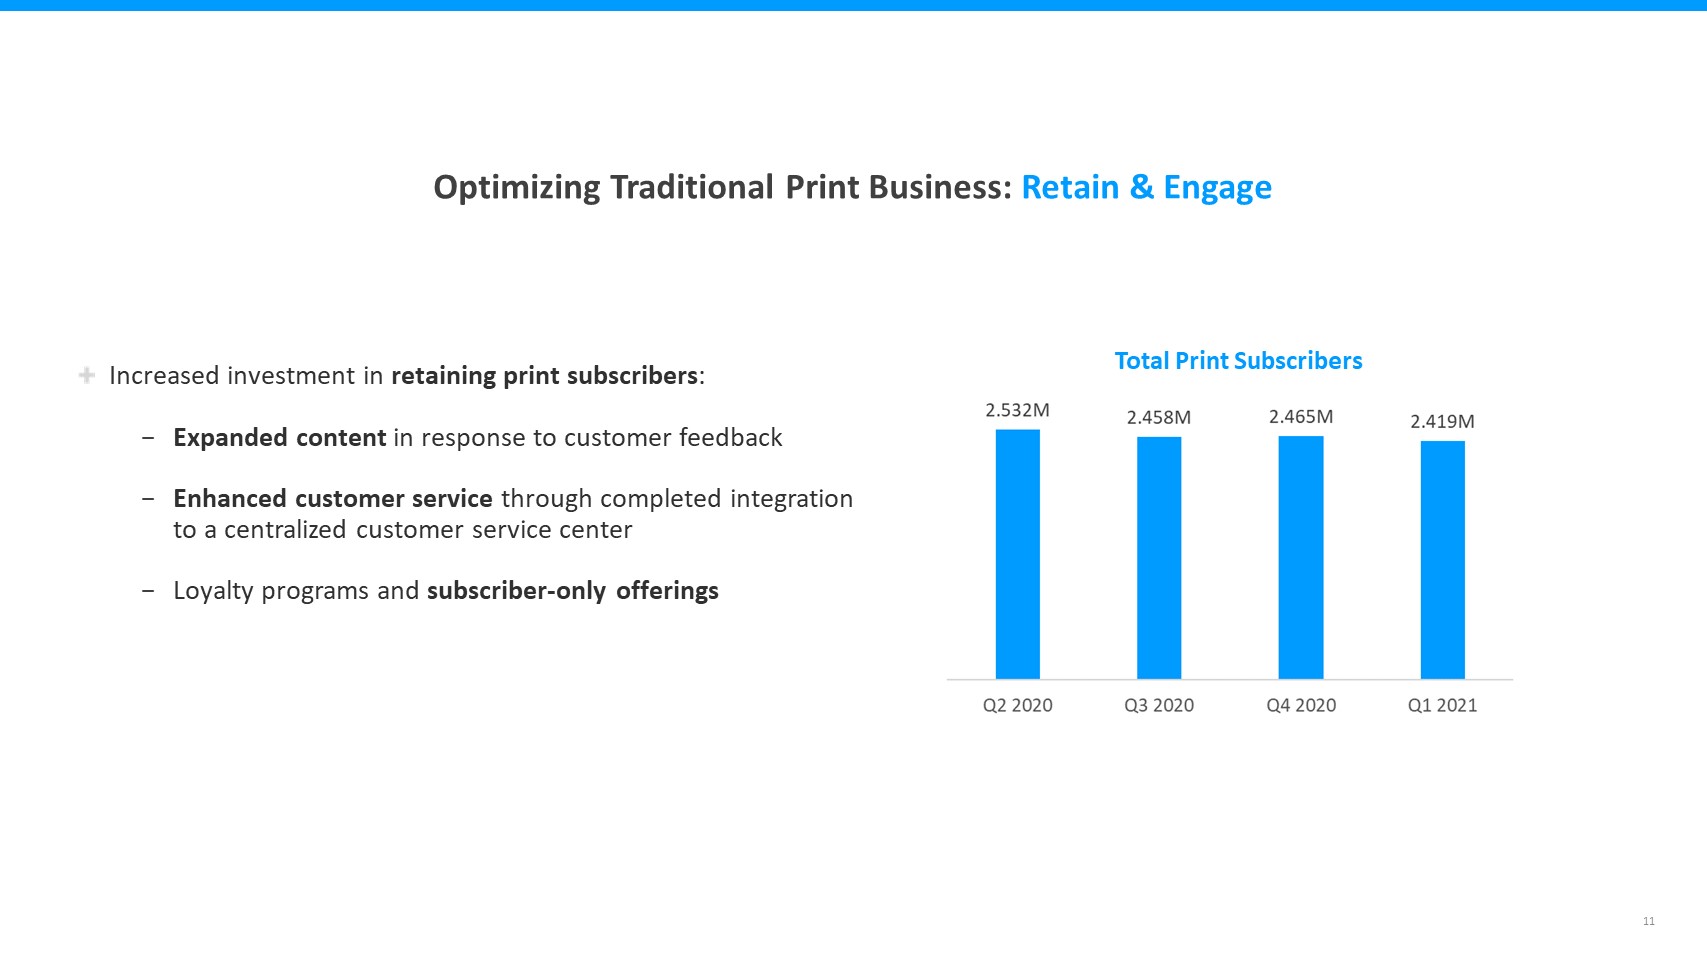
11 Optimizing Traditional Print Business: Retain & Engage Increased investment in retaining print
subscribers:Expanded content in response to customer feedbackEnhanced customer service through completed integration to a centralized customer service centerLoyalty programs and subscriber-only offerings Total Print
Subscribers

12 Prioritize Investments in Growth Businesses: Identify – Test - Invest Identify: Sports Betting /
Online GamingActively in discussions with online gaming partners to leverage our unparalleled assets and footprint in a partnershipAnnouncement pending Q2 2021Test: NFTsTesting first auction in several weeksLarge historical news archives offer
a potential opportunityInvest: USA TODAY NETWORK VenturesExpansion of flagship event concepts and promotions across complete footprintDevelopment of new event conceptsReturn to in-person events presents significant growth opportunity
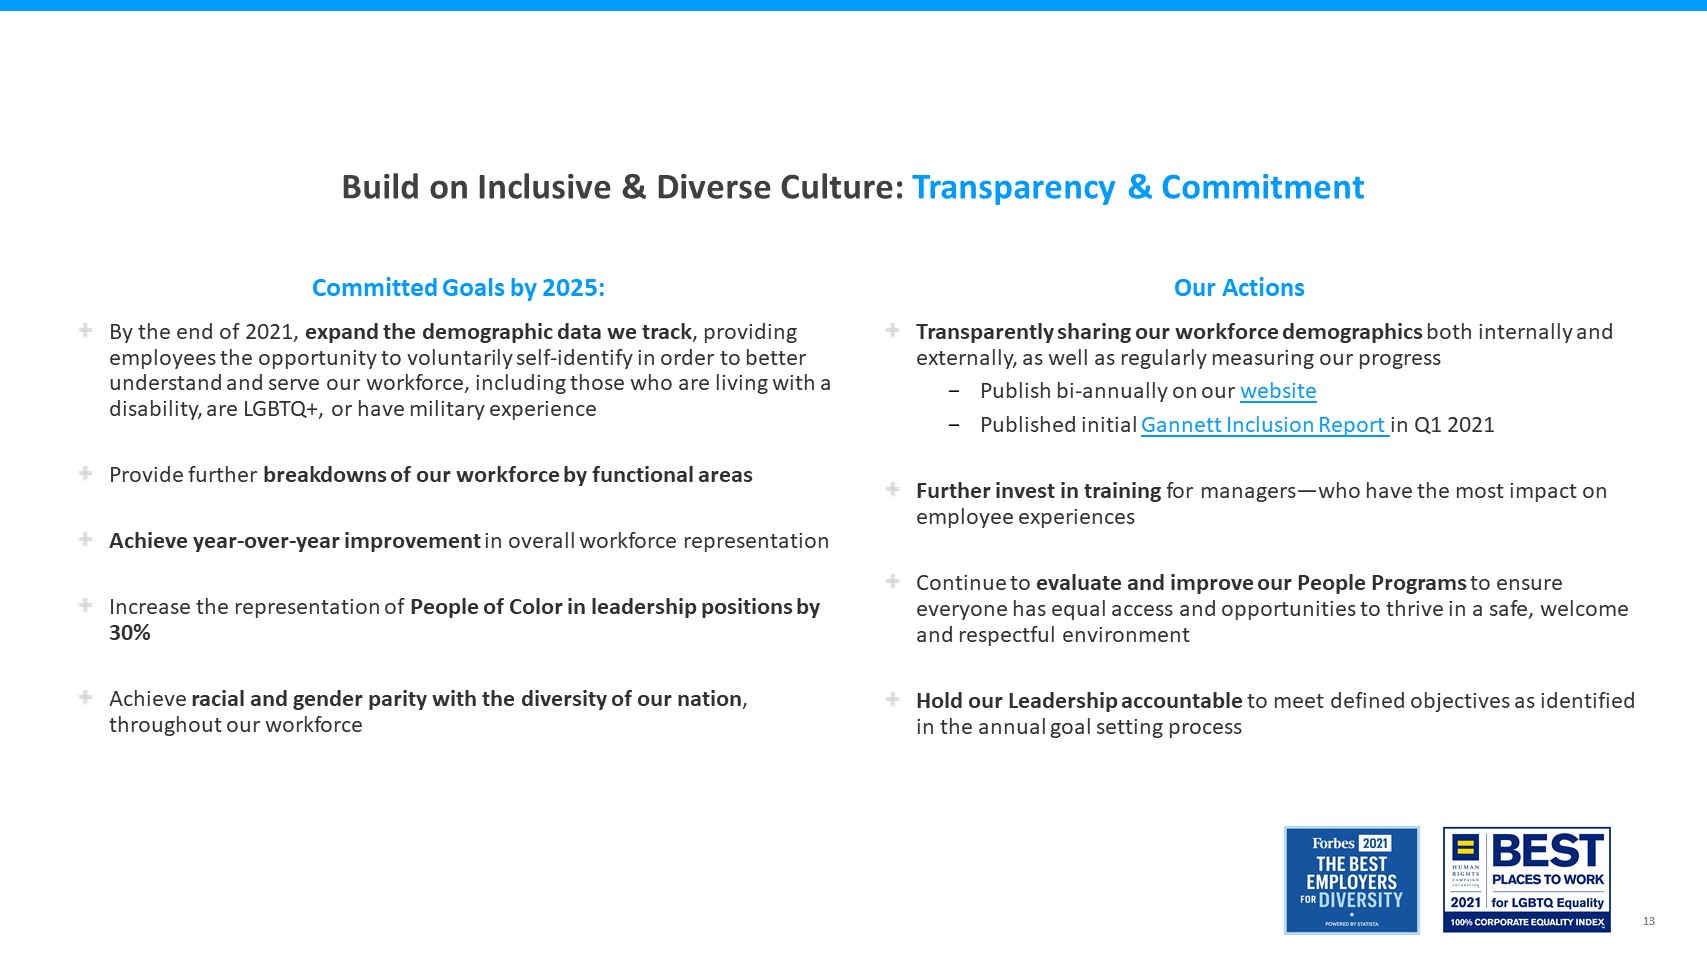
13 Build on Inclusive & Diverse Culture: Transparency & Commitment By the end of 2021, expand
the demographic data we track, providing employees the opportunity to voluntarily self-identify in order to better understand and serve our workforce, including those who are living with a disability, are LGBTQ+, or have military
experienceProvide further breakdowns of our workforce by functional areasAchieve year-over-year improvement in overall workforce representationIncrease the representation of People of Color in leadership positions by 30%Achieve racial and
gender parity with the diversity of our nation, throughout our workforce Our Actions Committed Goals by 2025: Transparently sharing our workforce demographics both internally and externally, as well as regularly measuring our
progressPublish bi-annually on our websitePublished initial Gannett Inclusion Report in Q1 2021Further invest in training for managers—who have the most impact on employee experiencesContinue to evaluate and improve our People Programs to
ensure everyone has equal access and opportunities to thrive in a safe, welcome and respectful environmentHold our Leadership accountable to meet defined objectives as identified in the annual goal setting process

14 Topline Stats: Community Engagementlocal reach across U.S. and U.K.(1) For the quarter ending March
31, 2021. Average Monthly Audience (UVs) 187M Total Pageviews Total Video Views (on platform) Event Attendees 5.5B 369M 38K+ U.S. Daily & U.K. Weekly Print Readership 13.0M

15 Topline Stats: Growth Driverslocal reach across U.S. and U.K.(1) As of May 7, 2021. Digital-only
Subscribers 1.2M DMS Customers Live Event HeldSince Onset of PandemicSafely welcomed 18,000+ attendees over 3 days 20K Accelerate digital subscriber growth Drive digital marketing services (DMS) growth Optimize
traditional print business Prioritize investments in growth businesses Build on inclusive & diverse culture Recognized as Top Employer for Diversity & LGBTQ Equality 1st Total Print Subscribers 2.4M

16 Q1 2021 Results and Non-GAAP Highlights(1) Total Operating RevenueSame store total revenues on a
pro forma basis decreased 16.5% $777.1M Adjusted EBITDAUp 1.4% to prior year quarter Free Cash Flow $100.5M $53.7M Net Cash Flow Providedby Operating Activities $61.3M Non-GAAP Results(1) GAAP Results Net loss
attributable to GannettReflects $126.6 million non-cash loss on the derivative associated with our convertible notes $142.3M $14.6M Adjusted Net Income attributable to Gannett Non-GAAP reconciliation is available in the appendix.

17 Non-GAAP Reconciliation The Company uses non-GAAP financial performance and liquidity measures to
supplement the financial information presented on a GAAP basis. These non-GAAP financial measures, which may not be comparable to similarly titled measures reported by other companies, should not be considered in isolation from or as a
substitute for the related GAAP measures and should be read together with financial information presented on a GAAP basis.The Company defines its non-GAAP measures as follows:Adjusted EBITDA is a non-GAAP performance measure the Company
believes offers a useful view of the overall operations of our business. The Company defines Adjusted EBITDA as Net income (loss) attributable to Gannett before: (1) Income tax expense (benefit), (2) Interest expense, (3) Gains or losses on the
early extinguishment of debt, (4) Non-operating pension income (expense), (5) Loss on Convertible notes derivative, (6) Other non-operating items, including equity income, (7) Depreciation and amortization, (8) Integration and reorganization
costs, (9) Asset impairments, (10) Goodwill and intangible impairments, (11) Gains or losses on the sale or disposal of assets, (12) Share-based compensation, (13) Other operating expenses, including third-party debt expenses and acquisition
costs, (14) Gains or losses on the sale of investments and (15) certain other non-recurring charges. The most directly comparable GAAP measure is Net income (loss) attributable to Gannett. Adjusted EBITDA margin is a non-GAAP performance
measure the Company believes offers a useful view of the overall operations of our business. Adjusted EBITDA margin is defined as Adjusted EBITDA divided by total Operating revenues. Adjusted Net Income (loss) attributable to Gannett is a
non-GAAP performance measure the Company believes offers a useful view of the overall operations of our business and is useful to analysts and investors in evaluating the results of operations and operational trends. The Company defines
Adjusted Net income (loss) attributable to Gannett before: (1) Gains or losses on the early extinguishment of debt, (2) Loss on Convertible notes derivative, (3) Asset impairments, (4) Gains or losses on the sale or disposal of assets and (5)
certain other non-recurring charges. The most directly comparable GAAP measure is Net income (loss) attributable to Gannett.Free cash flow is a non-GAAP liquidity measure that adjusts our reported GAAP results for items we believe are critical
to the ongoing success of our business. The Company defines Free cash flow as Net cash provided by operating activities as reported on the Statement of Cash Flows less capital expenditures, which results in a figure representing Free cash flow
available for use in operations, additional investments, debt obligations, and returns to stockholders. The most directly comparable GAAP financial measure is Net cash from operating activities. Management’s Use of Non-GAAP MeasuresAdjusted
EBITDA, Adjusted EBITDA margin, Adjusted Net Income (loss) attributable to Gannett and Free cash flow are not measurements of financial performance under GAAP and should not be considered in isolation or as an alternative to income from
operations, net income (loss), margin, cash flow from operating activities, or any other measure of performance or liquidity derived in accordance with GAAP. We believe these non-GAAP financial measures as we have defined them are helpful in
identifying trends in our day-to-day performance because these items excluded have little or no significance on our day-to-day operations. These measures provide an assessment of controllable expenses and affords management the ability to make
decisions which are expected to facilitate meeting current financial goals as well as achieve optimal financial performance. Adjusted EBITDA, Adjusted EBITDA margin and Adjusted Net Income (loss) attributable to Gannett provide us with measures
of financial performance, independent of items that are beyond the control of management in the short-term, such as depreciation and amortization, taxation, non-cash impairments, and interest expense associated with our capital structure. These
metrics measure our financial performance based on operational factors that management can impact in the short-term, namely the cost structure or expenses of the organization. Adjusted EBITDA and Adjusted EBITDA margin are metrics we use to
review the financial performance of our business on a monthly basis.We use Adjusted EBITDA, Adjusted EBITDA margin and Adjusted Net Income (loss) attributable to Gannett as measures of our day-to-day operating performance, which is evidenced by
the publishing and delivery of news and other media and excludes certain expenses that may not be indicative of our day-to-day business operating results. Limitations of Non-GAAP MeasuresEach of our non-GAAP measures have limitations as an
analytical tool. They should not be viewed in isolation or as a substitute for GAAP measures of earnings or cash flows. Material limitations in making the adjustments to our earnings to calculate Adjusted EBITDA and Adjusted Net Income (loss)
attributable to Gannett and using these non-GAAP financial measures as compared to GAAP net income (loss) include: the cash portion of interest / financing expense, income tax (benefit) provision, and charges related to asset impairments, which
may significantly affect our financial results.Management believes these items are important in evaluating our performance, results of operations, and financial position. We use non-GAAP financial measures to supplement our GAAP results in
order to provide a more complete understanding of the factors and trends affecting our business.Adjusted EBITDA, Adjusted EBITDA margin, Adjusted Net Income (loss) attributable to Gannett and Free Cash Flow are not alternatives to net income
(loss), income from operations, or cash flows provided by or used in operations as calculated and presented in accordance with GAAP. As such, they should not be considered or relied upon as a substitute or alternative for any such GAAP
financial measure. We strongly urge you to review the reconciliations of Net income (loss) attributable to Gannett to Adjusted EBITDA, Net income (loss) to Adjusted Net Income (loss) attributable to Gannett and Cash provided by operations to
Free Cash Flow along with our condensed consolidated financial statements included elsewhere in this report and in our filings with the Securities and Exchange Commission. We also strongly urge you to not rely on any single financial measure to
evaluate our business. In addition, because Adjusted EBITDA, Adjusted EBITDA margin, Adjusted net Income (loss) attributable to Gannett and Free Cash Flow are not measures of financial performance under GAAP and are susceptible to varying
calculations, the Adjusted EBITDA, Adjusted EBITDA margin, Adjusted Net Income (loss) attributable to Gannett and Free Cash Flow measures as presented in this report may differ from and may not be comparable to similarly titled measures used by
other companies.

18 Gannett Non-GAAP Reconciliation(1) (in thousands) 3 months endedMarch 31, 2021 Net
loss attributable to Gannett ($142,316) Benefit for income taxes (9,109) Interest expense 39,503 Loss on early extinguishment of debt 19,401 Non-operating pension income (23,878) Loss on Convertible notes derivative 126,600 Other
non-operating expense (income), net (1,875) Depreciation and amortization 58,103 Integration and reorganization costs 13,404 Other operating expenses(2) 10,576 Asset impairments 833 Net loss on sale or disposal of
assets 4,745 Share-based compensation expense 3,423 Other items 1,055 Adjusted EBITDA (non-GAAP basis) $100,465 Net income (loss) attributable to Gannett margin (18.3%) Adjusted EBITDA margin (non-GAAP basis) 12.9% (in thousands) 3
months endedMarch 31, 2021 Net cash flow provided by operating activities (GAAP basis) $61,316 Capital expenditures (7,607) Free cash flow (non-GAAP basis)(3) $53,709 Small discrepancies may exist due to rounding.Includes $10.2 million
of third-party fees related to the 5-Year Term LoanFree cash flow for the first quarter was negatively impacted by $21.1 million of integration and reorganization costs and $9.7 million of third-party fees related to the 5-Year Term Loan. (in
thousands) 3 months endedMarch 31, 2021 Net loss attributable to Gannett ($142,316) Provision for income taxes (18,606) Loss on early extinguishment of debt 19,401 Loss on Convertible notes derivative 126,600 Integration and
reorganization costs 13,404 Other operating expenses(2) 10,576 Asset impairments 833 Net loss on sale or disposal of assets 4,745 Adjusted Net Income attributable to Gannett $14,637

19 Gannett Same Store Revenue Reconciliation (in thousands) 3 months endedDecember 31,
2020 3 months endedDecember 31, 2019 $ Variance % Variance Total Pro Forma Gannett Revenue $777,084 $948,682 ($171,598) -18.1% Acquired Revenue - - Currency Impacts (4,541) - Exited
Operations (25) (25,565) Deferred Revenue Adjustments - 1,834 Same Store Revenue, Total Gannett $772,518 $924,951 ($152,433) -16.5%